Embed Size (px)
Citation preview
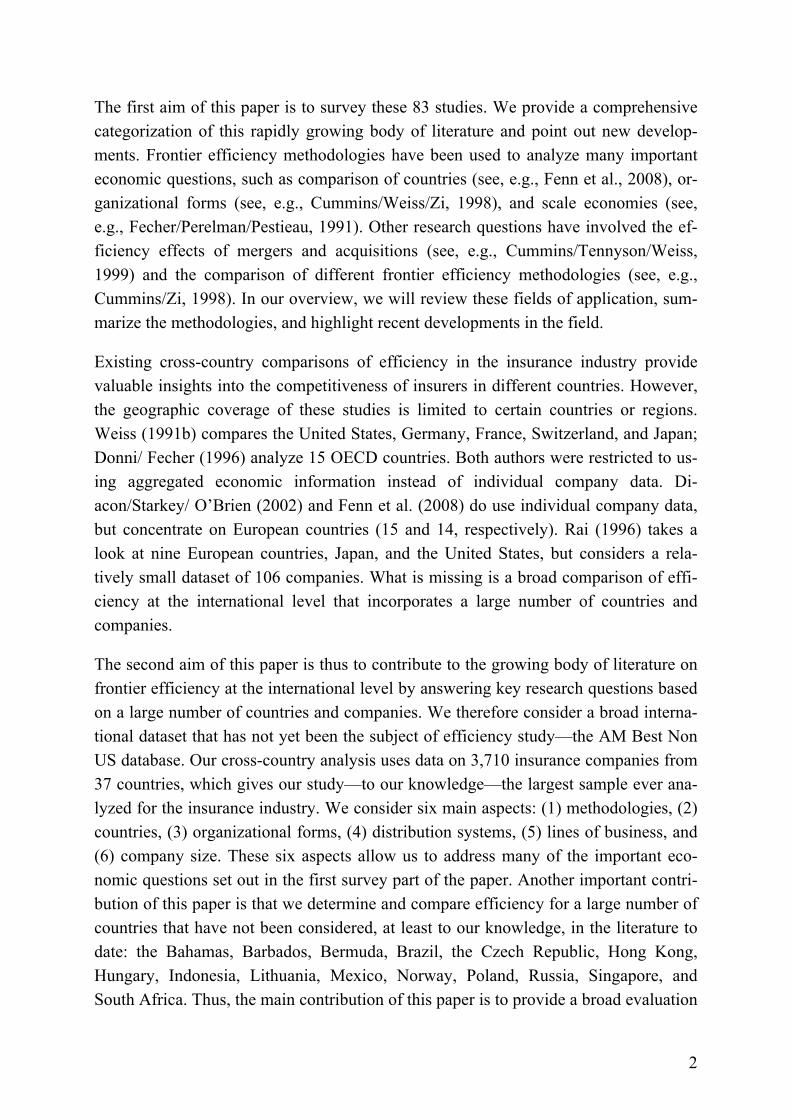
FRONTIER EFFICIENCY METHODOLOGIES TO MEASURE PER-
FORMANCE IN THE INSURANCE INDUSTRY: OVERVIEW AND NEW
EMPIRICAL EVIDENCE
Martin Eling, Michael Luhnen∗
JEL Classification: D23, G22, L11
ABSTRACT
The purpose of this paper is to provide an overview and new empirical evidence on frontier effi-
ciency measurement in the insurance industry, a topic of great interest in the academic literature
during the last several years. In the first step, we review 83 studies and put them into a joint
evaluation of efficiency measurement in the field of insurance. In the second step, an efficiency
comparison of 3,710 insurers from 37 countries is conducted using a dataset that has not yet been
subject to efficiency analysis (the AM Best Non US database). We compare different methodolo-
gies, countries, organizational forms, distribution systems, lines of business, and company sizes.
We find a steady efficiency growth in international insurance markets from 2002 to 2006 with
large differences across countries. Furthermore, we find evidence that stock companies are more
efficient than mutuals as well as for economies of scale, but no evidence for economies of scope in
the insurance industry. Only minor variations are found when comparing different frontier effi-
ciency methodologies (data envelopment analysis, stochastic frontier analysis) and different distri-
bution types (agency-based vs. direct writers). Our results give valuable insight into the competi-
tiveness of insurers in various countries.
(At the end of the paper there is an outline of further research that we would like to integrate in a
revised version of the paper to be presented at the conference on “Performance Measurement in
the Financial Services Sector.”)
1. INTRODUCTION
In recent years, efficiency measurement has captured a great deal of attention. The in-
surance sector in particular has seen rapid growth in the number of studies applying
frontier efficiency methods. Berger/Humphrey (1997) and Cummins/Weiss (2000)
surveyed eight and 21 studies, respectively; now, less than ten years after the Cum-
mins/Weiss survey, there are 83 studies on efficiency measurement in the insurance
industry. Recent work in the field has refined methodologies, addressed new topics
(e.g., market structure and risk management), and extended geographic coverage from
a previously US-focused view to a broad set of countries around the world, including
emerging markets such as China and Taiwan.
∗ Martin Eling is with the University of Wisconsin, School of Business, 4279 Grainger Hall, 975 University
Avenue, Madison, WI 53706, USA. Michael Luhnen is with the University of St. Gallen, Institute of Insurance
Economics, Kirchlistrasse 2, 9010 St. Gallen, Switzerland. We are grateful to Mareike Bodderas, Thomas Par-
nitzke, Hato Schmeiser, and Denis Toplek for valuable suggestions and comments.
2
The first aim of this paper is to survey these 83 studies. We provide a comprehensive
categorization of this rapidly growing body of literature and point out new develop-
ments. Frontier efficiency methodologies have been used to analyze many important
economic questions, such as comparison of countries (see, e.g., Fenn et al., 2008), or-
ganizational forms (see, e.g., Cummins/Weiss/Zi, 1998), and scale economies (see,
e.g., Fecher/Perelman/Pestieau, 1991). Other research questions have involved the ef-
ficiency effects of mergers and acquisitions (see, e.g., Cummins/Tennyson/Weiss,
1999) and the comparison of different frontier efficiency methodologies (see, e.g.,
Cummins/Zi, 1998). In our overview, we will review these fields of application, sum-
marize the methodologies, and highlight recent developments in the field.
Existing cross-country comparisons of efficiency in the insurance industry provide
valuable insights into the competitiveness of insurers in different countries. However,
the geographic coverage of these studies is limited to certain countries or regions.
Weiss (1991b) compares the United States, Germany, France, Switzerland, and Japan;
Donni/ Fecher (1996) analyze 15 OECD countries. Both authors were restricted to us-
ing aggregated economic information instead of individual company data. Di-
acon/Starkey/ O’Brien (2002) and Fenn et al. (2008) do use individual company data,
but concentrate on European countries (15 and 14, respectively). Rai (1996) takes a
look at nine European countries, Japan, and the United States, but considers a rela-
tively small dataset of 106 companies. What is missing is a broad comparison of effi-
ciency at the international level that incorporates a large number of countries and
companies.
The second aim of this paper is thus to contribute to the growing body of literature on
frontier efficiency at the international level by answering key research questions based
on a large number of countries and companies. We therefore consider a broad interna-
tional dataset that has not yet been the subject of efficiency study—the AM Best Non
US database. Our cross-country analysis uses data on 3,710 insurance companies from
37 countries, which gives our study—to our knowledge—the largest sample ever ana-
lyzed for the insurance industry. We consider six main aspects: (1) methodologies, (2)
countries, (3) organizational forms, (4) distribution systems, (5) lines of business, and
(6) company size. These six aspects allow us to address many of the important eco-
nomic questions set out in the first survey part of the paper. Another important contri-
bution of this paper is that we determine and compare efficiency for a large number of
countries that have not been considered, at least to our knowledge, in the literature to
date: the Bahamas, Barbados, Bermuda, Brazil, the Czech Republic, Hong Kong,
Hungary, Indonesia, Lithuania, Mexico, Norway, Poland, Russia, Singapore, and
South Africa. Thus, the main contribution of this paper is to provide a broad evaluation
3
of efficiency measurement in the insurance industry with a special emphasis on an in-
ternational comparison of efficiency.
Our main empirical findings can be summarized as follows:
(1) We find a steady efficiency growth in international insurance markets during the
sample period (2002–2006), with large efficiency differences between the 37 coun-
tries. The highest efficiency is found for Japan; the lowest for the Phillipines.
(2) We find evidence for the expense preference hypothesis (i.e., stock companies are
more efficient than mutuals) and for economies of scale (i.e., larger companies are
more efficient than smaller companies).
(3) We find only minor difference between distribution types (agency-based vs. direct
writers) and very little evidence for economies of scope (i.e., multi-line insurers are
not necessarily more efficient than mono-line insurers).
(4) We find that there is not much difference between the two frontier efficiency meth-
odologies data envelopment analysis and stochastic frontier analysis.
The remainder of the paper is organized as follows. Section 2 contains an overview of
83 studies on efficiency measurement in the insurance industry. The empirical exami-
nation is performed in Section 3. The results of the study are summarized in Section 4.
2. OVERVIEW OF EFFICIENCY MEASUREMENT IN THE INSURANCE INDUSTRY
In this section we provide an overview of 83 studies on efficiency measurement in the
insurance industry. Our overview builds upon and significantly extends two earlier
surveys of efficiency measurement in the financial services industry: one by Ber-
ger/Humphrey (1997), which focuses on banks and provides a valuable criteria frame-
work that we use to analyze the studies in the field of insurance, the second by Cum-
mins/Weiss (2000), which focuses on the insurance industry and covers 21 studies that
had been published by the year 1998.
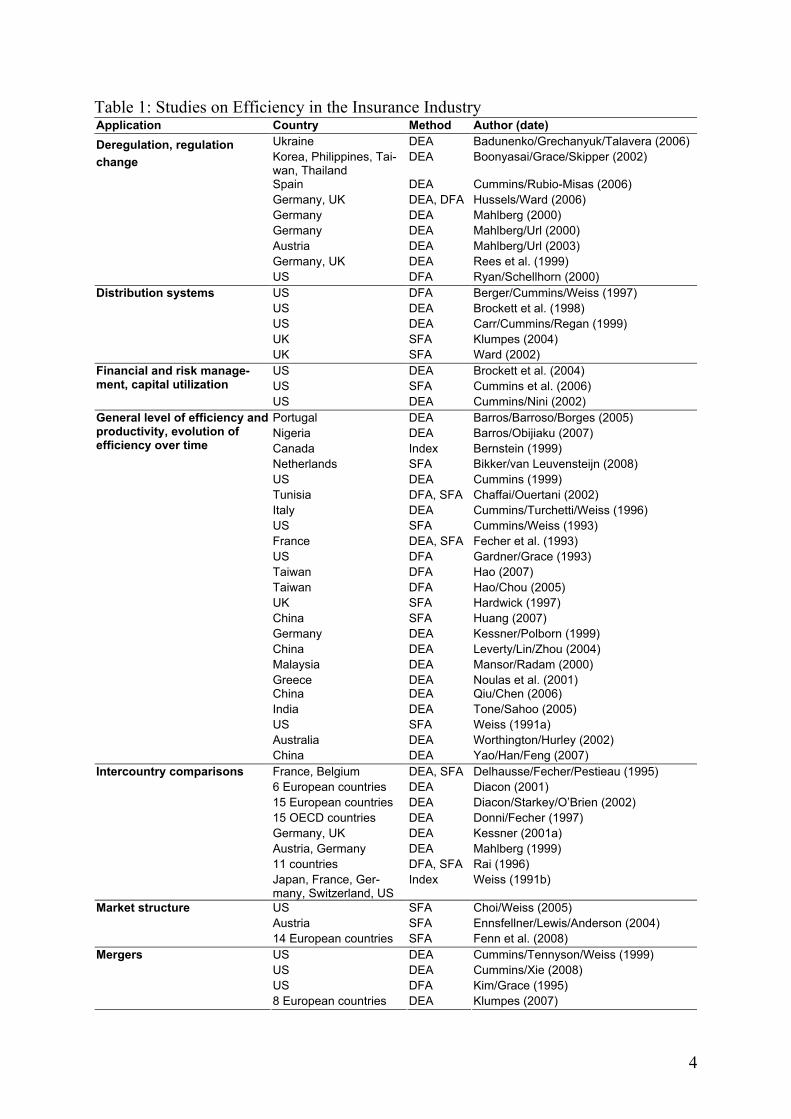
Table 1 summarizes the main features of the 83 studies. Although many of the studies
make contributions to more than one topic, in order to categorize them, we have ar-
ranged them according to their primary field of application (first column). The ten ap-
plication categories were chosen and refined based on the earlier overview by Ber-
ger/Humphrey (1997). Columns 2 and 3 show the country(ies) under investigation and
the efficient frontier method used; the fourth column lists the authors and year of pub-
lication of the study. More detailed information, such as input and output factors, types
of efficiency analyzed, sample periods, lines of business covered, and main findings,
can be found in the Appendix. In the following we discuss these studies, particularly
focusing on recent developments.
4
Table 1: Studies on Efficiency in the Insurance Industry Application Country Method Author (date)
Ukraine DEA Badunenko/Grechanyuk/Talavera (2006)
Korea, Philippines, Tai-wan, Thailand
DEA Boonyasai/Grace/Skipper (2002)
Spain DEA Cummins/Rubio-Misas (2006)
Germany, UK DEA, DFA Hussels/Ward (2006)
Germany DEA Mahlberg (2000)
Germany DEA Mahlberg/Url (2000)
Austria DEA Mahlberg/Url (2003)
Germany, UK DEA Rees et al. (1999)
Deregulation, regulation
change
US DFA Ryan/Schellhorn (2000)
US DFA Berger/Cummins/Weiss (1997)
US DEA Brockett et al. (1998)
US DEA Carr/Cummins/Regan (1999)
UK SFA Klumpes (2004)
Distribution systems
UK SFA Ward (2002)
US DEA Brockett et al. (2004)
US SFA Cummins et al. (2006)
Financial and risk manage-ment, capital utilization
US DEA Cummins/Nini (2002)
Portugal DEA Barros/Barroso/Borges (2005)
Nigeria DEA Barros/Obijiaku (2007)
Canada Index Bernstein (1999)
Netherlands SFA Bikker/van Leuvensteijn (2008)
US DEA Cummins (1999)
Tunisia DFA, SFA Chaffai/Ouertani (2002)
Italy DEA Cummins/Turchetti/Weiss (1996)
US SFA Cummins/Weiss (1993)
France DEA, SFA Fecher et al. (1993)
US DFA Gardner/Grace (1993)
Taiwan DFA Hao (2007)
Taiwan DFA Hao/Chou (2005)
UK SFA Hardwick (1997)
China SFA Huang (2007)
Germany DEA Kessner/Polborn (1999)
China DEA Leverty/Lin/Zhou (2004)
Malaysia DEA Mansor/Radam (2000)
Greece DEA Noulas et al. (2001) China DEA Qiu/Chen (2006)
India DEA Tone/Sahoo (2005)
US SFA Weiss (1991a)
Australia DEA Worthington/Hurley (2002)
General level of efficiency and productivity, evolution of efficiency over time
China DEA Yao/Han/Feng (2007)
France, Belgium DEA, SFA Delhausse/Fecher/Pestieau (1995)
6 European countries DEA Diacon (2001)
15 European countries DEA Diacon/Starkey/O’Brien (2002)
15 OECD countries DEA Donni/Fecher (1997)
Germany, UK DEA Kessner (2001a)
Austria, Germany DEA Mahlberg (1999)
11 countries DFA, SFA Rai (1996)
Intercountry comparisons
Japan, France, Ger-many, Switzerland, US
Index Weiss (1991b)
US SFA Choi/Weiss (2005)
Austria SFA Ennsfellner/Lewis/Anderson (2004)
Market structure
14 European countries SFA Fenn et al. (2008)
US DEA Cummins/Tennyson/Weiss (1999)
US DEA Cummins/Xie (2008)
US DFA Kim/Grace (1995)
Mergers
8 European countries DEA Klumpes (2007)
5
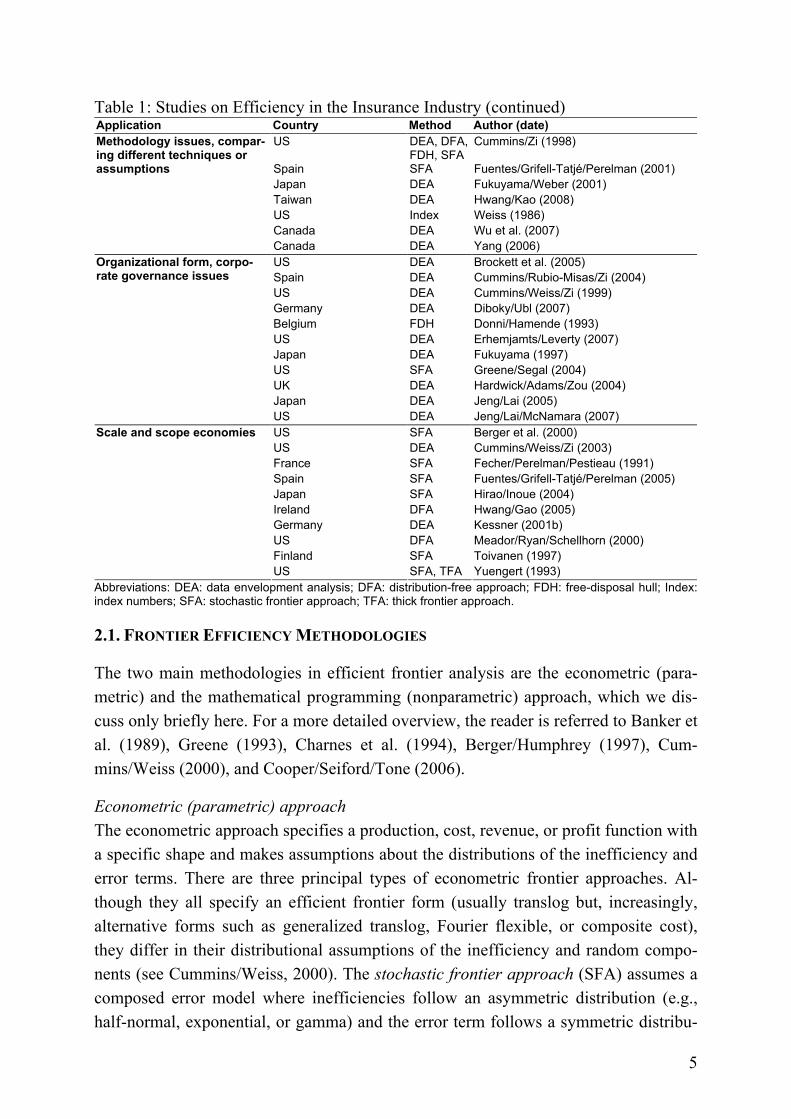
Table 1: Studies on Efficiency in the Insurance Industry (continued) Application Country Method Author (date)
US DEA, DFA, FDH, SFA
Cummins/Zi (1998)
Spain SFA Fuentes/Grifell-Tatjé/Perelman (2001)
Japan DEA Fukuyama/Weber (2001)
Taiwan DEA Hwang/Kao (2008)
US Index Weiss (1986)
Canada DEA Wu et al. (2007)
Methodology issues, compar-ing different techniques or assumptions
Canada DEA Yang (2006)
US DEA Brockett et al. (2005)
Spain DEA Cummins/Rubio-Misas/Zi (2004)
US DEA Cummins/Weiss/Zi (1999)
Germany DEA Diboky/Ubl (2007)
Belgium FDH Donni/Hamende (1993)
US DEA Erhemjamts/Leverty (2007)
Japan DEA Fukuyama (1997)
US SFA Greene/Segal (2004)
UK DEA Hardwick/Adams/Zou (2004)
Japan DEA Jeng/Lai (2005)
Organizational form, corpo-rate governance issues
US DEA Jeng/Lai/McNamara (2007)
US SFA Berger et al. (2000)
US DEA Cummins/Weiss/Zi (2003)
France SFA Fecher/Perelman/Pestieau (1991)
Spain SFA Fuentes/Grifell-Tatjé/Perelman (2005)
Japan SFA Hirao/Inoue (2004)
Ireland DFA Hwang/Gao (2005)
Germany DEA Kessner (2001b)
US DFA Meador/Ryan/Schellhorn (2000)
Finland SFA Toivanen (1997)
Scale and scope economies
US SFA, TFA Yuengert (1993)
Abbreviations: DEA: data envelopment analysis; DFA: distribution-free approach; FDH: free-disposal hull; Index: index numbers; SFA: stochastic frontier approach; TFA: thick frontier approach.
2.1. FRONTIER EFFICIENCY METHODOLOGIES
The two main methodologies in efficient frontier analysis are the econometric (para-
metric) and the mathematical programming (nonparametric) approach, which we dis-
cuss only briefly here. For a more detailed overview, the reader is referred to Banker et
al. (1989), Greene (1993), Charnes et al. (1994), Berger/Humphrey (1997), Cum-
mins/Weiss (2000), and Cooper/Seiford/Tone (2006).
Econometric (parametric) approach
The econometric approach specifies a production, cost, revenue, or profit function with
a specific shape and makes assumptions about the distributions of the inefficiency and
error terms. There are three principal types of econometric frontier approaches. Al-
though they all specify an efficient frontier form (usually translog but, increasingly,
alternative forms such as generalized translog, Fourier flexible, or composite cost),
they differ in their distributional assumptions of the inefficiency and random compo-
nents (see Cummins/Weiss, 2000). The stochastic frontier approach (SFA) assumes a
composed error model where inefficiencies follow an asymmetric distribution (e.g.,
half-normal, exponential, or gamma) and the error term follows a symmetric distribu-
6
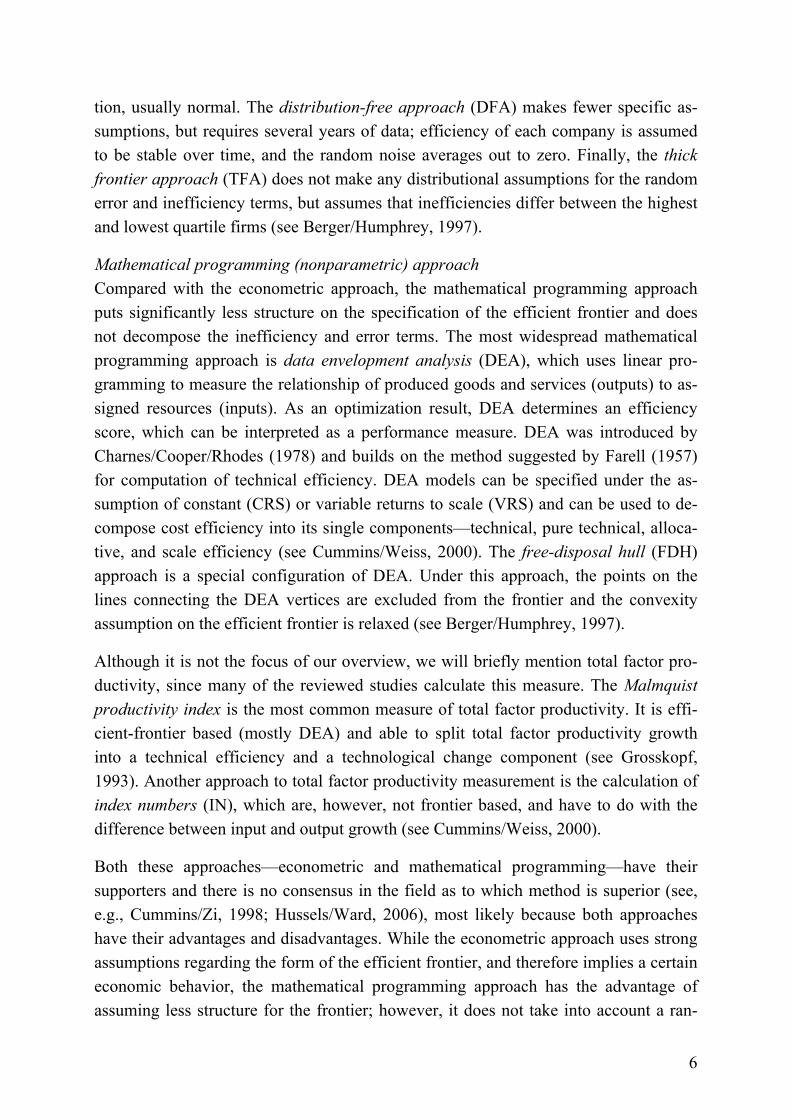
tion, usually normal. The distribution-free approach (DFA) makes fewer specific as-
sumptions, but requires several years of data; efficiency of each company is assumed
to be stable over time, and the random noise averages out to zero. Finally, the thick
frontier approach (TFA) does not make any distributional assumptions for the random
error and inefficiency terms, but assumes that inefficiencies differ between the highest
and lowest quartile firms (see Berger/Humphrey, 1997).
Mathematical programming (nonparametric) approach
Compared with the econometric approach, the mathematical programming approach
puts significantly less structure on the specification of the efficient frontier and does
not decompose the inefficiency and error terms. The most widespread mathematical
programming approach is data envelopment analysis (DEA), which uses linear pro-
gramming to measure the relationship of produced goods and services (outputs) to as-
signed resources (inputs). As an optimization result, DEA determines an efficiency
score, which can be interpreted as a performance measure. DEA was introduced by
Charnes/Cooper/Rhodes (1978) and builds on the method suggested by Farell (1957)
for computation of technical efficiency. DEA models can be specified under the as-
sumption of constant (CRS) or variable returns to scale (VRS) and can be used to de-
compose cost efficiency into its single components—technical, pure technical, alloca-
tive, and scale efficiency (see Cummins/Weiss, 2000). The free-disposal hull (FDH)
approach is a special configuration of DEA. Under this approach, the points on the
lines connecting the DEA vertices are excluded from the frontier and the convexity
assumption on the efficient frontier is relaxed (see Berger/Humphrey, 1997).
Although it is not the focus of our overview, we will briefly mention total factor pro-
ductivity, since many of the reviewed studies calculate this measure. The Malmquist
productivity index is the most common measure of total factor productivity. It is effi-
cient-frontier based (mostly DEA) and able to split total factor productivity growth
into a technical efficiency and a technological change component (see Grosskopf,
1993). Another approach to total factor productivity measurement is the calculation of
index numbers (IN), which are, however, not frontier based, and have to do with the
difference between input and output growth (see Cummins/Weiss, 2000).
Both these approaches—econometric and mathematical programming—have their
supporters and there is no consensus in the field as to which method is superior (see,
e.g., Cummins/Zi, 1998; Hussels/Ward, 2006), most likely because both approaches
have their advantages and disadvantages. While the econometric approach uses strong
assumptions regarding the form of the efficient frontier, and therefore implies a certain
economic behavior, the mathematical programming approach has the advantage of
assuming less structure for the frontier; however, it does not take into account a ran-
7
dom error and therefore runs the risk of mistaking a true random error for inefficiency
(see Berger/Humphrey, 1997).
Looking at the overview of methods used in frontier efficiency studies as set out in
Table 1, it becomes obvious that the nonparametric DEA approach has been most fre-
quently used: out of the 83 surveyed studies, 46 use DEA, 18 SFA, eight DFA, one
FDH, and three use index numbers. Additionally, total factor productivity using the
Malmquist productivity index has been calculated by 22 studies. For DEA, the most
widely used specification has been under the assumption of VRS. Only seven studies
follow the advice given by Cummins/Zi (1998) to consider multiple approaches, ide-
ally from both the econometric and mathematical programming sides. However, most
of those seven studies find highly correlated results across different approaches (see,
e.g., Hussels/Ward, 2006; Fecher et al., 1993; Delhausse/Fecher/Pestieau, 1995). Of-
ten, the choice of methods is determined by the available data, e.g., if the available
data are known to be noisy, the econometric approach, featuring an error term, may
lead to more accurate results than the mathematical programming approach (see Cum-
mins/Weiss, 2000).
In recent years, there have been a number of proposals for the improvement of effi-
cient frontier methodology in the insurance field. For the econometric approach, a ma-
jor direction has been to find more flexible specifications of the functional form, such
as the Fourier flexible distribution. This form approximates the real underlying distri-
bution more closely than do other forms, such as the translog, and thus addresses the
main drawback of the econometric approach (see, e.g., Berger/Cummins/Weiss, 1997;
Fenn et al., 2008; Klumpes, 2004), which is the possible misspecification of the shape
of the efficient frontier due to strong distributional assumptions. A further proposal has
been made regarding the incorporation of firm-specific variables into the estimation
process. Instead of using a two-stage approach, which first estimates inefficiency of
sample firms and then examines the association of inefficiency with firm-specific vari-
ables (such as organizational form), a one-stage approach is suggested. The estimated
frontier directly takes into account firm-specific variables and allows a joint modeling
of inefficiency effects (see, e.g., Greene/Segal, 2004; Fenn et al., 2008). Another con-
tribution has been made with regard to the Malmquist index of total factor productiv-
ity. Although this index is usually applied to nonparametric DEA for insurance com-
panies, Fuentes/Grifell-Tatjé/Perelman (2001) develop a parametric distance function
approach for the Malmquist productivity index calculation.
The mathematical programming approach has traditionally been viewed as a strictly
nonparametric approach; however, it has been shown that DEA can be interpreted as a
maximum likelihood estimator, providing a statistical base to DEA (see, e.g., Banker,
8
1993). Nevertheless, efficiency estimates are biased upward in finite examples and
therefore need to be corrected. That is why the bootstrapping procedure proposed by
Simar/Wilson (1998) has been applied to and extended for the insurance industry to
account for various kinds of efficiency (cost, technical, revenue) as well as CRS and
VRS models (see, e.g., Cummins/Weiss/Zi, 2003; Erhemjamts/Leverty, 2007;
Diboky/Ubl, 2007). A further innovation is the introduction of cross-frontier efficiency
analysis, which estimates efficiency of one particular technology relative to a best
practice frontier of an alternative technology (see Cummins/Weiss/Zi, 1999, 2003;
Cummins/Rubio-Misas/Zi, 2004). Cross-frontier analysis has been mainly used to ex-
amine the efficiency of different organizational forms. Finally, Brocket et al. (2004,
2005) apply a RAM (range-adjusted measure) version of DEA to the insurance indus-
try, addressing theoretical problems regarding the comparison set of each firm for
which efficiency has been calculated.
2.2. INPUT AND OUTPUT FACTORS USED IN EFFICIENCY MEASUREMENT
An important decision when employing frontier efficiency models involves the choice
of inputs, outputs, and their prices, since the definition of these factors can signifi-
cantly impact the results of a study (see Cummins/Weiss, 2000).
Choice of input factors
There are three main insurance inputs: labor, business service and materials, and capi-
tal. Labor can be further divided into agent and home-office labor. The category of
business service and materials is usually not further subdivided, but includes items like
travel, communications, and advertising. At least three categories of capital can be dis-
tinguished: physical, debt, and equity (see Cummins/Tennyson/Weiss, 1999; Cum-
mins/Weiss, 2000). Since data on the number of employees or hours worked are not
publicly available for the insurance industry, to proxy labor and business service input,
input quantities are derived by dividing the expenditures for these inputs by publicly
available wage variables or price indices, e.g., the US Department of Labor data on
average weekly wages for SIC Class 6311 (home-office life insurance labor), in the
case of a US study (see Berger/Cummins/Weiss, 1997; Cummins/Zi, 1998). Physical
capital is often included in the business service and materials category, but debt and
equity capital are important inputs for which adequate cost measures have to be found
(see Cummins/Weiss, 2000). One example of how to derive equity cost is the three-tier
approach to measuring cost of equity capital based on AM Best ratings (see Cum-
mins/Tennyson/Weiss, 1999).
There appears to be widespread agreement among researchers with regard to the
choice of inputs (see Appendix): 55 out of 83 studies use at least labor and capital as
inputs and most of them also add a third category (miscellaneous, mostly business ser-
9
vices). Out of those 55 studies, 15 differentiate between agent and nonagent labor.
Also, the number of studies differentiating between equity and debt capital is quite
low; only ten papers do so. Looking at the remaining 28 contributions that do not fol-
low the standard input categories, it becomes obvious that 15 of them incorporate
broader expenditure categories as inputs (e.g., total operating expenses) without de-
composing them into quantities and prices (see, e.g., Rees et al., 1999; Mahlberg/Url,
2003). There are a further nine studies that do not cover capital explicitly, i.e., they
consider labor only or labor and an additional composite category. Finally, four studies
that focus on financial intermediation consider only capital-related inputs (see, e.g.,
Brocket et al., 1998). The choice of input prices is mainly determined by the data that
are publicly available in the countries under investigation.
Choice of output factors
There are three principal approaches to measuring outputs in the financial services in-
dustry: the asset or intermediation approach, the user-cost approach, and the value-
added approach (see Berger/Humphrey, 1992). The intermediation approach views the
insurance company as a financial intermediary that manages a reservoir of assets, bor-
rowing funds from policyholders, investing them on capital markets, and paying out
claims, taxes, and other costs (see Brocket et al., 1998). The user-cost method differen-
tiates between inputs and outputs based on the net contribution to revenues: if a finan-
cial product yields a return that exceeds the opportunity cost of funds or if the financial
costs of a liability are less than the opportunity costs, it is deemed a financial input;
otherwise, it is considered a financial output (see Hancock, 1985; Cummins/Weiss,
2000). The value-added approach counts outputs as important if they contribute a sig-
nificant added value based on operating cost allocations (see Berger et al., 2000). Usu-
ally, several types of outputs are defined, representing the single lines of business un-
der review. In line with the theoretical literature on insurance pricing, the price of in-
surance outputs is calculated as the sum of premiums and investment income minus
output divided by output (see Cummins/Weiss, 2000).
The value-added approach to output measurement is clearly dominant in the insurance
industry: 69 out of 83 studies apply this approach (see Appendix). However, there is
an intense debate among those using the value-added approach as to whether
claims/benefits or premiums are the most appropriate proxy for value added (see, e.g.,
Cummins/Weiss, 2000). Out of the 69 articles, 32 specify output as either
claims/present value of claims (property-liability) or benefits/net incurred benefits
(life), following the arguments of Cummins/Weiss (2000). However, 35 studies spec-
ify output as premiums/sum insured, most likely because these measures are more
readily available for most countries. Two of the 69 studies applying the value-added
approach use neither of the two main proxies (e.g., Yuengert (1993) uses re-
10
serves/additions to reserves to proxy value added). There is no recognizable trend over
time as to whether either of the two main proxies is gaining more of a following
among researchers. Regarding the other two approaches for output measurement, five
studies employ the intermediation approach, e.g., taking ROI, liquid assets to liability,
and solvency scores as outputs (see Brockett et al., 2004, 2005). As argued by Cum-
mins/Weiss (2000), this approach is not optimal because insurers provide many ser-
vices in addition to financial intermediation. None of the studies reviewed uses the
user-cost approach, because this approach requires precise data on product revenues
and opportunity costs, which are not available in the insurance industry (see Klumpes,
2007). Four studies use both the value-added and intermediation approaches (see, e.g.,
Jeng/Lai, 2005). One study proposes a new relational two-stage approach to output
measurement (see Hwang/Kao, 2008): the authors construct a series relationship be-
tween the first output process (premium acquisition), providing the inputs for the sec-
ond output process (profit generation). Four studies apply physical outputs, e.g., Weiss
(1986) and Bernstein (1999) use number of policies as insurance output.
2.3. FIELDS OF APPLICATION IN INSURANCE EFFICIENCY MEASUREMENT AND SE-
LECTED RESULTS
Frontier efficiency methods have been applied to a wide range of countries (33 coun-
tries according to our survey) as well as to all major lines of business. Furthermore,
frontier efficiency methods have been used to investigate various economic issues,
including risk management (see, e.g., Cummins et al., 2006), market structure (see,
e.g., Choi/Weiss, 2005), organizational forms (see, e.g., Jeng/Lai, 2005), and mergers
(see, e.g., Cummins/Xie, 2008). However, it should be noted that findings regarding
the same economic issues often vary depending on country, line of business, time ho-
rizon, and method considered in the different studies. In the following, we analyze the
83 studies of our survey according to their field of application and selected main re-
sults. For this purpose, we consider ten application categories (see Table 1).
Deregulation and regulation change
There has been significant market deregulation of financial services in many countries
(e.g., European Union Third Generation Insurance Directive, 1994). The aim of de-
regulation in the financial services sector is to improve market efficiency and enhance
consumer choice through more competition. Consolidation, in particular, has the po-
tential to improve efficiency by efficient firms taking over less efficient ones and real-
izing economies of scale (see Cummins/Rubio-Misas, 2006). However, the evidence
on efficiency gains due to deregulation have been mixed. Rees et al. (1999) find mod-
est efficiency gains from deregulation for the United Kingdom and Germany for the
period from 1992–1994; however, Hussels/Ward (2006) do not find clear evidence for
11
a link between deregulation and efficiency for the same countries during the period
1991–2002. Mahlberg (2000) finds decreasing efficiency for Germany for the period
of 1992–1996, but an increase in productivity. For Spain, Cummins/Rubio-Misas
(2006) find clear evidence for total factor productivity growth for the period of 1989–
1998, with consolidation reducing the number of firms in the market. Boonyasai/
Grace/Skipper (2002) find evidence for productivity increases in Korea and the Philip-
pines due to deregulation. On the issue of changing regulation in the United States,
Ryan/Schellhorn (2000) find unchanged efficiency levels from the start of the 1990s to
the middle of that decade, a period during which risk-based capital requirements
(RBC) became effective.
Distribution systems
The effect of different distribution systems on the efficiency of insurance companies
has been another field of investigation but in this case the results have been more con-
sistent. Brockett et al. (1998, 2004), studying the United States, and Klumpes (2004),
studying the United Kingdom, both find that independent agent distribution systems
are more efficient than direct systems involving company representatives or employed
agents. However, Berger/Cummins/Weiss (1997) find in their study of the United
States that agent systems are less cost efficient, but equally profit efficient, as direct
systems due to differences in service intensity that are offset by higher revenues. On a
more general level, Ward (2002), in his study of the United Kingdom, finds that insur-
ers focusing on one distribution system are more efficient than those employing more
than one mode of distribution.
Financial and risk management, capital utilization
A relatively new field of application for frontier efficiency methods is that of financial
and risk management. Cummins et al. (2006) were the first to explicitly investigate the
relationship between risk management, financial intermediation, and economic effi-
ciency of insurance companies. In their application to the US property-liability indus-
try, they find that both activities significantly increase efficiency. In a similar vein,
Brockett et al. (2004) find that solvency scores used as an output have only limited
impact on efficiency scores and Cummins/Nini (2002) state that capital is used subop-
timally in US property-liability insurance.
General level of efficiency and productivity, evolution of efficiency over time
This category is comprised of all those studies whose primary research objective is to
show a country’s levels of efficiency and productivity and, in most cases, also to in-
vestigate the evolution of those measures over time. Many of these studies also look at
other issues, such as scale or scope economies. Naturally, this category contains a
large number of studies that represent a first application of efficiency frontier methods
12
to countries such as Nigeria (see Barros/Obijiaku, 2007), Tunisia (see Chaffai/
Ouertani, 2002), Malaysia (see Mansor/Radam, 2000), or Australia (see Worthington/
Hurley, 2002). Given the broad range of countries and time horizons employed, find-
ings regarding efficiency and productivity are obviously mixed; however, nearly all
studies note that there are significant levels of inefficiency in most countries with cor-
responding room for improvement, e.g., the Netherlands with 75% cost efficiency on
average (see Bikker/van Leuvensteijn, 2008), average efficiency of 77% (non-life) and
70% (life) in China (see Yao/Han/Feng, 2007), and average efficiency of 65% for
Greece (see Noulas et al., 2001).
Intercountry comparisons
Cross-country comparisons in the insurance industry can provide valuable insight into
the competitiveness and efficiencies of insurers in different countries. This sort of
study is especially interesting for the European market, where implementation of the
single European Union (EU) insurance license in 1994 raised concerns about interna-
tional competitiveness among insurers (see Diacon/Starkey/O’Brien, 2002). Conse-
quently, there have been quite a few efficiency studies on this topic. For a sample of
450 companies from 15 European countries and for the period 1996–1999, Diacon/
Starkey/O’Brien (2002) find striking international differences in average efficiency.
According to their study, the United Kingdom, Spain, Sweden, and Denmark have the
highest levels of technical efficiency. Additionally, in a recent study involving 14
European countries for the period 1995–2001, Fenn et al. (2008) find increasing re-
turns to scale for the majority of EU insurance companies, indicating that mergers and
acquisitions, facilitated by the liberalized EU market, have led to efficiency gains.
There are also cross-country efficiency studies looking at international country sam-
ples, e.g., Weiss (1991b), covering the United States, Germany, Switzerland, France,
and Japan; Donni/Fecher (1997), comparing 15 OECD countries; and Rai (1996), ana-
lyzing 11 countries.
Market structure
Several contributions to the efficient frontier literature study the effects of deregulation
and consolidation in general (see above), but only very few explicitly analyze the rela-
tionship between market structure and performance. In a recent contribution looking at
the US property-liability market, Choi/Weiss (2005) introduce the efficiency measure
into market structure analysis. They formalize the efficient structure hypothesis, which
claims that more efficient firms charge lower prices than their competitors, allowing
them to capture larger market shares as well as economic rents, leading to increased
market concentration, and incorporate x-efficiency and scale-efficiency into their
analysis. Results suggest that regulators should be more concerned with efficiency
rather than market power arising from industry consolidation. Further contributions to
13
the topic of market structure, but with a focus on the EU, have been made by Fenn et
al. (2008) and Ennsfellner/Lewis/ Anderson (2004).
Mergers
Another relatively new field for the application of frontier efficiency methods is that of
mergers and acquisitions. The few studies that have been done aim at understanding
the motivations of merger activity from the angle of efficiency gains. An early study
by Kim/Grace (1995) simulating efficiency gains from hypothetical horizontal mergers
in the US life insurance industry indicates that most mergers would improve cost effi-
ciencies, with the exception of mergers between large firms. Two other studies looking
at the US market are Cummins/Tennyson/Weiss (1999) for life insurance and Cum-
mins/Xie (2008) for property-liability insurance. Both studies conclude that mergers
are beneficial for efficiency, for both the acquiring and the target firm. Also, finan-
cially vulnerable firms are found more likely to be acquired. In his application to the
European insurance market, Klumpes (2007) tests the same hypothesis as did Cum-
mins/Tennyson/Weiss (1999) and Cummins/Xie (2008) and finds that acquiring firms
are more likely to be efficient than nonacquiring firms. However, he finds no strong
evidence that target firms achieve greater efficiency gains than nontarget firms. He
also implies that merger activity in the major European insurance markets seems to be
mainly driven by solvency objectives (i.e., financially weak insurers are bought by
financially sound companies) and less by value maximization, as found in the US.
Methodology issues, comparing different techniques or assumptions
There are a few studies whose primary objective is to solve methodological issues or
compare different techniques or assumptions over time. Among the most important of
these are Cummins/Zi (1998), comparing different frontier efficiency methods (DEA,
DFA, FDH, SFA), and Fuentes/Grifell-Tatjé/Perelman (2001), introducing a paramet-
ric frontier approach for the application of the Malmquist index. For a discussion of
these and other studies having methodological issues as their primary or secondary
research objective, the reader is referred to Section 2.1 of this paper, covering different
efficiency frontier techniques, and Section 2.2, covering different ways of treating in-
puts and outputs.
Organizational form, corporate governance issues
A very important and well-developed field of frontier efficiency analysis deals with
the effect of organizational form on performance. The two principal hypotheses in this
area are the expense preference hypothesis (see Mester, 1991) and the managerial dis-
cretion hypotheses (see Mayers/Smith, 1988). While the expense preference hypothe-
sis states that mutual insurers are less efficient than stock companies due to higher
perquisite consumption of mutual managers, the managerial discretion hypotheses pos-
14
its that the two organizational forms use different technologies and that mutual com-
panies are more efficient in lines of business with relatively low managerial discretion
(see Cummins/Weiss, 2000). Frontier efficiency studies have confirmed these hy-
potheses with the general finding that stock companies are more efficient than mutual
companies in most cases (see, e.g., Cummins/Weiss/Zi (1999) and Erhem-
jamts/Leverty (2007) for the United States and Diboky/Ubl (2007) for Germany).
However, in some areas, mutuals have been found to be more efficient. For example,
in the study by Cummins/Rubio-Misas/Zi (2004) for Spain smaller mutuals dominate
stock companies in the production of mutual output vectors. In another study covering
Japan, Fukuyama (1997) rejects the managerial discretion hypothesis, finding that mu-
tual and stock companies possess identical technologies. Other studies investigate effi-
ciency improvements after demutualization (see, e.g., Jeng/Lai/McNamara, 2007) and,
looking at corporate governance issues, the relation between cost efficiency and the
size of the corporate board of directors (see Hardwick/Adams/Zou, 2004).
Scale and scope economies
Scale and scope economies are classic areas of research in frontier efficiency litera-
ture. So far, scale economies has been the more extensively researched of the two and
is particularly important in the context of consolidation and the justification of mergers
(see Cummins/Weiss, 2000). Although detailed results vary across studies, depending
on countries, methods, and time horizons employed, many contributions have found,
on average, evidence for increasing returns to scale, meaning that unit costs of produc-
tion decline as firm size increases (see, e.g., Hardwick (1997) for UK, Hwang/Gao
(2005) for Ireland, Qiu/Chen (2006) for China, and Fecher/Perelman/Pestieau (1991)
for France). However, the differentiation between size clusters must be considered to
achieve more specific results. For example, Yuengert (1993), in his application to the
US life insurance market, finds increasing returns to scale for firms with up to US$15
billion in assets and constant returns to scale for bigger firms. In contrast, Cummins/Zi
(1998), for the same market, find increasing returns to scale for firms having up to
US$1 billion in assets, and decreasing returns to scale for all others except for a few
firms with constant returns to scale. The topic of scope economies is also of impor-
tance, since there is an increasing number of cross-industry mergers involving insurers
from different lines of business (see Cummins/Weiss, 2000). In general, researchers
have found evidence for the existence of economies of scope, meaning that multi-
product/-branch firms are more efficient than specialized firms (see, e.g., Meador/
Ryan/Schellhorn, 2000; Cummins/Weiss/Zi, 2003; Fuentes/Grifell-Tatjé/Perelman,
2005). Again, however, looking at the study results in more detail is revealing. For
example, in Berger et al. (2000), a US application, it is shown that profit scope
economies are more likely to be realized by larger firms.
15
3. NEW EMPIRICAL EVIDENCE
As mentioned above, the geographic coverage of efficiency studies in the insurance
industry has to date been limited to certain countries or regions. The contribution of
this section is to give new insights into efficiency at the international level by analyz-
ing a large number of countries and insurance companies. We compare different (1)
methodologies, (2) countries, (3) organizational forms, (4) distribution systems, (5)
lines of business, and (6) company sizes, which allows us to address many of the re-
search questions surveyed in Section 2. In each case, the results are presented at differ-
ent levels of aggregation, which enables us to identify the pure effect of methodolo-
gies, countries, organization, distribution, lines of business, and size on efficiency.
Additional cross-sectional insights including a Tobit regression analysis are provided
at the end of this section. In our analysis, we determine and compare efficiency for 15
countries that have not been considered in the literature to date: the Bahamas, Barba-
dos, Bermuda, Brazil, the Czech Republic, Hong Kong, Hungary, Indonesia, Lithua-
nia, Mexico, Norway, Poland, Russia, Singapore, and South Africa.
3.1. DATA AND METHODOLOGY
Our main data source is the 2007 edition of the AM Best Non US database (Version
2007.3). It contains information on 5,031 life and non-life insurance companies from
98 countries. The database has five years of data, covering the period 2002–2006.
Companies were included in our analysis if they had positive values for all the inputs
and outputs described in Table 2. This reduces our sample to 4,103 companies from 90
countries. Furthermore, in order to appropriately compare the different countries we
require each country to have at least a total of 30 firm years and to have data for each
of the five years that we analyze. This reduces our sample to 3,710 companies from 37
countries. The remaining 393 companies from 53 countries were included in the analy-
sis as “other” countries.1/2
1 These countries are : Antigua and Barbuda (1 company/3 firm years), Argentina (4/15), Bahrain (4/18), Bo-
livia (14/37), British Virgin Islands (3/8), Bulgaria (5/14), Cayman Islands (14/57), Chile (50/144), China
(8/19), Croatia (4/12), Cyprus (5/17), the Dominican Republic (1/4), Ecuador (40/107), Egypt (6/27), El Sal-
vador (8/17), Estonia (12/47), Greece (3/6), Guernsey (2/6), Iceland (7/21), India (12/52), the Isle of Man
(3/9), Israel (10/28), Jamaica (3/12), Jordan (2/6), Kazakhstan (1/5), Kenya (4/14), Kuwait (4/17), Latvia
(8/29), Lebanon (1/5), Macau (4/19), Malta (2/8), Monaco (1/1), Montserrat (1/2), Nigeria (2/9), the Northern
Mariana Islands (1/4), Oman (3/8), Pakistan (4/14), Panama (3/13), Peru (9/27), Qatar (3/14), Romania (3/6),
Saudi Arabia (1/5), Slovakia (10/23), Slovenia (4/15), South Korea (9/45), Tanzania (5/16), Thailand (17/45),
Trinidad and Tobago (6/27), Tunisia (2/10), the Ukraine (3/9), the United Arab Emirates (3/7), Uruguay
(12/34), and Venezuela (46/192). Unfortunately, for many South American countries (e.g., Venezuela), there
are no data available for 2006, which is why we excluded these from the country-specific analysis even though
the number of companies is relatively large. However, detailed results for all these countries are available upon
request. 2 We did not include Canadian insurers, which are covered in the database, but presented in a separate section
with different data fields.
16
As discussed above, there is widespread agreement in literature with regard to the
choice of inputs. We thus use labor, business services and material, debt capital, and
equity capital as inputs. Due to data availability, it was necessary to simplify this
scheme by combining labor and business services; only operating expenses (including
commissions) are available in the AM Best data. This simplification is common in
many other international comparisons (see Diacon/Starkey/O’Brien, 2002; Fenn et al.,
2008) for much the same reason it is made here. Furthermore, Ennsfell-
ner/Lewis/Anderson (2004) argue that the operating expenses should be treated as a
single input in order to reduce the number of parameters that will need to be estimated.
We thus use operating expenses to proxy both labor and business services and handle
these as a single input in the following analysis.
Cummins/Weiss (2000) showed in their analysis of operating expenses in the US in-
surance market that these are mostly labor related, e.g., in both life and non-life insur-
ance, the largest expenses are employee salaries and commissions. We therefore con-
centrate on labor to determine the price of the operating-expenses-related input factor.
The price of labor is determined using the ILO October Inquiry, a worldwide survey
of wages and hours of work published by the International Labour Organization (ILO;
see http://laborsta.ilo.org/) and used in a variety of efficiency applications (see, e.g.,
Fenn et al., 2008). The price of debt capital is determined using country-specific one-
year treasury bill rates for each year of the sample period; the price of equity capital is
determined using the yearly rate of total return of the country-specific MSCI stock
market indices (all data were obtained from the Datastream database; see Cummins/
Rubio-Misas (2006) for a comparable selection and a discussion on selection depend-
ing on the insurer’s capital structure and portfolio risk). To ensure that all monetary
values are directly comparable, we deflate each year’s value by the consumer price
index to the base year 2002 (see Weiss, 1991b; Cummins/Zi, 1998). Country-specific
consumer price indices were obtained from the International Labour Organization.
As is usual in most studies on efficiency in the insurance industry, we use the value-
added approach to determine the outputs. We thus distinguish between the three main
services provided by insurance companies—risk-pooling/-bearing, financial services,
and intermediation. According to Yuengert (1993), a good proxy for the amount of
risk-pooling/-bearing and financial services is the value of real incurred losses, defined
as current losses paid plus additions to reserves. As different types of services are pro-
vided by life and non-life insurance firms, we need separate output measures for each
type of firm (see Choi/Weiss, 2005). We use the present value of claims plus additions
to reserves as a proxy for the output volume for non-life insurance and the present
value of net incurred benefits plus additions to reserves for life insurance. As done, for
example, in Berger/Cummins/Weiss (1997), the price of risk-pooling/-bearing and
17
financial services is calculated as net premiums minus the volume proxy, expressed as
a ratio to the volume proxy. The output variable, which proxies the intermediation
function, is the real value of invested assets. To obtain present values we again deflate
each year’s value using the consumer price index. The price of the intermediation out-
put is the expected rate of return on assets (see Berger/Cummins/Weiss, 1997); we
therefore again use the yearly rate of total return of the country-specific MSCI stock
market indices.
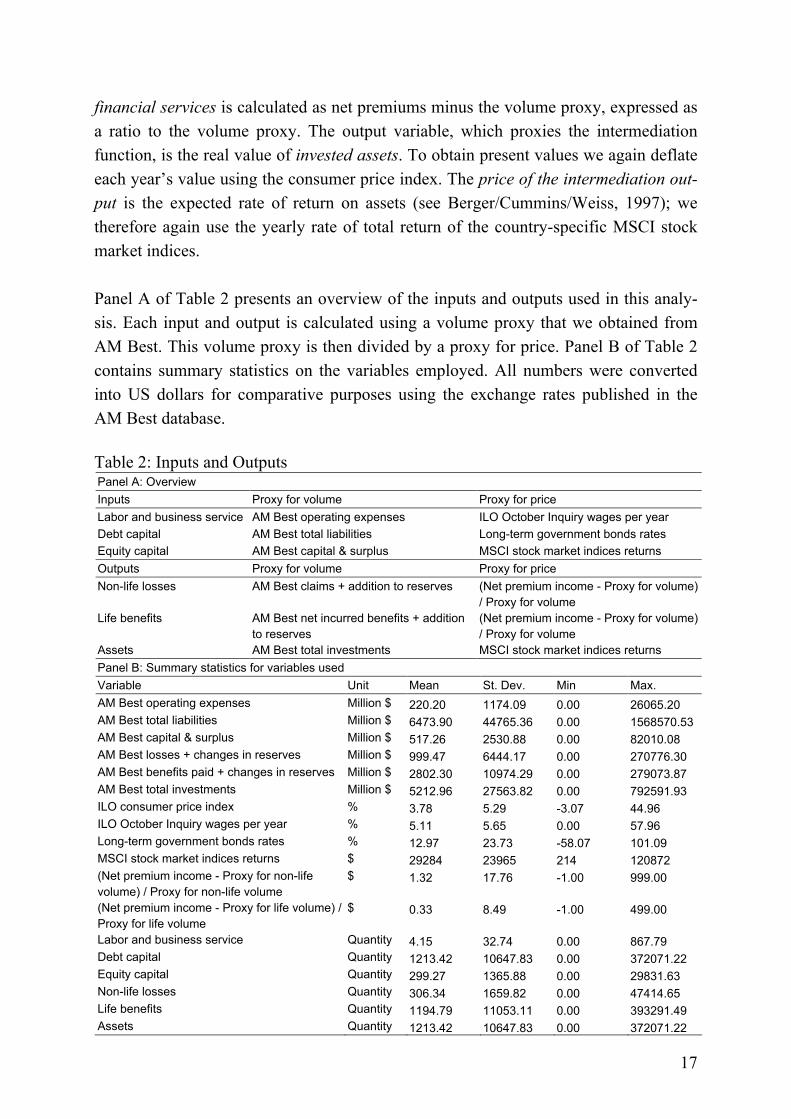
Panel A of Table 2 presents an overview of the inputs and outputs used in this analy-
sis. Each input and output is calculated using a volume proxy that we obtained from
AM Best. This volume proxy is then divided by a proxy for price. Panel B of Table 2
contains summary statistics on the variables employed. All numbers were converted
into US dollars for comparative purposes using the exchange rates published in the
AM Best database.
Table 2: Inputs and Outputs Panel A: Overview
Inputs Proxy for volume Proxy for price
Labor and business service AM Best operating expenses ILO October Inquiry wages per year
Debt capital AM Best total liabilities Long-term government bonds rates
Equity capital AM Best capital & surplus MSCI stock market indices returns
Outputs Proxy for volume Proxy for price
Non-life losses AM Best claims + addition to reserves (Net premium income - Proxy for volume)
/ Proxy for volume
Life benefits AM Best net incurred benefits + addition
to reserves
(Net premium income - Proxy for volume)
/ Proxy for volume
Assets AM Best total investments MSCI stock market indices returns
Panel B: Summary statistics for variables used
Variable Unit Mean St. Dev. Min Max.
AM Best operating expenses Million $ 220.20 1174.09 0.00 26065.20
AM Best total liabilities Million $ 6473.90 44765.36 0.00 1568570.53
AM Best capital & surplus Million $ 517.26 2530.88 0.00 82010.08
AM Best losses + changes in reserves Million $ 999.47 6444.17 0.00 270776.30
AM Best benefits paid + changes in reserves Million $ 2802.30 10974.29 0.00 279073.87
AM Best total investments Million $ 5212.96 27563.82 0.00 792591.93
ILO consumer price index % 3.78 5.29 -3.07 44.96
ILO October Inquiry wages per year % 5.11 5.65 0.00 57.96
Long-term government bonds rates % 12.97 23.73 -58.07 101.09
MSCI stock market indices returns $ 29284 23965 214 120872
(Net premium income - Proxy for non-life
volume) / Proxy for non-life volume
$ 1.32 17.76 -1.00 999.00
(Net premium income - Proxy for life volume) /
Proxy for life volume
$ 0.33 8.49 -1.00 499.00
Labor and business service Quantity 4.15 32.74 0.00 867.79
Debt capital Quantity 1213.42 10647.83 0.00 372071.22
Equity capital Quantity 299.27 1365.88 0.00 29831.63
Non-life losses Quantity 306.34 1659.82 0.00 47414.65
Life benefits Quantity 1194.79 11053.11 0.00 393291.49
Assets Quantity 1213.42 10647.83 0.00 372071.22
18
In the next section, we analyze two methodologies (data envelopment analysis, sto-
chastic frontier analysis), 37 countries (see Table 3 for listing), three organizational
forms (stocks, mutual, other), three distributional forms (agency based, direct writers,
both), three lines of business (life, non-life, groups), and three company sizes (large,
medium, small). For data envelopment analysis, we use Deap, Version 2.1 (see Coelli,
1996a) and calculate efficiency values assuming input orientation and variable returns
to scale. For stochastic frontier analysis, we calculate a translog production frontier
using Frontier, Version 4.1 (see Coelli, 1996b), assuming the inefficiencies to follow a
half-normal distribution. Company-specific information on domiciliary country, or-
ganization type, distribution type, and lines of business is extracted from the AM Best
database. Total assets is a widespread measure of insurer size (see, e.g., Cummins/Zi,
1998; Diacon/Starkey/O’Brien, 2002). For comparison of different company sizes, we
thus subdivide all companies by their total assets into large (total assets larger than
$816 million), medium, and small (total assets smaller than $64 million) insurers.
3.2. RESULTS
Data envelopment analysis
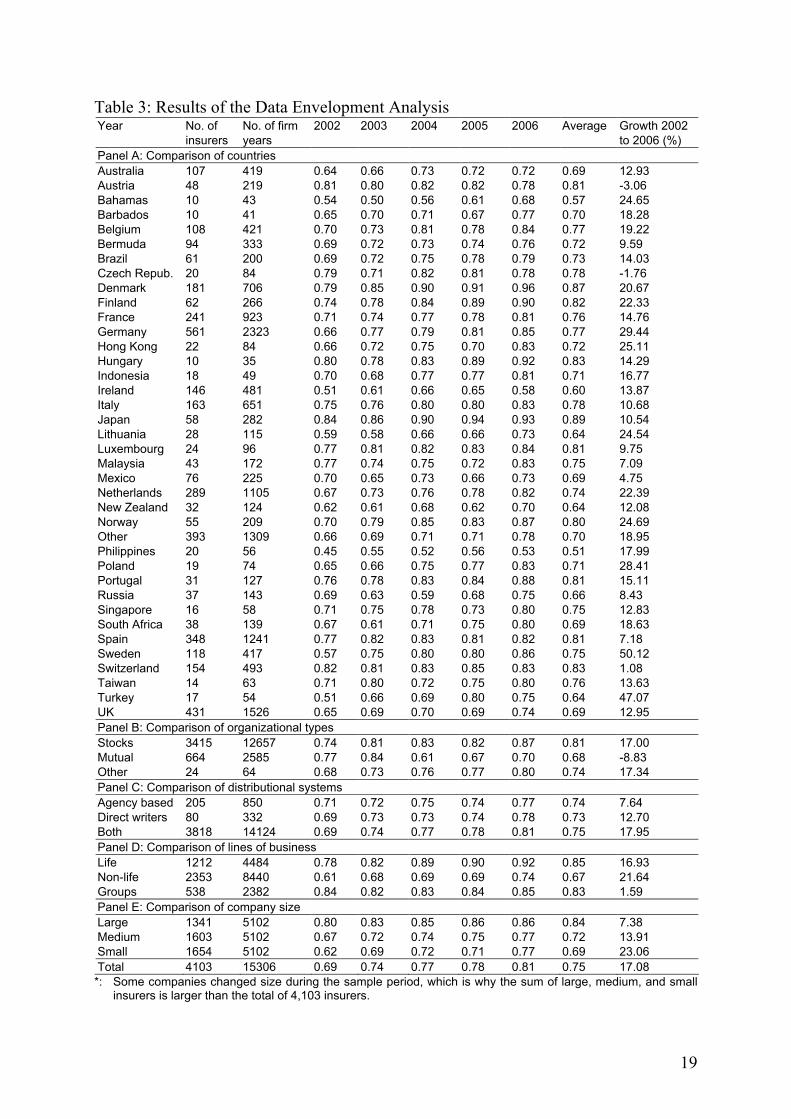
The results of the data envelopment analysis are set out in Table 3, presented at differ-
ent levels of aggregation so as to focus on different aspects of efficiency. The first fo-
cus is on countries (Panel A), the second on organization (Panel B), the third on distri-
bution (Panel C), the fourth on lines of business (Panel D), and the fifth on size (Panel
E). For comparison purposes, the average values are presented in the last line of the
table. Altogether our analysis covers 4,103 insurers, with a total of 15,306 firm years.
The last line of Table 3 shows that across all 4,103 companies efficiency increased by
17.08% from 2002 to 2006. There is a steady growth in efficiency from 0.69 in 2002
to 0.75 in 2006. However, large differences can be found between countries (see Panel
A). The country with the highest efficiency is Japan (average efficiency 0.89), fol-
lowed by Denmark (0.87) and Switzerland (0.83). The lowest efficiency values are
found for the Philippines (average efficiency 0.51), the Bahamas (0.57), and Ireland
(0.60). Overall, it appears that developed countries in Asia and Europe achieve higher
efficiency scores than do emerging market countries. The efficiency of the largest
economies under evaluation is in the upper-middle field: Germany is in 13th place
(average efficiency 0.77); France is in 15th place (0.76). Relatively low efficiency val-
ues were found for the United Kingdom, which is in 28th place (0.69). Considering the
development of efficiency over the sample period, the highest efficiency gains were
obtained in Sweden (+50.12%) and Turkey (+47.07%). Austria (–1.76%) and the
Czech Republic (–3.06%) are the only countries that did not increase efficiency from
2002 to 2006.
19
Table 3: Results of the Data Envelopment Analysis Year No. of
insurers No. of firm years
2002 2003 2004 2005 2006 Average Growth 2002 to 2006 (%)
Panel A: Comparison of countries
Australia 107 419 0.64 0.66 0.73 0.72 0.72 0.69 12.93 Austria 48 219 0.81 0.80 0.82 0.82 0.78 0.81 -3.06 Bahamas 10 43 0.54 0.50 0.56 0.61 0.68 0.57 24.65 Barbados 10 41 0.65 0.70 0.71 0.67 0.77 0.70 18.28 Belgium 108 421 0.70 0.73 0.81 0.78 0.84 0.77 19.22 Bermuda 94 333 0.69 0.72 0.73 0.74 0.76 0.72 9.59 Brazil 61 200 0.69 0.72 0.75 0.78 0.79 0.73 14.03 Czech Repub. 20 84 0.79 0.71 0.82 0.81 0.78 0.78 -1.76 Denmark 181 706 0.79 0.85 0.90 0.91 0.96 0.87 20.67 Finland 62 266 0.74 0.78 0.84 0.89 0.90 0.82 22.33 France 241 923 0.71 0.74 0.77 0.78 0.81 0.76 14.76 Germany 561 2323 0.66 0.77 0.79 0.81 0.85 0.77 29.44 Hong Kong 22 84 0.66 0.72 0.75 0.70 0.83 0.72 25.11 Hungary 10 35 0.80 0.78 0.83 0.89 0.92 0.83 14.29 Indonesia 18 49 0.70 0.68 0.77 0.77 0.81 0.71 16.77 Ireland 146 481 0.51 0.61 0.66 0.65 0.58 0.60 13.87 Italy 163 651 0.75 0.76 0.80 0.80 0.83 0.78 10.68 Japan 58 282 0.84 0.86 0.90 0.94 0.93 0.89 10.54 Lithuania 28 115 0.59 0.58 0.66 0.66 0.73 0.64 24.54 Luxembourg 24 96 0.77 0.81 0.82 0.83 0.84 0.81 9.75 Malaysia 43 172 0.77 0.74 0.75 0.72 0.83 0.75 7.09 Mexico 76 225 0.70 0.65 0.73 0.66 0.73 0.69 4.75 Netherlands 289 1105 0.67 0.73 0.76 0.78 0.82 0.74 22.39 New Zealand 32 124 0.62 0.61 0.68 0.62 0.70 0.64 12.08 Norway 55 209 0.70 0.79 0.85 0.83 0.87 0.80 24.69 Other 393 1309 0.66 0.69 0.71 0.71 0.78 0.70 18.95 Philippines 20 56 0.45 0.55 0.52 0.56 0.53 0.51 17.99 Poland 19 74 0.65 0.66 0.75 0.77 0.83 0.71 28.41 Portugal 31 127 0.76 0.78 0.83 0.84 0.88 0.81 15.11 Russia 37 143 0.69 0.63 0.59 0.68 0.75 0.66 8.43 Singapore 16 58 0.71 0.75 0.78 0.73 0.80 0.75 12.83 South Africa 38 139 0.67 0.61 0.71 0.75 0.80 0.69 18.63 Spain 348 1241 0.77 0.82 0.83 0.81 0.82 0.81 7.18 Sweden 118 417 0.57 0.75 0.80 0.80 0.86 0.75 50.12 Switzerland 154 493 0.82 0.81 0.83 0.85 0.83 0.83 1.08 Taiwan 14 63 0.71 0.80 0.72 0.75 0.80 0.76 13.63 Turkey 17 54 0.51 0.66 0.69 0.80 0.75 0.64 47.07 UK 431 1526 0.65 0.69 0.70 0.69 0.74 0.69 12.95
Panel B: Comparison of organizational types
Stocks 3415 12657 0.74 0.81 0.83 0.82 0.87 0.81 17.00 Mutual 664 2585 0.77 0.84 0.61 0.67 0.70 0.68 -8.83 Other 24 64 0.68 0.73 0.76 0.77 0.80 0.74 17.34
Panel C: Comparison of distributional systems
Agency based 205 850 0.71 0.72 0.75 0.74 0.77 0.74 7.64 Direct writers 80 332 0.69 0.73 0.73 0.74 0.78 0.73 12.70 Both 3818 14124 0.69 0.74 0.77 0.78 0.81 0.75 17.95
Panel D: Comparison of lines of business
Life 1212 4484 0.78 0.82 0.89 0.90 0.92 0.85 16.93 Non-life 2353 8440 0.61 0.68 0.69 0.69 0.74 0.67 21.64 Groups 538 2382 0.84 0.82 0.83 0.84 0.85 0.83 1.59
Panel E: Comparison of company size
Large 1341 5102 0.80 0.83 0.85 0.86 0.86 0.84 7.38 Medium 1603 5102 0.67 0.72 0.74 0.75 0.77 0.72 13.91 Small 1654 5102 0.62 0.69 0.72 0.71 0.77 0.69 23.06
Total 4103 15306 0.69 0.74 0.77 0.78 0.81 0.75 17.08 *: Some companies changed size during the sample period, which is why the sum of large, medium, and small
insurers is larger than the total of 4,103 insurers.
20
The second focus of our analysis concerns different organizational forms and their ef-
fects on efficiency (see Panel B of Table 3). We find evidence for the expense prefer-
ence hypothesis, as the average efficiency values of stock companies (0.81) are much
higher than those of mutual insurers (0.68). This finding is in line with most research
in the field, e.g., Cummins/Weiss/Zi (1999) and Erhemjamts/Leverty (2007). Other
legal forms (e.g., public companies) play only a very minor role in our sample. While
there is a steady growth in efficiency over time for stocks and other companies, we
find large variations and a decreasing efficiency for mutuals over time, an effect that
might be due to mergers, acquisitions, and demutualization occurring during the period
of investigation.
Panel C of Table 3 shows the results for different distribution systems. The DEA re-
sults do not confirm Ward’s (2002) finding that insurers focused on one distribution
system are more efficient than those using more than one system. Indeed, in our study,
the highest efficiency values are found for insurers using different distribution systems
(average efficiency 0.75), followed by agency based (0.74) and direct writers (0.73).
However, the differences are minor. Furthermore, note that the number of insurers that
identify as pure direct writer or agency based is relatively small in our sample (but still
large in absolute terms compared to other studies covering this aspect; e.g., Ward,
2002 covers 44 companies and Klumpes, 2004, 90 companies).
Interesting differences can be found when comparing different lines of business (see
Panel D of Table 3), a field that has not been in focus of literature to date. On a very
aggregate level (detailed results on less aggregated level are available upon request),
we compare life insurers, non-life insurers, and groups (i.e., companies offering both
life and non-life insurance). We find that average efficiency in life insurance is much
higher than in non-life insurance (0.85 vs. 0.67). This effect might be connected with
the size effects and economies of scale (see next paragraph) as, based on total assets,
the average life insurer is six times larger than the average non-life insurer. We find no
evidence for economies of scope; the multi-product/-branch firms are not more effi-
cient than specialized firms.
In Panel E of Table 3 the total sample is subdivided by total assets into three size
groups—large, medium, and small insurers. In agreement with most research on
economies of scale, we find that large companies have much higher efficiency than
small companies. Average efficiency for large companies is 0.84, while it is only 0.72
for medium companies, and 0.69 for small companies. However, smaller companies
have the most rapid gains in efficiency: from 2002 to 2006, efficiency increased for
21
large insurers by 7.38%, by 13.91% for medium insurers, and by 23.06% for small
insurers.
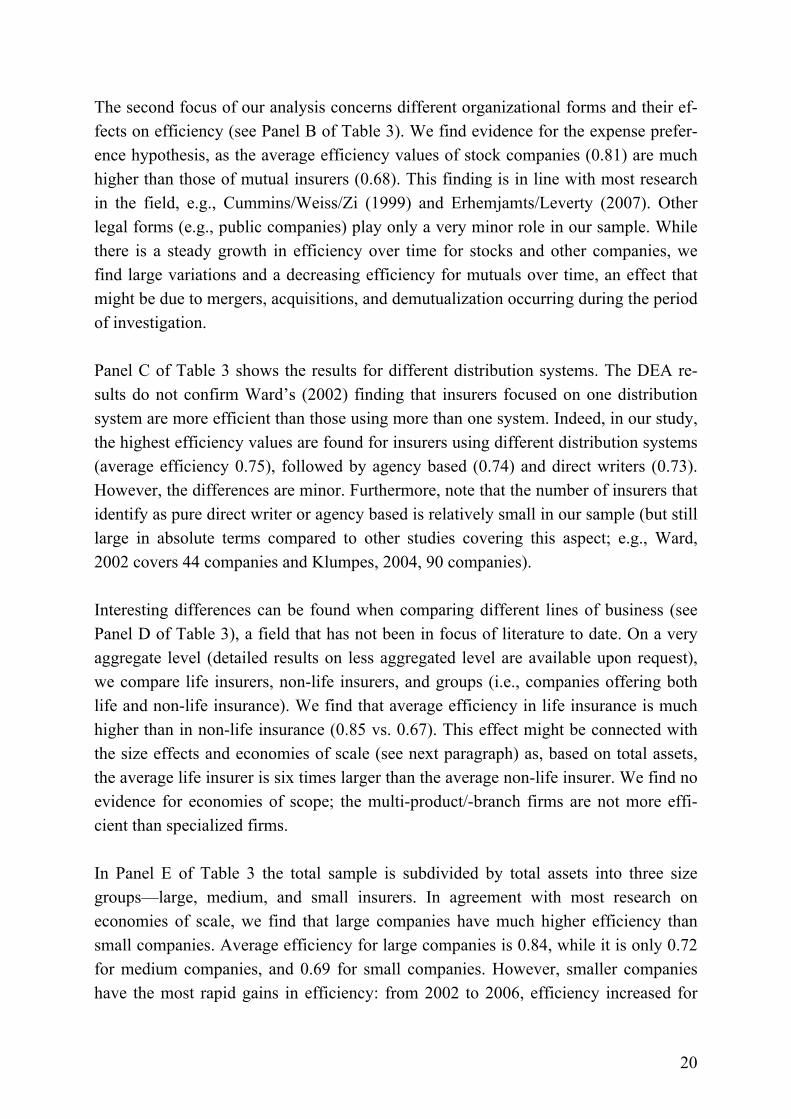
Stochastic frontier analysis
Table 4 is structured like Table 3 and shows the results of the stochastic frontier analy-
sis. Again, average efficiency is presented for different countries (Panel A), organiza-
tion types (Panel B), distribution systems (Panel C), lines of business (Panel D), and
company sizes (Panel E). The last line of the table shows the efficiency values of the
full sample. Below, we briefly highlight the main results and the main differences
compared to the DEA (Table 3).
One obvious difference between the results in Tables 3 and 4 is that the efficiency val-
ues are lower and more variable under the stochastic frontier analysis. The average
efficiency across all 4,103 companies is only 0.36 compared to 0.75 with the data en-
velopment analysis. Nevertheless, the results of the two types of analysis are very
similar, leading to identical economic insights. Under the SFA, efficiency increased by
30.20% from 2002 to 2006 and there is a growth in efficiency from 0.30 in 2002 to
0.38 in 2006. Large differences between countries are also found when employing sto-
chastic frontier analysis. The country with the highest efficiency is again Japan (aver-
age efficiency 0.62) and the country with the lowest efficiency is, again, the Philip-
pines (0.18). We again confirm the expense preference hypothesis: the average effi-
ciency value of stock companies (0.36) is higher than that of mutual insurers (0.33).
Again, efficiency in life insurance is on average much higher than in non-life insur-
ance (0.48 vs. 0.27). Efficiency for the multi-line groups (0.43) is lower than for the
mono-line life insurers; we thus, once more, find no evidence for economies of scope.
Finally, we find that efficiency for large companies (0.61 on average) is much higher
than for medium-sized (0.28) and small companies (0.19). All these observations con-
firm the results of the data envelopment analysis.
One difference between the results in Tables 4 and 3 has to do with distribution sys-
tems. The results of the SFA confirm Ward’s (2002) result that insurers focusing on
one distribution system have higher efficiency than those using more than one system.
Efficiency of agency-based insurers (0.51 on average) is again higher than that of di-
rect writers (0.45), but the individual efficiency of these two groups is now much
higher than the efficiency of those insurers using both (0.35). SFA thus provides more
clear results than DEA in this case. The finding that agency-based insurers are more
efficient than direct writers is in agreement with the findings of Brockett et al. (1998,
2004) for the United States and the findings of Klumpes (2004) for the United King-
dom.

22
Table 4: Results of the Stochastic Frontier Analysis Year No. of
insurers No. of firm years
2002 2003 2004 2005 2006 Average Growth 2002 to 2006 (%)
Panel A: Comparison of countries
Australia 107 419 0.34 0.52 0.35 0.44 0.34 0.40 0.15 Austria 48 219 0.29 0.42 0.33 0.50 0.29 0.37 -0.62 Bahamas 10 43 0.16 0.40 0.14 0.23 0.30 0.24 84.41 Barbados 10 41 0.27 0.26 0.29 0.33 0.22 0.27 -21.45 Belgium 108 421 0.28 0.40 0.28 0.38 0.32 0.33 12.78 Bermuda 94 333 0.32 0.35 0.37 0.45 0.30 0.36 -5.00 Brazil 61 200 0.19 0.37 0.17 0.32 0.31 0.26 64.50 Czech Repub. 20 84 0.18 0.29 0.19 0.37 0.21 0.25 18.48 Denmark 181 706 0.24 0.37 0.24 0.34 0.40 0.31 67.20 Finland 62 266 0.37 0.59 0.37 0.47 0.51 0.46 38.38 France 241 923 0.42 0.54 0.43 0.51 0.56 0.48 31.97 Germany 561 2323 0.35 0.52 0.32 0.42 0.45 0.41 28.39 Hong Kong 22 84 0.21 0.21 0.17 0.29 0.19 0.21 -7.85 Hungary 10 35 0.18 0.31 0.20 0.41 0.15 0.26 -19.89 Indonesia 18 49 0.23 0.19 0.20 0.39 0.14 0.22 -40.83 Ireland 146 481 0.27 0.40 0.25 0.35 0.28 0.31 4.83 Italy 163 651 0.39 0.55 0.42 0.51 0.49 0.47 25.84 Japan 58 282 0.56 0.73 0.54 0.66 0.60 0.62 6.01 Lithuania 28 115 0.15 0.20 0.14 0.27 0.18 0.19 17.46 Luxembourg 24 96 0.27 0.45 0.27 0.36 0.29 0.33 9.14 Malaysia 43 172 0.24 0.33 0.20 0.31 0.22 0.27 -7.18 Mexico 76 225 0.18 0.33 0.17 0.26 0.34 0.24 83.77 Netherlands 289 1105 0.32 0.41 0.30 0.38 0.34 0.35 6.48 New Zealand 32 124 0.20 0.29 0.18 0.26 0.22 0.23 12.29 Norway 55 209 0.32 0.34 0.33 0.38 0.40 0.35 26.99 Other 393 1309 0.20 0.32 0.20 0.38 0.27 0.26 35.72 Philippines 20 56 0.18 0.22 0.14 0.24 0.15 0.18 -14.53 Poland 19 74 0.29 0.43 0.27 0.33 0.29 0.33 -0.80 Portugal 31 127 0.27 0.45 0.28 0.38 0.28 0.34 4.33 Russia 37 143 0.18 0.25 0.18 0.33 0.15 0.22 -17.35 Singapore 16 58 0.24 0.20 0.20 0.32 0.24 0.24 -2.22 South Africa 38 139 0.26 0.44 0.30 0.40 0.50 0.36 89.25 Spain 348 1241 0.23 0.34 0.22 0.33 0.33 0.28 44.23 Sweden 118 417 0.31 0.39 0.31 0.41 0.41 0.36 35.28 Switzerland 154 493 0.37 0.41 0.32 0.41 0.54 0.38 47.40 Taiwan 14 63 0.36 0.40 0.33 0.43 0.32 0.37 -11.79 Turkey 17 54 0.19 0.25 0.22 0.33 0.22 0.23 12.14 UK 431 1526 0.27 0.49 0.34 0.45 0.39 0.39 44.40
Panel B: Comparison of organizational types
Stocks 3415 12657 0.30 0.43 0.30 0.42 0.39 0.36 30.58 Mutual 664 2585 0.29 0.40 0.27 0.36 0.38 0.33 29.79 Other 24 64 0.17 0.27 0.35 0.43 0.31 0.34 80.14
Panel C: Comparison of distributional systems
Agency based 205 850 0.48 0.54 0.48 0.56 0.49 0.51 0.82 Direct writers 80 332 0.44 0.50 0.41 0.50 0.39 0.45 -12.87 Both 3818 14124 0.28 0.42 0.28 0.39 0.38 0.35 33.41
Panel D: Comparison of lines of business
Life 1212 4484 0.31 0.73 0.30 0.49 0.61 0.48 96.20 Non-life 2353 8440 0.28 0.25 0.27 0.32 0.26 0.27 -5.69 Groups 538 2382 0.34 0.47 0.39 0.58 0.38 0.43 11.07
Panel E: Comparison of company size*
Large 1341 5102 0.52 0.73 0.53 0.65 0.60 0.61 14.38 Medium 1603 5102 0.24 0.37 0.22 0.31 0.23 0.28 -3.06 Small 1654 5102 0.17 0.23 0.14 0.23 0.18 0.19 4.92
Total 4103 15306 0.30 0.43 0.30 0.41 0.38 0.36 30.20 *: Some companies changed size during the sample period, which is why the sum of large, medium, and small
insurers is larger than the total of 4,103 insurers.
23
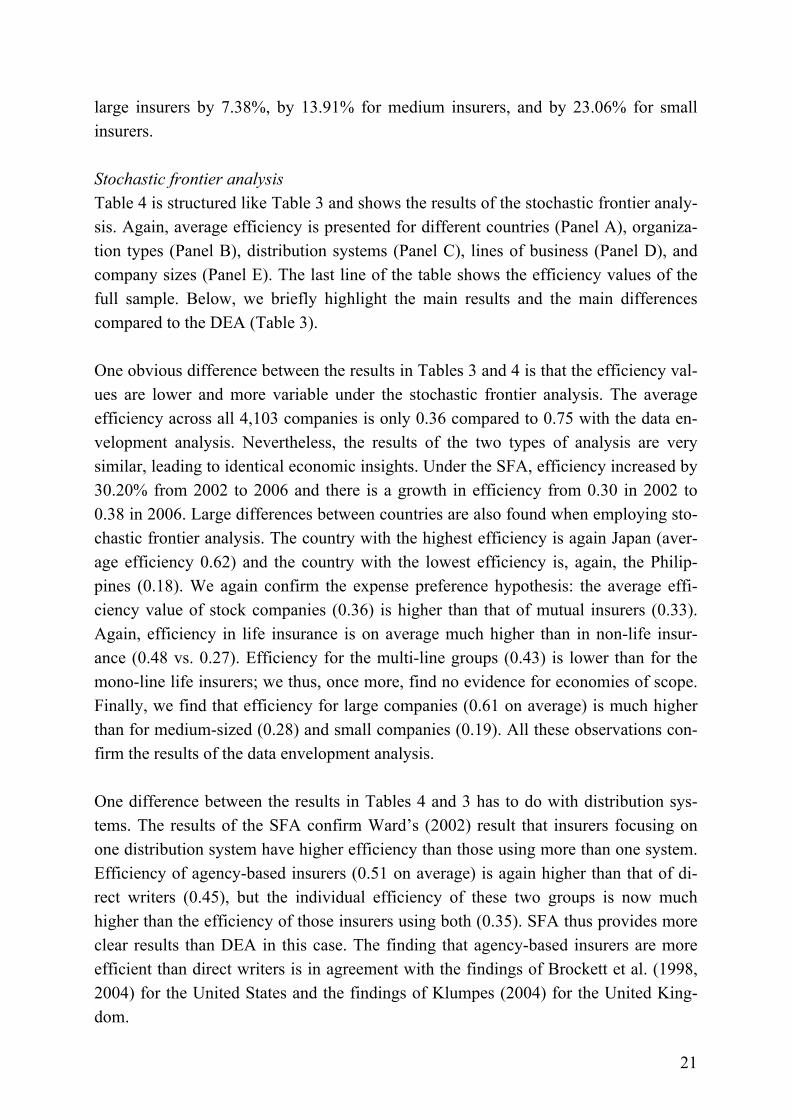
Further cross-sectional evidence and Tobit regression analysis
In this section we provide a cross-sectional analysis of the efficiency results presented
in Tables 3 and 4. Additional insights are provided by a Tobit regression analysis. The
groups shown in Table 5 are the result of combining the five comparison criteria from
the previous tables (countries, organization, distribution, line of business, size). We
ranked these groups according to their average efficiency score. To provide a sound
comparison, we display only the groups that have a minimum of ten firm years, result-
ing in a total of 261 groups.
Table 5: Results of Cross-Sectional Analysis Rank Country Organization Distribution Line of business Size Firm years Efficiency
Panel A: Based on efficiency values from data envelopment analysis
1 Japan Mutual Both Life Large 15 0.99
2 Denmark Stock Both Group Medium 11 0.98
3 Japan Mutual Agency Life Large 20 0.97
4 Denmark Stock Both Life Large 37 0.97
5 Denmark Mutual Both Life Large 86 0.97
6 Norway Stock Both Life Large 25 0.97
7 Japan Stock Agency Life Large 14 0.97
8 Brazil Stock Both Life Large 14 0.97
9 Japan Stock Both Non-Life Large 38 0.96
10 Spain Mutual Both Group Small 23 0.96
... … … … … … … …
261 Ireland Stock Agency Non-Life Medium 12 0.32
Panel B: Based on efficiency values from stochastic frontier analysis
1 Japan Mutual Both Life Large 15 0.91
2 Japan Mutual Agency Life Large 20 0.91
3 Netherlands Stock Agency Group Large 10 0.89
4 Japan Stock Agency Non-Life Large 25 0.89
5 France Stock Agency Group Large 29 0.87
6 Japan Stock Agency Life Large 14 0.86
7 Italy Stock Direct Group Large 0.85
8 Other Stock Agency Group Large 12 0.82
9 Other Stock Both Non-Life Large 11 0.82
10 Norway Mutual Both Non-Life Large 10 0.82
... … … … … … … …
261 Philippines Stock Both Non-Life Small 35 0.16
Panel A of Table 5 shows the results for the efficiency scores based on data envelop-
ment analysis. The best companies are large, mutual Japanese life insurers that use
both agents and direct writers (average efficiency score 0.99). The best ten groups are
dominated by companies from Japan (4 out of the top 10), by stocks (6 of 10), by
companies using both agency based and direct writers (8 of 10), companies operating
in life insurance (7 of 10), and by large companies (8 of 10). The worst group consists
of medium-sized Irish non-life insurers, which have an efficiency of 0.32.
24
In Panel B of Table 5, the results for the efficiency scores based on stochastic frontier
analysis are presented. The best group in Panel A (large, mutual Japanese life insurers
using both agents and direct writers) is also the best group in Panel B, the second best
group with the DEA (large, mutual Japanese life insurers using agents) is in third place
with SFA. We again find mostly Japanese companies among the best ten groups (4 of
10). In contrast to the DEA, there are no Danish companies among the best 10, but,
instead, insurers from the Netherlands, France, Italy, and Norway. The worst group
with SFA are small non-life insurers from the Philippines, which have an efficiency of
0.16. In summary, it appears that the most efficient companies are large life insurers
from Japan, operating as either stock or mutuals.
Finally, we conduct a Tobit regression analysis in order to identify the key drivers of
efficiency with respect to different independent variables. As the dependent variable
(i.e., the efficiency value) is limited between zero and one, standard regression coeffi-
cients will be underestimated and thus need to be corrected. This correction is pro-
vided by Tobin’s (1958) modified form of a standard regression analysis for the inves-
tigation of limited dependent variables. We determine Tobit regression parameters us-
ing the statistic software R. We use the following independent, explanatory variables
for our regression on the efficiency scores (see Diacon/Starkey/O’Brien (2002) for a
comparable selection): (1) organization (1 if company is stock; 0 otherwise), (2) distri-
bution (1 if both agency based and direct writers; 0 otherwise), (3) line of business (1
if life/group; 0 if non-life), (4) company size (natural logarithm of the total assets), and
(5) squared size (to capture nonlinearities between size and efficiency). Country and
year dummy variables are included to pick up country and time effects. The Tobit re-
gression results for the efficiency values based on data envelopment analysis are pre-
sented in Panel A of Table 6; the results based on stochastic frontier analysis in Panel
B of Table 6.
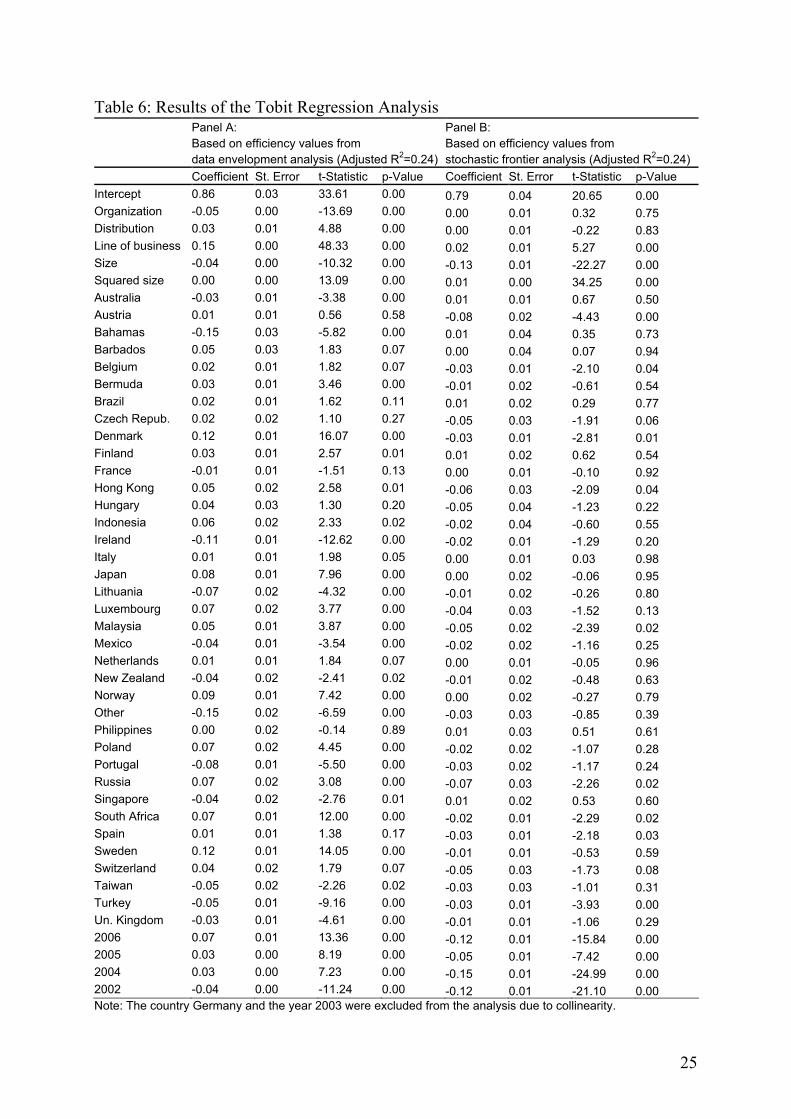
Considering Panel A, the results of the Tobit regression analysis confirm that organi-
zation and line of business are particularly and strongly associated with efficiency;
these have the (absolute) highest t-statistics and lowest p-values. Size and squared size
are also important for determining efficiency. The country dummies confirm the inter-
national differences previously identified. The results confirm the above findings that
the most efficient companies are insurers from Japan. Considering Panel B, the results
again show the importance of company size for efficiency. Surprisingly, though, and
in contrast to Panel A, organization and distribution do not significantly influence effi-
ciency. Line of business is again positively connected with efficiency.
25
Table 6: Results of the Tobit Regression Analysis Panel A:
Based on efficiency values from
data envelopment analysis (Adjusted R2=0.24)
Panel B:
Based on efficiency values from
stochastic frontier analysis (Adjusted R2=0.24)
Coefficient St. Error t-Statistic p-Value Coefficient St. Error t-Statistic p-Value
Intercept 0.86 0.03 33.61 0.00 0.79 0.04 20.65 0.00
Organization -0.05 0.00 -13.69 0.00 0.00 0.01 0.32 0.75
Distribution 0.03 0.01 4.88 0.00 0.00 0.01 -0.22 0.83
Line of business 0.15 0.00 48.33 0.00 0.02 0.01 5.27 0.00
Size -0.04 0.00 -10.32 0.00 -0.13 0.01 -22.27 0.00
Squared size 0.00 0.00 13.09 0.00 0.01 0.00 34.25 0.00
Australia -0.03 0.01 -3.38 0.00 0.01 0.01 0.67 0.50
Austria 0.01 0.01 0.56 0.58 -0.08 0.02 -4.43 0.00
Bahamas -0.15 0.03 -5.82 0.00 0.01 0.04 0.35 0.73
Barbados 0.05 0.03 1.83 0.07 0.00 0.04 0.07 0.94
Belgium 0.02 0.01 1.82 0.07 -0.03 0.01 -2.10 0.04
Bermuda 0.03 0.01 3.46 0.00 -0.01 0.02 -0.61 0.54
Brazil 0.02 0.01 1.62 0.11 0.01 0.02 0.29 0.77
Czech Repub. 0.02 0.02 1.10 0.27 -0.05 0.03 -1.91 0.06
Denmark 0.12 0.01 16.07 0.00 -0.03 0.01 -2.81 0.01
Finland 0.03 0.01 2.57 0.01 0.01 0.02 0.62 0.54
France -0.01 0.01 -1.51 0.13 0.00 0.01 -0.10 0.92
Hong Kong 0.05 0.02 2.58 0.01 -0.06 0.03 -2.09 0.04
Hungary 0.04 0.03 1.30 0.20 -0.05 0.04 -1.23 0.22
Indonesia 0.06 0.02 2.33 0.02 -0.02 0.04 -0.60 0.55
Ireland -0.11 0.01 -12.62 0.00 -0.02 0.01 -1.29 0.20
Italy 0.01 0.01 1.98 0.05 0.00 0.01 0.03 0.98
Japan 0.08 0.01 7.96 0.00 0.00 0.02 -0.06 0.95
Lithuania -0.07 0.02 -4.32 0.00 -0.01 0.02 -0.26 0.80
Luxembourg 0.07 0.02 3.77 0.00 -0.04 0.03 -1.52 0.13
Malaysia 0.05 0.01 3.87 0.00 -0.05 0.02 -2.39 0.02
Mexico -0.04 0.01 -3.54 0.00 -0.02 0.02 -1.16 0.25
Netherlands 0.01 0.01 1.84 0.07 0.00 0.01 -0.05 0.96
New Zealand -0.04 0.02 -2.41 0.02 -0.01 0.02 -0.48 0.63
Norway 0.09 0.01 7.42 0.00 0.00 0.02 -0.27 0.79
Other -0.15 0.02 -6.59 0.00 -0.03 0.03 -0.85 0.39
Philippines 0.00 0.02 -0.14 0.89 0.01 0.03 0.51 0.61
Poland 0.07 0.02 4.45 0.00 -0.02 0.02 -1.07 0.28
Portugal -0.08 0.01 -5.50 0.00 -0.03 0.02 -1.17 0.24
Russia 0.07 0.02 3.08 0.00 -0.07 0.03 -2.26 0.02
Singapore -0.04 0.02 -2.76 0.01 0.01 0.02 0.53 0.60
South Africa 0.07 0.01 12.00 0.00 -0.02 0.01 -2.29 0.02
Spain 0.01 0.01 1.38 0.17 -0.03 0.01 -2.18 0.03
Sweden 0.12 0.01 14.05 0.00 -0.01 0.01 -0.53 0.59
Switzerland 0.04 0.02 1.79 0.07 -0.05 0.03 -1.73 0.08
Taiwan -0.05 0.02 -2.26 0.02 -0.03 0.03 -1.01 0.31
Turkey -0.05 0.01 -9.16 0.00 -0.03 0.01 -3.93 0.00
Un. Kingdom -0.03 0.01 -4.61 0.00 -0.01 0.01 -1.06 0.29
2006 0.07 0.01 13.36 0.00 -0.12 0.01 -15.84 0.00
2005 0.03 0.00 8.19 0.00 -0.05 0.01 -7.42 0.00
2004 0.03 0.00 7.23 0.00 -0.15 0.01 -24.99 0.00
2002 -0.04 0.00 -11.24 0.00 -0.12 0.01 -21.10 0.00 Note: The country Germany and the year 2003 were excluded from the analysis due to collinearity.
26
4. CONCLUSION
The purpose of this paper was to review recent studies on efficiency in the insurance
industry and to provide new empirical evidence on this widely discussed topic. Our
overview extends two earlier surveys, one by Berger/Humphrey (1997) and the other
by Cummins/Weiss (2000), and analyzes 83 studies on efficiency measurement in the
insurance industry. Our results show that during the last several years, methodologies
have been refined, new topics have been addressed, and geographic coverage has been
extended beyond a US focused view to a broad set of countries. The large number of
studies illustrates the increasing interest in the international competitiveness and effi-
ciency of insurance companies.
In the second part of the paper, we extended existing cross-country comparisons of
efficiency in the insurance industry by analyzing a broad international dataset that has
not yet been the subject of an efficiency study. The cross-country analysis covers data
on 3,710 insurance companies from 37 countries, which makes our dataset, at least to
our knowledge, the largest ever analyzed in insurance-related efficiency literature. A
total of 15,306 firm years were analyzed using both data envelopment analysis (DEA)
and stochastic frontier analysis (SFA), which allows us to provide a broad range of
new insights into the efficiency of the international insurance industry:
� During the sample period from 2002 to 2006, we find a steady growth in efficiency
in the international insurance markets, although there are large differences between
countries. In our cross-country comparison, Japan is the most efficient country,
while insurers from the Philippines have the lowest efficiency values.
� We are the first to determine efficiency for the following 15 countries: the Bahamas
(0.57 average efficiency under DEA/0.24 average efficiency under SFA), Barbados
(0.70/0.27), Bermuda (0.72/0.36), Brazil (0.73/0.26), the Czech Republic
(0.78/0.25), Hong Kong (0.72/0.21), Hungary (0.83/0.26), Indonesia (0.71/0.22),
Lithuania (0.64/0.19), Mexico (0.69/0.24), Norway (0.80/0.35), Poland (0.71/0.33),
Russia (0.66/0.22), Singapore (0.75/0.24), and South Africa (0.69/0.36).
� The results illustrate that SFA provides lower efficiency values than DEA. How-
ever, in general, the results of the two approaches and the economic insights that
can be derived from them are actually very similar. One exception to this general
similarity has to do with different distribution types (agency-based vs. direct writ-
ers): the results of the SFA are in accordance with existing literature, which shows
that agency-based insurers are more efficient than direct writers; however, no dif-
ference in efficiency based on distribution type is found with DEA.
� In accordance with most other research on the topic, we find evidence for the ex-
pense preference hypothesis, which states that the average efficiency value of stock
27
companies is higher than that of mutual insurers. Again in line with most of the lit-
erature, we find that the efficiency of large insurers is higher than the efficiency of
small insurers, which is evidence for economies of scale. However, in contrast to
most other efficiency studies (see, e.g., Meador/Ryan/Schellhorn, 2000; Cum-
mins/Weiss/Zi, 2003; Fuentes/Grifell-Tatjé/Perelman, 2005), we find no evidence
for economies of scope in the international insurance industry. All results are con-
firmed by both DEA and SFA.
� Further cross sectional analysis including a Tobit regression analysis reveal that
organization type and line of business are strongly associated with efficiency. The
most efficient insurers are large companies selling life insurance in Japan.
All these results provide valuable insights into the competitiveness of insurers in dif-
ferent countries. Frontier efficiency methodologies can be used to determine im-
provement potential for different economies by measuring industry performance rela-
tive to the best practice industries. At the individual-company level, the results can be
used to compare performance with other firms in the industry and to identify areas and
operations that need improvement. A number of implications for different managerial
decisions can be drawn, including, e.g., decisions on mergers and acquisitions, organi-
zation, and distribution.
Further research should be undertaken to validate the results presented in this first
draft of the paper. Additional frontier efficiency methodologies (e.g., the distribution-
free approach presented by Meador/Ryan/Schellhorn (2000)), further cross-sectional
tests, and different types of efficiency (technical, scale, cost, revenue, and profit effi-
ciency) might be addressed. Furthermore, in order to deepen the integration of the re-
sults with existing literature, the results should be analyzed at a more disaggregated
level, for example, the results might be broken down by different countries and com-
pared to the results found for different countries in existing literature. Another idea
worth pursuit is to analyze the different lines of business at a more disaggregated level,
especially for the non-life insurance industry. We would be delighted to present our
paper, along with some of this further research, at the conference on “Performance
Measurement in the Financial Services Sector” and to contribute to a special issue of
the Journal of Banking and Finance.
28
REFERENCES
Badunenko, O., Grechanyuk, B., Talavera, O., 2006. Development Under Regulation:
The Way of the Ukrainian Insurance Market. Discussion Papers of DIW Berlin
644, DIW Berlin, German Institute for Economic Research.
Banker, R. D., 1993. Maximum Likelihood, Consistency and Data Envelopment
Analysis: A Statistical Foundation. Management Science 39 (10), 1265–1273.
Banker, R. D., Charnes, A., Cooper, W. W., Swarts, J., Thomas, D. A., 1989. An In-
troduction to Data Envelopment Analysis with Some of its Models and Their Uses.
In: Chan, J. L., Patton, J. M., eds., Research in Governmental and Non-Profit Ac-
counting, Vol. 5, JAI Press, Greenwich, 125–164.
Barros, P., Barroso, N., Borges, M. R., 2005. Evaluating the Efficiency and Productiv-
ity of Insurance Companies with a Malmquist Index: A Case Study for Portugal.
Geneva Papers on Risk and Insurance 30 (2), 244–267.
Barros, P., Obijiaku, E. L., 2007. Technical Efficiency of Nigerian Insurance Compa-
nies. Department of Economics, Institute for Economics and Business Administra-
tion (ISEG), Technical University of Lisbon. Working Papers No. 18.
Berger, A. N., Cummins, J. D., Weiss, M. A., 1997. The Coexistence of Multiple Dis-
tribution Systems for Financial Services: The Case of Property-Liability Insurance.
Journal of Business 70 (4), 515–546.
Berger, A. N., Cummins, J. D., Weiss, M. A., Zi, H., 2000. Conglomeration Versus
Strategic Focus: Evidence from the Insurance Industry. Journal of Financial In-
termediation 9 (4), 323–362.
Berger, A. N., Humphrey, D. B., 1992. Measurement and Efficiency Issues in Com-
mercial Banking. In: Griliches, Z., ed., Output Measurement in the Service Sectors,
Vol. 56, National Bureau of Economic Research, Studies in Income and Wealth,
University of Chicago Press (Chicago, IL), 245–279.
Berger, A. N., Humphrey, D. B., 1997. Efficiency of Financial Institutions: Interna-
tional Survey and Directions for Future Research. European Journal of Opera-
tional Research 98 (2), 175–212.
Bernstein, J. I., 1999. Total Factor Productivity Growth in the Canadian Life Insurance
Industry: 1979–1989. Canadian Journal of Economics 32 (2), 500–517.
Bikker, J. A., van Leuvensteijn, M., 2008. Competition and Efficiency in the Dutch
Life Insurance Industry. Applied Economics (forthcoming).
Boonyasai, T., Grace, M. F., Skipper, Jr., H. D., 2002. The Effect of Liberalization and
Deregulation on Life Insurer Efficiency. Working Paper No. 02-2, Center for Risk
Management and Insurance Research, Georgia State University, Atlanta.
Brockett, P. L., Cooper, W. W., Golden, L. L., Rousseau, J. J., Wang, Y., 1998. DEA
Evaluations of the Efficiency of Organizational Forms and Distribution Systems in
the US Property and Liability Insurance Industry. International Journal of Systems
Science 29 (11), 1235–1247.
29
Brockett, P. L., Cooper, W. W., Golden, L. L., Rousseau, J. J., Wang, Y., 2004. Evalu-
ating Solvency Versus Efficiency Performance and Different Forms of Organiza-
tion and Marketing in US Property-Liability Insurance Companies. European
Journal of Operational Research 154 (2), 492–514.
Brockett, P. L., Cooper, W. W., Golden, L. L., Rousseau, J. J., Wang, Y., 2005. Finan-
cial Intermediary Versus Production Approach to Efficiency of Marketing Distri-
bution Systems and Organizational Structure of Insurance Companies. Journal of
Risk and Insurance 72 (3), 393–412.
Carr, R. M., Cummins, J. D., Regan, L., 1999. Efficiency and Competitiveness in the
U.S. Life Insurance Industry: Corporate, Product, and Distribution Strategies. In:
Cummins, J. D., Santomero, A. M., eds., Changes in the Life Insurance Industry:
Efficiency, Technology and Risk Management. Kluwer Academic Publishers, Bos-
ton, MA.
Chaffai, M. E., Ouertani, M. N., 2002. Technical Efficiency in the Tunisian Insurance
Industry: A Comparison of Parametric and Non Parametric Time Variant Models.
Working Paper, Research Unit on Production Econometrics, Sfax University, Sfax.
Charnes, A., Cooper, W. W., Lewin, A., Seiford, L., 1994. Data Envelopment Analy-
sis: Theory, Methodology and Applications. Kluwer Academic Publishers, Boston,
MA.
Charnes, A., Cooper, W. W., Rhodes, E., 1978. Measuring the Efficiency of Decision
Making Units. European Journal of Operational Research 2 (6), 429–444.
Choi, P. B., Weiss, M. A., 2005. An Empirical Investigation of Market Structure, Effi-
ciency, and Performance in Property-Liability Insurance. Journal of Risk and In-
surance 72 (4), 635–673.
Coelli, T. J., 1996a. A Guide to Deap Version 2.1: A Data Envelopment Analysis
(Computer) Program, Working Paper No. 8/96, Department of Econometrics, Uni-
versity of New England.
Coelli, T. J., 1996b. A Guide to Frontier 4.1: A Computer Program for Stochastic
Frontier Production and Cost Function Estimation, Working Paper No. 7/96, De-
partment of Econometrics, University of New England.
Cooper, W. W., Seiford, L. M., Tone, K., 2006. Introduction to Data Envelopment
Analysis and its Uses. Springer, Berlin/Heidelberg/New York.
Cummins, J. D., 1999. Efficiency in the U.S. Life Insurance Industry: Are Insurers
Minimizing Costs and Maximizing Revenues? In: Cummins, J. D., Santomero, A.
M., eds., Changes in the Life Insurance Industry: Efficiency, Technology and Risk
Management. Kluwer Academic Publishers, Boston, MA.
Cummins, J. D., Dionne, G., Gagné, R., Nouira, A., 2006. Efficiency of Insurance
Firms with Endogenous Risk Management and Financial Intermediation Activities.
Working Paper.
Cummins, J. D., Nini, G. P., 2002. Optimal Capital Utilization by Financial Firms:
Evidence from the Property-Liability Insurance Industry. Journal of Financial Ser-
vices Research 21 (1–2), 15–53.
30
Cummins, J. D., Rubio-Misas, M., 2006. Deregulation, Consolidation, and Efficiency:
Evidence from the Spanish Insurance Industry. Journal of Money, Credit, and
Banking 38 (2), 323–355.
Cummins, J. D., Rubio-Misas, M., Zi, H., 2004. The Effect of Organizational Structure
on Efficiency: Evidence from the Spanish Insurance Industry. Journal of Banking
and Finance 28 (12), 3113–3150.
Cummins, J. D., Tennyson, S., Weiss, M. A., 1999. Consolidation and Efficiency in
the US Life Insurance Industry. Journal of Banking and Finance 23 (2–4), 325–
357.
Cummins, J. D., Turchetti, G., Weiss, M. A., 1996. Productivity and Technical Effi-
ciency Italian Insurance Industry. Working Paper, Wharton Financial Institutions
Center, University of Pennsylvania, PA.
Cummins, J. D., Weiss, M. A., 1993. Measuring Cost Efficiency in the Property-
Liability Insurance Industry. Journal of Banking and Finance 17 (2–3), 463–481.
Cummins, J. D., Weiss, M. A., 2000. Analyzing Firm Performance in the Insurance
Industry Using Frontier Efficiency Methods. In: Dionne, G., ed., Handbook of In-
surance Economics. Kluwer Academic Publishers, Boston, MA.
Cummins, J. D., Weiss, M. A., Zi, H., 1999. Organizational Form and Efficiency: The
Coexistence of Stock and Mutual Property-Liability Insurers. Management Science
45 (9), 1254–1269.
Cummins, J. D., Weiss, M. A., Zi, H., 2003. Economics of Scope in Financial Ser-
vices: A DEA Bootstrapping Analysis of the US Insurance Industry. Working Pa-
per, The Wharton School, Philadelphia, PA.
Cummins, J. D., Xie, X., 2008. Mergers and Acquisitions in the US Property-Liability
Insurance Industry: Productivity and Efficiency Effects. Journal of Banking and
Finance 32 (1), 30–55.
Cummins, J. D., Zi, H., 1998. Comparison of Frontier Efficiency Methods: An Appli-
cation to the U.S. Life Insurance Industry. Journal of Productivity Analysis 10 (2),
131–152.
Delhausse, B., Fecher, F., Pestieau, P., 1995. Measuring Productive Performance in
the Non-Life Insurance Industry: The Case of French and Belgian Markets.
Tijdschrift voor Economie en Management 40 (1), 47–69.
Diacon, S. R., 2001. The Efficiency of UK General Insurance Companies. Working
Paper, Centre for Risk & Insurance Studies, University of Nottingham.
Diacon, S. R., Starkey, K., O’Brien, C., 2002. Size and Efficiency in European Long-
Term Insurance Companies: An International Comparison. Geneva Papers on Risk
and Insurance 27 (3), 444–466.
Diboky, F., Ubl, E., 2007. Ownership and Efficiency in the German Life Insurance
Market: A DEA Bootstrap Approach. Working Paper.
Donni, O., Fecher, F., 1997. Efficiency and Productivity of the Insurance Industry in
the OECD Countries. Geneva Papers on Risk and Insurance 22 (84), 523–535.
31
Donni, O., Hamende, V., 1993. Performance des Sociétés Belges D’Assurance-
Comparaison des formes institutionelles. Annals of Public and Cooperative Eco-
nomics, Université de Liège.
Ennsfellner, K. C., Lewis, D., Anderson, R. I., 2004. Production Efficiency in the Aus-
trian Insurance Industry: A Bayesian Examination. Journal of Risk and Insurance
71 (1), 135–159.
Erhemjamts, O., Leverty, J. T., 2007. The Demise of the Mutual Organizational Form:
An Investigation of the Life Insurance Industry. Working Paper.
Farrell, M. J., 1957. The Measurement of Productive Efficiency. Journal of the Royal
Statistical Society A 120 (3), 253–281.
Fecher, F., Kessler, D., Perelman, S., Pestieau, P., 1993. Productive Performance in
the French Insurance Industry. Journal of Productivity Analysis 4 (1–2), 77–93.
Fecher, F., Perelman, S., Pestieau, P., 1991. Scale Economics and Performance in the
French Insurance Industry. Geneva Papers on Risk and Insurance 16 (60), 315–
326.
Fenn, P., Vencappa, D., Diacon, S., Klumpes, P., O’Brien, C., 2008. Market Structure
and the Efficiency of European Insurance Companies: A Stochastic Frontier
Analysis. Journal of Banking and Finance 32 (1), 86–100.
Fuentes, H., Grifell-Tatjé, E., Perelman, S., 2001. A Parametric Distance Function
Approach for Malmquist Productivity Index Estimation. Journal of Productivity
Analysis 15 (2), 79–94.
Fuentes, H., Grifell-Tatjé, E., Perelman, S., 2005. Product Specialization, Efficiency
and Productivity Change in the Spanish Insurance Industry. Working Paper, Uni-
versité de Liège.
Fukuyama, H., 1997. Investigating Productive Efficiency and Productivity Changes of
Japanese Life Insurance Companies. Pacific-Basin Finance Journal 5 (4), 481–
509.
Fukuyama, H., Weber, W. L., 2001. Efficiency and Productivity Change of Non-Life
Insurance Companies in Japan. Pacific Economic Review 6 (1), 129–146.
Gardner, L. A., Grace, M. F., 1993. X-Efficiency in the US Life Insurance Industry.
Journal of Banking and Finance 17 (2–3), 497–510.
Greene, W. H., 1993. The Econometric Approach to Efficiency Analysis. In: Fried, H.
O., Lovell, C. A. K., Schmidt, S. S., eds., The Measurement of Productive Effi-
ciency: Techniques and Applications. Oxford University Press, Oxford, 68–119.
Greene, W. H., Segal, D., 2004. Profitability and Efficiency in the U.S. Life Insurance
Industry. Journal of Productivity Analysis 21 (3), 229–247.
Grosskopf, S., 1993. Efficiency and Productivity. In: Fried, H. O., Lovell, C. A. K.,
Schmidt, S. S., eds., The Measurement of Productive Efficiency: Techniques and
Applications. Oxford University Press, Oxford.
Hancock, D., 1985. The Financial Firm: Production with Monetary and Non-Monetary
Goods. Journal of Political Economy 93 (5), 859–880.
32
Hao, J. C. J., 2007. Efficiency Test on Taiwan’s Life Insurance Industry-Using X-
Efficiency Approach. Information and Management Sciences 18 (1), 37–48.
Hao, J. C. J., Chou, L. Y., 2005. The Estimation of Efficiency for Life Insurance In-
dustry: The Case in Taiwan. Journal of Asian Economics 16 (5), 847–860.
Hardwick, P., 1997. Measuring Cost Inefficiency in the UK Life Insurance Industry.
Applied Financial Economics 7 (1), 37–44.
Hardwick, P., Adams, M., Zou, H., 2004. Corporate Governance and Cost Efficiency
in the United Kingdom Life Insurance Industry. Working Paper.
Hirao, Y., Inoue, T., 2004. On the Cost Structure of the Japanese Property-Casualty
Insurance Industry. Journal of Risk and Insurance 71 (3), 501–530.
Huang, W., 2007. Efficiency in the China Insurance Industry: 1999–2004. Working
Paper.
Hussels, S., Ward, D. R., 2006. The Impact of Deregulation on the German and UK
Life Insurance Markets: An Analysis of Efficiency and Productivity between
1991–2002. Working Paper, Cranfield Research Paper Series (4).
Hwang, S. N., Kao, C., 2008. Efficiency Decomposition in Two-Stage Data Envelop-
ment Analysis: An Application to Non-Life Insurance Companies in Taiwan.
European Journal of Operational Research 185 (1), 418–429.
Hwang, T., Gao, S. S., 2005. An Empirical Study of Cost Efficiency in the Irish Life
Insurance Industry. International Journal of Accounting, Auditing and Perform-
ance Evaluation 2 (3), 264–280.
Jeng, V., Lai, G. C., 2005. Ownership Structure, Agency Costs, Specialization, and
Efficiency: Analysis of Keiretsu and Independent Insurers in the Japanese Nonlife
Insurance Industry. Journal of Risk and Insurance 72 (1), 105–158.
Jeng, V., Lai, G. C., McNamara, M. J., 2007. Efficiency and Demutualization: Evi-
dence from the U.S. Life Insurance Industry in the 1980s and 1990s. Journal of
Risk and Insurance 74 (3), 683–711.
Kessner, K., 2001a. Ein Effizienzvergleich deutscher und britischer
Lebensversicherungen. In: Markttransparenz und Produktionseffizienz in der
deutschen Lebensversicherung. Dissertation, Ludwig-Maximilians-Universität
München.
Kessner, K., 2001b. Skaleneffizienz und Produktivitätswachstum in der deutschen
Lebensversicherung. In: Markttransparenz und Produktionseffizienz in der
deutschen Lebensversicherung. Dissertation, Ludwig-Maximilians-Universität
München.
Kessner, K., Polborn, M., 1999. Eine Effizienzanalyse der deutschen
Lebensversicherer—die Best Practice Methode. Zeitschrift für die gesamte
Versicherungswissenschaft 88, 469–488
Kim, H., Grace, M. F., 1995. Potential Ex Post Efficiency Gains of Insurance Com-
pany Mergers. Working Paper, Center for RMI Research 95-4, College of Business
Administration, Georgia State University, Atlanta.
33
Klumpes, P. J. M., 2004. Performance Benchmarking in Financial Services: Evidence
from the UK Life Insurance Industry. Journal of Business 77 (2), 257–274.
Klumpes, P. J. M., 2007. Consolidation and Efficiency in the Major European Insur-
ance Markets. Working Paper, Imperial College, London.
Leverty, T., Lin, Y., Zhou, H., 2004. Firm Performance in the Chinese Insurance In-
dustry. Working Paper.
Mahlberg, B., 1999. Effizienzmessung österreichischer und deutscher
Versicherungen—Ein Vergleich. Wirtschaftspolitische Blätter 46 (4), 400–406.
Mahlberg, B., 2000. Technischer Fortschritt und Produktivitätsveränderungen in der
deutschen Versicherungswirtschaft. Jahrbücher für Nationalökonomik und Statistik
220 (5).
Mahlberg, B., Url, T., 2000. The Transition to the Single Market in the German Insur-
ance Industry. Working Paper, Austrian Institute of Economic Research.
Mahlberg, B., Url, T., 2003. Effects of the Single Market on the Austrian Insurance
Industry. Empirical Economics 28, 813–838.
Mansor, S. A., Radam, A., 2000. Productivity and Efficiency Performance of the Ma-
laysian Life Insurance Industry. Jurnal Ekonomi Malaysia 34, 93–105.
Mayers, D., Smith, C. W., 1988. Ownership Structure Across Lines of Property-
Casualty Insurance. Journal of Law and Economics 31, 351–378.
Meador, J. W., Ryan, Jr., H. E., Schellhorn, C. D., 2000. Product Focus Versus Diver-
sification: Estimates of X-Efficiency for the US Life Insurance Industry. Working
Paper, Wharton Financial Institutions Center University of Pennsylvania.
Mester, L. J., 1991. Agency Costs Among Savings and Loans. Journal of Financial
Intermediation 1, 257–278.
Noulas, A. G., Hatzigayios, T., Lazaridis, J., Lyroudi, K., 2001. Non-Parametric Pro-
duction Frontier Approach to the Study of Efficiency of Non-Life Insurance Com-
panies in Greece. Journal of Financial Management and Analysis 14 (1), 19–26.
Qiu, S., Chen, B., 2006. Efficiencies of Life Insurers in China—An Application of
Data Envelopment Analysis. Working Paper.
Rai, A., 1996. Cost Efficiency of International Insurance Firms. Journal of Financial
Services Research 10 (3), 213–233.
Rees, R., Kessner, E., Klemperer, P., Matutes, C., 1999. Regulation and Efficiency in
European Insurance Markets. Economic Policy 14 (29), 363–397.
Ryan, Jr., H. E., Schellhorn, C. D., 2000. Life Insurer Cost Efficiency Before and Af-
ter Implementation of the NAIC Risk-Based Capital Standards. Journal of Insur-
ance Regulation 18 (3), 362–384.
Simar, L., Wilson, P. W., 1998. Sensitivity Analysis of Efficiency Scores: How to
Bootstrap in Nonparametric Frontier Models. Management Science 44 (11), 49–61.
Tobin, J., 1958. Estimation of Relationships for Limited Dependent Variables.
Econometrica 26 (1), 24–36.
Toivanen, O., 1997. Economies of Scale and Scope in the Finnish Non-Life Insurance
Industry. Journal of Banking and Finance 21 (6), 759–779.
34
Tone, K., Sahoo, B. K., 2005. Evaluating Cost Efficiency and Returns to Scale in the
Life Insurance Corporation of India Using Data Envelopment Analysis. Socio-
Economics Planning Sciences 39 (4), 261–285.
Ward, D., 2002. The Costs of Distribution in the UK Life Insurance Market. Applied
Economics 34 (15), 1959–1968.
Weiss, M. A., 1986. Analysis of Productivity at the Firm Level: An Application to
Life Insurers. Journal of Risk and Insurance 53 (1), 49–84.
Weiss, M. A., 1991a. Efficiency in the Property-Liability Insurance Industry. Journal
of Risk and Insurance 58 (3), 452–479.
Weiss, M. A., 1991b. International P/L Insurance Output, Input, and Productivity
Comparisons. Geneva Papers on Risk and Insurance Theory 16 (2), 179–200.
Worthington, A. C., Hurley, E. V., 2002. Cost Efficiency in Australian General Insur-
ers: A Non-Parametric Approach. The British Accounting Review 34 (2), 89–108.
Wu, D., Yang, Z., Vela, S., Liang, L., 2007. Simultaneous Analysis of Production and
Investment Performance of Canadian Life and Health Insurance Companies Using
Data Envelopment Analysis. Computers & Operations Research 34 (1), 180–198.
Yang, Z., 2006. A Two-Stage DEA Model to Evaluate the Overall Performance of Ca-
nadian Life and Health Insurance Companies and Computer. Mathematical and
Computer Modelling 43 (7–8), 910–919.
Yao, S., Han, Z., Feng, G., 2007. On the Technical Efficiency of China’s Insurance
Industry After WTO Accession. China Economic Review 18 (1), 66–86.
Yuengert, A. M., 1993. The Measurement of Efficiency in Life Insurance: Estimates
of a Mixed Normal-Gamma Error Model. Journal of Banking and Finance 17 (2–
3), 483–496.
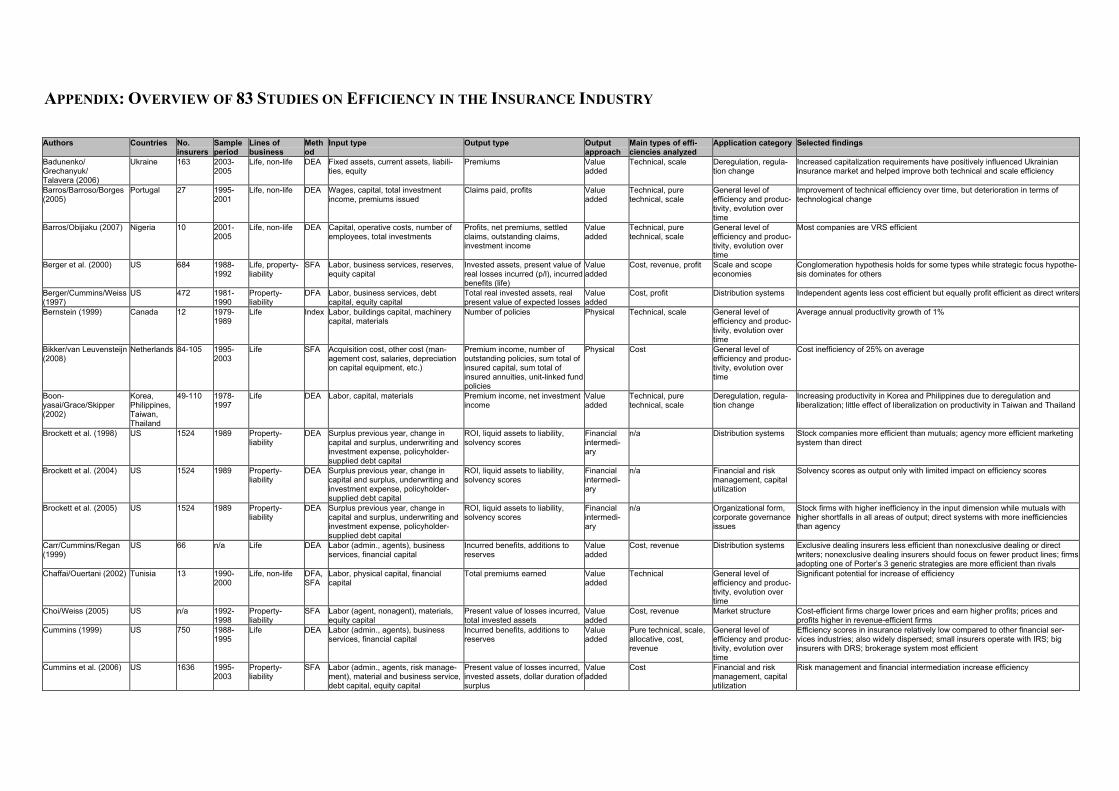
Authors Countries No. insurers
Sample period
Lines of business
Method
Input type Output type Output approach
Main types of effi-ciencies analyzed
Application category Selected findings
Badunenko/ Grechanyuk/ Talavera (2006)
Ukraine 163 2003-2005
Life, non-life DEA Fixed assets, current assets, liabili-ties, equity
Premiums Value added
Technical, scale Deregulation, regula-tion change
Increased capitalization requirements have positively influenced Ukrainian insurance market and helped improve both technical and scale efficiency
Barros/Barroso/Borges (2005)
Portugal 27 1995-2001
Life, non-life DEA Wages, capital, total investment income, premiums issued
Claims paid, profits Value added
Technical, pure technical, scale
General level of efficiency and produc-tivity, evolution over time
Improvement of technical efficiency over time, but deterioration in terms of technological change
Barros/Obijiaku (2007) Nigeria 10 2001-2005
Life, non-life DEA Capital, operative costs, number of employees, total investments
Profits, net premiums, settled claims, outstanding claims, investment income
Value added
Technical, pure technical, scale
General level of efficiency and produc-tivity, evolution over time
Most companies are VRS efficient
Berger et al. (2000) US 684 1988-1992
Life, property-liability
SFA Labor, business services, reserves, equity capital
Invested assets, present value of real losses incurred (p/l), incurred benefits (life)
Value added
Cost, revenue, profit Scale and scope economies
Conglomeration hypothesis holds for some types while strategic focus hypothe-sis dominates for others
Berger/Cummins/Weiss (1997)
US 472 1981-1990
Property-liability
DFA Labor, business services, debt capital, equity capital
Total real invested assets, real present value of expected losses
Value added
Cost, profit Distribution systems Independent agents less cost efficient but equally profit efficient as direct writers
Bernstein (1999) Canada 12 1979-1989
Life Index Labor, buildings capital, machinery capital, materials
Number of policies Physical Technical, scale General level of efficiency and produc-tivity, evolution over time
Average annual productivity growth of 1%
Bikker/van Leuvensteijn (2008)
Netherlands 84-105 1995-2003
Life SFA Acquisition cost, other cost (man-agement cost, salaries, depreciation on capital equipment, etc.)
Premium income, number of outstanding policies, sum total of insured capital, sum total of insured annuities, unit-linked fund policies
Physical Cost General level of efficiency and produc-tivity, evolution over time
Cost inefficiency of 25% on average
Boon-yasai/Grace/Skipper (2002)
Korea, Philippines, Taiwan, Thailand
49-110 1978-1997
Life DEA Labor, capital, materials Premium income, net investment income
Value added
Technical, pure technical, scale
Deregulation, regula-tion change
Increasing productivity in Korea and Philippines due to deregulation and liberalization; little effect of liberalization on productivity in Taiwan and Thailand
Brockett et al. (1998) US 1524 1989 Property-liability
DEA Surplus previous year, change in capital and surplus, underwriting and investment expense, policyholder-supplied debt capital
ROI, liquid assets to liability, solvency scores
Financial intermedi-ary
n/a Distribution systems Stock companies more efficient than mutuals; agency more efficient marketing system than direct
Brockett et al. (2004) US 1524 1989 Property-liability
DEA Surplus previous year, change in capital and surplus, underwriting and investment expense, policyholder-supplied debt capital
ROI, liquid assets to liability, solvency scores
Financial intermedi-ary
n/a Financial and risk management, capital utilization
Solvency scores as output only with limited impact on efficiency scores
Brockett et al. (2005) US 1524 1989 Property-liability
DEA Surplus previous year, change in capital and surplus, underwriting and investment expense, policyholder-supplied debt capital
ROI, liquid assets to liability, solvency scores
Financial intermedi-ary
n/a Organizational form, corporate governance issues
Stock firms with higher inefficiency in the input dimension while mutuals with higher shortfalls in all areas of output; direct systems with more inefficiencies than agency
Carr/Cummins/Regan (1999)
US 66 n/a Life DEA Labor (admin., agents), business services, financial capital
Incurred benefits, additions to reserves
Value added
Cost, revenue Distribution systems Exclusive dealing insurers less efficient than nonexclusive dealing or direct writers; nonexclusive dealing insurers should focus on fewer product lines; firms adopting one of Porter’s 3 generic strategies are more efficient than rivals
Chaffai/Ouertani (2002) Tunisia 13 1990-2000
Life, non-life DFA, SFA
Labor, physical capital, financial capital
Total premiums earned Value added
Technical General level of efficiency and produc-tivity, evolution over time
Significant potential for increase of efficiency
Choi/Weiss (2005) US n/a 1992-1998
Property-liability
SFA Labor (agent, nonagent), materials, equity capital
Present value of losses incurred, total invested assets
Value added
Cost, revenue Market structure Cost-efficient firms charge lower prices and earn higher profits; prices and profits higher in revenue-efficient firms
Cummins (1999) US 750 1988-1995
Life DEA Labor (admin., agents), business services, financial capital
Incurred benefits, additions to reserves
Value added
Pure technical, scale, allocative, cost, revenue
General level of efficiency and produc-tivity, evolution over time
Efficiency scores in insurance relatively low compared to other financial ser-vices industries; also widely dispersed; small insurers operate with IRS; big insurers with DRS; brokerage system most efficient
Cummins et al. (2006) US 1636 1995-2003
Property-liability
SFA Labor (admin., agents, risk manage-ment), material and business service, debt capital, equity capital
Present value of losses incurred, invested assets, dollar duration of surplus
Value added
Cost Financial and risk management, capital utilization
Risk management and financial intermediation increase efficiency
APPENDIX: OVERVIEW OF 83 STUDIES ON EFFICIENCY IN THE INSURANCE INDUSTRY
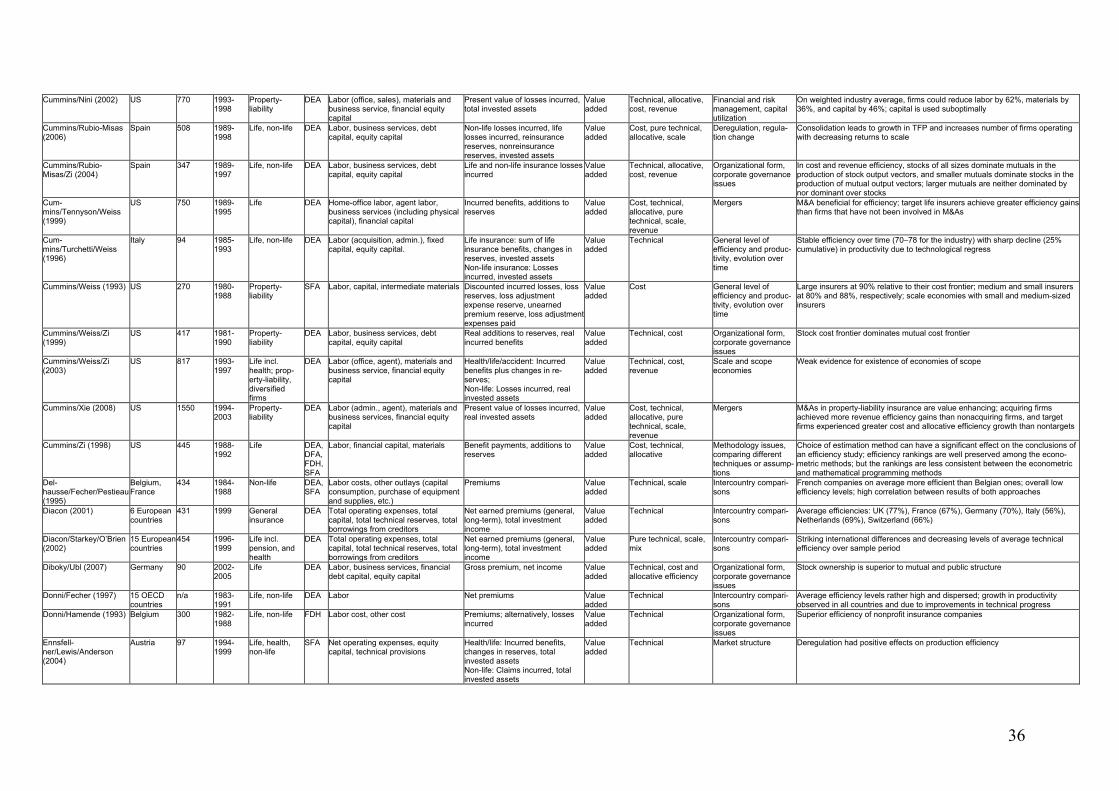
36
Cummins/Nini (2002) US 770 1993-1998
Property-liability
DEA Labor (office, sales), materials and business service, financial equity capital
Present value of losses incurred, total invested assets
Value added
Technical, allocative, cost, revenue
Financial and risk management, capital utilization
On weighted industry average, firms could reduce labor by 62%, materials by 36%, and capital by 46%; capital is used suboptimally
Cummins/Rubio-Misas (2006)
Spain 508 1989-1998
Life, non-life DEA Labor, business services, debt capital, equity capital
Non-life losses incurred, life losses incurred, reinsurance reserves, nonreinsurance reserves, invested assets
Value added
Cost, pure technical, allocative, scale
Deregulation, regula-tion change
Consolidation leads to growth in TFP and increases number of firms operating with decreasing returns to scale
Cummins/Rubio-Misas/Zi (2004)
Spain 347 1989-1997
Life, non-life DEA Labor, business services, debt capital, equity capital
Life and non-life insurance losses incurred
Value added
Technical, allocative, cost, revenue
Organizational form, corporate governance issues
In cost and revenue efficiency, stocks of all sizes dominate mutuals in the production of stock output vectors, and smaller mutuals dominate stocks in the production of mutual output vectors; larger mutuals are neither dominated by nor dominant over stocks
Cum-mins/Tennyson/Weiss (1999)
US 750 1989-1995
Life DEA Home-office labor, agent labor, business services (including physical capital), financial capital
Incurred benefits, additions to reserves
Value added
Cost, technical, allocative, pure technical, scale, revenue
Mergers M&A beneficial for efficiency; target life insurers achieve greater efficiency gains than firms that have not been involved in M&As
Cum-mins/Turchetti/Weiss (1996)
Italy 94 1985-1993
Life, non-life DEA Labor (acquisition, admin.), fixed capital, equity capital.
Life insurance: sum of life insurance benefits, changes in reserves, invested assets Non-life insurance: Losses incurred, invested assets
Value added
Technical General level of efficiency and produc-tivity, evolution over time
Stable efficiency over time (70–78 for the industry) with sharp decline (25% cumulative) in productivity due to technological regress
Cummins/Weiss (1993) US 270 1980-1988
Property-liability
SFA Labor, capital, intermediate materials Discounted incurred losses, loss reserves, loss adjustment expense reserve, unearned premium reserve, loss adjustment expenses paid
Value added
Cost General level of efficiency and produc-tivity, evolution over time
Large insurers at 90% relative to their cost frontier; medium and small insurers at 80% and 88%, respectively; scale economies with small and medium-sized insurers
Cummins/Weiss/Zi (1999)
US 417 1981-1990
Property-liability
DEA Labor, business services, debt capital, equity capital
Real additions to reserves, real incurred benefits
Value added
Technical, cost Organizational form, corporate governance issues
Stock cost frontier dominates mutual cost frontier
Cummins/Weiss/Zi (2003)
US 817 1993-1997
Life incl. health; prop-erty-liability, diversified firms
DEA Labor (office, agent), materials and business service, financial equity capital
Health/life/accident: Incurred benefits plus changes in re-serves; Non-life: Losses incurred, real invested assets
Value added
Technical, cost, revenue
Scale and scope economies
Weak evidence for existence of economies of scope
Cummins/Xie (2008) US 1550 1994-2003
Property-liability
DEA Labor (admin., agent), materials and business services, financial equity capital
Present value of losses incurred, real invested assets
Value added
Cost, technical, allocative, pure technical, scale, revenue
Mergers M&As in property-liability insurance are value enhancing; acquiring firms achieved more revenue efficiency gains than nonacquiring firms, and target firms experienced greater cost and allocative efficiency growth than nontargets
Cummins/Zi (1998) US 445 1988-1992
Life DEA, DFA, FDH, SFA
Labor, financial capital, materials Benefit payments, additions to reserves
Value added
Cost, technical, allocative
Methodology issues, comparing different techniques or assump-tions
Choice of estimation method can have a significant effect on the conclusions of an efficiency study; efficiency rankings are well preserved among the econo-metric methods; but the rankings are less consistent between the econometric and mathematical programming methods
Del-hausse/Fecher/Pestieau (1995)
Belgium, France
434 1984-1988
Non-life DEA, SFA
Labor costs, other outlays (capital consumption, purchase of equipment and supplies, etc.)
Premiums Value added
Technical, scale Intercountry compari-sons
French companies on average more efficient than Belgian ones; overall low efficiency levels; high correlation between results of both approaches
Diacon (2001) 6 European countries
431 1999 General insurance
DEA Total operating expenses, total capital, total technical reserves, total borrowings from creditors
Net earned premiums (general, long-term), total investment income
Value added
Technical Intercountry compari-sons
Average efficiencies: UK (77%), France (67%), Germany (70%), Italy (56%), Netherlands (69%), Switzerland (66%)
Diacon/Starkey/O’Brien (2002)
15 European countries
454 1996-1999
Life incl. pension, and health
DEA Total operating expenses, total capital, total technical reserves, total borrowings from creditors
Net earned premiums (general, long-term), total investment income
Value added
Pure technical, scale, mix
Intercountry compari-sons
Striking international differences and decreasing levels of average technical efficiency over sample period
Diboky/Ubl (2007) Germany 90 2002-2005
Life DEA Labor, business services, financial debt capital, equity capital
Gross premium, net income Value added
Technical, cost and allocative efficiency
Organizational form, corporate governance issues
Stock ownership is superior to mutual and public structure
Donni/Fecher (1997) 15 OECD countries
n/a 1983-1991
Life, non-life DEA Labor Net premiums Value added
Technical Intercountry compari-sons
Average efficiency levels rather high and dispersed; growth in productivity observed in all countries and due to improvements in technical progress
Donni/Hamende (1993) Belgium 300 1982-1988
Life, non-life FDH Labor cost, other cost Premiums; alternatively, losses incurred
Value added
Technical Organizational form, corporate governance issues
Superior efficiency of nonprofit insurance companies
Ennsfell-ner/Lewis/Anderson (2004)
Austria 97 1994-1999
Life, health, non-life
SFA Net operating expenses, equity capital, technical provisions
Health/life: Incurred benefits, changes in reserves, total invested assets Non-life: Claims incurred, total invested assets
Value added
Technical Market structure Deregulation had positive effects on production efficiency
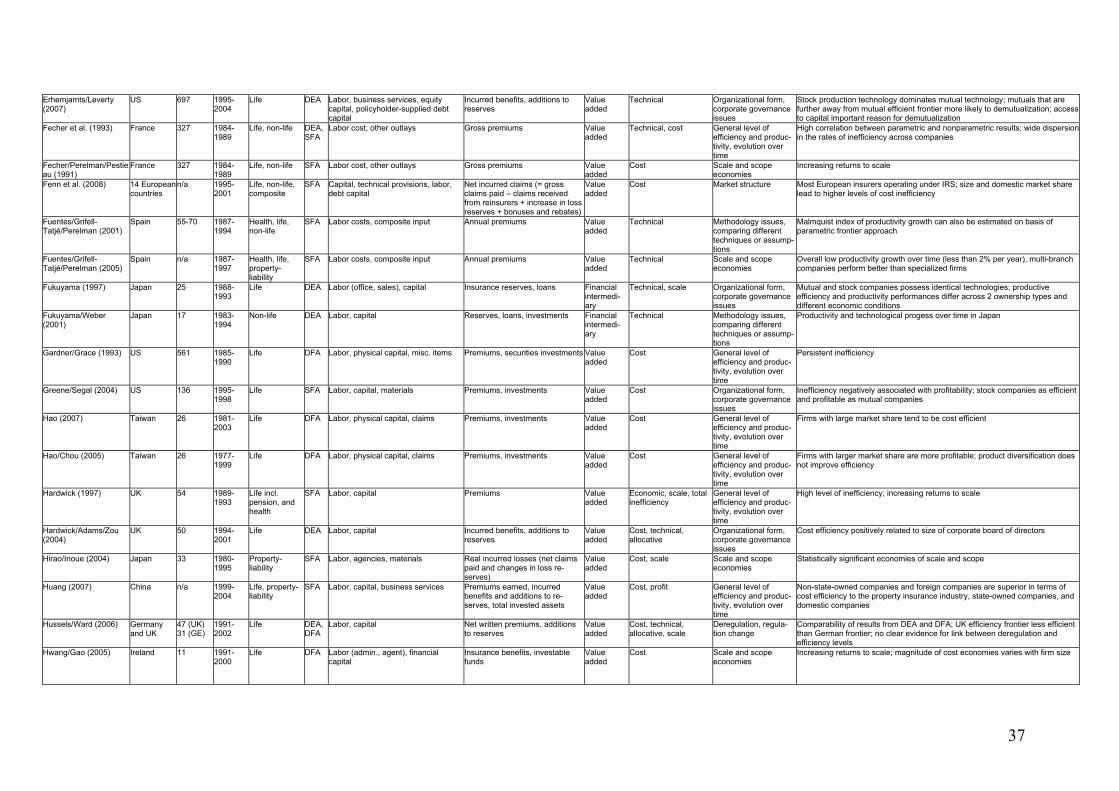
37
Erhemjamts/Leverty (2007)
US 697 1995-2004
Life DEA Labor, business services, equity capital, policyholder-supplied debt capital
Incurred benefits, additions to reserves
Value added
Technical Organizational form, corporate governance issues
Stock production technology dominates mutual technology; mutuals that are further away from mutual efficient frontier more likely to demutualization; access to capital important reason for demutualization
Fecher et al. (1993) France 327 1984-1989
Life, non-life DEA, SFA
Labor cost, other outlays Gross premiums Value added
Technical, cost General level of efficiency and produc-tivity, evolution over time
High correlation between parametric and nonparametric results; wide dispersion in the rates of inefficiency across companies
Fecher/Perelman/Pestieau (1991)
France 327 1984-1989
Life, non-life SFA Labor cost, other outlays Gross premiums Value added
Cost Scale and scope economies
Increasing returns to scale
Fenn et al. (2008) 14 European countries
n/a 1995-2001
Life, non-life, composite
SFA Capital, technical provisions, labor, debt capital
Net incurred claims (= gross claims paid – claims received from reinsurers + increase in loss reserves + bonuses and rebates)
Value added
Cost Market structure Most European insurers operating under IRS; size and domestic market share lead to higher levels of cost inefficiency
Fuentes/Grifell-Tatjé/Perelman (2001)
Spain 55-70 1987-1994
Health, life, non-life
SFA Labor costs, composite input Annual premiums Value added
Technical Methodology issues, comparing different techniques or assump-tions
Malmquist index of productivity growth can also be estimated on basis of parametric frontier approach
Fuentes/Grifell-Tatjé/Perelman (2005)
Spain n/a 1987-1997
Health, life, property-liability
SFA Labor costs, composite input Annual premiums Value added
Technical Scale and scope economies
Overall low productivity growth over time (less than 2% per year), multi-branch companies perform better than specialized firms
Fukuyama (1997) Japan 25 1988-1993
Life DEA Labor (office, sales), capital Insurance reserves, loans Financial intermedi-ary
Technical, scale Organizational form, corporate governance issues
Mutual and stock companies possess identical technologies; productive efficiency and productivity performances differ across 2 ownership types and different economic conditions
Fukuyama/Weber (2001)
Japan 17 1983-1994
Non-life DEA Labor, capital Reserves, loans, investments Financial intermedi-ary
Technical Methodology issues, comparing different techniques or assump-tions
Productivity and technological progess over time in Japan
Gardner/Grace (1993) US 561 1985-1990
Life DFA Labor, physical capital, misc. items Premiums, securities investments Value added
Cost General level of efficiency and produc-tivity, evolution over time
Persistent inefficiency
Greene/Segal (2004) US 136 1995-1998
Life SFA Labor, capital, materials Premiums, investments Value added
Cost Organizational form, corporate governance issues
Inefficiency negatively associated with profitability; stock companies as efficient and profitable as mutual companies
Hao (2007) Taiwan 26 1981-2003
Life DFA Labor, physical capital, claims Premiums, investments Value added
Cost General level of efficiency and produc-tivity, evolution over time
Firms with large market share tend to be cost efficient
Hao/Chou (2005) Taiwan 26 1977-1999
Life DFA Labor, physical capital, claims Premiums, investments Value added
Cost General level of efficiency and produc-tivity, evolution over time
Firms with larger market share are more profitable; product diversification does not improve efficiency
Hardwick (1997) UK 54 1989-1993
Life incl. pension, and health
SFA Labor, capital Premiums Value added
Economic, scale, total inefficiency
General level of efficiency and produc-tivity, evolution over time
High level of inefficiency; increasing returns to scale
Hardwick/Adams/Zou (2004)
UK 50 1994-2001
Life DEA Labor, capital Incurred benefits, additions to reserves
Value added
Cost, technical, allocative
Organizational form, corporate governance issues
Cost efficiency positively related to size of corporate board of directors
Hirao/Inoue (2004) Japan 33 1980-1995
Property-liability
SFA Labor, agencies, materials Real incurred losses (net claims paid and changes in loss re-serves)
Value added
Cost, scale Scale and scope economies
Statistically significant economies of scale and scope
Huang (2007) China n/a 1999-2004
Life, property-liability
SFA Labor, capital, business services Premiums earned, incurred benefits and additions to re-serves, total invested assets
Value added
Cost, profit General level of efficiency and produc-tivity, evolution over time
Non-state-owned companies and foreign companies are superior in terms of cost efficiency to the property insurance industry, state-owned companies, and domestic companies
Hussels/Ward (2006) Germany and UK
47 (UK) 31 (GE)
1991-2002
Life DEA, DFA
Labor, capital Net written premiums, additions to reserves
Value added
Cost, technical, allocative, scale
Deregulation, regula-tion change
Comparability of results from DEA and DFA; UK efficiency frontier less efficient than German frontier; no clear evidence for link between deregulation and efficiency levels
Hwang/Gao (2005) Ireland 11 1991-2000
Life DFA Labor (admin., agent), financial capital
Insurance benefits, investable funds
Value added
Cost Scale and scope economies
Increasing returns to scale; magnitude of cost economies varies with firm size
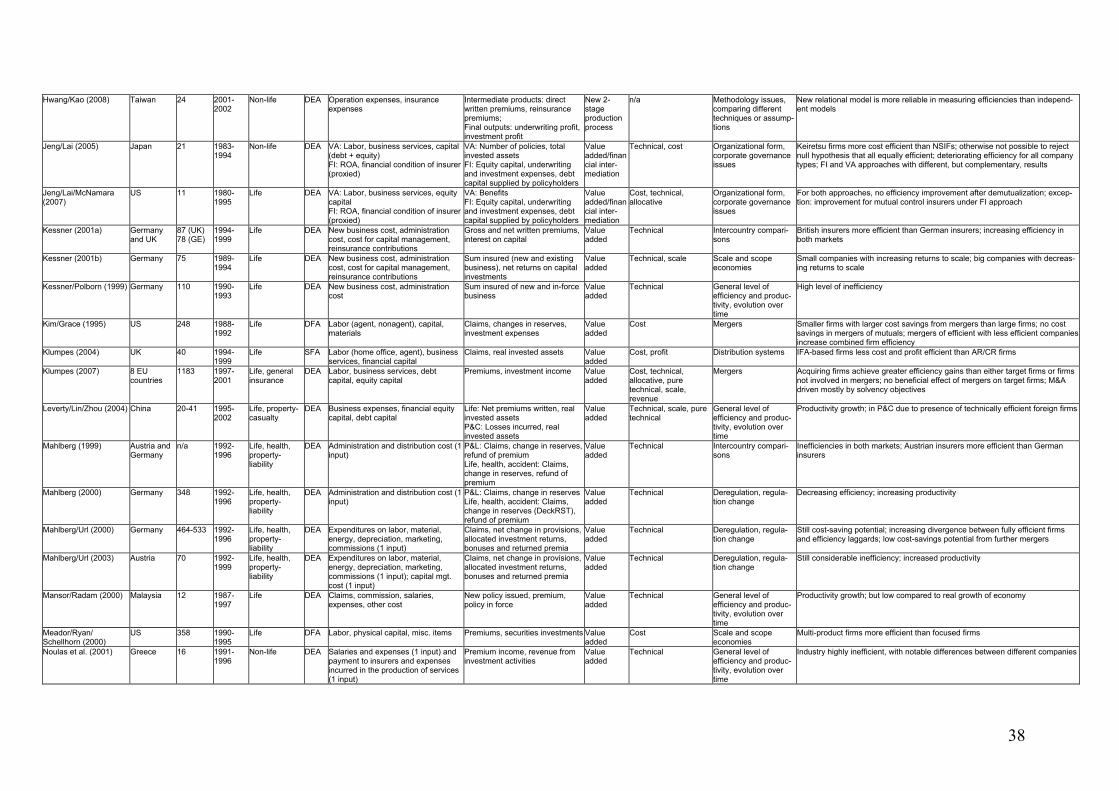
38
Hwang/Kao (2008) Taiwan 24 2001-2002
Non-life DEA Operation expenses, insurance expenses
Intermediate products: direct written premiums, reinsurance premiums; Final outputs: underwriting profit, investment profit
New 2-stage production process
n/a Methodology issues, comparing different techniques or assump-tions
New relational model is more reliable in measuring efficiencies than independ-ent models
Jeng/Lai (2005) Japan 21 1983-1994
Non-life DEA VA: Labor, business services, capital (debt + equity) FI: ROA, financial condition of insurer (proxied)
VA: Number of policies, total invested assets FI: Equity capital, underwriting and investment expenses, debt capital supplied by policyholders
Value added/financial inter-mediation
Technical, cost Organizational form, corporate governance issues
Keiretsu firms more cost efficient than NSIFs; otherwise not possible to reject null hypothesis that all equally efficient; deteriorating efficiency for all company types; FI and VA approaches with different, but complementary, results
Jeng/Lai/McNamara (2007)
US 11 1980-1995
Life DEA VA: Labor, business services, equity capital FI: ROA, financial condition of insurer (proxied)
VA: Benefits FI: Equity capital, underwriting and investment expenses, debt capital supplied by policyholders
Value added/financial inter-mediation
Cost, technical, allocative
Organizational form, corporate governance issues
For both approaches, no efficiency improvement after demutualization; excep-tion: improvement for mutual control insurers under FI approach
Kessner (2001a) Germany and UK
87 (UK) 78 (GE)
1994-1999
Life DEA New business cost, administration cost, cost for capital management, reinsurance contributions
Gross and net written premiums, interest on capital
Value added
Technical Intercountry compari-sons
British insurers more efficient than German insurers; increasing efficiency in both markets
Kessner (2001b) Germany 75 1989-1994
Life DEA New business cost, administration cost, cost for capital management, reinsurance contributions
Sum insured (new and existing business), net returns on capital investments
Value added
Technical, scale Scale and scope economies
Small companies with increasing returns to scale; big companies with decreas-ing returns to scale
Kessner/Polborn (1999) Germany 110 1990-1993
Life DEA New business cost, administration cost
Sum insured of new and in-force business
Value added
Technical General level of efficiency and produc-tivity, evolution over time
High level of inefficiency
Kim/Grace (1995) US 248 1988-1992
Life DFA Labor (agent, nonagent), capital, materials
Claims, changes in reserves, investment expenses
Value added
Cost Mergers Smaller firms with larger cost savings from mergers than large firms; no cost savings in mergers of mutuals; mergers of efficient with less efficient companies increase combined firm efficiency
Klumpes (2004) UK 40 1994-1999
Life SFA Labor (home office, agent), business services, financial capital
Claims, real invested assets Value added
Cost, profit Distribution systems IFA-based firms less cost and profit efficient than AR/CR firms
Klumpes (2007) 8 EU countries
1183 1997-2001
Life, general insurance
DEA Labor, business services, debt capital, equity capital
Premiums, investment income Value added
Cost, technical, allocative, pure technical, scale, revenue
Mergers Acquiring firms achieve greater efficiency gains than either target firms or firms not involved in mergers; no beneficial effect of mergers on target firms; M&A driven mostly by solvency objectives
Leverty/Lin/Zhou (2004) China 20-41 1995-2002
Life, property-casualty
DEA Business expenses, financial equity capital, debt capital
Life: Net premiums written, real invested assets P&C: Losses incurred, real invested assets
Value added
Technical, scale, pure technical
General level of efficiency and produc-tivity, evolution over time
Productivity growth; in P&C due to presence of technically efficient foreign firms
Mahlberg (1999) Austria and Germany
n/a 1992-1996
Life, health, property-liability
DEA Administration and distribution cost (1 input)
P&L: Claims, change in reserves, refund of premium Life, health, accident: Claims, change in reserves, refund of premium
Value added
Technical Intercountry compari-sons
Inefficiencies in both markets; Austrian insurers more efficient than German insurers
Mahlberg (2000) Germany 348 1992-1996
Life, health, property-liability
DEA Administration and distribution cost (1 input)
P&L: Claims, change in reserves Life, health, accident: Claims, change in reserves (DeckRST), refund of premium
Value added
Technical Deregulation, regula-tion change
Decreasing efficiency; increasing productivity
Mahlberg/Url (2000) Germany 464-533 1992-1996
Life, health, property-liability
DEA Expenditures on labor, material, energy, depreciation, marketing, commissions (1 input)
Claims, net change in provisions, allocated investment returns, bonuses and returned premia
Value added
Technical Deregulation, regula-tion change
Still cost-saving potential; increasing divergence between fully efficient firms and efficiency laggards; low cost-savings potential from further mergers
Mahlberg/Url (2003) Austria 70 1992-1999
Life, health, property-liability
DEA Expenditures on labor, material, energy, depreciation, marketing, commissions (1 input); capital mgt. cost (1 input)
Claims, net change in provisions, allocated investment returns, bonuses and returned premia
Value added
Technical Deregulation, regula-tion change
Still considerable inefficiency; increased productivity
Mansor/Radam (2000) Malaysia 12 1987-1997
Life DEA Claims, commission, salaries, expenses, other cost
New policy issued, premium, policy in force
Value added
Technical General level of efficiency and produc-tivity, evolution over time
Productivity growth; but low compared to real growth of economy
Meador/Ryan/ Schellhorn (2000)
US 358 1990-1995
Life DFA Labor, physical capital, misc. items Premiums, securities investments Value added
Cost Scale and scope economies
Multi-product firms more efficient than focused firms
Noulas et al. (2001) Greece 16 1991-1996
Non-life DEA Salaries and expenses (1 input) and payment to insurers and expenses incurred in the production of services (1 input)
Premium income, revenue from investment activities
Value added
Technical General level of efficiency and produc-tivity, evolution over time
Industry highly inefficient, with notable differences between different companies
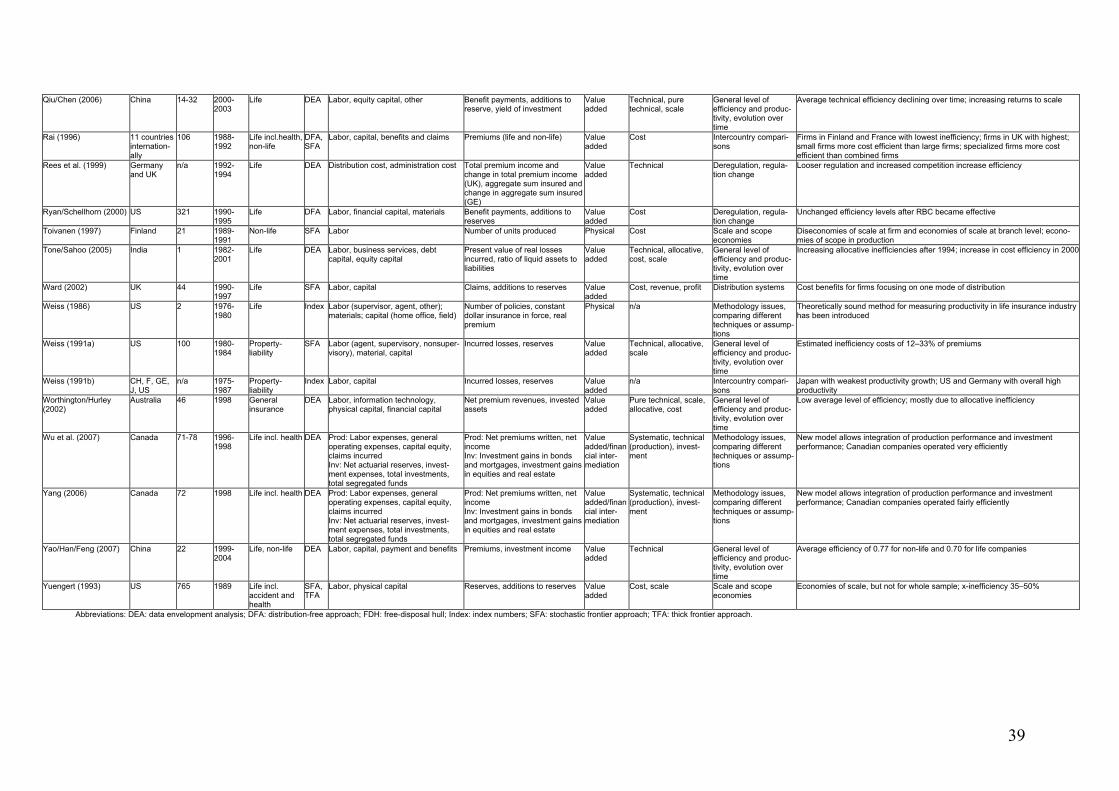
39
Qiu/Chen (2006) China 14-32 2000-2003
Life DEA Labor, equity capital, other Benefit payments, additions to reserve, yield of investment
Value added
Technical, pure technical, scale
General level of efficiency and produc-tivity, evolution over time
Average technical efficiency declining over time; increasing returns to scale
Rai (1996) 11 countries internation-ally
106 1988-1992
Life incl.health, non-life
DFA, SFA
Labor, capital, benefits and claims Premiums (life and non-life) Value added
Cost Intercountry compari-sons
Firms in Finland and France with lowest inefficiency; firms in UK with highest; small firms more cost efficient than large firms; specialized firms more cost efficient than combined firms
Rees et al. (1999) Germany and UK
n/a 1992-1994
Life DEA Distribution cost, administration cost Total premium income and change in total premium income (UK), aggregate sum insured and change in aggregate sum insured (GE)
Value added
Technical Deregulation, regula-tion change
Looser regulation and increased competition increase efficiency
Ryan/Schellhorn (2000) US 321 1990-1995
Life DFA Labor, financial capital, materials Benefit payments, additions to reserves
Value added
Cost Deregulation, regula-tion change
Unchanged efficiency levels after RBC became effective
Toivanen (1997) Finland 21 1989-1991
Non-life SFA Labor Number of units produced Physical Cost Scale and scope economies
Diseconomies of scale at firm and economies of scale at branch level; econo-mies of scope in production
Tone/Sahoo (2005) India 1 1982-2001
Life DEA Labor, business services, debt capital, equity capital
Present value of real losses incurred, ratio of liquid assets to liabilities
Value added
Technical, allocative, cost, scale
General level of efficiency and produc-tivity, evolution over time
Increasing allocative inefficiencies after 1994; increase in cost efficiency in 2000
Ward (2002) UK 44 1990-1997
Life SFA Labor, capital Claims, additions to reserves Value added
Cost, revenue, profit Distribution systems Cost benefits for firms focusing on one mode of distribution
Weiss (1986) US 2 1976-1980
Life Index Labor (supervisor, agent, other); materials; capital (home office, field)
Number of policies, constant dollar insurance in force, real premium
Physical n/a Methodology issues, comparing different techniques or assump-tions
Theoretically sound method for measuring productivity in life insurance industry has been introduced
Weiss (1991a) US 100 1980-1984
Property-liability
SFA Labor (agent, supervisory, nonsuper-visory), material, capital
Incurred losses, reserves Value added
Technical, allocative, scale
General level of efficiency and produc-tivity, evolution over time
Estimated inefficiency costs of 12–33% of premiums
Weiss (1991b) CH, F, GE, J, US
n/a 1975-1987
Property-liability
Index Labor, capital Incurred losses, reserves Value added
n/a Intercountry compari-sons
Japan with weakest productivity growth; US and Germany with overall high productivity
Worthington/Hurley (2002)
Australia 46 1998 General insurance
DEA Labor, information technology, physical capital, financial capital
Net premium revenues, invested assets
Value added
Pure technical, scale, allocative, cost
General level of efficiency and produc-tivity, evolution over time
Low average level of efficiency; mostly due to allocative inefficiency
Wu et al. (2007) Canada 71-78 1996-1998
Life incl. health DEA Prod: Labor expenses, general operating expenses, capital equity, claims incurred Inv: Net actuarial reserves, invest-ment expenses, total investments, total segregated funds
Prod: Net premiums written, net income Inv: Investment gains in bonds and mortgages, investment gains in equities and real estate
Value added/financial inter-mediation
Systematic, technical (production), invest-ment
Methodology issues, comparing different techniques or assump-tions
New model allows integration of production performance and investment performance; Canadian companies operated very efficiently
Yang (2006) Canada 72 1998 Life incl. health DEA Prod: Labor expenses, general operating expenses, capital equity, claims incurred Inv: Net actuarial reserves, invest-ment expenses, total investments, total segregated funds
Prod: Net premiums written, net income Inv: Investment gains in bonds and mortgages, investment gains in equities and real estate
Value added/financial inter-mediation
Systematic, technical (production), invest-ment
Methodology issues, comparing different techniques or assump-tions
New model allows integration of production performance and investment performance; Canadian companies operated fairly efficiently
Yao/Han/Feng (2007) China 22 1999-2004
Life, non-life DEA Labor, capital, payment and benefits Premiums, investment income Value added
Technical General level of efficiency and produc-tivity, evolution over time
Average efficiency of 0.77 for non-life and 0.70 for life companies
Yuengert (1993) US 765 1989 Life incl. accident and health
SFA, TFA
Labor, physical capital Reserves, additions to reserves Value added
Cost, scale Scale and scope economies
Economies of scale, but not for whole sample; x-inefficiency 35–50%
Abbreviations: DEA: data envelopment analysis; DFA: distribution-free approach; FDH: free-disposal hull; Index: index numbers; SFA: stochastic frontier approach; TFA: thick frontier approach.