Embed Size (px)
Citation preview

Frozen but alive: Molecular
responses to autophagy,
angiogenesis and energy
metabolism in the stress-tolerant
wood frog, Rana sylvatica
by
Rasha Al-attar
B.Sc. University of Ottawa, 2014
M.Sc. Carleton University, 2016
A Thesis Submitted to the Faculty of Graduate Studies and Research in Partial fulfillment
of the requirements for the degree of
Doctor of Philosophy
Department of Biology, Specialization in Biochemistry
© copyright 2020
Rasha Al-attar

II
The undersigned herby recommend to the Faculty of Graduate Studies and Research
acceptance of this thesis
Frozen but alive: Molecular responses to autophagy, angiogenesis and
energy metabolism in the stress-tolerant wood frog, Rana sylvatica
Submitted by
Rasha Al-attar, B.Sc. M.Sc.
in partial fulfillment of the requirements for the degree of Doctor of Philosophy
________________________________________________
Chair, Department of Biology
________________________________________________
Thesis Supervisor
________________________________________________
External Examiner
Carleton University

III
Abstract
The freeze-tolerant wood frogs (Rana sylvatica) are incredible creatures that can tolerate
the freezing of up to ~70% of their total body water during winter. Once frozen, these
frogs are considered clinically dead, exhibiting no signs of breathing, heartbeat, muscle
movement and nerve conductance; yet, they come back to life, unharmed, after a few
hours of thawing. Freezing is associated with ischemia due to the freezing of the blood,
with hyperglycemia due to the production of large quantities of glucose for
cryoprotection, and with dehydration as water moves from inside the cell to the
extracellular space to prevent intracellular freezing. Interestingly, wood frogs can tolerate
all these stresses independently of freezing, thereby creating a multifactorial model for
studying vertebrate freeze-tolerance. Oxygen availability is very low to non-existing
during freezing, anoxia, and dehydration; therefore, wood frogs are hypothesized to
reduce their overall metabolic rates to balance energy production with energy expenditure
in a process called metabolic rate depression (MRD). Animals that undergo MRD reduce
energy expensive or detrimental processes and allocate the limited energy available only
to pro-survival responses. This thesis examined the effects of freezing and its associated
stress on responses to autophagy, angiogenesis, select group of antioxidant enzymes, and
energy metabolism. Molecular responses to autophagy demonstrate a significant
reduction in autophagosome formation and lysosomal biogenesis in response to
anoxia/reoxygenation and to a lesser degree in response to dehydration/rehydration in
liver, whereas these two processes were significantly reduced under all conditions in
skeletal muscle. Current results also indicate that angiogenesis is regulated in a temporal
and stress-dependent manner, where wood frogs increase the expression of certain pro-

IV
and anti-angiogenic factors in anticipation of potential damage to capillaries or injury to
tissues. Investigation into the role of ETS1 as a transcriptional activator and repressor
demonstrated its potential involvement in promoting the expression of select antioxidant
enzymes, while repressing the expression of certain nuclear-encoded mitochondrial
proteins. Overall, findings in this thesis demonstrate the complexity of the mechanisms
involved in controlling metabolic rate depression in adaptive responses in wood frogs.

V
Statement of Contribution
I designed and performed all experiments outlined in this thesis, analyzed the data,
generated the figures, and wrote all chapters. Dr. Kenneth B. Storey provided funding,
materials and reagents, editorial review, and has approved all chapters. Janet M. Storey
assisted in animal sampling and provided editorial review of this thesis.
Chapter 1: Multifaceted regulation of the autophagic machinery in wood frogs
Awaiting submission to Biochimica et Biophysica Acta- Gene Regulatory
Mechanisms.
Al-attar, R. & Storey, K.B. (2020). Multifaceted regulation of the autophagic
machinery in wood frogs
Chapter 2: RAGE management: ETS1- EGR1 mediated transcriptional networks regulate
angiogenesis in wood frogs
Awaiting submission to The International Journal of Biochemistry and Cell
Biology.
Al-attar, R. & Storey, K.B. (2020). RAGE management: ETS1- EGR1 mediated
transcriptional networks regulate angiogenesis in wood frogs
Chapter 3: RAGE against the stress: Mitochondrial suppression in hypometabolic hearts
This chapter has been published in Gene.
R. Al-Attar, K.B. Storey, RAGE against the stress: Mitochondrial suppression in
hypometabolic hearts., Gene. 761 (2020) 145039.
https://doi.org/10.1016/j.gene.2020.145039.
Permission for inclusion of this manuscript, in part or in full, in an academic thesis or
dissertation has been granted by the publisher, Elsevier.

VI
Acknowledgement
First and foremost, I would like to give my deepest, most heartfelt thanks to my
thesis supervisor, Dr. Kenneth Storey for giving me the opportunity to work under his
supervision. Your passion for research, your enthusiasm for teaching, and your leadership
in dealing with different people and situations is greatly inspiring. You taught me
invaluable lessons both inside and outside the world of science that I will cherish and
carry with me for the rest of my life. Your guidance and the opportunities you have given
me will no doubt help me excel in my career and put me at a great advantage in my future
endeavors. For that, I am forever grateful to you. You are truly one of a kind!
Second, I would like to thank Jan Storey. Jan, you have helped me greatly in the
past 6 years, and I could not have done without your support. Thank you for always
helping me, being patient with me, and for sending me all those adorable Hudson
pictures. You are an incredible human being, and Ken is lucky to have a person like you
in his life (and he cannot deny it!).
Third, I would like to thank all the past and present Storey Lab members for all
their help and support through my time at the lab. Thank you Hanane for always being
there for me, for all the scientific and non-scientific conversations, all the laughter, and
for tolerating my NANDOS addiction. Thank you Ranim for being such an awesome
friend and TA partner, and for all the entertaining moments. Thank you, Stuart for all the
[random] facts, “Rasha’s word of the day”, and your help with the mousebird stuff. You
will be a great entomologist! Thank you, Liam, Alex and Sam, for the awesome 6 years,
and I wish you the best in your future careers. The list goes on and on with many more
wonderful people, past and present, that made my stay at the Storey Lab a truly great

VII
experience. I am saddened that I didn’t get to say “thank you” to you in person before I
leave the lab but blame that on COVID! However, this is not goodbye, and I am
anticipating many more outings when I come visit .
I would like to thank my parents, my aunt, my cousin, and my honorary family
member/sister, Tabassom. You were always there for me and pushed me to be the best
person I can be. Thank you for everything you have done for me, and I want you to know
that without your love and support, I would not be where I am today. Thank you
Tabassom for always being there for me, for cheering me through the bad times, for
celebrating with me through the good times. I am lucky to have a friend like you.
I would like to extend a special thanks to the amazing wood frog for being so
awesome and letting me use its abilities to expand my scientific knowledge. Lastly, thank
you to all reviewer #2’s out there for always going above and beyond with your very
necessary suggestions to make my manuscripts... better…

VIII
Table of Contents
Abstract ........................................................................................................................................ III
Statement of Contribution ........................................................................................................... V
Acknowledgement ........................................................................................................................ VI
Table of Contents ..................................................................................................................... VIII
List of Abbreviations .................................................................................................................... X
List of Figures ............................................................................................................................. XV
List of Tables ............................................................................................................................. XIX
List of Appendices ...................................................................................................................... XX
Chapter 1: General Introduction.................................................................................................. 1
1.1 Adaptations to cold temperatures .............................................................................. 2
1.2 The freeze-tolerant wood frog, Rana sylvatica ......................................................... 3
1.3 Ice nucleation in wood frogs ..................................................................................... 4
1.4 Challenges associated with freezing ......................................................................... 5
1.5 Adaptations to freezing and thawing in wood frogs ................................................. 6
1.6 Adaptations to dehydration, anoxia ......................................................................... 12
1.7 Regulation of MRD ................................................................................................. 17
1.8 General hypothesis .................................................................................................. 24
1.9 References- Chapter 1 ............................................................................................. 29
Chapter 2: Multifaceted regulation of the autophagic machinery in wood frogs .................. 40
1.1 Abstract ................................................................................................................... 42
2.2 Introduction ............................................................................................................. 43
2.3 Methods ................................................................................................................... 49
2.4 Results ..................................................................................................................... 61
2.5 Discussion ............................................................................................................... 68
2.6 References- Chapter 2 ............................................................................................. 92
Chapter 3: RAGE management: ETS1- EGR1 mediated transcriptional networks regulate
angiogenesis in wood frogs ........................................................................................................ 117
3.1 Abstract ................................................................................................................. 119
3.2 Introduction ........................................................................................................... 120
3.3 Materials and methods .......................................................................................... 125
3.4 Results ................................................................................................................... 132
3.5 Discussion ............................................................................................................. 137
3.6 References- Chapter 3 ........................................................................................... 153

IX
Chapter 4: RAGE against the stress: mitochondrial suppression in hypometabolic hearts
..................................................................................................................................................... 177
4.1 Abstract ................................................................................................................. 179
4.2 Introduction ........................................................................................................... 180
4.3 Materials and methods .......................................................................................... 184
4.4 Results ................................................................................................................... 189
4.5 Discussion ............................................................................................................. 192
4.6 References- Chapter 4 ........................................................................................... 206
Chapter 5: General discussion .................................................................................................. 222
5.1 General discussion................................................................................................. 223
5.2 Future directions .................................................................................................... 238
5.3 Concluding remarks .............................................................................................. 241
5.4 References- Chapter 5 ........................................................................................... 242

X
List of Abbreviations
4EBP Eukaryotic initiation factor 4 binding protein
ACC Acetyl-CoA carboxylase
Ac-HMGB1 Acetylated HMGB1
ADP Adenosine diphosphate
AGE Advanced glycation end products
ALEs Advanced lipoxidation end products
AMP Adenosine monophosphate
AMPK AMP-activated protein kinase
ANP Atrial natriuretic peptide
AOX1 Aldehyde oxidase 1
ASAH1 Acid ceramidase
ATG Autophagy regulating proteins
ATP Adenosine triphosphate
ATP5A1 ATP synthase H+ transporting mitochondrial F1 complex, α
subunit 1 cardiac muscle
ATP6V0D1 ATPase H+ transporting V0 subunit D1
BECN1 Beclin1
BGT1 Betaine-GABA transporters
BH3 Bcl-2 homology-3 domain
BSA Bovine serum albumin
CCD Coiled-coil domain
CDS Coding sequence
ChIP-Seq Chromatin immunoprecipitation with massive parallel DNA
sequencing
ChREBP Carbohydrate-responsive element binding protein
CLCN7 Chloride channel 7
CLEAR Coordinated lysosomal expression and regulation
CML Carboxymethyllysine

XI
CS Citrate synthase
CTNS Cystinosin
CTSA Cathepsin A
CYC1 Cytochrome c1
DMSO Dimethyl Sulfoxide
DNA Deoxyribonucleic acid
dNTP Deoxynucleoside triphosphate
DPI-ELISA DNA-protein interaction enzyme linked immunosorbent assay
DTT Dithiothreitol
ECD Evolutionarily conserved domain
ECL Enhanced chemiluminescence
EDTA Ethylenediaminetetraacetic acid
eEF-2 Eukaryotic elongation factor 2
eEF-2K eEF-2 kinase
EGF Endothelial growth factor
EGR1 Early growth response 1
ENCODE Encyclopedia of DNA elements
ER Endoplasmic reticulum
ETS1 E26 transformation-specific sequence 1
EZH2 Enhancer of zeste homolog 2
FGF Fibroblast growth factor
FIP200 FAK family interacting protein 200
GALNS N-acetylgalactosamine-6-sulfate sulfatase
GLUT Glucose transporter
GRP Glucose-regulated proteins
GS Glycogen synthase
GSK3 Glycogen synthase kinase 3
Gww Gram wet weight

XII
HCl Hydrochloric acid
HEPES 4-(2-hydroxyethyl)-1-piperazineethanesulfonic acid
HEXA/B β-hexosaminidase
HIF1α Hypoxia inducible factor 1α
HMGB1 High mobility group box 1
HRP Horse-radish peroxidase
HSP Heat shock proteins
IgG Immunoglobulin G
JNK1 c-jun N-terminal kinase 1
KCl Potassium chloride
KH2PO4 Potassium dihydrogen phosphate
LC3B Microtubule-associated proteins light chain 3B
LYNUS Lysosomal nutrient sensing
M.W. Molecular weight
MCOLN1 Mucolipin 1
mDia-1 Diaphanous-1
MEF2 Myocyte enhancer factor2
MgCl2 Magnesium chloride
miR MicroRNA
MiT/TFE Microphthalmia/transcription factor E
MRD Metabolic rate depression
mRNA Messenger RNA
mTORC1 Mechanistic target of rapamycin complex I
Na2HPO4 Disodium phosphate
Na3VO4 Sodium orthovanadate
NAB1 NGFI-A binding-1
NaCl Sodium chloride
NADH Nicotinamide adenine dinucleotide

XIII
NaF Sodium fluoride
NAGPA N-acetylglucosamine-1-phosphodiester alpha-N-
acetylglucosaminidase
NDUFAB1 NADH dehydrogenase (ubiquinone 1) α/β subcomplex 1
NFAT5 Nuclear factor of activated T cell 5
NFATc4 Nuclear factor of activated T cell 4
NO Nitric oxide
NOS Nitric oxide synthase
NRBF2 Nuclear receptor binding factor 2
PBS Phosphate buffer saline
PDH Pyruvate dehydrogenase complex
PE Phosphatidylethanolamine
Peroxiredoxin PRX
PI3P Phosphatidylinositol 3-phosphate
PKCβII protein kinase CβII
PMSF Phenylmethylsulfonyl fluoride
Pre-microRNA precursor- microRNA
PtdIns 3K phosphoinositide-3-kinase
PTMs Post-translational modifications
PVDF Polyvinylidiene difluoride
RAGE Receptor for AGE
RISC RNA-induced silencing complex
RNA Ribonucleic acid
RNS Reactive nitrogen species
ROS Reactive oxygen species
RT Room temperature
S6K Ribosomal protein S6 kinase
SDS-PAGE Sodium dodecyl sulphate-polyacrylamide gel electrophoresis
SEM Standard error of mean

XIV
SMIT Sodium/myo-inositol cotransporter
SMURF1 SMAD-specific E3 ubiquitin protein ligase 1
SNARE SNAP receptor
SOD Superoxide dismutase
SQSTM1 Sequestosome 1, p62
TBST Tris buffered saline Tween-20
TCA Tricarboxylic acid cycle
TFEB Transcription factor EB
TGF Transforming growth factor
T-HMGB Total HMGB1
Tie1/2 Tyrosine kinase with immunoglobulin-like receptors, and EGF-like
domain 1/2 receptor
TMB Tetramethylbenzidine
TMEM55B Phosphatidylinositol-4,5-bisphosphate 4-phosphatase
TNFα Tumor necrosis factor α
ULK1 Unc-51 like autophagy activating kinase 1
UTR Untranslated region
VAMP8 Vesicle-associated membrane protein 8
VEGF Vascular endothelial growth factor
VEGFR VEGF receptor
VSP Vacuolar sorting protein

XV
List of Figures
Figure 1.1: Schematic diagram of microRNA biogenesis. .............................................. 39
Figures 2.1: Schematic diagram showing different phases of autophagy...................... 104
Figure 2.2: Relative protein levels of key proteins involved in autophagosome formation
in liver over the anoxia/reoxygenation cycle measured by immunoblotting. ................. 106
Figure 2.3: Relative protein expression levels of key proteins involved in autophagosome
formation in liver over the dehydration/rehydration cycle measured using
immunoblotting. .............................................................................................................. 107
Figure 2.4: Relative protein expression levels of key proteins involved in autophagosome
formation in skeletal muscle over the anoxia/reoxygenation cycle measured using
immunoblotting. .............................................................................................................. 108
Figure 2.5: Relative protein expression levels of key proteins involved in autophagosome
formation in skeletal muscle over the dehydration/rehydration cycle measured using
immunoblotting. .............................................................................................................. 109
Figure 2.6: Relative DNA binding activity of TFEB to its consensus sequence in liver
and muscle measured by DPI-ELISA. Measurements were done using tissues of wood
frogs exposed to A) anoxia/reoxygenation, and B) dehydration/rehydration cycle. ...... 110
Figure 2.7: Relative protein expression levels of TFEB and one of its downstream
targets, ATP6V0D1, in liver measured by immunoblotting. Measurements were done
using tissues of wood frogs exposed to A) anoxia/reoxygenation, and B)
dehydration/rehydration cycle. ....................................................................................... 111
Figure 2.8: Relative protein expression levels of TFEB and one of its downstream
targets, ATP6V0D1 in muscle measured by immunoblotting. Measurements were done
using tissues of wood frogs exposed to A) anoxia/reoxygenation, and B)
dehydration/rehydration cycle. ....................................................................................... 112
Figure 2.9: Heatmap of relative transcript levels of select autophagy-regulating miRNAs
in liver measured using RT-qPCR. Data are presented as heat maps for A)
anoxia/reoxygenation and B) dehydration/rehydration cycles. ...................................... 113
Figure 2.10: Heatmap of relative transcript levels of select autophagy-regulating
miRNAs in skeletal muscle measured using RT-qPCR. Data are presented as heat maps
for the A) anoxia/reoxygenation and B) dehydration/rehydration cycles. ...................... 114

XVI
Figure 2.11: Relative transcript levels of p62 (sqstm1) in liver of wood frogs measured
using RT-qPCR. Measurements were done using liver of wood frogs exposed to A)
anoxia/reoxygenation, and B) dehydration/rehydration cycle. ....................................... 115
Figure 2.12: Schematic diagram showing the predicted binding sites of mmu-miR-17-5p
to different regions of the p62 transcript......................................................................... 116
Figure 3.1: Schematic diagram of HMGB1/AGE/RAGE-induced transcriptional
responses leading to angiogenic gene transcription. ....................................................... 162
Figure 3.2: Relative protein expression of HMGB1, Ac-HMGB1 (K29) and RAGE
measured in liver using immunoblotting. Measurements were done on liver from wood
frogs exposed to A) freeze/thaw, B) anoxia/reoxygenation, and C)
dehydration/rehydration treatments. ............................................................................... 164
Figure 3.3: Levels of AGE-adducts present in livers measured using the OxiSelect™
Advanced Glycation End Product (AGE) Competitive ELISA Kit. Measurements were
done using liver from wood frogs exposed to A) freeze/thaw, B) anoxia/reoxygenation,
C) dehydration/rehydration treatments. .......................................................................... 165
Figure 3.4: Relative transcript levels of ets1 in liver measured by RT-qPCR.
Measurements were done in liver of wood frogs expose to A) freeze/thaw, B)
anoxia/reoxygenation, C) dehydration/rehydration treatments. ...................................... 167
Figure 3.5: Total protein levels of ETS1 and EGR1 in liver measured using
immunoblotting. Measurements were done using liver of wood frogs expose to A)
freeze/thaw, B) anoxia/reoxygenation, C) dehydration/rehydration treatments. For ..... 169
Figure 3.6: Nuclear localization levels of ETS1, EGR1 and two of EGR1 co-repressors
NAB1 and NAB2 in liver measured using immunoblotting. Measurements were done in
liver of wood frogs exposed to A) freeze/thaw, B) anoxia/reoxygenation, C)
dehydration/rehydration treatments. ............................................................................... 171
Figure 3.7: Relative DNA binding activity of ETS1 and EGR1 to their consensus
sequence in liver measured by DPI-ELISA. Measurements were done using liver of wood
frogs expose to A) freeze/thaw, B) anoxia/reoxygenation, C) dehydration/rehydration
treatments. ....................................................................................................................... 173
Figure 3.8: Relative protein levels of angiogenic factors in liver from wood frogs
exposed to freeze/thaw treatments measured by immunoblotting. ................................. 174
Figure 3.9: Relative protein levels of angiogenic factors in liver of wood frogs exposed
to anoxia/reoxygenation treatments measured by immunoblotting. ............................... 175

XVII
Figure 3.10: Relative protein levels of angiogenic factors in liver of wood frogs expose
to dehydration/rehydration treatments measured by immunoblotting. ........................... 176
Figure 4.1: Schematic diagram representing physiological and molecular responses that
occur during metabolic rate depression in wood frogs. .................................................. 213
Figure 4.2: Levels of AGE-adducts in wood frog heart in response to freezing, anoxia or
dehydration measured using a commercially available assay. ........................................ 214
Figure 4.3: Protein levels of upstream RAGE activators and downstream RAGE-
regulated targets measured using western blotting ......................................................... 215
Figure 4.4: Relative nuclear localization of ETS1 proteins in response to freezing, anoxia
or dehydration measured by western blotting in wood frog heart. ................................. 216
Figure 4.5: Relative DNA binding activity of p-ETS1 (T38) in response to freezing,
anoxia or dehydration in wood frog heart. ...................................................................... 217
Figure 4.6: Schematic diagram showing the similarities between the ETS1 monomer
generated using the protein sequence of Xenopus tropicalis (NP_001123840_1) and
Humans (P14921.1). ....................................................................................................... 218
Figure 4.7: Relative protein expression levels of select ETS1 downstream targets
measured by western blotting in wood frog heart. .......................................................... 219
Figure S4.1: Alignment showing similarities between the ETS1 protein sequence of
Xenopus tropicalis (NP_001123840_1) and Humans (P14921.1), generated using Clustal
Omega ............................................................................................................................. 220
Figure D1: Representative immunoblot showing the A) enhanced chemiluminescent
band and B) Coomassie stained membrane of the ATP6V0D1 protein in liver of frogs
exposed to control, 24-hour anoxic, and 4-hour reoxygenated treatments. .................... 263
Figure E1: Standard curve generated using AGE-BSA standard following the
manufacturer’s protocol. ................................................................................................. 265
Figure F1: Analysis of upstream regulations of NFATc3 measured in wood frog heart in
response to freezing, anoxia or dehydration measured by immunoblotting. .................. 267
Figure F2: Relative nuclear levels of NFATc3 (A), and B) the DNA binding activity of
total NFATc3 in heart of wood frogs exposed to freezing, anoxia and dehydration
measured by immunoblotting. ........................................................................................ 268
Figure F3: Relative protein levels of downstream targets of NFATc3 and Tfam in wood
frog heart exposed to freezing, anoxia and dehydration measured by immunoblotting. 269

XVIII
Figure F4: Schematic diagram showing the similarities between the partial NFATc3
protein sequence of Xenopus tropicalis (NP_001135546.1) and splice variant 3 of
humans (N P_775186.1). ................................................................................................ 270

XIX
List of Tables
Table 2.1: Nucleotide sequences of miRNA specific forward primers, universal primer
and the stem-loop adapter. .............................................................................................. 103
Table 2.2: Nucleotide sequences (5'-3') of forward and reverse primers used for mRNA
analysis. ........................................................................................................................... 103
Table S4.1: Shows different posttranslational modifications that could modulate ETS-1
activity............................................................................................................................. 221
Table C1: Immunoblot antibody and protein information. ............................................ 260

XX
List of Appendices
Appendix A: List of current and future publications ..................................................... 253
Appendix B: List of Scientific communications at meetings ........................................ 257
Appendix C: List of antibodies and immunoblot conditions ......................................... 259
Appendix D: Representative blots ................................................................................. 262
Appendix E: Standard curve for AGE-BSA .................................................................. 264
Appendix F: Extra data .................................................................................................. 266

1
Chapter 1: General
Introduction

2
Animals living in the wild can be challenged with various unfavorable
environmental conditions (e.g. low oxygen levels, scarce food sources, extreme hot or
cold temperatures, etc.) that can put their life at risk. Some organisms are highly
susceptible to stressful environmental conditions, whereas others have developed
sophisticated physiological and biochemical mechanisms that enable them to endure
harsh conditions. Understanding the molecular adaptations that stress-tolerant animals
use not only increases our knowledge on the plasticity of different
biochemical/physiological mechanisms that support life in these conditions, but could
also potentially help us solve various medical complications such as diabetes, ischemic
stroke and prolonging the storage time of organs prior to transplantation by designing
interventions that mimic natural adaptive responses.
1.1 Adaptations to cold temperatures
Surviving winter in the wild can be challenging; therefore, adapting a survival
strategy becomes imperative for dealing with the deleterious effects of cold temperatures.
While different organisms such as some species of birds and butterflies opt for migrating
to places with warmer temperatures, others deal with cold temperatures by developing
adaptive strategies such as vitrification, anhydrobiosis, freeze-avoidance or simply
embracing the cold whether by developing a freeze-tolerance [1]. Vitrification is a
survival strategy where the free water available is solidified into an amorphous glass,
without forming ice crystals [2]. This process is used by many insect larvae (such as the
flat bark beetle) and select species of plants (such as birch trees) to survive winter [2,3].
Anhydrobiosis is another surviving strategy where organisms (such as some prokaryotes
and micro fauna) undergo complete dehydration and survive long periods in “suspended

3
animation” until favorable conditions arrive [4,5]. While anhydrobiosis is not a freeze-
specific response, a study demonstrated that the Antarctic tardigrades undergoing
anhydrobiosis were able to survive and reproduce after ~30 years of freezing [6]. Freeze-
avoidance is a winter survival strategy used by many insects, arthropods, and
invertebrates to prevent the body fluids from freezing in winter. This is done through the
accumulation of high levels of antifreeze proteins, solutes and cryoprotectants (e.g.
sorbitol, ribitol, xylitol, erythritol, mannitol, glycerol, glucose, sucrose, or trehalose),
which promote the supercooling of the body fluids to temperatures well below the limits
that these organisms might have encountered in their natural overwintering habitats [7].
Lastly, freeze-tolerance is an overwintering strategy used by many reptiles, invertebrates,
insects, intertidal species, and amphibians [1,8–11]. In this category of species, freezing
is initiated with a controlled ice nucleation process resulting in the formation of ice
crystals on the skin, extracellular and extra-organ spaces, while maintaining a liquid
intracellular state.
1.2 The freeze-tolerant wood frog, Rana sylvatica
The wood frog, Rana sylvatica, can endure whole body freezing during the winter
months. As such, it has become a suitable vertebrate model for studying natural freeze
tolerance (and its implications for organ cryopreservation). With a geographic
distribution stretching from Alaska, across the boreal forests of Canada and northeastern
USA, and down the Appalachian mountain range into the southern USA, these animals
endure varying degrees of sub-zero temperatures of -18 C to -3 C for weeks or months
at a time [12,13]. The large range of geographical distribution of these animals suggests
that wood frogs have different degrees of freeze tolerance. Indeed, a study comparing two

4
populations of wood frogs demonstrated that frogs native to interior Alaska have a higher
degree of freeze-tolerance than frogs native to southern Ohio, as the former population
can survive freezing at -16 ℃, which is ~10-13 ℃ below the tolerance limit of the
Ohioan frogs [14]. Moreover, Alaskan wood frogs were shown to endure ~193
consecutive days of freezing in their natural habitat, with 100% of survival rate upon
thawing [15]. This was partly attributed to the fact that Alaskan wood frogs had
accumulated higher levels of hepatic glycogen (233% higher during freezing), higher
plasma urea (106 µmol/mL), and higher levels of unidentified solutes (73 µmol/mL)
compared to Ohioan frogs, which accumulated much lower levels of glycogen, lower
uremia (28 µmol/mL) and exhibited no additional unidentified solutes [14].
1.3 Ice nucleation in wood frogs
When the temperatures fall in late autumn, wood frogs hide into the subnivean space,
under layers of duff and liter on forest floors in hibernacula, that would later prove to be
pivotal for their survival. Prolonged periods of physical inactivity (as experienced during
freezing) in plain sight renders wood frogs susceptible to predation and extreme
dehydration; therefore, hiding under the forest floor is necessary to mitigate these risks.
Controlled ice nucleation is an important aspect of freeze-tolerance as it would provide
enough time for the wood frog to adjust its physiology and metabolism in preparation for
full body freezing. When the moisture in the hibernacula freezes, it seeds the wood frog’s
skin, and that seeding is necessary to initiate the ice nucleation process that typically
occur at -2.5 ℃ to -3 ℃ [8]. Indeed, while 98% of the wood frogs kept on damp surfaces
froze at -2 ℃ without supercooling below the freezing point of their body fluid (-0.5 ℃),
only ~20% of these frogs were able to freeze on dry surfaces after they supercooled to ~-

5
3 ℃ [16,17]. On dry surfaces, ice nucleation can be triggered by bacterial species
(Pseudomonas and Enterobacter species) found on frog’s skin or in the gut, a finding that
is consistent with the limited supercooling capabilities of these tissues [18]. Amphibian
skin is permeable, and this allows ice crystals on the surface of the skin to penetrate into
the body and inoculate body fluids, thereby causing internal ice nucleation [17]. Indeed,
the movement of ice through the wood frog body was visualized by proton magnetic
resonance imaging, and results show that ice moves from outside-in and accumulates in
the abdominal cavity, bladder, ventricles of the brain, eye lenses and creates ice sheets
between the skin and the skeletal muscle [19].
1.4 Challenges associated with freezing
Frozen frogs exhibit no signs of heartbeat, breathing, nerve conductivity or physical
movement, but miraculously, recover with no measurable sign of damage soon after
thawing [8]. Freezing can be lethal for many reasons. First, formation of ice crystals
within the cell can result in architectural damage to the cell membrane and subcellular
compartments, the latter resulting in dysfunctional compartmentalization of different
cellular processes [20]. Freezing typically occurs in the extracellular space, with ice
slowly propagating through the space between organs (between the skin, skeletal muscle,
abdominal cavity, etc.), the lumen of the vascular system, and the extracellular fluids that
surround the tissues. While intact cell membrane prevents ice penetration into the cell,
there are serious challenges that are associated with ice crystal formation in the body.
These challenges include but are not limited to [1,2,8,21]: A) potential rupture of
capillaries due to ice crystal expansion leading to the loss of vascular integrity and
internal bleeding upon thawing, B) potential membrane damage due to extreme

6
dehydration as water is withdrawn from the cell to form ice crystals in the extracellular
space, resulting in dangerously high cytoplasmic ionic strength C) ischemic damage due
to interruption in blood flow, which not only prevents oxygen delivery to organs, but
also prevents the cleanup of accumulated waste products, D) metabolic dysfunction as
normal oxygen delivery is interrupted, E) oxidative damage due to outburst in reactive
oxygen species (ROS) levels soon after thawing and F) potential disuse-induced atrophy
of muscles due to prolonged freezing. As such, freeze-tolerant animals must have
mechanisms that protects them against the deleterious effects of freezing both at the
physiological and molecular levels.
1.5 Adaptations to freezing and thawing in wood frogs
Wood frogs have developed physiological, biochemical, and molecular mechanisms
that enables their successful survival following freeze-thaw episodes. One of the most
important issues that must be addressed in response to freezing is maintaining the
architectural integrity of cell and organelle membranes. Indeed, freeze-tolerant
invertebrates stabilize the architecture of their cell membranes by incorporating trehalose
and prolines, and use large quantities of various cryoprotectants to maintain cellular
integrity [1]. Recent studies report the presence of a membrane-associated high molecular
mass antifreeze glycolipid (xylomannan) in many freeze-tolerant animals including the
Alaskan wood frog, which function to stabilize the membranes in winter [15,22].
Moreover, transcript levels of stearoyl-CoA desaturase (SCD), an enzyme reported to
play a significant role in membrane fluidity and repair, were significantly up-regulated in
liver of wood frogs during freezing [23,24]. SCD converts palmitoyl-CoA and stearoyl-
CoA to palmitoleate and oleate; two monounsaturated fatty acids that can provide the

7
substrates needed for synthesizing different membrane phospholipids [24]. In support of
this, a study demonstrated a seasonal change in the liver membrane composition of wood
frogs, where winter increased levels of phosphatidylethanolamine to increase membrane
fluidity [25]. In addition, organisms that survive long term freezing often have
specialized ice-binding proteins that either prevent the recrystallization of smaller ice
crystals or minimize their growth into larger crystals, thereby reducing the risk of injuries
to tissues or the lumen of the capillaries [8]. For example, wood frogs were reported to
express a novel freeze-responsive protein, FR10, which has been recently identified as an
ice binding protein. The transcript levels of this protein were significantly induced in
liver, brain, lungs, heart, testes, and skeletal muscle in response to freezing, and has been
also shown to increase in response to dehydration in heart and brain, and in response to
anoxia in the heart, kidneys and lungs [26,27]. Although direct interactions between
FR10 and ice crystals has not been shown yet, the 3-dimentional modeling of this protein
suggests that it could function as either an ice-binding protein or an anti-freeze protein
[8,26,27].
Maintaining extracellular freeze-tolerance and intracellular freeze-avoidance is
crucial for wood frog survival, therefore wood frogs and other freeze-tolerant animals use
large quantities of cryoprotectants to address this problem. In fact, wood frogs
accumulate large reserves of hepatic glycogen in the fall (180 mg/g wet weight, 233%
higher in Alaskan frogs) to use as glucose later during freezing [14,17,28]. As early as 2-
5 minutes post the initial ice nucleation event on wood frog skin, signals are sent through
β-adrenergic signaling to the liver in efforts to initiate glycogenolysis and generate
glucose [29–31]. Glucose levels rise rapidly within minutes, increasing from 5 mM to

8
~40 mM within the first hour post ice nucleation and increasing up to 150-300 mM in
core organs in fully frozen animals [28,32]. Simultaneously, within 1 minute of ice
nucleation, the heart rate of wood frog doubles to 8 beats/minute to facilitate glucose
distribution to different organs [33]. In support of this, wood frogs showed a tissue-
dependent increase in the numbers of glucose transporters (GLUT) in cell membranes
during freezing to enable fast export (from liver) and uptake (by all other organs) of
cryoprotectants. For example, it was shown that Glut4 transcripts increased by 2-3 fold in
heart to allow glucose uptake, whereas GLUT2 proteins increased significantly in liver to
allow for glucose distribution [32,34]. The uptake of blood glucose in different tissues is
rapid, however it appears that the brain and the core organs have higher concentration of
glucose than peripheral tissues such as skeletal muscle and skin, where glucose levels in
peripheral tissues rising only to 30-60 mM during freezing [17]. This is potentially due to
the inward propagation of ice after ice nucleation, which cuts blood circulation to these
tissues, thereby inhibiting glucose delivery to these organs. While glucose is the main
cryoprotectant used during freezing, a study on Alaskan wood frogs also reported a
modest increase in plasma urea (106 µmol/mL), and additional levels of unidentified
solutes (73 µmol/mL) that could be important during freezing [14]. Carbohydrates such
as glucose are excellent source of cryoprotectants during freezing for many reasons: a)
glucose can be easily synthesized from stored hepatic glycogen, b) it can be easily
transported in or out of the cell, c) it can be easily removed from the body when its
presence is not needed, d) it has the ability to stabilize proteins and maintain their
function during stress, and lastly, e) it is a compatible solute and its accumulation at high
levels does not interfere with various enzymatic activities [20]. Although the use of

9
glycerol as a cryoprotectant can offer similar benefits without the potential cytotoxicity,
glucose is a better choice as its synthesis is more energy efficient [8]. However, high
levels of glucose in presence of oxidative stress can result in the formation of highly
reactive carbonyl containing compounds that could be conjugated to macromolecules,
resulting in various unfavorable outcomes [35]. As such, wood frogs must have
developed a regulatory mechanism that would reduce the formation of these conjugates to
prevent glucose-induced damage.
Ice crystals exclude solutes from their matrix and given that 65% of the wood frog’s
total body water is converted into ice, there is a profound imbalance in the fluid contents
between the intracellular and the extracellular compartments. As such, the fluid left in
cells and organs will have highly elevated osmolality and ionic strength, that is
exacerbated even further after the freeze-induced production of various cryoprotectants
[8]. To manage this situation, cells restrict the movements of water as well as small
solutes across the plasma membrane and strictly regulate this process via either active
transport or facilitated diffusion to maintain an electrochemical gradient that is conducive
to each cell’s function [36]. The movement of water and small solutes are regulated by
the availability and the activity of specific transporters that are either already localized to
the surface of the plasma membrane or that are transported to that location via secretory
vesicle in response to external stimuli [8]. The availability of these transporters is
regulated at multiple biological levels, including during transcription, post-transcription
and during translation, whereas their activity is regulated by post-translational
modification, localization, and various allosteric inhibitors or activators in response to
various internal stimuli [8]. For example, the nuclear factor of activated T cell 5 (NFAT5)

10
is an osmoregulatory transcription factor that is sensitive to hypertonicity in different cell
types partly by regulating the transporters needed to facilitate the movement of betaine
and myo-inositol molecules in or out of the cell [37–40]. NFAT5 regulates the expression
of the sodium/myo-inositol cotransporter (SMIT) and the sodium and chloride-dependent
betaine-GABA transporters (BGT1) in different cells, and these were shown to be
important in regulating the osmotic gradient [37–40]. Previous studies have reported
differential regulation of NFAT5 in response to freezing, anoxia and dehydration in
multiple tissues of wood frogs [39,40]. Interestingly, while protein levels of NFAT5
increased significantly in response to freezing and thawing in wood frog muscle, levels of
SMIT remained the same over the course of freezing and thawing, while levels of BGT1
only increased in response to thawing [39]. The same study also demonstrated that
despite an increase in NFAT5 levels in liver during freezing, levels of BGT1 and SMIT
remained unchanged under the same conditions, there were no significant changes in
either protein levels or NFAT5 in response to freezing in the kidney. In response to
anoxia, protein levels of NFAT5 were significantly increased which correlated with an
increase in BGT1, but not SMIT under the same conditions in the muscle, whereas in
liver and kidney there was a significant reduction in NFAT5 levels in response to 24 hour
anoxia [40]. Interestingly, the decrease in NFAT5 in the liver had no effect on the protein
expression of BGT1 and SMIT in response to anoxia, but levels of BGT1 increased
significantly in the kidney under the same condition [40]. On the other hand, responses to
dehydration were somewhat different where levels of SMIT in muscle, and BGT1 and
SMIT in liver increased significantly despite no change or a decrease in total protein
levels of NFAT 5[40]. Altogether, both studies concluded that the expression of these

11
transporters is in part regulated at the transcriptional level by NFAT5, and that their
expression is tissue and stress dependent in efforts to maintain appropriate intracellular
osmolality. While a few of these transporters are studied in wood frogs (GLUTs, as
discussed above), future studies are needed to decipher the regulatory mechanisms
involved in facilitating or inhibiting the activity of other important transporters in
response to stress.
Thawing is another highly regulated process that must be orchestrated in a controlled
manner to ensure survival. When temperatures rise in the spring, wood frogs begin to
thaw slowly; but unlike freezing, thawing occurs depending on glucose concentrations in
tissues. Because high glucose concentration lowers the melting point of the cellular
fluids, when temperatures rise, wood frogs thaw from the inside out, with tissues that
have higher glucose concentration thawing first [19]. This is advantageous to the frog
because it allows the heart, which is necessary to pump blood to all other organs to
facilitate thawing, to defrost first. In fact, the first measurable physiological change after
thawing is the initiation of cardiac function as early as one hour post thaw, although heart
rate is slow and arrhythmic (~1 beat/min) at that time point [33]. Moreover, heart rates
increased to 13.6 beats/min after 6 hours of thawing as the body temperature of the wood
frogs increased to 5 ℃, suggesting that perhaps increased cardiac activity plays a crucial
role in thawing the remaining organs. Indeed, it was hypothesized that resumption of
tissue reperfusion in early hours of thawing and the increase in energy demands in
warming organs is potentially the switch needed to change from anaerobic to aerobic
metabolism [33]. Following increases in cardiac function and tissue reperfusion,
pulmonary breathing, nerve excitability, limb reflexes and normal postures were restored

12
within 12 hours post-thawing [13,33]. However, despite a fast-physical recovery from
freezing, some physiological and biochemical parameters remain in place for longer
periods. For example, given that temperatures in early spring fluctuate, wood frogs retain
their high glucose levels for over a week following the initial thawing episode in case
another freezing episode occurs [41]. As such, wood frogs must also have regulatory
mechanisms in place not only to deal with the ROS generated from reperfusion, but also
to protect themselves against glucose-induced damage.
1.6 Adaptations to dehydration, anoxia
As discussed earlier, one of the main regulatory mechanisms that enables freezing
survival is intracellular dehydration, which not only prevents intracellular ice formation
but also provides a sequestration mechanism where ice crystals can form. The skin of
many terrestrial amphibians including wood frogs, has very low resistance to water loss
under dry or hot environmental conditions; therefore, such amphibians display greater
tolerance to dehydration, increased ionic strength and intracellular osmolality compared
to other vertebrates [1]. Indeed, it is highly likely that freeze-tolerance stems from pre-
existing mechanisms that enable animal survival in response to dehydration. For
example, when subjecting two freeze-tolerance species of frogs (wood frogs and the
spring peeper) to controlled dehydration at 5 ℃, both species lost up to 60% of their total
body water and responded with rapid initiation of glycogenolysis in liver and glucose
secretion to different organs [42,43]. Like thawing, glucose levels in both animals
returned to normal after rehydration. It is noteworthy to mention that initiation of
hyperglycemic responses during dehydration are not due to water loss by liver cells
directly. Instead, water is initially lost from extra-organ pools without affecting the water

13
content of the core organs, unless high percentage of total body water is lost [42,43]. This
can be seen in wood frogs where despite undergoing ~60% dehydration of total body
water, the water content in liver remained unchanged [43]. Moreover, dehydrating
anurans also accumulate high levels of urea and this trend has also been observed in
freeze-tolerant animals, albeit to a lower degree [44,45]. Urea plays a significant role in
increasing the osmolality of body fluids and provides resistant to extreme volume
reductions in the cell during dehydration or freezing [14,46].
Wood frogs and other freeze-tolerant animals must also have adaptations to overcome
problems associated with anoxia (ischemia) and reoxygenation (reperfusion). This is
because after the full onset of freezing, cardiac function comes to a halt and blood
freezes, thereby prevent oxygen delivery to organs and creating a state of ischemia. Not
surprisingly, wood frogs have been shown to tolerate up to 48 hours of anoxia in
chambers filled with N2 gas without exhibiting any sign of damage, independently
freezing [47]. Interestingly, exposure to anoxic conditions did not have a significant
effect on inducing a hyperglycemic response in wood frogs [9,48]. Understandably, a
strong hyperglycemic or uremic response is used for cryoprotection purposes during
freezing and dehydration where cell volumes are significantly reduced; a response that is
absent in anoxic frogs. As such, the limited amount of glucose available is probably used
for energy metabolism rather than cryoprotectant purposes. In support of this, a recent
phosphoproteomics study of anoxic wood frog liver demonstrated that levels of
phosphorylated fructokinase-2 remained unchanged in liver, probably in efforts to
promote anaerobic glycolysis until the available glucose is depleted [49].

14
While anoxia tolerance is not extensively studied in the wood frog, research on other
anoxia-tolerant models have provided insightful information on the molecular responses
needed to survive. Long-term anoxia survival requires several adaptive mechanisms that
if absent, could negatively impact survival. These adaptive mechanisms include: A)
maintaining a large internal reverse of fermentable fuels such as glycogen, B)
supplementing basic glycolytic pathways with other reactions to increase ATP yield per
molecule of glucose, C) optimizing the neutralization and acid buffering capacities of the
cell, D) managing ATP production with ATP consumption rates, and E) maintaining or
inducing a strong antioxidant response system [50]. In most organisms, lipids cannot be
used as a source of fuel in anaerobic conditions, therefore such organisms rely on
carbohydrate catabolism via glycolysis using glycogen (in animals), starch (plants) or
free sugars available in the system to generate energy [50]. Indeed, many anoxia-tolerant
vertebrates, including some species of turtles and frogs, build up large glycogen reserves
in their liver, which can be converted to glucose and mobilized via the blood to other
organs for energy production [51]. Studies on mollusks and other anoxia tolerant
organisms also show the use of certain amino acids (e. g. aspartate, asparagine,
glutamate, and glutamine) as metabolic fuels under oxygen deprived conditions [50,52].
While using glycolysis to generate energy under anerobic conditions is logical, it has its
own limitations: A) low ATP yield per glucose molecule and B) high cellular
acidification due to end-product accumulation [50]. As such, some anoxia-tolerant
species generate alternative end products (such as opines, ethanol, alanine, propionate,
acetate or succinate) to lactate, which not only generate more ATP per glucose molecule
catabolized, but also reduce intracellular acidification [50]. In wood frogs, exposure to

15
freezing was associated with a significant increase in lactate levels in liver (going from
0.76 ± 0.11 in control to 12.1 ± 1.40 µmol/g wet weight (gww)), heart (going from 6.17 ±
1.00 µmol/gww to 31.0 ± µmol/gww), kidney ( going from 8.15 to 35.2 ± 2.36
µmol/gww) and skeletal muscle (going from 1.99 ± 0.70 to 14.8 ± 1.83 µmol/gww);
suggesting a strong reliance on glycolysis for energy production under this condition
[41]. In a species of hypoxia tolerant frogs (Rana temporario), submergence in hypoxic
water at 3 ℃ resulted in the elevation of plasma lactate levels (~9 mmol/L), which was
returned to baseline (~1.5 mmol/L) after 8 weeks of treatment [53], suggesting that
perhaps alternative regulatory mechanisms exist to buffer lactic acidosis. In anoxic
turtles, excessive production of lactate and H+ is buffered by the release of Ca2+ and
HCO-3, which allows for maintaining a safe acid-base homeostatic balance in cells [51].
Due to limited oxygen availability under freezing, anoxia and dehydration, the
mitochondrial electron transport chain becomes greatly reduced, thereby shifting cellular
metabolism toward anaerobiosis [54]. Despite the presence of large quantities of
fermentable fuels under various conditions in wood frogs and adequate buffering systems
to prevent intracellular lactic acidosis, using glycolysis to generate energy will not be
enough to sustain normal metabolic rates. Under aerobic conditions, one mole of glucose
yields 38 moles of ATP; however, under anaerobic conditions, the catabolism of glucose
to lactate and H+ provides a net of only 2 moles of ATP [55]. The imbalance between
energy production and energy consumption is so great that without reprioritizing energy
expenditure, wood frogs will not be able to fuel their cells. Hence, these frogs (and many
other stress-tolerant species) have developed a coordinated biochemical response that
enables them to allocate the finite amount of energy available to fuel pro-survival

16
processes while decreasing or completely interrupting all other nonessential or highly
energy-expensive processes [8,51,53,55,56]. This phenomenon is termed metabolic rate
depression (MRD). While metabolic rates have not measured in wood frogs, studies in
other animals undergoing similar conditions suggest that without MRD, surviving such
conditions is not possible. For example, some species of adult turtles (Chrysemys picta
belli) submerged in anoxic water set to 3 ℃ reduce their metabolic rates by ~90%
compared to normal conditions, and rely mainly on hepatic glycogen reserve for months
[57]. Moreover, frogs that over winter in ice-locked ponds also demonstrate a significant
reduction in metabolic rates (down to ~90%), as do toads and other species of frogs that
live in arid regions of the world [44,58]. Accurate measurement of metabolic rates in
frozen animals is difficult because decreasing the body temperature causes a substantial
decrease in metabolic rates, and interruption in breathing and cardiac function after the
full onset of freezing prevents accurate measurement of oxygen consumption and carbon
dioxide release [8]. A study on freeze-tolerant moor frogs (Rana arvalis) showed that
oxygen consumption was reduced significantly as body temperature decreased, and this
reduction continued until frogs reached a body temperature of -2 ℃, thereafter oxygen
consumption remained the same [59]. Moreover, a study on frozen lizards (Lacerta
vivipara) showed initiation of freezing resulted in a 40% decrease in oxygen consumption
compared to supercooled animals, and both oxygen consumption and carbon dioxide
release fell to zero after ~6 hours of freezing [60]. These studies show that freezing,
anoxia and dehydration (hypoxia-like state)-induced MRD is common amongst stress-
tolerant animals; suggesting that perhaps wood frogs also reduce their metabolic rates in
response to these treatments. This was also partly evident by a study on wood frogs

17
where exposure cooling temperatures (4 ℃ to1 ℃) showed a significant reduction in
carbon dioxide release; suggesting that cold temperatures could potentially reduce
metabolic rates [61].
1.7 Regulation of MRD
The process of MRD is a complicated network of events that requires synchrony
between all cellular processes. Under MRD, the limited energy available is used only to
fuel pro-survival processes (e.g. antioxidant response, anti-apoptotic response, etc.) while
shutting down all detrimental (e. g. apoptosis), non-essential, or energy expensive
processes (e. g. cell cycle, growth, and proliferation) [62–67]. Multiple stress-tolerant
organisms decrease their metabolic rates to 1-30% of their normal levels when faced with
unfavorable conditions to conserve the finite amount of energy available [8,51]. By
decreasing the metabolic rates, many stress-tolerant animals can stay “inactive” for
prolonged periods of time (days, weeks, months or even years) and emerge once
environmental conditions are favorable again.
MRD is regulated at various levels of metabolic organization such as at
transcriptional, post-transcriptional, translational and post-translational levels [8].
Successful entry into and exist from MRD relies on the synchrony between all regulatory
stages; as such, wood frogs must have a coordinated response that enable the induction of
few pro-survival processes while reducing or halting the majority of non-essential or
detrimental processes. At the transcriptional level, epigenetic modification can alter the
accessibility of the DNA to the transcriptional machinery; thereby preventing
transcription [68,69]. For example, DNA methylation and histone acetylation were shown
to play a significant role in regulating hypometabolism in hibernating 13-lined ground

18
squirrels and anoxia tolerant freshwater turtles [70,71]. With respect to wood frogs, a
reduction in protein levels of histone methyl transferases as well as monomethylated
histone (Lys4) proteins were evidence of translational suppression during freezing [68].
The availability of certain transcription factors also contributes to transcriptional
regulation in wood frogs. For example, one of the downstream targets of the nuclear
factor of activated T cell 4 (NFATc4) transcription factor is the atrial natriuretic peptide
(ANP) gene, which plays a significant role in liver regeneration and repair under stress
[72]. As such, NFATc4 DNA binding was elevated in response to anoxia in liver but not
skeletal muscle of wood frogs, resulting in the activation of ANP transcription in the
former but not the latter tissue [72]. Moreover, the myocyte enhancer factor-2 (MEF2)
transcription factor family has been shown to regulate the expression of several genes
involved in glucose transport, phosphagen homeostasis and protein quality control check
[73]. In wood frogs, total levels of phosphorylated MEF2C remained the same in
response to 24-hour anoxia but not 40% dehydration in skeletal muscle, a trend that was
also similar to MEF2C nuclear localization [73]. Interestingly, transcript expression
patterns of glut4, one of the targets regulated by MEF2C that is responsible for glucose
uptake, also exhibited no change in response to dehydration but demonstrated a
significant increase in response to anoxia in wood frog muscle [73]. The same study also
reported no significant change in transcript levels of calreticulin and muscle creatine
kinase, suggesting that perhaps their induction is not necessary during dehydration or
anoxia survival. Altogether, wood frogs use a combination of DNA modifications and
transcription factor availability to regulate transcription under MRD in a temporal and
tissue-dependent manner.

19
At the post-transcriptional level, wood frogs and other stress-tolerant species have
been shown to use microRNA-mediated mechanisms to control the availability and levels
of specific transcripts; whereby the increased abundance of specific microRNAs imply
translational suppression of the mRNA targets, and reduced microRNA levels imply
translation initiation [74,75]. MicroRNAs are short (21-25 nucleotide) single stranded
non-coding RNA molecules that negatively regulate the expression of their target genes
by silencing the messenger RNA (mRNA) [76]. MicroRNAs are transcribed as pri-
microRNAs and subsequently cleaved by Drosha to form ~70 nucleotide precursor-
microRNAs (pre-microRNAs) consisting of hairpin structures [76] (Figure 1.2). Pre-
microRNAs are then exported to the cytoplasm using a RanGTP dependent transporter,
Exportin 5 [77]. Once in the cytoplasm, the pre-microRNA is cleaved by Dicer to form
short (21-25 nucleotide) single stranded RNAs that will further associate with different
proteins to form the RISC structure (RNA-induced silencing complex) and target mRNA
via complementarity [76]. The degree of complementary between the microRNA and the
target mRNA transcript dictates the fate of that mRNA. High complementarity leads to
complete degradation of the transcript, whereas partial complementarity can signal the
transcript for storage in p-bodies and stress-granules for future retrieval [78]. In wood
frogs, a series of studies have shown differential regulation of microRNAs in a tissue and
stress specific manner. For example, miR-16 (microRNA-16) levels increased
significantly in liver when wood frogs were exposed to freezing, indicating that
translation of downstream transcripts under its control (all components of the cell cycle)
was suppressed [79]. Indeed, wood frogs suppress cell cycle activity in response to
freezing, anoxia or dehydration stresses using multiple mechanisms including

20
microRNA-mediated action [66]. Furthermore, screening of 53 microRNAs in cardiac
and skeletal muscle of wood frogs over freeze/thaw showed differential microRNA
regulation in a tissue specific manner with 21 microRNAs showing decreased abundance
in heart during thawing whereas 16 microRNAs increased during freezing in skeletal
muscle [80]. The differentially regulated microRNAs regulated targets involved in
arrhythmogenic right ventricular cardiomyopathy, and actin cytoskeleton remodeling
[80]. Moreover, differential regulation of microRNAs in response to freezing and
thawing in wood frog brain hinted to potential activation of neuroprotective mechanisms
such as synaptic signaling and various intracellular signal transduction pathways that lead
to protection against ischemia/reperfusion injuries. For example, both exposure to
freezing and thawing resulted in the downregulation of miR-204, a microRNA known to
negatively impact the expression of the anti-apoptotic BCL2 protein in neuronal cells
[81]; suggesting a potential role for miRNAs in regulating apoptosis and promoting
survival [82].
Protein synthesis can consume up to ~40% of the total energy available in the
cell. As such, this process is strictly regulated in animals that undergo MRD in efforts to
conserve energy. Regulation of protein synthesis occurs mainly by modulating the
activity of the translational machinery. This could occurs via polysome disaggregation,
which is a hallmark of translational suppression [50,83]. Indeed, protein translation rates
in liver, kidney and brain was significantly reduced, with levels in the latter tissue
decreasing to 0.04% in response to hibernation (a condition also characterized by MRD)
in ground squirrels compared to their euthermic counterparts [84,85]. Regulating the
activity of the translational machinery can also dictate the rate of protein synthesis. For

21
example, studies on liver from frozen wood frogs showed that the AMP-activated protein
kinase (AMPK) phosphorylates and activates eEF-2K (eukaryotic elongation factor 2
kinase) which in turn leads to the phosphorylation of eEF-2 (eukaryotic elongation factor
2), thereby inhibiting peptide chain elongation in the frozen state [86]. Moreover,
exposure to freezing caused a greater than 50% decrease in 4EBP (eukaryotic initiation
factor 4 binding protein) and S6K (ribosomal protein S6 kinase) total and phosphorylated
levels (Jing Zhang, unpublished data). Both 4EBP and S6K play significant roles in
controlling mRNA translation and the decrease in both total and active forms of these
proteins indicate a significant reduction of mRNA translation during freezing.
At the post-translational level, reversible protein modification (such as
phosphorylation, acetylation, ubiquitination, SUMOylation, etc.) has been involved in
regulating MRD in several cases [8,83]. Post-translational modifications (PTMs) are
mediated by various enzymes and the level and activity of these enzymes is subjected to
tight regulation in response to various stress conditions. For example, AMPK activity was
increased by 2-fold in liver of frozen wood frogs and by 2.5, 4.5 and 3-fold in skeletal
muscle of dehydrated, frozen or thawed wood frogs compared to controls [86]. AMPK
inhibits multiple biosynthetic enzymes, the best-known being acetyl-CoA carboxylase
(ACC), a rate-limiting enzyme of fatty acid biosynthesis, that is inhibited by AMPK
phosphorylation at S79. Accordingly, phosphorylated ACC levels rose by 2.5-folds in
liver of frozen wood frogs compared to controls, which lead to the inhibition of fatty acid
biosynthesis [86]. Moreover, glycogen synthase kinase 3 (GSK3) was originally known
for its involvement in regulating glycogen synthase (GS) activity via phosphorylation and
inhibition. Indeed, while total levels of GSK3 did not change in most tissues,

22
phosphorylation at S9 decreased significantly during freezing in most wood frog organs,
implying that GSK3 was active [87]. Active GSK3 then inhibits GS, and that prevents the
re-conversion of glucose back to glycogen under conditions where cryoprotection is still
needed [87]. Moreover, the activity of the pyruvate dehydrogenase complex (PDH), a
multi-subunit enzyme that links anaerobic glycolysis to the aerobic tricarboxylic acid
cycle (TCA), was also shown to be regulated at the post-translational level in wood frog
[88]. A study demonstrated an increase in levels of various pyruvate dehydrogenase
kinases in response to freezing and but not anoxia in liver of wood frogs [88].
Accordingly, PDH also demonstrated an increase in phosphorylation levels at S293 and
S300 in response to freezing but not anoxia; suggesting that this complex is inhibited in
response to the former stress [88]. Regulation by PTMs can also facilitate localization
and the activity of transcription factors. Indeed, under metabolically depressed states
when energy levels are limiting, it is more ideal for animals to stabilize or increase the
activity of certain proteins instead of increasing their expression. For example, while the
total levels of MEF2C did not change in response to anoxia exposure, it phosphorylated
form increased under the same condition, which resulted in its nuclear localization and
the induction of select downstream genes [73]. Moreover, the localization of the
carbohydrate-responsive element binding protein (ChREBP) transcription factor was
hypothesized to be regulated by PTMs in response to freezing in a temporal manner [23].
Phosphorylation can also act to inhibit the activity of select transcription factors. For
example, NFATc4’s activity is inhibited by phosphorylation; and an increase in its
phosphatase (calcineurin A) was demonstrated in response to anoxia exposure in wood
frog liver [72]. This increase resulted in NFATc4 dephosphorylation, NFATc4 activation

23
and its subsequent nuclear translocation, resulting in the induction of its pro-survival
downstream genes in anoxic wood frogs [72]. Altogether, reversible PTMs play a
significant role in regulating MRD by modulating the activity, stability, and localization
of various proteins.
Although each regulatory stage is significant on its own, MRD requires a
coordinated response at all regulatory levels. For example, while inhibitory mechanisms
at the epigenetic level may be enough to prevent transcription by denying DNA
accessibility to the transcriptional machinery, decreased activity (controlled by post-
translational modifications) of specific transcription factors or co-regulators could also be
involved. Likewise, even if total protein levels of specific targets remain unchanged, an
increase in various post-translational modifications could modulate their activity by either
causing temporary inhibition or by stabilizing the available proteins to increase their half-
life. However, even under conditions with ~80-95% overall suppression in metabolism,
stress-tolerant organisms manage to increase the activity a small set of pro-survival
pathways by strategically channeling the available energy to those processes. For
example, whereas the cell cycle is halted, the anti-apoptotic response is induced to help
protect cells. A study on wood frogs exposed to anoxic conditions showed the
overexpression of anti-apoptotic proteins, Bcl-xL and c-IAP in the liver [64]. Moreover,
ROS production is a major hallmark of hypoxic/ischemic events and can cause even more
problems upon reoxygenation/reperfusion. Furthermore, hyperglycemia and increased
protein glycation are also known to promote prooxidant environments in the cell.
Therefore, wood frogs and other stress-tolerant animals increase their antioxidant defense
system accordingly. Indeed, wood frogs were confirmed to have higher basal levels of

24
antioxidant defenses compared to leopard frogs [8,62]. For example, glutathione
peroxidase activity rose by 2.5-fold in various tissues, and was also accompanied by an
increase in glutathione levels during freezing [8,62]. Moreover, levels of select
antioxidant enzymes such as the cytosolic superoxide dismutase1 (SOD1) and the
mitochondrial SOD2 were upregulated in brain and heart of wood frogs respectively in
response to freezing [65]. Additionally, protein levels of catalase was also upregulated in
response to anoxia in brain, suggesting that this antioxidant enzymes is required for ROS
detoxification in this tissue [65]. Wood frogs also differentially regulate the protein levels
of various heat shock proteins (HSPs) and glucose-regulated proteins (GRPs) in response
to stress. Indeed, protein levels of HSP110 was significantly elevated in response to
freezing in liver and kidney, in response to anoxia treatment in liver, brain, and heart, and
in response to dehydration treatments in muscle, brain heart and skin of wood frogs [63].
Protein levels of HSP70 also showed differential regulation, with levels rising in liver,
muscle, heart and kidney in response to freezing, in muscle in response to anoxia, and in
muscle, heart and kidney in response to dehydration [63]. Differential regulation of
HSP60, HSP10, GRP78, and GRP94 were also reported in a tissue and stress-dependent
manner [63]. Altogether, it is clear that despite strict energy utilization under MRD, wood
frogs strategically and selectively induce the expression of select antioxidant and pro-
survival factors to mitigate potential damage that could be cause in early stages,
prolonged exposure or early phases of recovery from different stresses.
1.8 General hypothesis: Molecular response to freezing, anoxia and dehydration
require the induction of various genes involved in regulating autophagy,
angiogenesis, antioxidant response and energy metabolism in a temporal, tissue, and
stress-dependent manner in anticipation for potential damage.

25
Objective 1: Multifaceted regulation of the autophagic machinery in wood frogs
Autophagy is a complex process, characterized by multiple stages (initiation,
nucleation, elongation, and fusion) involving the formation of an autophagosome, a
vesicle-like structure that engulfs defective cytoplasmic molecules, before fusing with the
lysosome to facilitate cargo degradation [89,90]. Autophagy has been extensively studied
in multiple animal models and in response to many environmental and disease conditions,
as dysregulation in autophagy could result in cell death [89,91,92]. Given its importance
in maintaining cellular homeostasis, it was of interest to see how autophagy is regulated
in response to dehydration/rehydration and anoxia/reoxygenation treatments in wood frog
liver and skeletal muscle. Briefly, regulation of autophagy involves the activity of several
transcription factors, chiefly Transcription factor EB (TFEB), which promotes the
transcription of numerous genes involved in autophagosome formation and lysosomal
biogenesis [93,94]. Autophagy is also regulated at the post-transcriptional level by
microRNAs, which target specific components of the autophagosome machinery, thereby
promoting or inhibiting their translation [95,96]. Moreover, autophagy can also be
regulated at the post-translational level by PTMs [97]. Indeed, series of PTMs
(phosphorylation, glycosylation, acetylation, methylation, lipidation, etc.) have been
demonstrated to be crucial for either inducing or inhibiting autophagy in response to
various stimuli [97,98]. In Chapter 2, regulation of autophagy will be studied at multiple
biological levels to decipher the dominant mode of regulation under each stress and tissue
in wood frogs. Logically, wood frogs have regulatory mechanisms that are induced early
after the initial exposure to stress in anticipation of potential damage that could result
after the full onset of stress or in early hours of recovery. While these regulatory

26
mechanisms may not be required at first, their availability on standby mode may be
crucial for mitigating potential damage when it arises. However, autophagy is an energy
expensive process, therefore it is likely that wood frogs reduce autophagic flux during
stress.
Specific hypothesis 1: Autophagy is an energy expensive process, therefore
autophagosome formation and lysosomal biogenesis will be attenuated in response to
stress, and this process is regulated at multiple biological levels in a tissue and stress
dependent manner.
Objective 2: RAGE management: ETS1- EGR1 mediated transcriptional networks
regulate angiogenesis in wood frogs
Freezing, thawing, dehydration, and or rehydration can cause potential rupture of
capillaries, leading to the loss of vascular integrity. Moreover, these stresses could also
result in tissue damage that if not dealt with appropriately, could result in organ failure.
As such, one of the protective mechanisms that could be induced in anticipation of these
events is angiogenesis; the formation of new blood vessels rooting from pre-existing
parent vessels [99–101]. Induction of angiogenesis in response to ischemia in the heart or
in response to tissue injury has been demonstrated to improve cardiac function and
accelerate wound healing [102,103]. Angiogenesis, like many other processes in the cell
is regulated at multiple biological levels. At the transcriptional level, pro and anti-
angiogenic targets are regulated by many transcription factors chiefly the early growth
response 1 (EGR1) and the E26 transformation-specific sequence 1 (ETS-1) transcript

27
factors [99–101]. Upstream to these two factors is the activation of the receptor for
advanced glycation end product (RAGE), which results in phosphorylation of several
kinases that lead to the induction and activation of EGR1 and ETS1 in response to stress
[104,105]. Freezing and dehydration are hyperglycemic events, and the presence of high
levels of glucose in the cell concurrently with the presence of oxidative stress accelerates
the formation of advanced glycation end products (AGEs) [35]. AGEs can associate with
various macromolecules, and negatively impact their function, stability, and clearance.
An earlier study on wood frogs demonstrated that glycated serum albumin is elevated 7
days post-thawing, thereby providing the first line of evidence that AGE formation could
be occurring in wood frogs. On the other hand, exposure to oxidative stress causes the
release of the nuclear high mobility group box 1 (HMGB1) protein to the cytoplasm and
subsequently extracellular space [106,107]. Both AGEs and HMGB1 are ligands of
RAGE and could potentially result in the activation of this receptor and subsequent
induction of EGR1 and ETS1 transcription factors. In Chapter 3, activation of
HMGB1/AGE/RAGE in response to freezing/thawing, anoxia/reoxygenation and
dehydration/rehydration in wood frog liver will be investigated. Moreover, this chapter
will focus on EGR1 and ETS1- regulated targets that are involved in angiogenesis to
determine whether this process occurs in wood frogs in response to stress.
Specific hypothesis 2: Pro and anti-angiogenic factors will be induced in response to
stress in wood frog liver, however their expression will be regulated in a temporal
manner in preparation for potential repair of damaged capillaries or wound healing.

28
Objective 3: RAGE-mediated transcriptional responses in wood frog heart
As mentioned in objective 2, freezing and dehydration are hyperglycemic events that
could result in the formation of AGEs, HMGB1 release from the nucleus to the
cytoplasm, and RAGE activation. A previous cDNA array screen in wood frog heart
demonstrated an increase in RAGE levels in response to freezing [32]. RAGE-mediated
signaling results in the activation of ETS1, a transcription factor that regulates a wide
range of downstream genes involved in numerous processes [108–112]. Other than
angiogenesis (discussed in objective 2), ETS1 also regulates genes encoding antioxidant
enzymes, glucose transport and metabolism, and nuclear encoded mitochondrial proteins
[110–113]. Interestingly, ETS1 can also act as a transcriptional repressor to select group
of downstream genes [114,115]. Studies have shown that overexpression of ETS1 results
in transcriptional inhibition of select nuclear encoded mitochondrial genes such as the
NADH dehydrogenase (ubiquinone 1) α/β subcomplex 1 (NDUFAB1), cytochrome c1
(CYC1), and ATP synthase H+ transporting mitochondrial F1 complex,α subunit 1
cardiac muscle (ATP5A1) [111,112]. This chapter will examine whether
AGE/HMGB1/RAGE mediated activation of ETS1 occurs in the heart of wood frogs
exposed to freezing, anoxia and dehydration, and whether this activation will result in
induction or repression of select downstream genes.
Specific hypothesis 3: ETS1 acts both as a transcriptional activator and a transcriptional
repressor. Specifically, ETS1 will inhibit the transcription of select nuclear encoded
mitochondrial genes, while inducing the expression of select antioxidant enzymes in
response to stress.
29
1.9 References- Chapter 1
[1] K.B. Storey, J.M. Storey, Natural freeze survival in animals, Annu. Rev. Ecol.
Syst. 27 (1996) 365–386. https://doi.org/10.1146/annurev.ecolsys.27.1.365.
[2] K.B. Storey, J.M. Storey, Physiology, biochemistry and molecular biology of
vertebrate freeze tolerance: The wood frog, in: B.J. Fuller, N. Lane, E.E. Benson
(Eds.), Life a Frozen State, CRC Press, Boca Raton, 2004: pp. 243–274.
[3] T. Sformo, K. Walters, K. Jeannet, B. Wowk, G.M. Fahy, B.M. Barnes, J.G.
Duman, Deep supercooling, vitrification and limited survival to -100 C in the
Alaskan beetle Cucujus clavipes puniceus (Coleoptera: Cucujidae) larvae, J. Exp.
Biol. 213 (2010) 502–509. https://doi.org/10.1242/jeb.035758.
[4] M. Potts, Desiccation tolerance of prokaryotes., Microbiol. Rev. 58 (1994) 755–
805. https://doi.org/10.1128/MMBR.58.4.755-805.1994.
[5] D.A. Wharton, Water loss and morphological changes during desiccation of the
anhydrobiotic nematode Ditylenchus dipsaci, J. Exp. Biol. 199 (1996) 1085–1093.
[6] M. Tsujimoto, S. Imura, H. Kanda, Recovery and reproduction of an Antarctic
tardigrade retrieved from a moss sample frozen for over 30 years, Cryobiology. 72
(2016) 78–81. https://doi.org/10.1016/j.cryobiol.2015.12.003.
[7] K.B. Storey, J.M. Storey, Insect cold hardiness: Metabolic, gene, and protein
adaptation, Can. J. Zool. 90 (2012) 456–475. https://doi.org/10.1139/z2012-011.
[8] K.B. Storey, J.M. Storey, Molecular physiology of freeze tolerance in vertebrates,
Physiol. Rev. 97 (2017) 623–665. https://doi.org/10.1152/physrev.00016.2016.
[9] K.B. Storey, J.M. Storey, Natural freeze tolerance in ectothermic vertebrates.,
Annu. Rev. Physiol. 54 (1992) 619–37.
https://doi.org/10.1146/annurev.ph.54.030192.003155.
[10] K.B. Storey, Reptile freeze tolerance: Metabolism and gene expression,
Cryobiology. 52 (2006) 1–16. https://doi.org/10.1016/j.cryobiol.2005.09.005.
[11] K.B. Storey, J.M. Storey, Biochemistry of freeze tolerance in terrestrial insects,
Trends Biochem. Sci. 8 (1983) 242–245. https://doi.org/10.1016/0968-
0004(83)90349-3.
[12] L.B. Middle, B.M. Barnes, Overwintering physiology of the wood frog, Rana
sylvatica, in interior Alaksa, Am. Zool. 41 (2001) 1526–1527.
[13] J.P. Costanzo, R.E. Lee, Avoidance and tolerance of freezing in ectothermic
vertebrates, J. Exp. Biol. 216 (2013) 1961–1967.
https://doi.org/10.1242/jeb.070268.
[14] J.P. Costanzo, M.C.F. do Amaral, A.J. Rosendale, R.E. Lee, Hibernation
physiology, freezing adaptation and extreme freeze tolerance in a northern
population of the wood frog., J. Exp. Biol. (2013).
https://doi.org/10.1242/jeb.089342.

30
[15] D.J. Larson, L. Middle, H. Vu, W. Zhang, A.S. Serianni, J. Duman, B.M. Barnes,
Wood frog adaptations to overwintering in Alaska: New limits to freezing
tolerance, J. Exp. Biol. (2014). https://doi.org/10.1242/jeb.101931.
[16] R.E. Lee, J.P. Costanzo, Biological ice nucleation and ice distribution in cold-
hardy ectotermic animals., Annu. Rev. Physiol. 60 (1998) 55–72.
https://doi.org/10.1146/annurev.physiol.60.1.55.
[17] K.B. Storey, J.M. Storey, Freeze tolerance in animals, Physiol. Rev. 68 (1988) 27–
84. https://doi.org/10.1152/physrev.1988.68.1.27.
[18] M.R. Lee, R.E. Lee, J.M. Strong-Gunderson, S.R. Minges, Isolation of ice-
nucleating active bacteria from the freeze-tolerant frog, Rana sylvatica,
Cryobiology. 32 (1995) 358–365. https://doi.org/10.1006/cryo.1995.1036.
[19] B. Rubinsky, S.T. Wong, J.S. Hong, J. Gilbert, M. Roos, K.B. Storey, 1H
magnetic resonance imaging of freezing and thawing in freeze-tolerant frogs., Am.
J. Physiol. 266 (1994) R1771-7.
https://doi.org/10.1152/ajpregu.1994.266.6.R1771.
[20] J.M. Storey, K.B. Storey, Cold hardiness and freeze tolerance, in: Funct. Metab.,
John Wiley & Sons, Inc., Hoboken, NJ, USA, 2005: pp. 473–503.
https://doi.org/10.1002/047167558X.ch17.
[21] K.B. Storey, J.M. Storey, Molecular biology of freezing tolerance, Compr.
Physiol. 3 (2013) 1283–1308. https://doi.org/10.1002/cphy.c130007.
[22] K.R. Walters, A.S. Serianni, Y. Voituron, T. Sformo, B.M. Barnes, J.G. Duman, A
thermal hysteresis-producing xylomannan glycolipid antifreeze associated with
cold tolerance is found in diverse taxa, J. Comp. Physiol. B. 181 (2011) 631–640.
https://doi.org/10.1007/s00360-011-0552-8.
[23] R. Al-attar, C.-W. Wu, K.K. Biggar, K. Storey, Carb-loading: Freeze-induced
activation of the glucose-responsive ChREBP transcriptional network in wood
frogs, Physiol. Biochem. Zool. (2019) 706463. https://doi.org/10.1086/706463.
[24] M. Miyazaki, J.M. Ntambi, Role of stearoyl-coenzyme A desaturase in lipid
metabolism, Prostaglandins, Leukot. Essent. Fat. Acids. 68 (2003) 113–121.
https://doi.org/10.1016/S0952-3278(02)00261-2.
[25] A.M. Reynolds, R.E. Lee, J.P. Costanzo, Membrane adaptation in phospholipids
and cholesterol in the widely distributed, freeze-tolerant wood frog, Rana
sylvatica, J. Comp. Physiol. B. 184 (2014) 371–383.
https://doi.org/10.1007/s00360-014-0805-4.
[26] Q. Cai, K.B. Storey, Upregulation of a novel gene by freezing exposure in the
freeze-tolerant wood frog (Rana sylvatica), Gene. 198 (1997) 305–312.
https://doi.org/10.1016/S0378-1119(97)00332-6.
[27] K.J. Sullivan, K.K. Biggar, K.B. Storey, Transcript expression of the freeze
responsive gene fr10 in Rana sylvatica during freezing, anoxia, dehydration, and
development, Mol. Cell. Biochem. 399 (2015) 17–25.

31
https://doi.org/10.1007/s11010-014-2226-9.
[28] K.B. Storey, J.M. Storey, Freeze tolerant frogs: Cryoprotectants and tissue
metabolism during freeze–thaw cycles, Can. J. Zool. 64 (1986) 49–56.
https://doi.org/10.1139/z86-008.
[29] S.J. Hemmings, K.B. Storey, Alterations in hepatic adrenergic receptor status in
Rana sylvatica in response to freezing and thawing: Implications to the freeze-
induced glycemic response., Can. J. Physiol. Pharmacol. 72 (1994) 1552–60.
http://www.ncbi.nlm.nih.gov/pubmed/7736347.
[30] J.M. Storey, K.B. Storey, Triggering of cryoprotectant synthesis by the initiation
of ice nucleation in the freeze tolerant frog, Rana sylvatica, J. Comp. Physiol. B.
156 (1985) 191–195. https://doi.org/10.1007/BF00695773.
[31] K.B. Storey, Glycolysis and the regulation of cryoprotectant synthesis in liver of
the freeze tolerant wood frog, J. Comp. Physiol. B. 157 (1987) 373–380.
https://doi.org/10.1007/BF00693364.
[32] K.B. Storey, Strategies for exploration of freeze responsive gene expression:
Advances in vertebrate freeze tolerance, Cryobiology. 48 (2004) 134–145.
https://doi.org/10.1016/j.cryobiol.2003.10.008.
[33] J.R. Layne, R.E. Lee, T.L. Heil, Freezing-induced changes in the heart rate of
wood frogs (Rana sylvatica)., Am. J. Physiol. 257 (1989) R1046-9.
https://doi.org/10.1152/ajpregu.1989.257.5.R1046.
[34] A.J. Rosendale, B.N. Philip, R.E. Lee, J.P. Costanzo, Cloning, characterization,
and expression of glucose transporter 2 in the freeze-tolerant wood frog, Rana
sylvatica, Biochim. Biophys. Acta. 1840 (2014) 1701–1711.
https://doi.org/10.1016/j.bbagen.2013.12.011.
[35] T.J. Lyons, A.J. Jenkins, Glycation, oxidation, and lipoxidation in the development
of the complications of diabetes: A carbonyl stress hypothesis., Diabetes Rev.
(Alexandria, Va.). 5 (1997) 365–391.
[36] L. Reuss, Water transport across cell membranes, in: ELS, John Wiley & Sons,
Ltd, Chichester, UK, 2012.
https://doi.org/10.1002/9780470015902.a0020621.pub2.
[37] Z. Zhang, J.D. Ferraris, H.L. Brooks, I. Brisc, M.B. Burg, Expression of osmotic
stress-related genes in tissues of normal and hyposmotic rats, Am. J. Physiol.
Physiol. 285 (2003) F688–F693. https://doi.org/10.1152/ajprenal.00028.2003.
[38] S. Maallem, A. Berod, M. Mutin, H.M. Kwon, M.L. Tappaz, Large discrepancies
in cellular distribution of the tonicity-induced expression of osmoprotective genes
and their regulatory transcription factor TonEBP in rat brain, Neuroscience. 142
(2006) 355–368. https://doi.org/10.1016/j.neuroscience.2006.06.028.
[39] Y. Zhang, R. Al-attar, K.B. Storey, TonEBP/NFAT5 regulates downstream
osmoregulatory proteins during freeze-thaw stress in the wood frog, Cryobiology.
79 (2017) 43–49. https://doi.org/10.1016/j.cryobiol.2017.09.003.

32
[40] R. Al-attar, Y. Zhang, K.B. Storey, Osmolyte regulation by TonEBP/NFAT5
during anoxia-recovery and dehydration–rehydration stresses in the freeze-tolerant
wood frog (Rana sylvatica), PeerJ. 5 (2017) e2797.
https://doi.org/10.7717/peerj.2797.
[41] K.B. Storey, J.M. Storey, Biochemical adaption for freezing tolerance in the wood
frog, Rana sylvatica, J. Comp. Physiol. B. 155 (1984) 29–36.
https://doi.org/10.1007/BF00688788.
[42] T.A. Churchill, K.B. Storey, Effects of dehydration on organ metabolism in the
frog Pseudacris crucifer : Hyperglycemic responses to dehydration mimic freezing-
induced cryoprotectant production, J. Comp. Physiol. B. 164 (1994) 492–498.
https://doi.org/10.1007/BF00714587.
[43] T.A. Churchill, K.B. Storey, Dehydration tolerance in wood frogs: A new
perspective on development of amphibian freeze tolerance, Am. J. Physiol. Integr.
Comp. Physiol. 265 (1993) R1324–R1332.
https://doi.org/10.1152/ajpregu.1993.265.6.R1324.
[44] K.B. Storey, Life in the slow lane: Molecular mechanisms of estivation., Comp.
Biochem. Physiol. A. Mol. Integr. Physiol. 133 (2002) 733–54.
https://doi.org/10.1016/S1095-6433(02)00206-4.
[45] J.P. Costanzo, R.E. Lee, Cryoprotection by urea in a terrestrially hibernating frog,
J. Exp. Biol. 208 (2005) 4079–4089. https://doi.org/10.1242/jeb.01859.
[46] J.P. Costanzo, R.E. Lee, Urea loading enhances freezing survival and postfreeze
recovery in a terrestrially hibernating frog, J. Exp. Biol. 211 (2008) 2969–2975.
https://doi.org/10.1242/jeb.019695.
[47] C.P. Holden, K.B. Storey, Second messenger and cAMP-dependent protein kinase
responses to dehydration and anoxia stresses in frogs., J. Comp. Physiol. B. 167
(1997) 305–12. https://doi.org/10.1007/s003600050078.
[48] K.B. Storey, J.M. Storey, Signal transduction and gene expression in the regulation
of natural freezing survival, in: Cell Mol. Response to Stress, 2001: pp. 1–19.
https://doi.org/10.1016/S1568-1254(01)80003-6.
[49] L.J. Hawkins, M. Wang, B. Zhang, Q. Xiao, H. Wang, K.B. Storey, Glucose and
urea metabolic enzymes are differentially phosphorylated during freezing, anoxia,
and dehydration exposures in a freeze tolerant frog, Comp. Biochem. Physiol. Part
D Genomics Proteomics. 30 (2019) 1–13.
https://doi.org/10.1016/j.cbd.2019.01.009.
[50] K.B. Storey, J.M. Storey, Oxygen limitation and metabolic rate depression, in:
Funct. Metab., John Wiley & Sons, Inc., Hoboken, NJ, USA, 2005: pp. 415–442.
https://doi.org/10.1002/047167558X.ch15.
[51] D.C. Jackson, G.R. Ultsch, Physiology of hibernation under the ice by turtles and
frogs, J. Exp. Zool. Part A Ecol. Genet. Physiol. 313 A (2010) 311–327.
https://doi.org/10.1002/jez.603.

33
[52] G. Gäde, W.R. Ellington, The anaerobic molluscan heart: Adaptation to
environmental anoxia. Comparison with energy metabolism in vertebrate hearts,
Comp. Biochem. Physiol. Part A Physiol. 76 (1983) 615–620.
https://doi.org/10.1016/0300-9629(83)90463-2.
[53] P.H. Donohoe, R.G. Boutilier, The protective effects of metabolic rate depression
in hypoxic cold submerged frogs, Respir. Physiol. 111 (1998) 325–336.
https://doi.org/10.1016/S0034-5687(97)00125-4.
[54] A. Krivoruchko, K.B. Storey, Forever young: Mechanisms of natural anoxia
tolerance and potential links to longevity., Oxid. Med. Cell. Longev. 3 (2010) 186–
198. https://doi.org/10.4161/oxim.3.3.4.
[55] K.B. Storey, Molecular mechanisms of anoxia tolerance, Int. Congr. Ser. 1275
(2004) 47–54. https://doi.org/10.1016/j.ics.2004.08.072.
[56] A. Gupta, K.B. Storey, Regulation of antioxidant systems in response to anoxia
and reoxygenation in Rana sylvatica, Comp. Biochem. Physiol. Part B Biochem.
Mol. Biol. 243–244 (2020) 110436. https://doi.org/10.1016/j.cbpb.2020.110436.
[57] C. V. Herbert, D.C. Jackson, Temperature effects on the responses to prolonged
submergence in the turtle Chrysemys picta bellii. II. Metabolic rate, blood acid-
base and ionic changes, and cardiovascular function in aerated and anoxic water,
Physiol. Zool. 58 (1985) 670–681.
https://doi.org/10.1086/physzool.58.6.30156071.
[58] P.H. Donohoe, T.G. West, R.G. Boutilier, Respiratory, metabolic, and acid-base
correlates of aerobic metabolic rate reduction in overwintering frogs, Am. J.
Physiol. Integr. Comp. Physiol. 274 (1998) R704–R710.
https://doi.org/10.1152/ajpregu.1998.274.3.R704.
[59] Y. Voituron, L. Paaschburg, M. Holmstrup, H. Barré, H. Ramløv, Survival and
metabolism of Rana arvalis during freezing, J. Comp. Physiol. B. 179 (2009) 223–
230. https://doi.org/10.1007/s00360-008-0307-3.
[60] Y. Voituron, B. Verdier, C. Grenot, The respiratory metabolism of a lizard
(Lacerta vivipara) in supercooled and frozen states, Am. J. Physiol. Integr. Comp.
Physiol. 283 (2002) R181–R186. https://doi.org/10.1152/ajpregu.00378.2001.
[61] B.J. Sinclair, J.R. Stinziano, C.M. Williams, H.A. Macmillan, K.E. Marshall, K.B.
Storey, Real-time measurement of metabolic rate during freezing and thawing of
the wood frog, Rana sylvatica: Implications for overwinter energy use, J. Exp.
Biol. 216 (2013) 292–302. https://doi.org/10.1242/jeb.076331.
[62] D.R. Joanisse, K.B. Storey, Oxidative damage and antioxidants in Rana sylvatica,
the freeze-tolerant wood frog., Am. J. Physiol. 271 (1996) R545-53.
https://doi.org/10.1152/ajpregu.1996.271.3.R545.
[63] J.M. Storey, K.B. Storey, In defense of proteins: Chaperones respond to freezing,
anoxia, or dehydration stress in tissues of freeze tolerant wood frogs, J. Exp. Zool.
Part A Ecol. Integr. Physiol. 331 (2019) 392–402. https://doi.org/10.1002/jez.2306.

34
[64] V.E.M. Gerber, S. Wijenayake, K.B. Storey, Anti-apoptotic response during
anoxia and recovery in a freeze-tolerant wood frog (Rana sylvatica)., PeerJ. 4
(2016) e1834. https://doi.org/10.7717/peerj.1834.
[65] C.-W. Wu, S.N. Tessier, K.B. Storey, Stress-induced antioxidant defense and
protein chaperone response in the freeze-tolerant wood frog Rana sylvatica, Cell
Stress Chaperones. 23 (2018) 1205–1217. https://doi.org/10.1007/s12192-018-
0926-x.
[66] J. Zhang, K.B. Storey, Cell cycle regulation in the freeze-tolerant wood frog, Rana
sylvatica, Cell Cycle. 11 (2012) 1727–1742. https://doi.org/10.4161/cc.19880.
[67] R. Roufayel, K.K. Biggar, K.B. Storey, Regulation of cell cycle components
during exposure to anoxia or dehydration stress in the wood frog, Rana sylvatica ,
J. Exp. Zool. Part A Ecol. Genet. Physiol. 315A (2011) 487–494.
https://doi.org/10.1002/jez.696.
[68] L.J. Hawkins, K.B. Storey, Histone methylation in the freeze-tolerant wood frog
(Rana sylvatica), J. Comp. Physiol. B. 188 (2018) 113–125.
https://doi.org/10.1007/s00360-017-1112-7.
[69] K.B. Storey, Regulation of hypometabolism: Insights into epigenetic controls., J.
Exp. Biol. 218 (2015) 150–9. https://doi.org/10.1242/jeb.106369.
[70] S. Wijenayake, K.B. Storey, The role of DNA methylation during anoxia tolerance
in a freshwater turtle (Trachemys scripta elegans ), J. Comp. Physiol. B Biochem.
Syst. Environ. Physiol. 186 (2016) 333–342. https://doi.org/10.1007/s00360-016-
0960-x.
[71] P.J. Morin, K.B. Storey, Evidence for a reduced transcriptional state during
hibernation in ground squirrels, Cryobiology. 53 (2006) 310–318.
https://doi.org/10.1016/j.cryobiol.2006.08.002.
[72] R. Al-Attar, K.B. Storey, Effects of anoxic exposure on the nuclear factor of
activated T cell (NFAT) transcription factors in the stress-tolerant wood frog., Cell
Biochem. Funct. 36 (2018) 420–430. https://doi.org/10.1002/cbf.3362.
[73] M.P. Hoyeck, H. Hadj-Moussa, K.B. Storey, The role of MEF2 transcription
factors in dehydration and anoxia survival in Rana sylvatica skeletal muscle,
PeerJ. 5 (2017) e4014. https://doi.org/10.7717/peerj.4014.
[74] K.K. Biggar, K.B. Storey, The emerging roles of microRNAs in the molecular
responses of metabolic rate depression, J. Mol. Cell Biol. 3 (2011) 167–175.
https://doi.org/10.1093/jmcb/mjq045.
[75] K.K. Biggar, K.B. Storey, Functional impact of microRNA regulation in models of
extreme stress adaptation, J. Mol. Cell Biol. 10 (2018) 93–101.
https://doi.org/10.1093/jmcb/mjx053.
[76] L. He, G.J. Hannon, Correction: MicroRNAs: Small RNAs with a big role in gene
regulation, Nat. Rev. Genet. 5 (2004) 631–631. https://doi.org/10.1038/nrg1415.

35
[77] A. Grishok, A.E. Pasquinelli, D. Conte, N. Li, S. Parrish, I. Ha, D.L. Baillie, A.
Fire, G. Ruvkun, C.C. Mello, Genes and mechanisms related to RNA interference
regulate expression of the small temporal RNAs that control C. elegans
developmental timing, Cell. 106 (2001) 23–34.
[78] J. Liu, M.A. Valencia-Sanchez, G.J. Hannon, R. Parker, MicroRNA-dependent
localization of targeted mRNAs to mammalian P-bodies, Nat. Cell Biol. 7 (2005)
719–723. https://doi.org/10.1038/ncb1274.
[79] K.K. Biggar, A. Dubuc, K. Storey, MicroRNA regulation below zero: Differential
expression of miRNA-21 and miRNA-16 during freezing in wood frogs,
Cryobiology. 59 (2009) 317–321. https://doi.org/10.1016/j.cryobiol.2009.08.009.
[80] S. Bansal, B.E. Luu, K.B. Storey, MicroRNA regulation in heart and skeletal
muscle over the freeze–thaw cycle in the freeze tolerant wood frog, J. Comp.
Physiol. B. 186 (2016) 229–241. https://doi.org/10.1007/s00360-015-0951-3.
[81] A. Sacconi, F. Biagioni, V. Canu, F. Mori, A. Di Benedetto, L. Lorenzon, C.
Ercolani, S. Di Agostino, A.M. Cambria, S. Germoni, G. Grasso, R. Blandino, V.
Panebianco, V. Ziparo, O. Federici, P. Muti, S. Strano, F. Carboni, M. Mottolese,
M. Diodoro, E. Pescarmona, A. Garofalo, G. Blandino, miR-204 targets Bcl-2
expression and enhances responsiveness of gastric cancer, Cell Death Dis. 3
(2012) e423–e423. https://doi.org/10.1038/cddis.2012.160.
[82] H. Hadj-Moussa, K.B. Storey, Micromanaging freeze tolerance: The biogenesis
and regulation of neuroprotective microRNAs in frozen brains, Cell. Mol. Life Sci.
75 (2018) 3635–3647. https://doi.org/10.1007/s00018-018-2821-0.
[83] R. Al-Attar, K.B. Storey, Suspended in time: Molecular responses to hibernation
also promote longevity., Exp. Gerontol. 134 (2020) 110889.
https://doi.org/10.1016/j.exger.2020.110889.
[84] J.E. Knight, E.N. Narus, S.L. Martin, A. Jacobson, B.M. Barnes, B.B. Boyer,
mRNA stability and polysome loss in hibernating arctic ground squirrels
(Spermophilus parryii), Mol. Cell. Biol. 20 (2000) 6374–6379.
https://doi.org/10.1128/MCB.20.17.6374-6379.2000.
[85] K.U. Frerichs, C.B. Smith, M. Brenner, D.J. DeGracia, G.S. Krause, L. Marrone,
T.E. Dever, J.M. Hallenbeck, Suppression of protein synthesis in brain during
hibernation involves inhibition of protein initiation and elongation., Proc. Natl.
Acad. Sci. U. S. A. 95 (1998) 14511–6. https://doi.org/10.1073/pnas.95.24.14511.
[86] M.H. Rider, N. Hussain, S. Horman, S.M. Dilworth, K.B. Storey, Stress-induced
activation of the AMP-activated protein kinase in the freeze-tolerant frog Rana
sylvatica, Cryobiology. 53 (2006) 297–309.
https://doi.org/10.1016/j.cryobiol.2006.08.001.
[87] C.A. Dieni, M.C. Bouffard, K.B. Storey, Glycogen synthase kinase-3:
Cryoprotection and glycogen metabolism in the freeze-tolerant wood frog., J. Exp.
Biol. 215 (2012) 543–51. https://doi.org/10.1242/jeb.065961.

36
[88] R. Al-Attar, S. Wijenayake, K.B. Storey, Metabolic reorganization in winter:
Regulation of pyruvate dehydrogenase (PDH) during long-term freezing and
anoxia., Cryobiology. 86 (2019) 10–18.
https://doi.org/10.1016/j.cryobiol.2019.01.006.
[89] N. Mizushima, M. Komatsu, Autophagy: Renovation of cells and tissues, Cell. 147
(2011) 728–741. https://doi.org/10.1016/j.cell.2011.10.026.
[90] C. He, D.J. Klionsky, Regulation mechanisms and signaling pathways of
autophagy, Annu. Rev. Genet. 43 (2009) 67–93. https://doi.org/10.1146/annurev-
genet-102808-114910.
[91] N. Mizushima, B. Levine, A.M. Cuervo, D.J. Klionsky, Autophagy fights disease
through cellular self-digestion, Nature. 451 (2008) 1069–1075.
https://doi.org/10.1038/nature06639.
[92] H.S. Jung, K.W. Chung, J. Won Kim, J. Kim, M. Komatsu, K. Tanaka, Y.H.
Nguyen, T.M. Kang, K.H. Yoon, J.W. Kim, Y.T. Jeong, M.S. Han, M.K. Lee,
K.W. Kim, J. Shin, M.S. Lee, Loss of autophagy diminishes pancreatic β cell mass
and function with resultant hyperglycemia, Cell Metab. 8 (2008) 318–324.
https://doi.org/10.1016/j.cmet.2008.08.013.
[93] M. Palmieri, S. Impey, H. Kang, A. di Ronza, C. Pelz, M. Sardiello, A. Ballabio,
Characterization of the CLEAR network reveals an integrated control of cellular
clearance pathways, Hum. Mol. Genet. 20 (2011) 3852–3866.
https://doi.org/10.1093/hmg/ddr306.
[94] M. Sardiello, M. Palmieri, A. di Ronza, D.L. Medina, M. Valenza, V.A.
Gennarino, C. Di Malta, F. Donaudy, V. Embrione, R.S. Polishchuk, S. Banfi, G.
Parenti, E. Cattaneo, A. Ballabio, A Gene Network Regulating Lysosomal
Biogenesis and Function, Science (80-. ). (2009).
https://doi.org/10.1126/science.1174447.
[95] L.B. Frankel, A.H. Lund, MicroRNA regulation of autophagy, Carcinogenesis. 33
(2012) 2018–2025. https://doi.org/10.1093/carcin/bgs266.
[96] H. Li, D. Miao, Q. Zhu, J. Huang, G. Lu, W. Xu, MicroRNA-17-5p contributes to
osteoarthritis progression by binding p62/SQSTM1., Exp. Ther. Med. 15 (2018)
1789–1794. https://doi.org/10.3892/etm.2017.5622.
[97] Y. Xie, R. Kang, X. Sun, M. Zhong, J. Huang, D.J. Klionsky, D. Tang,
Posttranslational modification of autophagy-related proteins in macroautophagy,
Autophagy. 11 (2015) 28–45. https://doi.org/10.4161/15548627.2014.984267.
[98] Y.L. Deribe, T. Pawson, I. Dikic, Post-translational modifications in signal
integration, Nat. Struct. Mol. Biol. 17 (2010) 666–672.
https://doi.org/10.1038/nsmb.1842.
[99] A.M. Randi, A. Sperone, N.H. Dryden, G.M. Birdsey, Regulation of angiogenesis
by ETS transcription factors., Biochem. Soc. Trans. 37 (2009) 1248–53.
https://doi.org/10.1042/BST0371248.

37
[100] N.A. Abdel-Malak, M. Mofarrahi, D. Mayaki, L.M. Khachigian, S.N.A. Hussain,
Early growth response-1 regulates angiopoietin-1-induced endothelial cell
proliferation, migration, and differentiation, Arterioscler. Thromb. Vasc. Biol. 29
(2009) 209–216. https://doi.org/10.1161/ATVBAHA.108.181073.
[101] R.G. Fahmy, C.R. Dass, L.-Q. Sun, C.N. Chesterman, L.M. Khachigian,
Transcription factor Egr-1 supports FGF-dependent angiogenesis during
neovascularization and tumor growth, Nat. Med. 9 (2003) 1026–1032.
https://doi.org/10.1038/nm905.
[102] P. Kumar, S. Kumar, E.P. Udupa, U. Kumar, P. Rao, T. Honnegowda, Role of
angiogenesis and angiogenic factors in acute and chronic wound healing, Plast.
Aesthetic Res. 2 (2015) 243. https://doi.org/10.4103/2347-9264.165438.
[103] T. Johnson, L. Zhao, G. Manuel, H. Taylor, D. Liu, Approaches to therapeutic
angiogenesis for ischemic heart disease, J. Mol. Med. 97 (2019) 141–151.
https://doi.org/10.1007/s00109-018-1729-3.
[104] Y. Xu, F. Toure, W. Qu, L. Lin, F. Song, X. Shen, R. Rosario, J. Garcia, A.M.
Schmidt, S.F. Yan, Advanced glycation end product (AGE)-receptor for age
(RAGE) signaling and up-regulation of Egr-1 in hypoxic macrophages, J. Biol.
Chem. 285 (2010) 23233–23240. https://doi.org/10.1074/jbc.M110.117457.
[105] J.S. Chang, T. Wendt, W. Qu, L. Kong, Y.S. Zou, A.M. Schmidt, S.F. Yan,
Oxygen deprivation triggers upregulation of early growth response-1 by the
receptor for advanced glycation end products, Circ. Res. 102 (2008) 905–913.
https://doi.org/10.1161/CIRCRESAHA.107.165308.
[106] S. Gardella, C. Andrei, D. Ferrera, L. V. Lotti, M.R. Torrisi, M.E. Bianchi, A.
Rubartelli, The nuclear protein HMGB1 is secreted by monocytes via a non-
classical, vesicle-mediated secretory pathway, EMBO Rep. 3 (2002) 995–1001.
https://doi.org/10.1093/embo-reports/kvf198.
[107] J. Evankovich, S.W. Cho, R. Zhang, J. Cardinal, R. Dhupar, L. Zhang, J.R. Klune,
J. Zlotnicki, T. Billiar, A. Tsung, High mobility group box 1 release from
hepatocytes during ischemia and reperfusion injury is mediated by decreased
histone deacetylase activity., J. Biol. Chem. 285 (2010) 39888–97.
https://doi.org/10.1074/jbc.M110.128348.
[108] Z. Gao, G.H. Kim, A.C. Mackinnon, A.E. Flagg, B. Bassett, J.U. Earley, E.C.
Svensson, Ets1 is required for proper migration and differentiation of the cardiac
neural crest., Development. 137 (2010) 1543–51.
https://doi.org/10.1242/dev.047696.
[109] H. Pei, C. Li, Y. Adereth, T. Hsu, D.K. Watson, R. Li, Caspase-1 is a direct target
gene of ETS1 and plays a role in ETS1-induced apoptosis, Cancer Res. 65 (2005)
7205–7213. https://doi.org/10.1158/0008-5472.CAN-04-3566.
[110] M. Shiota, H. Izumi, N. Miyamoto, T. Onitsuka, E. Kashiwagi, A. Kidani, G.
Hirano, M. Takahashi, M. Ono, M. Kuwano, S. Naito, Y. Sasaguri, K. Kohno, Ets
regulates peroxiredoxin1 and 5 expressions through their interaction with the high-

38
mobility group protein B1, Cancer Sci. 99 (2008) 1950–1959.
https://doi.org/10.1111/j.1349-7006.2008.00912.x.
[111] M.L. Verschoor, L.A. Wilson, C.P. Verschoor, G. Singh, Ets-1 Regulates Energy
Metabolism in Cancer Cells, PLoS One. 5 (2010) e13565.
https://doi.org/10.1371/journal.pone.0013565.
[112] M.L. Verschoor, C.P. Verschoor, G. Singh, Ets-1 global gene expression profile
reveals associations with metabolism and oxidative stress in ovarian and breast
cancers, Cancer Metab. 1 (2013) 17. https://doi.org/10.1186/2049-3002-1-17.
[113] X. Zhang, D. Wu, M. Aldarouish, X. Yin, C. Li, C. Wang, ETS-1: A potential
target of glycolysis for metabolic therapy by regulating glucose metabolism in
pancreatic cancer, Int. J. Oncol. 50 (2017) 232–240.
https://doi.org/10.3892/ijo.2016.3770.
[114] G. Mavrothalassitis, J. Ghysdael, Proteins of the ETS family with transcriptional
repressor activity, Oncogene. 19 (2000) 6524–6532.
https://doi.org/10.1038/sj.onc.1204045.
[115] D. Goldman, M.K. Sapru, S. Stewart, J. Plotkin, T.A. Libermann, B. Wasylyk, K.
Guan, Cloning and characterization of GETS-1, a goldfish Ets family member that
functions as a transcriptional repressor in muscle, Biochem. J. 335 (1998) 267–
275. https://doi.org/10.1042/bj3350267.
[116] K.K. Biggar, K.B. Storey, Insight into post-transcriptional gene regulation: Stress-
responsive microRNAs and their role in the environmental stress survival of
tolerant animals, J. Exp. Biol. 218 (2015) 1281–1289.
https://doi.org/10.1242/jeb.104828.

39
Figure 1.1: Schematic diagram of microRNA biogenesis.

40
Chapter 2: Multifaceted
regulation of the autophagic
machinery in wood frogs

41
Multifaceted regulation of the autophagic machinery in wood frogs
Rasha Al-attar1, Kenneth B. Storey1
1Institude of Biochemistry and Department of Biology, Carleton University, Ottawa, ON,
Canada (K1S 5B6)
Corresponding Author:
Kenneth B. Storey
Telephone: +1 (613) 520-2600 x3678

42
1.1 Abstract
The wood frog, Rana sylvatica, is one of the freeze-tolerant vertebrates known to
date. After the full onset of freezing, the wood frog is clinically dead, exhibiting no signs
of brain activity, breathing, heartbeat or muscle movement; but returns to normal function
hours after thawing. As a consequence of freezing, wood frogs must also endure extreme
cellular dehydration, hyperglycemia and anoxia. The current study investigates the effects
of the dehydration/rehydration and anoxia/recovery cycles in regulating autophagy and
lysosomal biogenesis in wood frog liver and skeletal muscle. The results show that
components of the autophagosome biogenesis machinery are significantly downregulated
in liver during anoxia/reoxygenation, and in muscle during anoxia/reoxygenation and
dehydration/rehydration. However, select components of the autophagosome machinery
are upregulated in response to dehydration in wood frog liver; suggesting the formation
of few mature autophagosomes that could engulf damaged macromolecules. Components
of the lysosomal machinery appear to be either unaffected in response to stress or
decrease in response to recovery in both tissues, suggesting potential impairment in
autophagosome and lysosome fusion. Autophagic flux under all conditions in liver and
muscle was shown to be regulated at multiple levels, mainly by transcriptional control
mediated by Transcription Factor EB, microRNAs, and reversible protein modification.
Reduced autophagic flux in liver and muscle under all conditions appears to be a
coordinated response to conserve energy and contribute to stress-induced metabolic rate
depression.
Keywords: Autophagy, lysosomal biogenesis, microRNA, dehydration/rehydration,
anoxia/reoxygenation, wood frogs, hypometabolism, wood frog

43
2.2 Introduction
Natural freeze-tolerance is an astonishing phenomenon that only a handful of
species have mastered. One of such species is the wood frog, Rana sylvatica [1,2]. When
temperatures decrease, wood frogs burry themselves into subnivean, and start the
freezing process as soon as ice from their hibernacula touches their skin [3,4]. Nuclear
magnetic resonance imaging showed that ice formed on the wood frog skin will slowly
propagate inwards to inoculate internal organs [5]. Concurrently, the liver starts the
glycogenolysis process and distributes glucose to different organs to be used as a
cryoprotectant [6]. In fact, blood glucose levels rise from 5 mM under normal conditions
to ~300 mM during freezing, making the wood frog extremely hyperglycemic [7]. Once
fully frozen, wood frogs become clinically dead with no signs of brain activity, heartbeat,
breathing or muscle movement; but resume to normal soon after thawing [8]. Freezing is
also associated with dehydration, because cells move their intracellular water to the
extracellular space to prevent internal ice formation in efforts to maintain cellular
integrity [9]. During this time, the wood frogs could lose up to 70% of their total body
water and become extremely dehydrated [9]. Moreover, complete cardiac arrest after the
full onset of freezing and the freezing of blood itself render the wood frog fully ischemic,
therefore freeze-tolerant frogs must also be anoxia tolerant [10]. Indeed, wood frogs have
been shown to tolerate up to 40% dehydration [11], 48-hour anoxia [12] and glucose
loading (~200 mM plasma glucose levels) [13] independently of freezing; thereby
providing a novel and multifaceted model for studying adaptations to freezing.
In this study, the effects of dehydration/rehydration and anoxia/reoxygenation
treatments on autophagy was investigated in wood frogs. Tolerance toward dehydration is
an evolutionarily conserved phenomenon across many species, especially anurans in

44
response to dry and hot temperatures [14]. Dehydration decreases cell volume and
increases both osmolality and ionic strength in the cytoplasm as it shrinks the cell. To
prevent excessive cellular shrinkage and damage to plasma membrane bilayer, wood
frogs use colligative cryoprotectants [9]. Indeed, exposure to dehydrating condition
stimulated the production and accumulation of glucose in liver, heart, brain, muscle and
kidney, with levels increasing by 9 to ~313 folds (with levels peaking at 1092, 1409, and
1263 nmol/mg protein in brain, heart and liver respectively) compared to control values
[9]. The same study also reported a concurrent decrease in liver glycogen levels and
increase in lactate production; the latter suggesting that wood frogs switch to anaerobic
energy metabolism as blood viscosity increases and blood volume decreases.
Dehydration also stimulates the production of urea, another colligative cryoprotectant
that not only retards water loss, but also contributes to increasing the body fluid
osmolality that is needed to combat excessive cell volume reduction [15,16]. Indeed,
Alaskan wood frogs increase their plasma urea levels from ~10 to ~86 µmol/mL in late
summer to over 187 µmol/mL under dehydrating conditions [17]. Less information is
available on metabolism in anoxia exposed wood frogs, but it has been reported that
exposure to anoxia does not initiate a strong hyperglycemic response as seen during
freezing or dehydration [18,19]. Interestingly, a lack of hyperglycemic response was also
observed in anoxic turtle livers; thereby suggesting that perhaps hyperglycemia is not a
suitable response to anoxia [20]. Understandably, a strong hyperglycemic response is
required for cryoprotective purposes during freezing and dehydration; a response that
may not be necessary under anoxic conditions since there are no evidence of cell volume
reduction, cellular shrinkage, or osmotic pressure. Therefore, glucose levels normally

45
present in anoxic wood frogs would be allocated for energy production rather than
cryoprotection. In support of this, a recent study on the phosphoproteome of the anoxic
wood frog liver proposed that the unchanged levels of phosphofructokinase-2 potentially
allows for anaerobic glycolysis to move forward until fuel levels are depleted [21].
Current literature lacks information on urea metabolism in anoxic wood frogs; however,
it appears that enzymes that regulate the urea cycle are preferentially more active in
frozen and dehydrated rather than anoxic wood frog livers [21]. This finding is also
supported by findings in turtle liver, where biosynthesis of urea drops to zero in anoxic
animals [20]. Although dehydration and anoxia appear to be different from each other,
they appear to share common features and elicit some common responses, one of which
is selective reduction in metabolic rates.
Under anoxic and dehydrating conditions, wood frogs have limited access to
oxygen; as such, they switch to anaerobic metabolism for energy production [22].
However, anaerobic metabolism cannot sustain full metabolic functions, therefore wood
frogs strategically reduce their metabolic rates to allocate the limited energy available
only for processes that promote survival, while reducing or halting all other detrimental
or non-essential ones. For example, cell destructive processes such as apoptosis [23] and
energy expensive proliferative processes such as the cell cycle [24] are attenuated,
whereas pro-survival targets such as protein chaperons, antioxidant enzymes, and
antioxidant metabolites are up-regulated [25,26]. Strict regulation of metabolic rate
depression (MRD) occurs at multiple biological levels: at the transcriptional level,
epigenetic modifications can alter the accessibility of DNA to the transcriptional
machinery; thereby preventing transcription [27]. At the post-transcriptional level, wood

46
frogs have been shown to use microRNA-mediated mechanisms to control the
availability and levels of specific transcripts, where perfect complementarity between
mRNA-microRNA would lead to transcript degradation and partial complementary
would lead to transcript storage [28]. At the translational level, strict regulation of the
ribosomal machinery suppresses protein synthesis to conserve energy [29], and at the
post-translational level, reversible protein modification functions to stabilize/enhance the
enzymatic activity of a given protein or render it inactive until it is needed [22]. Entry
into and exit out of a hypometabolic states depends on perfect synchrony between all
these biological levels; as such, any dysregulation at one or multiple level could lead to
catastrophic outcomes in wood frogs.
Macroautophagy (hereafter referred to as autophagy) is an energy expensive,
catabolic process where defective or dysfunctional cytoplasmic organelles and proteins
are degraded to generate metabolic substrates under different conditions [30]. Although
initial studies on autophagy focused on its role during starvation, recent studies have
investigated the importance of this process in maintaining cellular homeostasis during a
stress response and under different conditions [31–33]. Several studies focus on the
regulation of autophagy during ischemia/reperfusion and normoglycemia/hyperglycemia
events; however, some of these findings are conflicting. For example, one study showed
that excessive autophagy in hippocampal neurons treated with hypoxia/ischemia led to
cell death and inhibition of autophagy reversed this process [34] whereas another
reported that inhibition of autophagy accelerated ischemia-induced liver injury and
induction of autophagy in the same model decreased the levels of reactive oxygen species
and necrotic cell death [35]. Despite these conflicting reports, it is reasonable to propose

47
that basal autophagic activity is beneficial as it could prevent the accumulation of
damaged proteins, organelles, and macromolecules inside the cell.
Autophagy is a multiphase process (initiation, nucleation, elongation and fusion)
involving the fusion of a double-membraned vesicle (autophagosome) that engulfs
defected cytoplasmic material and then fuses with lysosomes, where the cargo will be
degraded [32,36]. A detailed explanation of the sequence of events that occur in
autophagy is outline in Figure 1.1. Given the complexity and the importance of
autophagy, this process is regulated at multiple biological levels. For example, at the
transcriptional level, the induction of autophagy and lysosomal biogenesis are controlled
by multiple epigenetic modifications (histone methylation [37], acetylation [38]), and
multiple transcription factors (for review [39]), one of which is Transcription factor EB
(TFEB). TFEB is a member of the MiT/TFE (microphthalmia/transcription factor E)
family and a master regulator of both autophagy and lysosomal biogenesis [40–42]. The
binding of TFEB to DNA occurs at a conserved E-box sequence (CACGTG), flanked by
specific nucleotides (GTCACGTGAC) that are characteristic to the Coordinated
Lysosomal Expression And Regulation (CLEAR) motif [40,41]. Bioinformatic analysis
revealed the existence of the CLEAR motif within the promoter region of many genes
involved in autophagy initiation and lysosome fusion (BECLIN1, NRBF2, RAB7a,
SQSTM1, various VPS proteins, etc.), lysosomal hydrolases and accessory proteins
(ASAH1, CTSA, GALNS, HEXA/B, etc.), lysosomal membrane formation (CLCN7,
CTNS, MCOLN1, TMEM55B), lysosomal acidification (ATP6 variants), and non-
lysosomal proteins that are involved in lysosomal biogenesis (SMURF1, NAGPA, etc.)

48
[40,41]. As such, activation of TFEB plays a significant role in regulating autophagy and
must therefore be strictly regulated to prevent excessive autophagic influx.
Beside regulation at the transcriptional level, autophagy is also regulated at the
post-transcriptional level by microRNAs (miRNA) [43]. MiRNAs are highly conserved,
small non-coding, single stranded RNAs (~22 nucleotides) that bind to the 3’-
untranslated region (UTR) of specific mRNA transcripts, and based on the degree of
complementarity, they can either degrade the transcript or sequester it in stress granules
and p-bodies for future retrieval [44]. Given the importance of miRNAs in regulating
mRNA translation, they appear to be a feasible and an energy efficient way of controlling
protein synthesis during MRD. Indeed, multiple studies in our laboratory have
demonstrated the involvement of microRNAs in regulating mRNA translation in different
animals that undergo MRD [28,45–48] and also as a response to whole body freezing in
wood frogs [45]. The versatility of miRNAs allows them to bind to multiple target
transcripts and regulate their translation under different conditions. In theory, given their
conserved nature and degree of complementarity to a given transcript, it is reasonable to
assume that the same miRNAs under one condition will likely bind to the same transcript
under different conditions. For example, overexpression of miR-17 resulted in a
significant decrease in protein levels of p62, whereas inhibition of this miRNA increased
the protein levels of p62 in human chondrosarcoma cells [49]. Similarly, overexpression
of miR-17 (along with its AAAGUGC-seed containing miR-20, 93, and 106) resulted in a
decrease protein levels of p62 in hematopoietic progenitors [50].
Autophagy can also be regulated by post-translational modifications (PTMs) [51].
Reversible protein modification is another energy efficient way of controlling protein

49
activity that results in either stabilization of the active form or inhibition of enzymatic
activities [52]. There are numerous known (phosphorylation, glycosylation, acetylation,
methylation, lipidation, etc.) and unknown modifications that can either modify the
proteins once or in sequential and combinatorial manner to regulate their activity [51,52].
Autophagy-regulating proteins (ATGs) are subjected to multiple forms of PTMs, namely
phosphorylation, acetylation, ubiquitination, and lipidation), where the identity of the
modification will dictate the functional role of the corresponding proteins [53,54].
This study evaluated the effects of 40% dehydration, rehydration and 24 h anoxia
and 4 h aerobic recovery on autophagy and lysosomal biogenesis at various biological
levels. The overall results demonstrate a strong attenuation in autophagic degradation
(marked by reduction in protein levels of the autophagic machinery) during anoxia,
reoxygenation, and rehydration (less so during dehydration) in liver and more strongly in
skeletal muscle in all conditions. Current results also demonstrate that the level at which
autophagy is regulated is highly dependent on the type of tissue and the nature of the
stress treatment.
2.3 Methods
Animal treatment
Animal treatment was carried out as described previously [11]. Briefly, adult male
wood frogs were collected from breeding ponds near Ottawa, Ontario during the spring,
kept on ice and transported to Carleton University. Frogs were washed in a tetracycline
bath, housed in plastic boxes lined with damp sphagnum moss, and acclimated at 5 ℃ for
two weeks. The control group (normoxic and hydrated wood frogs) was sampled from
this condition. Animals were euthanized by pithing and liver and hind leg skeletal muscle

50
samples were excised quickly, and flash frozen in liquid nitrogen before being stored at -
80 ℃. All animal care, experimental and euthanasia protocols were carried out as
previously approved by the Carleton University Animal Care Committee (Protocol no.
106935) following /guidelines set by the Canadian Council on Animal Care.
Anoxia/reoxygenation exposure
Sealed plastic containers with a layer of damp paper towel on the bottom (wetted
with water previously bubbled with 100% nitrogen gas for 30 min) were held on crushed
ice. The lid of each containers had two ports: one that would allow 100% nitrogen gas in
and one to vent excess air out. Nitrogen gas was flushed into the containers for
approximately 30 min. and then a group of 4-5 frogs was placed in each jar and lids were
sealed. The jars were flushed with nitrogen gas for another 15 min, before being
transferred to 5 ℃ incubators for 24 h. After the 24 h exposure period (hereafter anoxia),
half of the containers were removed sequentially, placed on ice again, and flushing with
nitrogen gas was reinstated while frogs were euthanized and sampled, as above. For the
reoxygenated group, 24 h anoxia-exposed frogs in other containers were transferred
quickly to new containers lined with damp paper towel (wetted with normoxic water) and
allowed to recover in normal air for 4 h in 5 ℃ incubators. Following this, containers
were placed on ice and animals were sampled as above.
Dehydration/rehydration exposure
Other groups of acclimated frogs were individually weighed, ranked based on
their weight, and placed in dry plastic containers (10 frogs per box) without lids and then
replaced in 5 ℃ incubators. Over time, frogs lost water through evaporation, and their
weights were monitored at intervals. The amount of body water lost was calculated using

51
the following equation (Mi - Md)/(Mi x %H2O) where Mi is the frog initial mass, Md is the
mass at each weighing, and % H2O is the percentage of total body mass of control,
normally hydrated frogs that is water (for control wood frogs this is 80.8 ± 1.2%) [55].
Under these conditions, wood frogs lost ~0.5% of their total body water per hour. Half of
the dehydrated frogs were sampled when they reached 40% of total body water lost. The
remaining 40% dehydrated frogs were transferred to new boxes with ~0.5 cm of water in
the bottom to rehydrate overnight (~16 h) before being sampled.
Total protein extraction for Western blot analysis
Total protein extraction procedures were followed as previously published [56].
Approximately 50 mg of frozen liver or muscle samples (n=4 independent biological
replicates obtained from different animals) were homogenized 1:2 w/v in ice cold
homogenization buffer containing 20 mM HEPES pH 7.4, 100 mM NaCl, 10 mM NaF, 1
mM Na3VO4, 10 mM β-glycerophosphate, 0.1 mM EDTA, and 1 µL of protease inhibitor
cocktail (Bioshop, cat. No. PICoo1.1) per mL of homogenization buffer with a few
crystals of PMSF (phenylmethylsulfonyl fluoride) added. Samples were homogenized
using a Polytron homogenizer for 15-20 seconds. Samples were then centrifuged at
12000 xg for 15 min at 4 ℃, supernatants were collected, and total soluble protein
concentrations were determined using the Bio-Rad protein assay (Bio-Rad, cat. No 500-
0006). Total protein concentration of control, stress and recovery samples were then
standardized to a common concentration using homogenization buffer. Aliquots of total
protein extracts were then mixed 1:1 v:v with 2X SDS loading buffer (100 mM Tris-HCl,
10% v:v glycerol, 10% v:v 2-β-mercaptoethanol, 4% w:v SDS and 0.2% w:v

52
bromophenol blue), and then samples were boiled in a water bath for 5 min. After cooling
on ice for 5 min, samples were stored at -80℃ until use.
Western blotting
Equal protein amounts from control, stress and recovery samples for each tissue
were loaded onto SDS-PAGE gels, 8-10% depending on protein molecular weight
(M.W.), and electrophoresis was carried out using a Bio-Rad Mini Protean III system
(60-150 min depending on protein M.W.) as previously explained [11]. Once the desired
separation was reached, proteins were transferred onto PVDF (polyvinylidene difluoride)
membranes at 160 mA for 45-120 min, depending on the protein’s molecular weight.
Following transfer, membranes were washed with TBST (20 mM Tris base pH 7.6, 150
mM NaCl, 0.05% v/v Tween-20) for 5 min while rocking at room temperature (RT).
Membranes were blocked with non-fat dry milk dissolved in TBST (1-10% as
appropriate) to prevent non-specific binding followed by washing for 3 x 5 min in TBST
while rocking at RT. Membranes were then incubated with 5 mL of primary antibody at
4℃ while rocking overnight, followed by washing as above and then incubation with 5
mL of secondary antibody conjugated to hose-radish peroxidase enzyme for 30 min at RT
while rocking. Membranes were washed again as above and visualized via enhanced
chemiluminescence reagents (ECL). Subsequently, membranes were stained with
Coomassie blue and reimaged to obtain a relative quantification of the total protein in
each lane transferred to the membrane. The estimated total protein in each lane will be
used to normalize the intensity of chemiluminescent bands of the protein of interest to
adjust for slight differences in protein loadings in each gel.

53
The following antibodies were purchased from GeneTex: anti-ULK1
(GTX132669), anti-p-ULK1 (S758) (GTX132654), anti-ATG14 (GTX128166), anti-
LC3B (GTX127375). Antibodies purchased from Abclonal were: anti-p-ULK1(S555)
(AP0760), anti-ATG4a (AP1808a), anti-TFEB (A7311), anti-ATP6V0D1 (A4271). The
following antibodies were from Abgent: anti-Beclin1 Abgent (AP1818a), anti-ATG3
(AP1807a), anti-ATG5L (AP1812a). The anti-p-Beclin1 (S93) antibody was purchased
from Cell Signaling (14717) and anti-p62 was from Biolegend (647701).
Total protein extraction for DNA-Protein interaction enzyme-linked immunosorbent
assay (DPI-ELISA)
Samples of frozen tissue (~50 mg each, n=4 independent biological replicates
from different animals) from control, stress and recovery groups were homogenized in
1:5 w/v cold lysis buffer (EMD Millipore, cat. No. 43-045) containing 10 mM β-
glycerophosphate, 10 mM NaF, 1mM Na3VO4, and 1% protease inhibitor cocktail per
mL of buffer for 15-20 sec using a Polytron homogenizer. Samples were incubated on ice
for ~40 min with intermittent vortexing followed by centrifugation at 14,000 x g at 4℃
for 20 min. Then supernatants were collected and stored at -80℃ until use.
DPI-ELISA
The DPI-ELISA procedure was followed as previously published [56]. DNA
oligonucleotides containing the TFEB consensus sequence were purchased from
Integrated DNA Technologies (Integrated DNA Technologies, Coralville, IA, USA). The
final concentrations of the forward (5'-Biotin-GTAGGCCCACGTGACCGGG-3') and
complementary probes (3’-CATCCGGTGCACTGGCCC-5’) were diluted to 500

54
pmol/µL using double distilled water. The single stranded probes were combined in a 1:1
ratio, before being placed in a thermocycler set to 95℃ for 10 minutes to hybridize. The
double stranded probes were then cooled RT, and diluted with 1x PBS (phosphate buffer
saline, 137 mM NaCl, 10 mM Na2HPO4, 2.7 mM KCl, and 2 mM KH2PO4, pH 7.4). A
volume of 50 µL of the diluted probe was added to each microplate well (40 pmol
probe/well) coated with streptavidin (R&D Systems, Minneapolis, MB, Canada), and
wells were incubated for 1 hour at RT without agitation. Following incubation, excess
unbound probes were removed, and each well was washed 2X with 200 µL of wash
buffer (1X PBS containing 0.1% Tween-20) and one time with 1X PBS. Probed
microplates were kept at 4℃ until use.
The concentration of total proteins extracted for DPI-ELISA was measured using
a Bio-Rad assay immediately before the experiment was performed. Briefly, equal
concentrations (n = 4 independent biological replicates obtained from different animals,
run in duplicates) of the liver and muscle were combined with transcription factor
binding buffer containing 50 mM KCl, 20 mM DTT, 10 mM HEPES, 3 mM MgCl2, 0.5
mM EDTA, 0.5 mg/mL BSA, 10% v:v glycerol, 0.05% NP-40, pH 7.9 and 1 µL of
salmon sperm DNA (1 µg/mL) per well and mixed briefly. The streptavidin coated
microplate wells were purchased from R&D systems (R&D Systems, cat no. CA73521-
134). A volume of 50 µL (containing 15-25 µg of total protein extract) was added to each
probed well, and the microplate was incubated for 1 h at RT with mild shaking. Negative
control wells contained the same assay components, but an equal volume of lysis buffer
(EMD Millipore, cat. no. 43-045) was added in lieu of proteins samples. Following
incubation, excess sample was discarded, and the wells were washed 3X with wash

55
buffer. To detect the amount of TFEB bound, 60 µL of 1:1000 anti-TFEB antibody
diluted in 1X PBST (1X PBS containing 0.05% Tween-20) was added to each well and
the microplate was incubated for 1 h at RT without agitation. Following the removal of
excess primary antibody and washing, 60 µL of 1:2000 anti-rabbit IgG conjugated to
HRP was added to each well, and the plate was incubated for another hour at RT without
agitation. Excess secondary antibody was removed, the wells were washed and 60 µL of
TMB (tetramethylbenzidine; Bioshop, cat. no. TMB333.100) was added to each well.
Once the desired intensity was reached, 60 µL of stop solution (1M HCl) was used to
terminate the reaction. The absorbance of each well was measured at 450 nm (with
reference wavelength of 655 nm) using a Multiskan spectrophotometer (Thermo Electron
Corporation, Waltham, MA, USA).
To ensure TFEB probe specificity, the same assay was performed using wells that
either lacked DNA probe, protein sample, or TFEB antibody. The optimum protein
concentration to be used for each tissue was determined by performing the same assay
using pooled samples at varying concentrations. The concentrations that had the lowest
protein amount and the highest signal to noise ratio were used for each tissue in the
quantification run.
Total RNA extraction
Total RNA was extracted as previously published [48]. Briefly, 50 mg of frozen
liver and muscle (n=4 independent biological replicates from different animals) was
homogenized in 1 mL of Trizol reagent (Invitrogen, cat. no. 15596-018) using a Polytron
homogenizer and subsequently samples were incubated for 5 min on ice. Then 200 µL of
chloroform was added to each tube and mixed for 15 sec. Samples were then centrifuged

56
at 10,000 rpm at 4 ℃ for 15 min. The upper aqueous layer was removed and combined
with another 200 µL of chloroform. Samples were mixed and centrifuged as above, and
the resulting aqueous layer containing total RNA was collected. Each sample was mixed
with 500 µL of isopropanol and placed on ice for ~15 min to precipitate RNA. Samples
were then centrifuged at 12,000 rpm for 15 min at 4 ℃, the supernatant was discarded,
and resulting pellets were washed with 1 mL of cold ethanol (70%). Samples were then
centrifuged at 7,500 rpm for 5 min at 4 ℃, the supernatant was discarded, and remaining
pellets were air dried for 15 min at RT. Pellets were resuspended in autoclaved double
distilled water (30-50 µL depending on pellet size), and the quality of the extracted RNA
was determined by the 260/280 nm ratio using a NanoDrop spectrometer (Fisher
Scientific, Wilmington, DE, USA); samples with ratios higher than 1.8 were used for
further analysis. The integrity of the extracted RNA was also tested by running equal
concentrations of each sample on a 1% agarose gel stained with SYBR Green to visualize
the 28S and the 18S ribosomal bands. RNA was stored at -80 ℃ for future use.
MicroRNA polyadenylation and stem-loop reverse transcription
MicroRNA polyadenylation, stem-loop reverse transcription and quantification
were performed as previously published [48]. Frozen RNA samples were thawed on ice,
and their concentration was again measured using a NanoDrop spectrophotometer. All
RNA concentrations were standardized to 0.8 µg/µL and used for subsequent steps. The
PolyA tailing kit (Epi-Bio, Cat no. PAP5104H) was used for polyadenylation. Briefly, a
total of 10 µL of reaction mixture [1 µg of total RNA, 2U of E. coli poly (A) polymerase
and 1 mM ATP] diluted in reaction buffer (10 mM MgCl2, 0.25 M NaCl, 0.1 M Tris-HCl
pH 8.0) was incubated for 30 min at 37 ℃ to enable microRNA polyadenylation. The

57
reaction was then heated to 95 ℃ for 5 mins to terminate the process and then incubated
on ice for ~15 min. To reverse transcribe the polyadenylated microRNA, 10 µL of each
sample was combined with 5 µL of 250 pM stem-loop adapter primer (Table 2.1) and
incubated at 95 ℃ for 5 min, followed by 60℃ for 5 min. Samples were then centrifuged
and immediately placed on ice for ~5 min. For the reverse transcription step, 15 µL of
polyadenylated microRNA was combined with 10 µL of master mix containing 1 µL (2
units) of mouse Maloney leukemia virus reverse transcriptase (Invitrogen, cat. no. 28025-
013), 1 µL of 25 mM deoxynucleotide triphosphate (BioShop, Burlington, ON, CA), 2
µL of 0.1M of DTT, 1 µL of autoclaved double distilled water, and 5 µL of 5x First
Strand buffer (ThermoFisher Scientific, cat. no. 18080044). Samples were then placed in
a thermocycler and subjected to the following protocol: 16 ℃ for 30 min, 42 ℃ for 30
min, and 85 ℃ for 5 min. Samples were then held at 10 ℃ for ~15 min, serially diluted
in autoclaved double distilled water and stored at -20 ℃ until needed.
Relative microRNA quantification
A select group of microRNAs known to be involved in autophagy regulation was
curated from literature. Their sequences were retrieved from miRbase
(http://www.mirbase.org/), compared to multiple vertebrate species and only the 100%
conserved ones were used for quantification. MicroRNA-specific primers, the universal
primer and reference primers were purchased from Integrated DNA Technologies
(Coralville, IA, USA) (Table 2.1). Relative microRNA amplification was carried out
using the MIQE guidelines [57] using a CFX ConnectTM Real-Time PCR Detection
System, as described previously [45]. Briefly, 2 µL of cDNA was combined with 18 µL
of master mix containing: 10.12 µL autoclaved double distilled water, 4 µL of 1 M

58
trehalose (BioShop, cat. No. TRE222), 2 µL of qRT-PCR buffer (100 mM Tris-HCl pH
8.5, 500 mM KCl, 20 mM MgCl2, 2 mM dNTPs, 100 nM Fluorescein and 1.5% Triton
X-100), 0.5 µL of 100% formamide (BioShop, cat no. FOR001), 0.5 µL of microRNA-
specific forward primer (25 mM), 0.5 µL of universal primer (25 mM), 0.1 µL of SYBR
green diluted in dimethyl sulfoxide (Invitrogen, cat. no. S7585), 0.16 µL of dNTPs (25
mM) and 0.13 µL of Taq polymerase (5U/µL, BioShop, cat. no. TAQ001.1). The
following program was used for microRNA amplification: initial denaturation for 3 min
at 95 ℃, 40 cycles of 15 sec at 95 ℃ followed by 1 min at 60℃. All RT-qPCR analyses
were run in duplicates, subjected to post-run melt curve analysis, and only reactions
amplifying a single peak were used for quantification.
microRNA binding-site prediction
The potential binding sites of miR-17-5p to the p62 mRNA were predicted using
SFold 2.2 STarMir software (http://sfold.wadsworth.org/cgi-bin/starmirtest2.pl) [58].
Since the wood frog is not genome sequenced, the mRNA sequences of another frog
(Xenopus laevis) were used as input sequences for the prediction. The HITS-CLIP based
model (mouse) was used to determine the predicted binding sites.
mRNA cDNA synthesis
First strand cDNA synthesis was carried out by combining 1 µg of RNA and 1 µL
of 200 ng/µL Oligo(dT) (Sigma Genosys) diluted to a final volume of 10 µL with
autoclaved ddH2O and incubated at 65 ℃ for 5 min in a thermocycler (iCycler,Biorad).
Samples were then chilled on ice for 2 min, combined with 4 µL of 5x First Strand Buffer
(Invitrogen), 2 µL of 100 mM DTT, 1 µL of MMLV reverse transcriptase (Invitrogen),

59
and 1 µL of 25 mM dNTPs (Bioshop), and incubated in a thermocycler at 42 ℃ for 60
min. Samples were then chilled on ice, serially diluted, and stored at -20 ℃ until needed.
Primer design & mRNA quantification
Given that the wood frog genome is not sequenced, the forward and reverse
primers for p62 (sequestosome 1; sqstm1) were designed using the Xenopus tropicalis
p62 gene sequence as input in PrimerQuest
(https://www.idtdna.com/pages/tools/primerquest). Only the forward and reverse primers
that were conserved across multiple vertebrate species were used for quantification using
a CFX ConnectTM Real-Time PCR Detection System (Bio-Rad, cat. No. 1855201)
following MIQE guidelines [57]. Each reaction (20 µL in total) contained 10.12 µL of
ddH2O, 4 µL of 1 M trehalose (BioShop, Cat no. TRE222), 2 µL of 10X qRT-PCR buffer
(500 mM KCl, 100 mM Tris-HCl pH 8.5, 20 mM MgCl2, 2 mM dNTPs, 1.5% Triton X-
100, and 100 nM fluorescein), 0.5 µL of 100% formamide (Bioshop, Cat no. For001), 0.5
µL each of forward and reverse primers (both 0.3 nmol/µL), 0.16 µL of 25 mM dNTPs,
0.125 µL Taq Polymerase (5U/ µL, BioShop, Cat no. Taq001.1), 0.1 µL of 100X SYBR
Green diluted with DMSO (Invitrogen, Cat no.S7585), and 2 µL of cDNA. The following
amplification program was used for p62 transcript amplification (Table 2): touchdown
PCR for 3 min at 95 ℃, 9 cycles of 10 sec at 95 ℃, 20 sec at 56 ℃, 20 sec at 72 ℃. The
amplification process then was carried out as follows: 39 cycles of 10 sec at 95℃, 20 sec
at 54 ℃ and 20 sec at 72 ℃. The sequence and amplification protocols for β-actin (Table
2) were performed as described previously [59]. The efficiency of each set of primers
was tested prior to the quantification run, and the specificity of the amplification process
60
was tested by performing a melt-curve analysis after each run. All primers used in this
study produced a single product, and each sample was run in duplicate.
Quantification and statistics
For western blot analysis, the band densities from ECL signals as well as the
corresponding Coomassie blue-stained membranes were determined using the GeneTools
software (Syngene, Frederick, MD, USA). The ECL signal for each band of interest was
standardized against a group of stably expressed bands (well separated from the band of
interest) in the same lane on the Coomassie stained membrane; this accounted for minor
variations in protein loading. This method of standardization was reported to more
reliable than using a single housekeeping protein as reference [60]. The fold changes in
protein levels observed during 24 h anoxia, 4 h aerobic recovery, 40% dehydration or
rehydration were calculated relative to the control group, which was set to 1. Histograms
show mean relative protein expression levels (mean ±SEM) obtained from n=4
independent biological replicates. Statistical significance as compared with controls
(p<0.05) was evaluated assessed by a one-way ANOVA with a Dunnett’s post-hoc test,
using the RBIOPLOT statistical and graphical R package [61].
The absorbance values obtained from the DPI-ELISA experiments were measured
at 450 nm, using 655 nm as the reference wavelength in a Multiskan spectrophotometer
(Thermo Electron Corporation, Waltham, MA, USA). The relative DNA binding levels
of TFEB observed during 24-h anoxia, 4h aerobic recovery, 40% dehydration and
rehydration are calculated relative to the control group, which was set to 1. Relative DNA
binding levels (mean ±SEM) were obtained from n=4 independent biological replicates.
Statistical significance from the control (p<0.05) were calculated by a One-Way ANOVA

61
with Dunnette’s post-hoc test, using the RBIOPLOT statistical and graphical R package
[61].
For all RT-qPCR analyses, the relative microRNA or mRNA levels were
calculated using the comparative ∆∆Cq method. Briefly, raw Cq values were linearized
(2-Cq), and the obtained values were standardized against reference genes that showed
stable expression under the experimental conditions tested. Relative microRNA transcript
levels in liver were standardized against Snord-24-17bp over the anoxia/recovery and
dehydration/rehydration cycles. Relative microRNA transcript levels in muscle were
standardized against Snord-74a-15bp over for anoxia/recovery data, and against 5S RNA
over the dehydration/rehydration cycle in wood frogs. The relative transcript abundance
of the p62 gene was normalized against β-actin in liver because it showed a stable
expression during the anoxia/recovery and dehydration/rehydration cycle in wood frogs.
Transcript levels of both mRNA and microRNA over the stress/recovery cycle were
expressed relative to the control, which was set to 1. Relative transcript abundance (mean
±SEM) was obtained from n=3-4 independent biological replicates. Statistically
significant differences from controls were calculated by a one-way ANOVA with
Dunnett’s post-hoc test, with p<0.05 accepted as significant using the RBIOPLOT
statistical and graphical R package [61].
2.4 Results
Relative protein expression levels of autophagy markers
Using immunoblotting, relative levels of select proteins involved in various stages
of autophagy were measured over the anoxia/recovery and dehydration/rehydration
cycles in wood frog liver and skeletal muscle. In liver of anoxia-exposed frogs, levels of

62
ULK1 increased significantly by 1.6 ± 0.10-fold after 24 h of anoxia exposure and
remained high at 1.67± 0.15-fold over controls after 4 h of aerobic recovery (Figure 2.2).
Phosphorylation of ULK1 also increased strongly under anoxia with p-ULK1 (S555) and
p-ULK (S758) contents rising by 5.1 ± 0.58-fold and 2.0 ± 0.10-fold, respectively, after
24 h anoxia exposure and remaining high at 5.5 ± 0.24-fold and 2.2 ± 0.2-fold over
controls, respectively, after 4 h of aerobic recovery. By contrast, total protein levels of
ATG3 and ATG4a decreased significantly by 30 ± 4% and 43 ± 4%, respectively, after
anoxia exposure and remained low at 30 ± 5% and 32 ± 10% compared to controls, after
aerobic recovery. Beclin1 levels also decreased significantly by 44 ± 1.0% after anoxic
exposure, while showing no significant difference from controls after 4 h aerobic
recovery. Levels of ATG5L, p-beclin1 (S93) and ATG14 remained unchanged over the
anoxia/recovery cycle, whereas p62 increased by 1.26 ± 0.07-fold after anoxia exposure
compared to the control group but returned to baseline after aerobic recovery. Levels of
LC3BI increased by 5.5 ± 0.42-fold after anoxia exposure and remained significantly
high at 2.7 ± 0.24-fold over controls after aerobic recovery. The same antibody capable
of detecting both forms of LC3B failed to detect levels of LC3BII in liver from
anoxic/reoxygenated wood frogs.
In liver of wood frogs exposed to 40% dehydration and rehydration treatments, a
similar response was seen for the ULK1 proteins (Figure 2.3). Levels of total ULK1, p-
ULK1 (S555) and p-ULK1 (S758) increased significantly by 2.9 ± 0.36-fold, 2.2 ± 0.11-
fold, and 3.8 ± 0.42-fold after dehydration, respectively. Total ULK1 and p-ULK1 (S555)
levels returned to control values after rehydration whereas p-ULK1 (S758) levels
remained high at 3.6 ±0.5-fold over controls. Total protein levels of ATG3, ATG4a and

63
beclin1 showed no significant change over the dehydration/rehydration cycle, but levels
of ATG5a decreased by 53 ± 4.7% during dehydration before returning to baseline after
rehydration. Levels of phosphorylated beclin1 (S93) increased by 3.6 ± 0.35-fold during
dehydration. ATG14 content was unchanged after dehydration but decreased by 48 ± 9%
after rehydration. Levels of p62, LC3BI and lipidated LC3BI (LC3BII) increased by 2.1
± 0.13-fold, 3.7 ± 0.63-fold and 8.1±1.3-fold respectively during dehydration compared
to controls but returned to baseline after rehydration. The ratio of lipidated (LC3BII) to
non-lipidated LC3BI increased by 2.2 ± 0.9-fold during dehydration before returning to
control levels upon recovery.
To investigate whether the expression of autophagy markers occurs in a tissue-
specific manner, we measured the same targets in skeletal muscle over the
anoxia/reoxygenation and dehydration/rehydration cycles. Notably, most targets showed
a significant downregulation, whereas targets such as p-ULK1 (S758) and LC3BII were
below the detection limit under both conditions in the muscle.
In muscle, total levels of ULK1 decreased to 14 ± 6.4% after 24 h anoxia and
remained low at to 13 ± 3.2% after reoxygenation, as compared with controls (Figure
2.4). By contrast, p-ULK1 (S555) levels were unchanged. ATG3 levels decreased by 43
± 15% after anoxia treatment before returning to baseline after reoxygenation. Levels of
ATG4a, ATG5L and beclin1 decreased by 43 ± 11%, 77 ± 5.0 %, 64 ± 7.5%,
respectively, after anoxia exposure treatment, and remained reduced after reoxygenation
at 52 ± 6.4%, 73 ± 5.7 %, and 47 ± 7.8% as compared to controls. While levels of p-
beclin1 (S93) showed no change in anoxia, levels decreased by 84 ± 1.6% after
reoxygenation. Both ATG14 and p62 contents also decreased significantly by 64 ± 9.2,
64
and 79 ± 7.2%, respectively, after anoxic treatment and remained low at 54 ± 7.6 and 78
± 3.3% of controls after reoxygenation. Whereas levels of LC3BI were unchanged after
anoxia exposure, levels increased by 4.4 ± 0.98-fold compared to the control group after
reoxygenation.
The effects of dehydration and rehydration on muscle are shown in Figure 2.5.
Total ULK1 was decreased by 70 ± 8.2% after dehydration and by 86 ± 1.6% after
rehydration, whereas levels of p-ULK1 (S555) and ATG3 were unchanged. Levels of
ATG4a decreased by 44 ± 15% after dehydration but showed no significant change after
rehydration compared to controls. ATG5L levels decreased by 44 ± 7.2% and remained
low 42 ± 3.9% after dehydration and rehydration treatments, respectively. Whereas total
levels of beclin1 were unchanged, levels of p-beclin1 (S93) decreased by 58 ± 3.7% after
dehydration and by 69 ± 5.7% after rehydration, as compared with controls, respectively.
Levels of ATG14 and p62 remained the same over the dehydration/rehydration cycle,
whereas LC3BI showed a significant increase by 2.5 ± 0.15-fold during rehydration,
compared to the control group.
Relative expression levels of TFEB, ATPV0D1, and DNA binding of TFEB
TFEB is a master regulator of lysosomal biogenesis and regulates the expression
of several autophagy-related proteins [40,41]. To probe TFEB involvement in dealing
with anoxia or dehydration stresses, we examined the DNA binding activity of TFEB
using an ELISA method, total TFEB protein levels, and the levels of a key lysosomal
downstream target, ATPV0D1. Effects of anoxia or dehydration stresses on TFEB
binding to its DNA consensus sequence were assessed in liver and muscle. Anoxia
exposure led to a significant 1.5 ± 0.15-fold increase in liver TFEB binding to DNA

65
compared to controls, but this was reversed after reoxygenation (Figure 2.6A).
Dehydration stress had the same effect with DNA binding increasing by 1.5 ± 0.20-fold
after 40% dehydration but again returning to baseline after rehydration (Figure 2.6B). A
very different response was seen for TFEB in skeletal muscle. DNA binding levels by
TFEB decreased by 48 ± 9.6% after anoxia exposure and by 69 ± 4.2% after
reoxygenation, as compared with values for control muscle (Figure 2.6A). Dehydration
stress had a similar effect in muscle with a substantial downward trend in TFEB binding
in muscle of 40% dehydrated frogs, and a significant 64 ± 9.4% decrease in binding in
muscle of rehydrated frogs compared to control (Figure 2.6B).
Total protein expression levels of TFEB as determined by immunoblotting were
not affected by anoxia/reoxygenation treatment in liver (Figure 2.7A), whereas levels of
ATPV0D1 protein (a transcriptional target of TFEB) were unaffected by anoxia but
showed a significant decrease (by 45 ± 5.4%) after 4 h of aerobic recovery compared to
the control group. By contrast with the response to anoxia, dehydration treatment led to a
2.1 ± 0.26-fold increase in TFEB protein levels in liver, with a return to baseline levels
after rehydration (Figure 2.7B). Levels of ATPV0D1 were unaffected by dehydration but
were decreased by 85 ± 2.8% after rehydration.
Skeletal muscle showed a different pattern of response by TFEB and ATPV0D1.
Anoxia exposure led to a strong decreased in both proteins (Figure 2.8A); TFEB and
ATPV0D1 decreased by 56 ± 7.9% and by 55 ± 10.7% after 24 h anoxia and fell further
by 78% ± 2% and 61 ± 8.8%, respectively, after reoxygenation, as compared to controls.
Dehydration/rehydration had a lesser effect on both TFEB and ATPV0D1 in skeletal
muscle. Dehydration to 40% of total body water loss did not significantly affect the levels

66
of these proteins but both TFEB and ATPV0D1 were significantly decreased by 32 ±
2.4% and 39 ± 4.7%, respectively, in muscle after rehydration, compared to controls
(Figure 2.8B).
Relative transcript levels of autophagy-regulating microRNAs
A list of ten miRNAs known to regulate components of the autophagic machinery
was curated from the literature and measured in wood frog liver and muscle over the
anoxia/reoxygenation and dehydration/rehydration cycles. Figure 2.9 shows the relative
responses of these miRNAs to stress and recovery in liver using a heat map format. Liver
transcript levels of miR-25-3p increased by 1.4 ± 0.1-fold after reoxygenation, whereas
miR-26-5p levels rose by 1.7 ± 0.16-fold and by 1.7 ± 0.1-fold after anoxia and
reoxygenation, respectively (Figure 2.9A). Levels of miR-30a-5p and miR-30d-5p
showed significant increases of 1.6 ± 0.09 and 1.5 ± 0.15-fold, respectively, after aerobic
recovery. Transcript levels of miR-106b-5p increased by 1.6 ± 0.07-fold after anoxia
treatment and remained high after aerobic recovery at 1.6 ± 0.04-fold compared to
controls.
In response to dehydration/rehydration, all but one of the miRNAs evaluated in
liver were downregulated during dehydration (Figure 2.9B). Transcript levels of miR-17-
5p, miR-20-5p, and miR-25-3p decreased by 50 ± 7.6%, 45 ± 5.7%, and 59 ± 2.9%,
respectively, after dehydration compared to controls. Similarly, levels of miR-30a-5p and
miR-30d-5p decreased by 53 ± 6.8% and 46 ± 7.9% respectively, in response to
dehydration compared with controls. By contrast, the only response to rehydration was a
1.4 ± 0.11-fold increase in miR-34a-5p levels compared with controls.

67
A comparable analysis of these ten miRNAs in skeletal muscle revealed only one
significant change in response to anoxia, a 25 ± 2.5% decrease in miR-20-5p in response
to anoxia followed by a return to baseline after reoxygenation (Figure 2.10A). However,
four miRNAs showed increased levels in response to dehydration/rehydration treatments
(Figure 2.10B). Transcript levels of miR-25-3p increased by 1.9 ± 0.1-fold in response to
dehydration and remained at this level (1.9 ± 0.3-fold) after rehydration, as compared to
the control group. MiR-30a-5p levels also rose by 1.9 ± 0.2-fold in response to
dehydration but decreased again after rehydration. Transcript levels of both miR-34a-5p
and miR-106b-5p increased by 1.4 ± 0.08-fold and 2.0 ± 0.1-fold, respectively, after
dehydration and levels remained high at 1.6 ± 0.07-fold and by 1.7 ± 0.22-fold after
rehydration compared to the control group.
Relative transcript levels of p62
Relative transcript abundance of p62, a downstream target of TFEB and miR-17-
5p was assessed in liver over anoxia/reoxygenation and dehydration/rehydration cycles
(Figure 2.11). Transcript levels of p62 increased by 2.0 ± 0.36-fold after anoxia and by
2.2 ± 0.3-fold after dehydration treatment before returning to baseline after recovery in
both conditions.
Bioinformatic analysis of miR-17 binding site
Previous studies have confirmed that miR-17-5p binds to the p62 transcript to
regulate its translation under different conditions [49,50]. Given that wood frogs are not
genome sequenced, the full-length transcript of p62 (NM_001086451.2) from another
frog, Xenopus laevis, was used to study the logistical probability of its binding with miR-

68
17-5p (Figure 2.12). The predictions showed both seed-site and seedless-site binding in
the 3’-UTR, 5’-UTR and the CDS of the p62 transcript.
2.5 Discussion
Autophagy is a highly complex process whereby damaged macromolecules and
organelles are tagged, degraded, and recycled in the cytoplasm. Studies have shown that
autophagy is initiated in response to many stimuli including but not limited to organismal
development [62], pathogenesis and disease [63], and during natural adaptation to
environmental stresses [64,65]. While there are conflicting studies on the role of
autophagy during stress [34,35], it is reasonable to assume that basal levels of autophagy
could be beneficial to cells. Autophagy has been extensively studied during nutrient
starvation [66]; however, wood frogs undergoing anoxia/reoxygenation and/or
dehydration/rehydration cycles are metabolically depressed and have access to sufficient
amounts of fermentable fuel (glucose, glycogen) as well as lipid fuels (in the case of
dehydration). As such, it is unlikely that initiation of autophagy during stress in wood
frogs is due to nutrient deprivation, but rather it could be a response that acts to clear up
stress-induced damaged macromolecules and organelles from the cell.
Immunoblotting was used to assess the effects of anoxia/reoxygenation and
dehydration/rehydration treatments on the expression levels of select proteins involved in
autophagosome biogenesis. We hypothesized that energy expensive catabolic processes
such as autophagy would be downregulated or maintained at a basal level under cell
stress conditions to conserve energy under hypometabolic states. The results for liver
show that total protein levels of ULK1 increased significantly in response to both anoxia

69
and reoxygenation (Figure 2.2), and dehydration (Figure 2.3) before returning to normal
upon rehydration. In agreement with these findings, previous studies have also reported
an increase in protein levels of ULK1 following hypoxia treatment in different cells lines;
suggesting that ULK1 activation may be necessary to initiate a similar stress-response in
wood frogs [67,68]. ULK1 is regulated by reversible phosphorylation at two different
sites: S555 activates and S758 inhibits. The increase in total ULK1 levels in the present
study was accompanied by an increase in its active form (p-ULK1 S555) under anoxia
Fig. 2.2), reoxygenation (Fig. 2.2), and dehydration in liver (Figure 2.3); similar findings
were also observed in hypoxic cells [68]. Interestingly, although p-ULK1
phosphorylation at S555 is mediated by AMPK (AMP activated protein kinase) [69], an
earlier study on wood frogs showed that the enzymatic activity of AMPK was not
affected by anoxia or dehydration treatments in liver; and modest levels of AMPK
remained active [70]. As such, perhaps the basal level of AMPK in liver was enough to
phosphorylate ULK1 at S555 to promote its activation. Active ULK1 can then translocate
to the isolation membrane (initiating from the endoplasmic reticulum, ER) and initiate the
nucleation phase of autophagosome formation [71]. Activation of ULK1 by AMPK is
balanced by deactivation of this kinase by mTORC1 (mechanistic target of rapamycin
complex 1) to balance autophagic flux. Surprisingly, levels of the inactive form of ULK1
(phosphorylated at S758) also increased during anoxia, reoxygenation, dehydration and
rehydration in the liver (Figure 2.2, 2.3). While information on mTORC1 responses to
anoxia or dehydration stresses is not available for wood frogs, studies on other animal
models capable of resisting various environmental stresses report either no change
[72,73] or an increase in mTOR activation following stress in liver [74]. Therefore, it is

70
possible that an increase in p-ULK1 (S758) phosphorylation is caused by mTOR
activation (or lack of inhibition) in wood frog liver. Interestingly, a recent study
demonstrated that hyperosmotic stress also promotes ULK1 phosphorylation at S758
[75]. Given that dehydration in wood frogs not only increases the concentration of all
ions and metabolites in cells, but also that frogs counter dehydration by a surge of
synthesis of compatible solutes (glucose, urea) to help defend cell volume [9,17]. As
such, it is possible that hyperosmotic conditions may be responsible in part for ULK1
inactivation. Hence, it appears that pools of both active and inactive ULK1 are present in
liver, perhaps to easily promote or inhibit autophagosome biogenesis depending on the
cellular requirements.
Nucleation and further maturation of phagophores involves an interconnected web
of known and unknown proteins and complexes, that although have similar functions, are
involved in different mechanisms of autophagy induction. A simplistic paradigm of
phagophore nucleation depends on ULK1 activation, where active ULK1 in a complex
with ATG13, FIP200 (FAK family interacting protein 200) and ATG101 promotes the
recruitment of the nucleation complex containing many proteins including beclin1 and
ATG14, to the growing phagophore [76,77]. The PtdIns 3K (phosphoinositide-3-kinase)
is involved in two complexes, where complex I involving VPS15 (vacuolar protein
sorting 15), VPS34, ATG14 and beclin1 regulates autophagy and complex II (VPS15,
VPS34, VPS38 and beclin1) regulates vacuolar protein sorting; for review see [78]. The
coiled-coil domain of ATG14 interacts with beclin1, and this interaction is necessary for
the recruitment of the VPS34 complex to the autophagosome biogenesis site at the ER
[79]. This recruitment facilitates the production and incorporation of PI3P

71
(phosphatidylinositol 3-phosphate) to the ER membrane, thereby promoting the
formation of membrane curvature termed the omegasome (nucleation step) [80]. Beclin1
is another crucial regulator of autophagy, and it contains three domains: a Bcl-2
homology (BH)-3 domain [81], a coiled-coil domain (CCD) [82], and an evolutionarily
conserved domain (ECD)[83], where each domain interacts with a set of co-factors to
maintain homeostasis between autophagy and apoptosis in the cell; for review see [84].
For example, under normal conditions, the BH3 domain of beclin1 can physically interact
with the anti-apoptotic Bcl-2 and Bcl-XL proteins to keep both processes at homeostatic
levels [85]. This interaction also leads to beclin1 homodimerization and inactivation
which results in the inhibition of autophagosome biogenesis [86]. There are multiple
mechanisms that can induce beclin1 activation and the initiation of autophagosome
biogenesis, and while they are different, the outcome is the same. Firstly, phosphorylation
of Bcl2 by JNK1 (c-jun N-terminal kinase1) can free beclin1 from its homodimerized
state, allowing it to heterodimerize with ATG14 to induce autophagosome biogenesis
[87]. Secondly, phosphorylation by kinases such as ULK1 at S30 [88] and or AMPK at
S93 [89] can also lead to beclin1 activation, its association with ATG14 [89] and the
induction of phagophore nucleation. Thirdly, when cells are faced with oxidative stress, a
non-histone chromatin binding protein called the high mobility group box 1 (HMGB1) is
translocated to the cytoplasm [90]. HMGB1 shares considerable homology with Bcl2 but
has higher affinity for beclin1 [91]. As such, it competes with Bcl2 for beclin1, and its
binding frees Bcl2 from beclin1 in favor of inhibiting apoptosis and promoting autophagy
[91,92]. Overall, the underlying mechanism is that liberated beclin1 will bind to ATG14
and promote the nucleation of the autophagosome. In the present study, levels of ATG14

72
were unaffected by anoxia/reoxygenation and dehydration, but levels decreased
significantly during rehydration in liver (Figure 2.2, 2.3). A lack of positive response
from ATG14 under such conditions may suggest that autophagosome formation is
unaffected in liver of wood frogs exposed to anoxia/reoxygenation and dehydration,
whereas further attenuation in autophagosome formation occurs after rehydration.
Interestingly, it was reported that ATG14, a crucial regulator of autophagy, is recycled
back to the cytoplasm after autophagosome maturation following fusion with the
lysosome [93]. Given that mRNA translation is greatly suppressed during MRD, it is
energetically more beneficial to increase the stability of proteins by extending protein
half-life via PTMs [94]. Therefore, despite a lack of positive response during these
conditions, if we suppose that only basal levels of autophagy are retained in the cell, then
the present amount of recyclable ATG14 could in theory be enough to facilitate the
autophagosome biogenesis process, albeit at lower levels. Total levels of beclin1 decrease
under anoxia, returned to baseline after reoxygenation, and were unchanged in response
to dehydration/rehydration treatment in liver (Figure 2.2, 2.3). Interestingly, the content
of p-beclin1 (S93), the active form, remained unaffected after anoxia/reoxygenation but
increased significantly during dehydration before returning to baseline after rehydration
in the same tissue (Figure 2.2, 2.3). A decrease in total beclin1 levels during anoxia
followed by a lack of response by its active form indicates that perhaps autophagosome
initiation is decreased below basal level during anoxia but returns to baseline after
reoxygenation. Conversely, a significant increase in the active form of p-beclin1 in
dehydrated liver hints at a potential increase in autophagosome biogenesis in this tissue,
whereas this response returns to baseline after rehydration. Phosphorylation of p-beclin1

73
(S93) by AMPK [89] promotes its association with ATG14 [89], and the recruitment of
more complexes to the growing phagophore. Moreover, the increase in active p-ULK1
(p-ULK S555) seen during dehydration (Figure 2.3) could also promote the
phosphorylation of beclin1 at an alternative site (S30) to stabilize its interaction with
ATG14 [88], and phosphorylation of ATG14 at S29 to promote the PI3P production
activity of VPS34 [95].
Binding of ATG14 to PI3P on the omegasome enhances the membrane sensing
ability of ATG14, which stabilizes the growing curvature and causes the recruitment of
the autophagosome elongation complex (ATG5, ATG12 and ATG16) [80]. The ubiquitin
activating enzyme E1-like ATG7 and the ubiquitin conjugating E2-like ATG10
covalently attach ATG5 to the ubiquitin-like ATG12 proteins [96]. The constitutive
binding of ATG5 and ATG12 is irrespective of the autophagic state of the cell and
together, these proteins are translocated to the isolation membrane upon autophagic
stimuli [97]. The ATG5-ATG12 complex can also bind non-covalently with ATG16, a
multimeric protein that is crucial for directing the localization of the elongation complex
to the growing isolation membrane [97,98]. It was shown that ATG5 is crucial for
membrane targeting and phagophore maturation [98], and deletion of ATG5 results in
decreased autophagic vesicles in embryonic stem cells [96]. The current data showed no
significant change in ATG5 levels over the anoxia/reoxygenation cycle in liver, but
surprisingly, levels decreased during dehydration before returning to normal after
rehydration (Figure 2.2, 2.3). A lack of response during anoxia could, again, be indicative
of basal levels of autophagosome formation; however, a decrease during dehydration
would suggest a reduction in this process. The latter is inconsistent with the remaining

74
markers that suggest a potential increase in autophagosome formation. During
phagophore maturation, ATG5 is localized to the outer membrane of the growing
autophagosome [96]. Indeed, the asymmetric distribution of ATG5 allows the ATG5-12
complex to dissociate from the fully formed autophagosome and before its fusion with
the lysosome, suggesting that perhaps this complex is also recyclable [96]. The recycling
of proteins rather than their degradation and de novo synthesis is a hallmark of MRD as it
allows cells to conserve the finite amount of energy available while still maintaining
basal activity levels. Alternatively, a decrease in ATG5 during dehydration may be in
response to limiting its non-autophagic activities. A previous study reported that cleavage
of ATG5 by calpain generates a truncated form of ATG5 that can translocated to the
mitochondria and binds with the anti-apoptotic Bcl-XL protein [99]. This association
activates Bax and promotes the release of cytochrome c from the mitochondria resulting
in cell death [99]. In wood frogs, anoxia and reoxygenation treatments induced the
expression of numerous anti-apoptotic proteins in liver, including Bcl-XL, which in
summation demonstrate a strong inhibition of apoptosis under such conditions [23].
Therefore, the limited amount of ATG5 available under the same conditions is probably
only allocated to promoting autophagosome assembly and maturation. In contrast, the
decrease in protein levels of ATG5 during dehydration could be a response to limit the
initiation of apoptosis in liver and channel the limited ATG5 available only toward
autophagosome maturation.
Another step necessary for autophagosome maturation and selective autophagy is
the attachment of numerous adaptor proteins, including but not limited to LC3 and p62.
The LC3 family is composed of multiple proteins (including but LC3A, LC3B and

75
LC3C), but LC3B has been extensively used as an autophagy marker [100,101]. The
ATG12 component of the ATG5-ATG12-ATG16 complex (resembles an E3 enzyme)
physically interacts with ATG3, facilitates its E2-like activity, and has been shown to be
crucial for the recruitment of LC3 to the growing autophagosome [102]. Pro-LC3B is
cleaved by ATG4 to generate LC3I [103]. This cleavage exposes the C-terminal glycine
residue of the protein, facilitating the E1-like ATG7, the E2-like ATG3, and the E3-like
ATG5-ATG12-ATG16 complex-mediated conjugation of phosphatidylethanolamine (PE)
to LC3BI to generate LC3BII [101,102]. Lipidated LC3B (LC3BII) can then be localized
both on the inside and outside of the autophagosomal membrane [104], and this
localization will promote the recruitment of p62 to the maturing autophagosome [105].
The p62 protein serves as an adaptor molecule that enables the recruitment and
engulfment of the polyubiquitinated macromolecules by the maturing autophagosome
and their degradation later in the autolysosome [106]. Once the maturation of the
autophagosome is complete, ATG14 can also directly bind many proteins, including the
SNARE (SNAP receptor) proteins STX17-SNAP29, found on the autophagosome and
promote their fusion with VAMP8 (vesicle-associated membrane protein 8) proteins
found on the lysosome, to form the autolysosome [93,107]. It was postulated that
dephosphorylation of PI3P leads to the dissociation of the majority of ATG14 proteins
from the autophagosome to promote curvature instability, a process that will prime the
autophagosomal membrane for fusion with the lysosome [80]. Interestingly, the
remaining ATG14 along with STX17 proteins can be retrieved from the autolysosome
and recycled back into the cytoplasm for reuse [93].

76
The present results show that levels of ATG3 and ATG4a both decreased
significantly in response to anoxia and reoxygenation, whereas levels of p62 and LC3BI
increased significantly after anoxia treatment liver in (Figure 2.2). Levels of LC3BI
remained high after reoxygenation in the same tissue (Figure 2.2). Interestingly,
correlated with significantly low levels of ATG3 and ATG4a, immunoblotting failed to
detect any LC3BII under the same conditions, suggesting that perhaps the few
autophagosome that do form do not fuse with the lysosome to complete the autophagic
degradation process. Indeed, an LC3BII/LC3BI ratio of higher than1 is indicative of
autolysosome formation and is considered one of the gold-standard methods for assessing
autophagic flux in the cell [108,109]. Lack of fusion of the autophagosome with the
lysosome during anoxia and reoxygenation in wood frog liver is also consistent with the
lack of p62 degradation (Figure 2.2). Therefore, given that p62 is degraded with the
tagged cargo in the autolysosome and can be used as a marker to measure autophagic flux
[108,109], then an increase in the levels of both p62 and LC3BI could suggest a strong
attenuation in autophagosome fusion with the lysosome in following
anoxia/reoxygenation treatments. Overall, it appears that cells exposed to these
conditions form limited numbers of autophagosomes to capture damaged
macromolecules and organelles but delay fusion with lysosomes and cargo degradation
until such time as energy levels are high again.
After the dehydration/rehydration treatments, liver ATG3 and ATG4 levels
remained constant (Figure 2.3). The data also showed a significant increase in both p62
and LC3BII/I ratio after dehydration treatment in liver before returning to normal after
rehydration (Figure 2.3). While levels of the two latter markers increased, the proteins

77
that regulate their attachment to the autophagosome remained the same. This is not
unusual if low levels of autophagic flux are assumed. Moreover, many proteins of the
autophagosome biogenesis machinery, including ATG3 and ATG4, will dissociate from
the mature autophagosome before its fusion with the lysosome and are recycled back to
the cytoplasm for subsequent conjugations [110]. As such, despite a lack of increase in
these levels, it is still possible to have a basal level of autophagic degradation. The
increase in LC3BII levels indicates the formation of complete autolysosomes and
potentially an increase in autophagic flux, however an increase in p62 levels can also
indicate a lack of autophagic degradation. While these results are somewhat conflicting, it
is likely that some of the mature autophagosomes fuse with lysosomes during
dehydration to degrade the tagged cargo. While dehydration can reduce the frog’s
metabolic rate substantially, these organisms still have access to oxygen albeit at hypoxic
levels. Therefore, in comparison to anoxia where no oxygen is available, dehydration
appears to favor the formation of more autolysosomes in support of increasing autophagic
flux and cargo degradation under these conditions.
Autophagy can also be regulated at the transcriptional level by tweaking the
transcriptional activity of various transcription factors necessary for transcribing proteins
involved in the initiation, nucleation, elongation and maturation complexes [111]. Of the
many transcription factors involved, this study focused on TFEB that is a master
regulator of lysosomal biogenesis and has been shown to regulate various proteins
involved in autophagosome biogenesis [39,41,42,112]. Under normal conditions, TFEB
is heavily phosphorylated by multiple kinases (mTORC1, ERK2, etc.) and is sequestered
in the cytoplasm where it associates with protein 14-3-3 [42,113]. Once the

78
transcriptional activity of TFEB is required, calcineurin facilitates TFEB
dephosphorylation, thereby allowing it to dissociate from protein 14-3-3 and enter the
nucleus [113]. In the nucleus, TFEB binds to many autophagy and lysosomal genes
containing the CLEAR element to induce their expression [39,41,42,112]. Of interest is
the localization of TFEB. This transcription factor can be found in the cytoplasm as well
as on the lysosomal surface where it interacts with the LYNUS (lysosome nutrient
sensing) machinery, and is either active or inactive depending on the cellular nutrient
levels [112]. Given the importance of TFEB in regulating both autophagy and lysosomal
biogenesis, an examination of its transcriptional activity under anoxia/reoxygenation and
dehydration/rehydration conditions was justified.
Analysis of the DNA binding activity of TFEB to its consensus sequence used
DPI-ELISA. The results show that the DNA binding ability of TFEB increased
significantly under anoxia before returning to baseline after aerobic recovery in liver
(Figure 2.6A). Interestingly, the total protein levels of TFEB remained the same over the
anoxia/reoxygenation treatment in the same tissue (Figure 2.7A). This suggests that
probable regulation of TFEB at the posttranslational level, instead of its de novo
synthesis, is responsible the increase in DNA binding activity. Indeed, TFEB is
dephosphorylated in response to various stimuli by calcineurin, and that step is required
for its nuclear localization and enhanced DNA binding activity [113]. A previous study
from our lab showed an increase in calcineurin levels after anoxia treatment in liver of
wood frogs [56]; suggesting that perhaps calcineurin is dephosphorylating and activating
TFEB in this tissue. On the other hand, the present results also demonstrate an increase
in TFEB DNA binding, and total protein levels in response to dehydration, with levels

79
returned to baseline after rehydration (Figure 2.6B, 2.7B). This suggests that perhaps
dehydrated cells require a higher number of lysosomes, a finding that could be supported
by a potential increase in autophagic flux in liver during dehydration.
TFEB has been shown to directly bind to the promoters of autophagy-related
genes including but not limited to ATG4, LC3B, beclin1, p62 and the lysosomal
hydrolase ATP6V0D1 (ATPase H+ transporting V0 subunit D1) [41,111,113].
Correlation with the present data, the increase in TFEB DNA binding in liver extracts
from anoxic and dehydrated correlates with an increase in p62 and LC3BI levels in the
tissue (Figure 2.2, 2.3), but not with the remaining factors. Moreover, levels of
ATP6V0D1 remained unchanged during anoxia and dehydration, despite an increase in
TFEB DNA binding levels, and decreased further during reoxygenation and recovery in
the same tissue (Figure 2.7A, 2.B). Perhaps maintaining only a basal level of this
lysosomal hydrolase is necessary during stress in wood frogs. This hypothesis also fits
with the proposed potential levels of autophagic flux under these conditions. It is likely
that due to limited energy available, degradation of the tagged cargo occurs at later stages
of recovery when full aerobic respiration is restored.
Regardless, the differential regulation of autophagy and lysosomal biogenesis
genes by TFEB suggests the involvement of a multi-level surveillance system that
regulates both processes. Therefore, it is possible that TFEB-mediated gene expression is
regulated either upstream of transcription by epigenetic factors that render specific genes
inaccessible to TFEB, or at the posttranscriptional level by miRNAs. To determine
whether the expression of autophagy targets is regulated at the posttranscriptional level, a

80
list of miRNAs that are known to regulate autophagy was curated from the literature.
Interestingly, whereas the general pattern of miRNA expression correlates well with the
dehydration/rehydration data, the correlation between the same miRNAs and their
downstream targets is poor under anoxia/reoxygenation conditions, suggesting that
perhaps other modes of regulation may be involved. For example, miRDB
(http://www.mirdb.org/) predicted 662 potential mRNA transcripts, including ULK1, that
harbored the conserved sequence for mature miR-25-3p. This prediction was also
validated by another group, where inhibition or overexpression of miR-25-3p increased
and decreased levels of ULK1 proteins, respectively [114]. Whereas these results show a
significant increase in miR-25-3p levels during reoxygenation (Figure 2.9A), protein
levels of ULK1 remain significantly high under the same condition (Figure 2.2). Given
the complexity of anoxia tolerance and autophagy, it is possible that induction of miR-25-
3p during reoxygenation is due to its alternative role in regulating other non-autophagy
targets. The results also showed an increase in miR-26-5p after both anoxia and
reoxygenation treatments (Figure 2.9A). This miRNA was shown to bind to the 3’UTR of
ULK2 transcripts in cancer cells leading to ULK2 transcript suppression and the
inhibition of autophagy [115]. ULK1 and ULK2 are both functionally redundant, and
therefore activation of autophagy could proceed even if only one of these kinases is
available. In the present study the levels of ULK1 were significantly increased over the
anoxia/reoxygenation treatment. As such, it is possible that an increase in miR-26-5p
suppresses the expression of ULK2 under the same conditions to conserve energy during
MRD. The present results also show an increase in the levels of miR-30a-5p and miR-
30d-5p after reoxygenation (Figure 2.9A). Previous studies have shown that miR-30a-5p

81
binds to the 3’UTR of the beclin1 transcript [116,117], whereas miR-30d-5p
overexpression was shown to reduce protein levels of ATG2B, ATG5, ATG12, beclin1
and BNIP3L, resulting in the reduction in the LC3BI to LC3BII conversion [118]. While
levels of ATG5 and beclin1 were not affected by overexpression of miR-30d-5p or miR-
30a-5p in the case of beclin1 upon reoxygenation, detection of LC3BII did not occur
under the same condition despite an increase in LC3BI levels (Figure 2.2). Although
further evaluation is warranted, it is possible that an increase in these microRNAs is
responsible for the absence of LCBI lipidation observed after reoxygenation, possibly as
an effort to reduce autophagic flux under this condition.
Levels of miR-106b-5p increased over the anoxia/reoxygenation cycle (Figure
2.9A). Previously, it was found that overexpression of miR-106b-5p was shown to
downregulate ATG16L1 protein expression by targeting its transcript at the 3’UTR, and
reducing the conversion of LC3BI to LC3BII [119]. Interestingly, the same study also
demonstrated that transfection with miR-106b-5p inhibited ATG12 gene expression, only
minimally reduced beclin1 gene expression, and surprisingly caused an increase in p62
protein levels [119]. Given that the current study shows the absence of LC3BII, a
minimal decrease in beclin1 and a significant increase in p62 levels, it is possible that
overexpression of miR-106-5p was associated with these changes during anoxia. Thus,
with the complexity of autophagy, the versatility of miRNAs, and the nature of the stress,
it appears that multiple networks of miRNAs regulate the expression of autophagy
proteins simultaneously. Regardless, these findings demonstrate the precision and rigor of
controls involved in fine-tuning this process over the anoxia/reoxygenation cycle.
82
The same analysis was performed for liver from dehydrated/rehydrated frogs. The
trend of miRNA expression following dehydration/rehydration treatments correlates well
with the liver protein expression data under the same conditions. For example,
overexpression of miR-20-5p and miR-25-3p was shown to inhibit ULK1 protein
expression [114,120]. The current study shows the opposite result – a decrease in
transcript levels of both miRNAs (Figure 2.9B) correlated with an increase in ULK1
protein levels during dehydration (Figure 2.3). Therefore, upregulation of ULK1 may be
facilitated by the actions of these two miRNAs during dehydration. Moreover, levels of
miR-30a-5p and miR-30d-5p were significantly reduced during dehydration (Figure
2.9B) suggesting that lower levels of miR-30a-5p could help to stabilize the protein levels
of its downstream target, beclin1, that did not change following dehydration treatment
(Figure 2.3). Perhaps, given that autophagy appears to be more active in liver of
dehydrated frogs, it is possible that alternative methods of regulation are involved.
Indeed, we have demonstrated that beclin1 levels are regulated by phosphorylation and
that an increase in p-beclin1(S93) could be responsible for promoting autophagosome
maturation (Figure 2.3). It is possible that a decrease in miR-30d-5p levels during
dehydration was responsible for the enhanced expression of ATG2B, ATG12 and
BNIP3L in wood frog liver. The upregulation of these proteins promotes conversion of
LC3BI to LC3BII, a finding that was evident in the results following
dehydration/rehydration treatments (Figure 2.3). MiR-40d-5p was also reported to target
ATG5 and beclin1 [118]. Surprisingly, despite evidence of some autophagic flux during
dehydration, levels of ATG5 were reduced and beclin1 remained the same in liver
(Figure 2.3). As such, it is possible that ATG5 and beclin1 levels are regulated by

83
alternative mechanisms that enhance their enzymatic activity and protein stability. The
present results also demonstrate an increase in miR-34a-5p (Figure 2.9B) during
rehydration, and this miRNA was shown to target the 3’UTR of the HMGB1 transcript
[121]. Stress-induced cytosolic translocation of HMGB1 displaces Bcl2 from the beclin1-
Bcl2 complex, thereby allowing beclin1 to participate in autophagosome biogenesis and
Bcl2 to inhibit apoptosis [91,92]. Therefore, it is possible that induction of miR-34a-5p
contributes to reducing HMGB1 levels to help dampen autophagic flux during
rehydration. Further experiments are warranted.
Since the genome of wood frogs have not been sequenced, validation of all gene
transcript levels could not be done to support the miRNA results. However, transcript
levels of p62 were measured in response to anoxia/reoxygenation and dehydration/
rehydration in liver (Figure 2.11). The results show that both anoxia and dehydration
stresses significantly increased p62 transcript levels, but values returned to normal during
recovery. Correlated with these results, the protein levels of p62 also increased under the
same conditions (Figure 2.2, 2.3). Previous studies have demonstrated that
overexpression miR-17 reduces the protein levels of p62 in different cell lines and under
different conditions [49,50]. The results of the present work show that whereas transcript
levels of miR-17-5p show a decreasing trend in response to anoxia and reoxygenation,
their difference is not statistically significant (Figure 2.9A). However, in response to
dehydration, transcript levels of miR-17-5p decreased significantly but returned to
baseline following rehydration (Figure 2.9B). These changes during anoxia and
dehydration may be responsible for promoting p62 protein translation in an effort to
support autophagosome assembly. Indeed, bioinformatic analysis predicted both seed

84
binding and seedless regions in the 3’UTR, 5’UTR and CDS of p62 transcripts where
miR-17-5p could bind (Figure 2.12). Therefore, it is highly likely that the expression of
miR-17-5p could contribute in part to regulating the expression of p62 protein under
stress conditions in wood frog liver. Altogether, it is evident that miRNAs, at least in
part, play a role in regulating autophagic flux in response to anoxia/reoxygenation and
dehydration/rehydration in wood frog liver.
To study whether the regulation of autophagosome biosynthesis occurs in a tissue-
specific manner, the same analyses were carried out on skeletal muscle from wood frogs
that underwent anoxia/reoxygenation or dehydration/rehydration treatments. Both liver
and muscle contain glycogen stores; however, only liver glycogen is used to generate
glucose to be distributed to the other organs. Muscle glycogen is allocated only to
muscle-specific use and does not contribute to overall cryoprotection for other organs. As
such, this raised interest in comparing autophagy and lysosomal biogenesis in a
metabolically active tissue such as liver with a tissue that is less metabolically active
under environmental stress conditions such as skeletal muscle.
In contrast to the liver, many of the targets involved in autophagosome biogenesis are
significantly downregulated after anoxia/reoxygenation and dehydration/rehydration in
wood frog muscle (Figure 2.4, 2.5). The results show a significant decrease in
components of the nucleation complex; where levels of ULK1, beclin1, and ATG14
decreased significantly in response to anoxia and reoxygenation in muscle (Figure 2.4).
Furthermore, there was no change in the phosphorylation levels of the active form of p-
ULK1 (S555) following anoxia/reoxygenation or dehydration/rehydration treatments

85
(Figure 2.4, 2.5). The activity of AMPK, the kinase that mediates the phosphorylation on
ULK1, was not affected by anoxia treatment but increased significantly during
dehydration in skeletal muscle [70]. Given the extremely low protein levels of ULK1
following anoxia/reoxygenation, the basal level of AMPK available may be responsible
for maintaining its S555 phosphorylation status (Figure 2.4). However, despite an
increase in AMPK levels during dehydration, levels of p-ULK1 S555 remained
unchanged under the same condition in the muscle (Figure 2.5). This suggests that
perhaps a basal level of autophagosome formation is occurring in the muscle; however,
given that total ULK1 levels were minuscule, the number of autophagosomes formed
must be low.
Recruitment of ATG13, FIP200 and ATG101 following ULK1 activation
facilitates the recruitment of beclin1 and ATG14, two factors that are crucial for
autophagosome biogenesis [76,77]. The results for wood frog muscle show a decrease in
beclin1 and ATG14 levels following anoxia and reoxygenation, but levels of both targets
remained unchanged in response to dehydration and rehydration treatments (Figure 2.4,
2.5). A significant decrease in beclin1 and ATG14 strongly supports attenuation of
autophagosome nucleation following anoxia/reoxygenation treatments, but a basal level
of autophagosome initiation would be maintained following dehydration/rehydration
treatment. As mentioned earlier, recruitment of the ATG5-ATG12-ATG16 complex to
the growing autophagosome is required for the maturation of the autophagosome and the
recruitment of other adaptor proteins that are crucial of cargo targeting and
autophagosome closure [97,98,102]. Our results demonstrate a significant reduction in
ATG5 protein levels following anoxia, reoxygenation, dehydration and rehydration

86
treatments in wood frog muscle, again suggesting a strong reduction in autophagosome
biogenesis. Although ATG5 has been shown to be recycled in the cell [96], in
combination with other factors, a strong case against autophagosome maturation can be
made.
As the autophagosome matures, ATG4 cleaves pro-LC3B to generate LC3BI
[103], and this facilitates the activity of ATG7, ATG3 and the ATG5-ATG12-ATG16
complex, whereby PE is attached to LC3BI to form LC3BII [101,102]. As a hallmark of
autophagosome maturation, LC3BII then coats both the outside and the inside of the
autophagosome [104] before recruiting the p62 adaptor protein to promote selective
cargo engulfment [106]. The results for wood frog muscle show a significant decrease in
ATG4 levels following anoxia, reoxygenation and dehydration before returning to normal
upon rehydration (Figure 2.4, 2.5). Interestingly, the changes in ATG4 levels following
anoxia, reoxygenation, and rehydration did not appear to affect its downstream activity in
cleaving LC3B into LC3BI under the same conditions, although levels rose following the
respective recoveries (Figure 2.4, 2.5). Levels of ATG3, one of the E2-like enzymes
necessary for LC3BII conversion were significantly downregulated following anoxia but
were unchanged upon reoxygenation, dehydration or rehydration. The decrease or lack of
response by ATG3 was evident, since under all conditions skeletal muscle failed to
convert LC3BI into LC3BII. Together, these results suggest the absence or a very limited
number of autophagosomes formed under all conditions. Interestingly, whereas low
levels of p62 indicated an increase in cargo recognition and engulfment, autophagosome
fusion with the lysosome and increase in autophagic flux, without other markers, these
results could be misleading [106]. Levels of p62 decreased strongly under anoxia and

87
reoxygenation, as compared with controls, but remained unaffected following
dehydration and rehydration (Figure 2.4, 2.5). Low levels of p62, in combination with our
previous findings, suggest that muscle exposed to anoxia and reoxygenation, and to a
lesser degree during dehydration and rehydration treatments, significantly reduces the
process of autophagosome formation, leading to incomplete autophagy. As explained
earlier, under energy-restricted conditions, ATP-expensive processes such as autophagy
are suppressed in an effort to conserve energy for pro-survival processes. Therefore,
wood frogs strategically use checkpoints at multiple biological levels to maintain the
autophagic machinery at bay under high stress conditions that might otherwise trigger
this catabolic process.
As explained earlier, TFEB is a master regulator of lysosomal biogenesis and has
been shown to also regulate the expression of several genes involved in autophagosome
biogenesis [39,41,42,112]. The results of this study showed that the DNA binding activity
of TFEB was significantly reduced following anoxia and reoxygenation, remained
unaffected during dehydration but decreased significantly following rehydration (Figure
2.6A, 2.6B). Given that this transcription factor regulates the vast majority of genes
involved in both autophagy and lysosome formation, the data on TFEB binding to DNA
are consistent with a decrease in autophagic flux. The reduction in DNA binding could
also be due to a significant decrease in TFEB protein levels following
anoxia/reoxygenation treatments (Figure 2.8A). Interestingly, the same correlation was
seen for dehydration/rehydration treatments, where unchanged DNA binding (Figure
2.6B) was associated with unchanged protein levels of TFEB following dehydration,
before significantly decreasing after rehydration (Figure 2.8B). Thus, these results for

88
TFEB protein levels strongly suggest an attenuation of the autophagy and lysosomal
biogenesis responses at the transcriptional level. Indeed, transcriptional regulation is one
of the main controlling steps involved in MRD [13,27,122].
Downregulation of targets involved in autophagosome biogenesis is also
supported by the results for TFEB analysis. Studies have shown that TFEB regulates the
transcription of numerous autophagy genes including but not limited to ATG4, beclin1,
p62 and ATP6V0D1 [41,111,113]. In response to anoxia, expression of ATG4, beclin1,
p62 and ATP6V0D1 in wood frog skeletal muscle (Figure 2.4, Figure 2.8A) correlated
well with TFEB DNA binding in response to anoxia, thereby providing another line of
evidence that both components of the autophagosome machinery and lysosomal
biogenesis are significantly reduced in muscle under stress conditions. Results for
dehydrated/rehydrated muscle also showed a correlation between unchanged DNA
binding activity of TFEB following dehydration, and the protein levels of Beclin1, p62,
and ATP6V0D1 (Figure 2.5, Figure 2.8B). Altogether, these results suggest that
transcriptional regulation, mediated in part by TFEB, is responsible for a significant
reduction in the levels of proteins involved in autophagosome and lysosomal biogenesis,
resulting in a decrease in autophagic flux in muscle.
Finally, we also examined the involvement of miRNAs in regulating protein
synthesis under stress and recovery in muscle. Whereas many of the miRNAs measured
showed downregulation in response to anoxia, only one miRNA showed a statistically
significant decrease. MiR-20 is previously shown to suppress the expression of ULK1
proteins [120], and therefore a reduction in its levels (Figure 2.10A) should lead to an

89
increase in ULK1 protein levels. Interestingly, our analysis shows a significant reduction
in ULK1 levels; suggesting that perhaps the expression of this kinase is regulated by
other factors upstream of miRNA control. Indeed, a reduction in TFEB activity could
account for this change and supports the proposal that ULK1 expression is regulated at
the transcriptional level during anoxia/reoxygenation in wood frog skeletal muscle.
Most of the miRNAs measured in muscle showed a significant increase following
dehydration and rehydration treatments, and our results demonstrate a strong correlation
between levels of the miRNA and their downstream targets. For example, levels of miR-
25-3p increased significantly in response to dehydration and rehydration (Figure 2.10B),
which correlates well with the decreased protein levels of ULK1 under the same
conditions (Figure 2.5A). Indeed, it was previously shown that overexpression of miR-
25-3p resulted in reduced levels of ULK1 protein [114]. As such, it is likely that the
reduction of ULK1 protein levels seen in wood frog muscle during dehydration and
rehydration is mediated post-transcriptionally via miRNAs. Other miRNAs such as miR-
30a 5p increased following dehydration, whereas miRNA 34a-5p and miR-106b-5p were
elevated under both dehydration and rehydration treatments (Figure 2.10B). Previously
we correlated the expression of miR30a with regulation of beclin1 [116,117], and while
this remains a possibility, our results for the response to dehydration indicate otherwise.
The increase in miR30a-5p (Figure 2.10B) did not affect the protein levels of beclin1
(Figure 2.5) following either dehydration or rehydration treatments, but a strong
reduction in ATG5 protein levels occurred under the same conditions (Figure 2.5B).
Considering that ATG5 plays a significant role in autophagosome maturation, reduced
levels of this protein, in part mediated at the posttranscriptional level, could account for

90
reduced autophagosome biogenesis in this tissue. Moreover, it was previously
hypothesized that induction of miR-34a-5p could be responsible for reducing the
expression of HMGB1, leading to promotion of autophagosome formation [121].
Although levels of HMGB1 in muscle were not measured, an increase in this miRNA
could suggest a decrease in HMGB1 expression levels. As such, this too could decrease
autophagosome biogenesis by retaining the inactive form of beclin1 in the cytoplasm.
Lastly, the increase in miR-106b-5p seen in response to dehydration/rehydration could
result in the downregulation of ATG16 [119]. Decreased levels of ATG16 could lead to
an inhibition of the conversion of LC3BI to LC3BII [119], and this was evident in the
results since LC3BII was not detected in any of the muscle samples (Figure 2.5).
Altogether, these data demonstrate that miRNAs could be significant contributors to
regulating autophagosome biosynthesis in response to dehydration/rehydration in wood
frog muscle.
In conclusion, our results demonstrate a strong decrease in autolysosome
formation in response to anoxia/reoxygenation in liver and muscle, a decrease in
autolysosome formation in response to dehydration/rehydration in muscle, and a potential
maintenance (or perhaps a small increase) of formation of autolysosomes in liver post
dehydration/rehydration. The data also show that autophagosome and lysosomal
biogenesis are regulated at all biological levels (transcript, post-transcription and post-
translation), and that perfect regulation of autophagic flux depends on perfect synchrony
between all these regulatory check points.

91
Acknowledgements: We thank J.M. Storey for editorial review of this manuscript. This
work was supposed by a Discovery Grant from the Natural Sciences and Engineering
Research Council of Canada (Grant #6793). K.B.S. holds the Canadian Research Chair in
Molecular Physiology and R.A. holds an Ontario Graduate Scholarship.

92
2.6 References- Chapter 2
[1] W.D. Schmid, Survival of frogs in low temperature., Science. 215 (1982) 697–8.
https://doi.org/10.1126/science.7058335.
[2] K.B. Storey, J.M. Storey, Natural freeze tolerance in ectothermic vertebrates.,
Annu. Rev. Physiol. 54 (1992) 619–37.
https://doi.org/10.1146/annurev.ph.54.030192.003155.
[3] J.R. Layne Jr., R.E. Lee Jr., J.L. Huang, Inoculation triggers freezing at high
subzero temperatures in a freeze-tolerant frog (Rana sylvatica) and insect (Eurosta
solidaginis), Can. J. Zool. 68 (1990) 506–510. https://doi.org/10.1139/z90-074.
[4] J.P. Costanzo, J.M. Bayuk, R.E. Lee, Inoculative freezing by environmental ice
nuclei in the freeze-tolerant wood frog, Rana sylvatica , J. Exp. Zool. 284 (1999)
7–14. https://doi.org/10.1002/(SICI)1097-010X(19990615)284:1<7::AID-
JEZ2>3.0.CO;2-4.
[5] B. Rubinsky, S.T. Wong, J.S. Hong, J. Gilbert, M. Roos, K.B. Storey, 1H
magnetic resonance imaging of freezing and thawing in freeze-tolerant frogs., Am.
J. Physiol. 266 (1994) R1771-7.
https://doi.org/10.1152/ajpregu.1994.266.6.R1771.
[6] K.B. Storey, Glycolysis and the regulation of cryoprotectant synthesis in liver of
the freeze tolerant wood frog, J. Comp. Physiol. B. 157 (1987) 373–380.
https://doi.org/10.1007/BF00693364.
[7] K.B. Storey, J.M. Storey, Biochemical adaption for freezing tolerance in the wood
frog, Rana sylvatica, J. Comp. Physiol. B. 155 (1984) 29–36.
https://doi.org/10.1007/BF00688788.
[8] J.P. Costanzo, R.E. Lee, Avoidance and tolerance of freezing in ectothermic
vertebrates, J. Exp. Biol. 216 (2013) 1961–1967.
https://doi.org/10.1242/jeb.070268.
[9] T.A. Churchill, K.B. Storey, Dehydration tolerance in wood frogs: A new
perspective on development of amphibian freeze tolerance, Am. J. Physiol. Integr.
Comp. Physiol. 265 (1993) R1324–R1332.
https://doi.org/10.1152/ajpregu.1993.265.6.R1324.
[10] J.R. Layne, R.E. Lee, T.L. Heil, Freezing-induced changes in the heart rate of
wood frogs (Rana sylvatica)., Am. J. Physiol. 257 (1989) R1046-9.
https://doi.org/10.1152/ajpregu.1989.257.5.R1046.
[11] R. Al-attar, Y. Zhang, K.B. Storey, Osmolyte regulation by TonEBP/NFAT5
during anoxia-recovery and dehydration–rehydration stresses in the freeze-tolerant
wood frog (Rana sylvatica), PeerJ. 5 (2017) e2797.
https://doi.org/10.7717/peerj.2797.
[12] C.P. Holden, K.B. Storey, Second messenger and cAMP-dependent protein kinase
responses to dehydration and anoxia stresses in frogs., J. Comp. Physiol. B. 167
(1997) 305–12. https://doi.org/10.1007/s003600050078.
[13] J. Zhang, L.J. Hawkins, K.B. Storey, DNA methylation and regulation of DNA

93
methyltransferases in a freeze-tolerant vertebrate, Biochem. Cell Biol. (2019) 1–9.
https://doi.org/10.1139/bcb-2019-0091.
[14] K.B. Storey, Life in the slow lane: Molecular mechanisms of estivation., Comp.
Biochem. Physiol. A. Mol. Integr. Physiol. 133 (2002) 733–54.
https://doi.org/10.1016/S1095-6433(02)00206-4.
[15] J.P. Costanzo, M.C.F. do Amaral, A.J. Rosendale, R.E. Lee, Hibernation
physiology, freezing adaptation and extreme freeze tolerance in a northern
population of the wood frog., J. Exp. Biol. (2013).
https://doi.org/10.1242/jeb.089342.
[16] J.P. Costanzo, R.E. Lee, Urea loading enhances freezing survival and postfreeze
recovery in a terrestrially hibernating frog, J. Exp. Biol. 211 (2008) 2969–2975.
https://doi.org/10.1242/jeb.019695.
[17] J.P. Costanzo, A.M. Reynolds, M.C.F. do Amaral, A.J. Rosendale, R.E. Lee,
Cryoprotectants and extreme freeze tolerance in a subarctic population of the wood
frog., PLoS One. 10 (2015) e0117234.
https://doi.org/10.1371/journal.pone.0117234.
[18] K.B. Storey, J.M. Storey, Biochemical adaptation to extreme environments, in:
Integr. Physiol. Proteomics Post-Genomics Age, 2005: pp. 169–200.
https://doi.org/10.1385/1-59259-925-7:169.
[19] K.B. Storey, J.M. Storey, Natural freeze survival in animals, Annu. Rev. Ecol.
Syst. 27 (1996) 365–386. https://doi.org/10.1146/annurev.ecolsys.27.1.365.
[20] P.W. Hochachka, L.T. Buck, C.J. Doll, S.C. Land, Unifying theory of hypoxia
tolerance: Molecular/metabolic defense and rescue mechanisms for surviving
oxygen lack., Proc. Natl. Acad. Sci. U. S. A. 93 (1996) 9493–9498.
https://doi.org/10.1073/pnas.93.18.9493.
[21] L.J. Hawkins, M. Wang, B. Zhang, Q. Xiao, H. Wang, K.B. Storey, Glucose and
urea metabolic enzymes are differentially phosphorylated during freezing, anoxia,
and dehydration exposures in a freeze tolerant frog, Comp. Biochem. Physiol. Part
D Genomics Proteomics. 30 (2019) 1–13.
https://doi.org/10.1016/j.cbd.2019.01.009.
[22] K.B. Storey, J.M. Storey, Molecular physiology of freeze tolerance in vertebrates,
Physiol. Rev. 97 (2017) 623–665. https://doi.org/10.1152/physrev.00016.2016.
[23] V.E.M. Gerber, S. Wijenayake, K.B. Storey, Anti-apoptotic response during
anoxia and recovery in a freeze-tolerant wood frog (Rana sylvatica)., PeerJ. 4
(2016) e1834. https://doi.org/10.7717/peerj.1834.
[24] R. Roufayel, K.K. Biggar, K.B. Storey, Regulation of cell cycle components
during exposure to anoxia or dehydration stress in the wood frog, Rana sylvatica ,
J. Exp. Zool. Part A Ecol. Genet. Physiol. 315A (2011) 487–494.
https://doi.org/10.1002/jez.696.
[25] C.-W. Wu, S.N. Tessier, K.B. Storey, Stress-induced antioxidant defense and
protein chaperone response in the freeze-tolerant wood frog Rana sylvatica, Cell
Stress Chaperones. 23 (2018) 1205–1217. https://doi.org/10.1007/s12192-018-

94
0926-x.
[26] J.M. Storey, K.B. Storey, In defense of proteins: Chaperones respond to freezing,
anoxia, or dehydration stress in tissues of freeze tolerant wood frogs, J. Exp. Zool.
Part A Ecol. Integr. Physiol. 331 (2019) 392–402. https://doi.org/10.1002/jez.2306.
[27] K.B. Storey, Regulation of hypometabolism: Insights into epigenetic controls., J.
Exp. Biol. 218 (2015) 150–9. https://doi.org/10.1242/jeb.106369.
[28] K.K. Biggar, K.B. Storey, The emerging roles of microRNAs in the molecular
responses of metabolic rate depression, J. Mol. Cell Biol. 3 (2011) 167–175.
https://doi.org/10.1093/jmcb/mjq045.
[29] K.B. Storey, J.M. Storey, Metabolic rate depression in animals: Transcriptional
and translational controls, Biol. Rev. 79 (2004) 207–233.
https://doi.org/10.1017/S1464793103006195.
[30] Z. Zhang, M. Guo, S. Zhao, W. Xu, J. Shao, F. Zhang, L. Wu, Y. Lu, S. Zheng,
The update on transcriptional regulation of autophagy in normal and pathologic
cells: A novel therapeutic target, Biomed. Pharmacother. 74 (2015) 17–29.
https://doi.org/10.1016/j.biopha.2015.06.003.
[31] N. Mizushima, B. Levine, A.M. Cuervo, D.J. Klionsky, Autophagy fights disease
through cellular self-digestion, Nature. 451 (2008) 1069–1075.
https://doi.org/10.1038/nature06639.
[32] N. Mizushima, M. Komatsu, Autophagy: Renovation of cells and tissues, Cell. 147
(2011) 728–741. https://doi.org/10.1016/j.cell.2011.10.026.
[33] H.S. Jung, K.W. Chung, J. Won Kim, J. Kim, M. Komatsu, K. Tanaka, Y.H.
Nguyen, T.M. Kang, K.H. Yoon, J.W. Kim, Y.T. Jeong, M.S. Han, M.K. Lee,
K.W. Kim, J. Shin, M.S. Lee, Loss of autophagy diminishes pancreatic β cell mass
and function with resultant hyperglycemia, Cell Metab. 8 (2008) 318–324.
https://doi.org/10.1016/j.cmet.2008.08.013.
[34] M. Koike, M. Shibata, M. Tadakoshi, K. Gotoh, M. Komatsu, S. Waguri, N.
Kawahara, K. Kuida, S. Nagata, E. Kominami, K. Tanaka, Y. Uchiyama,
Inhibition of autophagy prevents hippocampal pyramidal neuron death after
hypoxic-ischemic injury, Am. J. Pathol. 172 (2008) 454–469.
https://doi.org/10.2353/ajpath.2008.070876.
[35] K. Sun, X. Xie, Y. Liu, Z. Han, X. Zhao, N. Cai, S. Zhang, J. Song, L. Wei,
Autophagy lessens ischemic liver injury by reducing oxidative damage, Cell
Biosci. 3 (2013) 26. https://doi.org/10.1186/2045-3701-3-26.
[36] C. He, D.J. Klionsky, Regulation mechanisms and signaling pathways of
autophagy, Annu. Rev. Genet. 43 (2009) 67–93. https://doi.org/10.1146/annurev-
genet-102808-114910.
[37] J. Sakamaki, S. Wilkinson, M. Hahn, N. Tasdemir, J. O’Prey, W. Clark, A.
Hedley, C. Nixon, J.S. Long, M. New, T. Van Acker, S.A. Tooze, S.W. Lowe, I.
Dikic, K.M. Ryan, Bromodomain protein BRD4 is a transcriptional repressor of
autophagy and lysosomal function, Mol. Cell. 66 (2017) 517-532.e9.
https://doi.org/10.1016/j.molcel.2017.04.027.

95
[38] J. Füllgrabe, M.A. Lynch-Day, N. Heldring, W. Li, R.B. Struijk, Q. Ma, O.
Hermanson, M.G. Rosenfeld, D.J. Klionsky, B. Joseph, The histone H4 lysine 16
acetyltransferase hMOF regulates the outcome of autophagy, Nature. 500 (2013)
468–471. https://doi.org/10.1038/nature12313.
[39] C. Di Malta, L. Cinque, C. Settembre, Transcriptional regulation of autophagy:
mechanisms and diseases., Front. Cell Dev. Biol. 7 (2019) 114.
https://doi.org/10.3389/fcell.2019.00114.
[40] M. Sardiello, M. Palmieri, A. di Ronza, D.L. Medina, M. Valenza, V.A.
Gennarino, C. Di Malta, F. Donaudy, V. Embrione, R.S. Polishchuk, S. Banfi, G.
Parenti, E. Cattaneo, A. Ballabio, A Gene Network Regulating Lysosomal
Biogenesis and Function, Science (80-. ). (2009).
https://doi.org/10.1126/science.1174447.
[41] M. Palmieri, S. Impey, H. Kang, A. di Ronza, C. Pelz, M. Sardiello, A. Ballabio,
Characterization of the CLEAR network reveals an integrated control of cellular
clearance pathways, Hum. Mol. Genet. 20 (2011) 3852–3866.
https://doi.org/10.1093/hmg/ddr306.
[42] C. Settembre, C. Di Malta, V.A. Polito, M.G. Arencibia, F. Vetrini, S. Erdin, S.U.
Erdin, T. Huynh, D. Medina, P. Colella, M. Sardiello, D.C. Rubinsztein, A.
Ballabio, TFEB links autophagy to lysosomal biogenesis, Science (80-. ). 332
(2011) 1429–1433. https://doi.org/10.1126/science.1204592.
[43] L.B. Frankel, A.H. Lund, MicroRNA regulation of autophagy, Carcinogenesis. 33
(2012) 2018–2025. https://doi.org/10.1093/carcin/bgs266.
[44] J. O’Brien, H. Hayder, Y. Zayed, C. Peng, Overview of microRNA biogenesis,
mechanisms of actions, and circulation, Front. Endocrinol. (Lausanne). 9 (2018)
402. https://doi.org/10.3389/fendo.2018.00402.
[45] H. Hadj-Moussa, K.B. Storey, Micromanaging freeze tolerance: The biogenesis
and regulation of neuroprotective microRNAs in frozen brains, Cell. Mol. Life Sci.
75 (2018) 3635–3647. https://doi.org/10.1007/s00018-018-2821-0.
[46] S.G. English, H. Hadj-Moussa, K.B. Storey, MicroRNAs regulate survival in
oxygen-deprived environments, J. Exp. Biol. 221 (2018) jeb190579.
https://doi.org/10.1242/jeb.190579.
[47] S. Bansal, B.E. Luu, K.B. Storey, MicroRNA regulation in heart and skeletal
muscle over the freeze–thaw cycle in the freeze tolerant wood frog, J. Comp.
Physiol. B. 186 (2016) 229–241. https://doi.org/10.1007/s00360-015-0951-3.
[48] H. Hadj-Moussa, J.A. Moggridge, B.E. Luu, J.F. Quintero-Galvis, J.D. Gaitán-
Espitia, R.F. Nespolo, K.B. Storey, The hibernating South American marsupial,
Dromiciops gliroides, displays torpor-sensitive microRNA expression patterns,
Sci. Rep. 6 (2016) 24627. https://doi.org/10.1038/srep24627.
[49] H. Li, D. Miao, Q. Zhu, J. Huang, G. Lu, W. Xu, MicroRNA-17-5p contributes to
osteoarthritis progression by binding p62/SQSTM1., Exp. Ther. Med. 15 (2018)
1789–1794. https://doi.org/10.3892/etm.2017.5622.
[50] A. Meenhuis, P.A. van Veelen, H. de Looper, N. van Boxtel, I.J. van den Berge,

96
S.M. Sun, E. Taskesen, P. Stern, A.H. de Ru, A.J. van Adrichem, J. Demmers, M.
Jongen-Lavrencic, B. Löwenberg, I.P. Touw, P.A. Sharp, S.J. Erkeland, MiR-
17/20/93/106 promote hematopoietic cell expansion by targeting sequestosome 1–
regulated pathways in mice, Blood. 118 (2011) 916–925.
https://doi.org/10.1182/blood-2011-02-336487.
[51] Y. Xie, R. Kang, X. Sun, M. Zhong, J. Huang, D.J. Klionsky, D. Tang,
Posttranslational modification of autophagy-related proteins in macroautophagy,
Autophagy. 11 (2015) 28–45. https://doi.org/10.4161/15548627.2014.984267.
[52] Y.L. Deribe, T. Pawson, I. Dikic, Post-translational modifications in signal
integration, Nat. Struct. Mol. Biol. 17 (2010) 666–672.
https://doi.org/10.1038/nsmb.1842.
[53] D.G. McEwan, I. Dikic, The three musketeers of autophagy: Phosphorylation,
ubiquitylation and acetylation, Trends Cell Biol. 21 (2011) 195–201.
https://doi.org/10.1016/j.tcb.2010.12.006.
[54] T. Hanada, N.N. Noda, Y. Satomi, Y. Ichimura, Y. Fujioka, T. Takao, F. Inagaki,
Y. Ohsumi, The Atg12-Atg5 conjugate has a novel E3-like activity for protein
lipidation in autophagy, J. Biol. Chem. 282 (2007) 37298–37302.
https://doi.org/10.1074/jbc.C700195200.
[55] T.A. Churchill, K.B. Storey, Metabolic responses to dehydration by liver of the
wood frog, Rana sylvatica, Can. J. Zool. 72 (1994) 1420–1425.
https://doi.org/10.1139/z94-188.
[56] R. Al-Attar, K.B. Storey, Effects of anoxic exposure on the nuclear factor of
activated T cell (NFAT) transcription factors in the stress-tolerant wood frog., Cell
Biochem. Funct. 36 (2018) 420–430. https://doi.org/10.1002/cbf.3362.
[57] S.A. Bustin, V. Benes, J.A. Garson, J. Hellemans, J. Huggett, M. Kubista, R.
Mueller, T. Nolan, M.W. Pfaffl, G.L. Shipley, J. Vandesompele, C.T. Wittwer,
The MIQE guidelines: Minimum information for publication of quantitative real-
time PCR experiments, Clin. Chem. 55 (2009) 611–622.
https://doi.org/10.1373/clinchem.2008.112797.
[58] W. Rennie, S. Kanoria, C. Liu, B. Mallick, D. Long, A. Wolenc, C.S. Carmack, J.
Lu, Y. Ding, STarMirDB: A database of microRNA binding sites, RNA Biol. 13
(2016) 554–560. https://doi.org/10.1080/15476286.2016.1182279.
[59] J. Zhang, K.B. Storey, Akt signaling and freezing survival in the wood frog, Rana
sylvatica, Biochim. Biophys. Acta. 1830 (2013) 4828–37.
https://doi.org/10.1016/j.bbagen.2013.06.020.
[60] S.L. Eaton, S.L. Roche, M. Llavero Hurtado, K.J. Oldknow, C. Farquharson, T.H.
Gillingwater, T.M. Wishart, Total protein analysis as a reliable loading control for
quantitative fluorescent western blotting, PLoS One. 8 (2013) e72457.
https://doi.org/10.1371/journal.pone.0072457.
[61] J. Zhang, K.B. Storey, RBioplot: An easy-to-use R pipeline for automated
statistical analysis and data visualization in molecular biology and biochemistry,
PeerJ. 4 (2016) e2436. https://doi.org/10.7717/peerj.2436.

97
[62] G. Tettamanti, E. Carata, A. Montali, L. Dini, G.M. Fimia, Autophagy in
development and regeneration: role in tissue remodelling and cell survival, Eur.
Zool. J. 86 (2019) 113–131. https://doi.org/10.1080/24750263.2019.1601271.
[63] B. Levine, G. Kroemer, Autophagy in the pathogenesis of disease, Cell. 132
(2008) 27–42. https://doi.org/10.1016/j.cell.2007.12.018.
[64] W.A. Vistro, Y. Zhang, X. Bai, P. Yang, Y. Huang, W. Qu, A.S. Baloch, R. Wu, I.
Tarique, Q. Chen, In vivo autophagy up-regulation of small intestine enterocytes in
Chinese soft-shelled turtles during hibernation, Biomolecules. 9 (2019) 682.
https://doi.org/10.3390/biom9110682.
[65] H. Chang, X. Peng, X. Yan, J. Zhang, S. Xu, H. Wang, Z. Wang, X. Ma, Y. Gao,
Autophagy and Akt-mTOR signaling display periodic oscillations during torpor-
arousal cycles in oxidative skeletal muscle of Daurian ground squirrels
(Spermophilus dauricus), J. Comp. Physiol. B. 190 (2020) 113–123.
https://doi.org/10.1007/s00360-019-01245-5.
[66] L. Shang, S. Chen, F. Du, S. Li, L. Zhao, X. Wang, Nutrient starvation elicits an
acute autophagic response mediated by Ulk1 dephosphorylation and its subsequent
dissociation from AMPK, Proc. Natl. Acad. Sci. 108 (2011) 4788–4793.
https://doi.org/10.1073/pnas.1100844108.
[67] W. Li, Y. Yang, Z. Ba, S. Li, H. Chen, X. Hou, L. Ma, P. He, L. Jiang, L. Li, R.
He, L. Zhang, D. Feng, MicroRNA-93 regulates hypoxia-induced autophagy by
targeting ULK1, Oxid. Med. Cell. Longev. 2017 (2017) 1–13.
https://doi.org/10.1155/2017/2709053.
[68] W. Tian, W. Li, Y. Chen, Z. Yan, X. Huang, H. Zhuang, W. Zhong, Y. Chen, W.
Wu, C. Lin, H. Chen, X. Hou, L. Zhang, S. Sui, B. Zhao, Z. Hu, L. Li, D. Feng,
Phosphorylation of ULK1 by AMPK regulates translocation of ULK1 to
mitochondria and mitophagy, FEBS Lett. 589 (2015) 1847–1854.
https://doi.org/10.1016/j.febslet.2015.05.020.
[69] D. Egan, J. Kim, R.J. Shaw, K.-L. Guan, The autophagy initiating kinase ULK1 is
regulated via opposing phosphorylation by AMPK and mTOR., Autophagy. 7
(2011) 643–4. https://doi.org/10.4161/auto.7.6.15123.
[70] M.H. Rider, N. Hussain, S. Horman, S.M. Dilworth, K.B. Storey, Stress-induced
activation of the AMP-activated protein kinase in the freeze-tolerant frog Rana
sylvatica, Cryobiology. 53 (2006) 297–309.
https://doi.org/10.1016/j.cryobiol.2006.08.001.
[71] I.G. Ganley, D.H. Lam, J. Wang, X. Ding, S. Chen, X. Jiang,
ULK1·ATG13·FIP200 complex mediates mTOR signaling and is essential for
autophagy, J. Biol. Chem. 284 (2009) 12297–12305.
https://doi.org/10.1074/jbc.M900573200.
[72] R. Al-attar, C.L. Childers, V.C. Nguyen, M.E. Pamenter, K.B. Storey, Differential
protein phosphorylation is responsible for hypoxia-induced regulation of the
Akt/mTOR pathway in naked mole rats, Comp. Biochem. Physiol. Part A Mol.
Integr. Physiol. 242 (2020) 110653. https://doi.org/10.1016/j.cbpa.2020.110653.

98
[73] S.N. Tessier, J. Zhang, K.K. Biggar, C.W. Wu, F. Pifferi, M. Perret, K.B. Storey,
Regulation of the PI3K/AKT pathway and fuel utilization during primate torpor in
the gray mouse lemur, Microcebus murinus, Genomics, Proteomics Bioinforma.
13 (2015) 91–102. https://doi.org/10.1016/j.gpb.2015.03.006.
[74] B.E. Luu, S. Wijenayake, J. Zhang, S.N. Tessier, J.F. Quintero-Galvis, J.D.
Gaitán-Espitia, R.F. Nespolo, K.B. Storey, Strategies of biochemical adaptation for
hibernation in a South American marsupial, Dromiciops gliroides : 2. Control of
the Akt pathway and protein translation machinery, Comp. Biochem. Physiol. Part
B Biochem. Mol. Biol. 224 (2018) 19–25.
https://doi.org/10.1016/j.cbpb.2017.12.006.
[75] N. Tamura, S. Kageyama, M. Komatsu, S. Waguri, Hyperosmotic stress induces
unconventional autophagy independent of the Ulk1 complex, Mol. Cell. Biol. 39
(2019). https://doi.org/10.1128/MCB.00024-19.
[76] R.C. Russell, Y. Tian, H. Yuan, H.W. Park, Y.-Y. Chang, J. Kim, H. Kim, T.P.
Neufeld, A. Dillin, K.-L. Guan, ULK1 induces autophagy by phosphorylating
Beclin-1 and activating VPS34 lipid kinase, Nat. Cell Biol. 15 (2013) 741–750.
https://doi.org/10.1038/ncb2757.
[77] S.F. Funderburk, Q.J. Wang, Z. Yue, The beclin 1–VPS34 complex – at the
crossroads of autophagy and beyond, Trends Cell Biol. 20 (2010) 355–362.
https://doi.org/10.1016/j.tcb.2010.03.002.
[78] K. Obara, Y. Ohsumi, Atg14: A key player in orchestrating autophagy, Int. J. Cell
Biol. 2011 (2011) 1–7. https://doi.org/10.1155/2011/713435.
[79] K. Matsunaga, E. Morita, T. Saitoh, S. Akira, N.T. Ktistakis, T. Izumi, T. Noda, T.
Yoshimori, Autophagy requires endoplasmic reticulum targeting of the PI3-kinase
complex via Atg14L, J. Cell Biol. 190 (2010) 511–521.
https://doi.org/10.1083/jcb.200911141.
[80] W. Fan, A. Nassiri, Q. Zhong, Autophagosome targeting and membrane curvature
sensing by Barkor/Atg14(L), Proc. Natl. Acad. Sci. 108 (2011) 7769–7774.
https://doi.org/10.1073/pnas.1016472108.
[81] A. Oberstein, P.D. Jeffrey, Y. Shi, Crystal structure of the Bcl-X L-beclin1 peptide
complex, J. Biol. Chem. 282 (2007) 13123–13132.
https://doi.org/10.1074/jbc.M700492200.
[82] X. Li, L. He, K.H. Che, S.F. Funderburk, L. Pan, N. Pan, M. Zhang, Z. Yue, Y.
Zhao, Imperfect interface of Beclin1 coiled-coil domain regulates homodimer and
heterodimer formation with Atg14L and UVRAG, Nat. Commun. 3 (2012) 662.
https://doi.org/10.1038/ncomms1648.
[83] W. Huang, W. Choi, W. Hu, N. Mi, Q. Guo, M. Ma, M. Liu, Y. Tian, P. Lu, F.-L.
Wang, H. Deng, L. Liu, N. Gao, L. Yu, Y. Shi, Crystal structure and biochemical
analyses reveal beclin 1 as a novel membrane binding protein, Cell Res. 22 (2012)
473–489. https://doi.org/10.1038/cr.2012.24.
[84] R. Kang, H.J. Zeh, M.T. Lotze, D. Tang, The Beclin 1 network regulates
autophagy and apoptosis, Cell Death Differ. 18 (2011) 571–580.

99
https://doi.org/10.1038/cdd.2010.191.
[85] M.C. Maiuri, G. Le Toumelin, A. Criollo, J.-C. Rain, F. Gautier, P. Juin, E.
Tasdemir, G. Pierron, K. Troulinaki, N. Tavernarakis, J.A. Hickman, O. Geneste,
G. Kroemer, Functional and physical interaction between Bcl-XL and a BH3-like
domain in Beclin-1, EMBO J. 26 (2007) 2527–2539.
https://doi.org/10.1038/sj.emboj.7601689.
[86] S. Pattingre, A. Tassa, X. Qu, R. Garuti, H.L. Xiao, N. Mizushima, M. Packer,
M.D. Schneider, B. Levine, Bcl-2 antiapoptotic proteins inhibit Beclin 1-
dependent autophagy, Cell. 122 (2005) 927–939.
https://doi.org/10.1016/j.cell.2005.07.002.
[87] Y. Wei, S. Pattingre, S. Sinha, M. Bassik, B. Levine, JNK1-mediated
phosphorylation of Bcl-2 regulates starvation-induced autophagy, Mol. Cell. 30
(2008) 678–688. https://doi.org/10.1016/j.molcel.2008.06.001.
[88] J.-M. Park, M. Seo, C.H. Jung, D. Grunwald, M. Stone, N.M. Otto, E. Toso, Y.
Ahn, M. Kyba, T.J. Griffin, L. Higgins, D.-H. Kim, ULK1 phosphorylates Ser30
of BECN1 in association with ATG14 to stimulate autophagy induction,
Autophagy. 14 (2018) 584–597. https://doi.org/10.1080/15548627.2017.1422851.
[89] J. Kim, Y.C. Kim, C. Fang, R.C. Russell, J.H. Kim, W. Fan, R. Liu, Q. Zhong, K.-
L. Guan, Differential regulation of distinct Vps34 complexes by AMPK in nutrient
stress and autophagy, Cell. 152 (2013) 290–303.
https://doi.org/10.1016/j.cell.2012.12.016.
[90] J. Evankovich, S.W. Cho, R. Zhang, J. Cardinal, R. Dhupar, L. Zhang, J.R. Klune,
J. Zlotnicki, T. Billiar, A. Tsung, High mobility group box 1 release from
hepatocytes during ischemia and reperfusion injury is mediated by decreased
histone deacetylase activity., J. Biol. Chem. 285 (2010) 39888–97.
https://doi.org/10.1074/jbc.M110.128348.
[91] D. Tang, R. Kang, K.M. Livesey, C.W. Cheh, A. Farkas, P. Loughran, G. Hoppe,
M.E. Bianchi, K.J. Tracey, H.J. Zeh, M.T. Lotze, Endogenous HMGB1 regulates
autophagy, J. Cell Biol. 190 (2010) 881–892.
https://doi.org/10.1083/jcb.200911078.
[92] R. Kang, K.M. Livesey, H.J. Zeh, M.T. Lotze, D. Tang, HMGB1: A novel Beclin
1-binding protein active in autophagy, Autophagy. 6 (2010) 1209–1211.
https://doi.org/10.4161/auto.6.8.13651.
[93] R. Liu, X. Zhi, Q. Zhong, ATG14 controls SNARE-mediated autophagosome
fusion with a lysosome, Autophagy. 11 (2015) 847–849.
https://doi.org/10.1080/15548627.2015.1037549.
[94] K.B. Storey, J.M. Storey, Metabolic rate depression: the biochemistry of
mammalian hibernation., Adv. Clin. Chem. 52 (2010) 77–108.
https://doi.org/10.1016/S0065-2423(10)52003-1.
[95] M.S. Wold, J. Lim, V. Lachance, Z. Deng, Z. Yue, ULK1-mediated
phosphorylation of ATG14 promotes autophagy and is impaired in Huntington’s
disease models, Mol. Neurodegener. 11 (2016) 76. https://doi.org/10.1186/s13024-

100
016-0141-0.
[96] N. Mizushima, A. Yamamoto, M. Hatano, Y. Kobayashi, Y. Kabeya, K. Suzuki, T.
Tokuhisa, Y. Ohsumi, T. Yoshimori, Dissection of autophagosome formation
using Apg5-deficient mouse embryonic stem cells, J. Cell Biol. 152 (2001) 657–
668. https://doi.org/10.1083/jcb.152.4.657.
[97] A. Kuma, N. Mizushima, N. Ishihara, Y. Ohsumi, Formation of the ∼350-kDa
Apg12-Apg5·Apg16 multimeric complex, mediated by Apg16 oligomerization, is
essential for autophagy in yeast, J. Biol. Chem. 277 (2002) 18619–18625.
https://doi.org/10.1074/jbc.M111889200.
[98] N. Mizushima, Mouse Apg16L, a novel WD-repeat protein, targets to the
autophagic isolation membrane with the Apg12-Apg5 conjugate, J. Cell Sci. 116
(2003) 1679–1688. https://doi.org/10.1242/jcs.00381.
[99] S. Yousefi, R. Perozzo, I. Schmid, A. Ziemiecki, T. Schaffner, L. Scapozza, T.
Brunner, H.-U. Simon, Calpain-mediated cleavage of Atg5 switches autophagy to
apoptosis, Nat. Cell Biol. 8 (2006) 1124–1132. https://doi.org/10.1038/ncb1482.
[100] I. Tanida, T. Ueno, E. Kominami, Human light chain 3/MAP1LC3B is cleaved at
its carboxyl-terminal Met121 to expose Gly120 for lipidation and targeting to
autophagosomal membranes., J. Biol. Chem. 279 (2004) 47704–10.
https://doi.org/10.1074/jbc.M407016200.
[101] G. Runwal, E. Stamatakou, F.H. Siddiqi, C. Puri, Y. Zhu, D.C. Rubinsztein, LC3-
positive structures are prominent in autophagy-deficient cells, Sci. Rep. 9 (2019)
10147. https://doi.org/10.1038/s41598-019-46657-z.
[102] C. Otomo, Z. Metlagel, G. Takaesu, T. Otomo, Structure of the human
ATG12~ATG5 conjugate required for LC3 lipidation in autophagy, Nat. Struct.
Mol. Biol. 20 (2013) 59–66. https://doi.org/10.1038/nsmb.2431.
[103] M. Li, Y. Fu, Z. Yang, X.-M. Yin, Measurement of the activity of the Atg4
cysteine proteases, in: Methods Enzymol., 2017: pp. 207–225.
https://doi.org/10.1016/bs.mie.2016.10.024.
[104] Y. Kabeya, LC3, a mammalian homologue of yeast Apg8p, is localized in
autophagosome membranes after processing, EMBO J. 19 (2000) 5720–5728.
https://doi.org/10.1093/emboj/19.21.5720.
[105] E. Shvets, E. Fass, R. Scherz-Shouval, Z. Elazar, The N-terminus and Phe52
residue of LC3 recruit p62/SQSTM1 into autophagosomes, J. Cell Sci. 121 (2008)
2685–2695. https://doi.org/10.1242/jcs.026005.
[106] G. Bjørkøy, T. Lamark, A. Brech, H. Outzen, M. Perander, A. Øvervatn, H.
Stenmark, T. Johansen, p62/SQSTM1 forms protein aggregates degraded by
autophagy and has a protective effect on huntingtin-induced cell death, J. Cell
Biol. 171 (2005) 603–614. https://doi.org/10.1083/jcb.200507002.
[107] J. Diao, R. Liu, Y. Rong, M. Zhao, J. Zhang, Y. Lai, Q. Zhou, L.M. Wilz, J. Li, S.
Vivona, R.A. Pfuetzner, A.T. Brunger, Q. Zhong, ATG14 promotes membrane
tethering and fusion of autophagosomes to endolysosomes, Nature. 520 (2015)
563–566. https://doi.org/10.1038/nature14147.

101
[108] Z. Zhang, R. Singh, M. Aschner, Methods for the detection of autophagy in
mammalian cells, Curr. Protoc. Toxicol. 69 (2016).
https://doi.org/10.1002/cptx.11.
[109] N. Mizushima, T. Yoshimori, B. Levine, Methods in mammalian autophagy
research, Cell. 140 (2010) 313–326. https://doi.org/10.1016/j.cell.2010.01.028.
[110] D.J. Klionsky, The molecular machinery of autophagy: Unanswered questions, J.
Cell Sci. 118 (2005) 7–18. https://doi.org/10.1242/jcs.01620.
[111] J. Füllgrabe, G. Ghislat, D.-H. Cho, D.C. Rubinsztein, Transcriptional regulation
of mammalian autophagy at a glance, J. Cell Sci. 129 (2016) 3059–3066.
https://doi.org/10.1242/jcs.188920.
[112] C. Settembre, R. Zoncu, D.L. Medina, F. Vetrini, S. Erdin, S. Erdin, T. Huynh, M.
Ferron, G. Karsenty, M.C. Vellard, V. Facchinetti, D.M. Sabatini, A. Ballabio, A
lysosome-to-nucleus signalling mechanism senses and regulates the lysosome via
mTOR and TFEB, EMBO J. 31 (2012) 1095–1108.
https://doi.org/10.1038/emboj.2012.32.
[113] D.L. Medina, S. Di Paola, I. Peluso, A. Armani, D. De Stefani, R. Venditti, S.
Montefusco, A. Scotto-Rosato, C. Prezioso, A. Forrester, C. Settembre, W. Wang,
Q. Gao, H. Xu, M. Sandri, R. Rizzuto, M.A. De Matteis, A. Ballabio, Lysosomal
calcium signalling regulates autophagy through calcineurin and TFEB, Nat. Cell
Biol. 17 (2015) 288–299. https://doi.org/10.1038/ncb3114.
[114] Z. Wang, N. Wang, P. Liu, Q. Chen, H. Situ, T. Xie, J. Zhang, C. Peng, Y. Lin, J.
Chen, MicroRNA-25 regulates chemoresistance-associated autophagy in breast
cancer cells, a process modulated by the natural autophagy inducer
isoliquiritigenin, Oncotarget. 5 (2014). https://doi.org/10.18632/oncotarget.2192.
[115] D.Z. John Clotaire, B. Zhang, N. Wei, R. Gao, F. Zhao, Y. Wang, M. Lei, W.
Huang, miR-26b inhibits autophagy by targeting ULK2 in prostate cancer cells,
Biochem. Biophys. Res. Commun. 472 (2016) 194–200.
https://doi.org/10.1016/j.bbrc.2016.02.093.
[116] H. Zhu, H. Wu, X. Liu, B. Li, Y. Chen, X. Ren, C.-G. Liu, J.-M. Yang, Regulation
of autophagy by a beclin 1-targeted microRNA, miR-30a, in cancer cells,
Autophagy. 5 (2009) 816–823. https://doi.org/10.4161/auto.9064.
[117] Y. Yu, L. Cao, L. Yang, R. Kang, M. Lotze, D. Tang, microRNA 30A promotes
autophagy in response to cancer therapy, Autophagy. 8 (2012) 853–855.
https://doi.org/10.4161/auto.20053.
[118] X. Yang, X. Zhong, J.L. Tanyi, J. Shen, C. Xu, P. Gao, T.M. Zheng, A.
DeMichele, L. Zhang, mir-30d Regulates multiple genes in the autophagy pathway
and impairs autophagy process in human cancer cells, Biochem. Biophys. Res.
Commun. 431 (2013) 617–622. https://doi.org/10.1016/j.bbrc.2012.12.083.
[119] Z. Zhai, F. Wu, A.Y. Chuang, J.H. Kwon, miR-106b fine tunes ATG16L1
expression and autophagic activity in intestinal epithelial HCT116 cells, Inflamm.
Bowel Dis. 19 (2013) 2295–2301.
https://doi.org/10.1097/MIB.0b013e31829e71cf.

102
[120] H. Wu, F. Wang, S. Hu, C. Yin, X. Li, S. Zhao, J. Wang, X. Yan, MiR-20a and
miR-106b negatively regulate autophagy induced by leucine deprivation via
suppression of ULK1 expression in C2C12 myoblasts, Cell. Signal. 24 (2012)
2179–2186. https://doi.org/10.1016/j.cellsig.2012.07.001.
[121] K. Liu, J. Huang, M. Xie, Y. Yu, S. Zhu, R. Kang, L. Cao, D. Tang, X. Duan,
MIR34A regulates autophagy and apoptosis by targeting HMGB1 in the
retinoblastoma cell, Autophagy. 10 (2014) 442–452.
https://doi.org/10.4161/auto.27418.
[122] P.J. Morin, K.B. Storey, Evidence for a reduced transcriptional state during
hibernation in ground squirrels, Cryobiology. 53 (2006) 310–318.
https://doi.org/10.1016/j.cryobiol.2006.08.002.

103
Tables
Table 2.1: Nucleotide sequences of miRNA specific forward primers, universal primer
and the stem-loop adapter.
Target Primer Sequence (5'-3')
miR-17-5p ACACTCCAGCTGGGCAAAGTGCTTACAGT
miR-20-5p ACACTCCAGCTGGGCAAAGTGCTCATAGT
miR-25-3p ACACTCCAGCTGGGCATTGCACTTGTCTC
miR-26-5p ACACTCCAGCTGGGTTCAAGTAATCCAGG
miR-30a-5p ACACTCCAGCTGGGTGTAAACATCCTCGA
miR-30d-5p ACACTCCAGCTGGGTGTAAACATCCCCGA
mir-34a-5p ACACTCCAGCTGGGTGGCAGTGTCTTAGC
miR-93-5p ACACTCCAGCTGGGCAAAGTGCTGTTCGTGC
mir-106b-5p ACACTCCAGCTGGGTAAAGTGCTGACAGTGC
miR-124-5p ACACTCCAGCTGGGCGTGTTCACAGCGGA
Snord-24-17bp ACACTCCAGCTGGGTGCAGATGATGTAAAA
Snord-74a-15bp ACACTCCAGCTGGGGTTGTCAGCTATCCA
5S RNA GGCCTGGTTAGTACTTGGATG
Universal Primer CTCACAGTACGTTGGTATCCTTGTG
Stem-loop Adapter CTCACAGTACGTTGGTATCCTTGTGATGTTCGA
TGCCATATTGTACTGTGAGTTTTTTTTTVN
Table 2.2: Nucleotide sequences (5'-3') of forward and reverse primers used for mRNA
analysis.
Forward Reverse
p62 GGCCTTTCTCTGCTGAATGA GGGCAGATGAGGCACTTAAA
β-
actin AGAAGTCGTGCCAGGCATCA AGGAGGAAGCTATCCGTGTT

104
Figures
Figures 2.1: Schematic diagram showing different phases of autophagy. The initiation of
autophagosome formation is regulated by many protein kinases including AMPK and
mTORC1 that function oppositely to each other. These two kinases maintain cellular
homeostasis by balancing anabolic and catabolic responses in the cell; where AMPK
phosphorylation (S317, S467, S555, T575, S637, and S777) under ATP depleting
conditions and mTORC1 phosphorylation (S638 and S758) under nutrient deprived
conditions promote the activation and deactivation of ULK1, respectively. ULK1, a key
initiator of autophagosome formation, is a serine/threonine kinase that forms a complex
with ATG13, FIP200 and ATG101 [74–76]. Both ATG13 and FIP200 promote the
stabilization of ULK1, promote its catalytic activity, and facilitate the translocation of the
complex to the isolation membrane (pre-autophagosomal structure) before starting the
omegasome formation. At the initiation site, the p-ULK1 complex promotes the
recruitment of multiple other factors and complexes including the nucleation VPS34
complex, which consists of the class III phosphatidylinositol (PtdIns) kinase complex
(VPS34, VPS15, beclin1 and ATG14. Beclin1 activation is mediated by phosphorylation,
either by AMPK (S93 in humans) or by ULK1 at S30, and these events are necessary for
induction of autophagy. The VPS34 complex promotes the production of PI3P at the
growing phagophore, resulting in the recruitment of WIPI proteins, the maturation of the
phagosome and the recruitment of the elongation complex. ATG12-ATG5-ATG16L (the
elongation complex) functions as a ubiquitin-like conjugating complex that is necessary
for phagophore elongation and LC3 recruitment to the growing phagophore. LC3 is then
cleaved by ATG4 to LC3I which allows it to form a complex with the E1-like ATG7 and
the E2-like ATG3 before getting conjugated with phosphatidylethanolamine (PE, LC3II).
WIPI proteins also recruit cargo-recognition proteins such as p62 and NBR1 (neighbor of
BRCA1 gene 1) which can bind to both LC3 on the maturing autophagosome and act as

105
receptors for ubiquitinated targets for their selective degradation. Both p62 and NBR1 are
degraded with the ubiquitinated cargo, thus serving as a marker to measure autophagic
flux in cells. Once autophagosome formation and closure has been completed, they are
delivered to the perinuclear region, where they can fuse with lysosomes to help many
proteins including the those in the SNAREs family.

106
Figure 2.2: Relative protein levels of key proteins involved in autophagosome formation
in liver over the anoxia/reoxygenation cycle measured by immunoblotting. Histogram
shows means ± SEM, n=4 independent biological replicates obtained from different
animals. The corresponding enhanced chemiluminescence bands are also shown.
Significance difference from the control (p<0.05) is denoted by an asterisk (*) as
determined using a one-way ANOVA with Dunnett’s post-hoc test.

107
Figure 2.3: Relative protein expression levels of key proteins involved in autophagosome
formation in liver over the dehydration/rehydration cycle measured using
immunoblotting. For more information, see Figure 2.2.

108
Figure 2.4: Relative protein expression levels of key proteins involved in autophagosome
formation in skeletal muscle over the anoxia/reoxygenation cycle measured using
immunoblotting. For more information, see Figure 2.2.

109
Figure 2.5: Relative protein expression levels of key proteins involved in autophagosome
formation in skeletal muscle over the dehydration/rehydration cycle measured using
immunoblotting. For more information, see Figure 2.2.

110
Figure 2.6: Relative DNA binding activity of TFEB to its consensus sequence in liver
and muscle measured by DPI-ELISA. Measurements were done using tissues of wood
frogs exposed to A) anoxia/reoxygenation, and B) dehydration/rehydration cycle. For
more information, see Figure 2.2.

111
Figure 2.7: Relative protein expression levels of TFEB and one of its downstream
targets, ATP6V0D1, in liver measured by immunoblotting. Measurements were done
using tissues of wood frogs exposed to A) anoxia/reoxygenation, and B)
dehydration/rehydration cycle. For more information, see Figure 2.2.

112
Figure 2.8: Relative protein expression levels of TFEB and one of its downstream
targets, ATP6V0D1 in muscle measured by immunoblotting. Measurements were done
using tissues of wood frogs exposed to A) anoxia/reoxygenation, and B)
dehydration/rehydration cycle. For more information, see Figure 2.2.

113
Figure 2.9: Heatmap of relative transcript levels of select autophagy-regulating miRNAs
in liver measured using RT-qPCR. Data are presented as heat maps for A)
anoxia/reoxygenation and B) dehydration/rehydration cycles. Significance difference
from the control (p<0.05) is denoted by an asterisk (*) as determined using a one-way
ANOVA with Dunnett’s post-hoc test.

114
Figure 2.10: Heatmap of relative transcript levels of select autophagy-regulating
miRNAs in skeletal muscle measured using RT-qPCR. Data are presented as heat maps
for the A) anoxia/reoxygenation and B) dehydration/rehydration cycles. For more
information, see Figure 2.9.

115
Figure 2.11: Relative transcript levels of p62 (sqstm1) in liver of wood frogs measured
using RT-qPCR. Measurements were done using liver of wood frogs exposed to A)
anoxia/reoxygenation, and B) dehydration/rehydration cycle. For more information, see
Figure 2.2.

116
Figure 2.12: Schematic diagram showing the predicted binding sites of mmu-miR-17-5p
to different regions of the p62 transcript. The prediction of miR-17-5p binding to (A)
seed-site and (B) seedless-site of the p62 (sqstm1) transcript was using the Xenopus
laevis transcript sequence. The diagram was generated using the Sfold 2.2 STarMiR
bioinformatics program. The seed-region (CGUGAAA) of mmu-miR-17-5p is shown in
red. MiRNA binding to the seed-site showed a logistical probability of 0.579 with
ΔG=−12.8 kcal mol−1 , whereas binding to the seedless-site showed a logistical
probability of 0.831 with ΔG=−21.0 kcal mol−1.

117
Chapter 3: RAGE
management: ETS1- EGR1
mediated transcriptional
networks regulate
angiogenesis in wood frogs

118
RAGE management: ETS1- EGR1 mediated transcriptional networks regulate
angiogenesis in wood frogs
Rasha Al-attar1, Kenneth B. Storey1
1Institude of Biochemistry and Department of Biology, Carleton University, Ottawa, ON,
Canada (K1S-5B6)
Corresponding Author:
Kenneth B. Storey
Telephone: +1 (613) 520-2600 x3678
Keywords: Angiogenesis, wood frogs, EGR1, ETS1, freeze/thaw, anoxia/reoxygenation,
dehydration/rehydration, RAGE, AGE

119
3.1 Abstract
Freeze-tolerant species, such as wood frogs (Rana sylvatica), are susceptible to multiple
co-occurring stresses that they must overcome to survive. Freezing is accompanied by
mechanical stress and dehydration due to ice crystal formation in the extracellular space,
ischemia/anoxia due to interruption in blood flood, and hyperglycemia due to
cryoprotective measures. Wood frogs can survive dehydration, anoxia, and high glucose
stress independently of freezing, thereby creating a multifactorial model for studying
freeze-tolerance. Oxidative stress and high glucose levels favors the production of pro-
oxidant molecules and advanced glycation end product (AGE) adducts that could cause
substantial cellular damage. In this study, the involvement of the high mobility group box
1 (HMGB1)-AGE/RAGE (receptor for AGE) axis and the regulation of ETS1 and EGR1-
mediated angiogenic responses were investigated in liver of wood frogs expose to
freeze/thaw, anoxia/reoxygenation and dehydration/rehydration treatments. HMGB1 and
not AGE-adducts are likely to induce the activation of ETS1 and EGR1 via the RAGE
pathway. The increase in nuclear localization of both ETS1 and EGR1, but not DNA
binding activity in response to stress hints to a potential spatial and temporal regulation in
inducing angiogenic factors. Freeze/thaw and dehydration/rehydration treatments
increase the levels of both pro- and anti-angiogenic factors, perhaps to prepare for the
distribution of cryoprotectants or enable the repair of capillary damaged capillaries and
wounds when needed. Overall, wood frogs appear to anticipate the need for angiogenesis
in response to freezing and dehydration but not anoxic treatments, probably due to
mechanical/architectural stresses associated with the two former conditions.

120
3.2 Introduction
The freeze-tolerant wood frog, Rana sylvatica, is one of the few vertebrate species
that can tolerate full body freezing in winter [1]. With over 65-70% of its total body
water frozen in winter, these animals experience no breathing, no heartbeat, no brain
conductivity or muscle movement but these functions resume to normal only hours after
thawing [1]. Freezing is the integration of multiple stresses that occur simultaneously and
must be adequately dealt with to ensure survival. For example, to prevent damage to
intracellular organs and cell membrane integrity, wood frogs dehydrate their cells to
confine ice crystal formation strictly to the extracellular and interstitial spaces [2]. As a
result, wood frogs experience extreme dehydration, which is associated with increased
osmolality, ionic strength, and substantial decrease in cell volume [3]. Moreover, freezing
also interrupts blood delivery to organs as the heart stops beating and blood freezes,
therefore wood frog organs are left anoxic [4]. Inadequate oxygen availability under these
conditions initiates a biomolecular response that favors anaerobic metabolism,
accompanied by a strong reduction in metabolic rate to match energy demand with
supply [1]. The strict regulation of energy allocation allows for pro-survival pathways to
be induced [5,6] and processes that are energy expensive and potentially injurious to the
cell to be reduced [7]. As a cryoprotective measure, wood frogs substantially increase
their blood glucose levels from 5mM under normal conditions to ~300 mM during
freezing and become extremely hyperglycemic [2]. Interestingly, wood frogs can survive
anoxia, dehydration, and glucose-loading even when unfrozen, thereby providing a
unique model for studying freezing and its associated stresses independently.

121
With glucose used as a cryoprotective agent in response to freezing and
dehydration [3,8], glucose-induced cytotoxicity becomes imminent. Indeed, high levels
of glucose could result in macromolecule glycation, a non-enzymatic process where a
covalent bond is created between the free amino groups of amino acids (N-terminal
amino acids, lysine or arginine) and the carbonyl group of a reducing sugar (in this case
glucose) in a process called the Maillard reaction to form a Schiff base [9]. After
isomerization, the Schiff base is converted into a stable Amadori product. Fragmentation
of these products through retro-aldol reactions generates a variety of carbonyl species that
are highly reactive called glycation intermediaries. These intermediate molecules can
undergo further oxidation, dehydration, and degradation reactions to form highly stable
advanced glycation end products (AGEs) [10]. These AGE products can also react with
amino acid residues to form AGE-protein adducts or protein crosslinks [10]. Carbonyl
groups can also be generated during lipid catabolism (e. g. malondialdehyde), forming
the advanced lipoxidation end products (ALEs) [10]. Although originating from different
sources, AGEs and ALEs cannot always be distinguished from each other. For example,
the most common AGE compound, N-ɛ-carboxymethyllysine (CML) [11], can be
generated following both lipid and carbohydrate catabolism [12]. Alternatively,
excessive glucose in the presence of oxidative stress can undergo autoxidation and yield
highly reactive carbonyl-containing compounds that can also be conjugated to proteins
[10]. In short-lived proteins, glycation results in the formation of Amadori products only.
This is because AGE formation is a very slow process and can take up to months or
years; therefore, AGE formation predominantly affects long lived proteins such as

122
collagen. However, hyperglycemia or oxidative stress can accelerate the formation of
AGEs to hours, thereby also affecting short-lived macromolecules [13].
Previous study on wood frogs demonstrated that despite high levels of glucose
during freezing, glycated hemoglobin levels decreased after 48 hours of freezing and
levels continued to decrease following 3-7 days of thawing [14]. Interestingly, the same
study reported an elevation in glycated serum albumin levels 7 days post-thawing,
suggesting that perhaps wood frogs have a unique mechanism for selective protein
glycation [14]. AGE adducts, along with other secretory molecules, can bind to the
receptor for advanced glycation end products (RAGE) and initiate a cascade of
intracellular events that results in the repression or induction of numerous signaling
pathways [15]. RAGE is a cell surface receptor from the immunoglobulin superfamily,
and it recognizes its ligands based on their three-dimensional structures, rather than
specific amino acid epitopes [15]. Along with AGEs, the high mobility group box 1
(HMGB1) is another widely acknowledged ligand for RAGE [16]. Under normal
conditions, this non-histone DNA binding protein resides in the nucleus, but upon
stimulation with oxidative stress, it becomes acetylated and is secreted into the cytoplasm
[17]. There, it can interact with other regulatory proteins to promote or repress numerous
signaling processes. For example, in response to various stimuli, HMGB1 has been
shown to promote autophagy by binding to and activating Beclin1, an important
autophagy initiator [18]. HMGB1 can also translocate to the extracellular space via
secretory vesicles and bind to various receptors including RAGE [19]. Association of
AGEs and RAGE has been implicated in regulating inflammation, autophagy and
angiogenesis amongst other processes [15,20]. Angiogenesis, in theory, could be a

123
beneficial response to freezing and dehydration as it would speed up the delivery of
cryoprotects such as glucose and urea to different organs. Interestingly, a cDNA array
screen in our laboratory demonstrated an increase in RAGE levels in wood frog heart
following freezing [21]. Therefore, it was of interest to study whether a) AGEs
accumulate in wood frogs during freeze/thaw, anoxia/reoxygenation,
dehydration/rehydration cycles and b) if so, can RAGE induce a transcriptional response
under these conditions.
Binding of ligands to RAGE activates several kinases that ultimately lead to the
activation of various transcription factors such as the E26 transformation-specific
sequence 1 (ETS-1) and the early growth response 1 (EGR1) under conditions of hypoxia
or oxidative stress [22,23] (Figure 3.1). Upon ligand binding to the extracellular domain
of RAGE, its cytoplasmic domain interacts with diaphanous-1 (mDia-1), a protein that is
necessary to transduce signals to downstream kinases. Indeed, activation of mDia-1 was
necessary for protein kinase CβII activation and its subsequent phosphorylation of
ERK1/2 and JNK under low oxygen conditions resulting in the phosphorylation and
activation of the ELK-1 transcription factor [22,23]. This facilitates ELK-1 cytoplasmic
to nuclear translocation, and induction of the egr1 gene [24]. After being translated in the
cytoplasm, EGR1 enters the nucleus and induces the transcription of various genes
involved in tissue repair, inflammation and angiogenesis [25]. The transcriptional
regulation by EGR1 depends on two co-repressors, NAB1 (NGFI-A binding-1,
constitutive) and NAB2 (inducible), which physically interact with EGR1 to prevent its
association with DNA and transcriptional activity [26,27]. The mechanism of ETS1
activation is similar to the mechanism of EGR1 activation. Following ERK1/2 activation,

124
this kinase phosphorylates ETS1, a process that is necessary to facilitate its cytoplasmic
to nuclear translocation [28].
Both EGR1 and ETS1 are involved in angiogenesis; the formation of new blood
vessels stemming from pre-existing ones [29–31]. While angiogenesis is a normal
physiological process during development and adulthood, its inappropriate initiation
could manifest in serious pathology such as cancer [32]. By contrast, activation of
angiogenesis in ischemic heart or during tissue injury has been shown reduce the
progression of cardiac infarction [33], and accelerate would healing [34]. Under normal
conditions, endothelial cells (ECs) are in their quiescent state and reside in the luminal
surface of the vessels. Upon stimulation by inflammation or injury, several growth factors
are released including but not limited to vascular endothelial growth factor (VEGF),
transforming growth factors (TGFs), endothelial growth factors (EGFs), tumor necrosis
factor α (TNFα), angiogenin, angiopoietin, and fibroblast growth factors (FGFs) [34,35].
These growth factors bind to receptors (e.g. VEGF receptors, FGF receptors, tyrosine
kinase with immunoglobulin-like receptors, and EGF-like domain 1/2 receptors, Tie1,
Tie2, and integrin receptors) found on the EC surface of the parent vessel, and promote
the induction and release of proteolytic enzymes that degrade the basement membrane
surrounding the parent vessel [35]. Following a chemotactic gradient toward growth
factors, EC cells will proliferate and sprout until the two or more sprouts fuse together to
form a lumen. Oxygenated blood with flow through the lumen to supply local tissue with
oxygen, and when levels return to normal, growth factor secretion (mainly VEGF)
decreases and returns to baseline. Pericytes are then recruited to promote the maturation
and stabilization of the newly formed capillary. While angiogenesis is a complex process

125
and requires a coordinated response from multiple signaling pathways, the underlying
mechanism remains the same: to detect secreted pro-angiogenic ligands from secreting
vessels by receptors found on the parent vessels. Here, the role of AGE/HMGB1/RAGE
axis in regulating angiogenesis in response to environmental stressors in the wood frog
was studied. Current results show that angiogenic responses are likely induced by the
HMGB1/RAGE axis, and that ETS1 and EGR1 regulate the expression of angiogenic
targets in a temporal manner in response to freezing and dehydration in frogs.
3.3 Materials and methods
Animal treatment
Animal treatment was performed as previously published [36,37]. Briefly, adult
male wood frogs were captured at breeding ponds near Oxford Mills, Ontario and
transported on ice to Carleton University’s animal care facility. Following a tetracycline
bath and a two-week acclimation period at 5℃, the frogs were divided into 7 groups. The
control group was sampled following the acclimation period, whereas the remaining
groups (~25 frogs per group) destined for the freeze/thaw treatments were placed in
plastic containers (3-4 frogs per container) previously lined with damp paper towel, and
housed in incubators set to -4℃ for 45 minutes. This process is done to promote a
gradual decrease in body temperature and initiate the ice nucleation process. Following
incubation, the temperature of the incubator was increased to -2.5℃ and wood frogs were
maintained at this temperature for 24 hours. This incubation period was chosen because it
was previously reported that wood frogs reach maximum body ice content and exhibit no
signs of breathing, movement, heartbeat, or brain conductivity following 24 hours
freezing [38]. The frozen group were sampled at this time point, and the other frozen

126
group was transferred to a 5℃ incubator for the next 8 hours to facilitate wood frog
thawing. This incubation period was chosen because wood frogs have been shown to
regain most of their physiological functions at that time [38]. The thawed group was
sampled at this time point. The anoxia/reoxygenation and dehydration/rehydration
treatments were performed as previously published [36].
All animals were euthanized by pithing. Tissues were excised quickly and
immediately flash frozen in liquid nitrogen to preserve the metabolic profile in each
condition before storage at -80℃. All animal treatment protocols were approved by
Carleton University’s Animal Care Committee (protocol no. 13683), and all procedures
were performed following the guidelines set by the Canadian Council on Animal Care.
Total protein extraction
Total protein extraction was performed as previously described [37]. Briefly, ~50
mg of frozen liver tissue from control, 24 hour freezing, 8 hour thaw, 24 hour anoxia, 4
hour reoxygenation, 40% dehydration and rehydration was homogenized 1:5 (w:v) with
lysis buffer (EMD Millipore, catalogue no. 43-045) containing 1 mM Na3VO4, 10 mM β-
glycerophosphate, 10mM NaF, and 10 µL/mL of protease inhibitor cocktail (Bioshop,
catalogue no. PIC001.1) using a Polytron homogenizer for ~20 seconds. All samples
were placed on ice for ~40 minutes with intermitted vortexing every 10 minutes. Samples
were then centrifuged at 10,000 xg at 4℃ for 20 minutes, and the supernatant containing
the soluble protein fraction was collected. The total protein concentration of all samples
was measured using the Bradford method (Bio-Rad, catalogue no. 500-0006), and the
concentration was adjusted to 10 µg/µL before storage at -80℃ using the respective
cytoplasmic and nuclear extraction buffers.

127
Cytoplasmic-nuclear fractionation
To assess the localization of transcription factors and other secretory proteins, a
cytoplasmic-nuclear fractionation procedure was performed. Approximately 50 mg of
frozen tissue was homogenized 1:5 (w:v) with 1x buffer A (10 mM HEPES, 10 mM KCl,
10 mM EDTA, 20 mM β-glycerol phosphate (pH 7.9), 10 µL of 100 mM DTT per mL of
buffer and 10 µL of protease inhibitor cocktail per mL of buffer) using a Dounce
homogenizer for a total of ~3-4 stokes. Samples were then incubated on ice for 25
minutes to allow for adequate extraction before centrifugation at 12,000 rpm for 15
minutes at 4℃. The supernatant was collected and stored as the cytoplasmic fraction.
The pellets were resuspended in ~300 µL of 5X buffer B (100 mM HEPES, 2 M
NaCl, 5 mM EDTA; 50% (v:v) glycerol, 100 mM β-glycerol phosphate (pH 7.9), 10 µL
of 100 mM DTT and 10 µL of protease inhibitor per mL of buffer), and sonicated for 10
seconds. All samples were incubated on ice for 10 minutes, before being centrifuged at
14,000 rpm for 10 minutes at 4℃. The supernatant was collected and stored at -80 ℃ as
the nuclear fraction.
The concentration of both cytoplasmic and nuclear fraction was measured using
the Bradford method, and the sample concentration was normalized to 5 µg/µL. The
successfulness of the fractionation procedure was determined by western blotting, where
the enrichment of β-tubulin (cytoplasmic marker) and histone H3 (nuclear marker) in the
cytoplasmic and nuclear fractions respectively was demonstrated in the respective
fractions.
Western blotting

128
The concentration of total proteins as well as cytoplasmic and nuclear fractions
for all samples was measured using a Bradford assay and standardized to a constant
concentration immediately before the start of protein treatment. All samples were mixed
with equal volumes of 2X SDS loading buffer (0.2% w:v bromophenol blue, 4% w:v
SDS, 10% v:v 2-β-mercaptoethanol, 20% v:v glycerol and 100 mM Tris-base pH 6.8),
and boiled for 5 minutes in a water bath. Subsequently, samples were cooled on ice and
stored at -20℃ for future use.
The western blot procedure was performed as previously described [37]. The
following antibodies were purchased from Abclonal: Ac-HMGB1 K29 (A16002), NAB1
(A15692), NAB2 (A5827), FGF2 (A0235), ANGPT1(A7877), ANGPT2 (A0698),
Tie1(A3334), Tie2(A0743), VEGFR1, VE-cad (A0734). ETS1(Sc-55581) and EGR1
(Sc-189) antibodies were purchased from Santa-Cruz biotechnology. RAGE(GTX23611)
and VEGF(GTX129844) antibodies were purchase from GeneTex and the
HMGB1(PCRP-HMGB1-3A7) antibody was purchase from the University of Iowa
hybridoma bank.
Advanced glycation end-product (AGE) measurement
Wood frogs are exposed to high levels of hyperglycemia in response to freezing
and dehydration, and this could promote protein glycation resulting in RAGE activation.
Therefore, total levels of AGEs formed under each condition was measured using a
commercially available OxiSelect TM Advanced Glycation End Product (AGE)
Competitive ELISA Kit (Cell BioLabs, catalogue no. STA-817) following the
manufacturer’s protocol. All reagents except for phosphate buffered saline (137 mM
NaCl, 10 mM Na2HPO4, 2.7 mM KCl, and 2 mM KH2PO4, pH 7.4) were provided by the

129
manufacturer. AGE conjugates (10 µg/mL) were diluted in PBS and mixed in a 1:1 ratio
with 1x conjugate diluent also diluted in PBS. A volume of 100 µL of the resulting
mixture was added to each well, and the plate was incubated at 4℃ overnight without
agitation. Following incubation, excess AGE conjugates were decanted, and the wells
were washed twice with 1X PBS. To block unreactive sites, 200 µL of assay diluent was
added to each well and the plate was blocked at room temperature for 1 hour. Following
incubation, excess assay diluent was discarded and 50 µL of total liver extracts (55 µg)
diluted with 1X PBS containing 0.1% BSA, or AGE-BSA standard was added to each
well in duplicate. The plate was incubated for 10 minutes at room temperature on a
rocker, before the addition of 50 µL of anti-AGE antibody to each well. The plate was
incubated at room temperature for 1 hour while rocking and subsequently washed 3x with
250 µL of wash buffer. A volume of 100 µL of secondary antibody conjugated to HRP
was added to each well and the plate was incubated for 1 hour at room temperature while
rocking. Following incubation, the wells were washed three times and incubated with 100
µL of substrate solution for ~10 minutes at room temperature while rocking. Following
color development, the reaction was stopped by adding 100 µL of stop solution to each
well and the plate was read at 450 nm. The amount of AGE protein adducts in the sample
was calculated using the standard curve.
DNA-protein interaction enzyme linked immune sorbent assay (DPI-ELISA)
To assess the DNA binding activity of ETS1 and EGR1 to their consensus
sequence, a DPI-ELISA technique using DNA probes specific to these transcription
factors was performed following a previously established method [39]. DNA
oligonucleotides containing the consensus sequence of ETS1 (forward, 5'-Biotin-

130
GATCTCGAGCAGGAAGTTCGA-3', complementary 3'-
CTAGAGCTCGTCCTTCAAGCT-5') and EGR1 (forward- 5'–Biotin
GGATCCAAGCGGGGGCGAGCGGGGGCGA–3', complementary 3'–
CCTAGGTTCGCCCCCGCTCGCCCCCGCT–5') were purchased from Integrated DNA
Technologies (Coralville, IA, USA). The concentration of 1:1000 was used for anti-ETS1
and anti-EGR1 antibodies and a concentration of 1:2000 anti-rabbit-HRP antibody was
used in this experiment. Probe specificity for each transcription factor was tested by
performing the same assay but omitting either the probes, primary antibody, or proteins
from the reaction. Varying concentration of pooled samples was used to determine the
optimum protein concentration for each transcription factor under each condition.
Total RNA isolation and cDNA synthesis
Total RNA extraction was carried out as previously described [40]. First strand
cDNA synthesis and mRNA quantification was done following a previously established
protocol [41]. In a final volume of 10 µL, 1 µg of RNA and 1 µL of 200 ng/µL Oligo
(DT) (Sigma Genosys, TX, USA) were combined and incubated in a thermocycler
(iCycler, Bio-Rad) set to 65 ℃ for 5 minutes. Samples were cooled on ice for few
minutes, combined with 1 µL of dNTP (BioShop), 1 µL of MMLV Reverse Transcriptase
(Invitrogen), 2 µL of 100 mM DTT and 4µL of 5x First Strand Buffer (Invitrogen), and
incubated for 60 minutes at 42 ℃. Following cDNA synthesis, all samples were cooled
on ice and serially diluted before storage at -20 ℃.
The forward and reverse primers for ets1 were designed using a conserved region
of the coding sequence found in several species and purchased from Integrated DNA
Technologies. For transcript quantification, 18 µL of master mix (10.12 µL of ddH2O, 4

131
µL of 1M Trehalose, 0.5 µL of 100% formamide, 0.5 µL of forward and 0.5 µL of
reverse primers (0.3 nmol/ µL), 0.16 µL of 25 mM dNTPs, 0.125 µL of 5U/ µL Taq
Polymerase (BioShop, catalogue no. TAQ001.1), 0.1 µL of 100x SYBR Green diluted
with DMSO, and 2 µL of 10X q-RT-PCR buffer (500 mM KCl, 100 mM Tris-HCl pH
8.5, 20 mM MgCl2, 2mM dNTP, 1.5% Triton X-100 and 100 nM Fluorescein) was added
to 2 µL of cDNA, and amplification was carried out using the CFX ConnectTM Real-Time
PCR Detection System (Bio-Rad, cat. No. 1855201) according to MIQE guidelines [42].
The amplification protocol for ets1 is as follows: 95 ℃ for 3 minutes, 39 cycles of 95 ℃
for 20 seconds, 56.7 ℃ for 20 seconds and 72 ℃ for 20 seconds. The amplification
protocol for the reference gene, β-actin, was performed according to previously
optimized parameters [43]. The following primers were used: β-actin Forward (5’-
AGAAGTCGTGCCAGGCATCA-3’), Reverse (5’-AGGAGGAAGCTATCCGTGTT-
3’) and ets1 Forward (5’-ATCAAGCAGGAGGTGGTGTC-3’) And Reverse (5’-
GATTGGTCCACTGCCTGTGT-3’).
Quantification and statistics
For western blot measurements, band intensities obtained from the enhanced
chemiluminescent signal and the corresponding Coomassie Blue-stained membranes
were analyzed using GeneTools (Syngene, Frederick, MD, USA). To account for loading
variation, band densities from the enhanced chemiluminescent signal were standardized
against a group of stably expressed proteins within the same lane. This method of
analysis is more reliable than using a single housekeeping protein [44]. Fold changes in
response to stress and recovery are reported relative to the control group (set to 1).
Absorbance values from DPI-ELISA and AGE measurement were measured at 450 nm,

132
with 655 nm set as the reference wavelength. Relative DNA binding of ETS1 and EGR1
under different conditions are reported relative to the control, which was set to 1. Values
obtained from AGE measurement were converted to protein amount using an AGE-BSA
standard curve and are reported as levels of AGE adducts for each condition. Relative
mRNA transcript levels were calculated by linearizing the raw Cq values (2-Cq), and ets1
values were standardized against values obtained for β-actin. Fold-change during stress
and recovery are reported relative to the control, which was set to 1. Histograms for all
experiments represent the mean relative protein expression (mean ± SEM) measured in
n=4 independent biological replicates. Statistically significant difference compared to the
control (p<0.05) were calculated using a One-Way ANOVA and analyzed using the
Dunnett’s post-hoc test. All statistical analyses and graphical presentations were
performed using the RBIOPLOT statistical and graphical R package [45].
3.4 Results
Relative expression levels of RAGE and its ligands
Protein levels of RAGE, HMGB1 and Ac-HMGB1 (K29) were measured using
western blotting in liver of wood frogs undergone freeze/thaw, anoxia/reoxygenation and
dehydration/rehydration treatments. For freeze/thaw experiments, total levels of HMGB1
(T-HMGB1) were unchanged in response to freezing but increased by 2.8 ± 0.6-fold after
thawing (Figure 3.2A). Levels of acetylated HMGB1 (Ac-HMGB1 K29), the cytoplasmic
form of HMGB1, increased by 1.4 ± 0.07-fold following freezing but returned to baseline
after thawing. Protein levels of RAGE rose by 2.7 ± 0.7-fold after freezing, and showed a
reduction following an 8 H thaw, although the decrease was not deemed statistically
significant.

133
Anoxia/reoxygenation treatment results demonstrate that T-HMGB1 is
significantly increased by 1.5 ± 0.1-fold following anoxia exposure, but levels returned to
control values after reoxygenation (Figure 3.2B). Levels of Ac-HMGB1 K29 remained
unchanged in response to treatment, whereas levels of RAGE significantly rose by 2.5 ±
0.2-fold and 2.3 ± 0.14-fold following anoxia/reoxygenation treatment.
Dehydration/rehydration treatment showed a similar response as anoxia/reoxygenation
treatment. Here, levels of T-HMGB1 rose by 1.8 ± 0.1-fold in response to dehydration
before decreasing to near control values after rehydration (Figure 3.2C). Like previous
results, dehydration/rehydration had no effects on HMGB1 acetylation, whereas levels of
RAGE rose by 10.9 ± 0.7-fold and 7.6 ± 0.9-fold, respectively.
Total levels of AGE in liver from different conditions was measured using a
commercially available kit and the amount of AGE-adduct was calculated based on a
BSA-AGE standard curve. Under normal conditions, wood frog liver had 4.4 ± 0.5
µg/mL of AGE adducts. This level decreased significantly down to 2.3 ± 0.2 µg/mL and
2.7 ± 0.6 µg/mL in response to freezing and thawing (Figure 3.3). In response to anoxia,
levels decreased to 1.8 ± 0.2 µg/mL but rebound to near control values (4.7± 0.2 µg/mL)
after reoxygenation. A similar response was observed during dehydration where levels
decreased to 2.2 ± 0.2 µg/mL but rebound to near control values after rehydration (4.4 ±
0.5 µg/mL).
Relative expression levels of ETS1 and EGR1
Using qRT-PCR, transcript levels of ets1 were measured across all conditions.
Relative to the control, transcript levels of ets1 rose by 1.7 ± 0.2-fold and by 2.0 ± 0.2-
fold after freezing and thawing respectively (Figure 3.4A). The same pattern was seen in

134
response to anoxia and reoxygenation where transcript levels rose by 2.1 ± 0.3-fold and
by 2.0 ± 0.3-fold, respectively (Figure 3.4B). In contrast, transcript levels of ets1
decreased significantly by 91 ± 1.4% and by 84 ± 2.3% in response to dehydration and
rehydration, respectively (Figure 3.4C).
Using western blotting, the levels of ETS1 and EGR1, two transcription factors
that are activated downstream of RAGE and are involved in angiogenesis were measured
[29,30,46]. Relative to the control, total protein levels of ETS1 increased significantly by
3.5 ± 0.6-fold in response to freezing but returned to normal upon thawing (Figure 3.5A).
EGR1 protein levels rose by 2.1 ± 0.17-fold after freezing and increased further by 3.2 ±
0.4-fold after thawing. Anoxia and reoxygenation had no influence on total protein
expression of ETS1 or EGR1 (Figure 3.5B). In response to dehydration, levels of ETS1
remained the same but decreased by 58 ± 3% after rehydration. Dehydration and
rehydration treatments did not appear to affect the total protein expression of EGR1 in
liver (Figure 3.5C).
Relative nuclear localization level of ETS1, EGR1 and two repressors of EGR1
Following cytoplasmic and nuclear fractionation, the nuclear fraction of all
conditions was used in western blot analysis to assess the relative nuclear localization of
ETS1, EGR1, NAB1 and NAB2, where the latter two proteins are EGR1 repressors. In
response to freezing, the nuclear localization of ETS1 increased by 2.3 ± 0.6-fold but
returned to near control values after thawing (Figure 3.6A). Levels of EGR1 rose
significantly in response to freeze/thaw treatment by 3.0 ± 0.5-fold and by 3.1 ± 0.6-fold,
respectively. Nuclear levels of NAB1 increased by 1.4 ± 0.04-fold in response to freezing

135
but decreased by 37 ± 9% after thawing. NAB2 levels also increased by 1.9 ± 0.2-fold
after freezing but returned to near control values after thawing.
Anoxic treatment increased ETS1 nuclear localization by 1.4 ± 0.1-fold, but levels
returned to normal after reoxygenation (Figure 3.6B). There was no significant change in
nuclear localization levels of EGR1 or NAB1, but NAB2 levels increased by 2.1 ± 0.2-
fold and by 3.5 ± 0.4-fold respectively following anoxia and reoxygenation. In response
to dehydration and rehydration treatment, nuclear accumulation levels of ETS1 increased
by 2.3 ± 0.3-fold and by 2.1 ± 0.3-fold (Figure 3.6C), whereas the same treatment did not
show a statistically significant change in EGR1 nuclear levels. Nuclear levels of NAB1
decreased by 39 ±6.1% and by 37 ± 7.3% in response to dehydration and rehydration,
respectively. For NAB2, exposure to dehydration did not have an effect on its nuclear
localization, but rehydration treatments reduced its levels by 67 ± 7.1%.
DNA binding activity of ETS1 and EGR1
To determine whether ETS1 and EGR1 were transcriptionally active, a DPI-
ELISA was performed. Freezing and thawing treatments resulted in a significant
reduction in ETS1 DNA binding activity by 53 ± 4.5% and 50 ± 11% respectively,
whereas no effect was seen on EGR1 DNA binding in response to either treatment
(Figure 3.7A). Similar results were obtained after anoxia/reoxygenation treatment where
relative ETS1 DNA binding activities decreased by 81 ± 5 % and by 61 ± 6%
respectively. (Figure 3.7B), The same treatment had no effect on EGR1 DNA binding.
Dehydration also resulted in a significant decrease in ETS1 DNA binding by 53 ± 7%,
but levels return to near normal after rehydration (Figure 3.7C). In response to both

136
dehydration and rehydration, levels of EGR1 DNA binding increased by 1.4 ± 0.05-fold
and by 1.7 ± 0.1-fold, respectively.
Protein expression levels of angiogenic factors regulated by ETS1 and EGR1
Using western blotting, protein expression levels of select angiogenic markers
previously reported to be under the transcriptional control of ETS1 and EGR1 were
measured. In response to freezing and thawing, protein levels of VEGF remained the
same, whereas levels of FGF2 decreased by 80 ± 4.3% after freezing but increased by 1.8
± 0.1-fold after thawing, relative to the control group (Figure 3.8). Protein levels of
ANGPT1 increased by 1.9 ± 0.2-fold after freezing but returned to baseline after thawing,
whereas levels of ANGPT2 increased in response to both treatments by 1.5 ± 0.03-fold
and by 1.8 ± 0.2-fold, respectively. Levels of Tie1 showed no statistical change in
response to freezing but increased by 2.0 ± 0.05-fold after thawing. Similar trends were
seen in Tie2 protein levels where a 5.1 ± 0.3-fold and 3.9 ± 0.3-fold increase was seen in
response freezing and thawing, respectively. Protein levels of VEGFR1 also increased by
3.3 ± 0.3-fold after freezing but returned to near control values after thawing, whereas
levels of VE-cad increased in response to both treatments by 1.3 ± 0.1-fold and 1.3 ± 0.1-
fold, respectively.
Anoxia and reoxygenation treatment showed a slightly different response (Figure
3.9). In response to anoxia and reoxygenation, protein levels of VEGF decreased by 34 ±
9 % and by 41 ± 5% respectively, relative to the control. There were no statistically
significant changes in FGF2, ANGPT1 or VEGFR1 in response to either treatment.
Levels of ANGPT2 did not show a significant decrease after anoxia treatment, but levels
decreased significantly by 34 ± 5% in response to reoxygenation. Total levels of Tie1

137
increased in response to both treatments by 2.4 ± 0.4-fold and by 4.3 ± 0.2-fold,
respectively. Tie2 protein levels increased by 1.8 ± 0.1-fold after anoxia treatment and
further by 2.1 ± 0.1-fold after reoxygenation. Levels of VE-cad did not show a
statistically significant change in response to anoxia, but levels decreased by 72 ± 5%
after reoxygenation.
Dehydration and rehydration treatment, to a certain degree, showed similar
responses as the freeze/thaw experiments. Levels of VEGF were not affected by
dehydration but decreased by 59 ± 5% in response to rehydration (Figure 3.10). No
significant changes were seen in FGF2 or VEGFR1 levels in response to either condition.
Levels of ANGPT1 increased by 2.5 ± 0.2-fold after dehydration and by 2.0 ± 0.04-fold
after rehydration. Similar results were observed in ANGPT2 where levels increased by
2.0 ± 0.1-fold and by 1.5 ± 0.2-fold in response to dehydration and rehydration,
respectively. Levels of Tie1 increased by 3.8 ± 0.3-fold and by 2.6 ± 0.5-fold in response
to dehydration and rehydration, respectively. Tie2 protein levels also showed the same
trends where levels increased by 2.3 ± 0.2-fold and by 1.7 ± 0.2-fold in response to the
dehydration, rehydration treatments. VE-cad levels increased significantly by 1.3 ± 0.08-
fold in response to dehydration but returned to baseline values after rehydration.
3.5 Discussion
Wood frogs are resilient to many environmental stresses and can be used as model
organisms to decipher the key molecular events in many complications associated with
oxidative stress. Here, the involvement of the HMGB1/RAGE/AGE axis in promoting
transcriptional responses to angiogenesis was studied in liver of wood frogs exposed to
freeze/thaw, anoxia/reoxygenation and dehydration/rehydration treatments. HMGB1, a

138
pro-inflammatory molecule, is predominantly a nuclear protein and is only secreted to the
cytoplasm or extracellular space upon undergoing posttranslational modification in
response to stress [17]. Among other posttranslational modifications, acetylation of
HMGB1 was shown to be necessary for its nuclear export. Indeed, a single acetylation
event at either of HMGB1’s two nuclear localization signals can promote its nuclear
export and cytoplasmic accumulation [17,47]. In addition to participating in multiple
cytoplasmic events [48], and binding to extracellular receptors [49], HMGB1 has been
studied extensively for its interaction with RAGE in hyperglycemic or pro-oxidative
stress conditions, since this interaction can promote numerous downstream events such as
inflammation, tissue repair, and angiogenesis [50–52]. In this study, total levels of liver
HMGB1 showed an upwards trend in the 24 hour frozen condition, but this change was
not statistically significant with respect to the control group (Figure 3.2A) Instead,
HMGB1 levels rose significantly after recovery (Figure 3.2A). Interestingly, levels of
acetylated HMGB1 (K29) increased significantly following freezing and returned to near
control values after recovery. K29 is located within the nuclear localization signal and a
single acetylation event on this residue has been shown to promote nuclear export [17].
Cytoplasmic HMGB1 can be exported to the extracellular space in two ways: 1) via
pyroptosis, a proinflammatory program of cell death [53] or 2) via engulfment in
secretory lysosome that will exocytose with cell membrane [19]. Given that wood frogs
experience no sign of apoptosis under stress [7], it is logical to assume that acetylated
HMGB1 probably reaches the extracellular membrane by exocytosis of secretory
lysosomes. In correlation with HMGB1 acetylation, levels of RAGE also significantly
increased in response to freezing before returning to near normal values after thawing

139
(although a decreasing trend is observed, the change was not statistically significant). The
increase in total HMGB1 but not in its acetylated form in response to thawing suggests
that perhaps HMGB1 is retained in the nucleus. HMGB1 plays a significant role in
maintaining the dynamics of the chromatin structure, transcription, and DNA repair. As
such, its increase during thawing and probably nuclear retention is perhaps due to its
nuclear specific functions [54]. Altogether, this suggests that perhaps acetylated HMGB1
following freezing associates with RAGE to induce downstream regulatory signals.
HMGB1 and RAGE responses to anoxia/reoxygenation (Figure 3.2B) and
dehydration/rehydration (Figure 3.2C) were similar. In both cases, total levels of HMGB1
showed a significant increase during stress but returned to control levels during recovery;
HMGB1 levels remained the same and RAGE levels increased following both stresses
and both recoveries. Given that HMGB1 can be hyperacetylated at multiple sites, it is
possible that in response to anoxia/reoxygenation and dehydration/rehydration cycles, a
site other than K29 was acetylated [17]. Indeed, studies have shown that hypoxia or
ischemia/reperfusion in hepatocytes promotes HMGB1 acetylation and its nuclear export
[55]. Moreover, differential phosphorylation and methylation, along with changes in the
redox state of HMGB1 have also been implicated in its nuclear export [56,57]. Reduced
HMGB1 has been shown to bind to RAGE, whereas oxidized HMGB1 was shown to
increase cytotoxicity and apoptosis [58]. Taking these studies into consideration, it is
possible that posttranslational modifications other than acetylation and changes to
HMGB1 redox status may regulate its translocation from the nucleus to the cytoplasm or
extracellular space in anoxic or dehydrated wood frog liver. The increase in RAGE
proteins in response to anoxia/reoxygenation and dehydration/rehydration treatments was

140
also expected (Figure 3.2 B, 3.2 C respectively), as previous studies have reported the
involvement of hyperglycemia and oxidative stress in promoting the expression of this
receptor [59].
The experiments that measured the total levels of AGE adduct showed interesting
results (Figure 3.3). In response to freeze/thaw treatment, anoxia and dehydration, total
levels of AGE-adducts decreased significantly but returned to baseline after
reoxygenation and rehydration. This was unexpected, as freezing, thawing and
dehydration are accompanied by extreme hyperglycemia [3,8]. A previous study in wood
frogs showed that levels of glycated serum albumin were unchanged in response to
freezing and only increased 7 days post thawing [14]. Although speculative, it is possible
that wood frogs show differential glycation patterns with respect to the nature of the
protein. It is also possible that the duration of treatments in this study were not long
enough to induce AGE formation. Indeed, the first step of AGE formation is the
production of Schiff bases (reversible) and Amadori products, which are often short-lived
[60]. Moreover, given the strong antioxidant capacity of wood frogs, it is possible that
enhanced antioxidant responses during treatment prevent the formation or accumulation
of AGEs. Antioxidant metabolites and antioxidant enzymes including superoxide
dismutase, catalase, glutathione peroxidase, as well as carbonyl metabolizing enzymes
such as aldehyde dehydrogenase, aldo-keto reductase, carbonyl reductase and glutathione
S-transferases play a significant role in AGE removal [61]. Indeed, levels of aldo-keto
reductases, glutathione S-transferases, and other antioxidants are significantly
upregulated in response to stress in wood frogs [6,62,63]. As such, it is possible that the
antioxidant response generated during stress and early hours of recovery, neutralizes,
141
and/or prevents the formation of AGEs in wood frogs. Although levels are significantly
decreased across different conditions, AGE-adducts exist in detectable levels in the cell;
therefore, it is possible that even the limited number of AGE-adducts are enough to elicit
a RAGE response.
Activation of RAGE by its ligands results in the induction and activation of the
ETS1 and EGR1 transcription factors, and both are involved in the early stress response
[22,23]. Transcript levels of ets1 increased in response to freezing and thawing in wood
frogs (Figure 3.4A). Protein levels of ETS1 and EGR1 rose significantly in response to
freezing, and levels of EGR1 remained high even after thawing (Figure 3.5A), a trend
that correlates with RAGE activation during freezing. While levels of ets1 in response to
freezing correlate with its protein levels, there is a discrepancy between the two levels
after thawing. This is perhaps because high levels of the ETS1 transcription factor are not
required after thawing, and that ETS1 activity is regulated by other mechanisms such as
posttranscriptional modifications. The discrepancy between the transcript levels and
protein levels after thawing could be due to regulation by microRNAs. MicroRNAs are
small non-coding, single-stranded RNA species that bind to the transcript and prevent its
translation [64]. Indeed, miR-1 and miR-499 were reported to suppress the translation of
ets-1 by regulating its sequestration away from the translational machinery or degradation
[65]. Therefore, it is likely that the discrepancy seen in this study is due to regulation of
the ets1 transcripts at the posttranscriptional level. The increase in EGR1 total protein
levels, despite unchanging levels of RAGE during thawing, could be due to its
accumulation during freezing or early stages of thawing. Indeed, the transcription of egr1
is mediated by ELK-1, and is dependent on JNK-mediated ELK-1 phosphorylation and

142
nuclear localization [24]. In fact, JNK activity increased 90 minutes after thawing in
wood frog liver [66]. Therefore, it is possible that induction of JNK activity in early
hours of freezing is associated with EGR1 expression later stages of thawing as seen in
the current study.
Transcript levels of ets1 in response to anoxia/reoxygenation treatments showed
the same response as exposure to freezing/thawing, where levels under both conditions
increased significantly (Figure 3.4B). However, ets1 transcript levels were significantly
decreased in response to dehydration and rehydration (Figure 3.4C). There was no change
in levels of ETS1 or EGR1 in response to anoxia/reoxygenation treatments (Figure 3.5B).
By contrast, in response to dehydration, EGR1 remained the same and ETS1 levels
decreased after rehydration (Figure 3.5C). It appears that ets1 translation is also regulated
at the posttranscriptional level in response to anoxia/reoxygenation, perhaps to provide
the cell with a reservoir of ETS1 proteins when needed. However, in response to
dehydration, ETS1 transcription factors appear to be regulated by posttranslational
modifications or subcellular localization, and not at the transcriptional level. Given that
RAGE transactivates ETS1 via phosphorylation, it is likely that perhaps ETS1
phosphorylation status is elevated under those conditions to facilitate its nuclear
translocation. Indeed, JNK, one of the kinases involved in ETS1 phosphorylation was
shown to be elevated in response to short- and long-term anoxia in liver of hatching
turtles [67]. Similarly, ERK2, another kinase that phosphorylates and activates ETS1 is
also upregulated in response to early dehydration in liver of Xenopus laevis [68].
Therefore, it is possible that an increase in kinase activity in early hours of dehydration is
responsible for translocating ETS1 to the nucleus.

143
Wood frogs and other hypometabolic species induce the expression of specific
transcription factors when conditions are optimal, before the full onset of freezing or
long-term anoxia/rehydration but maintain these factors in their inactive form until they
are needed. This can be achieved by reversible protein modifications, a regulatory
mechanism that is widely used in animals that undergo metabolic rate depression, which
not only regulates enzymatic activities, but also controls subcellular localization of
proteins [69]. As such, nuclear levels of ETS1, EGR1 and two EGR1 co-repressors were
analyzed to determine whether this mode of regulation is used by these factors. In
response to freezing, nuclear levels of ETS1 increased significantly but rebounded to
control values after thawing (Figure 3.6A). This trend was similar to HMGB1-RAGE
activation under the same conditions. On the other hand, the levels of EGR1 were
elevated after both freezing and thawing, whereas levels of NAB1 increased after
freezing but decreased after thawing. Moreover, levels of NAB2 also increased following
freezing, but returned to normal after thawing (Figure 3.6A). An increase in nuclear
ETS1 and EGR1 levels is consistent with RAGE-mediated activation of these two
transcription factors. Both ETS1 and EGR1 are early response genes and are either
induced and or transactivated in response to stresses such as hypoxia [24,70]. Not
surprisingly, amongst many targets, these transcription factors induce the expression of
numerous genes such as HIF-1, tissue factor, apoptosis markers, and angiogenic markers
that are crucial for adapting to, or eliminating damage during, early onset of unfavorable
conditions [24,70,71]. However, their timely activation (or suppression) is crucial for
launching an appropriate response. For example, hypoxia can stimulate ETS1 expression,
but it can also enhance ETS1 protein degradation via the ubiquitin proteasome system;

144
and this is necessary for keeping a strict regulation on its transcriptional activity [70].
Indeed, EGR1 regulation is likely tightly controlled by its two co-repressors since they
are both upregulated in wood frog livers following freezing. NAB1 is an active repressor
that is tethered to the promoter region of certain genes to prevent their transcription [26];
however, NAB1 can also physically interact with EGR1 to decrease its transcriptional
activity [27]. The NAB2 co-repressor also interacts with and inhibits EGR1 transcription,
and is itself regulated by EGR1 in a negative feedback loop [27]. As such, it is possible
that having both NAB1 and NAB2 in the nucleus is necessary to regulate the expression
of certain EGR1 induced genes in a temporal manner without removing EGR1 from the
nucleus.
Nuclear localization of ETS1 and EGR1 responded in a similar manner to
anoxia/reoxygenation and dehydration/rehydration treatments (Figure 3.6B, 3.6C).
Nuclear accumulation of ETS1 increased in response to anoxia but returned to baseline
levels after reoxygenation (Figure 3.6B). Interestingly, levels of EGR1 and NAB1
remained the same, but levels of NAB2 significantly increased in response to both anoxia
and reoxygenation. This suggests that perhaps at 24-hour anoxia and 4-hour
reoxygenation, transcriptional activity of EGR1 is interrupted by NAB2, to prevent the
untimely transcription of downstream targets. In response to dehydration and rehydration,
nuclear accumulation of ETS1 increased, and while EGR1 showed similar trends, the
changes were not statistically significant (Figure 3.6C). Interestingly, levels of NAB1
were decreased in response to dehydration and rehydration, while levels of NAB2
showed no change in response to dehydration but increasing after rehydration.
Nonetheless, it is likely that nuclear accumulation of ETS1 and to some degree EGR1

145
could occur to ensure appropriate and time-dependent expression of select downstream
genes.
To assess this hypothesis, the DNA binding activity of both EGR1 and ETS1 was
measured (Figure 3.7). Interestingly, despite an increase in ETS1 nuclear accumulation
during freezing, the DNA binding activity of ETS1 significantly decreased after freezing
and thawing (Figure 3.7A). Similar decreases in ETS1 DNA binding were seen in
response to anoxia/reoxygenation and dehydration (Figure 3.7B, 3.7C). As mentioned
earlier, the presence of these transcription factors in the nucleus does not necessarily
suggest of active transcription at that time, specifically. It is possible that the nuclear
accumulation of ETS1 was required for early hours of freezing, but because it is also
required for early or late hours of thawing, it remains in the nucleus but in its inactive
form to provide temporal-dependent gene expression [72]. Different posttranslational
modifications or regulatory proteins could facilitate this process. Indeed, an early study
showed that Sp100 physically interacts with ETS1 to enhance its transcriptional activity
[73]. In addition, alternative calcium-dependent phosphorylation of four serine residues
in ETS1 inhibit its DNA binding activity significantly [74]. Therefore, with respect to the
evidence provided, it is possible that despite having ETS1 available in the nucleus, it may
be present in its inactive form [72]. Comparably, EGR1-mediated gene expressions
appeared to be regulated by its two co-repressors. While DNA binding levels remained
unchanged in response to freeze/thaw (Figure 3.7A) and anoxia/reoxygenation (Figure
3.7B), EGR1 DNA binding levels increased in response to both dehydration and
rehydration (Figure 3.7C). Though nuclear EGR1 levels increased in the livers of frozen
and thawed wood frogs, NAB1 and NAB2 also increased, which could potentially

146
prevent EGR1 DNA binding from increasing relative to the control group under the same
conditions. Similarly, NAB2 levels increased in the nucleus in response to
anoxia/reoxygenation to levels, which was consistent with unchanging EGR1 DNA
binding levels following anoxia/reoxygenation. The decrease in levels of NAB1 in
response to dehydration/rehydration treatments and NAB2 in response to rehydration also
supports an increase in the DNA binding activity of EGR1 under the same conditions
(Figure 3.6C). Therefore, EGR1, like ETS1 appears to be regulated by factors present in
the nucleus to provide time-dependent gene expression activities.
The complex nature of angiogenesis requires highly regulated transcriptional
responses that must occur in a spatial and a temporal manner for successful vessel
formation [75]. Angiogenesis relies on signal integration from different growth factors,
receptors, and adhesion molecules among other pathways. In sprouting angiogenesis, new
blood vessels are formed from parent vessels in multiple steps including the proteolytic
degradation of the basement membrane of capillaries, proliferation of ECs and their
migration, EC tubulogenesis, fusion of the vessels and their pruning, and finally
stabilization of the vascular pericytes [76]. While many transcription factors are involved,
ETS1 and EGR1 have been reported to induce the transcription of several pro-angiogenic
genes and are involved in wound healing and tissue repair [29–31,77–79]. The first
evidence of potential angiogenic responses in wood frogs came from a study that reported
an increase in fibrinogen levels in liver following early hours of freezing, dehydration,
rehydration, but not in response to anoxia, possibly to facilitate wound healing [80].
Fibrinogen is cleaved into fibrin, and this is necessary for allowing EC spreading and
angiogenesis. VEGF, a necessary proangiogenic protein, binds at saturating levels to both

147
fibrinogen and fibrin clots to provide directionality to the site of angiogenesis [81].
Moreover, FGF2, another secreted protein involved in promoting endothelial cell
proliferation has also been shown to bind to both fibrinogen and fibrin [81]. In fact, the
presence of both VEGF and FGF2 function synergistically to promote angiogenesis and
their attachment to fibrinogen or fibrin provides the localization and the spatial
orientation information needed for maximum angiogenic responses under many
conditions including wound healing [81,82]. Other studies report that the promoter region
of VEGF contains an ETS1 binding site, whereas FGF2 expression is regulated by EGR1
[31,77]. Given our previous conclusions that ETS1 and EGR1 may be temporally
regulated in response to stress in wood frogs, it is possible that their temporal regulation
is involved in a timely expression of both VEGF and FGF2.
While levels of VEGF did not change in response to freezing or thawing, levels of
FGF2 decreased in response to freezing but increased drastically after thawing (Figure
3.8). Since EGR1’s DNA binding activity was not affected by the same treatment (Figure
3.7A), it is possible that alternative inhibitory mechanisms are involved to prevent FGF2
transcription. Indeed, while the synergistic effects of VEGF and FGF2 are needed for
enhanced angiogenesis, each factor can also induce this process on their own [81,82].
Interestingly, the angiogenic response of wood frog livers to anoxia and reoxygenation
was opposite of the response to freezing and thawing, where the levels of VEGF
decreased significantly under both conditions and the levels of FGF2 remained consistent
(Figure 3.9). Decreased VEGF levels correlate with decreased ETS1 DNA binding after
anoxia and reoxygenation (Figure 3.7B). Therefore, it is likely that ETS1 is involved in
regulating this process at that time point. While FGF2 levels remained the same in

148
response to dehydration and rehydration treatments, VEGF levels only decreased in
response to rehydration (Figure 3.10). The inconsistency between the DNA binding
levels of ETS1 and EGR1, and protein levels of VEGF and FGF2 could be due to their
temporal regulation at different durations of stress. Indeed, many of the changes required
at the full onset of stress, are done either early on following exposure or are induced at
later hours of recovery when energy levels are high. Alternatively, although these
proteins are differentially regulated in response to each stress, their levels are not entirely
depleted, and may still perform angiogenic activities albeit at lower capacity. It is
possible that the expression of VEGF and FGF2 occur at either early hours of freezing,
dehydration or anoxia to expand the vascular before delivering cryoprotective glucose to
different organs, or later during the recovery stage in case of wound healing and dealing
with injuries.
ANGPT1 and ANGPT2 are two other factors associated with angiogenesis
[83,84]. These two secreted glycoproteins are ligands to Tie1 and Tie2, two receptor
tyrosine kinases that are expressed mainly in the vascular endothelium [84,85]. ANGPT1
was shown to promote vascular remodeling, vascular enlargement, and stimulate EC
migration, proliferation and eventual differentiation [84]. Moreover, ANGPT1 decreases
the permeability of EC and stabilizes the newly formed vasculature by recruiting
pericytes and smooth muscle cells to the newly formed blood vessel [86]. ANGPT2 is an
antagonist to ANGPT1 that promotes vascular destabilization, enhances sprouting and
branching in response to VEGF, and disrupts pericyte recruitment [87]. As such,
ANGPT2-induced destabilization of the vasculature promotes angiogenesis in response to
VEGF, but in the absence of VEGF, ANGPT2 causes vessel regression [85,88]. Their

149
activities must be carefully regulated to ensure appropriate angiogenesis, as one promotes
the onset of the process while the other stabilizes the newly formed vessels.
Interestingly, ANGPT1 expression has been shown to enhance the expression and
activation of EGR1, which in turn induced pro-angiogenic factors such as FGF2,
interleukin 8, VEGFR1 and the platelet derived growth factor B [30]. In addition, EGR1
was also shown to promote the expression of several matrix metalloproteinases, which
are necessary for angiogenesis [46]. ETS1 was shown to bind to the promoter region of
ANGPT2, and induce its expression [83]. Moreover, other members of the ETS
transcription family were shown to regulate the expression of both Tie1 and Tie2 during
angiogenesis [29]. The results of this study show that freezing increased ANGPT1 levels,
whereas both freezing and thawing increased ANGPT2 levels (Figure 3.8). Tie1 and
VEGFR1 levels only increased in response to thawing, whereas Tie2 levels increased
under both treatment conditions (Figure 3.8). The presence of both ANGPT1 and
ANGPT2 and their receptors presents a tug-of-war scenario between promoting
angiogenesis and restricting it. Indeed, ANGPT2 can only promote angiogenesis in
presence of VEGF [85,88]. Moreover, while VEGF binds to VEGFR1 with higher
affinity, the kinase activity of this receptor is relatively weaker than that of VEGF-
VEGFR2 [89]. Given the high affinity of VEGF for VEGFR1, VEGFR1 can act as a
suppressor of angiogenesis by sequestering the available VEGF in a spatial manner until
its needed [89,90]. Therefore, even though VEGF levels did not change in response to
treatment, it is possible that the basal amount present is necessary to promote low levels
of angiogenic responses to fulfill wood frog requirement for blood vessel formation or

150
wound healing when needed and that VEGFR1 provides the required VEGF
sequestration.
In response to dehydration and rehydration, levels of ANGPT1, ANGPT2, Tie1
and Tie2 increased under both conditions. Like freezing, the presence of both
proangiogenic and antiangiogenic factors provides the cell with a choice of inducing or
repressing angiogenesis whenever needed in response to dehydration/rehydration
treatments. Indeed, formation of ice crystals during freezing and significant reduction in
cell volume during dehydration could result in capillary damage or tissue injury;
therefore, having proangiogenic factors at hand could result in new vessel formation or
capillary and tissue repair when needed. Responses to anoxia/reoxygenation treatments
were somewhat different. While ANGPT1 and VEGFR1 levels remain the same in
response to anoxia and reoxygenation (Figure 3.9), levels of ANGPT2 show a decrease in
response to reoxygenation, whereas levels of Tie1 and Tie2 increase in response to both
conditions (Figure 3.9). These results suggest that perhaps angiogenesis or tissue repair is
occurring at minimal level in response to anoxia and reoxygenation. This is because
despite not having an increase in growth factors (VEGF, FGF2, ANGPT2), levels of Tie
1 and Tie2 increased; suggesting that perhaps the low levels of secreted growth factors
available is binding to and activating downstream angiogenic signals. While plausible,
further investigation is warranted.
VE-cad is an adhesion molecule specific to EC and interacts homophilically with
neighboring cells to provide strength and stability to the endothelium. Binding of VEGF
to VEGFR2 activates its tyrosine kinase domain, and through a sequence of events,
results in the phosphorylation of VE-cad [91]. This phosphorylation event results in

151
internalization of VE-cad and the destabilization of the endothelium [92]. As such, levels
of VE-cad are reduced in response to angiogenesis to destabilize the endothelium for
subsequent growth. The proximal promoter region of VE-cad harbors an ETS-binding
site, and a previous study showed that ETS1 carries the transactivation of this promoter
[93]. Results in this study show that total protein levels of VE-cad increased in response
to freezing, thawing (Figure 3.8), and dehydration (Figure 3.10), but was reduced in
response to reoxygenation (Figure 3.9). The increase in VE-cad correlates with the
increase in ETS1 nuclear localization seen in this study in response to freeze/thaw and
dehydration/rehydration, but not with ETS1 DNA binding activity. Oppositely, the
reduction in DNA binding activity of ETS in response to reoxygenation correlates with
protein levels of VE-cad. The discrepancy between the binding can be explained by two
reasons. First, as mentioned earlier, angiogenesis is a complex process that occurs in a
spatiotemporal manner with multiple activators and repressors at play [75]. Angiogenic
responses in wood frogs might occur in response to early periods of freezing or
dehydration to facilitate the distribution of cryoprotective glucose to different organs and
upon respective recoveries to heal injured tissue or capillaries. As such it is possible that
ETS1 activation in the early hours of freezing resulted in the induction of VE-cad and
other angiogenic factors in anticipation and preparation for future events but is
interrupted once enough factors are transcribed. With respect to reoxygenation, a
decrease in both VE-cad could indicate pro-angiogenic responses, but that this response
might occur at basal level depending on the availability of other growth factors. A second
reason for the discrepancy between ETS1 binding and downstream targets could be
regulated by posttranslational modifications and changes in subcellular localization. For

152
example, given the limited energy available, it is possible that the low levels of pro-
angiogenic factors available are post-translationally modified to maintain their activity at
desired level. Indeed, VE-cad molecules are destabilized in response to phosphorylation
in response to VEGFR2 [91]. Given that VEGFR2 proteins were below the detection
limit in this study, it is possible that absence of this phosphorylation event is another
mechanism to keep angiogenic activities at low level. In fact, high levels of VE-cad in
response to freezing and anoxia together with absence of VEGFR2 is suggestive of a
highly stable endothelium, and attenuated angiogenesis.
In conclusion, this study has demonstrated to that the HMGB1/AGE/RAGE axis
might be involved in regulating angiogenesis by inducing or transactivating ETS1 and
EGR1, two transcription factors that are involved in angiogenesis. Current results also
show that both ETS1 and EGR1 appear to be induced in early hours of treatment
(especially in response to freezing and dehydration) to upregulate pro- and anti-
angiogenic factors in preparation for potential vessel expansion or wound healing. The
presence of both activators and repressors of angiogenesis enable the cell to suppress
angiogenic responses when they are not required, but to induce this process when needed.
Acknowledgement
We thank J.M. Storey for editorial review of this manuscript. This work was supported
by a Discovery Grant from the Natural Sciences and Engineering Research Council of
Canada (Grant #6793). K.B.S. holds the Canadian Research Chair in Molecular
Physiology and R.A. holds an Ontario Graduate Scholarship.

153
3.6 References- Chapter 3
[1] K.B. Storey, J.M. Storey, Molecular physiology of freeze tolerance in vertebrates,
Physiol. Rev. 97 (2017) 623–665. https://doi.org/10.1152/physrev.00016.2016.
[2] K.B. Storey, J.M. Storey, Freeze tolerance in animals, Physiol. Rev. 68 (1988) 27–
84. https://doi.org/10.1152/physrev.1988.68.1.27.
[3] T.A. Churchill, K.B. Storey, Dehydration tolerance in wood frogs: A new
perspective on development of amphibian freeze tolerance, Am. J. Physiol. Integr.
Comp. Physiol. 265 (1993) R1324–R1332.
https://doi.org/10.1152/ajpregu.1993.265.6.R1324.
[4] C.P. Holden, K.B. Storey, Second messenger and cAMP-dependent protein kinase
responses to dehydration and anoxia stresses in frogs., J. Comp. Physiol. B. 167
(1997) 305–12. https://doi.org/10.1007/s003600050078.
[5] C.W. Wu, K.K. Biggar, J. Zhang, S.N. Tessier, F. Pifferi, M. Perret, K.B. Storey,
Induction of antioxidant and heat shock protein responses during torpor in the
Gray Mouse Lemur, Microcebus murinus, Genomics, Proteomics Bioinforma. 13
(2015) 19–126. https://doi.org/10.1016/j.gpb.2015.03.004.
[6] D.R. Joanisse, K.B. Storey, Oxidative damage and antioxidants in Rana sylvatica,
the freeze-tolerant wood frog., Am. J. Physiol. 271 (1996) R545-53.
https://doi.org/10.1152/ajpregu.1996.271.3.R545.
[7] V.E.M. Gerber, S. Wijenayake, K.B. Storey, Anti-apoptotic response during
anoxia and recovery in a freeze-tolerant wood frog (Rana sylvatica)., PeerJ. 4
(2016) e1834. https://doi.org/10.7717/peerj.1834.
[8] K.B. Storey, J.M. Storey, Biochemical adaption for freezing tolerance in the wood
frog, Rana sylvatica, J. Comp. Physiol. B. 155 (1984) 29–36.
https://doi.org/10.1007/BF00688788.
[9] J.W. Baynes, N.G. Watkins, C.I. Fisher, C.J. Hull, J.S. Patrick, M.U. Ahmed, J.A.
Dunn, S.R. Thorpe, The Amadori product on protein: Structure and reactions.,
Prog. Clin. Biol. Res. 304 (1989) 43–67.
http://www.ncbi.nlm.nih.gov/pubmed/2675036.
[10] T.J. Lyons, A.J. Jenkins, Glycation, oxidation, and lipoxidation in the development
of the complications of diabetes: A carbonyl stress hypothesis., Diabetes Rev.
(Alexandria, Va.). 5 (1997) 365–391.
[11] K. Ikeda, T. Higashi, H. Sano, Y. Jinnouchi, M. Yoshida, T. Araki, S. Ueda, S.
Horiuchi, N ε -(carboxymethyl)lysine protein adduct is a major immunological
epitope in proteins modified with advanced glycation end products of the Maillard
reaction †, Biochemistry. 35 (1996) 8075–8083.
https://doi.org/10.1021/bi9530550.
[12] T. Miyata, K. Kurokawa, C. Van Ypersele De Strihou, Advanced glycation and
lipoxidation end products: Role of reactive carbonyl compounds generated during

154
carbohydrate and lipid metabolism., J. Am. Soc. Nephrol. 11 (2000) 1744–52.
http://www.ncbi.nlm.nih.gov/pubmed/10966500.
[13] A.W. Stitt, J.E. Moore, J.A. Sharkey, G. Murphy, D.A.C. Simpson, R. Bucala, H.
Vlassara, D.B. Archer, Advanced glycation end products in vitreous: Structural
and functional implications for diabetic vitreopathy., Invest. Ophthalmol. Vis. Sci.
39 (1998) 2517–23. http://www.ncbi.nlm.nih.gov/pubmed/9856760.
[14] J.A. MacDonald, T. Degenhardt, J.W. Baynes, K.B. Storey, Glycation of wood
frog (Rana sylvatica) hemoglobin and blood proteins: In vivo and in vitro
studies, Cryobiology. 59 (2009) 223–225.
https://doi.org/10.1016/j.cryobiol.2009.06.008.
[15] A. Bierhaus, P.M. Humpert, M. Morcos, T. Wendt, T. Chavakis, B. Arnold, D.M.
Stern, P.P. Nawroth, Understanding RAGE, the receptor for advanced glycation
end products, J. Mol. Med. 83 (2005) 876–886. https://doi.org/10.1007/s00109-
005-0688-7.
[16] H. Yang, H. Wang, S.S. Chavan, U. Andersson, High mobility group box protein 1
(HMGB1): The prototypical endogenous danger molecule, Mol. Med. 21 (2015)
S6–S12. https://doi.org/10.2119/molmed.2015.00087.
[17] B. Lu, D.J. Antoine, K. Kwan, P. Lundback, H. Wahamaa, H. Schierbeck, M.
Robinson, M.A.D. Van Zoelen, H. Yang, J. Li, H. Erlandsson-Harris, S.S. Chavan,
H. Wang, U. Andersson, K.J. Tracey, JAK/STAT1 signaling promotes HMGB1
hyperacetylation and nuclear translocation, Proc. Natl. Acad. Sci. 111 (2014)
3068–3073. https://doi.org/10.1073/pnas.1316925111.
[18] R. Kang, K.M. Livesey, H.J. Zeh, M.T. Lotze, D. Tang, HMGB1: A novel Beclin
1-binding protein active in autophagy, Autophagy. 6 (2010) 1209–1211.
https://doi.org/10.4161/auto.6.8.13651.
[19] S. Gardella, C. Andrei, D. Ferrera, L. V. Lotti, M.R. Torrisi, M.E. Bianchi, A.
Rubartelli, The nuclear protein HMGB1 is secreted by monocytes via a non-
classical, vesicle-mediated secretory pathway, EMBO Rep. 3 (2002) 995–1001.
https://doi.org/10.1093/embo-reports/kvf198.
[20] L.G. Bucciarelli, M. Kaneko, R. Ananthakrishnan, E. Harja, L.K. Lee, Y.C.
Hwang, S. Lerner, S. Bakr, Q. Li, Y. Lu, F. Song, W. Qu, T. Gomez, S.Z. Yu, F.Y.
Shi, A.M. Schmidt, R. Ramasamy, Receptor for advanced-glycation end products:
Key modulator of myocardial ischemic injury, Circulation. 113 (2006) 1226–1234.
https://doi.org/10.1161/CIRCULATIONAHA.105.575993.
[21] K.B. Storey, Strategies for exploration of freeze responsive gene expression:
Advances in vertebrate freeze tolerance, Cryobiology. 48 (2004) 134–145.
https://doi.org/10.1016/j.cryobiol.2003.10.008.
[22] Y. Xu, F. Toure, W. Qu, L. Lin, F. Song, X. Shen, R. Rosario, J. Garcia, A.M.
Schmidt, S.F. Yan, Advanced glycation end product (AGE)-receptor for age
(RAGE) signaling and up-regulation of Egr-1 in hypoxic macrophages, J. Biol.
Chem. 285 (2010) 23233–23240. https://doi.org/10.1074/jbc.M110.117457.

155
[23] J.S. Chang, T. Wendt, W. Qu, L. Kong, Y.S. Zou, A.M. Schmidt, S.F. Yan,
Oxygen deprivation triggers upregulation of early growth response-1 by the
receptor for advanced glycation end products, Circ. Res. 102 (2008) 905–913.
https://doi.org/10.1161/CIRCRESAHA.107.165308.
[24] S.F. Yan, J. Lu, Y.S. Zou, J. Soh-Won, D.M. Cohen, P.M. Buttrick, D.R. Cooper,
S.F. Steinberg, N. Mackman, D.J. Pinsky, D.M. Stern, Hypoxia-associated
induction of early growth response-1 gene expression, J. Biol. Chem. 274 (1999)
15030–15040. https://doi.org/10.1074/jbc.274.21.15030.
[25] J.-I. Pagel, E. Deindl, Early growth response 1-a transcription factor in the
crossfire of signal transduction cascades., Indian J. Biochem. Biophys. 48 (2011)
226–35. http://www.ncbi.nlm.nih.gov/pubmed/22053691.
[26] A.H. Swirnoff, E.D. Apel, J. Svaren, B.R. Sevetson, D.B. Zimonjic, N.C. Popescu,
J. Milbrandt, Nab1, a corepressor of NGFI-A (Egr-1), contains an active
transcriptional repression domain, Mol. Cell. Biol. 18 (1998) 512–524.
https://doi.org/10.1128/MCB.18.1.512.
[27] J. Kumbrink, M. Gerlinger, J.P. Johnson, Egr-1 induces the expression of its
corepressor Nab2 by activation of the Nab2 promoter thereby establishing a
negative feedback loop, J. Biol. Chem. 280 (2005) 42785–42793.
https://doi.org/10.1074/jbc.M511079200.
[28] W.K. Wang, Q.H. Lu, J.N. Zhang, B. Wang, X.J. Liu, F.S. An, W.D. Qin, X.Y.
Chen, W.Q. Dong, C. Zhang, Y. Zhang, M.X. Zhang, HMGB1 mediates
hyperglycaemia-induced cardiomyocyte apoptosis via ERK/Ets-1 signalling
pathway, J. Cell. Mol. Med. 18 (2014) 2311–2320.
https://doi.org/10.1111/jcmm.12399.
[29] A.M. Randi, A. Sperone, N.H. Dryden, G.M. Birdsey, Regulation of angiogenesis
by ETS transcription factors., Biochem. Soc. Trans. 37 (2009) 1248–53.
https://doi.org/10.1042/BST0371248.
[30] N.A. Abdel-Malak, M. Mofarrahi, D. Mayaki, L.M. Khachigian, S.N.A. Hussain,
Early growth response-1 regulates angiopoietin-1-induced endothelial cell
proliferation, migration, and differentiation, Arterioscler. Thromb. Vasc. Biol. 29
(2009) 209–216. https://doi.org/10.1161/ATVBAHA.108.181073.
[31] R.G. Fahmy, C.R. Dass, L.-Q. Sun, C.N. Chesterman, L.M. Khachigian,
Transcription factor Egr-1 supports FGF-dependent angiogenesis during
neovascularization and tumor growth, Nat. Med. 9 (2003) 1026–1032.
https://doi.org/10.1038/nm905.
[32] T. Tonini, F. Rossi, P.P. Claudio, Molecular basis of angiogenesis and cancer,
Oncogene. 22 (2003) 6549–6556. https://doi.org/10.1038/sj.onc.1206816.
[33] T. Johnson, L. Zhao, G. Manuel, H. Taylor, D. Liu, Approaches to therapeutic
angiogenesis for ischemic heart disease, J. Mol. Med. 97 (2019) 141–151.
https://doi.org/10.1007/s00109-018-1729-3.

156
[34] P. Kumar, S. Kumar, E.P. Udupa, U. Kumar, P. Rao, T. Honnegowda, Role of
angiogenesis and angiogenic factors in acute and chronic wound healing, Plast.
Aesthetic Res. 2 (2015) 243. https://doi.org/10.4103/2347-9264.165438.
[35] M.G. Tonnesen, X. Feng, R.A.F. Clark, Angiogenesis in wound healing, J.
Investig. Dermatology Symp. Proc. 5 (2000) 40–46.
https://doi.org/10.1046/j.1087-0024.2000.00014.x.
[36] R. Al-attar, Y. Zhang, K.B. Storey, Osmolyte regulation by TonEBP/NFAT5
during anoxia-recovery and dehydration–rehydration stresses in the freeze-tolerant
wood frog (Rana sylvatica), PeerJ. 5 (2017) e2797.
https://doi.org/10.7717/peerj.2797.
[37] R. Al-Attar, S. Wijenayake, K.B. Storey, Metabolic reorganization in winter:
Regulation of pyruvate dehydrogenase (PDH) during long-term freezing and
anoxia., Cryobiology. 86 (2019) 10–18.
https://doi.org/10.1016/j.cryobiol.2019.01.006.
[38] J.P. Costanzo, R.E. Lee, Avoidance and tolerance of freezing in ectothermic
vertebrates, J. Exp. Biol. 216 (2013) 1961–1967.
https://doi.org/10.1242/jeb.070268.
[39] R. Al-Attar, K.B. Storey, Effects of anoxic exposure on the nuclear factor of
activated T cell (NFAT) transcription factors in the stress-tolerant wood frog., Cell
Biochem. Funct. 36 (2018) 420–430. https://doi.org/10.1002/cbf.3362.
[40] S.G. English, H. Hadj-Moussa, K.B. Storey, MicroRNAs regulate survival in
oxygen-deprived environments, J. Exp. Biol. 221 (2018) jeb190579.
https://doi.org/10.1242/jeb.190579.
[41] M.P. Hoyeck, H. Hadj-Moussa, K.B. Storey, The role of MEF2 transcription
factors in dehydration and anoxia survival in Rana sylvatica skeletal muscle,
PeerJ. 5 (2017) e4014. https://doi.org/10.7717/peerj.4014.
[42] S.A. Bustin, V. Benes, J.A. Garson, J. Hellemans, J. Huggett, M. Kubista, R.
Mueller, T. Nolan, M.W. Pfaffl, G.L. Shipley, J. Vandesompele, C.T. Wittwer,
The MIQE guidelines: Minimum information for publication of quantitative real-
time PCR experiments, Clin. Chem. 55 (2009) 611–622.
https://doi.org/10.1373/clinchem.2008.112797.
[43] J. Zhang, K.B. Storey, Akt signaling and freezing survival in the wood frog, Rana
sylvatica, Biochim. Biophys. Acta. 1830 (2013) 4828–37.
https://doi.org/10.1016/j.bbagen.2013.06.020.
[44] S.L. Eaton, S.L. Roche, M. Llavero Hurtado, K.J. Oldknow, C. Farquharson, T.H.
Gillingwater, T.M. Wishart, Total protein analysis as a reliable loading control for
quantitative fluorescent western blotting, PLoS One. 8 (2013) e72457.
https://doi.org/10.1371/journal.pone.0072457.
[45] J. Zhang, K.B. Storey, RBioplot: An easy-to-use R pipeline for automated
statistical analysis and data visualization in molecular biology and biochemistry,

157
PeerJ. 4 (2016) e2436. https://doi.org/10.7717/peerj.2436.
[46] T.L. Haas, D. Stitelman, S.J. Davis, S.S. Apte, J.A. Madri, Egr-1 mediates
extracellular matrix-driven transcription of membrane type 1 matrix
metalloproteinase in endothelium, J. Biol. Chem. 274 (1999) 22679–22685.
https://doi.org/10.1074/jbc.274.32.22679.
[47] T. Bonaldi, F. Talamo, P. Scaffidi, D. Ferrera, A. Porto, A. Bachi, A. Rubartelli,
A. Agresti, M.E. Bianchi, Monocytic cells hyperacetylate chromatin protein
HMGB1 to redirect it towards secretion, EMBO J. 22 (2003) 5551–5560.
https://doi.org/10.1093/emboj/cdg516.
[48] X. Zhu, J.S. Messer, Y. Wang, F. Lin, C.M. Cham, J. Chang, T.R. Billiar, M.T.
Lotze, D.L. Boone, E.B. Chang, Cytosolic HMGB1 controls the cellular
autophagy/apoptosis checkpoint during inflammation, J. Clin. Invest. 125 (2015)
1098–1110. https://doi.org/10.1172/JCI76344.
[49] J.S. Park, F. Gamboni-Robertson, Q. He, D. Svetkauskaite, J.-Y. Kim, D.
Strassheim, J.-W. Sohn, S. Yamada, I. Maruyama, A. Banerjee, A. Ishizaka, E.
Abraham, High mobility group box 1 protein interacts with multiple Toll-like
receptors., Am. J. Physiol. Cell Physiol. 290 (2006) C917-24.
https://doi.org/10.1152/ajpcell.00401.2005.
[50] A. Petrović, D. Bogojević, A. Korać, I. Golić, S. Jovanović-Stojanov, V.
Martinović, S. Ivanović-Matić, J. Stevanović, G. Poznanović, I. Grigorov,
Oxidative stress-dependent contribution of HMGB1 to the interplay between
apoptosis and autophagy in diabetic rat liver, J. Physiol. Biochem. 73 (2017) 511–
521. https://doi.org/10.1007/s13105-017-0574-0.
[51] H. Wu, Z. Chen, J. Xie, L.-N. Kang, L. Wang, B. Xu, High mobility group box-1:
A missing link between diabetes and its complications, Mediators Inflamm. 2016
(2016) 1–11. https://doi.org/10.1155/2016/3896147.
[52] S. Yang, L. Xu, T. Yang, F. Wang, High-mobility group box-1 and its role in
angiogenesis, J. Leukoc. Biol. 95 (2014) 563–574.
https://doi.org/10.1189/jlb.0713412.
[53] M. Lamkanfi, A. Sarkar, L. Vande Walle, A.C. Vitari, A.O. Amer, M.D. Wewers,
K.J. Tracey, T.-D. Kanneganti, V.M. Dixit, Inflammasome-dependent release of
the alarmin HMGB1 in endotoxemia, J. Immunol. 185 (2010) 4385–4392.
https://doi.org/10.4049/jimmunol.1000803.
[54] S.S. Lange, K.M. Vasquez, HMGB1: The jack-of-all-trades protein is a master
DNA repair mechanic, Mol. Carcinog. 48 (2009) 571–580.
https://doi.org/10.1002/mc.20544.
[55] J. Evankovich, S.W. Cho, R. Zhang, J. Cardinal, R. Dhupar, L. Zhang, J.R. Klune,
J. Zlotnicki, T. Billiar, A. Tsung, High mobility group box 1 release from
hepatocytes during ischemia and reperfusion injury is mediated by decreased
histone deacetylase activity., J. Biol. Chem. 285 (2010) 39888–97.
https://doi.org/10.1074/jbc.M110.128348.

158
[56] Y. Tang, X. Zhao, D. Antoine, X. Xiao, H. Wang, U. Andersson, T.R. Billiar, K.J.
Tracey, B. Lu, Regulation of Posttranslational Modifications of HMGB1 During
Immune Responses, Antioxid. Redox Signal. 24 (2016) 620–634.
https://doi.org/10.1089/ars.2015.6409.
[57] C. Janko, M. Filipović, L.E. Munoz, C. Schorn, G. Schett, I. Ivanović-Burmazović,
M. Herrmann, Redox modulation of HMGB1-related signaling, Antioxid. Redox
Signal. 20 (2014) 1075–1085. https://doi.org/10.1089/ars.2013.5179.
[58] D. Tang, M.T. Loze, H.J. Zeh, III, R. Kang, The redox protein HMGB1 regulates
cell death and survival in cancer treatment, Autophagy. 6 (2010) 1181–1183.
https://doi.org/10.4161/auto.6.8.13367.
[59] D. Yao, M. Brownlee, Hyperglycemia-induced reactive oxygen species increase
expression of the receptor for advanced glycation end products (RAGE) and
RAGE ligands, Diabetes. 59 (2010) 249–255. https://doi.org/db09-0801
[pii];10.2337/db09-0801 [doi].
[60] M. Fournet, F. Bonté, A. Desmoulière, Glycation damage: A possible hub for
major pathophysiological disorders and aging, Aging Dis. 9 (2018) 880.
https://doi.org/10.14336/AD.2017.1121.
[61] E.M. Ellis, Reactive carbonyls and oxidative stress: Potential for therapeutic
intervention, Pharmacol. Ther. 115 (2007) 13–24.
https://doi.org/10.1016/j.pharmthera.2007.03.015.
[62] A. Gupta, K.B. Storey, Regulation of antioxidant systems in response to anoxia
and reoxygenation in Rana sylvatica, Comp. Biochem. Physiol. Part B Biochem.
Mol. Biol. 243–244 (2020) 110436. https://doi.org/10.1016/j.cbpb.2020.110436.
[63] C.-W. Wu, S.N. Tessier, K.B. Storey, Stress-induced antioxidant defense and
protein chaperone response in the freeze-tolerant wood frog Rana sylvatica, Cell
Stress Chaperones. 23 (2018) 1205–1217. https://doi.org/10.1007/s12192-018-
0926-x.
[64] K.K. Biggar, K.B. Storey, The emerging roles of microRNAs in the molecular
responses of metabolic rate depression, J. Mol. Cell Biol. 3 (2011) 167–175.
https://doi.org/10.1093/jmcb/mjq045.
[65] W. Wei, Z. Hu, H. Fu, Y. Tie, H. Zhang, Y. Wu, X. ZHeng, MicroRNA-1 and
microRNA-499 downregulate the expression of the ets1 proto-oncogene in HepG2
cells, Oncol. Rep. 28 (2012) 701–706. https://doi.org/10.3892/or.2012.1850.
[66] S.C. Greenway, K.B. Storey, Activation of mitogen-activated protein kinases
during natural freezing and thawing in the wood frog, Mol. Cell. Biochem. 209
(2000) 29–37. https://doi.org/10.1023/a:1007077522680.
[67] S.C. Greenway, K.B. Storey, Discordant responses of mitogen-activated protein
kinases to anoxia and freezing exposures in hatchling turtles, J. Comp. Physiol. B
Biochem. Syst. Environ. Physiol. 169 (1999) 521–527.
https://doi.org/10.1007/s003600050251.

159
[68] A.I. Malik, K.B. Storey, Activation of extracellular signal-regulated kinases during
dehydration in the African clawed frog, Xenopus laevis., J. Exp. Biol. 212 (2009)
2595–603. https://doi.org/10.1242/jeb.030627.
[69] R. Al-Attar, K.B. Storey, Suspended in time: Molecular responses to hibernation
also promote longevity., Exp. Gerontol. 134 (2020) 110889.
https://doi.org/10.1016/j.exger.2020.110889.
[70] N. Qiao, C. Xu, Y.-X. Zhu, Y. Cao, D.-C. Liu, X. Han, Ets-1 as an early response
gene against hypoxia-induced apoptosis in pancreatic β-cells., Cell Death Dis. 6
(2015) e1650. https://doi.org/10.1038/cddis.2015.8.
[71] T. Oikawa, T. Yamada, Molecular biology of the Ets family of transcription
factors, Gene. 303 (2003) 11–34. https://doi.org/10.1016/S0378-1119(02)01156-3.
[72] J.S. Yordy, R.C. Muise-Helmericks, Signal transduction and the Ets family of
transcription factors, Oncogene. 19 (2000) 6503–6513.
https://doi.org/10.1038/sj.onc.1204036.
[73] C. Wasylyk, S.E. Schlumberger, P. Criqui-Filipe, B. Wasylyk, Sp100 interacts
with ETS-1 and stimulates its transcriptional activity, Mol. Cell. Biol. 22 (2002)
2687–2702. https://doi.org/10.1128/MCB.22.8.2687-2702.2002.
[74] D.O. Cowley, B.J. Graves, Phosphorylation represses Ets-1 DNA binding by
reinforcing autoinhibition., Genes Dev. 14 (2000) 366–76.
https://doi.org/10.1101/gad.14.3.366.
[75] K. Bentley, S. Chakravartula, The temporal basis of angiogenesis, Philos. Trans.
R. Soc. B Biol. Sci. 372 (2017) 20150522. https://doi.org/10.1098/rstb.2015.0522.
[76] D. Ribatti, E. Crivellato, “Sprouting angiogenesis”, a reappraisal, Dev. Biol. 372
(2012) 157–165. https://doi.org/10.1016/j.ydbio.2012.09.018.
[77] N. Hashiya, N. Jo, M. Aoki, K. Matsumoto, T. Nakamura, Y. Sato, N. Ogata, T.
Ogihara, Y. Kaneda, R. Morishita, In vivo evidence of angiogenesis induced by
transcription factor Ets-1[1] N. Hashiya, N. Jo, M. Aoki, K. Matsumoto, T.
Nakamura, Y. Sato, N. Ogata, T. Ogihara, Y. Kaneda, R. Morishita, In vivo
evidence of angiogenesis induced by transcription facto, Circulation. 109 (2004)
3035–3041. https://doi.org/10.1161/01.CIR.0000130643.41587.DB.
[78] W.K. Kim, Y. Kwon, M. Park, S. Yun, J.-Y. Kwon, H. Kim, Identification of
specifically activated angiogenic molecules in HMGB-1-induced angiogenesis,
BMB Rep. 50 (2017) 590–595. https://doi.org/10.5483/BMBRep.2017.50.11.129.
[79] M. Bryant, G.M. Drew, P. Houston, P. Hissey, C.J. Campbell, M. Braddock,
Tissue repair with a therapeutic transcription factor., Hum. Gene Ther. 11 (2000)
2143–2158. https://doi.org/10.1089/104303400750001444.
[80] Q. Cai, K.B. Storey, Freezing-induced genes in wood frog (Rana sylvatica):
fibrinogen upregulation by freezing and dehydration, Am. J. Physiol. Integr.
Comp. Physiol. 272 (1997) R1480–R1492.
https://doi.org/10.1152/ajpregu.1997.272.5.R1480.

160
[81] A. Sahni, C.W. Francis, Vascular endothelial growth factor binds to fibrinogen and
fibrin and stimulates endothelial cell proliferation, Blood. 96 (2000) 3772–3778.
https://doi.org/10.1182/blood.V96.12.3772.h8003772_3772_3778.
[82] M.S. Pepper, S.J. Mandriota, M. Jeltsch, V. Kumar, K. Alitalo, Vascular
endothelial growth factor (VEGF)-C synergizes with basic fibroblast growth factor
and VEGF in the induction of angiogenesis in vitro and alters endothelial cell
extracellular proteolytic activity, J. Cell. Physiol. 177 (1998) 439–452.
https://doi.org/10.1002/(SICI)1097-4652(199812)177:3<439::AID-
JCP7>3.0.CO;2-2.
[83] Y. Hasegawa, M. Abe, T. Yamazaki, O. Niizeki, K. Shiiba, I. Sasaki, Y. Sato,
Transcriptional regulation of human angiopoietin-2 by transcription factor Ets-1,
Biochem. Biophys. Res. Commun. 316 (2004) 52–58.
https://doi.org/10.1016/j.bbrc.2004.02.019.
[84] N.P.J. Brindle, P. Saharinen, K. Alitalo, Signaling and functions of angiopoietin-1
in vascular protection., Circ. Res. 98 (2006) 1014–23.
https://doi.org/10.1161/01.RES.0000218275.54089.12.
[85] T. Asahara, D. Chen, T. Takahashi, K. Fujikawa, M. Kearney, M. Magner, G.D.
Yancopoulos, J.M. Isner, Tie2 Receptor Ligands, Angiopoietin-1 and
Angiopoietin-2, Modulate VEGF-Induced Postnatal Neovascularization, Circ. Res.
83 (1998) 233–240. https://doi.org/10.1161/01.RES.83.3.233.
[86] S. Davis, T.H. Aldrich, P.F. Jones, A. Acheson, D.L. Compton, V. Jain, T.E. Ryan,
J. Bruno, C. Radziejewski, P.C. Maisonpierre, G.D. Yancopoulos, Isolation of
angiopoietin-1, a ligand for the TIE2 receptor, by secretion-trap expression
cloning, Cell. 87 (1996) 1161–1169. https://doi.org/10.1016/S0092-
8674(00)81812-7.
[87] E. Fagiani, P. Lorentz, L. Kopfstein, G. Christofori, Angiopoietin-1 and -2 exert
antagonistic functions in tumor angiogenesis, yet both induce lymphangiogenesis,
Cancer Res. 71 (2011) 5717–5727. https://doi.org/10.1158/0008-5472.CAN-10-
4635.
[88] J. Holash, Vessel Cooption, Regression, and Growth in Tumors Mediated by
Angiopoietins and VEGF, Science (80-. ). 284 (1999) 1994–1998.
https://doi.org/10.1126/science.284.5422.1994.
[89] M. Shibuya, Vascular endothelial growth factor receptor-1 (VEGFR-1/Flt-1): a
dual regulator for angiogenesis, Angiogenesis. 9 (2006) 225–230.
https://doi.org/10.1007/s10456-006-9055-8.
[90] S. Hiratsuka, K. Nakao, K. Nakamura, M. Katsuki, Y. Maru, M. Shibuya,
Membrane fixation of vascular endothelial growth factor receptor 1 ligand-binding
domain is important for sasculogenesis and angiogenesis in Mice, Mol. Cell. Biol.
25 (2005) 346–354. https://doi.org/10.1128/MCB.25.1.346-354.2005.
[91] N. Lambeng, Y. Wallez, C. Rampon, F. Cand, G. Christe, D. Gulino-Debrac, I.
Vilgrain, P. Huber, Vascular endothelial–cadherin tyrosine phosphorylation in

161
angiogenic and quiescent adult tissues, Circ. Res. 96 (2005) 384–391.
https://doi.org/10.1161/01.RES.0000156652.99586.9f.
[92] K. Xiao, J. Garner, K.M. Buckley, P.A. Vincent, C.M. Chiasson, E. Dejana, V.
Faundez, A.P. Kowalczyk, p120-catenin regulates clathrin-dependent endocytosis
of Ve-cadherin, Mol. Biol. Cell. 16 (2005) 5141–5151.
https://doi.org/10.1091/mbc.e05-05-0440.
[93] E. Lelièvre, V. Mattot, P. Huber, B. Vandenbunder, F. Soncin, ETS1 lowers
capillary endothelial cell density at confluence and induces the expression of VE-
cadherin, Oncogene. 19 (2000) 2438–2446.
https://doi.org/10.1038/sj.onc.1203563.

162
Figures
Figure 3.1: Schematic diagram of HMGB1/AGE/RAGE-induced transcriptional
responses leading to angiogenic gene transcription. Upon binding of AGEs or HMGB1 to
the extracellular domain of RAGE, the cytoplasmic domain of this receptor interacts with
and activates mDia1, which then promotes the translocation of PKCβII to the cell
membrane. This translocation allows the phosphorylation of JNK and subsequently
ERK1/2, leading to the phosphorylation and activation of the transcription factors ETS1
and ELK-1. ELK-1 transcribed another transcription factor called EGR1, and upon its
translation, EGR1 returns to the nucleus and together with ETS1 promote the expression
of a gene network that regulates angiogenesis. Illustration was created by BioRender
(https://biorender.com/).
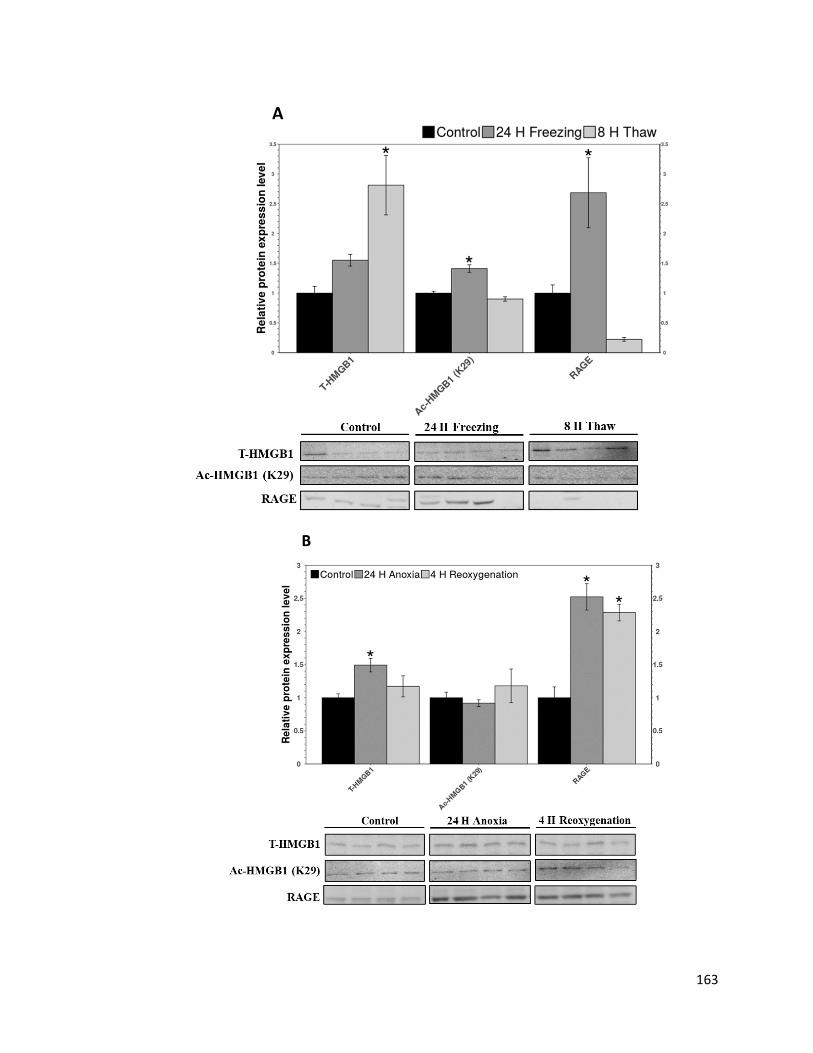
163

164
Figure 3.2: Relative protein expression of HMGB1, Ac-HMGB1 (K29) and RAGE
measured in liver using immunoblotting. Measurements were done on liver from wood
frogs exposed to A) freeze/thaw, B) anoxia/reoxygenation, and C)
dehydration/rehydration treatments. Histogram represents mean ± SEM of n=4
independent biological replicates. Significance from the control (P<0.05) is denote by (*)
as calculated using a One-Way ANOVA with a Dunnett post-hoc test.

165
Figure 3.3: Levels of AGE-adducts present in livers measured using the OxiSelect™
Advanced Glycation End Product (AGE) Competitive ELISA Kit. Measurements were
done using liver from wood frogs exposed to A) freeze/thaw, B) anoxia/reoxygenation,
C) dehydration/rehydration treatments. For more information, please see Figure 3.2.

166

167
Figure 3.4: Relative transcript levels of ets1 in liver measured by RT-qPCR.
Measurements were done in liver of wood frogs expose to A) freeze/thaw, B)
anoxia/reoxygenation, C) dehydration/rehydration treatments. For more information,
please see Figure 3.2.

168

169
Figure 3.5: Total protein levels of ETS1 and EGR1 in liver measured using
immunoblotting. Measurements were done using liver of wood frogs expose to A)
freeze/thaw, B) anoxia/reoxygenation, C) dehydration/rehydration treatments. For more
information, please see Figure 3.2.

170

171
Figure 3.6: Nuclear localization levels of ETS1, EGR1 and two of EGR1 co-repressors
NAB1 and NAB2 in liver measured using immunoblotting. Measurements were done in
liver of wood frogs exposed to A) freeze/thaw, B) anoxia/reoxygenation, C)
dehydration/rehydration treatments. For more information, please see Figure 3.2.

172

173
Figure 3.7: Relative DNA binding activity of ETS1 and EGR1 to their consensus
sequence in liver measured by DPI-ELISA. Measurements were done using liver of wood
frogs expose to A) freeze/thaw, B) anoxia/reoxygenation, C) dehydration/rehydration
treatments. For more information, please see Figure 3.2.

174
Figure 3.8: Relative protein levels of angiogenic factors in liver from wood frogs
exposed to freeze/thaw treatments measured by immunoblotting. For more information,
please see Figure 3.2.

175
Figure 3.9: Relative protein levels of angiogenic factors in liver of wood frogs exposed
to anoxia/reoxygenation treatments measured by immunoblotting. For more information,
please see Figure 3.2.

176
Figure 3.10: Relative protein levels of angiogenic factors in liver of wood frogs expose
to dehydration/rehydration treatments measured by immunoblotting. For more
information, please see Figure 3.2.

177
Chapter 4: RAGE against
the stress: mitochondrial
suppression in
hypometabolic hearts

178
RAGE against the stress: mitochondrial suppression in hypometabolic hearts
Rasha Al-attar1, Kenneth B. Storey1
1Institude of Biochemistry and Department of Biology, Carleton University, Ottawa, ON,
Canada (K1S-5B6)
Corresponding Author:
Kenneth B. Storey
Telephone: +1 (613) 520-2600 x3678
Keywords: Metabolic rate depression, RAGE, AGE, ETS1, mitochondria, transcription,
wood frog
This study has been published in Gene.
R. Al-Attar, K.B. Storey, RAGE against the stress: Mitochondrial suppression in
hypometabolic hearts., Gene. 761 (2020) 145039.
https://doi.org/10.1016/j.gene.2020.145039.

179
4.1 Abstract
The wood frog (Rana sylvatica) can tolerate full body freezing in winter. As a
protective response, wood frogs dehydrate their cells and accumulate large quantities of
glucose as an intracellular cryoprotectant. Freezing causes ischemia since blood delivery
to organs is interrupted. Fascinatingly, wood frogs can tolerate dehydration, extreme
hyperglycemia, and anoxia independently of freezing. In response to low oxygen levels,
wood frogs strategically reduce their metabolic rates and allocate the finite amount of
intracellular fuel available to pro-survival processes while reducing or interrupting all
others. In this study, the involvement of advanced glycation end products (AGEs) and the
high mobility group box 1 (HMGB1) protein in activating RAGE (AGE receptor) were
investigated. The results show that freezing, anoxia and dehydration induced the
expression of total HMGB1 and its acetylation in the heart. RAGE levels were induced in
response to all stress conditions, which resulted in differential regulation of the ETS1
transcription factor. While the nuclear localization of total ETS1 was not affected, the
DNA binding activity of total and its active form increased in response to freezing and
dehydration but not in response to anoxia. Current results indicate that ETS1 acts as a
transcriptional activator for peroxiredoxin 1 in response to freezing but acts as a
transcriptional repressor of several nuclear-encoded mitochondrial genes in response to
all stresses. Altogether, current results show that the HMGB1/RAGE axis may activate
ETS1 in a stress-dependent manner and that activation could result in both transcriptional
activation and/or repression in a stress-dependent manner.

180
4.2 Introduction
Animals in the wild are faced with various unfavorable environmental conditions
(e,g, cold temperatures, food scarcity, limited oxygen availability, droughts) that they
must overcome in order to survive. The freeze-tolerant wood frog (Rana sylvatica), is one
such animals that deals with cold temperatures by using a freeze-tolerant strategy [1].
These incredible animals can endure the freezing of up to 65-70% of their body water,
and spend weeks in a state of suspended animation characterized by the cessation of
heartbeat, breathing, muscle movement or brain conductivity, but resume normal
functions once thawed [1]. The onset of freezing in wood frogs triggers the conversion of
liver glycogen to glucose, and the distribution of huge quantities of this sugar to all
organs in the body to be used as a cryoprotective agent [2]. In fact, blood glucose levels
can rise from 5 mM under normal conditions to ~200-300 mM during freezing, leaving
wood frog organs in a state of extreme hyperglycemia [2]. Another cryoprotective
measure used by wood frogs is their ability to endure cellular dehydration. As ice crystals
start growing in extracellular spaces, water is drawn out of cells due to the rising
osmolality of extracellular fluids leading to a drastic decrease in cell volume that is partly
mitigated by the production and/or uptake of glucose as a counteracting osmolyte [3].
Secession of cardiac activity and the freezing of blood plasma ultimately halts oxygen
delivery to organs, thereby leaving them in an anoxic state and necessitating a shift from
aerobic to anaerobic metabolism for ATP production [4]. Given that the amount of
energy generated anaerobically is far less than the amount generated under aerobic
conditions, wood frogs also use metabolic rate depression (MRD) to minimize ATP and
fuel consumption over what can be many weeks or months in the frozen state during the
winter [1]. MRD is a finely tuned and a highly complex phenomenon where most energy

181
expensive (e.g. the cell cycle) or detrimental processes (e.g. apoptosis) are suppressed,
whereas pro-survival processes such as the cytoprotective and antioxidant responses are
enhanced [5–7] (Figure 1).
Interestingly, wood frogs can tolerate hyperglycemia, dehydration, and anoxia
independently of freezing, and thus they provide a unique model for deciphering the
mechanisms of freeze tolerance in vertebrates. The accumulation of extreme amounts of
glucose as a cryoprotective agent, occurring especially in response to freezing and
dehydration (and to a lesser degree under anoxia) could result in glucose-induced
cytotoxicity and damage to proteins. Indeed, high levels of glucose can result in non-
enzymatic glycation of macromolecules where glucose moieties are covalently attached
to the free amino groups of N-terminal amino acids, arginine or lysine residues in a non-
enzymatic manner. Upon further processing these molecules are converted into highly
stable advanced glycation end products (AGEs) [8]. AGEs can interact with various
amino acid residues within a protein to generate protein crosslinks or AGE-protein
adducts [8]. Generation of AGEs is a slow process and can take from months to years to
accumulate and therefore most proteins that are affected by AGEs are long-lived proteins
such as collagen. However, conditions that favor hyperglycemia or oxidative stress can
reduce the time of AGE formation to a few hours, thereby also affecting the glycation of
short-lived macromolecules [9].
High levels of glucose during freezing in wood frogs did not cause a change in
glycated serum albumin levels; however, levels had increased 7 hours post thaw [10].
The same study also reported that levels of glycated hemoglobin decreased in response to
freezing and remained low after 7 days of thawing. Interestingly, in vitro treatment of

182
whole blood from wood frogs, leopard frogs and rats with 0.4 M glucose resulted in an
increase in glycated hemoglobin levels in all species, albeit levels in leopard frogs and
wood frogs were higher than in the rat [10]. Altogether, these results suggest that perhaps
wood frogs have a unique in vivo mechanism that prevents or reduces protein glycation in
response to freezing. AGE-adducts and other secreted molecules can initiate cascades of
events after binding to the receptor for AGE (RAGE) [11]. Another ligand recognized by
RAGE is the high mobility group box 1 (HMGB1) protein [12]. Under normal
conditions, this non-histone DNA binding protein binds chromatin structures to maintain
their integrity; however, in response to oxidative stress, HMGB1 becomes acetylated and
is exported to the cytoplasm and the plasma membrane [13]. Indeed, HMGB1 is
engulfed in secretory vesicles and is exported into the extracellular space where it can
bind to RAGE and other cell surface receptors such as toll-like-receptors to induce a
cascade of events [14,15]. Previous cDNA array screening by our group demonstrated
that levels of RAGE are significantly upregulated in response to freezing in wood frog
heart [16]. Therefore, we investigated whether exposure to freezing, anoxia and
dehydration increases RAGE ligands and if so, can RAGE increase transcriptional
responses to promote adaptation under these conditions.
Binding of ligands to RAGE on the surface of the cell triggers the recruitment and
association of diaphanous-1 (mDia-1) with the cytoplasmic domain of RAGE [17]. mDia-
1 was shown to be necessary for the activation of protein kinase CβII (PKCβII), its
membrane association and subsequent activation of JNK and ERK1/2 kinases under
hypoxic conditions [17,18]. Activated ERK1/2 can then phosphorylate the E26
transformation-specific sequence 1 (ETS1) transcription factor that results in its nuclear

183
translocation from the cytoplasm [19]. ETS1 regulates numerous genes involved in
angiogenesis, proliferation, autophagy, apoptosis, antioxidant defense, and energy
metabolism, to name a few [20–24]. The ETS family of transcription factors has also
been reported to act as transcriptional repressors [25]. Indeed, ETS1 overexpression in
goldfish (a highly anoxia tolerant species) was shown to suppress the transcription of
nicotinic acetylcholine receptor epsilon-subunit in muscle cells [26]. Moreover,
overexpression of ETS1 was also shown to coincide with reduction in the expression
level of several proteins involved in the electron transport chain including, but not limited
to, NADH dehydrogenase (ubiquinone 1) α/β subcomplex 1 (NDUFAB1), cytochrome c1
(CYC1), and ATP synthase H+ transporting mitochondrial F1 complex,α subunit 1
cardiac muscle (ATP5A1) [23,24]. All three proteins play a significant role in promoting
mitochondrial bioenergetics and dysregulation of their expression could manifest in
mitochondrial stress in mammalian cells [27–29]. Aside from mitochondrial
bioenergetics, ETS1 is also involved in regulating the expression of a network of genes
involved in glucose uptake and metabolism [23,24]. For example, overexpression of
ETS1 was shown to reduce the expression of citrate synthase (CS), an important enzyme
that initiates the tricarboxylic acid cycle (TCA) [23,24]. By contrast, ETS1 was also
shown to promote the expression of glucose transporter 1 (GLUT1) [30]. This transporter
localizes on the plasma membrane, is ubiquitous in most tissues including the heart, and
is responsible for basal glucose uptake by cardiac cells [31].
The present study examines the involvement of AGE and HMGB1 in regulating
the activity of the ETS1 transcription factor in wood frogs dealing with environmental
stress (freezing, anoxia, dehydration). Current results demonstrate that the

184
HMGB1/RAGE axis leads to the differential regulation of ETS1 in a stress-dependent
manner. Furthermore, the DNA binding activity of active ETS1 can lead to
transcriptional activation of PRX1 in response to freezing, but potentially inhibit PRX5 in
response to dehydration and AOX1 in response to freezing and dehydration in the heart.
Moreover, selected downstream targets encoding components of nuclear-encoded
mitochondrial proteins, glucose uptake and metabolism appear to be negatively impacted
by an increase in DNA binding by active ETS1.
4.3 Materials and methods
Animal treatment
Adult male wood frogs were captured from breeding ponds in the Ottawa area in
early spring and transported to Carleton University. All animal experiments were
performed as previously described [32,33]. Following treatment, all animals were
euthanized by pithing and tissues were quickly collected and flash frozen in liquid
nitrogen followed by long term storage at -80℃. All animal treatment protocols were
previously approved by the Carleton University Animal Care Committee (protocol #
106935) and followed guidelines set by the Canadian Council on Animal Care.
Total protein extraction
Total protein extraction was performed as previously published [34]. The
supernatant containing the soluble protein fraction was collected and protein
concentration was measured using the Bradford method (Bio-Rad, catalogue no. 500-
0006). All samples were standardized to a constant concentration and frozen for long
term storage at -80 ℃.
Cytoplasmic-nuclear fractionation

185
For transcription factors to be transcriptionally active, they must localize to the
nucleus. As such, nuclear localization of ETS1 was assessed by first isolating
cytoplasmic versus nuclear fractions. Briefly, ~50 mg of frozen heart tissue was
homogenized 1:5 (w:v) in 1x buffer A (10 mM HEPES pH 7.9, 10 mM KCl, 10 mM
EDTA, and 20 mM β-glycerol phosphate, with 10 µL of 100 mM DTT and 10 µL of
protease inhibitor cocktail added per mL of buffer) using a manual Dounce homogenizer
with 5-6 strokes. All homogenates were incubated on ice for ~25 min to maximize
extraction before being centrifuged at 12,000 rpm for15 min at 4℃. Following
centrifugation, the soluble fraction was collected and stored in at -80℃ as the
cytoplasmic fraction. The pellet was resuspended in ~250 µL of buffer B (100 mM
HEPES pH 7.9, 2 M NaCl, 5 mM EDTA; 50% v:v glycerol and 100 mM β-glycerol
phosphate with 10 µL of 100 mM DTT and 10 µL of protease inhibitor added per mL of
buffer followed by sonication for ~10 sec before incubation on ice for 10 min. Pellet
homogenates were then centrifuged at 14,000 rpm at 4℃ for 10 min. The supernatant
containing the nuclear fraction was collected and stored at -80℃. To ensure successful
fractionation, all fractions were subjected to western blot analysis. Both nuclear and
cytoplasmic fractions were probed with antibodies to a nuclear only (histone H3) or
cytoplasm only (β-tubulin) protein to ensure the enrichment of each marker in its
respective fraction.
Western blotting
Protein concentrations of total protein extracts and cytoplasmic/nuclear fractions
were measured using the Bradford method and standardized to a constant concentration.
Samples were treated and used for western blot analysis as previously described [35].

186
The following antibodies were used: HMGB1(PCRP-HMGB1-3A7, University of Iowa
hybridoma bank), Ac-HMGB1 K29 (A16002, Abclonal), RAGE (GTX23611, GeneTex),
PKCIIβ S660 (9371, Cell Signaling), AOX1 (A3586, Abclonal), CYC1 (A10449,
Abclonal), p-ETS1 T38 (E-Ab-21277, eLabScience), GLUT1 (A6982, Abclonal), PRX1
(A16412, Abclonal), PRX 5 (A1269, Abclonal), ERK2 (Sc-1647, SantaCruz), ATP5A1
(A5884, Abclonal), NDUFAB1 (A14657, Abclonal), CS (110624, GeneTex).
Advanced glycation end-product (AGE) measurement
Total levels of AGE-adducts formed under each condition was measured using a
commercially available kit (OxiSelect TM Advanced Glycation End Product Competitive
ELISA Kit, Cell BioLabs, catalogue no. STA-817) following a protocol provided by the
manufacturer. AGE-conjugate (10 µg/mL) and conjugate diluent both provided by the kit
were diluted to 1X with PBS and mixed in a 1:1 v:v ratio. A 100 µL volume of the
mixture was added to each well of the microplate and incubated overnight at 4℃. Excess
solution was discarded, and wells were washed with 100 µL of PBS twice. A 200 µL
volume of assay diluent was added to each well to block unreactive sites, and the plate
was incubated for 1 h at room temperature. Following blocking, excess assay diluent was
removed, and 50 µL of either heart extracts (40 µg) or AGE-BSA standard was added to
each well in duplicate. The concentration of total protein homogenates was again
measured using the Bradford method and the concentration was standardized using
phosphate buffered saline (137 mM NaCl, 10 mM Na2HPO4, 2.7 mM KCl, and 2 mM
KH2PO4, pH 7.4) containing 0.1% BSA. The plate was incubated at room temperature for
10 minutes with gentle shaking. Following incubation, 50 µL of anti-AGE antibody was
added to each well and the plate was incubated for another hour at room temperature with

187
gentle agitation. Subsequently, excess solution was removed, wells were washed 3x with
250 µL wash buffer and 100 µL of secondary antibody conjugated to HRP was added to
each well. The plate was incubated for 1 h at room temperature with gentle agitation
before discarding excess secondary antibody. All wells were washed three times and
incubated with a volume of 100 µL of substrate solution for 10 min with gentle agitation
at room temperature. Once the desired color intensity was reached, the reaction was
terminated by adding 100 µL of stop solution to each well. The plate was read at 450 nm,
and the amount of AGE-adducts in the sample was calculated using the standard curve
generated.
DNA-protein interaction enzyme linked immunosorbent assay (DPI-ELISA)
The DNA binding activity of total ETS1 and p-ETS1 T38 (one of the active forms
of ETS1) to the ETS consensus sequence was measured using a DPI-ELISA as
previously explained [35]. DNA oligonucleotides containing the ETS1 consensus
sequence (forward, 5'-Biotin-GATCTCGAGCAGGAAGTTCGA-3', complementary 3'-
CTAGAGCTCGTCCTTCAAGCT-5') were generated by Integrated DNA Technologies
(Coralville, IA, USA). Primary antibodies (anti-ETS1 and anti-p-ETS1 T38) were diluted
to 1:1000 and secondary antibody (anti-rabbit HRP) was diluted to 1:2000, both in PBST
(PBS containing 0.05% Tween-20). The specificity of the probe for the ETS1
transcription factor was previously tested by performing the same assay in wells lacking
either the probe, primary antibody, or the protein. Using a dilution curve of pooled heart
samples, it was determined that the optimum concentration to be used in the assay is 25
µg of protein per well.
Comparison of the 3-dimentional structure of ETS1

188
Many studies referenced here rely on findings in mammals, and non-amphibian
models. Therefore, to ensure structural similarities between amphibian and mammalian
ETS1, the protein sequence of Xenopus tropicalis (NP_001123840_1) and Human
(P14921.1) was used to predict the 3-dimentional structure of this protein using the
Protein Homology/Analogy Recognition Engine V2.0 (Pyre2)
(http://www.sbg.bio.ic.ac.uk/phyre2/html/page.cgi?id=index). The generated files were
then analyzed using the PyMOL Molecular Graphics System, Version 2.0 Schrödinger,
LLC.
Quantification and statistics
Band intensities on membranes corresponding to the enhanced chemiluminescent
signal and the corresponding Coomassie-blue stained membrane were quantified using
GeneTools (Syngene, Frederick, MD, USA). Band intensities of enhanced
chemiluminescence signals were standardized against the intensity a group of proteins in
each lane that showed stable expression across all lanes; this was used to account for any
loading variations that may have occurred. This method was shown to be more accurate
than using a single housekeeping protein [36]. Changes in protein expression or
localization were reported as fold-change relative to the control, which was set to 1. For
DPI-ELISA and AGE-adduct measurement, relative intensities of microplate well were
measured at 450 nm, with a reference wavelength of 655. The relative DNA binding
activity of total ETS1 and p-ETS1 T38 under different conditions was reported with
respect to the control group which was set to 1. The amounts of AGE-adducts in hearts
under each condition were calculated by converting the absorbance values into
concentrations using an AGE-BSA standard curve. All histograms are presented as mean

189
relative protein expression, protein localization or DNA binding activity ± SEM for n=4
independent biological replicates. Statistical testing used a One-Way ANOVA with a
Dunnett’s post-hoc test. Significant difference from control was accepted if P<0.05. The
SigmaPlot software (SYSTAT, San Jose, CA, US) was used for statistical analysis and
graphical presentation [37].
4.4 Results
Expression levels of AGE-adducts and protein levels of RAGE and its ligands and
downstream factors
Levels of AGE-adducts in hearts decreased down to 3.05 ± 0.3 µg/mL in response
to 24 h of freezing at -2.5°C, a significant reduction from the 4.5 ± 0.3 µg/mL for heart
from 5°C acclimated controls (Figure 2). However, despite showing a decreasing trend,
there was no significant change in AGE-adduct levels in response to anoxia or
dehydration. Relative total and post-translationally modified levels of different proteins
were measured using western blotting. Levels of total HMGB1 (T-HMGB1) increased by
2.7 ± 0.24-fold, 2.7 ± 0.07-fold, and 2.2 ± 0.21-fold following freezing, anoxia and
dehydration treatments (Figure 3). Levels of acetylated HMGB1 (Ac-HMGB1 K29) also
increased in response to all treatments with levels rising by 4.8 ± 0.34-fold, 4.7 ± 0.30-
fold, and 2.0 ± 0.17-fold in response to freezing, anoxia and dehydration, respectively.
Total protein levels of RAGE, the receptor that binds AGEs and HMGB1 also increased
under all conditions. RAGE levels increased by 1.7 ± 0.12-fold following freezing, by 1.9
± 0.08-fold following anoxia and by 2.6 ± 0.23-fold following dehydration exposure. The
phosphorylated form of PKCIIβ (S660) did not show a statistically significant change in
response to freezing or anoxia, but levels increased by 2.2 ± 0.38-fold in response to

190
dehydration. Total levels of ERK2 remained the same in response to freezing, decreased
by 33 ± 7% in response to anoxia, and increased by 1.8 ± 0.23-fold following dehydration
treatment. The total protein levels of ETS1 did not change in response freezing or anoxia
but decreased by 22 ± 6% after dehydration. The phosphorylated form of p-ETS1 (T38)
also showed no change in response to freezing or anoxia but showed a significant
increase by 2.8 ± 0.57-fold in response to dehydration.
Nuclear localization of ETS1 and DNA binding activity of ETS1
Levels of nuclear ETS1 did not change significantly in response to freezing,
anoxia or dehydration (Figure 4). The DNA binding levels of total ETS1 and p-ETS1
(T38) showed similar trends. For total ETS1, the DNA binding activity increased by 1.57
± 0.12-fold and by 1.44 ± 0.085-fold in response to freezing and dehydration
respectively, but no changes was observed in response to anoxia treatment (Figure 5).
The binding of p-ETS1 (T38) also increased by 2.2 ± 0.26-fold and 2.1± 0.19-fold in
response to freezing and dehydration, respectively, while showing no significant change
in response to anoxia exposure (Figure 5).
Comparison of ETS-1 structure
The primary sequences of ETS-1 from Xenopus tropicalis and humans were
highly similar to each other. Therefore, we predicted that the 3-dimentional structures
will also share high degree of similarity. Indeed, the predicted structure for Xenopus
tropicalis (Figure 6A) and humans (Figure 6B) showed high degree of similarity when
superimposed (Figure 6C), indicating that perhaps the two proteins will act similarly
when bound to DNA (Figure 6D).
Relative expression of downstream targets

191
To assess whether ETS1 is acting as a transcriptional activator or a
transcriptional repressor, a list of targets containing the ETS1 binding domain within
their promotor were curated using the ENCOCDE Transcription Factor Targets from
Harmonizome (http://amp.pharm.mssm.edu/Harmonizome/). These targets were found to
be regulated by ETS1 in multiple studies in both tissues and different cell lines. The first
set of targets measured were the AOX1, PRX1 and PRX5 enzymes involved in ROS
metabolism. Levels of AOX1 decreased in response to freezing (by 40 ± 11%) and
dehydration (by 34 ± 7.7%) but remained unchanged after anoxia exposure (Figure 7).
Levels of PRX1 increased by 1.9 ± 0.23-fold in response to freezing but showed no
change in response to anoxia or dehydration treatments. Levels of PRX5 showed a
decreasing trend in response to freezing and anoxia treatment but changes were not
statistically significant; however, protein levels of PRX5 decreased by 54 ± 3% in
response to dehydration.
Levels of three proteins involved in the mitochondrial electron transport chain
were also measured. Protein levels of ATP5A1 showed no change in response to
freezing, anoxia or dehydration, whereas levels of NDUFAB1 decreased under all
conditions (Figure 7). Protein levels of NDUFAB1 decreased by 70 ± 3% in response to
freezing, by 66 ± 9% in response to anoxia, and by 72 ± 4% in response to dehydration.
Levels of CYC1 also decreased by 38 ± 1.9% in response to freezing, showed no change
in response to anoxia, but decreased by 40 ± 7% in response to dehydration.
Levels of CS and GLUT1, two targets involved in glycolysis and glucose
transport, respectively, were also measured. CS did not change in response to freezing or
anoxia but showed a 53 ± 7.4% decrease in response to dehydration (Figure 7). Levels of

192
GLUT1 also decreased by 45± 5.4% following freezing, by 65 ± 7.2% in response to
anoxia and by 57 ± 19% in response to dehydration.
4.5 Discussion
Wood frogs are fascinating models for studying extreme stress tolerance in
vertebrate species for they can independently tolerate anoxia, major dehydration and
hyperglycemia, and in combination, have developed one of the most amazing vertebrate
survival mechanisms – freeze tolerance [1]. High rates of glycogenolysis and glucose
output from liver are detectable in wood frogs < 2 min after the freezing exotherm is
recorded, and concurrently, heart rate doubles to 8 beats/min as early as 1 minute post-
nucleation to facilitate glucose distribution as a cryoprotectant from the liver to all organs
[38–40]. Elevated cardiac function persists for about ~1 hour post-nucleation and halts
within ~20 h as body ice content reaches its maximum [40]. Resumption of cardiac
activity in early hours of thawing restores blood flow to other organs, and this is
important for the wood frog’s recovery because it has been hypothesized that resumption
of tissue perfusion and the rise in energy demand by warming organs could potentially be
the switch needed to change from anaerobic to aerobic metabolism [40]. Dehydration
also elicits a hyperglycemic response where glucose levels increase to 1092, 1409 and
1263 nmol/mg of protein in brain, heart and liver of wood frog, respectively [3].
However, unlike freezing and dehydration, exposure to anoxia did not appear to initiate a
hyperglycemic response in wood frogs probably due to the absence of mechanical stress
on the cellular architecture [41].
Hyperglycemia and oxidative stress can result in drastic physiological and
biochemical changes that lead to various outcomes in the cell. One of these is AGE

193
formation that, under normal conditions, is a slow process and takes a significant amount
of time (months up to years) before AGE accumulation results in irreversible damage.
However, under conditions where hyperglycemia and oxidative stress co-occur, AGE
formation is accelerated and levels can rise over only a few hours, thereby affecting even
short-lived macromolecules [9]. Surprisingly, the present data showed that levels of
AGE-adducts decreased significantly in response to freezing and, although they showed a
decreasing trend in response to anoxia and dehydration, the changes observed were not
statistically significant (Figure 2). Interestingly, in agreement with current results, a
previous study demonstrated that levels of glycated hemoglobin in serum decreased in
response to freezing [10]. The decrease in AGE-adduct levels during freezing could be
due to the enhanced antioxidant response (both metabolites and detoxifying enzymes)
that accompanies this condition. Antioxidant enzymes such as superoxide dismutase,
glutathione peroxidase, catalase and carbonyl metabolizing enzymes such as aldo-keto
reductases, aldehyde dehydrogenases, carbonyl reductases and glutathione S-transferases
all participate in AGE clear-up from organs [42]. Indeed, freeze-tolerant wood frogs have
higher basal antioxidant responses than non-freeze-tolerant frogs [7]. The same study
reported that glutathione status in multiple tissues of wood frogs, including the heart, and
lipid peroxidation as measured by thiobarbituric acid-reactive substances (TBARS) and
by Fe(III)-xylenol orange complex formation also showed little to no change in multiple
tissues in response to freezing [7]. This indicated that there was little to no increase in
oxidative damage in wood frogs. Moreover, levels of glutathione peroxidase activity
increased in all tissues in response to freezing, including the heart, which further
indicates preparedness by wood frogs to deal with ROS generation [7]. In another study,

194
levels of superoxide dismutase 2 increased in response to 4-hour freezing in wood frog
heart but remained unchanged in response to 24-hour freezing, 24-hour anoxia or
dehydration [43]. suggesting that perhaps that high basal levels of these antioxidant
responses is sufficient to prevent excessive AGE-adduct formation. While freezing has
been extensively studied regarding antioxidant defenses, such studies are lacking for
anoxia or dehydration stressed wood frogs. Nonetheless, studies on other anoxia and
dehydration tolerant frogs and turtles demonstrate an increase in antioxidant responses
under these conditions [44–46]. As such, it is likely that wood frogs also elicit the same
antioxidant responses to combat oxidative damage in response to anoxia and dehydration,
which could result in lowering overall AGE levels.
HMGB1, normally a nuclear protein, can be post-translationally modified by
acetylation, transported into the cytoplasm and eventually released into the extracellular
matrix in response to oxidative stress or hyperglycemia [13,47]. The current results
showed that total HMGB1 is significantly elevated in response to freezing, anoxia and
dehydration (Figure 3) in wood frog heart. This elevation was paralleled by an increase in
HMGB1 acetylation at K29 (Figure 3), which together suggests that, HMGB1 could
potentially be translocated into the cytoplasm and subsequently into the extracellular
matrix to bind to various cell surface receptors. A cDNA array analysis of gene
expression by our group demonstrated an increase in RAGE transcript levels following
freezing exposure in heart of wood frogs [16]. Congruent with these results, the current
study reports an increase in RAGE protein levels in response to freezing, anoxia and
dehydration (Figure 3), suggesting that perhaps these conditions favor the activation of
RAGE signaling in wood frogs. Altogether, these results suggest that changes in either

195
HMGB1 or AGE-adduct levels could be sufficient to bind to RAGE and initiate cascades
of RAGE-dependent events that result in differential regulation of ETS1 transcriptional
responses.
Binding of AGEs or HMGB1 to RAGE results in a cascade of events that lead to
PKCβII activation by priming its phosphorylation and membrane anchoring, and leading
to the activation of JNK and ERK1/2 kinases, respectively, under low oxygen conditions
[17,18,48]. Activated ERK1/2 can then phosphorylate ETS1 to promote its nuclear
translocation [19]. The present results showed no change in phosphorylation (activation)
of PKCβII S660 in response to anoxia or freezing, but levels increased in response to
dehydration (Figure 3). PKCs are responsible for regulating a large number of
physiological changes such as cell polarity, proliferation and differentiation, migration
and metabolism [49]; some of these are strictly attenuated under MRD. The trends seen
for PKCβII S660 were similar to those for ERK2, where levels remained the same in
response to freezing, slightly but significantly decreased in response to anoxia, and
increased in response to dehydration (Figure 3). Signal transduction through PKCβII to
ERK2 is mediated via JNK [17,18]. In response to freezing, JNK activity in the heart
remained unchanged in wood frog [50], a result that correlates with the unchanged levels
of active ERK2 (Figure 3). Moreover, while JNK activities have not been measured in
anoxic wood frogs, studies on other anoxia tolerant models show an increase in JNK
levels only in response to the early hours of anoxia exposure [51]. As such, perhaps the
requirement for JNK-mediated activation of ERK2 is only needed in early stages of the
stress and not when the animal is fully adapted 24-hour post-exposure. Altogether,
although there is a lack of increase in ERK2 in response to freezing or anoxia, it is still

196
likely that the basal level of ERK2 available can remain active and participate in ETS1
activation by phosphorylating this transcription factor.
The current study demonstrates no change in ETS1 levels in response to freezing
and anoxia, but a small significant decrease in response to dehydration (Figure 3). ETS1
is an early response transcription factor that is induced or activated in response to the
early stages of cellular stress, especially under condition of oxygen deprivation [52].
Regulating a remarkable range of signaling pathways, ETS1 is involved in many
processes including, but not limited to, angiogenesis, apoptosis, energy metabolism,
cellular energetics and autophagy [20,21,23,24]. As such, its timely expression and
activation must be under strict regulation by various mechanisms to ensure that its
transcriptional activities are stimulated appropriately. Given the involvement of ETS1 in
many process, it is possible that at the time timepoints studies here, the regulation of
ETS1 is not needed at the transcriptional level and that the amount of ETS1 available in
cells is enough to carry out other processes as needed. The current study also investigated
the phosphorylation status of ETS1 (T38) and results show that the phosphorylation level
was not affected by freezing or anoxia but was significantly increased in response to
dehydration (Figure 3). Posttranslational modifications are an energy-efficient way of
regulating protein-enzyme activity, especially under conditions when ATP synthesis is
attenuated. Indeed, numerous pathways and enzyme activities are regulated by reversible
posttranslational modifications (PTMs) [34,53]. As shown in Table S1, ETS1 was
predicted to have multiple phosphorylation sites, and was shown to undergo other forms
of posttranslational modifications. However, due to limited commercial antibodies
available that cross-react with wood frogs, we were unable to measure the levels of

197
alternative modifications. Therefore, with respect to the data provided, it is possible that
in addition to other modified forms, only basal levels of active p-ETS1 (T38) may be
required under freezing and anoxic conditions, while more active ETS1 (T38) is needed
to regulate gene expression during dehydration. An antibody that detects total ETS1 (both
modified and unmodified) was used to assess the nuclear localization of this transcription
factor. The results demonstrated that nuclear localization of ETS1 did not change
significantly in response to freezing, anoxia or dehydration, although the trends were all
decreasing (Figure 4). In response to a specific stimulus such as hypoxia, hyperglycemia,
or oxidative stress, specific transcription factors are translocated to the nucleus to induce
the expression of gene families required for mitigating the stress [52,54]. However, while
some transcription factors are induced in response to stress, their downstream
transcriptional activity may be temporally regulated. For example, freezing or
dehydration could cause architectural damage to capillaries in an organ, but this is not
always imminent. As such, maintaining a pool of transcription factors in the nucleus
needed to deal with wound healing or capillary biogenesis is a pro-active measure to
promote survival.
To determine whether the DNA binding activity of ETS1 in the heart is affected
by stress in wood frogs, a DPI-ELISA was performed using antibodies that react with
total ETS1 and one of its active forms, p-ETS1 (T38). Interestingly, whereas the nuclear
localization of total ETS1 did not change in response to stress (Figure 4), the DNA
binding by either ETS1 or p-ETS1 T38 increased in response to freezing and dehydration
but was unchanged under anoxia (Figure 5). This suggests that in response to prolonged
stress, the activity of ETS1 is regulated at the posttranslational level and that ETS1

198
transcriptional activity plays a significant role in the cellular response to stress in wood
frog heart. Not surprisingly, given the number of genes that this transcription factor
regulates, and the hypometabolic consequences of the stresses imposed, using PTMs
appears to be an effective and energy efficient way of controlling gene expression. The
amphibian primary protein sequence (Figure S1) and its 3-dimentional structure (Figure
6) shares high degrees of similarity to that of human ETS1, which enabled us to use data
from mammalian models to support our findings here in amphibians. Using the
amphibian ETS1 as input, it was predicted that this transcription factor can be
phosphorylated, SUMOylate and acetylated at multiple locations (Table S1). While it
requires further validations, these predictions support our hypothesis that PTMs play a
significant role in regulating ETS1 activity in the cell. Moreover, reports show that the
DNA binding ability of ETS1 is enhanced in the presence of HMGB1 [22]. Therefore, the
strong increase in total HMGB1 levels, as well as acetylated HMGB1, seen in this study
(Figure 3) could support the enhanced DNA binding activity of p-ETS1 T38 in response
to freezing or dehydration.
Several studies have reported that the ETS1 can act both as a transcriptional
activator [22–24] and a transcriptional suppressor [23–26,30]. As such, based on
available ChIP-seq information (see methods) and published data [23,24], a group of
downstream targets known to be regulated by ETS1 were assembled and analyzed. The
present results show that protein levels of AOX1 were significantly downregulated in
response to freezing and dehydration (Figure 7). AOX1 is a cytosolic enzyme that plays
an important role in xenobiotic metabolism, but has been shown recently to catalyzes the
reduction of nitrites to NO in the presence of aldehyde containing substrates or NADH

199
[55]. Interestingly, NO is known to regulate cardiac contractility and heart rate, and low
levels of NO were shown to be protective against cardiac remodeling [56]. Whereas this
could protect wood frog hearts during stress, it is possible that the activity of AOX1 is
required in the early hours of stress exposure (pre-conditioning) or during the early hours
of recovery (post-conditioning), and not when the heart is fully adapted following long
term exposure to stress. In addition, oxidation of NADH by AOX1 can also result in the
production of pro-oxidant species (ROS, RNS, superoxide anion radicals) that although
necessary at low levels to initiate redox signaling, could be extremely pathogenic in high
levels [57]. Therefore, given that frogs exposed to freezing, anoxia and dehydration are
already at risk of oxidative stress, down-regulation of AOX1 could be a protective
response in this situation. Interestingly, the DNA binding of both total and p-ETS1 T38
reflects the same trends as AOX1, indicating that ETS1 may be a transcriptional repressor
of AOX1. In support of this argument, there are multiple ETS binding sites within the
promotor region of the AOX1 gene [23,24] and given its role in generating pro-oxidant
species, it is possible that the transcriptional inhibition of AOX1 is mediated by ETS1.
Further investigation is warranted to validate this hypothesis.
ETS1 has been also shown to regulate the expression of PRX1 and PRX5 [22–
24]. PRX1 is a typical 2-cysteine peroxidase localized to the cytoplasm, whereas PRX5 is
an atypical 2-cysteine peroxidase that resides mainly in the cytoplasm and has a higher
antioxidant activity in response to ROS [58]. Both of these peroxidases are stress
responsive, and it was shown that their expression is mediated by ETS1 in response to
hydrogen peroxide or hypoxia treatments [22]. Interestingly, the same study
demonstrated that HMGB1 physically interact with ETS1 to enhance its transcriptional

200
activity at PRX1 and PRX5 promotors. The current results show that expression of PRX1
was significantly regulated in response to freezing, whereas expression of PRX5 was
significantly downregulated in response to dehydration (Figure 7). The DNA binding
activity of ETS1 in response to freezing, correlates with an increase in the protein levels
of PRX1 in response to the same treatment, therefore it is possible that this increase is
mediated by ETS1. Moreover, PRX1 has been shown to play additional roles in cells by
participating in cell signaling and chaperone activity. For example, in response to
ionizing radiation, PRX1 was shown to interact with JNK to reduce its apoptotic activity,
thereby promoting cell survival [59]. Moreover, in response to thermal stress, PRX1 has
been shown to switch from being a peroxidase to acting as a protein chaperone that binds
to denatured proteins [60]. In fact, the same study reported that PRX1 bound to CS in
response to stress and prevented its denaturation and aggregation. As such, it is possible
that the increase in PRX1 in response to freezing is not only a systemic response to
combat AGE formation (as shown by decreasing levels during freezing) in the heart, but
also acts to inhibit apoptosis or protein denaturation/aggregation during stress.
Alternatively, although these antioxidant enzymes play roles in ROS detoxification,
under conditions of MRD, the cell must strictly but strategically allocate its available
energy to pro-survival processes only. Therefore, if other antioxidant enzymes with
similar functions are up regulated, then inducing the expression of peroxiredoxins might
not be necessary. Indeed, studies have reported that PRXs have overlapping
detoxification activities with glutathione peroxidases and catalases. Importantly, the
catalytic efficiency of PRXs (~105 M-1s-1) is substantially lower as compared to
glutathione peroxidases (108 M-1s-1) and catalases (106 M-1s-1) [61,62]. As such, it is

201
possible that wood frogs reduce or maintain the basal expression of certain antioxidant
enzymes in response to stress in favor of promoting the expression and activity of the
more potent ones.
Overexpression of ETS1 has previously been shown to coincide with decreased
expression of components of the mitochondrial electron transport chain including but not
limited to NDUFAB1, CYC1 and ATP5A1 [23,24]. Mitochondria are the powerhouse of
the cell and are central to energy metabolism under aerobic conditions. When oxygen
levels are plentiful in cells, the mitochondria pump protons across the mitochondrial
membrane; thereby generating a proton-motive force that allows F1F0-ATPase to generate
ATP from ADP [63]. However, under anerobic conditions the mitochondria become a
liability as they become the major producers of ROS. In such circumstances, the F1F0-
ATPase commits “cellular treason” to maintain the proton-motive force by hydrolyzing
ATP into ADP [63]; thereby limiting ATP availability in the cell when levels are already
scarce. As such, animals that tolerate low oxygen conditions (hypoxia or anoxia) must
limit ATP hydrolysis by either reducing the proton conductance of the inner
mitochondrial membrane or inhibiting the activity of F1F0-ATPase in order to survive
[63]. A study on mitochondria isolated from the skeletal muscle of hypoxic frogs reported
that due to decreased metabolic rates, the mitochondria exhibited a lower rate of proton
leakage without affecting proton conductance [64]. Moreover, mitochondria isolated
from anoxia tolerant frogs showed that although protein conductance was not altered in
response to anoxia, the F1F0-ATPase enzyme was greatly inhibited [63]. A decrease in
F1F0-ATPase activity was also reported in anoxic turtle brain, suggesting that this is an
adaptive response [65]. In the present study, exposure to freezing, anoxia or dehydration

202
did not affect the expression level of ATP5A1 (a component of the F1F0-ATPase
complex) (Figure 7), despite an increase in the DNA binding activity of ETS1 in response
to freezing and dehydration (Figure 5). Given that the F1F0-ATPase activity is
hypothesized to be reduced in wood frogs under oxygen deprived conditions as an
adaptive response, it is possible that F1F0-ATPase inhibition occurs at another level or
perhaps by PTMs under stress conditions. While possible, further investigation is
warranted to validate this hypothesis.
The current study demonstrated a very strong reduction in levels of NDUFAB1 in
response to freezing, anoxia and dehydration (Figure 7), which correlates with an
increase in DNA binding of active ETS1 in freezing and dehydration but not anoxia
(Figure 5). This protein plays a significant role in mitochondria by acting as an accessory
protein for complex I-III, not only by stabilizing these complexes, but by promoting the
synthesis of iron-sulfur centers needed in these subunits [27]. The importance of this
protein in promoting cardio-protection against ischemia-reperfusion injury was attributed
to its role in decreasing ROS production and stabilizing mitochondrial complexes [27].
While this is a protective response in stress intolerant animals, as discussed earlier,
hypoxia/anoxia tolerant animals greatly reduce the activity of their mitochondria as an
adaptive response to prevent disruption of the mitochondrial electrochemical gradient. As
such, a reduction of NDUFAB1 levels in wood frogs under stress conditions, that may be
mediated at the transcriptional level by ETS1-mediated promotor suppression, could
contribute to the suppression of mitochondrial activity. Moreover, NDUFAB1 is also
known as the mitochondrial acyl carrier protein and plays an essential role in
mitochondria fatty acid synthesis [66]. This pathway is responsible for generating lipoic

203
acid, a cofactor needed for the activity of several enzymes including but not limited to
pyruvate dehydrogenase, oxoacid dehydrogenase, and α-ketoglutarate dehydrogenase
[66]. Whereas the activity of pyruvate dehydrogenase has not been studied in wood frog
heart, freezing and anoxia exposure resulted in decreased pyruvate dehydrogenase
complex activity in wood frog liver, an action that was linked to the efforts to attenuate
glycolytic flux under these conditions, particularly when high rates of glycogenolysis
must be directed into glucose synthesis and export as the cryoprotectant [34]. As such, a
reduction in NDUFAB1 levels could play a role in suppressing the activity of the
pyruvate dehydrogenase complex under stress conditions.
A reduction in CYC1 protein levels was also seen in response to freezing and
dehydration (Figure 7) and correlates with the increase in DNA binding activity of ETS1
under the same conditions (Figure 5). This suggests that perhaps CYC1 transcription is
inhibited by ETS1. In complex III (cytochrome bc1 complex) electrons are accepted from
ubiquinol and are transferred to cytochrome c, a process that also allows the translocation
of protons across the inner mitochondrial membrane [67]. In this process, two electron
molecules are sequentially transferred to CYC1 via the Rieske iron-sulfur protein [67].
Theoretically, reduction or inhibition of the nuclear encoded mitochondrial genes could
reduce ROS production under oxygen limiting conditions [67]. For example, low levels
of cytochrome c would retain Rieske and CYC1 in their reduced forms, thereby
preventing further oxidation of ubiquinol and subsequently the generation of
ubisemiquinone, resulting in reduced ROS production at complex III. As such, the
reduction in CYC1 seen in this study is perhaps a regulatory mechanism by cells to
attenuate ROS generation in wood frogs. This hypothesis is plausible since the electron

204
transport chain has been reported to be in a more reduced form in response to stress in
other hypoxia/anoxia tolerant organisms [63,64].
ETS1 also plays a role in metabolism by regulating a set of genes involved in
glucose metabolism and uptake [23,24]. Interestingly, overexpression of ETS1 coincided
with reduction in CS levels under hypoxic conditions, but silencing of ETS1 reduced
levels of GLUT1 [23,24,30]. The current results show that levels of CS remained
unchanged in response to freezing and anoxia but decreased significantly in response to
dehydration (Figure 7). Although an increase in ETS1 DNA binding in response to
freezing should have, in theory, decreased levels of CS as was seen in response to
dehydration, it is possible that alternative regulatory mechanisms are involved in
regulating CS activity or expression. Indeed, studies have shown a reduction in CS
activity in response to anoxia in turtle brain [65], hypoxia in flour beetle [68], and
hibernation in skeletal muscle of bears [69]; all of these reflect a lower oxidative capacity
by the mitochondria. While the increase in active ETS1 DNA binding could potentially
explain the regulation of CS at the transcriptional level in response to dehydration, it
appears that CS protein levels and activity could be regulated at other stages downstream
of its transcription. Indeed, reversible protein posttranslational modifications are an
essential regulatory mechanism used to control enzymatic activity under hypometabolic
states [53] but validation of such additional controls on CS is required. Lastly, levels of
GLUT1 were greatly reduced in response to all three stresses in wood frog hearts (Figure
7), an outcome that also reflects active ETS1 DNA binding in response to freezing and
dehydration (but not anoxia) (Figure 5). The importance of glucose as a cryoprotective
and osmoprotective agent has been established in wood frogs in response to freezing and

205
dehydration [1,70]. As such, it is expected that wood frogs induce the expression of
glucose transporters in different tissues to promote the uptake of glucose. In fact, it has
been shown that transcript levels of glut4, a transporter that is expressed in multiple
tissues including the heart to accelerate glucose uptake, is significantly increased in
response to anoxia in wood frog skeletal muscle [71]. Protein levels of GLUT2 also
increase significantly in liver of wood frogs in response to freezing, hypoxia and glucose
loading [72], suggesting that perhaps each tissue induces the expression of a certain
GLUT in response to stress. Therefore, it is likely that levels of most or all GLUT
isoforms are modulated under stress conditions to support the needs for glucose transport.
In conclusion, current results show that ETS1 is potentially activated by the
HMGB1/RAGE axis. Moreover, enhanced DNA Binding activity by p-ETS1 T38 in
response to freezing and dehydration could result in activating/suppressing a network of
genes involved in the antioxidant response, mitochondrial energetics, and glucose
metabolism. These adaptive responses appear to promote cytoprotection in wood frog
heart that protects the tissue from freezing, anoxia, and dehydration stresses.
Acknowledgements
We thank J.M. Storey for editorial review of this manuscript. This study was
supported by a Discovery Grant from the Natural Sciences and Engineering Research
Council of Canada (Grant #6793). K.B.S. holds the Canadian Research Chair in
Molecular Physiology and R.A. holds an Ontario Graduate Scholarship.
206
4.6 References- Chapter 4
[1] K.B. Storey, J.M. Storey, Molecular physiology of freeze tolerance in vertebrates,
Physiol. Rev. 97 (2017) 623–665. https://doi.org/10.1152/physrev.00016.2016.
[2] K.B. Storey, J.M. Storey, Freeze tolerance in animals, Physiol. Rev. 68 (1988) 27–
84. https://doi.org/10.1152/physrev.1988.68.1.27.
[3] T.A. Churchill, K.B. Storey, Dehydration tolerance in wood frogs: A new
perspective on development of amphibian freeze tolerance, Am. J. Physiol. Integr.
Comp. Physiol. 265 (1993) R1324–R1332.
https://doi.org/10.1152/ajpregu.1993.265.6.R1324.
[4] C.P. Holden, K.B. Storey, Second messenger and cAMP-dependent protein kinase
responses to dehydration and anoxia stresses in frogs., J. Comp. Physiol. B. 167
(1997) 305–12. https://doi.org/10.1007/s003600050078.
[5] V.E.M. Gerber, S. Wijenayake, K.B. Storey, Anti-apoptotic response during
anoxia and recovery in a freeze-tolerant wood frog (Rana sylvatica)., PeerJ. 4
(2016) e1834. https://doi.org/10.7717/peerj.1834.
[6] J.M. Storey, K.B. Storey, In defense of proteins: Chaperones respond to freezing,
anoxia, or dehydration stress in tissues of freeze tolerant wood frogs, J. Exp. Zool.
Part A Ecol. Integr. Physiol. 331 (2019) 392–402. https://doi.org/10.1002/jez.2306.
[7] D.R. Joanisse, K.B. Storey, Oxidative damage and antioxidants in Rana sylvatica,
the freeze-tolerant wood frog., Am. J. Physiol. 271 (1996) R545-53.
https://doi.org/10.1152/ajpregu.1996.271.3.R545.
[8] T.J. Lyons, A.J. Jenkins, Glycation, oxidation, and lipoxidation in the development
of the complications of diabetes: A carbonyl stress hypothesis., Diabetes Rev.
(Alexandria, Va.). 5 (1997) 365–391.
[9] A.W. Stitt, J.E. Moore, J.A. Sharkey, G. Murphy, D.A.C. Simpson, R. Bucala, H.
Vlassara, D.B. Archer, Advanced glycation end products in vitreous: Structural
and functional implications for diabetic vitreopathy., Invest. Ophthalmol. Vis. Sci.
39 (1998) 2517–23. http://www.ncbi.nlm.nih.gov/pubmed/9856760.
[10] J.A. MacDonald, T. Degenhardt, J.W. Baynes, K.B. Storey, Glycation of wood
frog (Rana sylvatica) hemoglobin and blood proteins: In vivo and in vitro
studies, Cryobiology. 59 (2009) 223–225.
https://doi.org/10.1016/j.cryobiol.2009.06.008.
[11] A. Bierhaus, P.M. Humpert, M. Morcos, T. Wendt, T. Chavakis, B. Arnold, D.M.
Stern, P.P. Nawroth, Understanding RAGE, the receptor for advanced glycation
end products, J. Mol. Med. 83 (2005) 876–886. https://doi.org/10.1007/s00109-
005-0688-7.
[12] H. Yang, H. Wang, S.S. Chavan, U. Andersson, High mobility group box protein 1
(HMGB1): The prototypical endogenous danger molecule, Mol. Med. 21 (2015)
S6–S12. https://doi.org/10.2119/molmed.2015.00087.

207
[13] B. Lu, D.J. Antoine, K. Kwan, P. Lundback, H. Wahamaa, H. Schierbeck, M.
Robinson, M.A.D. Van Zoelen, H. Yang, J. Li, H. Erlandsson-Harris, S.S. Chavan,
H. Wang, U. Andersson, K.J. Tracey, JAK/STAT1 signaling promotes HMGB1
hyperacetylation and nuclear translocation, Proc. Natl. Acad. Sci. 111 (2014)
3068–3073. https://doi.org/10.1073/pnas.1316925111.
[14] J.S. Park, F. Gamboni-Robertson, Q. He, D. Svetkauskaite, J.-Y. Kim, D.
Strassheim, J.-W. Sohn, S. Yamada, I. Maruyama, A. Banerjee, A. Ishizaka, E.
Abraham, High mobility group box 1 protein interacts with multiple Toll-like
receptors., Am. J. Physiol. Cell Physiol. 290 (2006) C917-24.
https://doi.org/10.1152/ajpcell.00401.2005.
[15] C.-Z. Wu, J.-J. Zheng, Y.-H. Bai, P. Xia, H.-C. Zhang, Y. Guo, HMGB1/RAGE
axis mediates the apoptosis, invasion, autophagy, and angiogenesis of the renal cell
carcinoma., Onco. Targets. Ther. 11 (2018) 4501–4510.
https://doi.org/10.2147/OTT.S167197.
[16] K.B. Storey, Strategies for exploration of freeze responsive gene expression:
Advances in vertebrate freeze tolerance, Cryobiology. 48 (2004) 134–145.
https://doi.org/10.1016/j.cryobiol.2003.10.008.
[17] Y. Xu, F. Toure, W. Qu, L. Lin, F. Song, X. Shen, R. Rosario, J. Garcia, A.M.
Schmidt, S.F. Yan, Advanced glycation end product (AGE)-receptor for age
(RAGE) signaling and up-regulation of Egr-1 in hypoxic macrophages, J. Biol.
Chem. 285 (2010) 23233–23240. https://doi.org/10.1074/jbc.M110.117457.
[18] J.S. Chang, T. Wendt, W. Qu, L. Kong, Y.S. Zou, A.M. Schmidt, S.F. Yan,
Oxygen deprivation triggers upregulation of early growth response-1 by the
receptor for advanced glycation end products, Circ. Res. 102 (2008) 905–913.
https://doi.org/10.1161/CIRCRESAHA.107.165308.
[19] W.K. Wang, Q.H. Lu, J.N. Zhang, B. Wang, X.J. Liu, F.S. An, W.D. Qin, X.Y.
Chen, W.Q. Dong, C. Zhang, Y. Zhang, M.X. Zhang, HMGB1 mediates
hyperglycaemia-induced cardiomyocyte apoptosis via ERK/Ets-1 signalling
pathway, J. Cell. Mol. Med. 18 (2014) 2311–2320.
https://doi.org/10.1111/jcmm.12399.
[20] Z. Gao, G.H. Kim, A.C. Mackinnon, A.E. Flagg, B. Bassett, J.U. Earley, E.C.
Svensson, Ets1 is required for proper migration and differentiation of the cardiac
neural crest., Development. 137 (2010) 1543–51.
https://doi.org/10.1242/dev.047696.
[21] H. Pei, C. Li, Y. Adereth, T. Hsu, D.K. Watson, R. Li, Caspase-1 is a direct target
gene of ETS1 and plays a role in ETS1-induced apoptosis, Cancer Res. 65 (2005)
7205–7213. https://doi.org/10.1158/0008-5472.CAN-04-3566.
[22] M. Shiota, H. Izumi, N. Miyamoto, T. Onitsuka, E. Kashiwagi, A. Kidani, G.
Hirano, M. Takahashi, M. Ono, M. Kuwano, S. Naito, Y. Sasaguri, K. Kohno, Ets
regulates peroxiredoxin1 and 5 expressions through their interaction with the high-
mobility group protein B1, Cancer Sci. 99 (2008) 1950–1959.
208
https://doi.org/10.1111/j.1349-7006.2008.00912.x.
[23] M.L. Verschoor, L.A. Wilson, C.P. Verschoor, G. Singh, Ets-1 Regulates Energy
Metabolism in Cancer Cells, PLoS One. 5 (2010) e13565.
https://doi.org/10.1371/journal.pone.0013565.
[24] M.L. Verschoor, C.P. Verschoor, G. Singh, Ets-1 global gene expression profile
reveals associations with metabolism and oxidative stress in ovarian and breast
cancers, Cancer Metab. 1 (2013) 17. https://doi.org/10.1186/2049-3002-1-17.
[25] G. Mavrothalassitis, J. Ghysdael, Proteins of the ETS family with transcriptional
repressor activity, Oncogene. 19 (2000) 6524–6532.
https://doi.org/10.1038/sj.onc.1204045.
[26] D. Goldman, M.K. Sapru, S. Stewart, J. Plotkin, T.A. Libermann, B. Wasylyk, K.
Guan, Cloning and characterization of GETS-1, a goldfish Ets family member that
functions as a transcriptional repressor in muscle, Biochem. J. 335 (1998) 267–
275. https://doi.org/10.1042/bj3350267.
[27] T. Hou, R. Zhang, C. Jian, W. Ding, Y. Wang, S. Ling, Q. Ma, X. Hu, H. Cheng,
X. Wang, NDUFAB1 confers cardio-protection by enhancing mitochondrial
bioenergetics through coordination of respiratory complex and supercomplex
assembly, Cell Res. 29 (2019) 754–766. https://doi.org/10.1038/s41422-019-0208-
x.
[28] R. Zhang, T. Hou, H. Cheng, X. Wang, NDUFAB1 protects against obesity and
insulin resistance by enhancing mitochondrial metabolism, FASEB J. 33 (2019)
13310–13322. https://doi.org/10.1096/fj.201901117RR.
[29] R. Ni, D. Zheng, S. Xiong, D.J. Hill, T. Sun, R.B. Gardiner, G.-C. Fan, Y. Lu,
E.D. Abel, P.A. Greer, T. Peng, Mitochondrial calpain-1 disrupts ATP synthase
and induces superoxide generation in type 1 diabetic hearts: A novel mechanism
contributing to diabetic cardiomyopathy., Diabetes. 65 (2016) 255–68.
https://doi.org/10.2337/db15-0963.
[30] X. Zhang, D. Wu, M. Aldarouish, X. Yin, C. Li, C. Wang, ETS-1: A potential
target of glycolysis for metabolic therapy by regulating glucose metabolism in
pancreatic cancer, Int. J. Oncol. 50 (2017) 232–240.
https://doi.org/10.3892/ijo.2016.3770.
[31] D. Shao, R. Tian, Glucose transporters in cardiac metabolism and hypertrophy, in:
Compr. Physiol., John Wiley & Sons, Inc., Hoboken, NJ, USA, 2015: pp. 331–
351. https://doi.org/10.1002/cphy.c150016.
[32] Y. Zhang, R. Al-attar, K.B. Storey, TonEBP/NFAT5 regulates downstream
osmoregulatory proteins during freeze-thaw stress in the wood frog, Cryobiology.
79 (2017) 43–49. https://doi.org/10.1016/j.cryobiol.2017.09.003.
[33] R. Al-attar, Y. Zhang, K.B. Storey, Osmolyte regulation by TonEBP/NFAT5
during anoxia-recovery and dehydration–rehydration stresses in the freeze-tolerant
wood frog (Rana sylvatica), PeerJ. 5 (2017) e2797.

209
https://doi.org/10.7717/peerj.2797.
[34] R. Al-Attar, S. Wijenayake, K.B. Storey, Metabolic reorganization in winter:
Regulation of pyruvate dehydrogenase (PDH) during long-term freezing and
anoxia., Cryobiology. 86 (2019) 10–18.
https://doi.org/10.1016/j.cryobiol.2019.01.006.
[35] R. Al-Attar, K.B. Storey, Effects of anoxic exposure on the nuclear factor of
activated T cell (NFAT) transcription factors in the stress-tolerant wood frog., Cell
Biochem. Funct. 36 (2018) 420–430. https://doi.org/10.1002/cbf.3362.
[36] S.L. Eaton, S.L. Roche, M. Llavero Hurtado, K.J. Oldknow, C. Farquharson, T.H.
Gillingwater, T.M. Wishart, Total protein analysis as a reliable loading control for
quantitative fluorescent western blotting, PLoS One. 8 (2013) e72457.
https://doi.org/10.1371/journal.pone.0072457.
[37] J. Zhang, K.B. Storey, RBioplot: An easy-to-use R pipeline for automated
statistical analysis and data visualization in molecular biology and biochemistry,
PeerJ. 4 (2016) e2436. https://doi.org/10.7717/peerj.2436.
[38] J.M. Storey, K.B. Storey, β-Adrenergic, hormonal, and nervous influences on
cryoprotectant synthesis by liver of the freeze-tolerant wood frog Rana sylvatica,
Cryobiology. 33 (1996) 186–195. https://doi.org/10.1006/cryo.1996.0019.
[39] K.B. Storey, J.M. Storey, Biochemical adaption for freezing tolerance in the wood
frog, Rana sylvatica, J. Comp. Physiol. B. 155 (1984) 29–36.
https://doi.org/10.1007/BF00688788.
[40] J.R. Layne, R.E. Lee, T.L. Heil, Freezing-induced changes in the heart rate of
wood frogs (Rana sylvatica)., Am. J. Physiol. 257 (1989) R1046-9.
https://doi.org/10.1152/ajpregu.1989.257.5.R1046.
[41] C.P. Holden, K.B. Storey, Signal transduction, second messenger, and protein
kinase responses during freezing exposures in wood frogs, Am. J. Physiol. Integr.
Comp. Physiol. 271 (1996) R1205–R1211.
https://doi.org/10.1152/ajpregu.1996.271.5.R1205.
[42] E.M. Ellis, Reactive carbonyls and oxidative stress: Potential for therapeutic
intervention, Pharmacol. Ther. 115 (2007) 13–24.
https://doi.org/10.1016/j.pharmthera.2007.03.015.
[43] C.-W. Wu, S.N. Tessier, K.B. Storey, Stress-induced antioxidant defense and
protein chaperone response in the freeze-tolerant wood frog Rana sylvatica, Cell
Stress Chaperones. 23 (2018) 1205–1217. https://doi.org/10.1007/s12192-018-
0926-x.
[44] M. Hermes-Lima, K.B. Storey, Relationship between anoxia exposure and
antioxidant status in the frog Rana pipiens, Am. J. Physiol. Integr. Comp. Physiol.
271 (1996) R918–R925. https://doi.org/10.1152/ajpregu.1996.271.4.R918.
[45] A. Bundgaard, A.M. James, W. Joyce, M.P. Murphy, A. Fago, Suppression of
reactive oxygen species generation in heart mitochondria from anoxic turtles: The

210
role of complex I S -nitrosation, J. Exp. Biol. 221 (2018) jeb174391.
https://doi.org/10.1242/jeb.174391.
[46] A.I. Malik, K.B. Storey, Activation of antioxidant defense during dehydration
stress in the African clawed frog, Gene. 442 (2009) 99–107.
https://doi.org/10.1016/j.gene.2009.04.007.
[47] D. Yao, M. Brownlee, Hyperglycemia-induced reactive oxygen species increase
expression of the receptor for advanced glycation end products (RAGE) and
RAGE ligands, Diabetes. 59 (2010) 249–255. https://doi.org/db09-0801
[pii];10.2337/db09-0801 [doi].
[48] T.A. Leonard, B. Różycki, L.F. Saidi, G. Hummer, J.H. Hurley, Crystal structure
and allosteric activation of protein kinase C βII, Cell. 144 (2011) 55–66.
https://doi.org/10.1016/j.cell.2010.12.013.
[49] C. Rosse, M. Linch, S. Kermorgant, A.J.M. Cameron, K. Boeckeler, P.J. Parker,
PKC and the control of localized signal dynamics, Nat. Rev. Mol. Cell Biol. 11
(2010) 103–112. https://doi.org/10.1038/nrm2847.
[50] S.C. Greenway, K.B. Storey, Activation of mitogen-activated protein kinases
during natural freezing and thawing in the wood frog, Mol. Cell. Biochem. 209
(2000) 29–37. https://doi.org/10.1023/a:1007077522680.
[51] S.C. Greenway, K.B. Storey, Discordant responses of mitogen-activated protein
kinases to anoxia and freezing exposures in hatchling turtles, J. Comp. Physiol. B
Biochem. Syst. Environ. Physiol. 169 (1999) 521–527.
https://doi.org/10.1007/s003600050251.
[52] N. Qiao, C. Xu, Y.-X. Zhu, Y. Cao, D.-C. Liu, X. Han, Ets-1 as an early response
gene against hypoxia-induced apoptosis in pancreatic β-cells., Cell Death Dis. 6
(2015) e1650. https://doi.org/10.1038/cddis.2015.8.
[53] R. Al-Attar, K.B. Storey, Suspended in time: Molecular responses to hibernation
also promote longevity., Exp. Gerontol. 134 (2020) 110889.
https://doi.org/10.1016/j.exger.2020.110889.
[54] S.F. Yan, J. Lu, Y.S. Zou, J. Soh-Won, D.M. Cohen, P.M. Buttrick, D.R. Cooper,
S.F. Steinberg, N. Mackman, D.J. Pinsky, D.M. Stern, Hypoxia-associated
induction of early growth response-1 gene expression, J. Biol. Chem. 274 (1999)
15030–15040. https://doi.org/10.1074/jbc.274.21.15030.
[55] H. Li, T.K. Kundu, J.L. Zweier, Characterization of the magnitude and mechanism
of aldehyde oxidase-mediated nitric oxide production from nitrite, J. Biol. Chem.
284 (2009) 33850–33858. https://doi.org/10.1074/jbc.M109.019125.
[56] R. Rastaldo, P. Pagliaro, S. Cappello, C. Penna, D. Mancardi, N. Westerhof, G.
Losano, Nitric oxide and cardiac function, Life Sci. 81 (2007) 779–793.
https://doi.org/10.1016/j.lfs.2007.07.019.
[57] T.K. Kundu, M. Velayutham, J.L. Zweier, Aldehyde oxidase functions as a
superoxide generating NADH oxidase: An important redox regulated pathway of

211
cellular oxygen radical formation, Biochemistry. 51 (2012) 2930–2939.
https://doi.org/10.1021/bi3000879.
[58] A. Perkins, K.J. Nelson, D. Parsonage, L.B. Poole, P.A. Karplus, Peroxiredoxins:
Guardians against oxidative stress and modulators of peroxide signaling, Trends
Biochem. Sci. 40 (2015) 435–445. https://doi.org/10.1016/j.tibs.2015.05.001.
[59] Y.-J. Kim, W.-S. Lee, C. Ip, H.-Z. Chae, E.-M. Park, Y.-M. Park, Prx1 suppresses
radiation-induced c-Jun NH 2 -rerminal kinase signaling in lung cancer cells
through interaction with the glutathione S -transferase Pi/c-Jun NH 2 -terminal
kinase complex, Cancer Res. 66 (2006) 7136–7142. https://doi.org/10.1158/0008-
5472.CAN-05-4446.
[60] I. Hanukoglu, R. Rapoport, Routes and regulation of NADPH production in
steroidogenic mitochondria, Endocr Res. 21 (1995) 231–241.
[61] B. Hofmann, H.-J. Hecht, L. Flohé, Peroxiredoxins, Biol. Chem. 383 (2002) 347–
64. https://doi.org/10.1515/BC.2002.040.
[62] A. Hillar, B. Peters, R. Pauls, A. Loboda, H. Zhang, A.G. Mauk, P.C. Loewen,
Modulation of the activities of catalase−peroxidase HPI of Escherichia coli by site-
directed mutagenesis †, Biochemistry. 39 (2000) 5868–5875.
https://doi.org/10.1021/bi0000059.
[63] J. St-Pierre, M.D. Brand, R.G. Boutilier, Mitochondria as ATP consumers:
Cellular treason in anoxia, Proc. Natl. Acad. Sci. 97 (2000) 8670–8674.
https://doi.org/10.1073/pnas.140093597.
[64] J. St-Pierre, M.D. Brand, R.G. Boutilier, The effect of metabolic depression on
proton leak rate in mitochondria from hibernating frogs, J. Exp. Biol. 203 (2000)
1469–1476.
[65] M.E. Pamenter, C.R. Gomez, J.G. Richards, W.K. Milsom, Mitochondrial
responses to prolonged anoxia in brain of red-eared slider turtles, Biol. Lett. 12
(2016) 20150797. https://doi.org/10.1098/rsbl.2015.0797.
[66] S. Brody, C. Oh, U. Hoja, E. Schweizer, Mitochondrial acyl carrier protein is
involved in lipoic acid synthesis in Saccharomyces cerevisiae, FEBS Lett. 408
(1997) 217–220. https://doi.org/10.1016/S0014-5793(97)00428-6.
[67] R.D. Guzy, P.T. Schumacker, Oxygen sensing by mitochondria at complex III:
The paradox of increased reactive oxygen species during hypoxia, Exp. Physiol. 91
(2006) 807–819. https://doi.org/10.1113/expphysiol.2006.033506.
[68] L. Wang, S. Cui, Z. Liu, Y. Ping, J. Qiu, X. Geng, Inhibition of mitochondrial
respiration under hypoxia and increased antioxidant activity after reoxygenation of
Tribolium castaneum, PLoS One. 13 (2018) e0199056.
https://doi.org/10.1371/journal.pone.0199056.
[69] B. Chazarin, K.B. Storey, A. Ziemianin, S. Chanon, M. Plumel, I. Chery, C.
Durand, A.L. Evans, J.M. Arnemo, A. Zedrosser, J.E. Swenson, G. Gauquelin-
Koch, C. Simon, S. Blanc, E. Lefai, F. Bertile, Metabolic reprogramming

212
involving glycolysis in the hibernating brown bear skeletal muscle, Front. Zool. 16
(2019) 12. https://doi.org/10.1186/s12983-019-0312-2.
[70] T.A. Churchill, K.B. Storey, Metabolic responses to dehydration by liver of the
wood frog, Rana sylvatica, Can. J. Zool. 72 (1994) 1420–1425.
https://doi.org/10.1139/z94-188.
[71] M.P. Hoyeck, H. Hadj-Moussa, K.B. Storey, The role of MEF2 transcription
factors in dehydration and anoxia survival in Rana sylvatica skeletal muscle,
PeerJ. 5 (2017) e4014. https://doi.org/10.7717/peerj.4014.
[72] A.J. Rosendale, R.E. Lee, J.P. Costanzo, Effect of physiological stress on
expression of glucose transporter 2 in liver of the wood frog, Rana sylvatica, J.
Exp. Zool. Part A Ecol. Genet. Physiol. 321 (2014) 566–576.
https://doi.org/10.1002/jez.1885.

213
Figure
Figure 4.1: Schematic diagram representing physiological and molecular responses that
occur during metabolic rate depression in wood frogs. Illustration was created by
BioRender (https://biorender.com/).

214
Figure 4.2: Levels of AGE-adducts in wood frog heart in response to freezing, anoxia or
dehydration measured using a commercially available assay. Histogram shows mean ±
SEM of n=4 independent biological replicates from different frogs. Statistical
significance from the control is denoted by (*) (P<0.05) and was calculated using a one-
way ANOVA with a Dunnett post-hoc test.
Contr
ol
24 H
Fre
ezin
g
24 H
Anoxi
a
40%
Deh
ydra
tion
AG
E-a
dd
ucts
(µ
g/m
L)
0
1
2
3
4
5
6
*

215
Figure 4.3: Protein levels of upstream RAGE activators and downstream RAGE-
regulated targets measured using western blotting. For more information, please see
Figure 2.

216
Figure 4.4: Relative nuclear localization of ETS1 proteins in response to freezing, anoxia
or dehydration measured by western blotting in wood frog heart. For more information,
see Figure 4.2.

217
Figure 4.5: Relative DNA binding activity of p-ETS1 (T38) in response to freezing,
anoxia or dehydration in wood frog heart. For more information, see Figure 4.2.
Total E
TS1
p-ETS1
(T38)
Re
lati
ve D
NA
bin
din
g ac
tivi
ty
0.0
0.5
1.0
1.5
2.0
2.5
3.0
Control
24 H Freezing
24 H Anoxia
40% Dehydration
**
**

218
Figure 4.6: Schematic diagram showing the similarities between the ETS1 monomer
generated using the protein sequence of Xenopus tropicalis (NP_001123840_1) and
Humans (P14921.1). Using the online Phyre2 program, the ETS1 structure for Xenopus
tropicalis (A) and human (B) were predicted. Using Pymol, both figures were
superimposed (C) to show conservancy between the two structures. D) The Crystal
structure of ETS1 homodimer DNA complex was retrieved from the PDB protein data
bank (2nny), manipulated using Pymol.

219
Figure 4.7: Relative protein expression levels of select ETS1 downstream targets
measured by western blotting in wood frog heart. For more information, see Figure 4.2.

220
Figure S4.1: Alignment showing similarities between the ETS1 protein sequence of
Xenopus tropicalis (NP_001123840_1) and Humans (P14921.1), generated using Clustal
Omega. Conserved phosphorylation site T38 is shown in red.

221
Table S4.1: Shows different posttranslational modifications that could modulate ETS-1
activity. Confirmed phosphorylation site information was retrieved from
PhosphoSitePlus ® (https://www.phosphosite.org/). Potential SUMOylation and
acetylation sites on Xenopus laevis ETS-1 were predicted using the Bio CUCKOO
program (http://gps.biocuckoo.cn/).
Protein Modification Site
ETS1 Phosphorylation T38, T251, S257, S276, S282, Y283, S285
Acetylation K2, K89, K433
SUMOylating K14, K198, K224, K433

222
Chapter 5: General
discussion

223
5.1 General discussion
Harsh environmental conditions could be challenging to some animals living in
the wild. Extreme temperatures, limited food availability, or oxygen deprivation could
result in death. Animals that survive these unfavorable conditions do so by employing
sophisticated adaptive mechanisms that include responses at the physiological,
biochemical, and molecular levels. Of interest to this thesis was understanding the
molecular mechanisms behind vertebrate freezing tolerance by using the freeze-tolerant
wood frog, Rana sylvatica, as a model organism. Understanding the plasticity involved in
supporting survival under these conditions will increase our knowledge and could
potentially help in finding solutions to various medical complications such as diabetes,
ischemic stroke, or prolonging organ storage time before transplantations by designing
interventions that mimic those found in natural adaptive responses.
Freezing is a multifactorial stress, and requires adaptations to deal with
hyperglycemia, dehydration, and anoxia [1,2]. Each of these conditions are associated
with series of complications that if not dealt with appropriately could result in cell death.
For example, ice crystal growth could damage the lumen of the capillaries, leading to the
loss of vascular integrity, resulting in internal bleeding upon thawing [3,4]. Extreme
dehydration could also rupture cell membranes, and extreme increases in cytoplasmic
ionic strength could result in disruption in various cellular processes [5]. Prolonged
anoxia (or ischemia in case of freezing) deprives cells from oxygen, increases the levels
of reactive oxygen species (ROS), and prevents waste cleanup from organs. Moreover,
while accumulating large quantities of glucose as cryoprotectant is beneficial in cells,
glucose is prone to autooxidation and under conditions of oxidative stress, could result in

224
the formation of advanced glycation end products (AGEs) [6,7]. In addition to enduring
these stresses, recovery from each condition is also associated with potential damage,
chiefly an outburst of ROS production upon reperfusion, that must be mitigated to ensure
survival. The commonality amongst freezing, anoxia and dehydration stresses is the low
or absent availability of oxygen, which forces cells to switch from aerobic metabolism to
generating energy in an anaerobic manner. Although copious amounts of glucose are
available (especially under freezing or dehydration conditions, less so in response to
anoxia), the amount of energy generated anaerobically is far less than the amount
generated under aerobic conditions and cannot provide enough energy to sustain normal
metabolic rates. As such, wood frogs are hypothesized to reduce their metabolic rates to a
fraction of normal in a process called metabolic rate depression (MRD) to balance energy
production with energy utilization in their cells. While data on metabolic rates are scarce
for wood frogs, and extremely difficult to measure for frozen animals, other ectotherms
are known to show significant reductions in their overall metabolism in response to
anoxia. For example, adult turtles (Chrysemys picta belli) submerged in anoxic water at
3℃ reduce their metabolism by ~90% and survive for months by relying only on their
internal fuels [8]. Similarly, frogs that overwinter in ice-locked ponds, or toads or adult
frogs that live in arid regions in the world reduce their metabolism down to ~10% of their
normal rates, to deal with unfavorable environmental conditions [9,10]. Moreover, some
species of lizards (Lacerta vivipara) have also been reported to decrease their metabolic
rates drastically in response to freezing [11], although the accuracy of measuring
metabolic rates from a frozen organisms is debatable.

225
Regulation of MRD occurs at multiple biological levels in stress, tissue, and time
dependent manner. In chapter 2, regulation of autophagy was studied to document
responses to 24-hour anoxia, 4-hour reoxygenation, 40% dehydration, and full
rehydration in wood frog liver and skeletal muscle. Autophagy is an energy expensive,
catabolic process where defective or dysfunctional cytoplasmic organelles and
macromolecules are engulfed and degraded to generate metabolic substrates in response
to different stimuli [12]. There are conflicting studies on the benefits of autophagy in
response to different conditions. For example, it was shown that excessive autophagy in
hippocampal neurons in response to hypoxia/ischemia resulted in autophagic cell death,
and that inhibiting autophagy reversed this process [13]. Another study reported that
inhibition of autophagy exacerbated ischemia-induced liver damage, and induction of this
process reduced ROS levels and prevented necrotic cell death [14]. Not surprisingly,
activation of autophagy depends on the amount of energy available in the cell since this
process is highly energy expensive and requires the activation of numerous complexes; a
process that may not be possible in conditions under many environmental stress
conditions.
Autophagy is a multistage process that is divided into four phases: initiation,
nucleation, elongation, and fusion [15]. Each of these stages requires the formation of
complexes, and studies have used some of the proteins involved in these complexes as
markers of autophagic flux. The induction of these proteins depends on the activity of
specific transcription factors including but not limited to Transcription factor EB (TFEB)
[16,17]. Studies of this transcription factor revealed that TFEB binds to various genes
involved in autophagosome formation and lysosomal biogenesis and, therefore, for

226
autophagy to be active, this transcription factor must be active [16,17]. At the post-
transcriptional level, autophagy is also regulated by various microRNAs that strictly
regulate the translation of various mRNA transcripts encoding essential proteins involved
in the complexes used for autophagosome formation and lysosome formation [18]. At the
protein level, autophagy or lysosomal biogenesis are regulated by various post-
translational modifications (PTMs) [19]. Indeed, autophagosome formation is regulated
by the Unc-51 like autophagy activating kinase 1 (ULK1), which is either activated by
AMPK (AMP activated protein kinase)-mediated phosphorylation at S555 or inhibited by
mTOR (mechanistic target of rapamycin)-mediated phosphorylation at S758 [20,21].
Other components of autophagy (autophagy regulating proteins, ATGs) are also subject
to PTMs, namely phosphorylation, acetylation, ubiquitination and lipidation, where the
specificity of each PTM can dictate protein function [22,23]. In Chapter 2, regulation of
autophagy was investigated at the transcriptional level by studying the activity of TFEB,
at the post-transcriptional level by studying various autophagy regulating microRNAs
(autophagomiRs), and at the post-translational level by reversible protein
phosphorylation.
In general, exposure to anoxia or reoxygenation reduced the protein levels of the
majority of autophagy markers, with the exception of ULK1 where total levels as well as
levels of its active (p-ULK1 S555) and inactive (P-ULK1 S758) forms increased under
both conditions. Responses to dehydration showed different trends with levels of select
autophagy markers (p-beclin 1 S93), p62 and the LC3BII/I ratio increased significantly
compared to the control group. These changes were also accompanied by an increase in
total, active and inactive forms of ULK1 in the same tissue in response to dehydration.

227
Changes observed under anoxia/reoxygenation and dehydration/rehydration coincided
with the DNA binding activity of TFEB, a transcription factor that carries out the
transcription of numerous targets including, but not limited to, the transcription of p62.
However, despite an increase in the DNA binding levels of TFEB in response to anoxia
and dehydration, levels of ATPV0D1 (a lysosomal marker under TFEB control) remained
the same. Interestingly, control of autophagy at the post-transcriptional level showed a
tissue and stress-dependent regulation. For example, while only 2 microRNAs were
increased in response to anoxia in wood frog liver, the majority of the microRNAs
measured showed a decreasing trend in response to dehydration, a finding that correlates
with the increasing trends of their downstream targets under the same conditions.
Altogether these changes suggest that autophagosome formation in liver is greatly
attenuated in response to anoxia/reoxygenation (probably at the transcriptional level) but
responds to dehydration at the post-translational level. Responses to dehydration by liver
do suggest the formation of small numbers of autophagosomes, probably in an effort to
engulf and process damaged cytoplasmic cargo under stress, but the evidence suggests
that fusion with lysosomes is postponed until more favorable conditions arise.
Interestingly, the comparable analysis in skeletal muscle showed significant
reductions in most autophagosome and lysosome targets in response to
anoxia/reoxygenation as well as dehydration/rehydration, where total levels of ULK1
were significantly reduced in response to all conditions. Regulated reduction in protein
levels during anoxia/reoxygenation appears to occur at the transcriptional level, as
supported by the decrease in TFEB transcriptional activity in response to these
conditions. Indeed, it was reported that activation of EZH2 (enhancer of zeste homolog

228
2), a methyl transferase enzyme that inhibits gene expression by methylating promoter
regions, targets several autophagy genes and causes their silencing [24]. Likewise,
inactivation of EZH2 relieves that inhibition and induces the expression of several pro-
autophagy proteins including, but not limited to, ATG5 and ATG7 [24]. Moreover, the
arginine methyltransferase 1 (CRM1) was shown to induce autophagy by enhancing the
transcriptional activity of TFEB, thereby promoting the expression of autophagy and
lysosomal genes [25]. Studies of epigenetic regulation of anoxia and dehydration
tolerance in wood frogs are beginning to be evaluated; however, studies on other
hypometabolic models have demonstrated the involvement of epigenetics in regulating
multiple aspects of MRD, where markers that promote global gene suppression are
induced in response to stress [26–29]. Regulation of autophagy at the transcriptional level
in muscles from anoxic frogs is also supported by a general decrease in levels of
autophagomiRs. In theory, if the downstream targets are not transcribed, then no
regulation is required to inhibit their mRNA translation at the post-transcriptional level.
Results for skeletal muscle from dehydrated/rehydrated frogs showed a different
response. Whereas the DNA binding activity of TFEB did not change in response to
dehydration, it decreased significantly in response to rehydration, and combined with
decreases in protein levels of select downstream targets, this suggests that perhaps
regulation of autophagy occurs at the post-transcriptional level in this tissue. Indeed,
there was an overall increase in the expression of autophagomiRs in muscle from
dehydrated/rehydrated wood frogs, thereby further supporting the hypothesis that
microRNAs are in part responsible for reducing autophagic activities in muscle from
frogs exposed to dehydration/rehydration treatments.

229
Maintaining very low levels of autophagic flux or inhibiting autophagy all
together appears to be an appropriate response that supports MRD for many reasons.
First, autophagy is induced in response to multiple stimuli including but not limited to
nutrient deprivation or oxidative stress. As discussed, wood frogs experience no nutrient
limitations as they have access to high levels of glucose (more so during
dehydration/rehydration) during stress. Although the primary function of glucose is
cryoprotection, it could also be used for energy production when required. Moreover,
despite facing conditions that promote oxidative stress, wood frogs and other animals
capable of undergoing MRD, have higher levels of antioxidant enzymes, heat shock
proteins, and antioxidant metabolites [30–34]. In fact, a study demonstrated that freeze-
tolerant species such as Rana sylvatica, have higher basal levels of antioxidant enzymes
compared to a less stress-tolerant aquatic frog [34]. Moreover, there are no studies to date
that report any measurable damage in wood frogs following stress or recovery. As such,
even if faced with a surge in oxidants, the wood frog’s ability to launch an antioxidant
response renders it unassailable to oxidative damage.
Second, the induction of autophagosome formation and lysosomal biogenesis
requires a plethora of complexes that, although recyclable, are energetically expensive to
synthesize and maintain. Given that protein translation is greatly suppressed during MRD
[35], maintaining the translation of complexes involved in autophagy becomes extremely
energy expensive. Moreover, even if these proteins are translated adequately and in a
timely manner, most autophagy proteins depend on post-translational modifications for
activation. Indeed, acetylation (the conjugation of an acetyl group, donated from acetyl-
CoA, to a protein) plays a significant role in activating various autophagy proteins [36].

230
Pyruvate dehydrogenase, the enzyme complex that generates acetyl-CoA, is significantly
inhibited during freezing and anoxia in wood frogs [37]. This reduction depletes the cell
of its pool of free acetyl-CoA molecules to use for activating various autophagy proteins
and, thus, provides another line of evidence that autophagy is significantly reduced under
stress conditions. Third, some animals capable of undergoing MRD have been reported to
have higher basal autophagic flux, that could partly be responsible for stress survival
[38]. While more studies are warranted, it is possible that wood frogs also have higher
basal levels of autophagy compared to non-stress tolerant frogs. A significant reduction
in autophagic flux appears to be a pro-survival mechanism used by wood frogs in
response to anoxia/reoxygenation, dehydration and rehydration treatments. Altogether,
results in Chapter 2 support the first hypothesis proposed in this thesis; that,
autophagosome formation and lysosomal biogenesis is greatly attenuated in response to
stress in wood frogs, and the degree of this attenuation occurs in a tissue and stress
dependent manner.
In Chapter 3, the involvement of RAGE in regulating transcriptional responses to
angiogenesis (the formation of new blood vessels sprouting from pre-existing ones) was
studied in liver of wood frogs exposed to 24-hour freezing, 8-hour thawing, 24-hour
anoxia, 4-hour aerobic recovery, 40% dehydration and full rehydration. Freezing,
thawing, dehydration and or rehydration treatments could potentially rupture capillaries,
resulting in loss of vascular integrity in wood frog organs. Moreover, although protective
mechanisms are put in place, the presence of ice crystals in the extracellular spaces (such
as the lumen of capillaries) could result in tissue damage during freezing and excessive
bleeding upon recovery. In addition, forming new blood vesicles early in response to

231
stress could also potentially help with the distribution of glucose from the liver to all
other organs in the body. In addition, numerous studies have reported the benefits of
activating angiogenesis in response to stress. For example, induction of angiogenesis in
hearts exposed to ischemic stress or in response to tissue injury reduced the progression
of cardiac infarction and accelerated wound healing [39,40]. As such, it was of interest to
determine whether angiogenesis occurs in wood frogs, and if so, what molecular
mechanisms regulate this process.
As mentioned earlier, freezing, thawing, dehydration, and rehydration (and to a
lesser degree anoxia and reoxygenation) are hyperglycemic events, and wood frogs
generate large quantities of glucose to use as a cryo- or osmo-protectant under these
conditions [5,41]. However, despite offering protective benefits, excessive glucose levels
in presence of oxidative stress results in the production and accumulation of AGEs [6,7].
Indeed, a previous study in our laboratory showed that whereas levels of glycated serum
albumin did not change in response to freezing, levels had increased significantly 7 days
post-thawing [42]. Another protein that is involved in regulating angiogenesis is the high
mobility group box 1 (HMGB1) [43]. Under normal conditions, this non-histone, DNA-
binding protein resides in the nucleus, but upon stimulation, it becomes acetylated and is
exported into the cytoplasm [44]. In the cytoplasm, HMGB1 can regulate various
processes, including autophagy, by binding to and activating Beclin 1 [45]. Indeed, the
unchanged levels of acetylated HMGB1 seen in Chapter 3 in response to anoxia,
reoxygenation, dehydration, and rehydration correlates with low levels of Beclin 1
activation, and ultimately a reduction in autophagosome formation in liver of wood frogs
as seen in Chapter 2. Once in the cytoplasm, acetylated HMGB1 will associate with

232
secretory vesicles and get transported into the extracellular space where it can associate
with different receptors including the receptor for AGE (RAGE) [46]. Association of
AGE and HMGB1 results in the activation of RAGE and subsequent signal transduction
events that lead to the expression and activation of the early growth response 1 (EGR1)
and the E26 transformation-specific sequence 1 (ETS1) transcription factors [47,48].
These transcription factors regulate numerous genes, including various pro- and anti-
angiogenic targets.
Results from Chapter 3 demonstrate that AGE generation is greatly reduced in
response to freezing, thawing, anoxia, and dehydration, probably owning to the strong
activation of potent antioxidant responses under these conditions in wood frogs. Indeed,
numerous studies have demonstrated the up regulation of various antioxidant enzymes
including, but not limited to, aldo-keto reductases and glutathione S-transferases, as well
as antioxidant metabolites in response to stress in wood frogs [33,34,49]. These enzymes
have been shown to promote AGE clearance and prevent the accumulation of AGE-
adducts in the cell [50]. Although low, the presence of these adducts could still result in
the activation of RAGE. In Chapter 3, protein levels of RAGE were shown to be
strongly induced in response to freezing, anoxia, reoxygenation, dehydration and
rehydration in wood frog liver. Together, results in Chapter 3 demonstrate the potential
activation of RAGE signaling under stress conditions, which prompted further
investigation of angiogenesis.
The results presented in this thesis show that the nuclear levels and DNA binding
activity of ETS1 and EGR1 are regulated in a stress-dependent manner. For example,

233
while the nuclear levels of ETS1 were upregulated in response to freezing, anoxia,
dehydration, and rehydration, EGR1 levels were upregulated only in response to freezing
and thawing. Moreover, two transcriptional repressors of EGR1, NAB1 (NGFI-A
binding-1, constitutive) and NAB2 (inducible), also appeared to be localized to the
nucleus in a stress-dependent manner. Whereas promoting the nuclear localization of a
transcription factor along with its inhibitor may seem counterintuitive, it may be a
strategic response by wood frogs. This is because wood frogs, along with many animals
that undergo MRD, induce the expression of essential and pro-survival factors necessary
for long term stress survival or in response to stages of recovery, before the full onset of
stress when energy levels are high. However, wood frogs also have mechanisms that
allow them to maintain the activity of these factors at minimum until they are required in
the cell. Indeed, the transcriptional responses controlled by ETS1 and EGR1 also
demonstrate this phenomenon, more so in response to freezing and dehydration. For
example, angiopoietin 1 (ANGPT1) and ANGPT2 are two important factors that regulate
angiogenesis by associating with receptors Tie1 and Tie2 [51,52]. However, whereas
ANGPT1 promotes vascular remodeling, vascular enlargement, and endothelial cell (EC)
migration, and stabilization of newly formed vasculature, ANGPT2 promotes vascular
destabilization, enhances sprouting and disrupts the recruitment of pericytes, thereby
preventing the stabilization of the vasculature [51,53]. Whereas both ANGPTs are needed
for angiogenesis, their presence should be regulated in an inverse manner to first promote
vascular destabilization and sprouting during the initiation of angiogenesis (ANGPT2),
and then promote vascular remodeling, EC migration and vascular stabilization at the end
of angiogenesis (ANGPT1). Wood frogs upregulate both factors in anticipation of

234
potential damage in response to freezing and dehydration but less so in response to
anoxia treatment. Indeed, dehydration and freezing and their respective recoveries could
result in architectural damage to capillaries or cause tissue injury. Therefore, having both
these factors available can enable frogs to use them as necessary whenever needed. Other
angiogenic factors such as VEGFR1 (vascular endothelial growth factor receptor 1) and
VE-cad (vascular endothelial cadherin) are also regulated in the same manner. The
angiogenic responses by ETS1 and EGR1 appear to be regulated in a temporal manner,
where the induction of downstream angiogenic factors appear to occur before the full
onset of stress in anticipation to potential damage that may occur during/after stress or in
early stages of recovery. Altogether, results shown in Chapter 3 demonstrate the
potential involvement of the HMGB1/RAGE axis in inducing and activating
transcriptional responses by ETS1 and EGR1 in a time- and stress-dependent manner,
resulting in the induction of both pro- and anti-angiogenic factors in wood frogs. These
findings support the original hypothesis, where temporal induction of angiogenesis as a
preparative response may be necessary to repair damaged capillaries or promote wound
healing in wood frogs, particularly after a prolonged freezing bout.
In Chapter 4, the involvement of RAGE signaling in inducing ETS1 activation
was examined in wood frog heart after exposure to 24-hour freezing, 24-hour anoxia or
40% dehydration. In addition to regulating angiogenesis, ETS1 also regulates the
expression of other genes encoding various antioxidant enzymes, components of the
mitochondrial electron transport chain, glucose uptake and energy metabolism [54–57].
As a transcriptional activator, ETS1 was shown to promote the expression of aldehyde
oxidase 1 (AOX1), peroxiredoxin 1, (PRX1), PRX5, glucose transporter 1 (GLUT1) [54–

235
56]. Interestingly, in addition to its role as a transcriptional activator, ETS1 can also act
as a transcriptional repressor of several downstream genes [58,59]. For example, studies
have shown that induction of ETS1 resulted in the downregulation of select nuclear-
encoded mitochondrial genes such as the NADH dehydrogenase (ubiquinone 1) α/β
subcomplex 1 (NDUFAB1), cytochrome c1 (CYC1), and ATP synthase H+ transporting
mitochondrial F1 complex, α subunit 1 cardiac muscle (ATP5A1) [55,56]. Mitochondria
are the powerhouse of the cell and are responsible for generating the majority of ATP
available under aerobic conditions. However, when oxygen is scarce, mitochondria
become a liability to cells since they become the major producers of ROS. Under these
conditions, the F1F0-ATPase commits “cellular treason” and uses a portion of the
available ATP to maintain the proton-motive force in the cell [60]. As such, animals that
survive under oxygen-deprived conditions have adapted a mechanism that allows them to
limit ATP hydrolysis by inhibiting the activity of the F1F0-ATPase, or by reducing
proton conductance of the inner mitochondrial membrane [60]. Indeed, the activity of
F1F0-ATPase was shown to be significantly reduced in brains of anoxic turtles [61], and
in mitochondria isolated from frogs exposed to anoxia [60]. Therefore, it is possible that
this inhibition can be at least partially traced to the transcriptional level via down-
regulation of the transcription of nuclear encoded mitochondrial proteins.
In Chapter 3, the involvement of HMGB/AGE/RAGE axis in activating ETS1
was investigated in wood frog liver and in Chapter 4, the involvement of the same
pathway in inducing the activity of ETS1 was examined in the heart of wood frogs. A
preliminary study by our group, using cDNA arrays, demonstrated that exposure to
freezing induced the expression of RAGE in wood frog hearts [1]. Hearts from freeze or

236
dehydration exposed frogs accumulate large quantities of glucose, as such, they are also
prone to accumulating large quantities of AGEs and AGE-adducts. Results in Chapter 4
demonstrate that AGE levels are reduced in response to freezing but are unaffected by
exposure to anoxia or dehydration. Moreover, both total protein and acetylated HMGB1
levels were elevated in response to all treatment conditions, which coincides with the
same increasing trends seen in RAGE protein levels. These results indicate that HMGB1,
and to a lesser degree AGE, could induce a RAGE-mediated response. However,
investigation into downstream targets of RAGE that function upstream of ETS1
activation demonstrated two things: (1) ETS1 phosphorylation in response to dehydration
may be mediated by the canonical way of RAGE/ETS1 pathway activation, and (2) ETS1
activation may be regulated in a temporal manner by alternative factors in response to
freezing and anoxia. Regardless of the activation mode, results in Chapter 4
demonstrated that both total ETS1 and the active form (p-ETS1 T38) show strong DNA
binding activity in response to freezing and dehydration but not in response to anoxia
treatment. This pattern of activation correlated well with the expression patterns of
AOX1 under the same conditions. However, in this case, ETS1 appears to act as a
transcriptional repressor to AOX1. This is not surprising, given the role of AOX1 in
inducing the production of superoxide anions, reactive nitrogen species, and ROS in the
cell [62]. Therefore, to eliminate the production of these prooxidant species, it is logical
for wood frogs to use ETS1 as a transcriptional repressor to prevent the expression of
AOX1 in the heart in an effort to reduce oxidative damage. It appears that ETS1 induced
the expression of PRX1 in response to freezing but not anoxia or dehydration. In
addition, PRX5 expression patterns were not affected by ETS1 activation, and in fact

237
were reduced in response to dehydration. Under metabolically depressed states, it is
possible that cells would prioritize the production of more potent antioxidant enzymes in
larger quantities, rather than activating less potent ones such as PRX5. In response to all
three conditions, ETS1 appears to reduce the expression of NDUFAB1 and CYC1; which
correlate with results presented in other published studies. These two proteins are
components of the electron transport chain, and given that the activity of the electron
transport chain is greatly reduced in response to low oxygen levels, it is logical to assume
that decreasing the transcription of these subunits by ETS1 is a protective response
initiated by wood frogs. However, increased DNA binding of ETS1 in response to
freezing and dehydration had no effect on the expression profile of ATP5A1, a
component of the F1F0-ATPase complex. Given that previous studies on anoxic frogs
report significant reduction in the activity of this complex, it is possible that wood frogs
attenuate its activity downstream of its transcription, potentially at the post-translational
level by PTMs. Similarly, overexpression of ETS1 should inhibit the expression citrate
synthase (CS) [55,56]. In Chapter 4, it was demonstrated that activation of ETS1 resulted
in a reduction of CS expression only in response to dehydration and had no effect on its
expression in response to freezing despite an increase in ETS1 DNA binding activity
observed under the same condition. This demonstrated that CS could be potentially
regulated at the post-translational level in wood frogs, downstream of ETS1 activation.
Lastly, the increase in ETS1 DNA binding should have increased the expression of
GLUT1, but the opposite was observed; when DNA binding levels of ETS1 increased,
levels of GLUT1 decreased. As mentioned earlier, under a hypmetabolic state when
energy levels are limited, inducing the expression of more potent proteins that do a

238
similar job is favored over inducing the expression of similar targets with lower activity
levels. As such, given that transcript levels of glut4 were induced in the heart, then it may
be unnecessary for wood frogs to alter the expression of GLUT1 if its function is similar
to another highly expressed transporter [63]. Therefore, while ETS1 could have in theory
activated GLUT1, it is possible that in the case of wood frogs, it acted as a transcriptional
repressor to prevent the expression of GLUT1 in the heart to conserve energy. While
these assumptions are logical, further experiments are needed to confirm these
suggestions. Altogether, results in Chapter 4 partly support the original hypothesis
where ETS1 was proposed to act as a transcriptional activator of some antioxidant
enzymes, but act as a transcriptional repressor of select nuclear-encoded mitochondrial
proteins, antioxidant enzymes, and metabolic targets.
5.2 Future directions
While this thesis provides a comprehensive overview on the regulation of several
signaling pathways in wood frogs in response to freezing, anoxia or dehydration, along
with the respective recoveries from these stresses, further experiments could provide a
more definitive answer to the proposed hypotheses. First, the results of Chapter 2 clearly
demonstrate a significant reduction in autophagosome formation and lysosomal
biogenesis in response to anoxia/reoxygenation and to a lesser degree in response to
dehydration and rehydration in liver, and in response to both anoxia/reoxygenation and
dehydration/rehydration in skeletal muscle. However, visualizing the numbers of
autophagic vacuoles formed could provide a more definitive answer to autophagic flux
under these conditions. For example, whereas our results indicate a significant reduction,
the levels of the proteins involved in both autophagosome formation and lysosomal

239
biogenesis are not fully depleted. As such, it is still possible for cells to maintain a low
level of autophagic flux to clear engulfed cargo. Therefore, visualizing different stages of
autophagosome formation using transmission electron microscopy (TEM) would provide
more information about autophagic flux in wood frogs. This method has been widely
used in autophagy research to detect different autophagic compartments in cells [38,64].
Although identifying autophagic vacuoles is extremely difficult and requires a well-
trained individual, using this method as compared to other microscopy methods is
preferred because it does not require the utilization of highly specific antibodies, which
may not be commercially available or specific to frogs. In combination with the current
results shown in Chapter 2, having TEM data would add another layer of confidence in
assuming that autophagic flux is either inhibited or occurs at very low levels in wood
frogs exposed to stress.
Given that the wood frogs are currently not genome sequenced, it is extremely
difficult to detect the transcript levels of select downstream markers. Although proteins
are the functional units of the cell, having the transcript levels would enable us to
determine the biological level at which these targets are being regulated. This may soon
be a possibility since the wood frog genome is currently being sequenced. Having a
comprehensive list of all targets regulated by certain transcription factors would be
useful, because it will allow researchers to investigate how a given pathway is regulated
at the transcriptional level and whether a defect in transcription is responsible for
downstream events. As such, chromatin immunoprecipitation and subsequent massive
parallel sequencing (ChIP-seq) can be used to generate a genome-wide map of gene
promotor regions that are occupied by specific transcription factors studied in this thesis

240
(TFEB, ETS1 and EGR1) [65]. In combination with transcription factor localization
studies, DNA binding activity and measurement of protein levels of select targets, ChIP-
seq data can provide insightful information on whether the targets of interest are
regulated at the transcriptional level by the transcription factor in question. Combining
the ChIP-seq data from ETS1 and measuring the transcript levels of select downstream
genes would provide more information on whether ETS1 acts as a transcriptional
activator or a transcriptional repressor to these targets. Moreover, the obtained ChIP-seq
information could provide insight into novel gene promotors that are being occupied by a
specific transcription factor; thereby creating new avenues for future research.
Lastly, as demonstrated by target prediction programs in Chapter 4, ETS1 (and
other transcription factors) can be post-translationally modified, and the identity of these
modifications can affect the intracellular localization and the transcriptional activity of
this transcription factor. Immunoprecipitation (IP) is a relatively easy and cost-effective
way of purifying a specific protein from a sample using commercially available
antibodies [66]. Combining the IP products with western blotting using pan antibodies
that detect various modifications reported by the prediction software (e. g. methylation,
nitrosylation, acetylation, ubiquitination, SUMOylation, etc) could provide a general idea
of the identity and the relative levels of these modifications on ETS1 in response to
stress. Moreover, using the same IP products to measure the DNA binding levels of a
given transcription factor by utilizing an antibody that detects a specific PTM, could in
theory give information on whether this modification has a role in regulating the DNA
binding activity of the transcription factor in question. Altogether, performing these
simple experiments could lead to finding novel PTMs for a given transcription factor, and

241
increase our understanding of the various modifications used by wood frogs to regulate
enzymatic activities in response to stress.
5.3 Concluding remarks
In conclusion, the findings in this thesis provide novel information on the regulatory
mechanisms involved in controlling autophagy, angiogenesis, energy metabolism and
select antioxidant defense responses in wood frogs exposed to environmental stress. With
regards to autophagy, the results show that autophagosome formation and lysosomal
biogenesis is greatly attenuated in response to anoxia/reoxygenation and to a lesser
degree in response to dehydration and rehydration in liver, whereas greater inhibition of
these two processes in response to anoxia/reoxygenation and dehydration/rehydration
was seen in skeletal muscle. Moreover, current results also show that angiogenesis is
regulated in a temporal and stress-dependent manner, where wood frogs increase the
expression of certain pro- and anti-angiogenic factors in anticipation of potential damage
to capillaries or injuries in tissues. Lastly, results in this thesis also show that reduction in
the activity of the electron transport chain could be regulated, in part, at the
transcriptional level, where increased ETS1 DNA binding would inhibit the expression of
nuclear encoded mitochondrial proteins. Similarly, activation of ETS1 also results in
inhibition of enzymes involved in ROS production, while promoting the expression of
antioxidant enzymes that alleviate this process. Overall, findings in this study
demonstrate the highly regulated and extremely sophisticated mechanisms involved in
controlling metabolic rate depression and stress survival in wood frogs.

242
5.4 References- Chapter 5
[1] K.B. Storey, Strategies for exploration of freeze responsive gene expression:
Advances in vertebrate freeze tolerance, Cryobiology. 48 (2004) 134–145.
https://doi.org/10.1016/j.cryobiol.2003.10.008.
[2] K.B. Storey, J.M. Storey, Freeze tolerant frogs: Cryoprotectants and tissue
metabolism during freeze–thaw cycles, Can. J. Zool. 64 (1986) 49–56.
https://doi.org/10.1139/z86-008.
[3] K.B. Storey, J.M. Storey, Physiology, biochemistry and molecular biology of
vertebrate freeze tolerance: The wood frog, in: B.J. Fuller, N. Lane, E.E. Benson
(Eds.), Life a Frozen State, CRC Press, Boca Raton, 2004: pp. 243–274.
[4] K.B. Storey, J.M. Storey, Molecular physiology of freeze tolerance in vertebrates,
Physiol. Rev. 97 (2017) 623–665. https://doi.org/10.1152/physrev.00016.2016.
[5] T.A. Churchill, K.B. Storey, Dehydration tolerance in wood frogs: A new
perspective on development of amphibian freeze tolerance, Am. J. Physiol. Integr.
Comp. Physiol. 265 (1993) R1324–R1332.
https://doi.org/10.1152/ajpregu.1993.265.6.R1324.
[6] A.W. Stitt, J.E. Moore, J.A. Sharkey, G. Murphy, D.A.C. Simpson, R. Bucala, H.
Vlassara, D.B. Archer, Advanced glycation end products in vitreous: Structural
and functional implications for diabetic vitreopathy., Invest. Ophthalmol. Vis. Sci.
39 (1998) 2517–23. http://www.ncbi.nlm.nih.gov/pubmed/9856760.
[7] M. Fournet, F. Bonté, A. Desmoulière, Glycation damage: A possible hub for
major pathophysiological disorders and aging, Aging Dis. 9 (2018) 880.

243
https://doi.org/10.14336/AD.2017.1121.
[8] C. V. Herbert, D.C. Jackson, Temperature effects on the responses to prolonged
submergence in the turtle Chrysemys picta bellii. II. Metabolic rate, blood acid-
base and ionic changes, and cardiovascular function in aerated and anoxic water,
Physiol. Zool. 58 (1985) 670–681.
https://doi.org/10.1086/physzool.58.6.30156071.
[9] P.H. Donohoe, T.G. West, R.G. Boutilier, Respiratory, metabolic, and acid-base
correlates of aerobic metabolic rate reduction in overwintering frogs, Am. J.
Physiol. Integr. Comp. Physiol. 274 (1998) R704–R710.
https://doi.org/10.1152/ajpregu.1998.274.3.R704.
[10] K.B. Storey, Life in the slow lane: Molecular mechanisms of estivation., Comp.
Biochem. Physiol. A. Mol. Integr. Physiol. 133 (2002) 733–54.
https://doi.org/10.1016/S1095-6433(02)00206-4.
[11] Y. Voituron, B. Verdier, C. Grenot, The respiratory metabolism of a lizard
(Lacerta vivipara) in supercooled and frozen states, Am. J. Physiol. Integr. Comp.
Physiol. 283 (2002) R181–R186. https://doi.org/10.1152/ajpregu.00378.2001.
[12] Z. Zhang, M. Guo, S. Zhao, W. Xu, J. Shao, F. Zhang, L. Wu, Y. Lu, S. Zheng,
The update on transcriptional regulation of autophagy in normal and pathologic
cells: A novel therapeutic target, Biomed. Pharmacother. 74 (2015) 17–29.
https://doi.org/10.1016/j.biopha.2015.06.003.
[13] M. Koike, M. Shibata, M. Tadakoshi, K. Gotoh, M. Komatsu, S. Waguri, N.
Kawahara, K. Kuida, S. Nagata, E. Kominami, K. Tanaka, Y. Uchiyama,

244
Inhibition of autophagy prevents hippocampal pyramidal neuron death after
hypoxic-ischemic injury, Am. J. Pathol. 172 (2008) 454–469.
https://doi.org/10.2353/ajpath.2008.070876.
[14] K. Sun, X. Xie, Y. Liu, Z. Han, X. Zhao, N. Cai, S. Zhang, J. Song, L. Wei,
Autophagy lessens ischemic liver injury by reducing oxidative damage, Cell
Biosci. 3 (2013) 26. https://doi.org/10.1186/2045-3701-3-26.
[15] C. He, D.J. Klionsky, Regulation mechanisms and signaling pathways of
autophagy, Annu. Rev. Genet. 43 (2009) 67–93. https://doi.org/10.1146/annurev-
genet-102808-114910.
[16] M. Palmieri, S. Impey, H. Kang, A. di Ronza, C. Pelz, M. Sardiello, A. Ballabio,
Characterization of the CLEAR network reveals an integrated control of cellular
clearance pathways, Hum. Mol. Genet. 20 (2011) 3852–3866.
https://doi.org/10.1093/hmg/ddr306.
[17] M. Sardiello, M. Palmieri, A. di Ronza, D.L. Medina, M. Valenza, V.A.
Gennarino, C. Di Malta, F. Donaudy, V. Embrione, R.S. Polishchuk, S. Banfi, G.
Parenti, E. Cattaneo, A. Ballabio, A Gene Network Regulating Lysosomal
Biogenesis and Function, Science (80-. ). (2009).
https://doi.org/10.1126/science.1174447.
[18] L.B. Frankel, A.H. Lund, MicroRNA regulation of autophagy, Carcinogenesis. 33
(2012) 2018–2025. https://doi.org/10.1093/carcin/bgs266.
[19] Y. Xie, R. Kang, X. Sun, M. Zhong, J. Huang, D.J. Klionsky, D. Tang,
Posttranslational modification of autophagy-related proteins in macroautophagy,

245
Autophagy. 11 (2015) 28–45. https://doi.org/10.4161/15548627.2014.984267.
[20] W. Tian, W. Li, Y. Chen, Z. Yan, X. Huang, H. Zhuang, W. Zhong, Y. Chen, W.
Wu, C. Lin, H. Chen, X. Hou, L. Zhang, S. Sui, B. Zhao, Z. Hu, L. Li, D. Feng,
Phosphorylation of ULK1 by AMPK regulates translocation of ULK1 to
mitochondria and mitophagy, FEBS Lett. 589 (2015) 1847–1854.
https://doi.org/10.1016/j.febslet.2015.05.020.
[21] L. Shang, S. Chen, F. Du, S. Li, L. Zhao, X. Wang, Nutrient starvation elicits an
acute autophagic response mediated by Ulk1 dephosphorylation and its subsequent
dissociation from AMPK, Proc. Natl. Acad. Sci. 108 (2011) 4788–4793.
https://doi.org/10.1073/pnas.1100844108.
[22] D.G. McEwan, I. Dikic, The three musketeers of autophagy: Phosphorylation,
ubiquitylation and acetylation, Trends Cell Biol. 21 (2011) 195–201.
https://doi.org/10.1016/j.tcb.2010.12.006.
[23] T. Hanada, N.N. Noda, Y. Satomi, Y. Ichimura, Y. Fujioka, T. Takao, F. Inagaki,
Y. Ohsumi, The Atg12-Atg5 conjugate has a novel E3-like activity for protein
lipidation in autophagy, J. Biol. Chem. 282 (2007) 37298–37302.
https://doi.org/10.1074/jbc.C700195200.
[24] R. Li, X. Yi, X. Wei, B. Huo, X. Guo, C. Cheng, Z.-M. Fang, J. Wang, X. Feng, P.
Zheng, Y.-S. Su, J.F. Masau, X.-H. Zhu, D.-S. Jiang, EZH2 inhibits autophagic
cell death of aortic vascular smooth muscle cells to affect aortic dissection, Cell
Death Dis. 9 (2018) 180. https://doi.org/10.1038/s41419-017-0213-2.
[25] H.-J.R. Shin, H. Kim, S. Oh, J.-G. Lee, M. Kee, H.-J. Ko, M.-N. Kweon, K.-J.

246
Won, S.H. Baek, AMPK–SKP2–CARM1 signalling cascade in transcriptional
regulation of autophagy, Nature. 534 (2016) 553–557.
https://doi.org/10.1038/nature18014.
[26] R. Al-Attar, K.B. Storey, Suspended in time: Molecular responses to hibernation
also promote longevity., Exp. Gerontol. 134 (2020) 110889.
https://doi.org/10.1016/j.exger.2020.110889.
[27] L.J. Hawkins, K.B. Storey, Histone methylation in the freeze-tolerant wood frog
(Rana sylvatica), J. Comp. Physiol. B. 188 (2018) 113–125.
https://doi.org/10.1007/s00360-017-1112-7.
[28] J. Zhang, L.J. Hawkins, K.B. Storey, DNA methylation and regulation of DNA
methyltransferases in a freeze-tolerant vertebrate, Biochem. Cell Biol. (2019) 1–9.
https://doi.org/10.1139/bcb-2019-0091.
[29] S.N. Tessier, B.E. Luu, J.C. Smith, K.B. Storey, The role of global histone post-
translational modifications during mammalian hibernation, Cryobiology. 75 (2017)
28–36. https://doi.org/10.1016/j.cryobiol.2017.02.008.
[30] C.W. Wu, K.K. Biggar, J. Zhang, S.N. Tessier, F. Pifferi, M. Perret, K.B. Storey,
Induction of antioxidant and heat shock protein responses during torpor in the
Gray Mouse Lemur, Microcebus murinus, Genomics, Proteomics Bioinforma. 13
(2015) 19–126. https://doi.org/10.1016/j.gpb.2015.03.004.
[31] K. Storey, Storey, Heat shock proteins and hypometabolism: adaptive strategy for
proteome preservation, Res. Rep. Biol. 2011 (2011) 57.
https://doi.org/10.2147/RRB.S13351.

247
[32] J.M. Storey, K.B. Storey, In defense of proteins: Chaperones respond to freezing,
anoxia, or dehydration stress in tissues of freeze tolerant wood frogs, J. Exp. Zool.
Part A Ecol. Integr. Physiol. 331 (2019) 392–402. https://doi.org/10.1002/jez.2306.
[33] C.-W. Wu, S.N. Tessier, K.B. Storey, Stress-induced antioxidant defense and
protein chaperone response in the freeze-tolerant wood frog Rana sylvatica, Cell
Stress Chaperones. 23 (2018) 1205–1217. https://doi.org/10.1007/s12192-018-
0926-x.
[34] D.R. Joanisse, K.B. Storey, Oxidative damage and antioxidants in Rana sylvatica,
the freeze-tolerant wood frog., Am. J. Physiol. 271 (1996) R545-53.
https://doi.org/10.1152/ajpregu.1996.271.3.R545.
[35] K.B. Storey, J.M. Storey, Metabolic rate depression in animals: Transcriptional
and translational controls, Biol. Rev. 79 (2004) 207–233.
https://doi.org/10.1017/S1464793103006195.
[36] Á. Bánréti, M. Sass, Y. Graba, The emerging role of acetylation in the regulation
of autophagy, Autophagy. 9 (2013) 819–829. https://doi.org/10.4161/auto.23908.
[37] R. Al-Attar, S. Wijenayake, K.B. Storey, Metabolic reorganization in winter:
Regulation of pyruvate dehydrogenase (PDH) during long-term freezing and
anoxia., Cryobiology. 86 (2019) 10–18.
https://doi.org/10.1016/j.cryobiol.2019.01.006.
[38] S. Zhao, L. Lin, G. Kan, C. Xu, Q. Tang, C. Yu, W. Sun, L. Cai, C. Xu, S. Cui,
High autophagy in the naked mole rat may play a significant role in maintaining
good health, Cell. Physiol. Biochem. 33 (2014) 321–332.

248
https://doi.org/10.1159/000356672.
[39] T. Johnson, L. Zhao, G. Manuel, H. Taylor, D. Liu, Approaches to therapeutic
angiogenesis for ischemic heart disease, J. Mol. Med. 97 (2019) 141–151.
https://doi.org/10.1007/s00109-018-1729-3.
[40] M.G. Tonnesen, X. Feng, R.A.F. Clark, Angiogenesis in wound healing, J.
Investig. Dermatology Symp. Proc. 5 (2000) 40–46.
https://doi.org/10.1046/j.1087-0024.2000.00014.x.
[41] K.B. Storey, J.M. Storey, Biochemical adaption for freezing tolerance in the wood
frog, Rana sylvatica, J. Comp. Physiol. B. 155 (1984) 29–36.
https://doi.org/10.1007/BF00688788.
[42] J.A. MacDonald, T. Degenhardt, J.W. Baynes, K.B. Storey, Glycation of wood
frog (Rana sylvatica) hemoglobin and blood proteins: In vivo and in vitro
studies, Cryobiology. 59 (2009) 223–225.
https://doi.org/10.1016/j.cryobiol.2009.06.008.
[43] S. Yang, L. Xu, T. Yang, F. Wang, High-mobility group box-1 and its role in
angiogenesis, J. Leukoc. Biol. 95 (2014) 563–574.
https://doi.org/10.1189/jlb.0713412.
[44] J. Evankovich, S.W. Cho, R. Zhang, J. Cardinal, R. Dhupar, L. Zhang, J.R. Klune,
J. Zlotnicki, T. Billiar, A. Tsung, High mobility group box 1 release from
hepatocytes during ischemia and reperfusion injury is mediated by decreased
histone deacetylase activity., J. Biol. Chem. 285 (2010) 39888–97.
https://doi.org/10.1074/jbc.M110.128348.

249
[45] R. Kang, K.M. Livesey, H.J. Zeh, M.T. Lotze, D. Tang, HMGB1: A novel Beclin
1-binding protein active in autophagy, Autophagy. 6 (2010) 1209–1211.
https://doi.org/10.4161/auto.6.8.13651.
[46] S. Gardella, C. Andrei, D. Ferrera, L. V. Lotti, M.R. Torrisi, M.E. Bianchi, A.
Rubartelli, The nuclear protein HMGB1 is secreted by monocytes via a non-
classical, vesicle-mediated secretory pathway, EMBO Rep. 3 (2002) 995–1001.
https://doi.org/10.1093/embo-reports/kvf198.
[47] Y. Xu, F. Toure, W. Qu, L. Lin, F. Song, X. Shen, R. Rosario, J. Garcia, A.M.
Schmidt, S.F. Yan, Advanced glycation end product (AGE)-receptor for age
(RAGE) signaling and up-regulation of Egr-1 in hypoxic macrophages, J. Biol.
Chem. 285 (2010) 23233–23240. https://doi.org/10.1074/jbc.M110.117457.
[48] J.S. Chang, T. Wendt, W. Qu, L. Kong, Y.S. Zou, A.M. Schmidt, S.F. Yan,
Oxygen deprivation triggers upregulation of early growth response-1 by the
receptor for advanced glycation end products, Circ. Res. 102 (2008) 905–913.
https://doi.org/10.1161/CIRCRESAHA.107.165308.
[49] A. Gupta, K.B. Storey, Regulation of antioxidant systems in response to anoxia
and reoxygenation in Rana sylvatica, Comp. Biochem. Physiol. Part B Biochem.
Mol. Biol. 243–244 (2020) 110436. https://doi.org/10.1016/j.cbpb.2020.110436.
[50] E.M. Ellis, Reactive carbonyls and oxidative stress: Potential for therapeutic
intervention, Pharmacol. Ther. 115 (2007) 13–24.
https://doi.org/10.1016/j.pharmthera.2007.03.015.
[51] N.P.J. Brindle, P. Saharinen, K. Alitalo, Signaling and functions of angiopoietin-1

250
in vascular protection., Circ. Res. 98 (2006) 1014–23.
https://doi.org/10.1161/01.RES.0000218275.54089.12.
[52] T. Asahara, D. Chen, T. Takahashi, K. Fujikawa, M. Kearney, M. Magner, G.D.
Yancopoulos, J.M. Isner, Tie2 Receptor Ligands, Angiopoietin-1 and
Angiopoietin-2, Modulate VEGF-Induced Postnatal Neovascularization, Circ. Res.
83 (1998) 233–240. https://doi.org/10.1161/01.RES.83.3.233.
[53] S. Davis, T.H. Aldrich, P.F. Jones, A. Acheson, D.L. Compton, V. Jain, T.E. Ryan,
J. Bruno, C. Radziejewski, P.C. Maisonpierre, G.D. Yancopoulos, Isolation of
angiopoietin-1, a ligand for the TIE2 receptor, by secretion-trap expression
cloning, Cell. 87 (1996) 1161–1169. https://doi.org/10.1016/S0092-
8674(00)81812-7.
[54] M. Shiota, H. Izumi, N. Miyamoto, T. Onitsuka, E. Kashiwagi, A. Kidani, G.
Hirano, M. Takahashi, M. Ono, M. Kuwano, S. Naito, Y. Sasaguri, K. Kohno, Ets
regulates peroxiredoxin1 and 5 expressions through their interaction with the high-
mobility group protein B1, Cancer Sci. 99 (2008) 1950–1959.
https://doi.org/10.1111/j.1349-7006.2008.00912.x.
[55] M.L. Verschoor, L.A. Wilson, C.P. Verschoor, G. Singh, Ets-1 Regulates Energy
Metabolism in Cancer Cells, PLoS One. 5 (2010) e13565.
https://doi.org/10.1371/journal.pone.0013565.
[56] M.L. Verschoor, C.P. Verschoor, G. Singh, Ets-1 global gene expression profile
reveals associations with metabolism and oxidative stress in ovarian and breast
cancers, Cancer Metab. 1 (2013) 17. https://doi.org/10.1186/2049-3002-1-17.

251
[57] X. Zhang, D. Wu, M. Aldarouish, X. Yin, C. Li, C. Wang, ETS-1: A potential
target of glycolysis for metabolic therapy by regulating glucose metabolism in
pancreatic cancer, Int. J. Oncol. 50 (2017) 232–240.
https://doi.org/10.3892/ijo.2016.3770.
[58] G. Mavrothalassitis, J. Ghysdael, Proteins of the ETS family with transcriptional
repressor activity, Oncogene. 19 (2000) 6524–6532.
https://doi.org/10.1038/sj.onc.1204045.
[59] D. Goldman, M.K. Sapru, S. Stewart, J. Plotkin, T.A. Libermann, B. Wasylyk, K.
Guan, Cloning and characterization of GETS-1, a goldfish Ets family member that
functions as a transcriptional repressor in muscle, Biochem. J. 335 (1998) 267–
275. https://doi.org/10.1042/bj3350267.
[60] J. St-Pierre, M.D. Brand, R.G. Boutilier, Mitochondria as ATP consumers:
Cellular treason in anoxia, Proc. Natl. Acad. Sci. 97 (2000) 8670–8674.
https://doi.org/10.1073/pnas.140093597.
[61] M.E. Pamenter, C.R. Gomez, J.G. Richards, W.K. Milsom, Mitochondrial
responses to prolonged anoxia in brain of red-eared slider turtles, Biol. Lett. 12
(2016) 20150797. https://doi.org/10.1098/rsbl.2015.0797.
[62] T.K. Kundu, M. Velayutham, J.L. Zweier, Aldehyde oxidase functions as a
superoxide generating NADH oxidase: An important redox regulated pathway of
cellular oxygen radical formation, Biochemistry. 51 (2012) 2930–2939.
https://doi.org/10.1021/bi3000879.
[63] M.P. Hoyeck, H. Hadj-Moussa, K.B. Storey, The role of MEF2 transcription

252
factors in dehydration and anoxia survival in Rana sylvatica skeletal muscle,
PeerJ. 5 (2017) e4014. https://doi.org/10.7717/peerj.4014.
[64] E.-L. Eskelinen, F. Reggiori, M. Baba, A.L. Kovács, P.O. Seglen, Seeing is
believing: The impact of electron microscopy on autophagy research, Autophagy.
7 (2011) 935–956. https://doi.org/10.4161/auto.7.9.15760.
[65] R. Mundade, H.G. Ozer, H. Wei, L. Prabhu, T. Lu, Role of ChIP-seq in the
discovery of transcription factor binding sites, differential gene regulation
mechanism, epigenetic marks and beyond, Cell Cycle. 13 (2014) 2847–2852.
https://doi.org/10.4161/15384101.2014.949201.
[66] B. Kaboord, M. Perr, Isolation of proteins and protein complexes by
immunoprecipitation, in: Methods Mol. Biol., 2008: pp. 349–364.
https://doi.org/10.1007/978-1-60327-064-9_27.

253
Appendix A: List of current
and future publications

254
Manuscript published in peer reviewed journals
1. R. Al-attar, Y. Zhang, K.B. Storey, Osmolyte regulation by TonEBP/NFAT5 during
anoxia-recovery and dehydration–rehydration stresses in the freeze-tolerant wood
frog (Rana sylvatica), PeerJ. 5 (2017) e2797. doi:10.7717/peerj.2797.
2. Y. Zhang, R. Al-attar, K.B. Storey, TonEBP/NFAT5 regulates downstream
osmoregulatory proteins during freeze-thaw stress in the wood frog, Cryobiology. 79
(2017) 43–49. doi:10.1016/j.cryobiol.2017.09.003.
3. L.J. Hawkins*, R. Al-attar*, K.B. Storey, Transcriptional regulation of metabolism
in disease: From transcription factors to epigenetics, PeerJ. 6 (2018) e5062.
doi:10.7717/peerj.5062. (*equal contribution)
4. R. Al-Attar, K.B. Storey, Effects of anoxic exposure on the nuclear factor of activated
T cell (NFAT) transcription factors in the stress-tolerant wood frog., Cell Biochem.
Funct. 36 (2018) 420–430. doi:10.1002/cbf.3362.
5. R. Al-Attar*, S. Wijenayake*, K.B. Storey, Metabolic reorganization in winter:
regulation of pyruvate dehydrogenase (PDH) during long-term freezing and anoxia.,
Cryobiology. 86 (2019) 10–18. doi:10.1016/j.cryobiol.2019.01.006. (*equal
contribution)
6. J.-Y. Zhang, B.E. Luu, D.-N. Yu, L.-P. Zhang, R. Al-attar, K.B. Storey, The
complete mitochondrial genome of Dryophytes versicolor: Phylogenetic relationship
among Hylidae and mitochondrial protein-coding gene expression in response to
freezing and anoxia, Int. J. Biol. Macromol. 132 (2019) 461–469.
doi:10.1016/j.ijbiomac.2019.03.220.
7. R. Al-attar*, C.-W. Wu*, K.K. Biggar, K. Storey, Carb-loading: Freeze-induced
activation of the glucose-responsive ChREBP transcriptional network in wood frogs,
Physiol. Biochem. Zool. (2019) 706463. https://doi.org/10.1086/706463. (* equal
contribution)
8. R. Al-attar, C.L. Childers, V.C. Nguyen, M.E. Pamenter, K.B. Storey, Differential
protein phosphorylation is responsible for hypoxia-induced regulation of the
Akt/mTOR pathway in naked mole rats, Comp. Biochem. Physiol. Part A Mol. Integr.
Physiol. 242 (2020) 110653. https://doi.org/10.1016/j.cbpa.2020.110653. (Special
issue)
9. R. Al-Attar, K.B. Storey, Suspended in time: Molecular responses to hibernation also
promote longevity., Exp. Gerontol. 134 (2020) 110889.
https://doi.org/10.1016/j.exger.2020.110889.(Special issue, invited review)
10. R. Al-Attar, K.B. Storey, RAGE against the stress: Mitochondrial suppression in
hypometabolic hearts., Gene. 761 (2020) 145039.
https://doi.org/10.1016/j.gene.2020.145039.
11. S.R. Green, R. Al-Attar, A.E. McKechnie, S. Naidoo, K.B. Storey, Role of Akt
signaling pathway regulation in the speckled mousebird (Colius striatus) during
torpor displays tissue specific responses, Cell. Signal. 75 (2020) 109763.
https://doi.org/10.1016/j.cellsig.2020.109763.

255
Manuscripts currently under review in peer-reviewed journals
1. R. Saleem, R. Al-attar, K.B. Storey, Activation of pro-survival pathways of the north
American Myotis lucifugus, during hibernation, Cryobiology (Cryo_2020_16, in
revision)
Non-manuscript peer-reviewed contributions
1. R. Al-attar, K. Storey, Surviving winter: NFATs regulate cryoprotection in freeze-
tolerant Rana sylvatica, Cryobiology. 73 (2016) 430.
https://doi.org/10.1016/j.cryobiol.2016.09.120.
2. S. Wijenayake, R. Al-attar, S. Tessier, K. Storey, Hibernation vs freezing: The tale
of metabolic reorganization in winter, Cryobiology. 73 (2016) 427.
https://doi.org/10.1016/j.cryobiol.2016.09.111.
3. R. Al-attar, K. B. Storey, Organ Cryopreservation: Nature’s Protocol For Freezing
Organs, Sci. Trends. (2018). https://doi.org/10.31988/SciTrends.26890.
Commentary written about my work
1. O. Birceanu, Recovering from oxygen deprivation, froggy style!, J. Exp. Biol. 222
(2019) jeb192658. https://doi.org/10.1242/jeb.192658
Completed projects (not submitted)
2020
1. R. Al-attar, K. B. Storey, Multifactorial regulation of autophagy during anoxia and
dehydration in stress-tolerant wood frogs- Data collection complete
2. R. Al-attar, O. Aguilar, K. B. Storey, Regulation of autophagy during freezing in
wood frogs- Data collection complete
3. Gupta, R. Al-attar, K.B. Storey, Regulation of apoptosis and antioxidant response
during hypoxia in jumbo squids- Data collection complete
4. R. Al-attar*, L. J. Hawkins*, N. Bedard, S. S. Wing, K. B. Storey, Differential
regulation of microRNAs in the liver of USP19 null mice after dexamethasone
injection- Data collection complete (*equal contribution)2021
2021
5. S. English, R. Al-attar, K.B. Storey, NFAT5-mediated osmoregulation in
dehydration tolerant Xenopus laevis- Data collection complete
6. S. Mahrous, J. Robert, R. Al-attar, K.B. Storey, GATA4-mediated transcriptional
network in skeletal and cardiac muscle of wood frogs- Data collection complete
2022
7. R. Al-attar, K. B. Storey, RAGE management: Cyto-nuclear cross talk under
oxidative stress- Data collection complete
8. R. Al-attar, K. B. Storey, Involvement of RAGE signaling in angiogenesis- Data
collection complete
9. Y. Zhang, R. Al-attar, K. B. Storey, NFAT signaling during dehydration in wood

256
frogs- Data collection complete
10. J. Robert, R. Al-attar, K.B. Storey, Anti-apoptotic responses during freezing and
dehydration in wood frogs- Data collection complete
11. S. Wijenayake, R. Al-attar, K.B. Storey, Post-translational modification of the
pyruvate dehydrogenase complex in hyperglycemic conditions- Data collection
complete
2023
12. R. Al-attar, S. Green, A. E. McKechnie, S. Naidoo, K. B. Storey, Involvement of
MAPK signaling in regulating apoptosis in torpid speckled mousebirds- Data
collection complete
13. S. Green, R. Al-attar, A. E. McKechnie, S. Naidoo, K. B. Storey, Post-translational
regulation of the pyruvate dehydrogenase complex during torpor in speckled
mousebirds- Data collection complete
2024
14. R. Al-attar*, A.J. Watts*, K. B. Storey, Involvement of microRNA in regulating
anoxia-tolerance in tree frogs- Data collection complete (*equal contribution)
15. S. Mahrous, R. Al-attar, K. B. Storey, Regulation of the antioxidant response in gray
tree frogs- Data collection complete
16. R. Al-attar, K. B. Storey, Regulation of the NFAT transcriptional response during
freezing in wood frogs- Data collection complete

257
Appendix B: List of
Scientific communications at
meetings

258
1. Al-attar, R., K. B. Storey, “Multifaceted regulation of autophagy and lysosomal
biogenesis supports environmental stress-tolerance in wood frogs”. The 10th
International Congress of Comparative Physiology and Biochemistry, Ottawa,
Ontario, Canada, August 5-9, 2019 (Oral presentation).
2. R. Al-attar, K. B. Storey, “RAGE management: Cyto-nuclear cross talk under
oxidative stress”. The 10th International Congress of Comparative Physiology
and Biochemistry, Ottawa, Ontario, Canada, August 5-9, 2019 (Oral
presentation).
3. R. Al-attar, S. Mahrous, J. Robert, K. B. Storey, “GATA4-mediated gene
expression promotes muscle remodeling during stress in the freeze-tolerant wood
frog, Rana sylvatica”. The 21st annual Chemistry and Biochemistry Graduate
Research Conference, Montreal, Quebec, Canada, Nov 9th, 2018. (Poster
presentation)
4. R. Al-attar, K. B. Storey, Regulation of autophagy-related proteins in the freeze-
tolerant wood frog, Rana sylvatica. 13th annual meeting of the International
Conference on Genomics (ICG-13), Shenzhen, China, Oct 24-28, 2018. (Poster
presentation- Recipient of the Outstanding Poster Award)
5. R. Al Al-attar, L. J. Hawkins, N. Bedard, S. S. Wing, K. B. Storey, Differential
regulation of microRNAs in the liver of USP10 null mice during fasting. 2nd
annual Toronto RNA Enthusiasts Day symposium, Toronto, Ontario, Canada,
August 2, 2017. (Poster presentation)
6. R. Al-attar, K. B. Storey, Surviving anoxia: Regulation of the autophagy-
related proteins in the freeze-tolerant wood frog, Rana sylvatica. 60th Annual
national meeting of the Canadian Society for Molecular Biosciences conference,
Ottawa, Ontario, Canada, May 16-21, 2017. (Poster presentation)
7. R. Al-attar, K. B. Storey, Surviving winter: NFATs regulate cryoprotection in
freeze-tolerant Rana sylvatica. 53rd Annual international meeting of the Society
for Cryobiology, Ottawa, Ontario, Canada, July 23-27, 2016. (Oral presentation,
Invited speaker)- Cryobiology 73, 430 (2016)
8. S. Wijenayake, R. Al-attar, K. B. Storey, Hibernation vs Freezing: The Tale of
Metabolic Reorganization in Winter. 53rd Annual Meeting of the Society for
Cryobiology, Ottawa, Ontario, Canada, July 23-27, 2016. (Oral presentation)-
Cryobiology 73, 427 (2016)
9. R. Al-attar, K. B. Storey, Surviving diabetes: The tale of NFATs and the frozen
frog. Ottawa-Carleton Institute of Biology Symposium, Ottawa, University,
Ottawa, Ontario, Canada, April 5, 2016. (3rd prize winter for oral presentations).
10. R. Al-attar, K. B. Storey, The Role of NFATs in Molecular Adaptation to Stress
in Wood Frogs. Ottawa-Carleton Student Northern Research Symposium 2015,
Carleton University, Ottawa, Ontario, Canada, March 6, 2015. (1st prize-poster
presentations).
11. R. Al-attar, S. Wijenayake, K. B. Storey, Pyruvate Dehydrogenase Kinase (1-4)
Regulation under Freezing, Anoxia and Dehydration in Liver & Muscle of Rana
Sylvatica. 12th Annual Ottawa-Carleton Institute of Biology Symposium,
Carleton University, Ottawa, Ontario, Canada, April 29, 2015. (Poster
presentation)

259
Appendix C: List of
antibodies and immunoblot
conditions
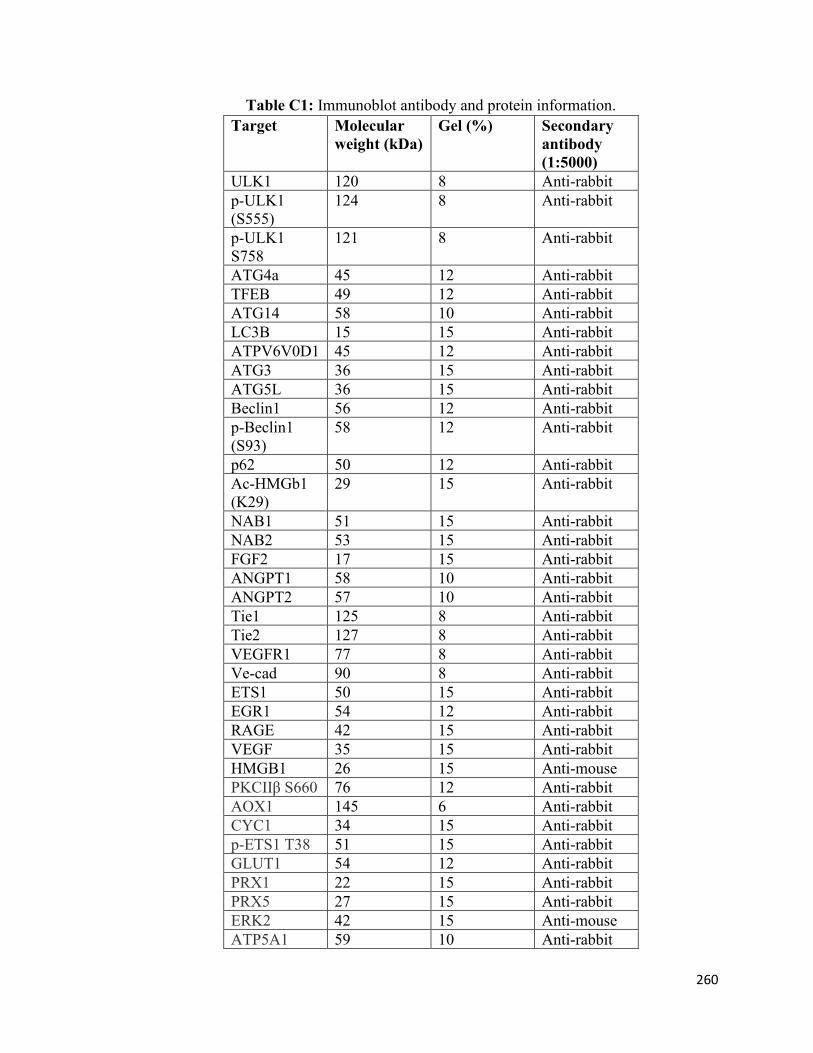
260
Table C1: Immunoblot antibody and protein information.
Target Molecular
weight (kDa)
Gel (%) Secondary
antibody
(1:5000)
ULK1 120 8 Anti-rabbit
p-ULK1
(S555)
124 8 Anti-rabbit
p-ULK1
S758
121 8 Anti-rabbit
ATG4a 45 12 Anti-rabbit
TFEB 49 12 Anti-rabbit
ATG14 58 10 Anti-rabbit
LC3B 15 15 Anti-rabbit
ATPV6V0D1 45 12 Anti-rabbit
ATG3 36 15 Anti-rabbit
ATG5L 36 15 Anti-rabbit
Beclin1 56 12 Anti-rabbit
p-Beclin1
(S93)
58 12 Anti-rabbit
p62 50 12 Anti-rabbit
Ac-HMGb1
(K29)
29 15 Anti-rabbit
NAB1 51 15 Anti-rabbit
NAB2 53 15 Anti-rabbit
FGF2 17 15 Anti-rabbit
ANGPT1 58 10 Anti-rabbit
ANGPT2 57 10 Anti-rabbit
Tie1 125 8 Anti-rabbit
Tie2 127 8 Anti-rabbit
VEGFR1 77 8 Anti-rabbit
Ve-cad 90 8 Anti-rabbit
ETS1 50 15 Anti-rabbit
EGR1 54 12 Anti-rabbit
RAGE 42 15 Anti-rabbit
VEGF 35 15 Anti-rabbit
HMGB1 26 15 Anti-mouse
PKCIIβ S660 76 12 Anti-rabbit
AOX1 145 6 Anti-rabbit
CYC1 34 15 Anti-rabbit
p-ETS1 T38 51 15 Anti-rabbit
GLUT1 54 12 Anti-rabbit
PRX1 22 15 Anti-rabbit
PRX5 27 15 Anti-rabbit
ERK2 42 15 Anti-mouse
ATP5A1 59 10 Anti-rabbit

261
NDUFAB1 17 15 Anti-rabbit
CS 51.8 12 Anti-rabbit

262
Appendix D: Representative
blots

263
Figure D1: Representative immunoblot showing the A) enhanced chemiluminescent
band and B) Coomassie stained membrane of the ATP6V0D1 protein in liver of frogs
exposed to control, 24-hour anoxic, and 4-hour reoxygenated treatments. Red boxes
represent the bands quantified.

264
Appendix E: Standard curve
for AGE-BSA

265
Figure E1: Standard curve generated using AGE-BSA standard following the
manufacturer’s protocol.

266
Appendix F: Extra data

267
Due to abrupt closure of laboratories because of COVID-19, the fourth data chapter is
incomplete. Missing measurements are targets of early apoptosis markers (measured
using the MILLIPLEX MAP Early Apoptosis Magnetic Bead 7-plex Kit - Cell Signaling
Multiplex Assay (MilliporeSigma, cat no. 48-669MAG). This kit has been purchased
previously and will be used by Aakriti Gupta upon laboratory reopening at her
convenience. Aakriti will receive second authorship for her contribution.
Figure F1: Analysis of upstream regulations of NFATc3 measured in wood frog heart in
response to freezing, anoxia or dehydration measured by immunoblotting. Histogram
shows mean ± SEM of n=4 independent biological replicates from different frogs.
Statistical significance from the control is denoted by (*) (P<0.05) and was calculated
using a one-way ANOVA with a Dunnett post-hoc test.

268
Figure F2: Relative nuclear levels of NFATc3 (A), and B) the DNA binding activity of
total NFATc3 in heart of wood frogs exposed to freezing, anoxia and dehydration
measured by immunoblotting. Please see Figure 1 for more information.

269
Figure F3: Relative protein levels of downstream targets of NFATc3 and Tfam in wood
frog heart exposed to freezing, anoxia and dehydration measured by immunoblotting.
Please see Figure 1 for more information.

270
Figure F4: Schematic diagram showing the similarities between the partial NFATc3
protein sequence of Xenopus tropicalis (NP_001135546.1) and splice variant 3 of
humans (N P_775186.1). Using the online Phyre2 program, the NFATc3 structure for
Xenopus laevis (A) and the splice variant 3 of humans (B) were predicted. Using Pymol,
both figures were superimposed (C) to show conservancy between the two sequences.
Using Clustal Omega, the protein sequence of NFATc3 from both organisms was aliened
(D), and the Calcineurin binding site (CBS) and DNA binding Site (DBS) were annotated
based on information retreated from literature.

271
That’s a wrap! And what an amazing/memorable journey it’s been!
Thank you, Ken, Jan, Dr. DeRosa, Dr. Pamenter, and my examiners for reading my thesis
😊