Embed Size (px)
Citation preview

The path to financial truth.
EVA® is a registered service mark of EVA Dimensions LLC (in the field of financial data, valuation analytics, and investment management) and of Stern Stewart & Co. (in the field of financial and incentive consulting) Copyright © 2009 by EVA Dimension LLC. All rights reserved
EVA Express Training Guide

EVA® is a registered service mark of EVA Dimensions LLC (in the field of financial data, valuation analytics, and investment management) and of Stern Stewart & Co. (in the field of financial and incentive consulting) Copyright © 2009 by EVA Dimension LLC. All rights reserved
The path to financial truth.
EVA Express Overview Download rich EVA-based analytics directly
to Excel with EVA Express.
Two versions of EVA Express:
- EVA Express Dashboard: Download an Excel based dashboard with an
interactive, guided tour of the EVA Margin Statement and an EVA Momentum
Report for any set of Russell 3000 companies. Color-coded comparison tables
highlight EVA strengths and weaknesses through drill-down reports. There are
two versions of EVA Express Dashboard – one for operating companies (OPCO)
and another for financial companies (FINCO).
- EVA Express Reports: Download FRS Reports directly to your Excel
workbook and refresh for updated data. Incorporate EVA Margin,
EVA Momentum and 400 proprietary metrics into your own models.
Continue reading for instructions on using
both versions of EVA Express.
To learn more about EVA Express:
- Corporate: Alan Slatas [email protected] (617.962.3201)
- Investors: Craig Sterling, [email protected] (917.882.1403)
2

The path to financial truth.
EVA® is a registered service mark of EVA Dimensions LLC (in the field of financial data, valuation analytics, and investment management) and of Stern Stewart & Co. (in the field of financial and incentive consulting) Copyright © 2009 by EVA Dimension LLC. All rights reserved
EVA Express Dashboard
EVA® is a registered service mark of EVA Dimensions LLC (in the field of financial data, valuation analytics, and investment management) and of Stern Stewart & Co. (in the field of financial and incentive consulting) Copyright © 2009 by EVA Dimension LLC. All rights reserved
The path to financial truth.
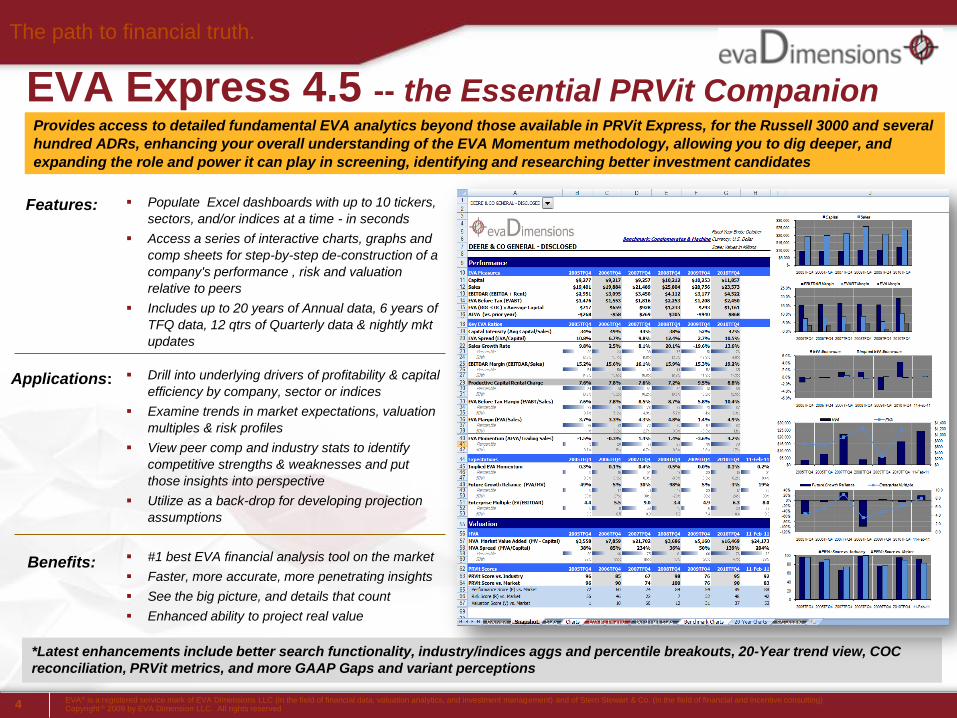
EVA Express 4.5 -- the Essential PRVit Companion
#1 best EVA financial analysis tool on the market
Faster, more accurate, more penetrating insights
See the big picture, and details that count
Enhanced ability to project real value
Populate Excel dashboards with up to 10 tickers,
sectors, and/or indices at a time - in seconds
Access a series of interactive charts, graphs and
comp sheets for step-by-step de-construction of a
company's performance , risk and valuation
relative to peers
Includes up to 20 years of Annual data, 6 years of
TFQ data, 12 qtrs of Quarterly data & nightly mkt
updates
Features:
Applications: Drill into underlying drivers of profitability & capital
efficiency by company, sector or indices
Examine trends in market expectations, valuation
multiples & risk profiles
View peer comp and industry stats to identify
competitive strengths & weaknesses and put
those insights into perspective
Utilize as a back-drop for developing projection
assumptions
Benefits:
Provides access to detailed fundamental EVA analytics beyond those available in PRVit Express, for the Russell 3000 and several
hundred ADRs, enhancing your overall understanding of the EVA Momentum methodology, allowing you to dig deeper, and
expanding the role and power it can play in screening, identifying and researching better investment candidates
*Latest enhancements include better search functionality, industry/indices aggs and percentile breakouts, 20-Year trend view, COC
reconciliation, PRVit metrics, and more GAAP Gaps and variant perceptions
4

EVA® is a registered service mark of EVA Dimensions LLC (in the field of financial data, valuation analytics, and investment management) and of Stern Stewart & Co. (in the field of financial and incentive consulting) Copyright © 2009 by EVA Dimension LLC. All rights reserved
The path to financial truth.
EVA Express Dashboard Overview The EVA Express Dashboard is a pre-structured Excel Workbook with robust reports and tables that provide a guided tour of
EVA analytics. Enter your password, select your companies, and voila, you will be able to view a wide spectrum performance,
valuation & benchmarking statistics organized in color coded tables and presentation-ready charts and graphs.
There are two versions of the EVA Express Dashboard:
1. OPCO Dashboard - Contains dashboard reports specifically for Operating Companies.
2. FINCO Dashboard - Built for analyzing EVA drivers for Financial and Insurance Companies.
The Dashboard covers the gauntlet of Key Performance Indicators areas, including:
EVA PERFORMANCE - Is EVA positive or negative, rising or falling – has the company been an EVA creator or destroyer?, How have margins,
capital intensity, and return on capital changed?, What are the biggest gap sources between net income and EVA? Is there a growing or shrinking
gap between EVA and EPS?
CAPITAL COST COMPONENTS - Which capital cost components are most significant, have most improved/deteriorated?, Do goodwill and special
items capital account for a significant component of cost structure?, What is the risk profile? Compare the risk (variation) in EBITDAR and EVA vs.
sales – are fixed operating and capital costs increasing EVA risk compared to sales risk?
DELTA EVA & EVA MOMENTUM - What are the most significant components of the improvement or deterioration in the EVA margin? Has growth
been profitable, or a detriment to EVA? For public companies, has the expected EVA Improvement (over 1 to 5 years), expressed as a percent of
sales or capital, been rising or falling, and has actual EVA momentum been in the size and direction to match those expectations?
MVA & SHAREHOLDER WEALTH - Has MVA been positive or negative, on the rise or in decline? How much shareholder wealth has the company
created now vs. 5 years before? What about the components of MVA, is there relatively more or less reliance on future growth in EVA as indicated
by FVA?
CASH FLOW - Is there a distinct difference between NOPAT and Operating Cash Generation, which is measured before depreciation but after
working capital investment (hence it eliminates non cash sales, inventory accumulations, and reserve draw-downs from profit), leaving the spread
compared to NOPAT as a measure of earnings vs. cash flow quality?, Has the company been shifting either its investment or financing mix over time,
and if so, have the mix shifts been appropriately correlated?
CAPITAL STRUCTURE - What is the current capital structure condition, and how has that evolved through time?, What capital structure mix of debt
and equity has the company employed over time as an average that would be used in determining its weighted average cost of capital?, Are
shareholder distributions sensible in light of the firm’s operating risk, growth strategy, and financial policies?
5

EVA® is a registered service mark of EVA Dimensions LLC (in the field of financial data, valuation analytics, and investment management) and of Stern Stewart & Co. (in the field of financial and incentive consulting) Copyright © 2009 by EVA Dimension LLC. All rights reserved
The path to financial truth.
Excel 2007: Opening EVA Express Dashboard 1. Save EVAExpress OPCO Installation File 2007 V4.5.xlsm to a
memorable place on your computer and then open the file.
2. If you receive the security warning depicted on the right, click the
Options button and then choose to „Enable this Content‟. If you
receive a different security warning, turn to the slide 28 for
troubleshooting tips.
3. Open the Add-Ins ribbon and select
EVA Express> MASTER KPI Dashboard> Batch Report
4. Enter your username and password and click OK. You will
be prompted to change your password the first time you
open the file*.
5. In the Master KPI Dashboard Wizard, enter up to 10 tickers
or industry aggregates, select a benchmark and
click Create.
Your security settings may prevent you from seeing these
menu options. See slide 28 for troubleshooting tips
6
* Contact support with any password issues at [email protected] or 888.500.3560

EVA® is a registered service mark of EVA Dimensions LLC (in the field of financial data, valuation analytics, and investment management) and of Stern Stewart & Co. (in the field of financial and incentive consulting) Copyright © 2009 by EVA Dimension LLC. All rights reserved
The path to financial truth.
Excel 2003: Opening EVA Express Dashboard
7
1. Save EVAExpress OPCO Installation File 2003 V4.5.xlsm to a memorable
place on your computer and then open the file.
2. If you receive the security warning depicted on the right, select „Enable Macros‟.
3. If you receive a different warning, or have difficulty running EVA Express, turn to
slide 28 to review troubleshooting tips. Alternatively, contact support at [email protected].
4. Click the FRS menu and select Master KPI Dashboard> Batch Run
5. Enter your username and password*. You will be
prompted to change your password on your first login.
6. In the KPI Dashboard Wizard, enter up to 10
tickers or industry aggregates, select a benchmark and
click Create
Your security settings may prevent you from seeing these
menu options. See slide 28 for troubleshooting tips
* Contact support with any password issues at [email protected] or 888.500.3560

EVA® is a registered service mark of EVA Dimensions LLC (in the field of financial data, valuation analytics, and investment management) and of Stern Stewart & Co. (in the field of financial and incentive consulting) Copyright © 2009 by EVA Dimension LLC. All rights reserved
The path to financial truth.
Dashboard Report Tabs & Functionality
Overview Tab: Provides a high-level summary of how the Dashboard is structured, the
different reports and tabs.
Snapshot, Stats, Charts, EVA Mo Pyramid, Benchmark Stats, Benchmark Charts & 20
Year Charts: These worksheets contain your pre-formatted output.
KPI Legend: Lists the KPI definitions including greater explanations and additional
background on calculations.
8

EVA® is a registered service mark of EVA Dimensions LLC (in the field of financial data, valuation analytics, and investment management) and of Stern Stewart & Co. (in the field of financial and incentive consulting) Copyright © 2009 by EVA Dimension LLC. All rights reserved
The path to financial truth.
The Dashboard: Use of Selector windows 1. All 6 output tabs have a Selector window at the top of each spreadsheet. Click the
down arrow, and select the name of the entity you want to examine.
2. The Snapshot, Stats, Charts, and EVA Mo Pyramid Tab are all linked and
changing the name on any one selector on these 4 tabs automatically shifts the
output of the other three.
4. Instructions for additional
functionality on the user controlled
tabs is covered in the next slides.
3. As you will see on the Benchmark
Stats and Benchmarks Chart tab later,
there are 5 Selector windows which
are independently controlled from the
other 4 tabs.
9
EVA® is a registered service mark of EVA Dimensions LLC (in the field of financial data, valuation analytics, and investment management) and of Stern Stewart & Co. (in the field of financial and incentive consulting) Copyright © 2009 by EVA Dimension LLC. All rights reserved
The path to financial truth.
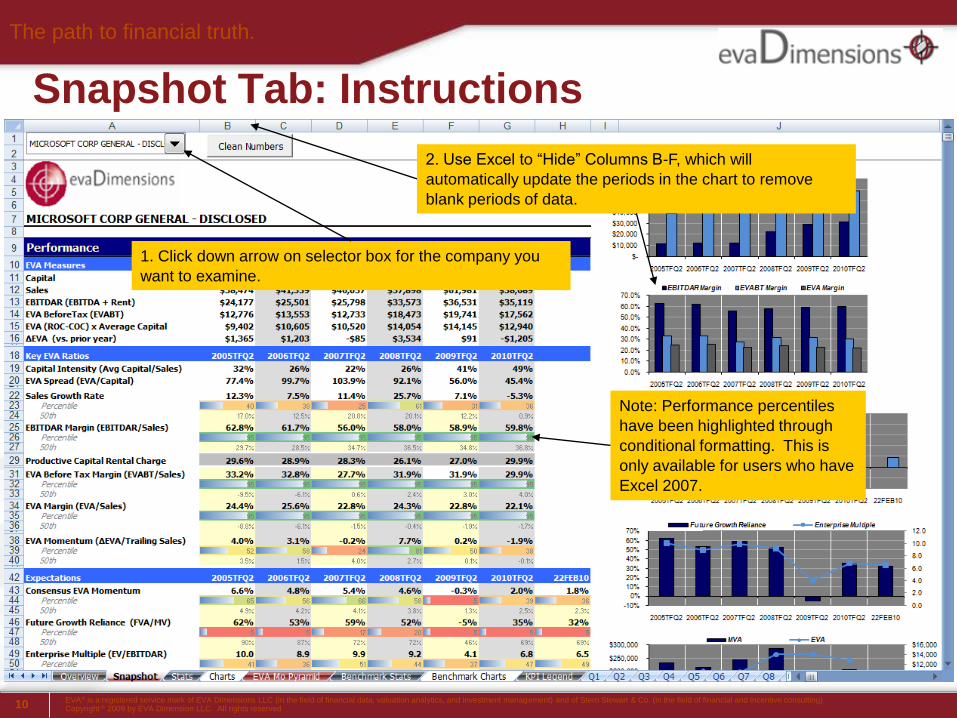
Snapshot Tab: Instructions
10
1. Click down arrow on selector box for the company you
want to examine.
2. Use Excel to “Hide” Columns B-F, which will
automatically update the periods in the chart to remove
blank periods of data.
Note: Performance percentiles
have been highlighted through
conditional formatting. This is
only available for users who have
Excel 2007.

EVA® is a registered service mark of EVA Dimensions LLC (in the field of financial data, valuation analytics, and investment management) and of Stern Stewart & Co. (in the field of financial and incentive consulting) Copyright © 2009 by EVA Dimension LLC. All rights reserved
The path to financial truth.
Stats Tab: Instructions
3. Click “1” to “4” to
reveal more detail.
Level “5” provides
performance and
percentile scores.
Quarterly data pulled from Q tabs
TFQ data pulled from TFQ tabs
2. Click “1” for 6 years, “2” to add most recent qtr/prior years, and “3” to see all trailing 12 qtrs.
1. Click down arrow on selector box for the company you
want to examine.
Note: This tab also uses conditional
formatting available in Excel 2007 to
highlight Performance percentiles
scores.
11

EVA® is a registered service mark of EVA Dimensions LLC (in the field of financial data, valuation analytics, and investment management) and of Stern Stewart & Co. (in the field of financial and incentive consulting) Copyright © 2009 by EVA Dimension LLC. All rights reserved
The path to financial truth.
Charts Tab: Instructions
3. Click “1” to collapse reports to section
headers, “4” to reveal all, and scroll down to
section of interest.
1. Click down arrow on selector box for the company you
want to examine.
2. Click down arrow on selector box to specify either
Quarterly or TFQ data to use in the charts.
12

EVA® is a registered service mark of EVA Dimensions LLC (in the field of financial data, valuation analytics, and investment management) and of Stern Stewart & Co. (in the field of financial and incentive consulting) Copyright © 2009 by EVA Dimension LLC. All rights reserved
The path to financial truth.
EVA Mo Pyramid: Instructions
3. Click “1”
to “5” to
reveal more
detail in
stages
2. Choose Among 2 Trees:
i. 1 through 5 TFQs Strategic View
(Choose between 1 to 5 TFQs)
ii. Choose Qtr vs Same Qtr Year Ago
(Choose ending Qtr from any of most
recent 8 Qtrs)
TFQ data pulled from TFQ tabs
Quarterly data pulled from Q tabs
1. Click down arrow on selector box for the company you
want to examine.
13
EVA® is a registered service mark of EVA Dimensions LLC (in the field of financial data, valuation analytics, and investment management) and of Stern Stewart & Co. (in the field of financial and incentive consulting) Copyright © 2009 by EVA Dimension LLC. All rights reserved
The path to financial truth.
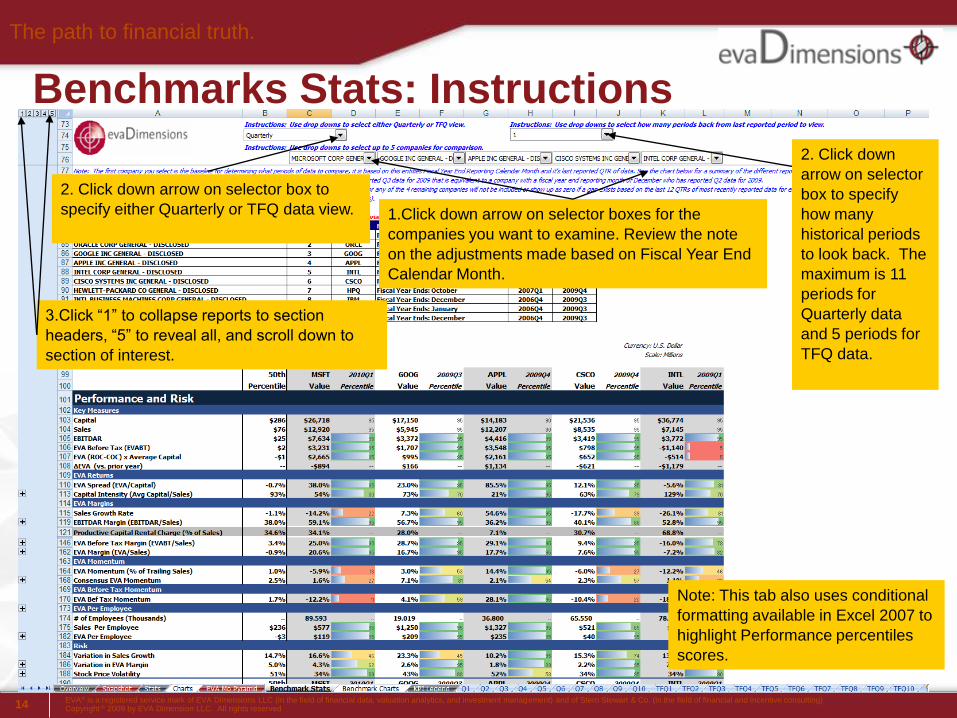
Benchmarks Stats: Instructions
14
3.Click “1” to collapse reports to section
headers, “5” to reveal all, and scroll down to
section of interest.
1.Click down arrow on selector boxes for the
companies you want to examine. Review the note
on the adjustments made based on Fiscal Year End
Calendar Month.
2. Click down arrow on selector box to
specify either Quarterly or TFQ data view.
2. Click down
arrow on selector
box to specify
how many
historical periods
to look back. The
maximum is 11
periods for
Quarterly data
and 5 periods for
TFQ data.
Note: This tab also uses conditional
formatting available in Excel 2007 to
highlight Performance percentiles
scores.

EVA® is a registered service mark of EVA Dimensions LLC (in the field of financial data, valuation analytics, and investment management) and of Stern Stewart & Co. (in the field of financial and incentive consulting) Copyright © 2009 by EVA Dimension LLC. All rights reserved
The path to financial truth.
Benchmark Charts: Instructions
3. Click “1” to
collapse reports to
section headers, “4”
to reveal all.
1. Click down arrow on selector boxes for the companies you want to
examine. Review the note on the adjustments made based on Fiscal
Year End Calendar Month, it is the same as made on the Benchmark
Stats Tab.
2. Click down arrow on selector box to specify either
Quarterly or TFQ data view.
15

EVA® is a registered service mark of EVA Dimensions LLC (in the field of financial data, valuation analytics, and investment management) and of Stern Stewart & Co. (in the field of financial and incentive consulting) Copyright © 2009 by EVA Dimension LLC. All rights reserved
The path to financial truth.
20 Year Charts: Instructions
2. Click “1” to
collapse reports to
section headers, “2”
to reveal all.
1. Click down arrow on selector boxes for the companies you want to
examine. Review the note on the adjustments made based on Fiscal
Year End Calendar Month, it is the same as made on the Benchmark
Stats Tab.
16

EVA® is a registered service mark of EVA Dimensions LLC (in the field of financial data, valuation analytics, and investment management) and of Stern Stewart & Co. (in the field of financial and incentive consulting) Copyright © 2009 by EVA Dimension LLC. All rights reserved
The path to financial truth.
KPI Legend Tab: Definitions and Explanations
17
Click
“1” to
“2” to
revel
more
detail

The path to financial truth.
EVA® is a registered service mark of EVA Dimensions LLC (in the field of financial data, valuation analytics, and investment management) and of Stern Stewart & Co. (in the field of financial and incentive consulting) Copyright © 2009 by EVA Dimension LLC. All rights reserved
EVA Express Reports

EVA® is a registered service mark of EVA Dimensions LLC (in the field of financial data, valuation analytics, and investment management) and of Stern Stewart & Co. (in the field of financial and incentive consulting) Copyright © 2009 by EVA Dimension LLC. All rights reserved
The path to financial truth.
Excel 2007: Opening EVA Express Reports 1. Save EVAExpress Reports Installation File 2007.xlsm to
a memorable place on your computer and then open.
2. If you receive the security warning depicted on the right,
click the Options button and then choose to „Enable this
Content‟.
3. Open the Add-Ins ribbon and select EVA Express> KPI
Dashboard> FRS Report
4. Enter your username and password
and click OK*
5. The Report Options window will open.
Your security settings may prevent you from seeing these
menu options. See slide 28 for troubleshooting tips
19
* Contact support with any password issues at [email protected] or 888.500.3560
EVA® is a registered service mark of EVA Dimensions LLC (in the field of financial data, valuation analytics, and investment management) and of Stern Stewart & Co. (in the field of financial and incentive consulting) Copyright © 2009 by EVA Dimension LLC. All rights reserved
The path to financial truth.
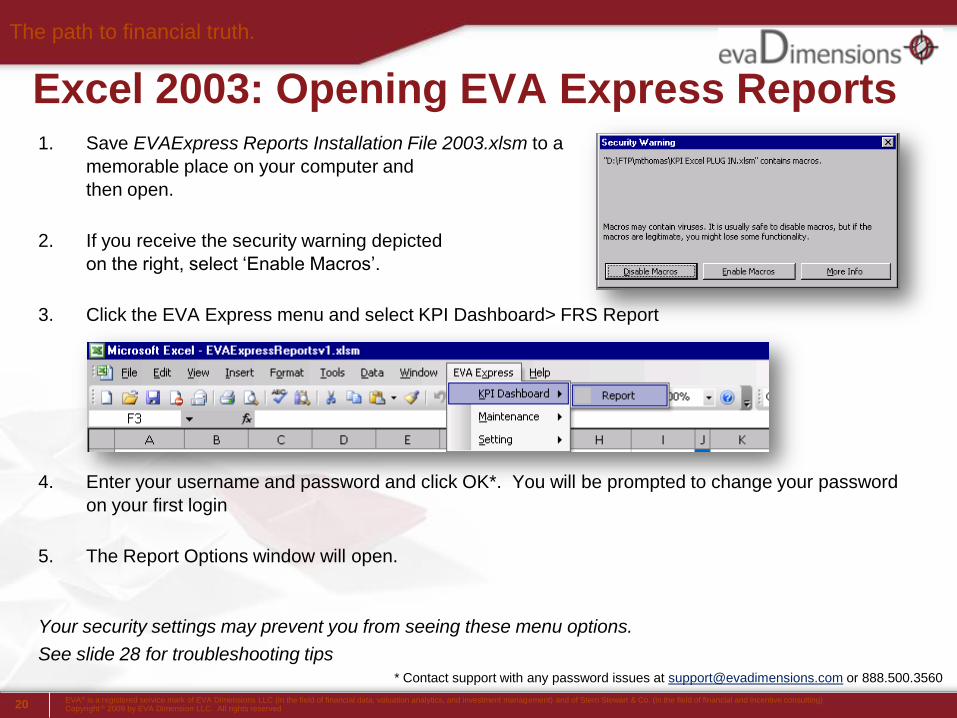
Excel 2003: Opening EVA Express Reports 1. Save EVAExpress Reports Installation File 2003.xlsm to a
memorable place on your computer and
then open.
2. If you receive the security warning depicted
on the right, select „Enable Macros‟.
3. Click the EVA Express menu and select KPI Dashboard> FRS Report
4. Enter your username and password and click OK*. You will be prompted to change your password
on your first login
5. The Report Options window will open.
Your security settings may prevent you from seeing these menu options.
See slide 28 for troubleshooting tips
20
* Contact support with any password issues at [email protected] or 888.500.3560

EVA® is a registered service mark of EVA Dimensions LLC (in the field of financial data, valuation analytics, and investment management) and of Stern Stewart & Co. (in the field of financial and incentive consulting) Copyright © 2009 by EVA Dimension LLC. All rights reserved
The path to financial truth.
EVA Express Reports
21
1. Select a Report Template. KPI 1 Page
Summary is a good place to start.
2. Enter a Ticker and select the company‟s
industry for a benchmark.
3. Select whether to view Annual, Quarterly
or Trailing 4 Quarters.
4. Select a start and end date, or select the
number of periods back from the last
history period (LHP).
5. Select View Blank Lines so that the
report has the same number of lines,
even when data is 0 or unavailable.
This is important if your report provides
data to a model.
6. Click Create Report
1 2
3 4
5
6

EVA® is a registered service mark of EVA Dimensions LLC (in the field of financial data, valuation analytics, and investment management) and of Stern Stewart & Co. (in the field of financial and incentive consulting) Copyright © 2009 by EVA Dimension LLC. All rights reserved
The path to financial truth.
EVA Express Reports
22
12. Your selected report will appear on a new
worksheet as „Ticker_ReportName‟
13. Repeat these steps to run the report named:
OPCO EVA MO 6TFQ Benchmark Summary.
14. Click on the Benchmark Options+ to add
benchmark comparisons to your report

EVA® is a registered service mark of EVA Dimensions LLC (in the field of financial data, valuation analytics, and investment management) and of Stern Stewart & Co. (in the field of financial and incentive consulting) Copyright © 2009 by EVA Dimension LLC. All rights reserved
The path to financial truth.
EVA Express Reports
23
15. Check the Show Percentile box to display the
selected company‟s percentile ranking for each
report metric
16. Click Show Distribution and the 50 boxes to
display the median figure for each report metric.
17. The Show Aggregate and Share box displays
the total value of the benchmark industry and
the % share for the selected company.
18. The Show Individual Members of Group
displays each company in the selected
benchmark industry.

EVA® is a registered service mark of EVA Dimensions LLC (in the field of financial data, valuation analytics, and investment management) and of Stern Stewart & Co. (in the field of financial and incentive consulting) Copyright © 2009 by EVA Dimension LLC. All rights reserved
The path to financial truth.
Creating Custom Reports
1. Create a new worksheet
2. Right click and select
EVA Express> Custom Report Template
3. Click on the Report Items+ button to open
the KPI Explorer
4. Check the KPIs that you would like to
appear on your report
5. Use the Search Box to find a KPI or
select OK when finished
6. Enter the desired Ticker, Benchmark,
Date Range, etc.
7. Click Create Report
8. To edit your report, right click and
select Edit Parameters
24

EVA® is a registered service mark of EVA Dimensions LLC (in the field of financial data, valuation analytics, and investment management) and of Stern Stewart & Co. (in the field of financial and incentive consulting) Copyright © 2009 by EVA Dimension LLC. All rights reserved
The path to financial truth.
KPI ALL Report
25
Take a moment to run and examine the KPI ALL report, and note that it is organized in 7 sections (as is the
full “Analytical Report” output of 2723 lines):
1. EVA Summary: NOPAT, Capital, Cost of Capital, Capital Charge, EVA, Margins, Capital Intensity,
ROC, EVA, Delta EVA, Company Type, EPS-to-EVA
2. EVA Dimensions: EVA Income Statement, EVA Per Sales (Margins), EVA Per Capital (Returns),
EVA Per Employee, EVA Risk metrics
3. Delta EVA and EVA Momentum: Delta EVA, Delta EVA Momentum (Delta EVA per Trailing Sales,
Capital), Expected EVA Improvement (5, 10 and 20 years)
4. MVA and Shareholder Wealth: Market Value, Capital, MVA (Market Value Added), CVA (Current
Value Added), FVA (Future Value Added), Valuation Multiples, MVAxGW&SI (MVA before deducting
goodwill and special item capital)
5. Delta MVA and Shareholder Returns: Delta MVA, total return measured through cash flow and
through EVA/MVA
6. Cash Flow: Free Cash Flow (FCF), cash returns, investment and financing mix
7. Capital Structure: Leverage ratios, coverage multiples, shareholder distributions

EVA® is a registered service mark of EVA Dimensions LLC (in the field of financial data, valuation analytics, and investment management) and of Stern Stewart & Co. (in the field of financial and incentive consulting) Copyright © 2009 by EVA Dimension LLC. All rights reserved
The path to financial truth.
Additional Features EVA Express Reports
26
Refreshing a Report:
- Open the EVA Express Menu and select
Maintenance> Manage Report
- Refresh Report: Update the report with current data
- Edit Parameter: Re-open the Report Options window
to edit the parameters of the report
- Rename Report: Updates the name of the worksheet
- Delete: Removes the sheet from your workbook
Changing your password
- Open the EVA Express Menu and select
Settings>Change Password
- Enter your new password in the Change Password
window

EVA® is a registered service mark of EVA Dimensions LLC (in the field of financial data, valuation analytics, and investment management) and of Stern Stewart & Co. (in the field of financial and incentive consulting) Copyright © 2009 by EVA Dimension LLC. All rights reserved
The path to financial truth.
FRS Report Descriptions
27
Financial Reports ALL: Basic income, balance sheet and supplemental
data
Analytical Reports ALL: All 2723 lines including KPIs and reconciliations
KPI ALL: The 350 or so most important results
Financial, Analytical and KPI reports unchecked: Run these reports to
open Report Explorer window and customize your own reports
KPI 1 Page Summary: Report of the most important EVA related metrics.
The KPI 3 Page and KPI 7 Page breakout metrics to show underlying
drivers
Reconciliation Report: Displays all details behind the computation of
NOPAT, Capital, Market Value, MVA, and Free Cash Flow
27
Summary Reports: Provide excerpts from Analytical Reports ALL

EVA® is a registered service mark of EVA Dimensions LLC (in the field of financial data, valuation analytics, and investment management) and of Stern Stewart & Co. (in the field of financial and incentive consulting) Copyright © 2009 by EVA Dimension LLC. All rights reserved
The path to financial truth.
If you experience any issues with EVA Express, it may be due to one of the following:
1. If you are using Excel 2003, make sure you are using the Excel 2003 version of PRVit Express.
EVA Express OPCO Installation 2003.xls is the version for Excel 2003.
EVA Express OPCO Installation 2007.xlsm is the version for Excel 2007
2. If the buttons and fields do not work at all, it is likely that Macros are not enabled. If you see the Security
Warning at the top of your screen, click on Options and then choose to „Enable this Content‟. If you do
not see the Security Warning, close and reopen your workbook.
Troubleshooting Tips
28

EVA® is a registered service mark of EVA Dimensions LLC (in the field of financial data, valuation analytics, and investment management) and of Stern Stewart & Co. (in the field of financial and incentive consulting) Copyright © 2009 by EVA Dimension LLC. All rights reserved
The path to financial truth.
If you are using Excel 2007 and EVA express is not working, your computer may be configured
to disable ActiveX and/or Macros without warning.
1. To enable ActiveX in Excel 2007:
o Open Excel Options by clicking on the windows icon and then select Excel Options
o Open the Trust Center and then click on the Trust Center Settings button
o Select ActiveX settings in the left navigation
o Make sure the first option „Disable all controls without notification‟ is NOT SELECTED. The second
option is recommended: ‘Prompt me before enabling Unsafe for Initialization controls..’
o Click OK
o Close and reopen EVA Express. You should now receive an ActiveX security alert (see previous
slide). Choose to enable ActiveX.
Troubleshooting Tips continued
29

EVA® is a registered service mark of EVA Dimensions LLC (in the field of financial data, valuation analytics, and investment management) and of Stern Stewart & Co. (in the field of financial and incentive consulting) Copyright © 2009 by EVA Dimension LLC. All rights reserved
The path to financial truth.
If you are using Excel 2007 and EVA Express is not working at all, your computer may be
configured to disable ActiveX and/or Macros without warning.
2. To change your Macro security settings in Excel 2007:
o Open Excel Options by clicking on the windows icon and then select Excel Options
o Open the Trust Center and then click on the Trust Center Settings button
o Select Macro settings in the left navigation
o Make sure the SECOND option „Disable all controls WITH notification‟ is SELECTED.
o Click OK
o Close and reopen EVA Express. You should now receive a Macro security alert (see slide 28).
Choose to enable Macros.
Troubleshooting Tips continued
30

EVA® is a registered service mark of EVA Dimensions LLC (in the field of financial data, valuation analytics, and investment management) and of Stern Stewart & Co. (in the field of financial and incentive consulting) Copyright © 2009 by EVA Dimension LLC. All rights reserved
The path to financial truth.
Troubleshooting Tips continued
1. If you are using Excel 2003 and receive the warning on
the right, your security settings will need to be changed to
allow PRVit Express to run properly.
2. Go to the Tools menu, and select Macro and Security as
depicted on the bottom right.
3. Change your security setting to „Medium‟ so that you can
choose whether to run Macros. Click OK.
4. ** Close and re-open the EVA Express workbook
before continuing.
31
* Contact support with any password issues at [email protected] or 888.500.3560

EVA® is a registered service mark of EVA Dimensions LLC (in the field of financial data, valuation analytics, and investment management) and of Stern Stewart & Co. (in the field of financial and incentive consulting) Copyright © 2009 by EVA Dimension LLC. All rights reserved
The path to financial truth.
Troubleshooting Tips continued
32
• If your temporary Internet files take up too much space on your computer, you may need to
delete your temporary internet files:
o In Internet Explorer, select Tools>Internet Options.
o On the Internet Options window, select the Delete button to open the Delete Browsing History window. Check
Temporary Internet files and then the Delete button.

EVA® is a registered service mark of EVA Dimensions LLC (in the field of financial data, valuation analytics, and investment management) and of Stern Stewart & Co. (in the field of financial and incentive consulting) Copyright © 2009 by EVA Dimension LLC. All rights reserved
The path to financial truth.
Next Steps
For questions or issues, please contact support at: - [email protected]
- 888.500.3560
To schedule a demo or learn more about
EVA Express, please contact: - Corporate: Alan Slatas [email protected] (617.962.3201)
- Investors: Craig Sterling, [email protected] (917.882.1403)
33