Embed Size (px)
Citation preview
Approved by USDA’s World Agricultural Outlook Board
Fruit and Tree Nuts Outlook: September 2020 Jaclyn Kramer, coordinator Skyler Simnitt and Linda Calvin
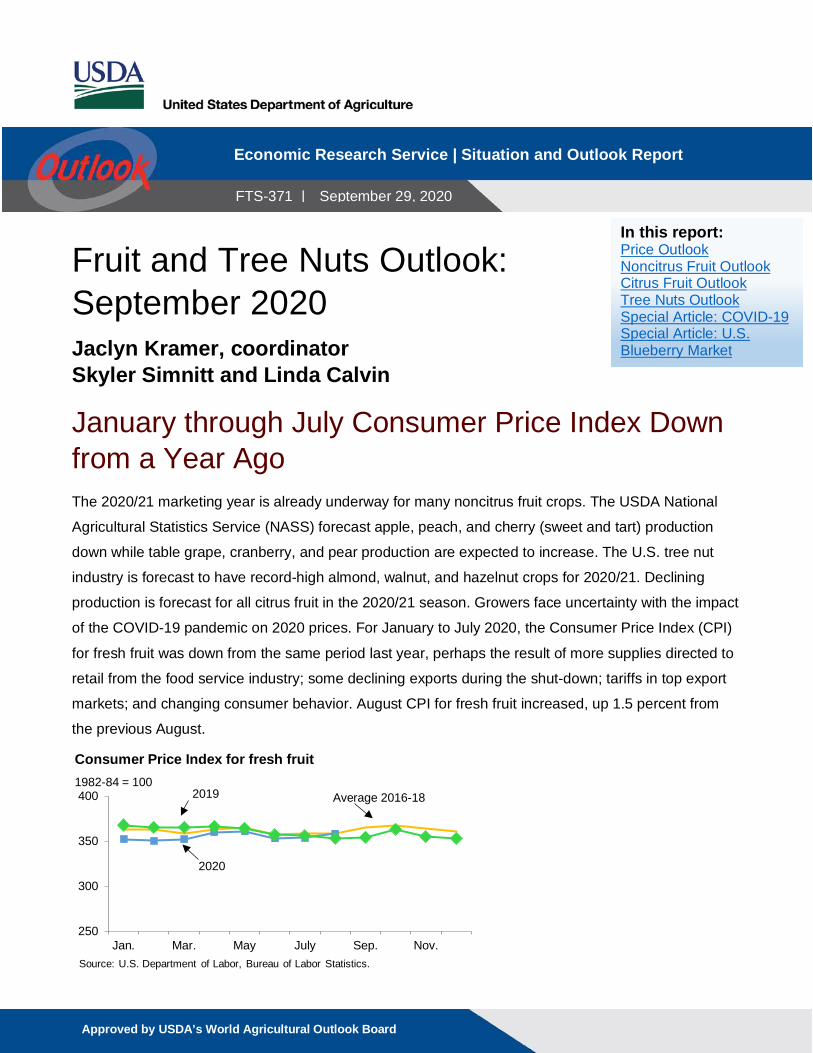
January through July Consumer Price Index Down from a Year Ago The 2020/21 marketing year is already underway for many noncitrus fruit crops. The USDA National
Agricultural Statistics Service (NASS) forecast apple, peach, and cherry (sweet and tart) production
down while table grape, cranberry, and pear production are expected to increase. The U.S. tree nut
industry is forecast to have record-high almond, walnut, and hazelnut crops for 2020/21. Declining
production is forecast for all citrus fruit in the 2020/21 season. Growers face uncertainty with the impact
of the COVID-19 pandemic on 2020 prices. For January to July 2020, the Consumer Price Index (CPI)
for fresh fruit was down from the same period last year, perhaps the result of more supplies directed to
retail from the food service industry; some declining exports during the shut-down; tariffs in top export
markets; and changing consumer behavior. August CPI for fresh fruit increased, up 1.5 percent from
the previous August.
250
300
350
400
Jan. Mar. May July Sep. Nov.
Consumer Price Index for fresh fruit1982-84 = 100
Source: U.S. Department of Labor, Bureau of Labor Statistics.
Average 2016-18
2020
2019
Economic Research Service | Situation and Outlook Report
FTS-371 | September 29, 2020
In this report: Price Outlook Noncitrus Fruit Outlook Citrus Fruit Outlook Tree Nuts Outlook Special Article: COVID-19 Special Article: U.S. Blueberry Market
2
Fruit and Tree Nuts Outlook: September 2020, FTS-371, September 29, 2020 USDA, Economic Research Service
Price Outlook Fruit and Nut Grower Price Index Is Up
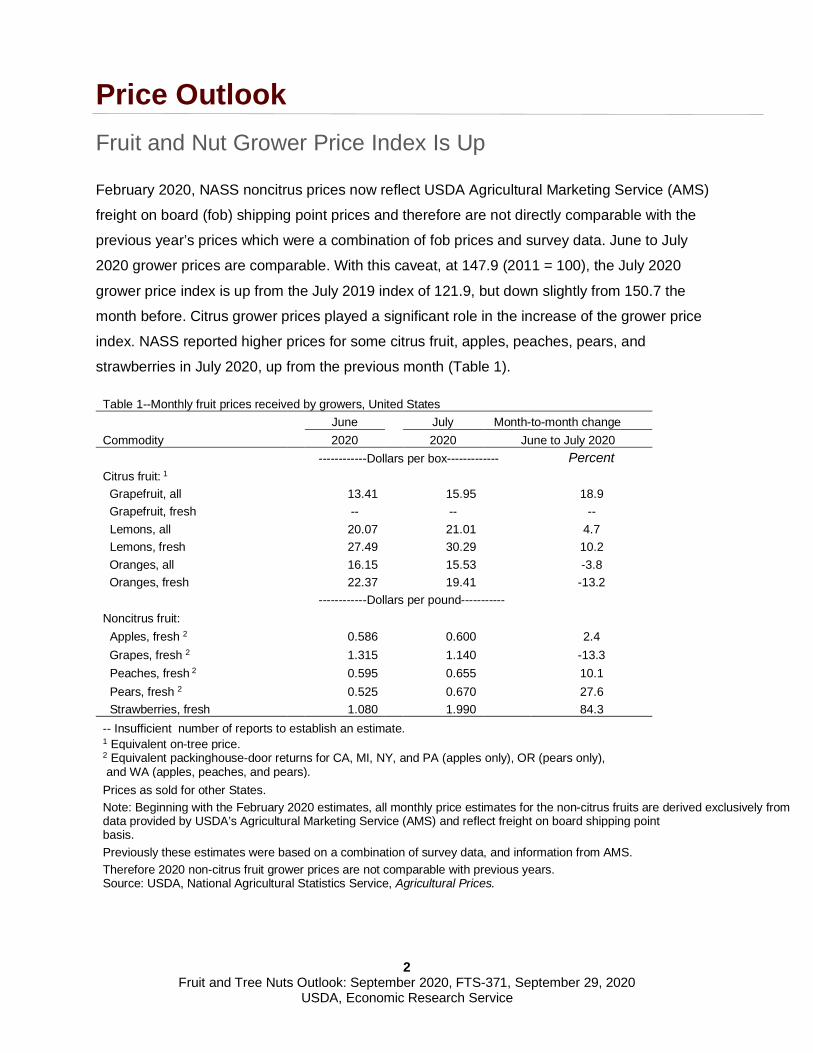
February 2020, NASS noncitrus prices now reflect USDA Agricultural Marketing Service (AMS)
freight on board (fob) shipping point prices and therefore are not directly comparable with the
previous year’s prices which were a combination of fob prices and survey data. June to July
2020 grower prices are comparable. With this caveat, at 147.9 (2011 = 100), the July 2020
grower price index is up from the July 2019 index of 121.9, but down slightly from 150.7 the
month before. Citrus grower prices played a significant role in the increase of the grower price
index. NASS reported higher prices for some citrus fruit, apples, peaches, pears, and
strawberries in July 2020, up from the previous month (Table 1).
Table 1--Monthly fruit prices received by growers, United States June July Month-to-month change Commodity 2020 2020 June to July 2020 ------------Dollars per box------------- Percent Citrus fruit: 1 Grapefruit, all 13.41 15.95 18.9 Grapefruit, fresh -- -- -- Lemons, all 20.07 21.01 4.7 Lemons, fresh 27.49 30.29 10.2 Oranges, all 16.15 15.53 -3.8 Oranges, fresh 22.37 19.41 -13.2 ------------Dollars per pound----------- Noncitrus fruit: Apples, fresh 2 0.586 0.600 2.4 Grapes, fresh 2 1.315 1.140 -13.3 Peaches, fresh 2 0.595 0.655 10.1 Pears, fresh 2 0.525 0.670 27.6 Strawberries, fresh 1.080 1.990 84.3 -- Insufficient number of reports to establish an estimate. 1 Equivalent on-tree price. 2 Equivalent packinghouse-door returns for CA, MI, NY, and PA (apples only), OR (pears only), and WA (apples, peaches, and pears). Prices as sold for other States. Note: Beginning with the February 2020 estimates, all monthly price estimates for the non-citrus fruits are derived exclusively from data provided by USDA’s Agricultural Marketing Service (AMS) and reflect freight on board shipping point basis. Previously these estimates were based on a combination of survey data, and information from AMS. Therefore 2020 non-citrus fruit grower prices are not comparable with previous years.
Source: USDA, National Agricultural Statistics Service, Agricultural Prices.
3
Fruit and Tree Nuts Outlook: September 2020, FTS-371, September 29, 2020 USDA, Economic Research Service
Some factors behind the grower price movements for selected fresh-market fruit are as follows:
• Declining citrus production in 2019/20 and higher consumption in the early part of the
year kept upward pressure on most citrus grower prices.
• Supplies of peaches were down due to frost in Colorado, a decline in acreage in
Georgia, and California’s tight labor supply, pushing up prices in July.
• Strawberry shipments from California were down 9 percent in July and demand has
been strong, likely keeping grower prices high.
• Lower U.S. pear shipments in June-August 2020 likely increased fresh pear prices in
July.
Consumer Price Index for Fresh Fruit, Down in January through July 2020, Rises in August 2020
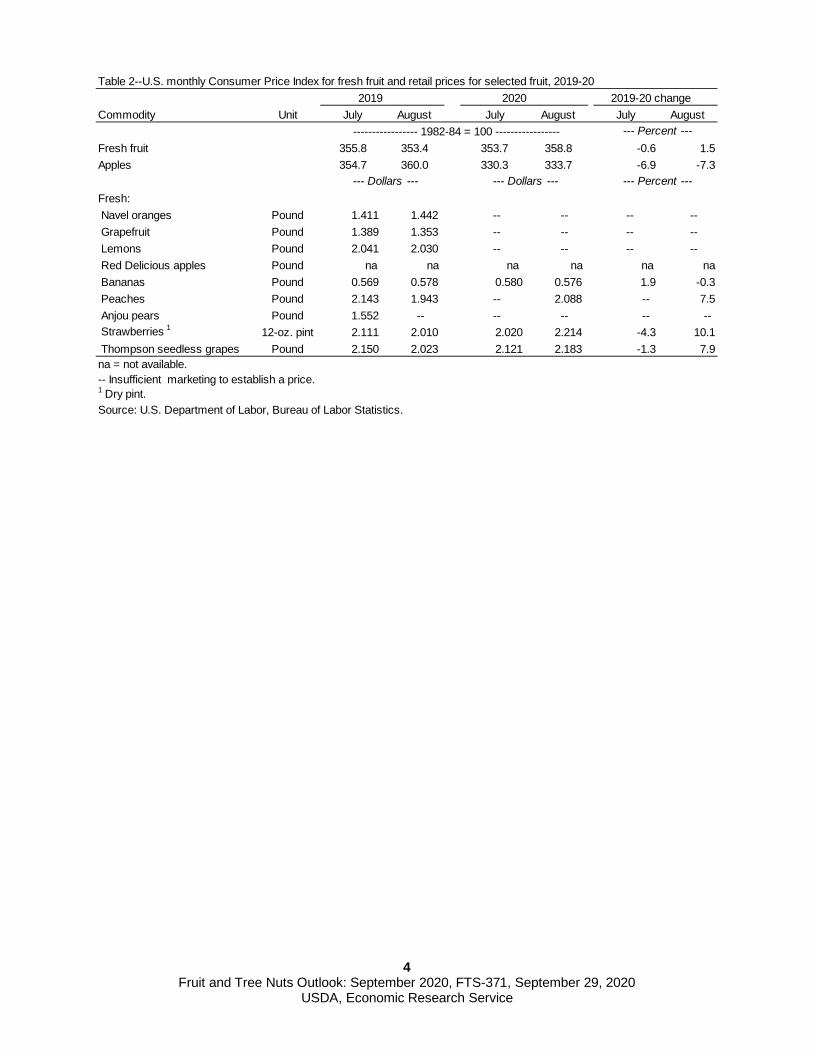
The Bureau of Labor Statistics (BLS) Consumer Price Index (CPI) for fresh fruit was reported at
358.8 (1982-84 = 100) in August 2020, up from 353.4 in August 2019 (Table 2). Retail prices for
peaches, strawberries, and grapes were up relative to August 2019 prices. While no prices were
reported for Red Delicious apples, the decrease in the CPI for apples in August indicates
generally lower retail apple prices, likely a result of abundant apples in cold storage this year.
Banana imports are up 13 percent year-to-date, likely decreasing prices. The CPI for fresh fruit
declined in 2020 from January to July. A decrease in exports and supplies to the food service
industry may have directed more supplies to retail. The CPI increased in August 2020. The
increase in prices may be the result of the decrease in shipments of peaches, pears, and
strawberries.
4
Fruit and Tree Nuts Outlook: September 2020, FTS-371, September 29, 2020 USDA, Economic Research Service
Table 2--U.S. monthly Consumer Price Index for fresh fruit and retail prices for selected fruit, 2019-202019 2020 2019-20 change
Commodity Unit July August July August July August ----------------- 1982-84 = 100 ----------------- --- Percent ---
Fresh fruit 355.8 353.4 353.7 358.8 -0.6 1.5Apples 354.7 360.0 330.3 333.7 -6.9 -7.3
--- Dollars --- --- Dollars --- --- Percent ---Fresh: Navel oranges Pound 1.411 1.442 -- -- -- -- Grapefruit Pound 1.389 1.353 -- -- -- -- Lemons Pound 2.041 2.030 -- -- -- -- Red Delicious apples Pound na na na na na na Bananas Pound 0.569 0.578 0.580 0.576 1.9 -0.3 Peaches Pound 2.143 1.943 -- 2.088 -- 7.5 Anjou pears Pound 1.552 -- -- -- -- -- Strawberries 1 12-oz. pint 2.111 2.010 2.020 2.214 -4.3 10.1 Thompson seedless grapes Pound 2.150 2.023 2.121 2.183 -1.3 7.9na = not available. -- Insufficient marketing to establish a price.1 Dry pint. Source: U.S. Department of Labor, Bureau of Labor Statistics.
5
Fruit and Tree Nuts Outlook: September 2020, FTS-371, September 29, 2020 USDA, Economic Research Service
Noncitrus Fruit Outlook Production a Mixed Bag with Commodity Forecasts Up and Down
The 2020 harvest is underway for many noncitrus fruit crops. USDA’s National Agricultural
Statistics Service (NASS) forecast 2020 production levels up for the pear, grape, and cranberry
crops; the apple, peach, and cherry (both sweet and tart) crops are expected to be down.
COVID-19 has brought about many changes, which may potentially affect the quantity of the
forecast crop harvested if there are labor shortages. COVID-19 also has a potential impact on
domestic, export, and import markets. These effects are still evolving (see Special Article “The
Initial Impact of COVID-19 on the Fruit Industry: Apples, Table Grapes, and Strawberries,
March-June 2020”). In addition, some Western crops like apples may be affected by the smoke
from the massive September wildfires.
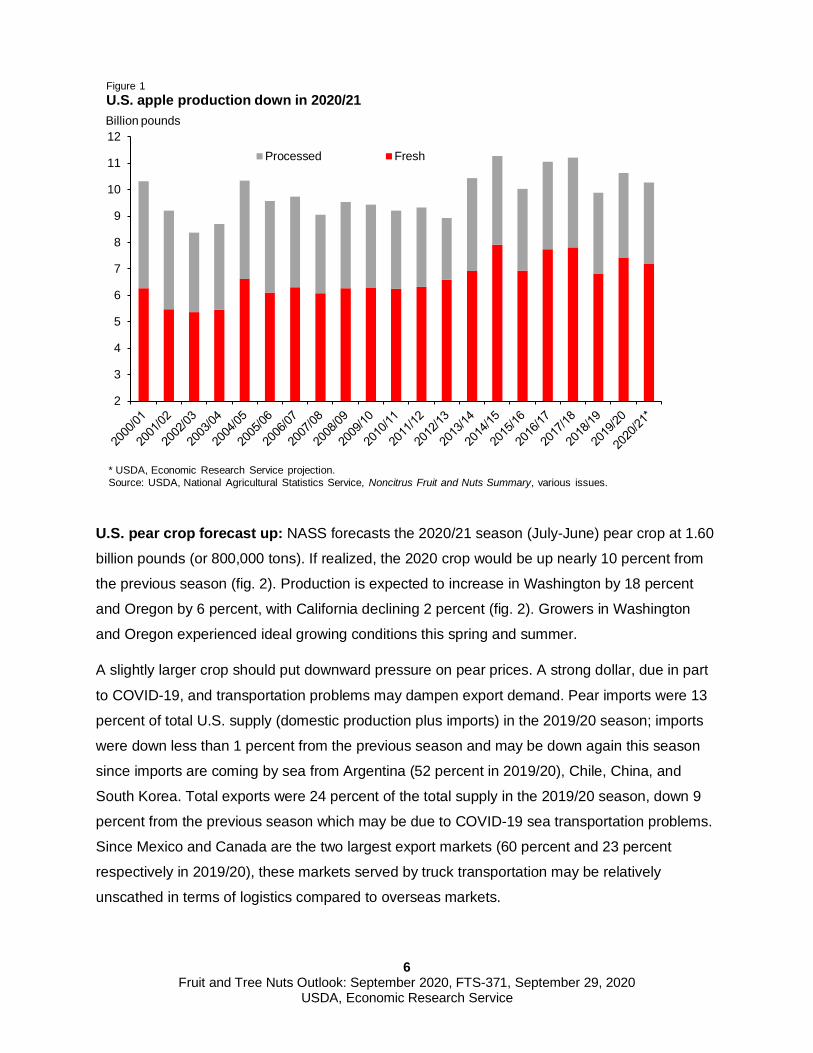
U.S. apple crop expected to be smaller: For the 2020/21 season (August-July) U.S.
production is forecast at 10.65 billion pounds, down 3 percent from a year ago (fig. 1).
Production is expected to be down in all States except for Oregon, which is a small producer.
The Washington crop is forecast to be 7.4 billion pounds, down 3 percent from last year. As for
all crops during the pandemic, the supply of labor is uncertain, which could affect the quantity of
apples harvested. Lower supplies could put upward pressure on prices. Between the 2010/11
and 2019/20 seasons, apple exports averaged 27 percent of total U.S. supply (production plus
imports). As long as high tariffs on apples remain in India and China, the export market will
probably remain sluggish, pushing more apples onto the domestic market and exerting
downward pressure on prices. Production in major States where apple processing is important
is forecast down 2 percent in New York, down 3 percent in Michigan, down 17 percent in
Pennsylvania, and down 16 percent in Virginia. This could push processed apple production
down and prices up.
6
Fruit and Tree Nuts Outlook: September 2020, FTS-371, September 29, 2020 USDA, Economic Research Service
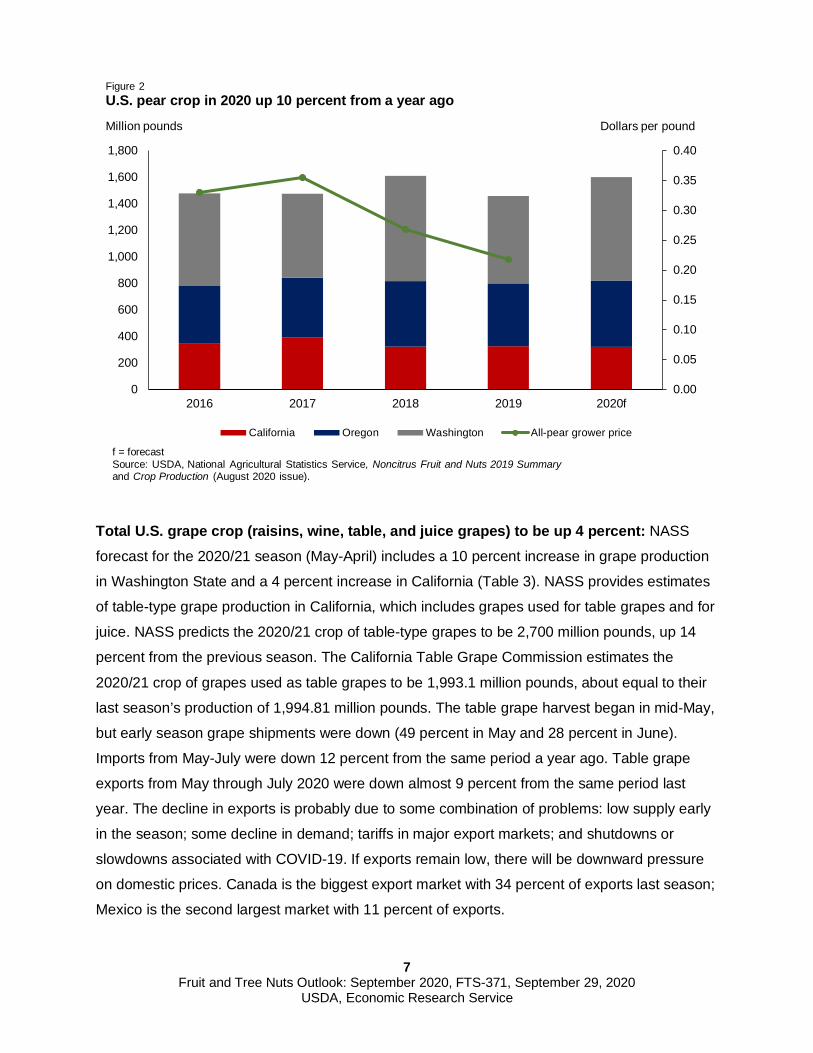
U.S. pear crop forecast up: NASS forecasts the 2020/21 season (July-June) pear crop at 1.60
billion pounds (or 800,000 tons). If realized, the 2020 crop would be up nearly 10 percent from
the previous season (fig. 2). Production is expected to increase in Washington by 18 percent
and Oregon by 6 percent, with California declining 2 percent (fig. 2). Growers in Washington
and Oregon experienced ideal growing conditions this spring and summer.
A slightly larger crop should put downward pressure on pear prices. A strong dollar, due in part
to COVID-19, and transportation problems may dampen export demand. Pear imports were 13
percent of total U.S. supply (domestic production plus imports) in the 2019/20 season; imports
were down less than 1 percent from the previous season and may be down again this season
since imports are coming by sea from Argentina (52 percent in 2019/20), Chile, China, and
South Korea. Total exports were 24 percent of the total supply in the 2019/20 season, down 9
percent from the previous season which may be due to COVID-19 sea transportation problems.
Since Mexico and Canada are the two largest export markets (60 percent and 23 percent
respectively in 2019/20), these markets served by truck transportation may be relatively
unscathed in terms of logistics compared to overseas markets.
2
3
4
5
6
7
8
9
10
11
12Processed Fresh
Figure 1U.S. apple production down in 2020/21Billion pounds
* USDA, Economic Research Service projection.Source: USDA, National Agricultural Statistics Service, Noncitrus Fruit and Nuts Summary, various issues.
7
Fruit and Tree Nuts Outlook: September 2020, FTS-371, September 29, 2020 USDA, Economic Research Service
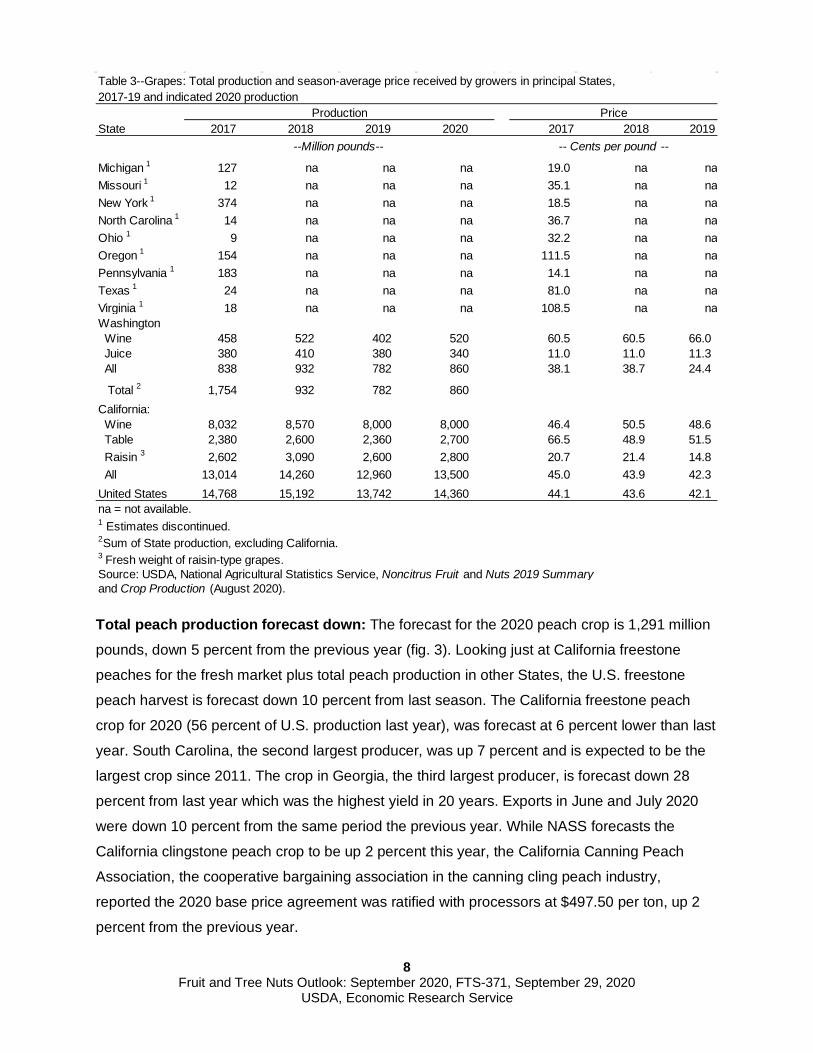
Total U.S. grape crop (raisins, wine, table, and juice grapes) to be up 4 percent: NASS
forecast for the 2020/21 season (May-April) includes a 10 percent increase in grape production
in Washington State and a 4 percent increase in California (Table 3). NASS provides estimates
of table-type grape production in California, which includes grapes used for table grapes and for
juice. NASS predicts the 2020/21 crop of table-type grapes to be 2,700 million pounds, up 14
percent from the previous season. The California Table Grape Commission estimates the
2020/21 crop of grapes used as table grapes to be 1,993.1 million pounds, about equal to their
last season’s production of 1,994.81 million pounds. The table grape harvest began in mid-May,
but early season grape shipments were down (49 percent in May and 28 percent in June).
Imports from May-July were down 12 percent from the same period a year ago. Table grape
exports from May through July 2020 were down almost 9 percent from the same period last
year. The decline in exports is probably due to some combination of problems: low supply early
in the season; some decline in demand; tariffs in major export markets; and shutdowns or
slowdowns associated with COVID-19. If exports remain low, there will be downward pressure
on domestic prices. Canada is the biggest export market with 34 percent of exports last season;
Mexico is the second largest market with 11 percent of exports.
0.00
0.05
0.10
0.15
0.20
0.25
0.30
0.35
0.40
0
200
400
600
800
1,000
1,200
1,400
1,600
1,800
2016 2017 2018 2019 2020f
California Oregon Washington All-pear grower price
f = forecastSource: USDA, National Agricultural Statistics Service, Noncitrus Fruit and Nuts 2019 Summaryand Crop Production (August 2020 issue).
Dollars per pound
Figure 2U.S. pear crop in 2020 up 10 percent from a year agoMillion pounds
8
Fruit and Tree Nuts Outlook: September 2020, FTS-371, September 29, 2020 USDA, Economic Research Service
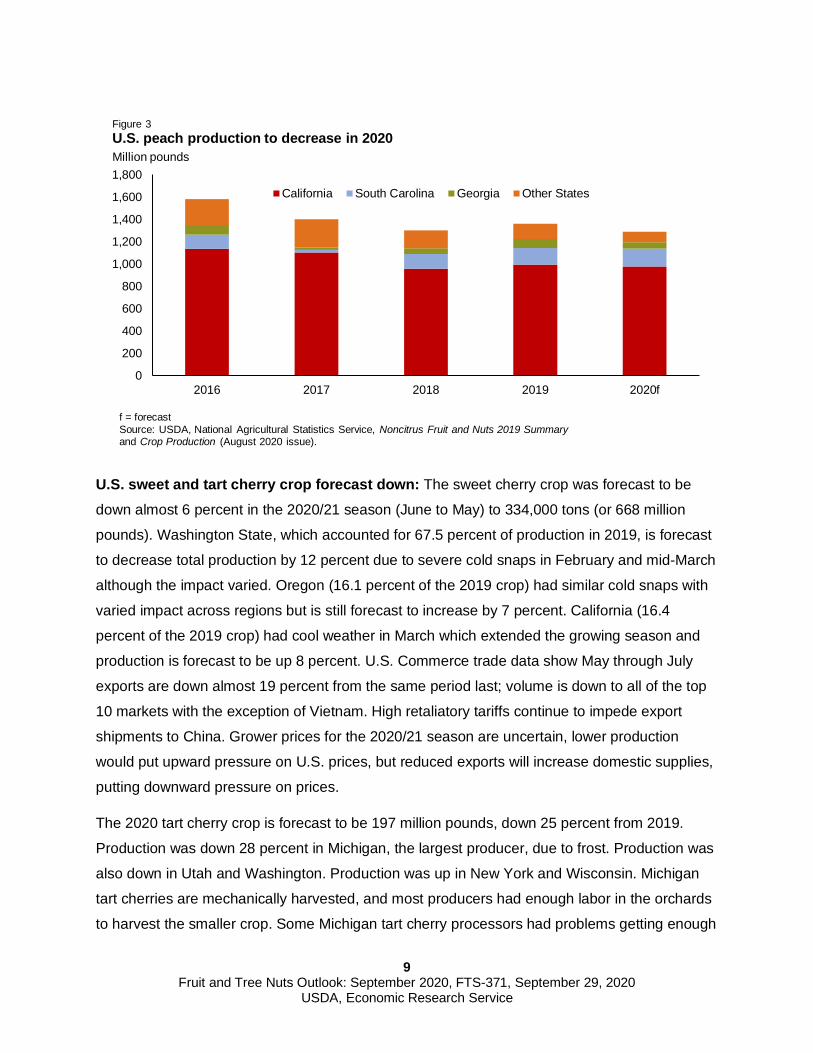
Total peach production forecast down: The forecast for the 2020 peach crop is 1,291 million
pounds, down 5 percent from the previous year (fig. 3). Looking just at California freestone
peaches for the fresh market plus total peach production in other States, the U.S. freestone
peach harvest is forecast down 10 percent from last season. The California freestone peach
crop for 2020 (56 percent of U.S. production last year), was forecast at 6 percent lower than last
year. South Carolina, the second largest producer, was up 7 percent and is expected to be the
largest crop since 2011. The crop in Georgia, the third largest producer, is forecast down 28
percent from last year which was the highest yield in 20 years. Exports in June and July 2020
were down 10 percent from the same period the previous year. While NASS forecasts the
California clingstone peach crop to be up 2 percent this year, the California Canning Peach
Association, the cooperative bargaining association in the canning cling peach industry,
reported the 2020 base price agreement was ratified with processors at $497.50 per ton, up 2
percent from the previous year.
Table 3--Grapes: Total production and season-average price received by growers in principal States, 2017-19 and indicated 2020 production
PriceState 2017 2018 2019 2020 2017 2018 2019
-- Cents per pound --
Michigan 1 127 na na na 19.0 na naMissouri 1 12 na na na 35.1 na naNew York 1 374 na na na 18.5 na naNorth Carolina 1 14 na na na 36.7 na naOhio 1 9 na na na 32.2 na naOregon 1 154 na na na 111.5 na naPennsylvania 1 183 na na na 14.1 na naTexas 1 24 na na na 81.0 na naVirginia 1 18 na na na 108.5 na naWashington Wine 458 522 402 520 60.5 60.5 66.0 Juice 380 410 380 340 11.0 11.0 11.3 All 838 932 782 860 38.1 38.7 24.4
Total 2 1,754 932 782 860California: Wine 8,032 8,570 8,000 8,000 46.4 50.5 48.6 Table 2,380 2,600 2,360 2,700 66.5 48.9 51.5 Raisin 3 2,602 3,090 2,600 2,800 20.7 21.4 14.8 All 13,014 14,260 12,960 13,500 45.0 43.9 42.3 United States 14,768 15,192 13,742 14,360 44.1 43.6 42.1 na = not available.1 Estimates discontinued.2Sum of State production, excluding California. 3 Fresh weight of raisin-type grapes.Source: USDA, National Agricultural Statistics Service, Noncitrus Fruit and Nuts 2019 Summaryand Crop Production (August 2020).
Production
--Million pounds--
9
Fruit and Tree Nuts Outlook: September 2020, FTS-371, September 29, 2020 USDA, Economic Research Service
U.S. sweet and tart cherry crop forecast down: The sweet cherry crop was forecast to be
down almost 6 percent in the 2020/21 season (June to May) to 334,000 tons (or 668 million
pounds). Washington State, which accounted for 67.5 percent of production in 2019, is forecast
to decrease total production by 12 percent due to severe cold snaps in February and mid-March
although the impact varied. Oregon (16.1 percent of the 2019 crop) had similar cold snaps with
varied impact across regions but is still forecast to increase by 7 percent. California (16.4
percent of the 2019 crop) had cool weather in March which extended the growing season and
production is forecast to be up 8 percent. U.S. Commerce trade data show May through July
exports are down almost 19 percent from the same period last; volume is down to all of the top
10 markets with the exception of Vietnam. High retaliatory tariffs continue to impede export
shipments to China. Grower prices for the 2020/21 season are uncertain, lower production
would put upward pressure on U.S. prices, but reduced exports will increase domestic supplies,
putting downward pressure on prices.
The 2020 tart cherry crop is forecast to be 197 million pounds, down 25 percent from 2019.
Production was down 28 percent in Michigan, the largest producer, due to frost. Production was
also down in Utah and Washington. Production was up in New York and Wisconsin. Michigan
tart cherries are mechanically harvested, and most producers had enough labor in the orchards
to harvest the smaller crop. Some Michigan tart cherry processors had problems getting enough
0
200
400
600
800
1,000
1,200
1,400
1,600
1,800
2016 2017 2018 2019 2020f
California South Carolina Georgia Other States
Figure 3U.S. peach production to decrease in 2020Million pounds
f = forecastSource: USDA, National Agricultural Statistics Service, Noncitrus Fruit and Nuts 2019 Summary and Crop Production (August 2020 issue).
10
Fruit and Tree Nuts Outlook: September 2020, FTS-371, September 29, 2020 USDA, Economic Research Service
labor. The bottleneck in processing led to some fruit never getting to the processor, while some
fruit was stored at the farm before going to the processor and the quality declined.
The fresh tart cherry market is less than 1 percent of tart cherry production with the rest going to
processing. Lower production and lower beginning tart cherry stocks (down 10 percent) will put
upward pressure on processed tart cherry prices. Imports of frozen tart cherries were down 46
percent in the January-July 2020 period compared to the same period the year before which will
put additional upward pressure on prices. Tart cherry exports were down 14 percent for the first
7 months of this year compared to the same period last year.
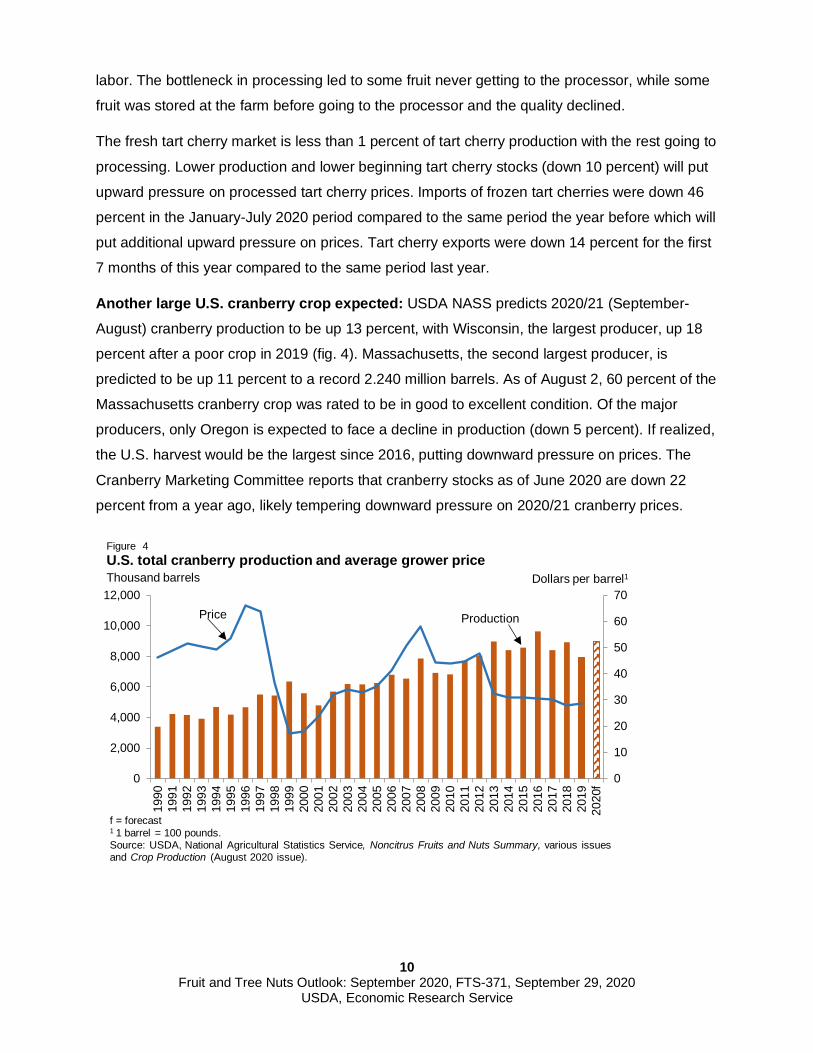
Another large U.S. cranberry crop expected: USDA NASS predicts 2020/21 (September-
August) cranberry production to be up 13 percent, with Wisconsin, the largest producer, up 18
percent after a poor crop in 2019 (fig. 4). Massachusetts, the second largest producer, is
predicted to be up 11 percent to a record 2.240 million barrels. As of August 2, 60 percent of the
Massachusetts cranberry crop was rated to be in good to excellent condition. Of the major
producers, only Oregon is expected to face a decline in production (down 5 percent). If realized,
the U.S. harvest would be the largest since 2016, putting downward pressure on prices. The
Cranberry Marketing Committee reports that cranberry stocks as of June 2020 are down 22
percent from a year ago, likely tempering downward pressure on 2020/21 cranberry prices.
0
10
20
30
40
50
60
70
0
2,000
4,000
6,000
8,000
10,000
12,000
1990
1991
1992
1993
1994
1995
1996
1997
1998
1999
2000
2001
2002
2003
2004
2005
2006
2007
2008
2009
2010
2011
2012
2013
2014
2015
2016
2017
2018
2019
2020
f
Figure 4U.S. total cranberry production and average grower priceThousand barrels Dollars per barrel1
f = forecast1 1 barrel = 100 pounds.Source: USDA, National Agricultural Statistics Service, Noncitrus Fruits and Nuts Summary, various issues and Crop Production (August 2020 issue).
ProductionPrice
11
Fruit and Tree Nuts Outlook: September 2020, FTS-371, September 29, 2020 USDA, Economic Research Service
Citrus Fruit Outlook Total U.S. Citrus Production is Down but Fresh Production is Up in 2019/20
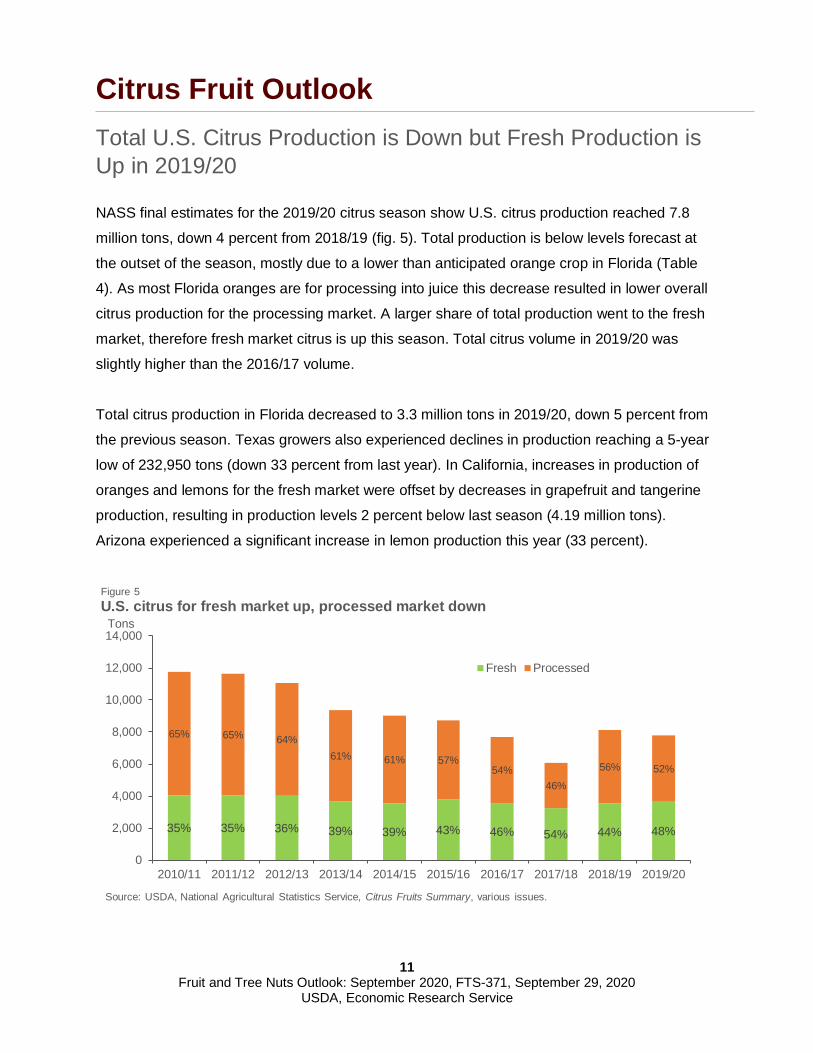
NASS final estimates for the 2019/20 citrus season show U.S. citrus production reached 7.8
million tons, down 4 percent from 2018/19 (fig. 5). Total production is below levels forecast at
the outset of the season, mostly due to a lower than anticipated orange crop in Florida (Table
4). As most Florida oranges are for processing into juice this decrease resulted in lower overall
citrus production for the processing market. A larger share of total production went to the fresh
market, therefore fresh market citrus is up this season. Total citrus volume in 2019/20 was
slightly higher than the 2016/17 volume.
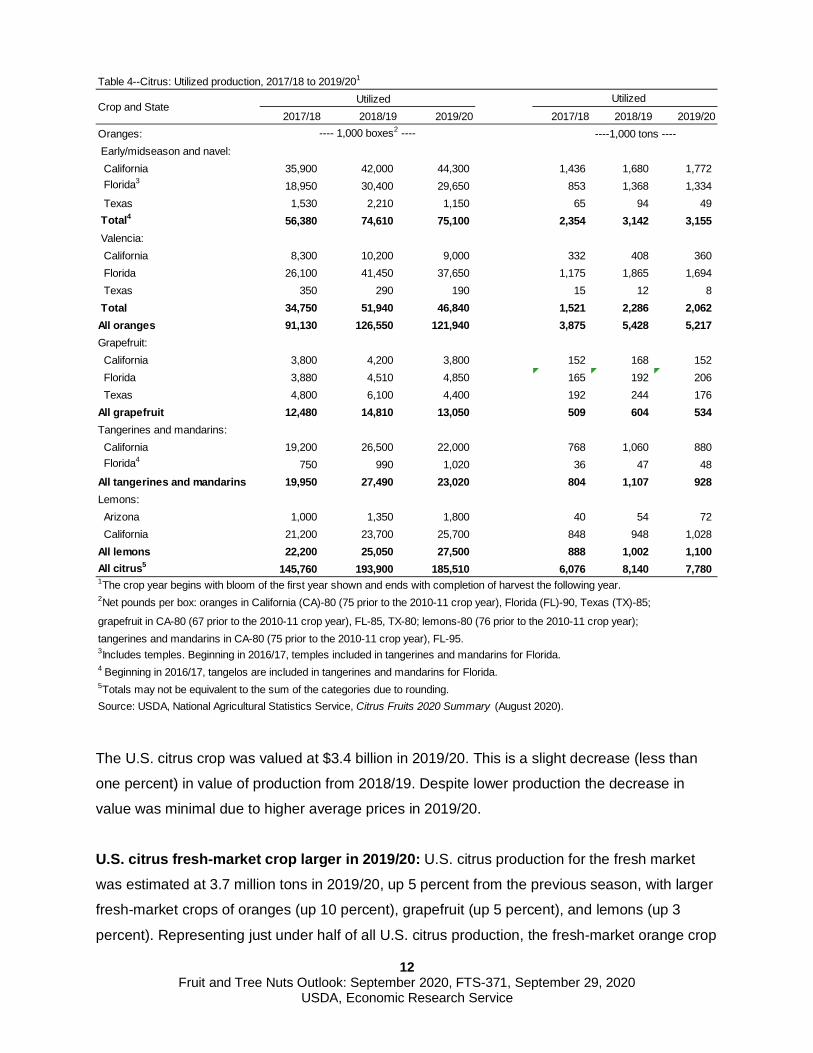
Total citrus production in Florida decreased to 3.3 million tons in 2019/20, down 5 percent from
the previous season. Texas growers also experienced declines in production reaching a 5-year
low of 232,950 tons (down 33 percent from last year). In California, increases in production of
oranges and lemons for the fresh market were offset by decreases in grapefruit and tangerine
production, resulting in production levels 2 percent below last season (4.19 million tons).
Arizona experienced a significant increase in lemon production this year (33 percent).
35% 35% 36% 39% 39% 43% 46% 54% 44% 48%
65% 65% 64%61% 61% 57%
54%46%
56% 52%
0
2,000
4,000
6,000
8,000
10,000
12,000
14,000
2010/11 2011/12 2012/13 2013/14 2014/15 2015/16 2016/17 2017/18 2018/19 2019/20
Tons
Figure 5U.S. citrus for fresh market up, processed market down
Fresh Processed
Source: USDA, National Agricultural Statistics Service, Citrus Fruits Summary, various issues.
12
Fruit and Tree Nuts Outlook: September 2020, FTS-371, September 29, 2020 USDA, Economic Research Service
The U.S. citrus crop was valued at $3.4 billion in 2019/20. This is a slight decrease (less than
one percent) in value of production from 2018/19. Despite lower production the decrease in
value was minimal due to higher average prices in 2019/20.
U.S. citrus fresh-market crop larger in 2019/20: U.S. citrus production for the fresh market
was estimated at 3.7 million tons in 2019/20, up 5 percent from the previous season, with larger
fresh-market crops of oranges (up 10 percent), grapefruit (up 5 percent), and lemons (up 3
percent). Representing just under half of all U.S. citrus production, the fresh-market orange crop
Table 4--Citrus: Utilized production, 2017/18 to 2019/201
Utilized2017/18 2018/19 2019/20 2017/18 2018/19 2019/20
Oranges: Early/midseason and navel: California 35,900 42,000 44,300 1,436 1,680 1,772 Florida3 18,950 30,400 29,650 853 1,368 1,334 Texas 1,530 2,210 1,150 65 94 49 Total4 56,380 74,610 75,100 2,354 3,142 3,155 Valencia: California 8,300 10,200 9,000 332 408 360 Florida 26,100 41,450 37,650 1,175 1,865 1,694 Texas 350 290 190 15 12 8 Total 34,750 51,940 46,840 1,521 2,286 2,062 All oranges 91,130 126,550 121,940 3,875 5,428 5,217 Grapefruit: California 3,800 4,200 3,800 152 168 152 Florida 3,880 4,510 4,850 165 192 206 Texas 4,800 6,100 4,400 192 244 176 All grapefruit 12,480 14,810 13,050 509 604 534 Tangerines and mandarins: California 19,200 26,500 22,000 768 1,060 880 Florida4 750 990 1,020 36 47 48 All tangerines and mandarins 19,950 27,490 23,020 804 1,107 928 Lemons: Arizona 1,000 1,350 1,800 40 54 72 California 21,200 23,700 25,700 848 948 1,028 All lemons 22,200 25,050 27,500 888 1,002 1,100 All citrus5 145,760 193,900 185,510 6,076 8,140 7,780 1The crop year begins with bloom of the first year shown and ends with completion of harvest the following year.2Net pounds per box: oranges in California (CA)-80 (75 prior to the 2010-11 crop year), Florida (FL)-90, Texas (TX)-85;
grapefruit in CA-80 (67 prior to the 2010-11 crop year), FL-85, TX-80; lemons-80 (76 prior to the 2010-11 crop year); tangerines and mandarins in CA-80 (75 prior to the 2010-11 crop year), FL-95.3Includes temples. Beginning in 2016/17, temples included in tangerines and mandarins for Florida.4 Beginning in 2016/17, tangelos are included in tangerines and mandarins for Florida.5Totals may not be equivalent to the sum of the categories due to rounding.
Crop and State Utilized
---- 1,000 boxes2 ---- ----1,000 tons ----
Source: USDA, National Agricultural Statistics Service, Citrus Fruits 2020 Summary (August 2020).
13
Fruit and Tree Nuts Outlook: September 2020, FTS-371, September 29, 2020 USDA, Economic Research Service
increased from the previous season to 1.88 million tons, thanks to larger fresh market crops in
California and Florida. Overall, the average equivalent-on-tree price for a box of fresh oranges
increased from $15.09 in 2018/19 to $17.08 in 2019/20, mostly due to higher prices in the
months of May, June, and July. These higher prices may suggest an increase in demand for
fresh oranges this season, as per capita availability is up 9 percent from 2018/19.
Whether this increase in prices over last year correspond to a temporary spike in demand or a
new trend in the market, remains to be seen. U.S. imports of fresh oranges in 2019/20
(November through July) were down 1 percent from the same period last year, while fresh
orange exports increased 8 percent to date. South Korea remained the top market for U.S. fresh
oranges, followed by Canada and Hong Kong.
Florida leads in grapefruit production in 2019/20: Florida led other States in grapefruit
production this season with Florida growers producing a combined 206,000 tons for the fresh
and processed markets. Texas came in second, producing 176,000 tons while California came
in last at 164,000 tons. This marks a 28 percent decrease in Texas grapefruit production from
last season, and the loss of Texas’s position as the lead grapefruit producing State. Declines in
grapefruit production in Texas in 2019/20 may be due to a prolonged drought that affected parts
of the Rio Grande Valley (Texas’s primary citrus producing region). Higher production levels of
grapefruit for the fresh market in Florida and California this season, however, more than offset
losses in Texas as total fresh-market production increased by 5 percent in 2019/20. Higher
average yields in Florida this season are likely due to favorable weather. Despite a larger fresh
market crop than last season, imports of fresh grapefruit from September through July 2019/20
were up by 3 percent from the same period last year, while exports were down by 2 percent.
There was a 6 percent increase in the amount of fresh grapefruit available in the U.S. this
season with per capita consumption at 1.53 pounds. This increase in domestic consumption is
reflected in lower average equivalent-on-tree grower prices in 2019/20 compared with last
season.
U.S. lemon crop in 2019/20 largest in decades: U.S. growers produced 1.1 million tons of
lemons in 2019/20 the largest lemon crop in 39 years. More than two-thirds of lemons (760,000
tons) went to the fresh market, a 3 percent increase in quantity over 2018/19. Higher yields in
both California and Arizona were likely due to favorable weather. Perhaps in response to the
larger crop, fresh lemon imports to the U.S. this season (August through July 2019/20) were
down by 22.4 million pounds (7 percent) from last season. Mexico, Chile, and Argentina remain
14
Fruit and Tree Nuts Outlook: September 2020, FTS-371, September 29, 2020 USDA, Economic Research Service
the main suppliers of lemons to the U.S. market, and together they supply 96 percent of lemon
imports into the United States. Additionally, U.S. fresh lemon exports this season lagged 3
percent behind 2018/19, continuing what is now a five-year trend in declining lemon exports.
Lower export volumes alongside higher domestic production increased the total supply of fresh
market lemons in the United States, with per capita consumption increasing by 2 percent in
2019/20. A greater supply of fresh lemons in the United States this season resulted in lower
grower prices, as the average equivalent-on-tree price per box fell from $24.91 in 2018/19 to
$20.55 (17 percent) in 2019/20.
Smaller U.S. tangerine crop in 2019/20: Production of U.S. tangerines, mandarins, and
tangelos for the fresh market is down by 13 percent (107,000 tons) this season due to smaller
crops in California. Imports for tangerines, mandarins, and tangelos were higher for the period
from November through July 2019/20, with 732 million pounds imported primarily from Chile,
Peru, and Morocco. The increase in imports did not compensate for the lower domestic
production; 2019/20 is the first time since 2006/07 that there was a year-over-year reduction in
the total quantity of tangerines, mandarins, and tangelos available for consumption in the United
States. Per capita consumption in 2019/20 was 6.23 pounds.
Majority of U.S. citrus goes to processing in 2019/20: The majority of U.S. citrus in 2019/20
(52 percent) went to the processing market, most of which was oranges. Florida produced 88
percent of all U.S oranges for processing while California and Texas produced the remainder.
All three of these States had smaller orange crops for the processing market in 2019/20
compared with 2018/19. Florida’s production levels were 7 percent below last season, while
California and Texas experienced decreases of 21 percent and 75 percent, respectively. A total
of 414 million gallons of orange juice were produced domestically in the United States in
2019/20, 10 percent below production from last season.
Orange juice imports to the U.S. from October to July 2019/20 were down by more than 184
million gallons (38 percent) from the same period last season. This decrease in orange juice
imports from 2018/19 may be due to higher than average beginning stocks (524 million gallons),
but also due to smaller crops in Brazil and Mexico. Brazil and Mexico remain the primary
suppliers of orange juice to the United States, accounting for 56 percent and 34 percent of the
orange juice imported. U.S. exports of orange juice from October to July 2019/20 increased over
last season by 13 percent (5.7 million gallons). Canada remains the primary export market for
15
Fruit and Tree Nuts Outlook: September 2020, FTS-371, September 29, 2020 USDA, Economic Research Service
U.S.-produced orange juice, accounting for 70 percent of exports. The Dominican Republic and
South Korea were the second and third largest purchasers of U.S. orange juice, accounting for
9 and 4 percent of U.S. exports, respectively.
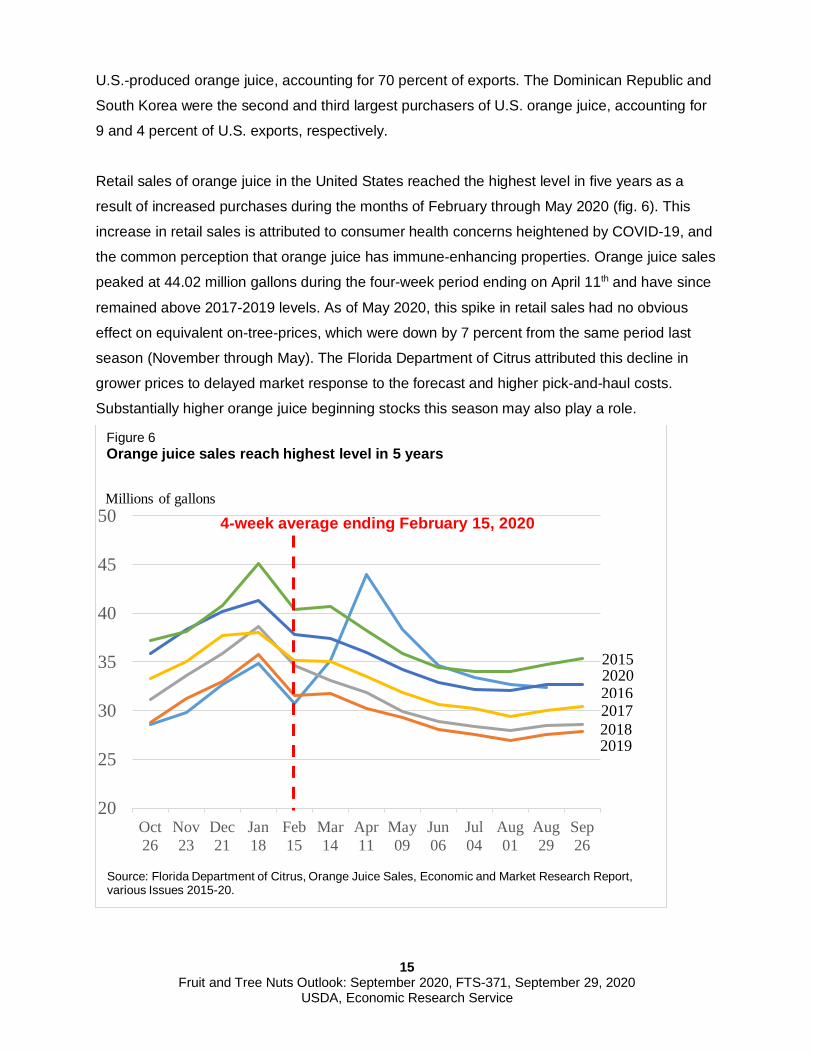
Retail sales of orange juice in the United States reached the highest level in five years as a
result of increased purchases during the months of February through May 2020 (fig. 6). This
increase in retail sales is attributed to consumer health concerns heightened by COVID-19, and
the common perception that orange juice has immune-enhancing properties. Orange juice sales
peaked at 44.02 million gallons during the four-week period ending on April 11th and have since
remained above 2017-2019 levels. As of May 2020, this spike in retail sales had no obvious
effect on equivalent on-tree-prices, which were down by 7 percent from the same period last
season (November through May). The Florida Department of Citrus attributed this decline in
grower prices to delayed market response to the forecast and higher pick-and-haul costs.
Substantially higher orange juice beginning stocks this season may also play a role.
20
25
30
35
40
45
50
Oct26
Nov23
Dec21
Jan18
Feb15
Mar14
Apr11
May09
Jun06
Jul04
Aug01
Aug29
Sep26
4-week average ending February 15, 2020
Figure 6Orange juice sales reach highest level in 5 years
Millions of gallons
2015
2016201720182019
2020
Source: Florida Department of Citrus, Orange Juice Sales, Economic and Market Research Report, various Issues 2015-20.
16
Fruit and Tree Nuts Outlook: September 2020, FTS-371, September 29, 2020 USDA, Economic Research Service
U.S. grapefruit for processing is down in 2019/20 U.S. grapefruit production for the processing market was down by 84,856 tons (26 percent) in
2019/20 due to decreased production levels in California and Texas. This smaller crop for the
processing market resulted in a 22 percent reduction in grapefruit juice production in 2019/20.
Similar to the orange juice market, retail sales of grapefruit juice experienced a brief uptick from
February-May 2020, peaking at 1.14 million gallons during the four-week period ending April 11.
This brief increase in retail sales did not evidently result in higher consumption levels however,
as cold storage data from the Florida Department of Citrus and NASS indicate higher ending
inventories than in 2018/19.
U.S. import levels of grapefruit juice this season (3.91 million gallons) are less than a third of
what they were in 2018/19. The primary suppliers of grapefruit juice to the United States were
Mexico, South Africa, and Spain. Grapefruit juice exports are down 17 percent this season for
October to July 2019/20. The three top export markets for U.S. grapefruit juice for October to
July 2019/20 were Canada, Japan, and Belgium. U.S. grapefruit juice exports have decreased
every year since the 2010/11 season. This trend may indicate changing consumer preferences
in primary destination markets.
U.S. Citrus Production 2020/21 Likely Below 2019/20 Levels
NASS will release initial 2020/21 forecasts for all-citrus production in the United States in
October. However, an early forecast pegs navel orange production in California at 84 million 40-
pound cartons, down 5 percent from the previous year, according to the 2020/21 California
Navel Orange Objective Measurement Report released September 11 by the NASS Pacific
Regional Office. This forecast decrease in production is most likely due to a reduction in bearing
acreage, as forecast average fruit size was slightly larger and fruit set was unchanged from the
previous year.
The results of the first orange and grapefruit maturity tests for Florida’s 2020/21 season were
published by NASS on September 11. Sampled fruit included early oranges, midseason
oranges, and red and white seedless grapefruit. The survey shows that all oranges and
grapefruit have lower unfinished juice and solids per box for 2020/21, compared with the same
time last season, suggesting a lower saleable juice yield per box in 2020/21.
17
Fruit and Tree Nuts Outlook: September 2020, FTS-371, September 29, 2020 USDA, Economic Research Service
Citrus greening disease, also known as Huanglongbing (HLB), remains a threat to citrus grove
health and productivity across all producing States. In Florida, where greening is rampant, total
bearing acreage decreased by 1.7 percent this season to 380,500 acres. In the other citrus
producing States greening is less prevalent yet can lead to higher production costs, especially
as infected trees are removed and or replaced. In 2019/20 there was a modest increase in total
bearing acreage of California citrus (700 acres) over last season, mostly due to new lemon and
tangerine acreage, but acreage devoted to orange production declined by 2000 acres (1
percent). In contrast, Texas had a 3 percent (700 acre) reduction in total citrus bearing acreage
from the 2018/19 season. Assuming these trends continue, expect total production in 2020/21 to
be slightly below 2019/20 levels.
While greening continues to affect U.S. citrus production, hope remains for the long-term
viability of the industry. The 2019/20 season provided multiple reasons to remain cautiously
optimistic about the future of U.S. citrus: there was a notable spike in juice sales which,
according to Citrus Industry News, suggests that the American public still values orange juice
for its health benefits; there was continued slowdown of acreage loss rates due to greening
thanks to comprehensive greening management strategies; and plant pathologists at University
of California, Riverside have discovered a peptide in finger limes that may eventually lead to
future treatments or even a cure for citrus greening.
18
Fruit and Tree Nuts Outlook: September 2020, FTS-371, September 29, 2020 USDA, Economic Research Service
Tree Nuts Outlook Record High Almond, Walnut, and Hazelnut Production Forecast
The 2020/21 season is underway for many tree crops with record-high supplies of almond,
walnut, and hazelnut crops expected. In the previous season (2019/20) lower production, overall
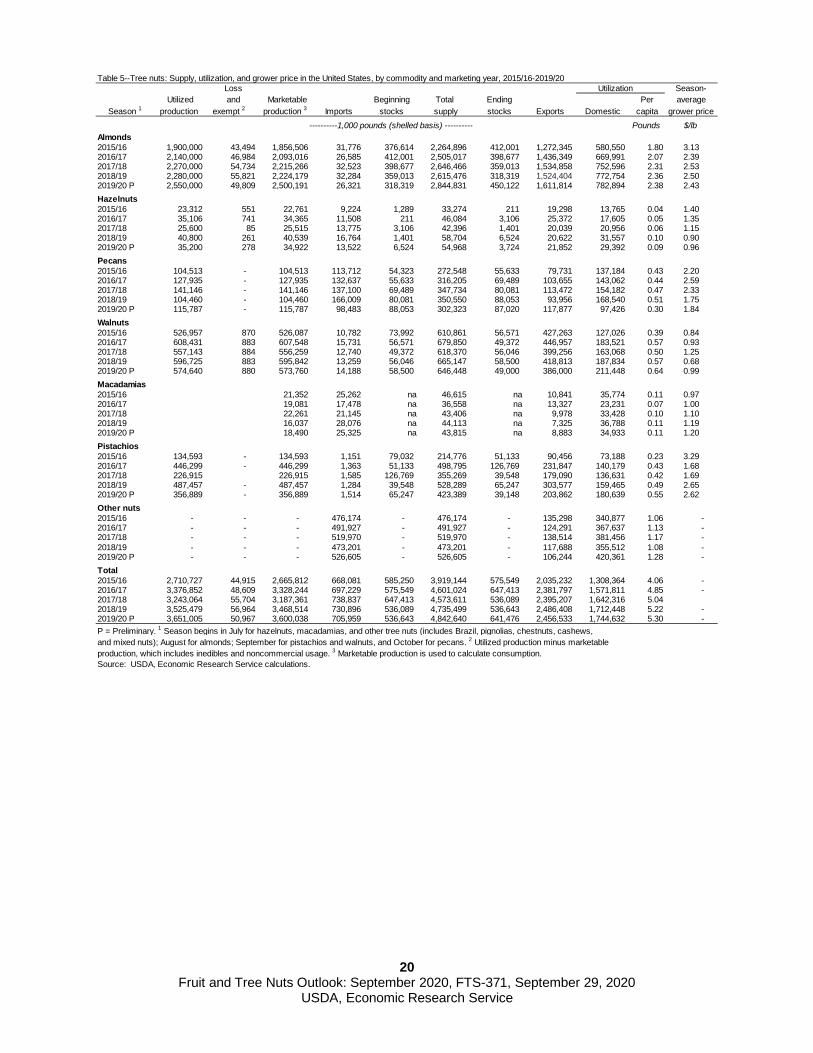
lower U.S. imports, and an increase in demand generally increased grower prices (Table 5).
COVID-19 and high tariffs reduced overall U.S. exports. The marketable quantity of all U.S. tree
nuts, led by almonds, was estimated at 3.6 billion pounds (shelled basis) in 2019/20, up 4
percent from the previous season. Smoke from the recent wildfires in California and Oregon
affected the air quality but it’s still uncertain the impact on the tree nut crop.
Almond crop expected to be another record high in 2020/21: The 2019/20 (August-July)
almond season saw a record-setting domestic crop, and fairly strong demand (Table 5).
Consumption likely increased as many stocked up during the COVID-19 shutdown. U.S. exports
increased 6 percent from the previous season. Despite port issues and high tariffs, exports to
India and China increased. Exports to Germany also increased. According to the 2020
California Almond Objective Measurement Report released by NASS on July 7, another record-
setting 3-billion-pound crop (shelled basis) is forecast for the 2020/21 season, up 18 percent
from 2019/20. Bearing acreage rose to 1.26 million acres in 2020. California experienced good
growing conditions with dry, hot weather in May and June in the final stages of production. The
forecast larger crop, and high stocks carried over from last season, are expected to increase
supplies in the domestic market and likely will put downward pressure on 2020/21 grower
prices.
Walnut production forecast to increase in 2020/21: In the 2019/20 (September to August)
season, lower production and higher imports led to increased domestic consumption and
reduced ending stocks (Table 5, reported on shelled basis). Tariffs in China, COVID-19 port
issues, and lower U.S. supplies, reduced U.S. walnut exports from the previous season. The
2020 California Walnut Objective Measurement Report, released by NASS on August 28,
forecast walnut production for the 2020/21 season at a record 1.56 billion pounds (or 780,000
tons), in-shell basis, up 19 percent from last year. This forecast is based on 380,000 bearing
acres, up 4 percent, and average nut per tree of 1,197, up 22 percent from last year.
19
Fruit and Tree Nuts Outlook: September 2020, FTS-371, September 29, 2020 USDA, Economic Research Service
Hazelnut production soars in 2020/21: Oregon’s 2020 hazelnut crop is forecast to be 61
percent larger than the 2019 crop which was an “off-year” cycle in the alternate bearing
tendency of hazelnut trees. A smaller crop, low carryover stocks in 2019/20 (July-June) and
smaller imports in 2019/20 put upward pressure on grower prices this season. The large
2020/21 season crop could put downward pressure on grower prices.
Low U.S. pistachio exports in 2019/20: In the 2019/20 season (September-August) U.S.
production dropped 27 percent due to lower yields in an off-year. U.S. exports dropped 33
percent with large decreases to key markets Hong Kong, India, and Turkey through July,
compared to a year ago. High tariffs affected U.S. exports prior to COVID-19 port closures. Iran
and the United States are the top suppliers of pistachios. Iran’s exports are expected to
increase while U.S. supplies are down. High beginning stocks and low exports likely put
downward pressure on grower prices.
Lower U.S. pecan consumption in 2019/20: Domestic pecan production was up 11 percent in
2019/20 (October-September) and in-shell pecans in storage also went up. Imports were down
from top U.S. supplier Mexico after a record setting year in 2018/19. High year-to-date exports
to China, Thailand, and South Korea likely decreased U.S consumption and drove up 2019/20
grower prices from the previous season. The rise in prices in 2019/20 drove the crop value to
$471 million, up 12 percent from the previous season. NASS will release the initial U.S. pecan
production forecast for the 2020/21 season in its October 2020 Crop Production report.
Macadamia nut production is up: In the 2019/20 (July-June) season, Hawaii’s bearing acres
remained unchanged, yield per acre increased 320 pounds, and production increased 15
percent from the previous season. Exports increased 21 percent from last year. The export
volumes were up to Japan and Canada, top macadamia export markets. Imports, mainly from
South Africa and Australia, slightly decreased. Domestic consumption and grower prices
remained steady from the previous year.
20
Fruit and Tree Nuts Outlook: September 2020, FTS-371, September 29, 2020 USDA, Economic Research Service
Table 5--Tree nuts: Supply, utilization, and grower price in the United States, by commodity and marketing year, 2015/16-2019/20Loss Utilization Season-
Utilized and Marketable Beginning Total Ending Per averageSeason 1 production exempt 2 production 3 Imports stocks supply stocks Exports Domestic capita grower price
Pounds $/lbAlmonds2015/16 1,900,000 43,494 1,856,506 31,776 376,614 2,264,896 412,001 1,272,345 580,550 1.80 3.132016/17 2,140,000 46,984 2,093,016 26,585 412,001 2,505,017 398,677 1,436,349 669,991 2.07 2.392017/18 2,270,000 54,734 2,215,266 32,523 398,677 2,646,466 359,013 1,534,858 752,596 2.31 2.532018/19 2,280,000 55,821 2,224,179 32,284 359,013 2,615,476 318,319 1,524,404 772,754 2.36 2.502019/20 P 2,550,000 49,809 2,500,191 26,321 318,319 2,844,831 450,122 1,611,814 782,894 2.38 2.43Hazelnuts2015/16 23,312 551 22,761 9,224 1,289 33,274 211 19,298 13,765 0.04 1.402016/17 35,106 741 34,365 11,508 211 46,084 3,106 25,372 17,605 0.05 1.352017/18 25,600 85 25,515 13,775 3,106 42,396 1,401 20,039 20,956 0.06 1.152018/19 40,800 261 40,539 16,764 1,401 58,704 6,524 20,622 31,557 0.10 0.902019/20 P 35,200 278 34,922 13,522 6,524 54,968 3,724 21,852 29,392 0.09 0.96Pecans2015/16 104,513 - 104,513 113,712 54,323 272,548 55,633 79,731 137,184 0.43 2.202016/17 127,935 - 127,935 132,637 55,633 316,205 69,489 103,655 143,062 0.44 2.592017/18 141,146 - 141,146 137,100 69,489 347,734 80,081 113,472 154,182 0.47 2.332018/19 104,460 - 104,460 166,009 80,081 350,550 88,053 93,956 168,540 0.51 1.752019/20 P 115,787 - 115,787 98,483 88,053 302,323 87,020 117,877 97,426 0.30 1.84Walnuts2015/16 526,957 870 526,087 10,782 73,992 610,861 56,571 427,263 127,026 0.39 0.842016/17 608,431 883 607,548 15,731 56,571 679,850 49,372 446,957 183,521 0.57 0.932017/18 557,143 884 556,259 12,740 49,372 618,370 56,046 399,256 163,068 0.50 1.252018/19 596,725 883 595,842 13,259 56,046 665,147 58,500 418,813 187,834 0.57 0.682019/20 P 574,640 880 573,760 14,188 58,500 646,448 49,000 386,000 211,448 0.64 0.99Macadamias2015/16 21,352 25,262 na 46,615 na 10,841 35,774 0.11 0.972016/17 19,081 17,478 na 36,558 na 13,327 23,231 0.07 1.002017/18 22,261 21,145 na 43,406 na 9,978 33,428 0.10 1.102018/19 16,037 28,076 na 44,113 na 7,325 36,788 0.11 1.192019/20 P 18,490 25,325 na 43,815 na 8,883 34,933 0.11 1.20Pistachios2015/16 134,593 - 134,593 1,151 79,032 214,776 51,133 90,456 73,188 0.23 3.292016/17 446,299 - 446,299 1,363 51,133 498,795 126,769 231,847 140,179 0.43 1.682017/18 226,915 226,915 1,585 126,769 355,269 39,548 179,090 136,631 0.42 1.692018/19 487,457 - 487,457 1,284 39,548 528,289 65,247 303,577 159,465 0.49 2.652019/20 P 356,889 - 356,889 1,514 65,247 423,389 39,148 203,862 180,639 0.55 2.62Other nuts2015/16 - - - 476,174 - 476,174 - 135,298 340,877 1.06 - 2016/17 - - - 491,927 - 491,927 - 124,291 367,637 1.13 - 2017/18 - - - 519,970 - 519,970 - 138,514 381,456 1.17 - 2018/19 - - - 473,201 - 473,201 - 117,688 355,512 1.08 - 2019/20 P - - - 526,605 - 526,605 - 106,244 420,361 1.28 - Total2015/16 2,710,727 44,915 2,665,812 668,081 585,250 3,919,144 575,549 2,035,232 1,308,364 4.06 - 2016/17 3,376,852 48,609 3,328,244 697,229 575,549 4,601,024 647,413 2,381,797 1,571,811 4.85 - 2017/18 3,243,064 55,704 3,187,361 738,837 647,413 4,573,611 536,089 2,395,207 1,642,316 5.042018/19 3,525,479 56,964 3,468,514 730,896 536,089 4,735,499 536,643 2,486,408 1,712,448 5.22 - 2019/20 P 3,651,005 50,967 3,600,038 705,959 536,643 4,842,640 641,476 2,456,533 1,744,632 5.30 - P = Preliminary. 1 Season begins in July for hazelnuts, macadamias, and other tree nuts (includes Brazil, pignolias, chestnuts, cashews, and mixed nuts); August for almonds; September for pistachios and walnuts, and October for pecans. 2 Utilized production minus marketable production, which includes inedibles and noncommercial usage. 3 Marketable production is used to calculate consumption.Source: USDA, Economic Research Service calculations.
----------1,000 pounds (shelled basis) ----------
21
Fruit and Tree Nuts Outlook: September 2020, FTS-371, September 29, 2020 USDA, Economic Research Service
Special Article The Initial Impact of COVID-19 on the Fruit Industry:
Apples, Table Grapes, and Strawberries, March-June 20201
Jaclyn Kramer and Linda Calvin
This paper looks at the initial impact of COVID-19 (March-June) on three commodities: apples,
table grapes, and strawberries for the fresh market. The USDA National Agricultural Statistics
Service (NASS) Noncitrus Fruit and Nuts 2019 Summary released in May 2020 reported the
total noncitrus crop value was $15.4 billion in 2019. The top three crops, apples, strawberries,
and grapes (including table, raisin, and wine grapes), accounted for 71 percent of the total
value. Beginning in March 2020, the produce industry faced many shocks. The pandemic led to
both supply and demand issues.
By the time stay-at-home orders were put in place in March in the United States, most of the
decisions about production for 2020 had been made. Apples and table grapes are perennials
and the acreage is fixed, although supply may be affected by weather, labor availability,
consumer demand, prices, and management decisions. Strawberries, an annual crop, were
planted last fall for winter, spring, and summer harvest. This summer, California growers will
plant for the fall season and there could be changes in plans in response to the COVID-19
situation at that point. Similarly, Florida strawberry growers could make changes for their
upcoming season. Each of these crops is hand harvested which makes the industries very
dependent on the availability and the continued good health of their workers, which is now
uncertain. Costs have increased as firms provide more personal protective equipment to
workers. In some cases, firms stagger worker schedules to improve social distancing, which can
also raise costs. Imports are also an important part of the supply available to consumers in the
United States. Because perishable table grapes and strawberries have large imports to supply
the market in the off-season or low-production periods, those shipments are also considered. In
this case, which suppliers are hit hardest depends on when they harvest. Apples are storable
allowing for more domestic year-round availability. While all three crops have processing
options, usually a drastic alternative when the demand in the fresh market is down (grower
1 The report relies on information available at the end of June 2020.
22
Fruit and Tree Nuts Outlook: September 2020, FTS-371, September 29, 2020 USDA, Economic Research Service
returns for processing are a fraction of fresh receipts), a shift to the processed market did not
occur through early summer.
Consumer demand is also uncertain. The global pandemic increased consumption at home and
decreased food consumed at foodservice venues. On average, fruit is one of the commodity
groups with a higher percent of product consumed at home (as opposed to foodservice venues)
and has been less affected by the stay-at-home order than other commodity groups. According
to Consumer Diets Surveys, on average 84 percent of fruit was consumed at home from 2013-
16. At-home food is sourced mainly from grocery stores, although during the pandemic the
demand for on-line food services has grown. Information Resources Inc. scanner data shows a
spike of sales for fresh fruit in mid-March 2020 of roughly 28 percent compared with 2019, as
many consumers stocked up in preparation for the quarantine. After that, the average number of
consumer trips to the grocery stores from April to early June 2020 declined compared to the
same time period in 2019.
Apples
The United States is one of the largest producers and consumers of apples. Total U.S. utilized
production in 2019/20 season (August-July) was 53 million tons with 70 percent destined for the
fresh market. In the 2018/19 season imports accounted for about 4 percent of total supply
(domestic production and imports) and exports accounted for 23 percent of supply. Exports are
a critical component of industry health, but export growth has slowed over the last few years, in
part due to retaliatory tariffs in China and India. Washington is the largest producer for the fresh
market and in May 2020 USDA NASS estimated 79 percent of its utilized production going to
the fresh market in 2019/20. The rest of this discussion focusses on the Washington industry.
Apples are harvested in the fall; those that are not sold immediately are stored in
packinghouses. Over the following year packinghouses take apples out of storage, run them
through a packing line, and ship the apples to buyers. Since apples are picked by hand, the fall
harvest requires a huge labor force. Field workers are used for the rest of the year in smaller
numbers for pruning and other between-harvest production tasks. The packinghouse operations
require a much smaller labor force employed throughout the year.
As of June 2020, on the supply side, COVID-19 has primarily affected packinghouses. On June
14, Northwest Public Radio reported that Yakima County, Washington, had the most COVID-19
cases per capita of West Coast counties and that the main hot spots were long-term care
23
Fruit and Tree Nuts Outlook: September 2020, FTS-371, September 29, 2020 USDA, Economic Research Service
facilities and agriculture. Yakima is part of the important apple production area in Washington.
Other commodity industries could look at the COVID-19 situation in Yakima with concern. In
May 2020 workers mounted short strikes in several Yakima-area packinghouses over demands
for more protective equipment. The strikes were resolved. The governor of Washington issued
an emergency executive order in response to COVID-19 that requires new safety precautions in
both packinghouses and orchards. Costs increased with provision of protective equipment and
spacing workers to social distance, which slows down the packing lines.
Apples are storable and a short slow-down of packing would not have much of an impact on the
apple supply (although it would be a problem for marketing). A small harvest labor force, due to
fewer numbers of workers to start with or a large number of ill workers in the fall when there is
limited time to harvest the crop, would greatly affect the supply of apples next season. In the
past the apple industry struggled to get the 60,000-70,000 workers needed to harvest the crop.
Growers who did not have enough labor were forced to make tough choices about which apples
to harvest. This decision is a function of relative varietal supplies and prices, domestic and
international market conditions, and labor costs. This year the pandemic has further highlighted
the usual uncertainty about labor availability.
The Washington apple industry uses a lot of H2-A labor, which requires providing housing and
transportation to the workplace for workers hired under this program. In practice, housing
provided by employers for their H-2A workers is usually collective, with multiple workers sharing
a living space. Although housing accommodations must conform to program rules and local
occupancy rates, social distancing recommendations in light of COVID-19 may render such
accommodations inadequate. Given the time frame, it wasn’t possible to build enough new
housing to provide social distancing during the pandemic. In addition, after the pandemic,
additional housing might not be needed. Busing people to work posed another challenge. It
would be difficult to get enough buses and licensed drivers to take workers to the orchards if
workers were spread six feet apart. Washington State made an emergency rule for all
temporary worker housing licensed by the State or provided by employers to cope with the
COVID-19 situation, including H2-A housing. The rule called for the following: workers will
socially isolate together in small groups they will live, eat, travel in buses, and work in the
orchards as a group. If one person in a small group gets sick it reduces the chance of a larger
group of workers getting sick. Growers must schedule buses to make multiple trips to bring the
workers to the orchards.
24
Fruit and Tree Nuts Outlook: September 2020, FTS-371, September 29, 2020 USDA, Economic Research Service
Using H-2A labor comes with many restrictions so it is not very flexible once the workers are in
place. For example, if a grower decides to stop harvesting, the worker is entitled to collect pay
for three quarters of the contracted period. Some growers may be reducing H-2A labor in 2020
because of the inflexibility in the face of a very uncertain season, therefore, accepting a
potentially smaller harvest.
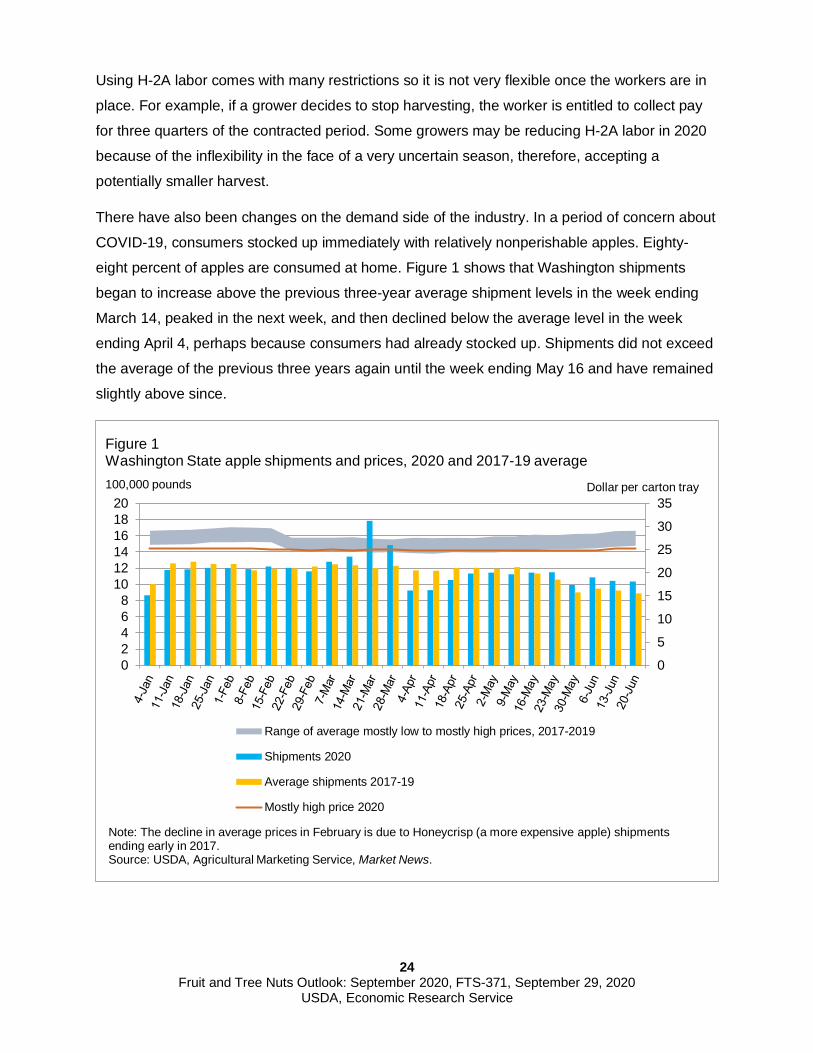
There have also been changes on the demand side of the industry. In a period of concern about
COVID-19, consumers stocked up immediately with relatively nonperishable apples. Eighty-
eight percent of apples are consumed at home. Figure 1 shows that Washington shipments
began to increase above the previous three-year average shipment levels in the week ending
March 14, peaked in the next week, and then declined below the average level in the week
ending April 4, perhaps because consumers had already stocked up. Shipments did not exceed
the average of the previous three years again until the week ending May 16 and have remained
slightly above since.
0
5
10
15
20
25
30
35
02468
101214161820
Range of average mostly low to mostly high prices, 2017-2019
Shipments 2020
Average shipments 2017-19
Mostly high price 2020
100,000 pounds
Figure 1Washington State apple shipments and prices, 2020 and 2017-19 average
Dollar per carton tray
Note: The decline in average prices in February is due to Honeycrisp (a more expensive apple) shipments ending early in 2017.Source: USDA, Agricultural Marketing Service, Market News.
25
Fruit and Tree Nuts Outlook: September 2020, FTS-371, September 29, 2020 USDA, Economic Research Service
Sales of whole apples to the food service industry is a small share of the industry, so the impact
of these apples returning to the general pool of apples for sale did not cause much disruption.
Apples that are sliced and put into small bags for schools and quick service restaurants (QSR)
likely had a decline in demand as schools and in-restaurant dining ceased. Most QSRs,
however, kept their take-out operations going. Any apples that were initially slated to go into the
sliced snack apple industry could be put back into the supply of apples available as whole fruit.
At the same time, export markets demand has slowed. Washington apples transported by sea-
going vessels take three to six weeks to arrive, depending on the destination. Apples shipped
just prior to the pandemic might have arrived in ports that were locked down without workers to
unload, provide cold storage, and transport products to wholesale markets that might also be
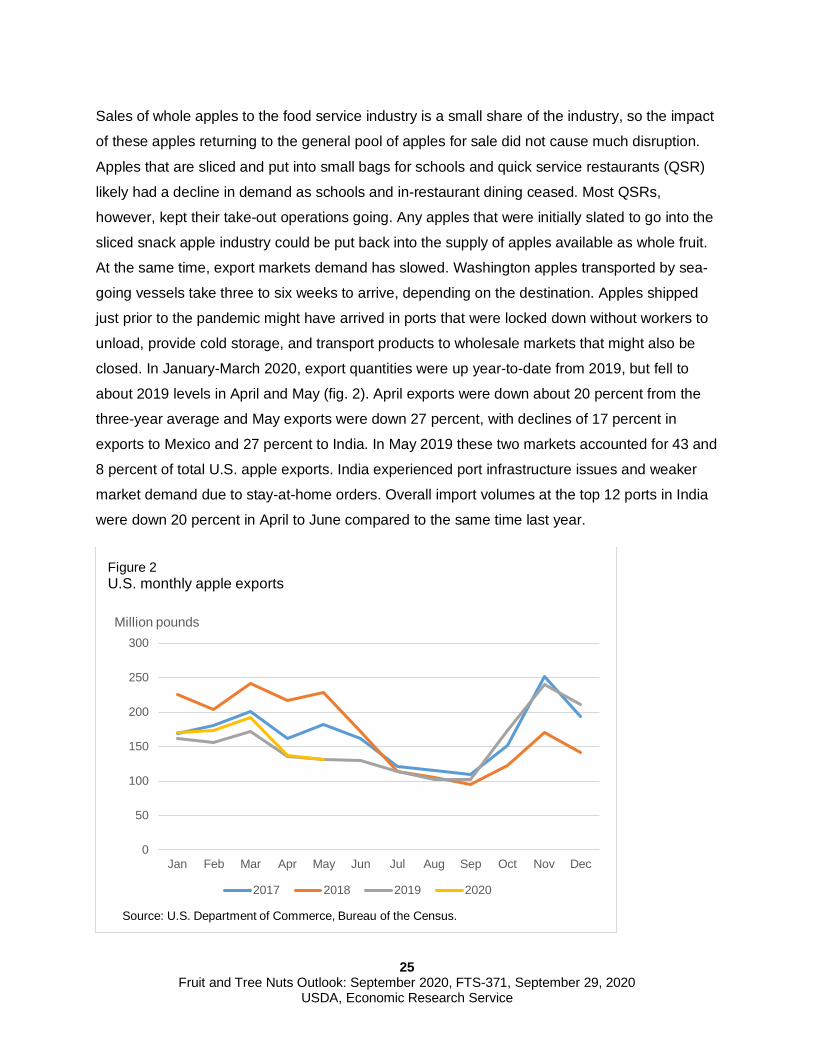
closed. In January-March 2020, export quantities were up year-to-date from 2019, but fell to
about 2019 levels in April and May (fig. 2). April exports were down about 20 percent from the
three-year average and May exports were down 27 percent, with declines of 17 percent in
exports to Mexico and 27 percent to India. In May 2019 these two markets accounted for 43 and
8 percent of total U.S. apple exports. India experienced port infrastructure issues and weaker
market demand due to stay-at-home orders. Overall import volumes at the top 12 ports in India
were down 20 percent in April to June compared to the same time last year.
0
50
100
150
200
250
300
Jan Feb Mar Apr May Jun Jul Aug Sep Oct Nov Dec
Million pounds
Figure 2U.S. monthly apple exports
2017 2018 2019 2020
Source: U.S. Department of Commerce, Bureau of the Census.
26
Fruit and Tree Nuts Outlook: September 2020, FTS-371, September 29, 2020 USDA, Economic Research Service
The 2019/20 season apple harvest was up 8 percent from the previous year and cold storage
stocks are large, which helps explain why prices in 2020 are below or very close to the 3-year
average mostly low price based on USDA Agricultural Marketing Service (AMS) shipping point
prices.2 The U.S. Apple Commission reported June 2020 fresh apple holdings were 34.1 million
bushels, up 23 percent from June 2019 and 26 percent greater than the five-year average of 27
million bushels. Total processed apple holdings were 13.8 million bushels, 28 percent greater
than June 2019 and 25 percent greater than the five-year average. The U.S. Apple Commission
reported total holdings of 47.9 million bushels of fresh and processing apples. That is equivalent
to an unprecedented 19 percent of the 2019/20 crop, up 24 percent compared to June 2019.
Apple prices are generally stable over time compared to other fruit. Once the harvest is in,
shippers know the supply for the next year and price accordingly. Shippers do not have to
respond to day-to-day fluctuations in supply and price as is the case for strawberry growers, for
example. Average apple prices were fairly even during the first few months of the outbreak with
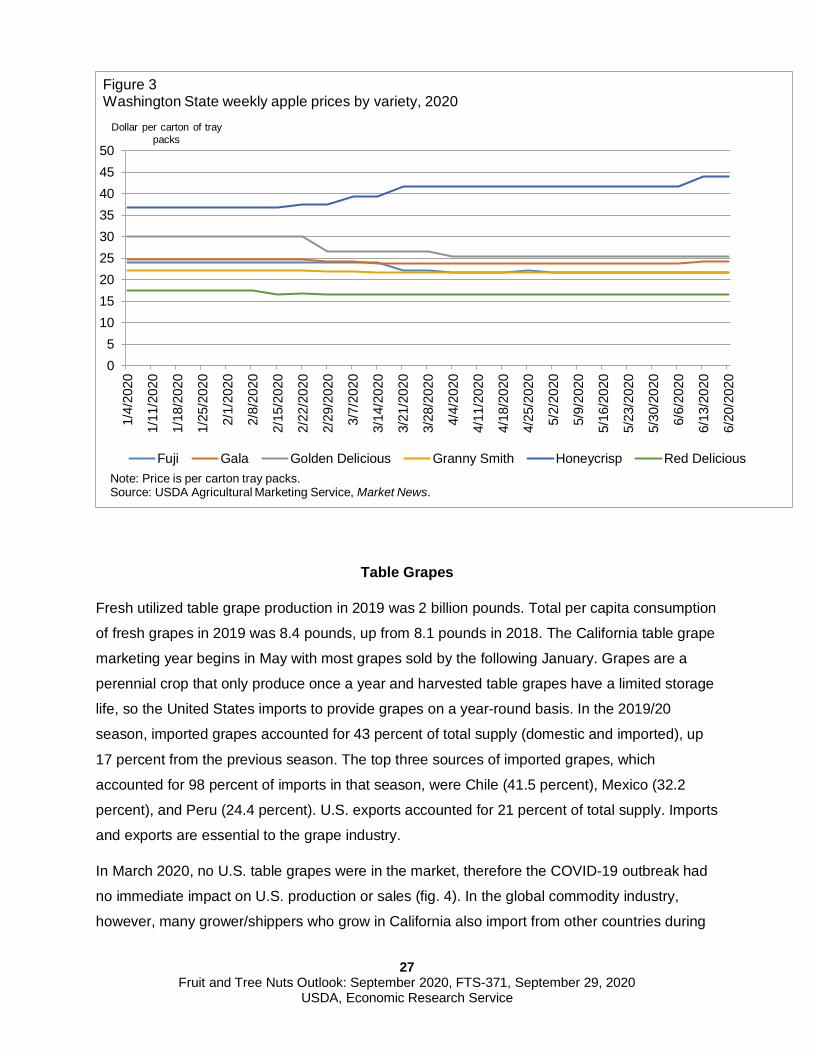
a tiny increase in the first two weeks of June. Apple prices by variety show increases in the price
of Honeycrisp apples (fig. 3). Between the week ending March 7 and June 20, 2020, Honeycrisp
prices went up 12 percent as the seasonal supply was ending, Red Delicious did not change,
Gala prices decreased by less than 1 percent, Granny Smith declined 1 percent, Golden
Delicious declined 4 percent, and Fuji declined 10 percent.
With large stocks of apples that need to be sold before the harvest that begins in August,
growers are anxious to sell as many apples as possible. The industry reports that consumers
have increased demand for bags of apples over individual apples, perhaps because of the
desire to speed up the shopping experience or concern about other consumers handling
individual apples before they do. Some shippers have put more apples in bags, but this format
typically sells at a discount to the same weight of individual apples. Many retailers also
introduced changes in how they stock apples. With fewer workers in stores, some retailers want
to simplify operations and have only a certain number of stock-keeping units, which means a lot
of the newer varieties with lower volume might not be included in their smaller selection of
varieties.
2 USDA AMS estimates the mostly low price as a price that represents at least 50 percent of the sales in the market and does not include the absolute lowest or highest price. The mostly high price is defined similarly.
27
Fruit and Tree Nuts Outlook: September 2020, FTS-371, September 29, 2020 USDA, Economic Research Service
Table Grapes
Fresh utilized table grape production in 2019 was 2 billion pounds. Total per capita consumption
of fresh grapes in 2019 was 8.4 pounds, up from 8.1 pounds in 2018. The California table grape
marketing year begins in May with most grapes sold by the following January. Grapes are a
perennial crop that only produce once a year and harvested table grapes have a limited storage
life, so the United States imports to provide grapes on a year-round basis. In the 2019/20
season, imported grapes accounted for 43 percent of total supply (domestic and imported), up
17 percent from the previous season. The top three sources of imported grapes, which
accounted for 98 percent of imports in that season, were Chile (41.5 percent), Mexico (32.2
percent), and Peru (24.4 percent). U.S. exports accounted for 21 percent of total supply. Imports
and exports are essential to the grape industry.
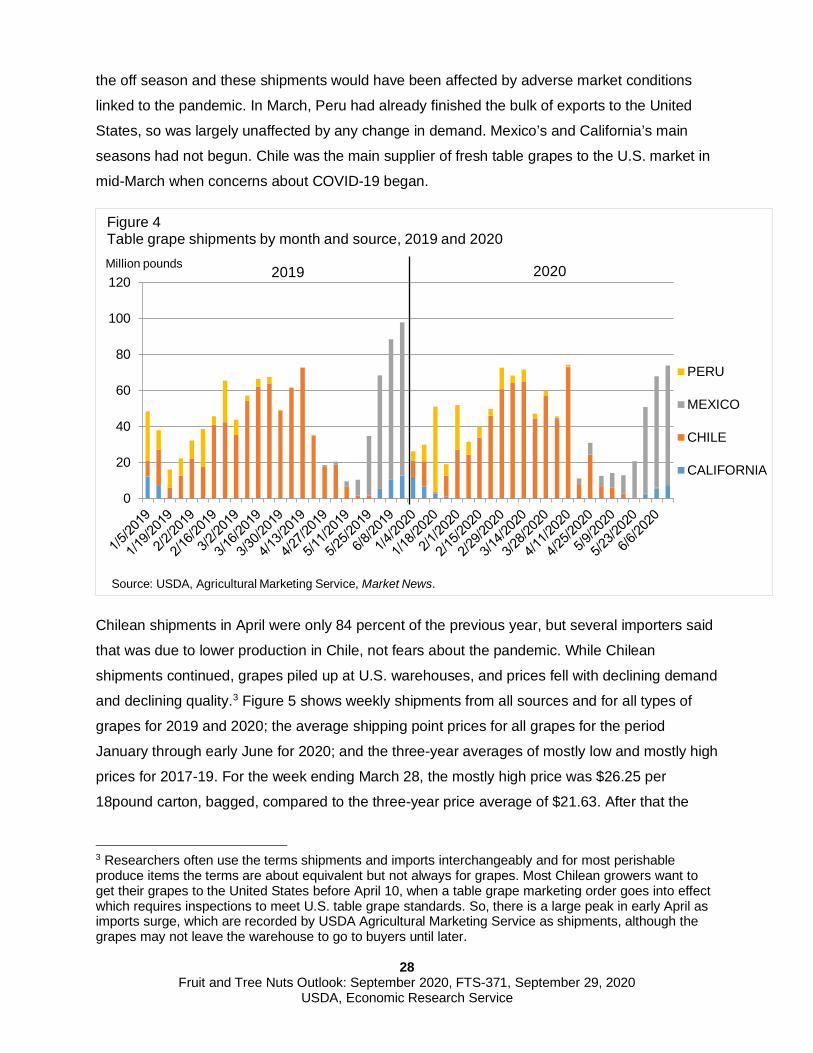
In March 2020, no U.S. table grapes were in the market, therefore the COVID-19 outbreak had
no immediate impact on U.S. production or sales (fig. 4). In the global commodity industry,
however, many grower/shippers who grow in California also import from other countries during
05
101520253035404550
1/4/
2020
1/11
/202
0
1/18
/202
0
1/25
/202
0
2/1/
2020
2/8/
2020
2/15
/202
0
2/22
/202
0
2/29
/202
0
3/7/
2020
3/14
/202
0
3/21
/202
0
3/28
/202
0
4/4/
2020
4/11
/202
0
4/18
/202
0
4/25
/202
0
5/2/
2020
5/9/
2020
5/16
/202
0
5/23
/202
0
5/30
/202
0
6/6/
2020
6/13
/202
0
6/20
/202
0
Dollar per carton of tray packs
Figure 3Washington State weekly apple prices by variety, 2020
Fuji Gala Golden Delicious Granny Smith Honeycrisp Red DeliciousNote: Price is per carton tray packs.Source: USDA Agricultural Marketing Service, Market News.
28
Fruit and Tree Nuts Outlook: September 2020, FTS-371, September 29, 2020 USDA, Economic Research Service
the off season and these shipments would have been affected by adverse market conditions
linked to the pandemic. In March, Peru had already finished the bulk of exports to the United
States, so was largely unaffected by any change in demand. Mexico’s and California’s main
seasons had not begun. Chile was the main supplier of fresh table grapes to the U.S. market in
mid-March when concerns about COVID-19 began.
Chilean shipments in April were only 84 percent of the previous year, but several importers said
that was due to lower production in Chile, not fears about the pandemic. While Chilean
shipments continued, grapes piled up at U.S. warehouses, and prices fell with declining demand
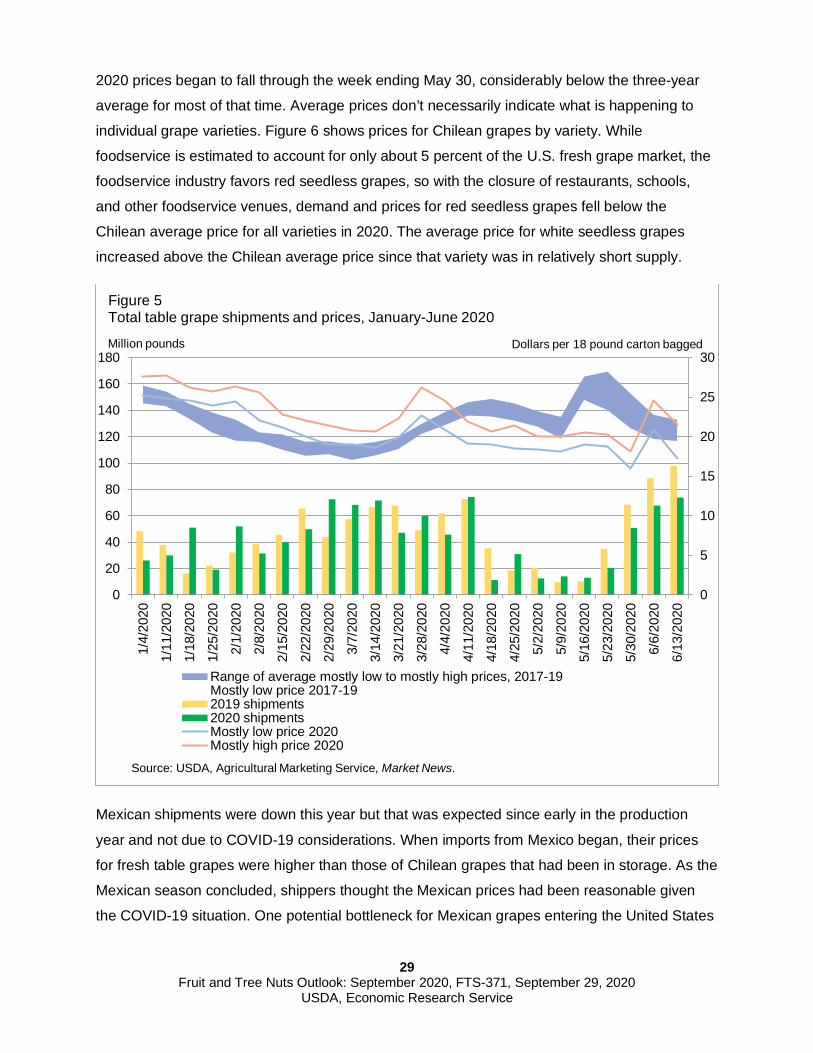
and declining quality.3 Figure 5 shows weekly shipments from all sources and for all types of
grapes for 2019 and 2020; the average shipping point prices for all grapes for the period
January through early June for 2020; and the three-year averages of mostly low and mostly high
prices for 2017-19. For the week ending March 28, the mostly high price was $26.25 per
18pound carton, bagged, compared to the three-year price average of $21.63. After that the
3 Researchers often use the terms shipments and imports interchangeably and for most perishable produce items the terms are about equivalent but not always for grapes. Most Chilean growers want to get their grapes to the United States before April 10, when a table grape marketing order goes into effect which requires inspections to meet U.S. table grape standards. So, there is a large peak in early April as imports surge, which are recorded by USDA Agricultural Marketing Service as shipments, although the grapes may not leave the warehouse to go to buyers until later.
0
20
40
60
80
100
120Million pounds
Figure 4Table grape shipments by month and source, 2019 and 2020
PERU
MEXICO
CHILE
CALIFORNIA
Source: USDA, Agricultural Marketing Service, Market News.
2019 2020
29
Fruit and Tree Nuts Outlook: September 2020, FTS-371, September 29, 2020 USDA, Economic Research Service
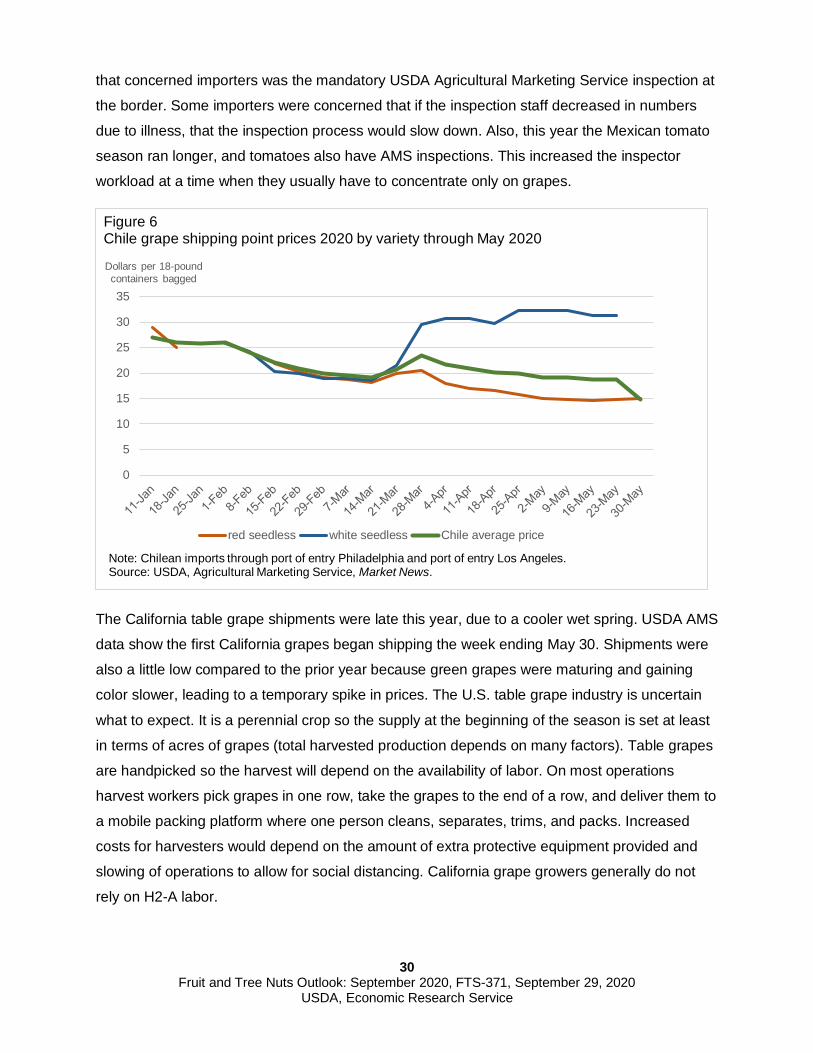
2020 prices began to fall through the week ending May 30, considerably below the three-year
average for most of that time. Average prices don’t necessarily indicate what is happening to
individual grape varieties. Figure 6 shows prices for Chilean grapes by variety. While
foodservice is estimated to account for only about 5 percent of the U.S. fresh grape market, the
foodservice industry favors red seedless grapes, so with the closure of restaurants, schools,
and other foodservice venues, demand and prices for red seedless grapes fell below the
Chilean average price for all varieties in 2020. The average price for white seedless grapes
increased above the Chilean average price since that variety was in relatively short supply.
Mexican shipments were down this year but that was expected since early in the production
year and not due to COVID-19 considerations. When imports from Mexico began, their prices
for fresh table grapes were higher than those of Chilean grapes that had been in storage. As the
Mexican season concluded, shippers thought the Mexican prices had been reasonable given
the COVID-19 situation. One potential bottleneck for Mexican grapes entering the United States
0
5
10
15
20
25
30
0
20
40
60
80
100
120
140
160
180
1/4/
2020
1/11
/202
0
1/18
/202
0
1/25
/202
0
2/1/
2020
2/8/
2020
2/15
/202
0
2/22
/202
0
2/29
/202
0
3/7/
2020
3/14
/202
0
3/21
/202
0
3/28
/202
0
4/4/
2020
4/11
/202
0
4/18
/202
0
4/25
/202
0
5/2/
2020
5/9/
2020
5/16
/202
0
5/23
/202
0
5/30
/202
0
6/6/
2020
6/13
/202
0Range of average mostly low to mostly high prices, 2017-19Mostly low price 2017-192019 shipments2020 shipmentsMostly low price 2020Mostly high price 2020
Million pounds Dollars per 18 pound carton bagged
Figure 5Total table grape shipments and prices, January-June 2020
Source: USDA, Agricultural Marketing Service, Market News.
30
Fruit and Tree Nuts Outlook: September 2020, FTS-371, September 29, 2020 USDA, Economic Research Service
that concerned importers was the mandatory USDA Agricultural Marketing Service inspection at
the border. Some importers were concerned that if the inspection staff decreased in numbers
due to illness, that the inspection process would slow down. Also, this year the Mexican tomato
season ran longer, and tomatoes also have AMS inspections. This increased the inspector
workload at a time when they usually have to concentrate only on grapes.
The California table grape shipments were late this year, due to a cooler wet spring. USDA AMS
data show the first California grapes began shipping the week ending May 30. Shipments were
also a little low compared to the prior year because green grapes were maturing and gaining
color slower, leading to a temporary spike in prices. The U.S. table grape industry is uncertain
what to expect. It is a perennial crop so the supply at the beginning of the season is set at least
in terms of acres of grapes (total harvested production depends on many factors). Table grapes
are handpicked so the harvest will depend on the availability of labor. On most operations
harvest workers pick grapes in one row, take the grapes to the end of a row, and deliver them to
a mobile packing platform where one person cleans, separates, trims, and packs. Increased
costs for harvesters would depend on the amount of extra protective equipment provided and
slowing of operations to allow for social distancing. California grape growers generally do not
rely on H2-A labor.
0
5
10
15
20
25
30
35
Dollars per 18-pound containers bagged
Figure 6Chile grape shipping point prices 2020 by variety through May 2020
red seedless white seedless Chile average price
Note: Chilean imports through port of entry Philadelphia and port of entry Los Angeles. Source: USDA, Agricultural Marketing Service, Market News.
31
Fruit and Tree Nuts Outlook: September 2020, FTS-371, September 29, 2020 USDA, Economic Research Service
Demand for grapes has declined with on-line shopping. Consumers aren’t as likely to buy
grapes when they can’t see the actual product. Also, consumers stocking up at the grocery
store may have bought less perishable fruit. Shippers were initially concerned about how
consumers would react to the usual retail packaging that features grapes in an unsealed bag
with holes in the side for ventilation, instead of a closed bag which might be viewed as safer;
however, packaging has not apparently affected demand. With COVID-19, sampling grapes in
stores has disappeared, eliminating an important marketing tool in some markets. As a result of
the changes due to COVID-19, the California Grape Commission changed its promotion
strategy. A new focus is advertising through on–line food suppliers and providing incentives to
retailers to merchandize and promote California grapes on their e-commerce platforms. The
Commission launched new advertising campaigns focusing on snacking and health and
removed discussion of grapes as part of entertaining gatherings of families and friends. As
noted above, foodservice grape sales declined drastically, but only about 5 percent of grapes go
to foodservice. If a firm specializes in sales to the foodservice market, however, it would face
marketing challenges as it tried to find another buyer for the grapes no longer purchased by
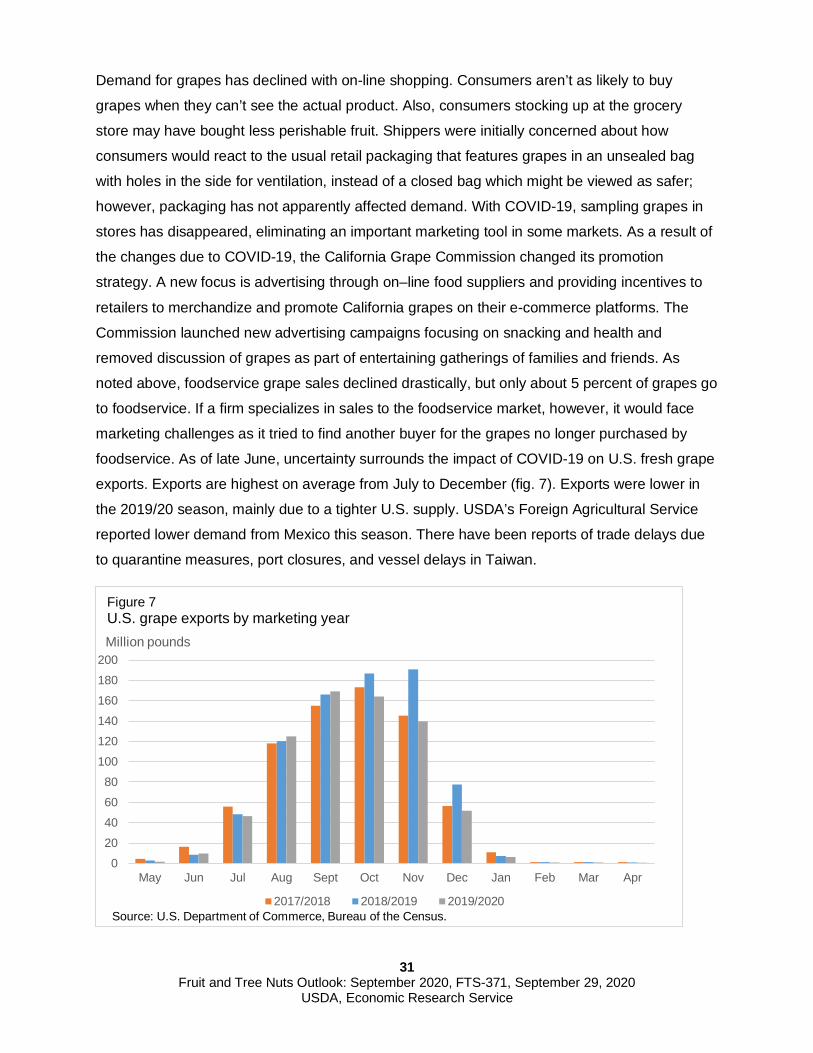
foodservice. As of late June, uncertainty surrounds the impact of COVID-19 on U.S. fresh grape
exports. Exports are highest on average from July to December (fig. 7). Exports were lower in
the 2019/20 season, mainly due to a tighter U.S. supply. USDA’s Foreign Agricultural Service
reported lower demand from Mexico this season. There have been reports of trade delays due
to quarantine measures, port closures, and vessel delays in Taiwan.
020406080
100120140160180200
May Jun Jul Aug Sept Oct Nov Dec Jan Feb Mar Apr
Million pounds
Figure 7U.S. grape exports by marketing year
2017/2018 2018/2019 2019/2020Source: U.S. Department of Commerce, Bureau of the Census.
32
Fruit and Tree Nuts Outlook: September 2020, FTS-371, September 29, 2020 USDA, Economic Research Service
Strawberries
In the United States fresh-market strawberries are grown on a large commercial basis in
California and Florida. California harvests some strawberries every month, but the vast majority
is harvested during April-November. Florida is a winter-spring producer, shipping from mid-
December to mid-May. Fresh-market strawberries are very perishable with extremely limited
short-term storage options, so the United States imports strawberries from Mexico. Central
Mexico ships strawberries to the United States from November to March. Baja California,
Mexico, ships smaller amounts with most shipments in January through April. Mexico creates
competition during the Florida season and the California production areas of Orange County
and Oxnard. In 2018, California produced 74.2 percent of total fresh supply (domestic utilized
supply plus imports), Florida produced 10.2 percent, and imports, virtually all from Mexico,
accounted for 14.8 percent. The United States exported 13 percent of total fresh supply.
In mid-March (week ending March 14), California producers were harvesting berries in Oxnard
and Santa Maria (Salinas/Watsonville, the biggest producing region wouldn’t start until the week
ending April 25). Florida and Mexico were also harvesting. Producers in California, Florida, and
Mexico could have been affected by changes in supply or demand due to the pandemic.
The pandemic created potential problems for the supply side. Growers were more concerned
than usual about labor availability due to potential worker illness. To address the labor health
issue, the California Strawberry Commission put together a program to instruct owners and
workers about the best practices to minimize the chance of infection. Fresh-market strawberries
are hand harvested and field packed. Harvest workers proceed up a row of berries with a cart
holding a cardboard box of clamshells. When the cartons are full, the workers take the berries to
the end of the row where the boxes are checked, individual harvesters given credit for their
work, and boxes are palletized. This consolidation point may be the most difficult place for
workers to socially distance. Harvester workers can socially distance in the fields in most cases
with adjustments to spacing of workers and schedules. More problematic might be the often
cramped conditions in worker accommodations and in transportation to the fields where workers
could become infected with the virus. California strawberry growers need to be concerned about
labor availability over a very long season, unlike other crops that have a much more condensed
harvesting season, such as cherries.
The Florida industry was near the end of their season when news about COVID-19 started to
affect demand. Initially, there was a big run on everything as people flocked to grocery stores to
stock up. Then consumers started to shop less frequently and many favored less perishable
33
Fruit and Tree Nuts Outlook: September 2020, FTS-371, September 29, 2020 USDA, Economic Research Service
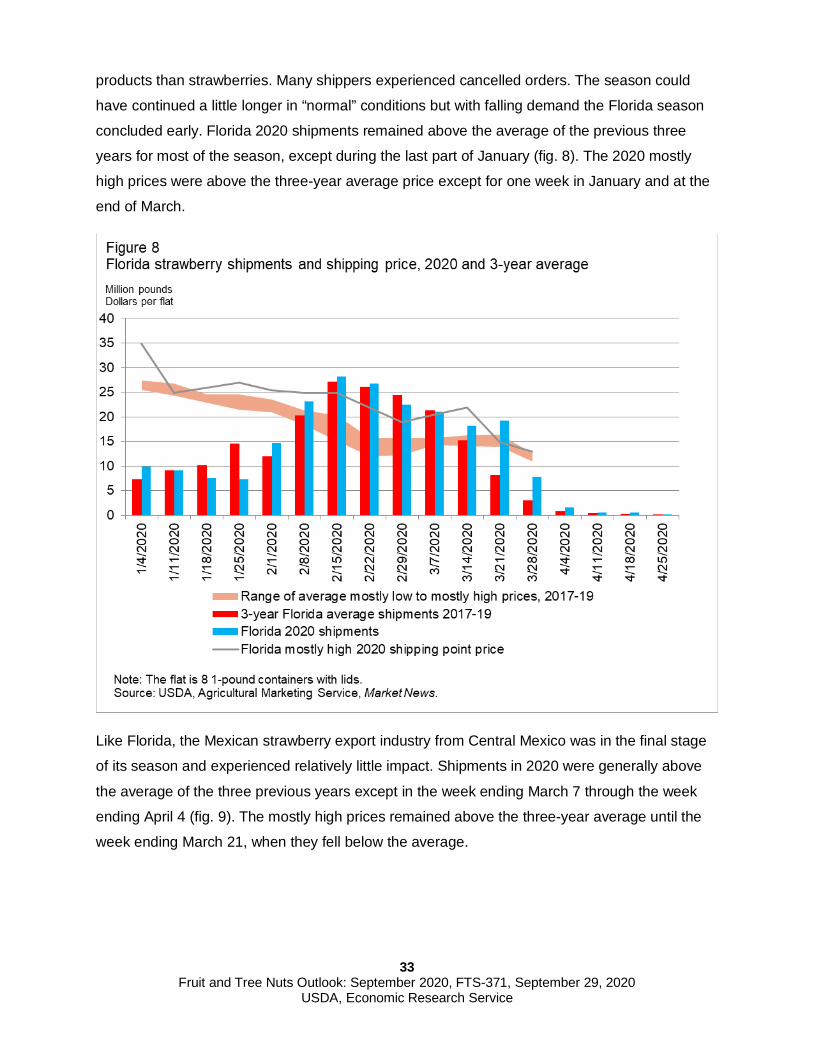
products than strawberries. Many shippers experienced cancelled orders. The season could
have continued a little longer in “normal” conditions but with falling demand the Florida season
concluded early. Florida 2020 shipments remained above the average of the previous three
years for most of the season, except during the last part of January (fig. 8). The 2020 mostly
high prices were above the three-year average price except for one week in January and at the
end of March.
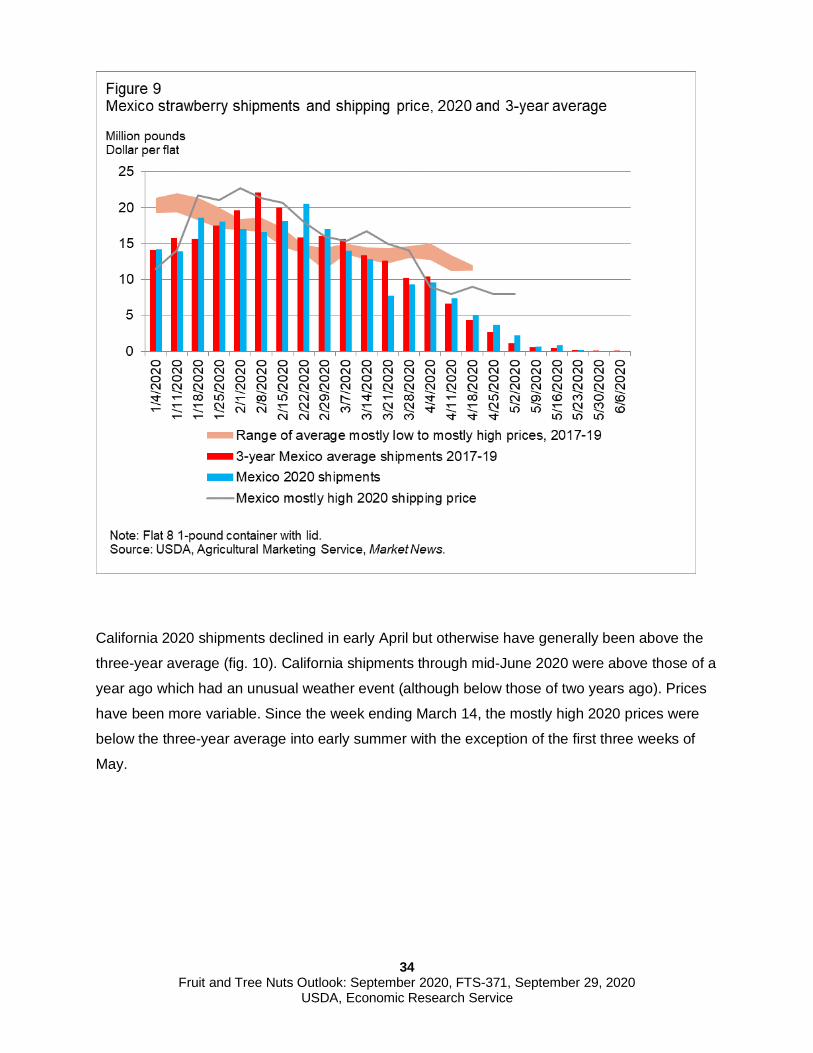
Like Florida, the Mexican strawberry export industry from Central Mexico was in the final stage
of its season and experienced relatively little impact. Shipments in 2020 were generally above
the average of the three previous years except in the week ending March 7 through the week
ending April 4 (fig. 9). The mostly high prices remained above the three-year average until the
week ending March 21, when they fell below the average.
34
Fruit and Tree Nuts Outlook: September 2020, FTS-371, September 29, 2020 USDA, Economic Research Service
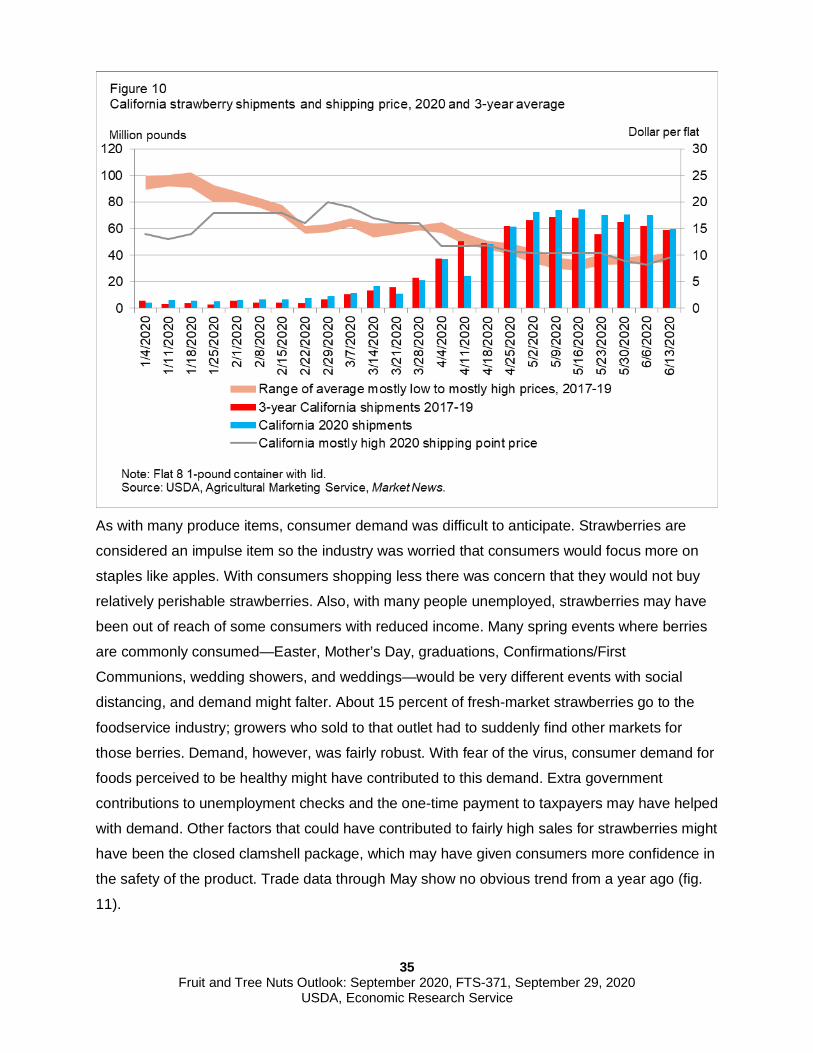
California 2020 shipments declined in early April but otherwise have generally been above the
three-year average (fig. 10). California shipments through mid-June 2020 were above those of a
year ago which had an unusual weather event (although below those of two years ago). Prices
have been more variable. Since the week ending March 14, the mostly high 2020 prices were
below the three-year average into early summer with the exception of the first three weeks of
May.
35
Fruit and Tree Nuts Outlook: September 2020, FTS-371, September 29, 2020 USDA, Economic Research Service
As with many produce items, consumer demand was difficult to anticipate. Strawberries are
considered an impulse item so the industry was worried that consumers would focus more on
staples like apples. With consumers shopping less there was concern that they would not buy
relatively perishable strawberries. Also, with many people unemployed, strawberries may have
been out of reach of some consumers with reduced income. Many spring events where berries
are commonly consumed—Easter, Mother’s Day, graduations, Confirmations/First
Communions, wedding showers, and weddings—would be very different events with social
distancing, and demand might falter. About 15 percent of fresh-market strawberries go to the
foodservice industry; growers who sold to that outlet had to suddenly find other markets for
those berries. Demand, however, was fairly robust. With fear of the virus, consumer demand for
foods perceived to be healthy might have contributed to this demand. Extra government
contributions to unemployment checks and the one-time payment to taxpayers may have helped
with demand. Other factors that could have contributed to fairly high sales for strawberries might
have been the closed clamshell package, which may have given consumers more confidence in
the safety of the product. Trade data through May show no obvious trend from a year ago (fig.
11).
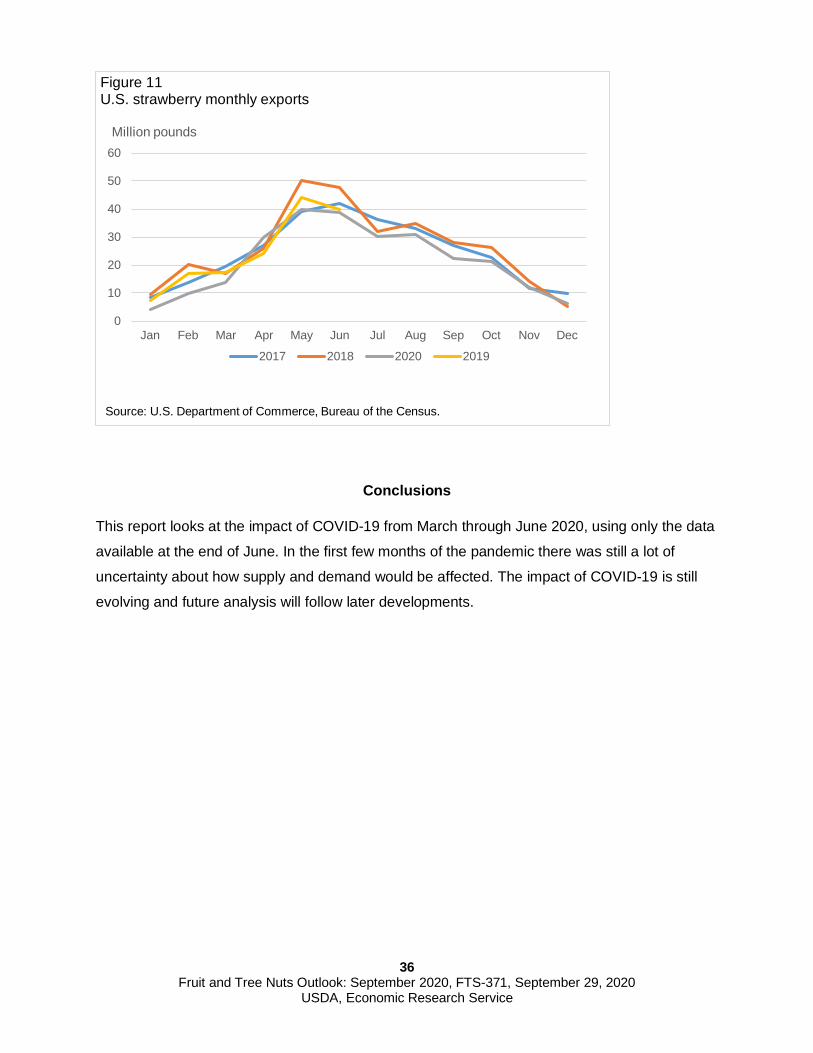
36
Fruit and Tree Nuts Outlook: September 2020, FTS-371, September 29, 2020 USDA, Economic Research Service
Conclusions
This report looks at the impact of COVID-19 from March through June 2020, using only the data
available at the end of June. In the first few months of the pandemic there was still a lot of
uncertainty about how supply and demand would be affected. The impact of COVID-19 is still
evolving and future analysis will follow later developments.
0
10
20
30
40
50
60
Jan Feb Mar Apr May Jun Jul Aug Sep Oct Nov Dec
Million pounds
Figure 11U.S. strawberry monthly exports
2017 2018 2020 2019
Source: U.S. Department of Commerce, Bureau of the Census.
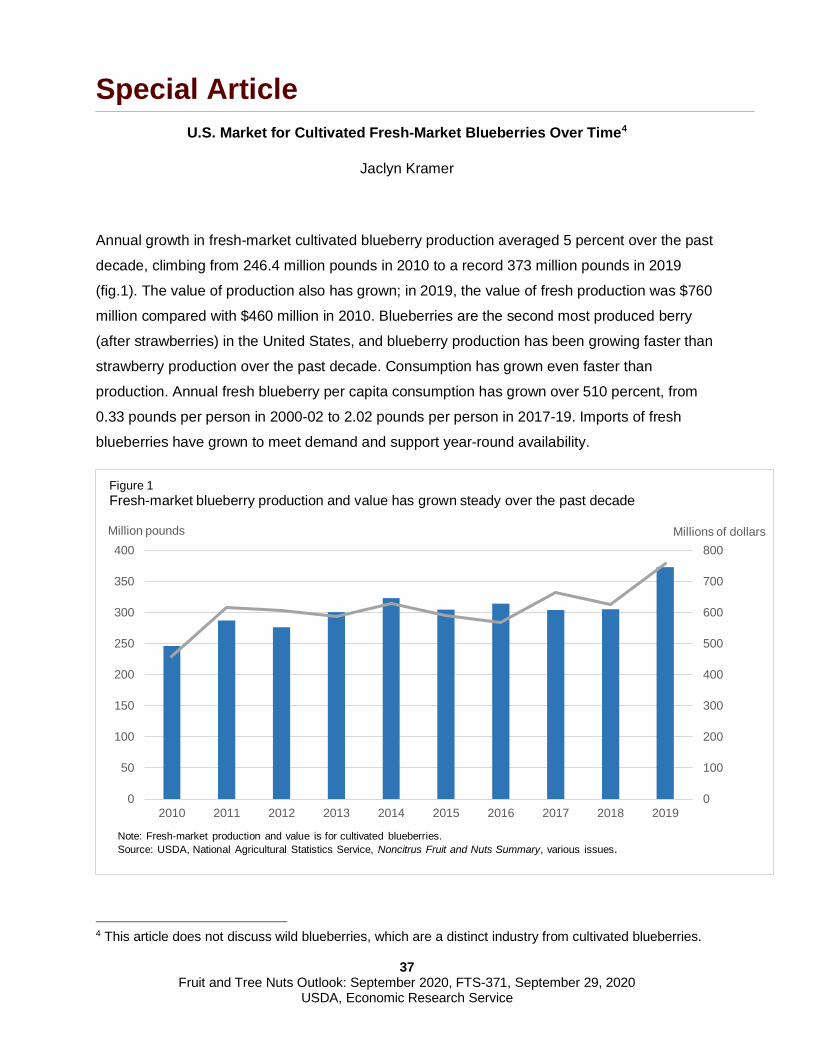
37
Fruit and Tree Nuts Outlook: September 2020, FTS-371, September 29, 2020 USDA, Economic Research Service
Special Article U.S. Market for Cultivated Fresh-Market Blueberries Over Time4
Jaclyn Kramer
Annual growth in fresh-market cultivated blueberry production averaged 5 percent over the past
decade, climbing from 246.4 million pounds in 2010 to a record 373 million pounds in 2019
(fig.1). The value of production also has grown; in 2019, the value of fresh production was $760
million compared with $460 million in 2010. Blueberries are the second most produced berry
(after strawberries) in the United States, and blueberry production has been growing faster than
strawberry production over the past decade. Consumption has grown even faster than
production. Annual fresh blueberry per capita consumption has grown over 510 percent, from
0.33 pounds per person in 2000-02 to 2.02 pounds per person in 2017-19. Imports of fresh
blueberries have grown to meet demand and support year-round availability.
4 This article does not discuss wild blueberries, which are a distinct industry from cultivated blueberries.
0
100
200
300
400
500
600
700
800
0
50
100
150
200
250
300
350
400
2010 2011 2012 2013 2014 2015 2016 2017 2018 2019
Millions of dollarsMillion pounds
Figure 1Fresh-market blueberry production and value has grown steady over the past decade
Note: Fresh-market production and value is for cultivated blueberries.Source: USDA, National Agricultural Statistics Service, Noncitrus Fruit and Nuts Summary, various issues.
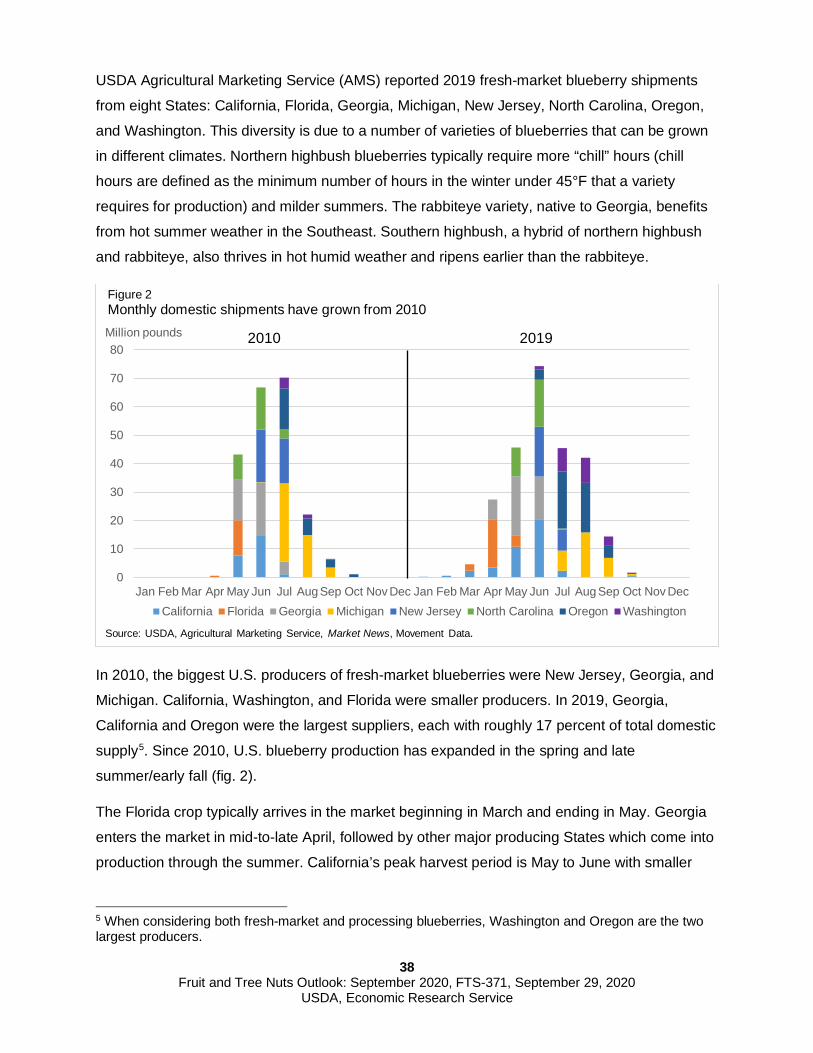
38
Fruit and Tree Nuts Outlook: September 2020, FTS-371, September 29, 2020 USDA, Economic Research Service
USDA Agricultural Marketing Service (AMS) reported 2019 fresh-market blueberry shipments
from eight States: California, Florida, Georgia, Michigan, New Jersey, North Carolina, Oregon,
and Washington. This diversity is due to a number of varieties of blueberries that can be grown
in different climates. Northern highbush blueberries typically require more “chill” hours (chill
hours are defined as the minimum number of hours in the winter under 45°F that a variety
requires for production) and milder summers. The rabbiteye variety, native to Georgia, benefits
from hot summer weather in the Southeast. Southern highbush, a hybrid of northern highbush
and rabbiteye, also thrives in hot humid weather and ripens earlier than the rabbiteye.
In 2010, the biggest U.S. producers of fresh-market blueberries were New Jersey, Georgia, and
Michigan. California, Washington, and Florida were smaller producers. In 2019, Georgia,
California and Oregon were the largest suppliers, each with roughly 17 percent of total domestic
supply5. Since 2010, U.S. blueberry production has expanded in the spring and late
summer/early fall (fig. 2).
The Florida crop typically arrives in the market beginning in March and ending in May. Georgia
enters the market in mid-to-late April, followed by other major producing States which come into
production through the summer. California’s peak harvest period is May to June with smaller
5 When considering both fresh-market and processing blueberries, Washington and Oregon are the two largest producers.
0
10
20
30
40
50
60
70
80
Jan Feb Mar Apr May Jun Jul Aug Sep Oct Nov Dec Jan Feb Mar Apr May Jun Jul Aug Sep Oct Nov Dec
Million pounds
Figure 2Monthly domestic shipments have grown from 2010
California Florida Georgia Michigan New Jersey North Carolina Oregon Washington
Source: USDA, Agricultural Marketing Service, Market News, Movement Data.
2010 2019
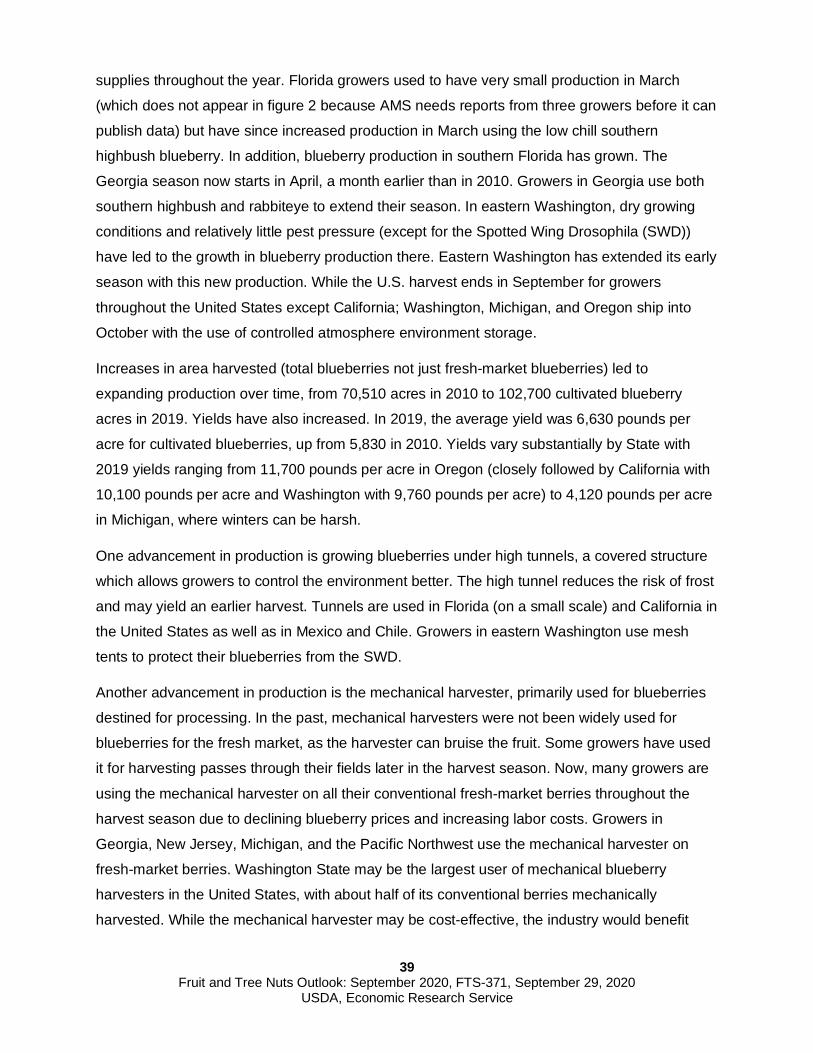
39
Fruit and Tree Nuts Outlook: September 2020, FTS-371, September 29, 2020 USDA, Economic Research Service
supplies throughout the year. Florida growers used to have very small production in March
(which does not appear in figure 2 because AMS needs reports from three growers before it can
publish data) but have since increased production in March using the low chill southern
highbush blueberry. In addition, blueberry production in southern Florida has grown. The
Georgia season now starts in April, a month earlier than in 2010. Growers in Georgia use both
southern highbush and rabbiteye to extend their season. In eastern Washington, dry growing
conditions and relatively little pest pressure (except for the Spotted Wing Drosophila (SWD))
have led to the growth in blueberry production there. Eastern Washington has extended its early
season with this new production. While the U.S. harvest ends in September for growers
throughout the United States except California; Washington, Michigan, and Oregon ship into
October with the use of controlled atmosphere environment storage.
Increases in area harvested (total blueberries not just fresh-market blueberries) led to
expanding production over time, from 70,510 acres in 2010 to 102,700 cultivated blueberry
acres in 2019. Yields have also increased. In 2019, the average yield was 6,630 pounds per
acre for cultivated blueberries, up from 5,830 in 2010. Yields vary substantially by State with
2019 yields ranging from 11,700 pounds per acre in Oregon (closely followed by California with
10,100 pounds per acre and Washington with 9,760 pounds per acre) to 4,120 pounds per acre
in Michigan, where winters can be harsh.
One advancement in production is growing blueberries under high tunnels, a covered structure
which allows growers to control the environment better. The high tunnel reduces the risk of frost
and may yield an earlier harvest. Tunnels are used in Florida (on a small scale) and California in
the United States as well as in Mexico and Chile. Growers in eastern Washington use mesh
tents to protect their blueberries from the SWD.
Another advancement in production is the mechanical harvester, primarily used for blueberries
destined for processing. In the past, mechanical harvesters were not been widely used for
blueberries for the fresh market, as the harvester can bruise the fruit. Some growers have used
it for harvesting passes through their fields later in the harvest season. Now, many growers are
using the mechanical harvester on all their conventional fresh-market berries throughout the
harvest season due to declining blueberry prices and increasing labor costs. Growers in
Georgia, New Jersey, Michigan, and the Pacific Northwest use the mechanical harvester on
fresh-market berries. Washington State may be the largest user of mechanical blueberry
harvesters in the United States, with about half of its conventional berries mechanically
harvested. While the mechanical harvester may be cost-effective, the industry would benefit
40
Fruit and Tree Nuts Outlook: September 2020, FTS-371, September 29, 2020 USDA, Economic Research Service
from a more advanced mechanical harvester to handle delicate fresh-market berries and from
newer varieties that do not bruise as easily.
Global blueberry production grew rapidly over the past decade; on average, 60 percent of U.S.
blueberry consumption was imported during 2017-19. In 2010, Chile was the main foreign
supplier of fresh-market blueberries to the United States. In 2019, about 80 percent of U.S.
blueberry imports came from three countries: Peru, Chile and Mexico. Since 2010, Peru’s
blueberry exports have grown exponentially; in 2019, Peru became the leading supplier of U.S.
blueberry imports (fig. 3). The boost in production in these countries is likely a result of
increased cultivation of newer varieties and expanded acreage devoted to blueberries in
relatively new producers of blueberries such as Peru and Mexico.
0
20
40
60
80
100
120
140
160
2010 2011 2012 2013 2014 2015 2016 2017 2018 2019
Million pounds
Figure 3Top U.S. imports from Latin America
Peru Chile Mexico
Note: U.S. imports of cultivated blueberries only. Source: U.S. Department of Commerce, Bureau of the Census.
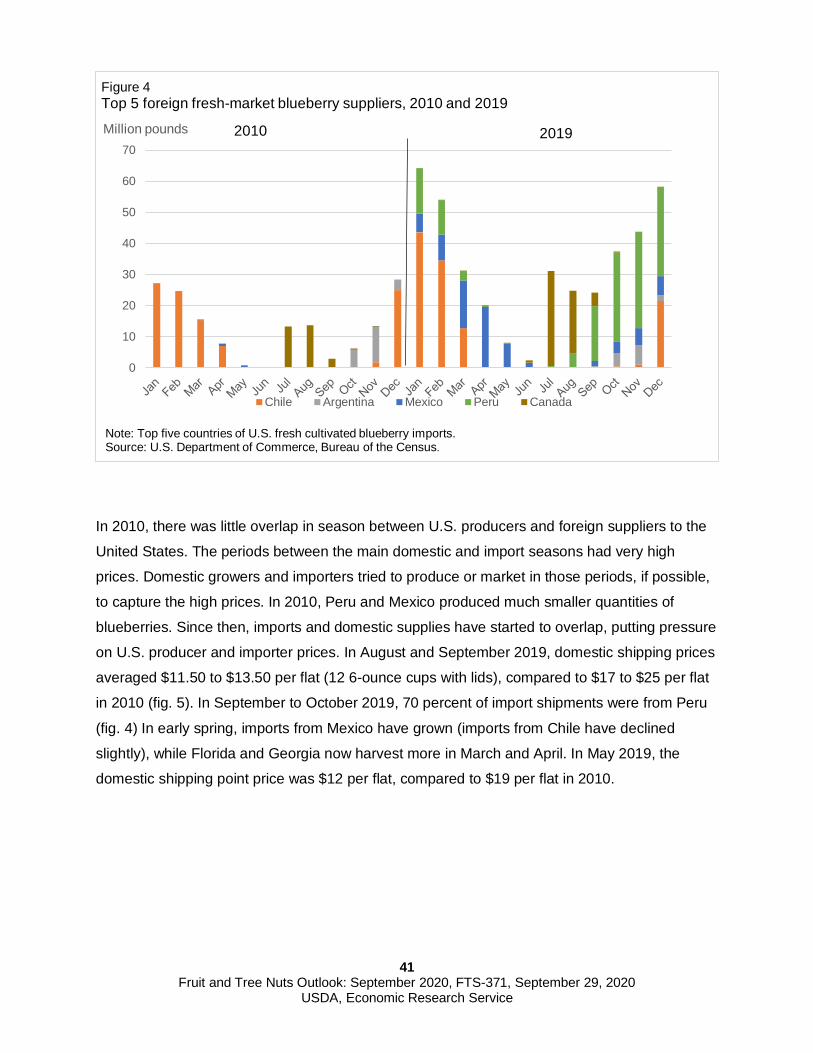
41
Fruit and Tree Nuts Outlook: September 2020, FTS-371, September 29, 2020 USDA, Economic Research Service
In 2010, there was little overlap in season between U.S. producers and foreign suppliers to the
United States. The periods between the main domestic and import seasons had very high
prices. Domestic growers and importers tried to produce or market in those periods, if possible,
to capture the high prices. In 2010, Peru and Mexico produced much smaller quantities of
blueberries. Since then, imports and domestic supplies have started to overlap, putting pressure
on U.S. producer and importer prices. In August and September 2019, domestic shipping prices
averaged $11.50 to $13.50 per flat (12 6-ounce cups with lids), compared to $17 to $25 per flat
in 2010 (fig. 5). In September to October 2019, 70 percent of import shipments were from Peru
(fig. 4) In early spring, imports from Mexico have grown (imports from Chile have declined
slightly), while Florida and Georgia now harvest more in March and April. In May 2019, the
domestic shipping point price was $12 per flat, compared to $19 per flat in 2010.
0
10
20
30
40
50
60
70Million pounds
Figure 4Top 5 foreign fresh-market blueberry suppliers, 2010 and 2019
Chile Argentina Mexico Peru Canada
20192010
Note: Top five countries of U.S. fresh cultivated blueberry imports.Source: U.S. Department of Commerce, Bureau of the Census.
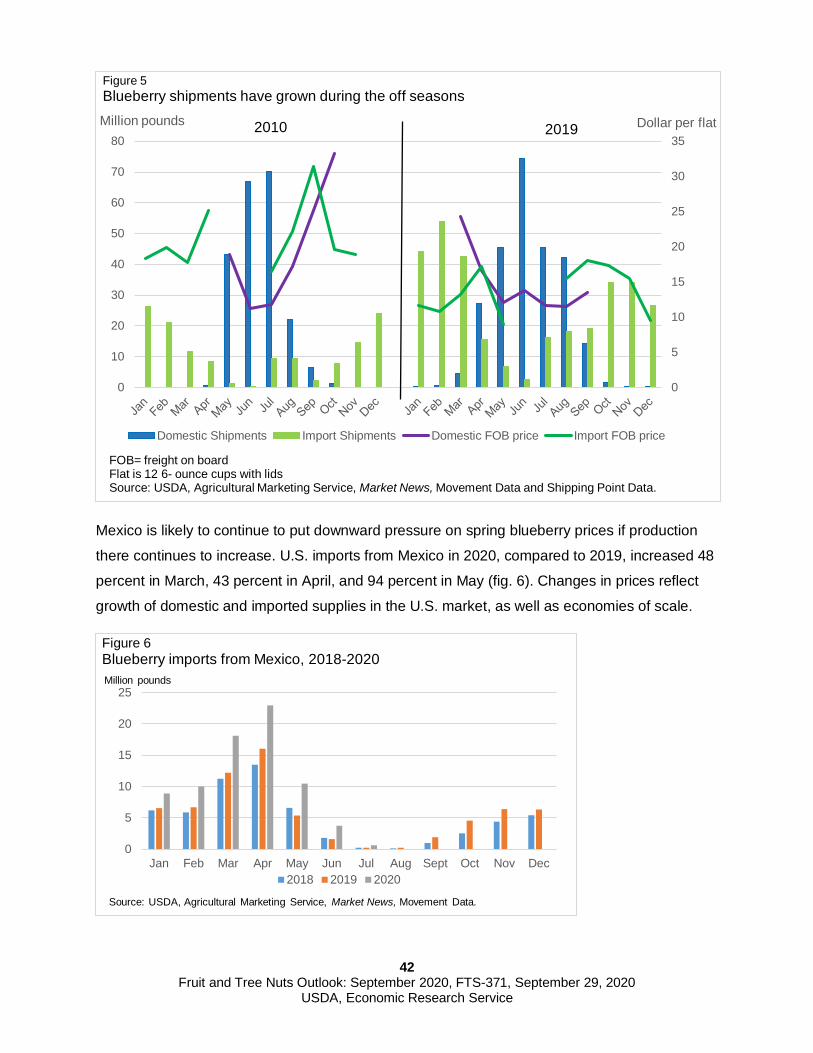
42
Fruit and Tree Nuts Outlook: September 2020, FTS-371, September 29, 2020 USDA, Economic Research Service
Mexico is likely to continue to put downward pressure on spring blueberry prices if production
there continues to increase. U.S. imports from Mexico in 2020, compared to 2019, increased 48
percent in March, 43 percent in April, and 94 percent in May (fig. 6). Changes in prices reflect
growth of domestic and imported supplies in the U.S. market, as well as economies of scale.
0
5
10
15
20
25
30
35
0
10
20
30
40
50
60
70
80Dollar per flatMillion pounds
Figure 5Blueberry shipments have grown during the off seasons
Domestic Shipments Import Shipments Domestic FOB price Import FOB price
FOB= freight on boardFlat is 12 6- ounce cups with lidsSource: USDA, Agricultural Marketing Service, Market News, Movement Data and Shipping Point Data.
2010 2019
0
5
10
15
20
25
Jan Feb Mar Apr May Jun Jul Aug Sept Oct Nov Dec
Million pounds
Figure 6Blueberry imports from Mexico, 2018-2020
2018 2019 2020
Source: USDA, Agricultural Marketing Service, Market News, Movement Data.
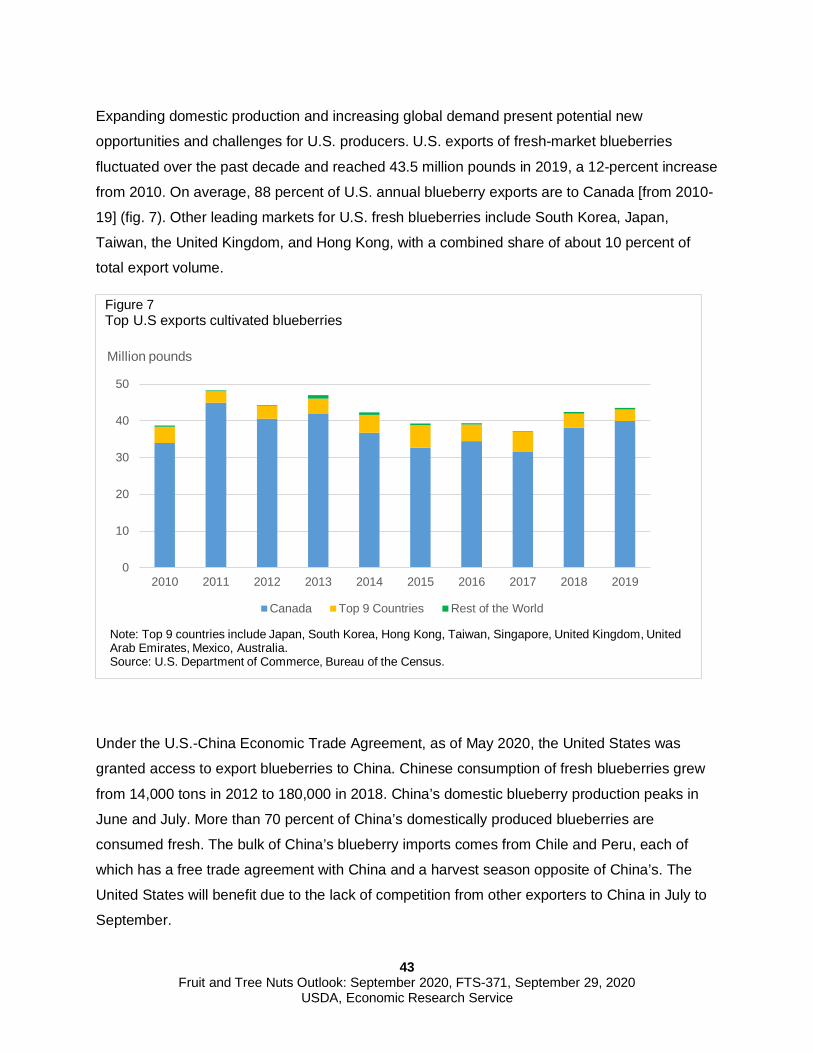
43
Fruit and Tree Nuts Outlook: September 2020, FTS-371, September 29, 2020 USDA, Economic Research Service
Expanding domestic production and increasing global demand present potential new
opportunities and challenges for U.S. producers. U.S. exports of fresh-market blueberries
fluctuated over the past decade and reached 43.5 million pounds in 2019, a 12-percent increase
from 2010. On average, 88 percent of U.S. annual blueberry exports are to Canada [from 2010-
19] (fig. 7). Other leading markets for U.S. fresh blueberries include South Korea, Japan,
Taiwan, the United Kingdom, and Hong Kong, with a combined share of about 10 percent of
total export volume.
Under the U.S.-China Economic Trade Agreement, as of May 2020, the United States was
granted access to export blueberries to China. Chinese consumption of fresh blueberries grew
from 14,000 tons in 2012 to 180,000 in 2018. China’s domestic blueberry production peaks in
June and July. More than 70 percent of China’s domestically produced blueberries are
consumed fresh. The bulk of China’s blueberry imports comes from Chile and Peru, each of
which has a free trade agreement with China and a harvest season opposite of China’s. The
United States will benefit due to the lack of competition from other exporters to China in July to
September.
0
10
20
30
40
50
2010 2011 2012 2013 2014 2015 2016 2017 2018 2019
Million pounds
Figure 7Top U.S exports cultivated blueberries
Canada Top 9 Countries Rest of the World
Note: Top 9 countries include Japan, South Korea, Hong Kong, Taiwan, Singapore, United Kingdom, United Arab Emirates, Mexico, Australia.Source: U.S. Department of Commerce, Bureau of the Census.
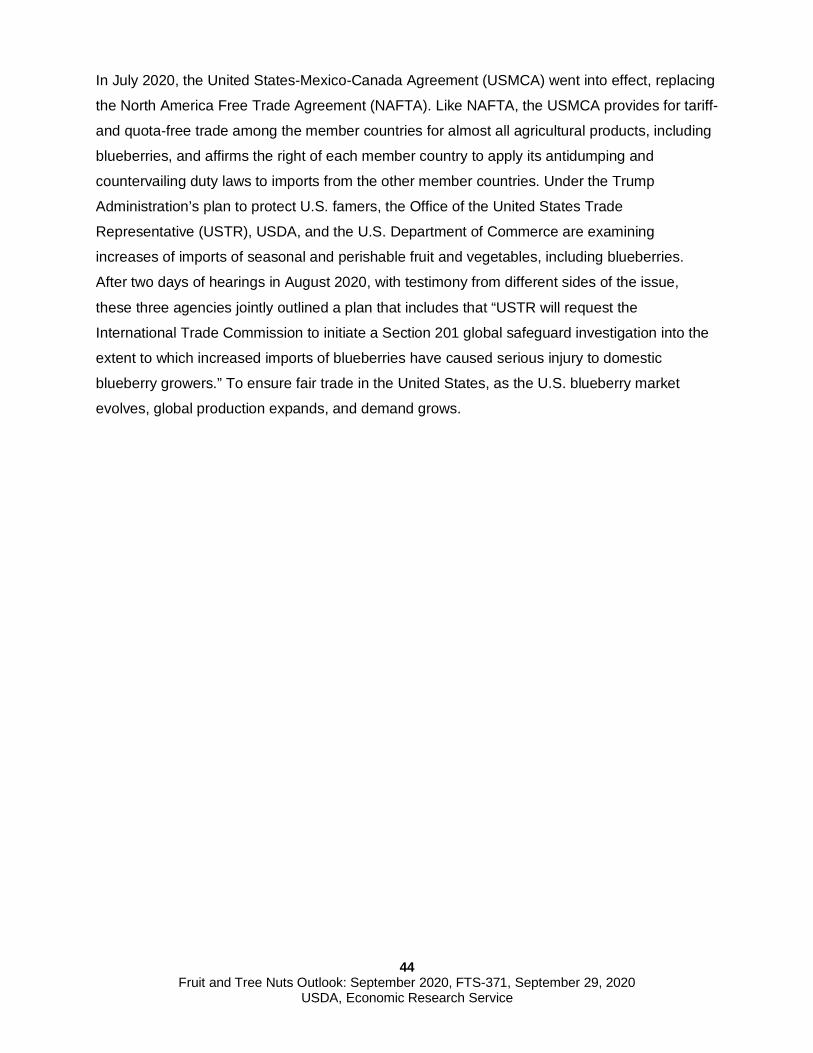
44
Fruit and Tree Nuts Outlook: September 2020, FTS-371, September 29, 2020 USDA, Economic Research Service
In July 2020, the United States-Mexico-Canada Agreement (USMCA) went into effect, replacing
the North America Free Trade Agreement (NAFTA). Like NAFTA, the USMCA provides for tariff-
and quota-free trade among the member countries for almost all agricultural products, including
blueberries, and affirms the right of each member country to apply its antidumping and
countervailing duty laws to imports from the other member countries. Under the Trump
Administration’s plan to protect U.S. famers, the Office of the United States Trade
Representative (USTR), USDA, and the U.S. Department of Commerce are examining
increases of imports of seasonal and perishable fruit and vegetables, including blueberries.
After two days of hearings in August 2020, with testimony from different sides of the issue,
these three agencies jointly outlined a plan that includes that “USTR will request the
International Trade Commission to initiate a Section 201 global safeguard investigation into the
extent to which increased imports of blueberries have caused serious injury to domestic
blueberry growers.” To ensure fair trade in the United States, as the U.S. blueberry market
evolves, global production expands, and demand grows.
45
Fruit and Tree Nuts Outlook: September 2020, FTS-371, September 29, 2020 USDA, Economic Research Service
Suggested Citation Kramer, J. Simnitt, S. and Calvin. L (2020), Fruit and Tree Nuts Outlook: September 2020, FTS-
371, U.S. Department of Agriculture, Economic Research Service, September 29, 2020.
Use of commercial and trade names does not imply approval or constitute endorsement by USDA.
In accordance with Federal civil rights law and U.S. Department of Agriculture (USDA) civil rights regulations and policies, the USDA, its Agencies, offices, and employees, and institutions participating in or administering USDA programs are prohibited from discriminating based on race, color, national origin, religion, sex, gender identity (including gender expression), sexual orientation, disability, age, marital status, family/parental status, income derived from a public assistance program, political beliefs, or reprisal or retaliation for prior civil rights activity, in any program or activity conducted or funded by USDA (not all bases apply to all programs). Remedies and complaint filing deadlines vary by program or incident.
Persons with disabilities who require alternative means of communication for program information (e.g., Braille, large print, audiotape, American Sign Language, etc.) should contact the responsible Agency or USDA's TARGET Center at (202) 720-2600 (voice and TTY) or contact USDA through the Federal Relay Service at (800) 877-8339. Additionally, program information may be made available in languages other than English.
To file a program discrimination complaint, complete the USDA Program Discrimination Complaint Form, AD-3027, found online at How to File a Program Discrimination Complaint and at any USDA office or write a letter addressed to USDA and provide in the letter all of the information requested in the form. To request a copy of the complaint form, call (866) 632-9992. Submit your completed form or letter to USDA by: (1) mail: U.S. Department of Agriculture, Office of the Assistant Secretary for Civil Rights, 1400 Independence Avenue, SW, Washington, D.C. 20250-9410; (2) fax: (202) 690-7442; or (3) email: [email protected].
USDA is an equal opportunity provider, employer, and lender.