Embed Size (px)
Citation preview
Fruit and Vegetable Plate Waste Among Students in a Suburban School
District Participating in the National School Lunch Program
Kellyn M. Handforth, MPH; Mary Beth Gilboy, PhD, MPH, RD, LDN;
Jeffrey Harris, DrPH, MPH, RD, LDN; Nicole Melia, RD, LDN
ABSTRACT
Purpose/Objectives The purpose of this project was to assess fruit and vegetable plate waste, examine patterns of
selection and consumption of specific fruit and vegetable subgroups, and analyze for differences
across gender, grade level, and school.
Methods A previously-validated digital photography method was used to collect plate waste data from 693
trays at two elementary schools, one middle school, and one high school in a suburban school
district. Post-consumption photographs were compared to photographs of pre-portioned standard
servings. Fruit and vegetable consumption was estimated to the nearest 10%. Differences in
consumption across grade level, gender, and school were ascertained using the Kruskal-Wallis
Test with post hoc Mann-Whitney U Tests.
Results
The rate of consumption differed across grade levels. Elementary and middle school students
consumed significantly less of the selected whole fruits compared to high school students
(p=0.014). High school students consumed significantly more of the selected cut up fresh fruit
compared to elementary school students (p=0.001). This study shows that some categories were
readily selected and consumed, and a few were highly wasted. Cut fresh fruits, canned fruits, and
fruit juices were highly selected and consumed. Potato products were moderately selected and
highly consumed. Whole fruits and raw vegetables were highly selected, but often wasted.
Cooked vegetables and dried fruits had low rates of both selection and consumption.
Applications for Child Nutrition Professionals Whole fruits should be replaced with cut fresh fruits at elementary and middle schools. Greater
variety of fruits and vegetables should be introduced to improve selection and consumption.
School nutrition professionals should reduce or remove highly processed potato products
because they may compete with selection and consumption of healthier vegetable options.
Further research is needed to identify student preferences for healthy vegetables. Taste-testing,
school gardens, and other educational initiatives may increase consumption, and reduce overall
waste.
Keywords: Plate waste; Healthy Hunger Free Kids Act of 2010; fruits; vegetables; foodservice;
nutrition
INTRODUCTION
The National School Lunch Program (NSLP) is one of the largest federally assisted meal
programs in the United States, operating in over 100,000 schools, and serving an estimated 31
million students each day (United States Department of Agriculture [USDA] Food and Nutrition
Service [FNS], 2013). Participating students consume up to 47% of their daily calories at school,
which demonstrates the NSLP greatly contributes to overall diet and food acceptance (Briefel,
Wilson, & Gleason, 2009). Prior to 2012, the NSLP followed the 1995 Dietary Guidelines for
Americans, and lunch could consist of any three to five food groups, including 2 oz. meat or
meat alternative, 1 serving grain, 8 oz. dairy, and one serving fruit (½ cup), and one serving of
vegetable (¾ cup) (Child Nutrition and WIC Reauthorization Act, 2004). In 2012, new federal
standards were implemented as a part of the Healthy, Hunger-Free Kids Act of 2010 (HHFKA).
These standards aligned the NSLP with the 2005 Dietary Guidelines for Americans (Healthy,
Hunger-Free Kids Act, 2010). Under the HHFKA, the NSLP established weekly offerings of
dark green and orange vegetables and legumes, portion sizes of a half-cup or greater for fruits
and vegetables, and a requirement that students must take at least one fruit or vegetable as a
component of a NSLP meal (USDA-FNS, 2012). The requirements for dark green and orange
vegetables are particularly important because, in years prior, children were frequently consuming
processed potato and tomato products that were high in calories, fat, and sodium (Kimmons,
Gillespie, Seymour, Serdula, & Blanck, 2009). Consuming these products on a regular basis
increases the risk for obesity and chronic disease (Kimmons et al., 2009).
The updated NSLP guidelines were met with support, but also criticism. Initially, there was
concern that the fruit and vegetable requirements would increase plate waste among students
(Byker, Farris, Marcenelle, Davis, & Serrano, 2014). Recent studies have shown the guidelines
increase student selection of fruit and vegetables without significantly increasing waste (Cohen,
Richardson, Parker, Catalano, & Rimm, 2014; Schwartz, Henderson, Read, Danna, & Ickovics,
2015). However, these studies assert that fruit and vegetable plate waste remains a major
problem with up to 75% of vegetable selections and 40% of fruit selections being discarded by
students.
There are significant financial and health costs associated with plate waste. A recent study
showed that plate waste accounted for approximately 26% of the foodservice budget in Boston
public schools (Cohen, Richardson, Austin, Economos, & Rimm, 2013). Earlier studies reported
up to 37% of calories on students’ plates are wasted at school mealtimes, with girls wasting more
than boys, younger children wasting more than older children, and fruits and vegetables being
the most highly wasted categories (Buzby & Guthrie, 2002). This level of fruit and vegetable
waste among children is concerning because fruits and vegetables are part of a healthy diet that
reduces the risk for obesity and chronic disease (USDA, 2015a; USDA, 2015b). Because fruit
and vegetable plate waste negatively impacts foodservice costs and student health, it is important
to examine the level of waste under the new NSLP guidelines.
This project assessed fruit and vegetable plate waste in a southeastern Pennsylvania school
district, examined patterns of selection and consumption of specific fruit and vegetable
subgroups, and analyzed for differences across gender, grade level, and school. In addition, this
paper outlines research-based strategies for foodservice staff to reduce fruit and vegetable plate
waste by increasing consumption among students.
METHODS
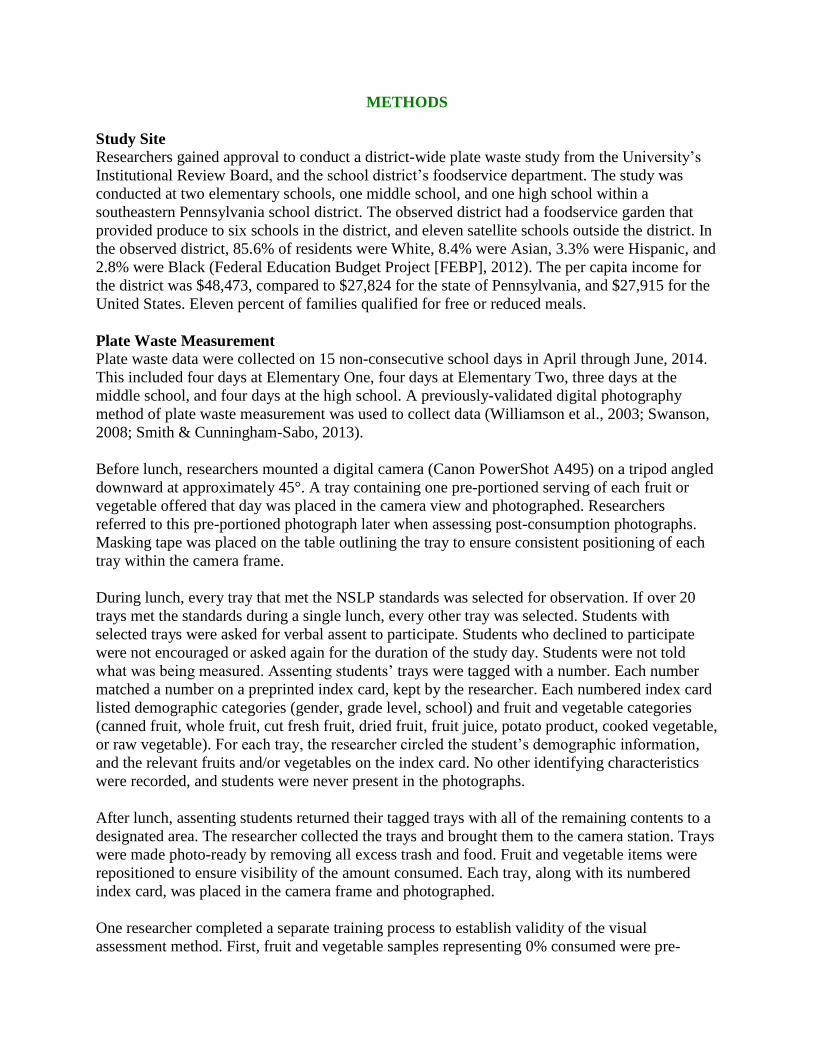
Study Site
Researchers gained approval to conduct a district-wide plate waste study from the University’s
Institutional Review Board, and the school district’s foodservice department. The study was
conducted at two elementary schools, one middle school, and one high school within a
southeastern Pennsylvania school district. The observed district had a foodservice garden that
provided produce to six schools in the district, and eleven satellite schools outside the district. In
the observed district, 85.6% of residents were White, 8.4% were Asian, 3.3% were Hispanic, and
2.8% were Black (Federal Education Budget Project [FEBP], 2012). The per capita income for
the district was $48,473, compared to $27,824 for the state of Pennsylvania, and $27,915 for the
United States. Eleven percent of families qualified for free or reduced meals.
Plate Waste Measurement
Plate waste data were collected on 15 non-consecutive school days in April through June, 2014.
This included four days at Elementary One, four days at Elementary Two, three days at the
middle school, and four days at the high school. A previously-validated digital photography
method of plate waste measurement was used to collect data (Williamson et al., 2003; Swanson,
2008; Smith & Cunningham-Sabo, 2013).
Before lunch, researchers mounted a digital camera (Canon PowerShot A495) on a tripod angled
downward at approximately 45°. A tray containing one pre-portioned serving of each fruit or
vegetable offered that day was placed in the camera view and photographed. Researchers
referred to this pre-portioned photograph later when assessing post-consumption photographs.
Masking tape was placed on the table outlining the tray to ensure consistent positioning of each
tray within the camera frame.
During lunch, every tray that met the NSLP standards was selected for observation. If over 20
trays met the standards during a single lunch, every other tray was selected. Students with
selected trays were asked for verbal assent to participate. Students who declined to participate
were not encouraged or asked again for the duration of the study day. Students were not told
what was being measured. Assenting students’ trays were tagged with a number. Each number
matched a number on a preprinted index card, kept by the researcher. Each numbered index card
listed demographic categories (gender, grade level, school) and fruit and vegetable categories
(canned fruit, whole fruit, cut fresh fruit, dried fruit, fruit juice, potato product, cooked vegetable,
or raw vegetable). For each tray, the researcher circled the student’s demographic information,
and the relevant fruits and/or vegetables on the index card. No other identifying characteristics
were recorded, and students were never present in the photographs.
After lunch, assenting students returned their tagged trays with all of the remaining contents to a
designated area. The researcher collected the trays and brought them to the camera station. Trays
were made photo-ready by removing all excess trash and food. Fruit and vegetable items were
repositioned to ensure visibility of the amount consumed. Each tray, along with its numbered
index card, was placed in the camera frame and photographed.
One researcher completed a separate training process to establish validity of the visual
assessment method. First, fruit and vegetable samples representing 0% consumed were pre-
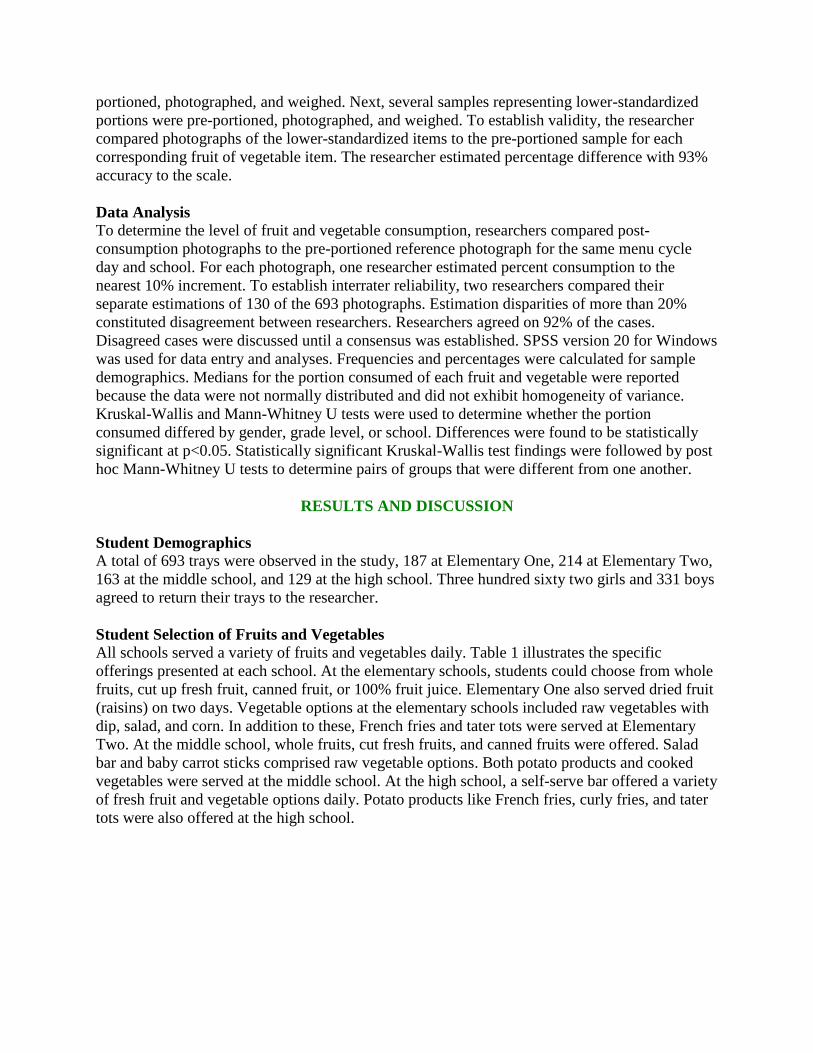
portioned, photographed, and weighed. Next, several samples representing lower-standardized
portions were pre-portioned, photographed, and weighed. To establish validity, the researcher
compared photographs of the lower-standardized items to the pre-portioned sample for each
corresponding fruit of vegetable item. The researcher estimated percentage difference with 93%
accuracy to the scale.
Data Analysis
To determine the level of fruit and vegetable consumption, researchers compared post-
consumption photographs to the pre-portioned reference photograph for the same menu cycle
day and school. For each photograph, one researcher estimated percent consumption to the
nearest 10% increment. To establish interrater reliability, two researchers compared their
separate estimations of 130 of the 693 photographs. Estimation disparities of more than 20%
constituted disagreement between researchers. Researchers agreed on 92% of the cases.
Disagreed cases were discussed until a consensus was established. SPSS version 20 for Windows
was used for data entry and analyses. Frequencies and percentages were calculated for sample
demographics. Medians for the portion consumed of each fruit and vegetable were reported
because the data were not normally distributed and did not exhibit homogeneity of variance.
Kruskal-Wallis and Mann-Whitney U tests were used to determine whether the portion
consumed differed by gender, grade level, or school. Differences were found to be statistically
significant at p<0.05. Statistically significant Kruskal-Wallis test findings were followed by post
hoc Mann-Whitney U tests to determine pairs of groups that were different from one another.
RESULTS AND DISCUSSION
Student Demographics
A total of 693 trays were observed in the study, 187 at Elementary One, 214 at Elementary Two,
163 at the middle school, and 129 at the high school. Three hundred sixty two girls and 331 boys
agreed to return their trays to the researcher.
Student Selection of Fruits and Vegetables All schools served a variety of fruits and vegetables daily. Table 1 illustrates the specific
offerings presented at each school. At the elementary schools, students could choose from whole
fruits, cut up fresh fruit, canned fruit, or 100% fruit juice. Elementary One also served dried fruit
(raisins) on two days. Vegetable options at the elementary schools included raw vegetables with
dip, salad, and corn. In addition to these, French fries and tater tots were served at Elementary
Two. At the middle school, whole fruits, cut fresh fruits, and canned fruits were offered. Salad
bar and baby carrot sticks comprised raw vegetable options. Both potato products and cooked
vegetables were served at the middle school. At the high school, a self-serve bar offered a variety
of fresh fruit and vegetable options daily. Potato products like French fries, curly fries, and tater
tots were also offered at the high school.
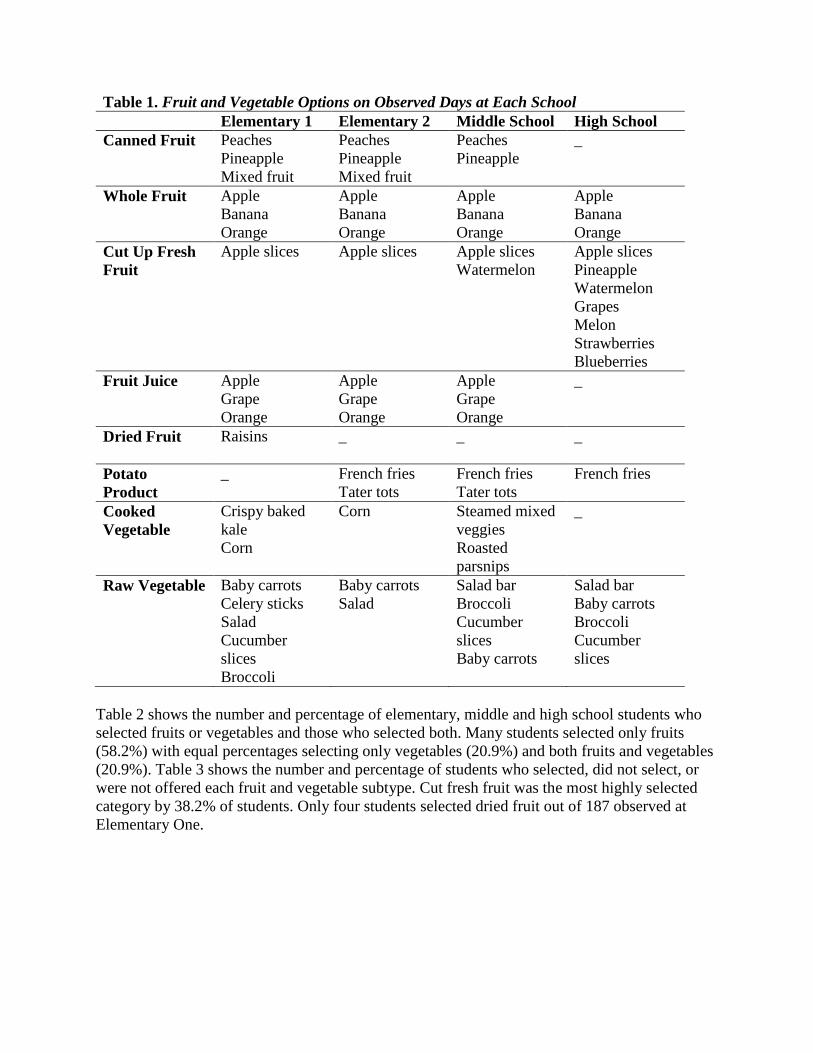
Table 1. Fruit and Vegetable Options on Observed Days at Each School
Elementary 1 Elementary 2 Middle School High School
Canned Fruit Peaches
Pineapple
Mixed fruit
Peaches
Pineapple
Mixed fruit
Peaches
Pineapple
_
Whole Fruit Apple
Banana
Orange
Apple
Banana
Orange
Apple
Banana
Orange
Apple
Banana
Orange
Cut Up Fresh
Fruit
Apple slices Apple slices Apple slices
Watermelon
Apple slices
Pineapple
Watermelon
Grapes
Melon
Strawberries
Blueberries
Fruit Juice Apple
Grape
Orange
Apple
Grape
Orange
Apple
Grape
Orange
_
Dried Fruit
Raisins _ _ _
Potato
Product
_ French fries
Tater tots
French fries
Tater tots
French fries
Cooked
Vegetable
Crispy baked
kale
Corn
Corn Steamed mixed
veggies
Roasted
parsnips
_
Raw Vegetable Baby carrots
Celery sticks
Salad
Cucumber
slices
Broccoli
Baby carrots
Salad
Salad bar
Broccoli
Cucumber
slices
Baby carrots
Salad bar
Baby carrots
Broccoli
Cucumber
slices
Table 2 shows the number and percentage of elementary, middle and high school students who
selected fruits or vegetables and those who selected both. Many students selected only fruits
(58.2%) with equal percentages selecting only vegetables (20.9%) and both fruits and vegetables
(20.9%). Table 3 shows the number and percentage of students who selected, did not select, or
were not offered each fruit and vegetable subtype. Cut fresh fruit was the most highly selected
category by 38.2% of students. Only four students selected dried fruit out of 187 observed at
Elementary One.
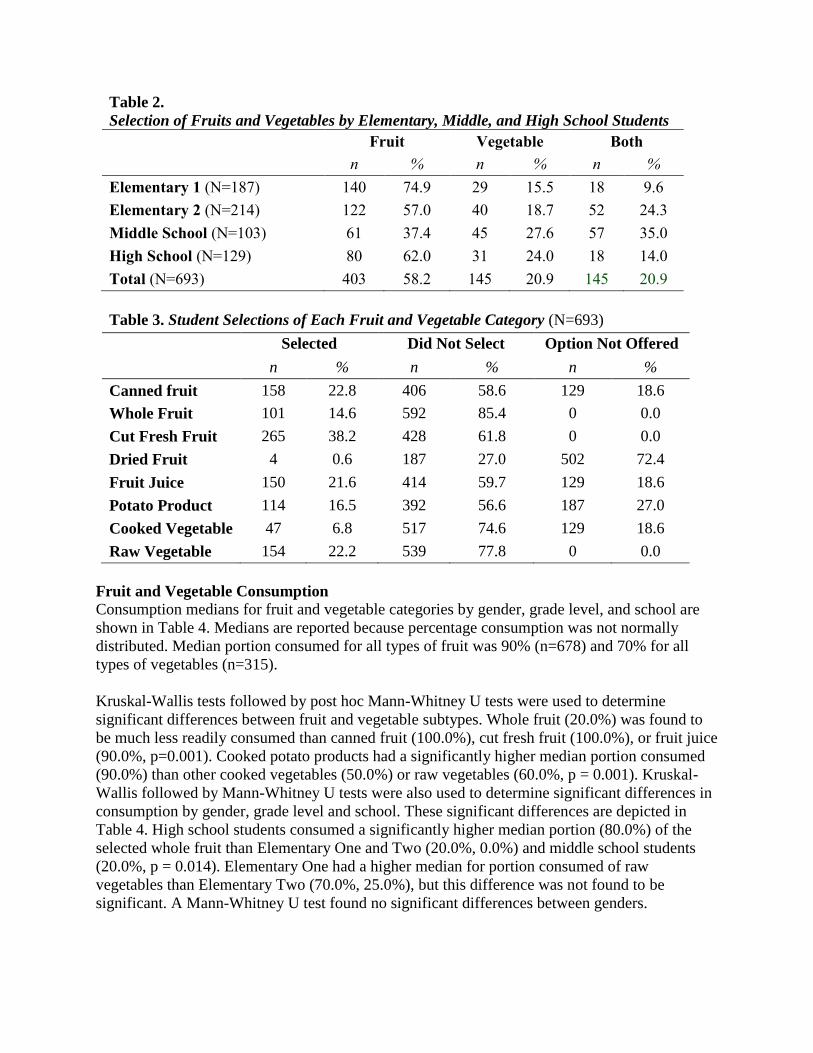
Table 2.
Selection of Fruits and Vegetables by Elementary, Middle, and High School Students
Fruit Vegetable Both
n % n % n %
Elementary 1 (N=187) 140 74.9 29 15.5 18 9.6
Elementary 2 (N=214) 122 57.0 40 18.7 52 24.3
Middle School (N=103) 61 37.4 45 27.6 57 35.0
High School (N=129) 80 62.0 31 24.0 18 14.0
Total (N=693) 403 58.2 145 20.9 145 20.9
Table 3. Student Selections of Each Fruit and Vegetable Category (N=693)
Selected Did Not Select Option Not Offered
n % n % n %
Canned fruit 158 22.8 406 58.6 129 18.6
Whole Fruit 101 14.6 592 85.4 0 0.0
Cut Fresh Fruit 265 38.2 428 61.8 0 0.0
Dried Fruit 4 0.6 187 27.0 502 72.4
Fruit Juice 150 21.6 414 59.7 129 18.6
Potato Product 114 16.5 392 56.6 187 27.0
Cooked Vegetable 47 6.8 517 74.6 129 18.6
Raw Vegetable 154 22.2 539 77.8 0 0.0
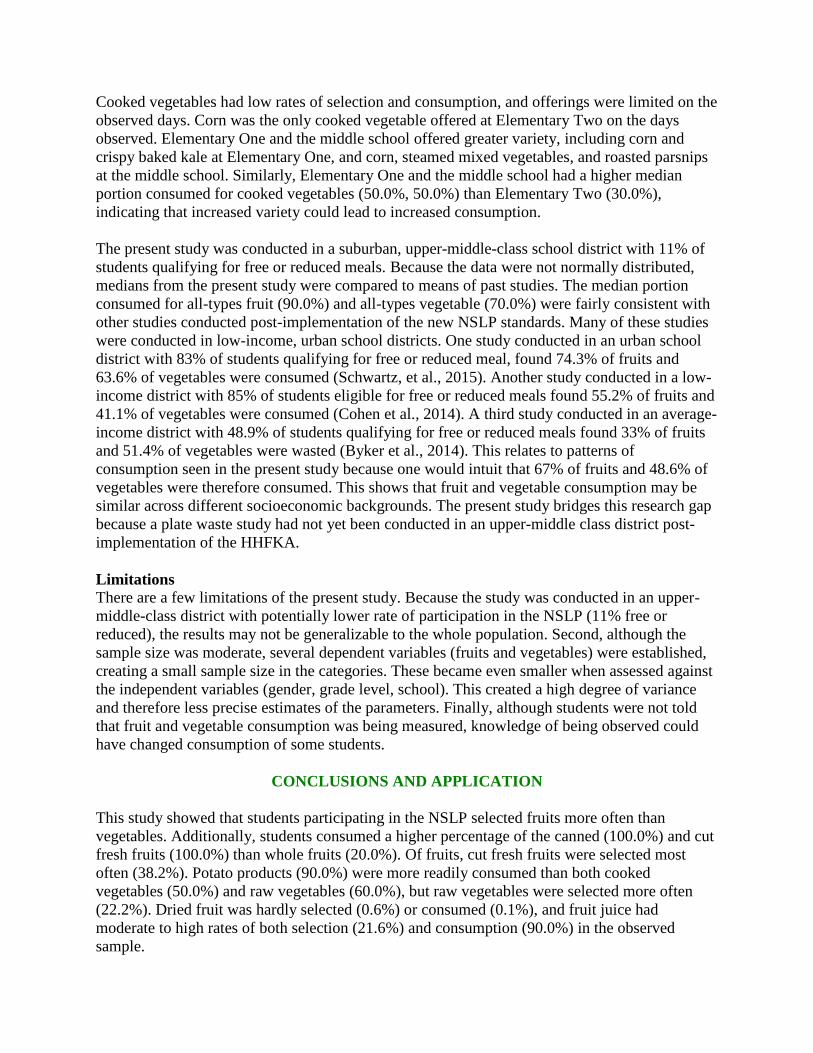
Fruit and Vegetable Consumption
Consumption medians for fruit and vegetable categories by gender, grade level, and school are
shown in Table 4. Medians are reported because percentage consumption was not normally
distributed. Median portion consumed for all types of fruit was 90% (n=678) and 70% for all
types of vegetables (n=315).
Kruskal-Wallis tests followed by post hoc Mann-Whitney U tests were used to determine
significant differences between fruit and vegetable subtypes. Whole fruit (20.0%) was found to
be much less readily consumed than canned fruit (100.0%), cut fresh fruit (100.0%), or fruit juice
(90.0%, p=0.001). Cooked potato products had a significantly higher median portion consumed
(90.0%) than other cooked vegetables (50.0%) or raw vegetables (60.0%, p = 0.001). Kruskal-
Wallis followed by Mann-Whitney U tests were also used to determine significant differences in
consumption by gender, grade level and school. These significant differences are depicted in
Table 4. High school students consumed a significantly higher median portion (80.0%) of the
selected whole fruit than Elementary One and Two (20.0%, 0.0%) and middle school students
(20.0%, p = 0.014). Elementary One had a higher median for portion consumed of raw
vegetables than Elementary Two (70.0%, 25.0%), but this difference was not found to be
significant. A Mann-Whitney U test found no significant differences between genders.
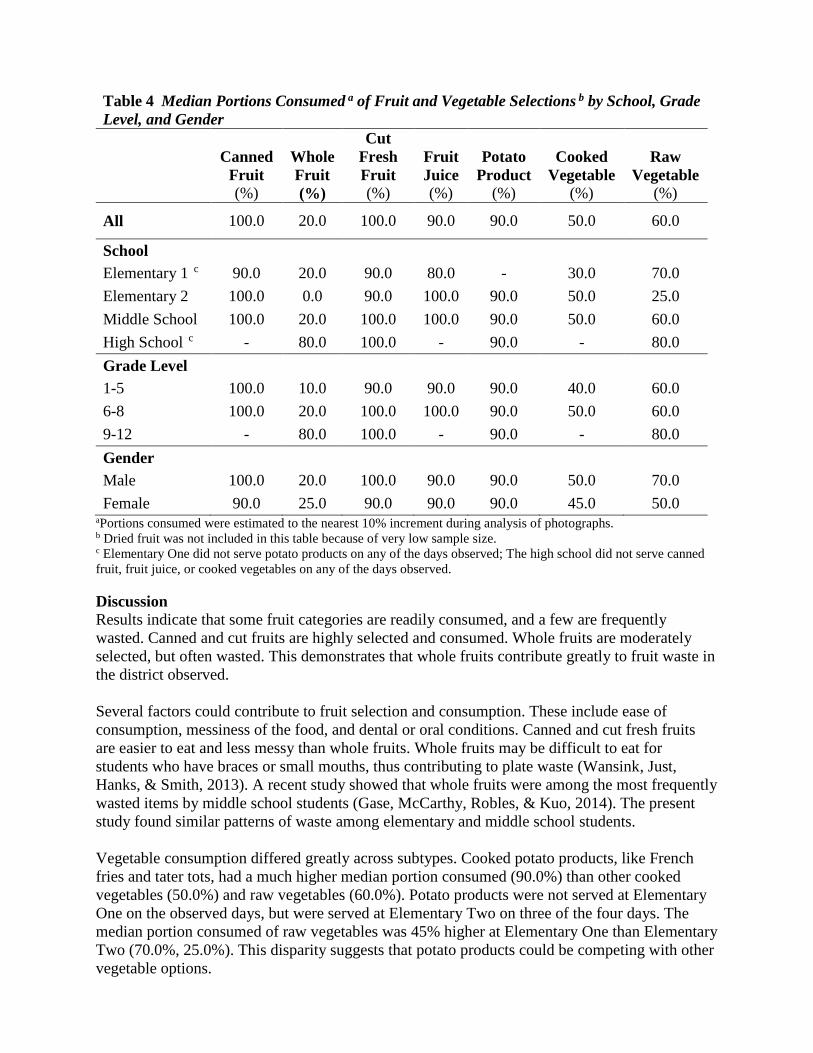
aPortions consumed were estimated to the nearest 10% increment during analysis of photographs.
b Dried fruit was not included in this table because of very low sample size. c Elementary One did not serve potato products on any of the days observed; The high school did not serve canned
fruit, fruit juice, or cooked vegetables on any of the days observed.
Discussion
Results indicate that some fruit categories are readily consumed, and a few are frequently
wasted. Canned and cut fruits are highly selected and consumed. Whole fruits are moderately
selected, but often wasted. This demonstrates that whole fruits contribute greatly to fruit waste in
the district observed.
Several factors could contribute to fruit selection and consumption. These include ease of
consumption, messiness of the food, and dental or oral conditions. Canned and cut fresh fruits
are easier to eat and less messy than whole fruits. Whole fruits may be difficult to eat for
students who have braces or small mouths, thus contributing to plate waste (Wansink, Just,
Hanks, & Smith, 2013). A recent study showed that whole fruits were among the most frequently
wasted items by middle school students (Gase, McCarthy, Robles, & Kuo, 2014). The present
study found similar patterns of waste among elementary and middle school students.
Vegetable consumption differed greatly across subtypes. Cooked potato products, like French
fries and tater tots, had a much higher median portion consumed (90.0%) than other cooked
vegetables (50.0%) and raw vegetables (60.0%). Potato products were not served at Elementary
One on the observed days, but were served at Elementary Two on three of the four days. The
median portion consumed of raw vegetables was 45% higher at Elementary One than Elementary
Two (70.0%, 25.0%). This disparity suggests that potato products could be competing with other
vegetable options.
Table 4 Median Portions Consumed a of Fruit and Vegetable Selections b by School, Grade
Level, and Gender
Canned
Fruit
(%)
Whole
Fruit
(%)
Cut
Fresh
Fruit
(%)
Fruit
Juice
(%)
Potato
Product
(%)
Cooked
Vegetable
(%)
Raw
Vegetable
(%)
All 100.0 20.0 100.0 90.0 90.0 50.0 60.0
School
Elementary 1 c 90.0 20.0 90.0 80.0 - 30.0 70.0
Elementary 2 100.0 0.0 90.0 100.0 90.0 50.0 25.0
Middle School 100.0 20.0 100.0 100.0 90.0 50.0 60.0
High School c - 80.0 100.0 - 90.0 - 80.0
Grade Level
1-5 100.0 10.0 90.0 90.0 90.0 40.0 60.0
6-8 100.0 20.0 100.0 100.0 90.0 50.0 60.0
9-12 - 80.0 100.0 - 90.0 - 80.0
Gender
Male 100.0 20.0 100.0 90.0 90.0 50.0 70.0
Female 90.0 25.0 90.0 90.0 90.0 45.0 50.0
Cooked vegetables had low rates of selection and consumption, and offerings were limited on the
observed days. Corn was the only cooked vegetable offered at Elementary Two on the days
observed. Elementary One and the middle school offered greater variety, including corn and
crispy baked kale at Elementary One, and corn, steamed mixed vegetables, and roasted parsnips
at the middle school. Similarly, Elementary One and the middle school had a higher median
portion consumed for cooked vegetables (50.0%, 50.0%) than Elementary Two (30.0%),
indicating that increased variety could lead to increased consumption.
The present study was conducted in a suburban, upper-middle-class school district with 11% of
students qualifying for free or reduced meals. Because the data were not normally distributed,
medians from the present study were compared to means of past studies. The median portion
consumed for all-types fruit (90.0%) and all-types vegetable (70.0%) were fairly consistent with
other studies conducted post-implementation of the new NSLP standards. Many of these studies
were conducted in low-income, urban school districts. One study conducted in an urban school
district with 83% of students qualifying for free or reduced meal, found 74.3% of fruits and
63.6% of vegetables were consumed (Schwartz, et al., 2015). Another study conducted in a low-
income district with 85% of students eligible for free or reduced meals found 55.2% of fruits and
41.1% of vegetables were consumed (Cohen et al., 2014). A third study conducted in an average-
income district with 48.9% of students qualifying for free or reduced meals found 33% of fruits
and 51.4% of vegetables were wasted (Byker et al., 2014). This relates to patterns of
consumption seen in the present study because one would intuit that 67% of fruits and 48.6% of
vegetables were therefore consumed. This shows that fruit and vegetable consumption may be
similar across different socioeconomic backgrounds. The present study bridges this research gap
because a plate waste study had not yet been conducted in an upper-middle class district post-
implementation of the HHFKA.
Limitations
There are a few limitations of the present study. Because the study was conducted in an upper-
middle-class district with potentially lower rate of participation in the NSLP (11% free or
reduced), the results may not be generalizable to the whole population. Second, although the
sample size was moderate, several dependent variables (fruits and vegetables) were established,
creating a small sample size in the categories. These became even smaller when assessed against
the independent variables (gender, grade level, school). This created a high degree of variance
and therefore less precise estimates of the parameters. Finally, although students were not told
that fruit and vegetable consumption was being measured, knowledge of being observed could
have changed consumption of some students.
CONCLUSIONS AND APPLICATION
This study showed that students participating in the NSLP selected fruits more often than
vegetables. Additionally, students consumed a higher percentage of the canned (100.0%) and cut
fresh fruits (100.0%) than whole fruits (20.0%). Of fruits, cut fresh fruits were selected most
often (38.2%). Potato products (90.0%) were more readily consumed than both cooked
vegetables (50.0%) and raw vegetables (60.0%), but raw vegetables were selected more often
(22.2%). Dried fruit was hardly selected (0.6%) or consumed (0.1%), and fruit juice had
moderate to high rates of both selection (21.6%) and consumption (90.0%) in the observed
sample.
Recommendations
The present study examined specific fruit and vegetable subtypes, which could help foodservice
professionals determine where plate waste could be occurring. From this study, several
interventions can be applied to reduce waste while increasing student consumption. First, school
nutrition personnel should reduce or remove whole fruits at the elementary and middle school
levels, replacing with cut up fresh fruits. A study of middle school students found that pre-slicing
whole apples increased apple consumption by 17% (Wansink et al., 2013). Second, school
nutrition personnel could offer a greater variety of fruit and vegetable options daily. Past
research showed that greater variety increased consumption (Adams et al., 2005; Hakim &
Meissen, 2013). The present study supports the findings of past research because the greatest
variety of cooked vegetables were offered at Elementary One and the middle school, where
consumption of this subtype was the highest (50.0%, 50.0%). At the elementary schools, sliced
apples were the only option for cut fresh fruit, and consumption of this subtype was lower
(90.0%, 90.0%) than at the middle (100.0%) and high schools (100.0%). A self-serve fruit and
vegetable bar offered a wide variety of cut fresh fruits at the high school, where consumption
was determined to be the highest by Kruskal-Wallis test (100.0%). Raw vegetable consumption
was comparable at the high school and Elementary One, both of which offered many different
types of raw vegetables (70.0% and 80.0%).
From the present study, it appears that potato products could be competing with selection and
consumption of other raw and cooked vegetables. This is demonstrated by the disparity of raw
vegetable consumption between Elementary One, where potato products were not offered, and
Elementary Two, where they were offered most days (70.0%, 25.0%). Taking this into
consideration, it may be beneficial for school nutrition professionals to reduce or remove highly-
processed potato options in the interest of student health.
Not a lot is known about student preferences for raw or cooked vegetables. The present study did
not examine student preferences for specific vegetable items. Following this study, another study
should be conducted using the same methods to objectively determine student selection and
consumption of raw and cooked vegetable menu items.
This study should observe specific vegetable types and preparations (i.e. roasted broccoli,
steamed asparagus, cooked corn, raw vegetables with dip, salad with dressing). From this type of
study, student selection and consumption of raw and cooked vegetables can be objectively
examined. In addition to an objective follow up study, a survey tool could be used by foodservice
professionals to subjectively assess student preferences for raw and cooked vegetable types,
preparations, and serving sizes.
Experiential learning approaches have been shown to improve outcomes for healthy eating
among students (Dudley, Cotton, & Peralta, 2015). Taste-testing, school gardens, and
educational assemblies could be among these initiatives. The district observed offered taste-
testing opportunities in which students were allowed to try new recipes before they were served
in the cafeteria. Within the district, it had not been measured whether this initiative improved
consumption. However, because the positive outcome of experiential learning is supported by
prior research, it could be beneficial to implement in a district that does not currently offer taste-
testing. The same is true for school foodservice gardens. A foodservice garden provided fresh
produce to the observed district’s lunch program, which promoted agricultural education and
interest among students. Students were encouraged to join in the Farm-to-Plate process by
volunteering, touring the garden, or participating in the Adopt-A-Seedling program, a program in
which elementary students planted a seedling in the garden and watched it grow over time. Past
research shows that school gardens significantly increased students’ consumption of fruits and
vegetables (Taylor & Johnson, 2013; Davis, Ventura, Cook, Gyllenhammer, & Gatto, 2011;
Heim, Stang, & Ireland, 2009). Finally, a school assembly could help inform students about the
plate waste problem. At the assembly, empty trash bins could be lined up on stage to represent
the weekly amount of fruit and vegetable waste. This could be done around Earth Day so that it
relates to educational curriculum. These are just a few examples of experiential learning
implementations that could increase consumption of fruits and vegetables among students
(Dudley et al., 2015).
The present study shows that fruit and vegetable plate waste is a major problem with median
values of 90.0% of fruits and 70.0% of vegetables being consumed. Fruit and vegetable plate
waste increases costs for school nutrition departments and may compromise the health of
children because they miss out on vital nutrients from the fruits and vegetables they do not
consume. School nutrition departments should apply the aforementioned recommendations to
increase consumption among students and reduce plate waste of fruits and vegetables. Further
research is needed to determine student preferences for raw and cooked vegetable options.
ACKNOWLEDGEMENTS
This project was supported by the Master of Public Health Program and the Nutrition
Department at West Chester University of Pennsylvania. Equipment was provided by the
Foodservice Department at Great Valley School District. The authors appreciate the assistance of
foodservice staff at the district, and would like to thank all students who participated in the study.
Technical assistance was provided by West Chester University of Pennsylvania. The contents of
this publication do not necessarily reflect the views or policies of Great Valley School District or
West Chester University of Pennsylvania.
REFERENCES
Adams, M.A., Pelletier, R.L. Zive, M.M., & Sallis, J.F. (2005). Salad bars and fruit and
vegetable consumption in elementary schools: A plate waste study. Journal of the American
Dietetic Association, 105(11), 1789-92. doi:10.1016/j.jada.2005.08.013
Briefel, R.R., Wilson, A., & Gleason, P.M. (2009). Consumption of low-nutrient, energy-dense
foods and beverages at school, home, and other locations among school lunch participants and
nonparticipants. Journal of the American Dietetic Association, 109(2), 79-90.
doi:10.1016/j.jada.2008.10
Buzby, J.C., & Guthrie, J.F. (2002). Plate waste in school nutrition programs: Final report to
Congress. Electronic publications from the Food Nutrition & Assistance Program.
E-FAN-02-009. Retrieved from http://www.ers.usda.gov/media/887982/efan02009.pdf
Byker, C.J., Farris, A.R., Marcenelle, M., Davis, G.C., & Serrano, E.L. (2014). Food waste in a
school nutrition program after implementation of new lunch program guidelines. Journal of
Nutrition Education & Behavior, 46(5), 406-411. doi.org/10.1016/j.jneb.2014.03.009
Child Nutrition and WIC Reauthorization Act of 2004. (2004). Pub. L. 108-265, § 118, Stat. 731.
Cohen, J.F.W., Richardson, S., Parker, E., Catalano, P.J., & Rimm, E.B. (2014). Impact of the
new U.S. Department of Agriculture school meal standards on food selection, consumption, and
waste. American Journal of Preventative Medicine, 46(4), 388-394.
doi:10.1016/j.amepre.2013.11.013
Cohen, J.F.W., Richardson, S., Austin, S.B., Economos, C.D., & Rimm, E.B. (2013). School
lunch waste among middle school students: Implications for nutrients consumed and food waste
costs. American Journal of Preventative Medicine, 44(2), 114-121.
doi:10.1016/j.amepre.2012.09.060
Davis, J.N., Ventura, E.E., Cook, L.T., Gyllenhammer, L.E., & Gatto, N.M. (2011). LA Sprouts:
A gardening, nutrition, and cooking intervention for Latino youth improves diet and reduce
obesity. Journal of the American Dietetic Association, 111(8), 1224-1230.
doi:10.1016/j.jada.2011.05.009
Dudley, D. A., Cotton, W. G., & Peralta, L. R. (2015). Teaching approaches and strategies that
promote healthy eating in primary school children: A systematic review and meta-analysis.
International Journal of Behavioral Nutrition & Physical Activity, 12(1), 1-26.
doi:10.1186/s12966-015-0182-8
Federal Education Budget Project (2012). Great Valley School District. New America
Foundation. Retrieved from http://febp.newamerica.net/k12/PA/4210870
Gase, L. N., McCarthy, W. J., Robles, B., & Kuo, T. (2014). Student receptivity to new school
meal offerings: Assessing fruit and vegetable waste among middle school students in the Los
Angeles Unified School District. Preventive Medicine, 67, 28-33.
doi:10.1016/j.ypmed.2014.04.013
Hakim, S, & Meissen, G. (2013). Increasing consumption of fruits and vegetables in the school
cafeteria: The influence of active choice. Journal of Health Care for the Poor and Underserved,
24(2). doi:10.1353/hpu.2013.0109
Healthy, Hunger-Free Kids Act of 2010, Pub. L. No 111-296, §243, 124 Stat. 3183-3266.
Heim, S., Stand, J., & Ireland, M. (2009). A garden pilot project enhances fruit and vegetable
consumption among children. Journal of the American Dietetic Association, 109(7) 1220-1226.
doi:10.1016/j.jada.2009.04.009
Kimmons, J., Gillespie, C., Seymour, J., Serdula, M., & Blanck, H.M. (2009). Fruit and
vegetable intake among adolescents and adults in the United States: Percentage meeting
individualized recommendations. Medscape Journal of Medicine, 11(2), 26. Retrieved from
http://www.medscape.com/viewarticle/586492
Schwartz, M.B., Henderson, K.E., Read, M., Danna, N., & Ickovics, J.R. (2015). New school
meal regulations increase fruit consumption and do not increase total plate waste. Childhood
Obesity, 19(9). doi:10.1089/chi.2015.0019
Smith, S.L., & Cunningham-Sabo, L. (2013). Food choice, plate waste, and nutrient intake of
elementary- and middle-school students participating in the National School Lunch Program.
Public Health Nutrition, 1-9. doi:10.1017/S1368980013001894
Swanson, M. (2008). Digital photography as a tool to measure school cafeteria consumption.
Journal of School Health, 78(8), 423-427.
doi:10.111/j.1746-1561.2008.00326.x
Taylor J.C., & Johnson, R.K. (2013). Farm to school as a strategy to increase children’s fruit and
vegetable consumption in the United States: Research and recommendations. British Nutrition
Foundation Nutrition Bulletin, 38, 70-79. doi:10.1111/nbu.12009
U.S. Department of Agriculture, & U.S. Department of Health and Human Services. (2010).
Dietary Guidelines for Americans 2010. Washington, DC: U.S. Government Printing Office.
U.S. Department of Agriculture, Food and Nutrition Service. (2012). Nutrition standards in the
National School Lunch and School Breakfast Programs: Final rule. Federal Register. 70(17).
Retrieved from http://www.gpo.gov/fdsys/pkg/FR-2012-01-26/pdf/2012-1010.pdf
U.S. Department of Agriculture, Food and Nutrition Service. (2013). National School Lunch
Program fact sheet. Retrieved from
http://www.fns.usda.gov/sites/default/files/NSLPFactSheet.pdf
U.S. Department of Agriculture. (2015a). Nutrients and health benefits. Why is it important to
eat fruit? Retrieved from http://www.choosemyplate.gov/fruits-nutrients-health
U.S. Department of Agriculture. (2015b). Nutrients and health benefits. Why is it important to
eat vegetables? Retrieved from http://www.choosemyplate.gov/vegetables-nutrients-health
Wansink, B., Just, D.R., Hanks, A.S., & Smith, L.E. (2013). Pre-sliced fruit in school cafeterias:
Children’s selection and intake. American Journal of Preventative Medicine, 44(5) 477-480.
doi:10.1016/j.amepre.2013.02.003
Williamson, D.A., Allen, R., Martin, P.D., Alfonso, A.J., Gerald, B., & Hunt. (2003).
Comparison of digital photography to weighed and visual estimation of portion sizes. Journal of
the American Dietetic Association, 103(9), 1139-1145. PMID: 12963941
BIOGRAPHY
Handforth, Gilboy, and Harris are all associated with the West Chester University of
Pennsylvania where Handforth is a Plate Waste Research Coordinator and Analyst, Gilboy is
Coordinator of the Nutrition Track of the MPH Program, and Harris is Chair of the Nutrition
Department. Melia is Supervisor of Foodservice at Great Valley School District in southeastern
Pennsylvania.