Embed Size (px)
Citation preview
Fruit and Vegetable Processing Industry Self-Monitoring Manual Table of Contents
1. Introduction 5 1.1 Preface 6 1.1 1.1.1 Project objectives 6
1.1.2. Organization of the inspection and self-monitoring manuals 6 1.2 Introduction to the Fruit and Vegetable processing industry 7
1.2.1 Egyptian SIC code for the Fruit and Vegetable processing industry
7
1.2.2 Industry size distribution 7 2. Description of the industry 8
2.1 Raw materials, products and utilities. 8 2.2 Production lines 9
2.2.1 Tomato paste production line 9 2.2.2 Frozen vegetables production line 12 2.2.3 Juice and syrup production line 14 2.2.4 Jam production line. 16 2.2.5 Canned beans production line 18 2.2.6 Lentil soup production line 18
2.3 Service units: description and potential pollution sources 20 2.3.1 Boilers 20 2.3.2 Water Treatment Units 20 2.3.3 Cooling Towers 21 2.3.4 Refrigeration systems 21 2.3.5 Clean in Place 22 2.3.6 Tin Cans Manufacturing 22 2.3.7 Laboratories 22 2.3.8 Workshops and Garage 23 2.3.9 Storage Facilities 23 2.3.10 Wastewater Treatment Plants 23 2.3.11 Restaurants, Washrooms and Housing Complex 23
2.4 Emissions, effluents and solid wastes 26 2.4.1 Air emissions 26 2.4.2 Effluents 26 2.4.3 Solid wastes 28
2.5 Characteristics of the Fruit and Vegetable processing industry 29 3. Environmental and health impacts of pollutants. 30
3.1 Impact of air emissions 30 3.2 Impact of effluents 31 3.3 Environmental Impact of Solid Wastes 31
4. Egyptian laws and regulations 32 4.1 Concerning air emissions 32 4.2 Concerning effluents 33 4.3 Concerning solid waste 33 4.4 Concerning work environment 33 4.5 Concerning hazardous material and waste 35 4.6 Concerning the Environmental Register. 35
2
5 Pollution abatement measures 36 5.1 Air pollution 36 5.2 Water pollution abatement measures 37 5.3 Abatement measures for solid waste pollution 38 5.4 Water and energy conservation 38
6 Environmental self-monitoring 40 6.1 Benefits of SM 40 6.2 Scope and objectives of SM 40 6.3 Self-monitoring and Environmental Management Systems (EMS) 41
6.3.1 Environmental Management Systems (EMS) 41 6.3.2 Link between self-monitoring and (EMS) 43 6.3.3 SM link to pollution prevention and cleaner production 44
6.4 Regulatory aspects 47 6.4.1 SM and environmental register 47 6.4.2. SM and inspection 47
7 Planning of SM 49 7.1 Assessment of existing monitoring capacity 51 7.2 Identification of key parameters 51 7.3 General data required 52 7.4 Data collection, manipulation and reporting 52 7.5 Criteria for selecting monitoring method 53
7.5.1 Direct or indirect measurement 53 7.5.2 Mass balance 55 7.5.3 Emission factor 56 7.5.4 Engineering calculations 56
8 Monitoring of raw materials, utilities and products 57 8.1 Raw materials and chemicals 57 8.2 Utilities 57 8.3 Products 58
9 Operation control 59 9.1 Monitoring process parameters 59 9.2 Planned maintenance 62
10 Environmental monitoring 64 10.1 Emission to air 64 10.2 Effluents (wastewater) 65 10.3 Monitoring of solid waste 68
11 Data collection, processing and usage 69 11.1 Data collection and processing 69 11.2 Using SM outputs 69
11.2.1 Techniques for summarizing and illustrating data 69 11.2.2 Environmental register 71 11.2.3 Reporting 71 11. 2.4 Internal auditing and conclusions on results 71 11.2.5 Feedback and decision making 71
11.2.6 Using outputs in public relations 72 Annex A Data collection and processing 73 Annex B Register for environmental conditions 77 Annex C References 84
3
List of Acronyms BOD Biological Oxygen Demand
CAPMAS Central Agency for Public Mobilization and Statistics
CO Carbon Monoxide
COD Chemical Oxygen Demand
EMS Environmental Management System
O&G Oil and Grease
SIC Standard Industrial Classification
SM Self-Monitoring
SMS Self-Monitoring system
SOx Sulfur Oxides
TDS Total Dissolved Solids
UHT Ultra High Temperature
WWTP Wastewater Treatment Plant
µm Micro meter 10-6 m
VOCs Volatile Organic Compounds
NOx Nitogen Oxides
CFCs Chloro-fluoro carbon
MHUUC Ministry of Housing, utilities and urban Communities
CP Cleaner Production
Eop End-of-pipe
4
1. INTRODUCTION
The Egyptian Pollution Abatement Project (EPAP) sponsored by FINIDA has assigned Finish and Egyptian consultants for the task of developing Sector specific inspection and monitoring guidelines. This task is based on a previous collaboration between FINIDA and EPAP that resulted in the development of four Inspection Guidelines: • Fundamentals and Background Manual that provides basic information about
air pollution, wastewater characteristics, solid waste, hazardous materials and wastes and work environment. • Guidelines for Inspectorate Management that discusses the strategy, objectives
and tasks of the inspectorate management. • Guidelines for Team Leaders that identifies the team leader resposibilities and
tasks. • Guidelines for Inspectors that presents a methodology for performing all types
of inspection. Tasks during the various phases of planning, performing field inspection, report preparation and follow-up are discussed. Several checklists are included.
The three guidelines were later summarized into one that will be referred to as the Inspection Guidelines. A General Inspection Manual, GIM, is being developed covering aspects common to all sectors. On the other hand, EPAP realized the need to introduce the concept of self-monitoring, as it provides useful information to the plant’s management on the production efficiency as well as the environmental status. Self-monitoring should cover, as a minimum, the monitoring of the releases to the environment including emissions to air, wastewater, solid waste and hazardous waste. A comprehensive self-monitoring plan may cover process parameters that would affect the environmental impacts. Such plan would assist the management to identify sources of waste, prevent pollution at the source, reduce emissions, and achieve economic benefits. Therefore, a Self-Monitoring Guidebook was also developed to present the industrial community, the consultants, and government officials with the general principles and both managerial and technical aspects to be followed for self-monitoring. The textile industry was chosen as a case study for implementing and testing the manual and a self-monitoring manual for this industry was developed.
5
1.1 Preface
The developed manuals were tested through a number of training programs that targeted RBOs and EMUs. The inspectors involved in the training used these manuals to inspect a number of industrial facilities. Feedback from the concerned parties led to the improvement of these manuals and their continuous update. There was clearly a need for sector-specific guidelines, and EPAP took the initiative to develop such manuals. Five sectors were chosen: • Food Industry with specific reference to the five sub-sectors of Dairy
products, Vegetables and Fruit processing, Grain Milling, Carbonated Beverages and Confectionery. • Pulp and Paper Industry • Metallurgical Industry with specific reference to the two sub-sectors of
Iron and Steel and Aluminum. • Engineering Industry with specific reference to Motor Vehicles Assembly
and Fabricated Metals industries. • Textile Industry.
1.1.1. Project objectives The project aims at the development of sector-specific guidelines for inspection and monitoring to be used by inspectors and plant personnel respectively. These manuals are meant to be simplified but without abstention of any information necessary to the targeted users. Flowcharts, tables and highlighted notes are used for easy representation of information. With respect to the food industry, each sub-sector will have two distinct manuals one for inspection and the other for self-monitoring. Description of the industry, pollution aspects and relevant environmental laws will be similar for both manuals. Each manual will be, as much as possible a stand-alone with occasional cross-reference to the General Guidelines previously developed to avoid undue repetitions.
1.1.2 Organization of the manual The self-monitoring manual for the fruits and vegetables industry includes eleven chapters. The first chapter represents an introduction to the whole project and to the specific sub-sector of the industry. Chapters 2 to 5 deal with the fruits and vegetables industry and its environmental impacts. The description of the industry in Chapter two includes the inputs and outputs, a description of the different production lines with their specific inputs and outputs. In addition, it also includes a brief description of the service and auxiliary units that could be present at the industrial establishment with their potential sources of pollution and the various emissions, effluents and solid wastes generated from the different processes. Chapter 3 describes the environmental and health impacts of the various pollutants whereas Chapter 4 gives a summary of the articles in the Egyptian environmental laws relevant to the fruits and vegetables industry. Chapter 5 gives examples of pollution abatement techniques and measures applicable to the fruits and vegetables industry.
6
The information and steps needed to establish of a self-monitoring system are detailed in chapter 6-11 inclusive. A reasonably detailed introduction to the definition, objectives, benefits of self-monitoring are presented in Chapter 6, in addition to the link between self-monitoring and each of environmental management system and cleaner production. Chapter 7 deals with the aspects of planning of self-monitoring. Monitoring of raw materials is discussed in Chapter 8, while operation control aspects are discussed in Chapter 9. Environmental monitoring is described in Chapter 10. Chapter 11 is dealing with data collection, data processing and data usage. It is worth mentioning that there will be a frequent need of referring to other sources of information in order to plan, implement, and operate an effective and sustainable self-monitoring system. Therefore, references pertinent to subject matter will be mentioned. In addition, need may arise, in some instances where plant personnel are advised to call for external consultation in order to establish a proper, effective, and sustainable self-monitoring system.
1.2 Introduction to the fruit and vegetable processing industry
The fruit and vegetable processing industry is a major enterprise in Egypt, occupying a significant place in food supply. This industry has been identified as an important contributor to the pollution of waterways especially when large industrial establishments are involved as well as solid waste.
1.2.1 Egyptian SIC code for the fruit and vegetable processing industry
The Standard Industrial Classification (SIC) code for the food industry is 15 and the fruit and vegetable processing industries are part of sub-sector 154, which includes other food industries as well.
The CAPMAS (Central Agency for Public Mobilization and Statistics) 1997 data, which is based on the 1996 census, shows that the total number of facilities is 18842.
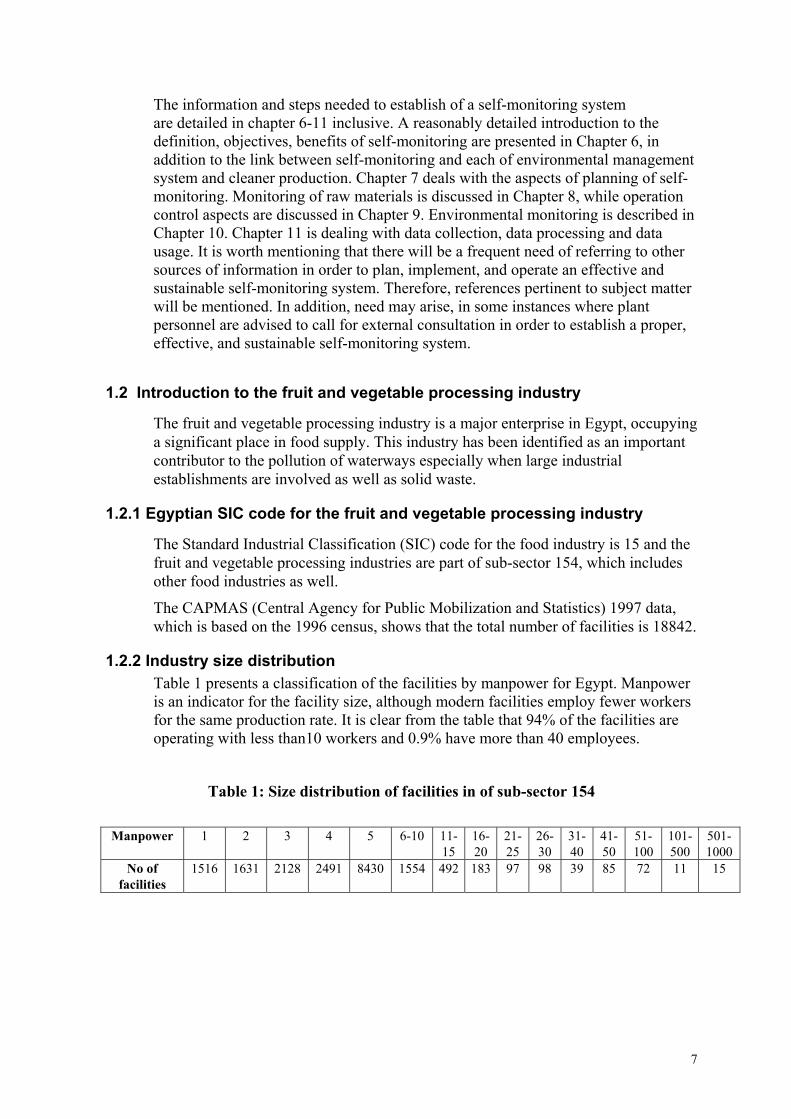
1.2.2 Industry size distribution Table 1 presents a classification of the facilities by manpower for Egypt. Manpower is an indicator for the facility size, although modern facilities employ fewer workers for the same production rate. It is clear from the table that 94% of the facilities are operating with less than10 workers and 0.9% have more than 40 employees.
Table 1: Size distribution of facilities in of sub-sector 154
Manpower 1 2 3 4 5 6-10 11-
15 16- 20
21- 25
26- 30
31-40
41-50
51- 100
101- 500
501-1000
No of facilities
1516 1631 2128 2491 8430 1554 492 183 97 98 39 85 72 11 15
7
2. DESCRIPTION OF THE INDUSTRY The fruit and vegetable processing industry is characterized by the multitude of products and therefore production lines. Plants can have as few as one or two production lines or all of them. Service and ancillary units provide water and energy requirements as well as maintenance, storage, packaging, testing and analysis needs. Because of the nature of fruit and vegetable industry, which is susceptible to microbial spoilage, equipment is characterized by designs which facilitate hygienic operation, easy cleaning and sterilization. While many older plants use open equipment and batch processing, modern facilities use closed systems operated continuously for periods up to 24 hours. Shut down for cleaning is generally required at least once per day.
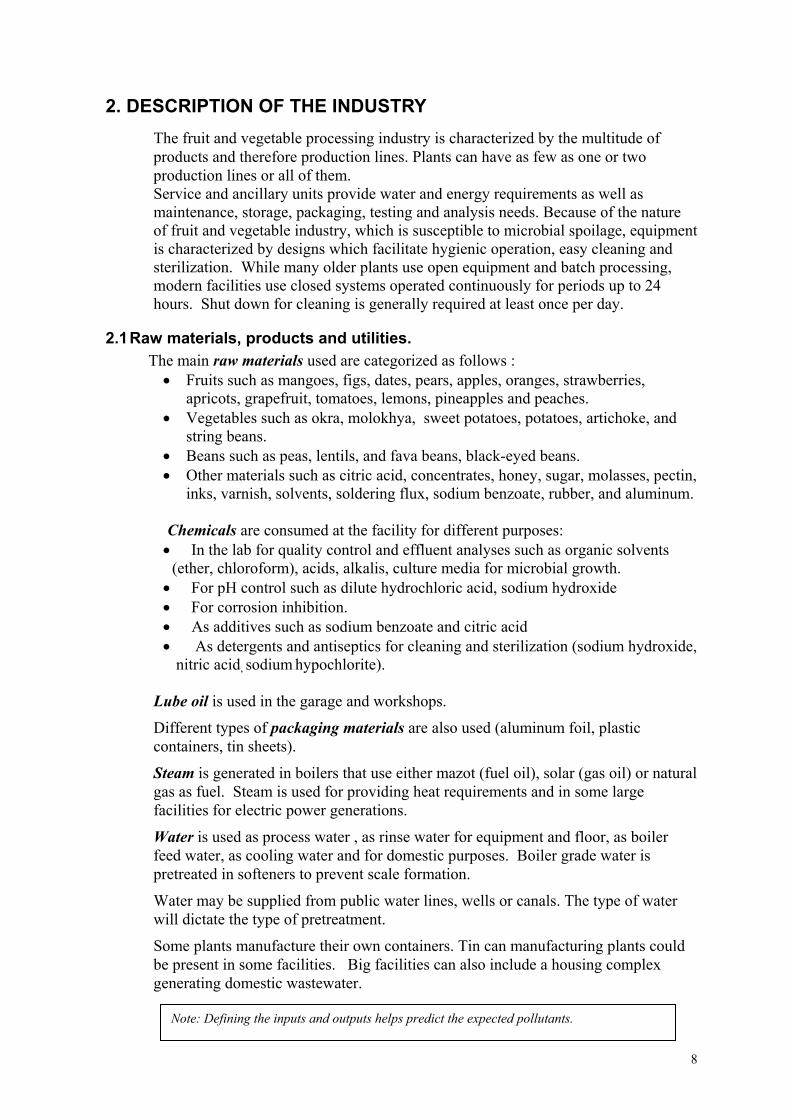
2.1 Raw materials, products and utilities. The main raw materials used are categorized as follows : • Fruits such as mangoes, figs, dates, pears, apples, oranges, strawberries,
apricots, grapefruit, tomatoes, lemons, pineapples and peaches. • Vegetables such as okra, molokhya, sweet potatoes, potatoes, artichoke, and
string beans. • Beans such as peas, lentils, and fava beans, black-eyed beans. • Other materials such as citric acid, concentrates, honey, sugar, molasses, pectin,
inks, varnish, solvents, soldering flux, sodium benzoate, rubber, and aluminum. Chemicals are consumed at the facility for different purposes: • In the lab for quality control and effluent analyses such as organic solvents
(ether, chloroform), acids, alkalis, culture media for microbial growth. • For pH control such as dilute hydrochloric acid, sodium hydroxide • For corrosion inhibition. • As additives such as sodium benzoate and citric acid • As detergents and antiseptics for cleaning and sterilization (sodium hydroxide,
nitric acid, sodium hypochlorite).
Lube oil is used in the garage and workshops.
Different types of packaging materials are also used (aluminum foil, plastic containers, tin sheets).
Steam is generated in boilers that use either mazot (fuel oil), solar (gas oil) or natural gas as fuel. Steam is used for providing heat requirements and in some large facilities for electric power generations.
Water is used as process water , as rinse water for equipment and floor, as boiler feed water, as cooling water and for domestic purposes. Boiler grade water is pretreated in softeners to prevent scale formation.
Water may be supplied from public water lines, wells or canals. The type of water will dictate the type of pretreatment.
Some plants manufacture their own containers. Tin can manufacturing plants could be present in some facilities. Big facilities can also include a housing complex generating domestic wastewater.
Note: Defining the inputs and outputs helps predict the expected pollutants.
8
2.2 Production lines
Table 2 presents the various production lines and service units that could be present in a facility.
Note: Knowledge of the processes involved in each production line and units allows the prediction of pollution hazards and expected violations and helps determine possibilities for implementing cleaner technology.
Table 2. Production lines and service units in fruit and vegetable processing
Service Units Production Lines
Boilers Cooling towers Refrigerators Tin can manufacturing plant Laboratory Mechanical & electrical workshops Garage Storage facilities. Wastewater Treatment Plant Restaurant and Housing complex.
Tomato paste production line Frozen vegetables and fruit production line Juice and syrup production line. Jam production line Canned fava beans production line Canned vegetables production line Lentil soup production line Agar production line
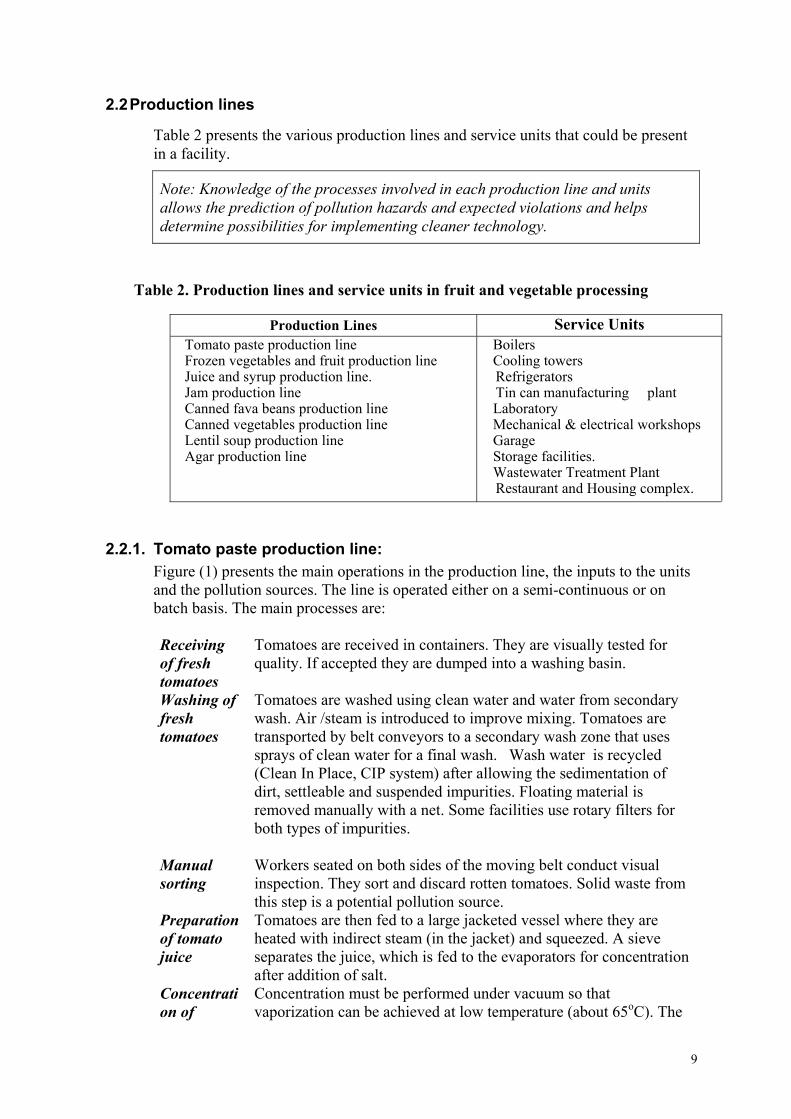
2.2.1. Tomato paste production line: Figure (1) presents the main operations in the production line, the inputs to the units and the pollution sources. The line is operated either on a semi-continuous or on batch basis. The main processes are:
Receiving of fresh tomatoes
Tomatoes are received in containers. They are visually tested for quality. If accepted they are dumped into a washing basin.
Washing of fresh tomatoes
Tomatoes are washed using clean water and water from secondary wash. Air /steam is introduced to improve mixing. Tomatoes are transported by belt conveyors to a secondary wash zone that uses sprays of clean water for a final wash. Wash water is recycled (Clean In Place, CIP system) after allowing the sedimentation of dirt, settleable and suspended impurities. Floating material is removed manually with a net. Some facilities use rotary filters for both types of impurities.
Manual sorting
Workers seated on both sides of the moving belt conduct visual inspection. They sort and discard rotten tomatoes. Solid waste from this step is a potential pollution source.
Preparation of tomato juice
Tomatoes are then fed to a large jacketed vessel where they are heated with indirect steam (in the jacket) and squeezed. A sieve separates the juice, which is fed to the evaporators for concentration after addition of salt.
Concentration of
Concentration must be performed under vacuum so that vaporization can be achieved at low temperature (about 65oC). The
9
tomato juice
vaporization temperature is an important quality control parameter. A higher temperature will cause overcooking (brown color). Vacuum is produced by barometric leg condensers, which use large amounts of cooling water. The waste cooling water is hot (60oC) and will be contaminated with organic matter since it comes in direct contact with the water vapors from the tomato juice.
Canning and sterilization
The tomato paste is then canned, sealed and sterilized using successive heating and cooling methods. The sterilizers use water heated with live steam that fills the workplace then cooling water. Heat and humidity limits for work environment should be checked.
Tomato juice production
Sometimes the same line is used to prepare tomato juice adding salt to the cooked juice. The juice is packed, sterilized, and stored.
Note: Find out: • What happens to tomato reject ? • When is the CIP basin emptied? • What type of detergent and/or antiseptic is used? • Are there screens on the gutter to prevent solids discharge to sewer? • What happens to the solid waste from the filtration unit? • How is sterilization performed? In open or closed equipment?
10
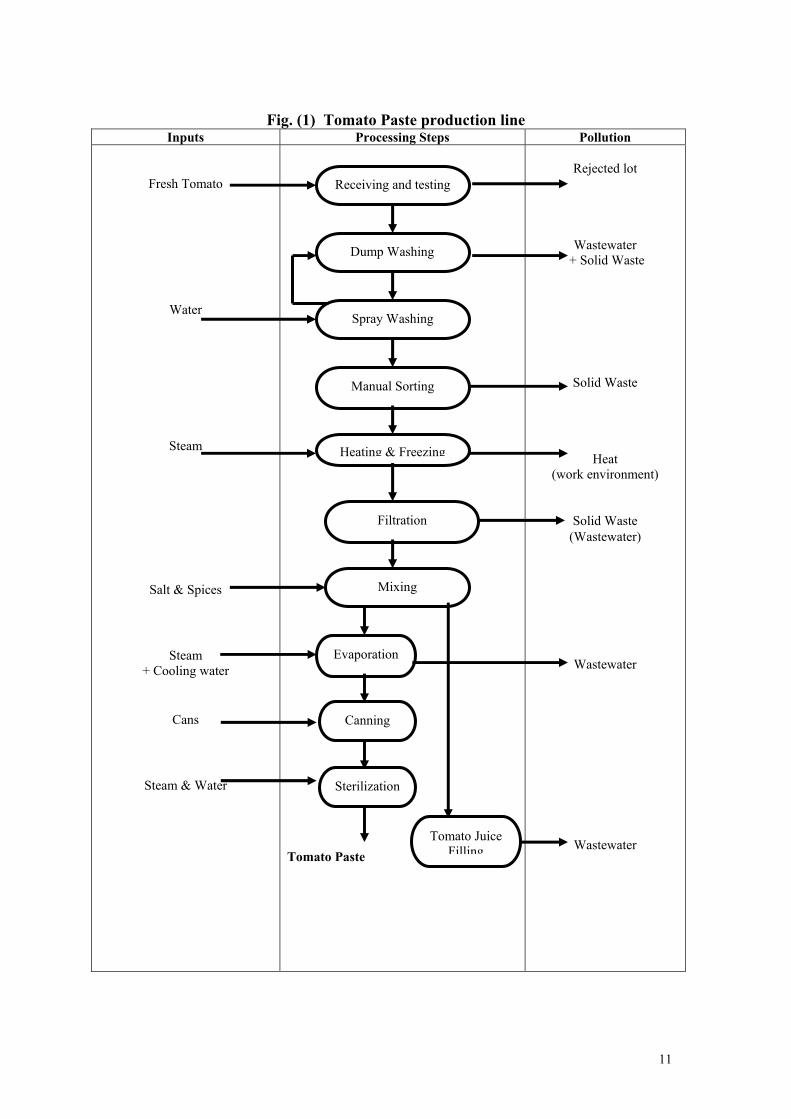
Fig. (1) Tomato Paste production line
Inputs Processing Steps Pollution
Fresh Tomato
Water
Steam
Salt & Spices
Steam + Cooling water
Cans
Steam & Water
Tomato Paste
Rejected lot
Wastewater + Solid Waste
Solid Waste
Heat (work environment)
Solid Waste (Wastewater)
Wastewater
Wastewater Tomato Juice
Filling
Sterilization
Canning
Evaporation
Mixing
Filtration
Heating & Freezing
Manual Sorting
Spray Washing
Dump Washing
Receiving and testing
11
2.2.2 Frozen vegetables production line Figure (2) presents the main operations in the production line, the inputs to the units and the pollution sources. The main processes are:
Receiving and washing
Fresh vegetables are weighed and manually sorted. They are then dumped in a water basin using re-circulated water and then washed by a water spray while transported on a belt conveyor. The wash-water from spraying operation is used as make up to the basin, which is continuously purged. The wastewater from this operation is high in suspended solids, BOD and floating material such as hay.
Preparation The vegetables are peeled, trimmed and cut depending on the type of vegetable. This step generates a large amount of solid waste. Another washing step is performed, by dumping the prepared vegetables in water.
Cooking and freezing
The prepared vegetables are partially cooked in a jacketed vessel where steam is introduced in the jacket to provide heat. Some facilities use live steam injected directly in the vessel. The half-cooked vegetables are strained. Cold water (5-6º C) is passed over the half cooked vegetables and then introduced on a belt conveyor into a tunnel freezer where quench cooling occurs at a temperature less than –20ºC. This process takes 20 minutes and preserves the vegetables. Only the outer surface of the vegetables freezes without affecting its properties. Boiled molokhya leaves are minced and packed prior freezing. Heat and humidity could impact work environment if steam leaks occur.
Packaging and storing
Frozen vegetables are packed manually in pouches and stored in freezers. Cooling water is used for the compressors of the freezers. Freon (commercial name for CFCs) and ammonia are usually used as a refrigerant.
Note : The sources of pollution are: • Waste water from the washing and cooking steps. • Solid waste from vegetable preparation. • Spent cooling water. • Humidity, if steam leaks occur, and noise at the compressors.
12
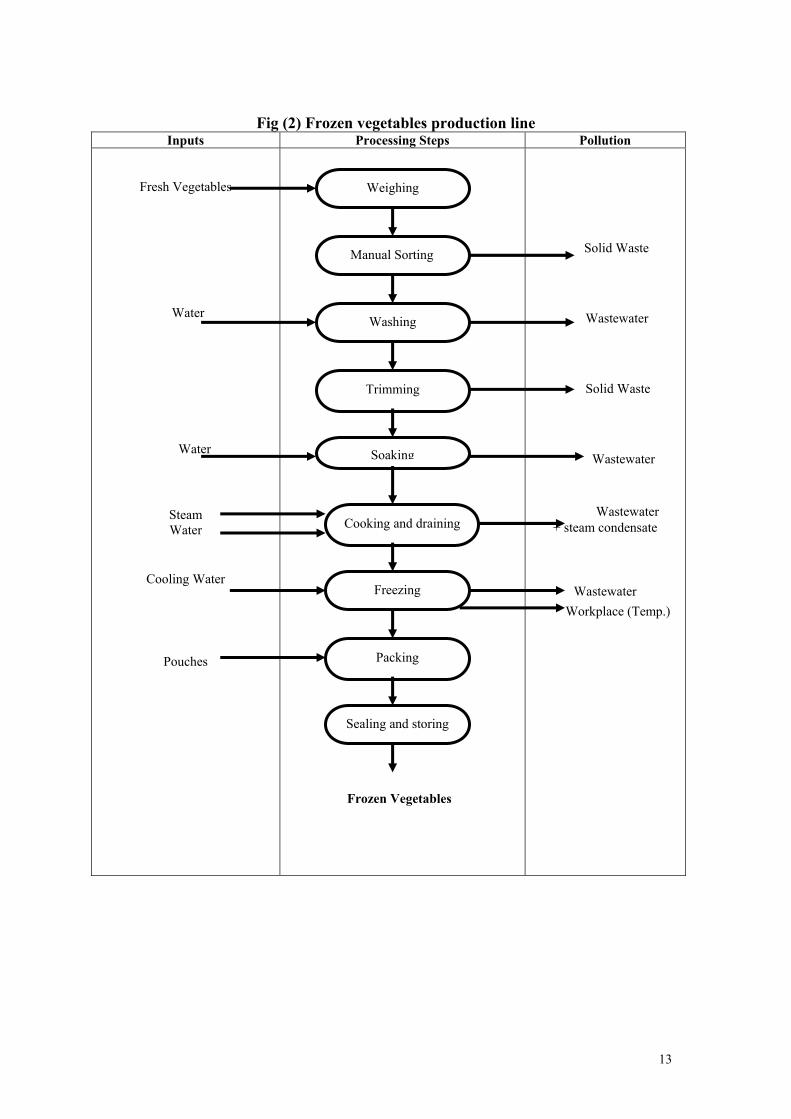
Fig (2) Frozen vegetables production line
Inputs Processing Steps Pollution
Fresh Vegetables Water Water
Steam Water
Cooling Water
Pouches
Frozen Vegetables
Solid Waste Wastewater Solid Waste Wastewater Wastewater
+ steam condensate
Wastewater
Workplace (Temp.)
Sealing and storing
Packing
Freezing
Cooking and draining
Soaking
Trimming
Washing
Manual Sorting
Weighing
13
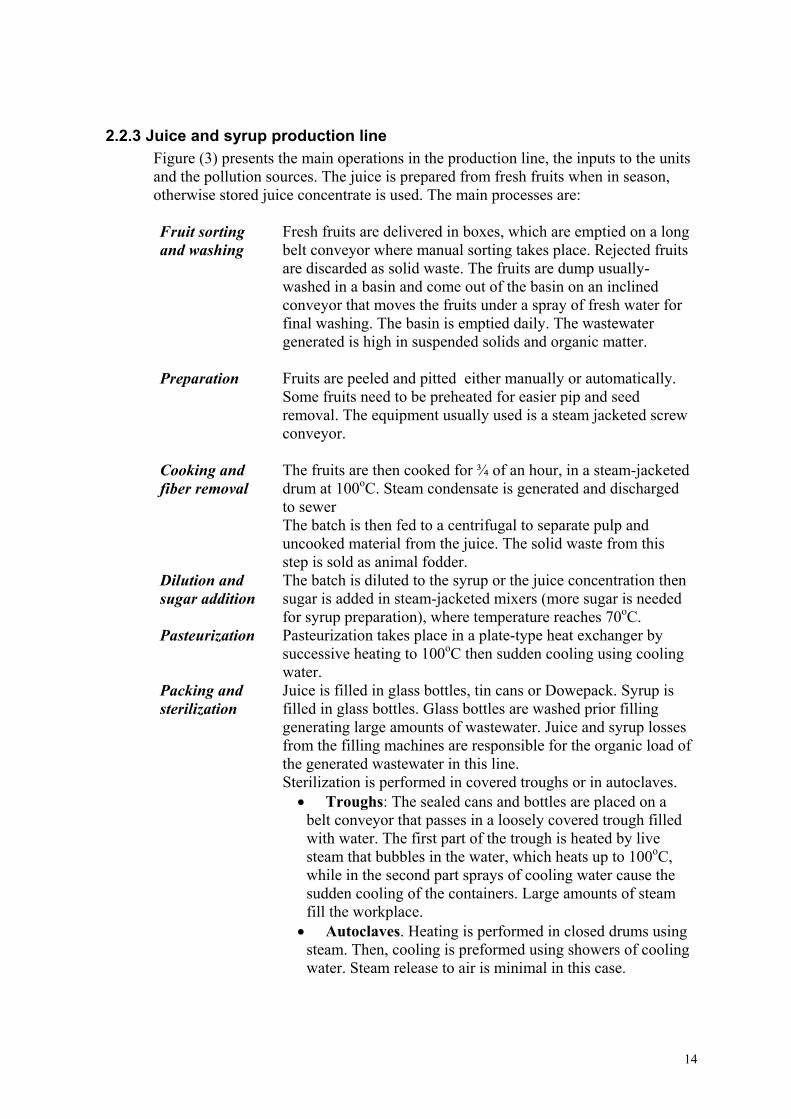
2.2.3 Juice and syrup production line Figure (3) presents the main operations in the production line, the inputs to the units and the pollution sources. The juice is prepared from fresh fruits when in season, otherwise stored juice concentrate is used. The main processes are:
Fruit sorting and washing
Fresh fruits are delivered in boxes, which are emptied on a long belt conveyor where manual sorting takes place. Rejected fruits are discarded as solid waste. The fruits are dump usually-washed in a basin and come out of the basin on an inclined conveyor that moves the fruits under a spray of fresh water for final washing. The basin is emptied daily. The wastewater generated is high in suspended solids and organic matter.
Preparation Fruits are peeled and pitted either manually or automatically. Some fruits need to be preheated for easier pip and seed removal. The equipment usually used is a steam jacketed screw conveyor.
Cooking and fiber removal
The fruits are then cooked for ¾ of an hour, in a steam-jacketed drum at 100oC. Steam condensate is generated and discharged to sewer The batch is then fed to a centrifugal to separate pulp and uncooked material from the juice. The solid waste from this step is sold as animal fodder.
Dilution and sugar addition
The batch is diluted to the syrup or the juice concentration then sugar is added in steam-jacketed mixers (more sugar is needed for syrup preparation), where temperature reaches 70oC.
Pasteurization Pasteurization takes place in a plate-type heat exchanger by successive heating to 100oC then sudden cooling using cooling water.
Packing and sterilization
Juice is filled in glass bottles, tin cans or Dowepack. Syrup is filled in glass bottles. Glass bottles are washed prior filling generating large amounts of wastewater. Juice and syrup losses from the filling machines are responsible for the organic load of the generated wastewater in this line. Sterilization is performed in covered troughs or in autoclaves. • Troughs: The sealed cans and bottles are placed on a
belt conveyor that passes in a loosely covered trough filled with water. The first part of the trough is heated by live steam that bubbles in the water, which heats up to 100oC, while in the second part sprays of cooling water cause the sudden cooling of the containers. Large amounts of steam fill the workplace. • Autoclaves. Heating is performed in closed drums using
steam. Then, cooling is preformed using showers of cooling water. Steam release to air is minimal in this case.
14
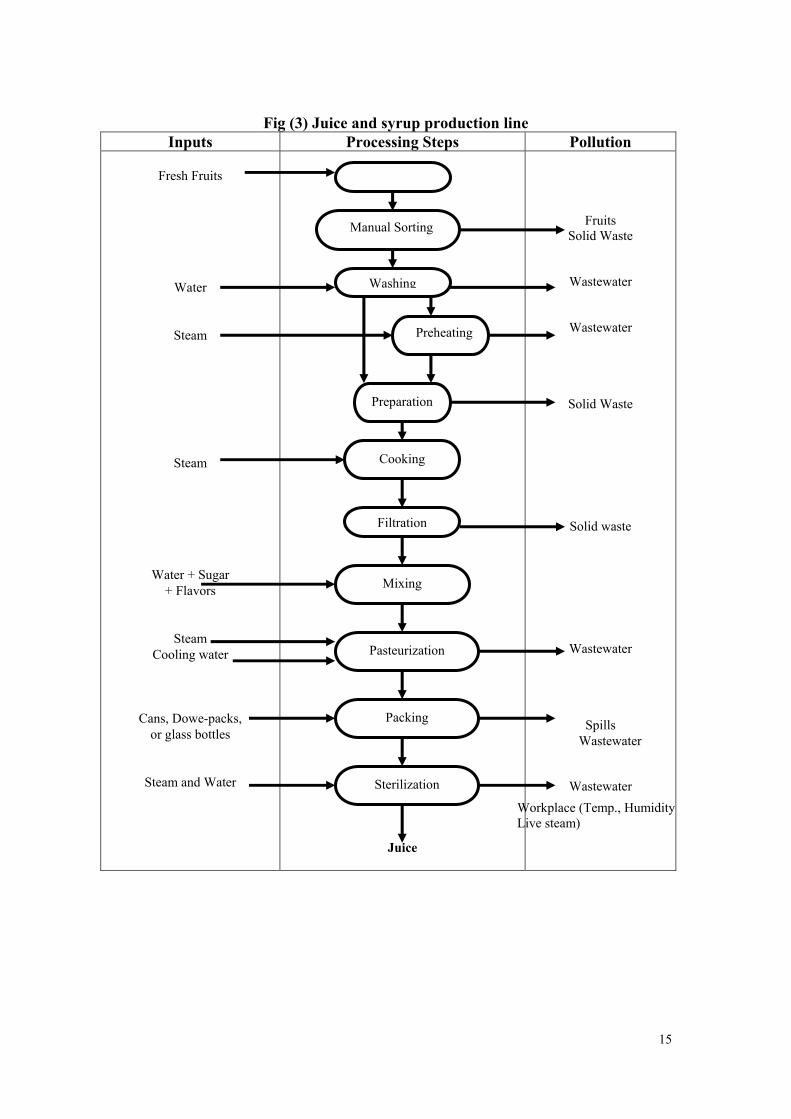
Fig (3) Juice and syrup production line
Inputs Processing Steps Pollution
Fresh Fruits
Water
Steam
Steam
Water + Sugar + Flavors
Steam Cooling water
Cans, Dowe-packs, or glass bottles
Steam and Water
Juice
Fruits Solid Waste
Wastewater
Wastewater
Solid Waste
Solid waste
Wastewater
Spills
Wastewater
Receiving
Workplace (Temp., HumidityLive steam)
Wastewater
Sterilization
Packing
Pasteurization
Mixing
Filtration
Cooking
Preparation
Preheating
Washing
Manual Sorting
15
2.2.4 Jam production line Figure (4) presents the main processes in the production line, the inputs to the units and the pollution sources. Jam production goes through the same steps as juice production but instead of water addition, water vaporization takes place.
Juice preparation The steps for sorting, washing, pitting, peeling, preheating if
necessary and juice extraction, are performed in the same way as for juice production. The amount of sugar added depends on the type of fruit. Citric acid is added as a preservative.
Juice concentration
A multistage evaporator operating under vacuum is used. Vacuum is performed by jet ejectors, which use cooling water to produce the vacuum effect. The pressure in the evaporator reaches 0.2 bars and the temperature 65oC. The lower the pressure the lower the cooking temperature. The concentration system increases the solids concentration in the jam to 65%. Concentration is usually measured using an optical device. A sample is spread on a piece of glass and the device is calibrated to give the reading for the solids concentration.
Pasteurization and packing
Jam is pasteurized by heating to 90oC for half an hour then suddenly cooling. Both operations are usually performed in the same equipment used for evaporation by passing steam in the jacket at first, then passing cold water. Jam is then packed in glass containers or tin cans the sterilized by the same procedure explained in the previous section.
Note: • The evaporation temperature is an important parameter for quality control.
16
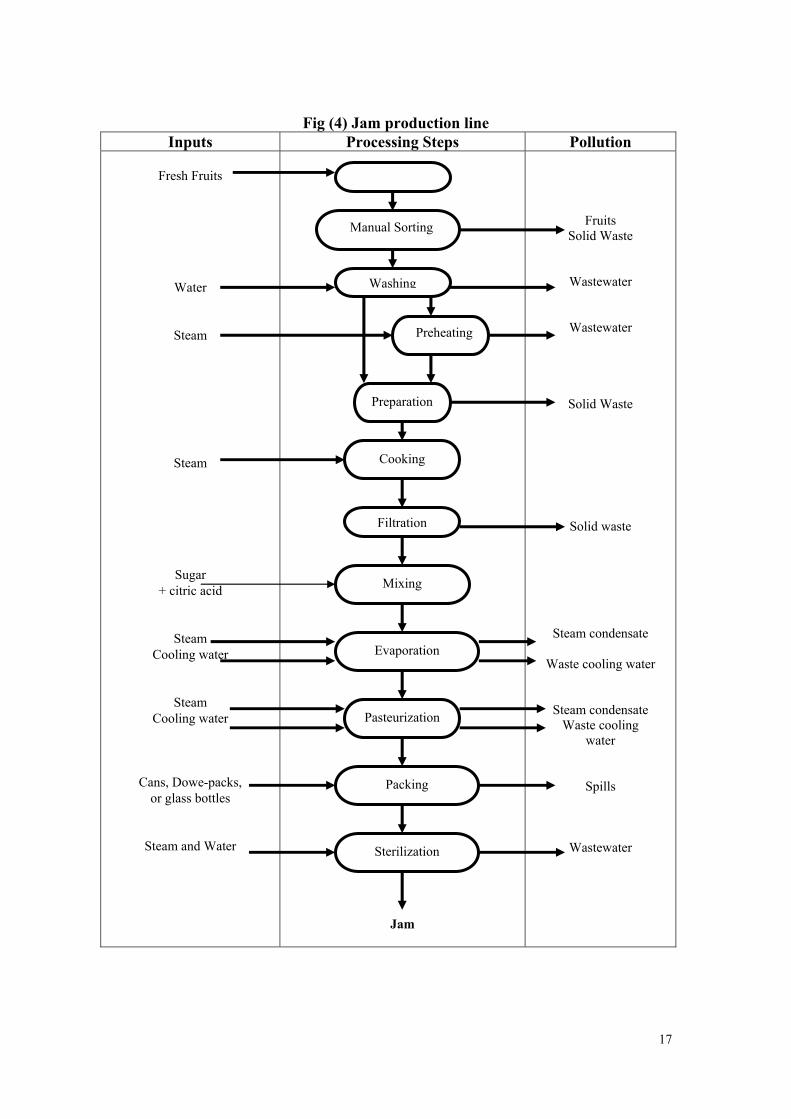
Fig (4) Jam production line
Inputs Processing Steps Pollution
Fresh Fruits
Water
Steam
Steam
Sugar + citric acid
Steam Cooling water
Steam Cooling water
Cans, Dowe-packs, or glass bottles
Steam and Water
Jam
Fruits Solid Waste
Wastewater
Wastewater
Solid Waste
Solid waste
Steam condensate
Waste cooling water
Steam condensate Waste cooling
water
Spills
Wastewater
Receiving
Pasteurization
Sterilization
Packing
Evaporation
Mixing
Filtration
Cooking
Preparation
Preheating
Washing
Manual Sorting
17
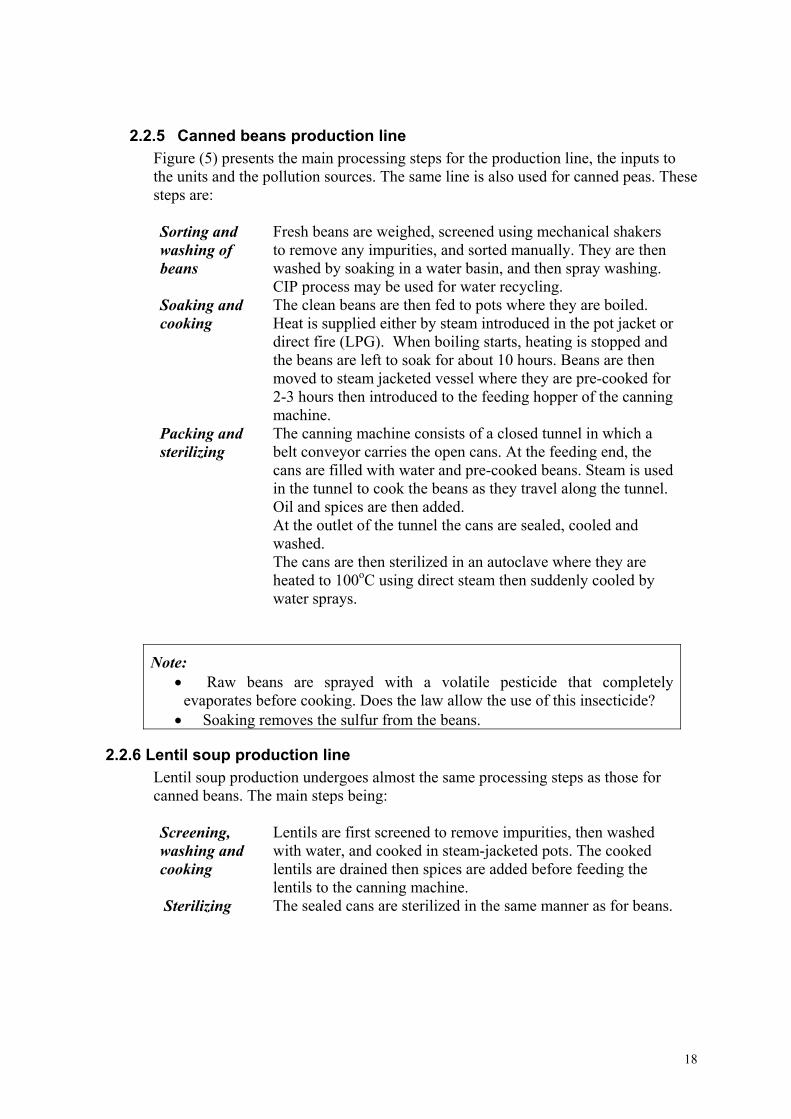
2.2.5 Canned beans production line Figure (5) presents the main processing steps for the production line, the inputs to the units and the pollution sources. The same line is also used for canned peas. These steps are:
Sorting and washing of beans
Fresh beans are weighed, screened using mechanical shakers to remove any impurities, and sorted manually. They are then washed by soaking in a water basin, and then spray washing. CIP process may be used for water recycling.
Soaking and cooking
The clean beans are then fed to pots where they are boiled. Heat is supplied either by steam introduced in the pot jacket or direct fire (LPG). When boiling starts, heating is stopped and the beans are left to soak for about 10 hours. Beans are then moved to steam jacketed vessel where they are pre-cooked for 2-3 hours then introduced to the feeding hopper of the canning machine.
Packing and sterilizing
The canning machine consists of a closed tunnel in which a belt conveyor carries the open cans. At the feeding end, the cans are filled with water and pre-cooked beans. Steam is used in the tunnel to cook the beans as they travel along the tunnel. Oil and spices are then added. At the outlet of the tunnel the cans are sealed, cooled and washed. The cans are then sterilized in an autoclave where they are heated to 100oC using direct steam then suddenly cooled by water sprays.
Note: • Raw beans are sprayed with a volatile pesticide that completely
evaporates before cooking. Does the law allow the use of this insecticide? • Soaking removes the sulfur from the beans.
2.2.6 Lentil soup production line Lentil soup production undergoes almost the same processing steps as those for canned beans. The main steps being:
Screening, washing and cooking
Lentils are first screened to remove impurities, then washed with water, and cooked in steam-jacketed pots. The cooked lentils are drained then spices are added before feeding the lentils to the canning machine.
Sterilizing The sealed cans are sterilized in the same manner as for beans.
18
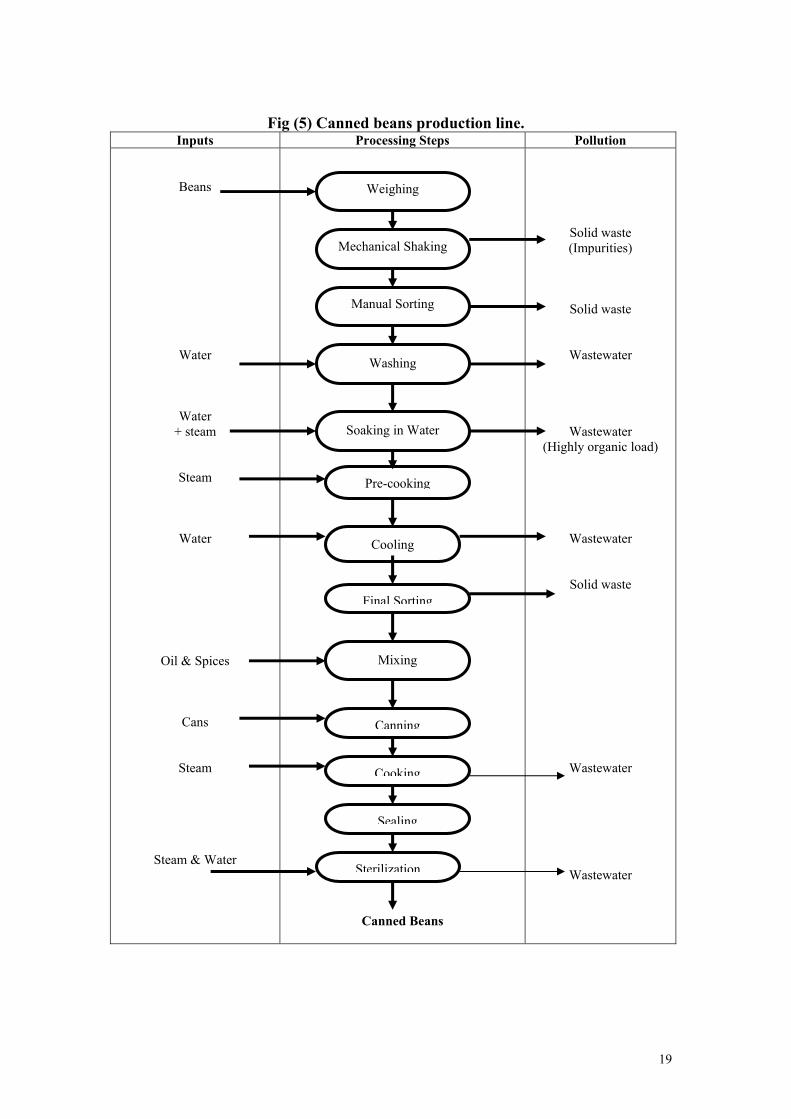
Fig (5) Canned beans production line.
Inputs Processing Steps Pollution
Beans
Water
Water + steam
Steam
Water
Oil & Spices
Cans
Steam
Steam & Water
Canned Beans
Solid waste (Impurities)
Solid waste
Wastewater
Wastewater (Highly organic load)
Wastewater
Solid waste
Wastewater
Wastewater
Sterilization
Sealing
Cooking
Canning
Mixing
Final Sorting
Cooling
Pre-cooking
Soaking in Water
Washing
Manual Sorting
Mechanical Shaking
Weighing
19
2.3. Service units: description and potential pollution sources
Medium and large size plants will have some/all of the following service and auxiliary units. These units can be pollution sources and therefore should be inspected and monitored. Figure (6) shows the various units with their corresponding raw materials and potential pollution sources.
2.3.1. Boilers
Boilers are used to produce steam for:
• heat supply to the processes
• electric power generation
Conventional steam-producing thermal power plants generate electricity through a series of energy conversion stages. Fuel is burned in boilers to convert water to high-pressure steam, which is then used to drive the turbine to generate electricity.
The gaseous emissions generated by boilers are typical of those from combustion processes. The exhaust gases from burning fuel oil (Mazot) or gas oil (solar) contain primarily particulates (including heavy metals if they are present in significant concentrations in the fuel), sulfur and nitrogen oxides (SOx and NOx) and volatile organic compounds (VOCs). The concentration of these pollutants in the exhaust gases is a function of firing configuration (nozzle design, chimney height), operating practices and fuel composition. Gas-fired boilers generally produce negligible quantities of particulates and pollutants.
Wastewater is generated as blowdown purged from boilers to keep the concentration of dissolved salts at a level that prevents salt precipitation and consequently scale formation. The blowdown will be high in TDS.
Due to bad insulation of boiler body and steam lines, high temperature in the workplace can be observed. In the case of power plants, water is used for cooling the turbines and is also generated as steam condensate. The amount of wastewater generated depends on whether cooling is performed in open or closed cycle and on the recycling of steam condensate. Contamination may arise from lubricating and fuel oil.
2.3.2. Water Treatment Units
There are different types of water used in industry. Depending on the application and the water source, different treatment processes are applied.
a) Water Softening for medium hardness water: Calcium and magnesium ions are removed from hard water by cation exchange for sodium ions. When the exchange resin has removed the ions to the limits of its capacity, it is regenerated to the sodium form with a salt solution (sodium chloride) in the pH range of 6-8. This is performed by taking the softener out of service, backwashing with the salt solution, rinsing to eliminate excess salt, then returning it to service. The treated water has a hardness level of less than 1 ppm expressed as calcium carbonate.
20
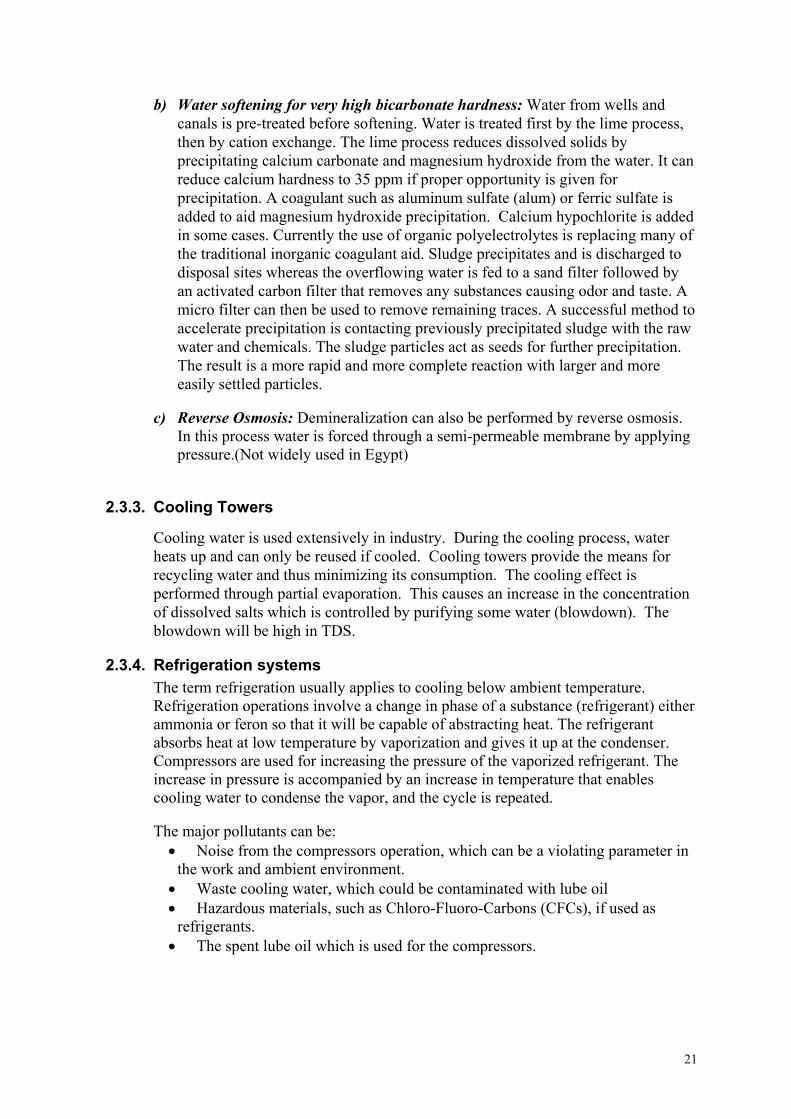
b) Water softening for very high bicarbonate hardness: Water from wells and canals is pre-treated before softening. Water is treated first by the lime process, then by cation exchange. The lime process reduces dissolved solids by precipitating calcium carbonate and magnesium hydroxide from the water. It can reduce calcium hardness to 35 ppm if proper opportunity is given for precipitation. A coagulant such as aluminum sulfate (alum) or ferric sulfate is added to aid magnesium hydroxide precipitation. Calcium hypochlorite is added in some cases. Currently the use of organic polyelectrolytes is replacing many of the traditional inorganic coagulant aid. Sludge precipitates and is discharged to disposal sites whereas the overflowing water is fed to a sand filter followed by an activated carbon filter that removes any substances causing odor and taste. A micro filter can then be used to remove remaining traces. A successful method to accelerate precipitation is contacting previously precipitated sludge with the raw water and chemicals. The sludge particles act as seeds for further precipitation. The result is a more rapid and more complete reaction with larger and more easily settled particles.
c) Reverse Osmosis: Demineralization can also be performed by reverse osmosis.
In this process water is forced through a semi-permeable membrane by applying pressure.(Not widely used in Egypt)
2.3.3. Cooling Towers
Cooling water is used extensively in industry. During the cooling process, water heats up and can only be reused if cooled. Cooling towers provide the means for recycling water and thus minimizing its consumption. The cooling effect is performed through partial evaporation. This causes an increase in the concentration of dissolved salts which is controlled by purifying some water (blowdown). The blowdown will be high in TDS.
2.3.4. Refrigeration systems The term refrigeration usually applies to cooling below ambient temperature. Refrigeration operations involve a change in phase of a substance (refrigerant) either ammonia or feron so that it will be capable of abstracting heat. The refrigerant absorbs heat at low temperature by vaporization and gives it up at the condenser. Compressors are used for increasing the pressure of the vaporized refrigerant. The increase in pressure is accompanied by an increase in temperature that enables cooling water to condense the vapor, and the cycle is repeated.
The major pollutants can be: • Noise from the compressors operation, which can be a violating parameter in
the work and ambient environment. • Waste cooling water, which could be contaminated with lube oil • Hazardous materials, such as Chloro-Fluoro-Carbons (CFCs), if used as
refrigerants. • The spent lube oil which is used for the compressors.
21
2.3.5. Clean in Place The Clean in Place (CIP) system consists mainly of a wash tank and recycling pumps. Its main purpose is to minimize wash water consumption by recycling part of the spent wash water. Detergents, acids and/ or alkalis are added to the wash water when equipment washing is performed. In this case, the use of CIP will also minimize the consumption of these additives. For washing fruits and vegetables no addtitives are used. After using the spent wash water for a number of cycles, it is discharged to the factory sewer system causing a shock load of pollutants. The nature of the pollutants depends on the material or equipment being washed and the additives used. The most important parameters are O & G, BOD, COD, TSS.
2.3.6. Tin Cans Manufacturing
Some food plants have their own tin can production where tin sheets are fed to a cutting and forming machine operating in a continuous mode. The sheets are first lacquered and left to dry . The sheets are then moved to the printing line that uses inks and solvents to print labels. The produced cans are dried in furnaces then sterilized before filling.
Environmental violations could be due to:
• Noise generated by machine operation
• Solid waste resulting from damaged cans and scrap tin.
• Floor washing wastewater contaminated with Oil and Grease from lube oil, paints and solvents(usually only dry cleaning is performed with no wastewater)
• Air emissions (VOC’s) in workplace
• Heat generated from paint dryer.
2.3.7. Laboratories
Laboratories have an important role in the food industry, as they are responsible for:
• Testing raw materials, chemicals, water, wastewater, packaging material, etc.
• Quality control of the different products and comparing the findings with the standard specifications for raw materials and final products
• The measured parameters are physical properties, chemical composition, and bacteriological counts.
Chemicals used for testing could be hazardous. Proper handling and storage are required for compliance with environmental law.
Note: If the industrial and domestic discharge lines are segregated the wastewater from the lab must be discharged to the industrial line
22
2.3.8. Workshops and Garage
Large facilities have electrical and mechanical workshops for maintenance and repair purposes. Environmental violations could be due to:
• Noise
• Rinse water contaminated with lube oil
• Spent lube oil
Pollution in the garage area will depend upon the services offered. The presence of a gasoline or diesel station implies fuel storage in underground or over the ground tanks that require leak and spill control plans.
Replacing lube oil implies discharge of spent oil to the sewer lines or selling it to recycling stations.
2.3.9. Storage Facilities
The specifications for the storage facilities depend on the stored material.
• Fresh fruits and vegetables are delivered daily and are stored in shaded areas for not more than 8 hours.
• Canned or bottled products are packed in carton boxes and stored in product storing buildings.
• Frozen vegetables are packaged either in plastic bags and stored at about (-18oC) in freezers.
• Some of the chemicals used in the lab . could be hazardous and require special handling, storage and management procedures as required by law.
• Fuel is used for the boilers and for the cars and delivery trucks. It is stored in underground or over ground tanks. The types of fuel usually used are fuel oil (Mazot), gas oil (solar), natural gas and gasoline. Fuel storage requires safety measures and spill prevention plans.
2.3.10. Wastewater Treatment Plants
Although a WWTP is a pollution abatement measure, it has to be inspected and monitored for potential pollution. Pollution may be due to malfunctioning or improper management . Fruit and vegetable processing discharges mainly wastewater, high in organic load. From time to time peak load will be discharged. They may be due to internal processes, to seasonal fluctuations, to lack of control or a “force majeur” situation such as power collapse.
The potential pollution sources are:
• Fruit & vegetable reject and filterate solid waste which can be processed and reused as animal fodder .
• Treated water which represents a water pollution problem if not complying with relevant environmental laws.
2.3.11. Restaurants, Washrooms and Housing Complex
These facilities will generate domestic wastewater as well as domestic solid waste.
23
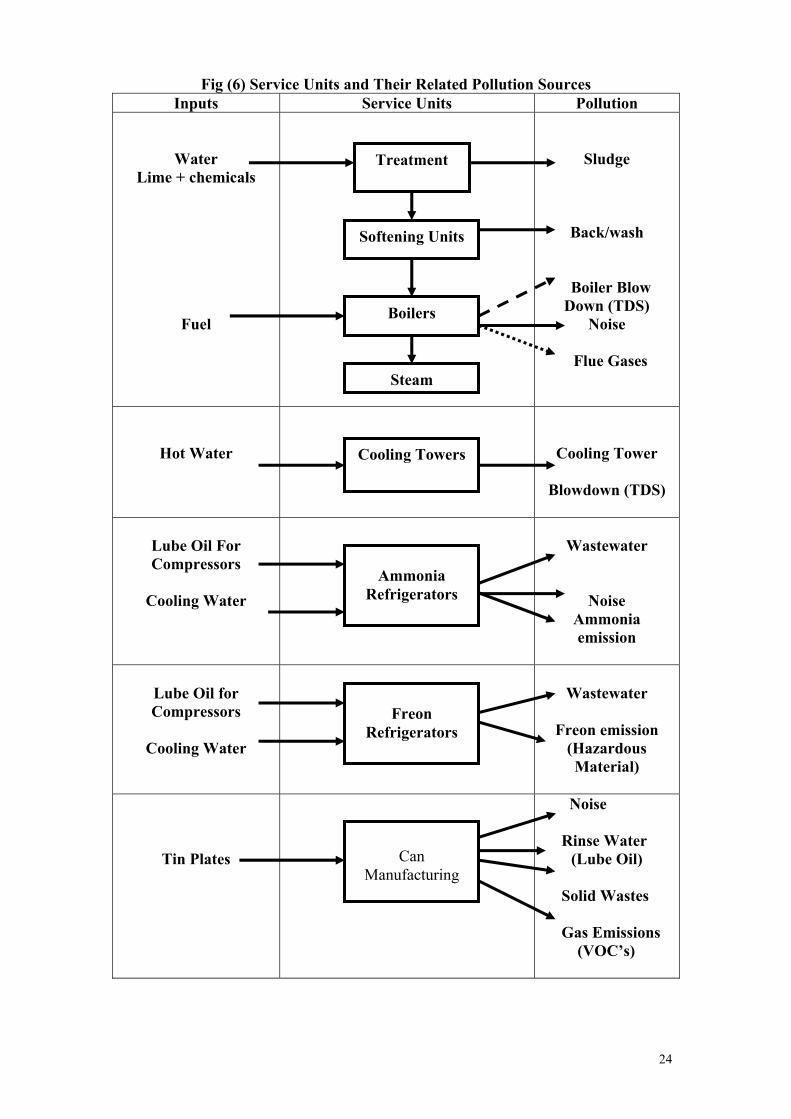
Fig (6) Service Units and Their Related Pollution Sources Inputs Service Units Pollution
Water Lime + chemicals
Fuel
Sludge
Back/wash
Boiler Blow Down (TDS)
Noise
Flue Gases
Hot Water
Cooling Tower
Blowdown (TDS)
Lube Oil For Compressors
Cooling Water
Wastewater
Noise Ammonia emission
Lube Oil for Compressors
Cooling Water
Wastewater
Freon emission
(Hazardous Material)
Tin Plates
Noise
Rinse Water (Lube Oil)
Solid Wastes Gas Emissions (VOC’s)
Treatment
Softening Units
Boilers
Steam
Cooling Towers
Ammonia
Refrigerators
Freon
Refrigerators
Can
Manufacturing
24
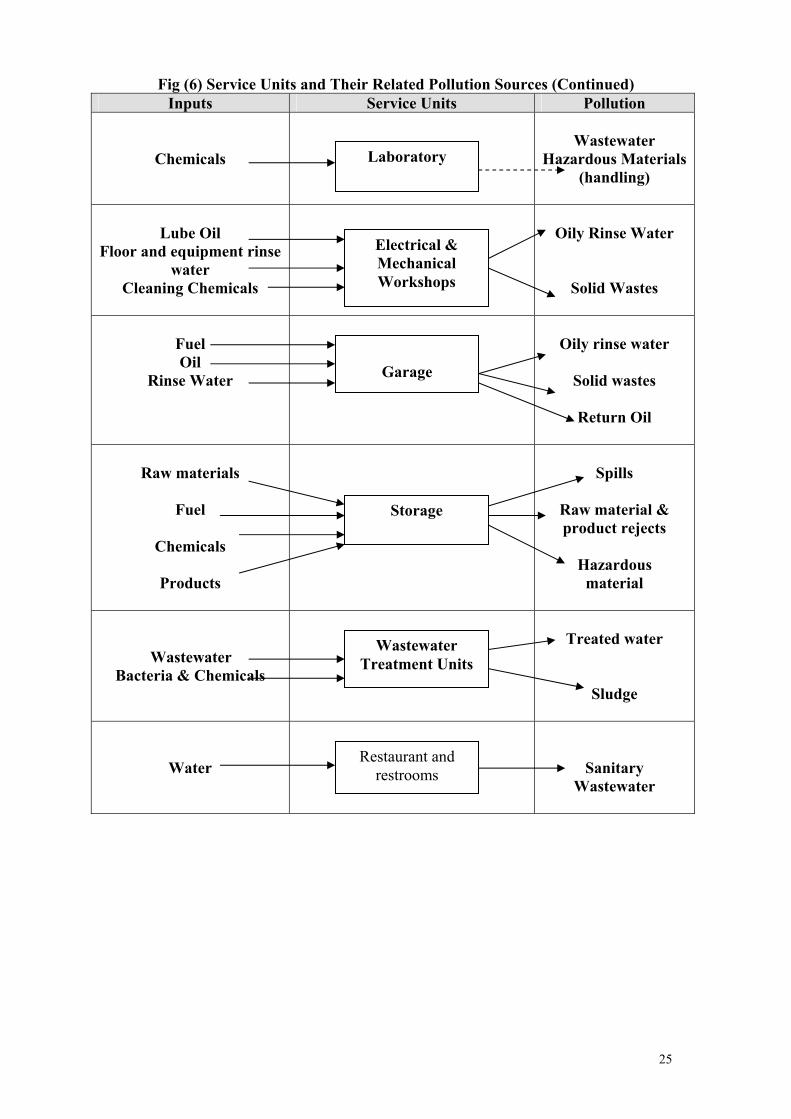
Fig (6) Service Units and Their Related Pollution Sources (Continued) Inputs Service Units Pollution
Chemicals
Wastewater
Hazardous Materials (handling)
Lube Oil Floor and equipment rinse
water Cleaning Chemicals
Oily Rinse Water
Solid Wastes
Fuel Oil
Rinse Water
Oily rinse water
Solid wastes
Return Oil
Raw materials
Fuel
Chemicals
Products
Spills
Raw material & product rejects
Hazardous
material
Wastewater Bacteria & Chemicals
Treated water
Sludge
Water
Sanitary Wastewater
Laboratory
Electrical & Mechanical Workshops
Garage
Storage
Wastewater Treatment Units
Restaurant and restrooms
25
2.4. Emissions, effluents and solid wastes
Table (3) summarizes the major polluting processes, their outputs and the violating parameters.
2.4.1. Air emissions
The sources of air emission in the fruit and vegetable industry are:
• Exhaust gases resulting from fuel consumption used to generate steam from boilers and generators . The violating parameters would be: particulate matters (PM10), sulfur oxides, nitrogen oxides and carbon monoxide.
• Freon (trade-name CFCs) resulting from leaks in refrigeration tubes and is considered an ozone depleting substance.
• Steam leaking from heating tubes or used as live steam has a negative impact on air quality of workplace with respect to heat and humidity.
• Odor problems can occur with poor management of solid wastes and effluents.
2.4.2. Effluents
The fruit and vegetable processing industry typically generates large volumes of effluents that contain high organic loads, cleansing and blanching agents, salt and suspended particles such as fibers and soil particles. They may also contain pesticide residues washed from the raw materials. The various sources of pollution are:
Fruit and vegetable wash-water, which is expected to be high in suspended and dissolved solids.
Juice, tomato paste and jam filling machines, which are responsible for spills that raise the BOD level in the wastewater.
Cooling water associated with the jet ejectors that generate vacuum in the evaporators. The wastewater will be contaminated with organic matter.
Blowdowns from the cooling tower and boilers as well as backwash of softeners are high in TDS and TSS.
Spent lube oil from garage and workshops if discharged to sewer will give oily wastewater (O&G).
Floor and equipment washing and sanitation produces a wastewater containing organic matter, oil and grease, and traces of the chemicals used for neutralization and sanitation.
Typical effluent characteristics of the Egyptian fruit and vegetable industry are shown in table (4). Typical pollution loads per ton of production are given in table (5). It is clear that the main impact will be due to high organic loads. The effluent is violating Egyptian environmental laws as shown in section 4.2.
26
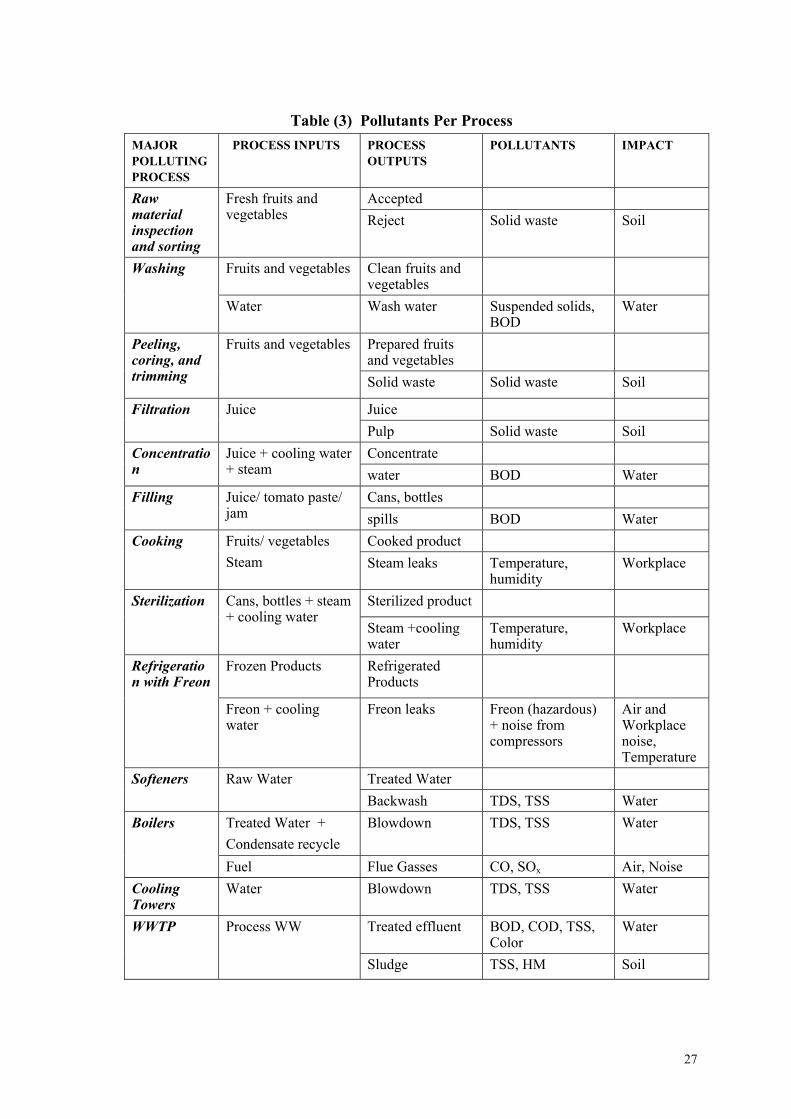
Table (3) Pollutants Per Process MAJOR POLLUTING PROCESS
PROCESS INPUTS PROCESS OUTPUTS
POLLUTANTS IMPACT
Accepted Raw material inspection and sorting
Fresh fruits and vegetables Reject Solid waste Soil
Fruits and vegetables Clean fruits and vegetables
Washing
Water Wash water Suspended solids, BOD
Water
Prepared fruits and vegetables
Peeling, coring, and trimming
Fruits and vegetables
Solid waste Solid waste Soil
JuiceFiltration JuicePulp Solid waste SoilConcentrateConcentratio
nJuice + cooling water + steam water BOD Water
Cans, bottlesFilling Juice/ tomato paste/ jam spills BOD Water
Cooked productCooking Fruits/ vegetables Steam Steam leaks Temperature,
humidityWorkplace
Sterilized productSterilization Cans, bottles + steam + cooling water
Steam +cooling water
Temperature, humidity
Workplace
Frozen Products Refrigerated Products
Refrigeration with Freon
Freon + cooling water
Freon leaks Freon (hazardous) + noise from compressors
Air and Workplace noise, Temperature
Treated WaterSofteners Raw WaterBackwash TDS, TSS Water
Treated Water + Condensate recycle
Blowdown TDS, TSS WaterBoilers
Fuel Flue Gasses CO, SOx Air, NoiseCooling Towers
Water Blowdown TDS, TSS Water
Treated effluent BOD, COD, TSS, Color
WaterWWTP Process WW
Sludge TSS, HM Soil
27
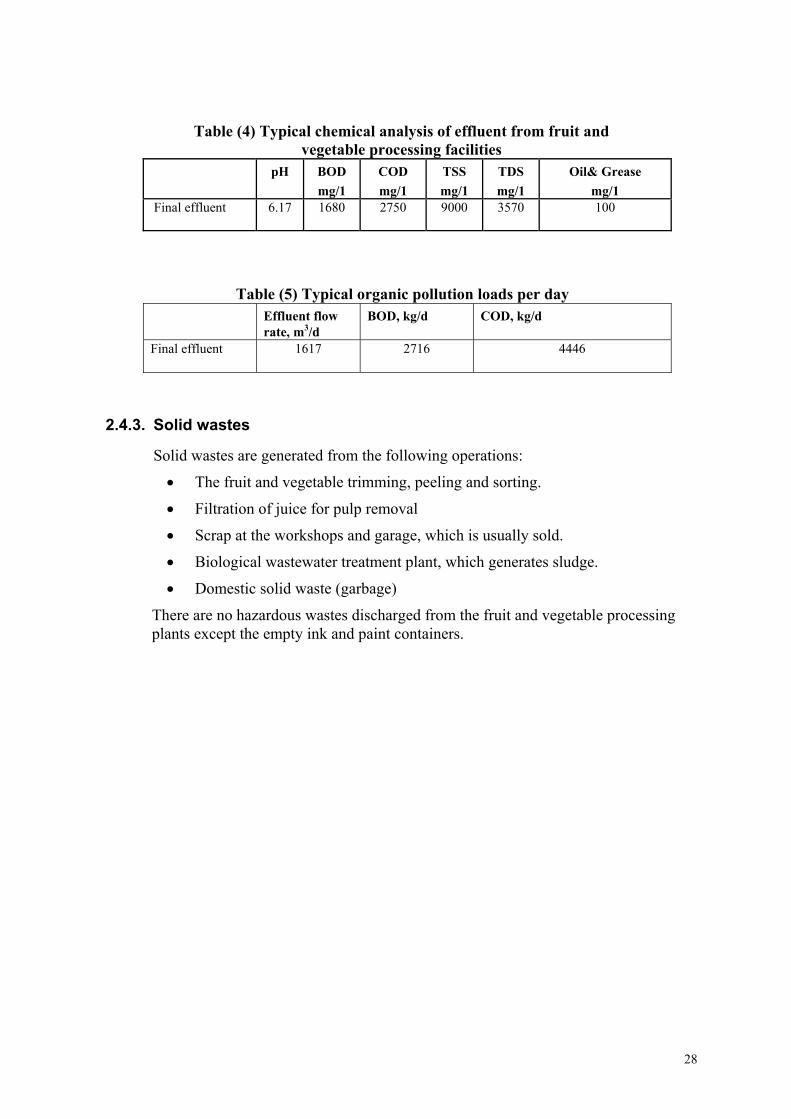
Table (4) Typical chemical analysis of effluent from fruit and
vegetable processing facilities pH
BOD mg/1
COD mg/1
TSS mg/1
TDS mg/1
Oil& Grease mg/1
Final effluent
6.17
1680
2750
9000
3570
100
Table (5) Typical organic pollution loads per day Effluent flow
rate, m3/d BOD, kg/d COD, kg/d
Final effluent 1617 2716 4446
2.4.3. Solid wastes
Solid wastes are generated from the following operations:
• The fruit and vegetable trimming, peeling and sorting.
• Filtration of juice for pulp removal
• Scrap at the workshops and garage, which is usually sold.
• Biological wastewater treatment plant, which generates sludge.
• Domestic solid waste (garbage)
There are no hazardous wastes discharged from the fruit and vegetable processing plants except the empty ink and paint containers.
28
2.5. Characteristics of the fruit and vegetable processing industry
Processing (canning, drying, freezing and preparation of juices, concentrates, syrups, and jams) increases the shelf-life of fruits and vegetables. There are some characteristics specific to the industry that should be taken into consideration when conducting inspection and/or self-monitoring of fruit and vegetable processing facilities.
• Due to the introduction of the market economy in Egypt and its implication on increased import and product diversity, most facilities operate upon market demand. Consequently the generated effluents have daily fluctuations in flow-rate as well as concentration of organic load.
• Production lines are operated on a semi-continuous basis with parts of the production lines operating in batches.
• Due to the special nature of food processes, washing and sanitation are performed at least once a day for both operating modes (batch or continuous).
• Pollution loads are expected to be higher during start-up and shutdown.
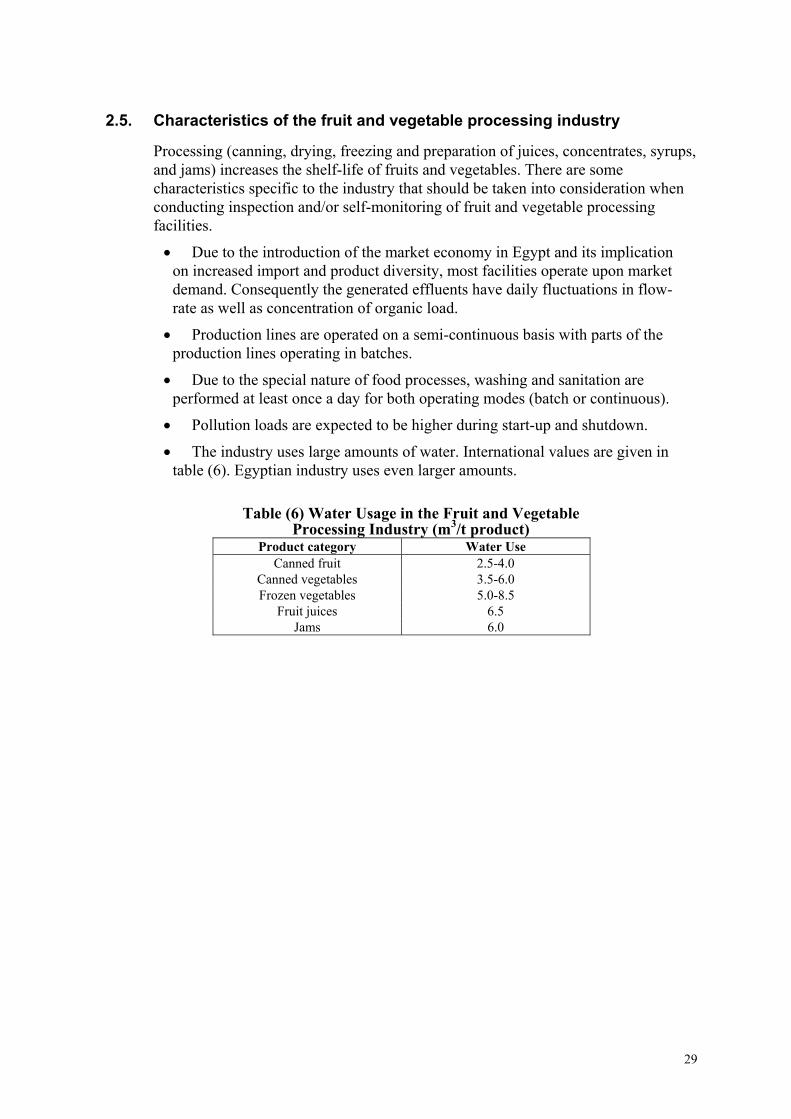
• The industry uses large amounts of water. International values are given in table (6). Egyptian industry uses even larger amounts.
Table (6) Water Usage in the Fruit and Vegetable
Processing Industry (m3/t product) Product category Water Use
Canned fruit 2.5-4.0 Canned vegetables 3.5-6.0 Frozen vegetables 5.0-8.5
Fruit juices 6.5 Jams 6.0
29
3. ENVIRONMENTAL AND HEALTH IMPACTS OF POLLUTANTS
3.1. Impact of air emissions
Particulate matters
Recent epidemiological evidence suggests that much of the health damage caused by exposure to particulates is associated with particulate matters smaller than 10µm (PM10). These particles penetrate most deeply into the lungs, causing a large spectrum of illnesses (e.g. asthma attack, cough, bronchitis). Emissions of particulates include ash, soot and carbon compounds, which are often the result of incomplete combustion. Acid condensate, sulphates and nitrates as well as lead, cadmium, and other metals can also be detected.
Sulfur Oxides
Air pollution by sulfur oxides is a major environmental problem. This compound is harmful to plant and animal life, as well as many building materials. Another problem of great concern is acid rain which is caused by the dissolution of sulfur oxides in atmospheric water droplets to form acidic solutions that can be very damaging when distributed in the form of rain. Acid rain is corrosive to metals, limestone, and other materials.
Nitrogen Oxides
Nitrogen oxides also dissolve in atmospheric water droplets to form acid rain.
Carbon dioxide
Combustion of fossil fuels to produce electricity and heat contribute to the green house effect caused by the formation of carbon dioxide. The greenhouse phenomenon occurs when heat radiation from earth is absorbed by the gases causing a surface temperature increase.
Freon Freon is a trade name for Chloro-Fluoro-Carbons (CFCs) which are considered to be Ozone Destroying Substances (ODSs). The Ozone Depleting Potential (ODP) for these substances reflects the ability to destroy the ozone layer (Table 7).
Ammonia Ammonia vapour is a sever irritant to eyes, causes vomiting, diarrhea, sweating and coughing. High concentration can cause respiratory arrest.
Water Vapor (Humidity)
Humidity in workplace is regulated by law 4/1994 due to its effect on the respiratory system especially for people suffering from asthma.
30
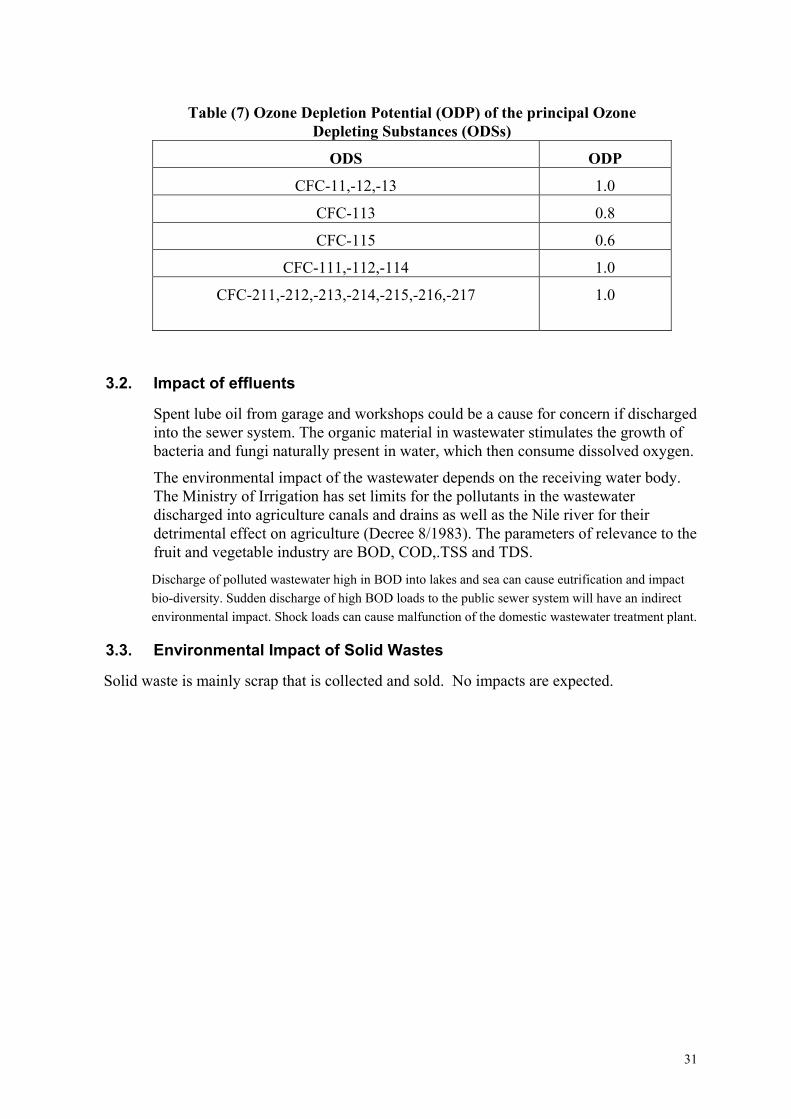
Table (7) Ozone Depletion Potential (ODP) of the principal Ozone Depleting Substances (ODSs)
ODS ODP
CFC-11,-12,-13 1.0
CFC-113 0.8
CFC-115 0.6
CFC-111,-112,-114 1.0
CFC-211,-212,-213,-214,-215,-216,-217 1.0
3.2. Impact of effluents
Spent lube oil from garage and workshops could be a cause for concern if discharged into the sewer system. The organic material in wastewater stimulates the growth of bacteria and fungi naturally present in water, which then consume dissolved oxygen.
The environmental impact of the wastewater depends on the receiving water body. The Ministry of Irrigation has set limits for the pollutants in the wastewater discharged into agriculture canals and drains as well as the Nile river for their detrimental effect on agriculture (Decree 8/1983). The parameters of relevance to the fruit and vegetable industry are BOD, COD,.TSS and TDS.
Discharge of polluted wastewater high in BOD into lakes and sea can cause eutrification and impact bio-diversity. Sudden discharge of high BOD loads to the public sewer system will have an indirect environmental impact. Shock loads can cause malfunction of the domestic wastewater treatment plant.
3.3. Environmental Impact of Solid Wastes
Solid waste is mainly scrap that is collected and sold. No impacts are expected.
31
4. EGYPTIAN LAWS AND REGULATIONS There are a number of laws and regulations that address the different environmental violations. The following are the laws applicable to the fruit and vegetable processing industry.
4.1. Concerning air emissions Article 40 of Law 4/1994, article 42 of the executive regulations and annex 6 deal with gaseous emissions from combustion of fuel. The statutes relevant to the fuel combustion are:
• The use of solar oil and other heavy oil products, as well crude oil shall be
prohibited in dwelling zones. • The sulfur percentage in fuel used in urban zones and near the dwelling zones
shall not exceed 1.5%. • The design of the burner and fire-house shall allow for complete mixing of fuel
with the required amount of air, and for the uniform temperature distribution that ensure complete combustion and minimize gas emissions caused by incomplete combustion.. • Gases containing carbon dioxide shall be emitted through chimneys rising
sufficiently high in order that these gases become lighter before reaching the ground surface, or using fuel that contains high proportions of sulfur in power generating stations, as well as in industry and other regions lying away from inhabited urban areas, providing that atmospheric factors and adequate distances to prevent these gases from reaching the dwelling and agricultural zones and regions, as well as the water courses shall be observed. • Chimneys from which a total emission of wastes reaches 7000 – 15000 kg/hr,
shall have heights ranging between 18 – 36 meters. • Chimneys from which a total emission of gaseous wastes reaches more than
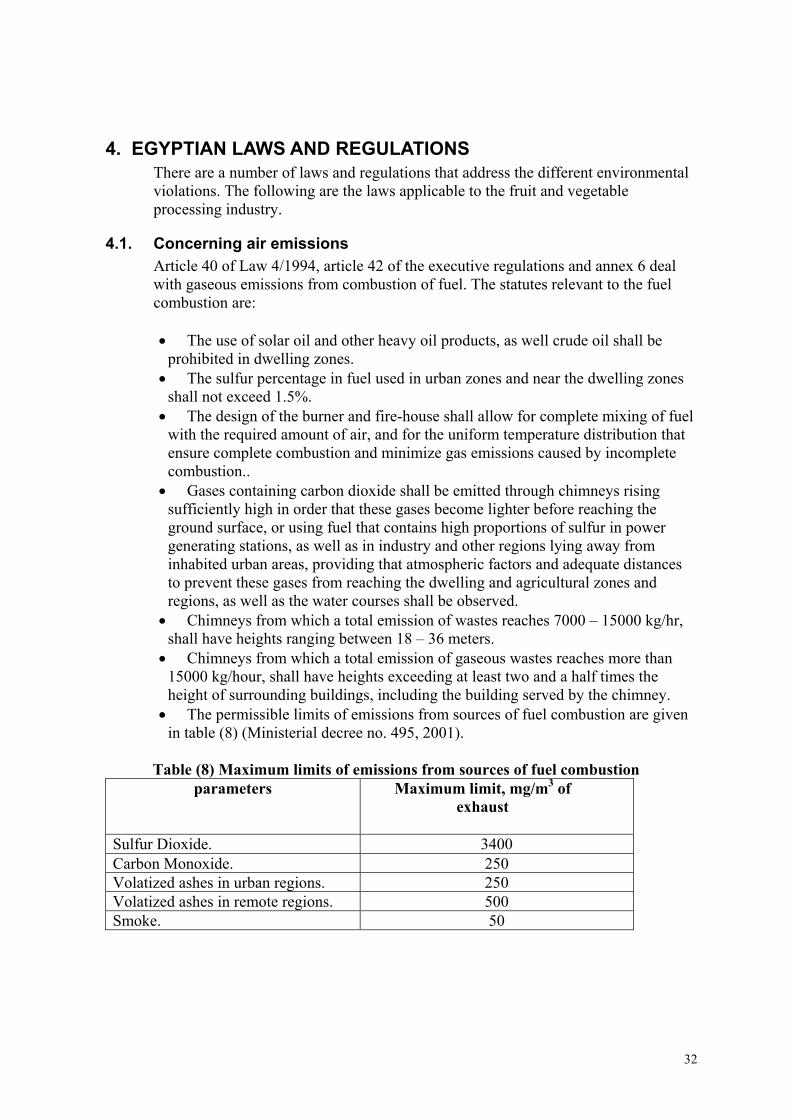
15000 kg/hour, shall have heights exceeding at least two and a half times the height of surrounding buildings, including the building served by the chimney. • The permissible limits of emissions from sources of fuel combustion are given
in table (8) (Ministerial decree no. 495, 2001). Table (8) Maximum limits of emissions from sources of fuel combustion
parameters Maximum limit, mg/m3 of exhaust
Sulfur Dioxide. 3400 Carbon Monoxide. 250 Volatized ashes in urban regions. 250 Volatized ashes in remote regions. 500 Smoke. 50
32
4.2. Concerning effluents Limits for pollutants in wastewater vary depending on the type of receiving water body. The parameters that should be monitored and/or inspected are BOD, COD, pH, temperature, residual chlorine, TSS, TDS, Oil and Grease. Table (9) presents the permissible limits for discharges to the different recipients (sea, Nile, canals, agricultural drains, public sewer) according to the different relevant laws. Spent lube oil has a negative impact on water and soil and therefore its disposal should be monitored/inspected. A record should be kept for this purpose.
4.3. Concerning solid waste A number of laws address solid waste management. The following laws apply to scrap and sludge from the WWTP: • Law 38/1967 which addresses public cleanliness, regulates the collection
and disposal of solid wastes from houses, public places, commercial and industrial establishments. • Ministry of Housing, Utilities and Urban Communities (MHUUC) decree
No. 134 of 1968, which provides guidelines from domestic and industrial sources, including specifications for collection, transportation, composting, incineration and land disposal. • Law 31/1976, which amended law 38/1967 • Law 43/1979, the Law of Local administration, which provided that city
councils are responsible for “physical and social infrastructure”, effectively delegating responsibility for infrastructure functions. • Law 4/1994, article 37 and article 38 of the executive regulations regulates
incineration of solid waste.
4.4. Concerning work environment
Violations of work environment could be encountered:
• In the boiler house: gas emissions, regulated by article 43 of Law 4/1994, article 45 of the executive regulations and annex 8.
• Wherever heating is performed: temperature and humidity are regulated by article 44 of Law 4/1994, article 46 of the executive regulations and annex 9.
• In refrigeration rooms: ammonia leaks are regulated by article 43 of Law 4/1994, article 45 of the executive regulations and annex 8.
• Near heavy machinery: noise is regulated by article 42 of Law 4/1994, article 44 of the executive regulations and table 1, annex 7.
• Ventilation is regulated by article 45 of Law 4/1994 and article 47 of the executive regulations.
• Smoking is regulated by article 46 of Law 4/1994 and article 48 of the executive regulations, and Law 52/1981.
• Work environment conditions are addressed in Law 137/1981 for Labor, Minister of Housing Decree 380/1983, Minister of Industry Decree 380/1982
33
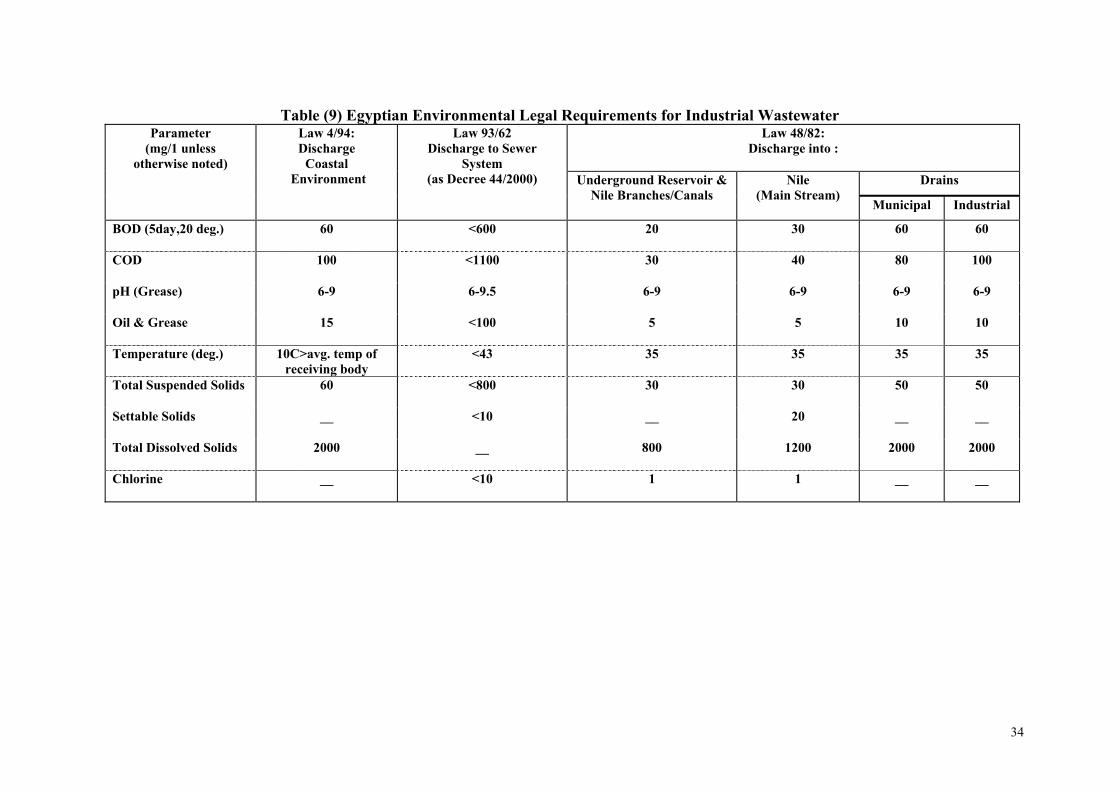
Table (9) Egyptian Environmental Legal Requirements for Industrial Wastewater Law 48/82:
Discharge into :
Drains
Parameter (mg/1 unless
otherwise noted)
Law 4/94: Discharge
Coastal Environment
Law 93/62 Discharge to Sewer
System (as Decree 44/2000) Underground Reservoir &
Nile Branches/Canals
Nile (Main Stream)
Municipal Industrial
BOD (5day,20 deg.)
60 <600 20 30 60 60
COD
100 <1100 30 40 80 100
pH (Grease)
6-9 6-9.5 6-9 6-9 6-9 6-9
Oil & Grease
15 <100 5 5 10 10
Temperature (deg.)
10C>avg. temp of receiving body
<43 35 35 35 35
Total Suspended Solids
60 <800 30 30 50 50
Settable Solids
__ <10 __ 20 __ __
Total Dissolved Solids
2000 __ 800 1200 2000 2000
Chlorine
__ <10 1 1 __ __
34
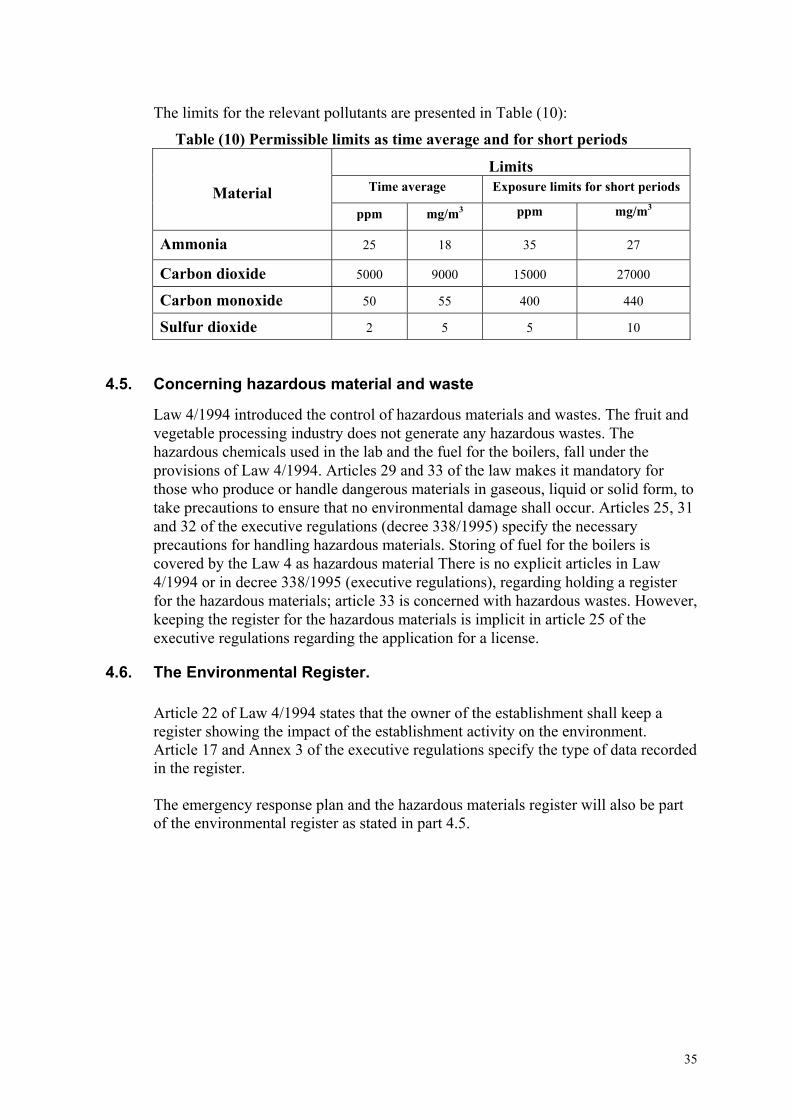
The limits for the relevant pollutants are presented in Table (10):
Table (10) Permissible limits as time average and for short periods
Limits Time average Exposure limits for short periods
Material ppm mg/m3 ppm mg/m3
Ammonia 25 18 35 27
Carbon dioxide 5000 9000 15000 27000
Carbon monoxide 50 55 400 440
Sulfur dioxide 2 5 5 10
4.5. Concerning hazardous material and waste
Law 4/1994 introduced the control of hazardous materials and wastes. The fruit and vegetable processing industry does not generate any hazardous wastes. The hazardous chemicals used in the lab and the fuel for the boilers, fall under the provisions of Law 4/1994. Articles 29 and 33 of the law makes it mandatory for those who produce or handle dangerous materials in gaseous, liquid or solid form, to take precautions to ensure that no environmental damage shall occur. Articles 25, 31 and 32 of the executive regulations (decree 338/1995) specify the necessary precautions for handling hazardous materials. Storing of fuel for the boilers is covered by the Law 4 as hazardous material There is no explicit articles in Law 4/1994 or in decree 338/1995 (executive regulations), regarding holding a register for the hazardous materials; article 33 is concerned with hazardous wastes. However, keeping the register for the hazardous materials is implicit in article 25 of the executive regulations regarding the application for a license.
4.6. The Environmental Register.
Article 22 of Law 4/1994 states that the owner of the establishment shall keep a register showing the impact of the establishment activity on the environment. Article 17 and Annex 3 of the executive regulations specify the type of data recorded in the register. The emergency response plan and the hazardous materials register will also be part of the environmental register as stated in part 4.5.
35
5. POLLUTION ABATEMENT MEASURES
This section deals with pollution abatement in the three media air, water and soil. Three types of interventions will be considered: • In-plant modifications, which are changes that are performed in the plant to reduce pollutant concentrations in streams through recovery of materials, segregation and/or integration of streams, reducing the flow rate of the wastewater streams that need further treatment to reduce the hold-up of the required WWTP. • In-Process modifications, which are changes performed on the process such as the introduction of newer technology, substitution of a hazardous raw material, performing process optimization and control. • End-of-pipe (EoP) measures, which involve treatment of the pollutant or its separation for further disposal. Whereas in-plant and in-process modifications usually have an economic return on investment, end-of-pipe measures will be performed for the sole purpose of compliance with the laws without economic.
Egyptian Environmental Laws do not require water and energy conservation measures. These measures have been considered in this manual since resource depletion and hence conservation is a worldwide-recognized environmental issue that could be implemented in Egypt in the near future. Water conservation measures can lead to higher concentrations of pollutants in the effluent streams. Both energy and water conservation measures will provide both financial and economic benefits. The term Cleaner Production (CP) refers to the same concepts of pollution reduction through in-process, in-plant and resource conservation, in contradistinction to end-of-pipe treatment. In many cases, the adoption of CP can eliminate the need for (EoP) treatment. The following CP and EoP measures have been identified for the fruit and vegetables processing industry.
5.1. Air pollution Flue gases
Particulate matter in flue (exhaust) gases are due the ash and heavy metal content of the fuel, low combustion temperature, low excess oxygen level, high flow rate of flue gases. Sulfur dioxide is due to the sulfur content of the fuel. Nitrogen oxides are formed when maximum combustion temperature and high excess oxygen. Carbon monoxide is formed when incomplete combustion occurs at low air to fuel ratio. The following measures can be adopted to minimize air pollution from flue (exhaust) gases: • Replace Mazot by solar or natural gas. Mazot is high in
sulfur content. • Regulate the fuel to air ratio for an optimum excess air that
ensures complete combustion of carbon monoxide to dioxide. • Keep the combustion temperature at a moderate value to
minimize particulate matter and nitrogen oxides.
Gas leaks Freon and steam leaks are minimized through maintenance and repair. Freon should be replaced by another non-hazardous refrigerant.
36
5.2. Water pollution abatement measures In-plant modifications
• The installation of product-capture systems for filling machines can reduce product losses. • The installation of screens and grates on the drains prevents
solid waste to reach the wastewater • Provide simple treatment options (sedimentation, coalescing
plate filters, etc..) to allow water to be recycled. • Improve the distribution chain by carefully managing
temperatures and other important variables through the last cycle stage of the product. • Implementation of a quality control system such as HACCP
(Hazard Analysis & Critical Control Point) is recommended to minimize waste. • Integration and segregation of sewer lines to minimize
treatment needs and ensure compliance with the environmental laws, can be an option for many factories. In some cases where there are several discharge points from the factory, mixing of the streams could lead to compliance. In other cases where treatment is imperative some streams could be segregated and discharged without violation. The remaining streams will require a smaller treatment unit.
In-process modifications
• Implementation of a control system involving pressure regulators on the steam lines, temperature controllers, flow controllers… • Use dry methods such as vibration or air jets to clean raw
fruits and vegetables. Dry peeling methods reduce the effluent volume (by up to 35%) and pollutant concentration (organic load by 25%). • Install DAF unit to recover suspended material. • Recover useful materials from the wastes, such as
recovering oil from skins and seeds. • Introduce a fermentation operation to produce alcohol. • Use countercurrent systems where washing is necessary. • Replace batch processes with continuous ones. • Modernize the equipment. • Introduce controlled atmosphere packaging. This technique
allows food to retain its quality for a longer time thus, passing through the distribution chain without getting spoiled. • Use of packaging material with the right strength ensures
protection of the final product from the factory gate to the final consumption.
End-of-pipe treatment
Because of the typically high content of suspended solids, COD and BOD in the fruit and vegetable processing industry waste-streams, end-of-pipe treatment frequently involves settling tanks and biological treatment. Pretreatment of effluents consists of screening, flow equalization, neutralization and air flotation (to remove fats and solids); it is normally followed by biological treatment. If space is available pond systems are potential treatment methods. Other possible biological treatment methods include trickling filters, rotating biological contactors and
37
activated sludge treatment. The flows are frequently seasonal, and robust treatment systems are preferred for onsite treatment.
5.3. Abatement measures for solid waste pollution Fruit and vegetable process wastes
• Cleaning and preparation of raw fruit and vegetable in the farm will reduce the amount of material, which has to be transported and which eventually have to be disposed of by the factory. If crop grading, trimming, selection, culling and inspection can take place in the field, the amount of solid waste generated by the factory will be further reduced. A further advantage to the producer is that these residues may be usefully employed in situ, as fertilizer or animal feed. • The raw fruits and vegetables delivered to the factories are often
damaged. The soft fruits and the tomatoes are often bruised, crushed and rotting. In addition to costing the factory money due to lost raw materials, these losses will also unnecessarily increase the pollution load. Tainting of the final product may also occur. The factory should refuse to accept goods delivered in an unacceptable condition. • Organic waste from the factory should be used in the production
of animal feed or organic fertilizers Scrap Scrap is collected and sold.
Sludge • Effluent treatment processes generate solids. On average 70-
80% of the original carbon is converted to solids. This sludge is subject to putrefaction, is malodorous and offensive. It can also be hazardous to health by absorbing pathogens that multiply in this favorable medium and toxins. Raw sludge is saturated with bound water, should be de-watered and disposed of in sanitary landfills. • Sludge can also be generated from water treatment when lime
and chemicals are used.
5.4. Water and energy conservation Water and sewer service costs have been rising, and these increases can cut into profits. Using water more efficiently can help counter these increases.
Water Conservation
• Procure clean fruits and vegetables, thus reducing the concentration of dirt and organic materials (including pesticides) in the effluent and reducing water usage. • Install water meters and monitor water use • Use automatic shut-off nozzles and mark hand-operated valves
so that open, close and directed-flow positions are easily identified. • Use high-pressure, low-volume cleaning systems, such as CIP
(clean in place) for washing equipment. • Install liquid level controls with automatic pump stops where
overflow is likely to occur. • Recycle cooling water through cooling towers.
38

39
• Minimize spills on the floor minimizes floor washing. • Repair leaks. • Handle solid waste dry. • Recycle steam condensate whenever economically viable.
Energy conservation measures
• Insulation of steam lines. • Installation of steam traps. • Repair or replace steam valves. • Maximize boilers efficiency. • Install pressure regulators on steam lines. • Adjust the power factor
6. ENVIRONMENTAL SELF-MONITORING
Self-Monitoring (SM) is a process that primarily relates to measurements of process inputs, releases and environmental pollution levels, as well as process conditions (operation controls) that are directly related to the monitored emissions. Self – monitoring is necessary for the plant to improve its economic performance by identifying the sources of wastes in raw materials, water, and energy that represent the main sources of pollution. Thus, the plant would be able to implement pollution prevention techniques that could reduce production costs and minimize compliance costs, which should lead to improved economic and environmental performance of the plant. In addition, self-monitoring may include reporting of the results to the pertinent authorities. Monitoring can be carried out by the industrial establishment, or on its behalf, and paid for by the industrial establishment. The information obtained from the sampling component of the monitoring system must be recorded and the results reported to the appropriate internal and external decision-makers.
6.1 Benefits of SM In general, the benefits of self-monitoring results to the operators include: • Raising their awareness about the process performance and efficiency • Having them ready for inspection by authorities. • Providing inspectors with more reliable data to verify the single
unrepresentative samples and/or measurements • Raising their awareness about impact of pollutants • Implementing corrective actions if non-compliance occurs. • Deciding on raw materials, additives, fuels, and investment strategies. • Identifying trends in plant performance and setting alarms. • Improving process efficiency.
These benefits are generated through implementing an integrated environmental self-monitoring plan that comprises: • Emission monitoring, which covers releases to air, wastewater, and solid and
hazardous waste as well as regulated working conditions • Monitoring of process parameters (operation controls) that are directly related
to the releases; such as temperature, pressure, and humidity. In addition, process conditions such as shutdowns, maintenance operations, and spills need to be also monitored, linked to emissions, and reported.
6.2 Scope and Objectives of SM
As previously indicated, environmental self-monitoring comprises the monitoring of environmental releases (emissions) as well as the monitoring of process parameters (operation controls) that affect the environmental impact of the facility. The objectives of each type are separately detailed as follows:
40
a) Emissions self-monitoring The basic objective of self-monitoring is to monitor compliance with environmental regulations. As the inventory for hazardous materials and wastes is mandatory with procedures for handling and storage as regulated by law 4/1994, self-monitoring should assist in covering this area. The objectives of emission monitoring may go beyond monitoring compliance; i.e. to assist improving environmental performance. In other words, monitoring of emissions at the process level is necessary to minimize emissions at the source through pollution abatement and prevention measures. While Egyptian regulations consider only concentration of the pollutants, self-monitoring may include pollution loads as well as the environmental impact on the receiving media. These data are required to assess the improvement of the environmental performance.
b) Process self-monitoring (operation control)
In most industrial facilities monitoring of process operations already exists. Some process operation controls should be monitored for improved environmental benefits. The main objectives of process self-monitoring (operation control) is:
� Optimization of process operation by controlling the operating conditions � Minimization of losses � Planned maintenance and repair as opposed to emergency maintenance and
shutdown � Minimization of cost through conservation of energy and water
6.3 SM and Environmental Management Systems (EMS)
Aside from the regulatory aspects, SM has shown to be a necessary tool for the plant to manage its releases, control its environmental impacts and improve its environmental performance. Such achievements represent the main objectives of the Environmental Management Systems (EMS), which in turn constitute a requirement for internal monitoring, checking and implementing the corrective actions. In addition, EMS encourages the industrial plants to adopt Cleaner Production, (CP), and Pollution Prevention, (P2), measures as the main tools for continual improvement. This can be achieved only by implementing a comprehensive and effective SM plan. The following sections highlight the concept of EMS, link to SM and link between SM and cleaner production.
6.3.1 Environmental Management Systems (EMS)
An Environmental Management System (EMS) is a framework that helps a company achieve its environmental goals through consistent control of its operations. The EMS itself does not dictate a level of environmental performance of the company; each company tailors its EMS to its specific business goals. Compliance with environmental laws and regulations has become a major goal that has to be attained with minimum cost. This is the minimum level for environmental performance to be achieved through the EMS. In general, an EMS comprises five phases leading to continual improvement; commitment and policy, planning, implementation,
41
evaluation and review. These phases will be herein explained within the context of the standard system “ISO 14000”, which is internationally recognized. With regard to Egypt, this system is being gradually implemented by the Egyptian Industry. The different stages of the EMS form a cycle (Figure 7) that allows feedback of information and continuous improvement. This system includes the following elements:
1. Environmental policy. Top management commits to an environmental policy
that comprises, as a minimum, compliance with laws and regulations, pollution prevention and continual improvement. The policy is the foundation of the EMS
2. Planning: The company first identifies environmental aspects of its activities. Environmental aspects are those items such as air pollutants or hazardous wastes that can have negative impacts on people and/or the environment. Once the pertinent laws and regulations are identified, the company sets objectives and targets. An objective is an overall environmental goal (e.g. minimize use of chemical x). A target is a detailed, quantified requirement that arises from the objective (e.g. reduce use of chemical x by 25% by September 2003). The final part of the planning stage is developing an action plan for meeting the targets, including schedule, resources, and the clearly defined steps to meet the targets.
3. Implementation. This phase comprises the establishment of the structure, assignments and responsibilities of the designated personnel. An important component is personnel training and awareness for all employees. Other steps in the implementation stage include documentation, document control, implementing operation procedure, and setting up internal and external communication lines. In addition, an emergency and preparedness plan has to be developed.
4. Checking and Corrective Action. The company monitors its operations and activities to ensure that targets are being met. If not, the company takes corrective action and keeps records for the emissions and environmental performance. Internal audit is a key element to improve the system.
5. Management Review. Top management regularly reviews the results of the evaluation to see if the EMS is efficient and effective. Management determines whether the original environmental policy is consistent with company values. The plan is then revised to optimize the effectiveness of the EMS. The review stage creates a feedback of information necessary for continuous improvement.
42
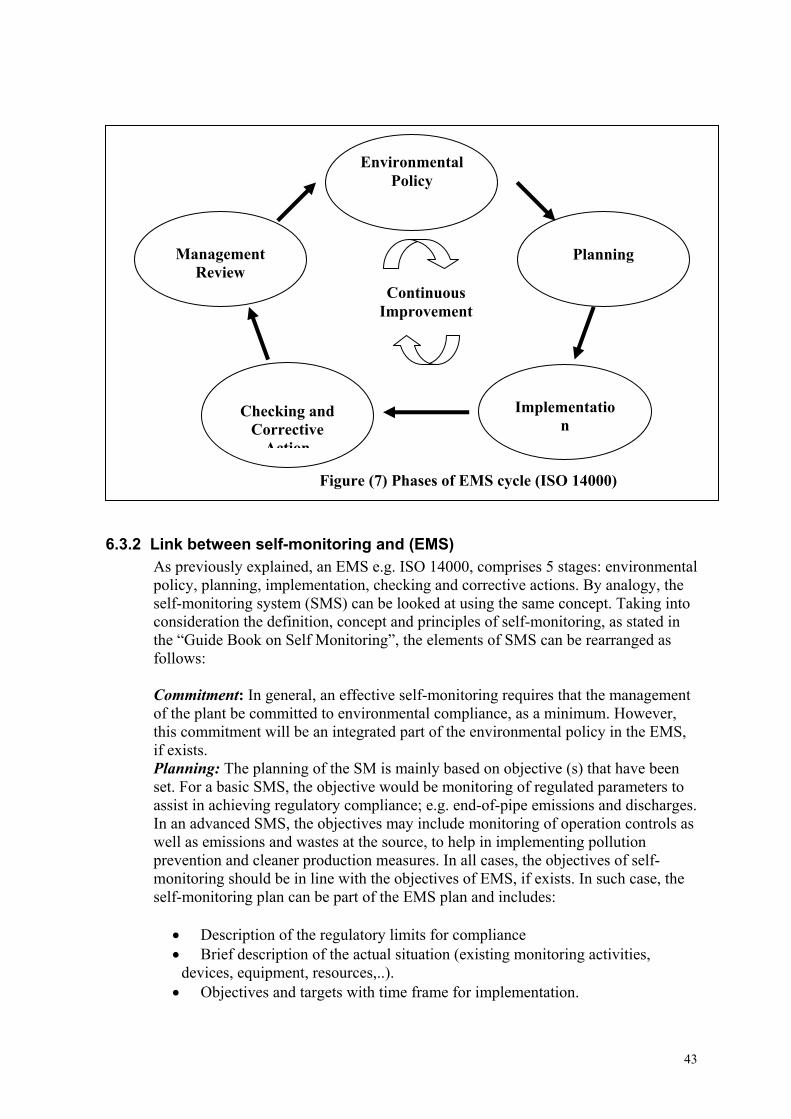
Figure (7) Phases of EMS cycle (ISO 14000)
Continuous Improvement
Checking and
Corrective Action
Implementatio
n
Management
Review
Planning
Environmental Policy
6.3.2 Link between self-monitoring and (EMS) As previously explained, an EMS e.g. ISO 14000, comprises 5 stages: environmental policy, planning, implementation, checking and corrective actions. By analogy, the self-monitoring system (SMS) can be looked at using the same concept. Taking into consideration the definition, concept and principles of self-monitoring, as stated in the “Guide Book on Self Monitoring”, the elements of SMS can be rearranged as follows:
Commitment: In general, an effective self-monitoring requires that the management of the plant be committed to environmental compliance, as a minimum. However, this commitment will be an integrated part of the environmental policy in the EMS, if exists. Planning: The planning of the SM is mainly based on objective (s) that have been set. For a basic SMS, the objective would be monitoring of regulated parameters to assist in achieving regulatory compliance; e.g. end-of-pipe emissions and discharges. In an advanced SMS, the objectives may include monitoring of operation controls as well as emissions and wastes at the source, to help in implementing pollution prevention and cleaner production measures. In all cases, the objectives of self-monitoring should be in line with the objectives of EMS, if exists. In such case, the self-monitoring plan can be part of the EMS plan and includes:
• Description of the regulatory limits for compliance • Brief description of the actual situation (existing monitoring activities,
devices, equipment, resources,..). • Objectives and targets with time frame for implementation.
43
• Identification of parameters monitored, location of monitoring points and preparation of a self-monitoring schedule. • Description of methods and procedures used for sampling, analyses,
measurements, calculations, recording and data manipulation. • Description of tasks • Training program
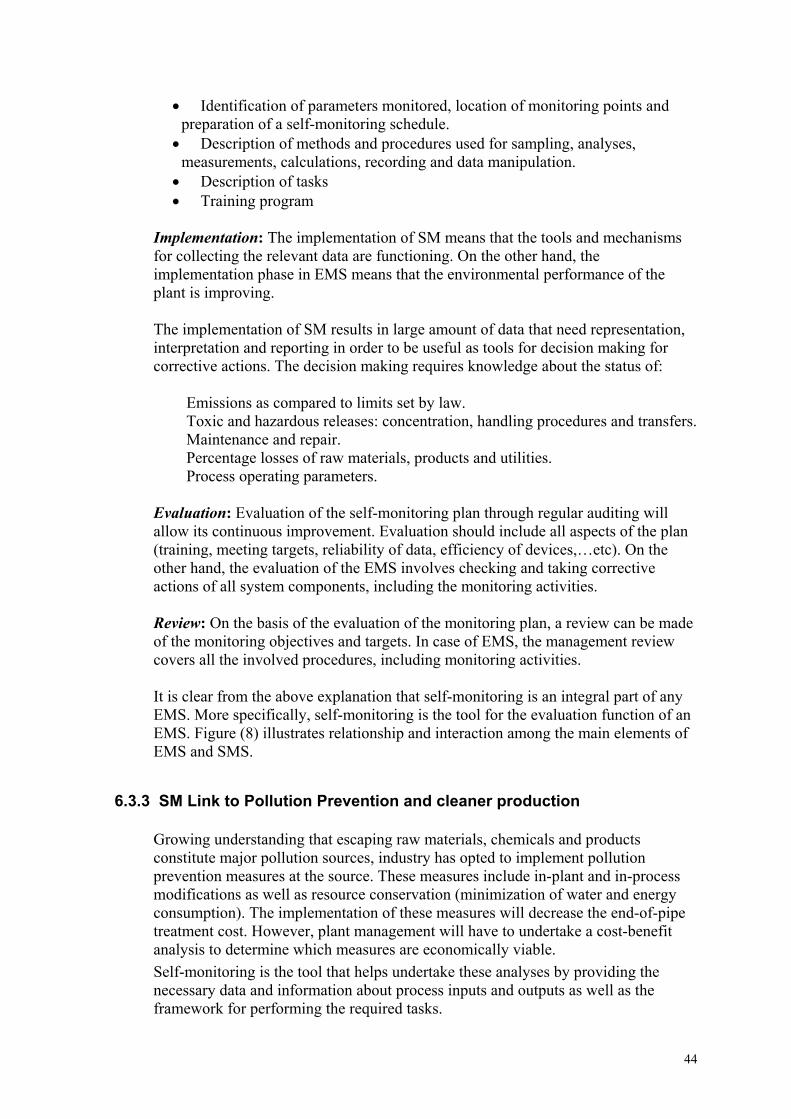
Implementation: The implementation of SM means that the tools and mechanisms for collecting the relevant data are functioning. On the other hand, the implementation phase in EMS means that the environmental performance of the plant is improving. The implementation of SM results in large amount of data that need representation, interpretation and reporting in order to be useful as tools for decision making for corrective actions. The decision making requires knowledge about the status of:
� Emissions as compared to limits set by law. � Toxic and hazardous releases: concentration, handling procedures and transfers. � Maintenance and repair. � Percentage losses of raw materials, products and utilities. � Process operating parameters.
Evaluation: Evaluation of the self-monitoring plan through regular auditing will allow its continuous improvement. Evaluation should include all aspects of the plan (training, meeting targets, reliability of data, efficiency of devices,…etc). On the other hand, the evaluation of the EMS involves checking and taking corrective actions of all system components, including the monitoring activities. Review: On the basis of the evaluation of the monitoring plan, a review can be made of the monitoring objectives and targets. In case of EMS, the management review covers all the involved procedures, including monitoring activities. It is clear from the above explanation that self-monitoring is an integral part of any EMS. More specifically, self-monitoring is the tool for the evaluation function of an EMS. Figure (8) illustrates relationship and interaction among the main elements of EMS and SMS.
6.3.3 SM Link to Pollution Prevention and cleaner production
Growing understanding that escaping raw materials, chemicals and products constitute major pollution sources, industry has opted to implement pollution prevention measures at the source. These measures include in-plant and in-process modifications as well as resource conservation (minimization of water and energy consumption). The implementation of these measures will decrease the end-of-pipe treatment cost. However, plant management will have to undertake a cost-benefit analysis to determine which measures are economically viable. Self-monitoring is the tool that helps undertake these analyses by providing the necessary data and information about process inputs and outputs as well as the framework for performing the required tasks.
44

The introduction of emission monitoring for the purpose of improved environmental performance through the application of cleaner technology widens the objectives of the plant EMS beyond compliance with relevant laws and should be met with economic incentives from the part of the competent authorities.
45
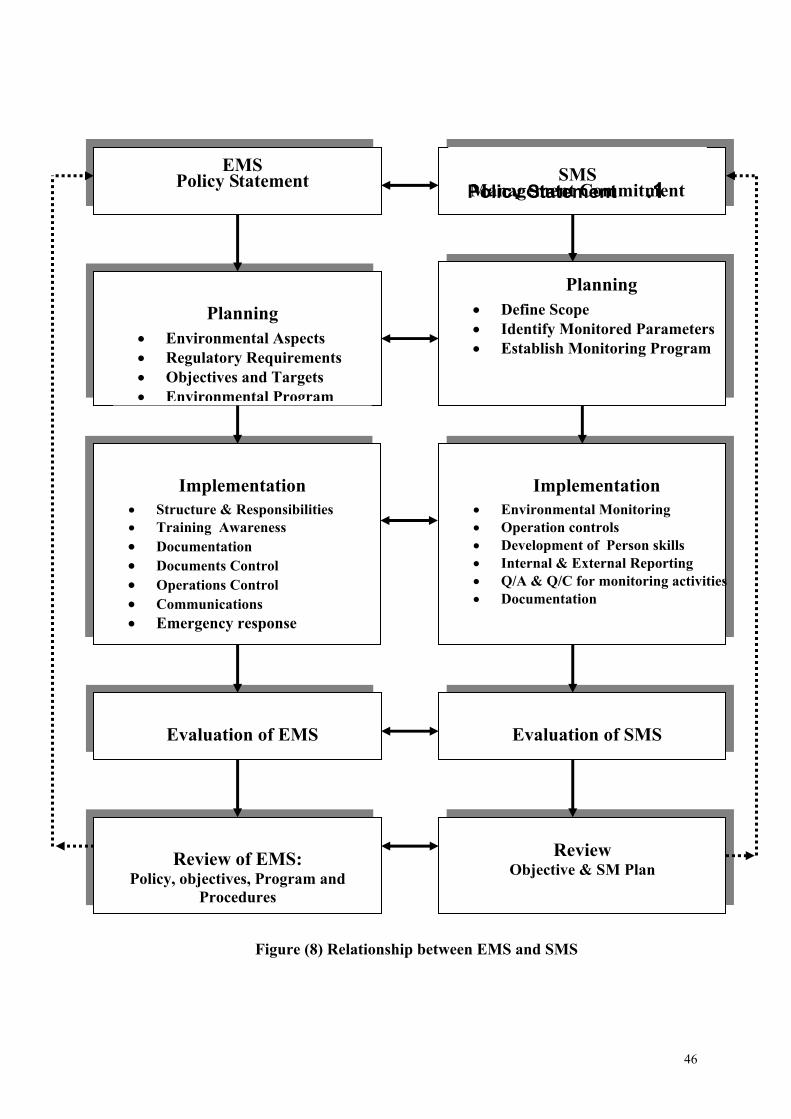
Figure (8) Relationship between EMS and SMS
Review Objective & SM Plan
Evaluation of SMS
Implementation • Environmental Monitoring • Operation controls • Development of Person skills • Internal & External Reporting • Q/A & Q/C for monitoring activities • Documentation
Planning • Define Scope • Identify Monitored Parameters • Establish Monitoring Program
1. y StatementSMS
Management Commitment Polic
Review of EMS: Policy, objectives, Program and
Procedures
Evaluation of EMS
Implementation • Structure & Responsibilities • Training Awareness • Documentation • Documents Control • Operations Control • Communications • Emergency response
Planning • Environmental Aspects • Regulatory Requirements • Objectives and Targets • Environmental Program
EMS Policy Statement
46
6.4 Regulatory Aspects
In developed industrial countries, e.g. in Europe, the competent authorities must approve the monitoring program, specify the standards and quality requirements for self-monitoring that are to be achieved by the operator, and ensure those possibilities for cheating and fraud are minimized. The competent authorities will receive self-monitoring reports periodically from the operator. These should provide summary information, following data reduction, in a format facilitating easy comparison with permit limits. Additionally, the competent authorities would inspect the operator’s self-monitoring records, including log sheets covering sampling, analyses, instrumental monitoring, and data-reduction calculations.
6.4.1 SM and Environmental Register
According to Law 4/1994, industrial facilities (operators) are required to keep a record of their inputs, outputs and releases in the environmental register as stated by which implicitly requires some sort of self-monitoring. The Egyptian Environmental Affairs Agency (EEAA) is mandated to check the validity of the data in the Environmental Register. The responsibilities of the operator and the competent authority are not affected by who carries out the monitoring. It is the responsibility of the operator to comply with laws and regulations. On the other hand, the competent authorities (inspectors) are responsible for assessing and ensuring the operator’s compliance.
When combined with Self-monitoring, the Environmental Register can offer benefits to the competent authorities through:
• Utilizing the operator’s knowledge and experience of his process in
planning and carrying out a monitoring program that can lead to improved control over releases to the environment.
• Self-monitoring will normally provide more information than may be
obtained by periodic inspection by the competent authorities. • Providing a mechanism for educating the operator about the requirements
for complying with relevant laws, regulations and permits and for increasing of management responsibility for compliance and the impact of process releases on the environment.
6.4.2 SM and Inspection
Self-monitoring does not constitute self-regulation. SM provides additional information on which the competent authorities can judge whether an operator is complying with relevant legislation and conditions of permits. It does not change the duty of the competent authority to assess compliance by means of inspection and by performing its own monitoring or choose to rely on the operator’s monitoring data or a combination of both. The competent authority continues to be responsible for enforcement.
47
As mentioned above, SM provides a wealth of information that can be utilized by the competent authority in reviewing standards and developing applicable environmental policies. However, the competent authority will have to check the reliability of the SM data. Thus, inspectors may be required to check the SMS plan, QA/QC procedures, data handling and documentation. In this context, it is expected that inspectors may perform the following tasks:
• Check the SM program • Check and verify the specified measurement standards • Check the reliability of the data (by carrying out independent monitoring). • Inspect SM arrangements such as:
- The positioning and serviceability of fixed instrumentation. - Records confirming the maintenance and calibration of instrumentation
and sampling equipment. - Manual sampling and analytical procedures.
This expected interaction would help both partners, i.e. the operator and the competent authority, in achieving their objectives in terms of reliability of emission data and environmental performance.
48
7. PLANNING OF SM
Planning for SM starts by setting the objectives. It should be clear that a number of process control parameters needs to be monitored, along with environmental monitoring. For the purpose of this manual environmental self-monitoring will be considered in addition to monitoring of process parameters that are related to emissions (operation controls). Compliance monitoring requires measurements, analysis and data on end-of-pipe releases, whereas operation controls target the production units that offer pollution prevention opportunities. The environmental manager with the help of various sector managers should carry out the planning activities. With reference to ”Guidebook for Industrial Self-Monitoring”, the main elements of the Self-Monitoring Plan, that describes the SMS, include: • Objectives and results required from the self-monitoring system • Organization and share of responsibilities and tasks • Planning activities and design of an implementation schedule • Definition of the parameters and relevant monitored indicators to reach the
objectives • Design of an appropriate measurement and sampling program • Data processing and reporting procedures • System for follow-up of decisions, actions and monitoring development • Quality assurance and control
With reference to the Guidebook for Industrial Self-Monitoring the objective of the SMS can be limited to provide the data required for the Environmental Register, which is mandated by the Environmental Law, e.g. total inputs, outputs and emissions on the plant level. This objective ”compliance with regulations” requires the ”Basic Self-Monitoring System” which comprises the minimum requirements. In these cases where self-monitoring is not mandatory, operator can build a ”basic” self-monitoring system that focuses on the regulated emissions, as a minimum. Then, the system can be gradually upgraded, ”continual improvement” through internal auditing of all system components. Other objectives, e.g. waste minimization, pollution prevention and improved environmental performance require upgraded SMS that includes monitoring of inputs, outputs and releases on the level of operations and detailed processes. In all cases, the established SMS should be gradually improved and upgraded, considering the plant financial and economic constrains.
The following sections are detailing the stepwise activities that are needed to develop a viable, realistic, and applicable plan for a self-monitoring system. Figure (9) presents the various steps for the preparation and implementation of a self-monitoring plan.
49
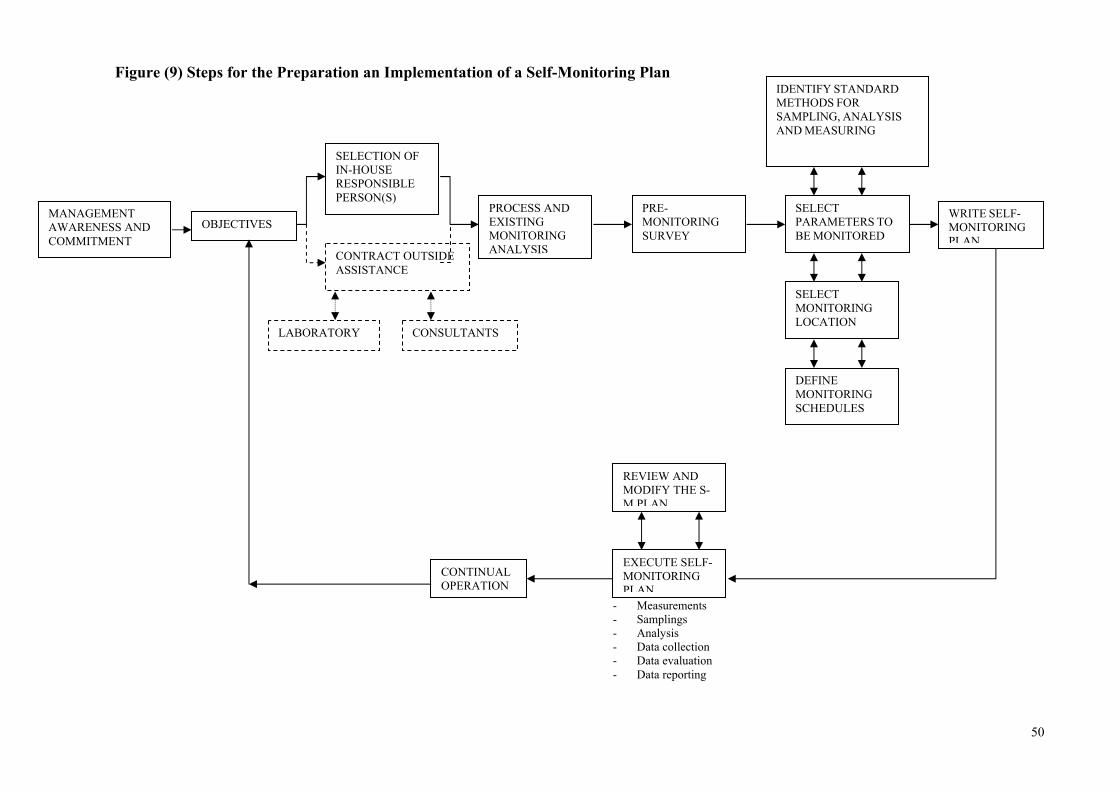
Figure (9) Steps for the Preparation an Implementation of a Self-Monitoring Plan
WRITE SELF-MONITORING PLAN
OBJECTIVES
CONTINUAL OPERATION
REVIEW AND MODIFY THE S-M PLAN
EXECUTE SELF-MONITORING PLAN
- Measurements - Samplings - Analysis - Data collection - Data evaluation - Data reporting
IDENTIFY STANDARD METHODS FOR SAMPLING, ANALYSIS AND MEASURING
DEFINE MONITORING SCHEDULES
SELECT MONITORING LOCATION
SELECT PARAMETERS TO BE MONITORED
PRE-MONITORING SURVEY
PROCESS AND EXISTING MONITORING ANALYSIS
CONSULTANTS LABORATORY
CONTRACT OUTSIDE ASSISTANCE
SELECTION OF IN-HOUSE RESPONSIBLE PERSON(S)
MANAGEMENT AWARENESS AND COMMITMENT
50
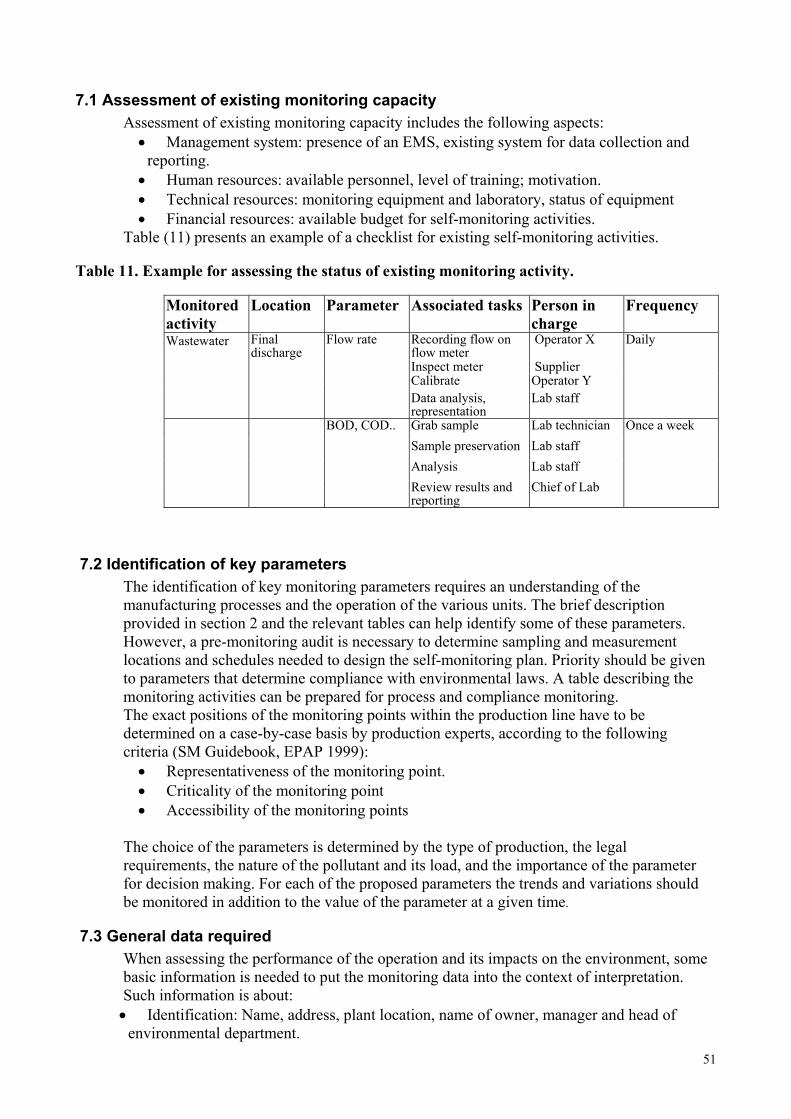
7.1 Assessment of existing monitoring capacity Assessment of existing monitoring capacity includes the following aspects: • Management system: presence of an EMS, existing system for data collection and
reporting. • Human resources: available personnel, level of training; motivation. • Technical resources: monitoring equipment and laboratory, status of equipment • Financial resources: available budget for self-monitoring activities.
Table (11) presents an example of a checklist for existing self-monitoring activities. Table 11. Example for assessing the status of existing monitoring activity.
Monitored activity
Location Parameter Associated tasks Person in charge
Frequency
Recording flow on flow meter
Operator X
Inspect meter Supplier Calibrate Operator Y
Wastewater Final discharge
Flow rate
Data analysis, representation
Lab staff
Daily
Grab sample Lab technician Sample preservation Lab staff Analysis Lab staff
BOD, COD..
Review results and reporting
Chief of Lab
Once a week
7.2 Identification of key parameters The identification of key monitoring parameters requires an understanding of the manufacturing processes and the operation of the various units. The brief description provided in section 2 and the relevant tables can help identify some of these parameters. However, a pre-monitoring audit is necessary to determine sampling and measurement locations and schedules needed to design the self-monitoring plan. Priority should be given to parameters that determine compliance with environmental laws. A table describing the monitoring activities can be prepared for process and compliance monitoring. The exact positions of the monitoring points within the production line have to be determined on a case-by-case basis by production experts, according to the following criteria (SM Guidebook, EPAP 1999): • Representativeness of the monitoring point. • Criticality of the monitoring point • Accessibility of the monitoring points
The choice of the parameters is determined by the type of production, the legal requirements, the nature of the pollutant and its load, and the importance of the parameter for decision making. For each of the proposed parameters the trends and variations should be monitored in addition to the value of the parameter at a given time.
7.3 General data required When assessing the performance of the operation and its impacts on the environment, some basic information is needed to put the monitoring data into the context of interpretation. Such information is about: • Identification: Name, address, plant location, name of owner, manager and head of
environmental department. 51
• Inputs name, type and amount: Raw materials, chemicals, fuels, water, steam, and electricity. • Technology: Description of process, applied technology, operating conditions
(temperature, pressure), maximum capacity, operating capacity during monitoring. • Outputs name, type and rate: Products, by-products • Abatement techniques: Air pollution prevention, wastewater treatment, solid waste
management, noise abatement • Emissions and their sources: receiving media, pollutant type, concentration and load,
pollutant impact. • Existing EMS system, analyses and measurement results, relevant environmental laws
and allowable pollutant levels. • Assessment of legislative and regulatory requirements.
7.4 Data collection, manipulation and reporting Data collection and analysis should be carefully planned according to the following principles: • Base the analysis on trends over a long period to take into consideration the shock
loads that characterize the fruits and vegetables industry. • Determine the causes and degree of variability of a parameter. A dramatic change of a
low-variability parameter may be interpreted as a sign of anomaly of the process. This will require an investigation to find the potential source of the problem and take the right corrective action. • Study the correlation between different parameters. The cause of variation for a
highly variable parameter may be correlated to another parameter. A considerable amount of data may be generated by the operator carrying out self-monitoring especially when continuous monitoring instrumentation is used. Data reduction is necessary to calculate time-averaged means, percentile values and the like. When compliance data are recorded in the environmental register the relevant calculations for data reduction should be specified. Measured values are used to form half-hourly mean values for each successive half-hour to generate frequency distribution. For each calendar day a daily mean value, related to the daily operating time, is calculated from the half-hourly mean values and kept on file. Measurement results should be kept in the environmental register for at least 10 years (Article 22 of law 4/1994 and 17 of its executive regulations). An annual report is prepared on the outcome of the measurements including information on: • Measurement planning • The outcome of each individual measure • Measurement methods used • Operating conditions that are important for the assessment of individual data and
measurement results.
7.5 Criteria for selecting monitoring method. The choice of monitoring method used to determine the value of the parameter depends on the specific features of the process, the emission sources, the physical state and properties of the sample and the nature of emissions from the operation. The latter can be classified as:
Normal emissions
Occur during normal operation and normal process and abatement technique conditions .
52
Diffused and fugitive emissions
These are emissions from a certain process but from scattered points such as emissions from ventilation ducts, barrels, and scattered small stores. The diffuse emissions are calculated/estimated by monitoring the source periodically and assessing the long-term emission from the measurement results or by mass balance calculations.
Exceptional emissions
Exceptional emissions refer to varying input or process conditions, start-ups, shutdowns, by-pass of a process for malfunctioning and accidental causes. The emissions can differ from those of normal operation in their volume and/or concentration. These emissions can be multiple compared to normal emissions. It can be impossible to measure the concentration or volume of the exceptional emissions as the measuring device is calibrated according to the normal operating conditions. Estimation techniques should then be performed.
There are four basic methods that may be used to develop estimates: • Direct or indirect measurement • Mass balance • Emission factors • Engineering calculations
7.5.1. Direct or indirect measurement a) Direct measurements: Using monitoring data or direct measurements is usually the best method for developing chemical release and/or other waste-management activity quality estimates. Data may have also been collected for the facility through an occupational health and safety assessment. If only a small number of direct measurement data is available or if the monitoring data are not based on a representative sample, another estimation method should be used to give a more accurate result.
Note : Treatment Efficiencies Supplier data on treatment efficiencies often represent ideal operating conditions, should be adjusted to account for downtime and process upsets during the year that would result in lower efficiencies. Efficiencies reported by supplier are often general and may not apply to specific chemicals. For example, an incinerator or flare may be 99.99% efficient in destroying organic chemicals, but will have 0% efficiency in destroying metals.
For successful measurements the following considerations should be satisfied: • The frequency of measurement and sampling must cover temporal variations of the
process and specifically the period during which harm occurs. • Continuous monitoring is suitable for large emission sources, such as stacks and
wastewater canals except in cases where high temperature or corrosive substances are involved. At smaller sites the cost of continuous monitoring is weighed against the value of the monitoring results and the possibility of obtaining representative results from periodic measurements. • Utilization rate (percentage of continuous monitoring time to total operation time)
should be known when performing continuous monitoring.
53
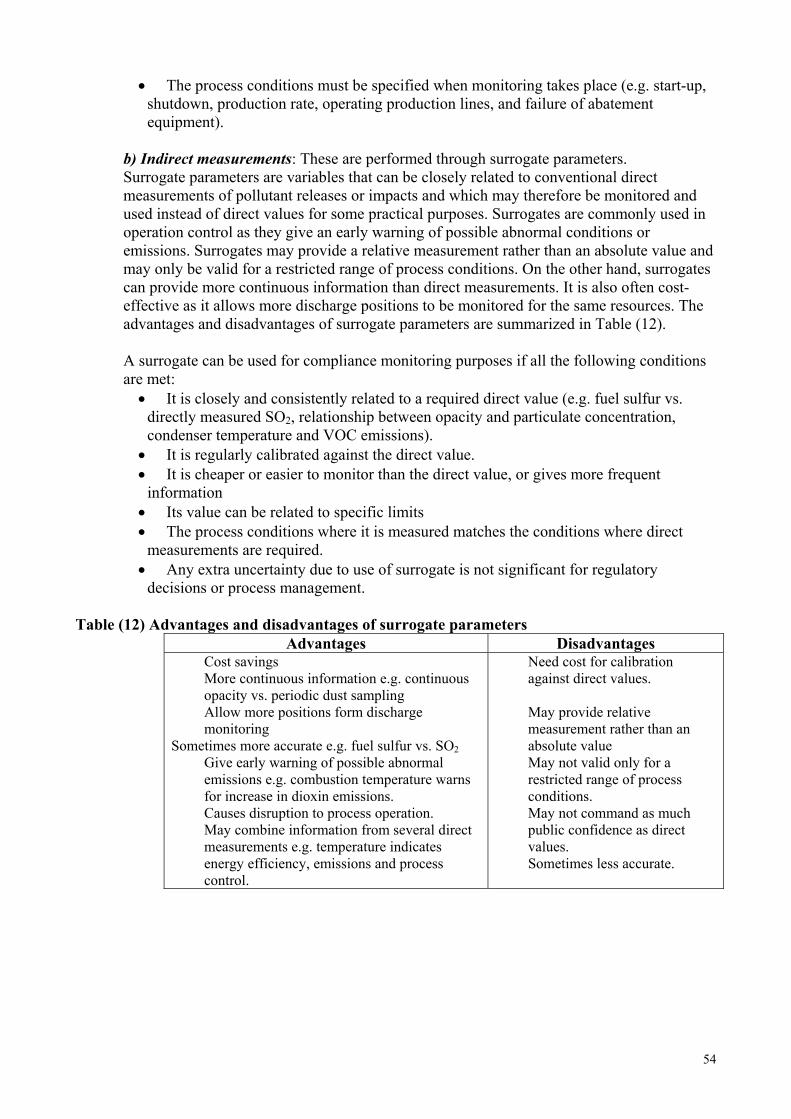
• The process conditions must be specified when monitoring takes place (e.g. start-up, shutdown, production rate, operating production lines, and failure of abatement equipment).
b) Indirect measurements: These are performed through surrogate parameters. Surrogate parameters are variables that can be closely related to conventional direct measurements of pollutant releases or impacts and which may therefore be monitored and used instead of direct values for some practical purposes. Surrogates are commonly used in operation control as they give an early warning of possible abnormal conditions or emissions. Surrogates may provide a relative measurement rather than an absolute value and may only be valid for a restricted range of process conditions. On the other hand, surrogates can provide more continuous information than direct measurements. It is also often cost-effective as it allows more discharge positions to be monitored for the same resources. The advantages and disadvantages of surrogate parameters are summarized in Table (12). A surrogate can be used for compliance monitoring purposes if all the following conditions are met: • It is closely and consistently related to a required direct value (e.g. fuel sulfur vs.
directly measured SO2, relationship between opacity and particulate concentration, condenser temperature and VOC emissions). • It is regularly calibrated against the direct value. • It is cheaper or easier to monitor than the direct value, or gives more frequent
information • Its value can be related to specific limits • The process conditions where it is measured matches the conditions where direct
measurements are required. • Any extra uncertainty due to use of surrogate is not significant for regulatory
decisions or process management. Table (12) Advantages and disadvantages of surrogate parameters
Advantages Disadvantages � Cost savings � More continuous information e.g. continuous
opacity vs. periodic dust sampling � Allow more positions form discharge
monitoring Sometimes more accurate e.g. fuel sulfur vs. SO2
� Give early warning of possible abnormal emissions e.g. combustion temperature warns for increase in dioxin emissions.
� Causes disruption to process operation. � May combine information from several direct
measurements e.g. temperature indicates energy efficiency, emissions and process control.
� Need cost for calibration against direct values.
� May provide relative
measurement rather than an absolute value
� May not valid only for a restricted range of process conditions.
� May not command as much public confidence as direct values.
� Sometimes less accurate.
54
7.5.2. Mass balance A mass balance involves determining the amount of chemical entering and leaving an operation. The mass balance is written as follows:
Input + Generation = Output + Consumption
• Input refers to the materials (chemicals) entering an operation. For example, chlorine
added to process water as a disinfectant would be considered an input to the water treatment operation. • Generation identifies those chemicals that are created during an operation. For
example, when nitrogen sources are used in biological wastewater treatment systems, additional ammonia may be produced (generated). • Output means any stream by which the chemical leaves the operation. Output may
include on-site releases and other waste management activities to the environment, storage, or disposal; or the amount of chemical that leaves with the final products. In a can coating operation, for example, pigments in the paint may leave the operation as part of the product (the coating on the can) and on paint spray booth filters sent for disposal. • Consumption refers to the amount of chemical that is converted to another substance
during the operation (i.e., reacted). For example, phosphoric acid would be consumed by neutralization during wastewater treatment.
The mass balance technique may be used for manufactured, processed, or otherwise used substances. It is typically most useful for chemical that do not become part of the final product, such as catalysts, solvents, acids, and bases. For large inputs and outputs, a mass balance may not be the best estimation method, because slight uncertainties in mass calculations can yield significant errors in the release and other waste management estimates. Material balance calculations are also used to examine the effects of emission reduction on the material balances of the plant. A material balance calculation gives an impression of the magnitude of the emission of a specific substance but cannot show neither accurate emission amounts, nor their division between emissions into the air, water discharges or solid wastes. Material balance calculations are often based on evaluated process flows and concentrations. Calculating a reliable average emission level for a factory means long term monitoring of the processes and statistical examination.
7.5.3. Emission factors An emission factor is a representative value that attempts to relate the quantity of an emission released with an associated activity. These factors are usually expressed as the weight of emission released divided by a unit weight, volume, distance, or duration of the activity (e.g. kg of emission released per kg of product). Emission factors have been developed for many different industries and activities. Emission factors depend on the technology used, raw materials and pollution control devices. Emission factors can be obtained from industrial database e.g. DSS (available at EEAA).
55
Note Sources of information on emission factors should be carefully evaluated and the conditions for using the factors reviewed to determine if it is applicable to the situation at the facility.
7.5.4. Engineering calculations. Engineering calculations are assumptions and/or judgements used to estimate quantities of listed chemicals released or managed. The quantities are estimated by using physical and chemical properties and relationships (e.g. Raoult’s law, Ideal gas law) or by modifying an emission factor to reflect the chemical properties of the toxic chemical in question. Engineering calculations rely on the process parameters; thorough knowledge of the operation is required to complete these calculations. Engineering calculations can also include computer models. Several computer models are available for estimating emissions from landfills, wastewater treatment, water treatment and other processes.
56
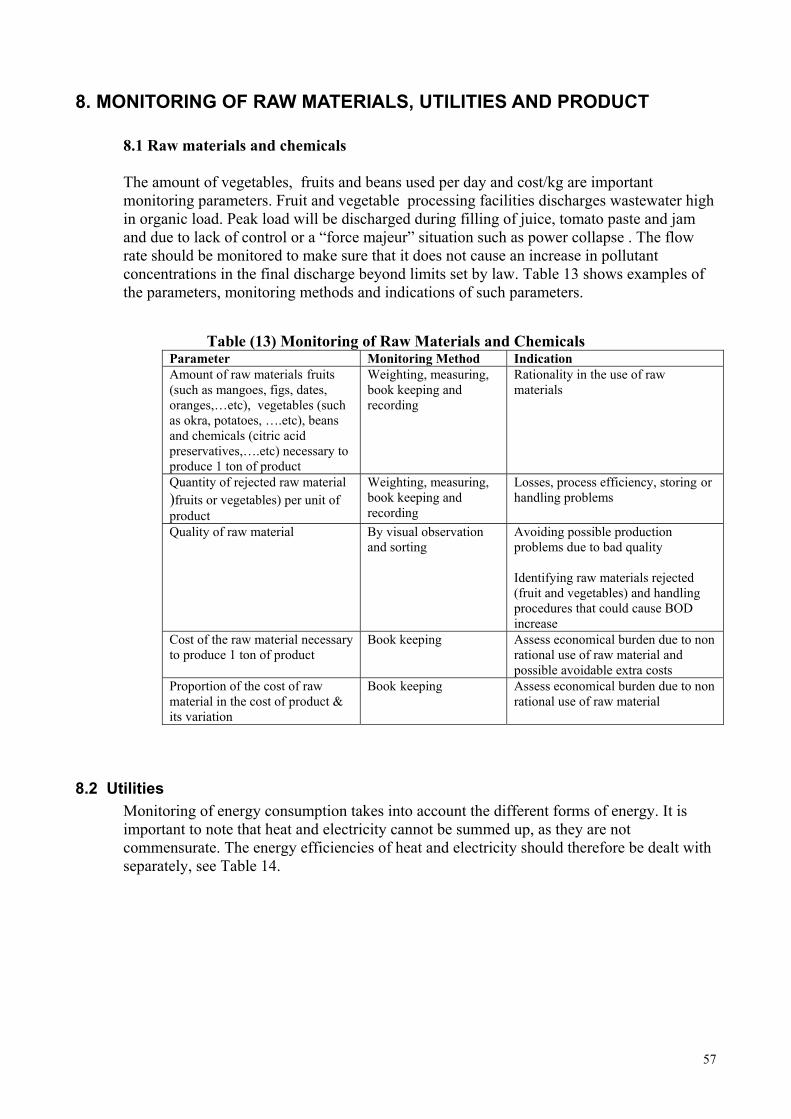
8. MONITORING OF RAW MATERIALS, UTILITIES AND PRODUCT
8.1 Raw materials and chemicals The amount of vegetables, fruits and beans used per day and cost/kg are important monitoring parameters. Fruit and vegetable processing facilities discharges wastewater high in organic load. Peak load will be discharged during filling of juice, tomato paste and jam and due to lack of control or a “force majeur” situation such as power collapse . The flow rate should be monitored to make sure that it does not cause an increase in pollutant concentrations in the final discharge beyond limits set by law. Table 13 shows examples of the parameters, monitoring methods and indications of such parameters.
Table (13) Monitoring of Raw Materials and Chemicals Parameter Monitoring Method Indication Amount of raw materials fruits (such as mangoes, figs, dates, oranges,…etc), vegetables (such as okra, potatoes, ….etc), beans and chemicals (citric acid preservatives,….etc) necessary to produce 1 ton of product
Weighting, measuring, book keeping and recording
Rationality in the use of raw materials
Quantity of rejected raw material )fruits or vegetables) per unit of product
Weighting, measuring, book keeping and recording
Losses, process efficiency, storing or handling problems
Quality of raw material By visual observation and sorting
Avoiding possible production problems due to bad quality Identifying raw materials rejected (fruit and vegetables) and handling procedures that could cause BOD increase
Cost of the raw material necessary to produce 1 ton of product
Book keeping Assess economical burden due to non rational use of raw material and possible avoidable extra costs
Proportion of the cost of raw material in the cost of product & its variation
Book keeping Assess economical burden due to non rational use of raw material
8.2 Utilities Monitoring of energy consumption takes into account the different forms of energy. It is important to note that heat and electricity cannot be summed up, as they are not commensurate. The energy efficiencies of heat and electricity should therefore be dealt with separately, see Table 14.
57
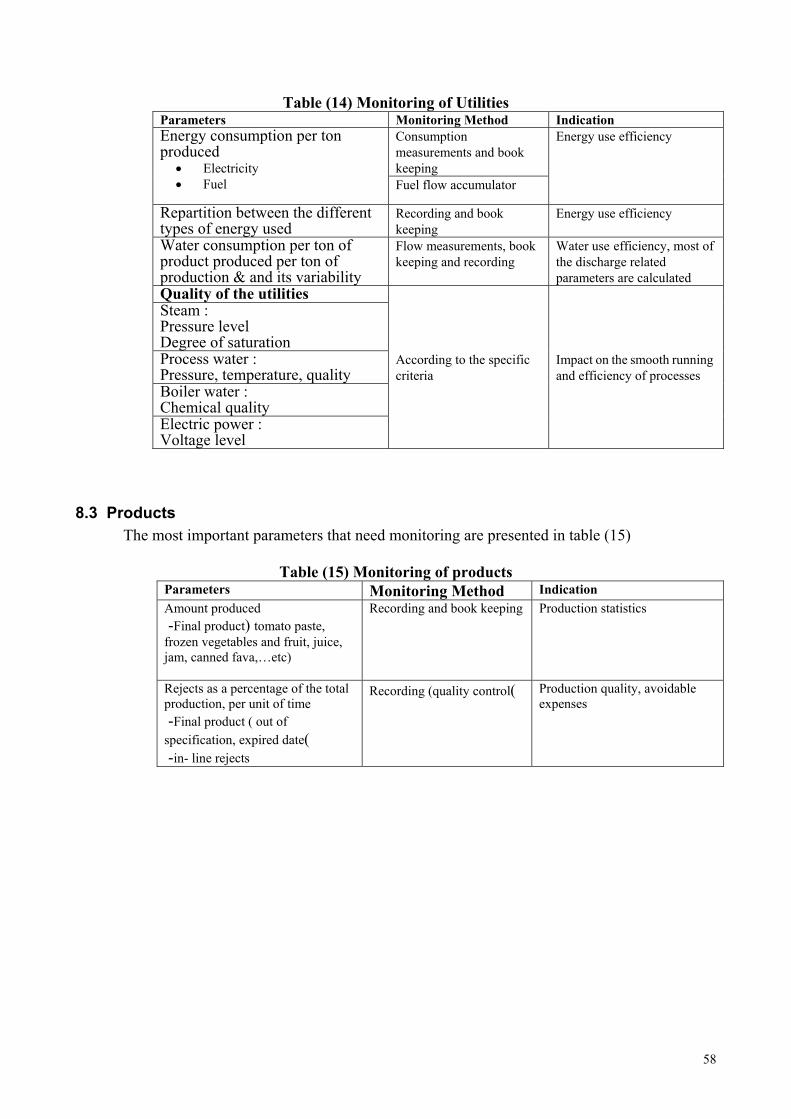
Table (14) Monitoring of Utilities
Parameters Monitoring Method Indication Consumption measurements and book keeping
Energy consumption per ton produced
• Electricity • Fuel Fuel flow accumulator
Energy use efficiency
Repartition between the different types of energy used
Recording and book keeping
Energy use efficiency
Water consumption per ton of product produced per ton of production & and its variability
Flow measurements, book keeping and recording
Water use efficiency, most of the discharge related parameters are calculated
Quality of the utilities Steam : Pressure level Degree of saturation
Process water : Pressure, temperature, quality
According to the specific criteria
Impact on the smooth running and efficiency of processes
Boiler water : Chemical quality
Electric power : Voltage level
8.3 Products The most important parameters that need monitoring are presented in table (15)
Table (15) Monitoring of products
Parameters Monitoring Method Indication Amount produced - Final product) tomato paste,
frozen vegetables and fruit, juice, jam, canned fava,…etc)
Recording and book keeping Production statistics
Rejects as a percentage of the total production, per unit of time - Final product ( out of
specification, expired date( - in- line rejects
Recording (quality control(
Production quality, avoidable expenses
58

9. OPERATION CONTROL
Processes should be operated at the optimum operating conditions to ensure the highest yield and productivity as well as product quality. Operation control deals with the control and monitoring of key parameters that affect environmental performance. These key parameters are monitored to minimize losses and therefore pollution. Planned maintenance is also important to minimize pollution and improve environmental performance.
9.1 Monitoring process parameters Table (16) presents the major processes in each production line and the parameters that should be monitored to minimize losses, maximizing productivity and predict maintenance needs.
59
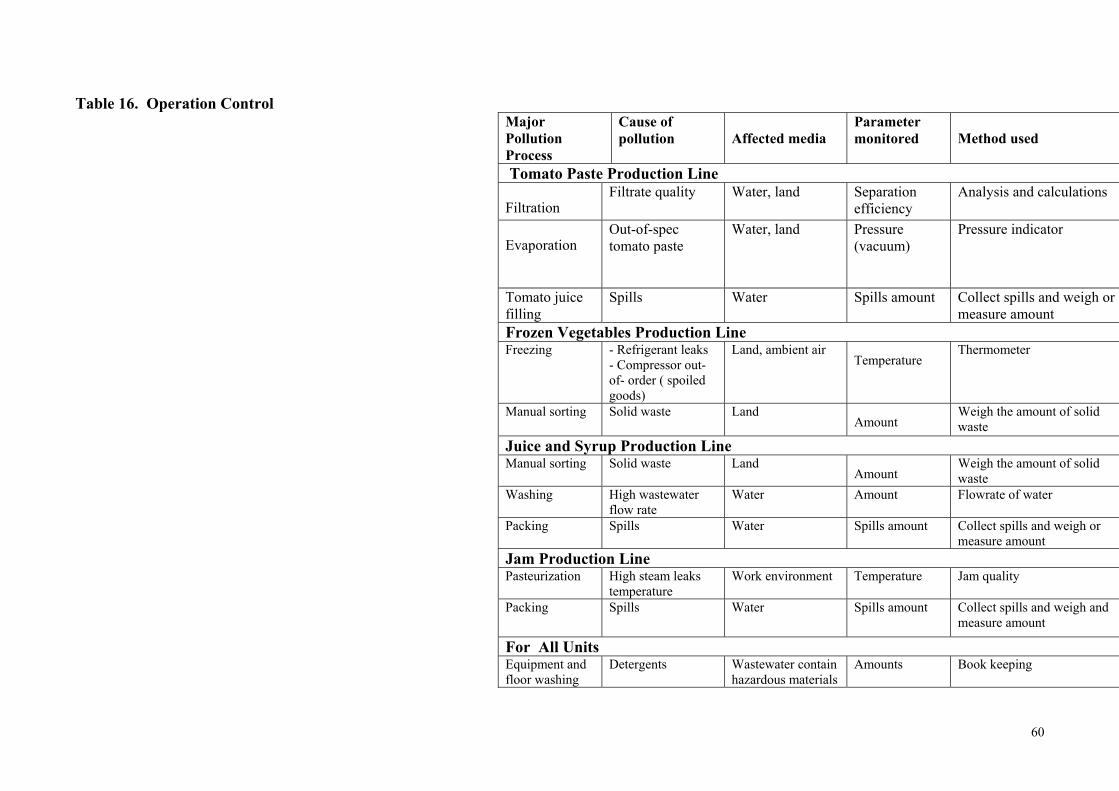
Table 16. Operation Control
Method usedParameter monitoredAffected media
Cause of pollution
Major Pollution Process Tomato Paste Production Line
Analysis and calculations Separation efficiency
Water, land Filtrate quality Filtration
Pressure indicator Pressure (vacuum)
Water, land Out-of-spec tomato pasteEvaporation
Collect spills and weigh or measure amount
Spills amount Water SpillsTomato juice fillingFrozen Vegetables Production Line
Thermometer Temperature
Land, ambient air - Refrigerant leaks - Compressor out- of- order ( spoiled goods)
Freezing
Weigh the amount of solid waste Amount
Land Solid waste Manual sorting
Juice and Syrup Production LineWeigh the amount of solid waste Amount
Land Solid waste Manual sorting
Flowrate of water Amount Water High wastewater flow rate
Washing
Collect spills and weigh or measure amount
Spills amount Water Spills Packing
Jam Production Line Jam quality Temperature Work environment High steam leaks
temperature Pasteurization
Collect spills and weigh and measure amount
Spills amount Water Spills Packing
For All UnitsBook keeping Amounts Wastewater contain
hazardous materials Detergents Equipment and
floor washing
60
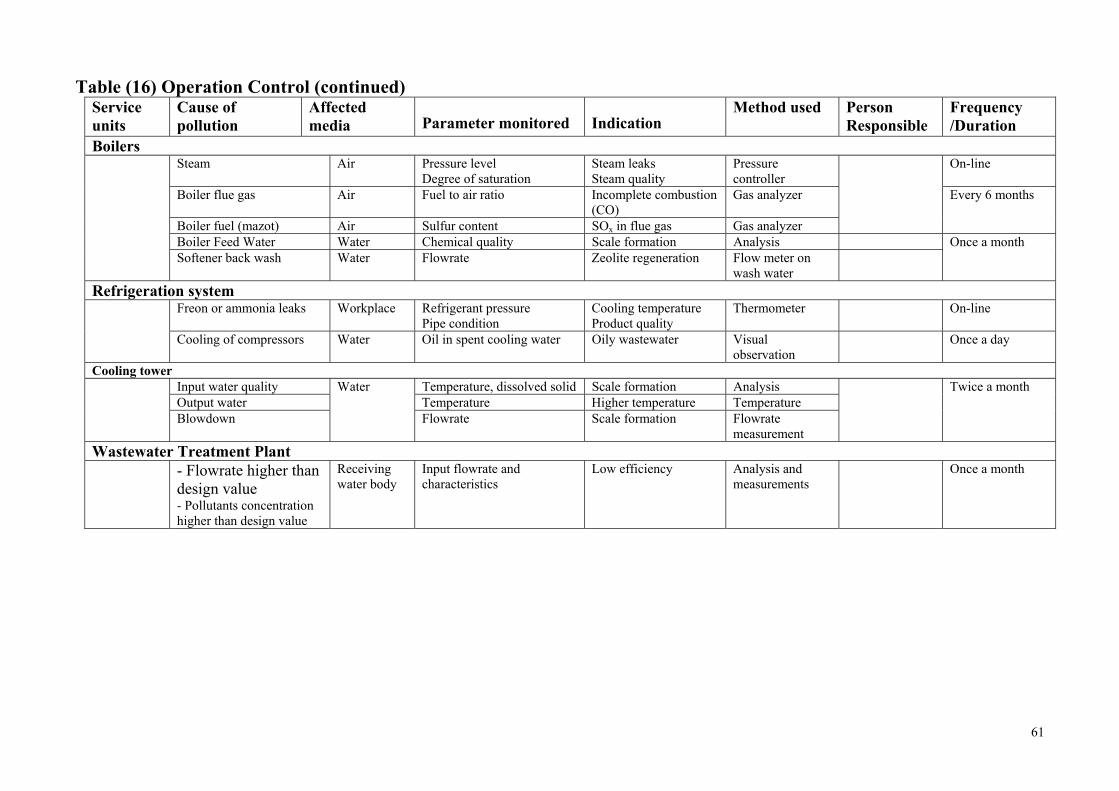
Table (16) Operation Control (continued) Service units
Cause of pollution
Affected media Parameter monitored Indication
Method used Person Responsible
Frequency /Duration
Boilers Steam Air Pressure level
Degree of saturation Steam leaks Steam quality
Pressure controller
On-line
Boiler flue gas Air Fuel to air ratio Incomplete combustion (CO)
Gas analyzer
Boiler fuel (mazot) Air Sulfur content SOx in flue gas Gas analyzer
Every 6 months
Boiler Feed Water Water Chemical quality Scale formation Analysis
Softener back wash Water Flowrate Zeolite regeneration Flow meter on wash water
Once a month
Refrigeration system Freon or ammonia leaks Workplace Refrigerant pressure
Pipe condition Cooling temperature Product quality
Thermometer On-line
Cooling of compressors Water Oil in spent cooling water Oily wastewater Visual observation
Once a day
Cooling tower Input water quality Temperature, dissolved solid Scale formation Analysis Output water Temperature Higher temperature Temperature
Blowdown
Water
Flowrate Scale formation Flowratemeasurement
Twice a month
Wastewater Treatment Plant - Flowrate higher than
design value - Pollutants concentration higher than design value
Receiving water body
Input flowrate and characteristics
Low efficiency Analysis and measurements
Once a month
61
9.2 Planned maintenance
Maintenance can be classified broadly into planned and emergency maintenance. Various types of planned activities (preventive, predictive) are undertaken with the basic objective of avoiding the need for emergency (breakdown) maintenance and the corresponding loss of plant profitability. The cost of an unscheduled breakdown resulting in loss of production can be substantial, and the cost of repairs may also be considerably higher than the cost of routine, planned maintenance of the equipment. A preventive maintenance program must include the following basic elements: • Inventory of equipment with detailed design and operating parameters. The
operating parameters are monitored as indicators for predictive maintenance. • A record of failure rate and causes • Evaluation of condition of equipment using the following criteria:
- Maintenance cost per unit of product - Downtime due to maintenance - Percent of planned maintenance hours as compared with emergency
maintenance • Determination of corrective actions.
It is clear from the above paragraph that maintenance is a pollution prevention measure as it increases the efficiency of the unit, minimizes water consumption by preventing leaks, helps conserve energy through proper maintenance of electric and mechanical equipment as well as insulation of steam pipes. Table (17) includes examples of the parameters that can be monitored. The following are examples of typical maintenance procedures for some service units operated in chemical plants:
Compressors and refrigeration systems
Routine checking should include: • Testing for leaks • Checking refrigerant charge • Checking oil level and lubrication
Boilers, steam lines, heaters and dryers
There are many items to be checked to prevent explosion, such as checking operating procedures, detection of flame failure, detection of unburned combustibles. With respect to energy conservation, the maintenance of steam traps, steam valves and insulation of steam lines is important. The following parameters should be monitored: • Water level in the boiler • Water quality to prevent the build up of scales that
reduce heat transfer rates • Temperature of metal, gas and water • Pressure • Fuel to air ratio • Check the fuel supply for leaks • Check air supply for leaks • Check the flue gas temperature.
62
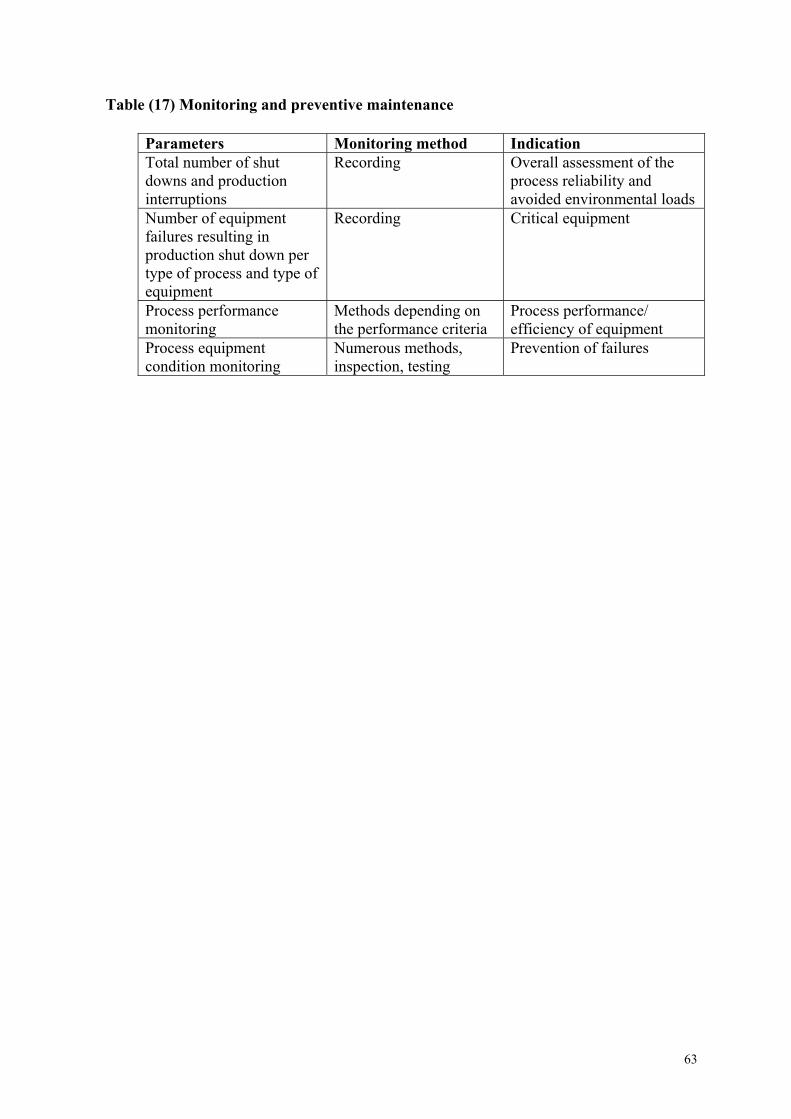
Table (17) Monitoring and preventive maintenance
Parameters Monitoring method Indication Total number of shut downs and production interruptions
Recording Overall assessment of the process reliability and avoided environmental loads
Number of equipment failures resulting in production shut down per type of process and type of equipment
Recording Critical equipment
Process performance monitoring
Methods depending on the performance criteria
Process performance/ efficiency of equipment
Process equipment condition monitoring
Numerous methods, inspection, testing
Prevention of failures
63
10. ENVIRONMENTAL MONITORING
Environmental monitoring covers emissions to air, effluent and solid and hazardous waste. Section 4 presents the various law and regulations that apply to emissions, effluents and wastes from the Fruit and Vegetables industry. Expected pollutants and hazardous releases from the industry are specified in section 2.4, Table (3). For each production line related pollution aspects are identified in section 2.2, Figures 2 -6. The pollution aspects of service units are presented in section 2.3 and Figure 7. The output from the measurements and analysis of the parameters are recorded in the environmental register of the facility. Table (18) presents the compliance monitoring activities for the different aspects of pollution as per environmental laws. Monitoring of pollutants and releases requires careful consideration of the techniques being used because of the expected effect on the interpretation and hence, the reliability of the collected data. The common techniques used in environmental monitoring will be explained in next section.
10.1 Emission to air Air emissions can be measured either on periodical or continuous basis. Periodical measurements: Periodical measurements give the state of emissions over the chosen sampling time. Quantities needed in every emission calculation, such as volume flow, oxygen content and humidity of the fume, are determined by periodical measurements. Periodical measurement results are also used as a support for converting the continuous concentration measurement results into annual emissions. Periodical measurements are carried out as manual single measurements or as short period continuous measurements by the plant itself or by an exterior measurer. Periodical emission measurements are carried out annually for the following emission components: NOx,SO2, CO,CO2, Cl and particles. In all cases, it should be noted that regular maintenance, control and calibration are needed to obtain an acceptable measurement accuracy level. Continuous measurements: The continuous measurements describe the temporal variation of the concentrations of the emission components during the operation. General requirements for continuous monitoring systems are that the sampling locations should be representative and that the monitoring equipment should be suitable for the concentrations to be monitored in the prevailing circumstances. The emission control data system should preferably be part of the process control system Sulfur dioxide, TRS, particles, carbon oxide are generally measured continuously. Emission calculation: Differences between the different calculation methods can cause mistakes when comparing the environmental loads of different plants. Material balance calculations are used to complete emission measurements in order to get an impression of the reliability of the measurement results as well as to create a general view of the total emission level of each component. The amount of diffuse emissions that cannot be recorded by emission measurements can be substantial.
64
10.2 Effluents (wastewater) The regulations set the limits for the concentrations of specific pollutants of in wastewater when discharged to a recipient body. For monitoring purposes, the discharge values for specific substances or parameters are mostly expressed as total amounts per unit time. In some cases these values are given as specific amounts per ton of product or as purification efficiencies. Limit values are set for a large number of parameters such as COD/BOD5, TSS, phosphorus and nitrogen. Monitored control parameters: Typical wastewater control parameters include the following:
� Wastewater flow (Q), m3/d � Total suspended solids (TSS), mg/l � Temperature, ˚C � Chemical oxygen demand (CODCr) � Biological oxygen demand (BOD5) � Total nitrogen (N), mg/l � pH � Conductivity, mS/m
Flow measurement: Measuring of the total wastewater flow is required for the operation of the wastewater treatment plant. There have been no provisions on the procedures or the accuracy of a flow measurement, but installation of automatic composite samplers (preferable flow dependent) can be used. Wastewater flow is usually measured with venture measurement equipment, but also magnetic and ultrasonic methods are used. Measurement equipment is maintained several times a year and the measurement system is calibrated regularly. Regular maintenance, control and calibration are needed to obtain an acceptable measurement accuracy level. The structure of the measurement system, a possible mounting fault or a false choice for measurement area can cause errors. Other sources of error or factors disturbing the measurement are dirt deposition and temperature variations. Evaluation of the total error is extremely difficult, as it must include all these factors. Sampling: Well realized sampling is essential for determining of wastewater discharges. There are general instructions for wastewater sampling. However, industry-specific problems such as variation of the wastewater quality or flow rate have to be solved on case-by-case basis.
65
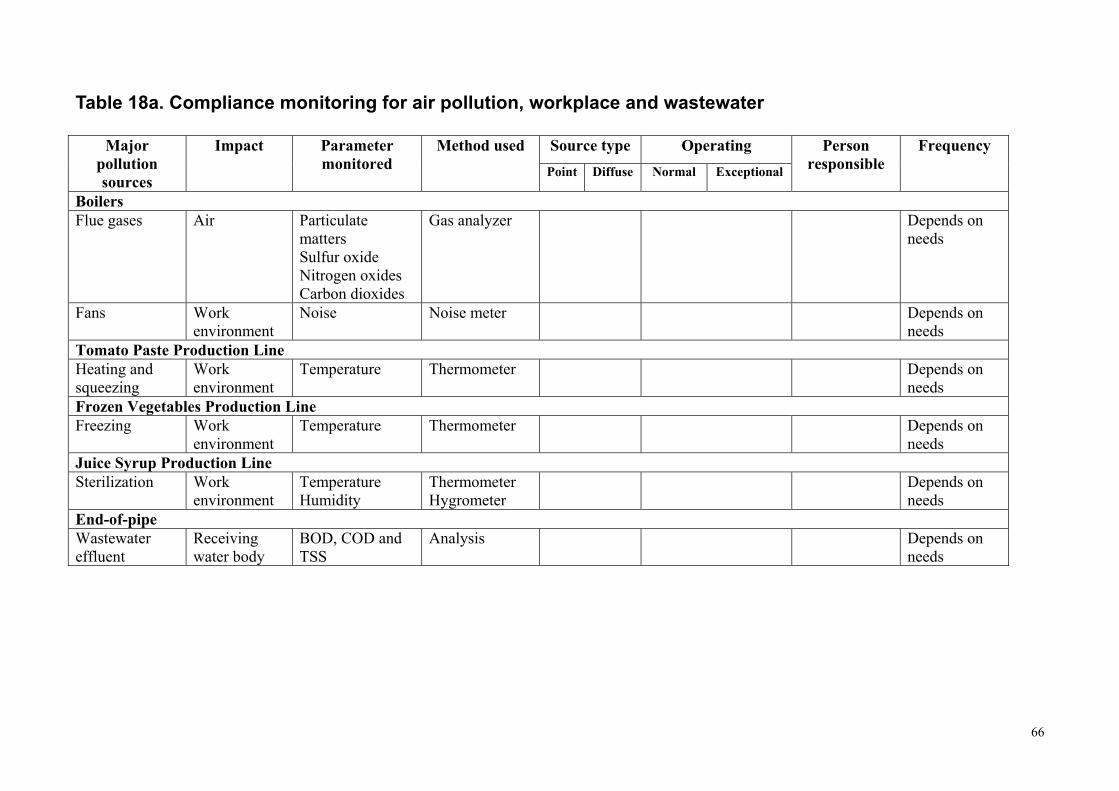
Table 18a. Compliance monitoring for air pollution, workplace and wastewater
Source type Operating Major pollution sources
Impact
Parametermonitored
Method used Point Diffuse Normal Exceptional
Person responsible
Frequency
Boilers Flue gases Air Particulate
matters Sulfur oxideNitrogen oxidesCarbon dioxides
Gas analyzer Depends on needs
Fans Workenvironment
Noise Noise meter Depends on needs
Tomato Paste Production Line Heating and squeezing
Work environment
Temperature
Thermometer Depends on needs
Frozen Vegetables Production Line Freezing Work
environment Temperature Thermometer Depends on
needs Juice Syrup Production Line Sterilization Work
environment Temperature Humidity
Thermometer Hygrometer
Depends onneeds
End-of-pipe Wastewater effluent
Receiving water body
BOD, COD and TSS
Analysis Depends onneeds
66
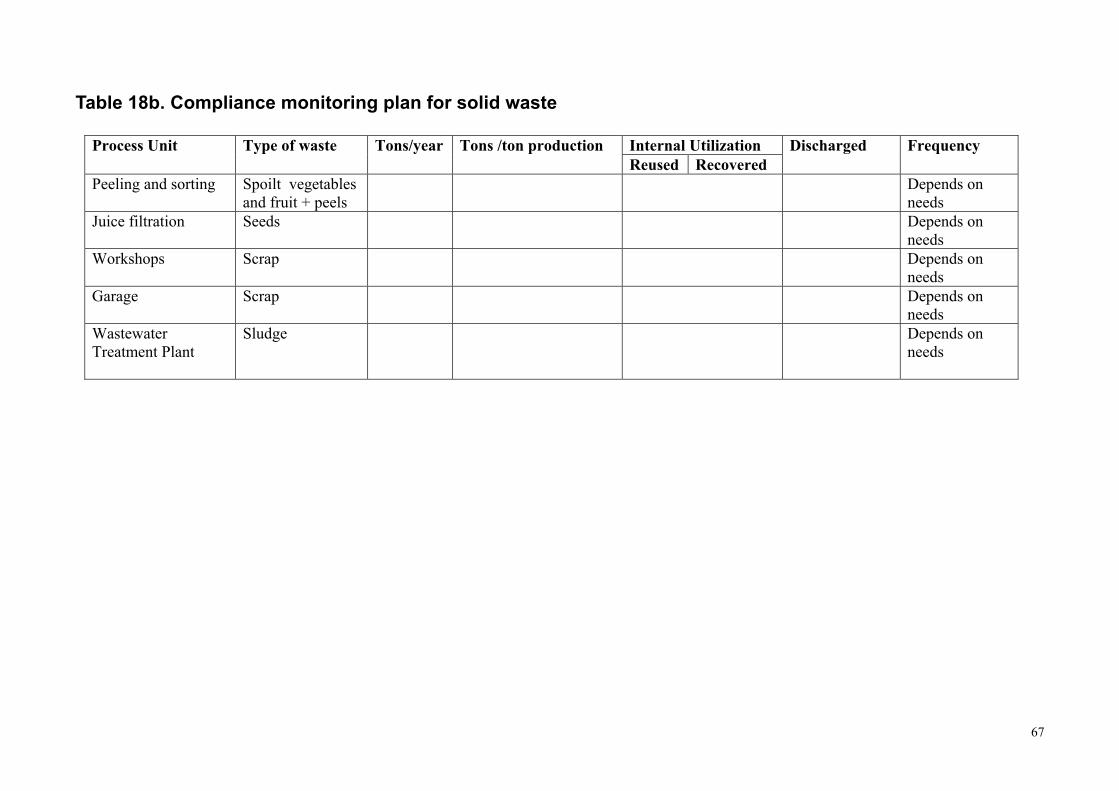
Table 18b. Compliance monitoring plan for solid waste
Internal Utilization Process Unit
Type of waste Tons/year Tons /ton production Reused Recovered
Discharged Frequency
Peeling and sorting
Spoilt vegetables and fruit + peels
Depends on needs
Juice filtration
Seeds Depends on needs
Workshops
Scrap Depends on needs
Garage
Scrap Depends on needs
Wastewater Treatment Plant
Sludge Depends on needs
67
Samples are either single grab samples, composite samples, or composite samples in proportion to the flow. A single grab sample reveals the composition of the wastewater at the sampling time. With several single samples it is possible to follow the wastewater load peaks, quality variation and the variation range of the significant parameters. A composite sample reveals the average composition over a chosen period. A 24-hour composite sample is normally taken in proportion to the flow so that the sampler is controlled by flow meter. Sampling period and sample size should be considered on case-by-case basis depending on the analyses used and on the issues affecting the reliability of sampling and analyses. Samples for wastewater analysis are mostly taken over 24 hours, 5-7 days a week. In some cases samples are frozen and combined to cover a longer period. Samples for COD and suspended solid determination are taken daily or continuously and analyzed daily. Samples for BOD and nutrient determination are usually taken weekly. pH and conductivity are usually measured continuously. Analyses: A specific analysis program may be needed for each plant. The program usually covers a wide range of measurements and analyses, as predetermined in the self-monitoring plan. The measurements and analyses should be carried out according to the standards recommended by the authorities.
10
It is important to mention that in year 2000, EEAA/Central Laboratories developed a document detailing all the standard sampling and analysis techniques for wastewater.
Calculations: Wastewater discharges are calculated and reported as specified in the monitoring plan. Discharges are often calculated as below:
Discharge per day The arithmetic mean value of the daily samples taken during one month divided by the number of sampling days
Discharge per month Daily discharge multiplied by calendar days Discharge per year Sum of the values of monthly discharges
The efficiency of biological wastewater treatment is also controlled by calculating the reduction of organic matter (BOD, COD) between untreated wastewater before primary sedimentation and treated wastewater after secondary clarification. A typical wastewater discharge monitoring report includes e.g. monthly mean values and variations for discharges at the monitoring points before and after the treatment, applicable limit values and also some production information.
.3 Monitoring of solid waste The properties of solid wastes that are generated, especially when they are utilized or taken to a landfill, have to be investigated. The general principles in landfill operation are that the composition, leachability, long-term behavior and the properties of the waste. The approval for using a landfill for a specific waste is based on the origin and the properties of the waste. The evaluation of the waste is based on the following: � The composition of the waste � The organic content and degradation properties of the waste, � The content and leachability of harmful compounds, and � The ecotoxicological effects of the waste and the landfill waters
68
11. DATA COLLECTION, PROCESSING AND USAGE
The general objective for the self-monitoring system is to produce data that is representative, repeatable, reliable, compatible and comparable. These characteristics are dependent on the applied measures for quality control and quality assurance throughout the data production chain i.e. volume determination, sampling, sample pretreatment, treatment and analysis, data processing and reporting.
11.1 Data collection and processing
The different parts of the monitoring system of a plant include diverse factors affecting the reliability and comparability of the emission data. These factors have to be taken into consideration in sampling, sample treatment and analysis as well as in processing and reporting of the data. Requirements for the whole data production chain should be set in the monitoring program. In addition, implementation of the relevant measures for quality control and quality assurance is extremely important in obtaining maximum reliability, repeatability and comparability. The aspects and parameters that are involved in data collection and processing are explained in the Annex A. Figure (10) shows the main aspects and parameters that affect the effectiveness of SM in terms of reliability, repeatability and comparability.
11.2 Using SM outputs
The implementation of the self-monitoring plan will basically result in three outputs: • Data and information about the facility • Preparing the environmental register as required by law. • Reports describing results of the self-monitoring and problems faced during
implementation • Feed back and decision making
11.2.1 Techniques for summarizing and illustrating data
It is best practice to record process and environmental information in a detailed archive or database. It can then be related easily to the monitoring results and used to evaluate, compare and manage aspects of process performance such as: • the rate of release of pollutants compared to production • the rate of generation of waste compared to production • the rate of consumption of energy and/or materials compared to production • the impacts on environmental receptors compared to production or to their
sensitivity • the overall resource efficiency of the process, i.e. production compared to
inputs or raw materials and energy, and outputs of pollutants and waste There are many techniques used in the interpretation of results (e.g. statistical analysis of the measurement results, reduction of operating conditions to normal conditions when monitoring gaseous emissions).
69
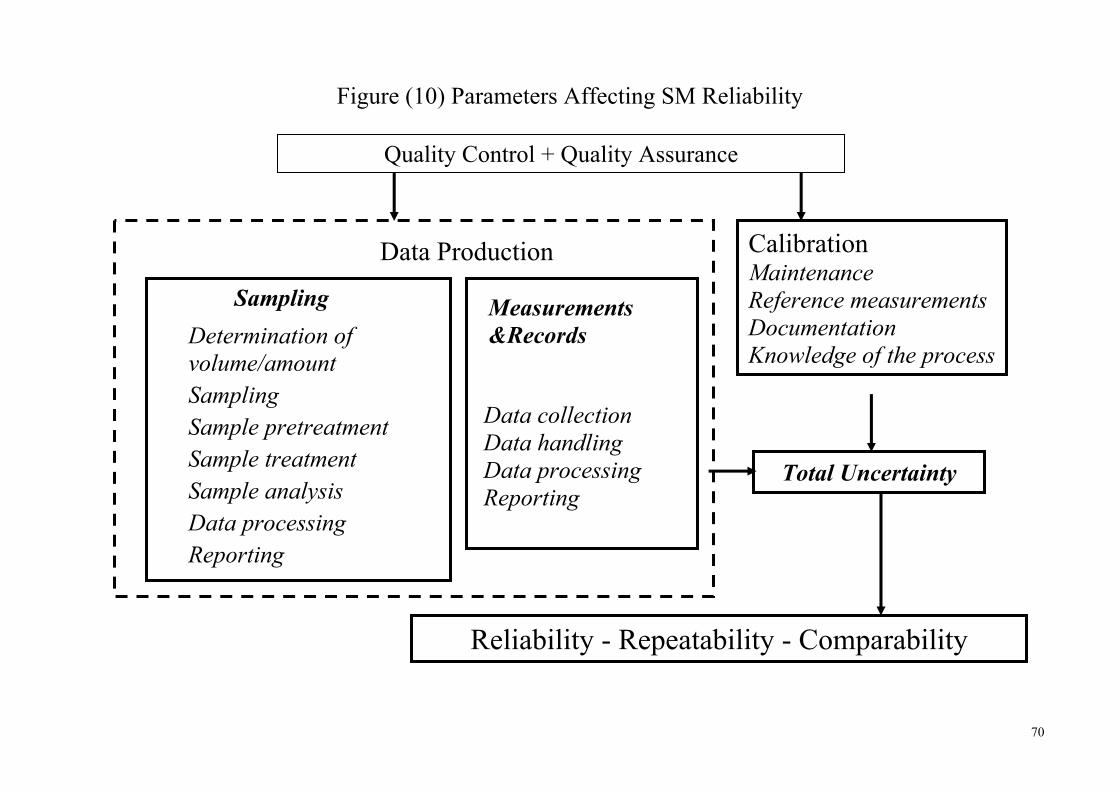
Figure (10) Parameters Affecting SM Reliability
Data Production
SamplingDetermination of volume/amount Sampling Sample pretreatment Sample treatment Sample analysis Data processing Reporting
Measurements &Records
Reliability - Repeatability - Comparability
Quality Control + Quality Assurance
Data collection Data handling Data processing Reporting
Calibration Maintenance Reference measurements Documentation Knowledge of the process
Total Uncertainty
70
11.2.2. Environmental register Only monitoring data related to compliance will be included in the environmental register. Description of the measuring and/or analytical techniques used should be reported as well as the location of sampling and measuring. EEAA/EPAP prepared a detailed description of the environmental register, based on the requirements of law 4/1994, see Annex B. The competent authorities could request the inspection of the measuring devices to check their operability and the maintenance record for these devices. The procedures for taking samples could also be checked by the inspector. The inspectors check whether the facility has provided information that is relevant and of sufficient quality. To assess compliance, a simple numerical or statistical comparison between the measurements, their uncertainty and the limit value is performed. According to Law 4/1994, compliance self-monitoring data should be recorded and kept for a minimum of 10 years.
11.2.3. Reporting Description of the reporting scheme, its content, recipient and purpose should be included in the self-monitoring plan. A monitoring report is a uniform presentation of data over a fixed period. An annual monitoring report that provides information of the past calendar year is always required. Shorter period reports are required for significant polluters. The conditions of the process and equipment as well as location of monitoring points should be specified. Reporting can be: • Internal to inform management and raise the environmental awareness of the
facility personnel. It should include problems met during the implementation of the SM plan to be used in decision making. • External for the competent authority based on the environmental register,
establishments are required to report on environmental violations.
11.2.4. Internal auditing and conclusions on results The data obtained must be compared regularly with the objectives written down in the monitoring program to check that they are being met.
11.2.5. Feedback and decision making Feedback on the assessment of compliance based on the monitoring results should include all parties involved with the monitoring activities. The participants should make the necessary improvements and corrections to the next monitoring program. In those parts of the monitoring program where compliance is met, possible reduction in frequency of monitoring can be considered and instead move resources to parts that need more accurate monitoring, e.g. borderline or non-compliance situations. Feedback should include all parts of the monitoring program, process, product control, maintenance, environmental management and occupational safety. Detailed requirements should be set for the improvements needed and a date fixed for their implementation.
71

11.2.6. Using outputs in public relations The monitoring data is refined and distributed to the end users such as national and international reporting, research and statistical purposes, citizens, and the media. The citizens have the right to present complaints about the health or environmental impacts caused by the operation these complaints are directed to the permitting and supervising authority. Monitoring data is needed e.g. in national research and statistics, for planning and evaluation purposes, by national group organizations and the media.
72
Annex A
DATA COLLECTION AND PROCESSING
The general objective for the self-monitoring system is to produce data that is representative, repeatable, reliable, compatible and comparable. These characteristics is dependent on the applied measures for quality control and quality assurance throughout the data production chain i.e. volume determination, sampling, sample pretreatment, treatment and analysis, data processing and reporting. Data production chain is explained in Section 3.
1 Reliability
The realism and correctness of the measurement results should be assessed against the knowledge of the processes and inputs, e.g. by using mass balance calculations. Good knowledge of the process: This is essential for achieving reliable emission data. Process input variations can include varying properties of the raw material, chemicals or fuel used in the processes, and the size of the input. The interdependency between the inputs, processes and outputs (products and environmental load) should be known to be able to assess the correctness of the monitoring results. Total uncertainty: The results obtained from any measurement have a specific uncertainty. It is important that the uncertainty is estimated and taken into account when the results are used in process management or for regulatory purposes. For example, the measurement result 10 g/t ± 2 g/t indicates that the uncertainty for this specific measurement is 20 % of the measured value. Each step of the data production chain has an uncertainty and the total uncertainty of the measurement is the sum of these partial uncertainties. Uncertainty of each step of the data production chain must be known in order to be able to give the uncertainty of the final results, i.e. the uncertainty of the whole data production chain. When assessing the measurement uncertainty it is good to keep in mind that the factors causing measurement error can also affect each other. Calibration and maintenance have to be carried out according to the relevant instructions and the management of them must be documented. Reference measurements are carried out to certify the reliability of the measurements in practice. Results of an independent and neutral measurement laboratory are compared with the operator or consultant monitoring results. Reference measurements should be carried out regularly.
2 Comparability
Monitoring systems at the individual plants differ according to the scale, production, capacity or economic aspects of the operation. Data on necessary auxiliary measures and good documentation of the measurement procedure improves both the comparability and reliability of the results. All reference data, i.e. auxiliary measures
73
and reference data (inputs and outputs) should be clearly defined in the monitoring program or permit according to the nationally and internationally used standards and guidelines.
3 Data Production Chain
The different parts of the monitoring system of a plant include diverse factors affecting the reliability and comparability of the emission data. These factors have to be taken into consideration in sampling, sample treatment and analysis as well as in processing and reporting of the data. Requirements for the whole data production chain should be set in the monitoring program.
Data Production Chain: The data production chain includes the following phases: • Determination of volume/amount • Sampling • Sample pretreatment • Sample treatment • Sample analysis • Data processing • Reporting
Determination of volume/amount: The accuracy of determination of the volume of the release has a substantial impact on magnitude of the total emissions. Variations in the volume measurement results can be caused either by variations in the flow of the emission or in the accuracy of the measurement. Measurement of volume flow or amount of the emission can be continuous, periodic or single.
Sampling: Continuous emission analysis includes sampling, sample pretreatment, sample treatment and analysis. Variations in the process or emission treatment affect also the quantity and quality of the sample. Both sampling conditions and the sampling point must be representative. Measurement of emission concentration can be continuous, periodic or single. The sample must be representative in relation to the measurement point, emission flow/amount, sampling period and time period. Sample pretreatment: Sample pretreatment includes all treatment of the sample before it is taken to the laboratory. The need for sample pretreatment is determined by the needs to protect the substance to be determined from any changes before analysis. Usually the appropriate pretreatment method is presented in the standards. Sample treatment: Sample treatment includes operations in the laboratory before analysis, such as dilution, concentration, pH adjustment, adding of reagents. Sample treatment is usually carried out according to standards or specific method instructions. The treatment methods used should be documented. Sample analysis: Sample analysis includes physical, chemical or biological determination of the parameter. Figures presented in emission reporting are not always comparable, without describing the analysis methods used.
74
Data processing: The calculation methods for the emission data are process specific and their function is to give as true load data for the specific process as possible. The correspondences of the equations to the reality must be checked from time to time and automatically in cases of any changes having an impact on them. The following general rules for emission calculation need to be determined and used nationally to harmonize the methods: • calculation methods for the peak of an hour, calendar day, monthly/annual
means • amount of emission data needed for calculation of the annual mean of the
emission • exceeding times, i.e. percentage of time of the exceptional emissions of the
total operation time • utilization rate for the continuous measurements, i.e. percentage of time
during which the measurement system has not been available of the total operation time • calculation formulas used for data conversion into reference conditions • conversion factors used for data conversion between different units • calculation methods for total emissions over a certain period
Reporting: Data reporting should include sufficient data on the parameters, pollutants and other measures that are defined in the monitoring plan. The data to be reported should be presented in the form required with all the additional information and documentation.
A monitoring report is a uniform presentation of the emission data over a fixed period. An annual monitoring report-providing information of the past calendar year is always required. In case of large industrial sites, shorter period reports are demanded (a monthly report or a report over 3, 4 or 6 months). Emission data must be presented in a form easy to compare with the given emission limits. The following data is needed for reporting:
• The emission parameters and pollutants are reported with all the relevant the
reference parameters, auxiliary measures and uncertainties expressed as required in the monitoring program in one or more of the following forms:
- Specific emissions (ton / ton of production): used for assessing performance
or efficiency - Total emissions (t/ year) : used for assessing the environmental load - Concentration (mg / m3, PPM, % O2): used for e.g. operation control - Flow rate (m/s): used for e.g. velocity/rate for flue gas/effluent - Residence time (s): used e.g. for assessing completeness of combustion - Temperature (0C): requirements for controlling certain exhaust pollutants. - Heat (W): thermal stress in the recipient - The exceptional and diffuse emissions are included in the total emissions of
the period. • Operation control data should be available to the authority. • Utilization rate of the measurement system is expressed e.g. as percentage of
the process operation time. • Documentation of the reference measurements.
75
4 Quality control and quality assurance
Quality control is a system of routine technical activities to measure and control the quality of monitoring data as it is being produced. QC includes e.g. checking of equipment, methods and procedures, and that the monitoring system is regularly calibrated and maintained. The relevant instruments personnel and analytical laboratories should be certified under recognized schemes. Quality assurance includes a system of reviewing the implementation of the quality system by personnel not directly involved in the monitoring process. QA reviews verify that the quality objectives are met and ensures that the monitoring carried out represents the best available results. Guidelines for the below listed factors help to harmonize the practical factors at site level. The monitoring plan can determine the listed factors even in details. If the plant or the laboratory uses a sub-supplier in any step of the data production chain, the competence of the sub-supplier has to be checked, too. Quality system work involves the following processes:
Data production chain Maintenance and calibration Certification and Accreditation
76
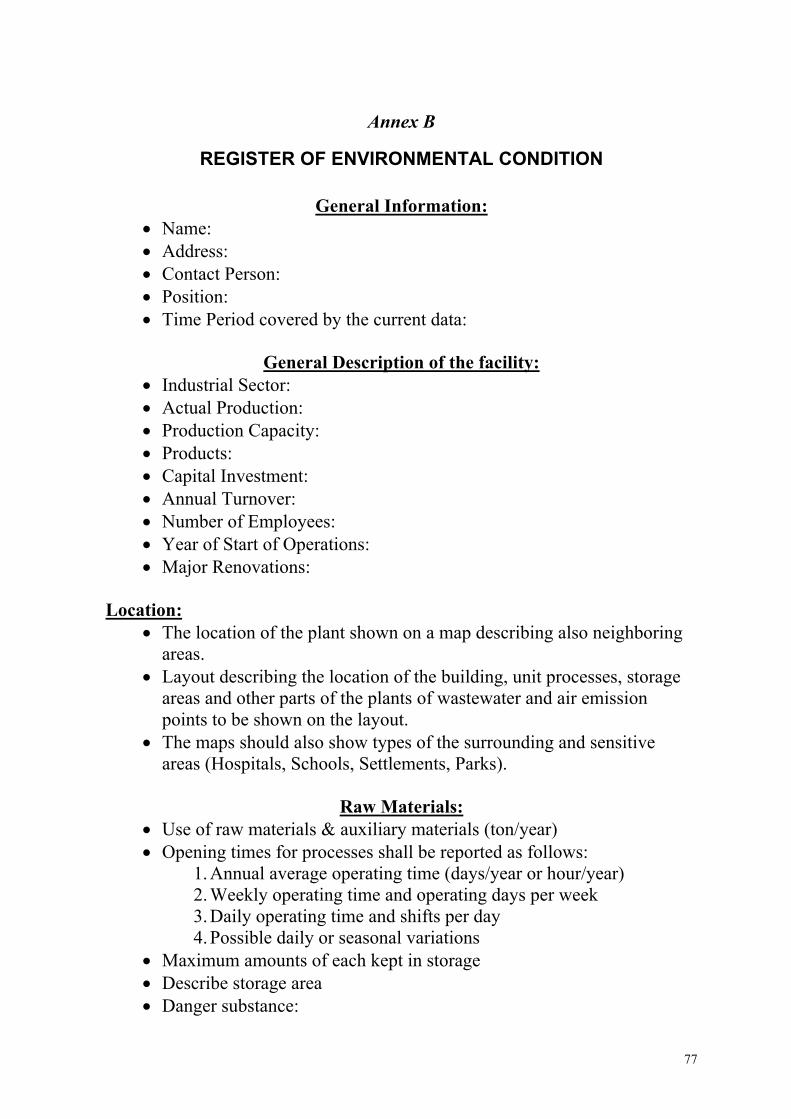
Annex B
REGISTER OF ENVIRONMENTAL CONDITION
General Information: • Name: • Address: • Contact Person: • Position: • Time Period covered by the current data:
General Description of the facility:
• Industrial Sector: • Actual Production: • Production Capacity: • Products: • Capital Investment: • Annual Turnover: • Number of Employees: • Year of Start of Operations: • Major Renovations:
Location:
• The location of the plant shown on a map describing also neighboring areas.
• Layout describing the location of the building, unit processes, storage areas and other parts of the plants of wastewater and air emission points to be shown on the layout.
• The maps should also show types of the surrounding and sensitive areas (Hospitals, Schools, Settlements, Parks).
Raw Materials:
• Use of raw materials & auxiliary materials (ton/year) • Opening times for processes shall be reported as follows:
1. Annual average operating time (days/year or hour/year) 2. Weekly operating time and operating days per week 3. Daily operating time and shifts per day 4. Possible daily or seasonal variations
• Maximum amounts of each kept in storage • Describe storage area • Danger substance:
77
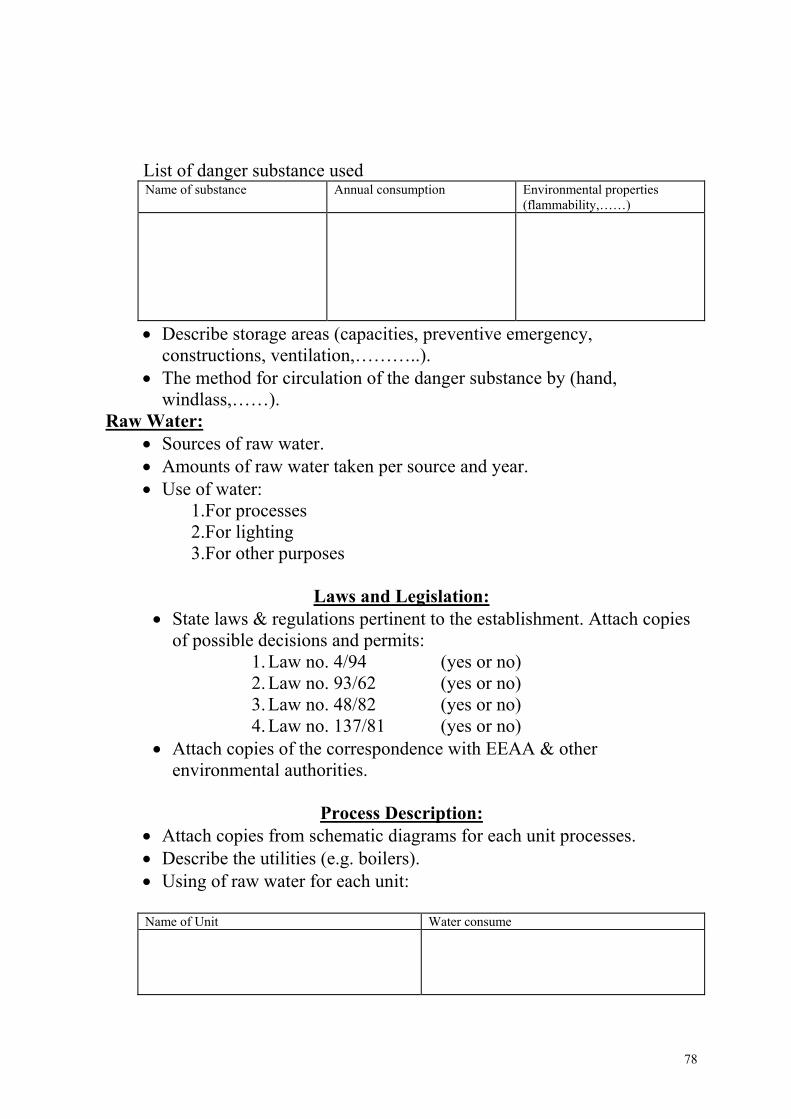
List of danger substance used Name of substance Annual consumption Environmental properties
(flammability,……)
• Describe storage areas (capacities, preventive emergency, constructions, ventilation,………..).
• The method for circulation of the danger substance by (hand, windlass,……).
Raw Water: • Sources of raw water. • Amounts of raw water taken per source and year. • Use of water:
1.For processes 2.For lighting 3.For other purposes
Laws and Legislation:
• State laws & regulations pertinent to the establishment. Attach copies of possible decisions and permits:
1. Law no. 4/94 (yes or no) 2. Law no. 93/62 (yes or no) 3. Law no. 48/82 (yes or no) 4. Law no. 137/81 (yes or no)
• Attach copies of the correspondence with EEAA & other environmental authorities.
Process Description:
• Attach copies from schematic diagrams for each unit processes. • Describe the utilities (e.g. boilers). • Using of raw water for each unit:
Name of Unit Water consume
78
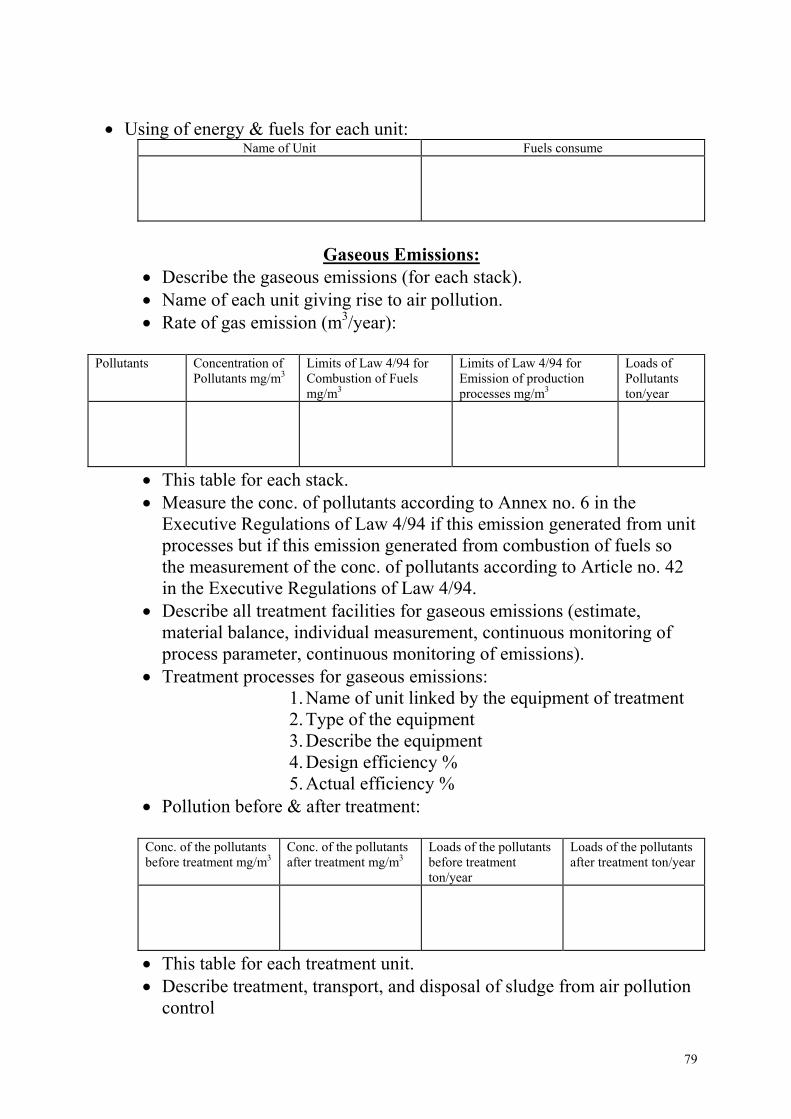
• Using of energy & fuels for each unit:
Name of Unit Fuels consume
Gaseous Emissions:
• Describe the gaseous emissions (for each stack). • Name of each unit giving rise to air pollution. • Rate of gas emission (m3/year):
Pollutants Concentration of Pollutants mg/m3
Limits of Law 4/94 for Combustion of Fuels mg/m3
Limits of Law 4/94 for Emission of production processes mg/m3
Loads of Pollutants ton/year
• This table for each stack. • Measure the conc. of pollutants according to Annex no. 6 in the
Executive Regulations of Law 4/94 if this emission generated from unit processes but if this emission generated from combustion of fuels so the measurement of the conc. of pollutants according to Article no. 42 in the Executive Regulations of Law 4/94.
• Describe all treatment facilities for gaseous emissions (estimate, material balance, individual measurement, continuous monitoring of process parameter, continuous monitoring of emissions).
• Treatment processes for gaseous emissions: 1. Name of unit linked by the equipment of treatment 2. Type of the equipment 3. Describe the equipment 4. Design efficiency % 5. Actual efficiency %
• Pollution before & after treatment:
Conc. of the pollutants before treatment mg/m3
Conc. of the pollutants after treatment mg/m3
Loads of the pollutants before treatment ton/year
Loads of the pollutants after treatment ton/year
• This table for each treatment unit. • Describe treatment, transport, and disposal of sludge from air pollution
control
79
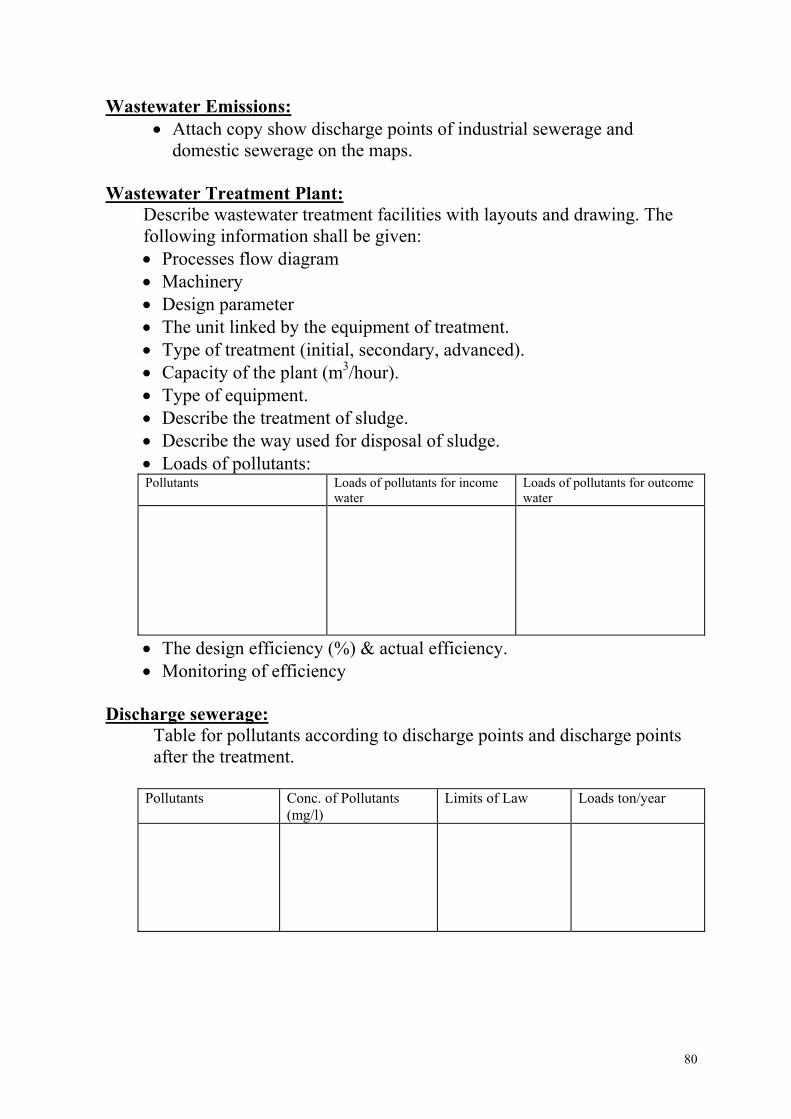
Wastewater Emissions: • Attach copy show discharge points of industrial sewerage and
domestic sewerage on the maps. Wastewater Treatment Plant:
Describe wastewater treatment facilities with layouts and drawing. The following information shall be given: • Processes flow diagram • Machinery • Design parameter • The unit linked by the equipment of treatment. • Type of treatment (initial, secondary, advanced). • Capacity of the plant (m3/hour). • Type of equipment. • Describe the treatment of sludge. • Describe the way used for disposal of sludge. • Loads of pollutants: Pollutants Loads of pollutants for income
water Loads of pollutants for outcome water
• The design efficiency (%) & actual efficiency. • Monitoring of efficiency
Discharge sewerage:
Table for pollutants according to discharge points and discharge points after the treatment.
Pollutants Conc. of Pollutants
(mg/l) Limits of Law Loads ton/year
80
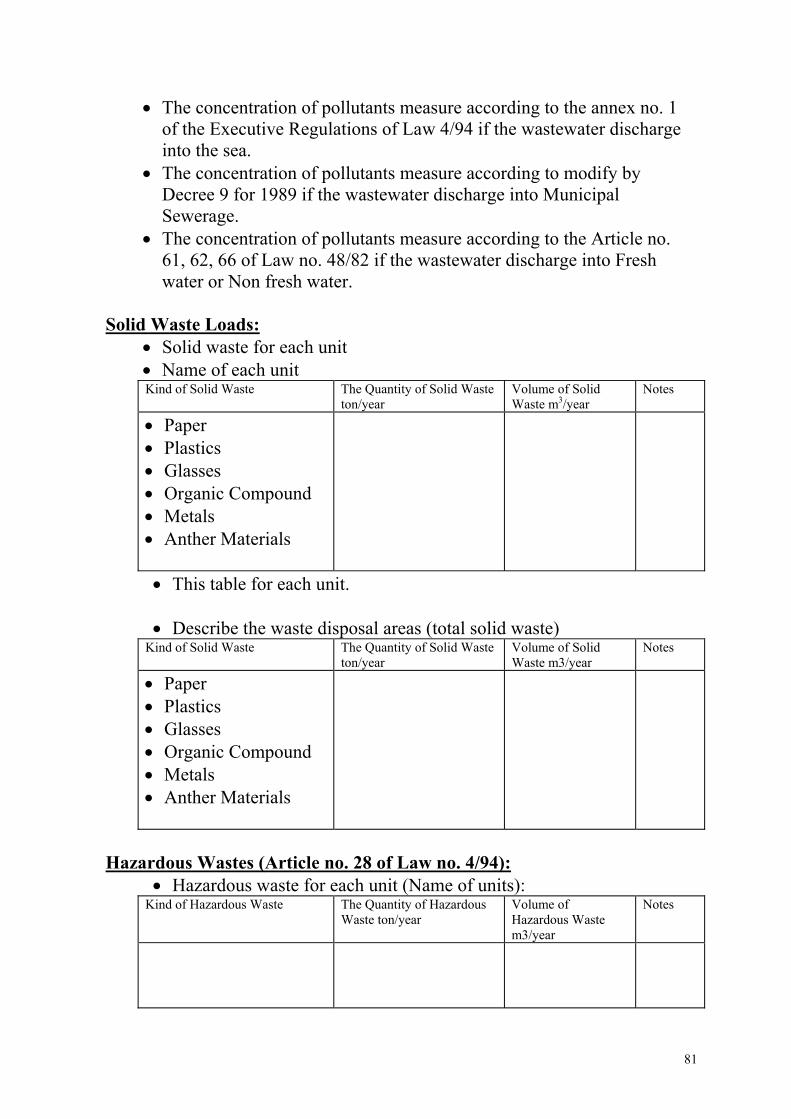
• The concentration of pollutants measure according to the annex no. 1 of the Executive Regulations of Law 4/94 if the wastewater discharge into the sea.
• The concentration of pollutants measure according to modify by Decree 9 for 1989 if the wastewater discharge into Municipal Sewerage.
• The concentration of pollutants measure according to the Article no. 61, 62, 66 of Law no. 48/82 if the wastewater discharge into Fresh water or Non fresh water.
Solid Waste Loads:
• Solid waste for each unit • Name of each unit Kind of Solid Waste The Quantity of Solid Waste
ton/year Volume of Solid Waste m3/year
Notes
• Paper • Plastics • Glasses • Organic Compound • Metals • Anther Materials
• This table for each unit.
• Describe the waste disposal areas (total solid waste) Kind of Solid Waste The Quantity of Solid Waste
ton/year Volume of Solid Waste m3/year
Notes
• Paper • Plastics • Glasses • Organic Compound • Metals • Anther Materials
Hazardous Wastes (Article no. 28 of Law no. 4/94):
• Hazardous waste for each unit (Name of units): Kind of Hazardous Waste The Quantity of Hazardous
Waste ton/year Volume of Hazardous Waste m3/year
Notes
81
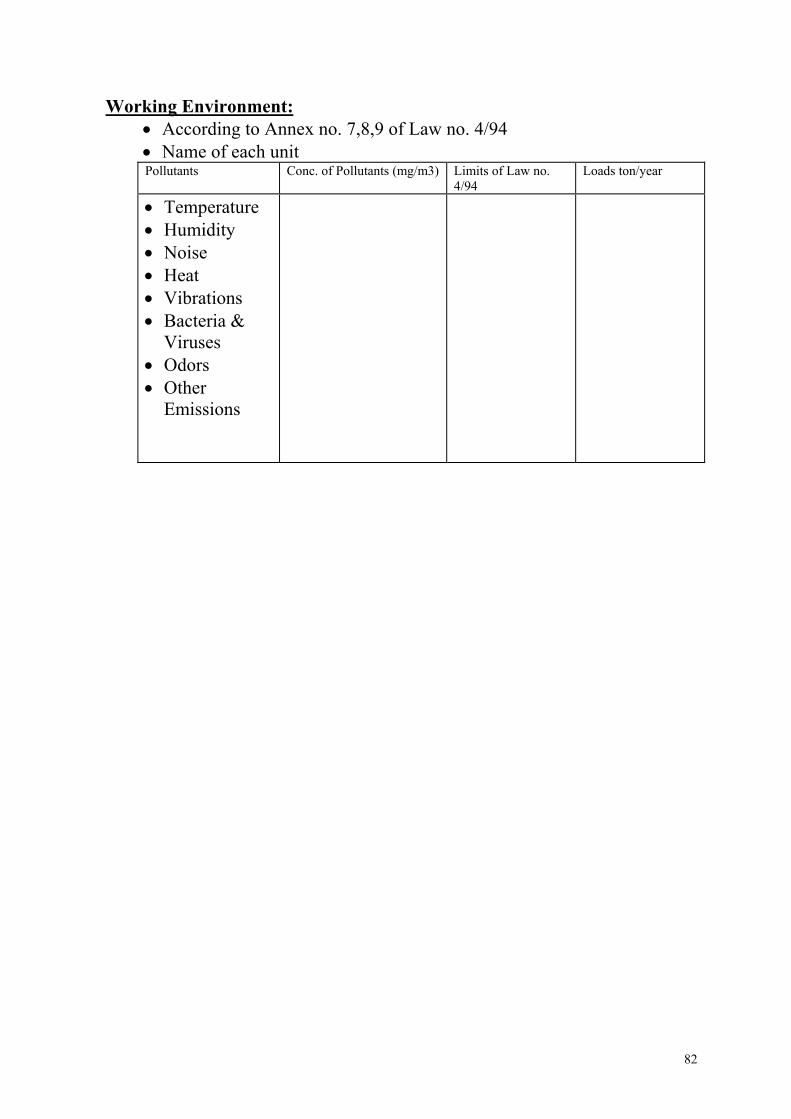
Working Environment: • According to Annex no. 7,8,9 of Law no. 4/94 • Name of each unit Pollutants Conc. of Pollutants (mg/m3) Limits of Law no.
4/94 Loads ton/year
• Temperature • Humidity • Noise • Heat • Vibrations • Bacteria &
Viruses • Odors • Other
Emissions
82
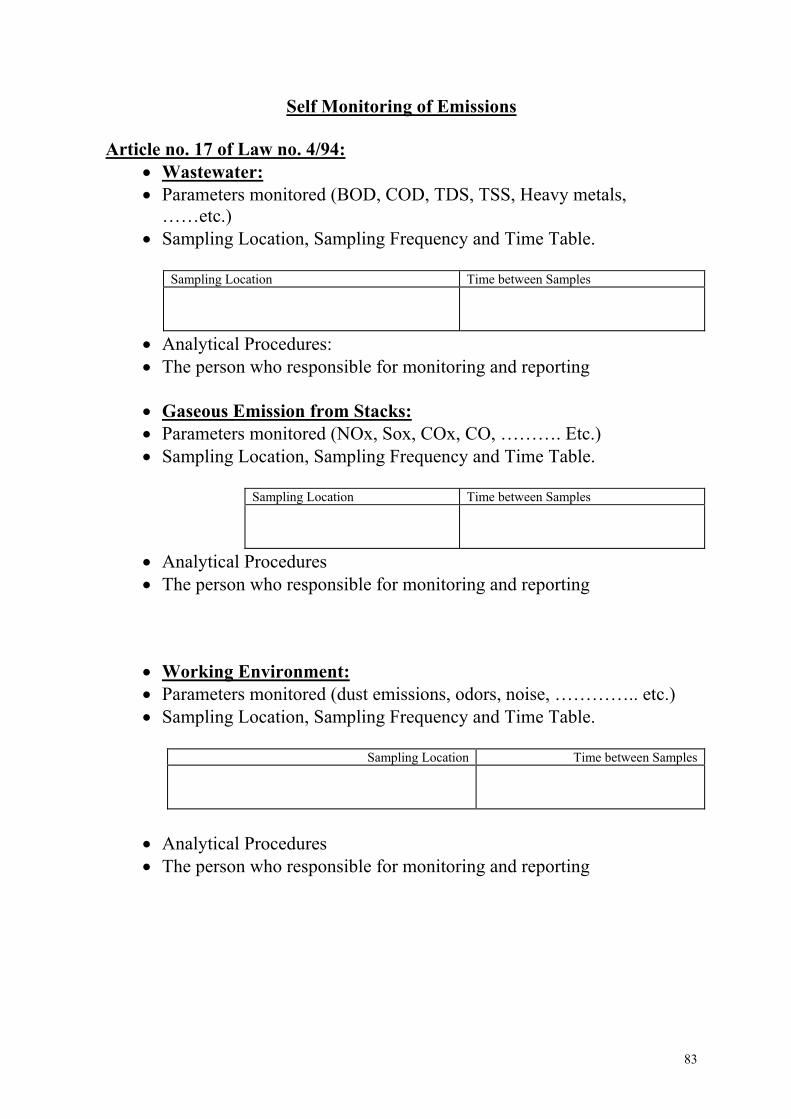
Self Monitoring of Emissions Article no. 17 of Law no. 4/94:
• Wastewater: • Parameters monitored (BOD, COD, TDS, TSS, Heavy metals,
……etc.) • Sampling Location, Sampling Frequency and Time Table.
Sampling Location Time between Samples
• Analytical Procedures: • The person who responsible for monitoring and reporting
• Gaseous Emission from Stacks: • Parameters monitored (NOx, Sox, COx, CO, ………. Etc.) • Sampling Location, Sampling Frequency and Time Table.
Sampling Location Time between Samples
• Analytical Procedures • The person who responsible for monitoring and reporting
• Working Environment: • Parameters monitored (dust emissions, odors, noise, ………….. etc.) • Sampling Location, Sampling Frequency and Time Table.
Sampling Location Time between Samples
• Analytical Procedures • The person who responsible for monitoring and reporting
83
84
Annex C
REFERENCES
- Multimedia Environmental Compliance Guide for Food Processors, United States Environmental Protection Agency (EPA), 1999
- Egypt cleaner production opportunities, Food processing sector SEAM project,
1999.
- National Industrial Pollution Prevention Program – Support for Environmental Assessment and Management, Food industry sector study, 1999.
- Pollution Prevention and Abatement Handbook, World bank Group, 1998.
- Food Industry Water and Energy Conservation, SEAM Project, 1998.
- Compliance Action Plans for Food Industry Facilities, EPAP, 1997.
- General Inspection Manual, GIM, EPAP 2001.
- Fundamentals and Background Manual (FBM) – EI/01, EPAP 1999.
- Guidelines for Inspectorate Management – EI/02, EPAP 1999.
- Guidelines for Team Leader – EI/03, EPAP 1999.
- Guidelines for Inspectors – EI/04, EPAP 1999.
- “Monitoring and Control Practices of Emissions in Pulp and Paper Industry
in Finland”, 1998, Saarinen K., Jouttijarvi T. and Forsius K., Saarinen K. Finnish Environment Institute
- “Data Production Chain in Monitoring of Emissions”, 1999, Saarinen K,
Finnish Environment Institute. - Draft Document “Self-Monitoring Manual for Fruits and vegetables
Processing Industry”, August 2002, prepared by Dr. Shadia El Shishini, ENVIRONICS.