Embed Size (px)
Citation preview

FRUIT AND VEGETABLE SERVINGS IN LOCAL FARM-SOURCED AND STANDARD LUNCHES OFFERED TO CHILDREN IN A HEAD START
PROGRAM by
Amy M. Johnson, R.D., L.D
B. S., University of Central Missouri, 2008
Submitted to the graduate degree program in Dietetics and Nutrition and the Graduate Faculty of the University of Kansas in partial fulfillment
of the Requirements for the degree of Master’s of Science.
_________________________________
Debra Sullivan, Ph.D., R.D., Chairperson
____________________
Cheryl Gibson, Ph.D.
____________________
Susan Carlson, Ph.D.
Date Defended: ___________

ii
The Thesis Committee for Amy Johnson certifies That this is the approved Version of the following thesis:
FRUIT AND VEGETABLE SERVINGS IN LOCAL FARM-SOURCED AND STANDARD LUNCHES OFFERED TO CHILDREN IN A HEAD START
PROGRAM
Committee:
_________________________________
Debra Sullivan, Ph.D., R.D., Chairperson
____________________
Cheryl Gibson, Ph.D.
____________________
Susan Carlson, Ph.D.
Date approved: ___________

Acknowledgements
iii
This project was made possible by a grant funded to Dr. Cheryl Gibson in
collaboration with KC Healthy Kids and Good Natured Family Farms.
Direction was given by Debra Sullivan, PhD and Susan Carlson, PhD of the
department of Dietetics and Nutrition and by Cheryl Gibson, PhD of the
department of Internal Medicine of the University of Kansas Medical Center;
many thanks for their suggestions. Statistical analysis was provided by
Kendra Spaeth, MS, RD of the department of Dietetics and Nutrition. Further
assistance was offered by Savannah Maxwell of the department of Dietetics
and Nutrition and by Susan Harvey, PhD of the Department of Internal
Medicine of the University of Kansas Medical Center.

Abstract
iv
The objective of this project was to compare servings of fruits and
vegetables consumed in locally-sourced or farm-to-school lunches to that in
conventional lunches served to students attending a Head Start preschool.
The students took part in the ―Fine Dining Friday‖ program sponsored by a
local chef. The sample used in this study was the entire student population
enrolled in the Head Start preschool. No subject identifiers were obtained
besides gender. Students between 2 and 5 years old were observed eating
lunch twice a week for 25 weeks to coincide with a local chef’s ―Fine Dining
Friday‖ program for a total of 732 observations. In this observational study,
research staff were trained to visually determine amounts of each food item
placed on the subjects’ plates and the amount consumed, as a percentage of
the original amount. Amounts were recorded and analyzed for mean servings
of food groups, macro-, and micro-nutrients for all conventional lunches and
locally-sourced lunches. Independent-samples t-tests were performed using
SPSS version 17.0 software package. There were no significant differences
in either fruit or vegetable consumption between conventional lunches and
locally-sourced lunches served to the subjects. Tomatoes, other vegetables
(such as lettuce, cucumbers and green beans), and fried potatoes were main
contributors to total vegetable intake in conventional lunches and tomatoes,
other vegetables and deep-yellow vegetables contributed to total intake in
locally-sourced lunches. Dark-green vegetables had the same contribution to
total vegetable intake in both lunches. There were no differences in total

v
energy, fat, saturated fat, total carbohydrates, total protein, vitamin C,
calcium, iron, or potassium between the conventional lunches and locally-
sourced lunches. Vitamin D and sodium were higher in conventional lunches
whereas dietary fiber was higher in locally-sourced lunches. Even though
there was more variety of fruit and vegetable offerings in the locally-sourced
lunches, the consumption of those possibly unfamiliar foods to the sample
may have been limited by the phenomenon of food neophobia. Future
studies should focus on offering locally-sourced foods on a repeated basis,
possibly in the form of a rotating cycle menu.

Table of Contents
vi
List of Tables and Figures ..............................................................................vii
Chapter 1: Introduction ................................................................................... 1
Chapter 2: Review of Literature
Background on Childhood Obesity ................................................................. 4
Impact of Fruits and Vegetables on Various Diseases ................................... 5
Recommendations and Intakes of Fruits and Vegetables in Children ............. 6
Impact of School Meals on Children’s Nutrition .............................................. 7
Food Neophobia ............................................................................................ 9
Farm to School Programs ............................................................................ 10
Chapter 3: Methods
Overview ...................................................................................................... 12
Setting and Program Characteristics ............................................................ 13
Sample ........................................................................................................ 13
Ethics ........................................................................................................... 14
Procedures and Materials ............................................................................ 14
Description of Serving Sizes ........................................................................ 15
Analysis of Data ........................................................................................... 16
Chapter 4: Results
Sample Characteristics ................................................................................ 17
Food Group Servings ................................................................................... 18
Vegetable Profiles of Lunches...................................................................... 18
Intake of Selected Nutrients ......................................................................... 21
Chapter 5: Discussion
Sample ........................................................................................................ 22
Fruit and Vegetable Intakes ......................................................................... 23
Vegetable Profiles of Lunches...................................................................... 24
Intakes of Selected Nutrients ....................................................................... 24
Limitations.................................................................................................... 25
Implications and Future Studies ................................................................... 26
Conclusion ................................................................................................... 27
Chapter 6: Summary .................................................................................... 28
References .................................................................................................... 30
APPENDIX A – Data Collection Form ........................................................... 34
APPENDIX B – Weekly Menus ...................................................................... 38
APPENDIX C – Photos of Selected Meals .................................................... 42

List of Tables and Figures
vii
In-Text Tables:
Table 1: Sample Characteristics ................................................................... 17
Table 2: Food Group Servings...................................................................... 18
Table 3: Mean Intake of Selected Nutrients .................................................. 21
In-Text Figure:
Figure 1: Vegetable Profiles of Lunches ....................................................... 20
Chapter 1
Introduction
1
Childhood obesity is a well-documented phenomenon. In fact, 13.9%
of all American children ages 2-5 are overweight or obese (1). Preschool
children who are obese may have a greater risk of being obese adults. Since
obesity is known to contribute to several diseases such as type 2 diabetes
mellitus, hypertension, cardiovascular disease and certain cancers, most
nutritionists recommend a sensible diet that is moderate in energy, low in fat
and rich in fruits and vegetables. A diet that is rich in fruits and vegetables is
recommended because they have a low energy density due to their high
water and fiber content, but at the same time they are rich in various vitamins
and minerals. The typical American diet is generally one that is plentiful in
simple carbohydrates and fat but low in fruits and vegetables. Research
indicates that, when fruit juice and French fries are not included in the
calculations, preschool-aged children are not meeting the recommended
servings of fruits and vegetables (2, 3). Preschools and Head Start programs
(federally sponsored preschools for children in low-income families) have a
significant influence on their students’ nutrition status with the meals they
serve. Even though Head Start programs must follow the United States
Department of Agriculture (USDA) recommendations for school lunches as
outlined in the National School Lunch Program (NSLP), they may be
composed of more processed food and canned fruits and vegetables as
opposed to fresh, minimally processed food. Processed foods are likely to

2
contain higher sodium and fat and less fiber than whole, fresh foods such as
fruits and vegetables. Research indicates that preschool meals contain more
saturated fat than current recommendations (4). Farm-to-school programs
address this issue by partnering schools with local farms and agriculture to 1)
provide children with fresh, local, and minimally processed foods and 2)
support local agriculture and strengthen local food systems. A local chef
provides meals to schools using a farm-to-school program and collaborates
with local farmers whenever possible to provide students minimally processed
foods while at the same time supporting the local economy. Local foods,
especially fresh fruits and vegetables, can make a positive contribution to the
nutrition of children and may encourage choices of more nutrient dense foods
outside of school. Recent research studying the effects of school gardens
has shown to improve consumption of fruits and vegetables in children, albeit
temporarily (5). One recent report that reviewed evaluations of several farm-
to-school programs around the nation shows promise in that they may
positively impact children’s knowledge of local produce and healthy eating
and change behaviors that result in more fruit and vegetable consumption (6).
Statement of Purpose
Due to the novelty of the farm-to-school concept published scientific
research has been extremely limited. There have not been any studies
identified that compare preschool-aged children’s fruit and vegetable

3
consumption in farm-to-school meals to that in conventional school meals.
The major objective of this thesis project was to compare the servings of fruits
and vegetables consumed in a meal sourced by local farmers and producers
with a standard meal served to preschool students enrolled in a local Head
Start preschool.
Research Question
Do students in a local Head Start preschool eat more servings of fruits
and vegetables when served local, farm-sourced lunches compared to their
conventional school lunches?

Chapter 2
Review of Literature
4
Background on Childhood Obesity
America is facing a crisis in childhood obesity, especially for preschool-
aged children. Obesity is known to contribute to several diseases such as
type 2 diabetes mellitus, hypertension, cardiovascular disease and certain
cancers. Results from the 2003-2004 National Health and Nutrition
Examination Survey (NHANES) estimate that 13.9% of all children ages 2-5
are currently overweight (1). In fact, the rate has been increasing since the
1976-1980 data were collected when prevalence was 5%, to 7.2% in 1988-
1994, to 10.3% in 1999-2000 (1). The prevalence of overweight in that age
group has doubled in the past 10 years.
Preschool-aged children in low-income families have an even higher
prevalence of overweight. A recent report published by the Centers for
Disease Control and Prevention (CDC) finds that 14.6% of all preschool-aged
children in families who are assisted by federally-funded programs for eligible
families, such as WIC, are obese (7). For low-income preschool-aged
children living in Missouri the rate of obesity is 13.9%, equal to that of the
national rate for that age group, regardless of income status (7).
Obesity is one of the top 10 health priorities of Healthy People 2010.
Objective 19-3c calls to ―Reduce the proportion of children and adolescents
who are overweight or obese‖ to achieve the overall goals of increasing

5
quality of life and decreasing health disparities (8). A sensible diet that is
moderate in energy, low in fat and rich in fruits and vegetables is considered
optimal for nutrition as described in the Dietary Guidelines for Americans (9).
Impact of Fruits and Vegetables on Various Diseases
Fruits and vegetables may have a protective effect against some of the
most prevalent diseases in America. Perhaps the strongest evidence that
fruits and vegetables may be protective against certain diseases is in the
case of coronary heart disease. In a meta-analysis of cohort studies studying
the association of fruit and vegetable intake and coronary heart disease,
individuals who ate more than 5 servings of fruits and vegetables per day had
a 17% reduced risk of coronary heart disease (p<0.0001) compared with
those individuals who ate less than 3 servings per day. Persons who ate
between 3 and 5 servings of fruits and vegetables per day had a smaller and
not statistically significant decrease in coronary heart disease risk of 7%
compared with those who ate less than 3 servings per day (10).
A similar meta-analysis was conducted to review the evidence that fruit
and vegetable intake is associated with reduced stroke risk (11). In their
meta-analysis, He et al. (2006) concluded that individuals who ate more than
5 servings of fruits and vegetables per day had a 26% decrease in risk of
stroke (p<0.0001) compared to those who ate less than 3 servings per day
while those who ate between 3 and 5 servings of fruits and vegetables per

6
day had a reduction in risk of stroke of 11% (p=0.005) compared to those who
ate less than 3 servings per day (11).
The Therapeutic Lifestyle Changes (TLC) diet and the Dietary
Approaches to Stop Hypertension (DASH) diet, both supported by the
National Heart Lung and Blood Institute recommend at least 5 servings of
fruits and vegetables every day (12, 13). Fruits and vegetables may also play
a protective roll in certain cancers. In a meta-analysis to determine the
association of fruits and vegetables and protection against gastric cancer, it
was concluded that higher fruit or vegetable intake was indeed associated
with decreased risk of several types of gastric cancers (14). The World
Cancer Research Fund and American Institute for Cancer Research
concluded in a 2007 expert report that there is convincing evidence that
increased amounts of fruits and non-starchy vegetables in the diet may also
reduce the risk of mouth, larynx, pharynx, and esophagus cancers (15).
Recommendations and Intakes of Fruits and Vegetables in Children
The most recent publication of the Dietary Guidelines for Americans
recommends at least one cup each of fruits and vegetables, in a variety of
colors for persons in the lowest energy category of 1,000 calories per day.
Most preschool-aged children fall into this category (9). The Centers for
Disease Control and Prevention further categorizes recommendations by age
groups and physical activity. They recommend one cup each of fruits and

7
vegetables for children ages 2-3 regardless of activity level. For children 4-8
years of age, they recommend one cup fruits and 1½ cups vegetables for
those less active and 1½ cups each of fruits and vegetables for more active
children (16).
How close are preschool-aged children to meeting these
recommendations? A study by Munoz et al. (1997) concluded that, at that
time, 2-5 year old boys met the recommendation of 3 servings of vegetables
and fruits only 17.8% and 33.8% of the time, respectively. Girls met the
recommendations for vegetables and fruits only 20.4% and 30.2% of the time,
respectively (3). More recent data show that children aged 2-5 are consuming
an average of 1.29 cups per day of fruits and 0.76 cups per day of
vegetables. It should be pointed out, however, that about 40% of the fruit
intake was from juice and 11% of the vegetable intake was from French fries
(2). Although many children of preschool ages are likely to receive most of
their food at home, most children who attend Head Start programs receive the
majority of their daily food intake at school. Food consumed in preschool can
impact preschool-aged children’s nutritional intake and status.
Impact of School Meals on Children’s Nutrition
Since school-age children spend a considerable amount of time in
school, the effect of the meals they receive in the school setting on their
nutritional status is a subject of scrutiny. Frequently schools rely heavily on

8
processed food for their students because it is both quick and economical.
However, commercially-prepared foods are more likely to contain higher
sodium and fat and less fiber than whole, fresh foods such as fruits and
vegetables (17). Head Start programs must follow the USDA
recommendations for school lunches as outlined in the National School Lunch
Program (18). The National School Lunch Program (NSLP)
recommendations are based on the 1995 Dietary Guidelines for Americans.
Recent research reveals that schools may be doing a poor job at
reducing certain nutrients that are associated with various disease states. In
particular, total fat, saturated fat and sodium. According to the latest School
Nutrition Dietary Assessment Study (SNDA III), less than one third of all
schools meet the requirements for total fat and saturated fat (19). Sodium
and fiber are not standardized by the USDA for the NSLP but
recommendations do exist. Crepinsek et al. (2007) found that the mean
sodium content offered in school lunches is 1442mg which is more than the
recommended level (17). Bollella et al. (1999) concluded that children who
attend all-day head start programs consume 12.1% of their total energy intake
in the form of saturated fat from the meals served at school, exceeding the
recommendation that no more than 10% of total daily energy intake be in the
form of saturated fat (4).
Most nutritionists agree that dietary fiber is an important component of
a sensible diet. Yet fewer than 8% of schools offered lunches containing at

9
least one third of daily fiber intakes recommended by the 2005 Dietary
Guidelines (19). On a positive note, the SNDAA III did find that most schools
are meeting the USDA standard for protein, vitamin A, vitamin C, calcium and
iron (18).
To meet the updated dietary recommendations and at the request of
the USDA, the Institutes of Medicine (IOM) has published recommendations
to revise the current standards of the NSLP and the National Breakfast
Program (NBP). Those recommendations include increasing the number of
fruits, vegetables and whole grains offered at school meals, setting both
minimums and maximum calorie levels of meals, and a focus on reducing
saturated fat and sodium content of the meals (20).
Food Neophobia
Food neophobia is generally defined as a ―reluctance to eat and/or
avoidance of novel foods‖ (21). This phenomenon has been researched
extensively and the general consensus is that food neophobia is based on
both genetic and environmental factors (22). Food neophobia has been
associated with decreased consumption of fruits and vegetables in children.
Cooke et al. (2006) found that 4-5 year old children who scored high on the
Child Food Neophobia Scale consumed 35% less fruits and vegetables
(p<0.05) in test meals served at school than those children who had low
neophobia scores (23). Similar findings have been found in children aged 2-6

10
years using the Child Food Neophobia Scale and a food frequency
questionnaire (24). Galloway et al. (2003) found that young girls about 7
years of age who were categorized as ―high pickiness-high neophobia‖ had
significantly lower vegetable intake scores than those categorized as ―low
pickiness-low neophobia‖ (p<0.01) (25).
Repeated exposure to certain foods can decrease neophobia and
increase acceptance of novel foods, according to research. Wardle, et al.
(2003) found that repeated exposure to red pepper increased consumption
from about one piece to about 9 pieces in 5-7 year old children (p<0.005) in
the school setting (26). The positive effect of repeated exposure was also
seen in the home setting, where parents were the main influence. Children
aged 2-6 years significantly increased their voluntary consumption of a target
vegetable from 47% to 77% (p<0.01) after 14 exposures to that vegetable.
(27).
Farm-to-School Programs
Farm to school programs are a way to incorporate fresh foods into
students’ diets while supporting local farmers. Even though the published
studies on the farm-to-school concept are limited, garden-based nutrition
programs show promise to increase fruit and vegetable intake in children. A
pilot intervention to promote fruit and vegetable intake on 4th-6th grade
students attending a YMCA summer camp found that subjects increased their

11
preference for vegetables and increased requests for fruits and vegetables at
home (5). McAleese et al. (2007) found that their garden-based nutrition
intervention in 6th graders effectively increased the subjects’ total fruit and
vegetable consumption from 1.93 servings to 4.5 servings per day (28).
A recent report that reviewed evaluations of several farm-to-school
programs around the nation revealed numerous positive impacts of farm-to-
school programs on children. Positive outcomes include increased
knowledge of local produce and healthy eating and increased fruit and
vegetable consumption (6). The farm-to-school concept has even caught the
attention of the federal government. Kathleen Merrigan, Agriculture Deputy
Secretary, recently announced the proposed creation of ―Farm to School
Tactical Teams‖ to help schools obtain locally-sourced foods for their students
(29). At this time there is limited research on the effectiveness of the farm-to-
school programs. Further, we have not found any previous studies that
compare preschool-aged children’s fruit and vegetable consumption in farm-
to-school meals to that in conventional school meals.

Chapter 3
Methods
12
Overview
The purpose of this thesis was to compare the servings of fruits and
vegetables consumed in a meal sourced by local farmers and producers with
a standard meal served to preschool students enrolled in a local Head Start
preschool. It was an observational study. The students were between the
ages of 2 and 5 years of age and enrolled in a Head Start preschool in
western Kansas City, Missouri. The students took part in the ―Fine Dining
Friday‖ program sponsored by a local chef. Trained staff from the University
of Kansas Medical Center (KUMC) visually observed a random sample of
meals being consumed by students eating lunch. Observations were
conducted on a randomly chosen day between Monday and Thursday, when
standard lunch was served and on Friday, when the meal was served for a
total of two days per week. KUMC staff observed and documented the intake
of all food and beverage items served to the sample of students on each day.
Students were identified only by their classroom and gender; no student-
specific identifiers were obtained. Data were collected for 25 weeks to
coincide with the local chef’s ―Fine Dining Friday‖ program, which operated
from June 19, 2009 to December 18, 2009. Data collected were entered into
and analyzed by the Nutrition Data System for Research (NDSR) (version
2008, University of Minnesota, Minneapolis, MN).

13
Setting and Program Characteristics
The Head Start preschool was located in western Kansas City,
Missouri. Data were collected for 25 weeks to coincide with a local chef’s
―Fine Dining Friday‖ program, which operated from June 19, 2009 to
December 18, 2009. The ―Fine Dining Friday‖ program, managed by a local
chef, was a farm-to-school program which aimed to provide students with
meals made from food bought from local farmers. The food served as part of
the ―Fine Dining Friday‖ program was locally-sourced, mostly organic, and
homemade. At lunch time the tables were decorated with tablecloths and
local flowers served as centerpieces. There was also an education
component integrated into the program in which some of the farmers were
brought into the classroom to educate the students on the foods they would
be eating during the program and the food’s origination on the farm.
Sample
The subjects in this study were children aged 2 to 5 years who were
enrolled in a local Head Start preschool in Kansas City, Missouri. The Head
Start preschool took part in the ―Fine Dining Friday‖ program administered by
a local chef. All students were offered lunch each day and, therefore, all
participated in the ―Fine Dining Friday‖ program. The school had an
enrollment of 85 students when the study began. There were five classrooms
in the school and classes were observed a reasonably equal number of times
14
throughout the study period. There was no identification of students other
than their gender and classroom. The classrooms are named Butterflies,
Dolphins, Eagles, Grasshoppers and Little Ducks.
Ethics
This thesis was covered under an existing approved protocol to
evaluate the ―Fine Dining Friday‖ program, in which Cheryl Gibson, Ph.D. was
principal investigator.
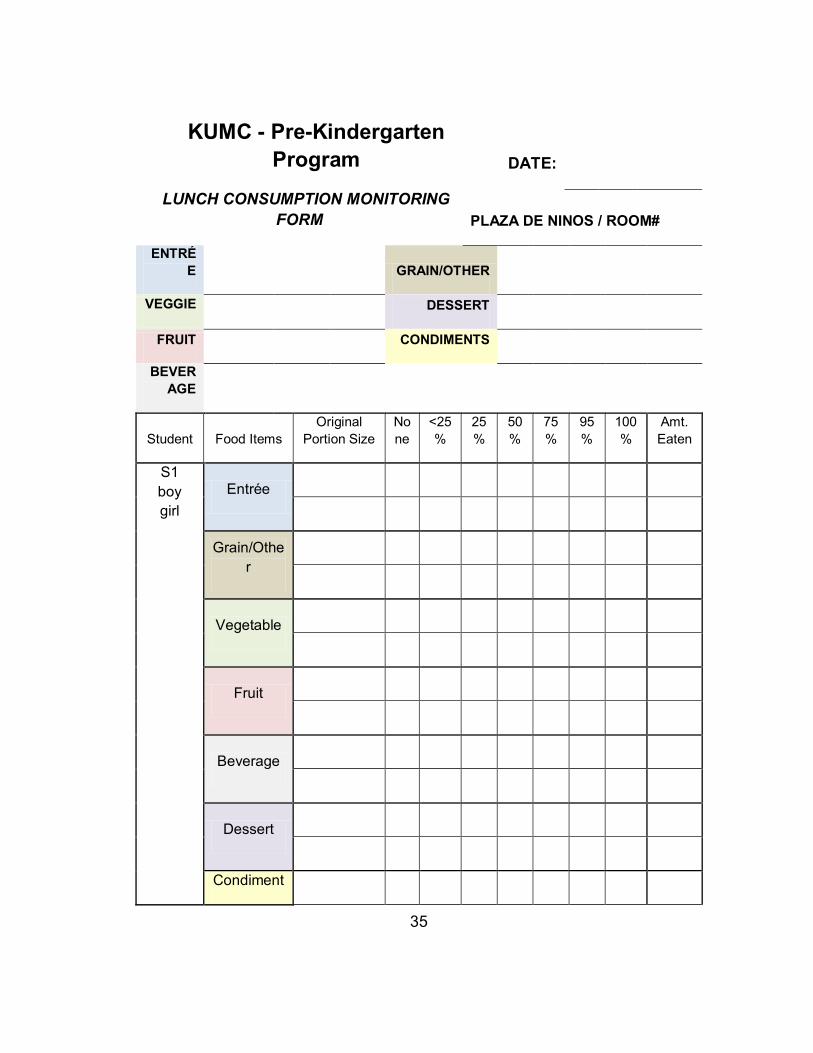
Procedures and Materials
In this observational study, KUMC staff were trained to visually determine
amounts of each food item placed on the subjects’ plates and the amount
consumed, as a percentage of the original amount. Staff recorded each
child’s food record on an intake sheet based on their gender and a temporary
identifier for that day, such as color of clothing they were wearing (see
Appendix A for a copy of the intake sheet). The intake sheet included areas
to record the main entrée, grain item, vegetable, fruit, beverage, condiment,
and dessert. A modified version of the Comstock’s method was employed to
measure and document student consumption (30). The KUMC staff visually
observed a random sample (approximately 20-25%) of students eating lunch
at each occurrence. Observations were conducted on a randomly chosen
day between Monday and Thursday when standard lunch was served and on

15
Friday, when the locally-sourced lunch was served for a total of two days per
week. KUMC staff observed and documented the intake of all food and
beverage items served to the sample on each day. Measurements of food
consumed were standardized according to home measures of cups,
tablespoons, teaspoons, and fluid ounces. Data were collected for 25 weeks
to coincide with a local chef’s ―Fine Dining Friday‖ program, which was in
operation from June 19, 2009 to December 18, 2009. Data were then
entered into the Nutrition Data System for Research (NDSR) (version 2008,
University of Minnesota, Minneapolis, MN) by the same KUMC staff collecting
the data. The NDSR software program was used to determine total number
of servings consumed for fruits and vegetables for each observed meal
occurrence and the overall nutrient intake for each observed meal
occurrence.
Description of Serving Sizes
The National School Lunch Program (NSLP) defines serving sizes of
food groups for children attending preschool (31). Therefore this project
utilized the same serving sizes. One serving of fruit or vegetable is equal to
½ cup fruit or vegetable. One serving of grains is equal to one slice of bread
or a biscuit or roll or ½ cup cooked rice, macaroni, or other pasta or cereal
grain. One serving of meat is equal to 1½ oz. lean meat, poultry, fish,
alternate protein, or cheese; ¾ of a large egg; 3/8 cup cooked dried beans or
16
peas; 3 Tbsp. peanut or other nut or seed butters; or 6 fl. oz. or ¾ cup yogurt
of any kind. One serving of milk is equal to 6 fl.oz.
Analysis of Data
Independent-samples t-tests were performed using SPSS version 17.0
software package. Differences with a p-value of less than 0.05 were
considered to be statistically significant for the primary planned comparisons.
Adjustment for multiple comparisons when examining the micronutrient
content of meals was performed using the Bonferroni correction.

17
Sample Characteristics
The sample included 85 students enrolled in a local Head Start
preschool. The average age was 3.4 years. Sixty-eight percent of the
subjects were of Hispanic or Latino ethnicity, 16% were African American, 8%
were Caucasian and 8% were of mixed race. The average income of families
with children attending the preschool was $13,064 per year. A total of 732
observations were made at 22 conventional lunches and 22 locally-sourced
lunches. Table 1 depicts the characteristics of the sample.
Table 1: Sample Characteristics
Student Population 85
Ages Average age: 3.4 years Age 2: n=10; Age 3: n=34; Age 4: n=38; Age 5: n=3
Ethnicity White (not of Hispanic origin): 8%; Black or African American: 16%; Hispanic or Latino: 68%; Mixed race (all include Hispanic or Latino): 8%
Annual Income Average: $13,064 Range: $3,000 - $32,000
Total Observations 732 22 Conventional lunches: n=350 22 Locally-sourced lunches: n=382
18
Food Group Servings
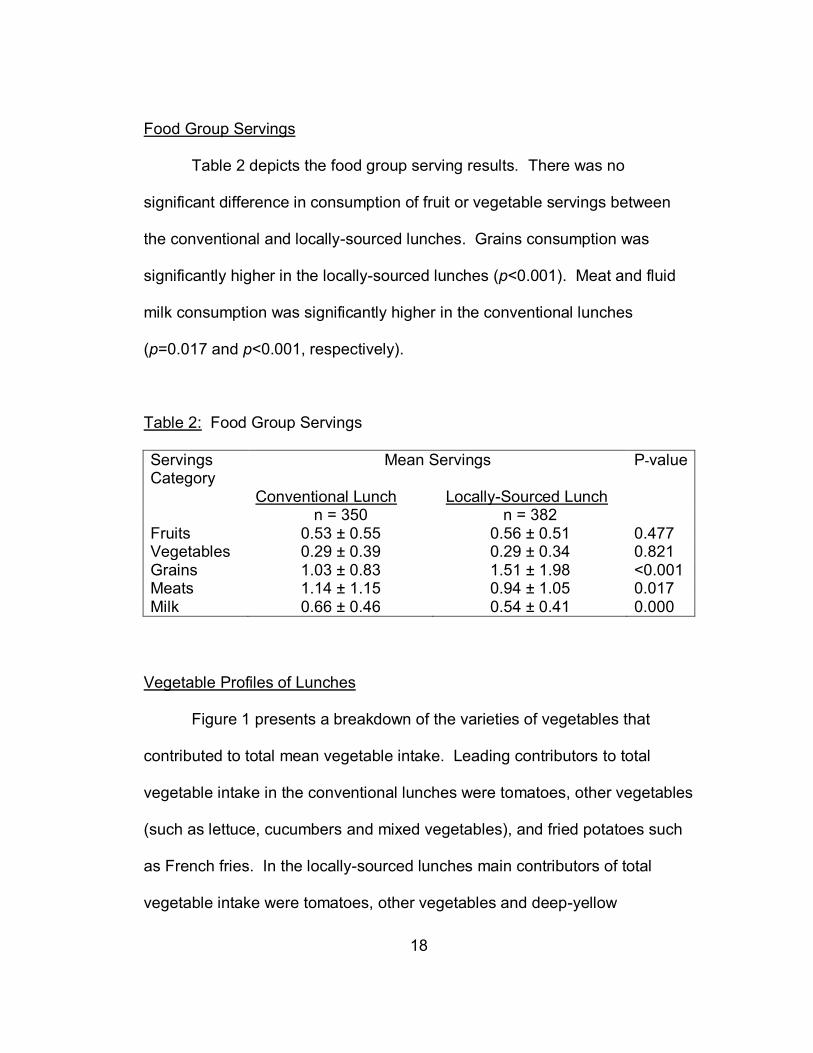
Table 2 depicts the food group serving results. There was no
significant difference in consumption of fruit or vegetable servings between
the conventional and locally-sourced lunches. Grains consumption was
significantly higher in the locally-sourced lunches (p<0.001). Meat and fluid
milk consumption was significantly higher in the conventional lunches
(p=0.017 and p<0.001, respectively).
Table 2: Food Group Servings
Servings Category
Mean Servings
Conventional Lunch Locally-Sourced Lunch
P-value
n = 350 n = 382 Fruits 0.53 ± 0.55 0.56 ± 0.51 0.477 Vegetables 0.29 ± 0.39 0.29 ± 0.34 0.821 Grains 1.03 ± 0.83 1.51 ± 1.98 <0.001 Meats 1.14 ± 1.15 0.94 ± 1.05 0.017 Milk 0.66 ± 0.46 0.54 ± 0.41 0.000
Vegetable Profiles of Lunches
Figure 1 presents a breakdown of the varieties of vegetables that
contributed to total mean vegetable intake. Leading contributors to total
vegetable intake in the conventional lunches were tomatoes, other vegetables
(such as lettuce, cucumbers and mixed vegetables), and fried potatoes such
as French fries. In the locally-sourced lunches main contributors of total
vegetable intake were tomatoes, other vegetables and deep-yellow

19
vegetables. Dark-green vegetables had the same contribution to total
vegetable intake in both the conventional and locally-sourced lunches. Fried
potatoes contributed significantly more to the total intake in the conventional
lunches compared to the locally-sourced lunches (p<0.001), while deep-
yellow vegetables contributed significantly more to the total intake in the
locally-sourced lunches compared to the conventional lunches (p<0.001).

20
Dark-green Vegetables
7%
Deep-yellow Vegetables*
20%
Tomato33%
White Potatoes7%
Fried Potatoes0%
Other Starchy Vegetables
3%
Legumes (cooked dried
beans)7%
Other Vegetables
23%
Locally-Sourced Lunches
* Denotes significance
Dark-green Vegetables
7%Deep-yellow Vegetables
10%
Tomato30%
White Potatoes3%
Fried Potatoes*
13%
Other Starchy Vegetables
7%
Legumes (cooked dried
beans)3%
Other Vegetables
27%
Conventional Lunches
Figure 1: Vegetable Profiles of Lunches

21
Intake of Selected Nutrients
There were few differences in mean values of selected macro- and
micro-nutrients between the conventional and locally-sourced lunches. Total
energy, total fat, saturated fat, total carbohydrates, total protein, vitamin C,
calcium, iron, and potassium were not significantly different in the
conventional lunches compared to the locally-sourced lunches. Vitamin D
and sodium were significantly higher in the conventional lunches compared to
the locally-sourced lunches (p<0.001 and p=0.029, respectively). However,
dietary fiber in the locally-sourced lunches was significantly greater compared
to the conventional lunches (p<0.001). Table 3 illustrates the results for
intake of selected nutrients.
Table 3: Mean Intake of Selected Nutrients
Nutrient Mean Intakes Conventional Locally-Sourced Lunches Lunches
P-value
n = 350 n = 382 Energy (kcal) 333.56 ± 161.29 310.67 ± 213.85 0.105 Total Fat (g) 11.55 ± 7.82 10.31 ± 9.98 0.063 Total CHO (g) 41.67 ± 20.53 39.27 ± 28.54 0.196 Tot. Protein (g) 16.63 ± 9.23 16.99 ± 12.61 0.661 Total SFA (g) 3.74 ± 2.94 4.29 ± 5.00 0.077 Total Fiber (g) 2.44 ± 1.53 3.91 ± 4.18 <0.001 Vitamin D (mcg) 1.83 ± 1.20 1.54 ± 1.08 <0.001 Vitamin C (mg) 9.17 ± 10.39 10.71 ± 11.48 0.058 Calcium (mg) 269.15 ± 150.94 301.88 ± 277.45 0.051 Iron (mg) 1.98 ± 1.19 1.91 ± 1.79 0.524 Sodium (mg) 631.08 ± 372.18 558.45 ± 506.17 0.029* Potassium (mg) 539.85 ± 253.18 535.43 ± 316.39 0.836
*Using the Bonferroni correction, this value is no longer considered statistically significant

Chapter 5
Discussion
22
This research appears to be the first of its kind to compare fruit and
vegetable intake in a locally-sourced or farm-to-school meal to a conventional
school meal in preschool-aged children. Because of the childhood obesity
epidemic and the knowledge that fruit and vegetable intake can have a
favorable impact on certain obesity-related diseases and some cancers, it is
important to find out if farm to school programs can improve fruit and
vegetable intakes among children. The published studies on this topic so far
are limited in number.
Sample
The sample for this project had a mean age of 3.4 years. Students of
Hispanic/Latino ethnicity made up the majority of the student body. This
ethnic group, along with American Indian/Alaska Natives had the highest
prevalence of childhood obesity in 2008, whereas non-Hispanic Whites and
Black/African Americans had the lowest rates of childhood obesity (7). The
average income of families with children who were enrolled in this Head Start
preschool was $13,064, which was less than 100% of the Federal Poverty
guideline for a family of 2 (31). Indeed, families with children who were
enrolled in this Head Start preschool could be considered low-income.
23
Fruit and Vegetable Intakes
The objective of this project was to compare servings of fruits and
vegetables consumed in locally-sourced or farm-to-school lunches to that in
conventional lunches served to students attending a Head Start preschool.
The results of this project did not find a significant difference in fruit or
vegetable servings between the two lunch types. In fact, both lunch types
yielded very similar intakes of both fruits and vegetables.
Both lunch types yielded consumptions of about ¼ cup of fruits and
slightly more than one tablespoon of vegetables per meal. That is roughly
25% and 7%, respectively, of both the Dietary Guidelines for Americans and
Centers for Disease Control and Prevention for this age group (9, 16). Even
though this is only one meal, if it is theorized that these subjects consumed
the same serving sizes at breakfast and dinner then total daily consumption
would be 75% and 21% of fruits and vegetables, respectively. In terms of
fruits, that is similar to Lorsen et al.’s findings (2) but below their findings for
vegetables. These results are also in line with Munoz et al.’s findings that
indicate many children are not meeting the current recommendations (3).
These results further fall below the National School Lunch Program
regulations that recommend students in this group have at least ½ cup each
of fruits and vegetables at lunch (32).

24
Vegetable Profiles of Lunches
The profiles of the two lunch types were similar for tomatoes and other
vegetables (including lettuce, cucumbers and mixed vegetables) but the
locally-sourced lunches included significantly more deep-yellow vegetables
(including carrots, yellow squash and sweet potatoes). The locally-sourced
lunches offered more of a variety of fruits and vegetables than the
conventional lunches and a more varied menu altogether, possibly
introducing unfamiliar foods such as whipped sweet potatoes, squash and
fresh basil to the sample. If these foods were indeed novel to some subjects
then food neophobia may have affected consumption of those foods. (see
Appendix B for weekly menus) On the other hand, the conventional lunches
included significantly more fried potatoes than the locally-sourced lunches.
The proportion of fried potatoes to the total intake in the conventional lunches
is similar to previous research (2).
Intakes of Selected Nutrients
The total energy, iron and vitamin C were less than National School
Lunch Program requirements for those nutrients in both lunch types (31).
Saturated fat was above NSLP requirements in the locally-sourced lunch,
which could be due to the fact that cheese was served more often in the
locally-sourced lunches than in the conventional lunches. Both lunch types
met the requirements for total fat, protein, and calcium (30). The findings that

25
sodium was higher in the conventional lunches and fiber was higher in the
locally-sourced lunches supports the theory that farm-to-school programs
offer minimally-processed foods rich in fruits and vegetables compared to that
in conventional school meals. The results for total fat, saturated fat and
sodium for the conventional lunches do not support the previous research that
indicates schools are doing poorly in meeting standards and
recommendations (4, 17, 19). This was a pilot study with a small sample
size. If a Bonferroni correction would have been used the difference in
sodium may not have been significant. A Bonferroni correction is a
conservative adjustment to account for multiple comparisons. Future studies
could increase power by having a larger sample size to determine if that
remains a significant variable.
Limitations
One limitation of this study is that the ―Fine Dining Friday‖ program was
conducted through the summer and only about half of a normal school year.
While the Head Start preschool is year-round, this project cannot be
generalized to children attending schools with a traditional 9 month school
year during the fall, winter and spring. Another limitation of the study is that
while the chef administering the farm-to-school program was focused on
providing children with minimally processed foods coming from local sources,
nothing in the marketing literature stated intent to provide more fruits and

26
vegetables than a standard school lunch. And in fact, their meals did not
create more consumption of fruits and vegetables among the sample of
students in this project. Because the program was administered by a chef
and not a dietitian, adequate knowledge to plan appropriate menus for this
population may have been lacking. The fact that the students serve
themselves as opposed to having the teachers place the food on their plates
may affect their intake, as the students often choose not to take foods that
they may not be familiar with at home. The tablecloths and flower
centerpieces featured as part of the ―Fine Dining Friday‖ program could have
also affected the students’ intakes, as they were a deviation from the
students’ normal routine of no table dressings during meal times. Refer to
Appendix C for photograph examples of the difference in table dressings
between conventional lunches and locally-sourced lunches.
Implications and Future Studies
One implication for this study is that farm-to-school meals give children
the opportunity to consume a variety of locally produced foods, especially
fruits and vegetables, in the school setting. For example, the locally-sourced
lunches in this project offered yellow and orange colored watermelon in
addition to the normal red color that is usually the only color available at
supermarkets. Sweet potatoes were another common alternative to white
potatoes served in the locally-sourced meal. Since sweet potatoes offer more

27
fiber and vitamin A than white potatoes, it is a good substitution to the starchy
staple in most American’s diets. Research shows that repeated exposure is
the key for food acceptance, especially in young children. For this population,
it may be necessary to offer repeated and continued exposures of the
perceived novel or unfamiliar foods to gain acceptance and liking. Future
studies should focus on offering locally-sourced foods on a repeated basis,
possibly in the form of a rotating cycle menu. Further, trained nutrition
professionals should be used for collaboration in planning meals.
Conclusion
There were no significant differences in either fruit or vegetable
consumption between conventional lunches and locally-sourced lunches
served to students in a Head Start preschool. Even though there was more
variety of fruit and vegetable offerings in the locally-sourced lunches, the
consumption of those possibly unfamiliar foods to the sample may have been
limited by the phenomenon of food neophobia. Both lunch types were similar
in macronutrient composition. The locally-sourced lunches did offer benefits
such as higher dietary fiber likely due to higher whole grain content in the
foods and less sodium compared to the conventional lunches.

Chapter 6
Summary
28
The purpose of this thesis project was to compare the servings of fruits
and vegetables consumed in a meal sourced by local farmers and producers
with a standard meal served to preschool students enrolled in a local Head
Start preschool. The sample consisted of students between the ages of 2
and 5 years of age enrolled in a local Head Start preschool in Kansas City,
Missouri. Visual observations were made by KUMC staff on random samples
of students eating lunch on randomly chosen days between Monday and
Thursday for the conventional lunches and on Fridays to observe the locally-
sourced lunches. Data were collected for 25 weeks to coincide with a local
chef’s ―Fine Dining Friday‖ program.
There was no significant difference in consumption of fruit between the
conventional and locally-sourced lunches (0.53 ± 0.55 and 0.56 ± 0.51
servings, respectively). There was also no significant difference in vegetable
consumption between the conventional lunches (0.29 ± 0.39 servings) and
locally-sourced lunches (0.29 ± 0.34 servings). Both lunch types yielded
consumptions of about ¼ cup of fruits and slightly more than one tablespoon
of vegetables per meal. Those amounts are below the Dietary Guidelines for
Americans, Centers for Disease Control and Prevention, and the National
School Lunch Program guidelines for this age group. These findings support

29
previous research that shows many American children do not meet current
recommendations for fruit and vegetable servings (2, 3).
Even though there was more variety of fruit and vegetable offerings in
the locally-sourced lunches, the consumption of those possibly unfamiliar
foods to the sample may have been limited by the phenomenon of food
neophobia. Future studies should focus on offering locally-sourced foods on
a repeated basis, possibly in the form of a rotating cycle menu.

References
30
1. Centers for Disease Control and Prevention. National Center for Health
Statistics. Prevalence of Overweight Among Children and Adolescents:
United States, 2003-2004. National Center for Health Statistics Health E-
Stats. April 2006. Available at
http://www.cdc.gov/nchs/products/pubs/pubd/hestats/overweight/overwght_ch
ild_03.htm. Accessed on October 13, 2009.
2. Lorsen, B. A., Melgar-Quinonez, H. R., Taylor, C. A. Correlates of Fruit
and Vegetable Intakes in US Children. J Am Diet Assoc . 2009; 109 (3),
474-478.
3. Munoz, K. A., Krebs-Smith, S. M., Ballard-Barbash, R., Cleveland, L. E.
Food Intakes of US Children and Adolescents Compared With
Recommendations. Pediatrics . 1997; 100, 323-329.
4. Bollella, M. C., Spark, A., Boccia, L. A., Nicklas, T. A., Pittman, B. P., &
Williams, C. L. Nutrient Intake of Head Start Children: Home vs. School. J Am
Coll Nutr. 1999; 18 (2), 108-14.
5. Heim, S. S. A Garden Pilot Project Enhances Fruit and Vegetable
Consumption Among Children. J Am Diet Assoc. 2009; 109 (7), 1220-1226.
6. Joshi, A. a. Bearing Fruit: Farm to School Program Evaluation Resources
and Recommendations. 2009. (O. College, Ed.) Urban and Environmental
Policy Institute. Available at:
http://departments.oxy.edu/uepi/cfj/bearingfruit.htm. Accessed on October
13, 2009
7. Centers for Disease Control and Prevention. Obesity Prevalence Among
Low-Income, Preschool-Aged Children — United States, 1998–2008. MMWR.
July 24, 2009, Vol. 58, 28, pp. 769-773.
8. Office of Disease Prevention and Health Promotion. Us Department of
Health and Human Services. . Healthy People 2010. Available at
http://www.healthypeople.gov/default.htm. Accessed on October 8, 2008.
9. US Department of Health and Human Services and US Department of
Agriculture. Dietary Guidelines for Americans, 2005. 6th ed, Washington, DC :
US Government Printing Office, January, 2005.

31
10. He FJ, Nowson CA, Lucas M, MacGregor GA. Increased consumption of
fruit and vegetables is related to a reduced risk of coronary heart disease:
meta-analysis of cohort studies. J Hum Hypertens, 2007, 21:717-728.
11. He Feng J, Nowson Caryl A, MacGregor Graham A. Fruit and vegetable
consumption and stroke: meta-analysis of cohort studies. Lancet, 2006,
367:320-326.
12. National Heart, Lung, and Blood Institute. National Institutes of Health.
TLD Diet: Daily Food Guide. National Cholesterol Education Program: Live
Healthier Live Longer. Available at
http://www.nhlbi.nih.gov/chd/Tipsheets/daily.htm. Accessed on October 13,
2009.
13. Health, Department of Health and Human Services. National Institutes of.
In Brief: Your Guide to Lowering Your Blood Pressure with DASH. National
Heart Lung and Blood Institute. 2006. Available at
http://www.nhlbi.nih.gov/health/public/heart/hbp/dash/dash_inbrief.htm.
Accessed on October 13, 2009.
14. Fruit and vegetable consumption and gastric cancer by location and
histological type: case–control and meta-analysis. Lunet N, Valbuena C,
Vieira AL, Lopes C, Lopes C, David L, et al. Eur J Cancer Prev. 2007,
16:312-327.
15. World Cancer Research Fund / American Institute for Cancer Research.
Food, Nutrition, Physical Activity and the Prevention of Cancer: A Global
Perspective. Washington, DC : AICR, 2007.
16. Centers for Disease Control and Prevention. How Many Fruits and
Vegetables do You Need? Fruits and Veggies: More Matters. Available at
http://www.fruitsandveggiesmatter.gov/publications/index.html. Accessed on
October 13, 2009.
17. Crepinsek MK, Gordon AR, McKinney PM, Condon EM, Wilson A. Meals
Offered and Served in US Public Schools: Do They Meet Nutrition
Standards? J Am Diet Assoc. 2009, 109(2; Supp 1):S31-S43.
18. Services, United States Department of Agriculture. Food and Nutrition.
National School Lunch Program. United States Department of Agriculture,

32
June 4, 2009. Available at http://www.fns.usda.gov/cnd/Lunch/default.htm.
Accessed on September 24, 2009.
19. United States Department of Agriculture. Food and Nutrition Service.
Office of Research, Nutrition and Analysis. School Nutrition Dietary
Assessment-III: Summary of Findings. November 2007. Available at
http://www.fns.usda.gov/ora/MENU/Published/CNP/FILES/SNDAIII-
SummaryofFindings.pdf. Accessed on September 24, 2009.
20. Institutes of Medicine of the National Academies. Comparison of Current
Requirements and New Recommendations. Institutes of Medicine. October
20, 2009. Available at http://www.iom.edu/en/Reports/2009/School-Meals-
Building-Blocks-for-Healthy-Children.aspx. Accessed on October 20, 2009.
21. Pliner P, Hobden k. Development of a scale to measure the trait of food
neophobia in humans. Appetite. 1992, 19:105-120.
22. Cooke LJ, Haworth CMA, Wardle J. Genetic and environmental
influences on children's food neophobia. Am J Clin Nutr. 2007, 86:428-433.
23. Cooke L, Carnell S, Wardle J. Food neophobia and mealtime food
consumption in 4-5 year old children. Int J Behav Nutr Phys Act. 2006, 3:14-
19.
24. Cooke L, Wardle J, Gibson EL. Relationship between parental report of
food neophobia and everyday food consumption in 2-6-year-old children.
Appetite. 2003, 41:205-206.
25. Galloway AT, Lee Y, Birch LL. Predictors and consequences of food
neophobia and pickiness in young girls. J Am Diet Assoc. 2003, 103(6):692-
698.
26. Wardle J, Herrera ML, Cooke L, Gibson EL. Modifying children's food
preferences: the effects of exposure and reward on acceptance of an
unfamiliar vegetable. Eur J Clin Nutr. 2003, 57(2):341-348.
27. Wardle J, Cooke LJ, Gibson EL, Sapochnik M, Sheiham A, Lawson M.
Increasing children's acceptance of vegetables; a randomized trial of parent-
led exposure. Appetite. 2002, 40:155-162.
33
28. McAleese JD, Rankin LL. Garden-Based Nutrition Education Affects Fruit
and Vegetable Consumption in Sixth-Grade Adolescents. J Am Diet Assoc.
2007, 107(4):662-665.
29. United States Department of Agriculture, Office of Communications.
Agriculture Deputy Secretary Merrigan Announces Initiative To Connect
Children to Where Their Food Comes From and Provide More Local foods in
School Lunches. USDA. Food and Nutrition Service. September 15, 2009.
Available at http://www.fns.usda.gov/cga/PressReleases/2009/PR-0441.htm.
Accessed on September 22, 2009.
30. Comstock EM, St Pierre RG, Mackiernan YD. Measuring individual plate
waste in school lunches. Visual estimation and children's ratings vs. actual
weighing of plate waste. J Am Diet Assoc. 1981, 79(3):290-296.
31. United States Department of Health and Human Servies. Office of the
Secretary. Annual Updated of the HHS Poverty Guidelines. Federal Register:
January 23, 2009. Available at
http://aspe.os.dhhs.gov/poverty/09fedreg.shtml. Accessed on March 30,
2010.
32. United States Department of Agriculture. Food and Nutrition Service.
Part 210 - National School Lunch Program. Subchapter A - Child Nutrition
Programs. SOURCE: 53 FR 29147, Aug. 2, 1988, unless otherwise noted.
Mountain Plains Regional Office, FNS, U.S. Department of Agriculture, 1244
Speer Boulevard, Suite 903, Denver, Colorado 80204. Available at
http://www.fns.usda.gov/cnd/Governance/regulations.htm#REAUTHORIZATI
ON. Accessed on March 8, 2010.

34
APPENDIX A
Data Collection Intake Sheet
35
KUMC - Pre-Kindergarten
Program DATE:
LUNCH CONSUMPTION MONITORING
FORM PLAZA DE NINOS / ROOM#
ENTRÉ
E GRAIN/OTHER
VEGGIE DESSERT
FRUIT CONDIMENTS
BEVER
AGE
Student Food Items
Original
Portion Size
No
ne
<25
%
25
%
50
%
75
%
95
%
100
%
Amt.
Eaten
S1
boy
girl
Entrée
Grain/Othe
r
Vegetable
Fruit
Beverage
Dessert
Condiment

36
S2
boy
girl
Entrée
Grain/Othe
r
Vegetable
Fruit
Beverage
Dessert
Condiment
S3
boy
girl
Entrée
Grain/Othe
r
Vegetable
Fruit

37
Beverage
Dessert
Condiment

38
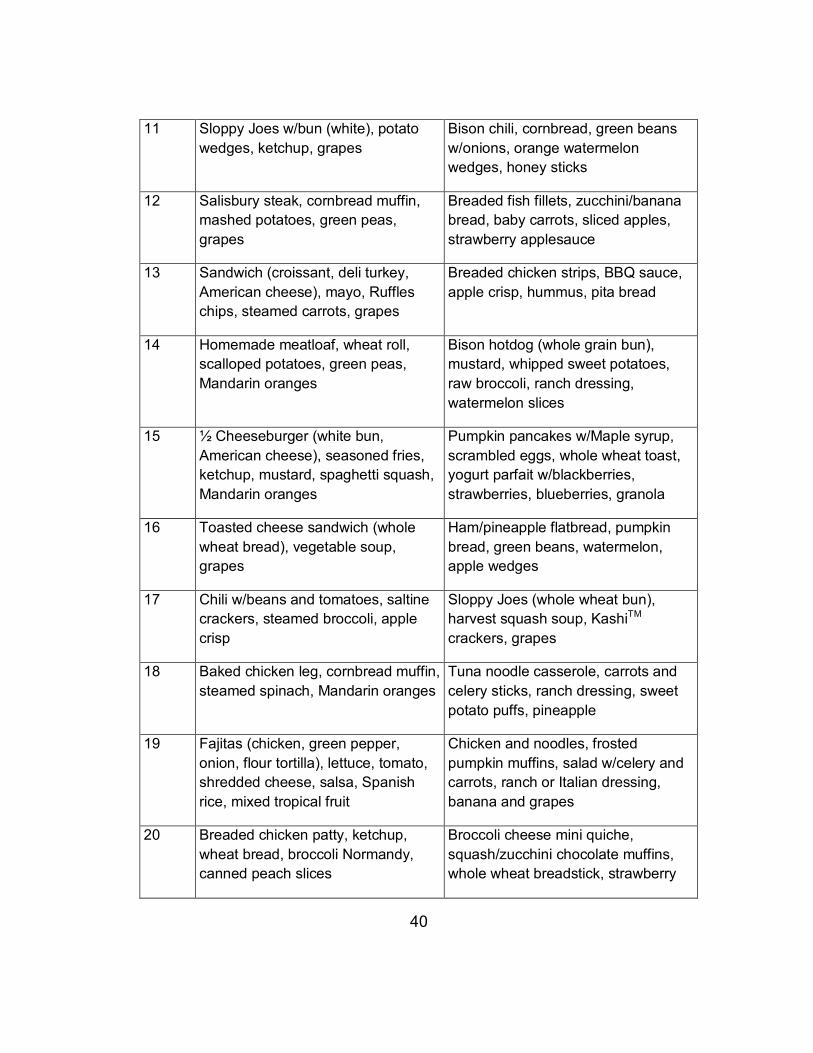
APPENDIX B
Weekly Menus

Weekly Menus
39
Week
Conventional Lunches Locally-Sourced Lunches
1 Taco salad (chips, taco meat),
lettuce, tomato, cheese, salsa,
Spanish rice, refried beans, fruit
(watermelon, pineapple)
Grilled cheese sand., salad
w/cucumbers, carrots, tomato, ranch
dressing, yogurt w/cinnamon and
raisins, fruit (oranges, blueberries,
watermelon)
2 Spaghetti w/meat sauce, lettuce
salad, dressing, garlic toast,
applesauce, Mandarin oranges
Data not collected
3 Hot dog w/bun (white), ketchup,
Ruffles chips, steamed broccoli,
pineapple
Cheeseburger (wheat bun, American
cheese), lettuce, tomato, organic
ketchup, sweet potato fries,
cantaloupe, watermelon
4 Breaded baked fish, cornbread
muffin, mixed veggies, applesauce,
lemon
Bean/Cheese quesadilla, taco sauce,
Spanish rice, yellow squash and
zucchini, watermelon, peach slices
5 Lasagna, salad w/cucumbers and
carrots, ranch dressing, garlic toast,
pineapple, pears
Baked chicken strips, ketchup,
Original 7-Grain KashiTM crackers,
corn soup, blackberries, blueberries,
oranges
8 Data not collected Cheese pizza, Parmesan cheese,
cherry tomato salad w/basil and
mozzarella, honey sticks, honeydew
melon
9 Spaghetti w/meat sauce, Parmesan
cheese, garlic toast, salad
w/cucumbers and carrots, ranch
dressing, corn, applesauce
Taco salad (chips, meat), lettuce,
cheese, salsa, frijoles, watermelon
slices
10 Hamburger pizza, steamed carrots,
pear slices
Macaroni and cheese, whole wheat
roll, cucumbers and tomatoes, ranch
dressing, yellow watermelon slices
40
11 Sloppy Joes w/bun (white), potato
wedges, ketchup, grapes
Bison chili, cornbread, green beans
w/onions, orange watermelon
wedges, honey sticks
12 Salisbury steak, cornbread muffin,
mashed potatoes, green peas,
grapes
Breaded fish fillets, zucchini/banana
bread, baby carrots, sliced apples,
strawberry applesauce
13 Sandwich (croissant, deli turkey,
American cheese), mayo, Ruffles
chips, steamed carrots, grapes
Breaded chicken strips, BBQ sauce,
apple crisp, hummus, pita bread
14 Homemade meatloaf, wheat roll,
scalloped potatoes, green peas,
Mandarin oranges
Bison hotdog (whole grain bun),
mustard, whipped sweet potatoes,
raw broccoli, ranch dressing,
watermelon slices
15 ½ Cheeseburger (white bun,
American cheese), seasoned fries,
ketchup, mustard, spaghetti squash,
Mandarin oranges
Pumpkin pancakes w/Maple syrup,
scrambled eggs, whole wheat toast,
yogurt parfait w/blackberries,
strawberries, blueberries, granola
16 Toasted cheese sandwich (whole
wheat bread), vegetable soup,
grapes
Ham/pineapple flatbread, pumpkin
bread, green beans, watermelon,
apple wedges
17 Chili w/beans and tomatoes, saltine
crackers, steamed broccoli, apple
crisp
Sloppy Joes (whole wheat bun),
harvest squash soup, KashiTM
crackers, grapes
18 Baked chicken leg, cornbread muffin,
steamed spinach, Mandarin oranges
Tuna noodle casserole, carrots and
celery sticks, ranch dressing, sweet
potato puffs, pineapple
19 Fajitas (chicken, green pepper,
onion, flour tortilla), lettuce, tomato,
shredded cheese, salsa, Spanish
rice, mixed tropical fruit
Chicken and noodles, frosted
pumpkin muffins, salad w/celery and
carrots, ranch or Italian dressing,
banana and grapes
20 Breaded chicken patty, ketchup,
wheat bread, broccoli Normandy,
canned peach slices
Broccoli cheese mini quiche,
squash/zucchini chocolate muffins,
whole wheat breadstick, strawberry

41
applesauce
21 Chicken nuggets, BBQ sauce,
cornbread muffins, mixed veggies
(peas, corn, green beans, carrots),
mango slices, grapes
Bison meatloaf, mashed potatoes,
green beans, pears
22 Pepperoni pizza pocket, tossed
salad, ranch dressing, tropical mixed
fruit (banana, pineapple, peach)
Sun butter and jelly cutout, broccoli
and rice, string cheese, banana
23 Breaded chicken breast patty (white
bun), ketchup, green beans, peaches
Spaghetti w/meat sauce, Parmesan
cheese, wheat roll, mixed greens
salad, ranch or Italian dressing,
orange slices
24 Grilled cheese, potato soup, mixed
veggies (peas, corn, green beans,
carrots), grapes
Cheese pizza wheels, pasta salad,
cottage cheese, grapes
25 Chicken strips, BBQ sauce, wheat
bread, steamed carrots, applesauce
Beefy noodles, cinnamon raisin
bread, raw carrots and celery, ranch
dressing, fresh pear quarters

42
APPENDIX C
Photos of Selected Meals

43
Conventional Lunches Locally-Sourced Lunches