Embed Size (px)
Citation preview

Frutarom Industries Ltd.
Annual Report 2009

TTAABBLLEE OOFF CCOONNTTEENNTTSS SECTION A DESCRIPTION OF THE COMPANY’S
BUSINESS SECTION B DIRECTORS REPORT FOR THE PERIOD SECTION C FINANCIAL REPORTS FOR THE PERIOD
ENDED DECEMBER 31, 2009 SECTION D ADDITIONAL INFORMATION

Section A
Description of the Company's Business

FORWARD-LOOKING STATEMENTS
This report includes statements that are “forward-looking statements.” Forward-
looking statements, as defined in the Securities Law – 1968, include forecast estimates
or other information relating to future events or circumstances whose occurrence is
not certain and which are not solely in the Company’s control. These forward-looking
statements can be identified, among others, by the use of terms such as, “believes,”
“estimates,” “intends,” “expects,” “plans,” “will” or, in each case, their negative or
other variations or comparable terminology, or by discussions of strategy, plans,
objectives, goals, future events or intentions.
By their nature, forward-looking statements involve risk and uncertainty. Forward-
looking statements are not guarantees of future performance and the actual results of
the Company’s operations, financial conditions and its development, including the
realization of its strategy and goals, may be materially different from those described
or discussed in this report.
Important factors that could cause the actual results of the Company’s activity,
financial status and development, including realization of its strategy and goals, to
differ materially from those described in this report, include, among others: the global
economic crisis; competition in the markets in which the Company operates; changes
in demand for the Company’s products; changes in the Company’s ability to introduce,
produce and market new products; future changes in accounting policies; the ability of
the Company to successfully identify and acquire complementary products and
companies; the ability of the Company to merge activities and/or companies that have
been and/or will be acquired by it; the impact of certain laws, regulations and
standards, especially in the areas of the environment, intellectual property, tax, health
and safety; currency fluctuations; the Company’s ability to obtain regulatory approvals
for its products; fluctuation in the prices of raw material needed to the Company and
its ability to maintain access to them; and the recruitment and continued employment
of key employees.
Subject to the requirements of the Tel Aviv Stock Exchange and/or the London Stock
Exchange and/or as required by applicable law, the Company does not intend to
update any industry information or forward-looking statements set out in this report.

TTAABBLLEE OOFF CCOONNTTEENNTTSS
Chapter 1: Description of the Company’s Business 1
1. The Group's Activity and Description of the Development of its Business…………….. 2
2. The Group's Fields of Operation…………………………………………..………..…….… 12
3. Investments in the Company's Capital and Transactions in its Shares…..……………. 13
4. Distribution of Dividends……………………………………………………………….…….. 15
Chapter 2: Other Information 16
5. Financial Data Regarding the Company's Fields of Activity…………………………….. 16
6. Market Environment and Influence of External Factors on the Company's Activity…… 17
Chapter 3: Description of the Company’s Business by Fields of Activity 21
The Flavors Field
7. Overview of the Flavors Market………………………………………............................... 22
8. Products and Services in the Flavors Segment…………………………………………… 27
9. Segmentation of the Income and Profitability of Products and Services……………….. 29
10. New Products…………………………………………………………………………………. 29
11. Customers……………………………………………………………………………………… 30
12. Order Backlog…………………………………………………………………………………. 30
13. Competition…………………………………………………………………………………….. 30
14. Production Capacity…………………………………………………………………………... 31
The Fine Ingredients Field
15. Overview of the Fine Ingredients Market…………………………………………………… 31
16. Products and Services in the Fine Ingredients Segment…………………………………. 34
17. Segmentation of the Income and Profitability of Products and Services………………... 38
18. New Products………………………………………………………………………………….. 38
19. Customers……………………………………………………………………………………… 38

20. Orders Backlog…………………………………………………………...…………………… 38
21. Competition……………………………………………………………………………………. 39
22. Production Capacity…………………………………………………………………………... 39
23. Frutarom's Trade & Marketing Activity………………………………................................. 40
Chapter 4: Description of the Company’s Business: Matters Relating to the Group's Overall Activity
41
24. Marketing, Sales and Customer Support…………………………………………………. 41
25. Research and Development…………………………………………………………………. 42
26. Seasonality of Demand………………………………………………………………………. 43
27. Fixed Assets, Facilities and Production Capacity………………….................................. 44
28. Intangible Assets…………………………………………………………............................. 48
29. Human Resources…………………………………………………………………………….. 49
30. Raw Materials and Suppliers…………………………………………………….................. 54
31. Working Capital……………………………………………………………………………….. 54
32. Capital Expenditure…………………………………………………………………............... 56
33. Capital Resources…………………………………………………………………………….. 56
34. Taxation………………………………………………………………………………………… 57
35. Environment……………………………………………………………………………………. 57
36. Limitations and Supervision of the Company's Business………………….……………… 59
37. Material Agreements………………………………………………………...……………….. 59
38. Litigation………………………………………………………………………………………... 60
39. Key Strengths and Strategy……………..………………………………............................. 61
40. Financial Data Regarding Geographic Regions …………………………………………... 67
41. Risk Factors……………………………………………………………………………………. 67
42. Details about the valuation of the Savory Activity in Germany ………………………….. 77

CChhaapptteerr 11 –– TTHHEE CCOOMMPPAANNYY''SS BBUUSSIINNEESSSS AANNDD IITTSS
DDEEVVEELLOOPPMMEENNTT The following terms will have the meaning ascribed to them: "US$"
United States dollar
"Financial reports" The financial reports of the company as at December 31, 2009 attached as chapter 3 to this report
"The Company" or "Frutarom"
Frutarom Industries Ltd., including its affiliated companies
"The Ordinance" Income Tax Ordinance (New Version)
"Share"
Ordinary share par value NIS 1.00 of the Company
"GDR"
Global Depositary Receipt
"Flachsmann"
Emil Flachsmann AG
"IFF"
International Flavors & Fragrances Inc.
"Nesse" GewurzMühle Nesse GmbH and GewurzMühle Nesse Gebr. Krause GmbH
"Acatris" Acatris Inc., Acatris Specialities Holding B.V., and Acatris Belgium NV
"Belmay"
Belmay Limited
"Jupiter"
Jupiter Flavours Limited
"Raychan"
Raychan Be'erot Yitzhak Food Industries Ltd.
"Adumim"
Adumim Food Additives Ltd.
"Abaco"
Abaco Manufacturing LLC and Abaco Incorporated
"Gewurzmuller Group"
Gewurzmuller GmbH and Blessing Biotech GmbH
"Rad"
Rad Natural Technologies Ltd.
"Oxford"
Oxford Chemicals Limited
"FSI"
Flavors Specialties Inc.
"CH" Christian Hansen GmbH and Christian Hansen A/S All the financial data in this report are in US dollars unless stated otherwise.

2
1. The Group's Activity and Description of the Development of its Business
General
1.1. Frutarom Industries Ltd. (the "Company" or "Frutarom") was associated in Israel in 1995 as a private company with limited shares under the name Frutarom NewCo (1995) Ltd. In 1996 the Company changed its name to Frutarom Industries Ltd.
1.2. Frutarom Ltd., a wholly owned subsidiary through which the Company
coordinates and holds its business and production activity, was established in 1933 as Frutarom Palestine Ltd. Frutarom's operations initially consisted of the cultivation of aromatic plants and flowers for the extraction and distillation of flavor and fine ingredients materials and essential oils.
1.3. In 1952, Frutarom's assets were purchased by Electrochemical
Industries Ltd. ("EIL").
1.4. In May 1996, as part of the Company's spin off from EIL, the Company's shares were listed for trade on the Tel Aviv Stock Exchange.
1.5. Today, the Frutarom Group is a global company which is one of the
ten leading companies in the world in the field of flavors and specialty fine ingredients mainly for the food, beverage, flavor, fragrance, pharma/nutraceutical, health and functional food, food additives and personal care industries. Each year the Company produces, markets and sells over 20,000 products to more than 13,000 customers in over 120 countries, has production facilities in Europe, North America, Israel and Asia, and employs 1,450 people.
1.6. In February 2005, the Company raised capital from international and
Israeli institutional investors by issuing shares and registering GDRs for trade on the London Stock Exchange Official List. The net proceeds from the capital raising are intended for use in financing future strategic acquisitions as part of Frutarom's rapid growth strategy, combining rapid internal growth of core activities at above average industry growth, with strategic acquisitions of activities and knowhow in Frutarom's main fields of activity and in strategic geographic locations, as well as to refinance the cost of acquiring IFF's European Food Systems business, which was completed during the second half of 2004.
For additional information on the Company's growth strategy refer to section 0 of this report. For additional information on the acquisition of IFF's Food Systems business in Europe, refer to section 1.15 of this report.
1.7. The main shareholder in the Company is the ICC Group, which,
through ICC Industries Inc.1, holds 21,308,025 shares, represeting 36.85% of the Company's share equity and voting rights.
1 ICC Industries Inc. directly and through its subsidiaries, holds the abovementioned shares. Dr. John
Farber who also serves as the Company's Chairman of the Board of Directors is the controlling shareholder of ICC Industries Inc. Maya Farber, the wife of Dr. John Farber, serves as a director in the Company.

3

4
1.8. In the second half of the 1980s, when Frutarom came under new management, it was decided to adopt a business strategy whose aims included materially growing the Company's international activities and establishing Frutarom as a major multinational company in its field by substantially expanding the Company's flavors activity, which is the Company's most profitable field of activity.
1.9. At the beginning of the 1990s, Frutarom's management decided to
expand the Company's global activity through acquisitions of companies and activities in the Company's fields of activity. Accordingly, at the beginning of the 1990s the Company acquired small flavors companies in the United States and United Kingdom. These acquisitions contributed to expanding Frutarom's geographic presence, product portfolio and customer base.
1.10. In 1993 the Company made its first strategic acquisition by acquiring
the Meer Corporation in the United States, a company that produced, marketed and sold natural botanical extracts, gums and natural stabilizers. This acquisition provided Frutarom with a significant foothold in the American market and considerably expanded its natural product portfolio.
1.11. During 1997 and 1998, Frutarom made a strategic decision to
penetrate and expand its activity in emerging markets by establishing subsidiaries in selected target countries. Accordingly, Frutarom established subsidiaries in Russia, Ukraine and Kazakhstan. The Company also established subsidiaries in Brazil, Mexico, Turkey, China and South Africa. Activity in these countries has grown significantly and become an important part of Frutarom's current and future activity. Frutarom intends to continue establishing additional subsidiaries and expanding its activities in emerging markets.
1.12. Since 1999, Frutarom have continued and will continue to execute its
rapid and profitable growth strategy while focusing and achieving organic growth in rates higher than those accepted in the industry in which it operates. During this period Frutarom made several strategic acquisitions of companies and activities that are complementary and synergetic with its own core activities by acquiring Baltimore Spice Israel Ltd. in 1999; CPL Aromas Ltd.'s flavors and fine ingredients activity in 2001 (refer to section 1.13); the Swiss company, Emil Flachsmann AG, in 2003 (refer to section 1.14); the European Food Systems activity of IFF during the second half of 2004 (refer to section 1.15); the German Nesse in January 2006 (refer to section 1.16); Acatris in October 2006 (refer to section 1.17); Belmay in England in March 2007 (refer to section 1.18); Jupiter in England in April 2007 (refer to section 1.19); Abaco in the USA in July 2007 (refer to section 1.20); the Adumim activity (refer to section 1.19) and Raychan (refer to section 1.22), which were completed in August 2007; the German Gerwurzmuller Group in October 2007 (refer to section 1.23), the Rad activity in November 2007 (refer to section 1.24), the assets and business of the UK company Oxford completed in January 2009 (refer to section 1.25) and the assets and business of FSI in March 2009 (refer to section 1.26) and the acquisition of the assets and the Savory activities of CH in June 2009 (refer to section 1.27).
1.13. Acquisition of activity from CPL Aromas Ltd. – In 2001 Frutarom,
through Frutarom (UK) Ltd., acquired the Flavors and Fine Ingredients

5
activities of CPL Aromas Ltd.'s. In consideration, Frutarom paid approximately US$ 16 million. This acquisition established Frutarom's position in the English market in which it later became a leading in the flavors market, expanded its presence in additional international markets (for instance: Western Europe, the United States and Asia) and its product portfolio.
1.14. Acquisition of Emil Flachsmann AG – In June 2003, Frutarom,
through Frutarom (UK) Ltd., completed the acquisition of 100% of the issued share equity of Flachsmann for a total consideration of approximately US$ 18 million.
Flachsmann was established in Switzerland in 1935 and develops, manufactures, markets and sells natural flavors, botanical extracts and natural functional food ingredients for the food and beverage, pharma/nutraceutical, and flavor and fragrance industries. The Flachsmann acquisition continues to be an important strategic step in Frutarom's business development.
1.15. Acquisition of IFF's European Food System Activity – During the
second half of 2004 Frutarom, through its subsidiaries in Switzerland, Germany and France, acquired IFF's European Food Systems business. The acquisition price was Eur 33.5 million (approximately US$ 41.3 million).
The acquired business develops, produces and markets Food Systems (for details of the Food Systems business refer to section 8.11 of this report), and has two production sites in Switzerland and Germany, as well as marketing, sales and research and development activities in Switzerland, Germany and France. The acquisition of IFF's European Food Systems activity significantly expanded Frutarom's food and beverage customer base, geographic reach in Europe, including entry into countries where Frutarom previously had little or no presence, and its product portfolio, including sales of products that integrate flavors, natural functional food ingredients and Food Systems.
1.16. Acquisition of Nesse2 – In January 2006, Frutarom acquired 70% of
the issued and paid up share equity of GewurzMuhle Nesse GmbH and GewurzMuhle Nesse Gebr. Krause GmbH. Companies owned by the Krause family, the sellers. The acquisition was performed through Frutarom Germany GmbH, a wholly owned subsidiary of Frutarom.
Nesse has been active since 1880 and became an international group. Nesse operates two production sites in Germany and has sales and marketing representatives in 20 additional countries, mainly Eastern and Western Europe. Nesse develops, produces, markets and sells innovative, unique savory solutions that include savory flavors and specialty functional ingredients. Nesse’s extensive customer base includes hundreds of food manufacturers, principally in Eastern and Western Europe.
2 For details concerning the valuation of Frutarom's savory activity in Germany in accordance
with Regulation 8b to the Israeli Securities Regulations (Immediate and Periodic Reports), 1970, see section 42 of this report.

6
Frutarom paid Euro 18.41 million for the acquisition and, during Q1 2008, an additional amount of Euro 18.89 million was paid for the exercise of an option for the acquisition of the remaining 30% of the issued and paid up share capital of Nesse and for the improvement in Nesse's operating profit during the years 2005-2007. Effective as of this report date, the Company holds 100% of Nesse's share capital. For additional details on the abovementioned exercise of option, see the Company's immediate report dated May 12, 2008 which was issued on the same date. The acquisition of Nesse and the exercise of option were another significant milestone in implementing Frutarom’s rapid growth strategy. The acquisition and the exercise of option strengthened Frutarom’s technological capabilities and offering to customers in the savory field and contributed to strengthening and positioning Frutarom in Western and Eastern Europe as a leading flavors supplier. The Nesse acquisition expanded Frutarom’s geographic spread to additional countries in which Frutarom was less active, such as Poland, Czech Republic, Latvia, and others. Nesse’s savory activity is synergetic with Frutarom’s activities in the more than 120 countries in which Frutarom operates, especially in Western and Eastern Europe. Frutarom is taking advantage of its large, dedicated global sales and marketing infrastructure to realize the substantial cross-selling opportunities created by the acquisition, by expanding both the customer base and by expending the product portfolio. During 2009, Frutarom continued to merge and consolidate the activities of Nesee, the Gewurzmuller Group, acquired on 2007, and CH's Savory activity, acquired on 2009, for the purpose of achieving maximum efficiency and operational saving. Frutarom continues to act to achieve optimal cross-selling opportunities in its global savory activities.
1.17. Acquisition of Acatris – In October 2006, Frutarom completed the acquisition of 100% of the share equity of the American company, Acatris Inc.; of the Dutch company, Acatris Specialities Holding B.V.; and of the Belgian company Acatris Belgium NV in consideration for Eur 10.5. The acquisition was performed through Frutarom's wholly owned subsidiary.
Acatris managed multinational activity from its centers in Holland and Belgium, through which it developed, produced and marketed active ingredients and unique, natural botanical extracts with scientifically proven health attributes that are supported by clinical research and protected by patents, and owns the Lifeline products that includes, among others, the products Fenulife, Soylife and Linumlife. The Acatris group sold its products to over 350 customers, some leaders in their fields, mainly in Western Europe and the USA in the nutraceutical, food, functional food and cosmeceutical markets. The acquisition of Acatris was strategic and an additional important step in implementing Frutarom’s strategy for rapid growth. This acquisition substantially strengthened the unique, natural product portfolio offered by Frutarom to its customers, particularly in the rapidly

7
growing nutraceutical and functional food markets, and Frutarom's position as a leading global manufacturer in these markets. The activity of Frutarom and Acatris are highly synergetic, especially in the field of unique natural products. Frutarom completed the integration of Acatris’s activity with the global organization of Frutarom’s Fine Ingredients Activity, particularly with the activity of Frutarom Switzerland (formerly Flachsmann) and Frutarom USA in the field of unique natural botanical extracts as part of the Frutarom Health business unit (for further details on Frutarom Health Business Unit refer to section 16.8 below). As part of Acatris' integration procedure with Frutarom's activities, the name of the American Company Acatris Inc. was changed into Frutarom Inc., the name of the Belgian Company Acatris Belgium NV was changed into Frutarom Belgium NV and the name of the Dutch Company Acatris Specialties Holding B.V. was changed into Frutarom Netherlands B.V.
1.18. Acquisition of Belmay – In April 2007, Frutarom completed the acquisition of 100% of the share equity of the English company Belmay in consideration for a payment in cash of US$ 17.8 million.
Belmay is a leading British flavor house that develops, produces and markets flavors, with a particular focus on natural flavors, for the food and beverage industry. Belmay has a site with significant production capacity that is located close to Frutarom’s production site in Kettering, England. Belmay’s extensive customer base includes leading food and beverage manufacturers in its countries of operation. The Belmay acquisition was also an important strategic acquisition that continues the implementation of Frutarom's rapid growth strategy and made Frutarom the leading flavor house in the British market. The Belmay acquisition significantly strengthened Frutarom’s technological capabilities and the product portfolio it offers its customers in the flavors field, especially in soft drinks and alcoholic beverages. Upon completing the acquisition, Frutarom acted to merge and consolidate Belmay's activity with that of Frutarom's Flavors Activity in England in order to achieve optimal operational efficiency and savings. During the period which commenced on the fourth quarter of 2007 and ended June 2008, Frutarom completed a process of reorganizing the activities of the Flavors Activity in England, including reducing headcount and merging the flavors activity of Frutarom's Flavors Activity in England—of Belmay, Jupiter and Frutarom UK—at Belmay's site.
1.19. Acquisition of Jupiter – In April 2007, through its subsidiary Frutarom (UK) Limited, Frutarom acquired 100% of the share equity of the English company Jupiter Flavours Limited, which developed, produced and marketed flavors. In consideration, Frutarom made cash payment of US$ 2.8 million. In accordance with the acquisition agreement, an additional payment of US$ 600,000 was made based on Jupiter's results during 2007.
The acquisition of Jupiter, which joins Frutarom’s acquisition of the British company, Belmay (for further details refer to section 1.18

8
above), contributed to strengthening Frutarom’s activity in Britain and to its position as the leading flavors producer in the British market. Until June 2008, Frutarom completed the integration of Jupiter's activity with its existing activity in England, as stated.
1.20. Acquisition of Raychan – In August 2007, Frutarom completed the acquisition of Raychan for a consideration of US$ 1 million and the assumption of Raychan’s debt in the amount of US$ 1.2 million.
Raychan develops, produces and markets flavor compounds and markets ingredients for the food industry. Raychan’s activity was highly synergetic with Frutarom’s activity in Israel and that of Nesse, which was acquired by Frutarom at the beginning of 2006, and broadened Frutarom’s product offering in the fields of savory and functional products and solutions to its customers in Israel and worldwide. During the fourth quarter of 2007, the merger and integration of Raychan's activities at Frutarom's site in Acco was completed during the fourth quarter of 2007 while achieving operational savings.
1.21. Acquisition of the activities of Adumim – In August 2007, Frutarom completed the acquisition of the activity of Adumim. According to the agreement, Frutarom acquired Adumim’s assets (without Adumim's liabilities and excluding real estate and the customer, debit and cash balances) in consideration for US$ 4.3 million. Adumim has two main fields of activity: the development, production and marketing of ingredients and unique fine ingredients for the food and functional food industries, and the development and production of dietary additives containing medicinal plant extracts, vitamins and minerals. Adumim’s activity is synergetic and complements Frutarom’s operations and broadened Frutarom’s product portfolio and the natural, healthful solutions which Frutarom offers its customers worldwide, especially in the fields of food, nutraceuticals and functional food. The acquisition also strengthened Frutarom in the natural emulsions and clean label areas, both of which are characterized by an above average growth rate. Adumim’s products, some of which are patented, were integrated into Frutarom’s product offering. The completion of the merge of Adumim's activities with Frtuarom's existing activities in Israel, while achieving substantial operating savings, was completed during the first quarter of 2008.
1.22. Acquisition of Abaco – In July 2007, through its subsidiary Frutarom USA, Frutarom signed an agreement to acquire 100% of the ownership of Abaco (including Abaco Manufacturing LLC and Abaco Incorporated), a private American company, for a consideration of US$ 4 million (and the assumption of Abaco's debt in the amount of US$ 1.1 million).
Abaco developed, produced and marketed unique ingredients for the flavors and fragrances industry and its activity is very compatible with that of Frutarom's Fine Ingredients Activity, whose main development laboratories and production facilities are in the USA, England and Israel. The acquisition mainly expands the activity of Frutarom USA.

9
The acquisition strengthened Frutarom's capabilities and expertise in the field of unique ingredients for the flavor and fragrance industry and improved Frutarom's service and quality to customers in the field, particularly in the USA. The process of integrating Abaco's activity with Frutarom USA's existing activity was completed during the fourth quarter of 2007.
1.23. Acquisition of the Gewurzmuller Group3 – In October 2007,
Frutarom acquired 100% of the share equity of the Gewurzmuller Group for a cash consideration of US$ 67 million (about Euro 47.3 million). The acquisition agreement determined a future payment mechanism such that the final payment to be made will reflect the Gewurzmuller Group's value based on an average multiple of 7.1 on the EBITDA that the Gewurzmuller Group achieves during the twelve months ending December 31, 2007. During the third quarter of 2008, Frutarom paid the remaining said consideration for the acquisition of the Gewurzmuller Group in an amount of approximately US$ 21.7 million (approximately Euro 13.9 million). For further information on the acquisition of the Gewurzmuller Group, refer to the Company's complementary Immediate Report dated October 17, 2007 and published at the time.
Gewurzmuller was established in 1896by the Rendlen, the seller, family. Gewurzmuller develops, produces and markets unique and innovative savory solutions, including savory flavors, seasoning compounds and functional ingredients for the food industry, with special emphasis on the fields of processed meat and convenience food. Blessing Biotech GmbH develops, produces and markets starter cultures, which are natural products based on microbiological processes, mainly fermentation of microorganisms and enzymes, and which are used to manufacture food, especially meat, dairy and baked goods. Starter cultures enable food manufacturers to control flavor, color, texture and product shelf life.
The Gewurzmuller Group operated two production sites in Stuttgart, Germany. The main site, which was renovated four years ago, is modern and efficient and would allow a substantial increase in production capacity. This site meets the most exacting standards of the European food industry. The Gewurzmuller Group has sales and marketing representatives in 12 countries. The Gewurzmuller Group's extensive customer base includes thousands of food manufacturers, among them leaders in their field, especially in Eastern and Western Europe, in particular Germany, Austria, Switzerland, Sweden, Denmark, Russia, Ukraine and Bulgaria. Gewurzmuller's activity is especially synergetic with Frutarom's activity. During 2009, Frutarom acted to merge and consolidate the activities of Nesse, the Gewurzmuller Group and the Savory activities of CH for the purpose of achieving maximum efficiency and operational saving. , The acquisition considerably boosted both Frutarom's technological
3 For details concerning the valuation of the Nesse Activity, the Gewurzmuller Group and the
Savory activity of CH, according to section 8b to the Israeli Securities Regulations (Immediate and Periodic Reports), 1970, see section 42.

10
capabilities and its product offering to customers worldwide in the field of savory flavors and functional products, as well as Frutarom's extensive global customer base. Frutarom is acting and will continue to act in order to exploit the full cross selling opportunities arising from this important acquisition. The acquisition of Gewurzmuller further establishes Frutarom's position as one of the ten largest global leaders in the field of flavors and enhances its presence and position as a leading global producer of savory flavors.
1.24. Acquisition of Rad – In November 2007, Frutarom acquired the activity of Rad through its subsidiary, Frutarom Ltd. Rad researches, develops, produces, markets, distributes and sells unique natural plant extracts with anti-oxidant activity for use in food, dietary supplements and cosmetic products. RAD possesses unique knowhow, which is protected by patents, in this field.
In accordance with the acquisition agreement, Frutarom acquired Rad's assets in consideration for a cash payment of US$ 4.1 million. Rad's activity is synergetic with and complements Frutarom's activity and expands the range of natural health and taste solutions that Frutarom offers its customers worldwide. Rad has an impressive pipeline of projects together with its varied customers throughout the world, including large, multinational leaders in their field. RAD's products, which are protected by patents, will be integrated with the product offering of products produced and marketed by Frutarom's Flavors Activity.
1.25. Acquisition of Oxford's assets and business – in January 2009, Frutarom completed the acquisition of the assets and business of the UK Company Oxford in consideration for approximately US$ 12 million (₤ 8.25 million). In 2008, the sales turnover of Oxford's activity totaled approximately US$ 14.54 million (approximately £ 10.0 million) and the operating profit was approximately US$ 1.5 million (approximately £ 1.0 million). For additional details in the matter of the acquisition of Oxford's assets and business, see the Company's immediate reports dated January 5, 2009 issued on January 5, 2009, dated January 12, 2009 issued on January 12, 2009 and dated February 2, 2009 issued on February 2, 2009. Oxford which was established in 1973 employed approximately 70 people on its acquisition date. Oxford developed, produced and marketed specialty ingredients for the flavor and fragrance industry. Oxford's activity is highly synergetic with Frutarom's global activities in the field of Specialty Fine Ingredients,, whose development laboratories and production facilities are located in the U.S., UK, Switzerland and Israel. Activity The acquisition expanded the Specialty Fine Ingredients products which Frutarom offers her customers as well as its customer base around the world. Frutarom acts to utilize the many cross-selling opportunities which arise from the acquisition by selling its products to Oxford's customers around the world as well as selling Oxford's products to Frutarom’s existing customers, especially in markets where Oxford has not had any significant activities prior to
4 As at the date of completing the acquisition.
11
the acquisition. Oxford has a pipeline of innovative and interesting products under development, with emphasis on natural flavors.
Frutarom and Oxford have two production and development plants located in close proximity in Northern England. During Q2 2009, Frutarom completed the merger of activities in the two UK plants, while achieving operational savings and maximizing the synergy; including with other Frutarom's plants around the world (including its plant is Israel), inter alia, by integrating its research and development, operations, marketing, purchasing and sales infrastructure with that of Oxford.
1.26. Acquisition of FSI's assets and business - in March 2009, the Company signed, through its wholly owned subsidiary, Frutarom USA, Inc., an agreement to acquire the assets and business of the US Company FSI in consideration for approximately US$ 17.2 million. The acquisition agreement determines a future earn-out mechanism, based on the average EBITDA to be reached by FSI's activities during the 24-month period ending on December 31, 2010, multiplied by 5.5, so that the total consideration may increase up to US$ 27 million or decrease up to US$ 13.15 million. For additional details in the matter of the acquisition of FSI's business and assets, see the Company's immediate report dated March 4, 2009 issued on that date.
In 2008, FSI's sales totaled approximately US$ 11.51 million and the adjusted EBITDA5 totaled approximately US$ 3.57 million6. The acquisition of FSI's activity significantly strengthens and establishes Frutarom's Flavor activity in North-, Central- and South-America. During 2009, Frutarom acted to implement its plan to merge and consolidate the acquired activity with its activities in the US. FSI is a flavor and botanical extracts company that develops, produces and markets flavors and botanical extracts mainly for the food and beverage industry. FSI was established in 1979 by 3 experienced and reputable founders. FSI has a production site in Corona, California, in the West Coast of the US. FSI's broad customer base includes leading food and beverage manufacturers in its countries of operation.
1.27. Acquisition of CH's assets and Savory activities7 8 - in June 2009,
Frutarom signed, via its subsidiaries in Germany, an agreement to acquire CH's assets and Savory activities in consideration for a cash payment of approximately US$ 7.3 million (Euro 5.275 million).
CH's Savory activity develops, manufactures and markets unique and innovative Savory flavor solutions which include flavors, seasoning
5 After adjustment for nonrecurring expenses and various adjustments which arise from FSI being a
private company. 6 FSI's financial data are based on FSI's managerial and tax reports, which were not audited or reviewed
by the auditor and the actual results may therefore significantly differ from the above financial data. 7 For details concerning the valuation of the Nesse Activity, the Gewurzmuller Group and the Savory
activity of CH, according to section 8b to the Israeli Securities Regulations (Immediate and Periodic Reports), 1970, see section 42. 8 While referring to the financial data mentioned above (hereinafter: "The Financial Data") it will be
emphasized that the financial data are based on CH's managerial reports which were not audited or reviewed by an auditor and therefore the actual results may be different from the financial data mentioned above.

12
mixes and functional raw materials to the food industry with a special emphasis on the processed meat field and convenience food. The acquired activity has a large customer base, mainly among the leading meat manufacturers in Germany and export activity to Scandinavia and to UK. The activity is highly synergetic to those of the German Nesse and Gewurzmuller Group which were acquired by Frutarom in 2006 and 2007. The acquired activity had a manufacturing site in Holdorf, Germany, which is approximately 140 kilometers far from Frutarom's manufacturing site in Nesse. During 2009, Frutarom acted to merge and consolidate the activities of Nesse, the Gewurzmuller Group and CH's Savory activity for the purpose of achieving maximum efficiency and operational saving.
1.28. The consolidation trend in Frutarom's field of activity continues and in the last few years a reduction occurred in the number of players in this field. Frutarom, which is one of the ten biggest companies in the world in the F&F field, continues to be one of the leading and most active companies as acquirer. Frutarom's management will continue to invest substantial resources in locating and executing potential new acquisitions which will fit its rapid growth strategy.
The Company estimates that its solid capital structure, the strong cash-flow it achieves and support from financial institutions will continue to enable it to execute additional strategic acquisitions.
2. The Group's Fields of Operation
Frutarom is a global company that develops, manufactures, markets and sells flavors and specialty fine ingredients used in the production of food and beverage, flavors and fragrances, pharma/nutraceutical, personal care and other products. Frutarom has two main activities, each of which is a main field of activity and reports as a business sector in the Company's consolidated financial reports (refer also to Note 6 in the financial reports for 2009, which are included in this periodic report), as detailed below:
2.1. The Flavors Activity– Frutarom's Flavors Activity develops, produces,
markets and sells high quality, value added sweet and savory flavors and Food Systems products used mainly by manufacturers of food and beverages and other consumer products. Frutarom develops for its customers thousands of different flavors, most of which are tailor-made, and continuously develops new flavors in order to meet changing consumer preferences and customer needs. The Flavors Activity is the most profitable of Frutarom's Activities and has experienced rapid growth since 2001. Flavor sales increased from US$ 39.1 million in 2001 to US$ 297.1 million in 2009. The growth in the sales of the Flavors Activity derives from focusing on both developed and emerging markets and by serving multinational, mid sized, local and private brand customers, and the execution of strategic acquisitions. The proportion of Frutarom's total sales under the Flavors Activity has increased from 39.0% in 2001 to 70.0% in 2009.
2.2. The Specialty Fine Ingredients Activity– As part of Frutarom's
Specialty Fine Ingredients Activity develops, produces, markets and sells natural flavor extracts, natural functional food ingredients, natural

13
pharma/nutraceutical extracts, specialty essential oils, citrus products, aroma chemicals, and natural gums. The Fine Ingredients are sold principally to the food and beverage, flavor and fragrance, pharmaceutical and personal care industries. The sales of Fine Ingredients have experienced significant growth since 2001, with sales increasing from US$ 57.5 million in 2001 to US$ 123.8 million in 2009. The growth in sales was achieved by focusing primarily on the development of new and innovative value-added products, and as a result of several successful strategic acquisitions, and by focusing on multinational, mid sized customers. The proportion of Frutarom's total sales represented by the products of the Fine Ingredients Activity totaled 29% in 2009.
Although a majority of the fine ingredients produced by the Company are sold to third parties, a portion of Frutarom's specialty fine ingredients production, for example in citrus, is reserved solely for use by the Flavors Activity in its production of certain flavors, giving Frutarom a unique advantage.
2.3. Trade & Marketing Activity – in addition to the Flavors and Specialty
Fine Ingredients activities, Frutarom trades and markets various raw materials produced by third parties to customers in Israel. Due to the reason that this activity is considered as non core activity and sue to its low volume, it will not be reviewed separately in this report. In 2009, the activity totaled US$ 7.1 million and its relative portion of Frutarom's total sales was 2.0%.
3. Investments in the Company's Capital and Transactions in its Shares
3.1. In a significant private placement and non significant private offering
made by the Company in January 2004, the Company allocated 900,000 shares par value NIS 1.00 each of the Company to three officers in the Company, including the President of the Company, Mr. Ori Yehudai, as part of the Options Plan for officers (refer to section 29.9of this report).
3.2. In a non material private placement made by the Company in June
2004, the Company allocated to an officer 150,000 inconvertible options to an officeholder in accordance with the instructions in Section 102(b)(3) of the Income Tax Ordinance (New Version). Each option may be exercised to one ordinary share par value NIS 1.00 each of the Company and in total to 150,000 ordinary shares of the Company. In June 2007, the officeholder realized 30,000 options for which the Company allocated 30,000 shares in consideration for NIS 326,100. In May 2008, the senior officeholder exercised 40,000 options against which the Company allocated 40,000 shares in consideration for NIS 434,800. In May 2009, the senior officeholder exercised the remaining 40,000 options against which the Company allocated 40,000 shares in consideration for NIS 434,800.
3.3. On February 8, 2005 the Company completed an offering by way of issuing its shares and registering GDRs in the London Stock Exchange Main Listing ("capital recruitment"). In recruiting the capital the Company offered 10,000,000 ordinary shares (in the form of shares and GDRs wherein each GDR represents one share). The shares were sold for NIS 33.50 for each share and the GDRs for US$ 7.63 for each GDR (the "Offering Price"). The Company received proceeds of

14
approximately US$ 76.3 million for the Offering. The net proceeds (deducting commission to the underwriters and other expenses related to the Offering, totaling US$ 4.9 million) received by the Company totaled US$ 71.4 million.
3.4. As part of the offering stated in section 3.3, ICC Handels AG, a fully
owned subsidiary of ICC Industries Inc. (the controlling party in the Company) sold 2,000,000 shares in the Company at the Offering Price.
3.5. On February 16, 2005, UBS, on behalf of the underwriters, notified the
Company and ICC Handels AG of the full exercise of the over- allotment option given by the Company and by ICC Handels AG to purchase up to 1,200,000 additional shares in the Company at the Offering Price. Upon exercise of the option, the Company issued 600,000 additional shares and 600,000 existing shares were sold by ICC Handels AG.
3.6. Once the option was exercised, the total size of the Offering was
13,200,000 shares of the Company of which 10,600,000 were sold by the Company and 2,600,000 by ICC Handels AG. Upon exercise of the option, the proceeds from the offering totaled to US$ 4.6 million. The net proceeds (minus commission to the underwriters and other expenses related to the Offering totaled US$ 0.2 million) that the company received increased by US$ 4.4 million and totaled US$ 75.8 million.
3.7. In a material private placement and non material private placement
made by the Company in January 2006, the Company allotted 725,000 non-transferable options to four senior officers of the Company, among them the Company's president, Mr. Ori Yehudai. The options were allocated to the officers without remuneration in accordance with the instructions of Section 102(b)(3) of the Internal Revenue Ordinance. Each option is exercisable into one share in the Company, and in total for 725,000 ordinary shares in the Company. In May 2009, 125,000 options expired in accordance with the terms of the private offering as a result of the retirement of a senior officeholder. In September 2009, 125,000 additional options expired in accordance with the terms of the private offering as a result of the retirement of another senior officeholder. Effective as of December 31, 2009, in accordance with the private offering, the remaining options stand at 475,000 untradeable options.

15
4. Distribution of Dividends
4.1. The Company's policy regarding distributing dividends, including the amount of the distribution, depends on several factors, including the level of the Company's profitability and its investment plans and strategic acquisitions.
In recent years the Company has declared and distributed dividends to its shareholders as detailed in the following table (in NIS thousands):
Year Price Per Share Total Sum
NIS 000 Total Sum US$ 000
2008 0.18 10,387 3,006 2009 0.18 10,401 2,485
The stated dividend does not require the approval of a court of law.
4.2. As of 31.12.2009 the distributable retained earnings are US$ 190,237.
Upon approval of the financial reports for the period ended December 31, 2009, the Board of Directors of the Company decided to distribute a cash dividend in the amount of NIS 0.18 per share for an overall total of NIS 10,408 thousands.
4.3. The Company intends to continue distributing dividends to its
shareholders in the future. At the same time, there is no certainty that the stated dividend will be declared and distributed in the future, and it is also uncertain that if a future dividend were to be distributed, it would be in accordance with that described above.

16
CCHHAAPPTTEERR 22 –– OOTTHHEERR IINNFFOORRMMAATTIIOONN 5. Financial Data Regarding the Company's Fields of Activity
5.1. Following are financial data for the Group broken down by fields of activity for the years 2007 through 2009 (in US$ 000)9:
2009
Field of activity Consolidated
Flavors Fine Ingredients
Adjustment to consolidated
From external 297,062 121,043 7,074 425,179
2,735 (2,735)
Income
From other fields of activity
Total Income 297,062 123,778 4,339 425,179
2,735 _____ (2,735) _____
Expenses Expenses that are income of other fields of activity
256,615 114,585 6,694 377,894
Expenses that are not income of other fields of activity
Total Expenses 259,350 114,585 3,959 377,894
Operating Profit 37,712 9,193 380 47,285
Total Liabilities 71,276 32,630 103,732 207,638
Total Assets 295,448 94,940 135,725 526,113
2008
Field of activity
Flavors Fine Ingredients
Adjustment to consolidated
Consolidated
From external 339,819 120,292 13,175 473,286 Income
From other fields of activity - 4,047 (4,047) -
Total Income 339,819 124,339 9,128 473,286
Expenses Expenses that are income of other fields of activity
4,047 - (4,047) -
Expenses that are not income of other fields of activity
288,215 116,007 12,453 416,675
Total Expenses 292,262 116,007 8,406 416,675
Operating Profit 47,557 8,332 722 56,611
Total Liabilities 73,403 24,849 134,280 232,532
Total Assets 279,571 74,726 156,495 510,792
9 The profit from normal activities of all subsidiaries is attributable to the Company.

17
2007
Field of activity
Flavors Fine Ingredients
Adjustment to consolidated Consolidated
From external 247,672 110,088 10,501 368,261 Income
From other fields of activity
-- 4,863 (4,863) --
Total Income 247,672 114,951 5,683 368,261
Expenses Expenses that are income of other fields of activity
4,863 -- (4,863) --
215,986 107,047 10,702 333,735
Expenses that are not income of other fields of activity
Total Expenses 220,849 107,047 5,839 333,735
Operating Profit 26,823 7,904 (201) 34,526
Total Liabilities 154,067 17,231 126,298 297,596
Total Assets 320,808 77,642 150,261 548,711
5.2. Significance of Adjustment to Consolidated – The intercompany trade
and marketing activity and sales and purchases between are cancelled in the framework of the adjustment to the consolidated.
5.3. Explanation of Developments – For an explanation of developments
that occurred in the data shown above refer to the explanation in the Directors Report for the year ended December 31, 2009.
6. Market Environment and Influence of External Factors on the Company's
Activity
Market Environment – Global Flavor and Fragrance Industry
6.1. Frutarom operates in the global flavors and fine ingredients markets. The segments of the flavors market in which Frutarom operates are flavor compounds and food systems. The segments of the fine ingredients market in which Frutarom principally operates include natural flavor extracts, natural functional food ingredients, natural pharma/nutraceutical extracts, specialty essential oils, citrus products and aroma chemicals.
6.2. The research company Leffingwell & Associates10 estimates the global
market for flavors, fragrances and fine ingredients to be approximately US$20billion in 2009. Frutarom does not operate in the market for fragrance compounds, but does operate in the markets for functional food ingredients (which is not included in the above estimation). Accordingly, the Company believes that the global market in which it
10
2005-2009 Flavor & Fragrance Industry Leaders

18
operates had sales of approximately US$ 16 billion. Based on Leffingwell & Associates’ data, Frutarom is ranked globally as one of the top ten companies in the field of flavors and fragrances.
6.3. In 2009, IAL Consultants11 estimated that global sales in industrialized
nations (the USA and Western Europe) in the flavors and fine ingredients markets in which the Company operates will grow at an annual rate of between 1.9% and 3.2% during 2009-2014. In the Company's opinion, the volume of sales in these countries in the Fine Ingredients markets in which the Company operates will increase at a similar annual rate during 2009-2014. In accordance with these estimations, the growth rate in emerging markets in which Frutarom operates, such as Eastern Europe, Russia, China, India, Central and South America is expected to be significantly higher, reaching average annual rates of between 3.9% and 6% from 2009 to 2014.
6.4. In the last months of 2008 the economic climate in the world changed
and a financial crisis which penetrated the global economy changed the growth trend characterizing most of the world's economies in recent years and the business environment in which Frutarom operates. Frutarom entered into this challenging economic period as a leading global company, stronger-than-ever, with an experienced global management, an excellent variety of customers – multinational and regional throughout the world, with excellent technologies and products and an excellent pipeline of products under development, in collaboration with its many customers. Upon the breakout of the global economic crisis, Frutarom deepened its focus and decisively acted to strengthen its operational efficiency while tightly reducing and controlling its expense level. At the same time, Frutarom further strengthened the R&D and Sales infrastructures in order to ensure its further future growth. In spite of the relative slowdown in the markets of Frutarom's operation, which originate in the global economic crisis, it estimates that Frutarom maintained the market share with its customers. Frutarom estimates that the stabilization of the global economy in recent months, the moderation in currencies fluctuations, the halt of the destocking trend and the signs of gradual improvement in consumption, including in countries significantly affected by the devaluation in their currency, including in countries affected by significant depreciation in their currency rate, may contribute to an improvement in our sales level and to future return to a growth trend at rates similar to those characterizing our activities in the past.
6.5. The flavor, fragrance and fine ingredients industry can be divided into
main groups: (i) large multinational companies, (ii) mid-sized companies and (iii) local and small companies.
Large multinational companies generally operate globally and have revenues in excess of US$ 1 billion. In the global Flavor and Fine Ingredients markets there are five such companies. According to Leffingwell & Associates they represented approximately 60% of the flavor, fragrance and fine ingredients market as measured by sales (excluding sales of natural functional food ingredients and pharma/nutraceutical extracts). These multi national companies
11
IAL Consultants October 2009.

19
generally focus primarily on customers who are large multinational food and beverage producers. Local and small companies generally have revenues of less than US$ 100 million (most of them are much smaller and sell only several million dollars). In the global Flavor and Fine Ingredients markets there are approximately 300-400 such companies. Leffingwell & Associates estimates, that, in sales terms, these companies represent approximately 23% of the flavor, fragrance and fine ingredients market (excluding sales of natural functional food ingredients and pharma/nutraceutical extracts). These companies generally focus on smaller local customers and have limited service and research and development capabilities.
Mid-sized companies ,to which Frutarom also belong, have revenues of between US$ 100 million and US$ 1 billion. In the global Flavor and Fine Ingredients markets there are only seven such mid-sized companies. Leffingwell & Associates estimates that these companies represented approximately 17% of the flavor, fragrance and fine ingredients market as measured by sales (excluding sales of natural functional food ingredients and pharma/nutraceutical extracts). About half of the mid-sized companies are focused on specific geographical markets such as the USA and Japan. The rest are companies with a global deployment and comprehensive and diverse product offering.
6.6. The flavors and fine ingredients market in which the Company is active
is characterized by high entry barriers:
� Long term relationships – The market is characterized by long term relationships between manufacturers and their customers, which include mostly the food and beverage, flavor and fragrance and pharma/nutra industries. These industries impart great importance to reliability, quality of service and the manufacturers' knowledge and understanding of the customers' needs.
� Research and development – Since the preferences of the end users are constantly changing and the customers' markets (mainly food and beverage) are dynamic and competitive, the market is characterized by a large number of new and innovative products. Accordingly, manufacturers are required to invest in research and development and to offer a wide range of new innovative products, some of them at the manufacturer's own initiative and some in cooperation with the customer.
� Compliance with quality and regulatory standards – The flavors and fine ingredients are principally intended for the food and beverage and pharma/nutra industries, which are subject to strict quality and regulatory standards, as a result of which manufacturers are required to meet the same strict standards.
� The importance of flavors in the final product – Since the flavors play a major role in determining the flavor of the end-product, they are often a vital element in determining its success. Since the flavors can not be precisely matched and as they represent a comparatively small percentage of the final product's overall cost, the food and beverage manufacture will usually avoid replacing the flavors manufacturer.

20
� Investments in production in the field of fine ingredients – In the fine ingredients field, considerable capital investment is required to build manufacturing facility and/or increase production capacity. These investments comprise a significant entry barrier to new manufacturers in the field.
In view of the entry barriers described above, the market is characterized by an absence of new manufacturers, other than through mergers and acquisitions. In general, the market is characterized by a trend of consolidation and a decrease in the number of manufacturers.

21
CCHHAAPPTTEERR 33 –– DDEESSCCRRIIPPTTIIOONN OOFF TTHHEE CCOOMMPPAANNYY''SS BBUUSSIINNEESSSS BBYY
FFIIEELLDDSS OOFF AACCTTIIVVIITTYY
6.7. Frutarom is a global company that develops, manufactures, markets and sells flavors and specialty fine ingredients used in the production of food and beverage, flavors and fragrances, pharma/nutraceutical, personal care and other products. Frutarom operates principally in two activities, each of which constitutes a main field of Activity12 - the Flavors activity and the Specialty Fine Ingredients Activity
6.8. Both activities of the Company are complementary and synergetic to a
great extent. This synergy finds expression in a number of areas:
� Sales and marketing – Frutarom's sales and marketing policy is that a single dedicated sales person works with a certain customer to sell all the variety of Frutarom products. The products of the Specialty Fine Ingredients intended for the food and beverage industry are sold through the Flavors sales personnel.
� Research and development – The knowhow and knowledge of the Flavors Field personnel with the needs of the food and beverage industry enable to develop and produce new and innovative specialty fine ingredients that meet their needs.
� Operations – A significant number of Frutarom's production sites are shared , thereby sharing the same resources.
� Fine ingredients – Most of the specialty fine ingredients produced by
Frutarom are sold to third parties. At the same time, a small portion of the fine ingredients are used solely by Frutarom's Flavors Activity in its production of unique flavors that give Frutarom a unique competitive advantage.
In view of the considerable synergy that exists between the two activities and their complementary activity, it is not always possible to separate the fields of activity according to the various characteristics.
12
In addition to its flavors and fine ingredients activities, Frutarom also imports and markets various raw materials, not produced by it, to customers in Israel. This activity is not considered a core activity and in 2009 totaled at approximately US$ 7.1 million, being 2 % of Frutarom activity. In view of the fact that this activity is not significant for Frutarom, it has not been dealt with separately in this report, although it is reported as a separate business segment in the financial reports.

22
Flavors Market
7. Overview of the Flavors Market
General
7.1. Flavor compounds are the key building blocks that impart taste in food and beverage products and, as such, play a material role in determining the consumer acceptance of the end products in which they are used.
7.2. The Company estimates that global sales of flavor compounds in 2009
amounted to US$ 7.7 billion. Flavors products are sold principally to producers of prepared foods, beverage, dairy, bakery, meat and fish, confectionery and pharmaceutical products.
Examples of end user products using flavors are:
� Beverages – carbonated, noncarbonated, sport and functional,
alcoholic and juices � Dairy – yogurt, drinking yogurt, ice cream, cheese and chilled
desserts � Bakery – cakes and cookies, crackers and cereals � Confectionery – candy, chocolate, jam and chewing gum � Savory and convenience food – ready meals, instant soup, ready
sauces and instant noodles � Snacks – potato chips and other savory snacks � Meat – sausages and frankfurters
� Oral hygiene and pharmaceuticals – toothpaste, mouthwash,
vitamins and medicines
� Others – tobacco, animal feed and pet food
7.3. The global market for flavors has expanded rapidly over the last 60 years, primarily as a result of an increase in demand for, as well as an increase in the variety of, consumer end products containing flavors. The demand for consumer goods containing flavor products has increased as a result of rapid population growth and consumer preferences resulting from various factors such as increases in personal income, leisure time, health concerns and urbanization. These factors have led to an overall increase in food and beverage products containing flavors and to rapid growth in demand for convenience food and foods with healthier and/or natural content.

23
7.4. The following table sets forth the sales of flavors compounds by region in 2009 and the projected annual growth rate in these geographic regions13:
Country Estimated world consumption in 2009
(US$ million)
Average growth expected in 2009-2014
Western Europe 1,742 1.9% Eastern Europe 173 3.9% North America 2,334.9 3.2% South America 474.5 6.9% Asia - Pacific 1,982.3 5.2% Middle East and Africa
421.5 3.4%
Total 7,128.3 3.7%
7.5. In 2009, North America and Western Europe together accounted for
approximately 50% of flavors compounds sales worldwide, although they accounted for less than 10% of the world's population. Demand for flavor compounds in developed countries is expected to grow moderately, with more rapid growth expected in emerging markets such as Eastern Europe, Russia, China, India and South America. Frutarom estimates that the growth rates are even higher in many of the emerging markets in which it operates. Sales in these regions are expected to grow as a result of projected growth in GNP in these regions and from changes in consumer preferences. The continuation of the global economic crisis also in 2010 may affect the levels of demand for Frutarom's products including on demand levels to flavors.
7.6. An additional important segment of the flavors market is the food systems business, consisting of ripples, fillings and other preparations made from fruit, vegetables and other natural ingredients used in a wide range of food products, such as dairy and ice cream, sweet and savory baked products, convenience food and other prepared food products.
Characteristics of the Flavors Market
7.7. Reliable and high levels of service – Food and beverage producers, the
principal customers of flavors manufacturers, expect reliable and high levels of service that meet their needs in terms of support and lead time, while maintaining high quality, regulatory and safety standards. This in turn encourages long term relationships between flavor producers and their customers. As a result, large multinational customers, and increasingly, mid sized customers, have limited the number of their flavor suppliers, placing those that remain on "core lists," creating a barrier to entry for small flavor manufacturers.
7.8. Research and development – The development of new flavor products
is a complex, artistic and technological process calling upon the many combined knowledge and skills of a flavor manufacturer's research and development personnel. Effective research and development is important to ensure a continuous stream of innovative products and to maintain the profitability and growth of a flavor manufacturer. The initiative for the development of new flavor products either comes from the flavor manufacturer itself or from the customer for use in a specific
13
Estimate based on 2009 IAL Consultants.

24
newly developed end product. As such, in order to anticipate market demands, a flavor manufacturer's research and development personnel are required to be familiar with the different taste requirements of the different end product types and target markets. In addition, as most flavors are tailor made for a specific customer, a close collaborative relationship with customers is required. These flavor product formulas are generally treated as trade secrets and remain proprietary to the flavor manufacturer. As most flavor products are tailor -made specifically for use in a given end product, customers are less likely to change suppliers for such flavor products during the course of such end products' life cycle.
7.9. Low price sensitivity – Flavor products play a major role in determining
the flavor of the end product to which they are added, and are often a vital element in such product's success. At the same time, flavor products represent a comparatively small percentage of an end product's total cost. Demand for flavor products is generally less sensitive to changes in price, as customers generally place a greater emphasis on a flavor product's performance, quality and consistency than on its price when selecting a supplier.
7.10. Production processes – Flavor products typically contain a large
number of ingredients (typically over 30), which are blended using formulas created by a manufacturer's flavorists. The production processes involved in the manufacture of flavors products are less complex and capital intensive compared to fine ingredients. However, the production process for flavor products requires skill and knowhow to achieve the required consistency and quality.
7.11. High and relatively stable profitability – As the flavors market tends to
be characterized by long term relationships and customer loyalty, combined with relatively low price sensitivity and simple production processes, the flavors market generally benefits from high and stable margins (including in comparison to the fine ingredients industry).
End User Market Characteristics
7.12. As flavors are primarily sold to food and beverage producers, the
flavors market is generally driven by trends in the food and beverage end user market. According to IAL Consultants, global sales in the food and beverage market amounted to approximately US$ 1,424 billion in 2009. Frutarom believes that over 50% of such total global sales are generated by mid sized and local and small food and beverage producers. Although there has been a general trend towards consolidation in the food and beverage industry, Frutarom believes that mid sized (annual revenues of between US$ 100 million and US$ 3 billion) and local and small (annual revenues of below US$ 100 million) food and beverage producers will continue to play a significant role in the market, and that new mid sized, local and small producers will continue to emerge.
7.13. The large multinational flavors manufacturers tend to focus primarily on
the large multinational food and beverage producers, offering their customers a high degree of service and tailor made product development. Frutarom believe that these flavors producers focus to a lesser extent on mid sized customers, offering limited service and tailor made product offering to these customers. However, the Company

25
believes that mid sized and local food and beverage producers generally require the same degree of service and tailor made products as the large multinational food and beverage producers, and also require short lead times and manufacturing flexibility. The local, small flavors manufacturers generally do not have the product breadth and service capabilities to support the mid sized and local food and beverage producers' needs, creating a market opportunity for mid sized flavors manufacturer to service this segment.
7.14. The following are the main trends in the consumer market for food and
beverage which drive the flavor market:
� Local and global tastes – Since tastes vary in different geographic locations and among different cultures, flavor manufacturers are required to have a thorough knowledge of local tastes in each of the countries in which they are active. Accordingly, it is important for a global flavors manufacturer to have a physical presence in its key target markets and to have direct contact with customers in order to better understand local tastes and to be able to respond quickly and efficiently to changes in consumer preferences. In addition, a globalization trend is now characterized the flavors industry, as multinational food and beverage customers are now launching global brands in many different markets simultaneously.
� Strong trend towards natural products – There has been a general
increase in consumer demand for food and beverage products that contain natural ingredients and have dietary values (reducing fat, salt, cholesterol, etc.). Natural products are generally perceived by consumers as being of higher quality, healthier and more environmentally friendly. Similarly, there is a growing demand for organic products and so-called ‘clean label’ products. As a result, natural food and beverage products are generally viewed as specialty, premium products with higher prices. This trend has created new opportunities for flavors manufacturers to develop new and innovative natural flavor products. The Company estimates that in spite of the effects of the economic crisis which characterized the global markets in 2009, the consumer trend of preferring natural and healthy food will continue.
� Private label – Private label goods manufacturers, which tend to be
mid sized and local and small food manufacturers, have been a growing and increasingly important customer segment for the flavors industry. Over the last decade consumers of food products have become increasingly price conscious which increased the growth rates of private label products in comparison to the branded food industry. This trend was accelerated in 2009 as a result of the economic crisis. As a result, supermarket chains and other retailers have generally been increasing their private label product offerings. In addition, supermarket chains and other retailers have been placing greater importance on supporting their own brand image. The demand from supermarket chains and retailers to private labels products which resemble existing products and unique premium products has provided the flavors industry with new opportunities. Frutarom has increased and will continue to increase its market share in the Private label market.

26
� Growing market for convenience food – There has been a general increase in demand for processed foods with greater convenience (consumed both in and outside the home). This increase in demand for convenience foods has been spurred by new packaging and cooking technologies as well as changing social habits and consumer preferences. Examples of convenience foods include "ready to eat" meals, fresh pasta; ready-to-cook, fresh seasoned or marinated meat or poultry; salads; and sauces in liquid form. This has created new opportunities for flavor manufacturers in the savory flavors and functional fine ingredients fields which are responsible for the creation of food texture and its extended shelf life, to develop and market flavors and unique fine ingredients products for this segment.
� Emerging markets – In recent years, certain developing markets,
such as the CIS, Eastern Europe, China, India and South America, have experienced above market average growth in demand for flavors products. Further, these markets have been characterized by a trend towards increased consumption of processed foods, which in turn has driven the emergence of mid sized, local and small food companies, which creates new market opportunities for flavors manufacturers. The Company expects that the early signs of the improvement in the global economy and in the consumption may cause a moderate improvement in the growth rate of these markets.
Key Success Factors in the Flavors Segment
7.15. The Company's management estimates that the key success factors in
the flavors segment are:
� Long term relationships – Long term relationships with customers and collaboration in the development of new products.
� Global and local presence in target markets – Knowledge of the
various flavor preferences in the different markets and the ability to provide global and local support to customers.
� Superior and reliable service – The ability to provide a high level of
service and the reliability of a flavors manufacturer in giving service are critical both for mid sized and local customers and for multinational customers.
� Presence in emerging markets – Emerging markets grow at
considerably higher rates compared with developed markets and a presence in these markets, knowledge and understanding of their unique needs and the ability to provide support to manufacturers in these markets are a critical success factor.
� Strong research and development and innovation – The ability to
develop new innovative products both at the initiative of the flavors manufacturer and in collaboration with customers is of extreme importance in determining a flavors manufacturer's success.
� Compliance with strict quality, regulatory and safety standards –
Since the flavors are intended principally for the food and beverage and pharmaceutical markets, they must comply with strict quality, regulatory and safety standards.

27
8. Products and Services in the Flavors Segment
8.1. The Flavors Activity includes the development, manufacturing, marketing and selling of flavor compounds (sweet and savory) and the development, manufacturing, marketing and selling of food systems. The Flavors Activity is the most profitable of Frutarom's activities and has undergone accelerated growth since 2001. The Flavors sales grew from US$ 39.1 million in 2001 to US$ 297.1 million in 2009. The growth in the Flavors sales is principally the result of its growth strategy focusing on both developed and emerging markets and on multinational, mid sized and local customers and the successful execution of strategic acquisitions in recent years. The relative portion of the Flavors Activity in Frutarom's overall activities grew from 39% in 2001 to 70% in 2009.
8.2. The Company produces thousands of different flavors for its customers
and continuously develops new flavors in order to meet changing consumer preferences and customer needs. Frutarom maintains collaborative relationships with its customers and many of its products are tailor made. Frutarom's flavor production meets strict quality, safety and regulatory standards, which are required by food and beverage producers.
The combination of long-term customer relationships and customer loyalty, with relatively low price sensitivity and simple production processes, provide Frutarom with generally higher and more stable margin in the Flavors Activity compared to the Fine Ingredients Activity.
8.3. As the success of many of the flavors developed by Frutarom depends
on knowledge of local tastes, Frutarom maintains 27 local research and development laboratories and 48 sales and marketing operations in close proximity to its customers. In addition, Frutarom's global presence enables it to introduce new tastes to local markets. Frutarom's global reach also provides it with the means to service the needs of food and beverage producers who launch global brands in many markets simultaneously.
8.4. Frutarom's Flavors Activity provides efficient and quality respond to the
accelerated growth of private label products, while providing assistance and support in developing and marketing the products. Private label goods manufacturers tend to be mid sized and local food and beverage producers. Frutarom offers these customers a comprehensive product offering, personalized service and flexibility in terms of minimum quantities and supply times. The acquisition during 2007 of Belmay and Jupiter in England; Raychan and Adumim's and Rad's activity in Israel; the Gewurzmuller Group and CH's Savory activities in Germany and FSI in the US which were carried out in the last three years considerably expanded Frutarom's product offering to private label manufacturers.
8.5. Frutarom provides excellent respond to growing consumer demand for
natural products, as most of the Flavors Activity's products are based on natural ingredients. In addition, in response to growing demand for convenience foods, Frutarom also positioned itself to respond to these growing needs and currently offers a variety of sweet and savory flavor compounds and food systems based on vegetables, fruits and other

28
natural ingredients used in convenience foods by food manufacturers. Frutarom significantly strengthened its product offering in savory flavors and specialty functional products for convenience foods with its acquisition of Nesse, Raychan, Rad the Gewurzmuller Group and CH's Savory activities.
As stated, Frutarom divides the activities of the Flavors Activity into two main categories: (i) flavor compounds and (ii) food systems.
8.6. Flavor Compounds – Frutarom's Flavors Activity offers a wide variety
of flavor compounds designed to enhance or create new tastes or to mask certain tastes in processed foods and beverages to which they are added. The flavor compounds produced by the Company are used primarily as ingredients in consumables manufactured by food and beverage producers, such as soft drinks and juices, dairy and ice cream products, baked goods, confectionery, chewing gum, and a variety of savory foods including snacks, soups and salad dressings, as well as meat, meat substitutes and fish.
8.7. Most flavor compounds consist of numerous fine ingredients (typically
more than 30) combined according to formulas developed in the Company's laboratories by the research and development team of the Flavors Activity. The development of flavor compounds is undertaken either at Frutarom's own initiative or according to the unique requirements of its various customers.
8.8. Frutarom offers natural, organic, nature identical and artificial flavor
compounds. Natural flavor compounds are manufactured from natural ingredients, such as natural extracts and essential oils. Nature identical and artificial compounds are produced using synthetic ingredients. Some of Frutarom's flavor products use fine ingredients manufactured by the Company exclusively for the Flavors Activity.
8.9. Frutarom produces savory flavor compounds for savory snacks and
pastries. Flavor products for dried prepared food products manufacturer by Frutarom include savory flavor compounds containing seasonings for instant soups, dried pasta sauces and other dry prepared food products. Further, Frutarom produces savory flavors, seasonings and specialty functional ingredients for meat, poultry and fish processors, as well as a line of flavor compounds for products utilizing meat substitutes, designed to help impart meat flavor to vegetarian preparations.
8.10. Frutarom sells its flavor compounds in stable liquid, paste, powder,
emulsion and granulated form and sometimes bundled with stabilizers and emulsifiers (ingredients which alter texture and other properties of the products to which they are added).
8.11. Food Systems – As part of the Flavors Activity, Frutarom produces a
wide variety of food systems. These food systems include sauces, ripples, fillings and other preparations made from fruit, vegetables and other natural ingredients used in a wide range of food products, such as dairy (yogurts, ice cream, chilled desserts, butter and cheese), sweet and savory baked products, "ready to eat" meals and other convenience food products. Frutarom's food systems business allows it to combine several fields of its core expertise, as the food systems often are produced using flavor compounds, natural flavor extracts and

29
increasingly, natural functional food ingredients manufactured under the Fine Ingredients Activity, allowing it to provide customers with food systems which are comprehensive, tailor made food production solutions.
8.12. Frutarom designs food systems with special characteristics, such as
specific flavor and/or functional food qualities, high speed filling capabilities (allowing the food system to be integrated into the end product more quickly and efficiently), freeze-thaw stability (allowing a product to be frozen and defrosted without affecting its consistency, structure or palatability) and high volume fruit integrity (containing a high percentage of fruit). Frutarom offers a variety of savory vegetable based preparations for applications such as pizza toppings, filled breads, pasta fillings and other prepared meal products. Frutarom also offers a variety of sweet fruit, vanilla, chocolate and toffee preparations and sauces, low calorie sauces and fruit preparations, which can include functional food ingredients in order to help impart well-being benefits to the food products to which they are added.
9. Segmentation of the Income and Profitability of Products and Services
9.1. Following are the Company's sales (in US$ millions) for the years
2007through 2009 deriving from the Flavors Activity, their portion of the Company's total income, the amount and the operating profit for the flavors field and their rate:
2009 2008 2007
Company's total income
425,179 473,286 368,261
Income from flavors segment
297,062
339,819 247,672
% of Company's total income
69.9% 71.8% 67.3%
Operating profit
37,712 47,557 26,823
% of Operating profit
12.7% 14.0% 10.8%
10. New Products
10.1. Under the Flavors Activity, Frutarom develops many new products as part of its ongoing activity. Many of the new products are developed in cooperation with a specific customer or are tailor made to the needs of a specific customer. No one new product developed by the Company is significant in terms of expected sales turnover and/or development costs.

30
11. Customers
11.1. The flavors manufactured by Frutarom are sold to an extensive customer base comprising thousands of large multinational, mid-sized, local and small customers. The customers are primarily food and beverage manufacturers and they are located in about 120 different countries worldwide.
11.2. The Flavors Activity does not have any customers whose purchasing
turnover constitutes over 10% of the Company's sales turnover. The management of the Company estimates that it has no dependency on any of its customers.
11.3. Most of the sales are to regular customers since, as described above,
the flavors segment is characterized by long term relationships and customer loyalty. As is accepted in the flavors market, there are no long term supply contracts.
12. Orders Backlog
12.1. As is accepted in the flavors market, orders are received on an ongoing
basis, close to the supply date and therefore "orders backlog" has no significance.
13. Competition
13.1. In the market for flavors products, Frutarom's competitors consist mainly of large global manufacturers, mid sized companies and smaller, local manufacturers. Competition is based to a large extent on product quality, the ability to establish and maintain long term customer relationships, value added service, reliability and tailor made product development. As the cost of flavors products used in the end products for which they are designed is comparatively small, this market tends to be comparatively less price sensitive. Flavors manufacturers are required to differentiate themselves by maintaining close collaborative relationships with customers, thorough knowledge and understanding of target markets, effective research and development and an established reputation for consistent, reliable and effective service, product supply and quality, and the ability to supply product on short notice and with short lead time.
13.2. The large multinational flavors manufacturers are established,
experienced companies with a global presence and established technical and commercial capabilities, focusing primarily on large multinationals customers. The large multinational flavors producers with whom Frutarom competes include Givaudan; Firmenich; IFF Inc.; Symrise and Takasago.
13.3. The mid sized flavors manufacturers with whom Frutarom competes
tend to focus on both large multinational food and beverage producers as well as mid-sized and smaller food and beverage producers who tend to operate on a regional basis. Mid-sized flavor manufacturers with whom Frutarom competes include among others; ; Silesia; Mane; and Kerry Ingredients.
13.4. There are in excess of over 500 small and local flavors manufacturers
with more limited research and development capabilities who focus on

31
narrow market segments and local customers. In recent years there has been a trend towards consolidation in the flavors manufacturing industry, resulting in increasing market concentration.
14. Production Capacity
14.1. Since production processes in the flavors segment are simple and do not require significant capital investment, production capacity is not a significant factor or a limitation to the Company's ability to meet demands by its customers or its ability to grow in the flavors segment. For more production capacity information refer to section 27 to this report.
Fine Ingredients Market 15. Overview of the Fine Ingredients Market
General
15.1. Frutarom's Fine Ingredients Activity is focused mainly on developing,
producing and marketing natural fine ingredients for the food and beverage, flavor and fragrance, pharma/nutraceutical and personal care industries. Fine ingredients are often sold directly to food and beverage manufacturers, who use them in the manufacture of consumer end products. Flavor and fragrance manufacturers use fine ingredients products as the building blocks for the flavor and fragrance compounds they manufacture.
15.2. Frutarom operates in the following segments of the fine ingredients
market: natural flavor extracts, natural functional food ingredients, natural pharma/nutraceutical extracts, specialty essential oils and citrus products, aroma chemicals, and natural gums.
15.3. According to SRI Consultants, global sales in 2006 for natural
extracts/essential oils and aroma chemicals are estimated at US$ 4.4 billion. Sales of functional food ingredients (excluding sales of functional food ingredients outside of the United States and Europe and excluding sales of pharma/nutraceutical extracts) in 2003 were estimated at US$ 2.8 billion. The global fine ingredients markets in which the Company operates had estimated sales of approximately US$ 7.7 billion in 2003, of which 37% were for functional food ingredients, 36% for sales of natural extracts/essential oils, and 27% for sales of aroma chemicals.
15.4. SRI Consultants estimates that global sales of natural
extracts/essential oils will grow at an annual rate of 3-4% between 2006 and 2011 in Western Europe and the USA and that the market for natural extracts may grow at a higher rate. Global sales of aroma chemicals are expected to grow 1.5-2.5% annually between 2006 and 2011 in Western Europe and the USA. Sales of natural extracts/essential oils and aroma chemicals in certain developing markets, such as Eastern Europe, Russia, South America and India, are projected to grow at significantly higher rates than in West European, North American and Japanese markets.

32
Characteristics of the Fine Ingredients Market
15.5. Research and development – Innovation is a key success factor in the fine ingredients market. Research and development of new fine ingredients products is a sophisticated process that requires a high level of expertise, experience and investment. In many cases, the development of new fine ingredients products takes longer than flavor products. Some of the natural fine ingredients are tailor made to customer needs and require long term relationships with the customers and collaborative development efforts.
15.6. Production – Fine ingredients production tends to be more
sophisticated and complicated than flavors production, requiring extensive knowhow. In addition, fine ingredients production requires greater capital investment in the construction of manufacturing facilities, as well as in increasing production capacity when required. The production of fine ingredients must also comply with stricter environmental and regulatory standards.
15.7. Supply chain – Customers are increasingly seeking to optimize their
inventory by reducing stocks, therefore requiring fine ingredients manufacturers to meet shorter lead times and to keep local stocks in main markets. In addition, mid sized and local customers purchase hundreds of fine ingredients in varying relatively small quantities. The large multinational fine ingredients manufacturer generally have strict policies of minimum quantity and standardized packaging, while small fine ingredients manufacturers generally do not have the operational flexibility and the required global supply chain to meet the needs of many mid sized customers. This has created a market opportunity for mid sized fine ingredients producers to cater to this market segment.
15.8. High entry barriers – An established reputation and brand recognition,
which can only be developed over time, are key success factors for manufacturers in the fine ingredients market. Food and beverage producers require a high degree of reliability and consistency, and once a flavor is incorporated into a product, producers rarely risk replacing a flavor supplier. In addition, building a competitive multinational fine ingredient business generally requires strong research and development, production and global supply chain capabilities. These factors create significant barriers to entry.
15.9. Increased demand for natural products – The increase in consumer
demand for natural products has in turn increased demand for a variety of fine ingredients, such as natural flavor extracts and natural specialty essential oils, to be used in such products. Natural fine ingredients tend to be more unique and less interchangeable, resulting in greater customer loyalty. Many of the natural extracts and specialty essential oils are tailor made to customer needs.
15.10. High growth in functional food ingredients – Changes in consumer
preferences favoring foods with health and well-being benefits have led to rapidly growing demand for functional foods. Functional foods are foods with certain ingredients added which provide, or are perceived as providing, health and well-being benefits, such as juices or yogurts with health additives. The end use segments of the functional food industry exhibiting the highest growth are the dairy and beverage segments. Many of the active ingredients used in functional foods are derived

33
from plants and herbs using similar production processes as used in the production of flavor extracts. Functional food ingredients manufacturers are often required by food and beverage producers to provide a scientific basis for the health claims attached to such functional food ingredients, such as clinical studies.
15.11. Regulatory, health safety and certification – The fine ingredients used
in the food and beverage and pharma/nutraceutical industries are increasingly subject to strict health and safety regulations and standards. This trend has been compounded by the general trend for increased regulation of the food and beverage and pharma/nutraceutical industries. Customers are increasingly requiring fine ingredients manufacturers to provide certification that their products meet strict regulatory standards. In addition, there is increasing demand for products with certain certified qualities, such as genetically modified organism ("GMO") free and pesticide free. Kosher and halal certified products are also increasingly in demand and by a wider demographic customer base. As a result, fine ingredients manufacturers are increasingly required to document their manufacturing processes and to adhere to strict standards in order to ensure compliance with such certification requirements. Lastly, fine ingredients manufacturers are expected to be approved by various manufacturing certifications, such as ISO 9001, Swiss GMP and BRC (British Retail Consortium) Global Standard – food.
15.12. Sourcing – in order to maintain a high level of product quality and
consistency and to ensure the availability of raw materials used for the production of the specialty fine ingredients, manufactured by the Company, as and when needed for production, long term relationships with suppliers, growers and/or producers of raw materials are of crucial importance to the specialty fine ingredients manufacturers. This is particularly the case for natural raw materials, which are mostly crop-related goods and are often subject to seasonality in supply.
15.13. Shift of high volume/low margin production – during recent years, there
has been an increase in the production of certain fine ingredients, mainly aroma chemicals, in certain countries such as China and India, where the cost structure tends to be less expensive for the manufacturers. These low cost manufacturers tends to have less technical sophistication and research and development capabilities, focusing on higher volume and lower margin fine ingredients products. In addition, they usually tend not to have global sales and marketing capabilities, brand recognition or approved supplier status. This has led certain fine ingredients manufacturers to differentiate themselves from these low cost/high volume manufacturers by developing close, collaborative relationships with customers, providing higher added-value products and services, and investing in research and development in order to develop higher margin, specialty fine ingredients products.
Key Success Factors in the Fine Ingredients Segment 15.14. The Company's management estimates that the key success factors in
the fine ingredients segment are:

34
� Positioning and reputation as a reliable supplier – Great importance is attributed to the reliability of service and to building a relationship and reputation as a supplier in the market.
� New, innovative and comprehensive product portfolio – The fine
ingredients market attributes considerable importance to new, innovative, added value products that satisfy customer demand.
� Research and development and innovation – Suppliers are required
to have strong research and development and innovation competencies and to supply innovative products, such as functional food ingredients, and adapt products, principally natural, to the customers' needs.
� Compliance with quality, regulatory and safety standards – Since the
fine ingredients are intended for the food and beverage and pharma/nutraceutical markets, they must comply with strict quality, regulatory and safety standards.
� Raw materials reliability and supply chain– The ability to purchase
high quality raw materials and supply fine ingredients upon short notice and in varying quantities is significant.
16. Products and Services in the Fine Ingredients Segment
16.1. Under the Fine Ingredients Activity, Frutarom develops, manufactures,
markets and sells natural flavor extracts, natural functional food ingredients, natural pharma/nutraceutical extracts, specialty essential oils and citrus products, aroma chemicals, and natural gums.
The sales of the Specialty Fine Ingredients grew substantially from US$ 57.5 million in 2001 to US$ 123.8 million in 2009. The growth in the sales of Fine Ingredients results mainly from the development of new and innovative high-added-value products, higher than average margin, focus on natural product portfolio and focus on both multinational and mid sized customers and the successful execution of strategic acquisitions. The portion of sales of the Fine Ingredients out of Frutarom's total sales totaled 29% in 2009.
16.2. The Specialty Fine Ingredients are sold principally to the food and beverage, flavor and fragrance, pharma/nutraceutical and personal care industries. Frutarom has an established reputation in the market for fine ingredients, with a broad customer base of both multinational and mid sized customers supported by Frutarom's large sales and marketing team and efficient global supply chain. Although the majority of the fine ingredients produced by the Company are sold to third parties (including competing flavor manufacturers), a portion of Frutarom's fine ingredients production is used by the in the manufacturing of Frutarom's flavor compounds. Further, certain fine ingredients manufactured by Frutarom are reserved solely for the Company's own use and are not sold to third party flavor producers, providing the Company with a competitive advantage in producing certain flavors such as citrus flavors, a field in which Frutarom estimates it is a global leader.
16.3. Frutarom's Specialty Fine Ingredients meet strict health, safety and
quality standards, such as Swiss GMP, British BRC and ISO 9001

35
standards. In addition, Frutarom's fine ingredients are generally GMO free and pesticide free, and satisfy a variety of kosher and halal certifications. Kosher and halal foods are in increasing demand by different demographic groups.
16.4. Frutarom has extensive experience in the production of natural
ingredients and standardized botanical extracts and is devoting significant resources to the development of products that cater to the growing market for natural products. The Company's management believes it is one of the leaders in this market due to its over 77 years of experience in the production and supply of natural fine ingredients, proprietary extraction techniques, broad product portfolio and research and development and an efficient global supply chain capabilities.
16.5. Frutarom believes its relationship with and understanding of food and
beverage producers provide it with a competitive advantage in the functional food ingredients market. This is complemented by the Company's research and development capabilities, proprietary production technologies and clinical study capabilities which have been enhanced through the acquisition of Flachsmann in 2003 and Acatris in 2006.
16.6. Frutarom maintains close relationships with supplier, growers and/or
producers of raw materials which are used by Frutarom to manufacture the specialty fine ingredients in order to ensure effective raw material sources. The supply of these raw material is crucial to maintaining high product quality and consistency and to ensure continuance manufacturing of the specialty fine ingredients. This is particularly the case for natural raw materials, which are mostly based on crop related goods and are often subject to seasonality in supply. In addition, Frutarom has an efficient global supply chain for fine ingredients, enabling it to rapidly respond to varying customer lead time requirements.
16.7. The acquisition of Flachsmann in June 2003, Acatris in October 2006
Abaco in July 2007 and Oxford in February 2009 significantly bolstered Frutarom's specialty fine ingredients business. Flachsmann and Acatris are established manufacturers of natural extracts, including pharma-grade botanical extracts. The Acatris Lifeline product line includes, among others, unique natural botanical extracts possessing scientifically proven health values supported by clinical research and protected by patents. The Flachsmann, Acatris, Abaco and Oxford acquisitions contributed to the Company's knowhow and product portfolio, as well as expanding Frutarom's customer base and sales and marketing network. In addition, the acquisitions expended the Company’s customer base and sales and market infrastructure.
16.8. As a result of the fact that in 2008, Frutarom completed the merger of
its activities in the field of unique natural botanical extracts, which mainly includes the activity of Frutarom Switzerland (formerly Flachsmann), Frutarom USA and Acatris, which was acquired in October 2006. Under the Business Unit of Frutarom Health, Frutarom has further acted during 2009 to realize the maximum potential of the synergy embedded in the merger of these activities. Frutarom Health provides Frutarom's customers in the fields of natural and healthy extracts with a range of solutions and allows the research and development activity for new products in the field to be concentrated
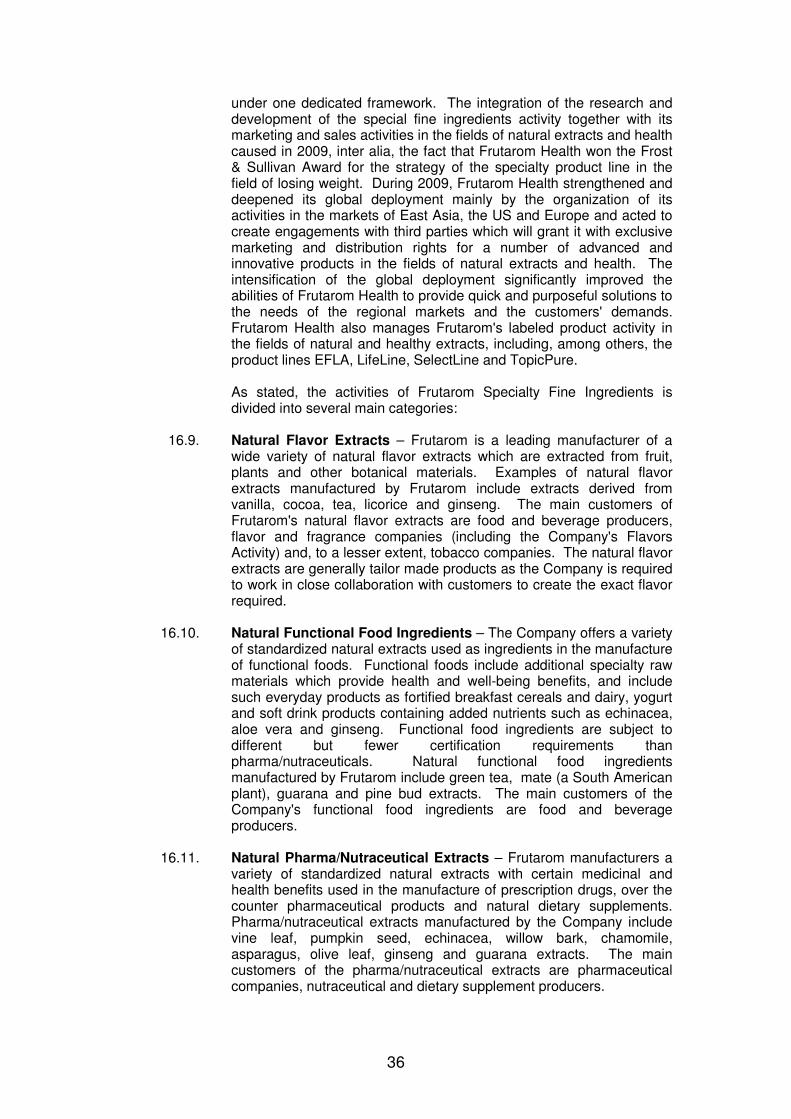
36
under one dedicated framework. The integration of the research and development of the special fine ingredients activity together with its marketing and sales activities in the fields of natural extracts and health caused in 2009, inter alia, the fact that Frutarom Health won the Frost & Sullivan Award for the strategy of the specialty product line in the field of losing weight. During 2009, Frutarom Health strengthened and deepened its global deployment mainly by the organization of its activities in the markets of East Asia, the US and Europe and acted to create engagements with third parties which will grant it with exclusive marketing and distribution rights for a number of advanced and innovative products in the fields of natural extracts and health. The intensification of the global deployment significantly improved the abilities of Frutarom Health to provide quick and purposeful solutions to the needs of the regional markets and the customers' demands. Frutarom Health also manages Frutarom's labeled product activity in the fields of natural and healthy extracts, including, among others, the product lines EFLA, LifeLine, SelectLine and TopicPure.
As stated, the activities of Frutarom Specialty Fine Ingredients is divided into several main categories:
16.9. Natural Flavor Extracts – Frutarom is a leading manufacturer of a
wide variety of natural flavor extracts which are extracted from fruit, plants and other botanical materials. Examples of natural flavor extracts manufactured by Frutarom include extracts derived from vanilla, cocoa, tea, licorice and ginseng. The main customers of Frutarom's natural flavor extracts are food and beverage producers, flavor and fragrance companies (including the Company's Flavors Activity) and, to a lesser extent, tobacco companies. The natural flavor extracts are generally tailor made products as the Company is required to work in close collaboration with customers to create the exact flavor required.
16.10. Natural Functional Food Ingredients – The Company offers a variety
of standardized natural extracts used as ingredients in the manufacture of functional foods. Functional foods include additional specialty raw materials which provide health and well-being benefits, and include such everyday products as fortified breakfast cereals and dairy, yogurt and soft drink products containing added nutrients such as echinacea, aloe vera and ginseng. Functional food ingredients are subject to different but fewer certification requirements than pharma/nutraceuticals. Natural functional food ingredients manufactured by Frutarom include green tea, mate (a South American plant), guarana and pine bud extracts. The main customers of the Company's functional food ingredients are food and beverage producers.
16.11. Natural Pharma/Nutraceutical Extracts – Frutarom manufacturers a
variety of standardized natural extracts with certain medicinal and health benefits used in the manufacture of prescription drugs, over the counter pharmaceutical products and natural dietary supplements. Pharma/nutraceutical extracts manufactured by the Company include vine leaf, pumpkin seed, echinacea, willow bark, chamomile, asparagus, olive leaf, ginseng and guarana extracts. The main customers of the pharma/nutraceutical extracts are pharmaceutical companies, nutraceutical and dietary supplement producers.

37
16.12. Specialty Essential Oils and Citrus Products – The Company produces a wide range of specialty essential oils and is a leading producer of specialty citrus products. Specialty essential oils produced by Frutarom include citrus (such as orange, grapefruit and lemon), mint (peppermint and spearmint), floral, spice, herb and woody oils. These products are used in food and beverages, flavor and fragrance applications, pharmaceutical products, cosmetics and other well-being and personal care applications.
16.13. The Company believes that it is the global leader in specialty citrus
products, which are used to impart citrus flavors into food, beverages, fragrances and other personal care products. Frutarom has been active in the production of citrus specialties since 1933. The Company continuously invests in innovative and unique technologies in the processing, extraction and distillation of specialty citrus products. The Group is an approved supplier of citrus specialty products to large multinational and mid sized flavor manufacturers. Specialty citrus products manufactured by Frutarom include orange, grapefruit, sweetie (a citrus variety derived from hybridization of pomelo and white grapefruit), lemon, lime and mandarin ingredients. A number of Frutarom's citrus specialty products are reserved solely for the use of the Flavors Activity and are not sold to third party flavor manufacturers, providing the Company with a competitive advantage in producing citrus flavors. Frutarom also specializes in a variety of natural mint oils used mainly in the manufacture of chewing gum, candies and personal care products.
16.14. Aroma Chemicals – Frutarom produces over 600 different types of
aroma chemicals used in the manufacture of flavor and fragrance compounds, food, animal feed, cosmetics, oral hygiene products and other applications. Frutarom is a leading global player in the field of aroma chemicals, Frutarom focuses on research and development, manufacturing and selling of value added specialty aroma chemicals, with a continuous shift in product mix towards low volume, high margin products. Frutarom's range of aroma chemicals used in flavor and fragrance applications includes diketones and pyrazines, which are used to create roasted and toasted aromas. In addition, Frutarom manufactures unsaturated aldehydes, which are cooling agents designed to impart a cool sensation when orally consumed or applied to the skin, used in the manufacture of candies, chewing gum, skin care products and oral hygiene products, among others. The Oxford acquisition, at the beginning of 2009, significantly strengthened Frutarom's positioning and leading position in this field.
16.15. Natural Gums – Frutarom offers a range of natural water soluble gums
and stabilizers derived from a variety of botanical sources, including certain types of gum trees, seeds, seaweed and beet sugar. The natural water soluble gums and stabilizers are used in the production of food, beverages, pharmaceuticals and cosmetics. Natural gums produced by the Company include emulsifying agents, agglomeration aids, encapsulation agents and coating agents. The main customers are producers of food, beverages and flavors, and pharmaceutical companies.

38
17. Segmentation of the Income and Profitability of Products and Services
17.1. Following are the Company's sales (in US$ millions) for the years 2007 through 2009 deriving from the field of Specialty Fine Ingredients, its portion of the Company's total income, the amount of and the operating profit for the Fine Ingredients field and their rate:
2009 2008 2007
Company's total income
425,179 473,286 368,261
Income from Fine Ingredients segment
123,778 124,339 114,951
% of Company's total income
29.1% 26.3% 31.2%
Operating profit
9,193 8,332 7,904
% of Operating profit
7.4% 6.7% 6.9%
18. New Products
18.1. Frutarom develops new Specialty Fine Ingredients as part of its daily activity in order to strengthen it position and improve its product diversity among others by replacing low profit margin products with new innovative, added-value products with high profit margin. None of the new is significant from the aspect of forecasted sales turnover and/or development expenses.
19. Customers
19.1. The Specialty Fine Ingredients manufactured by Frutarom are sold to many large multinational, mid sized, local and small customers in the food and beverage, pharma/nutraceutical, flavor, fragrance and personal care industries.
19.2. No particular customer has a purchasing turnover exceeding 10% of
the Company's sales turnover. The Company's management believes that it is not dependent on any one of its customers.
19.3. Excluding a number of supply contracts for periods not exceeding one
year, most sales are on the basis of specific orders by customers and based on the Company's forecast. The sales are mainly to permanent customers with whom there is a long term relationship.
20. Order Backlog
20.1. As accepted in the specialty fine ingredients market, orders are received on an ongoing basis close to the supply date and therefore the term, "order backlog" has no significance. There are a number of supply agreements for periods not exceeding one year, none of which are significant relative to the Company's overall activity.

39
21. Competition
21.1. In the market for specialty fine ingredients, competition varies by product category.
21.2. In the natural flavor extracts category, the Company's competitors
consist of multinational and mid sized flavor manufacturers that produce natural flavor extract principally for internal use. These competitors include IFF, Symrise, Robertet, Sensient and Mane. Competitors in this category also include specialized manufacturers who focus only on natural flavor extracts, such as Naturex, as well as pharma/nutraceutical manufacturers with limited natural flavor extract production.
21.3. In the functional food ingredients and pharma/nutraceutical extracts
category, Frutarom's competitors consist mainly of specialized pharma/nutraceutical companies such as Indena S.p.A., Martin Bauer GmbH & Co. KG, Naturex, and Botanicals International, as well as a number of smaller, innovative, start-up companies that concentrate on unique products or technologies.
21.4. In the essential oils category, Frutarom's competitors include
companies such as Treatt plc that focus on the manufacture of essential oils, including specialty essential oils as one of their product offerings. Large multinational and mid sized flavor manufacturers produce specialty essential oils primarily for internal use. There are also growers and processors of essential oils mainly in developed countries, which are represented by traders and distributors of specialty essential oils, which also compete in the market for essential oils.
21.5. In the aroma chemicals category, the Company competes with large
multinational flavor manufacturers who produce specialty aroma chemicals primarily for internal use. Additional competitors in this field are specialized aroma chemicals manufacturers such as PFW, Aromor, Fontarome and Bedoukian Research. Other manufacturers of aroma chemicals include low cost producers located mainly in Asia. These manufacturers have direct and limited sales and marketing infrastructures, and they are reliant on traders for the purpose of marketing and selling their products. There are also large chemical companies that manufacturer high volume aroma chemicals as part of their wider product offering but in most cases do not offer specialty aroma chemicals. For the most part, Frutarom does not compete with these low cost producers as it is focused on higher profit margin specialty aroma chemicals whose scope is not substantial.
22. Production Capacity
22.1. Fine ingredients production requires capital investment in building production facilities and expanding production capacity if and when the need arises. In addition, the production process for fine ingredients and production facilities demand compliance with strict quality, health and environmental regulations and the production capacity therefore presents an entry barrier to the fine ingredients market. For more on production capacity refer to section 27 in this report.
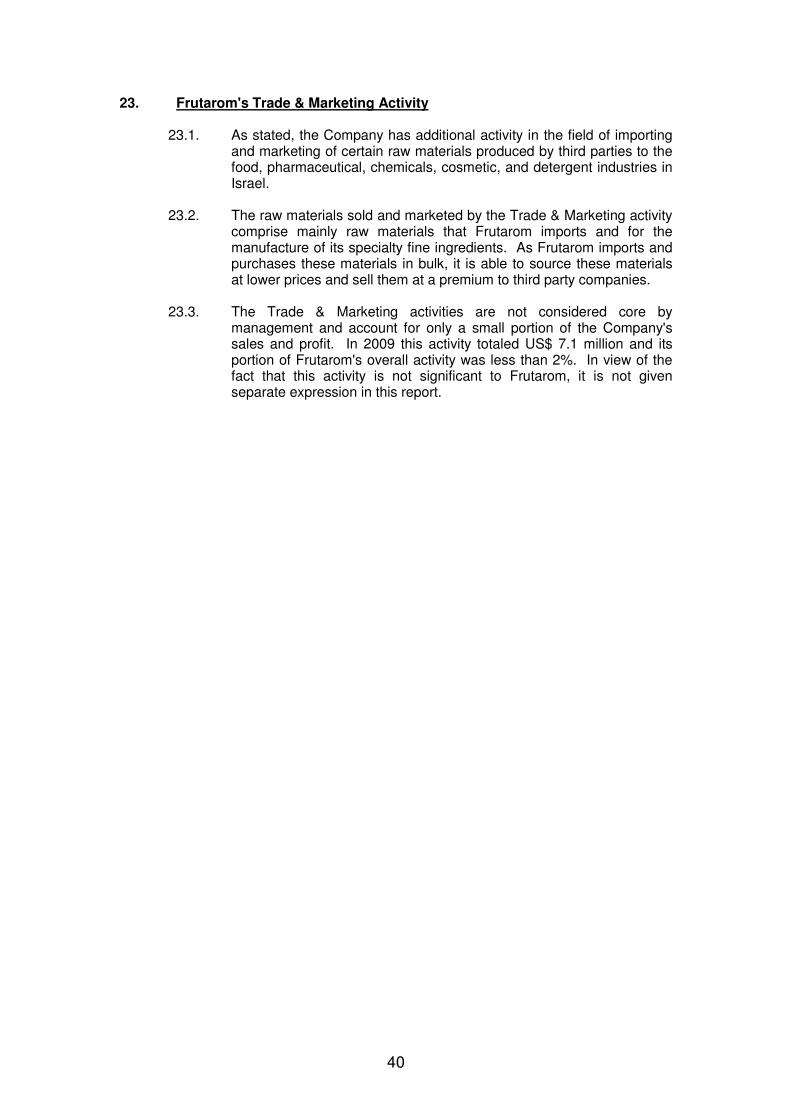
40
23. Frutarom's Trade & Marketing Activity
23.1. As stated, the Company has additional activity in the field of importing and marketing of certain raw materials produced by third parties to the food, pharmaceutical, chemicals, cosmetic, and detergent industries in Israel.
23.2. The raw materials sold and marketed by the Trade & Marketing activity
comprise mainly raw materials that Frutarom imports and for the manufacture of its specialty fine ingredients. As Frutarom imports and purchases these materials in bulk, it is able to source these materials at lower prices and sell them at a premium to third party companies.
23.3. The Trade & Marketing activities are not considered core by
management and account for only a small portion of the Company's sales and profit. In 2009 this activity totaled US$ 7.1 million and its portion of Frutarom's overall activity was less than 2%. In view of the fact that this activity is not significant to Frutarom, it is not given separate expression in this report.

41
CCHHAAPPTTEERR 44 –– DDEESSCCRRIIPPTTIIOONN OOFF TTHHEE CCOOMMPPAANNYY''SS BBUUSSIINNEESSSS::
MMAATTTTEERRSS RREELLAATTIINNGG TTOO TTHHEE GGRROOUUPP''SS OOVVEERRAALLLL
AACCTTIIVVIITTYY 24. Marketing, Sales and Customer Support
24.1. Frutarom maintains a global marketing, sales and customer technical support network, with established local R&D, sales and marketing personnel in all of its key target markets. Frutarom believes that its global network provides it with a competitive advantage and is a key factor in the success of its growth strategy. On December 31, 2009, Frutarom had 329 sales and marketing personnel and maintained 27 local research and development laboratories and 48 sales offices in close proximity to its customers, including in the United States, Canada, Mexico, Brazil, the United Kingdom, Switzerland, Germany, France, Italy, Spain, Israel, Romania, Turkey, Russia, Ukraine, Kazakhstan, Belarus, China, Hong Kong, Indonesia, India and South Africa. The Company markets and sells its products primarily through its own sales personnel. In certain countries, Frutarom uses third party agents and distributors to sell its products.
24.2. Frutarom's global sales and marketing network is a key component of
the Company's strategy to provide tailor made specialized products and services and high quality customer support to both large multinational and mid sized and local customers.
24.3. In the mid sized customer segment, Frutarom differentiates itself from
its major competitors by offering its mid sized and local customers the same quality of service and tailor made product specialization as normally reserved only for large multinational companies. Frutarom's sales and marketing team and research and development laboratories work equally closely with both large multinational and mid sized and local companies to offer them timely and responsive personalized development services, including custom flavors and specialty ingredients tailor made to the specific needs of Frutarom's customers. Management believes that the mid sized and local customer segment represents more than 50% of the world's food and beverage market.
24.4. The Flavors and Fine Ingredients activities each have their own
separate sales, marketing and customer support personnel. However, Frutarom assigns a single sales person to be dedicated to any customers of the Company that purchase the products of both activities. This single-sales person interface allows Frutarom to better respond to its customers' needs and to identify and realize cross selling opportunities.
24.5. The Flavors Activity's sales, marketing and customer support activities
focus primarily on Frutarom's customers in the food and beverage industries, while the Special Fine Ingredients Activity's sales, marketing and customer support activities focus primarily on Frutarom's customers in the flavor, fragrance, pharma/nutraceutical and personal care industries. The sales representatives of the Flavors Activity also sell products of the Specialty Fine Ingredients to their customers in the food industry.
24.6. Frutarom's marketing and sales team form an important link between
Frutarom's customers and its research and development team.
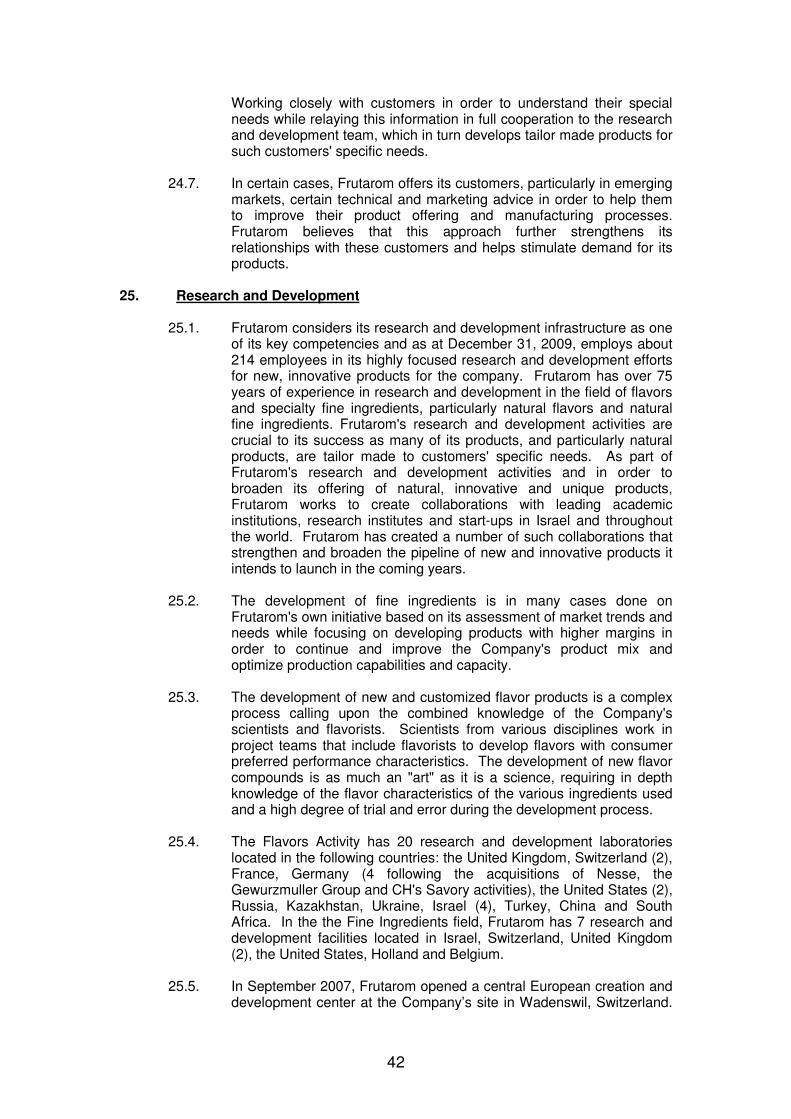
42
Working closely with customers in order to understand their special needs while relaying this information in full cooperation to the research and development team, which in turn develops tailor made products for such customers' specific needs.
24.7. In certain cases, Frutarom offers its customers, particularly in emerging
markets, certain technical and marketing advice in order to help them to improve their product offering and manufacturing processes. Frutarom believes that this approach further strengthens its relationships with these customers and helps stimulate demand for its products.
25. Research and Development
25.1. Frutarom considers its research and development infrastructure as one of its key competencies and as at December 31, 2009, employs about 214 employees in its highly focused research and development efforts for new, innovative products for the company. Frutarom has over 75 years of experience in research and development in the field of flavors and specialty fine ingredients, particularly natural flavors and natural fine ingredients. Frutarom's research and development activities are crucial to its success as many of its products, and particularly natural products, are tailor made to customers' specific needs. As part of Frutarom's research and development activities and in order to broaden its offering of natural, innovative and unique products, Frutarom works to create collaborations with leading academic institutions, research institutes and start-ups in Israel and throughout the world. Frutarom has created a number of such collaborations that strengthen and broaden the pipeline of new and innovative products it intends to launch in the coming years.
25.2. The development of fine ingredients is in many cases done on
Frutarom's own initiative based on its assessment of market trends and needs while focusing on developing products with higher margins in order to continue and improve the Company's product mix and optimize production capabilities and capacity.
25.3. The development of new and customized flavor products is a complex
process calling upon the combined knowledge of the Company's scientists and flavorists. Scientists from various disciplines work in project teams that include flavorists to develop flavors with consumer preferred performance characteristics. The development of new flavor compounds is as much an "art" as it is a science, requiring in depth knowledge of the flavor characteristics of the various ingredients used and a high degree of trial and error during the development process.
25.4. The Flavors Activity has 20 research and development laboratories
located in the following countries: the United Kingdom, Switzerland (2), France, Germany (4 following the acquisitions of Nesse, the Gewurzmuller Group and CH's Savory activities), the United States (2), Russia, Kazakhstan, Ukraine, Israel (4), Turkey, China and South Africa. In the the Fine Ingredients field, Frutarom has 7 research and development facilities located in Israel, Switzerland, United Kingdom (2), the United States, Holland and Belgium.
25.5. In September 2007, Frutarom opened a central European creation and
development center at the Company’s site in Wadenswil, Switzerland.

43
In the specialty innovation center, the Company develops both flavors and innovative Specialty Fine Ingredients that join the Company’s range of capabilities in flavors, fine ingredients and functional food while creating synergy between them. The creation center boosts Frutarom’s research and development capabilities and aids the Company in strengthening its position as a leading global supplier in the field of taste and health.
25.6. For details regarding amounts attributed, in the financial statements to:
liabilities for grants received, amount attributed to R&D expenses and amounts attributed as intangible assets please refer to Note 2 F.(6) and Note 11a(2(b) of the financial statements.
26. Seasonality of Demand
26.1. The Company’s business is subject to seasonal fluctuations, generally
with higher sales and profitability (due to product mix) in the first half of a given year and lower sales in the second half of a given year (in particular, in the fourth quarter).Many of the Company’s products are used by its customers in the manufacture of beverages and dairy products such as soft drinks, ice cream and yoghurts, for which demand generally increases markedly during the summer months. As a result, sales of certain flavors and fine ingredients produced by Frutarom rise in the first half of the year, as manufacturers of beverages and dairy products re-stock their inventories and increase production in advance of rising demand during the summer months.
26.2. Sales of the Company’s products generally decrease in the third
quarter as the summer ends and further in the fourth quarter as the weather cools, and many of Frutarom’s customer’s reduce production and inventory levels in advance of the year end and the holiday season.
26.3. The impact of seasonality on the Company’s results has steadily
decreased in recent years as the Company has increased its sales of products such as savory flavors, functional food ingredients and natural botanical extracts intended for the pharma/nutraceutical industry, which generally have lower seasonality in demand.

44
27. Fixed Assets, Facilities and Production Capacity
27.1. Frutarom has 15 production facilities around the world. The following
table sets forth Frutarom's major production facilities and the activity at each:
Country Location Field of Activity Size (m2)
Israel Haifa Flavors and fine ingredients 35,490 Israel Acco Flavors 9,273 Switzerland Wadenswil Flavors and fine ingredients 13,464 Switzerland Reinach Food systems 15,532 Germany Emmerich Food systems 19,000 Germany Nesse-Loxstedt Flavors 10,812 Germany Sittensen Flavors 10,001 Germany Stuttgart
(Gewurzmuller) Flavors 13,600
Germany Stuttgart (Blessing)
Flavors 1,650
UK Teesside Fine ingredients 21,500 UK Hartlepool Fine ingredients 31,971
UK Wellingborough Flavors 8,090
USA North Bergen (NJ) Flavors and fine ingredients 32,000
USA Corona (CA) Flavors 14,000
China Kunshan Flavors 15,000
In addition, the Company has additional production facilities that are not significant compared to the Company's scope of activity. Following is a description of the Company's significant plants:
• Haifa, Israel – In the Haifa Plant, under its both activities, the
Company produces flavors and fine ingredients (specialty essential oils, specialty citrus products and aromatic chemicals).
Production Capacity and Shifts – The flavors production is carried out over five days a week in one shift. At times there may be halts in production for the purpose of maintenance work (during the intermediate days of Succoth and Passover). The plant has additional potential production capacity of approximately 100%, assuming that two shifts were to be worked each day.
The fine ingredients production is carried out over five days a week in three shifts, excluding halts in production for the purpose of maintenance work (during the intermediate days of Succoth and Passover).
The land on which the plant is located is owned by the Company or subject to long term lease agreements with the Israel Lands Authority (excluding an area of 7,031m2 that is rented by the Company from a third party).
• Acco, Israel – The Company produces flavor mixes (mainly savory
flavors and seasonings) at the plant in Acco. During the fourth quarter

45
of 2007, Raychan's production activity was merged into the plant in Acco.
Production Capacity and Shifts – The plant's production is carried out over five days a week in two shifts, excluding halts in production for maintenance work for about a week during the intermediate days of Passover. The plant has additional potential production capacity of 60% to 70% assuming that three shifts were to be worked per day.
The land on which the plant is located is subject to long term lease agreements with the Israel Lands Authority, excluding a storage area adjacent to the Plant which is rented to the Company.
• Wädenswil, Switzerland – At the Wädenswil plant the Company's
Flavors Activity produces flavors and the Specialty Fine Ingredients Activity produces natural extracts.
Production Capacity and Shifts –The plant's production is carried out over five days a week in two shifts, excluding occasional halts for maintenance work. The plant has additional potential production capacity of about 30%-40% assuming that it shifted to a continuous production in three shifts.
The land on which the plant is located is owned by the Company.
• Reinach, Switzerland – At this plant the Company's Flavors Activity
produces food systems.
Production Capacity and Shifts –The plant's production is carried out over five days a week in one and a half shifts each day (14 hours of each 24 hours), excluding a four hour halt for maintenance work each Friday. The plant has additional potential production capacity of about 20%-25% assuming that it shifted to continuous production in three shifts.
The land on which the plant is located is owned by the Company.
• Emmerich, Germany – At this plant the Company's Flavors Activity produces food systems.
Production Capacity and Shifts – The plant operates five days a week in two shifts, excluding a four hour halt for maintenance work on each Friday. The plant has additional potential production capacity of about 30%-35% assuming that it shifted to continuous production in three shifts.
The land on which the plant is located is owned by the Company.
• Nesse-Loxstedt, Germany (Nesse) – At this plant the Company's Flavors Activity produces savory flavor mixes.
Production Capacity and Shifts – The plant operates five days a week in one shift. The plant has additional potential production capacity of about 60%-65% assuming that it shifted to continuous production in three shifts.

46
Part of the land on which the plant is located is owned by the Company, and part is leased by the Company.
• Sittensen, Germany (Nesse) – At this plant the Company's Flavors Activity produces savory flavor mixes and seasonings.
Production Capacity and Shifts – The plant operates five days a week in two shifts (excluding Friday, when there is one shift). The plant has additional potential production capacity of about 30%-35% assuming that it shifted to continuous production in three shifts.
The land on which the plant is located is owned by the Company.
• Sittensen, Germany (Nesse) – At this plant the Company's Flavors
Activity produces savory flavors and seasonings.
Production Capacity and Shifts – The plant’s production is carried out over five days a week in two shifts (except for Friday, when there is only one shift). The plant has additional potential production capacity of about 30-35% assuming that it produced continuously in three shifts.
The land on which the plant is located is rented by the Company.
• Stuttgart, Germany (Gewurzmuller) – At this plant the Company's
Flavors Activity produces savory flavor mixes and seasonings.
Production Capacity and Shifts – the plant operates five days a week in one shift. Maintenance work is carried out from time to time, according to need. The plant has additional potential production capacity of around 150% assuming that it produced continuously in three shifts.
The land on which the plant is located is rented by the Company.
• Stuttgart, Germany (Blessing) – At this plant, Blessing, under the
Company's Flavors Activity, produces starter cultures (for details regarding starter culture products, refer to section 1.23 of this report).
Production Capacity and Shifts – The plant operates five days a week in continuous production. The number of shifts and their duration corresponds with the volume of the production activity. Maintenance work is carried out from time to time, according to need. The plant has additional potential production capacity of around 20%.
The land on which the plant is located is rented by the Company.
• Wellingborough, UK (Belmay) – At this plant the Company's Flavors
Activity produces flavors.
Production Capacity and Shifts – The plant’s production is carried out over five days a week with a 9 hour shift for flavors production. Maintenance work is performed on an ongoing basis. The plant has additional potential production capacity of 100% assuming that it switched to multiple shifts.
The land on which the plant is located is owned by the Company.

47
• Hartlepool, UK (Oxford) – At the Hartlepool plant, the Company's Specialty Fine Ingredients Activity produces aromatic chemicals.
Production Capacity and Shifts – The plant operates five days a week in two shifts (24 hours a day), excluding two initiated halt periods of one week each for maintenance work (one in August and one at the end of December). The plant has additional potential production capacity of about 35%-40% (7 days a week) assuming that it shifts to continuous production.
The land on which the plant is located is owned by the Company.
• Teesside, UK – At this plant the Company's Specialty Fine Ingredients
Activity produces natural plant extracts for essential oils and aroma chemicals.
Production Capacity and Shifts – The plant's production is carried out over five days a week, in three shifts (24 hours a day), excluding halts periods for maintenance work (up to two weeks, generally in December). The plant has additional potential production capacity of 35%-40% assuming that it shifted to continuous production (7 days a week).
The land on which the plant is located is owned by the Company.
• North Bergen, New Jersey, USA – At this plant the Company's
Flavors Activity produces flavors and the Fine Ingredients Activity produces natural plant extracts and natural gums.
Production Capacity and Shifts – The operates five days a week in one or two shifts (subject to the Production Department), excluding an initiative halt for maintenance work. The plant has additional potential production capacity of over 100% assuming that it produced continuously (three shifts, seven days a week).
The land on which the plant is located is owned by the Company.
• Corona (CA), USA (FSI site) – At the Company's plant in Corona
(California), the Company manufactures flavor extracts for its Flavors Activity and extracts from natural plants.
Production Capacity and Shifts – The plant’s production is carried out over 5 days a week (according to customers' orders) in 1 shift during most of the year and in 1.5-2 shifts during summer months, excluding an initiated halt period for maintenance work. The plant has additional potential production capacity of 50%-40% assuming that it shifts to production in two shifts.
The land on which the plant is located is rented by the Company.
• Kunshan, China – At this plant the Company's Flavors Activity
produces flavors.
Production Capacity and Shifts – The plant operates five days a week in one shift. Maintenance is performed from time to time.
The land on which the plant is located is leased by the Company.

48
27.2. In addition to these production facilities, Azur S.A., a subsidiary of
Frutarom's controlling shareholder, ICC Industries, provides Frutarom with toll manufacturing services from its facility in Azur, Romania, for the production of specialty aroma chemicals.
28. Intangible Assets
28.1. The Company's business depends on intellectual property, which consists mainly of the formulas used to create its flavors and production processes for the production of fine ingredients. These formulas are not patented but are highly confidential proprietary business information, available to a limited number of people within the Company. It is generally industry practice not to patent the formulas used in the production of flavors, as doing so would make the formulas publicly known and the patent protection would only be available to a given flavor producer for a limited time. The Company also relies, in part, on confidentiality and non competition agreements with employees and consultants and to a lesser extent, patents (in the case of certain production processes developed by the Company) to protect its intellectual property. Frutarom does not believe that it depends materially on any single intellectual property right, proprietary formula, patent or license.
28.2. The Company has not registered the "Frutarom" trademark in all of the
jurisdictions in which it currently operates. In certain such jurisdictions, a trademark substantially similar to "Frutarom" has already been registered by third parties. The Company's management believes that not registering the "Frutarom" trademark in all the jurisdictions in which it operates does not constitute a significant risk to the Company and its activities.
28.3. For details regarding amounts attributable as assets in the Financial
Statement, please refer to Note 5 and Note 8 of the Financial Statement.

49
29. Human Resources
29.1. Frutarom had 1,448 employees as at December 31, 2009. The following table sets forth the number of employees employed by the Company by geographic region in the last three years:
December 31, Country
2009 2008 2007
Israel 320 366 404
Switzerland 234 256 234
Germany 373 385 391
UK 194 155 180
USA 156 133 132
Belgium 31 37 30
China 46 33 33
Russia 27 29 29
Ukraine 11 11 14
Kazakhstan 12 11 11
France 10 12 17
Turkey 17 17 15
Mexico 2 2 2
Brazil 5 2 2
South Africa 7 0 0
Hong Kong 3 0 0
Total 1,448 1,450 1,499
29.2. The following table shows the breakdown of Company employees by
fields of activity in the last two years:
December 31, Field
2009 2008
Sales and marketing 329 293
Research and development 214 227
Operations 688 682
219 217 248
Total 1,448 1,450
29.3. Following is Frutarom's organizational chart:


51
29.4. The majority of Frutarom's employees at its sites located in Germany, Switzerland (Reinach), the United States and Israel are covered by collective bargaining agreements. These agreements vary from country to country and deal principally with conditions of employment, salaries, promotion, pension schemes, certain benefit programs, procedures for hiring and dismissing employees and procedures for settling labor disputes. More than 40% of the Company's employees worldwide are covered by such collective bargaining agreements.
Employees that are not covered by the collective bargaining agreement have personal employment agreements, that vary from country to country based on the local regulation in each country.
29.5. The Company believes that it generally has good labor relations.
Directors and Senior Management in the Company
29.6. As at December 31, 2009, the Company's senior management was composed of 13 employees. The Company has personal employment contracts with the members of the senior management. These contracts include standard clauses regarding non competition, confidentiality, and transfer of intellectual rights to the Company, as is customary in the industry in which the Company operates.
29.7. A number of members of the Company’s senior management are
entitled in the case of their employment in the Company being terminated within a period of 12 months from the date on which the holding of ICC Handels AG14 decreases below 26% of the Company's share capital, to continue receiving their salaries and benefits from the Company for periods ranging between six and twelve months. Furthermore, upon the occurrence of such a change of control, all options and/or ordinary shares previously granted to these members of the senior management (and which are subject to a lock up period) will become immediately exercisable.
29.8. Officers in the Company are insured by directors and officers insurance. In addition, the Company granted the officers a commitment for advance indemnification for actions they take by virtue of their being officers in the Company. The indemnification is limited to an amount not to exceed 25% of the Company's equity at the time the indemnification is given to the officer, as appears in the Company's last financial reports (reviewed or audited).
14
To the best of the Company's knowledge, ICC Handeles AG is fully owned subsidiary of ICC Industries Inc., the controlling party in the Company.

52
29.9. Employee Equity Incentive Plans
The Company currently has equity incentive plans for senior employees in effect, which are discussed individually below. 2003 Share Option Plan
The Company’s 2003 Share Option Plan allowed the Company to grant certain of its board members and senior management options exercisable into Shares. Commencing at 2003, every six months, the board of directors decides the amount of funds allocated to the 2003 Share Option Plan, based on the recommendations of the compensation committee. These funds are then used to buy Shares on the TASE and against them options are allocated for senior officeholders in the Company according to ratios determined by the Board of Directors based on the recommendations of the Payroll Committee. The purchased shares are held in trust by Frutarom’s wholly-owned subsidiary, Frutarom Trust Ltd., until the options to which they relate are exercised. Options granted under the 2003 Share Option Plan become exercisable over a three-year period from the date on which they are granted, with a third of the options granted on a given date becoming exercisable at the end of each of the three years following their grant. However, the board of directors of the Company has the exclusive right to declare options exercisable as from an earlier date. The exercise price was set by the board of directors at one third of the average share price paid by the Company for the Shares underlying such options and is due upon exercise of the option by the employee. Options granted under the 1996 Share Option Plan expire on the sixth anniversary of the date of grant. Any tax consequences arising from the grant or exercise of any options under the plan are the responsibility of the employee. With respect to Israeli employees, the 2003 Option Plan is as set forth in the directives of Section 102 to the Income Tax Ordinance. The Company elected the "Course of Capital Profit". The number of Shares covered by each option granted under the 2003 Share Option Plan, as well as the exercise price, are proportionally increased or decreased by the changes in the Company’s outstanding share capital resulting from a stock split, reverse stock split, stock dividend, combination or reclassification of Shares. A side from few exceptions, in the event that the employment of an employee holding options granted under the 2003 Share Option Plan is terminated without cause, such employee has the right to exercise all exercisable options within 90 days from the date of termination. The remaining options which were granted but unexercised are terminated immediately. If the employment of an employee is terminated for cause, all unexercised options terminate immediately. As of December 31, 2009, the Company had options outstanding under the 2003 Share Option Plan for a total of 445,332 Shares.

53
Senior Executive Share Plan On December 2003, the Company adopted the Senior Executive Share Plan as an incentive share plan for certain members of its senior management. The Company has authorized the issuance of up to 1.2 million Shares for the Senior Executive Share Plan. The amount of Shares, issue, exercise price and method of issuance under the Senior Executive Share Plan is determined by the board of directors based on the recommendation of the compensation committee. The Company has allotted 900,000 Shares and allotted options for a further 150,000 Shares to members of senior management under the Senior Executive Share Plan as described in greater detail below. Any tax liabilities under the Executive Share Plan are the responsibility of the employee. In connection with the Senior Executive Share Plan, the Company has entered into an agreement with the Israeli tax authorities pursuant to which the Company has agreed that it will not be entitled to deduct the costs of the Senior Executive Share Plan from its revenues. Under the Senior Executive Share Plan, the Company has issued 900,000 Shares (the ‘Allotted Shares’). The lock-up period with respect to the Allotted Shares expired on January 1, 2007. With the departure of one of the Company’s senior employees on June 30, 2005, the Company purchased from him 125,000 shares that were still subject to the lock up. Effective as of December 31, 2009, the senior employees exercised all the shares held by the trustee. Under the Senior Executive Share Plan, the Company has granted options for an additional 150,000 Shares (the ‘‘Senior Executive Option Shares’’). With respect to the Senior Executive Option Shares, options with respect to 25% of the Shares became exercisable on 9 October 2004, with a further 25% becoming exercisable on 9 October of each of the three subsequent years. The exercise price for the Shares is NIS 10.87 per Share. In June 2007, an officeholder realized 30,000 options for which the Company allocated 30,000 shares for a consideration of NIS 326,100. In May 2008, the senior officeholder exercised 40,000 options against which the Company allocated 40,000 shares in consideration for NIS 434,800. In July 2008, the senior officeholder exercised another 40,000 options against which the Company allocated another 40,000 shares in consideration for NIS 434,800 and in May 2009 the senior employee exercised the balance of the 40,000 option warrants against which the Company allotted 40,000 shares in consideration for NIS 434,800. On January 2006, the Company allotted 725,000 non-transferable options to four senior officers of the Company. 600,000 of the shares can be exercisable in three equal portions on January 1, 2008, January 1, 2009 and January 1, 2010. The additional 125,000 shares can be exercised in four equal portions on January 1, 2007, January 1, 2008, January 1, 2009, and January 1, 2010. The exercise price is NIS 31.068 per option. The option shares will expire on February 1, 2012. In May 2009, the 125,000 options expired, in accordance with the terms of the private offering, as a result of the retirement of a senior employee. In September 2009, 125,000 additional options have expired in accordance with the terms of the private offering as a result of the retirement of another senior employee. Effective as of December 31, 2009, the balance of the options complies with the private offering and stands at 475,000 untradeable options.

54
Options granted to Israeli employees are held by a trustee in accordance with section 102(b)(3) of the Income Tax Ordinance.
30. Raw Materials and Suppliers Frutarom purchases thousands of raw materials which it uses for the manufacture of its products from a wide range of suppliers, with more than one supplier for most products. The principal raw materials purchased by the Company include plants, leaves and roots from which the Company produces natural flavor extracts, functional food ingredients and pharma/nutraceutical extracts. In addition the Company purchases essential oils from which it manufactures specialty essential oils such as citrus oils and mint oils. Other raw materials purchased by the Company include natural and synthetic chemicals, alcohols, esters and acids and oleoresins The supply chain managers, both global and local, and the purchasing units of the Company are regularly monitoring the raw materials price trend and if necessary, the Company acts to adjust the selling prices of its products to the changes in the raw material prices.
30.1. In recent years, none of Frutarom's suppliers, supplied more than 10% of the consumption of its raw materials. There is a small number of raw materials for which Frutarom has exclusive suppliers; however, since these raw materials are used in only a limited number of Frutarom's approximately 20,000 products, and since the materials having only one supplier are used in a limited number of Frutarom's products (none of which is substantial), management does not believe that its dependence on these exclusive suppliers is material.
30.2. Frutarom seeks to reduce costs and secure supplies by purchasing raw
materials directly from the source rather than from dealers or distributors. Frutarom has a centralized supply chain and the purchase of the raw materials used for the manufacture of the products of the two activities is implemented through it in order to leverage the purchasing power of the raw materials in large quantities while achieving attractive prices.
30.3. The Company carefully manages its global supply chain to ensure
availability of raw materials at its production facilities. Frutarom maintains comparatively high stocks of certain raw materials, as most of the natural ingredients used by Frutarom in its production are crop related goods. In addition, raw materials delivery times are generally longer than the delivery times to customers by Frutarom of its end products, requiring Frutarom to maintain stocks of raw materials sufficient to enable it to supply its products to customers as ordered with short lead times. However, Frutarom generally maintains comparatively low stocks of finished goods. Further, the availability and the prices of many of the raw materials used by Frutarom to manufacture its products, and in particular the natural ingredients, are subject to fluctuations as a result of international supply and demand.
31. Working Capital
31.1. The Company keeps close track of the items of working capital. The follow up is conducted at the level of the subsidiaries, under close supervision by the Company's headquarters and the management. The average rate of working capital as a percentage of the Company's sales for 2009 stands at 26.7% compared with an average of 34.6% in

55
2008. The Company is active in working to reduce working capital requirements in all their parameters. Following are the details of the Company's policy regarding the items of working capital:
31.2. Inventory – The Company's activity is characterized by seasonality of
demand (refer to section 26 of this report). The Company manufactures at a number of production sites worldwide (refer to section 27 of this report). In view of the fact that the Company's production sites are located throughout the world and the considerable importance that the Company attributes to customer service, the Company maintains a flexible inventory policy that ensures availability of inventory at the various production sites and with cooperation between them. This inventory policy enables the Company to meet short supply times to its customers. Frutarom maintains comparatively high stocks of natural raw materials whose availability may be irregular due to their seasonal nature. The Company orders raw materials from its suppliers taking into account past experience, volume and the rate of sales, production limitations and seasonality. Since most of the production is done according to specific orders from customers Frutarom generally maintains limited stocks of finished products under the Flavors Activity. The balance of inventory as at December 31, 2009 was US$ 79.1 million compared with US$ 94.9 million as at December 31, 2008 (refer to note 16 to the financial reports attached to this report). The inventory days, during 2009, is set on 147 days.
31.3. Customer Credit – The Company implements procedures that determine the conditions for granting its customers a credit framework. The Company follows up on an ongoing basis on deviations from the credit framework granted to its customers and the collection process. Due to the global nature of the Company's customer base and the lack of dependency on any particular customers, the Company does not insure its credit to customers. The balance of credit to customers as at December 31, 2009 was approximately US$65.2million compared with US$ 68.2 million as at December 31, 2008 (refer to note 15 to the financial reports).
31.4. Supplier Credit – The Company has a global supply chain and purchase unit at headquarters that manages the supply and purchase of strategic materials from suppliers and which serves the two main activities of the Company. The average scope of supplier credit in the report period stood at 53 days and US$27.2million. The balance of the Company's debt to suppliers as at December 31, 2009 was approximately US$28.3million compared with US$ 26.7 million as at December 31, 2008 (refer to note 19(a) to the financial reports attached to this report).
31.5. The turnover of goods returned to the Company is not material to its activity.

56
32. Capital Expenditure
32.1. The Company's capital expenditure is in principle the result of the enhancement and expansion of existing facilities, as well as investment in developing new manufacturing facilities, investment in environment protection, sales and marketing offices and research and development laboratories.
32.2. The Company's planned investments for the next three years are
expected to average approximately US$ 12 million to US$ 15 million per annum. Most of the planned capital expenditures in the coming years are related to upgrades of existing production facilities; continued implementation of a new company-wide IT system; improvements and capacity increases to Frutarom's production facilities; and investment in ecology, energy conservation and environment. The Company will examine the implementation of the various investments when necessary. Other then above mentioned, the company has no additional material investments planed for the next year.
32.3. The balance of the depreciated cost of the fixed assets in the
Company's balance sheet as at December 31, 2009 following deduction of investment grants is US$126.1million. For further information on the Company's investment in fixed assets refer to note 7 of the financial reports attached to this report.
32.4. The Company believes that the cash flow from current operating
activities will be sufficient to meet the Company's anticipated capital expenditure and working capital required to support the Company's internal growth in the next several years.
33. Capital Resources
33.1. The Company's activity is financed through external financing. During
the period reported, the average and effective interests were set on 3.5% and 3% respectively.
33.2. During 2009, the Company used long term loans from banks for the
purpose of financing acquisition made during recent year. At December 31, 2009, the Company's debt balance to banks stood at US$117.1million.
33.3. As part of a revision to the credit framework at the Company's disposal,
during 2007 the Company committed to a financing banking institute to meet the following standards:
• The Company's equity shall not at any time be less than US$
180,000 thousands. • The Company's equity shall not at any time be less than an amount
equal to 30% of the Company's balance sheet. • The ratio from the Activity of the balance of the Company's
financial liabilities in operating profit to service debt (operating profit to service debt meaning the accumulated sum of operating profit from current activities before finance expenses and taxes and with the addition of depreciation and amortization expenses) will be not more than 6.

57
As of the date on which this report was published, the Company meets these financial standards. For further details on the liabilities with respect to financial standards, refer to note 9 to the financial reports that are attached to this report.
33.4. The company and its Israeli, US, UK German and Swiss subsidiaries
have agreements with banks whereby the banks will extend revolving credit facilities. As of December 31, 2009, the unutilized credit balance of the Company and the consolidated companies in Israel were US$54 million.
33.5. For further details on the Company's loans refer to note 9 to the
financial reports that are attached to this report.
34. Taxation
34.1. For details of tax regulations applicable to the Company refer to note 13 in the financial reports.
34.2. The Company has final tax returns until 2006, inclusive.
34.3. The Company operates through subsidiaries throughout the world, where the tax rates vary from 12.5% to 42%.
34.4. The effective tax rate (on the consolidated) in 2009 was 22.6%
compared with 19.2% in 2008. For details on the changes between the Company's statutory tax rate and the effective tax rates refer to note 13 to the financial reports.
35. Environment
35.1. The Frutarom Group has and continues to act in an ongoing manner to
prevent environmental hazards and to preserve the environment. The Company is authorized within the framework of the Responsible Care program. The Company's management maintains a constant watch on the subject of environment protection and acts to reduce the environmental risks at all of the Group's sites.
As part of the implementation of the Company's strategic program for environmental protection, environmental trustees have been appointed at the Group's key production sites in the world. The trustees have undergone routine validation and training in order to heighten the involvement and awareness of the employees at all the Group's sites to the subject of protecting the environment. All of the Company's sites hold the licenses relevant to the legislative system in their country and, in the Company's estimation, act in accordance with the law. The sites in Israel hold business licenses in accordance with the Law for Licensing Businesses, 5728-1968, and valid poisons permits in accordance with the Law for Hazardous Materials, 5753-1993. Following is a list of the Frutarom Group's key activities in matters of environment during the year 2009:

58
• In accordance with the Environmental Arrangement Document agreed upon between the Environmental Protection Ministry and the Company in February 2009 (for details regarding the Environmental Arrangement Document, refer to Section 38 below), significant and extensive maintenance and upgrade works for handling the environmental issues including, inter alia, the installation of seven active carbon-based odor filtering systems, the erection of a continuous monitoring system for the environmental systems and the implementation of the LDAR Project for locating and repairing unfocused leakages in the site were implemented.
• At the Company's sites in Stuttgart, Germany, Reinach and
Switzerland all types of solid waste (organic, from the packing stage, plastic, carton and wood) for recycling and reuse.
• At the Company's site in Wadenswill in Switzerland an electric
power station has operated for a number of years. It operates on natural gases produced from the organic waste arising from the production process.
• At the Company's sites in Reinach in Switzerland a heat recycling
system was installed in 2009 which causes significant saving in the consumption of energy.
• At the Company's site in New Jersey, USA, a multi year program
for handling the sites waste water is in place in cooperation and with the approval of the relevant authorities in the USA. As part of the program, the construction process of a closed waste water transport system, the upgrade of waste water collection facilities and the rest of the Company's activities related to the plant's infrastructure continue and should prevent contact between rainwater and the plant's waste water. The 2009 work plan has been fully implemented. In addition, last year an alcohol recycling system from organic waste and from the extraction process was installed, which causes saving of approximately 30% in alchol waste which requires organized evacuation.
• At the Company's sites in Northern UK a great emphasis is put on
the recycling of methanol and ethanol in production processes and thus a significant reduction of the volume of waste is achieved. In addition, organic materials are sent to the production of compost and thus they help the environment.
35.2. On October 30, 2007, the IPPC directive (96/61/EC) went into effect in
the European Union. This regulation sets stringent standards in all matters relating to preventing environmental hazards and is expected to be enforced at the Group's sites in Europe. In Israel, a number of laws have been proposed that will likely tighten the requirements on the Company's sites in Israel.
35.3. For details about a hearing implemented for the Company before the
issuance of an administrative closing order as set forth in the Business Licensing Law, 1961 and the Hazards Prevention Law 1961 issued thereto by the Ministry of Environmental Protection with respect to its compliance with the terms of the Environmental Arrangement Document agreed upon between the Ministry for the Environmental Protection and the Company in February 2009 (for details regarding

59
the Environmental Arrangement Document refer to Section 38 below), refer to the Company's immediate reports dated September 3, 2009, September 13, 2009 and September 15, 2009.
35.4. Refer to section 38 of this report regarding lawsuits and legal
procedures relating to environment.
36. Limitations and Supervision of the Company's Business
36.1. The Company develops, produces and markets its products in a number of jurisdictions throughout the world and is subject to the legislation, regulations and control in effect on its activities in each of the various countries. These laws and regulations include, among others, the U.S. Food and Drug Administration's (FDA) regulations regarding activity in the United States; EU directives implemented into local law in the European jurisdictions in which the Company operates; and regulations determined by the Ministry of Health in Israel. These laws and regulations determine standards relating to food production, production facilities, equipment and the personnel required to produce products required for human consumption.
36.2. In addition, the Company is subject to various rules relating to health,
work safety and environment at the local and international levels in the various jurisdictions where it operates. The Company's production facilities in the United States, Israel, the United Kingdom, Switzerland, Germany and China are subject to environmental standards in each of these countries relating to air emissions, waste water discharges, the use of hazardous materials, waste disposal practices and clean up of existing environmental contamination. In recent years, there has been a significant increase in the stringency of environmental regulation and enforcement of environmental standards in each of these countries and in the world, and the cost of compliance has risen significantly.
36.3. Frutarom believes that it currently operates its facilities in material
compliance with relevant laws and regulations related to food manufacturing, work safety, health and the environment. In addition, compliance with existing governmental regulations has not materially affected Frutarom's operations, earnings or competitive position in its markets.
36.4. For additional information on regulation, health, safety and permits
refer to section 1.15 of this report.
37. Material Agreements
37.1. For details regarding the Flachsmann acquisition agreement refer to section 1.14 of this report.
37.2. For details regarding the IFF European food systems acquisition
agreements refer to section 1.15 of this report.
37.3. For details regarding the Nesse acquisition’s agreements refer to section 1.16 of this report.
37.4. For details regarding the Acatris acquisition’s agreements refer to
section 1.17 of this report.

60
37.5. For details regarding the Belmay acquisition agreement refer to section
1.18 of this report.
37.6. For details regarding the Jupiter acquisition agreement refer to section 1.17 of this report.
37.7. For details regarding the Raychan acquisition agreement refer to
section 1.20 of this report.
37.8. For details regarding the Adumim activity acquisition agreement refer to section 1.21 of this report.
37.9. For details regarding the Abaco acquisition agreement refer to section 1.22 of this report.
37.10. For details regarding the Gewurzmuller Group acquisition agreement
refer to section 1.23 of this report.
37.11. For details regarding the Rad activity acquisition agreement refer to section 1.24 of this report.
37.12. For details regarding the Oxford assets and business acquisition
agreement refer to section 1.25 .
37.13. For details regarding the FSI assets and business acquisition agreement refer to section 1.26.
37.14. For details regarding the acquisition of CH's assets and Savory activity
refer to section 1.27.
37.15. As part of the capital raising (refer to sections 3.4 through 3.7), the Company concluded a number of agreements, including an underwriting agreement with the offering underwriters, Morgan Stanley, UBS and HSBC, and a depositary agreement with The Bank of New York. These agreements include the standard clauses for this type of agreement.
37.16. For details regarding the Company's commitment to a financing
banking institute to meet financial standards refer to section 33.3.
37.17. For details regarding the Environmental Arrangement Document between the Ministry of the Environment and the Company refer to section 33.3.
37.18. The Company is not a party to strategic cooperation agreements.
38. Litigation
38.1. For details regarding litigation in which the Company is involved, refer to Note 11b(2) of the financial statements.
38.2. Excluding the above, the Company is not involved in any significant
litigation in which the amount claimed (without interest and expenses) exceeds 10% of the current assets based on the consolidated financial reports.

61
39. Key Strengths and Strategy
Key Strengths Frutarom believes that it has a number of key strengths that enable it to compete effectively and achieve above-average industry growth and continued margin expansion:
39.1. Established global flavors and fine ingredients company with a differentiated, value-added product portfolio
Frutarom is an established global company with a strong local presence in its key target markets. Frutarom’s broad product portfolio comprises approximately 20,000 products, focusing on flavors and natural fine ingredients, including natural extracts, specialty essential oils and citrus products. The majority of the Company’s sales derive from its extensive natural products offering in the fields of flavors, functional food and pharma/nutraceuticals. Frutarom markets and sells its products to over 13,000 customers in more than 120 countries, operating production facilities in Europe, North America, Israel, Asia and South Africa. Frutarom has 27 research and development laboratories. Frutarom sells and markets its products principally through its 48 sales and marketing offices.
39.2. Strong focus on delivering superior service and comprehensive
offering to both large multinational and mid-sized and local customers
Frutarom differentiates itself from its major competitors by focusing not only on the large multinational customer base, but also on mid-sized and local customers. Frutarom offers the same level of high-quality service and product specialization to mid-sized and local food and beverage producers as is normally reserved only for large multinational companies. Frutarom’s sales and marketing team and research and development laboratories work closely with both types of customers to offer them timely and responsive personalized development services, including custom flavors and specialty fine ingredients tailored to their specific needs. In addition, Frutarom offers mid-sized and local food and beverage producers a high degree of flexibility with respect to minimum order requirements and lead times. Management believes that the mid-sized and local customer segment represents a large and attractive growth market, and that this focus enables Frutarom to achieve broader product sales and deeper market penetration. Special focus is given to the private label producers, which consist one of the most growing market segment in the flavors field. In light of consumers becoming increasingly price conscious, the variety of private label products has increased and the supermarket chains and other retailers have become more aware of the importance of supporting their own brand image. The demand from supermarket chains and other retailers to private labels products which resemble existing products and unique premium products, offers new business opportunities for the flavors producers. The trends of increased growth rates of private label products were accelerated due to the financial global crisis. In the Company's opinion, this trend will also continue with the end of the global economic crisis.

62
39.3. Focus on functional food ingredients
Changes in consumer preferences together with an ageing population have led to rapidly growing demand for functional foods which have, or are perceived to have, health and well-being benefits. Frutarom’s functional food ingredient product offering and research and development competencies have been significantly enhanced by its acquisition of Flachsmann, Acatris, Adumim and Rad (refer to sections 1.14, 1.17, 1.21 and 1.24 in this report). The market for functional foods is a relatively new, evolving and innovative market requiring close collaboration between functional food ingredients manufacturers and food and beverage producers. Frutarom believes its relationship with, and understanding of, food and beverage producers provide it with a competitive advantage. Frutarom is also able to provide a solid scientific basis for the health benefits of its functional food ingredients, such as clinical studies, that are often required by food and beverage producers. As part of its research and development activity and in order to broaden its portfolio of natural, innovative and unique products, Frutarom acts to create cooperation with academic institutions, research institutes and start-up companies in Israel and throughout the world. Furthermore, Frutarom’s functional food ingredients production meets strict health and safety standards, such as the Swiss GMP and British BRC standards.
39.4. Strong technological base and innovation Frutarom estimates that one of its core strengths is its emphasis on
technology and innovation. Frutarom has consistently invested in its research and development capabilities and in acquiring new technologies. Frutarom has established 27 research and development laboratories throughout the world in close proximity to its customers and developed new tailor-made products in close collaboration with them, further strengthening its customer relationships. In addition, Frutarom has proprietary botanical extraction capabilities which have been bolstered through the Flachsmann and Rad acquisitions. Frutarom also cooperates with universities and research institutions internationally in the development of new innovative products. As a result, Frutarom believes it is a leader in the development of unique, natural ingredients for flavors, functional foods and pharma/nutraceutical applications.
39.5. Well positioned in developed countries
Frutarom believes it has a well-established position and recognized brand name in developed countries, with research and development and manufacturing facilities, as well as a large, dedicated and experienced sales team. In addition, Frutarom’s recent acquisitions have strengthened its presence in West European and other selected markets, enlarging its customer base and geographic reach and providing Frutarom with significant cross-selling opportunities.

63
39.6. Strong presence in, and focus on, more rapidly growing emerging markets
Frutarom has a strong presence in emerging markets in which demand for flavors and fine ingredients is growing more rapidly than developed markets. The Company has an established presence in Russia, Ukraine, Kazakhstan, Romania, Turkey, China, South Africa, India, Brazil and Mexico. Frutarom is continuously strengthening its position in emerging markets, by building local sales and marketing and research and development capabilities, providing it with knowledge and understanding of local consumer tastes and possibility to provide effective service. Frutarom also offers technical and marketing advice to emerging food and beverage producers in these markets, helping them improve their product offerings and operations, which in turn strengthens its relationships with existing and potential customers.
39.7. Proven track record of acquisition-led profitable growth Frutarom has a proven track record of identifying, executing and
integrating acquisitions. Since 1990, Frutarom has acquired 24 businesses such as the CPL business in 2001; Flachsmann in 2003 and the IFF business in 2004; the flavors extracts business of A.M. Todd Botanical Therapeutics in June 2005; the acquisition of Nesse in January 2006; the acquisition of Acatris in October 2006; the acquisition of Belmay in England in March 2007; the acquisition of Jupiter in England in April 2007, the acquisition of Abaco in the USA in July 2007; the acquisition of the Adumim activity and the acquisition of Raychan, which were completed in August 2007; the acquisition of the Gewurzmuller Group in Germany in October 2007; and the acquisition of the Rad activity in November 2007, the acquisition of Oxford's assets and business in February 2009; the acquisition of the American FSI's assets and business in March 2009 and the acquisition of CH's assets and Savory activities in Germany in June 2009 (refer to sections 1.13 through 1.26 to this report). These acquisitions have significantly strengthened Frutarom’s position as a leading global player in the field of flavors, fragrances and specialty ingredients, its geographic reach, mainly in Western and Eastern Europe, and enabled it to enter new markets. These acquisitions have also significantly increased the Company’s product portfolio in both sweet and savory solutions and in the field of natural extracts with dietary attributes and its large multinational and mid-sized and local customer bases, creating significant new cross-selling opportunities of newly-acquired products to its existing customers and vice versa. In addition, the technological know-how and management expertise acquired through these acquisitions have enhanced the Company’s strengths in product innovation and operational efficiencies.
39.8. Experienced management team The Company has a highly qualified global senior management team
with extensive experience in the flavors and ingredients business, including in research and development, operations, sales and marketing, and the acquisition and integration of new businesses.

64
Strategy Frutarom’s strategic objective is to increase shareholder value over
time by becoming one of the leading global flavor and fine ingredients manufacturers and achieving above-average industry growth and profitability. The key elements of Frutarom’s strategy are as follows:
39.9. Focus on two core businesses and leveraging synergies between
them The Company intends to continue focusing on its two core businesses,
flavors and specialty fine ingredients, and leveraging the synergies between them. Since fine ingredients are the key components used in the production of flavors, the Company’s expertise in natural fine ingredients enables it to produce high quality, tailor-made specialty flavors. Similarly, the Company’s fine ingredients business benefits from the expertise of its flavors business, allowing it to better understand the needs of its customers including third party flavor manufacturers. In addition, as certain of the Company’s fine ingredients are sold directly to food and beverage producers, the Company’s strategy is to use a single sales person to sell both flavor and fine ingredients products to such customers, thereby achieving operational efficiencies. As part of its strategy for rapid profitable growth, Frutarom acts strategically to expand the scope of its activity and product portfolio in the savory field, which is growing more quickly than the average for the industry. Following the acquisition of Nesse, Raychan, Rad, the Gewurzmuller Group and CH's assets and Savory activities, Frutarom believes that it has a comprehensive solutions product range to offer manufacturers of meat and fish products, snacks, and convenience food which will also support continued growth. The acquisitions of Acatris expanded the offering of natural, unique products that Frutarom offers its customers, mainly in the functional foods and nutraceuticals markets.
39.10. Continue to focus on superior customer service and product development for both large multinational and mid sized and local customers
Frutarom intends to enhance its customer service and expand its
product portfolio for both large multinational as well as mid sized and local customers. In the large multinational food and beverage customer segment, Frutarom will seek to improve its niche, specialized product offering and increase its offering of comprehensive natural solutions. In the mid sized, local and private label customer segment, Frutarom intends to continue to offer this customer segment the same level of service and customized product development as normally reserved for large multinational companies, as well as the short lead times and manufacturing flexibility they require.
39.11. Expand market position in developed markets
Frutarom believes there are additional opportunities to expand in both
Western Europe and USA, principally by leveraging cross-selling

65
opportunities resulting from its recent acquisitions and the opportunities to perform additional acquisitions.
39.12. Continue penetrating and strengthening Frutarom’s market
position in more rapidly growing emerging markets Frutarom believes that there are significant growth opportunities in
certain fast growing emerging markets with growing demand for flavors and fine ingredients products. Frutarom intends to strengthen its position in and further penetrate the emerging markets where it already operates, including the CIS, Eastern Europe, Turkey, Brazil, Mexico, China, South Africa, India and other countries in Asia, as well as to expand into other developing countries to take advantage of growth opportunities in these markets. Frutarom believes that a local presence in these emerging markets will provide it with a significant competitive advantage as these markets continue to expand and develop. Frutarom therefore intends to allocate additional resources to establishing new production sites and research and development laboratories, hiring new sales and marketing personnel and expanding its technical and marketing advice to emerging food and beverage producers in select emerging markets.
39.13. Achieve leadership position in the growing market for natural and
healthy products Frutarom believes it is well positioned to take advantage of the growing
trend for food and beverage manufacturers to utilize more natural and healthy ingredients in their products. The acquisition of Flachsmann, Acatris, Rad and FSI strengthened Frutarom’s position as a market leader by leveraging its existing expertise in natural flavor extracts, functional food ingredients and natural pharma/nutraceutical extracts, as well as allocating more of its research and development and sales and marketing resources to the development and marketing of healthy and natural products. Within the framework of Frutarom Health (for additional information on Frutarom Health refer to section 16.8 of this report) Frutarom is working to continue building on the reputation and strength of its “EFLA” branded pharma-grade botanical extracts, which are produced in its Swiss facilities. In parallel, Frutarom integrated the Lifeline leading product line that was added to the Company’s product offering upon completing the Acatris acquisition. Frutarom works to create cooperation with academic institutions, research institutes and start-ups in Israel and worldwide in order to expand its pipeline of healthy and tasty products that it intends to launch in coming years. During 2009 Also, Frutarom acted to create a number of such collaborations.
39.14. Provide comprehensive natural solutions to the food and
beverage industry Frutarom offers comprehensive, integrated solutions, combining natural
flavors and functional food ingredients and with its food systems product offering. With the recent acquisition of the IFF Business, the Company has significantly bolstered its food systems capabilities, which, when combined with its existing expertise in the fields of natural flavor extracts, functional food ingredients and natural flavors, enable it to offer these solutions to food and beverage producers. Frutarom uses its newly expanded food systems capabilities and seek new ways

66
of bundling its new and innovative products into a tailor made offering suited to its customers’ needs.
39.15. Expand investments in research and development
Frutarom believes that technology and innovation are key to its
success. Therefore, the Company intends to continue to invest in research and development both in the Flavors and Fine Ingredients Activity.
39.16. Enhancing profitability
Frutarom intends to act to expand its margins by: (i) continuing to focus
on operational efficiencies, including maximization of facilities utilization and inventory management while focusing on efficiently merging the acquisitions of recent years while achieving substantial operational savings. During 2009, Frutarom has completed the merger of the acquisition in the UK (Oxford) with its raw material production sites in the UK, and acted to merge the sales, service and purchasing systems between Nesse, the Gewurzmuller sites and CH's assets and Savory activities in Germany and to integrate FSI activity (acquired in March 2009) with its US activity; (ii) continuing to exploit synergies within and between the segments; (iii) taking advantage of scale by leveraging fixed costs over a larger product and customer base; and (iv) continuing to improve its product mix and to develop and market unique new, higher profit margin, value-added products.
39.17. Continue rapid growth through strategic acquisitions
Acquisitions have also contributed to Frutarom’ rapid growth and
Frutarom will continue to evaluate acquisition opportunities that meet its strict investment criteria and enhance shareholder value as part of its ongoing growth strategy. Frutarom will seek acquisition opportunities that expand its portfolio of products, targeted geographic reach and customer base, and which provide Frutarom with further product bundling and cross-selling opportunities. In addition, Frutarom will work to further integrate its recent acquisitions with its own operations in order to optimize cross selling opportunities and to realize additional synergies and cost savings. For example, Frutarom intends to use the recently acquired IFF business as a platform for expanding its food systems business into additional countries such as Italy and Spain and certain emerging markets. In addition, Frutarom will invest in research and development of innovative and added value food systems products, and intends to leverage the diverse product portfolio of the IFF Business to increase the Company’s product offering in the bakery and convenience food segments.

67
40. Financial Data regarding Geographic Regions
40.1. Frutarom manufacturers, markets and sells its products throughout the world. The following table set forth the Company's sales in the last three years broken down by geographic regions.
2007 2008 2009
Change % 2008 vs
2009
EMEA 254.1 333.2 298.7 70.3% America 45.9 52.5 49.7 11.7% Israel* 40.5 52.8 37.1 8.7% Asia and Far East
27.8 34.8 39.7 9.3%
Total 368.3 473.3 425.2 100% * The sales in Israel include the trade and marketing activity in Israel (an activity which is not one of Frutarom's core activities) in the amounts of US$10.5M, US$13.2M and US$7.1M in 2007-2009 respectively.
40.2. For further information on the geographic regions refer to note 6 in the financial reports attached to this report.
41. Risk Factors
41.1. Below are the main risk factors:
Risks Related to the Macro Economy Environment
� The effects of the global economic crisis on the Company's activities.
2009 was characterized by a relative slowdown in the markets of the Company's operation as a result of the global economic crisis which materially changed the growth trend characterizing most of the world's economies in recent years and the business environment of Frutarom's operation. Frutarom entered the challenging and crisis-related period which affects the world as a more than ever leading and strong global company, with an experienced global management, an excellent variety of multinational and regional customers around the world, with excellent technologies and products and an excellent pipeline of products under development, jointly with its many customers. Frutarom estimates that the stabilization of the global economy in recent months, the moderation in currencies fluctuations, the halt of the destocking trend and the signs of gradual improvement in consumption, including in countries significantly affected by the devaluation in their currency, may contribute to an improvement in our sales level and to future return to a growth trend at rates similar to those characterizing our activities in the past. Nevertheless, as of the date of this report, the Company does not have any future information in these matters and it cannot estimate their effect on its activities in the future. However, in view of the moderate recovery signs from the economic crisis which characterized the beginning of 2010, the food industry and the industries derived

68
therefrom may be characterized by signs of moderate return to growth rates during 2010.
� The Company’s operations in emerging markets may be adversely affected by political, economic and legal developments in these countries.
The Company operates in a number of countries outside of Western Europe and the United States, such as Russia, Turkey, Kazakhstan, Ukraine China and South Africa, and therefore is generally susceptible to the political, economic and legal systems and conditions in these countries which are generally less predictable than in countries with more developed institutional structures. The Company’s facilities in these countries could be subject to disruption as a result of economic or political instability or the expropriation or nationalization of its assets situated there. The more significant risks of operating in emerging market countries arise from the establishment or enforcement of foreign exchange restrictions, which could effectively prevent Frutarom from receiving profits from, or selling its interests in, companies located in these countries. While none of the countries in which Frutarom’s subsidiaries are located currently has foreign exchange controls that affect it significantly, many of these countries have had such controls in the recent past and the Company cannot give any assurances that they will not reinstitute such controls in the future.
� Currency fluctuations may affect the accurate interpretation of
financial statements and trends are unpredictable.
The Company reports its financial results in US dollars. Frutarom has sales, expenses, assets and liabilities denominated in currencies other than the U.S. dollar (in particular, Euro, Swiss francs, British pounds and NIS) due to its global operations. Fluctuations in the exchange rates of these foreign currencies could have an impact on the Company’s results of operations. Although the Company generally tries to match its sales and costs, as well as monetary assets and liabilities, in the same foreign currencies, there can be no assurance that such activities will be adequate to counter the effects of changes in foreign exchange rates on Frutarom’s results of operations.
In addition, even where revenues and expenses are matched, the Company must translate the results of operations, assets and liabilities of its subsidiaries with a functional currency other than the US dollar into US dollars in its consolidated financial statements. To do so, the Company translates balance sheet items into US dollars using fiscal year end exchange rates as well as income statement and cash flow items by using average exchange rates during the relevant period. Consequently, increases and decreases in the value of the US dollar versus other currencies could affect the Company’s reported results of operations and the value of its assets and liabilities in its consolidated balance sheet, even if its results of operations or the value of those assets and liabilities has not changed in their original currency. These translations could significantly affect the comparability of the Company’s results between financial periods and/or result in significant changes to the carrying value of its assets, liabilities and shareholders’ equity.

69
The Company currently does not hedge its currency exposure through financial instruments. Although the Company actively manages its foreign currency denominated assets and liabilities in an effort to reduce its exposure to fluctuations in the exchange rate between the US dollar and other currencies, there can be no assurance that fluctuations in foreign exchange rates will not have a material adverse effect on the Company’s results of operations or financial condition. During most of 2009 the strengthening of the Western European and Israeli currencies (in which most of Frutarom’s sales are made) against the US dollar contributed to the decrease in the Company's sales and profit in US$ term. This trend was reversed during the recent months of 2009.
� The Company may suffer economic harm as a result of increases in interest rates.
The Company’s sources of finance, as needed, for short and long term, are linked to the US dollar, the pound Sterling, the Swiss franc and the Euro (according to the activity currency of the subsidiary), and bear Libor interest at variable rates. According to its policy, the Company does not use financial instruments to protect against possible rises in interest rates. As at the date of the balance sheet, the Company does not hold derivative securities. These rates are not generally subject to any caps. If interest rates increase, the Company may not be able to refinance its credit agreements, or any other indebtedness, on attractive terms. Increases in interest rates will impact the company's cash flow. The global financial crisis brought to the shrinkage of the credit markets which led to decrease in the availability of financing sources for businesses. The Company estimates that its cash flow generated from its current activities is expected to enable the full repayment of its expected liabilities without the need for external sources of finance. In addition, The Company re-approved the availability of its credit lines and her backup from leading financial institutes. Nevertheless, the continuation of the credit crisis may affect its ability to refinance its debts in attractive conditions.
Risks Related to the Industry
� Frutarom faces competition in the markets in which it
operates, which could have a material adverse effect on its business and ability to maintain and grow its market position.
The Company faces increased competition from large multinational and mid-sized companies as well as smaller regional companies in many of the markets in which it operates. Certain of the Company’s competitors have greater financial and technological resources, larger sales and marketing organizations and greater name recognition than the Company, and may therefore be better able to adapt to changes and trends in the industry.
The global market for flavors is characterized by close, collaborative relationships between flavor manufacturers and their

70
customers, particularly in the large multinational customer segment. Further, large multinational customers, and increasingly, mid-sized customers, limit the number of their suppliers, placing those that remain on ‘‘core lists’’. To compete more successfully in this environment, the Company must make greater investments in customer relationships and tailored product research and development in order to anticipate customers’ needs and to provide effective service. A failure by the Company to maintain positive relations with its existing customers, establish good relations with new customers, or secure inclusion on certain of the core lists, could have a material adverse effect on the Company’s business, results of operations or financial condition. In comparison to the market for flavor compounds, the market for fine ingredients is more price sensitive and is characterized by comparatively lower margins. Some of the fine ingredients products manufactured by the Company are less specialized and more interchangeable with those of its competitors. In particular, overcapacity in the global production of certain types of fine ingredients may have a negative impact on Frutarom’s sales and profitability. Although Frutarom has pursued a strategy of focusing on those fine ingredients products exhibiting higher margins and specialization, as well as on lowering costs of production, there can be no guarantee that operating margins for its fine ingredients products will not decrease in the future, which could in turn have a material adverse effect on the Company’s business, results of operations or financial condition.
� Changes in regulations could have a material adverse effect
on the Company and its ability to market and sell new products.
The Company is subject to a variety of health, safety and environmental rules at national, state and local levels in the various jurisdictions in which it operates. Generally, there is a trend towards increased regulation in the industry in which the Company operates. This has generally been a result of increased public sensitivity toward the composition and use of flavor products. For example, the market for nutraceuticals and functional foods is currently subject to increased regulation, particularly in the United States. Nutraceuticals are dietary food supplements which provide, or are perceived as providing, certain medical or health benefits. Functional foods are foods with certain ingredients added which provide, or are perceived as providing, health and well-being benefits, such as juices or yogurts with health additives. As a result of their medicinal qualities and claimed health benefits, nutraceuticals and functional food products are being increasingly viewed by regulators as having similar characteristics to pharmaceutical products, which has led to a general public debate, worldwide, as to whether nutraceuticals and functional food products should be subject to a more stringent regulatory framework similar to that governing the market for pharmaceutical products. Management has identified nutraceuticals and functional food ingredients as an important market for the future growth of the Company. The implementation of new governmental regulations governing nutraceuticals and functional foods could result in substantially greater ongoing compliance costs, which, in turn,

71
could have a material adverse effect on the Company’s business, results of operations or financial condition.
In addition, necessary regulatory approvals may not be obtained in a timely manner, if at all, for the Company’s products currently under development, if and when fully developed and tested. Delays in any part of the process or an inability to obtain regulatory approval for products could restrict the Company’s ability to launch new products, which, in turn, could have an adverse effect on the Company’s business, results of operations, financial condition or potential for growth.
� The costs of compliance with environmental, health and safety
laws and regulations may adversely affect the Company’s business, results of operations or financial condition.
Companies in the flavor and fine ingredients industry such as Frutarom use, manufacture, sell and distribute a number of environmentally hazardous materials, and therefore are subject to extensive regulation regarding the storage, handling, manufacture, transportation, use and disposal of their products, ingredients and byproducts. In particular, the Company’s production and research and development activities in the United Kingdom, Switzerland, Germany, the United States, Israel, China and other countries are subject to environmental standards relating to air emissions, waste water discharges, the use and handling of hazardous materials, waste disposal practices and clean-up of existing environmental contamination. Any increase in the stringency of applicable environmental regulations could have a material adverse effect on the Company’s business, results of operations or financial condition. In addition to ongoing environmental compliance costs, the Company might, from time to time, be required to incur extraordinary expenditures to meet applicable environmental standards and may be liable for costs associated with any remedial actions that are required in locations in which the Company’s facilities are located. As the Company cannot predict environmental matters with certainty, the amounts the Company has budgeted or will budget in the future for environmental improvement projects and any reserves it may establish for environmental clean-up liabilities may not be adequate. Both the ongoing costs of environmental compliance and non recurring expenditures may have a material adverse effect on the Company’s business, results of operations or financial condition.
The Company is also required to maintain and hold various environmental permits for operations at its facilities and is required to conduct its operations in accordance with conditions specified in these permits. Plant expansions are also subject to the securing of new or additional permits which may in some circumstances be difficult to obtain. All such permits may be revoked or modified by the relevant regulator acting unilaterally, and certain permits are time-limited and require periodic renewal. Any such revocation, modification or failure to renew could have a material adverse effect on the Company’s business, results of operations or financial condition.

72
� The Company’s sensitivity to price increases in the raw
materials it requires for its production.
The last years were characterized by relatively high fluctuations in the prices of raw materials used by Frutarom to manufacture its products, and in certain periods a continuous increase occurred in the prices of these raw materials with a more material increase in natural products, which are most of the products which Frutarom uses. The supply chain managers, both global and local, and the purchasing units of the Company are closely monitoring the raw materials price trend. Should the prices of raw materials, used by Frutarom to manufacture its products further, increase, there can be no guarantee that Frutarom will be able to suit the prices of its products to such an increase, which in turn could have a material adverse impact on its business, results of operations or financial condition. Similarly, the price, quality and availability of the main raw materials used by the Company, especially in the realm of natural products, are subject to fluctuations due to world supply and demand, as stated.
� Dependency on third parties to supply the raw materials required for production. The Company is dependent on the supply of raw materials it requires to manufacture its products. Although the Company purchases raw materials from a very wide range of suppliers, with no single supplier representing more than 10% of its total raw material purchases. Although most raw materials purchased by the Company have more than one supplier and are for the most part widely available, there can be no guarantee that this will continue to be the case.
� The Company may be subject to significant civil and criminal liabilities in connection with any failure to comply with the environmental, health and safety laws and regulations applicable to the Company as well as for the release of hazardous substances or for environmental contamination at its facilities.
As a result of environmental, health and safety laws and regulations, the Company may be subject to significant civil and criminal liabilities for environmental pollution and contamination as well as for non-compliance with applicable laws, regulations and standards applicable to the potentially hazardous substances it uses and produces globally. Environmental and health and safety laws may provide for criminal sanctions (including substantial fines) for violations. Some environmental laws also provide for strict liability for releases of hazardous substances, which could result in the Company being liable for remedying environmental damage without regard to its negligence or fault. Other environmental laws impose joint and several liability for the clean-up of pollution and contamination and could therefore expose the Company to liability arising out of the conduct of others. A number of claims and third party notices have been filed against the Company for bodily injury,

73
economic/property damages and for breach of environmental laws related to the pollution of the Kishon River located in Haifa, Israel. No assurance can be given as to the outcome of these claims or, if decided adversely to the Company, the scope of responsibility assigned by the court to the Company. For details refer to section 38 of this report. In February 2009, an environmental arrangement document was signed between the Company and the Ministry of Environmental Protection which relates to improvements and actions implemented by the Company in the Haifa Site in the environmental field (for details refer to section 38 below). There is no certainty that the Company's activities in accordance with the Arrangement Document will be considered satisfying by the Ministry for Environmental Protection, which may expose the Company to various sanctions. In addition, some environmental, health and safety laws may operate retroactively, imposing liability for past operations even though those operations may have been carried out in compliance with all applicable laws at the relevant time. Any civil or criminal liability under these laws may adversely affect the Company’s business, results of operations or financial condition.
Additionally, the Company may be subject to claims alleging personal injury or property damage as a result of alleged exposure to hazardous substances. The laws in the principal countries in which the Company operates allow for legal proceedings to be taken against it if its production facilities are alleged to have caused environmental contamination or personal injury. These proceedings may also be taken both by individuals and non-governmental organizations.
Risks Unique to the Company's Business
� Frutarom’s growth strategy relies significantly on its ability to
identify, acquire and integrate suitable businesses in the future.
A key element of Frutarom’s strategy is growth through organic expansion of its core activities and through acquisitions of flavor and specialty fine ingredients manufacturers. In line with this growth strategy, the Company has recently undertaken several strategic acquisitions, including its acquisition of CH's Savory activities in June 2009, FSI's assets and business in March 2009; of Oxford's assets and business completed in February 2009; of Rad's activity in November 2007; of the Gewurzmuller Group in October 2007; of Adumim's activity and of Raychan, which were completed in August 2007; of Abaco in July 2007; of Jupiter in April 2007; of Belmay in March 2007; of Acatris in October 2006; of Nesse in January 2006; of the IFF business in the second half of 2004; of Flachsmann in June 2003; and the flavors and fine ingredients activity of CPL Aromas Ltd. in February 2001. However, there can be no assurance that the Company will be able to continue to identify suitable acquisitions, acquire businesses on satisfactory terms or obtain the financing necessary to complete and support such acquisitions. Any failure to identify and execute future acquisitions successfully could adversely impact the Company’s growth strategy.

74
Integrating acquired businesses involves a number of risks, including possible adverse effects on the Company’s operating results, loss of customers, diversion of management’s attention, failure to retain key personnel, risks associated with unanticipated events or liabilities or difficulties in the integration of the operations, technologies, systems, services and products of the acquired businesses. In addition, the Company may be unable to achieve the anticipated synergies (including cost savings) from such acquisitions. Any failure to successfully integrate past or future acquisitions (including the IFF business) could have a material adverse effect on the Company’s business, results of operations or financial condition.
� The Company may not be able to successfully adapt to its
rapid growth in recent years.
The rapid and substantial growth in both operations and geographical coverage envisaged by the Company’s current strategy need to be managed effectively to ensure that the expected financial benefits through synergies and economies of scale are realized. A failure to adapt effectively to the rapid growth, including strains on management and logistics, could result in losses or acquisition costs that are not recovered as quickly as anticipated, if at all. Such problems could have a material adverse effect on the Company’s business, results of operations or financial condition.
� Frutarom may be required to pay substantial damages as a
result of product liability claims for which insurance coverage is not available.
The Company’s business exposes it to a risk of product liability, particularly as it is involved in the supply of flavors and fine ingredients to the food and beverage, flavor and fragrance, functional food, pharma/nutraceutical and personal care industries, which ingredients may be harmful to both humans and the environment. If a large product liability claim were successfully brought against the Company, its insurance protection might not be adequate or sufficient to cover such a claim in terms of paying any awards or settlements or paying for the Company’s defense costs or both. If a litigant were successful in a lawsuit against the Company, a lack of or inadequate insurance coverage could result in a material adverse effect on the Company’s business, results of operations or financial condition. If product liability claims were brought against the Company, it might damage the Company’s reputation as well as require the Company to divert significant time and effort of its management, which could adversely affect the Company’s business regardless of the outcome of the claim.
� The Company’s success depends on its ability to attract new and retain currently employed executives and skilled personnel.
The Company’s continued success depends on its ability to attract and retain trained flavorists, laboratory technicians and other skilled personnel. The Company operates in a highly specialized

75
marketplace where subtlety of flavor and quality of product are crucial and skilled personnel are critical to ensuring the delivery of a high quality end product. If a number of such employees were to leave permanently or on a temporary basis, the Company may have difficulty employing replacement personnel with the same experience and skill, in which case its research and development capabilities could suffer. Further, Frutarom’s continued success depends to a large extent on its senior management team. The loss of the services of certain members of its senior management or other key employees could have a negative impact on Frutarom’s results and its ability to implement its strategy. A failure to attract or retain trained flavorists, laboratory technicians and other skilled personnel or members of senior management could have a material adverse effect on the Company’s business, results of operations or financial condition.
� Significant confidential intellectual property is a vital element
of the Company’s business and it may be difficult to protect.
The Company’s business depends on intellectual property, which consists of formulae used to create its flavors. The Company’s formulae are not patented but constitute highly confidential proprietary business information, available to very few people even within the Company itself. Although the Company does not believe that it depends materially on any single proprietary formula, license or other intellectual property right, the loss of confidentiality with respect to proprietary formulae or loss of access to them and/or the future expiration of intellectual property rights or legal challenges to those rights could have an adverse impact on the Company’s business, results of operations or financial condition.
The Company also relies, in part, on confidentiality and non competition agreements with employees, manufacturers and third parties from which it has purchased product formulae to protect its intellectual property. It is possible that these agreements will be breached and the Company may not have adequate remedies for any such breach. Disputes may arise concerning the ownership of intellectual property or the applicability of confidentiality agreements. Furthermore, the Company’s trade secrets and proprietary technology may otherwise become known or be independently developed by its competitors in which case the Company may not be able to enjoy exclusivity with respect to certain of its formulae or maintain the confidentiality of information relating to its products.
� The Company may not have the right to use the ‘‘Frutarom’’
trademark in all of the jurisdictions in which it currently operates or where it may seek to expand its operations in the future.
The Company has not registered the ‘‘Frutarom’’ trademark in all of the jurisdictions in which it currently operates. In certain such jurisdictions, the ‘‘Frutarom’’ trademark, or a trademark substantially similar to ‘‘Frutarom,’’ has already been registered by third parties. For example, the ‘‘Frutarom’’ trademark has been registered by a German company throughout the European Community, in Germany and certain other European jurisdictions,

76
in relation to classes of goods which are the same as or similar to those of Frutarom. There is therefore a risk that the Company could face claims for compensation for past use, and injunctions preventing future use of the name Frutarom. Accordingly, there can be no guarantee that the Company will have the right to use the ‘‘Frutarom’’ trademark in all the jurisdictions in which it operates or where it may seek to operate in the future.
Below is a table that summarizes the various risk factors and the Company's evaluation of their level of impact thereon:
Risk factor's level of impact on the Company
Risk Factor
High Medium Low Risks Related to the Macro Economic Environment Effects of the global crisis � Stability in emerging markets � Currency fluctuations � Increases in interest rates � Risks Related to the Industry Competition in the different markets � Changes in environmental, health and safety laws and regulations
�
Meeting regulations and standards � Fluctuations in Raw materials prices � � Dependency on suppliers � Exposures to civil and criminal liabilities � Risks Unique to the Company's Business
Identify future acquisitions � Adaptation to the rapid growth � Liabilities claims without insurance coverage � Attract and retain key employees � Protection of the intellectual property � Use of "Frutarom" trademark �

77
42. Details about the valuations for the Savory Activity in Germany
The following are details about the valuation of Nesse and the Gewurzmuller Group as set forth in the Directives of Regulation 8b to the Securities Regulations (Periodic and Immediate Reports), 197015
Valuation subject Goodwill of Savory activity in Germany Valuation timing Goodwill value correct as of December 31, 2009.
Valuation implemented during March 2010.
Value of valuation subject close to valuation date
US$ 139,405 thousands
Value of subject of valuation determined in accordance with its value
US$ 250,645 thousands
Identification of impairer and its characterization
• The valuation of assets was implemented by the office of Financial Immunities – Dealing Rooms Ltd.. (FIDR) which is a company that provides business and financial services. FIDR is considered, in Israel, as one of the leading private firms in its field. FIDR was founded in 2003 and specialize in providing financial services in business, finance, regulatory and non regulatory matters, financial risks management (including dealing room transactions), economic opinion and fair value valuations.
• The impairer is experienced in performing valuations of assets for accounting needs in reporting corporations of sizes similar to those of the reported valuation.
• Impairer name – Gal Soly • Impairer's education – Bachelor Degree (BA) in
Economics and Management M.Sc in finance and accounting from Tel-Aviv University (Recanati Graduate School)
• The impairer has no personal interest in the Company and he is not dependent on the Company as the meaning of this term in the Certified Public Account Law – 1955 and in the regulations implemented according thereto.
• Indemnity – for reasonable expenses borne by the impairer with respect to every lawsuit, demand or other procedures due to opinion.
Valuation model • DCF – capitalization of cash flow. Assumptions according to which the impairer of assets implemented the valuation
• Capitalization rate: 16% • Growth rate: 5% • Sensitivity to growth: 0% through 5% • Sensitivity of capitalization rate: 12%-20% • Data used as a basis for comparison: Activity
results in recent years and a future forecast.
15 The full value estimation of the Savory activity in Germany is attached to this periodic report as Appendix A.

1
Frutarom Industries Ltd.
Evaluation
of the Activities in Germany
as at December 31, 2009
as set forth in
International Standard IAS 36 –
Depreciation of Assets
February 2010
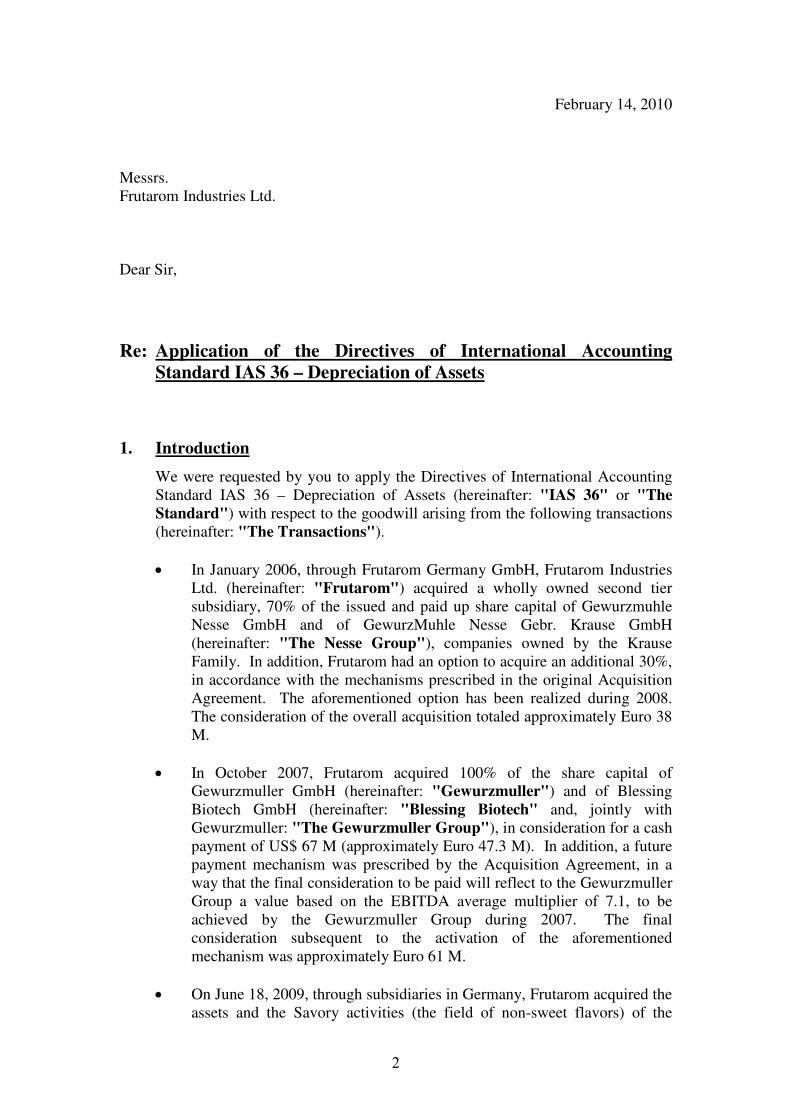
2
February 14, 2010 Messrs. Frutarom Industries Ltd. Dear Sir,
Re: Application of the Directives of International Accounting
Standard IAS 36 – Depreciation of Assets
1. Introduction
We were requested by you to apply the Directives of International Accounting Standard IAS 36 – Depreciation of Assets (hereinafter: "IAS 36" or "The Standard") with respect to the goodwill arising from the following transactions (hereinafter: "The Transactions").
• In January 2006, through Frutarom Germany GmbH, Frutarom Industries
Ltd. (hereinafter: "Frutarom") acquired a wholly owned second tier subsidiary, 70% of the issued and paid up share capital of Gewurzmuhle Nesse GmbH and of GewurzMuhle Nesse Gebr. Krause GmbH (hereinafter: "The Nesse Group"), companies owned by the Krause Family. In addition, Frutarom had an option to acquire an additional 30%, in accordance with the mechanisms prescribed in the original Acquisition Agreement. The aforementioned option has been realized during 2008. The consideration of the overall acquisition totaled approximately Euro 38 M.
• In October 2007, Frutarom acquired 100% of the share capital of
Gewurzmuller GmbH (hereinafter: "Gewurzmuller") and of Blessing Biotech GmbH (hereinafter: "Blessing Biotech" and, jointly with Gewurzmuller: "The Gewurzmuller Group"), in consideration for a cash payment of US$ 67 M (approximately Euro 47.3 M). In addition, a future payment mechanism was prescribed by the Acquisition Agreement, in a way that the final consideration to be paid will reflect to the Gewurzmuller Group a value based on the EBITDA average multiplier of 7.1, to be achieved by the Gewurzmuller Group during 2007. The final consideration subsequent to the activation of the aforementioned mechanism was approximately Euro 61 M.
• On June 18, 2009, through subsidiaries in Germany, Frutarom acquired the
assets and the Savory activities (the field of non-sweet flavors) of the

3
Christian Hensen Group (hereinafter: "CH") in Germany in consideration for a cash payment of approximately Euro 5.3 M.
During 2008, Frutarom commenced with the implementation of a plan to
integrate the activities of the Gewurzmuller Group and the activities of the Nesse Group (hereinafter: "The Groups") into one activity and to maximally utilize the cross-selling opportunities and the synergy existing in Germany and in various countries in order to achieve operational efficiency and maximal savings, a procedure which was accelerated and almost completed in 2009. Effective as of today, the Groups have one management, a joint Finance System, a joint Research and Development System, a joint Marketing System, a joint Purchasing System and, as far as Production is concerned, there is a transfer of each Group's products between the sites which is based on the work loads. In accordance with Frutarom's Management, in 2010 the Groups will be merged into one legal entity. In addition, the assets and the Savory activities of CH which were acquired in 2009 were merged with the activities of the groups, and, effective as of today, all the production is implemented in their sites (hereinafter jointly with the Groups: "The Activities in Germany" or "The Activities").
IAS 36 requires recognition in the loss from a depreciation of an asset any time,
where the value of the asset in the Books of Account exceeds its recoverable amount. If the recoverable amount of the single asset cannot be estimated, the Corporation should calculate the recoverable amount of the cash generating unit to which the asset is ascribed. A cash generating unit of an asset is the smallest group of assets which includes the asset and generates positive cash flow from an ongoing use. These are mainly independent of positive cash flows of other assets or other groups of assets.
Goodwill arising from an acquisition represents a payment implemented by the
purchaser while expecting future economic benefits. Goodwill does not generate cash flows independently from other assets or from other groups of assets. Therefore, the recoverable amount of the goodwill as a separate asset cannot be determined. Hence, if signs of the depreciation of the goodwill exist, the recoverable amount will be determined for the cash generating unit to which the goodwill is ascribed. The aforementioned amount will be compared to the book value of the said cash generating unit and any loss arising from the depreciation will be recognized only if its recoverable amount is lower than its value in the Books of Account.
With respect to the said work, the activities in Germany were identified as the
smallest cash generating unit to which the goodwill arising from the transaction can be allocated.

4
According to the provisions of the Standard, the recoverable amount of the cash generating unit1 will be calculated as the net selling price or the value of use, whichever higher:
a. The net selling price is the amount which can be received from selling the
cash generating unit in the transaction held in good faith between the willing buyer and the willing seller which operate intelligently, excluding any direct supplementary realization costs.
b. The value of using the cash generating unit is the current value of the
future cash flow estimations which are expected to arise from an ongoing utilization of the aforementioned unit and from the realization of the unit at the end of its useful life.
While determining the value of using the cash generating unit, the Standard requires that the Corporation uses, inter alia, the following:
a. Cash flow forecasts based on reasonable and established assumptions which reflect the current situation of the cash generating unit and represent the best estimation of the Management with respect to the economic conditions which will prevail during the useful life of the unit, and
b. Discount rate before tax which reflects current market estimations of the
funds' time value and the specific risks to the cash generating unit. The discount rate will not reflect risks for which the future cash flows have already been reconciled.
As the activities in Germany are not traded, there is no basis for a reliable
estimation of the consideration which will be received by selling it in the transaction held in good faith between the willing buyer and the willing seller which operate intelligently. Therefore, the net selling price of the activities in Germany cannot be determined. Hence, it is determined that the recoverable amount of the activities in Germany will be its value of use.
As set forth in the Standard, while examining the value of the cash generating
unit, the Corporation should examine whether goodwill relating to the said cash generating unit was recognized in the financial statements. If so, the Corporation should:
a. Implement a Bottom-Up Test, i.e., the Corporation should: 1) Examine whether the Book Value of the Goodwill can be reasonably
and consistently allocated to the examined cash generating unit, and then
1 Recoverable amount – the net selling price of an asset or the value of its use, whichever higher

5
2) Compare between the recoverable amount of the examined cash
generating unit and its book value (including the book value of any goodwill allocated) and to recognize the loss from depreciation, should there be any.
b. And if, while implementing the Bottom-Up Test, the Corporation cannot
reasonably and consistently allocate the book value of the goodwill to the examined cash generating unit, the Corporation should also implement the Top-Down Test, i.e., the Corporation should:
1) Identify the smallest cash generating unit which includes the
examined cash generating unit, to which the book value of the goodwill can be reasonably and consistently allocated (hereinafter: "The Comprehensive Cash Generating Unit"), and then,
2) Compare between the recoverable amount of the comprehensive cash
generating unit and its book value (including the book value of any goodwill allocated) and to recognize the loss from depreciation, should there be any.
Every time the Corporation examines whether depreciation has applied on the cash generating unit, it should take into account any goodwill related to future cash flows generated by the said cash generating unit. If the goodwill can be allocated reasonably and consistently, the Corporation will implement the Bottom-Up Test. If not, the Corporation will implement the two tests mentioned above.
We estimate, as detailed in the aforementioned work, the recoverable amount of
the activities in Germany, the cash generating unit we have identified, is higher than its value in Frutarom's unaudited financial statements as at December 31, 2009. Therefore, a depreciation of the goodwill should not be implemented as set forth in Section 104 to Accounting Standard IAS36.
The opinion is based on the following sources of information: • 2008-2009 Reports of the activities in Germany; • Financial reports of the activities in Germany from Frutarom's financial
statements as at December 31, 2009; • 2010 Budget of the activities in Germany; • 2010-2014 Multi-annual forecast of the activities in Germany (hereinafter:
"The Multi-annual Forecast"); • Financial, business and other operational information received from
Frutarom's Management; • Information about the activities in Germany;

6
• Relevant overt information published in the Internet sites; • Academic articles and publications;
• Meetings and conversations with Frutarom's Management. Limitation of responsibility Our work is earmarked for the use of Frutarom's Management and for the
described need only and no other use should be done on the work. Excluding a requirement according to the law, our opinion should not be transferred to any third party or mention our work without receiving our advanced and written consent. In any case, whether the said consent was granted or not, we will not bear any responsibility toward a third party which our opinion was transferred to.
During our work we received information, explanations and presentations from
Frutarom and/or from anyone on their behalf. Frutarom is responsible for the information, the correctness of the data, the presentations and the above clarifications. Within our work, we did not include an examination and/or a verification of the data we received as mentioned above. In view thereof, our work will not be considered and will not serve as an approval for the correctness, the completeness or the preciseness of the data transferred to us. Nevertheless, in a number of cases, we implemented various examinations for the probability of the data and the forecasts. These examinations included, inter alia, an analysis of the financial statements and other financial information. In any event, we will not be responsible for any loss, damage, cost or expense which will in any way be caused by deeds of deceit, misrepresentation or deception.
As a rule, forecasts relate to future events and are based on reasonable
assumptions as at the forecast date. These assumptions may change over the forecast period, and therefore forecasts which were prepared for estimation days may be different from the actual financial results and/or from the estimations implemented at a later date. Therefore, one cannot relate to the prepared forecasts at the security level attributed to the data of the audited financial statements. We do not express an opinion with respect adjusting the forecasts prepared by Frutarom to the financial results to be received in practice.
Economic estimations do not pretend to be an exact science and their
conclusions are subject to many cases in the subjective discretion of the impairer of assets. Therefore, there is no single stable fair value and usually we determine a reasonable limit for the fair value. As in this case the purpose of the estimation requires a specific value, a value representing the middle point of the reasonable value limit. Although we believe that the value determined by us is reasonable based on the information provided to us, another impairer of asset may have reached a different impairment of assets.

7
It is agreed between Financial Immunities and Frutarom that excluding the event where the Court determines that Financial Immunities operated in bad faith or with major negligence, Financial Immunities will not bear any responsibility toward Frutarom, from any source whatsoever and from any reason whatsoever, including civil wrongs, in all related to the implementation of services in accordance with the said offer, and Frutarom or anyone on its behalf will not have any claim and/or lawsuit toward Financial Immunities, including by way of a third party notice, in all connected, directly or indirectly, to the services granted in the engagement and the services granted by Financial Immunities to Frutarom.
• The said opinion is not a work of Due Diligence and it does not pretend to
include the information, the examinations and the tests or any other information included in the work of Due Diligence, including the examination of contracts and engagements.
• It should be emphasized that we do not have any personal interest in the
activities in Germany and our fees are not conditioned on the results of the opinion.
• In the past, we did not implement an impairment of assets for the activities
in Germany. • All the financial data in this report are in Euro thousands, unless stated
otherwise.
Yours Sincerely,
Financial Immunities Transaction Chambers Ltd.
8
Table of Contents
1 Introduction …………………………………………………….
2 Description of activities in Germany ………………………….
2.1 Fields of operation …………………………………………….
2.2 Production sites ……………………………………………….
2.3 Marketing and sales …………………………………………...
2.4 Customers ……………………………………………………..
2.5 Acquisition transactions ………………………………………
3 Business environment ………………………………………….
3.1 Global Flavor and Fragrance Industry………………...……….
3.2 Flavor Market …………………………………………………
3.2.1 General ………………………………………………………..
3.2.2 Flavor Market characteristics ……………………………...….
3.2.3 Food and Beverage Market characteristics ……………..…….
3.2.4 Critical success factors in the field of flavors …………...……
3.2.5 Competition …………………………………………………...
3.3 Risk factors in the Flavors and Fine Ingredients Markets …..
3.3.1 Macroeconomic risk factors …………………………………..
3.3.2 Branch related risk factors …………………………………….
4 Historical financial data ……………………………………….
4.1 Statement of income …………………………………………..
4.2 Balance sheet ………………………………………………….
5 Identification of cash generating unit ………………………
6 Estimation of recoverable amount ……………………………

9
7 Impairment of assets according to the cash flow capitalization method ………………………………………….
7.1 Statements of income …………………………………………
7.2 Forecast of revenues …………………………………………..
7.3 Expenses forecast ……………………………………………..
7.3.1 Cost of sale and gross margin …………………………………
7.3.2 Operating expenses and operating margin ………….………...
7.4 Investment and depreciation forecast …………………………
7.4.1 Investments in fixed assets ……………………………………
7.4.2 Investment in working capital ……………….………………..
7.5 Discount rate …………………………………………………..
7.6 Long term growth ……………………………………………..
7.7 Group's recoverable amount …………………………………..
7.7.1 Cash flow forecast …………………………………………….
8 Sensitivity analysis ……………………………………………..
9 Conclusion ……………………………………………………...

10
2. Description of the activities in Germany
As mentioned above, there are three activities in Germany which were merged into one activity: The activity of the Nesse Group, the activity of the Gewurzmuller Group and the activity acquired from CH.
2.1 Activities The activity in Germany develops, manufactures, markets and sells
innovative and unique Savory solutions (the area of the non-sweet flavors) including non-sweet flavors, seasoning mixes and unique functional raw materials for the food industry, with a special emphasis on the processed meat and the convenience food.
The activity in Germany develops, manufactures and markets Starter
Culture, which are natural products based on microbiological processes, which are mainly fermentation of microorganisms and enzymes used in the manufacture of food products, mainly in the fields of meat, milk and bakery. The Starter Culture products enable control over the flavor, color, texture and shelf life in the food production process.
2.2 Production sites The activity in Germany has five production sites in Germany: � The Nesse Loxstedt Plant – where savory flavor mixes are
produced. The Plant operates five days a week in one shift and it has an additional potential production capacity of approximately 30%-35%, if it shifts to continuous production in three shifts.
� The Sittensen Plant – where savory flavor mixes and seasonings
are produced. The Plant operates five days a week in two shifts (excluding Friday, where there is only one shift) and it has an additional potential production capacity of approximately 30%-35%, if it shifts to continuous production in three shifts.
� The Brenstadt Plant – where savory flavor mixes are produced.
The aforementioned Plant is planned to merge with the Nesse Loxtedt Plant in 2010.
� The Stuttgart Plant for the manufacture of savory flavor mixes
and seasonings – where savory flavor mixes and seasonings are produced. The aforementioned plant was renovated approximately four years ago. It is modern and efficient and has the capacity to significantly expand the production. It meets the strict standards of the European Food Industry. The Plant operates five days a week in one shift and it has an additional potential production capacity of approximately 100%, if it shifts to continuous production in three shifts.

11
� The Stuttgart Plant for the manufacture of starter culture – where Starter Culture products are manufactured. The Plant operates five days a week under continuous production and it has additional potential production capacity of approximately 20%.
2.3 Selling and marketing The activity in Germany has marketing and sales representatives in 20
other countries – in West and East Europe, in particular. 2.4 Customers The broad customer base of the activity includes hundreds of food
manufacturers – the leading companies in their field to name a few, mainly in West and East Europe and in Germany, Austria, Switzerland, Sweden, Denmark, Russia, Ukraine and Bulgaria, in particular.
2.5 Acquisition transactions In January 2006, through Frutarom Germany GmbH, Frutarom acquired a
wholly owned second tier subsidiary, 70% of the issued and paid up share capital of the Nesse Group. In addition, Frutarom had an option to acquire an additional 30%, in accordance with the mechanisms prescribed in the original Acquisition Agreement. The aforementioned option has been realized during 2008. The consideration of the overall acquisition totaled approximately Euro 38 M.
The acquisition of the Nesse Group was a significant step in the realization
of Frutarom's rapid growth strategy. The acquisition strengthened the technological abilities and the product offering Frutarom has for its customers in the Savory field (non-sweet flavors) and continued the trend of strengthening and positioning Frutarom in West and East Europe as the leading vendor in the flavor field. The acquisition of the Nesse Group expanded the geographical deployment of Frutarom to additional countries where Frutarom did not have significant presence, such as Poland, the Czech Republic, Latvia etc.
The savory activity of the Nesse Group is synergetic to Frutarom's
activities in some of the 120 countries where it operates, and in West and East Europe, in particular. Frutarom utilizes its global marketing and sales infrastructure in order to realize the many cross-selling opportunities generated by the said acquisition, both by expanding the customer base and by broadening the product offering.
• In October 2007, Frutarom acquired 100% of the share capital of the
Gewurzmuller Group in consideration for a cash payment of approximately Euro 47.3 M. In addition, a future payment mechanism was prescribed by the Acquisition Agreement, in a way that the final consideration to be paid will reflect to the Gewurzmuller Group a value based on the EBITDA average multiplier of 7.1, to be achieved by the

12
Gewurzmuller Group during 2007. The final consideration subsequent to the activation of the aforementioned mechanism was approximately Euro 61 M.
The acquisition of the Gewurzmuller Group is further implementation of
Frutarom's rapid growth strategy and is an important and significant strategic acquisition which establishes Frutarom's status as one of the ten largest and leading companies in the world in the flavor field and strengthens its presence and positioning as a leading global manufacturer of savory flavor solutions.
During 2008, Frutarom commenced with the implementation of a plan to
integrate the activities of the Gewurzmuller Group and the activities of the Nesse Group into one activity and to maximally utilize the cross-selling opportunities and the synergy existing in Germany and in various countries in order to achieve operational efficiency and maximal savings, a procedure which was accelerated and almost completed in 2009. Effective as of today, the Groups have one management, a joint Finance System, a joint Research and Development System, a joint Marketing System, a joint Purchasing System and, as far as Production is concerned, there is a transfer of each Group's products between the sites which is based on the work loads. In accordance with Frutarom's Management, in 2010 the Groups will be merged into one legal entity.
• On June 18, 2009, through subsidiaries in Germany, Frutarom acquired the
assets and the Savory activities (the field of non-sweet flavors) of CH in Germany in consideration for a cash payment of approximately Euro 5.3 M.
The Savory activity acquired from CH is extremely synergetic with the
activities of the Group. During Q3 2009, Frutarom has completed the transfer of the production activities from the Holdorf Site to the sites of the groups. The systems of Research and Development, Operations and Purchasing, Sales and Customer Service were also united while achieving maximum efficiency and significant operational savings. Upon completing the operational merger, Frutarom commenced acting to achieve maximal utilization of the cross-selling opportunities which exist between the activity acquired from CH and that which exists in Germany.

13
3. Business environment2
3.1 Global Flavor and Fragrance Industry In 2009, the global flavor and fragrance market is estimate at
approximately US$ 14.9 Billion, while the flavor market was estimated at approximately 52% of the market at an overall volume of approximately US$ 7.7 Billion and the fragrance market was estimated at 48% of the market at an overall volume of approximately US$ 7.1 Billion3.
A research implemented by IAI Consultants4 forecasts an average annual
growth of 3.7% in the global market of the flavors and fragrances during the next five years. Both the flavor and the fragrance markets are expected to increase by 3.7% a year by 2014.
The manufacturers operating in the industries of flavor, fragrance and fine
ingredients are divided into three major groups: Large multinational companies, medium-sized companies and small and local companies.
The large multinational companies usually operate globally and at a sales
turnover cost exceeding US$ Billion. In 2008, five such companies, which, according to the opinion of Leffingwell & Associates, represented, in sales terms, approximately 59% of the market of flavors, fragrances and fine ingredients (excluding sales of natural functional food ingredients and sales of natural extracts from medicinal herbs). These multinational companies mainly focus on customers which are large multinational food and beverage manufacturers.
The medium-sized companies usually have an income of between US$
100 M and US$ 500 M. In 2008 there were only seven medium-sized companies, which, according to the opinion of Leffingwell & Associates, represented, in sales terms, approximately 17% of the market of flavors, fragrances and fine ingredients (excluding sales of natural functional food ingredients and sales of natural extracts from medicinal herbs). Half of these medium-sized companies focus on a specific geographical market, such as the US and Japan and the rest have a global geographical deployment and a diverse and comprehensive product offering.
The small and local companies have a sales turnover lower than US$ 100
M (most are a lot smaller and sell for a number of millions of dollars). In 2008 there were only approximately 300-400 small and local companies, which, according to the opinion of Leffingwell & Associates, represented, in sales terms, approximately 24% of the market of flavors, fragrances and fine ingredients (excluding sales of natural functional food ingredients and sales of natural extracts from medicinal herbs). These companies usually
2 Source: The financial statements of Frutarom as at December 31, 2008 and IAI Consultants, "An
Overview of the Global Flavors & Fragrances Market 6th Edition, October, 2009 3 IAI Consultants, "An Overview of the Global Flavors & Fragrances Market 6th Edition, October,
2009 4 See Footnote 4.

14
focus on such customers that are small and local food manufacturers and their abilities are limited in the fields of unique service to the customer and of research and development.
The market of flavors and fine ingredients is characterized by high entry
blocks (see details below) and therefore the market is characterized by the non-entry of new manufacturers, but by way of mergers and acquisitions. As a rule, the market is characterized by a trend of consolidation and reduction of the number of manufacturers.
3.2 Flavor market 3.2.1 General Flavors are the central foundation stones in providing flavor to food
and beverage products, and as such, they have a material effect on the way in which the products used by the final consumers are received.
In Frutarom's opinion, in 2008, the global sales in the field of
flavors totaled approximately US$ 10 Billion. The flavor products are usually sold to manufacturers of ready-food, beverages, dairy products, pastries, meat and fish products, sweet products and pharmaceutical products.
The following are examples for final products which use flavors: • Beverages – carbonated beverages, non-carbonated beverages,
energy drinks, alcoholic drinks and juices. • Dairy products – yogurts, yogurt drinks, ice cream, cheeses
and cold desserts. • Pastries – cakes and cookies, crackers and cereal. • Sweet products – sweets, chocolate, jams and chewing gum. • Salty products and convenience food – ready-made meals,
instant soups, ready-made sauces and fast-preparation noodles. • Snacks – chips and other salty snacks. • Meat – hot dogs and sausages. • Mouth hygiene and pharmaceutical products – tooth pastes,
mouth washes, vitamins and medicines. • Other products – tobacco and animal food.

15
The global flavor market has rapidly increased in the last 60 years, mainly as a result of the increasing demand and the increasing variety of final consumption products which contain flavors. The increasing demand for final consumption products containing flavors is a product of the increase of the global population and of the change in consumers' priorities which stems from the increase in personal income, demographic changes, creation of leisure culture and a growing awareness to the issues of health and urbanization. These factors led to the increase in the number of food and beverage products which contain flavors and to a significant increase in the demand for convenience food products and for products containing natural and health ingredients.
The following table presents the sales of flavors by geographical
regions in 2009, the forecasted sales in 2014 and the rate of the average annual growth expected in these geographical regions5:
3.2.2 Flavor Market characteristics The following are details of the characteristics of the flavor market: • Reliable and quality service – the food and beverage
manufacturers which are the main customers of the flavor manufacturers expect reliable and quality service which meets their needs for support and due dates while maintaining high quality, regulatory standards and strict safety standards. This expectation creates long-term relations between the flavor manufacturers and their customers. As a result, large multinational customers, and increasingly also medium-sized customers, reduce the number of their flavor vendors more and more and enter the remaining vendors into approved vendor lists. This way they create an entry block for small flavor manufacturers.
• Research and development – the development of a new flavor
is a complex, creative and technological process, which requires extreme know-how and skills of the research and development people of the flavor manufacturer. Effective
5 Source: See Footnote 4.
Region
2009 (US$ M)
2014 (US$ M)
2009-2014 (% of growth)
West Europe 1,582 1,781 2.4 East Europe 533 638 3.7 North America 2,244 2,620 3.1 South America 457 647 7.2 Asia 2,409 2,984 4.4 Middle East and Africa 520 632 4.0
Total 7,744 9,303 3.7

16
research and development is a material factor to ensure consistent creation of new and innovative products and to maintain both the margin and the growth of the flavor manufacturer. The initiative to develop a new flavor may come from the flavor manufacturer itself or from the customer which needs a specific flavor for a final products and which is under a development process. Therefore, in order to forecast the market requirements, the research and development people of the flavor manufacturer are required to be highly familiar with the flavor preferences of the target markets and of the final products. In addition, as most of the flavors are especially tailored to the requirements of a specific customer, tight cooperation is required with the customers. The formulas of these flavors are commercial secrets and they remain the property of the flavor manufacturer. As most of the flavors are especially tailored to the requirements of a specific customer, the customers will usually avoid the replacement of the flavor vendor during the life of the final products they use.
• Low sensitivity to the price – as the flavors determine the
flavor of the final products, they are crucially important for its success. In addition, as flavors cannot be precisely imitated and its cost in the overall cost of the final product is negligent, the demand for the flavors is usually less sensitive to price changes, as when customers elect the flavor vendor, they more emphasize its reputation, quality and consistency than the price.
• Manufacture processes – flavors usually consist of a large
number of various raw materials (usually more than 30) which are mixed according to unique formulas created by the research and development people of the manufacturer. The production processes of the flavors are less complex than the production processes of the raw materials and the capital required for their manufacture is smaller than the capital required for the manufacture of the raw materials. Nevertheless, the manufacture of flavors requires skills and know-how in order to achieve the required quality and consistency.
• Relatively high and stable margin – as the flavor market is
characterized by long-term relations and relatively low sensitivity to price, in addition to simple manufacture processes, the flavor market is characterized by high and stable profit margins (also compared to the fine ingredients market).
3.2.3 Food and Beverage Market characteristics The main customers of flavors are food and beverage manufacturers
and therefore the flavor market is affected by trends characterizing the final consumer in the food and beverage market. According to Euromonitor, the global volume of sales in 2007 in the food and
17
beverage market totaled approximately US$ 1,484 Billion. In Frutarom's opinion, medium-sized and small and local food and beverage manufacturers comprise more than 50% of the total amount of global sales. In spite of the consolidation trend characterizing the food and beverage market, Frutarom estimates that medium-sized food and beverage manufacturers (with an annual income of between US$ 100 M and US$ 3 Billion) and small and local food and beverage manufacturers (with an annual income lower than US$ 100 M) will continue to be a considerable share and play a significant role in the global food and beverage market, and that new medium-sized and small and local manufacturers will continue to enter the market.
The large multinational flavor manufacturers tend to mainly focus
on large multinational food and beverage manufacturers and they offer these customers high quality service and a development of flavors specifically tailored to their needs. In Frutarom's opinion, the level of interest of large multinational flavor manufacturers in medium-sized customers is low while offering these customers a limited service and not investing resources in the development of flavors tailored to their needs. Nevertheless, Frutarom estimates, that medium-sized and local food and beverage manufacturers require the same high level of service and the tailoring of the flavors to their needs as similar to the large multinational manufacturers. In addition, these food and beverage manufacturers demand short due dates and flexibility in quantities manufactured for them. The small and local flavor manufacturers do not usually have the service abilities and the products required for supporting the needs of these customers. This situation creates a business opportunity to medium-sized flavor manufacturers which can provide service to this market share.
The food and beverage market is characterized by a number of
major trends which affect the flavor market as follows: • Preference of natural products – the demand for food and
beverage products containing ingredients which are natural and have high health and nutrition value (low amounts of fat, salt, cholesterol etc.) is increasing as natural products are usually grasped by consumers as more qualitative, healthier and friendlier to the environment. In addition, an increase occurred in the demand for organic and clean-label products. As a result, natural food and beverage products are usually grasped as expensive premium products. This trend creates new business opportunities to the flavor manufacturers in the field of innovative and natural flavor products.
• Emerging products – in recent years, the increase in the
consumption of flavors in the emerging markets such as former U.S.S.R., East Europe, China and India is higher than the

18
average rate in the global flavor market. In addition, these emerging markets are characterized by an increasing consumption of processed food which caused the growth of medium-sized and small and local food companies and created new business opportunities in the market for flavor manufacturers.
• Global and local flavors – as flavors change among various
geographical regions and various cultures, flavor manufacturers are required to be thoroughly familiar and have broad know-how in the local flavors of any of their countries of operation. Therefore, it is important that the global flavor manufacturer will have a physical presence in its target market and a direct connection with the local customers, so that it will be able to understand the local flavors and rapidly and effectively respond to changes in consumers' preferences. In addition, the consolidation trend characterizes the flavor market and is expressed in the simultaneous launching of the said product in a number of markets by multinational food and beverage manufacturers.
• Private brand – the manufacturers of private brands which are
usually medium-sized or small and local food manufacturers comprise one of the increasing market shares for the flavor market. During the last decade, consumers of food products became more and more aware to the product price. As a result, the supermarket chains and other retailers increased the variety of the private brand products. In addition, the supermarket chains and other retailers became aware of supporting the image of their private brand. When supermarket chains and retailers are concerned, the demand for brand products similar to products which exist in the market and the demand for premium products unique for their private brand create new business opportunities for the flavor manufacturers.
• Increasing consumption of convenience food – there is an
increase in the demand for processed food which provides more convenience (consumed indoors and outdoors). This increase in demand was accelerated both due to the development of new technologies of packaging, cooking and baking and due to changes in consumption habits and consumer preferences. Examples for convenience food are as follows: Ready-made meals, fresh pasta, fresh meat and poultry seasoned or marinated and ready to be cooked, salads and liquid sauces. This trend creates new business opportunities for the flavor manufacturers, especially in the field of savory flavors which can develop and market flavor products for this increasing market share.

19
3.2.4 Critical success factors in the field of flavor The critical success factors in the field of flavors are: • Long-term relations – long-term relationship with customers
and cooperation in the field of developing new products. • Global and local presence in the target markets – familiarity
with the various flavor preferences in the various markets and the ability to provide global and local support for customers.
• Quality and reliable service – the ability to provide high level
service and the reliability of the flavor manufacturers while providing the service are critical both for the medium-sized and local customers and for the international customers.
• Presence in emerging markets – the rate of increase in
emerging markets is significant compared to developed markets and the presence in these markets, the familiarity with their unique needs and the ability to provide support to the manufacturers in these markets are a critical success factor.
• Research and development and innovation – the ability to
develop new products is very important, both when the initiative of the flavor manufacturer is concerned and during the cooperation with the customers.
• Complying with quality, regulation and safety standards –
as flavors are mainly designated for the food and beverage market and for the pharmaceutical market, they are required to comply with the strict standards of quality, regulation and safety.
3.2.5 Competition In the flavor market, the main competitors are: Multinational flavor
manufacturers, medium-sized flavor manufacturers and small and local flavor manufacturers. The competition is mostly based on product quality, the ability to build and maintain a long-term relationship with the customer, an added value service, reliability and developing products specifically tailored to the customer's needs. As the cost of the flavor is a negligent component in the cost of the final product, the customers in the flavor market tend to be less affected by the price factor. The flavor manufacturers are required to differentiate themselves by building a close relationship with the customers, familiarity and thorough understanding of the target markets, high research and development abilities and reputation based on a consistent, reliable and effective service which they provide to their customers.

20
The large multinational flavor manufacturers are established
companies with a lot of experience, global presence and high technical and commercial abilities. Among the large multinational flavor manufacturers - Givaudan, IFF, Symrise GmbH & Co. and Takasago International Corporation.
The medium-sized flavor manufacturers tend to focus both on large
multinational food and beverage manufacturers and on medium-sized and smaller food and beverage manufacturers which operate in a small geographical region. Among the medium-sized flavor manufacturers – Wild Flavor, Robertet, Mane and Kerry Ingredients.
There are approximately 300-400 small and local flavor
manufacturers with more limited research and development abilities, which focus on a narrow market share and on local customers. In recent years, there is a consolidation trend among flavor manufacturers which causes an increase in market centralization.
3.3 Risk factors in the Flavors and Fine Ingredients Markets The risk factors in the Flavors and Fine Ingredients Markets are divided
into macroeconomic risk factors and branch-related risk factors. 3.3.1 Macroeconomic risk factors The following are details of the main macroeconomic risk factors: • The effect of the global economic crisis – in the last months
of 2008, the economic climate in the world changed and a financial crisis which penetrated and is still penetrating into the global economic materially changed the growth trend which characterized most of the world's economies in recent years. The global economic crisis caused a significant slowdown in the growth rates during 2009. Nevertheless, in the last months of 2009, the reduction trend of consumption was halted, a stabilization occurred in some of the countries and there are even first signs of returning to the growth trend. Frutarom estimates, that in spite of the temporary effects of the economic crisis, the trends characterizing the Flavors and Fine Ingredients Markets will not change.
• Companies' activities in emerging markets may be affected
by political, economic and legal developments in these markets – companies operating in a number of countries outside the US and West Europe, such as Russia, Turkey, Kazakhstan, Ukraine and China are exposed to political, economic and legal developments in these markets which are usually unexpected compared to developed countries. The risk

21
which is even more material than activities in emerging countries is related to foreign currency restrictions which may prevent the companies operating in these countries from being able to realize their profits from these countries or sell their assets in these countries.
• Fluctuations in exchange rates which cannot be forecasted –
the companies operating in the Flavor and Fine Ingredients markets are usually companies with global activities. Therefore, fluctuations in the currency rates of the countries in which the companies operate may affect the results of their operations.
• Increase in interest rates – many of the financing sources of
the companies operating in the Flavors and Fine Ingredients markets are linked to various currencies and bear a varying Libor interest. A growth in the interest rates increases the financing expenses of the companies, which may project on their cash flow.
3.3.2 Branch-related risk factors The main branch-related risk factors are as follows: • Widespread competition – companies operating in the flavors
and fine ingredients markets deal with an increasing competition from the large multinational companies and local and medium-sized companies in many markets of their operation. Some of the companies competing in these markets have larger financial and technological resources as well as broader marketing and sales infrastructures. In addition, their reputation is more widespread. Therefore, they may better adjust to changes and trends in the industry.
The global flavors market is characterized by tight relations
between the flavor manufacturers and their customers, mainly when large multinational customers are concerned. Moreover, large multinational customers and recently medium-sized customers as well limit the number of their vendors and work only with "approved" vendors. If a company operating in the said market cannot preserve its good relations with its customers, establish relations with new customers and achieve a status of an "approved" vendor with some of its customers may have negative material consequences on the Company's businesses, its results of operation and its financial position.
Compared to the flavors market, the fine ingredients market is
more price-sensitive and is characterized by relatively lower profit margins. Moreover, excess global production capacity of

22
fine ingredients may negatively affect the sales and the margins of the companies operating in the said market.
• Changes in regulation – the companies operating in the flavors and fine ingredients markets act under various international and local health, safety and environmental rules in various countries of their operation. As a rule, there is an increased regulation trend in these markets. The aforementioned trend arises from the increasing sensitivity of the consumers with respect to the inclusion of flavors in food products. In addition, certifications required by law may not be achieved on time, if at all, for the new products developed by the companies operating in these markets and thus negatively affect the results of operation of these companies.
• Costs relating to the compliance with environmental, health and safety standards – companies operating in the flavors and fine ingredients industry use, manufacture, sell and distribute also materials considered hazardous and therefore they are subject to a widespread legislation with respect to storage, treatment, manufacture, transportation, use and disposal of their products, ingredients and by-products.
• Sensitivity to increase in raw material prices – in recent years, the world is under an ongoing trend of an increase in the demands for raw materials, in general, and for raw materials for the food industry, in particular. The source of the increase in the demands is mainly in third world countries, the populations of which rapidly change their consumption habits and consumes more and more consumption products, including processed food. In addition, in recent years, the market of raw materials for the food industry is characterized by a decrease in supply, the source of which is damage to crops in various countries arising from extreme whether changes causing ongoing droughts and floods. The phenomenon of decrease in supply worsens due to the increasing shifting of crops such as wheat and soy for the benefit of corn and additional crops from which sugar is produced and nowadays they are used for the production of ethanol and additional materials from which bio diesel is produced.
• Dependence on third parties for the supply of raw materials required for production.
• Civil and criminal claims as a result of non-compliance with environmental, health and safety rules – the laws, rules and regulations relating to environment, health and safety may impose criminal and/or civil liability on the companies operating in the flavors and fine ingredients markets for pollution of the environment and non-compliance with the relevant laws, rules and standards. In addition, the companies can be exposed to claims for personal insuries and property damages arising from exposure to hazardous materials.

23
4. Historical financial data
4.1 Statement of income The financial data of the activities in Germany were examined for the
purpose of the historical analysis of the performances and trends of the activity. In the following table, the consolidated data of the activity in Germany for 2008-2009 are presented (in Euro thousands):
Euro thousands 2008 2009
Revenues 85,339 83,872 Cost of sale 50,116 50,290
Gross profit 35,223 33,582
& gross profit 41% 40%
Operating expenses Marketing, selling, research and development 11,937 12,814 Administrative an general 4,618 4,414
Total operating expenses 16,555 17,228
Operating profit 18,668 16,354
& operating profit 22% 19%

24
4.1 Statement of income
The financial data of the activities in Germany were examined for the
purpose of the historical analysis of the performances and trends of the activity. In the following table, the consolidated data of the activity in Germany for 2008-2009 are presented (in Euro thousands):
Euro thousands 2009
Current assets Cash and cash equivalents 4,390 Trade receivables 7,825 Expenses in advance 1,802 Inventory 10,743
Total current assets 24,760
Fixed assets Fixed assets, net 13,000 Other assets, net 83,014 Intercompany loands 51,687
Total fixed assets 147,701
Total assets 172,461
Current liabilities Current contingencies 3,205 Liabilities to vendors and to service providers 4,691 Other liabilities 10,138
Total current liabilities 18,034
Long-term liabilities Loans from banks 1,090 Intercompany loans 12,877 Liabilities for severance pay 2,211 Deferred taxes 5,561
Long-term liabilities 21,739
Shareholders' equity 132,688
Total liabilities and shareholders' equity 172,461

25
5. Identification of cash generating unit
The Standard requires recognition in the loss from a depreciation of an asset any time, where the value of the asset in the Books of Account exceeds its recoverable amount. If the recoverable amount of the single asset cannot be estimated, the Corporation should calculate the recoverable amount of the cash generating unit to which the asset is ascribed. A cash generating unit of an asset is the smallest group of assets which includes the asset and generates positive cash flow from an ongoing use. These are mainly independent of positive cash flows of other assets or other groups of assets.
As mentioned above, goodwill arising from an acquisition represents a payment
implemented by the purchaser while expecting future economic benefits. Goodwill does not generate cash flows independently from other assets or from other groups of assets. Therefore, the recoverable amount of the goodwill as a separate asset cannot be determined. Hence, if signs of the depreciation of the goodwill exist, the recoverable amount will be determined for the cash generating unit to which the goodwill is ascribed. The aforementioned amount will be compared to the book value of the said cash generating unit and any loss from the depreciation will be recognized only if its recoverable amount is lower than its value in the Books of Account.
With respect to the said work, the activities in Germany were identified as the
smallest cash generating unit to which the goodwill arising from the transaction can be allocated.

26
6. Estimation of recoverable amount
The Standard defines the recoverable amount as the highest of the asset's selling prices, net and the value of its use. Nevertheless, when one of these amounts exceeds the asset's value in the Books of Account, there is no decrease in the asset's value and there is no need to estimate the other amount. Moreover, sometimes it is impossible to set the selling price, net as there is no basis for a reliable estimate of the consideration to be received from selling the asset in a transaction held in good faith between a willing buyer and a willing seller which operate intelligently. In this case, the asset's recoverable amount will be its value of use.
The best proof for a selling price, net of an asset / activity is the price set in a
Sales Agreement binding the transaction held in good faith between the willing buyer and the willing seller which operate intelligently, excluding supplementary realization costs which were directly attributed to the realization of the asset. When there is no binding Sales Agreement but the asset is traded in an active market, the selling price, net will be the market price of the asset less realization costs. When there is no binding Sales Agreement or an active market for the asset, the selling price net will be based on the best available information in order to reflect the amount which the Corporation can receive, on the balance sheet date, in consideration for the realization of the asset under a transaction held in good faith between the willing buyer and the willing seller which operate intelligently after the realization costs were deducted.
The use value of the asset is the current value of the estimate of the future cash
flows expected to arise from an ongoing use of the asset and from its realization at the end of its useful life.
The recoverable amount will be set for each asset separately, unless the asset
does not generate positive cash flow from an ongoing use which are mainly independent of the positive cash flow from other assets or from other groups of assets. If it is so, the recoverable amount will be set for the cash generating unit to which the asset is ascribed.
As mentioned above, goodwill arising from an acquisition represents a payment
implemented by the purchases while expecting future economic benefits. Goodwill does not generate cash flows independently of other assets or of other groups of assets, and therefore, the recoverable amount of goodwill cannot be determined as a separate asset. Therefore, if there are signs for depreciation of goodwill, the recoverable amount will be set for the cash generating unit to which the goodwill is ascribed. This amount will be compared to the book value of the said cash generating unit and any loss from depreciation will be recognized only if its recoverable amount is lower than its book value.
As the activity in Germany was identified as the smallest cash generating unit to
which the goodwill arising from the transaction can be allocated and as the activity is not traded, there is no basis for a reliable estimate of the consideration to be received from its sale in a transaction held in good faith between the willing buyer and the willing seller operating intelligently. Therefore, the

27
selling price of the activity in Germany cannot be determined. Hence, the recoverable amount of the activity in Germany will be the value of its use.
Estimation of the use value of the cash generating unit includes the following
steps: (a) Estimation of the future cash flows, both the positive and the negative, to
be arising from an ongoing use of a cash generating unit and its final realization, and
(b) Implementation of a discount compatible with these future cash flows. While measuring the value of use, the following Directives of Standard were
implemented: (a) The forecasts of the cash flows were based on reasonable and established
assumptions representing the best estimate of the management with respect to the economic conditions to prevail during the rest of the useful life of the cash generating unit.
(b) The forecast of the cash flows of the cash generating unit were based on
the most updated financial forecasts approved by the Company's Management for a five-year period.
(c) The forecasts of cash flows until the end of the useful life of the cash
generating unit, exceeding the first five years, were estimated by an extrapolation of the Company's forecasts for a five-year period.
The future forecasts of cash flows include: 1. Positive forecasts of cash flows from the ongoing use of the cash
generating unit; 2. Negative forecasts of cash flows which are necessarily caused in order to
generate the positive cash flows from the ongoing use of the cash generating unit and which can be directly attributed or reasonably and consistently allocated to the cash generating unit, and
3. Cash flows, net to be received or paid while realization the cash generating
unit at the end of its useful life. As set forth in the Directives of the Standard, the future cash flows will be
estimated with respect to the cash generating unit in its current position, and therefore, the estimates of the future cash flows do not include positive or negative estimates of cash flows which are expected to arise from a future structural change with which the Company has not yet been engaged or from a future capital expenditure which will improve or increase the performance level of the cash generating unit exceeding the one that was estimated prior to the said capital expenditure.

28
In addition, the future estimates of cash flows do not include positive or negative cash flows from financing activities.
In order to implement the estimation, the cash flows of the activities in Germany
were forecasted and capitalized to change the forecast and the value of activities for the end of the period was also capitalized. As it was assumed that the activities in Germany is a "going concern" and that it will also continue after the end of the forecast period, its value at the end of the period was determined accordingly as the infinite current value of the cash flows based on a representative cash flow for the period and while assuming that a nominal growth of 2% per year will take place. The discount rate before tax according to which the operating cash flows were capitalized and which expresses the business risk relating to the cash generating unit we identified was set to approximate 16%.
As set forth in the Standard, while examining the value of the cash generating
unit, the Corporation should examine whether goodwill relating to the said cash generating unit was recognized in the financial statements. If so, the Corporation should:
a. Implement a Bottom-Up Test, i.e., the Corporation should: 1. Examine whether the Book Value of the Goodwill can be reasonably
and consistently allocated to the examined cash generating unit, and then
2. Compare between the recoverable amount of the examined cash
generating unit and its book value (including the book value of any goodwill allocated) and to recognize the loss from depreciation, should there be any.
b. And if, while implementing the Bottom-Up Test, the Corporation cannot
reasonably and consistently allocate the book value of the goodwill to the examined cash generating unit, the Corporation should also implement the Top-Down Test, i.e., the Corporation should:
1. Identify the smallest cash generating unit which includes the
examined cash generating unit, to which the book value of the goodwill can be reasonably and consistently allocated (hereinafter: "The Comprehensive Cash Generating Unit"), and then,
2. Compare between the recoverable amount of the comprehensive cash
generating unit and its book value (including the book value of any goodwill allocated) and to recognize the loss from depreciation, should there be any.
Every time the Corporation examines whether depreciation has applied on
the cash generating unit, it should take into account any goodwill related to future cash flows generated by the said cash generating unit. If the goodwill can be allocated reasonably and consistently, the Corporation

29
will implement the Bottom-Up Test. If not, the Corporation will implement the two tests mentioned above.
For the purpose of examining the value of use, we used the DCF Method: The analysis of a "going concern" – examining the value of the asset based
on the current value of the revenues they generate. Therefore, an economic impairment of assets of an active business will be implemented through the capitalization of cash flows, i.e., the ability of the Company's assets (the activities acquired) to generate a flow of revenues for the owners.
As a result, the value of the assets is derived from the profits which can be
produced from them and for the revenues the assets produce and it does not have its own entity. In addition, an importance for the efficiency of management and of the current and forecasted market conditions arises.
The basis for estimating by this method is an analysis of the estimate of the
Company's ability to generate cash flow and increase profits in the future. These flows are capitalized at an appropriate capitalization rate which reflects the price of the capital in which the Company operates and the alternative interest the investor faces. The basic principle lying in the basis of the analysis is that the Company, as mentioned above, a "going concern" and an active business, which will operate in the long-term and from here its target is to reach the current value of the long-term forecast of the cash flows.
An analysis based on the cash flow capitalization method requires the
building of a detailed model including various data and, inter alia, reflects factors such as reciprocal relations between inputs and outputs, the rates of increase of forecasts of different variables, an investment plan, working capital requirements and more. This detailed model is a basis for the analysis of the margins and the forecasted cash flows as well as setting the value range.
The forecast of Frutarom's Management and its estimates which are
included in this work and the feasibility examinations we implemented together with market analysis determine the forecast of revenues, the profitability and the economic value of the activity. However, some factors which affect the volume of revenues and expenses are not under the control of Frutarom's Management. Therefore, this model, although practically all of it is based on Management forecasts and estimates and our discretion as professional estimators must include uncertainty which is derived from the limited ability to forecast.
The main advantage of the method arises from tailoring it to the specific
business and its treatment of the unique factors in the business which is subject of this estimation. However, the disadvantage of the method is hardly forecasting the future revenues, expenses and investments, setting a

30
correct capital price and weighting various quality factors as detailed above.
The steps of the impairment of assets under the cash flow capitalization
method of the activity in Germany were: • Analyzing the areas of the activity in Germany; • Forecasting the revenues; • Analyzing the expense structure and forecasting the required
expenses to achieve the revenues achieved; • Forecasting the required investments during the forecast period; • Creating forecasted financial statements, including: Statements of
income, balance sheets and cash flows: • Calculating the economic value of the activities in Germany by
capitalizing the operating cash flow and the flow of investment, including the business value at the end of the forecast period, while using a weighted capital price adjusted to the business risk involved in the activity.
The impairment of assets was implemented for December 31, 2009

31
7. Impairment of assets according to the cash flow capitalization method
7.1 Statements of income
The following table includes the forecast of the statements of income of the activity in Germany for the years of the forecast together with the actual financial results for 2008-2009 (in Euro thousands):
Actual Forecast
Euro thousands
2008
2009
2010
2011
2012
2013
2014
Representing year
Revenues 85,339 83,872 92,098 96,703 101,538 106,615 111,946 114,815 % increase -1.7% 9.8% 5.0% 5.0% 5.0% 5.0% 2.0%
Cost of sale 50,116 50,290 53,622 56,294 59,100 62,046 65,139 66,437 % of revenues 58.7% 60.0% 58.2% 58.2% 58.2% 58.2% 58.2% 58.2%
Gross profit 35,223 33,582 38,476 40,408 42,438 44,569 46,8076 47,747
% gross profit 41.3% 40.0% 41.8% 41.8% 41.8% 41.8% 41.8% 41.8%
Operating results Marketing, selling, research
and development
11,937
12,814
13,381
13,905
14,449
15,015
15,603
15,848 % of revenues 14.0% 15.3% 14.5% 14.4% 14.2% 14.1% 13.9% 13.9%
Administrative and general 4,618 4,414 4,107 4,246 4,390 4,539 4,693 4,756 % of revenues 5.4% 5.3% 4.5% 4.4% 4.3% 4.3% 4.2% 4.2%
Total operating expenses 16,555 17,228 17,487 18,151 18,839 19,554 20,296 20,604
% of revenues 19.4% 20.5% 19.0% 18.8% 18.6% 18.3% 18.1% 18.0%
Operating profit 18,668 16,354 20,989 22,258 23,599 25,015 26,511 27,143
% operating profit 21.9% 19.5% 22.8% 23.0% 23.2% 23.5% 23.7% 23.8%
7.1 Forecast of revenues
In 2009, the revenues of the activities in Germany totaled approximately Euro 83.9 M, a decrease of approximately 1.7% compared to 2008. In accordance with Frutarom's Management, the decrease in income, for the first time in many years, arises from the effect of the global economic recession prevailing this year.
In 2010, based on the 2010 budget of the activities in Germany, it was
assumed that an increase of approximately 9.8% will occur in the revenues of the activity. In accordance with Frutarom's Management, effective as of today, a trend of stabilization and ending the global financial crisis begins to appear, a trend which will positively affect the income from the activities. Therefore, the significant increase forecasted in the income from the activities in Germany in 2010 is supported by this trend and corresponds with the rates of increase in the past.
Based on the multi-annual forecast, it was assumed that in 2011-2014 an
annual growth of approximately 5% in the income from the activities will take place. According to Frutarom's management, the activity in Germany is ascribed to the food market which grows by approximately 2%-3% per year while during the years, the activity itself shows growth which is higher than the increase in the market. The increase of the activity beyond the branch is explained, inter alia, for the fact that the activities in Germany are engaged with natural raw materials which have high growth rate as opposed to the food market which also includes artificial products. In spite the provisions above, for conservative reasons a lower growth (5%) in income was assumed. In addition, it was assumed that in the long

32
term an annual increase of 2% in income will occur in accordance with the long-term growth rate of the activity.
7.3 Expenses forecast
7.3.1 Cost of sale and gross margin
7.3.1.1 Cost of sale
The following table presents the forecast of the cost of sale of the activity in Germany during the years of the forecast together with the actual data for 2008-2009 (in Euro thousands):
Actual Forecast
Euro thousands
2008
2009
2010
2011
2012
2013
2014
Representing year
Cost of sale total excluding depreciation
48,264
48,593
52,037
54,631
57,354
60,212
63,213
64,473
% of revenues 56.6% 57.9% 56.5% 56.5% 56.5% 56.5% 56.5% 56.5%
Depreciation 1,852 1,696 1,584 1,664 1,747 1,834 1,926 1,964
Total cost of sale 50,116 50,290 53,622 56,294 59,100 62,046 65,139 66,437
% of revenues 58.7% 60.0% 58.2% 58.2% 58.2% 58.2% 58.2% 58.2%
7.3.1.1.1 Cost of sale excluding depreciation
The cost of sale excluding depreciation includes Consumption of materials expenses, payroll and related expenses, energy costs, insurance costs, ecology costs, rental of equipment costs, rent, expenses for the maintenance of building and equipment, expenses for vehicles, packaging costs, laboratory costs, security costs, transportation costs, office expenses, computerization expenses, communication expenses, consultation fees, legal fees, taxes and other expenses.
The 2010 cost of sale excluding depreciation
was created based on the 2010 budget of the activity in Germany which is based on past data of the activity and on the Management's future action plan. It was assumed that the 2010 cost of sale excluding depreciation will comprise approximately 57% of the forecasted turnover of revenues this year.
In order to forecast the cost of sale excluding
depreciation for 2011-2014, we analyzed the varying and the fixed component in the structure of the cost of sale excluding depreciation, including the change in the volume of the cost of sale excluding depreciation compared to the change in the volume of income. It was

33
assumed that from 2015 and thereafter, this cost will increase by 2% each year, in accordance with the long term growth rate.
7.3.1.1.2 Depreciation
In 2008 and 2009, the depreciation costs ascribed to the cost of sale totaled approximately 2% of the income turnover.
In 2010-2014 and in the representing year, it was
assumed that based on the 2010 budget of the Group and on past results, the depreciation costs ascribed to the cost of sales will comprise approximately 2% of the income turnover of the activity.
7.3.1.2 Gross margin
It can be seen from the said analysis, that the rate of the gross margin of the activity in Germany during the forecast years will be approximately 42%. The reasonability of the rate of this gross margin is examined compared to the past results of the activity and it was found that the forecasted rate of the gross margin is reasonable.
7.3.2 Operating expenses and operating margin
7.3.2.1 Marketing, sales, research and development expenses
The following table presents the forecast of the marketing, sales, research and development expenses of the activity in Germany during the years of the forecast together with the actual data for 2008-2009 (in Euro thousands):
Actual Forecast
Euro thousands
2008
2009
2010
2011
2012
2013
2014
Representing year
Total of marketing, sales, research and development expenses excluding depreciation
11,818
12,690
13,224
13,740
14,276
14,833
15,412
15,653
Expenses % of income 13.8% 15.1% 14.4% 14.2% 14.1% 13.9% 13.8% 13.7%
Depreciation 119 124 157 165 173 182 191 195 Total of marketing, sales,
research and development expenses
11,937
12,814
13,381
13,905
14,449
15,015
15,603
15,848
Expenses % of income 14.0% 15.3% 14.5% 14.4% 14.2% 14.1% 13.9% 13.9%
7.3.2.1.1 Marketing, sales, research and development expenses
Marketing, sales, research and development expenses excluding depreciation include payroll

34
and related expenses, energy costs, insurance costs, ecology costs, rental of equipment costs, rent, expenses for the maintenance of building and equipment, expenses for vehicles, packaging costs, laboratory and sampling costs, security costs, transportation and travel costs, office expenses, computerization expenses, communication expenses, consultation fees, legal fees, taxes and other expenses while intercompany commissions are setoff.
The 2010 marketing, sales, research and
development expenses excluding depreciation was created based on the 2010 budget of the activity in Germany which is based on past data of the activity and on the Management's future action plan. It was assumed that the 2010 marketing, sales, research and development expenses excluding depreciation will comprise approximately 14% of the forecasted turnover of revenues this year.
In order to forecast the marketing, sales,
research and development expenses excluding depreciation for 2011-2014, we analyzed the varying and the fixed component in the structure of the marketing, sales, research and development expenses excluding depreciation, including the change in the volume of the marketing, sales, research and development expenses excluding depreciation compared to the change in the volume of income. It was assumed that from 2015 and thereafter, this cost will increase by 2% each year, in accordance with the long term growth rate.
7.3.2.1.2 Depreciation
In 2008 and 2009, the depreciation costs ascribed to the marketing, sales, research and development expenses totaled approximately 0.2% of the income turnover.
In 2010-2014 and in the representing year, it was
assumed that based on the 2010 budget of the activity in Germany and on past results, the depreciation costs ascribed to the marketing, sales, research and development expenses will comprise approximately 0.2% of the income turnover of the activity.

35
7.3.2.2 Administrative and general expenses
The following table presents the forecast of the administrative and general expenses of the activity in Germany during the years of the forecast together with the actual data for 2008-2009 (in Euro thousands):
Actual Forecast
Euro thousands
2008
2009
2010
2011
2012
2013
2014
Representing year
Total of administrative and general expenses excluding depreciation
4,404
4,191
3,908
4,037
4,171
4,309
4,451
4,510
Expenses % of income 5.2% 5.0% 4.2% 4.2% 4.1% 4.0% 4.0% 3.9%
Depreciation 215 223 199 209 219 230 242 246 Total of administrative and
general expenses
4,618
4,414
4,107
4,246
4,390
4,539
4,693
4,756
Expenses % of income 5.4% 5.3% 4.5% 4.4% 4.3% 4.3% 4.2% 4.2%
7.3.2.1.1 Administrative and general expenses
Administrative and general expenses excluding depreciation include payroll and related expenses, energy costs, insurance costs, ecology costs, rental of equipment costs, rent, expenses for the maintenance of building and equipment, expenses for vehicles, packaging costs, laboratory costs, security costs, transportation costs, office expenses, computerization expenses, communication expenses, consultation fees, legal fees, audit fees, directors' fees, taxes and other expenses.
The 2010 administrative and general expenses
excluding depreciation was created based on the 2010 budget of the activity in Germany which is based on past data of the activity and on the Management's future action plan. It was assumed that the 2010 administrative and general expenses excluding depreciation will comprise approximately 4% of the forecasted turnover of revenues this year.
In order to forecast the administrative and
general expenses excluding depreciation for 2011-2014, we analyzed the varying and the fixed component in the structure of the marketing, sales, research and development expenses excluding depreciation, including the change in the volume of the administrative and general expenses excluding depreciation compared to the change in the volume of

36
income. It was assumed that from 2015 and thereafter, this cost will increase by 2% each year, in accordance with the long term growth rate.
7.3.2.2.2 Depreciation
In 2008 and 2009, the depreciation costs ascribed to the administrative and general expenses totaled approximately 0.3% of the income turnover.
In 2010-2014 and in the representing year, it was
assumed that based on the 2010 budget of the activity in Germany and on past results, the depreciation costs ascribed to the administrative and general expenses will comprise approximately 0.2% of the income turnover of the activity.
7.3.2.3 Operating margin
It can be seen from the said analysis that the rate of the operating margin of the activity in Germany during the forecast years will shift approximately 23%-24%. The reasonability of the rate of this operating profit was examined compared to the past results of the activity and it was found that the forecasted operating profit is reasonable.
7.4 Investments and depreciation forecast
7.4.1 Investments in fixed assets
The forecast of the investments in fixed assets was created based on Management policy with respect to the investment plan and in view of the investments required as a function of the economic depreciation for the activity asset.
The investment policy is to invest every year up to the amount of
the annual depreciation. Due to conservatism, it was assumed that the investment in fixed assets will be equal to the depreciation amount every year of the forecast years. In order to avoid any doubt, Management does not forecast special investments in fixed assets of the activity beyond maintaining the fixed assets which already exist.
7.4.2 Investment in working capital
The annual investment in working capital was calculated based on the credit policy of the activity in Germany as arising from the average of the credit days during 2008-2009 and from conversations with Frutarom's Management:
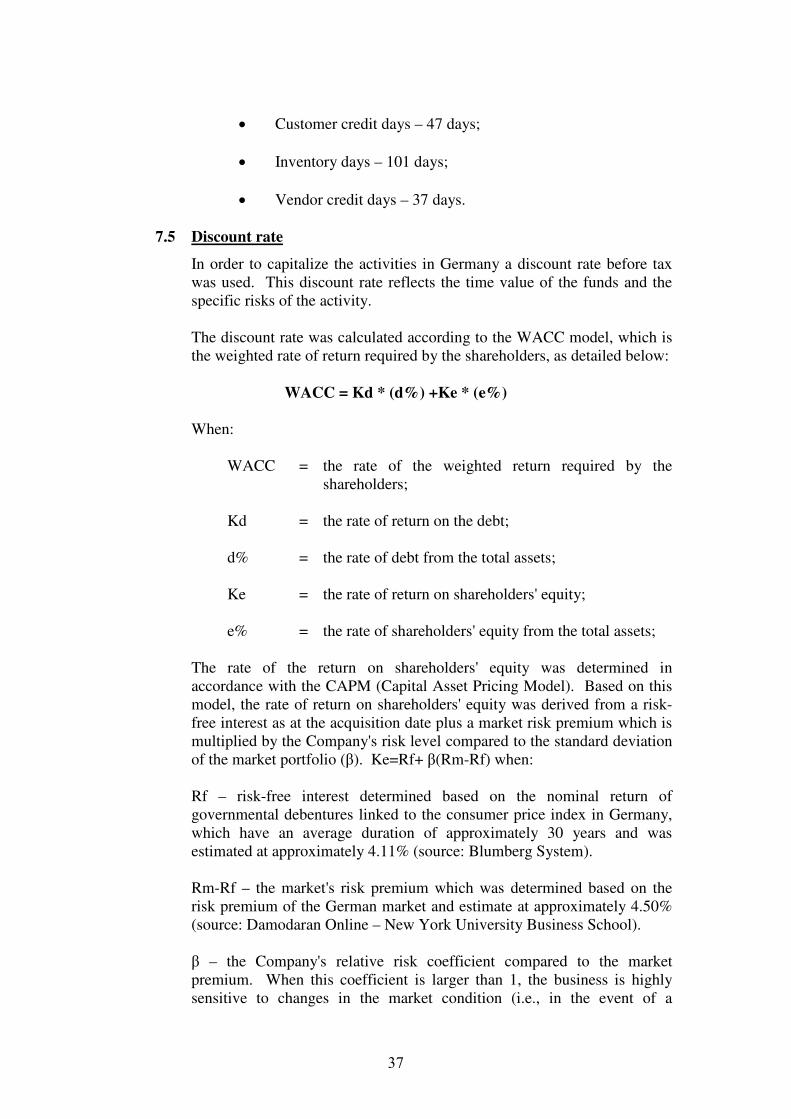
37
• Customer credit days – 47 days; • Inventory days – 101 days; • Vendor credit days – 37 days. 7.5 Discount rate
In order to capitalize the activities in Germany a discount rate before tax was used. This discount rate reflects the time value of the funds and the specific risks of the activity.
The discount rate was calculated according to the WACC model, which is
the weighted rate of return required by the shareholders, as detailed below:
WACC = Kd * (d%) +Ke * (e%) When: WACC = the rate of the weighted return required by the
shareholders; Kd = the rate of return on the debt; d% = the rate of debt from the total assets; Ke = the rate of return on shareholders' equity; e% = the rate of shareholders' equity from the total assets; The rate of the return on shareholders' equity was determined in
accordance with the CAPM (Capital Asset Pricing Model). Based on this model, the rate of return on shareholders' equity was derived from a risk-free interest as at the acquisition date plus a market risk premium which is multiplied by the Company's risk level compared to the standard deviation of the market portfolio (β). Ke=Rf+ β(Rm-Rf) when:
Rf – risk-free interest determined based on the nominal return of
governmental debentures linked to the consumer price index in Germany, which have an average duration of approximately 30 years and was estimated at approximately 4.11% (source: Blumberg System).
Rm-Rf – the market's risk premium which was determined based on the
risk premium of the German market and estimate at approximately 4.50% (source: Damodaran Online – New York University Business School).
β – the Company's relative risk coefficient compared to the market
premium. When this coefficient is larger than 1, the business is highly sensitive to changes in the market condition (i.e., in the event of a

38
recession, the branch will be more negatively affected from other branches, and in the event of prosperity the branch will be more positively affected from other branches). When the said coefficient is smaller than 1, the value of the business is less sensitive to changes in market condition than the average.
The beta is the ratio between an risk which cannot be distributed with
respect to the share (the capital market does not compensate the shareholders for the distributable risk component) and the standard deviation of the market portfolio and expresses the level of sensitivity of the return rate on the share to changes in the return rate of the market portfolio.
Process of finding the beta The process of finding the beta can be done in two ways: � Through running a regression such as GLS or OLS and examining
the typicality of the connection between a risk premium and an actual return excluding risk-free interest (if the Stock Exchange Company and the data are available) or through comparison to betas of similar companies.
� A common method to determine the beta price is through
differentiating the beta from the data of similar companies while making adjustments in view of the various leverage levels in similar companies.
� The adjustment process is calculated based on the following
calculation:
While assuming that:
(the joint difference between the price of the debt and the return of
the market portfolio is zero). Hence:
While assuming that:

39
Beta Asset (similar company) = Beta Asset (estimated company) Based on the M&M (Modigliani-Miller) Theorem with respect to
capital structure. The beta of the activity in Germany was calculated in accordance
with Frutarom's beta. The beta equity derived from the provisions mentioned above is estimate at 0.96 (source: Bizportal System).
In order to weight the capitalization rate, we examined the price of
Frutarom's debt based on the 2008 Audited Financial Statements and conversations with Frutarom's Management. It can be seen from the examination, the debt price is approximately 2.13%6. Nevertheless, the debt and shareholders' equity component taken for the purpose of the calculation is based on Frutarom's normative weights.
In addition, the normative weights which were used to calculate the
discount rate are: Approximately 19% for the debt weight and approximately 81% for the shareholders' equity weight.
Risk premium for small companies – a premium reflecting the excess
risk in the investments of small companies was added to the shareholders' equity price. This premium arises from the fact that investment in small companies bears more risk than investment in large and established companies. Therefore, investors expect a higher return when they invest in small companies. This premium was calculated on the basis of historical differences in returns between small companies and large companies in the American market. In view of the above, in this calculation, a premium at a rate of 5.81% was taken (source: Ibotson 2009).
On the basis of the work assumptions presented, the discount rate
after tax is 12% as detailed in the following table:
Parameter Value Shareholders' equity price 14.26% Shareholders' equity weight 81% Price of debt after tax 1.54% Weight of debt 19% Discount rate after tax (rounded off) 12.00%
As the basis of the discount rate detailed above is after tax, it must be
adjusted in a way that it reflects the discount rate before tax. For that purpose, the recoverable amount was calculated after the discount rate of 12% after tax was given. Afterwards, the discount rate before tax was calculated which is required to reach the recoverable amount received. It can be seen from the above calculation that the discount rate before tax is approximately 16%.
6 Libor+1/15%

40
7.6 Long-term growth
We assumed that the volume of the growth in the market where the activity in Germany takes place will be approximately 2%, a rate which embodies the growth rate of the population and a conservative component of the activity's organic growth.
7.7 The Group's recoverable amount
7.7.1 Cash flow forecast
The following table presents the free cash flow forecast for the forecast period7 (in Euro thousands):
In order to calculate the recoverable amount of the activity in
Germany, the operating cash flow was differentiated prior to the financing expenses and subsequent to the investments in fixed assets. This cash flow was capitalized at the discount rate before tax, which reflects the operating risk of the activity – estimated at approximately 16%. In addition, it was assumed that a nominal growth of 2% in the cash flow will take place.
7 It was assumed that the investments in fixed assets are equal to the depreciation amount.
Euro thousands
2010
2011
2012
2013
2014
Representing year
Operating profit 20,989 22,258 23,599 25,015 26,511 27,143 Changes in working capital (1,644) (1,062) (1,115) (1,170) (1,229) (516)
Total 19,345 21,196 22,484 23,845 25,282 26,627
Residual value 192,600 Value of use 17,954 16,944 15,480 14,140 12,914 96,446

41
8. Sensitivity
A sensitivity analysis of the recoverable amount compared to the discount rate before tax and the long-term growth rate is presented in the following table (in Euro thousands):
In addition, we have implemented a sensitivity analysis of the recoverable
amount compared to the discount rate before tax and the short-term growth rate. For the purpose of the aforementioned sensitivity analysis, the recoverable amount was calculated according to the assumption that the income from the activities in Germany will increase by 5% between the years 2010-2014 and, as from the representing year – by 2%.
A sensitivity analysis of the recoverable amount compared to the discount rate
before tax and the short-term growth rate is presented in the following table (in Euro thousands):
Discount rate before tax
173,878 12% 13% 14% 15% 16% 17% 18% 19% 20%
0.0% 215,728 199,152 184,91 172,651 161,898 152,410 144,003 136,482 129,720 0.5% 221,399 203,786 188,784 175,857 164,605 154,724 145,980 138,188 132,202 1.0% 227,581 208,802 192,911 179,291 167,491 157,172 148,072 139,988 132,762
1.5% 234,346 214,251 197,365 182,977 170,575 159,776 150,290 141,891 134,405
2.0% 241,782 220,191 202,186 186,945 173,878 162,553 152,645 143,905 136,139
2.5% 249,991 226,692 207,424 191,227 177,423 165,520 155,152 146,041 137,972 3.0% 259,102 233,836 213,133 195,863 181,239 168,698 157,825 148,309 139,911 3.5% 269,273 41,723 219,381 200,899 185,358 172,109 160,681 150,722 141,968 4.0% 280,699 250,478 226,248 206,389 189,818 175,781 163,739 153,295 144,152 4.5% 293,629 260,250 233,829 212,396 194,661 179,744 167,022 156,045 146,476
Lo
ng
-term g
row
th ra
te
5.0% 308,378 271,229 242,244 218,998 199,941 184,034 170,556 158,989 148,955
Discount rate before tax
140,754 12% 13% 14% 15% 16% 17% 18% 19% 20%
0.0% 174,644 161,219 149,717 139,754 131,044 123,366 116,549 110,457 104,980 1.0% 178,288 164,199 152,184 141,819 132,789 124,852 117,824 111,558 105,937 2.0% 182,190 167,373 154,800 143,999 134,624 126,411 119,157 112,707 106,933
3.0% 186,377 170,759 157,577 146,305 137,558 128,047 120,554 113,907 107,971 4.0% 190,883 174,381 160,532 148,747 138,598 129,769 122,018 115,162 109,054
5.0% 195,745 178,263 163,682 151,338 140,754 131,581 123,555 116,476 110,185
6.0% 201,007 182,435 167,047 154,092 143,036 133,492 125,171 117,853 111,367 7.0% 206,722 186,931 170,650 157,025 145,455 135,509 126,870 119,297 112,604 8.0% 212,948 191,789 174,518 160,154 148,023 137,643 128,661 120,813 113,899 9.0% 219,760 197,056 178,679 163,501 150,756 139,903 130,550 122,408 115,257
Sh
ort-term
gro
wth
rate
10.0% 227,243 202,785 183,169 167,089 153,669 142,301 132,547 124,088 116,682

42
9. Conclusion
As mentioned above the estimation of the recoverable amount was implemented by the estimation of the value of use of the activity in Germany as at December 31, 2009.
As mentioned above, the estimation of the value of use was based on: 1. Cash flow forecasts based on reasonable and established assumptions
which reflect the current position of the cash generating unit and represent the best estimate of the Management with respect to the economic conditions which will prevail during the useful life of the cash generating unit, and
2. Discount rate before tax, which reflects current market estimates of the
time value of the funds and the specific risks to the cash generating unit. The discount rate will not reflect risks, for which future cash flows have already been adjusted.
The cash flows were forecasted and capitalized for 2010-2015 and the
capitalization of the activity value for the end of the period. As it was assumed that the activity in Germany is a "going concern" and that it will also continue after the end of the forecast period, its value at the end of the period was determined accordingly as the infinite current value of the cash flows based on a representative cash flow for the period and while assuming that a nominal growth of 2% per year will take place. The discount rate before tax according to which the operating cash flows were capitalized and which expresses the business risk relating to the cash generating unit we identified was set to approximate 16%.
The following table presents the recoverable amount estimate and the value of
the activity in Germany in Frutarom's Books of Account (in Europe thousands):
Euro thousands
Value of use 173,878
Book value effective as at December 31, 2009 Operating assets 33,405 Operating liabilities 19,676
Operating assets, net 13,729
Know how 7,204 Customer relations 9,225 Goodwill 66,550
Total book value 96,708
Difference 77,170
Therefore, the depreciation of goodwill should not be implemented.

Section B
Directors' Report
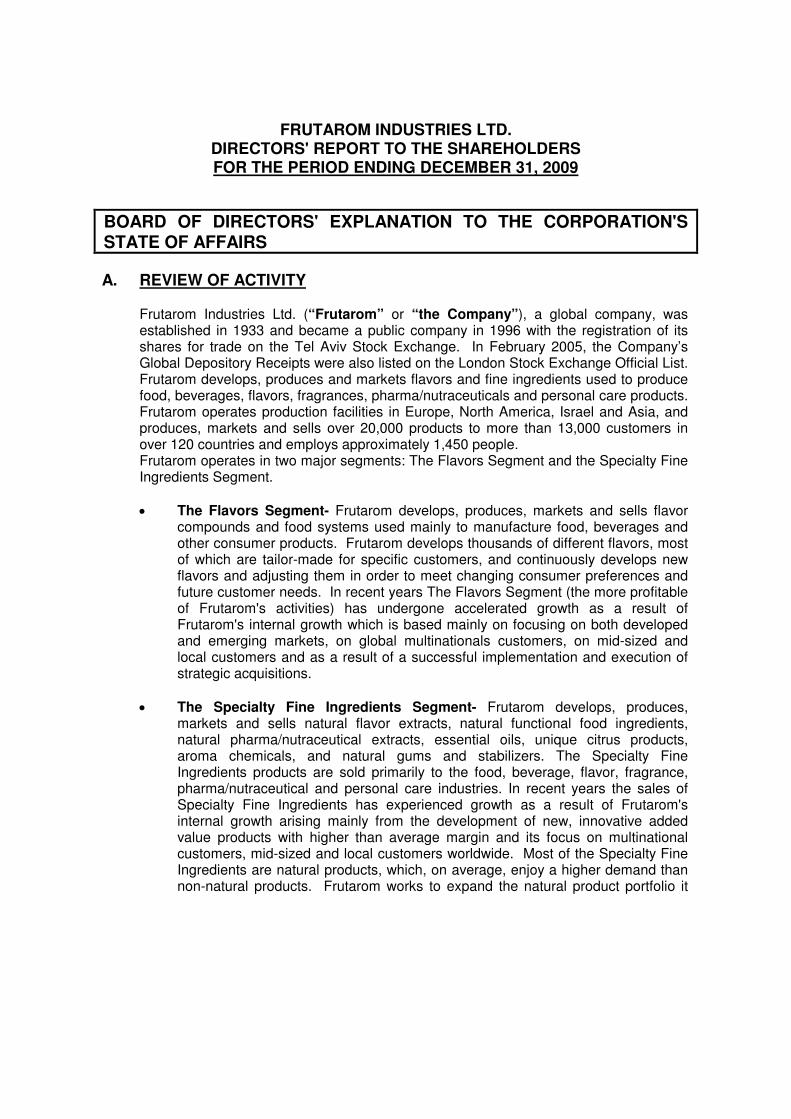
FRUTAROM INDUSTRIES LTD. DIRECTORS' REPORT TO THE SHAREHOLDERS FOR THE PERIOD ENDING DECEMBER 31, 2009
BOARD OF DIRECTORS' EXPLANATION TO THE CORPORATION'S
STATE OF AFFAIRS
A. REVIEW OF ACTIVITY Frutarom Industries Ltd. (“Frutarom” or “the Company”), a global company, was
established in 1933 and became a public company in 1996 with the registration of its shares for trade on the Tel Aviv Stock Exchange. In February 2005, the Company’s Global Depository Receipts were also listed on the London Stock Exchange Official List. Frutarom develops, produces and markets flavors and fine ingredients used to produce food, beverages, flavors, fragrances, pharma/nutraceuticals and personal care products. Frutarom operates production facilities in Europe, North America, Israel and Asia, and produces, markets and sells over 20,000 products to more than 13,000 customers in over 120 countries and employs approximately 1,450 people.
Frutarom operates in two major segments: The Flavors Segment and the Specialty Fine Ingredients Segment.
• The Flavors Segment- Frutarom develops, produces, markets and sells flavor
compounds and food systems used mainly to manufacture food, beverages and other consumer products. Frutarom develops thousands of different flavors, most of which are tailor-made for specific customers, and continuously develops new flavors and adjusting them in order to meet changing consumer preferences and future customer needs. In recent years The Flavors Segment (the more profitable of Frutarom's activities) has undergone accelerated growth as a result of Frutarom's internal growth which is based mainly on focusing on both developed and emerging markets, on global multinationals customers, on mid-sized and local customers and as a result of a successful implementation and execution of strategic acquisitions.
• The Specialty Fine Ingredients Segment- Frutarom develops, produces,
markets and sells natural flavor extracts, natural functional food ingredients, natural pharma/nutraceutical extracts, essential oils, unique citrus products, aroma chemicals, and natural gums and stabilizers. The Specialty Fine Ingredients products are sold primarily to the food, beverage, flavor, fragrance, pharma/nutraceutical and personal care industries. In recent years the sales of Specialty Fine Ingredients has experienced growth as a result of Frutarom's internal growth arising mainly from the development of new, innovative added value products with higher than average margin and its focus on multinational customers, mid-sized and local customers worldwide. Most of the Specialty Fine Ingredients are natural products, which, on average, enjoy a higher demand than non-natural products. Frutarom works to expand the natural product portfolio it

2
offers its customers, with particular emphasis on the functional food area. In addition, a number of strategic acquisitions in recent years which were successfully merged to Frutarom's global operation, contributed to the increase in the sales of the Specialty Fine Ingredients segment.
B. MERGERS AND ACQUISITIONS In recent years, Frutarom has implemented a strategy for achieving rapid and profitable
growth, through a combination of organic and profitable growth in its core activities and strategic acquisitions in its field. These acquisitions strengthen Frutarom's position as a leading global flavors and fine ingredients manufacturer and they contribute in strengthening Frutarom's human resources. Frutarom has extensive experience in successfully implementing acquisitions and mergers. Frutarom acts to integrate the acquired activities into its existing operations while utilizing the synergy, both commercial and operational, in order to take best advantage of the cross-selling opportunities, the cost savings and the improvement in profit margins. In the first half of 2009, Frutarom implemented three acquisitions as detailed below:
Acquisition of the Savory Activities of the Christian Hansen Group in Germany:
On June 18, 2009, Frutarom acquired, through its subsidiaries in Germany, the assets and the Savory activity of the Christian Hansen Group (hereinafter: "CH") in Germany in consideration for a cash payment of approximately US$ 7.3 M (€ 5.275 M).
CH's Savory activity develops, manufactures and markets unique and innovative Savory
solutions which include flavors, seasonings and functional ingredients for the food industry, with special emphasis on fields of processed meat and convenience food. The acquired activity has a large customer base, mainly among leading meat manufacturers in Germany and export activity to Scandinavia. The activity is largely synergetic to the activity of the German companies Gewurzmuller and Nesse, acquired by Frutarom in 2007 and in 2006.
During the third quarter, Frutarom completed, as planned, the transfer of the manufacturing activities from the CH Site in Holdorf to its sites in North and South Germany. CH management, research and development, operation and purchasing, sales and customer service were also integrated while achieving maximum efficiency and significant operational savings. Upon the completion of the operational merger, Frutarom acts to achieve maximum utilization of the many cross-selling opportunities which exist between the acquired activity and its existing activity in Germany.
Acquisition of Flavors Specialties Inc. in the US:
On March 4, 2009, Frutarom acquired the assets and business of the American Company Flavors Specialties Inc. (hereinafter: "FSI") in consideration for a cash payment of US$ 17.2 M. FSI develops, manufactures and markets flavors and natural botanical extracts mainly for the food and beverage industry in North America, Central America and South America. Since the acquisition, Frutarom has completed the merger and the integration of the activities of FSI with its existing activities in the US.

3
Acquisition of Oxford Chemicals Limited in UK:
On January 30, 2009, Frutarom completed the acquisition of the assets and business of Oxford Chemicals Limited (hereinafter: "Oxford") in consideration for approximately US$ 12 M (approximately £ 8.25 M). Oxford develops, manufactures and markets specialty fine ingredients for the flavor and fragrance industry. Since the acquisition, Frutarom has completed, as planned, the merger and the integration of Frutarom's and Oxford's research and development, operations, purchasing, marketing and sales infrastructure and will further act to achieve maximum utilization of the many cross-selling opportunities between Oxford's activities and Frutarom's existing activities.
Since the breakout of the global economic crisis, in the last months of 2008, Frutarom has acted, decisively, to strengthen its competitiveness and to improve its operational efficiency while tightly controlling and reducing its expense level and further strengthened the research & development and sales infrastructure, in order to ensure further future growth. In spite of the relative slowdown in 2009, in the markets in which Frutarom operates which results from the global economic crisis, Frutarom estimates that it maintained its market share with its customers. Frutarom estimates that the stabilization of the global economy in recent months, the moderation in currencies fluctuations, the halt of the destocking inventories trend and signs of gradual improvement in consumption, including in countries significantly affected by the devaluation in their currency, will contribute to the improvement in its sales level and to future return to a growth at rates similar to those characterizing its activities in the past.
Frutarom estimates, that its strong capital and cash flow position in addition to support from leading banks will allow Frutarom to continue implementing it acquisition strategy as part of Frutarom's rapid and profitable growth strategy, implemented in recent years, which incorporates profitable internal growth and strategic acquisitions, in order to strengthen its positioning as one of the leading global companies in the field of flavors and fine ingredients, and to realize its vision:
“To be the Preferred Partner for Tasty and Healthy Success.”
C RESULTS OF OPERATIONS IN Q4 2009 Sales Frutarom's sales in Q4 2009 increased by 9.9% and totaled at US$ 108.5 M compared
to US$ 98.7 M in the same quarter in 2008. In local currency terms, an increase of 3.1% was recorded compared to Q4 2008. The strengthening of the West European currencies and the NIS, in which most of Frutarom's sales are implemented, compared to the US$, contributed approximately 6.8% to the increase in the Company's sales in US$ terms.
The following factors have mainly contributed to the increase in sales:
a. The merger of Oxford's activities, which was acquired and consolidated as from February 1, 2009, the merger of the activities of FSI, which was acquired and consolidated as from March 4, 2009 and the merger of the Savory activities of CH in

4
Germany which was acquired and consolidated as from June 18, 2009. The merger of these activities has contributed an amount of approximately US$ 8.1 M to Frutarom's sales in Q4 of 2009.
b. Organic growth in the sale of the specialty fine ingredients manufactured and sold by
the Fine Ingredients Segment.
c. The strengthening of the West European currencies and the NIS (in which most of Frutarom's sales were implemented) compared to the US$ during the quarter has contributed, approximately 6.8% to the increase in the Company's sales in US$ terms, as mentioned above.
On the other hand, the decrease in the trade and marketing activity in Israel (activity which is not a core activity for Frutarom), which is partly the result of focusing on products with higher profit margins, caused a decrease of approximately 1.4% in sales.
Sales Breakdown by Fields of Activity in the fourth quarters of 2000-2009 (US$ M and %)
2009 2008 2007 2006 2005 2004 2003 2002 2001 2000
76.6 71.3 78.5 45.5 30.8 40.1 18.5 10.4 9.1 6.6 Sales
71% 72% 72% 63% 59% 70% 51% 44% 39% 35% %
Flavors
Segment
30.9 25.5 28.9 26.4 20.0 16.1 17.2 12.1 16.4 11.0 Sales
29% 26% 27% 36% 38% 28% 47% 51% 57% 59% %
Fine
Ingredients
Segment
1.4 2.7 2.6 2.0 1.3 1.5 1.4 1.5 1.2 1.2 Sales
1% 3% 2% 3% 2% 3% 4% 6% 5% 6% %
Trade &
Marketing
-0.4 0.8- 1.5- 1.4- 0.5 0.7- 0.6- 0.5- 0.2- 0.2- Sales
1%- 1%- 1%- 2%- 1% 1%- 2%- 2%- 1%- 1%- %
Inter
Segments
108.5 98.7 108.5 72.5 52.6 57.0 36.5 23.5 23.5 18.6 Total sales

5
The following is a summary of the profit and loss report for Q4 (US$ M):
2008 2009 Change
(%)
Sales 98.7 108.5 9.9%
Gross profit 36.5 39.6 8.6%
R&D, Selling, Administration, General and Other income 28.0 28.6 2.2%
Operating profit 8.4 11.0 30.1%
EBITDA 12.4 16.0 29.2%
Profit before tax 5.4 10.1 86.7%
Net profit 6.0 7.5 24.1%
Gross Profit The gross profit in Q4 2009 reached US$ 39.6 M compared to US$ 36.5 M in the same
quarter in 2008, an increase of 8.6%. The gross margin in the period reached 36.5% compared to 36.9% in the same period in 2008.
Selling and Marketing, Research and Development, Administration, General and
Other Expenses In Q4 2009, selling, marketing, research and development, administration, general and
other expenses totaled US$ 28.6 M (26.4% of sales) compared to US$ 28.0 M in 2008 (28.4% of sales). The improvement and decrease in the expense level as a percentage of sales were achieved due to actions taken by Frutarom's Management to improve efficiency and competitiveness in spite of the weakening of the US$ against the European currencies and the NIS and the additional expenses resulting from the merger of the three business activities acquired during 2009.
Operating Profit and EBITDA In Q4 2009, operating profit increased by 30.1% and totaled US$11.0M compared to
US$ 8.4 M in the same period. Operating margin for the period increased and reached 10.1% compared to 8.5% during the same period in 2008.
The EBITDA achieved by Frutarom in Q4 2009 increased by approximately 29.2% and
totaled at US$16.0M which are 14.8% of the sales compared to US$12.4M in the same quarter which were 12.6% of sales.

6
Finance Expenses / Income In Q4 2009, finance expenses totaled US$ 0.9 M (0.8% of sales), out of which US$ 0.5
M was for currency rate differences – compared to finance expenses of US$ 3.0 M (3.1% of sales), out of which US$ 0.7 M was for currency rate differences in Q4 2008.
The decrease in finance expenses arises both from the reduction of loans during the
year (in spite of the three acquisitions implemented in 2009) and from the decrease in interest rates in 2009 compared to 2008.
Profit before Tax In Q4 2009, the profit before tax increased at a sharp rate of 86.7% and totaled
US$10.1M (9.3% of sales) compared to US$ 5.4 M (5.5% of sales) in the same quarter last year.
Taxes on Income In Q4 2009, taxes on income totaled US$ 2.6 M (25.7% of profit before tax) compared to
tax income of US$ 0.6 M (11.8% of profit before tax) recorded in Q4 2008 for closing tax assessments from previous years.
Net Profit In Q4 2009, net profit increased by approximately 24.1% and reached US$ 7.5 M compared to US$ 6.0 M in Q4 2008. Net margin increased and reached 6.9% compared to 6.1% in the same quarter last year.
Liquidity In Q4 2009, the improvement in cash flow from operations continued and totaled at US$27.0M compared to US$ 15.8 M in Q4 2008.
Profit per Share In Q4 2009, the profit per share totaled at US$0.13 per share compared to US$ 0.10 per share in Q4 2008.

7
Summary of the profit for the quarters (US$ M):
Q1
2008
Q2
2008
Q3
2008
Q4
2008
Q1
2009
Q2
2009
Q3
2009
Q4
2009
Income 122.0 132.6 120.0 98.7 98.4 106.7 111.6 108.5
Gross profit 44.8 49.7 45.3 36.5 35.2 39.4 41.2 39.6
Selling, Marketing, R&D, Administration, General and Other Expenses
29.4 31.9 30.3 28.0 25.0 26.7 27.9 28.6
Operating profit 15.3 17.9 15.0 8.4 10.2 12.8 13.3 11.0
EBITDA 20.2 23.8 20.0 12.4 14.5 17.4 18.3 16.0
Finance expenses 2.8 2.2 2.5 3.0 3.3 0.1 0.0 0.9
Profit before tax 12.5 15.7 12.4 5.4 6.9 12.7 13.2 10.1
Net profit 9.7 12.0 9.4 6.0 5.6 10.1 10.0 7.5
Frutarom’s business is characterized by seasonal fluctuations, generally with higher
sales in the first half of a given year and lower sales and profitability during the second half of a given year and mainly in the fourth quarter. The seasonality arises from the fact that a substantial portion of the Company’s products are used by its customers in the manufacture of beverages, ice cream and yogurt, for which demand generally increases markedly during the summer months. As a result, sales of certain flavors and fine ingredients produced by Frutarom rise in the first half of the year as manufacturers of beverages, ice cream and yogurt restock their inventories and increase production in advance of rising demand during the summer months. The effect of seasonal fluctuations on the Frutarom’s results and business has become more moderate in recent years as Frutarom has increased its sales of products such as savory flavors due to the acquisition of Nesse, Gewurzmuller and the savory activities of CH in Germany in addition to the increase in the sales of natural functional food ingredients, and natural pharma/nutraceutical extracts, which are intended for the pharma/nutraceutical industries and are less affected by the lower seasonality in demand.
D. RESULTS OF OPERATIONS IN 2009
Sales Frutarom's sales in 2009 totaled US$ 425.2 M, a decrease of approximately 2.7% in
local currency terms compared to 2008 where Frutarom achieved record results. The strengthening of the US$ against the European currencies and the NIS (in which most of Frutarom's sales are implemented) in sharp rates of up to 16% during the first three quarters of 2009 caused a decrease in sales in 2009 at a rate of approximately 7.5%. In US$ terms, sales decreased this year compared to the same period in 10.2%. In spite of the decrease in sales, Frutarom estimates that it maintained its market share with its customers.
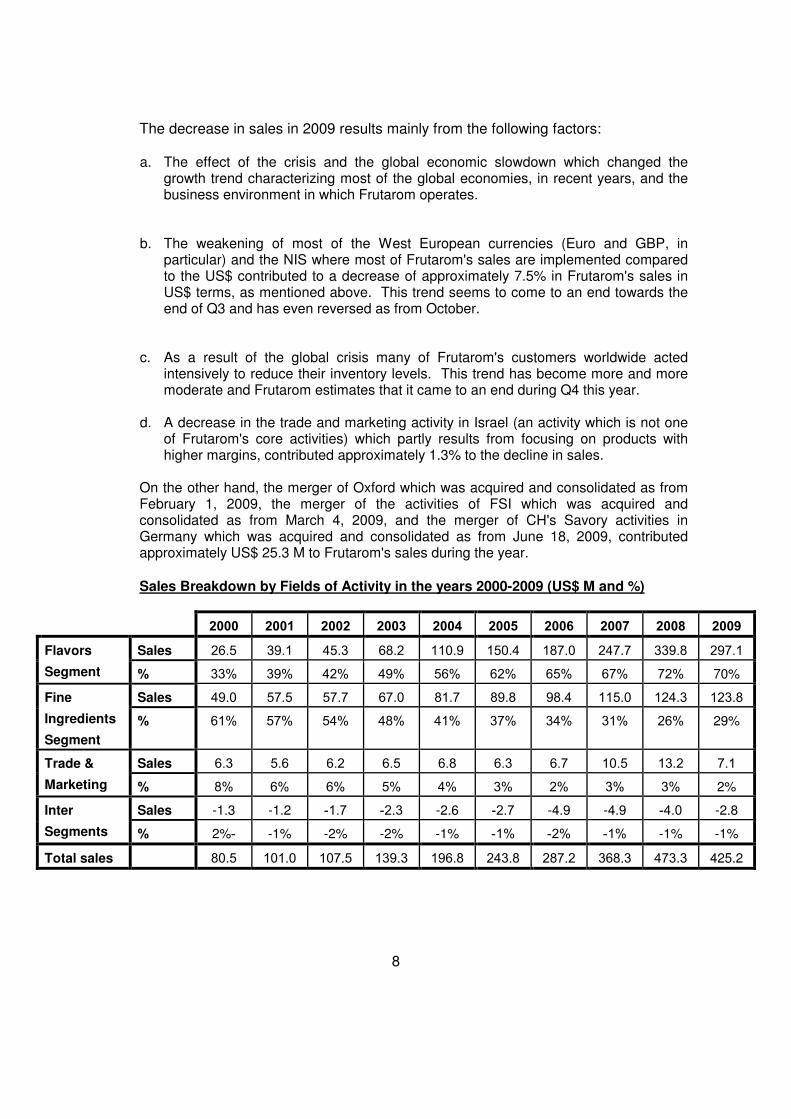
8
The decrease in sales in 2009 results mainly from the following factors:
a. The effect of the crisis and the global economic slowdown which changed the growth trend characterizing most of the global economies, in recent years, and the business environment in which Frutarom operates.
b. The weakening of most of the West European currencies (Euro and GBP, in particular) and the NIS where most of Frutarom's sales are implemented compared to the US$ contributed to a decrease of approximately 7.5% in Frutarom's sales in US$ terms, as mentioned above. This trend seems to come to an end towards the end of Q3 and has even reversed as from October.
c. As a result of the global crisis many of Frutarom's customers worldwide acted intensively to reduce their inventory levels. This trend has become more and more moderate and Frutarom estimates that it came to an end during Q4 this year.
d. A decrease in the trade and marketing activity in Israel (an activity which is not one
of Frutarom's core activities) which partly results from focusing on products with higher margins, contributed approximately 1.3% to the decline in sales.
On the other hand, the merger of Oxford which was acquired and consolidated as from
February 1, 2009, the merger of the activities of FSI which was acquired and consolidated as from March 4, 2009, and the merger of CH's Savory activities in Germany which was acquired and consolidated as from June 18, 2009, contributed approximately US$ 25.3 M to Frutarom's sales during the year.
Sales Breakdown by Fields of Activity in the years 2000-2009 (US$ M and %)
2009 2008 2007 2006 2005 2004 2003 2002 2001 2000
297.1 339.8 247.7 187.0 150.4 110.9 68.2 45.3 39.1 26.5 Sales
70% 72% 67% 65% 62% 56% 49% 42% 39% 33% %
Flavors
Segment
123.8 124.3 115.0 98.4 89.8 81.7 67.0 57.7 57.5 49.0 Sales
29% 26% 31% 34% 37% 41% 48% 54% 57% 61% %
Fine
Ingredients
Segment
7.1 13.2 10.5 6.7 6.3 6.8 6.5 6.2 5.6 6.3 Sales
2% 3% 3% 2% 3% 4% 5% 6% 6% 8% %
Trade &
Marketing
-2.8 4.0- -4.9 -4.9 2.7- -2.6 2.3- 1.7- -1.2 -1.3 Sales
-1% -1% 1%- 2%- 1%- -1% -2% -2% -1% 2%- %
Inter
Segments
425.2 473.3 368.3 287.2 243.8 196.8 139.3 107.5 101.0 80.5 Total sales

9
The following is a summary of the profit and loss report for 2009 (US$ M):
2008 2009 Change
(%)
Sales 473.3 425.2 -10.2%
Gross profit 176.3 155.5 -11.8%
R&D, Selling, Administration, General and Other income 119.7 108.2 -9.6%
Operating profit 56.6 47.3 -16.5%
EBITDA 76.3 66.2 -13.3%
Profit before tax 46.1 42.9 -6.8%
Net profit 37.2 33.2 -10.8%
Breakdown of sales by geographic regions The following is a table detailing the Company's sales in 2007, 2008 and 2009 by
geographic regions (US$ M):
2007 2008 2009
(%) of total sales in
2009
EMEA 254.1 333.2 298.7 70.3%
America 45.9 52.5 49.7 11.7%
Israel* 40.5 52.8 37.1 8.7%
Asia and the Far East 27.8 34.8 39.7 9.3%
Total 368.3 473.3 425.2 100%
* The sales in Israel include the trade and marketing activity in Israel (an activity which
is not one of Frutarom's core activities) in the amounts of US$10.5M, US$13.2M and US$7.1M in 2007-2009 respectively.
The Company's sales are mainly from EMEA (Europe, Middle East and Africa), Israel, America, Asia and the Far East. In 2009, 70.3% of the Company's sales originated in EMEA (the sales originated in EMEA decreased by 10.3% in 2009 compared to 2008. The decrease in sales resulted mainly due to the strengthening of the US$ against the European currencies during 2009), 11.7% of the Company's sales originated in America (the sales originated in America decreased by 5.3% in 2009 compared to 2008), 8.7% of the Company's sales originated in Israel (the sales originated in Israel decreased by

10
29.8% in 2009 compared to 20081), and 9.3% of the Company's sales originated in Asia and the Far East (the sales originated in Asia and the Far East increased by 14.0% in 2009 compared to 2008). As part of its strategy, Frutarom intends to act toward increasing sales in all territories, both thorough organic growth and through strategic acquisitions, with special emphasis on the US, Central and South America, Asia and the Far East.
Gross profit The gross profit for 2009 reached the amount of US$155.5M compared to US$176.3M
in 2008, a decline of 11.8%. The decline in gross profit is a result of the decrease in sales. The actions taken by Frutarom to improve its competitiveness and reduce its expenses moderated the effect of the decline in sales on the Company's gross profit and enabled the Company to maintain the gross margin level of 36.6% compared to 37.2% in 2008.
Selling and Marketing, Research and Development, Administration, General and
Other Expenses In 2009, selling, marketing, research and development, administration, general and
other expenses totaled at US$108.2M (25.5% of sales) compared to US$119.7M in 2008 (25.3% of sales). The expense level was affected by steps taken by Frutarom's Management to reduce and improve efficiency and by the strengthening of the US$ against the European currencies and the NIS. In spite of the acquisitions implemented during 2009, Frutarom succeeded in reducing the expense level compared to 2008.
During the year, the expenses included non-recurring costs for a restructuring plan of
the Company's activities in Germany, mainly as a result of the acquisition of CH's Savory activities and due to a restructuring plan of the Company's activities in UK as a result of the acquisition of Oxford – at a total amount of approximately US$1.4M.
Operating Profit and EBITDA
Excluding non-recurring expenses in 2009, as mentioned above, the operating profit in 2009 totaled at US$48.7M compared to US$56.6M in 2008 and the operating margin reached 11.4% compared to 12.0% in the same period. Including the aforementioned non-recurring effects, the operating profit in 2009 totaled US$47.3M and the operating margin reached 11.1%.
Excluding the aforementioned non-recurring effects, EBITDA achieved by Frutarom in 2009 reached US$67.6M, which are 15.9% of sales, compared to US$ 76.3 M in of 2008 which were 16.1% of sales. Including the non-recurring effects, the EBITDA achieved by Frutarom 2009 reached US$ 66.2 M, representing 15.6% of sales.
1 The sales originated from Israel were influenced by the reduction in the trade and marketing
activity in Israel (an activity which is not one of Frutarom's core activities) which decreased from US$13.2M in 2008 to US$7.1M in 2009.

11
In addition to the non-recurring effects, the operating profit and EBITDA were affected
by the strengthening of the US$ against the European currencies, at a rate of approximately 7.5%, resulting in a decrease, in US$ terms, of the profits and sales in Europe (which constitute as 70% of Frutarom's activities).
Finance Expenses / Income
In 2009, finance expenses totaled US$4.3M (1.0% of sales), out of which US$3.8M resulted from interest payments recorded for loans taken to finance the acquisitions implemented by the Company during 2007 and 2009. The finance expenses in the amount of US$0.5M were recorded as a result of rate differences due to the strengthening of the US$, mainly against the European currencies, the NIS and currencies of a number of the emerging markets in which Frutarom operates. In 2008 finance expenses totaled US$10.6M (2.2% of sales) out of which US$8.4M were for interest payments and US$2.1M for rate differences. The decline in finance expenses during 2009 compared to 2008 results from the decline in the level of loans (to which contributed the strong positive cash flow achieved by the Company in spite of the acquisitions implemented in 2009), the decline in interest rates and the weakening of the European currencies, in which most of the loans were taken, compared to the US$.
Profit before Tax
In 2009, profit before tax totaled US$42.9M (10.1% of sales) compared to US$46.1M (9.7% of sales) in 2008. Excluding non-recurring expenses, the profit before tax in 2009 totaled at US$44.3M (10.4% of the sales), compared to US$46.1M in 2008 (9.7% of the sales).
Taxes on Income
In 2009, taxes on income totaled US$9.7M (22.6% of profit before tax) compared to US$8.8M in 2008 (19.2% of profit before tax). In 2008, the Company recorded tax income of US$2.3M for closing tax assessments from previous years. During 2009 the Company recorded tax income of US$0.86M for closing tax assessments from previous years.
Net Profit
Excluding non-recurring expenses in 2009, the net profit in 2009 totaled at US$33.4M (7.8% of sales), compared to US$34.9M in 2008 (7.4% of sales). Net profit in 2009, including non-recurring expenses, reached US$33.2M compared to US$37.2M in 2008. In 2009, the Company maintained a similar level of net margin which reached 7.8% (7.9% in 2008).
Net profit has also been affected by the strengthening of the US$ against the European currencies, resulting in a decrease, in US$ terms, of the profit and sales in Europe (which constitute 70% of Frutarom's activities).
Liquidity In 2009, the company produced a record cash flow from ongoing operations, totaled at US$84.9M compared to US$37.0M in 2008.

12
Profit per share
In 2009, profit per share totaled US$ 0.58 compared to US$0.65 per share in 2008. E. FINANCIAL STATUS Total assets on December 31, 2009 totaled US$526.1M compared to US$510.8M on
December 31, 2008. On December 31, 2009, the Company’s current assets totaled US$203.6M compared to
US$214.5M on December 31, 2008. On December 31, 2009, net fixed assets excluding accumulated depreciation and other
assets, totaled US$317.3M compared to US$291.8M on December 31, 2008. The major part of the increase is a result of the merger of the three activities acquired during 2009.
F. LIQUIDITY In 2009, the Company generated a net positive record cash flow from operating activities
which reached US$84.9M compared to US$37.0M in 2008. The strong cash flow enabled the reduction of the amount of Frutarom's bank debt in spite of the three acquisitions implemented by it this year and will enable it, jointly with support from leading banks, to further implement additional strategic acquisitions in the future.
During Q4 2009, the trend of improvement in cash flow from operating activities
continued and reached US$27.0M compared to a cash flow of US$15.8M achieved during Q4 2008.
G. SOURCES OF FINANCE
Sources of the Company's Shareholders’ Equity The Company’s shareholders’ equity at December 31, 2009 totaled US$318.5M (60.5%
of the balance sheet) compared to US$278.3M (54.5% of the balance sheet) at December 31, 2008. Most of the increase in shareholders’ equity resulted from the profit achieved during the period (US$33.2M) and from the change in the US$ exchange rate compared to other currencies which are the main currency of activity of autonomic subsidiaries, which affected the equity fund from translation differences (US$ 8.2M) and increased the balance of the shareholders' equity. This item does not have any effect the profit and loss and cash flow.
On May 5, 2009, the Company issued 40,000 ordinary shares of NIS 1 par value each
resulting from the exercise of options granted to a senior officeholder in the Company in 2005. The exercise consideration totaled NIS 434,800 (US$ 0.105M). Following this exercise, the Company's issued and paid up share capital is NIS 57,826,357.

13
On March 18, 2009, the Company's Board of Directors decided on a distribution of a cash dividend in the amount of NIS 0.18 per share and in the total amount of NIS10.4 M. On May 6, 2009 the dividend was paid to the shareholders.
Long Term Loans Including Current Maturities of Long Term Loans (Average) The long-term credit from banks provided to the Company in 2009 totaled US$130.2M
compared to US$137.6M in 2008 and - in Q4 2009 - US$122.5M compared to US$141.2M in Q4 2008.
Short Term Loans Excluding Current Maturities of Long Term Loans (Average)
Short-term credit from banks provided to the Company in 2009 totaled US$10.4M
compared to US$12.3M in 2008, and in Q4 2009 – US$ 3.1 M compared to US$ 0.8 M in 2008.
The following are loans from banks and the forecast for their repayment (the amounts in
the table are in US$ thousands):
As detailed in this report with respect to the Company's financial status, its liquidity, the
positive cash flow it generates from its current activities and its sources of finance, and subject to the fact that there will not be a material adverse change in sales and or in its profitability, the Company estimates that the cash flow it generates from current activities will enable the full repayment of its expected liabilities without the need for external sources of finance.
Loan
NIS
linked to
the CPI
NIS not
linked to
the CPI
Euro US dollar Pound sterling Swiss
Franc other
Interest
Payments
Total
First year 0 1,325 30,631 6,208 5,723 3,011 13 1,917 48,828
Second year
0 1,325 24,296 875 5,723 0 5 992 33,215
Third year
0 662 22,100 875 10,830 0 5 405 34,878
Fourth year
0 0 0 3,500 0 0 8 15 3,523
Fifth year and thereafter
0 0 0 0 0 0 0 0 0
Total 0 3,312 77,027 11,458 22,276 3,011 31 3,329 120,444

14
Credit from Suppliers and to Customers (Average) During 2009 the average amount of credit from suppliers and other creditors was
US$56.6M (compared to US$94.9M during 2008). During 2009, the Company granted credit of US$72.2M to its customers (compared to US$86.6M during 2008).
H. SENIOR OFFICEHOLDERS RENUMERATION The Company's Board of Directors decides once a year, in accordance with the
recommendations of the Compensation Committee, on salary updates and granting a bonus to senior officeholders in the Company in accordance with the Company's performance in the last year. While deciding upon the salary updates and the annual bonus, the Board of Directors and the Compensation Committee take into account the Company's business and financial performance, the profit and the rate of profitability achieved by the Company, the growth rates achieved by the Company and the personal contribution of the managers to these achievements. In the opinion of the Company's Board of Directors, the remuneration granted to senior officeholders as detailed in Regulation 21, Chapter 4, of this report, are fair and reasonable while taking into account the Company's size and complexity, its business achievements in recent years, the assignments and the scope of responsibility of the officeholders and their contribution to its achievements. While deciding on the salary updates for 2010 and the bonus for 2009, the Board of Directors took into account, in particular, the effects of the global economic crisis on the Company and the results of its activity and the determined actions taken by the Company's Management in order to cope with the effects of the crisis and the good results achieved by the Company in 2009 in spite of the crisis.
I. SUMMARU OF THE SENSITIVITY TESTS TABLES
Sensitivity to Changes in the US Dollar- Israeli Shekel Exchange Rate
Sensitivity to Changes in the US Dollar-Pound Sterling Exchange Rate
Profit (Loss) from changes Fair value Profit (Loss) from changes
% of change +10% +5% - -5% -10%
Exchange rate 4.153 3.964 3.775 3.586 3.398
US$ 000
Total Exposure net (418) (209) 4,178 209 418
Profit (Loss) from changes Fair value Profit (Loss) from changes
% of change +10% +5% - -5% -10%
Exchange rate 0.679 0.649 0.618 0.587 0.556
US$ 000
Total Exposure net 2,233 1,116 (22,329) (1,116) (2,233)

15
Sensitivity to Changes in the US Dollar-Euro Exchange Rate
Sensitivity to Changes in the US Dollar-Swiss Franc Exchange Rate
Sensitivity to Changes in the US Dollar-Other Currencies Exchange Rate
The functional currency of most of the Group's companies is the local currency, and
therefore the currency translations of balance sheet balances, of these companies, do not influence the Company’s profit and loss and are directly attributed to the Company's shareholders' equity under the currency translation capital fund.
Sensitivity to Changes in Interest Rate on Fixed Rate Loans – Fair Value Risk Profit (Loss) from changes Fair value Profit (Loss) from changes
% of change +10% +5% - -5% -10%
US$ 000
Total exposure, net 21 11 6,194 (11) (21)
Profit (Loss) from changes Fair value Profit (Loss) from changes
% of change +10% +5% - -5% -10%
Exchange rate 0.763 0.728 0.694 0.659 0.624
US$ 000
Total exposure, net 6,333 3,167 (63,333) (3,167) (6,333)
Profit (Loss) from changes Fair value Profit (Loss) from changes
% of change +10% +5% - -5% -10%
Exchange rate 1.132 1.081 1.029 0.978 0.926
US$ 000
Total exposure, net 11 6 (112) (6) (11)
Profit (Loss) from changes Fair value Profit (Loss) from changes
% of change +10% +5% - -5% -10%
US$ 000
Total exposure, net (665) (331) 6,648 331 665

16
EXPOSURE TO MARKET RISKS AND THEIR MANAGEMENT
The Company's activity is characterized by significant dispersal. Through its two operational Segments, the Company produces thousands of products intended for thousands of customers throughout the world, using thousands of raw materials purchased from a wide range of suppliers worldwide. The Company is not significantly dependent on any one of its customers, products or suppliers.
A. RESPONSIBILITY FOR MARKET RISK MANAGEMENT Mr. Alon Granot, Executive Vice President and CFO, is responsible for managing market
risk. The Company's Management and Board of Directors are updated on material changes in the Company's exposure to various risks, and conduct discussions as needed.
For details about Mr. Alon Granot, please see Regulation 26a in Chapter D to the
Periodic Report.
B. DESCRIPTION OF MARKET RISKS Raw material price risks The Company is dependent on the supply of raw materials from third parties. Although
the Company purchases raw materials from a very wide range of suppliers, with no single supplier representing more than 5% of its total raw material purchases, and although most raw materials purchased by the Company have more than one supplier and are for the most part widely available, there can be no guarantee that this will continue to be the case. Furthermore, the price, quality and availability of the principal raw materials used by Company mainly in the natural products field are subject to fluctuations as a result of international supply and demand. Certain natural raw materials used by the Company are crop related, and their price, quality and availability could, among others, be adversely affected by unfavorable weather conditions. The Company does not normally make forward transactions and is exposed to price fluctuations in the raw materials it uses in accordance with global price trends. The Company’s Purchasing Department maintains an ongoing follow up on raw materials prices.
Currency Risks
The Company’s sales worldwide are conducted mainly in Euro, US dollars, Swiss francs, Pounds sterling, and NIS. The fact that raw materials purchases for Frutarom’s production are also conducted in various currencies reduces currency exposure. Most of the non dollar monetary balances derive from the local activity of the subsidiaries in Europe and in Israel. The functional currency of these companies is the local currency, and therefore the currency translations of these balances do not influence the Company’s finance expenses and are directly attributed to a currency translation capital fund.

17
Currency exposure is reviewed as needed, on at least a quarterly basis. The Company does not generally take external hedging actions nor does it use other financial instruments for protection against currency fluctuations.
Interest Risks
To the extent they are required, the Company’s sources of bank finance, short and long term, are linked to the Euro, US dollar, the Swiss franc, GBP, the NIS (according to the activity in which the subsidiary is active) and bear variable Libor interest. The Company’s policy is to not take protective steps against possible interest rises. As of the date of the balance sheet the Company did not hold any financial instruments, the Company had long term loans in an overall amount of US$70.2M and the scope of its short-term debt was approximately US$46.9M. The Company has cash flow reserves of approximately US$ 42.9 M effective as of December 31, 2009.
c. THE COMPANY'S POLICY REGARDING RISK MANAGEMENT
1. The Company attempts to reduce currency exposure, whether economic or accounting, by balancing liabilities and assets in each of the various currencies in which the Group operates.
2. The Executive Vice President and CFO is responsible for the management of the currency exposure in the Company. The Company’s policy does not determine any limit in terms of quantity for the exposure described above. The exposure level is checked on a regular basis by the Company’s Accounting Department and discussed in the Company's management.
3. Ongoing follow up is conducted in the raw materials area. Unusual occurrences, such as acute devaluation trends in a target country or price change trends in important raw materials that may influence the Company’s activity, are discussed by the Board of Directors. The Company did not use financial instruments or other instruments in order to protect the market risks to which it is exposed.
In 2009, there were no changes to the risk management policy.
D. SUPERVISION OF RISK MANAGEMENT POLICY AND ITS IMPLEMENTATION
Discussions are conducted by the Company’s management once a quarter on
implementing the risk management policy as related to currency exposure and interest. The Vice President and CFO reports to the Board of Directors on the exposure every year. Exposure to raw material prices is examined by the Purchasing Department and the Management of the Segments on a regular basis, and the Board of Directors receives reports as the situation warrants. In 2009, there were no deviations from the planned policy.

18
E. LINKAGE BASES REPORT AT DECEMBER 31, 2009 (IN US$ 000)
US$ NIS GBP Euro CHF Others Total
Assets
Cash and Equivalents 14,686 4,672 3,477 13,060 4,872 2,173 42,940
Customers 14,146 9,393 4,877 24,812 5,924 6,042 65,194
Other Debtors 4,944 5,296 1,056 2,454 1,979 669 16,398
Inventory 27,479 - 8,805 22,614 17,748 2,467 79,113
Other long term debtors 4,833 - - 138 - 239 5,210
Fixed assets, net 30,701 - 9,901 30,672 53,408 1,431 126,113
Other assets, net 28,528 - 27,360 129,304 5,953 - 191,145
Total Assets 125,317 19,361 55,476 223,054 89,884 13,021 526,113
Liabilities
Bank loans 11,458 3,312 22,276 77,027 3,011 31 117,115
Suppliers 4,332 6,725 2,835 10,519 3,034 845 28,290
Other creditors 3,819 5,146 6,066 5,213 4,880 1,071 26,195 Employee retirement rights liabilities 67 - - 10,108 1,320 110 11,605
Deferred taxes 5,174 - 4,089 8,762 6,408 - 24,433
Other long term liabilities - - - - - - -
Total Liabilities 24,850 15,183 35,266 111,629 18,653 2,057 207,638
Shareholders’ Equity 318,475
Net Assets (Liabilities) 100,467 4,178 20,210 111,425 71,231 10,964 -

19
F. SENSITIVITY TESTS
Sensitivity to Changes in the US Dollar- Israeli Shekel Exchange Rate
Sensitivity to Changes in the US Dollar-Pound Sterling Exchange Rate
Profit (Loss) from changes Fair value Profit (Loss) from changes
% of change +10% +5% - -5% -10%
Exchange rate 4.153 3.964 3.775 3.586 3.398
US$ 000
Cash and Equivalents (467) (234) 4,672 234 467 Customers (939) (470) 9,393 470 939 Other Debtors (530) (265) 5,296 265 530
(1,936) (968) 19,361 968 1,936
Bank Loans 331 166 3,312 (166) (331) Suppliers and Service providers 673 336 6,725 (336) (673) Other creditors 515 257 5,146 (257) (515)
Total exposure, net 1,518 759 15,183 (759) (1,518)
נטו, סך חשיפה (418) (209) 4,178 209 418
Profit (Loss) from changes Fair value Profit (Loss) from changes
% of change +10% +5% - -5% -10%
Exchange rate 0.679 0.649 0.618 0.587 0.556
US$ 000
Cash and Equivalents (348) (174) 3,477 174 348 Customers (488) (244) 4,877 244 488 Other Debtors (49) (25) 494 25 49
(885) (442) 8,848 442 885
Bank Loans 2,228 1,114 22,276 (1,114) (2,228) Suppliers and Service providers 284 142 2,835 (142) (284) Other creditors 607 303 6,066 (303) (607)
Total exposure, net 3,118 1,559 31,177 (1,559) (3,118)
נטו, סך חשיפה 2,233 1,116 (22,329) (1,116) (2,233)

20
Sensitivity to Changes in the US Dollar-Euro Exchange Rate
Sensitivity to Changes in the US Dollar-Swiss Franc Exchange Rate
Profit (Loss) from changes Fair value Profit (Loss) from changes
% of change +10% +5% - -5% -10%
Exchange rate 0.763 0.728 0.694 0.659 0.624
US$ 000
Cash and Equivalents (1,302) (651) 13,016 651 1,302
Short term investments (4) (2) 44 2 4
Customers (2,481) (1,241) 24,812 1,241 2,481
Other Debtors (166) (83) 1,662 83 166
(3,953) (1,977) 39,534 1,977 3,953
Credit from banks 7,703 3,851 77,027 (3,851) (7,703)
Suppliers and Service providers 1,052 526 10,519 (526) (1,052)
Other creditors 521 261 5,213 (261) (521)
Employee retirement rights liabilities
1,011 505 10,108 (505) (1,011)
10,287 5,143 102,867 (5,143) (10,287)
Total exposure, net 6,333 3,167 (63,333) (3,167) (6,333)
Profit (Loss) from changes Fair value Profit (Loss) from changes
% of change +10% +5% - -5% -10%
Exchange rate 1.132 1.081 1.029 0.978 0.926
US$ 000
Cash and Equivalents (487) (244) 4,872 244 487 Customers (592) (296) 5,924 296 592 Other Debtors (134) (67) 1,337 67 134
(1,213) (607) 12,133 607 1,213
Credit from Banks 301 151 3,011 (151) (301) Suppliers and Service providers 303 152 3,034 (152) (303) Other creditors 488 244 4,880 (244) (488) Employee retirement rights liabilities
132 66 1,320 (66) (132)
1,225 612 12,245 (612) (1,225)
Total exposure, net 11 6 (112) (6) (11)

21
Sensitivity to Changes in the US Dollar-Other Currencies Exchange Rate
Sensitivity to Changes in Interest Rate on Fixed Rate Loans – Fair Value Risk Profit (Loss) from changes Fair value Profit (Loss) from changes
% of change +10% +5% - -5% -10%
US$ 000
Long Term Loans (Euro) 21 11 3,183 (11) (21)
Long Term Loans (CHF) - - 3,011 - -
Total exposure, net 21 11 6,194 (11) (21)
Profit (Loss) from changes Fair value Profit (Loss) from changes
% of change +10% +5% - -5% -10%
US$ 000
Cash and Equivalents (217) (109) 2,173 109 217 Customers (604) (302) 6,042 302 604 Other Debtors (49) (25) 490 25 49
(871) (435) 8,705 435 871
Credit from Banks 3 2 31 (2) (3) Suppliers and Service providers 85 42 845 (42) (85) Other creditors 107 54 1,071 (54) (107) Employee retirement rights liabilities
11 6 110 (6) (11)
206 104 2,057 (104) (206)
Total exposure, net (665) (331) 6,648 331 665

22
CORPORATE GOVERNANCE ASPECTS
A. THE CORPORATION'S POLICY OF DONATIONS The Corporation did not decide on a policy with respect to the granting of donations.
B. DIRECTORS WITH ACCOUNTING AND FINANCIAL EXPERTISE AND INDEPENDENT DIRECTORS
Directors with Accounting and Financial Expertise The Company's Board of Directors has determined that the minimum number of
directors with accounting and financial expertise will be set at two. This number takes into account the character of the Company's activity, its complexity and size. The Board believes that this minimum number will enable it to meet its obligations according to law and the Company's Articles of Association, and especially relating to its responsibility to check the Company's financial status and to prepare and approve the financial reports.
The directors with accounting and financial expertise are:
• Dr. John Farber – Dr. Farber has served as Chairman and as a member of the
board of directors of Frutarom since 1996. He is also Chairman of ICC Industries Inc., the Company’s major shareholder, and a member of the boards of directors of various subsidiaries of ICC Industries Inc. Dr. Farber holds a Ph.D. from the Polytechnic Institute of Brooklyn, New York.
• Mr. John Oram – Mr. Oram has served as a member of the board of directors of
Frutarom since 1996. Mr. Oram, a fellow of the Institute of Chartered Accountants in England and Wales, qualified in 1967. Mr. Oram served as the President of ICC Industries Inc., the Company’s major shareholder, until April 2008.
• Mr. Hans Abderhalden – Mr. Abderhalden has served as a director on the board of
directors of Frutarom since December 2004. In addition, Mr. Abderhalden has also served as director on the board of directors of Frutarom Switzerland since 2002. Mr. Abderhalden possesses 25 years of experience in the flavor and fragrance industry. From 2000 through 2002 Mr. Abderhalden served as president and chief executive officer of Emil Flachsmann AG, which was acquired by Frutarom in 2003. Prior to that, Mr. Abderhalden worked for Givaudan for a period of 18 years, including as president of the global flavors division.
• Mr. Yacov Elinav – Mr. Elinav has served as an external director on the board of
directors of Frutarom since February 2008. Mr. Elinav has served since 2004 as chairman of the board of directors of Dash Securities and Investments Ltd. and until 2003 served as vice president of Bank HaPoalim Ltd. Mr. Elinav serves as a director in the following companies: Yellow Pages Ltd.; The Bank for Industrial

23
Development Ltd.; Ayalon Highways Ltd.; Delek Real Estate Ltd.; Yovalim Pension Funds management Ltd.; Elinav Consultation and Services Ltd.; New Kopel Ltd.; Middle East Pipes Ltd.; Tefron Ltd.; Dash Securities and Investments Ltd.; Dash Provident Funds Ltd.; Dash Institutionals Ltd.; Sapiens Ltd.; B.G. Group Ltd.; Polar Communication Ltd., The Phoenix Platinum C.A. Ltd.; Global Box Ltd, Mr. Elinav holds a bachelor's degree in economics.
• Mr. Isaac Angel – Mr. Angel has served as an external director on the board of
directors of Frutarom since February 2008. Until 2006, Mr. Angel served as general manager and president of Lipman Electronic Engineering Ltd and as a senior Vice President in Verifone Inc.
Independent Directors Effective on the date of this report, the Company did not adopt in its Articles of
Association the Instruction with Respect to the ratio of Independent Directors (as such is term is defined in the Companies Law – 1999).
C. DETAILS ABOUT THE CORPORATION'S INTERNAL AUDITOR The Company's Internal Auditor Mr. Yoav Barak, CPA, was appointed Internal Auditor of the Company and began his
work as internal auditor on January 17, 2005. The Internal Auditor complies with the Directives of Section 146(b) of the Companies' Law 1999 and with the Directives of Section 8 to the Internal Audit Law, 1992.
To the Company's best knowledge, the Internal Auditor does hold shares of the
Company. The Internal Auditor is not an employee of the Company, but provides the auditing
services as an external contractor. The Internal Auditor serves as a senior officeholder in the Corporation by the power of the law. The internal auditor does not fill other positions in the Company or provided additional external services.
Appointment Method The appointment of the internal auditor was approved by the Board of Directors of the
Company on January 17, 2005 based on the recommendation of the Audit Committee. The appointment was approved by the Board of Directors of the Company after reviewing his education (CPA and economist), and his experience in the field of internal auditing and in various managerial positions as internal auditor. The Board of Directors of the Company found the internal auditor to be suitable to fill his position in view of the Company's size, scope of activity and level of complexity.

24
The Internal Auditor's Supervisor The internal auditor reports to the Audit Committee of the Board of Directors of the
Company and the president of the Company.
Audit Program The audit program is an annual and multi-year program prepared by the internal auditor
in coordination with the president of the Company and its management, and approved by the Audit Committee of the Board of Directors of the Company. The considerations directing the program's preparation are based on subjects perceived as worthy of thorough analysis, according to their risk level, with the aim of locating faults, achieving efficiencies, and ensuring that the Company's assets are protected and the Company's procedures and the local laws of the countries of operation are observed. The annual audit program also includes follow up on the implementation of recommendations by the internal auditor and the Audit Committee by the Company's management. The Internal Auditor has independent discretion to deviate from the approved audit program, subject to consulting with the Company's President. The audit is carried out in accordance with the annual and multi-year audit programs and is updated as needed and as indicated by the findings of the audit. The audit is carried out through questionnaires and physical audits at the sites of the Company and related companies in Israel and throughout the world. Some of the audit subjects are checked throughout the Group, while others are specific subjects audited according to the annual program.
Auditing Outside of Israel or of Related Companies
The annual audit program also encompasses significant undertakings of the Company.
The internal auditor conducts at least one audit each year in each significant subsidiary.
Scope of the Internal Auditor's Position The scope of the internal auditor's position in the Company is adjusted to the Company's
rate of expansion and growth. The internal auditor is employed at a capacity of two and a half to three working days per week.
Number of hours invested in
internal auditing in the
Company
Number of hours invested in
internal auditing in related
companies
Activity in Israel 335 0 Activity outside of Israel 0 865
The scope and level of complexity of the Company’s activity were taken into account in
determining the internal auditor’s scope of employment. In 2009, the internal auditor’s scope of employment (1,200 man-hour in total) was higher
than his scope of employment in 2008 (1,045 man-hour in total), also due to increasing the number of audits due to the global economic crisis.

25
Performing the Audit As the Internal Auditor reported to the Company, the work of internal auditing is
conducted according to professional standards accepted in Israel and the world, including the professional standards of the Israel Internal Auditors Board, that ensure professional, reliable and independent control. The audit reports record the findings of the audit and the documented facts.
Free Access for the Internal Auditor The internal auditor has free and independent access to the Company's information
systems, including those of the related companies, whether ordinary or computerized, to all data bases and to all programs for automatic data processing of the Company and its related companies, including financial data. The internal auditor is entitled to enter any and all assets of the Company, including its related companies, and check them.
The Internal Auditor’s Accountability Audit reports are prepared and submitted in writing by the internal auditor to the Audit
Committee and to the members of the Company’s management. During 2009, two meetings were held, on January 26, 2009 and on August 26, 2009, at
which 9 audit reports were discussed and 2 audit letters from the Company's CPA. The president of the Company, the Executive Vice President and CFO, the Vice President for the Supply Chain, the Vice President Finance and the members of the Audit Committee received the audit reports and were present at all of the Audit Committee's meetings. The managers of the activities were present at the Committee's meetings when the audit reports related to their activity were reviewed.
Assessment by the Board of Directors of the Company of the Internal Auditor’s
Activity In the opinion of the Board of Directors of the Company, the scope, character and
continuity of the internal auditor’s activity and work program are reasonable under the circumstances and fulfill the internal audit goals of the Company.
The internal auditor’s compensation in 2009 was NIS 336,000. The Company does not
believe that this compensation would affect the professional considerations of the internal auditor. The payment entitled to the Internal Auditor is not contingent on the results of the Auditor's work.

26
D. DETAILS ABOUT THE EXTERNAL AUDITOR OF THE COMPANY The Auditor of the Company and of its material subsidiaries abroad is
PricewaterhouseCoopers. The subsidiaries which are non-material and which are audited by local accountants, constitute 10% of Company's total assets and their income constitute 12% of the total integrated income of the Company.
The fees paid by the Company to its Certified Public Accountant are as detailed below: 1. Total fee for audit services, for services related to audit and for tax services totaled
US$ 781 K in 2009 (compared to US$ 908 K in 2008) in Israel and in the subsidiaries abroad (10,417 hours in 2009 compared to 10,316 hours in 2008). The amount paid for tax services does not exceed 45% of the total fees detailed in this paragraph.
2. Other fees for additional services - the overall fees for services provided by the
Auditor which are not included in Paragraph 1 above totaled US$280K in 2009 (compared to US$ 282 K in 2008) in Israel and its subsidiaries abroad.
The Company's general meeting approved the appointment of the Auditor for 2009 and
authorized the Company's Board of Directors to determine its fees.
E. DISCLOSURE REGARDING THE APPROVAL PROCESS OF THE FINANCIAL REPORTS
The Company's financial reports are submitted for approval to the Board of Directors,
the organ in charge of the Company's ultimate supervision. The Board of the Company has six members, of whom five have accounting and financial expertise. The members of the Board receive the draft financial reports, the directors' report and the managerial report of the Company's management several days before the date of the Board meeting at which the reports are brought for their approval. The Company's auditors and members of the Company's senior management, including the president and CEO and executive vice presidents and CFO, are also invited to attend the meeting. The internal auditor of the Company is also present at this meeting. During the meeting, the president and CEO and the executive vice president – CFO present the financial results of the Company for the relevant period, in comparison to previous periods and with emphasis on special events that occurred during the period. During the presentation of the financial results of the Company, the Company's management answers questions and relates to the directors' comments. Following presentation of the Company's financial results, the Company's auditors answer any questions the directors may have. Finally, the Board votes on whether or not to approve the financial reports and the directors report and submit them to the securities authorities and stock exchanges. All of the members of the Board of Directors were present at the Board meeting held on March 16, 2010, when the reports were approved. All of the directors present voted in favor of approving the reports.

27
F. THE EFFECTIVENESS OF THE INTERNAL AUDIT On December 24, 2009, the Securities Regulations (Periodic and Immediate
Reports) (Amendment), 2009 ("The Regulations") were published, according to which corporations will be required to attach to their periodic reports an annual report regarding the evaluation of the effectiveness of the internal audit by the Board of Directors and Management. In accordance with Regulation 8 to the Regulations, the Company is required to disclose in this report the actions it has taken up to the report's date with respect to the stages of the Corporation's organization and progress in implementing the Regulations.
The Company decided on an organization plan with respect to the implementation of
the Regulations. The plan is based on mapping processes which, in the Company's opinion, are extremely material to the financial reporting and the disclosure, and on evaluating the relevant risk factors which, in the Company's opinion, relate to the financial reporting and the disclosure. The evaluation of the material risk factors by the Company are based on:
1. Materiality of the balance quantity-wise; 2. Scope of activities; 3. Complexity of the accounting principles applied on the balance or on the
disclosure; 4. The extent of exercising discretion during the decision making processes and
with respect to the recognition and measurement of the reporting and disclosure items;
5. Feasibility of the existence of errors (including errors in previous periods of
report), deceits and embezzlements; 6. Ability and quality of the information technology systems affecting the balance; 7. The complexity of the disclosure and the financial reporting and the extent in
which the organs engaged in reporting and disclosure have the necessary skills. The person responsible to the implementation of the project in the Company is Guy
Gill, VP Finance. Under the project, in addition to the processes required in accordance with the
Regulations, the Company will evaluate the effectiveness of the internal audit in the following fields:
1. Purchasing, consumption, and inventory cycles;

28
2. Sales' cycle. The processes required in accordance with the regulations are:
1. Process of completing the financial reports; 2. Information Technology General Control 3. Entity Level Control.
As of the date of the this report, the Company has completed the mapping of the material processes
DISCLOSURE RELATING TO THE CORPORATE'S FINANCIAL
REPRORTING
A. EVENTS FOLLOWING THE BALANCE SHEET DATE On March 16, 2010, upon the approval of the financial statements, the Company's Board
of Directors decided on the distribution of a cash dividend in the amount of NIS 0.18 per share and in a total amount of NIS10,401M.
B. CRITICAL ACCOUNTING ESTIMATIONS Preparation of the financial reports of the Company in accordance with IFRS demands
the use of critical accounting estimates, which obliges the management of the Company to use its judgment in the process of implementing the general accounting policies of the Company, to prepare estimates and make assumptions that influence the amounts presented in the attached financial reports.
Below are the critical accounting estimations used in preparing the financial reports of
the Company; during their implementation, management was required to make assumptions regarding circumstances and events involving significant uncertainty. In using its discretion to determine these estimates, the management of the Company based itself upon past experience, various facts and on reasonable assumptions in accordance with the suitable circumstances for each estimate. The actual results may be different from management's estimates. Regarding the material accounting estimates used in preparing the financial reports of the Company, refer also to note 4 to the attached financial reports.
Taxes on Income and Deferred Taxes The Company is assessed for tax purposes in numerous jurisdictions; accordingly, the
Company’s management is required to exercise discretion in order to determine the overall provision in respect of taxes on income. The Company records provisions in its books based on its estimates of whether additional taxes will be due. Where the final

29
tax outcome of these matters as determined by the tax authorities is different from the amounts that were initially recorded, such differences will be carried to income and loss in the period in which the final tax assessment is determined by the tax authorities.
The Company also records deferred tax assets and liabilities based on the differences
between the book value of its assets and liabilities and the amounts taken into account for tax purposes. The Company regularly reviews its deferred tax assets for recoverability based on historical taxable income, projected future taxable income, the expected timing of the reversals of existing temporary differences and the implementation of tax planning strategies. If the Company is unable to generate sufficient future taxable income, or if there is a material change in the actual effective tax rates or time period within which the underlying temporary differences become taxable or deductible, the Company could be required to eliminate a portion of the deferred tax asset resulting in an increase in its effective tax rate and an adverse impact on operating results.
Severance Pay
The present value of the Company’s liabilities in respect of severance pay is dependent
on several factors that are determined on an actuarial basis in accordance with various assumptions. The assumptions used in the calculation of the net cost (income) in respect of severance pay include the long term yield rate on the related severance pay funds and the rate of discount. Changes in those assumptions will influence the carrying amount of the assets and liabilities in respect of severance pay. The assumption regarding the expected yield on severance pay funds is determined uniformly in accordance with long term historical yields.
The assumption regarding the required rate of discount is determined by the Company
at the end of each year. This rate of discount shall be used in determining the estimated updated value of the future cash flows that would be required to cover the severance pay liabilities. The market of high quality corporate bonds is not sufficiently liquid to serve as the basis for determining the discount rate. Therefore, in determining this rate the Company uses interest rates applicable to governmental bonds denominated in the currency in which the benefits will be paid and that have terms to maturity approximating to the terms of the related liability.
Other key assumptions relating to pension liabilities, such as future payroll raises, are
based on existing rates of payroll inflation.
Provision for Contingent Liabilities Contingent provisions for legal liabilities are recorded in the books in accordance with
the discretion of the Company’s management regarding the likelihood that the cash flows will be used to meet the liabilities, and on the basis of the estimate determined by the management regarding the present value of the expected cash flows that would be required to meet the existing liabilities.

30
Provision for Impairment in Respect of Goodwill and Intangibles Once a year, the Company reviews the need to provide for impairment of goodwill and
intangibles. The need to make such a provision is assessed in relation to the recoverable value of the cash generating units of the Company. The recoverable amount of a cash generating unit is determined in accordance with the assumptions and calculations made by management.
C. EXCLUSION OF THE COMPANY'S SEPARATE FINANCIAL REPORT
UNDER REGULATION 9(C) TO THE REGULATIONS The Company excluded, from the 2009 Annual Report, a separate financial report as
set forth in Regulation 9C to the Regulations ("The Solo Report") due to the negligibility of the additional information of such report and the fact that the Solo Report will not add any material information (which is not included in the Company's consolidated reports) to the reasonable investor.
The Company decided that the information is negligible as the Company does not
have any commercial activities of any kind whatsoever and therefore the Company's results of operations has hardly any effect on the Groups' profit and loss. The Company does not employ people, it does not have any sales or expenses to third parties excluding part of the expenses of the Board of Directors which are paid by a wholly owned subsidiary (hereinafter: "Frutarom Ltd.") and are attributed thereto (the total of these expenses is reported separately under Note 23 to the consolidated financial statements).
All the Company's revenues (financing income on loans with Frutarom Ltd.,
Management and dividend) arise from Frutarom Ltd. As far as the balance sheet is concerned, excluding advanced payments to the
Income Tax Authority, the Company does not have any balances vis-à-vis third parties. Its only balances are loans and balances vis-à-vis the (wholly owned) companies in the Group and land in the amount of US$ 139 K.
The Company's Management decided, that as long as income from externals or from
companies not wholly owned by the Company are lower than 5% of the total revenues in the consolidated financial statements and as long as the expenses to externals or from companies not wholly owned by the Company are lower than 5% of the total expenses in the consolidated financial statements, the Company's separate financial information as set forth in Regulation 9C to the Regulations is negligible and its absence will not affect the prospects of an investor in the Company's shares to estimate the Company's liquidity prospects and will not add any material information to the reasonable investor.

31
As mentioned above, in 2009, the Company has no revenues and the total expenses of the members of the Board of Directors which is attributed thereto is lower than US$ 100 K.
The management of the Company has also examined the warning signs included in
Regulation 10(14) to the Regulations and decided that they do not exist.
The Board of Directors of the Company held four meetings during 2009. The Board of Directors thanks Frutarom’s employees and management for the Company’s achievements. _____________________ _____________________ Dr. John J. Farber Ori Yehudai Chairman of the Board President & CEO March 16, 2010

Section C
Financial Reports

FRUTAROM INDUSTRIES LTD.
2009 FINANCIAL STATEMENTS

FRUTAROM INDUSTRIES LTD.
2009 FINANCIAL STATEMENTS
TABLE OF CONTENTS
Page
REPORT OF THE AUDITORS 2
CONSOLIDATED FINANCIAL STATEMENTS IN U.S. DOLLARS
Statements of Financial Position 3-4
Income Statements and Statements of Comprehensive Income 5
Statements of Changes in Shareholders’ Equity 6-8
Statements of Cash Flows 9
Notes to Consolidated Financial Statements: 10-89
1. General 10
2. Principal accounting policies 10-28
3. Financial instruments and financial risk management 28-36
4. Critical accounting estimates and assumptions 37-38
5. Business combinations 38-47
6. Segment information 48-52
7. Property, plant and equipment 53-55
8. Intangible assets 56-58
9. Borrowings 59
10. Liability for employee rights upon retirement 60-62
11. Commitments and contingent liabilities 62-65
12. Equity 65-71
13. Taxes on income 71-77
14. Liabilities secured by pledges and restrictions placed in respect of
Liabilities 77-78
15. Accounts receivable 78-79
16. Inventory 79
17. Prepaid expenses in respect of operating lease 80
18. Cash and cash equivalents 80
19. Accounts payable 81
20. Provisions to liabilities and expenses 81
21. Income statement analysis 82-83
22. Cash flow from operations 84
23. Transactions and balances with related parties 85-86
24. Subsequent events 86
25. List of subsidiaries 87-89

Kesselman & Kesselman Certified Public Accountants 1 Nathanson Street Telephone +972-4-8605000 Facsimile +972-4-8605001
2 Kesselman & Kesselman is a member of PricewaterhouseCoopers International Limited, a company limited by guarantee registered in England and Wales.
REPORT OF THE AUDITORS
To the shareholders of
FRUTAROM INDUSTRIES LTD.
We have audited the consolidated statements of financial position of Frutarom Industries Ltd. (hereafter - the Company) as of 31 December 2009, 2008 and 2007 and the related consolidated statements of income, statements of comprehensive income, changes in equity and cash flows for each of the years ended on those dates. These financial statements are the responsibility of the Company's Board of Directors and management. Our responsibility is to express an opinion on these financial statements based on our audits. We did not audit the financial information of certain consolidated companies, whose assets included in consolidation constitute approximately 10%, 3% and 11% of total consolidated assets as of 31 December 2009, 2008 and 2007, and whose revenues included in consolidation constitute approximately 12%, 6%, and 11% of total consolidated revenues for each of the years ended on those dates, respectively. The financial information of the above consolidated companies was audited by other auditors, whose reports have been furnished to us, and our opinion, insofar as it relates to financial information included for these companies, is based on reports of the other auditors. We conducted our audits in accordance with auditing standards generally accepted in Israel, including those prescribed by the Israeli Auditors (Mode of Performance) Regulations, 1973. Those standards require that we plan and perform the audit to obtain reasonable assurance about whether the financial statements are free of material misstatement. An audit includes examining, on a test basis, evidence supporting the amounts and disclosures in the financial statements. An audit also includes assessing the accounting principles used and significant estimates made by the Company's Board of Directors and management, as well as evaluating the overall financial statement presentation. We believe that our audits and the reports of the other auditors provide a reasonable basis for our opinion. In our opinion, based on our audits and the reports of the other auditors, the accompanying financial statements referred to above present fairly, in all material respects, the consolidated financial position of the company and its subsidiaries as of 31 December 2009, 2008 and 2007 and the consolidated results of their operations, changes in equity and their cash flows for each of the years ended on those dates, in accordance with International Financial Reporting Standards (hereafter – IFRS). Haifa, Israel 16 March 2010

3
FRUTAROM INDUSTRIES LTD.
CONSOLIDATED STATEMENTS OF FINANCIAL POSITION
)
Dr. John J. Farber ) Chairman of the Board
)
Ori Yehudai ) President and CEO
) Alon Granot )
Executive Vice President and CFO
Date of approval of the financial statements by the Board of Directors: 16 March 2010.
As of 31 December
Note 2009 2008 2007
U.S. dollars in thousands
A s s e t s
CURRENT ASSETS: Cash and cash equivalents 18 42,940 37,229 31,942 Financial assets at fair value through profit
or loss 52 1,279 Accounts receivable: 15
Trade 65,194 68,204 78,006 Other 13,380 11,573 11,995
Prepaid expenses and advances to suppliers 3,018 2,564 3,637 Inventories 16 79,113 94,916 90,452
203,645 214,538 217,311
NON-CURRENT ASSETS : Property, plant and equipment - net 7 126,113 125,705 135,607 Intangible assets - net 2f;8 191,145 166,083 190,150 Deferred income tax assets 13d 3,653 2,990 3,745 Prepaid expenses in respect of operating lease 17 1,557 1,476 1,898
322,468 296,254 331,400
T o t a l assets 526,113 510,792 548,711

4
As of 31 December
Note 2009 2008 2007
U.S. dollars in thousands
L i a b i l i t i e s a n d S h a r e h o l d e r s ’ E q u i t y
CURRENT LIABILITIES: Credit and short term loans and current
maturities of long-term loans 9 46,911 42,784 44,221 Accounts payable: 19
Trade 28,290 26,705 38,797 Other 25,788 27,801 96,412 Provisions 20 407 1,028 440
101,396 98,318 179,870
NON-CURRENT LIABILITIES: Long-term loans net of current maturities 9 70,204 99,383 82,579 Liability for employee rights upon retirement - net 10 11,605 11,269 11,518 Deferred income taxes 13d 24,433 22,142 22,209 Provisions in respect of other liabilities 5 net of current maturities 1,420 1,420
106,242 134,214 117,726
COMMITMENTS AND CONTINGENT LIABILITIES 11
T o t a l liabilities 207,638 232,532 297,596
SHAREHOLDERS’ EQUITY: 12 Ordinary shares 16,597 16,490 16,466 Capital surplus 96,995 95,802 94,392 Translation differences 2c 18,063 9,836 17,638 Retained earnings 190,237 159,502 125,279 Net of - cost of Company shares held
by subsidiary (3,417) (3,370) (2,660)
T o t a l equity 318,475 278,260 251,115
T o t a l equity and liabilities 526,113 510,792 548,711
The accompanying notes are an integral part of these financial statements.

5
FRUTAROM INDUSTRIES LTD.
CONSOLIDATED INCOME STATEMENTS AND CONSOLIDATED STATEMENTS
OF COMPREHENSIVE INCOME
Year ended 31 December
Note 2009 2008 2007
U.S. dollars in thousands, (except for per share data)
SALES 425,179 473,286 368,261 COST OF SALES 21a 269,677 297,015 237,506
GROSS PROFIT 155,502 176,271 130,755 SELLING AND MARKETING, RESEARCH AND
DEVELOPMENT EXPENSES - net 21b 75,408 85,003 66,898 GENERAL AND ADMINISTRATIVE EXPENSES 21c 33,004 35,206 29,525 OTHER INCOME - net 21d (195) (549) (194)
OPERATING PROFIT 47,285 56,611 34,526 FINANCIAL EXPENSES - net 21e 4,344 10,550 2,923
PROFIT BEFORE TAXES ON INCOME 42,941 46,061 31,603 TAXES ON INCOME 13e 9,721 8,832 7,410
NET INCOME FOR THE YEAR 33,220 37,229 24,193
U.S dollars
EARNINGS PER SHARE: 2w BASIC 0.58 0.65 0.42
FULLY DILUTED 0.58 0.64 0.41
U.S. dollars in thousands
INCOME FOR THE YEAR 33,220 37,229 24,193 OTHER COMPREHENSIVE INCOME - translation differences 8,227 (7,802) 11,922
TOTAL COMPREHENSIVE INCOME FOR THE YEAR
41,447 29,427 36,115
The accompanying notes are an integral part of these financial statements.

6
(Continued) - 1
FRUTAROM INDUSTRIES LTD.
CONSOLIDATED STATEMENTS OF CHANGES IN EQUITY
The accompanying notes are an integral part of these financial statements.
Cost of
company
Ordinary Capital Translation Retained shares held by Total
Note shares surplus differences earnings subsidiary equity
U . S . d o l l a r s i n t h o u s a n d s
BALANCE AT 1 JANUARY 2007 16,434 93,116 5,716 103,658 (1,791) 217,133
Comprehensive income Income for the year - - - 24,193 - 24,193 Translation differences 2c - - 11,922 - - 11,922
Total comprehensive income for the year - - 11,922 24,193 - 36,115 Plan for allotment of Company shares to employees
of subsidiary: 2s Purchase of Company shares by subsidiary - - - - (1,194) (1,194) Receipts in respect of allotment of Company
shares to employees 12c1) - - - - 234 234 Recognition of compensation related to the plan 12c1) - - - - 91 91
Allotment of shares and options to senior employees: 12d;12c3) Receipts in respect of allotment of Company
shares to senior employees 32 167 - - - 199 Recognition of compensation related to employee
stock and option grants - 1,109 - - - 1,109 Dividend paid ,including erosion 12e - - - (2,572) - (2,572)
32 1,276 - (2,572) (869) (2,133)
BALANCE AT 31 DECEMBER 2007 16,466 94,392 17,638 125,279 (2,660) 251,115

7
(Continued) - 2
FRUTAROM INDUSTRIES LTD.
CONSODLIATED STATEMENTS OF CHANGES IN EQUITY
The accompanying notes are an integral part of these financial statements.
Cost of
Share Capital Translation Retained shares held by
Note capital surplus differences earnings subsidiary Total
U . S . d o l l a r s i n t h o u s a n d s
BALANCE AT 1 JANUARY 2008 16,466 94,392 17,638 125,279 (2,660) 251,115
Comprehensive income Income for the year - - - 37,229 - 37,229 Translation differences 2c - - (7,802) - - (7,802)
Total comprehensive income for the year - - (7,802) 37,229 - 29,427 Plan for allotment of Company shares to employees 2r
of subsidiary: Purchase of Company shares by subsidiary - - - - (1,160) (1,160) Receipts in respect of allotment of Company
shares to employees 12c1) - - - - 450 450 Allotment of shares and options to senior employees: 12d;12c3)
Receipts in respect of allotment of Company shares to senior employees 24 237 - - - 261
Recognition of compensation related to employee stock and option grants - 1,173 - - - 1,173
Dividend paid including erosion 12e - - - (3,006) - (3,006)
24 1,410 - (3,006) (710) (2,282)
BALANCE AT 31 DECEMBER 2008 16,490 95,802 9,836 159,502 (3,370) 278,260

8
(Concluded) - 3
FRUTAROM INDUSTRIES LTD.
CONSODLIATED STATEMENTS OF CHANGES IN EQUITY
The accompanying notes are an integral part of these financial statements.
Cost of
company
Ordinary Capital Translation Retained shares held by
Note shares surplus differences earnings subsidiary Total
U . S . d o l l a r s i n t h o u s a n d s
BALANCE AT 1 JANUARY 2009 16,490 95,802 9,836 159,502 (3,370) 278,260
Comprehensive income Income for the year - - - 33,220 - 33,220 Translation differences 2c - - 8,227 - - 8,227
Total comprehensive income for the year - - 8,227 33,220 - 41,447 Plan for allotment of Company shares to employees
of subsidiary: 2r - - - - Purchase of Company shares by subsidiary (517) (517) Receipts in respect of allotment of Company
shares to employees 12c1) - - - - 470 470 Allotment of shares and options to senior employees: 12d;12c3)
Receipts in respect of allotment of Company shares to senior employees 107 485 - - - 592
Recognition of compensation related to employee stock and option grants - 708 - - - 708
Dividend paid including erosion 12e - - - (2,485) - (2,485)
107 1,193 - (2,485) (47) (1,232)
BALANCE AT 31 DECEMBER 2009 16,597 96,995 18,063 190,237 (3,417) 318,475

9
FRUTAROM INDUSTRIES LTD.
CONSOLIDATED STATEMENTS OF CASH FLOWS
Year ended 31 December
Note 2009 2008 2007
U.S. dollars in thousands
CASH FLOWS FROM OPERATING ACTIVITIES: Cash generated from operations 22 96,294 51,560 24,032 Income tax paid (11,434) (14,540) (8,908)
Net cash provided by operating activities 84,860 37,020 15,124
CASH FLOWS FROM INVESTING ACTIVITIES:
Purchase of property, plant and equipment (5,397) (10,462) (14,685) Purchase of intangibles (1,196) (943) (2,820) Interest received 995 264 977 Acquisition of subsidiaries - net of cash acquired 5 - (51,761) (91,108) Acquisition of operations – net of cash acquired 5 (37,236) - (8,427) Reimbursement in respect of acquisition of operation 5 - 425 2,389 Proceeds from sale of property, plant and equipment 1,716 8,245 708 Proceeds from securities classified at fair value through profit or loss 52 1,227 2,199
Net cash used in investing activities (41,066) (53,005) (110,767)
CASH FLOWS FROM FINANCING ACTIVITIES: Receipts from senior employees in respect of allotment of shares 592 261 199 Interest paid (4,525) (8,015) (110) Receipt of long-term bank loans 12,848 82,117 89,483 Repayment of long-term bank loans (43,622) (27,621) (2,166) Receipt (repayment) of short-term bank loans and credit - net 358 (19,917) 20,521 Purchase of Company shares by subsidiary – net of receipts in respect of the shares (47) (710) (960) Dividend paid (2,485) (3,006) (2,572)
Net cash provided by (used in) financing activities (36,881) 23,109 104,395
INCREASE IN CASH AND CASH EQUIVALENTS AND BANK CREDIT 6,913 7,124 8,752 BALANCE OF CASH AND CASH EQUIVALENTS AND BANK CREDIT AT BEGINNING OF YEAR 37,229 28,177 17,744 PROFITS (LOSSES) FROM EXCHANE DIFFERENCES ON CASH, CASH EQUIVALENTS AND BANK CREDIT (1,202) 1,928 1,681
BALANCE OF CASH, CASH EQUIVALENTS AND BANK CREIDT AT END OF YEAR 18 42,940 37,229 28,177
The accompanying notes are an integral part of these financial statements.

10
FRUTAROM INDUSTRIES LTD.
NOTES TO THE CONSOLIDATED FINANCIAL STATEMENTS
NOTE 1 – GENERAL
Information on the activities of Frutarom Industries Ltd. and its subsidiaries (hereafter - the “Group”).
Frutarom Industries Ltd. is a global company, founded in 1933. The Company operates through the consolidated company (hereafter - Frutarom Ltd.) and the companies under its control. The Group has two main operations: the Flavours activity and the Fine Ingredients activity. The Group develops, manufactures, markets and sells flavours and fine ingredients used by producers of food and beverage, pharma-nutraceutical, flavours and fragrances, and personal care and cosmetics products as well as other products. The Company has production facilities in Europe, North America, Israel, and Asia (see also a list of consolidated companies in Note 25); The Company has 27 research and development laboratories and it sells and markets its products principally through its 48 sales and marketing offices. Segment information for the reporting years is presented as part of Note 6. The Company is a limited liability company incorporated and domiciled in Israel. The address of its registered office is 25 Heshaish St., Haifa Bay. The Company’s controlling shareholder is ICC Industries Inc. The Company’s shares have been listed on the Tel-Aviv Stock Exchange (the “TASE”) since 1996; since February 2005, Company’s shares are also listed through Global Depository Receipts in the official list of the London Stock Exchange (the “LSE”).
NOTE 2 – SUMMARY OF SIGNIFICANT ACCOUNTING POLICIES:
a. Basis of Preparation:
1) The Group's financial statements as of 31 December 2009, 2008 and 2007 and for each
of the three years ended on those dates were prepared in accordance International Financial Reporting Standards (hereafter – IFRS) and interpretations to IFRS issued by the International Financial Reporting Interpretations Committee (IFRIC)..
The significant accounting policies described below have been applied consistently in relation to all the years presented, unless otherwise stated. The financial statements have been prepared under the historical cost convention, subject to adjustments in respect of financial assets at fair value through profit or loss presented at fair value.
The preparation of financial statements in conformity with IFRS requires the use of certain critical accounting estimates. It also requires management to exercise its judgment in the process of applying the Group’s accounting policies. The areas involving a higher degree of judgment or complexity, or areas where assumptions and estimates are significant to the consolidated financial statements are disclosed in (Note 4). Actual results could differ significantly from those estimates and assumptions.
2) The period of the Group's operating cycle is 12 months. 3) The Group analyses the expenses recognized in the statment of comprehensive income
using the classification method based on the functional category to which the expense belongs.

11
FRUTAROM INDUSTRIES LTD.
NOTES TO THE CONSOLIDATED FINANCIAL STATEMENTS (continued)
NOTE 2 – SUMMARY OF SIGNIFICANT ACCOUNTING POLICIES (continued):
4) New International Financial Reporting Standards and amendments to existing
standards that are adopted for the first time in these financial statements The group adopted the following standards as from January 1, 2009: a) IAS 1 (Amendment) - "Presentation of Financial Statements" (hereinafter- IAS1R)
set comprehensive requirements for presenting financial statements, guidelines for the structure of financial statements and minimum requirements on content. Among other things, IAS1R mandates to present income and expense items recognized in equity and that do not stem from transactions with shareholders (hereinafter - other comprehensive income items) separately from owner-related equity transactions. All comprehensive income items need to be presented in the statement of comprehensive income. However, entities may elect whether to present all income and expense items recognized in the period in one or two statements: a statement that presents income or loss components (income statement) and a second statement that starts with income or loss and presents other comprehensive income components (statement of comprehensive income). The group elected to present all income and expense items recognized in the period in two statements: income statement and statement of comprehensive income. According to IAS 1R, comparative information was restated. This change in presentation does not affect the results of the group and earnings per share.
b) International Financial Reporting Standard No. 8 – "Operating Segments" –
(hereafter IFRS8). IFRS 8 replaces IAS 14 "Segment Reporting". The new standard requires the application of a 'management approach', whereby segment information is presented on the same basis as that used for internal reporting purposes. The application of the standard did not have any effect on the Group's segment reporting.
Goodwill is allocated by management to groups of cash-generating units based on segments levels.
c) Amendment to International Accounting Standard No. 38 – "Intangible Assets"
(hereafter – the amendment to IAS 38). The said amendment is part of the annual improvements project of the IASB published in May 2008. Under the Amendment to IAS 38, it is allowed to recognize a prepayment as an asset to the extent that the prepayment was made prior to the point at which the entity had the right to access the goods purchased or up to the point of receipt of services. As a result, the Group applies the said amendment to IAS 38 commencing 1 January 2009 with retroactive effect.
d) Interpretation No. 16 issued by the International Financial Reporting Interpretation
Committee – "Hedges of a Net Investment in a Foreign Operation" (effective for annual periods beginning on or after 1 October 2008; hereafter – IFRIC 16); IFRIC 16 clarifies the accounting treatment to be applied to hedges of net investments in a foreign operation, including the fact the hedges of a net investment are in respect of the translation differences between different functional currencies rather than translation differences arising from different presentation currencies. IFRIC 16 also

12
FRUTAROM INDUSTRIES LTD.
NOTES TO THE CONSOLIDATED FINANCIAL STATEMENTS (continued)
NOTE 2 – SUMMARY OF SIGNIFICANT ACCOUNTING POLICIES (continued):
clarifies that the hedging instrument can be held by any entity in the Group (except for the hedged foreign operation itself). The requirements set in IAS 21 – "Effects of the Changes in Exchange Rates of a Foreign Currency" – are relevant to the hedged item. The Group applies IFRIC 16 from 1 January 2009 but it is not expected that the implementation thereof would have a material effect on its financial statements.
e) IFRS 2 (amendment), ‘Share-based payment’ (effective 1 January 2009) deals with
vesting conditions and cancellations. It clarifies that vesting conditions are service conditions and performance conditions only. Other features of a share-based payment are not vesting conditions. These features would need to be included in the grant date fair value for share-based payments; they would not impact the number of awards expected to vest or valuation there of subsequent to grant date. All cancellations, whether by the entity or by other parties, should receive the same accounting treatment. The Group applies IFRS 2 (amendment) as from 1 January 2009. The amendment did not have a material impact on the group or Group’s financial statements for the reported years.
b. Principles of Consolidation
Subsidiaries are all entities over which the Group has the power to govern the financial and operating policies generally accompanying a shareholding of more than one half of the voting rights. The existence and effect of potential voting rights that are immediately exercisable or convertible are considered when assessing whether the Group controls another entity. Subsidiaries are fully consolidated from the date on which control is transferred to the Group. They are deconsolidated from the date the control ceases.
The purchase method of accounting is used to account for the acquisition of subsidiaries by the Group. The cost of an acquisition is measured as the fair value of the assets given, equity instruments issued and liabilities incurred or assumed at the date of transaction, plus costs directly attributable to the acquisition. Identifiable assets acquired, liabilities and contingent liabilities assumed in a business combination are measured initially at their fair values at the acquisition date, irrespective of the extent of any minority interest. The excess of the cost of acquisition over the fair value of the Company’s share of the identifiable net assets acquired is recorded as goodwill. If the cost of acquisition is less than the fair value of the net assets of the subsidiary acquired, the difference is recognized directly in the income statement. A put option to minority interest is accounted for as a financial liability (based on the current value of the exercise price of the option) as against the reduction of minority interest and modifying the amount of goodwill. Inter-company transactions, balances and unrealised gains on transactions between group companies are eliminated. Unrealised losses are also eliminated unless there are circumstances indicating the impairment of the transferred asset. Accounting policies of subsidiaries have been changed where necessary to ensure consistency with the policies adopted by the Group.

13
FRUTAROM INDUSTRIES LTD.
NOTES TO THE CONSOLIDATED FINANCIAL STATEMENTS (continued)
NOTE 2 – SUMMARY OF SIGNIFICANT ACCOUNTING POLICIES (continued):
c. Translation of Foreign Currency Balances and Transactions:
1) Functional and Presentation Currency.
Items included in the financial statements of each of the Group’s entities are measured using the currency of the primary economic environment in which that entity operates (the “Functional Currency”). The consolidated financial statements are presented in U.S. dollars, which is the Group’s functional and presentation currency.
2) Transactions and balances.
Foreign currency transactions in currencies different from the functional currency (hereafter – foreign currency) are translated into the functional currency using the exchange rates prevailing at the dates of the transactions. Foreign exchange gains and losses resulting from the settlement of such transactions and from the translation at period-end exchange rates of monetary assets and liabilities denominated in foreign currencies are attributed to the statement of comprehensive income.
Gains and losses arising from changes in exchange rates related to credit, cash and cash equivalents are presented in the statement of comprehensive income among "financial expenses". Gains and losses arising from change in exchange rate are also presented in the statement of comprehensive income among "financial expenses". .Translation differences on non-monetary financial assets and liabilities such as equities held at fair value through profit or loss are recognized in the statement of comprehensive income as part of the profit or loss arising from changes in the fair value.
3) Translation of Financial Statement of Group Companies.
The results and financial position of all the Company’s entities (none of which has the currency of hyperinflationary economy) that have a Functional Currency different from the presentation currency are translated into the presentation currency as follows:
(a) Assets and liabilities for each statement of financial position presented are
translated at the closing rate at the date of that statement of financial position; (b) income and expenses which are included in the comprehensive income statement
are translated at average exchange rates (unless this average is not a reasonable approximation of the cumulative effect of the rates prevailing on the transaction dates: in which case income and expenses are translated at the rate on the dates of the transactions);
(c) All resulting exchange differences are recognized as a separate component of equity.
On consolidation of the financial statements, exchange differences arising from the translation of the net investment in foreign operations and from loans and other currency instruments designated to serve as hedges to those investments are carried to equity. When a foreign operation is partially disposed of or sold, exchange differences that were recorded in equity are recognized in the statement of comprehensive income as part of the gain or loss on sale.

14
FRUTAROM INDUSTRIES LTD.
NOTES TO THE CONSOLIDATED FINANCIAL STATEMENTS (continued)
NOTE 2 – SUMMARY OF SIGNIFICANT ACCOUNTING POLICIES (continued):
Goodwill and fair value adjustments arising on the acquisition of a foreign entity are treated as assets and liabilities of the foreign entity and translated at the closing rate.
4) Information regarding exchange rates:
NIS Pound Sterling Euro Swiss Franc
Exchange rate as of December 31:
2009 3.775 0.6177 0.6937 1.0294 2008 3.802 0.6852 0.7177 1.0665 2007 3.846 0.4988 0.6794 1.1266
Increase (decrease) during the year: % % % %
2009 (0.7) (9.9) (3.3) (3.5) 2008 (1.1) 37.4 5.6 (5.3) 2007 (9.0) (2.1) (10.4) (7.6)
d. Segment Reporting (see also note 1)
Operating segments are reported in a manner consistent with the internal reporting provided to the chief operating decision-maker in the Group. The chief operating decision-maker, who is responsible for allocating resources and assessing performance of the operating segments and makes strategic decisions, has been identified as the President and the CEO.
The Group is organized on a worldwide basis into two major operating activities: Flavours, the Fine Ingredients. Another operating activity is Trade and Marketing. Each activity is considered to be a business segment.
e. Property, Plant and Equipment:
All property, plant and equipment are stated at historical cost less accumulated depreciation. Historical cost includes expenditure that is directly attributable to the acquisition of the items. Subsequent costs are included in the asset’s carrying amount or recognized as a separate asset, as appropriate, only when it is probable that future economic benefits associated with the item will flow to the Group and the cost of the item can be measured reliably. All other repairs and maintenance are charged to the income statement during the financial period in which they are incurred.

15
FRUTAROM INDUSTRIES LTD.
NOTES TO THE CONSOLIDATED FINANCIAL STATEMENTS (continued)
NOTE 2 – SUMMARY OF SIGNIFICANT ACCOUNTING POLICIES (continued):
Depreciation and impairment of property, plant and equipment are recognized in the income statement .
Land is not depreciated. Depreciation on other assets is calculated using the straight-line method to allocate their cost less their residual values over their estimated useful lives, as follows:
%
Buildings 2.7-4
Machinery and equipment 6.6-10
Vehicles and forklifts 15; 20
Computers 20-33
Office furniture and equipment 6-20
Leasehold improvements 10
Leasehold improvements are amortised by the straight-line method over the terms of the lease, which are shorter than the estimated useful life of the improvements.
The assets’ residual values and useful lives are reviewed, and adjusted if appropriate, at each statement of financial position date. An asset’s carrying amount is written down immediately to its recoverable amount if the asset’s carrying amount is greater than its estimated recoverable amount (Note 2g). Gains or losses on disposals are determined by comparing proceeds with carrying amount. These are included in the statement of comprehensive income among "other income - net".
f. Intangible Assets:
1) Goodwill represents the excess of the cost of an acquisition over the fair value of the
Group’s share of the net identifiable assets of the acquired subsidiary at the date of acquisition. Goodwill on acquisitions of subsidiaries is included in ‘intangible assets’. Goodwill is tested annually for impairment and carried at cost less accumulated impairment losses. Impairment losses on goodwill are not reversed when subsequent increase in value takes place. Gains or losses on the disposal of an entity include the carrying amount of goodwill relating to the entity sold.
Goodwill is allocated to cash-generating units for the purpose of impairment testing. The allocation is made to those cash-generating units or groups of cash-generating units that are expected to benefit from the business combination in which the goodwill arose. The Group allocates goodwill to each business segment in which it operates (note 2g).
2) Product formulas are initially recorded at their acquisition cost and amortised on a
straight-line basis over 10-20 years (mainly 20 years).
3) Customer relationships acquired in a business combination are recognized at fair value at the acquisition date. The customer relations have a finite useful life and are carried at cost less accumulated amortization. Amortization is calculated using the straight-line method over the expected life of the customer relationship (7-10 years).

16
FRUTAROM INDUSTRIES LTD.
NOTES TO THE CONSOLIDATED FINANCIAL STATEMENTS (continued)
NOTE 2 – SUMMARY OF SIGNIFICANT ACCOUNTING POLICIES (continued):
4) Separately acquired trademarks and licences are shown at historical cost. Trademarks
and licences acquired in a business combination are recognized at fair value at the acquisition date. Trademarks and licenses have a definite useful life and are carried at cost less accumulated amortization. Amortization is calculated using the straight-line method to allocate the cost of trademarks over their estimated useful lives (20 years).
5) Computer software
Acquired computer software licences are capitalized on the basis of the costs incurred to acquire and bring to use the specific software. These costs are amortised over their estimated useful lives (three to five years) using the straight line method.
Costs associated with maintaining computer software programmes are recognized as an expense as incurred. Costs that are directly associated with the development of identifiable and unique software products controlled by the Group, and that will probably generate economic benefits exceeding costs beyond one year, are recognized as intangible assets. Costs include the employee costs incurred as a result of developing software and an appropriate portion of relevant overheads.
Computer software development costs recognized as assets are amortised over their estimated useful lives using the straight line method (3-5 years).
6) Research and Development
Research expenses are accounted for as expenses as incurred. Cost incurred in respect of development projects (attributable to the design and testing of new or improved products) are recognized as intangible assets when the following criteria are met:
• It is technically feasible to complete the intangible assets so that it will be available for use;
• Management intends to complete the intangible asset and use it or sell it; • There is an ability to use or sell the intangible asset; • It can be demonstrated how the software product will generate probable future
economic benefits; • Adequate technical, financial and other resources to complete the development
and to use or sell the intangible asset are available; and • The expenditure attributable to the intangible asset during its development can
be reliably measured. Other development costs that do not meet the above criteria are recognized as cost as incurred. Development costs previously recognized as an expense are not recognized as an asset on a subsequent period. Capitalised development costs are presented as intangible assets and amortised as from the time the asset is available for use through its useful life (which does not exceed five years) in accordance with the straight-line method. Development assets are tested for impairment on an annual basis, in accordance with the provisions of IAS 36 – "Impairment of Assets".

17
FRUTAROM INDUSTRIES LTD.
NOTES TO THE CONSOLIDATED FINANCIAL STATEMENTS (continued)
NOTE 2 – SUMMARY OF SIGNIFICANT ACCOUNTING POLICIES (continued):
g. Impairment of non-financial assets
Assets, such as goodwill, that have an indefinite useful life are not subject to amortization and are tested annually for impairment. Assets that are subject to amortization are reviewed for impairment whenever events or changes in circumstances indicate that the carrying amount may not be recoverable. An impairment loss is recognized for the amount by which the asset’s carrying amount exceeds its recoverable amount. The recoverable amount is the higher of an asset’s fair value less costs to sell and value in use. For the purposes of assessing impairment, assets are grouped at the lowest levels for which there are separately identifiable cash flows (cash-generating units). Non-financial assets, other than goodwill, that were subject to impairment are reviewed for possible reversal of the impairment at each statement of financial position date.
h. Government Grants The group's research and development activities are supported in some of the countries in which it operates, and in Israel through the Israel Chief Scientist in the Ministry of Industry, Commerce and Labour (hereinafter - the OCS) by way of grants. The said grants are classified as "forgivable loans" in IAS 20 "Accounting for Government Grants and Disclosure of Government Assistance". If on the date of establishing the entitlement for the grant management concludes that it is more likely than not that the received grant will not be returned, than the grants received to support the group's research and development effort are recognized on the date of entitlement inception (in condition that there reception is very likely) to the statement of comprehensive income as an off set from the relevant research and development expenses. In cases where the grant is recognized in comprehensive income upon initial recognition, as above, and it is more likely than not in subsequent periods that the project will be successful and that royalties/repayments will be made to the OCS, the group recognizes a liability, measured according to the guidelines in IAS 37 - "Provisions, Contingent Liabilities and Contingent Assets".
i. Borrowing costs
Borrowing costs directly attributed to the acquisition, construction or production of a qualifying asset (an asset that takes a substantial period of time to get ready for its intended use or sale) are capitalised and included as part of the cost of the asset over the period of time it takes for acquisition, construction or production to be completed and to get the asset ready for its intended use or for sale. Borrowing costs directly attributable to acquisition, construction or production of qualifying assets are those borrowing costs that would not have been incurred had the expense relating to the qualifying asset not been incurred. Other borrowing costs are carried to comprehensive income as expenses.

18
FRUTAROM INDUSTRIES LTD.
NOTES TO THE CONSOLIDATED FINANCIAL STATEMENTS (continued)
NOTE 2 – SUMMARY OF SIGNIFICANT ACCOUNTING POLICIES (continued):
j. Financial assets:
1) Classification
The Group classifies its financial assets in the following categories: financial assets at fair value through profit or loss and loans and receivables. The classification depends on the purpose for which the financial assets were acquired. Group management determines the classification of its financial assets at initial recognition.
(a) Financial assets at fair value through profit or loss.
These assets are assets designed by management to be recognized at this category.
(b) Loans and receivables
Loans and receivables are non-derivative financial assets with fixed or determinable payments that are not quoted in an active market. They are included in current assets, except for maturities greater than 12 months after the statement of financial position date. These are classified as non-current assets. Loans and receivables of the Group are classified as "accounts receivable", "cash and cash equivalents" in the statement of financial position (Note 2l).
2) Recognition and measurement
Regular purchases and sales of financial assets are recognized on the trade-date – the date on which the Group commits to purchase or sell the asset. Investments are initially recognized at fair value plus transaction costs for all financial assets not carried at fair value through profit or loss. Financial assets at fair value through profit or loss are initially recognized at fair value, and transaction costs are expensed in the statement of comprehensive income . Financial assets are derecognized when the rights to receive cash flows from the investments have expired or have been transferred and the Group has transferred substantially all risks and rewards of ownership. Financial assets at fair value through profit or loss are subsequently carried at fair value. Loans and receivables are presented at amortized cost using the effective interest method. Gains or losses that stem from changes in the fair value of financial assets at fair value through profit or loss are presented in statement of comprehensive income under "financial expenses - net" in the period in which they incurred. Dividend income from financial assets at fair value through profit or loss are recognized in statement of comprehensive income under "other income - net" when the group is eligible to these payments. As to the way of measuring the fair value of financial statements of the group (see note 3c).

19
FRUTAROM INDUSTRIES LTD.
NOTES TO THE CONSOLIDATED FINANCIAL STATEMENTS (continued)
NOTE 2 – SUMMARY OF SIGNIFICANT ACCOUNTING POLICIES (continued):
3) Offsetting financial instruments Financial assets and liabilities are offset and the net amount reported in the statement of financial position when there is a legally enforceable right to offset the recognized amounts and there is an intention to settle on a net basis, or realize the asset and settle the liability simultaneously.
4) Impairment of financial assets
Financial assets are presented at amortized cost.
The Group assesses at the each statement of financial position date whether there is objective evidence that a financial asset or group of financial assets is impaired. A financial asset or a group of financial assets is impaired and impairment losses are incurred only if there is objective evidence of impairment as a result of one or more events that occurred after the initial recognition of the asset (a ‘loss event’) and that loss event (or events) has an impact on the estimated future cash flows of the financial asset or group of financial assets that can be reliably estimated.
The criteria that the Group uses to determine that there is objective evidence of an impairment loss include: • Significant financial difficulty of the issuer or obligor; • breach of contract, such as a default or delinquency in interest or principal payments; • The Group, for economic or legal reasons relating to the borrower’s financial
difficulty, granting to the borrower a concession that the lender would not otherwise consider;
• It becomes probable that the borrower will enter bankruptcy or other financial reorganization;
• The disappearance of an active market for that financial asset because of financial difficulties; or
• Observable data indicating that there is a measurable decrease in the estimated future cash flows from a portfolio of financial assets since the initial recognition of those assets, although the decrease cannot yet be identified with the individual financial assets in the portfolio, including: (i) Adverse changes in the payment status of borrowers in the portfolio; or (ii) National or local economic conditions that correlate with defaults on the assets in
the portfolio.
The Group first assesses whether objective evidence of impairment exists.
Where evidence as above exists, the amount of the loss is measured as the difference between the asset’s carrying amount and the present value of estimated future cash flows (excluding future credit losses that have not been incurred) discounted at the financial asset’s original effective interest rate (i.e., the effective interest rate computed for the asset upon initial recognition). The asset’s carrying amount is reduced and the amount of the loss is recognized in the statement of comprehensive income. The group may measure the impairment based on the fair value of the financial instrument while using an observable market price.

20
FRUTAROM INDUSTRIES LTD.
NOTES TO THE CONSOLIDATED FINANCIAL STATEMENTS (continued)
NOTE 2 – SUMMARY OF SIGNIFICANT ACCOUNTING POLICIES (continued):
If the amount of impairment loss in a subsequent period decreases, and this decrease may be attributed to an objective event that took place after the impairment was recognized (like improved credit rating of the borrower), reversing the previously recognized impairment loss is recorded in income. The impairment test of accounts receivable is described in note 2 l below.
k. Inventories
Inventories are stated at the lower of cost or net realisable value. Raw material cost is determined using the "moving average" method. The cost of finished goods and work in progress comprises raw materials, direct labour, other direct costs and related production overheads (based on normal operating capacity) but excludes borrowing costs. Net realisable value is the estimated selling price in the ordinary course of business, less the applicable and variable selling expenses.
l. Trade Receivables
Trade receivables are amounts due from customers for merchandise sold or services performed in the ordinary course of business. If collection is expected in one year or less they are classified as current assets. If not, they are presented as non-current assets. Trade receivables are recognized initially at fair value and subsequently measured at amortized cost using the effective interest method, less provision for doubtful accounts (hereafter – "provision for impairment" or "provision for doubtful accounts"). As to the way the impairment provision is determined and accounting treatment applied thereto subsequently see j4) below.
m. Cash and Cash Equivalents Cash and cash equivalents include cash in hand, short-term bank deposits and other highly liquid short-term investments, the maturity of which does not exceed three months, bank overdrafts (repayable upon demand), which are presented among "short-term credit and loans" on the current liabilities item in the statement of financial position.
n. Share Capital
Ordinary shares are classified as equity. Incremental costs directly attributable to the issue of new shares or options are shown in equity as a deduction, net of tax, from the proceeds. Where any Group company purchases the company’s equity share capital (treasury shares), the consideration paid, including any directly attributable incremental costs (net of income taxes) is deducted from equity attributable to the company’s equity holders until the shares are cancelled or reissued. Where such shares are subsequently reissued, any consideration received, net of any directly attributable incremental transaction costs and the related income tax effects are included in equity.

21
FRUTAROM INDUSTRIES LTD.
NOTES TO THE CONSOLIDATED FINANCIAL STATEMENTS (continued)
NOTE 2 – SUMMARY OF SIGNIFICANT ACCOUNTING POLICIES (continued):
o. Trade Payables
Trade payables are obligations of the Group to pay for goods or services that have been acquired in the ordinary course of business from suppliers. Accounts payable are classified as current liabilities if payment is due within one year or less. If not, they are presented as non-current liabilities. Trade payables are recognized initially at fair value and subsequently measured at amortised cost using the effective interest method.
p. Borrowings Borrowings is recognized initially at their fair value, net of transaction costs incurred. Borrowings are subsequently stated at amortised cost; any difference between the proceeds (net of transaction costs) and the redemption value is recognized in the financial expenses over the period of the borrowings using the effective interest method. Borrowings is classified as current liabilities unless the Group has an unconditional right to defer settlement of the liabilities for at least 12 months after the end of the reporting period.
q. Current and Deferred Income Taxes: The tax expenses for the reported years comprise of current and deferred tax. Tax is recognized in the statement of comprehensive income. The current income tax charge is calculated on the basis of the tax laws enacted or substantially enacted at the statement of financial position date in the countries where the company's subsidiaries operate and generate taxable income. Management periodically evaluates positions taken in tax returns with respect to situations in which applicable tax regulation is subject to interpretation. It establishes provisions where appropriate on the basis of amounts expected to be paid to the tax authorities. Deferred income tax is fully recognized, using the liability method, on temporary differences arising between the tax bases of assets and liabilities and their carrying amounts in the consolidated financial statements. Nevertheless, the deferred income tax is not accounted for if it arises from initial recognition of an asset or liability in a transaction other than a business combination that at the time of the transaction affects neither accounting nor taxable profit or loss. Deferred income tax assets are recognized to the extent that it is probable that future taxable profit will be available against which the temporary differences can be utilised. Deferred income tax is determined using tax rates (and laws) that have been enacted or substantially enacted by the statement of financial position date and are expected to apply when the related deferred income tax asset is realised or the deferred income tax liability is settled.
Deferred income tax are not calculated on temporary differences arising on investments in subsidiaries, since it has no intention to exercise its investments in subsidiaries in the near future.

22
FRUTAROM INDUSTRIES LTD.
NOTES TO THE CONSOLIDATED FINANCIAL STATEMENTS (continued)
NOTE 2 – SUMMARY OF SIGNIFICANT ACCOUNTING POLICIES (continued):
Deferred income tax assets and liabilities are offset only if:
- There is a legally enforceable right to offset current tax assets against current tax liabilities; and
- When the deferred income taxes assets and liabilities relate to income taxes levied by the same taxation authority on either the taxable entity or different taxable entities where there is an intention to settle the balances on a net basis.
As stated in Note 13c, upon distribution of dividends from tax-exempt income of "approved enterprises" or "benefited enterprises", the amount distributed will be subject to tax at the rate that would have been applicable had the company not been exempted from payment thereof. The amount of the related tax is charged as an expense in the statement of comprehensive income, when such dividend is distributed.
r. Employee Benefits:
1) Pension Obligations.
Group companies operate various pension schemes. The schemes are generally funded through payments to insurance companies or trustee-administered pension funds, determined by periodic actuarial calculations. The Group has both defined benefit and defined contribution plans. A defined contribution plan is a pension plan under which the Group pays fixed contributions into a separate entity. The Group has no legal or constructive obligations to pay further contributions if the fund does not hold sufficient assets to pay all employees the benefits relating to employee service in the current and prior periods. A defined benefit plan is a pension plan that is not a defined contribution plan. Typically defined benefit plans define an amount of pension benefit that an employee will receive on retirement, usually dependent on one or more factors such as age, years of service and compensation. The liability recognized in the statement of financial position in respect of defined benefit pension plans is the present value of the defined benefit obligation at the statement of financial position date less the fair value of plan assets, together with adjustments for unrecognised actuarial gains or losses. The defined benefit obligation is calculated annually by independent actuaries using the projected unit credit method. The present value of the defined benefit obligation is determined by discounting the estimated future cash outflows using interest rates that are denominated in the currency in which the benefits will be paid. Actuarial gains and losses arising from experience adjustments and changes in actuarial assumptions in excess of the greater of 10% of the value of plan assets or 10% of the defined benefit obligation are charged or credited to comprehensive income over the employees’ expected average remaining working lives. Amounts funded for severance pay are measured at fair value; these amounts constitute "plan's assets as defined in IAS 19 are therefore offset from the balance of liability for employee rights upon retirement for the purpose of presentation in the statement of financial position.

23
FRUTAROM INDUSTRIES LTD.
NOTES TO THE CONSOLIDATED FINANCIAL STATEMENTS (continued)
NOTE 2 – SUMMARY OF SIGNIFICANT ACCOUNTING POLICIES (continued):
For defined contribution plans, the Group pays contributions to publicly or privately administered pension insurance plans on a mandatory basis. The Group has no further payment obligations once the contributions have been paid. The contributions are recognized as employee benefit expense when they are due. Prepaid contributions are recognized as an asset to the extent that a cash refund or a reduction in the future payments is available.
2) Severance pay
Severance pay is paid in cases where an employee is made redundant by the Group prior to the regular retirement age, or where an employee has agreed to voluntary retirement in return for those benefits. The Group recognises severance pay when it is evidently committed to do one of the following: (a) An official and detailed redundancy plan, which is uncancellable; or (b) Granting severance pay as a result of a proposition made to employees in order to
encourage their voluntary retirement. In cases where benefits in respect of redundancy are payable after more than 12 months from balance sheet date, they are capitalised to their present value.
3) Vacation and Recreation Fees
Under the law, employee is entitled for vacation days and recreation fees (in Israel), both computed on an annual basis. The entitlement is based on the period of employment. The Group records a liability and an expense in respect of vacation and recreation fees, based on the benefit accumulated for each employee.
4) Bonus plans
Some of the Group's employees are entitled to receive an annual bonus in accordance with the bonuses plan determined by Group management for that year. The Group provides for payment of the bonus in accordance with meeting the targets of the plan and in accordance with Group's estimate as to the total amount of bonuses to be paid to employees.
s. Share-Based Compensation
The Group operates a number of equity-settled, share-based compensation plans, under which the Group receives services from employees as consideration for equity instruments (options) of the Company. The fair value of the employee services received in exchange for the grant of the options is recognized as an expense in the statement of comprehensive income. The total amount to be expensed is determined by reference to the fair value of the options granted:
� considering the impact of any non-market vesting conditions (for example,
remaining an employee of the entity over a specified time period); and � excluding the impact of any non-vesting conditions.

24
FRUTAROM INDUSTRIES LTD.
NOTES TO THE CONSOLIDATED FINANCIAL STATEMENTS (continued)
NOTE 2 – SUMMARY OF SIGNIFICANT ACCOUNTING POLICIES (continued):
Non-market vesting conditions are included in assumptions about the number of options that are expected to vest. The total expense is recognized over the vesting period, which is the period over which all of the specified vesting conditions are to be satisfied. At the date of each statement of financial position, the Group revises its estimates of the number of options that are expected to vest based on the non-marketing vesting conditions. It recognizes the impact of the revision to original estimates, if any, in the statement of comprehensive income, with a corresponding adjustment to equity.
t. Provisions
Provisions are recognized when: the Group has a present legal or constructive obligation as a result of past events and it is probable that an outflow of resources will be required to settle the obligation and it is possible to prepare a reliable estimation of the amount of liability.
Where there are a number of similar obligations, the likelihood that an outflow will be required in settlement is determined by considering the class of obligations as a whole. A provision is recognized even if the likelihood of an outflow with respect to any one item included in the same class of obligations may be remote. Provisions are measured at the present value of the cash flow expected to be required to settle the obligation using a pre-tax discount rate that reflects current market assessments of the time value of money and the risk specific to the obligation. The increase in the provision due to passage of time is recognized as interest expense.
u. Revenue Recognition Policy
Revenue comprises the fair value of the consideration received or receivable for the sale of goods in the ordinary course of the Group’s activities. Revenue is shown net of value-added tax, returns, rebates and discounts and after eliminating sales within the Group. The Group recognises revenue when the amount of revenue can be reliably measured, it is probable that future economic benefits will flow to the entity and when specific criteria have been met for each of the Group’s activities as described below. The amount of revenue is not considered to be reliably measurable until all contingencies relating to the sale have been resolved. The Group bases its estimates on historical results, taking into consideration the type of customer, the type of transaction and the specifics of each arrangement. Sales of goods The Group manufactures and sells a range of products. Sales of goods are recognized when a Group entity has delivered products to the client, the client has full discretion over the channel and price to sell the products, and there is no unfulfilled obligation that could affect the client’s acceptance of the products. Delivery does not occur until the products have left Group's plants, the risks of obsolescence and loss have been transferred to the client, and either the client has accepted the products in accordance with the sales contract, the acceptance provisions have lapsed, or the Group has objective evidence that all criteria for acceptance have been satisfied.
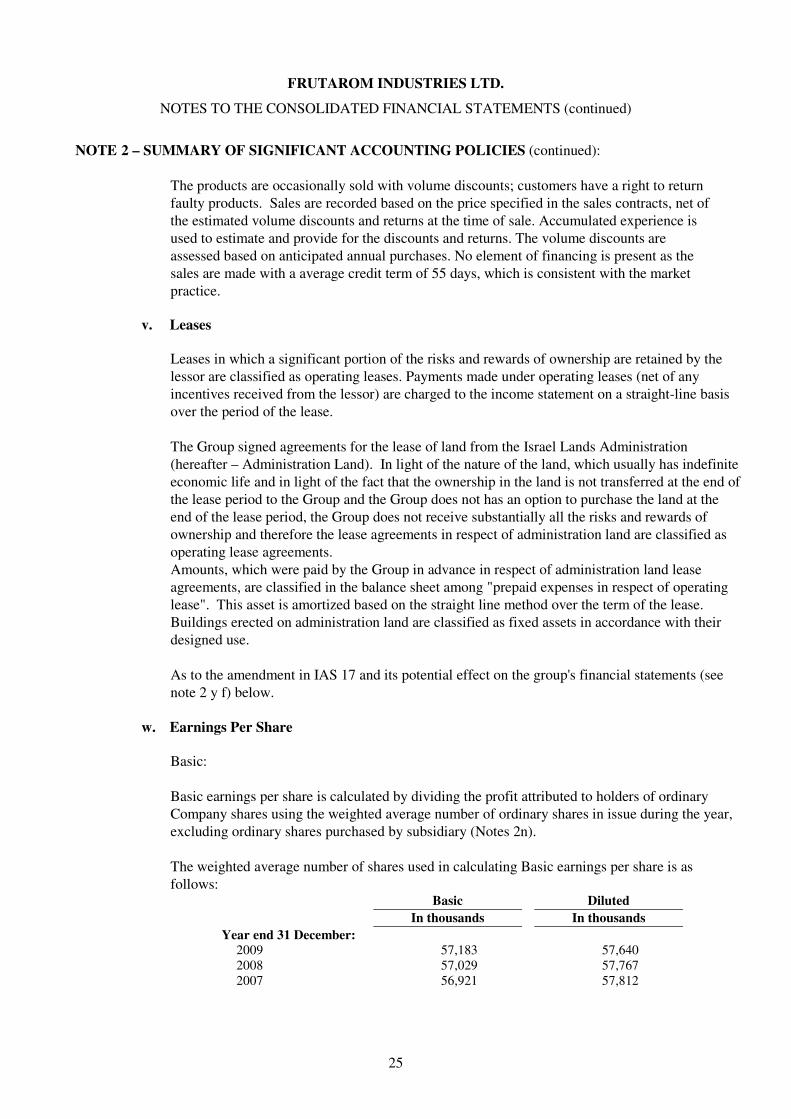
25
FRUTAROM INDUSTRIES LTD.
NOTES TO THE CONSOLIDATED FINANCIAL STATEMENTS (continued)
NOTE 2 – SUMMARY OF SIGNIFICANT ACCOUNTING POLICIES (continued):
The products are occasionally sold with volume discounts; customers have a right to return faulty products. Sales are recorded based on the price specified in the sales contracts, net of the estimated volume discounts and returns at the time of sale. Accumulated experience is used to estimate and provide for the discounts and returns. The volume discounts are assessed based on anticipated annual purchases. No element of financing is present as the sales are made with a average credit term of 55 days, which is consistent with the market practice.
v. Leases
Leases in which a significant portion of the risks and rewards of ownership are retained by the lessor are classified as operating leases. Payments made under operating leases (net of any incentives received from the lessor) are charged to the income statement on a straight-line basis over the period of the lease. The Group signed agreements for the lease of land from the Israel Lands Administration (hereafter – Administration Land). In light of the nature of the land, which usually has indefinite economic life and in light of the fact that the ownership in the land is not transferred at the end of the lease period to the Group and the Group does not has an option to purchase the land at the end of the lease period, the Group does not receive substantially all the risks and rewards of ownership and therefore the lease agreements in respect of administration land are classified as operating lease agreements. Amounts, which were paid by the Group in advance in respect of administration land lease agreements, are classified in the balance sheet among "prepaid expenses in respect of operating lease". This asset is amortized based on the straight line method over the term of the lease. Buildings erected on administration land are classified as fixed assets in accordance with their designed use. As to the amendment in IAS 17 and its potential effect on the group's financial statements (see note 2 y f) below.
w. Earnings Per Share Basic: Basic earnings per share is calculated by dividing the profit attributed to holders of ordinary Company shares using the weighted average number of ordinary shares in issue during the year, excluding ordinary shares purchased by subsidiary (Notes 2n). The weighted average number of shares used in calculating Basic earnings per share is as follows:
Basic Diluted
In thousands In thousands
Year end 31 December: 2009 57,183 57,640 2008 57,029 57,767 2007 56,921 57,812

26
FRUTAROM INDUSTRIES LTD.
NOTES TO THE CONSOLIDATED FINANCIAL STATEMENTS (continued)
NOTE 2 – SUMMARY OF SIGNIFICANT ACCOUNTING POLICIES (continued):
Fully diluted:
When calculated the diluted earnings per share, the Group adds to the average number of shares outstanding that was used to calculate the basic earnings per share also the weighted average of the number of shares to be issued assuming the all shares that have a potentially dilutive effect would be converted into shares. The potential shares, as above are only taken into account in cases where their effect is dilutive (reducing the earnings per share or increasing the loss per share).
x. Dividends
Dividend distribution to the Group’s shareholders is recognized as a liability in the Group's financial statements in the period in which the dividends are approved by the Group’s Board of Directors.
y. New International Financial Reporting Standards, Amendments to Standards and New interpretations
Standards, amendments and interpretations to existing standards that are not yet effective and have not been early adopted by the Company:
1) IAS 27 (Amended) – Consolidated and Separate Financial Statements (hereafter – IAS
27R) (effective for annual periods beginning on or after July 1, 2009). IAS27R requires that the effects of all transactions with non-controlling interest to be recorded in equity if there is no change in control and accordingly, no further goodwill or income (loss) would arise from these transactions. IAS27R also discusses the accounting treatment applied upon loss of control in investee. Any retained equity interests in the investee are to be remeasured to fair value and the resulting gain or loss is recognized in profit or loss. The Group would implement IAS27R prospectively with respect of transactions with non-controlling interest, commencing January 1, 2010; however, it is not expected by the company's management that the implementation would have a material effect on its financial statements.
2) IFRS 3 (revised), ‘Business combinations’ (effective for annual periods beginning on or
after 1 July 2009).
The revised standard continues to apply the acquisition method to business combinations, with some significant changes. For example, all payments to purchase a business are to be recorded at fair value at the acquisition date, with contingent payments classified as debt subsequently re-measured through profit or loss. There is a choice on an acquisition-by-acquisition basis to measure the non-controlling interest in the acquiree at fair vale or at the non-controlling interest’s proportionate share of the acquiree’s net assets. All acquisition-related costs should be expensed.
The Group will apply IFRS 3 (revised) prospectively to all business combinations from 1 January 2010.
3) IFRS 9 – "Financial Instruments" (hereafter – "IFRS 9").
IFRS 9 was published in November 2009; the standard represents completion of the first phase of a three-phase project for replacement of IAS 29 – "Financial Instruments – Recognition and Measurement" (hereafter – IAS 39) with a new standard. The first phase

27
FRUTAROM INDUSTRIES LTD.
NOTES TO THE CONSOLIDATED FINANCIAL STATEMENTS (continued)
NOTE 2 – SUMMARY OF SIGNIFICANT ACCOUNTING POLICIES (continued):
that was published replaces those parts of IAS 39 that deal with classification and measurement of financial assets. Set forth below is a summary of the provisions of IFRS 9:
- Financial assets are classified in accordance with one of the two following categories:
Financial assets that are measured subsequent to initial recognition at fair value and financial assets that are measured after initial recognition at amortized cost. The decision as to the classification of financial assets into one of the two categories is made on the date of initial recognition. Classification is based on the manner in which the entity manages its financial instruments (its business model) and on the characteristics of the contractual cash flows of the instruments.
- An embedded derivative where the host contract is a financial asset would be fully classified into one of the two categories mentioned above without separating the derivative from the host contract.
- A financial asset would be measured at amortized cost subsequent to initial recognition only if the following two conditions are met: (a) the financial asset is held as part of an entity's business model, the goal of which is holding the asset for collecting its contractual cash flows, and (b) the contractual cash flows stemming from the instrument only represent principal and interest payments (i.e., the instrument only has basic loan characteristics).
- Financial assets that are debt instruments, which do not meet the above conditions, would be measured at fair value through profit or loss.
- Financial assets that are equity instruments would be measured at fair value, as follows: i. Held for trade equity instruments would be measured at fair value through
profit or loss. ii. As to the other equity instruments, IFRS 9 allows an entity, on initial recognition,
to make an irrevocable election to recognize all changes in fair value in Other Comprehensive Income. There are no transfers from other comprehensive income to profit or loss, not even when the instrument is disposed of. On the other hand, dividends from such designated equity instruments are recognized in profit or loss. Election as above would be made separately for each and every instrument. Equity instruments for which an election as above was not made shall be measured at fair value through profit or loss. IFRS 9 applies to annual accounting periods commencing on or after 1 January 2013, with earlier application permitted. At this stage, the Group examines the provisions of the standard, its effect on the Group and the timing of its adoption by the Group.
d) Amendment to International Accounting Standard No. 36 – "Impairment of Assets"
(hereafter – the Amendment to IAS 36). The said amendment is part of the annual improvements project of the IASB published in April 2009. The Amendment to IAS 36 clarifies that the largest cash-generating unit (or group of units) to which goodwill should be allocated for the purposes of impairment testing is an operating segment as defined by paragraph 5 of IFRS 8, ‘Operating segments’ (that is, before the

28
FRUTAROM INDUSTRIES LTD.
NOTES TO THE CONSOLIDATED FINANCIAL STATEMENTS (continued)
NOTE 2 – SUMMARY OF SIGNIFICANT ACCOUNTING POLICIES (continued):
aggregation of segments with similar economic characteristics permitted by paragraph 12 of IFRS 8). The Amendment to IAS 36 is applicable prospectively for annual period commencing January 1, 2010 or thereafter. Early adoption is possible.
The Group would apply the said amendment commencing January 1, 2010 and it does not expect that the application thereof would have a material effect on its segment reporting.
e) Amendment to International Accounting Standard No. 38 – "Intangible Assets" (hereafter – the amendment to IAS 38). The said amendment is part of the annual improvements project of the IASB published in April 2009. The amendment clarifies, inter alia, the amendment clarifies the valuation techniques commonly used by entities when measuring the fair value of intangible assets acquired in a business combination that are not traded in active markets. The Amendment to IAS 38 is to be applied prospectively for annual period commencing January 1, 2010 or thereafter. Early adoption is possible.
The Group would apply the said amendment commencing January 1, 2010. At this stage it is not possible to estimate the impact that the said amendment would have on the Group's financial statements, if any.
f) Amendment to IAS 17 – "Leases" (hereafter – IAS 17). The said amendment is part
of the annual improvements project of the IASB published in April 2009. This Amendment deletes the specific guidance regarding classification of leases of land, so as to eliminate inconsistency with the general guidance on lease classification. As a result, leases of land should be classified as either finance or operating, using the general principles of IAS 17. The Amendment to IAS 17 is to be applied retroactively to reporting periods commencing January 1, 2010. Early adoption is possible. The Group would apply the said amendment commencing January 1, 2010 and it does not expect that the application thereof would have an impact on its financial statements.
g) Interpretation No. 16 issued by the International Financial Reporting Interpretation
Committee – "Hedges of a Net Investment in a Foreign Operation" (hereafter – the Amendment to IFRIC 16). The amendment states that, in a hedge of a net investment in a foreign operation, qualifying hedging instruments may be held by any entity or entities within the Group, including the foreign operation itself, as long as the designation, documentation and effectiveness requirements of IAS 39 – "Financial Instruments – Recognition and Measurement" - that relate to a net investment hedge are satisfied. The Amendment to IFRIC 16 is to be applied retroactively to reporting periods commencing July 1, 2009. Early adoption is possible. The Group would apply the said amendment commencing January 1, 2010 and it does not expect that the application thereof would have a material effect on its financial statements.
NOTE 3 – FINANCIAL INSTRUMENTS AND FINANCIAL RISK MANAGEMENT:
a. Financial Risk Factors
The Group’s activities expose it to a variety of financial risks: market risk (including currency risk, fair value interest rate risk, cash flow interest rate risk and price risk), credit risk and liquidity risk. The Group’s overall risk management programme focuses on the unpredictability of financial markets and seeks to minimise potential adverse effects on the Group’s financial performance.

29
FRUTAROM INDUSTRIES LTD.
NOTES TO THE CONSOLIDATED FINANCIAL STATEMENTS (continued)
NOTE 3 – FINANCIAL INSTRUMENTS AND FINANCIAL RISK MANAGEMENT (continued):
Risk management is carried out under policies approved by the board of directors and senior management. These policies cover specific areas, such as foreign exchange risk, interest rate risk, credit risk, use of non-derivative financial instruments, and investment of excess liquidity. Group policies also cover areas such as cash management and raising short and long-term debt. The Group’s business is characterised by considerable dispersion. The Group produces thousands of products intended for thousands of customers throughout the world, using thousands of raw materials purchased from a wide range of suppliers worldwide. As stated, the Group is not significantly dependent on any of its customers, products or suppliers.
Discussions on implementing the risk management policy as relates to currency exposure and interest are conducted by the Group’s management once each quarter. The Group does not use derivative financial instruments for its hedge or speculative purposes. 1) Market Risks:
(a) Foreign Exchange Risk
1. General
The Group operates globally and is exposed to movements in foreign currencies affecting its net income and financial position, as expressed in U.S. dollars. Transaction exposure arises because the equivalent amount in local currency paid or received in transactions denominated in foreign currencies may vary due to changes in exchange rates. Most of the Group’s subsidiaries produce their income primarily in the local currency. A significant amount of expenditures, especially for the purchase of goods for resale are in foreign currencies. Similarly, transaction exposure arises on net balances of financial assets held in foreign currencies. The fact that raw materials purchases for the Group’s production are also conducted in various currencies reduces currency exposure. The Group’s subsidiaries manage this exposure locally. In addition, Group Treasury monitors total global exposure with the help of comprehensive data received on a quarterly basis.
Generally, the Group does not take external hedging measures nor does it use derivative financial instruments for protecting itself from currency fluctuations.
Translation exposure arises from the consolidation of the Foreign Currency denominated financial statements of the Company’s subsidiaries. The effect on the Group’s consolidated comprehensive income is shown as a currency translation difference.

30
FRUTAROM INDUSTRIES LTD.
NOTES TO THE CONSOLIDATED FINANCIAL STATEMENTS (continued)
NOTE 3 – FINANCIAL INSTRUMENTS AND FINANCIAL RISK MANAGEMENT (continued):
At 31 December 2009, 2008 and 2007, if the U.S. dollar had weakened/strengthened by 1% against the currencies referred to below with all other variables unchanged, post-tax profit for the year would have been changed as follows:
December 31, 2009
U.S. dollars in thousands
Pound Swiss NIS sterling Euro Franc Other
Financial asset/liabilities, net 4,178 (76) 5,562 (2,948) 6,758
Exchange gains/losses: Impact of 1% strengthening (32) 1 (43) 23 (52) Impact 1% weakening 32 (1) 43 (23) 52
December 31, 2008
U.S. dollars in thousands
Pound Swiss NIS sterling Euro Franc Other
Financial asset/liabilities, net (25) 419 6,523 (2,904) 6,515
Exchange gains/losses: Impact of 1% strengthening * (3) (53) 23 (53) Impact 1% weakening * 3 53 (23) 53 December 31, 2007
U.S. dollars in thousands
Pound Swiss NIS Sterling Euro Franc Other
Financial asset/liabilities, net (16,179) 3,758 4,480 (1,828) 5,598
Exchange gains/losses: Impact of 1% strengthening 124 (29) (34) 14 (43) Impact 1% weakening (124) 29 34 (14) 43
* Represents amounts lower than $1 thousand.
The change is primarily as a result of foreign exchange gains/losses on translation of foreign currencies - denominated trade receivables, financial assets at fair value through profit or loss and foreign exchange losses/gains on translation of foreign currencies -denominated borrowings.
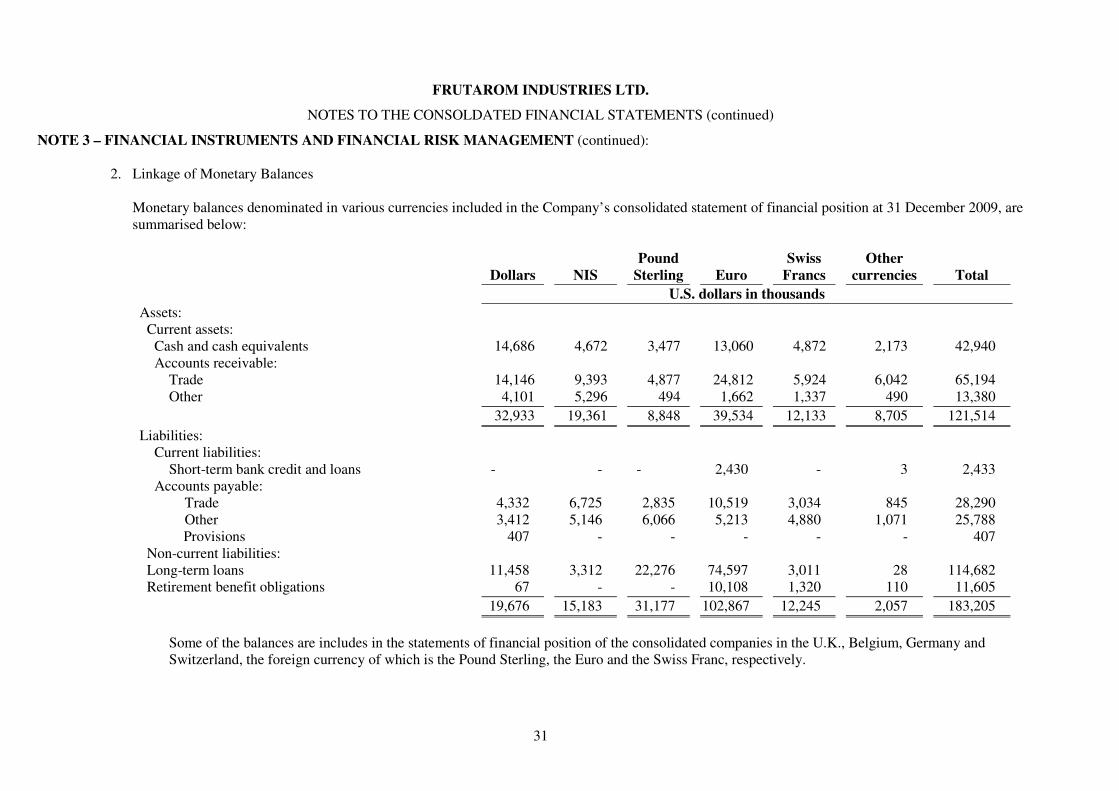
31
FRUTAROM INDUSTRIES LTD.
NOTES TO THE CONSOLDATED FINANCIAL STATEMENTS (continued)
NOTE 3 – FINANCIAL INSTRUMENTS AND FINANCIAL RISK MANAGEMENT (continued):
2. Linkage of Monetary Balances
Monetary balances denominated in various currencies included in the Company’s consolidated statement of financial position at 31 December 2009, are summarised below: Pound Swiss Other Dollars NIS Sterling Euro Francs currencies Total
U.S. dollars in thousands
Assets: Current assets:
Cash and cash equivalents 14,686 4,672 3,477 13,060 4,872 2,173 42,940 Accounts receivable:
Trade 14,146 9,393 4,877 24,812 5,924 6,042 65,194 Other 4,101 5,296 494 1,662 1,337 490 13,380
32,933 19,361 8,848 39,534 12,133 8,705 121,514
Liabilities: Current liabilities:
Short-term bank credit and loans - - - 2,430 - 3 2,433 Accounts payable:
Trade 4,332 6,725 2,835 10,519 3,034 845 28,290 Other 3,412 5,146 6,066 5,213 4,880 1,071 25,788 Provisions 407 - - - - - 407
Non-current liabilities: Long-term loans 11,458 3,312 22,276 74,597 3,011 28 114,682 Retirement benefit obligations 67 - - 10,108 1,320 110 11,605
19,676 15,183 31,177 102,867 12,245 2,057 183,205
Some of the balances are includes in the statements of financial position of the consolidated companies in the U.K., Belgium, Germany and Switzerland, the foreign currency of which is the Pound Sterling, the Euro and the Swiss Franc, respectively.

32
FRUTAROM INDUSTRIES LTD.
NOTES TO THE CONSOLDATED FINANCIAL STATEMENTS (continued)
NOTE 3 – FINANCIAL INSTRUMENTS AND FINANCIAL RISK MANAGEMENT (continued): Monetary balances denominated in various currencies included in the Company’s consolidated statement of financial position at 31 December 2008, are summarised below: : Pound Swiss Other Dollars NIS Sterling Euro Francs currencies Total
U.S. dollars in thousands
Assets: Current assets:
Cash and cash equivalents 8,061 3,661 2,456 11,707 8,544 2,800 37,229 Financial assets at fair value through profit or loss - - - 52 - - 52 Accounts receivable:
Trade 18,235 11,482 6,074 21,228 5,577 5,608 68,204 Other 2,806 3,344 241 3,205 1,608 369 11,573
29,102 18,487 8,771 36,192 15,729 8,777 117,058
Liabilities: Current liabilities:
Short-term bank credit and loans - 61 - 1,931 - - 1,992 Accounts payable:
Trade 5,732 5,768 1,712 9,959 2,768 766 26,705 Other 4,032 3,483 4,468 9,041 5,848 929 27,801 Provisions 29 783 - 216 - - 1,028
Non-current liabilities: Long-term loans 13,667 8,417 15,761 99,414 2,906 10 140,175 Retirement benefit obligations 426 - - 9,600 1,165 78 11,269 Provisions 1,420 - - - - - 1,420
25,306 18,512 21,941 130,161 12,687 1,783 210,390
Some of the balances are includes in the statements of financial position of the consolidated companies in the U.K., Belgium, Germany and Switzerland, the foreign currency of which is the Pound Sterling, the Euro and the Swiss Franc, respectively.

33
FRUTAROM INDUSTRIES LTD.
NOTES TO THE CONSOLDATED FINANCIAL STATEMENTS (continued)
NOTE 3 – FINANCIAL INSTRUMENTS AND FINANCIAL RISK MANAGEMENT (continued): Monetary balances denominated in various currencies included in the Company’s consolidated statement of financial position at 31 December 2007, are summarised below: Pound Swiss Other Dollars NIS Sterling Euro Francs currencies Total
U.S. dollars in thousands
Assets: Current assets:
Cash and cash equivalents 7,613 422 382 21,538 664 1,323 31,942 Financial assets at fair value through profit or loss - - - 1,279 - - 1,279 Accounts receivable:
Trade 21,233 10,662 10,544 27,118 6,592 1,857 78,006 Other 1,772 3,356 570 3,637 2,421 239 11,995
30,618 14,440 11,496 53,572 9,677 3,419 123,222
Liabilities: Current liabilities:
Short-term bank credit and loans - 2,052 20,864 1,095 3,023 8 27,042 Account payable:
Trade 7,151 7,556 4,594 13,446 4,971 1,079 38,797 Other 2,400 8,344 4,450 72,864 8,307 47 96,412 Provisions 259 181 - - - - 440
Non-current liabilities: Long-term loans 8,014 12,486 28 76,293 2,937 - 99,758 Retirement benefit obligations 480 - - 10,275 763 - 11,518 Provisions 1,420 - - - - - 1,420
19,724 30,619 29,936 173,973 20,001 1,134 275,387
Some of the balances are includes in the statements of financial position of the consolidated companies in the U.K., Belgium, Germany and Switzerland, the foreign currency of which is the Pound Sterling, the Euro and the Swiss Franc, respectively.

34
RUTAROM INDUSTRIES LTD.
NOTES TO THE CONSOLDATED FINANCIAL STATEMENTS (continued)
NOTE 3 – FINANCIAL INSTRUMENTS AND FINANCIAL RISK MANAGEMENT (continued):
(b) Raw Material Price Risks
Many of the raw materials used by the Group are natural products, which are seasonal. The Group purchases these for stock, generally during the season. Purchases are made out of season when necessary, sometimes at higher prices. The Group does not normally make future transactions. The Group is exposed to price changes in raw materials it uses in accordance with global price trends for these materials. The Group’s Purchasing Department maintains an ongoing follow up on material prices. Selling prices of the Group’s products are adjusted, as needed and as possible to significant and lengthy fluctuations in raw material prices.
2) Cash Flow Interest Rate Risk
Since on a current basis the Group does not have significant assets bearing interest, its revenues and operating cash flow are not dependent on changes in interest rates. The Group’s interest rate risk arises from long-term and short-term borrowings. Borrowings issued at variable rates expose the Group to cash flow interest rate risk. The Group analyses its interest rate exposure. Various scenarios are simulated taking into consideration refinancing, renewal of existing positions and alternative financing. Based on these scenarios, the Group calculates the impact on profit and loss of a defined interest rate shift. For each simulation, the same interest rate shift is used for all currencies. The scenarios are run only for liabilities that represent the major interest-bearing positions. Based on the simulations performed, the impact on post tax profit for the year 2009 of a 0.1% shift in interest on loans would have been a change of $94 thousand (2008- $90 thousand, 2007 - $32 thousand) in post tax profit.
3) Credit Risk
Credit risk arises from the possibility that the counter-party to a transaction may be unable or unwilling to meet their obligations causing a financial loss to the Group. Trade receivables are subject to a policy of active risk management, which focuses on the assessment of country risk, credit limits, ongoing credit evaluation and accounting monitoring procedures. There are no significant concentrations within trade receivables of counter-party credit risk due to the large number of customers that the Group deals with and their wide geographical spread. Country risk limits and exposures are continuously monitored. Collateral is generally not required. The provision for impairment of trade receivables is determined on basis of a periodic test of all amounts due. The exposure of other financial assets and liabilities to credit risk is controlled by setting a policy for limiting credit exposure to high-quality counter-parties, continuously reviewing credit ratings, and limiting individual aggregate credit exposure accordingly.

35
FRUTAROM INDUSTRIES LTD.
NOTES TO THE CONSOLDATED FINANCIAL STATEMENTS (continued)
NOTE 3 – FINANCIAL INSTRUMENTS AND FINANCIAL RISK MANAGEMENT (continued): No credit limits were exceeded during the reporting period, and management does not expect to incur any losses from non-performance by these counterparties.
4) Liquidity Risk
The Company’s subsidiaries must have sufficient availability of cash to meet their obligations. Each company is responsible for it's own cash management, including the short-term investment of cash surpluses and the raising of loans to cover cash deficits, subject to Group policies and guidelines.
The table presented below classifies the Group’s non-derivative financial liabilities into relevant maturity groupings based on the remaining period at December 31, 2009 to the contractual maturity date. Derivative financial liabilities are included in the analysis if their contractual repayment dates are essential for the understanding of the timing of the cash flows. The amounts presented in the table represent the contractual undiscounted cash flows.
Less than 1
year Between 1
and 3 years Between 3
and 5 years
U.S. dollars in thousands
As of 31 December 2009: Borrowings 48,828 68,093 3,523 Trade and other payables 54,485 - -
103,313 68,093 3,523
As of 31 December 2008: Borrowings 49,363 77,135 30,354 Trade and other payables 55,534 1,420 -
104,897 78,555 30,354
As of 31 December 2007: Borrowings 47,817 55,510 32,720 Trade and other payables 135,649 - 1,420
183,466 55,510 34,140
b. Capital risk management
Group’s objective is to maintain, as possible, stable capital structure, which according to Group's management its current capital structure, is stable. Consistent with others in the industry, the Group monitors capital, including others also, on the basis of the gearing ratio. This ratio is calculated as net debt divided by total capital. Net debt is calculated as total borrowings (including ‘current and non-current borrowings’ as shown in the consolidated statements of financial position) less cash and cash equivalents. Total capital is calculated as ‘equity’ as shown in the consolidated statements of financial position plus net debt.

36
FRUTAROM INDUSTRIES LTD.
NOTES TO THE FINANCIAL STATEMENTS (continued)
NOTE 3 – FINANCIAL RISK MANAGEMENT (continued): The gearing ratios at 31 December 2009, 2008 and 2007 were as follows:
2009 2008 2007
U.S. dollars in thousands
Total borrowings (Note 9) 117,115 142,167 126,800 Less - cash and cash equivalents (Note 18) (42,940) (37,229) (31,942)
Net debt 74,175 104,938 94,858
Total equity 318,475 278,260 251,115 Total capital 392,650 383,198 345,973 Gearing ratio 18.9% 27.4% 27.4%
The decrease in the Gearing ratio during 2009 resulting mainly from payment of loans. c. Fair Value of Financial Instruments:
The fair value of the financial instruments included in working capital of the Group is usually identical or close to their carrying value. The fair value of long-term receivables and long-term loans and other long-term liabilities also approximates the carrying value, since they bear interest at rates close to the prevailing market rates. The carrying amounts and fair values of the financial instruments are as follows:
Carrying amounts Fair values
31 December 31 December
2009 2008 2007 2009 2008 2007
U.S. dollars in thousands U.S. dollars in thousands
Assets: Current assets:
Accounts receivable: Trade 65,194 68,204 78,006 65,194 68,204 78,006 Other 13,380 11,573 11,995 13,380 11,573 11,995
78,574 79,777 90,001 78,574 79,777 90,001
Liabilities: Current liabilities:
Short-term credit and loans 2,433 1,992 27,042 2,433 1,992 27,042
Accounts payable: Trade 28,290 26,705 38,797 28,290 26,705 38,797 Other 26,195 28,829 96,852 26,195 28,829 96,852
Non-current liabilities: Long-term loans 114,682 140,175 99,758 114,682 140,175 99,758 Provisions for other liabilities - 1,420 1,420 - 1,352 1,288
171,600 199,121 263,869 171,600 199,053 263,737
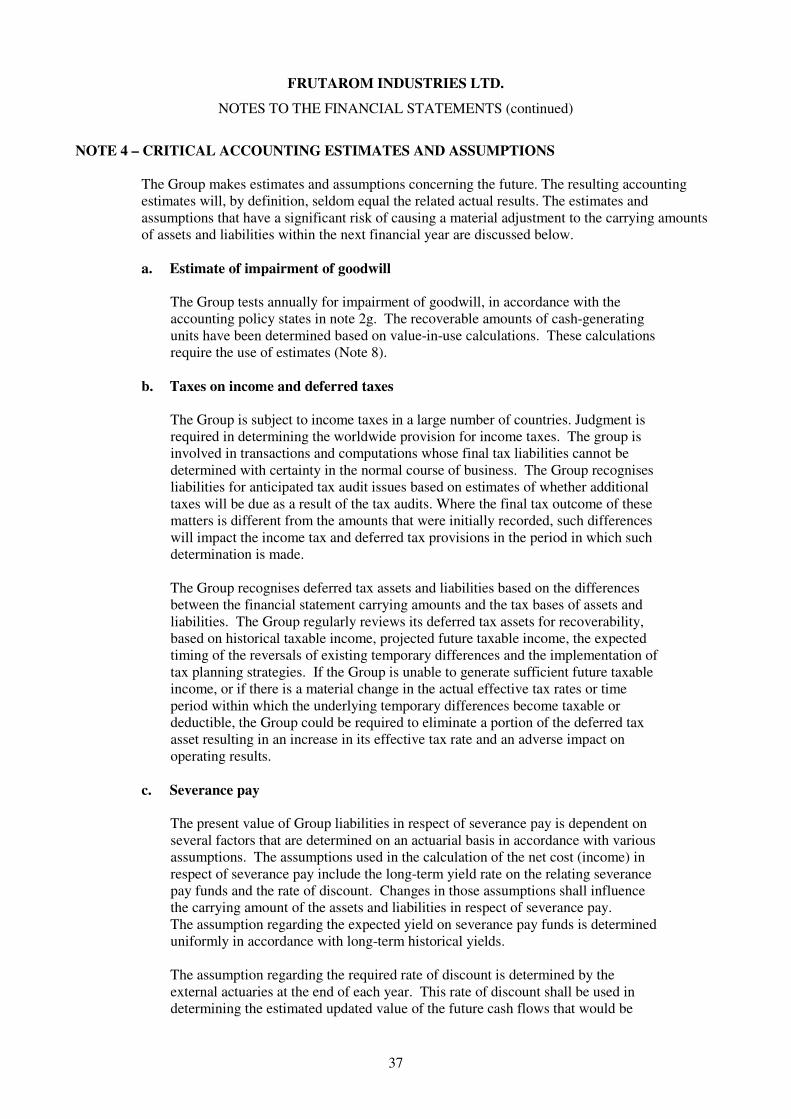
37
FRUTAROM INDUSTRIES LTD.
NOTES TO THE FINANCIAL STATEMENTS (continued)
NOTE 4 – CRITICAL ACCOUNTING ESTIMATES AND ASSUMPTIONS
The Group makes estimates and assumptions concerning the future. The resulting accounting estimates will, by definition, seldom equal the related actual results. The estimates and assumptions that have a significant risk of causing a material adjustment to the carrying amounts of assets and liabilities within the next financial year are discussed below. a. Estimate of impairment of goodwill
The Group tests annually for impairment of goodwill, in accordance with the accounting policy states in note 2g. The recoverable amounts of cash-generating units have been determined based on value-in-use calculations. These calculations require the use of estimates (Note 8).
b. Taxes on income and deferred taxes
The Group is subject to income taxes in a large number of countries. Judgment is required in determining the worldwide provision for income taxes. The group is involved in transactions and computations whose final tax liabilities cannot be determined with certainty in the normal course of business. The Group recognises liabilities for anticipated tax audit issues based on estimates of whether additional taxes will be due as a result of the tax audits. Where the final tax outcome of these matters is different from the amounts that were initially recorded, such differences will impact the income tax and deferred tax provisions in the period in which such determination is made. The Group recognises deferred tax assets and liabilities based on the differences between the financial statement carrying amounts and the tax bases of assets and liabilities. The Group regularly reviews its deferred tax assets for recoverability, based on historical taxable income, projected future taxable income, the expected timing of the reversals of existing temporary differences and the implementation of tax planning strategies. If the Group is unable to generate sufficient future taxable income, or if there is a material change in the actual effective tax rates or time period within which the underlying temporary differences become taxable or deductible, the Group could be required to eliminate a portion of the deferred tax asset resulting in an increase in its effective tax rate and an adverse impact on operating results.
c. Severance pay
The present value of Group liabilities in respect of severance pay is dependent on several factors that are determined on an actuarial basis in accordance with various assumptions. The assumptions used in the calculation of the net cost (income) in respect of severance pay include the long-term yield rate on the relating severance pay funds and the rate of discount. Changes in those assumptions shall influence the carrying amount of the assets and liabilities in respect of severance pay. The assumption regarding the expected yield on severance pay funds is determined uniformly in accordance with long-term historical yields. The assumption regarding the required rate of discount is determined by the external actuaries at the end of each year. This rate of discount shall be used in determining the estimated updated value of the future cash flows that would be

38
FRUTAROM INDUSTRIES LTD.
NOTES TO THE CONSOLDATED FINANCIAL STATEMENTS (continued)
NOTE 4 – CRITICAL ACCOUNTING ESTIMATES AND ASSUMPTIONS (continued):
required to cover the severance pay liabilities. The liquidity of the market of high-quality corporate bonds is sufficient to serve as basis for determining the rate of discount. Therefore, in determining this rate the Group uses interest rate in the currency in which the benefits will be paid.
Other key assumptions relating to pension liabilities, such as future payroll raise are based on existing rates of payroll inflation.
d. Provision
Provision for legal liabilities are recorded in the books of accounts in accordance with Group management’s judgment regarding the reasonability that the cash flows shall indeed by used to meet the liabilities, and on the basis of the estimate determined by the management regarding the present value of the expected cash outflows that would be required to meet the existing liabilities.
NOTE 5 – BUSINESS COMBINATIONS:
a. Acquisition of Belmay in 2007
On 1 April 2007 the Group purchased 100% of the issued and paid up share capital of the English company Belmay (hereafter – Belmay) in consideration for $17.8 million. Belmay develops, produces and markets flavours for the food and beverage industry. The cost of acquisition was allocated to assets (both tangible and intangible and including goodwill) and to liabilities purchased according to their fair value on the date of acquisition.
The cost of acquisition presented in this report aggregates $18,474 thousand. The intangible assets which were recognized include: Product formulas in the amount of £ 1,229 thousand ($2,402 thousand), customer relations in the amount of £ 1,159 thousand ($2,266 thousand) and goodwill in the amount of £ 4,662 thousand ($9,119 thousand). Product formulas and customer relations are amortised over an economic period of 20 years and 10 years, respectively. Goodwill is not amortised but it is examined for impairment on an annual basis. The operations of Belmay were merged with the Group's extracts operations in the UK.
b. Acquisition of Jupiter in 2007
On 19 April, 2007, the Group purchased 100% of the issued and paid up share capital of the English company Jupiter Flavours Limited (hereafter – Jupiter). Jupiter is a U.K company that develops, produces and markets flavours. At date of acquisition, the company paid an amount of £ 1,477 thousand ($2.8 million) in cash. In addition, a future consideration not exceeding the amount of $600 thousand which was based on the future results of Jupiter during the period ended 31 July 2007 was set in the purchase agreement. The said amount of £ 300 thousand ($600 thousand) was paid during 2007. The cost of acquisition was allocated to tangible and intangible assets (including goodwill) and to liabilities that were purchased based on their fair value at date of acquisition.

39
FRUTAROM INDUSTRIES LTD.
NOTES TO THE CONSOLDATED FINANCIAL STATEMENTS (continued)
NOTE 5 – BUSINESS COMBINATIONS (continued):
The cost of acquisition presented in this report aggregates $3,614 thousand. The intangible assets which were recognized include: product formulas in the amount of £ 249 thousand ($498 thousand), customer relations in the amount of £ 428 thousand ($856 thousand) and goodwill in the amount of £ 1,198 thousand ($2,396 thousand). Product formulas and customer relations are amortised over an economic period of 20 years and 10 years, respectively. Goodwill is not amortised but it is examined for impairment on an annual basis. The operations of Jupiter were merged with the Group's extracts operations in the UK.
c. Acquisition of Reichan in 2007
On 27 August 2007, the Group acquired 100% of the share capital of Reichan Ltd. (hereafter- Reichan). Reichan is engaged in developing, producing and marketing mixtures of flavours as well as in marketing raw materials for the food industry. In consideration for the acquisition, the Company paid an amount of NIS 4,250 thousand (approximately $1,030 thousand). The cost of acquisition was attributed to assets (tangible and intangible including goodwill) and to liabilities purchased according to their fair value on the date of acquisition. The cost of acquisition presented in this report aggregates approximately NIS 4,443 thousand (approximately $1,073 thousand). The intangible assets which were recognized include goodwill in the amount of NIS 10,801 thousand ($2,619 thousand). Goodwill is not amortised but tested for impairment annually. The operations of Reichan were merged with the Group's operations in the Akko plant.
d. Acquisition of the operations of Adumim in 2007
On 30 August 2007, the Group acquired the operations of Adumim Food Supplements Ltd. (hereafter – Adumim). Adumim is a public company traded in the Tel-Aviv Stock Exchange. Adumim is engaged in two main fields of operations: The development, production and marketing of supplements and raw materials for the food and functional food industries, and the development and production of dietary supplements. In consideration for the acquisition, the Company paid an amount of $4,250 thousand in cash. In accordance with the purchase agreement, the Company acquired the property, plant and equipment in the amount of $789 thousand and the inventory in the amount of $860 thousand. The balance of the other cost of acquisition was allocated to tangible assets, intangible assets (including goodwill) and to liabilities that were acquired based on their fair value at date of acquisition. The intangible assets which were recognized include: product formulas in the amount of $88 thousand, customer relations in the amount of $250 thousand and goodwill in the amount of $2,498 thousand. Product formulas and customer relations are amortized over an economic period of 20 years and 10 years, respectively. Goodwill is not amortized but it is examined for impairment on an annual basis.

40
FRUTAROM INDUSTRIES LTD.
NOTES TO THE CONSOLDATED FINANCIAL STATEMENTS (continued)
NOTE 5 – BUSINESS COMBINATIONS (continued):
The operations of Adumim were partially merged with the Group's operations in the Haifa Bay plant.
e. Acquisition of Abaco in 2007 On 3 July 2007, the Group acquired 100% of the share capital of the U.S. companies Abaco Manufacturing LLC and Abaco Incorporated (hereafter - Abaco). Abaco is engaged in the development, production and marketing unique raw materials for the flavour and aroma industry. In consideration for the acquisition, the Company paid an amount of $4 million in cash and on the date of acquisition. In addition, it undertook a debt of Abaco in the amount of $1.1 million. The cost of the acquisition is to be allocated to acquired tangible and intangible assets (including goodwill) and to liabilities based on their fair value at date of acquisition. The cost of acquisition presented in this report aggregates $5,200 thousand. The intangible assets which were recognized include: product formulas in the amount of $654 thousand, customer relations in the amount of $688 thousand and goodwill in the amount of $2,693 thousand. Product formulas and customer relations are amortised over an economic period of 20 years and 10 years, respectively. Goodwill is not amortised but it is examined for impairment on an annual basis. In 2008, the amount of the goodwill was updated by $190 thousand as part of the fair value adjustments as of acquisition date and the company received a refund of $425 thousand. The operations of Abaco were merged with the Group's operations in the U.S. plant.
f. Acquisition of the Gewurzmuller Group in 2007
On 11 October 2007, the Group signed an agreement for the acquisition of 100% of the share capital of The Gewurzmuller Group. The Gewurzmuller Group is engaged in the development, production and marketing of savoury flavours solutions (a spectrum of non-sweet flavours) and of Starter Culture -natural products based on microbiological processes. The consideration of the acquisition is approximately € 47.3 million (approximately $67 million). Based on the purchase agreement, a mechanism was set for the payment of a future consideration. As a result, the final consideration that was paid represented to the Gewurzmuller Group a value based on the average multiplier of 7.1 with respect to the EBITDA it obtained during the period of 12 months ended on 31 December 2007. This future consideration of € 13.9 million ($21.7 million) was paid on 14 July and 24 July and on 8 September 2008. The consideration of the acquisition was financed by a long-term bank loan (5 years), which bears interest at a rate of an annual LIBOR plus 1% during the first year and an annual LIBOR plus 1.2% as from the second year. Under the loan agreement, the Group undertook to comply with the following financial criteria:

41
FRUTAROM INDUSTRIES LTD.
NOTES TO THE CONSOLDATED FINANCIAL STATEMENTS (continued)
NOTE 5 – BUSINESS COMBINATIONS (continued):
1. The amount of the equity of the Group will not, at any time whatsoever, be less than
$180 Million. 2. The amount of the equity of the Group will not be less than 30% of its total balance
sheet. 3. The ratio - a division of the Group's total financial liabilities by the operating profit
from current operations before tax expenses plus depreciation and amortization expenses - will not exceed 6.
As to meeting the aforementioned criteria, see note 9.
The cost of acquisition was allocated to assets (tangible and intangible) (including goodwill) and to liabilities (including future consideration) acquired according to their fair value at date of acquisition. The cost of acquisition presented in this report aggregates € 61,370 thousand ($85,507 thousand). The intangible assets which were recognized include: product formulas in the amount of € 2,857 thousand ($4,051 thousand), customer relations in the amount of € 9,636 thousand ($13,663 thousand) and goodwill in the amount of € 42,587 thousand ($59,336 thousand). Product formulas and customer relations are amortized over an economic period of 20 years and 10 years, respectively. Goodwill is not amortized but it is examined for impairment on an annual basis. Further to the payment of the future consideration and in accordance with the purchase agreement, the Group updated in 2008 the cost of acquisition and as results, goodwill decreased by €5.2 million ($7.9 million dollars).
g. Acquisition of Rad Natural Technologies in 2007
On November 15, 2007, the Group acquired the operations and assets of Rad Ltd. (hereafter – Rad). Rad is engaged in the research and development, manufacture, marketing, distribution and sale of unique natural extracts from plants with anti-oxidant activities for the use in food products, dietary supplements and cosmetics and its know-how in the field is unique and protected by patents. In accordance with the agreement, the company acquired the assets of Rad, which include fixed assets, inventories, agreements, orders, goodwill, intellectual property and expenses in advance (the Group did not undertake Rad's liabilities) in consideration for a cash payment of U.S. $4.1 million, which was financed by a bank credit. A payment mechanism for a future consideration was determined in the agreement, according to which Rad will be entitled to an additional consideration, if the total sales of its products in the years 2008 and 2009 exceed $4 million. Rad will be entitled to an amount of $4.9 million, if the total sales of its products in the years 2008 and 2009 exceed $11.1 million.
42
FRUTAROM INDUSTRIES LTD.
NOTES TO THE CONSOLDATED FINANCIAL STATEMENTS (continued)
NOTE 5 – BUSINESS COMBINATIONS (continued):
Under the agreement, Rad's manager undertook to be employed at least until 31 December 2009, and the Company undertook to employ her at least until that date. The cost of acquisition was allocated to tangible assets and to intangible assets (including goodwill) that were purchased based on their fair value at date of acquisition. The cost of acquisition presented in this report aggregates $5,768 thousand. The intangible assets which were recognized include: product formulas in the amount of $5,236 thousand. Product formulas are amortised over an economic period of 20 years.
h. Acquisition of Oxford Chemicals Limited
On 30 January, 2009, the Group acquired the operations of Oxford Chemicals Limited (hereafter- Oxford). Oxford is a UK resident company engaged in the development, manufacture and marketing of unique raw materials for the flavour and fragrances industry. The consideration paid in cash in respect of the acquisition was ₤ 8,250 thousand (U.S. $11,734 thousand); the acquisition was financed by a long-term loan. The cost of acquisition was allocated to tangible assets, intangible assets (including goodwill) and to acquired liabilities based on their fair value at the date of acquisition. The cost of acquisition presented in these financial statements includes acquisition costs. The cost of acquisition amounts to ₤ 8,630 thousand (U.S. $12,274 thousand). The intangible assets that were recognized include: products formulas at the total amount of ₤ 697 thousand (U.S. $991 thousand), customer relationships at the total amount of ₤ 871 thousand (U.S. $1,239 thousand) and goodwill at the total amount of ₤ 3,751 thousand (U.S. $5,335 thousand). The products formula and customers relationship are amortized over an economic life of 20 years and 10 years, respectively. The goodwill is not amortized but tested annually for impairment.
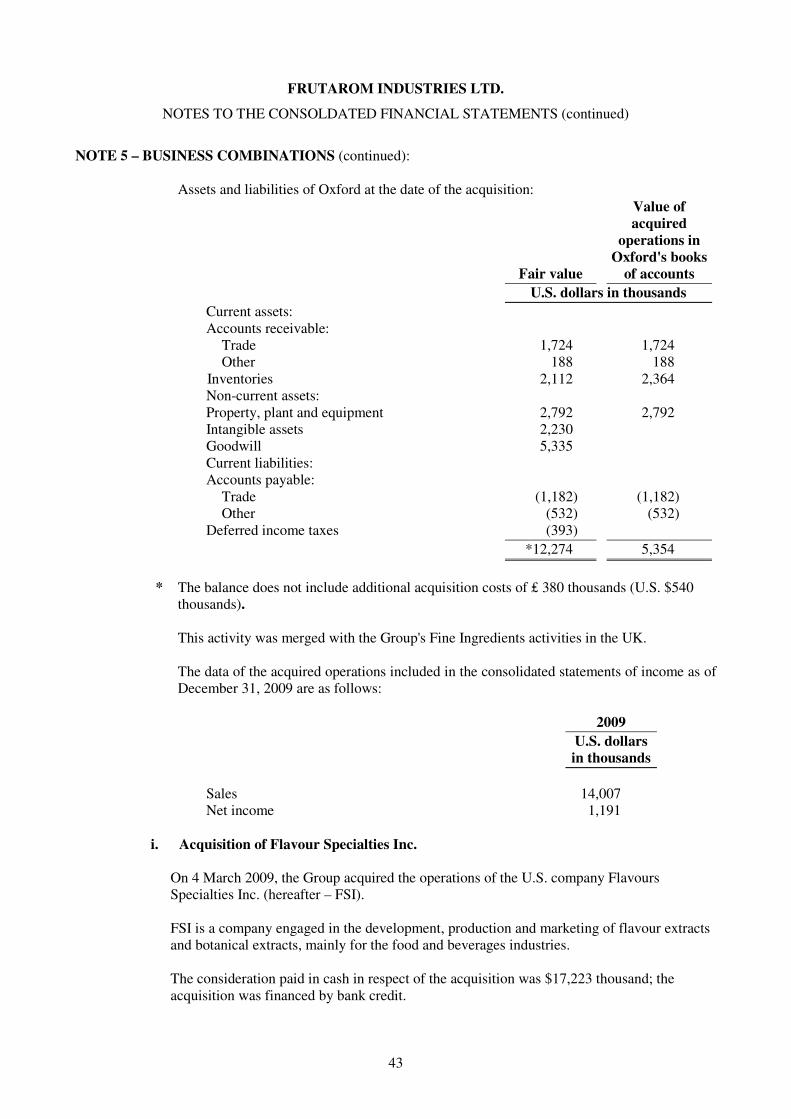
43
FRUTAROM INDUSTRIES LTD.
NOTES TO THE CONSOLDATED FINANCIAL STATEMENTS (continued)
NOTE 5 – BUSINESS COMBINATIONS (continued):
Assets and liabilities of Oxford at the date of the acquisition:
Fair value
Value of acquired
operations in Oxford's books
of accounts
U.S. dollars in thousands
Current assets: Accounts receivable:
Trade 1,724 1,724 Other 188 188
Inventories 2,112 2,364 Non-current assets: Property, plant and equipment 2,792 2,792 Intangible assets 2,230 Goodwill 5,335 Current liabilities: Accounts payable:
Trade (1,182) (1,182) Other (532) (532)
Deferred income taxes (393)
*12,274 5,354
* The balance does not include additional acquisition costs of ₤ 380 thousands (U.S. $540
thousands). This activity was merged with the Group's Fine Ingredients activities in the UK.
The data of the acquired operations included in the consolidated statements of income as of December 31, 2009 are as follows:
2009
U.S. dollars in thousands
Sales 14,007 Net income 1,191
i. Acquisition of Flavour Specialties Inc.
On 4 March 2009, the Group acquired the operations of the U.S. company Flavours Specialties Inc. (hereafter – FSI). FSI is a company engaged in the development, production and marketing of flavour extracts and botanical extracts, mainly for the food and beverages industries. The consideration paid in cash in respect of the acquisition was $17,223 thousand; the acquisition was financed by bank credit.

44
FRUTAROM INDUSTRIES LTD.
NOTES TO THE CONSOLDATED FINANCIAL STATEMENTS (continued)
NOTE 5 – BUSINESS COMBINATIONS (continued):
The purchase agreement stipulates a mechanism for the payment of a future consideration based on the average EBITDA achieved by FSI in the course of the 24 months ending 31 December 2010, multiplied by 5.5 so that the total consideration may increase to $27 million or decrease to $13.35 million. The said mechanism would increase the consideration in case where the average EBITDA of the acquired operations would exceed $3.1 Million ; the said mechanism would decrease the consideration in case where the average EBITDA of the acquired operations would decrease below $2.7 million. In no case will the additional amount exceed $10 million and the amount refunded would not exceed $3.85 million. Company's management estimates that it would be refunded with $3.85 million; this amount is capitalized and presented as of acquisition date at the total of $3,721 thousand. The cost of acquisition was allocated to tangible assets and intangible assets (including goodwill) acquired based on their fair value at the date of acquisition.
The cost of acquisition presented in these financial statements, which include acquisition costs, amount to $13,737 thousand. The intangible assets that were recognized include: products formulas at the total amount of U.S. $2,337 thousand, customer relationships at the total amount of U.S. $1,147 thousand and goodwill at the total amount of U.S. $7,043 thousand. The products formula and customers relationship are amortized over an economic life of 20 years and 7 years, respectively. The goodwill is not amortized but tested annually for impairment.
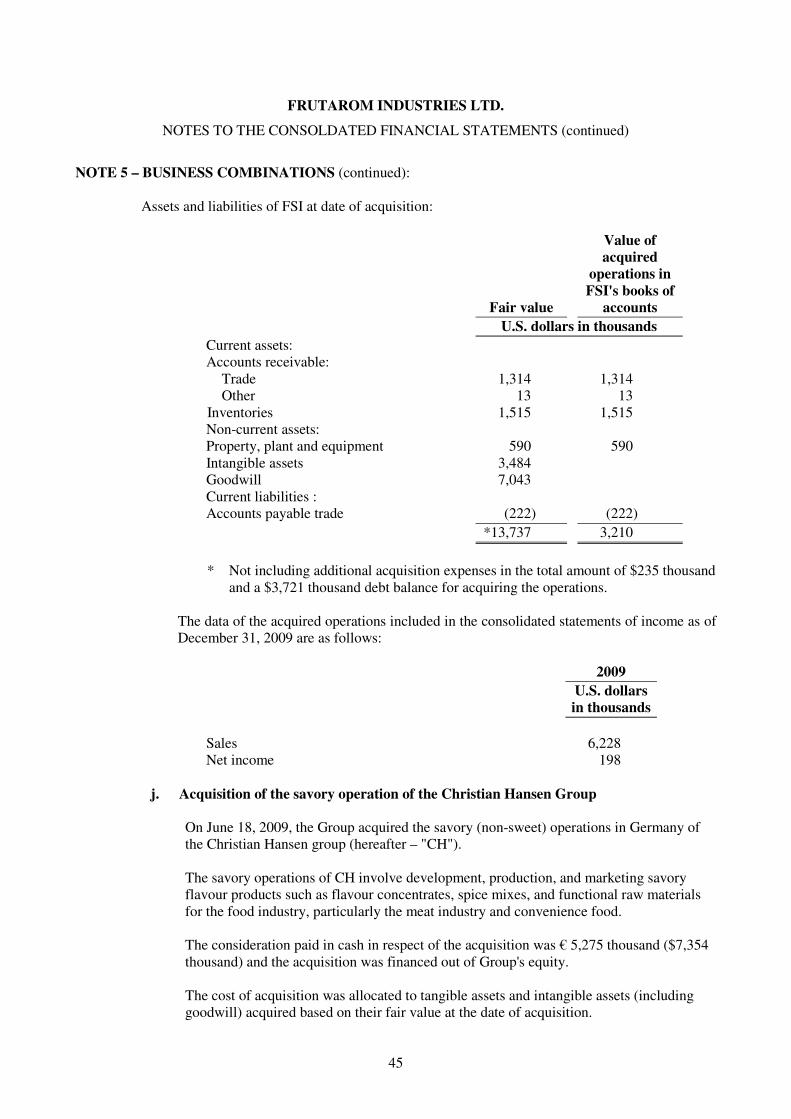
45
FRUTAROM INDUSTRIES LTD.
NOTES TO THE CONSOLDATED FINANCIAL STATEMENTS (continued)
NOTE 5 – BUSINESS COMBINATIONS (continued):
Assets and liabilities of FSI at date of acquisition:
Fair value
Value of acquired
operations in FSI's books of
accounts
U.S. dollars in thousands
Current assets: Accounts receivable:
Trade 1,314 1,314 Other 13 13
Inventories 1,515 1,515 Non-current assets: Property, plant and equipment 590 590 Intangible assets 3,484 Goodwill 7,043 Current liabilities : Accounts payable trade (222) (222)
*13,737 3,210
* Not including additional acquisition expenses in the total amount of $235 thousand
and a $3,721 thousand debt balance for acquiring the operations.
The data of the acquired operations included in the consolidated statements of income as of December 31, 2009 are as follows:
2009
U.S. dollars in thousands
Sales 6,228 Net income 198
j. Acquisition of the savory operation of the Christian Hansen Group
On June 18, 2009, the Group acquired the savory (non-sweet) operations in Germany of the Christian Hansen group (hereafter – "CH"). The savory operations of CH involve development, production, and marketing savory flavour products such as flavour concentrates, spice mixes, and functional raw materials for the food industry, particularly the meat industry and convenience food. The consideration paid in cash in respect of the acquisition was € 5,275 thousand ($7,354 thousand) and the acquisition was financed out of Group's equity. The cost of acquisition was allocated to tangible assets and intangible assets (including goodwill) acquired based on their fair value at the date of acquisition.

46
FRUTAROM INDUSTRIES LTD.
NOTES TO THE CONSOLDATED FINANCIAL STATEMENTS (continued)
NOTE 5 – BUSINESS COMBINATIONS (continued):
The cost of acquisition presented in these financial statements (including acquisition costs) amounts to € 5,425 thousand ($7,563 thousand).
The intangible assets that were recognized include: products formulas at the total amount of € 335 thousand ($467 thousand), customer relationships at the total amount of € 339 thousand ($473 thousand) and goodwill at the total amount of € 3,005 thousand ($4,190 thousand). The products formula and customers relationship are amortized over an economic life of 20 years and 10 years, respectively. The goodwill is not amortized but tested annually for impairment. The acquired operation is synergetic to the Group's savory operation in Germany and was merged into the existing savory operation.
Assets and liabilities of CH at date of acquisition:
Fair value
Value of acquired
operations in CH's books of
accounts
U.S. dollars in thousands
Current assets: Accounts receivable- other 74 Inventories 1,097 1,171 Non-current assets: Property, plant and equipment 1,181 1,372 Intangible assets 940 Goodwill 4,190 Deferred income taxes 81
*7,563 2,543
* Not including additional acquisition expenses in the total amount of € 150
thousand ($209 thousand).
The data of the acquired operations included in the consolidated statements of income as of December 31, 2009 are as follows:
2009
U.S. dollars in thousands
Sales 5,076
k. If the acquisitions had been taken place on 1 January 2009, based on unaudited
information provided by the owners of the acquired operation, according to the accounting policy of that entity prior to the acquisition, the group's revenues for the year ended 31 December 2009 would have been amounted to $432,002 thousands and the net income for that year would have been $33,486 thousands.

47
FRUTAROM INDUSTRIES LTD.
NOTES TO THE CONSOLDATED FINANCIAL STATEMENTS (continued)
NOTE 5 – BUSINESS COMBINATIONS (continued):
Further, interest expenses were recognized in respect of loans obtained for financing the acquisitions and the results of acquired operations were adjusted to reflect the depreciation and amortization that would have been recorded in the period, assuming that fair value adjustments of property, plant and equipment and intangible assets on the acquisitions would have been done on 1 January 2009 while taking into account resulting tax effects.

48
FRUTAROM INDUSTRIES LTD.
NOTES TO THE CONSOLIDATED FINANCIAL STATEMENTS (continued)
NOTE 6 – SEGMENT REPORTING
a. Segment data provided to the President and the CEO in respect of the reported segments for the year ended December 31, 2009 is as follows:
Flavours
operations
Fine ingredients
operations
Trade and marketing operations
Eliminations
Consolidated
Income statement data: U.S. dollars in thousands
Sales – net: Unaffiliated customers 297,062 121,043 7,074 - 425,179 Intersegment - 2,735 - (2,735) -
Total sales and other operating income 297,062 123,778 7,074 (2,735) 425,179
Segment results 37,712 9,193 480 (100) 47,285
Unallocated corporate expenses – net -
Operating profit 47,285 Financial expenses 4,344 Taxes on income 9,721
Net income 33,220
Other data: Segment assets 295,448 94,940 3,763 394,151 Unallocated corporate assets 131,962
Consolidated total assets 526,113
Segment liabilities 71,276 32,630 430 104,336 Unallocated corporate liabilities 103,302
Consolidated total liabilities 207,638
Cost of acquisition of long-term assets 2,077 1,592 Depreciation and amortization 9,484 2,648

49
FRUTAROM INDUSTRIES LTD.
NOTES TO THE CONSOLIDATED FINANCIAL STATEMENTS (continued)
NOTE 6 – SEGMENT REPORTING (continued):
Segment data provided to the President and the CEO in respect of the reported segments for the year ended December 31, 2008 is as follows:
Flavours
operations
Fine ingredients
operations
Trade and marketing operations
Eliminations
Consolidated
Income statement data: U.S. dollars in thousands
Sales – net: Unaffiliated customers 339,819 120,292 13,175 - 473,286 Intersegment - 4,047 - (4,047) -
Total sales and other operating income 339,819 124,339 13,175 (4,047) 473,286
Segment results 47,557 8,332 814 (92) 56,611
Unallocated corporate expenses – net -
Operating profit 56,611 Financial expenses 10,550 Taxes on income 8,832
Net income 37,229
Other data: Segment assets 279,571 74,726 5,296 359,593 Unallocated corporate assets 151,199
Consolidated total assets 510,792
Segment liabilities 73,403 24,849 687 98,939 Unallocated corporate liabilities 133,593
Consolidated total liabilities 232,532
Cost of acquisition of long-term assets 4,990 2,342 Depreciation and amortization 10,863 1,942

50
FRUTAROM INDUSTRIES LTD.
NOTES TO THE CONSOLIDATED FINANCIAL STATEMENTS (continued)
NOTE 6 – SEGMENT REPORTING (continued):
Segment data provided to the President and the CEO in respect of the reported segments for the year ended December 31, 2007 is as follows:
Flavours
operations
Fine ingredients operations
Trade and marketing operations
Eliminations
Consolidated
Income statement data: U.S. dollars in thousands
Sales – net: Unaffiliated customers 247,672 110,088 10,501 - 368,261 Intersegment - 4,863 - (4,863) -
Total sales and other operating income 247,672 114,951 10,501 (4,863) 368,261
Segment results 26,823 7,904 497 (698) 34,526 Unallocated corporate expenses - net -
Operating profit 34,526 Financial expenses 2,923 Taxes on income 7,410
Net income 24,193
Other data: Segment assets 320,808 77,642 2,295 400,745 Unallocated corporate assets 147,966
Consolidated total assets 548,711
Segment liabilities 154,067 17,231 512 171,810 Unallocated corporate liabilities 125,786
Consolidated total liabilities 297,596
Cost of acquisition of long-term assets 6,786 3,567 Depreciation and amortization 6,416 1,534

51
FRUTAROM INDUSTRIES LTD.
NOTES TO THE CONSOLIDATED FINANCIAL STATEMENTS (continued)
NOTE 6 – SEGMENT REPORTING (continued):
b. Additional information:
1) Business Segments
For management purposes, the Group is organized on a worldwide basis into two major operating activities: Flavour and Fine Ingredients. Another operating activity is Trade and Marketing, which is incorporated as a separate company in Israel (each operation is considered to be a reportable segment (Note 2d). The Flavour operation is engaged in the development, manufacturing and marketing of flavours, compounds and food systems. The Fine Ingredients operation is engaged in the development, manufacturing and marketing of natural flavours extracts, natural functional food ingredients, natural pharma-nutraceutical extracts, specialty essential oils and citrus products, aroma chemicals and natural gums. The Trade and Marketing activity focuses in trade and marketing of raw materials produced by third parties to customers in Israel. These operations are the basis on which the Group reports its primary segment information.
2) Geographical Segment information
The Group has operating production facilities in Europe, North America, Israel and Asia. In addition, the Group has 27 research and development laboratories and sells and markets its products principally through its 48 sales and marketing offices. The trade and marketing operations of raw materials are carried out in Israel by a subsidiary of the Company, which imports products not produced by Frutarom Ltd.
3) Sales by Destination Based on Customer Location
Following are data regarding the distribution of the Company’s consolidated sales by geographical market (based on customer locations):
Year ended 31 December
2009 2008 2007
U.S. dollars in thousands
Europe, Africa and the Middle East 298,723 333,176 254,012 America 49,718 52,510 45,950 Israel* 37,079 52,804 40,486 Asia and the Far East 39,659 34,796 27,813
425,179 473,286 368,261
*Including trade and marketing operations 7,047 13,175 10,501
52
FRUTAROM INDUSTRIES LTD.
NOTES TO THE CONSOLIDATED FINANCIAL STATEMENTS (continued)
NOTE 6 – SEGMENT REPORTING (continued):
4) Segment Assets and Liabilities.
Segment assets include all operating assets used by a segment and consist principally of receivables, inventories, property, plant and equipment and intangible assets, net of impairments and provisions. While most such assets can be directly attributed to individual segments, the carrying value of certain assets used jointly by two or more segments is allocated to the segments on a reasonable basis. Segment liabilities include all operating liabilities and consist principally of trade payables, wages, and taxes currently payable and accrued liabilities (including severance pay).
5) Inter-Segment Transfers.
Segment revenue, segment expenses and segment results include transfers between business segments and between geographical segments. Such transfers are accounted for at normal terms and conditions charged to unaffiliated customers for similar goods. Such transfers are eliminated in consolidation.

53
FRUTAROM INDUSTRIES LTD.
NOTES TO THE CONSOLIDATED FINANCIAL STATEMENTS (continued)
NOTE 7 – PROPERTY, PLANT AND EQUIPMENT
Composition of Assets, Grouped by Major Classifications and Changes Therein is as Follows:
2009:
Cost Accumulated depreciation Depreciated
Balance at Additions Retirements Balance Balance at Additions Retirements Balance balance
beginning during during at end beginning during during the at end 31 December of year the year the year Other* of year of year the year year Other* of year 2009
U.S. dollars in thousands U.S. dollars in thousands
Land and buildings 55,981 810 (717) 4,671 60,745 8,620 2,006 (452) 334 10,508 50,237 Machinery and equipment 102,036 3,540 (228) 4,469 109,817 46,613 7,056 (145) 1,644 55,168 54,649 Vehicles and forklifts 3,664 377 (1,210) 182 3,013 1,521 591 (540) 39 1,611 1,402 Furniture and office equipment (including computers) 30,086 642 (168) 1,201 31,761 22,273 1,770 (118) 651 24,576 7,185 Leasehold improvements 19,882 28 (64) 1,140 20,986 6,917 1,123 (31) 337 8,346 12,640
211,649 5,397 (2,387) 11,663 226,322 85,944 12,546 (1,286) 3,005 100,209 126,113
* Arising from translation of foreign currency financial statements of consolidated subsidiaries and from acquisition of companies and operations.

54
FRUTAROM INDUSTRIES LTD.
NOTES TO THE CONSOLIDATED FINANCIAL STATEMENTS (continued)
NOTE 7 – PROPERTY, PLANT AND EQUIPMENT
Composition of Assets, Grouped by Major Classifications and Changes Therein is as Follows:
2008:
Cost Accumulated depreciation Depreciated
Balance at Additions Retirements Balance Balance at Additions Retirements Balance balance
beginning during during at end beginning during during the at end 31 December of year the year the year Other* of year of year the year year Other* of year 2007
U.S. dollars in thousands U.S. dollars in thousands
Land and buildings 61,281 825 (5,487) (638) 55,981 8,171 2,311 (1,406) (456) 8,620 47,361 Machinery and equipment 99,429 7,059 (2,336) (2,116) 102,036 42,979 6,882 (1,793) (1,455) 46,613 55,423 Vehicles and forklifts 3,667 785 (769) (19) 3,664 1,408 631 (504) (14) 1,521 2,143 Furniture and office equipment (including computers) 29,749 1,620 (696) (587) 30,086 22,250 1,555 (659) (873) 22,273 7,813 Leasehold improvements 23,940 173 (2,100) (2,131) 19,882 7,651 2,255 (2,035) (954) 6,917 12,965
218,066 10,462 (11,388) (5,491) 211,649 82,459 13,634 (6,397) (3,752) 85,944 125,705
* Arising from translation of foreign currency financial statements of consolidated subsidiaries.

55
FRUTAROM INDUSTRIES LTD.
NOTES TO THE CONSOLIDATED FINANCIAL STATEMENTS (continued)
NOTE 7 – PROPERTY, PLANT AND EQUIPMENT
Composition of Assets, Grouped by Major Classifications and Changes Therein is as Follows:
2007:
Cost Accumulated depreciation Depreciated
Balance at Additions Retirements Balance Balance at Additions Retirements Balance balance
beginning during during at end beginning during during the at end 31 December of year the year the year Other* of year of year the year year Other* of year 2007
U.S. dollars in thousands U.S. dollars in thousands
Land and buildings 54,124 74 7,083 61,281 6,077 225 - 1,869 8,171 53,110 Machinery and equipment 79,380 8,736 (782) 12,095 99,429 32,994 5,181 (450) 5,254 42,979 56,450 Vehicles and forklifts 3,083 1,027 (807) 364 3,667 1,127 539 (556) 298 1,408 2,259 Furniture and office equipment (including computers) 10,138 1,563 (317) 18,365 29,749 7,107 1,574 (239) 13,808 22,250 7,499 Leasehold improvements 3,634 3,285 (89) 17,110 23,940 1,399 2,022 - 4,230 7,651 16,289
150,359 14,685 (1,995) 55,017 218,066 48,704 9,541 (1,245) 25,459 82,459 135,607
* Arising from translation of foreign currency financial statements of consolidated subsidiaries and from acquisition of consolidated companies and operations.

56
FRUTAROM INDUSTRIES LTD.
NOTES TO THE CONSOLIDATED FINANCIAL STATEMENTS (continued)
NOTE 8 – INTANGIBLE ASSETS
Original amount Amortized balance
31 December 31 December
2009 2008 2007 2009 2008 2007
U.S. dollars in thousands
Know-how and product formulas 35,645 30,385 33,723 28,255 24,899 28,733
Goodwill 136,522 115,775 132,249 135,262 114,582 130,829 Customer relations 26,469 22,502 24,281 19,703 18,427 22,372 Trademarks 230 207 285 133 130 193 Computer software 12,710 11,286 10,013 7,792 8,045 8,023
211,576 180,155 200,551 191,145 166,083 190,150

57
FRUTAROM INDUSTRIES LTD. NOTES TO THE CONSOLIDATED FINANCIAL STATEMENTS (continued)
NOTE 8 – INTANGIBLE ASSETS (continued):
Composition of Intangible Assets, Grouped by Major Classifications and Changes Therein is as Follows:
Know-how and
Computer Product customer software formulas *Goodwill relations Trademarks Total
U.S. dollars in thousands
Balance as of 1 January 2007 - net 5,625 15,601 34,141 4,603 202 60,172 Changes in year ended 31 December 2007: Acquisitions 2,820 - - - - 2,820 Changes in the excess of cost of acquisition - - 1,925 - - 1,925 Adjustment arising from acquisition of consolidated companies and operations 101 12,930 87,999 17,723 - 118,753 Exchange differences 432 1,325 6,764 1,020 5 9,546 Annual amortization charge (Note 2f) (955) (1,123) (974) (14) (3,066)
Closing net book amount 8,023 28,733 130,829 22,372 193 190,150 Changes in year ended 31 December 2008: Acquisitions 943 - - - - 943 Changes in the excess of cost of acquisition - (7,441) - - (7,441) Exchange differences 330 (2,634) (8,806) (1,532) (50) (12,692) Annual amortization charge (Note 2f) (1,251) (1,200) (2,413) (13) (4,877)
Closing net book amount 8,045 24,899 114,582 18,427 130 166,083 Changes in year ended 31 December 2009: Acquisitions 1,145 51 1,196 Changes in the excess of cost of acquisition - - (1,166) - - (1,166) Adjustment arising from acquisition of consolidated companies and operations - 3,795 16,568 2,859 - 23,222 Exchange differences 151 1,138 5,278 867 14 7,448 Annual amortization charge (Note 2f) (1,549) (1,628) (2,450) (11) (5,638)
Closing net book amount 7,792 28,255 135,262 19,703 133 191,145
* Goodwill as of December 31, 2009 is allocated to the Flavour segment in the U.K., Germany, Israel and in the USA and to the Fine Ingredients segment in Belgium, USA and in the UK.

58
FRUTAROM INDUSTRIES LTD.
NOTES TO THE CONSOLIDATED FINANCIAL STATEMENTS (continued)
NOTE 8 – INTANGIBLE ASSETS (continued):
Impairment test for goodwill
The goodwill recorded in the Group's books of accounts arises from acquisitions of consolidated companies and operations carried out by the Group over the years, the goodwill is allocated to the cash-generating units of the Group in accordance with the unit and the business segment from which it arises. Set forth below is a summary of goodwill allocation between the various cash-generating units:
31 December
2009 2008 2007
U.S. dollars in thousands
Cash-generating unit 1 95,932 88,538 100,848 Cash-generating unit 2 11,065 9,974 13,703 Cash-generating unit 3 7,334 7,088 7,486 Cash-generating unit 4 6,072 - - Cash-generating unit 5 7,043 - - Cash-generating unit 6 2,699 2,699 2,509 Cash-generating unit 7 2,619 2,619 2,619 Cash-generating unit 8 2,498 2,498 2,498 Cash-generating unit 9* - 1,166 1,166
Total 135,262 114,582 130,829
* See note 5g.
The changes in goodwill between the years are due to acquisitions of new companies/operations, changes in the exchange rate of the local currency compared with the dollar and purchase price adjustments as explained in Note 5. The recoverable amount of a cash-generating unit is determined based on value-in-use calculations. These calculations use pre-tax cash flow projections based on past results of the unit, its budget for the following year and the projection for future years, cash flows beyond the five-year period are extrapolated using a grow rate of 2%, which does not exceed the long-term growth rate for the food business, in which the Group operates. The discount rate taken into account in the calculation is 16.3% before taxes. Group management determined gross margins based on past performance and its expectations for developments in respect of each of the cash-generating units. The recoverable amount of cash-generating units 1-3 was calculated and examined by an external assessor, whereas the recoverable amount of the remaining cash-generating units was calculated and examined by Group management. The results of the above analysis show that the value of goodwill of each of the said cash-generating units would not be impaired, both in the basic calculations and in calculations performed for the purpose of sensitivity test.

59
FRUTAROM INDUSTRIES LTD.
NOTES TO THE CONSOLIDATED FINANCIAL STATEMENTS (continued)
NOTE 9 – BORROWINGS
31 December
2009 2008 2007
U.S. dollars in thousands
Non current borrowings 70,204 99,383 82,579
Current borrowings: Bank overdrafts (Note 18) - - 3,765 Current maturities of long-term loans 44,478 40,792 17,179 Bank borrowings 2,433 1,992 23,277
46,911 42,784 44,221
Total borrowings 117,115 142,167 126,800
Bank borrowings mature until 2013 and bear average interest of 2.02%. The exposure of the Group's cash flows to interest rate changes at the balance sheet dates is dependent at the rate of Libor-Euro, Libor-Dollar, and Libor-Pound Sterling and it is updated on a semi-annual basis. Due to the above, the fair value of current and non-current borrowings equals their carrying amount, as the impact of discounting is not significant. The fair values are based on cash flows discounted the borrowings' discount rate. The carrying amounts of the Group's borrowings are denominated in the following currencies:
Weighted 31 December
average interest 2009 2008 2007
rates 2009 U.S. dollars in thousands
Pound sterling 1.77% 22,276 15,761 20,892 Dollars 1.67% 11,458 13,667 8,014 NIS (unlinked) 2.55% 3,312 8,478 14,538 Euro 2.05% 77,027 101,345 77,388 Swiss Francs 4.60% 3,011 2,906 5,960 Other currencies 2.00% 31 10 8
117,115 142,167 126,800
The liabilities (net of current maturities) mature in the following years after the balance sheet dates:
2009 2008 2007
U.S. dollars in thousands
Second year 32,223 39,239 25,958 Third year 34,473 30,614 25,163 Fourth year 3,508 26,030 15,931 Fifth year -- 3,500 15,527
70,204 99,383 82,579
The Group has several loans, in respect of which it has undertaken to meet certain financial covenants (see note 14). The Group meets all the required financial covenants.

60
FRUTAROM INDUSTRIES LTD.
NOTES TO THE CONSOLIDATED FINANCIAL STATEMENTS (continued)
NOTE 10 – LIABILITY FOR EMPLOYEE RIGHTS UPON RETIREMENT:
a. Labour laws and agreements in Israel and abroad require the Company and its consolidated companies to pay severance pay and/or pensions to employees dismissed or retiring from their employ in certain other circumstances. The Israeli companies’ liability is covered mainly by regular contributions in defined contribution plans. The amounts funded as above are not reflected in the balance sheets since they are not under the control and management of the companies.
b. Under the agreement with its employees, the U.S. subsidiary financed a defined benefit plan. As part of the collective agreement signed between the Company’s subsidiary and the industrial labour union on 13 October, 2000, the U.S. subsidiary suspended the said plan and joined, as from that date, a comprehensive pension plan of the labour union, which is a defined contribution plan. The U.S. subsidiary will continue financing its existing liabilities under the suspended pension plan. The amount of liability for employee rights upon retirement and amounts funded, as presented in the consolidated accounts, reflect, inter alia, the U.S. subsidiary’s liability in respect of the suspended plan.
c. The Swiss and German subsidiaries have a liability for payment of pension to employees in Switzerland and Germany under a defined benefit plan. The said liabilities have been transferred to these subsidiaries as part of the Flachsmann, FS, Nesse and the Gewurzmuller Group acquisitions in 2003, 2004, 2006, and 2007, respectively (Note 5). The consolidated companies make deposits with pension plans in respect of these liabilities. The amount of the liability for pension (net) included in the balance sheet reflects the difference between the liability for pension payments and the assets of the pension fund, as detailed in d. below.
d. The following amounts related to employee remuneration and benefits are included in
determining operating profit: 2009 2008 2007
U.S. dollars in thousands
Wages and salaries 83,580 88,803 69,410 Social security costs 9,740 10,124 8,149 Post-employment benefits: defined benefit plans 1,500 1,815 1,173 Post-employment benefits: defined contribution plans 2,196 2,377 2,397 Termination benefit expenses 1,296 213 1,459 Compensation under stock option plans and other employee benefits 708 1,173 1,200
Total employees’ benefits 99,020 104,505 83,788
At year-end, the Group employed 1,448 people (1,450 people and 1,499 people, respectively, in 2008 and 2007).

61
FRUTAROM INDUSTRIES LTD.
NOTES TO THE CONSOLIDATED FINANCIAL STATEMENTS (continued)
NOTE 10 – LIABILITY FOR EMPLOYEE RIGHTS UPON RETIREMENT (continued):
Amounts recognized in the income statement for post-employment defined benefit plans consist of the following:
2009 2008 2007
U.S. dollars in thousands
Current service cost 1,196 1,386 1,167 Interest cost 1,639 2,152 1,527 Actual return on plan assets – U.S. subsidiary (143) (171) (228) Expected return on plan assets – Swiss and German consolidated companies (1,283) (1,254) (1,210) Employees’ contributions - - (262) Net actuarial losses (gains) recognized 91 (298) 179
Total included in employees’ remuneration 1,500 1,815 1,173
Changes during the year in the net asset (liability) recognized in the statement of financial position for post-employment defined benefit plans were as follows:
2009 2008 2007
U.S. dollars in thousands
At 1 January 11,269 11,518 7,499 Increase as a result of acquisition for the first time of a consolidated company - - 8,762 Total expenses included in employees’ remuneration 1,500 1,815 1,173 Contributions paid (1,552) (1,553) (6,947) Currency translation effects and others 388 (511) 1,031
At 31 December 11,605 11,269 11,518
The following amounts were recognized in the statement of financial position for post-employment defined benefit plans:
31 December
2009 2008 2007
U.S. dollars in thousands
Present value of obligations arising from fully or partially funded plans 46,147 43,948 52,224
Fair value of plan assets (32,085) (31,682) (40,041)
Excess of the present value of funded liability over plan assets 14,062 12,266 12,183
Unrecognised actuarial losses (2,457) (997) (665)
Balance of liability recognized in the statement of financial position 11,605 11,269 11,518
Amounts recognized in the statement of financial position for post-employment defined benefit plans are predominantly non-current and are reported as non-current liabilities.

62
FRUTAROM INDUSTRIES LTD.
NOTES TO THE CONSOLIDATED FINANCIAL STATEMENTS (continued)
NOTE 10 – LIABILITY FOR EMPLOYEE RIGHTS UPON RETIREMENT (continued):
The Group operates defined benefit schemes in several countries for which the actuarial assumptions vary based on local economic and social conditions. The assumptions used in the actuarial valuations of the defined benefit plans, were as follows:
U.S.A. Germany Switzerland
2009 2008 2007 2009 2008 2007 2009 2008 2007
Discount rates 6.25% 6.25% 5.75% 5.10% 6.00% 5.50% 3.25% 3.50% 3.50% Projected rates of
remuneration growth 1.20% 1.50% 1.50% 2.00% 1.50% 2.00% Expected rates of
return on plan assets 7.25% 7.25% 7.25% 5.60% 5.50% 4.50% 3.50% 3.20% 3.90%
NOTE 11 – COMMITMENTS AND CONTINGENT LIABILITIES
a. Commitments:
1) Lease Commitments:
Some of the premises, warehouses and a site in the U.K., Germany, Belgium and Israel occupied by the Group are rented under various operating lease agreements. The lease agreements for the premises will expire on various dates between 2010 and 2017. Minimum lease commitments of the Company and its consolidated companies under the above leases, at rates in effect on 31 December 2009, are as follows:
$in thousands
Year ending 31 December: 2010 4,557 2011 3,194 2012 2,367 2013 2,316 2014 and thereafter 3,353
15,787
Rental payments for the premises in Israel are payable in U.S. dollars and in the U.K. in Pounds Sterling; the rental payments for the premises in Germany and Belgium are payable in Euro. Rental expenses totalled $4,640 thousand $4,776 thousand and $3,289 thousand, in the years ended 31 December 2009, 2008 and 2007, respectively.
2) Royalty Commitments:
(a) The Group and several third parties entered into agreements whereunder the Group acquired licenses for use of know-how for the purpose of developing products. The Group will pay the third parties royalties at a range of rates of the sale of products developed, or a fixed amount in respect of each product sold.
63
FRUTAROM INDUSTRIES LTD.
NOTES TO THE CONSOLIDATED FINANCIAL STATEMENTS (continued)
NOTE 11 – COMMITMENTS AND CONTINGENT LIABILITIES (continued):
(b) Frutarom Ltd. is committed to pay royalties to the Government of Israel on
proceeds from sales of products in the research and development of which the Government participates by way of grants. Under the terms of Company’s funding from the Israeli Government, royalties of 3%-5% are payable on sales of products developed from a project so funded, up to 100% of the amount of the grant received by the Frutarom Ltd. (dollar linked); as from 1 January, 1999 – with the addition of an annual interest rate based on Libor. The maximum royalty amount payable by Frutarom Ltd. at 31 December 2009 is $961 thousand. In 2009, Frutarom Ltd. was of the opinion that it would not be required to refund Chief Scientist grants in the total amount of $285 thousand (2008 -$242 thousand); therefore it carried this amount to comprehensive income.
b. Contingent Liabilities:
1) Reimbursement of expenses arising from raise of capital
As part of a capital raise made by the Company in the London Stock Exchange (see note 13b), the Company and the Bank of New York (hereafter – the bank) signed, in February 2005, an agreement, whereunder the bank would allocate the GDRs issued in the LSE as part of the above capital raise, and would provide services to the Company and to the holders of the GDRs listed in the official list of the UK Listing Authority. In consideration for the right to provide services as above, the bank paid the Company $810 thousand and also undertook to bear further expenses of up to $270 thousand, relating to quoting the GDRs in future years. Under the said agreement, the Company might be required to reimburse the expenses paid by the bank (with the addition of $500 thousand) if one of the suspending conditions of the agreement, which pertain to cease of quoting the GDRs, the reduction of such quoting, or a change in ownership, is met. Under the agreement, such reimbursement of expenses might be required for a seven-year period, commencing the date of capital raise. The Company recognises the amounts received from the bank as revenues over the period during which the service is rendered.
2) Legal Procedures against the Company and consolidated companies (a) A number of claims and third party notices have been filed against the Group.
The claims are for bodily injury and economic damages, which the plaintiffs allege resulted from the pollution of the Kishon River, for which – according to the plaintiffs – the Group was among those responsible. Group’s management believes, based on the opinion of its legal counsel, that the chances that the plaintiffs will prevail in the claims are remote. Group also believes that even if it will be found liable due to the circumstances of the said claim, the potential damage that might arise to the Group is immaterial, due to the large number of defendants, the very small quantity of effluents discharged by the Group during the relevant years (about 0.01% of total effluents discharged by the other defendants); due to the fact that effluents discharged by the Group cannot cause the damages allegedly caused and due to the period during which effluents

64
FRUTAROM INDUSTRIES LTD.
NOTES TO THE CONSOLIDATED FINANCIAL STATEMENTS (continued)
NOTE 11 – COMMITMENTS AND CONTINGENT LIABILITIES (continued):
were discharged by the Group compared with the other defendants. Commencing in 2000, the Group discontinued discharge of all effluents to the Kishon River. Set forth below are the claims filed against the Group concerning the pollution of the Kishon River: (1) As part of several claims (that were joined), the amount of which was not
specified, and which were filed by 92 former soldiers (or their inheritors) against Haifa Chemicals Ltd. (“HCL”) and against three other defendants (hereafter- the defendants) for alleged bodily injury caused to the plaintiffs while the defendants polluted the Kishon River in the course of their military service, the defendants sent the Group and other parties third party notices; in these notices, the defendants demand that if the Court will find them liable for the damages caused to the plaintiffs, the third parties will bear the compensation to be paid to the plaintiffs, since those third parties were responsible for the damages.
(2) As part of a claim, the amount of which was not specified, and which was
filed by 41 fishermen and by their relatives against HCL and other parties, for alleged bodily injury, allegedly caused as a result of the pollution of the Kishon River by the defendants, the defendants sent the Group and other parties third party notices; in these notices, the defendants demand that if the Court will find them liable for the damages caused to the plaintiffs, the third parties will bear part of the compensation to be paid to the fishermen and/or indemnify the defendants for payment of such compensation.
(b) A claim was lodged against the Company in the Haifa District Court in
August 2007, for a smell hazard that was allegedly caused to the claimant by the company's Haifa plant (hereafter- the claim). At the same time an application was submitted for approval of the claim as a class action (hereafter – application for approval). The claimants claim that the smell hazards caused by the plant have damaged the individual's autonomy and his/her right to breathe clean air, to the extent that their quality of life was damaged. The Group, which the claimants wish to represent in the class action, consists of residents, who lived in a radius of 3.5 km and/or work in a radius of 2 km from the Company's plant in Haifa, and/or travelled frequently either by using their own vehicle or by using public transportation in the Akko-Haifa road, close to the Company's plant. The amounts claimed, as specified in the application for approval of the claim as a class action is NIS 225 million. In February 2009, the company signed a compromise agreement as part of the application for approval as above and the claim (hereafter- the agreement), as follows:

65
FRUTAROM INDUSTRIES LTD.
NOTES TO THE CONSOLIDATED FINANCIAL STATEMENTS (continued)
NOTE 11 – COMMITMENTS AND CONTINGENT LIABILITIES (continued):
1. Without acknowledging or admitting any of the claims addressed against
the Company in the application for approval and the claim, the Company would cease the manufacture in its Haifa Bay site of ten materials that potentially have strong smells. Cease of manufacture would take place within six months; and manufacture of further six materials would be ceased within 18 months, as from the date of approval of the agreement by the Court.
2. Without acknowledging or admitting the existence of any of the smell
hazards originating from the Company's Haifa Bay plant, the Company undertakes to continue its investment plan that includes environmental operations and handling the smell hazard. The Company also undertakes that in any case, subsequent to 1.1.2013 there would not be strong or unreasonable smells outside its Haifa Bay plant, originating from its operations there.
3. The Company would pay the applicants, who submitted the application
for approval and their representatives an amount of NIS 775 thousand. Subject to the agreement, the applicants, who submitted the application for approval have undertaken not to pursue any legal procedures regarding any of the claims made in the claim and in the application for approval or any other claim relating to "smell hazards" originating in the Company's site in the Haifa Bay through 1.1.2013. On 22.2.2009 the parties submitted the Court and application (hereafter – "the application") to accept the Court's approval for the settlement as a compromise settlement in a class action and to give the conditions set in the said settlement a status of a Court ruling.
(c) In addition to the aforementioned, consolidated companies of the Group are a party to legal procedures in the ordinary course of business; in the opinion of Group’s management the said legal procedures do not materially affect the Group’s financial position. Some of the claims are covered by insurance policies and in respect of the other claims, the Group has sufficiently provided in its accounts.
The Company believes that the above claim would not have a material effect on its business and operations.
NOTE 12 – EQUITY:
a. Share Capital: 1) Composed of ordinary shares of NIS 1 par value, as follows:
Number of shares in thousands and the amount thereof, denominated in NIS
31 December
2009 2008 2007
Authorised 100,000 100,000 100,000
Issued and paid 57,826 57,786 57,706
66
FRUTAROM INDUSTRIES LTD.
NOTES TO THE CONSOLIDATED FINANCIAL STATEMENTS (continued)
NOTE 12 – EQUITY (continued):
Company registered shares are quoted on the TASE at NIS 31.5 ($8.34 per share as of 31 December 2009. The GDRs representing the Company’s shares are quoted on the official list of the LSE.
2) Ordinary Company shares of NIS 1 par value, are held by a consolidated
company and included in the issued and paid share capital constitute 1.1% (582,715 shares) and 1.2% (693,190 shares) and 1.29% (747,044 shares) of the balance of ordinary issued and paid shares of this type as of 31 December 2009, 2008 and 2007, respectively.
b. Capital Raise
On 22 February 2005, the Company completed a public offering in the London Stock Exchange, in which it raised capital in the total amount of $76 million (net of issuance costs at the amount of $5 million) as against the allocation of 10,600,000 ordinary Company shares and of listing of Global Depositary Receipts (hereafter – GDRs) in the official list of the UK Listing Authority; each GDR represents one Company share; the price per GDR was $7.63. The allocation of shares and GDRs has taken place in two stages: in the first stage, on 8 February 2005, 10,000,000 Company shares were issued and GDRs were listed as above. In the second stage, on 22 February 2005, the underwriters fully exercised an option they were granted in the first stage, for the sale of additional 600,000 shares, at the price mentioned above. Commensurate with the said allocation, ICC Handles AG of the ICC Group – the Company’s controlling shareholder – sold 2,600,000 existing Company shares at the price mentioned above. The Company did not receive any consideration in respect of the shares sold by ICC Handles AG.
c. Employee Share Option Plan for Senior Employees of Subsidiaries:
1) In 1996, the Company’s Board of Directors approved an employee stock purchase plan (the “1996 Plan”), whereunder a consolidated company purchases Company shares in the TASE, for the purpose of granting the shares to senior employees of the Group. The 1996 plan was replaced in 2003 by the 2003 plan (hereinafter - the 2003 plan).
The rights to purchase the shares are granted to the employees twice a year. The senior employees have the right to exercise the shares they were granted at the end of the vesting period. The vesting period of the shares granted under this plan is spread over three equal, annual batches: one year, two years and three years from date of grant. In any event, an employee’s right, as above, expires six years from the date such right is granted. The exercise price per option is 33.3% of the average price paid by the subsidiary upon purchase of Company shares in a given grant.
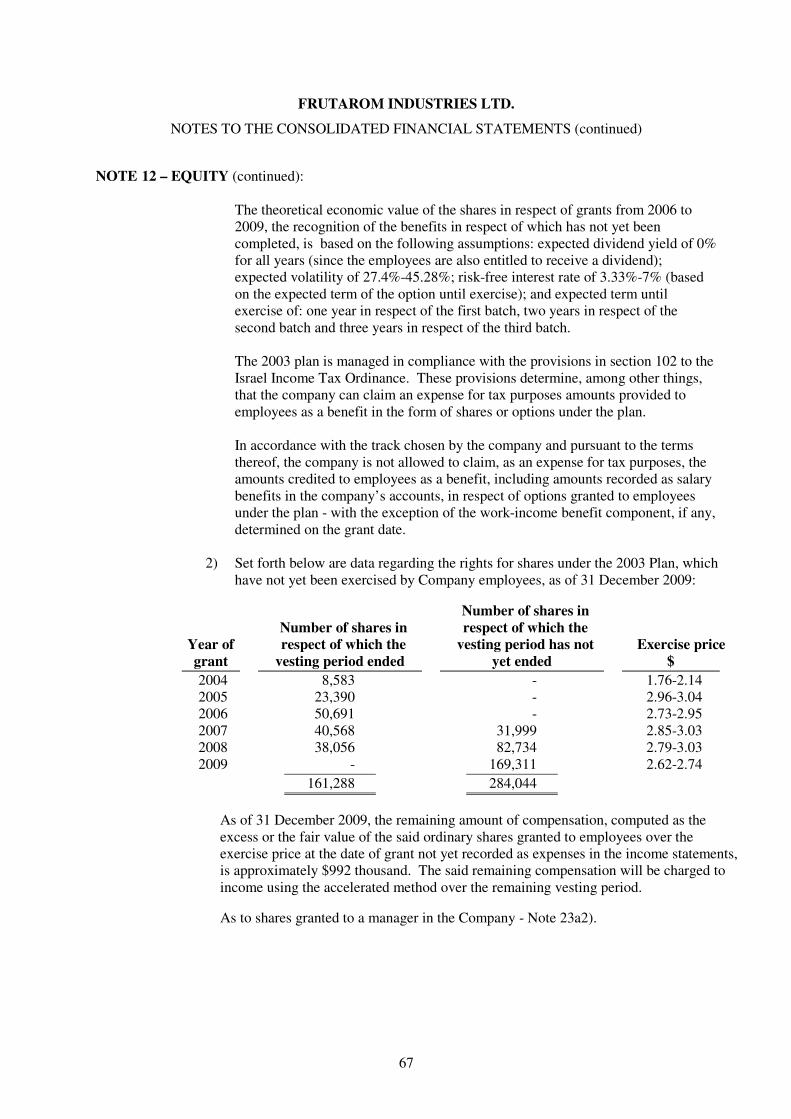
67
FRUTAROM INDUSTRIES LTD.
NOTES TO THE CONSOLIDATED FINANCIAL STATEMENTS (continued)
NOTE 12 – EQUITY (continued):
The theoretical economic value of the shares in respect of grants from 2006 to 2009, the recognition of the benefits in respect of which has not yet been completed, is based on the following assumptions: expected dividend yield of 0% for all years (since the employees are also entitled to receive a dividend); expected volatility of 27.4%-45.28%; risk-free interest rate of 3.33%-7% (based on the expected term of the option until exercise); and expected term until exercise of: one year in respect of the first batch, two years in respect of the second batch and three years in respect of the third batch. The 2003 plan is managed in compliance with the provisions in section 102 to the Israel Income Tax Ordinance. These provisions determine, among other things, that the company can claim an expense for tax purposes amounts provided to employees as a benefit in the form of shares or options under the plan. In accordance with the track chosen by the company and pursuant to the terms thereof, the company is not allowed to claim, as an expense for tax purposes, the amounts credited to employees as a benefit, including amounts recorded as salary benefits in the company’s accounts, in respect of options granted to employees under the plan - with the exception of the work-income benefit component, if any, determined on the grant date.
2) Set forth below are data regarding the rights for shares under the 2003 Plan, which
have not yet been exercised by Company employees, as of 31 December 2009:
Number of shares in Number of shares in respect of which the
Year of respect of which the vesting period has not Exercise price grant vesting period ended yet ended $
2004 8,583 - 1.76-2.14 2005 23,390 - 2.96-3.04 2006 50,691 - 2.73-2.95 2007 40,568 31,999 2.85-3.03 2008 38,056 82,734 2.79-3.03 2009 - 169,311 2.62-2.74
161,288 284,044
As of 31 December 2009, the remaining amount of compensation, computed as the excess or the fair value of the said ordinary shares granted to employees over the exercise price at the date of grant not yet recorded as expenses in the income statements, is approximately $992 thousand. The said remaining compensation will be charged to income using the accelerated method over the remaining vesting period.
As to shares granted to a manager in the Company - Note 23a2).

68
FRUTAROM INDUSTRIES LTD.
NOTES TO THE CONSOLIDATED FINANCIAL STATEMENTS (continued)
NOTE 12 – EQUITY (continued):
The changes in the number of rights for shares outstanding and their related weighted average exercise prices are as follows:
2009 2008 2007
Average Average Average exercise price exercise price exercise price in U.S. $ Rights for in U.S. $ Rights for in U.S. $ Rights for Per share shares per share shares per share shares
Outstanding at 1 January 2.85 551,289 2.54 601,159 1.97 636,117 Granted 2.79 169,311 3.18 169,606 2.70 150,599 Forfeited 2.70 (102,839) 1.55 (32,189) 2.30 (37,807) Exercised 2.73 (172,429) 2.56 (187,287) 1.16 (147,750)
Balance at 31 December 2.80 445,332 2.85 551,289 2.54 601,159
The following table summarises information about exercise price and the contractual terms of share rights outstanding at 31 December 2009: Share rights outstanding Share rights exercisable
Weighted Weighted Number average Number average
Range of outstanding at remaining Weighted exercisable at remaining Exercise 31 December contractual average 31 December contractual Prices 2009 life exercise price 2009 life
$ Years $ Years 1.76 4,493 0.25 1.76 4,493 0.25 2.14 4,090 0.75 2.14 4,090 0.75 2.96 11,073 1.25 2.96 11,073 1.25 3.04 12,317 1.75 3.04 12,317 1.75 2.95 29,540 2.25 2.95 29,540 2.25 2.73 21,151 2.75 2.73 21,151 2.75 3.03 38,454 3.25 3.03 19,537 3.25 2.85 34,113 3.75 2.85 21,031 3.75 3.03 51,126 4.25 3.03 15,737 4.25 2.79 69,664 4.75 2.79 22,319 4.75 2.62 71,632 5.25 2.62 - 5.25 2.74 97,679 5.75 2.74 - 5.75
445,332 161,288
3) On 21 December 2003, the Company’s Board of Directors resolved to issue up to
1,200,000 ordinary shares of NIS 1 par value, to be registered for trade in TASE and to be allotted to senior executive employees.
On 18 January 2004, the Company designated 900 thousand shares to senior employees, as part of the said resolution. The market value of Company’s shares at date of designation was NIS 19.64 ($4.46).

69
FRUTAROM INDUSTRIES LTD.
NOTES TO THE CONSOLIDATED FINANCIAL STATEMENTS (continued)
NOTE 12 – EQUITY (continued):
The allotted shares were held by a trustee and were granted to employees in equal batches at the end of the vesting period. The vesting period was outlined as follows: six months (1 July 2004), one year (1 January 2005), two years (1 January 2006) and three years (1 January 2007). In consideration for the shares, the employees paid NIS 5 ($1.14) per share, using a non-recourse loan they received for that purpose from the Company. In case that an employee as above will not complete the vesting period, the Company will repurchase from that employee the shares as against the offset of the employee’s debt to the Company. The loans to the employees are in NIS and they are unlinked and bear no interest. The loans are repayable upon sale of the share, or within 60 days from termination of the employee’s employment, whichever is earlier, but not later than 1 January 2010. Through 31 December 2009, the employees repaid the remaining balance of the loan and all shares in trusteeship were released. The theoretical economic value of the allotted shares – computed using the Black & Scholes shares valuation model, amounted at date of grant to U.S. $3,024 thousand. This value is based on the following assumptions: expected dividend at a rate set to 0% in all years (as the employees are also entitled to dividend), standard deviation of expected share price returns of 33% - 39%, annual risk-free interest at a rate of 1.24%, 1.24%, 1.76% and 2.27% (in accordance with the option’s expected life) and an expected average option life until exercise: six months for the first batch, one year for the second batch, two years for the third batch and three years for the fourth batch. The volatility measured at the standard deviation of expected share price returns is based on statistical analysis of weekly share price over the last six months, one year, two years and three years (in accordance with the vesting periods of the batches). As to shares granted to manager in the Company – Note 23a2). On 31 December 2009, a senior officer exercised 375,000 shares for an aggregate exercise price of $497 thousand (NIS 1,875 thousand).
d. Allotment of Options to Senior Employees
1) On 17 May 2004, the Company's Board of Directors approved under the 2003 plan (note 12c) to allot 150,000 non-marketable options (hereinafter - the options) to a senior employee, each of which is exercisable into one share of NIS1 par value.
The said options are to be held by a trustee and they will be granted to the employee in equal batches at the end of the vesting period. The vesting periods are as follows: the first batch vests on 9 October 2004; the second on 9 October 2005; the third on 9 October 2006 and the fourth on 9 October 2007. In any case, the employee’s right to exercise the options expires six years from date of grant (on 17 May 2010). The exercise price was set to NIS 10.87 ($2.36). The market value of the Company’s shares at date of allotment was NIS 20.94 ($4.55). On 16 June 2004, the Tel-Aviv Stock Exchange approved the registration of 150,000 Company shares of NIS 1 par value, which will arise from exercise of the said options.

70
FRUTAROM INDUSTRIES LTD.
NOTES TO THE CONSOLIDATED FINANCIAL STATEMENTS (continued)
NOTE 12 –EQUITY (continued):
The theoretical economic value of the allotted shares – computed using the Black & Scholes shares valuation model, amounted at date of grant to U.S. $346 thousand. This value is based on the following assumptions: expected dividend at a rate set to 0% in all years; standard deviation of expected share price returns of 33.3%, - 39.5%, annual risk-free interest at a rate of 1.74%, 1.74%, 2.82% and 3.1% (in accordance with the option’s expected life) and an expected average option life until exercise: five months for the first batch, seventeen months for the second batch, twenty nine months for the third batch and forty one months for the fourth batch.
The volatility measured at the standard deviation of expected share price returns is based on statistical analysis of weekly share price over the last five months, seventeen months, twenty nine months and forty one months (in accordance with the vesting periods of the batches).
2) On 2 January 2006, the Company’s Board of Directors approved, as part of the
2003 Plan (Note 12c) the allotment of 725,000 non-marketable options (the “Options”) to four senior employees of the Company; each option is exercisable into one ordinary share of NIS 1 par value.
The said options are to be held by a trustee and they will be granted to the employees in equal batches at the end of the vesting period. The vesting periods are as follows: For three senior employees – 3 equal batches – two years, three years and four years form date of grant. For 1 senior employee – 4 equal batches – one year, two years, three years and four years from date of grant. In any case, the employees’ right to exercise the options expires six years after the date of grant. The exercise price was set to NIS 31.07 ($6.75). The market value of the Company’s shares at date of allotment was NIS 34.52 ($7.50).
On 31 January 2006, the Tel-Aviv Stock Exchange approved the registration of 600,000 Company shares of NIS 1 par value, which will arise from exercise of the said options. 125,000 stocks out of the said amount are existing stocks held by Frutarom Ltd. The theoretical economic value of the allotted shares – computed using the Black & Scholes shares valuation model, amounted at date of grant to U.S. $1,620 thousand. This value is based on the following assumptions: expected dividend at a rate set to 0% in all years; standard deviation of expected share price returns of 29%-31%, annual risk-free interest at a rate of 4.35%-4.45% and an expected average option life until exercise of one year, two years, three years and four years. The volatility measured at the standard deviation of expected share price returns is based on statistical analysis of weekly share price over the last twelve months, twenty four months and thirty six and forty eight months (in accordance with the vesting periods of the batches). As to the fair value of options granted to a manager – Note 23a2).
71
FRUTAROM INDUSTRIES LTD.
NOTES TO THE CONSOLIDATED FINANCIAL STATEMENTS (continued)
NOTE 12 –EQUITY (continued):
On 5 May 2009, the group allotted 40,000 ordinary shares of NIS 1 par value each following the exercise of options that were granted to a senior official in the company in 2005. The exercise price for the options amounted to $105 thousand (NIS 435 thousand).
The Group creates deferred taxes for grants that fall into the scope of IFRS 2 – "Share Based Payment" – in accordance with the proportionate part of the estimated amount deductible for tax purposes by the Group at date of exercise of benefit by the employee and in respect of which work services were provided by the employee through the date of the statement of financial position (i.e., the estimated overall amount deductible for tax purposes divided by the overall vesting period and multiplied by the vesting period that has elapsed through the date of the statement of financial position). The said deferred taxes are recognized in the statement of comprehensive income.
e. Dividend and Retained Earnings
1) The amounts of the dividend paid presented in the statement of changes in shareholders’ equity are net the share of a consolidated company holding Company shares (Note 2n). The consolidated company’s share in the dividend is $27 thousand, $36 thousand and $33 thousand in 2009, 2008 and 2007, respectively. In determining the amount of retained earnings available for distribution as a dividend, the Companies Law stipulates that the cost of the Company’s shares acquired by a consolidated company (that are presented as a separate item on the statement of changes in shareholders’ equity) is to be deducted from the amount of retained earnings presented among Company’s shareholders’ equity.
2) In its meeting on 16 March, 2010, the Company's Board of Directors resolved to
distribute a final cash dividend out of retained earnings as of December 31, 2009; the amount of this dividend is $2,796 thousand (NIS 10,408 thousand). Frutarom Ltd. Does not intend to distribute dividend out of tax exempt income arising from "approved enterprise", as explained in Note 13c.
3) The dividend paid in 2009 and 2008 amounted to $2,485 (NIS 0.18 per share) and
$3,006 (NIS 0.18 per share). As mentioned in 2) above, the dividend in respect of 2009 in the amount of $2,796 thousand, was discussed in the Company's Board of Directors.
NOTE 13 - TAXES ON INCOME: a. Corporate taxation in Israel
1) Through the end of tax year 2007, the results of operations of the Company and its Israeli subsidiaries were measured having regard to the changes in the CPI in accordance with the Income Tax (Inflationary Adjustments) Law, 1985 (hereafter – the inflationary adjustments law).
Commencing 2008, the Company other subsidiaries are companies of foreign investors and have elected to keep their books and records in dollars for tax purposes, as permitted under the Income Tax Regulations (Principles for the Bookkeeping of Foreign Invested Companies and of Certain Partnerships and the Determination of Their Taxable Income), 1986.

72
FRUTAROM INDUSTRIES LTD.
NOTES TO THE CONSOLIDATED FINANCIAL STATEMENTS (continued)
NOTE 13 –TAXES ON INCOME (continued):
2) Tax rates The income of the Company and its Israeli subsidiaries (other than income from “approved" or "beneficiary enterprises”) is taxed at the regular rate; under the provisions of the Law for Amendment of the Income Tax Ordinance, 2005, of August 2005, the corporate tax rates is to be gradually reduced. As a result of this amendment the corporate tax rates applicable for tax year 2008 and thereafter are as follows: 2008 - 27%; 2009 - 26% and for 2010 and thereafter – 25%. On July 14, 2009 the Economic Rationalization Law (Legislation Amendments for the Implementation of the Economic Plan for the years 2009 and 2010), 2009 (hereafter – Amendment 2009), was passed in the Knesset; this law determined, inter alia a further gradual reduction of the corporate tax rate as from 2011, as follows: 2011 – 24%, 2012 – 23%, 2013 – 22%, 2014 – 21%, 2015 – 20%, 2016 and thereafter – 18%. The application of the law did not have a material effect on the Group's income tax expenses. Capital gains that are taxed at a reduced rate of 25% on the capital gains derived after January 1, 2003; (and as to marketable securities – that were acquired after 1 January 2006), and at the regular corporate tax rates on income derived through the aforementioned date.
b. Subsidiaries outside Israel
Subsidiaries that are incorporated outside of Israel are assessed for tax under the tax laws in their countries of residence. The principal tax rates applicable to subsidiaries outside Israel are as follows:
Company incorporated in the USA – tax rate of 42%. Company incorporated in Germany– tax rate of 30%; (through 2007, the tax rate was 40%). Company incorporated in Belgium – tax rate of 34% Company incorporated in the UK – tax rate of 28%; (through 2008 the tax rate was 30%). Company incorporated in the Switzerland – tax rate of 22%.
c. Encouragement Laws in Israel
1) Tax benefits under the Israeli Law for the Encouragement of Capital
Investments, 1959 (hereinafter - the Law) Under the law, including Amendment No. 60 to the law that was published in April 2005, by virtue of the “approved enterprise” or “benefited enterprise” status granted to certain enterprises of the Company, and by virtue of the “Foreign Investors’ Company“ status it was granted, Frutarom Ltd. is entitled to various tax benefits.

73
FRUTAROM INDUSTRIES LTD.
NOTES TO THE CONSOLIDATED FINANCIAL STATEMENTS (continued)
NOTE 13 –TAXES ON INCOME (continued): The main tax benefits available to Frutarom Ltd. are:
(a) Reduced tax rates
During the 10-year period of benefits, commencing in the first year in which Frutarom Ltd. earns taxable income from the approved or benefited enterprises (provided the maximum period to which it is restricted by law has not elapsed), the following reduced tax rates apply:
(1) Corporate tax at the rate of 20% on income from certain approved or
benefited enterprises owned by foreign investors' companies (this tax rate is determined based on the percentage of foreign shareholding as defined by the law).
(2) Tax exemption on income from certain approved enterprises which had
previously opted for by Frutarom Ltd. the "alternative benefits" track (involving waiver of investment grants) and tax exemption on income from a benefited enterprise; the length of the exemption period is two, four or six years, after which the income from these enterprises is taxable at a decreased rate (see 1a above) for an additional eight, six or four years, respectively.
In the event of distribution of cash dividends (and for benefited enterprise – also liquidation dividend) out of income, which was tax exempt as above, Frutarom Ltd. would have to pay the decreased tax rate (see 1a above) in respect of the amount distributed, (Note 2q). The period of benefits in respect of those of the abovementioned enterprises, which were activated, expires in the years 2010 through 2016.
(b) Accelerated depreciation
Frutarom Ltd. is entitled to claim accelerated depreciation for five tax years commencing in the first year of operation of each asset, in respect of buildings, machinery and equipment used by the approved enterprise.
(c) Conditions for entitlement to the benefits
The entitlement to the above benefits is conditional upon fulfilling the conditions stipulated by the law, regulations published thereunder and the instruments of approval for the specific investments in approved enterprises. In the event of failure to comply with these conditions, the benefits may be cancelled and Frutarom Ltd. may be required to refund the amount of the benefits, in whole or in part, with the addition of interest. Group’s management believes that as of 31 December 2009, Frutarom Ltd. fulfils all the requirements.
2) The Law For The Encouragement of Industry (Taxation), 1969:
Frutarom Ltd. is an “industrial company” as defined by this law. As such, Frutarom Ltd. is entitled to claim amortization over 8 years of acquired product formulas, as well as depreciation at increased rates for equipment used in industrial activity as stipulated by regulations published under the inflationary adjustments law, and have done so.

74
FRUTAROM INDUSTRIES LTD. NOTES TO THE CONSOLIDATED FINANCIAL STATEMENTS (continued)
NOTE 13 –TAXES ON INCOME (continued): d. Deferred Income Taxes
1) Composition of deferred taxes and changes therein in the reported year are as follows: In respect of balance sheet items
Provisions for employee rights
Vacation Depreciable and In respect of fixed Severance recreation Depreciable carryforward assets Pay pay Inventories Other intangibles tax losses Total
U.S. dollars in thousands
Balance at 31 December 2006 8,078 (1,723) (407) (264) (67) 4,470 (1,679) 8,408 Addition to deferred taxes in respect of acquisition of the subsidiaries 752 (416) - (192) (631) 8,738 - 8,251 Differences from translation of foreign currency financial statements of subsidiaries 447 (136) - 67 63 664 (85) 1,020 Amounts carried to comprehensive income 309 909 (57) (417) 505 (1,410) 946 785
Balance at 31 December 2007 9,586 (1,366) (464) (806) (130) 12,462 (818) 18,464 Differences from translation of foreign currency financial statements of subsidiaries (377) 59 82 (65) (836) 35 (1,102) Amounts carried to comprehensive income 2,064 (262) 107 103 (285) (720) 783 1,790
Balance at 31 December 2008 11,273 1,569 (357) (621) (480) 10,906 - 19,152 Addition to deferred taxes in respect of acquisition of the subsidiaries 367 - - (55) - - - 312 Differences from translation of foreign currency financial statements of subsidiaries 376 (43) - 33 39 438 - 843 Amounts carried to comprehensive income (400) 291 123 (720) 402 777 - 473
Balance at 31 December 2009 11,616 (1,321) (234) (1,363) (39) 12,121 - 20,780

75
FRUTAROM INDUSTRIES LTD.
NOTES TO THE CONSOLIDATED FINANCIAL STATEMENTS (continued)
NOTE 13 –TAXES ON INCOME (continued):
2) Classification of deferred tax assets and liabilities by maturities, are as follows:
31 December
2009 2008 2007
U.S. dollars in thousands
Deferred tax assets: Deferred tax asset to be recovered within 12 months 3,653 2,990 3,745 Deferred tax asset to be recovered after more than 12 months - - -
3,653 2,990 3,745
Deferred tax liabilities: Deferred tax liability to be recovered within 12 months 1,445 1,760 1,541 Deferred tax liability to be recovered after more than 12 months 22,988 20,382 20,668
24,433 22,142 22,209
20,780 19,152 18,464
3) The deferred taxes in respect of Group activities in Israel are computed at the tax rate of 18% (2008 – 18.5%). This rate is an average taking into account the income from Frutarom Ltd.’s approved enterprises.
Deferred taxes of foreign subsidiaries in Switzerland, U.S.A., U.K. and Germany are computed at the tax rates applicable to these companies (see b above).
e. Taxes on Income Included in The Income Statements:
1) As follows: 2009 2008 2007
U.S. dollars in thousands
For the reported year: Current 10,112 9,339 6,625 Deferred 473 1,790 785
10,585 11,129 7,410
For previous years (864) (2,297) -
T o t a l 9,721 8,832 7,410
Current taxes are computed at an average tax rate of 22.6%, 19.2% and 23.45%, for the years 2009, 2008 and 2007, respectively.

76
FRUTAROM INDUSTRIES LTD.
NOTES TO THE CONSOLIDATED FINANCIAL STATEMENTS (continued)
NOTE 13 –TAXES ON INCOME (continued):
2)
Following is a reconciliation of the theoretical tax expense, assuming all income is taxed at the regular tax rates applicable to companies in Israel (Note 13c above) and the actual tax expense:
2009 2008 2007
U.S. dollars in thousands
Income before taxes on income, as reported in the income statements 42,941 46,061 31,603
Theoretical tax expense in respect of this income – at 26% (2008 – 27%; 2007 – 29%) 11,165 12,436 9,165 Less – tax benefit arising from approved enterprise status (810) (239) (14) Increase in taxes resulting from different tax rates
applicable to foreign subsidiaries 693 112 243 Increase (decrease) in taxes arising from computation
of deferred taxes at a rate which is different from the theoretical rate (212) (397) 8
Increase (decrease) in taxes arising from permanent differences – disallowable expenses - 517 18
Decrease in taxes resulting from utilization, in the reported year, of carryforward tax losses and other expenses for which deferred taxes were not created (net of increase in taxes in respect of tax losses incurred in the reported year for which Deferred taxes were not created) (327) (1,112) -
Difference between the basis of measurement of income reported for tax purposes and the basis of measurement of income for financial reporting purposes – net 832 - (1,871) Income taxes in different tax rates (377) - -
Other (379) (188) (139)
Taxes on income for the reported year 10,585 11,129 7,410
f. Tax Assessments
The Company and its Israeli subsidiaries have received final tax assessments through the year 2006.

77
FRUTAROM INDUSTRIES LTD.
NOTES TO THE CONSOLIDATED FINANCIAL STATEMENTS (continued)
NOTE 13 –TAXES ON INCOME (continued):
g. Effect of adoption of IFRS in Israel on tax liability
As mentioned in note 2a, the Group prepares its financial statements in accordance with IFRS.
As also indicated in the said note, IFRS vary from Accounting Principles Generally Accepted in Israel and accordingly, preparation of financial statements in accordance with IFRS may reflect a financial position, results of operations and cash flows that are materially different from the ones presented in financial statements presented in accordance with accounting principles generally accepted in Israel.
In accordance with the law for the amendment of the Income Tax Ordinance (No. 174 – Temporary Order as to Tax Years 2007, 2008 and 2009), 2010 that was passed in the Knesset on January 25, 2010 and published in the official gazette on February, 4, 2010 (hereafter – the amendment to the ordinance), Accounting Standard No. 29 issued by the Israel Accounting Standard Board would not apply upon determining the taxable income for tax purposes in respect of tax years 2007, 2008 and 2009; this would be the case even if the said accounting standard was applied for the said tax years in the financial statements. The meaning of the amendment to the ordinance is that IFRS would actually not be applied upon computation of the income reported for tax purposes for the said tax years. The amendment to the ordinance did not have a material effect on the tax expenses reported in these financial statements.
NOTE 14 – LIABILITIES SECURED BY PLEDGES AND RESTRICTIONS PLACED IN
RESPECT OF LIABILITIES: a. To secure long-term bank loans and credit and short-term bank credit granted to
subsidiaries of the Company in the U.S.A., U.K. and Switzerland, the subsidiaries have registered floating charges on their assets.
b. To secure long and short-term loans extended to Frutarom Ltd., this company
registered floating charges on its share capital and its goodwill, floating charges on all its assets and insurance rights and floating charges on all its assets including the rights and yield arising from the assets.
c. To secure long-term loans and short-term credit extended by banks to Group
companies in the UK, the said companies have undertaken to meet the following financial criteria: 1) The quick ratio will not be lower than 1 at any given time. 2) The cash flows from operating activities would be equal to at least 1.4 of the
annual payment of principal of loans.
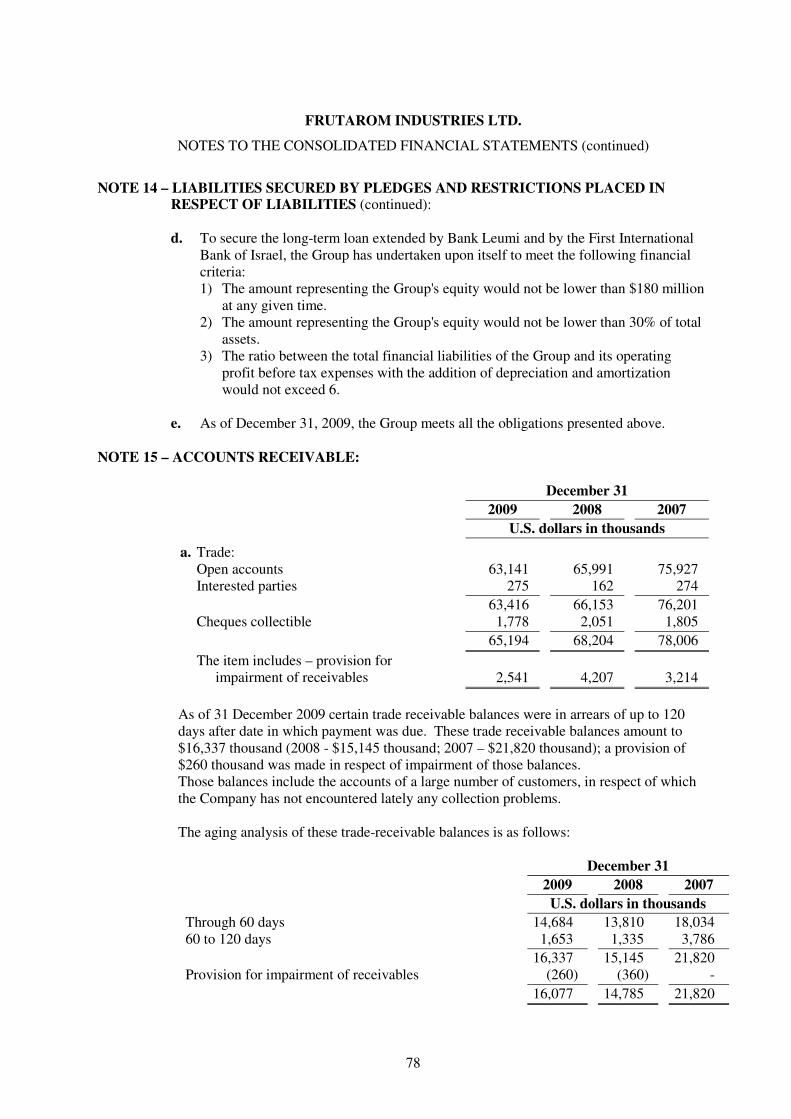
78
FRUTAROM INDUSTRIES LTD.
NOTES TO THE CONSOLIDATED FINANCIAL STATEMENTS (continued)
NOTE 14 – LIABILITIES SECURED BY PLEDGES AND RESTRICTIONS PLACED IN
RESPECT OF LIABILITIES (continued):
d. To secure the long-term loan extended by Bank Leumi and by the First International Bank of Israel, the Group has undertaken upon itself to meet the following financial criteria: 1) The amount representing the Group's equity would not be lower than $180 million
at any given time. 2) The amount representing the Group's equity would not be lower than 30% of total
assets. 3) The ratio between the total financial liabilities of the Group and its operating
profit before tax expenses with the addition of depreciation and amortization would not exceed 6.
e. As of December 31, 2009, the Group meets all the obligations presented above.
NOTE 15 – ACCOUNTS RECEIVABLE:
December 31
2009 2008 2007
U.S. dollars in thousands
a. Trade: Open accounts 63,141 65,991 75,927 Interested parties 275 162 274
63,416 66,153 76,201 Cheques collectible 1,778 2,051 1,805
65,194 68,204 78,006
The item includes – provision for impairment of receivables 2,541 4,207 3,214
As of 31 December 2009 certain trade receivable balances were in arrears of up to 120 days after date in which payment was due. These trade receivable balances amount to $16,337 thousand (2008 - $15,145 thousand; 2007 – $21,820 thousand); a provision of $260 thousand was made in respect of impairment of those balances. Those balances include the accounts of a large number of customers, in respect of which the Company has not encountered lately any collection problems. The aging analysis of these trade-receivable balances is as follows:
December 31
2009 2008 2007
U.S. dollars in thousands
Through 60 days 14,684 13,810 18,034 60 to 120 days 1,653 1,335 3,786
16,337 15,145 21,820 Provision for impairment of receivables (260) (360) -
16,077 14,785 21,820

79
FRUTAROM INDUSTRIES LTD.
NOTES TO THE CONSOLIDATED FINANCIAL STATEMENTS (continued)
NOTE 15 – ACCOUNTS RECEIVABLE (continued):
As of 31 December 2009, the value of trade-receivable balances over 120 days at the total amount of $3,576 thousand (2008 - $5,545 thousand; 2007 – $4,302 thousand) has decreased and a provision has been made in respect of these balances. The amount of the provision was $2,281 thousand as of 31 December 2009 (2008 - 3,874 thousand; 2007 – $3,214 thousand). The trade-receivable balances in respect of which impairment provision has been made are balances of customers, whose debts have not yet been paid for various reasons. The Group believes that it would be possible to collect some of the said debts; the aging of the said balances is presented below:
December 31
2009 2008 2007
U.S. dollars in thousands
120 days to 1 year 1,696 1,394 3,474 Over 1 year 1,880 4,151 828
3,576 5,545 4,302 Provision for impairment of receivables (2,281) (3,847) (3,214)
1,295 1,698 1,088
December 31
2009 2008 2007
U.S. dollars in thousands
b. Other: Employees 564 427 526 Related parties - 4 6 Government institutions 7,481 8,680 9,290 Refund receivable in respect of acquisition of FSI 3,779 - - Sundry 1,556 2,462 2,173
13,380 11,573 11,995
NOTE 16 – INVENTORIES December 31 2009 2008 2007
U.S. dollars in thousands
Raw materials and supplies 39,427 46,284 45,577 Products in process 3,065 4,270 3,930 Finished products 35,649 41,109 36,939
78,141 91,663 86,446 Inventories for commercial operations – purchased products 972 3,253 4,006
79,113 94,916 90,452

80
FRUTAROM INDUSTRIES LTD.
NOTES TO THE CONSOLIDATED FINANCIAL STATEMENTS (continued)
NOTE 17 – PRE-PAID EXPENES IN RESPECT OF OPERATING LEASE:
a) Frutarom Ltd. has a leasehold right in land located in the Akko Industrial Zone and the Haifa Bay. The net capitalised lease fees as at 31 December 2009, in respect of the said lands, amount to $1,237 thousand (2008 - $1,269 thousand). The leasing period is 49 years ending in the years 2032 through 2042. Frutarom Ltd. has a right to extend the leasing for an additional 49-year period.
b) In October 2003, Frutarom Ltd. entered into an agreement for the acquisition of
further lease rights in land from the Israel Land Administration; the land is located in an industrial zone at the North of Israel. In 2005 the company paid capital lease fees of $382 thousand in respect of the said land. In 2008, the land was returned to the Israel Land Administration and the Company received a refund of $324 thousand.
c) A subsidiary in China has “Land Use Rights” on land in China. The rights are for a
period of 50 years ending in 2046. Net capitalised lease fees as at 31 December 2009, in respect of the said land, amount to $199 thousand (2008 - $207 thousand).
d) Frutarom Ltd is engaged in operating lease agreements in relation to vehicles it is
using. For the last three months of the agreement, the company paid a total of $121 thousand.
NOTE 18 – CASH AND CASH EQUIVALENTS:
a. The cash and cash equivalents item is composed of the following balances: 31 December
2007 2008 2007
U.S. dollars in thousands
Cash and cash equivalents 42,940 37,229 31,942 Bank overdrafts - - (3,765)
42,940 37,229 28,177
b. Classified by currency, linkage terms and interest rates, the cash and cash equivalents
are as follows: Weighted interest rates as of 31 December
31 December 2009 2008 2007
2009 U.S. dollars in thousands
In Dollars 0.69% 14,686 8,061 7,613 In Pounds sterling 3,477 2,456 382 In Euro 0.43% 13,060 11,707 21,538 In Swiss Francs 0.12% 4,872 8,544 664 Other 6,845 6,461 1,745
42,940 37,229 31,942

81
FRUTAROM INDUSTRIES LTD.
NOTES TO THE CONSOLDIATED FINANCIAL STATEMENTS (continued)
NOTE 19 – ACCOUNTS PAYABLE:
31 December
2009 2008 2007
a. Trade: U.S. dollars in thousands
Open accounts 28,290 26,352 38,528 Cheques payable - 353 269
28,290 26,075 38,797
b. Other: Payroll and related expenses 8,663 7,799 7,813 Government institutions 6,759 9,151 18,678 Provision for commissions and discounts 1,734 1,896 1,914 Liability to Bank of New York (Note 11b1)) 231 347 444 Accrued expenses 7,191 7,366 8,644 Conditional consideration and put option respect of Nesse and the Gewurzmuller Group acquisitions (Note 5) - - 56,035 Sundry 1,210 1,242 2,884
25,788 27,801 96,412
NOTE 20 – PROVISIONS
Claims and litigations
U.S. dollars in thousands
Balance at 31 December 2006 946 Changes during 2007 - Utilised during the year (506)
Balance at 31 December 2007 440 Changes during 2008- additional provisions 558
Balance at 31 December 2008 1,028 Changes during 2009- Utilised during the year (621)
Balance at 31 December 2009 407
Claims and Litigation These provisions are made in respect of legal claims brought against the Group and potential litigations. Related estimated legal fees are also included in these provisions (Note 11b).

82
FRUTAROM INDUSTRIES LTD.
NOTES TO THE CONSOLDIATED FINANCIAL STATEMENTS (continued)
NOTE 21 – INCOME STATEMENT ANALYSIS:
2009 2008 2007
U.S. dollars in thousands
a. Cost of Sales: Industrial operations: Materials consumed 184,054 212,949 177,743 Payroll and related expenses 38,748 40,617 31,675 Depreciation and amortization 10,686 10,900 8,491 Other production expenses 23,818 25,888 19,931
257,306 290,354 237,840 Decrease (increase) in work in process and finished
products inventories 6,665 (4,510) (9,304)
263,971 285,844 228,536 Commercial operations – cost of products
sold 5,706 11,171 8,970
269,677 297,015 237,506
b. Selling, Marketing, Research and Development
Expenses – net: Payroll and related expenses 41,312 43,466 34,474 Transportation and shipping 11,126 14,440 10,616 Provisions for payment of
commissions and royalties 2,961 4,006 3,865 Provision for impairment of trade receivables 605 1,225 204 Depreciation and amortization 4,856 4,177 2,412 Travel and entertainment 2,638 3,656 3,282 Office rent and maintenance 4,032 4,430 3,794 Other 7,878 9,603 8,251
75,408 85,003 66,898
The item includes expenses for product development and research activities, net* 20,976 21,739 18,170
* net of participation from government departments and others 540 1,190 289

83
FRUTAROM INDUSTRIES LTD.
NOTES TO THE CONSOLDIATED FINANCIAL STATEMENTS (continued)
NOTE 21 – INCOME STATEMENT ANALYSIS (continued):
2009 2008 2007
U.S. dollars in thousands
c. General and Administrative Expenses: Payroll and related expenses 18,960 20,422 17,639 Depreciation and amortization 2,682 1,905 1,704 Professional fees 2,564 2,977 2,353 Communication, office supplies and
Maintenance 4,735 5,450 3,818 Travel and entertainment 1,014 1,295 1,420 Other 3,049 3,157 2,591
33,004 35,206 29,525
d. Other income – net:
Capital loss (gain) on sale of fixed assets (293) (3,231) 89 Rental (85) (81) (107) Impairment of property, plant and equipment and
intangible assets - 1,569 - Payment of compensation to distributor in respect
of termination of agreement 254 - - Expenses in respect of evacuation of a rented asset
and bringing it to the condition necessary for it to be capable operating in accordance with management's intentions - 892 -
Provision for lawsuits concerning environmental issues - 588 -
Other (71) (286) (176)
(195) (549) (194)
e. Financial Expenses – net: In respect of long-term loans and credit 3,806 8,039 903 In respect of exchange differences of
trade receivables and trade payable balances – net 506 2,130 167
In respect of cash and cash equivalents, short-term deposits and loans, short- term credit and other – net 32 381 1,260
Periodic change in non-current liability for the acquisition of Nesse - - 593
4,344 10,550 2,923

84
FRUTAROM INDUSTRIES LTD.
NOTES TO THE CONSOLDIATED FINANCIAL STATEMENTS (continued)
NOTE 22 – CASH FLOWS FROM OPERATIONS
2009 2008 2007
U.S. dollars in thousands
Net income 42,941 46,061 31,603
Adjustments required to reflect the cash flows from
operating activities: Depreciation and amortization 18,224 18,551 12,647 Recognition of compensation related to employee
stock and option grants 708 1,173 1,200 Liability for employee rights upon retirement - net (50) 243 (5,521) Deferred income taxes – net 473 1,879 785 Loss (gain) from sale of fixed assets (256) *(3,231) 42 Increase (decrease) in provisions - net (621) 588 (545) Erosion (gains from rate differences) of long-term loans (527) 558 550 Interest paid (received) 3,530 7,751 (867) Other - - 593
21,481 27,512 8,884
Changes in working capital: Decrease (increase) in accounts receivable:
Trade 8,807 2,850 (5,152) Other 1,588 1,114 6,506
Increase (decrease) in accounts payable: Trade (359) (11,991) 3,832 Other (1,829) (3,228) (6,078)
Decrease (increase) in inventories 23,665 (10,758) (15,563)
31,872 (22,013) (16,455)
Cash flows from operating activities 96,294 51,560 24,032
Non-cash transactions Refund in respect of land at the North of Israel 359
* Including capital loss in respect of returning the land in the industrial zone at the North of Israel.
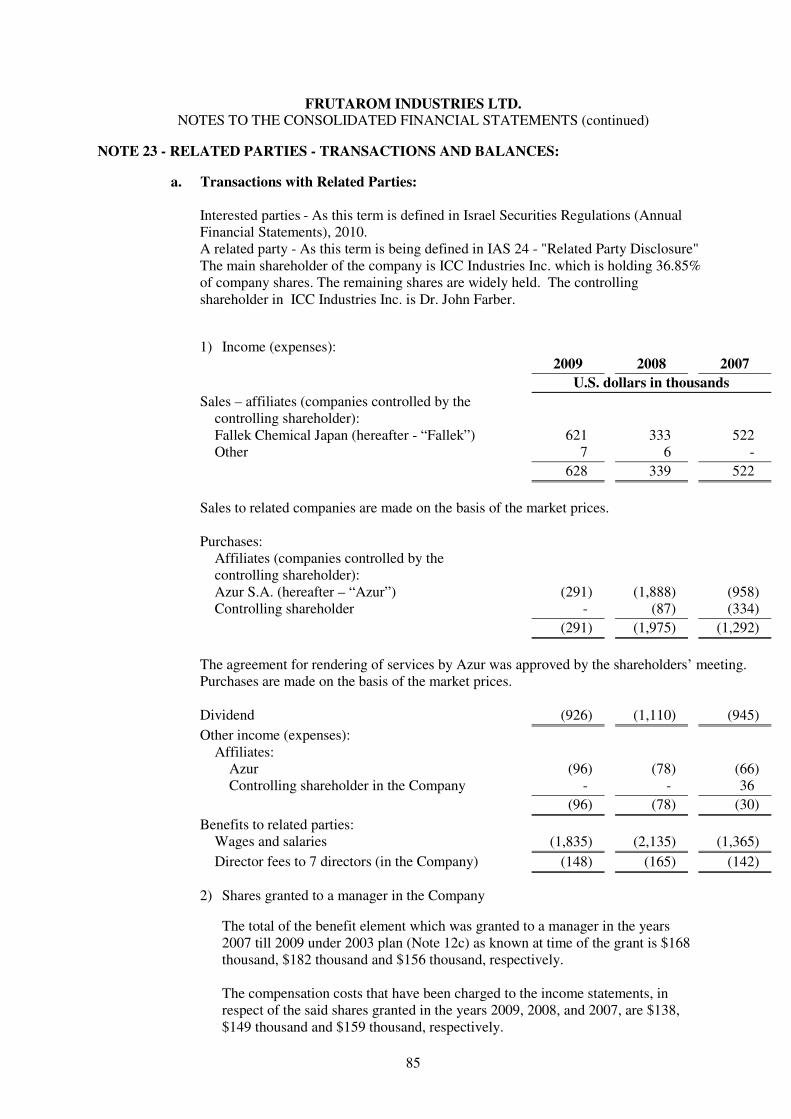
85
FRUTAROM INDUSTRIES LTD. NOTES TO THE CONSOLIDATED FINANCIAL STATEMENTS (continued)
NOTE 23 - RELATED PARTIES - TRANSACTIONS AND BALANCES:
a. Transactions with Related Parties:
Interested parties - As this term is defined in Israel Securities Regulations (Annual Financial Statements), 2010. A related party - As this term is being defined in IAS 24 - "Related Party Disclosure" The main shareholder of the company is ICC Industries Inc. which is holding 36.85% of company shares. The remaining shares are widely held. The controlling shareholder in ICC Industries Inc. is Dr. John Farber.
1) Income (expenses): 2009 2008 2007
U.S. dollars in thousands
Sales – affiliates (companies controlled by the controlling shareholder): Fallek Chemical Japan (hereafter - “Fallek”) 621 333 522 Other 7 6 -
628 339 522
Sales to related companies are made on the basis of the market prices.
Purchases:
Affiliates (companies controlled by the controlling shareholder): Azur S.A. (hereafter – “Azur”) (291) (1,888) (958) Controlling shareholder - (87) (334)
(291) (1,975) (1,292)
The agreement for rendering of services by Azur was approved by the shareholders’ meeting. Purchases are made on the basis of the market prices.
Dividend (926) (1,110) (945)
Other income (expenses): Affiliates:
Azur (96) (78) (66) Controlling shareholder in the Company - - 36
(96) (78) (30)
Benefits to related parties: Wages and salaries (1,835) (2,135) (1,365)
Director fees to 7 directors (in the Company) (148) (165) (142)
2) Shares granted to a manager in the Company
The total of the benefit element which was granted to a manager in the years 2007 till 2009 under 2003 plan (Note 12c) as known at time of the grant is $168 thousand, $182 thousand and $156 thousand, respectively. The compensation costs that have been charged to the income statements, in respect of the said shares granted in the years 2009, 2008, and 2007, are $138, $149 thousand and $159 thousand, respectively.
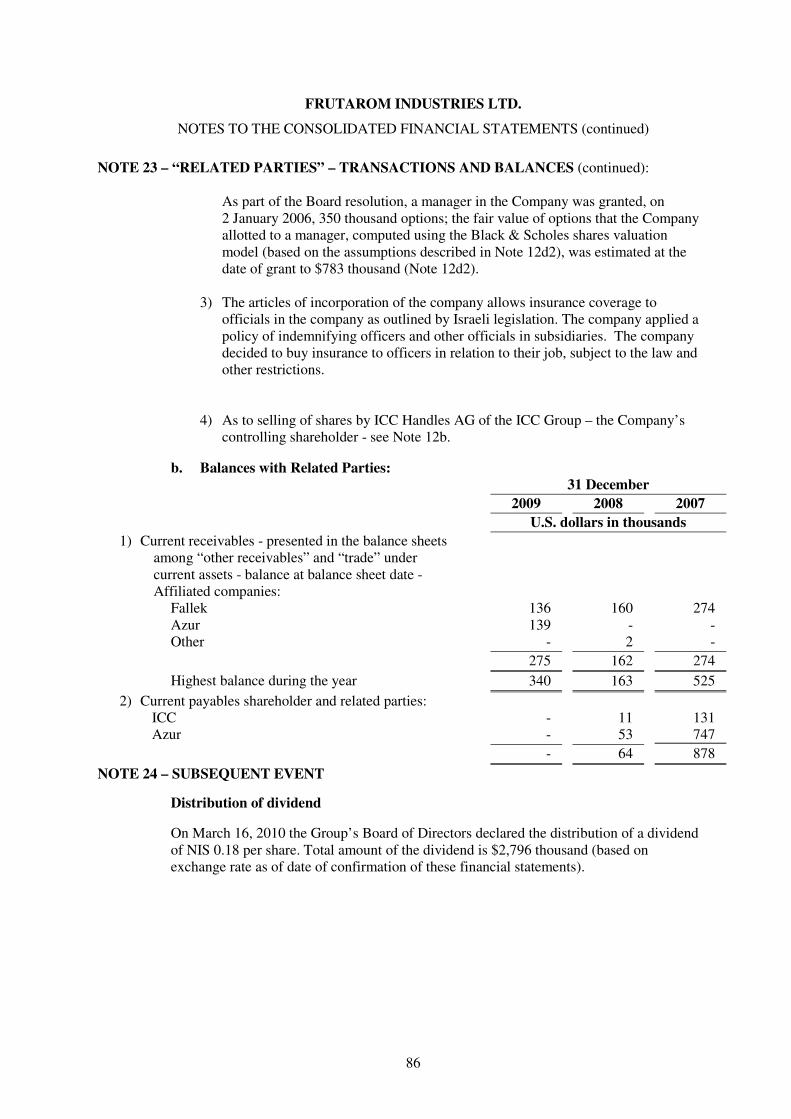
86
FRUTAROM INDUSTRIES LTD.
NOTES TO THE CONSOLIDATED FINANCIAL STATEMENTS (continued)
NOTE 23 – “RELATED PARTIES” – TRANSACTIONS AND BALANCES (continued): As part of the Board resolution, a manager in the Company was granted, on 2 January 2006, 350 thousand options; the fair value of options that the Company allotted to a manager, computed using the Black & Scholes shares valuation model (based on the assumptions described in Note 12d2), was estimated at the date of grant to $783 thousand (Note 12d2).
3) The articles of incorporation of the company allows insurance coverage to
officials in the company as outlined by Israeli legislation. The company applied a policy of indemnifying officers and other officials in subsidiaries. The company decided to buy insurance to officers in relation to their job, subject to the law and other restrictions.
4) As to selling of shares by ICC Handles AG of the ICC Group – the Company’s controlling shareholder - see Note 12b.
b. Balances with Related Parties: 31 December
2009 2008 2007
U.S. dollars in thousands
1) Current receivables - presented in the balance sheets among “other receivables” and “trade” under current assets - balance at balance sheet date - Affiliated companies:
Fallek 136 160 274 Azur 139 - - Other - 2 -
275 162 274
Highest balance during the year 340 163 525
2) Current payables shareholder and related parties: ICC - 11 131 Azur - 53 747
- 64 878
NOTE 24 – SUBSEQUENT EVENT
Distribution of dividend
On March 16, 2010 the Group’s Board of Directors declared the distribution of a dividend of NIS 0.18 per share. Total amount of the dividend is $2,796 thousand (based on exchange rate as of date of confirmation of these financial statements).
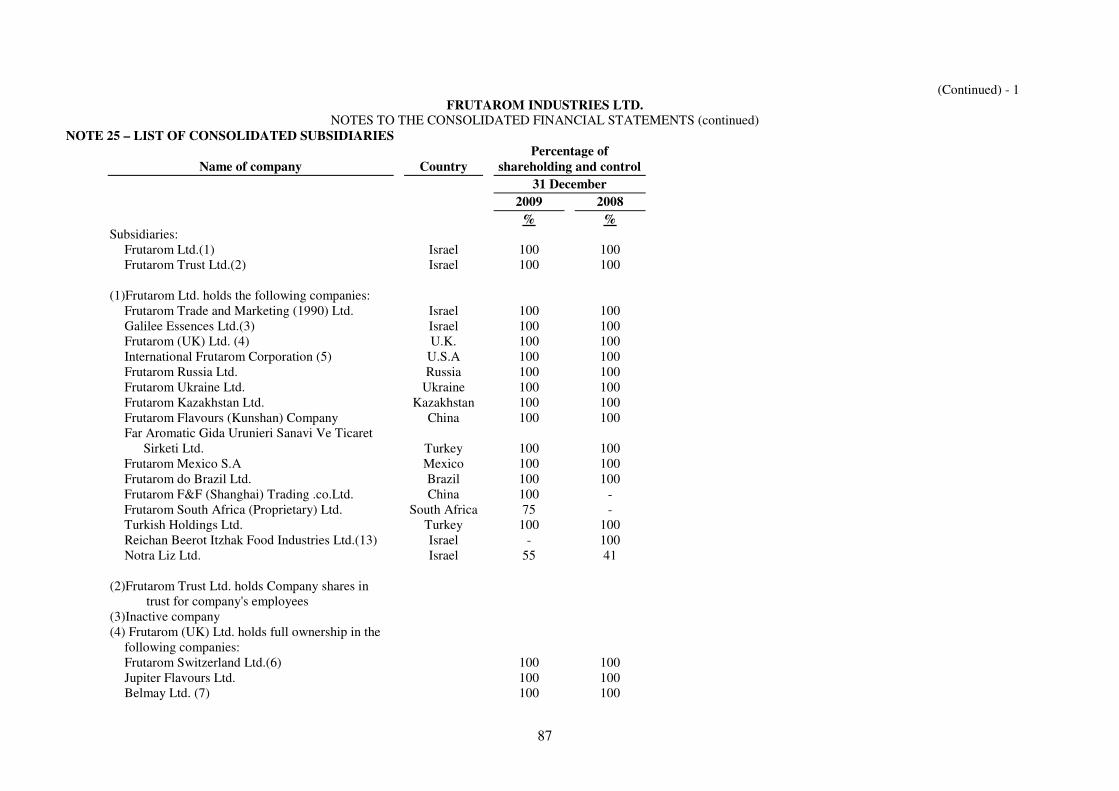
87
(Continued) - 1 FRUTAROM INDUSTRIES LTD.
NOTES TO THE CONSOLIDATED FINANCIAL STATEMENTS (continued) NOTE 25 – LIST OF CONSOLIDATED SUBSIDIARIES
Percentage of Name of company Country shareholding and control
31 December
2009 2008
% % Subsidiaries:
Frutarom Ltd.(1) Israel 100 100 Frutarom Trust Ltd.(2) Israel 100 100
(1)Frutarom Ltd. holds the following companies:
Frutarom Trade and Marketing (1990) Ltd. Israel 100 100 Galilee Essences Ltd.(3) Israel 100 100 Frutarom (UK) Ltd. (4) U.K. 100 100 International Frutarom Corporation (5) U.S.A 100 100 Frutarom Russia Ltd. Russia 100 100 Frutarom Ukraine Ltd. Ukraine 100 100 Frutarom Kazakhstan Ltd. Kazakhstan 100 100 Frutarom Flavours (Kunshan) Company China 100 100 Far Aromatic Gida Urunieri Sanavi Ve Ticaret
Sirketi Ltd. Turkey 100 100 Frutarom Mexico S.A Mexico 100 100 Frutarom do Brazil Ltd. Brazil 100 100 Frutarom F&F (Shanghai) Trading .co.Ltd. China 100 - Frutarom South Africa (Proprietary) Ltd. South Africa 75 - Turkish Holdings Ltd. Turkey 100 100 Reichan Beerot Itzhak Food Industries Ltd.(13) Israel - 100 Notra Liz Ltd. Israel 55 41
(2)Frutarom Trust Ltd. holds Company shares in
trust for company's employees (3)Inactive company (4) Frutarom (UK) Ltd. holds full ownership in the
following companies: Frutarom Switzerland Ltd.(6) 100 100 Jupiter Flavours Ltd. 100 100 Belmay Ltd. (7) 100 100

88
(Continued) - 2
FRUTAROM INDUSTRIES LTD.
NOTES TO THE CONSOLIDAETD FINANCIAL STATEMENTS (continued)
NOTE 25 – LIST OF CONSOLIDATED SUBSIDIARIES (continued): Percentage of
Name of company Country shareholding and control
31 December
2009 2008
% % (5) International Frutarom Corporation holds the
following companies: Frutarom U.S.A. Inc. 100 100 Frutarom Inc. 100 100 Abaco Inc. 100 100 Abaco Manufacturing LLC 100 100
(6) Frutarom Switzerland Ltd. has full ownership
in the following companies: Frutarom Germany GmbH(8) 100 100 Frutarom Nordic A/S 100 100 Frutarom France S.A.R.L 100 100 Frutrarom (Marketing) S.R.L 100 100 Frutarom Netherlands B.V.(9) 100 100
(7)Belmay Ltd. has full ownership in the following
companies - Belmay Pacific PTE Ltd. 100 100

89
(Concluded) - 2
FRUTAROM INDUSTRIES LTD.
NOTES TO THE CONSOLIDAETD FINANCIAL STATEMENTS (continued)
NOTE 25 – LIST OF CONSOLIDATED SUBSIDIARIES (continued): Percentage of
Name of company Country shareholding and control
31 December
2009 2008
% % (8)Frutarom Germany GmbH has holdings in the
following companies: GewurzMuhle Nesse GmbH(11) 100 70 GewurzMuhle Nesse Gebr. Krause GmbH(12) 100 70 GewurzMuller GmbH(10) 100 100 Blessing Biotech GmbH 100 100
(9)Frutarom Netherlands B.V. holds full ownership
in the following companies: Frutarom Belgium N.V. 100 100 Frutarom U.S.A. Holding Inc.(3) 100 100
(10)GewurzMuller GmbH holds full ownership in
the following companies Sell-4-u.com Agentur fur Marketing 100 100 E-business und Telemarketing GmbH 100 100 GewurzMuller AG(3) 100 100
(11)GewürzMühle Nesse GmbH holds 75% of
the issued and paid share capital of Food Venture GmbH.
(12) GewürzMühle Nesse Gebr. Krause GmbH
holds 100% of the issued and paid share capital of NESSEpol Sp. z.o.o.
(13) Merged into Frutarom Ltd.

Section D
Additional Information

Section D – Additional Details
Regulation 9 Financial Report………………………………………………….. 3
Regulation 10 Directors' Report………………………………………………….. 3
Regulation 10A Summary of Quarterly Profit and Loss Reports………………. 4
Regulation 10C Use of Proceeds on Shares…….……………………………… 5
Regulation 11 List of Investments in Subsidiaries and Affiliated Companies.. 5
Regulation 12 Changes in Investments in Subsidiaries and Affiliated
Companies……………….………………………………………
6
Regulation 13 Income of Subsidiaries and Affiliated Companies and Income
from them …………..……………………………………………
7
Regulation 14 Loans…………..………………………………………………… 7
Regulation 20 Trade on the Stock Exchange………………………………….. 7
Regulation 21 Payments to Interested Parties and Senior Officeholders …... 8
Regulation 22 Transactions with Controlling Parties………………………… 11
Regulation 24 Holdings of Interested Parties…………………………………… 14
Regulation 24A Registered and Issued Shareholders Capital and Convertible
Securities…………………………………………………………
16
Regulation 25A Registered Office….……………………………………………… 16
Regulation 26 Directors…………………………………………………………… 16
Regulation 26A Senior Officeholders……………………………………………… 19
Regulation 26B Independent Signatories………………………………………… 21
Regulation 27 Auditors of the Company..………..…………………………….. 21
Regulation 28 Changes to Memorandum or Articles of Association………… 21
Regulation 29 Recommendations and Resolutions of the Directors…………. 21
Regulation 29A Decisions of the Company…..……………………………….…. 22

Additional Details on the Company
Company name: Frutarom Industries Ltd.
Company number: 52-004280-5
Address: 25 HaShaish St., Haifa Bay
P.O.B. 10067, Haifa Bay 26110
Email: [email protected]
Telephone: +972-4-846 2462 Fax: +972-4-872 2517 Balance Sheet date: December 31, 2009 Date of report: March 17, 2010 Period of report: January 1, 2009 - December 31, 2009

Regulation 9 - Financial Report The Financial Report for the period ended December 31, 2009, including the auditor’s opinion, is attached and form an integral part thereof.
Regulation 10 – Directors' Report The Frutarom Industries Ltd. Directors' report for the period ending December 31, 2009 is attached and form an integral part thereof.

Regulation 10A - Summary of Quarterly Profit and Loss Reports
IN US$ 000 Q1 - 2009 Q2 -2009 Q3 - 2009 Q4 - 2009 2009 Total
SALES 98,424 100.0% 106,717 100.0% 111,580 100.0% 108,458 100.0% 425,179 100.0
%
Cost of sales Material consumed 45,913 46.6% 49,682 46.6% 51,764 46.4% 49,066 45.2% 196,425 46.2% Other manufacturing 17,287 17.6% 17,591 16.5% 18,587 16.7% 19,787 18.2% 73,252 17.2% - - - - - Total 63,200 64.2% 67,273 63.0% 70,351 63.0% 68,853 63.5% 269,677 63.4%
GROSS PROFIT 35,224 35.8% 39,444 37.0% 41,229 37.0% 39,605 36.5% 155,502 36.6%
R&D, Selling and G&A R&D 4,341 4.4% 5,110 4.8% 5,177 4.6% 6,348 5.9% 20,976 4.9% Selling expenses 12,749 13.0% 13,419 12.6% 13,992 12.5% 14,272 13.2% 54,432 12.8% General & Administration 7,798 7.9% 8,193 7.7% 8,712 7.8% 8,301 7.7% 33,004 7.8% Total 24,888 25.3% 26,722 25.0% 27,881 25.0% 28,921 26.7% 108,412 25.5%
OPERATING PROFIT 10,336 10.5% 12,722 11.9% 13,348 12.0% 10,684 9.9% 47,090 11.1%
Financing expenses 3,310 3.4% 65 0.1% 85 0.1% 884 0.8% 4,344 1.0% Other expenses 107 0.1% (34) (0.0)% 17 0.0% (285) (0.3)% (195) (0.0)%
PROFIT BEFORE TAX 6,919 7.0% 12,691 11.9% 13,246 11.9% 10,085 9.3% 42,941 10.1%
TAX 1,318 1.3% 2,600 2.4% 3,215 2.9% 2,588 2.4% 9,721 2.3%
Tax rate 19.0% 20.5% 24.3% 25.7% 22.6%
NET PROFIT 5,601 5.7% 10,091 9.5% 10,031 9.0% 7,497 6.9% 33,220 7.8%

Regulation 10C - Use of Proceeds on Shares None. Regulation 11 - Investments in Subsidiaries and Affiliated Companies
Holding %
Name of company Type of Share
Par Value
Number of Shares Total Par Value
Equity Voting
Right to appoint director
Frutarom Ltd. #51-013293-9
Ordinary
1₪ 57,826,357 57,826,357 100 100 100
Frutarom Trust Ltd. #51-239737-3
Ordinary 1₪ 100 100 100 100 100
*Frutarom Ltd. directly and indirectly holds the following companies:
Frutarom Trade & Marketing (1990) Ltd. 100% Galilee Essences Ltd.(1) 100% Frutarom (UK) Ltd. (2) 100% International Frutarom Corp.(6) 100% Frutarom Russia Ltd. 100% Frutarom Ukraine Ltd. 100% Frutarom Kazakhstan Ltd. 100% Frutarom Flavors (Kunshan) Company 100% Far Aromatik Gida Urunleri Sanayi Ve Ticaret Limited Sirketi 100% Frutarom Mexico S.A. 100% Frutarom do Brazil Ltda. 100% Nutralease Ltd. 55% Frutarom F&F (Shanghai) Trading Co. Ltd. 100% Frutarom South Africa (Proprietary) Ltd. 75% Turkish Holdings Ltd. ) 1( 100%
(1) Dormant company
(2) Frutarom (UK) Ltd. holds the following companies: Frutarom Switzerland Ltd. (3) 100% Jupiter Flavours Ltd. 100% Belmay Ltd. (7) 100%
(3) Frutarom Switzerland Ltd. holds the following companies:
Frutarom Germany GmbH(4) 100% Frutarom Nordic A/S. 100% Frutarom France S.A.R.L. 100% Frutarom (Marketing) S.R.L. (1) 100%

Frutarom Netherlands B.V. (5) 100%
(4) Frutarom Germany GmbH holds the following companies: GewurzMuhle Nesse GmbH(9) 70% GewurzMuhle Nesse Gebr. Krause GmbH(10) 70% GewürzMüller GmbH(8) 100% Blessing Biotech GmbH 100%
(5) Frutarom Netherlands B.V. holds the following companies: Frutarom Belgium N.V. (11) 100% Frutarom USA Holding Inc. (1) 100%
(6) International Frutarom Corporation holds the following companies: Frutarom USA Inc. 100% Frutarom Inc. 100% Abaco Inc. 100% Abaco Manufacturing LLC. 100%
(7) Belmay Ltd. holds the following companies: Belmay Pacific PTE Ltd. 100%
(8) GewürzMüller GmbH holds the following companies:
Sell-4-u.com Agentur für Marketing E-business und Telemarketing GmbH 100%
GewürzMüller AG(1) 100%
(9) GewürzMühle Nesse GmbH holds: Food Ventures GmbH 75%
(10) GewürzMühle Nesse Gebr. Krause GmbH holds: NESSEpol Sp. Z.o.o.
75%
(11) one share is held by International Frutarom Corporation
Regulation 12 - Changes in Investments in Subsidiaries and Affiliated Companies
During the Report Period A. Changes to investments by Frutarom Ltd.
On July 2009 the Company signed an investment agreement with a South African company and its owner, according to which in return of an investment of US$110,000 in the South African company, Frutarom will be allocated with 75% of the South African company's issued share capital. Following the execution of the investment agreement the company changed its name to Frutarom South Africa (Proprietary) Ltd. The agreement further provides Frutarom with a put option and the owner with a call option, which will allow Frutarom to buy the remaining 25% of Frutarom South Africa (Proprietary) Ltd. issued share capital, at a price which will be determined based on the financial results of the company during 2010-2011.

On November 2009, the merger of RayHan Be'erot Yitzhak Ltd. Into Frutarom Ltd. was completed in accordance with Article 323 of the Companies Law, 1999.
B. Changes to investments of Belamy Ltd. On May 2009 Belamay Denmark AS and Belamy AS were liquidated. Regulation 13 - Income of Subsidiaries and Affiliated Companies and Income from
them
Company name Profit before tax (US$ 000)
Profit after tax (US$ 000)
Dividend (US$ 000)
Management fees
Interest
Frutarom Ltd. 42,632 33,436 2,485 156 228 Frutarom Trust Ltd. - - - - -
Regulation 14 – Loans Granting loans is not one of the Company’s main business activities.
Regulation 20 - Trade on the Stock Exchange
During the report period the Company issued 40,000 ordinary shares of the Company par value NIS 1.00 each, resulting from the exercise of 40,000 options by a senior officeholder. During the report period and following the retirement of 2 senior employees, 250,000 non registered options expired in accordance with the terms of the option plan under which they were allocated. During the report period trade in the Company’s shares was not halted, excluding technical halts due to the publication of the Company’s financial reports (on March 19, 2009, May 27, 2009, August 27, 2009, and November 24, 2009).
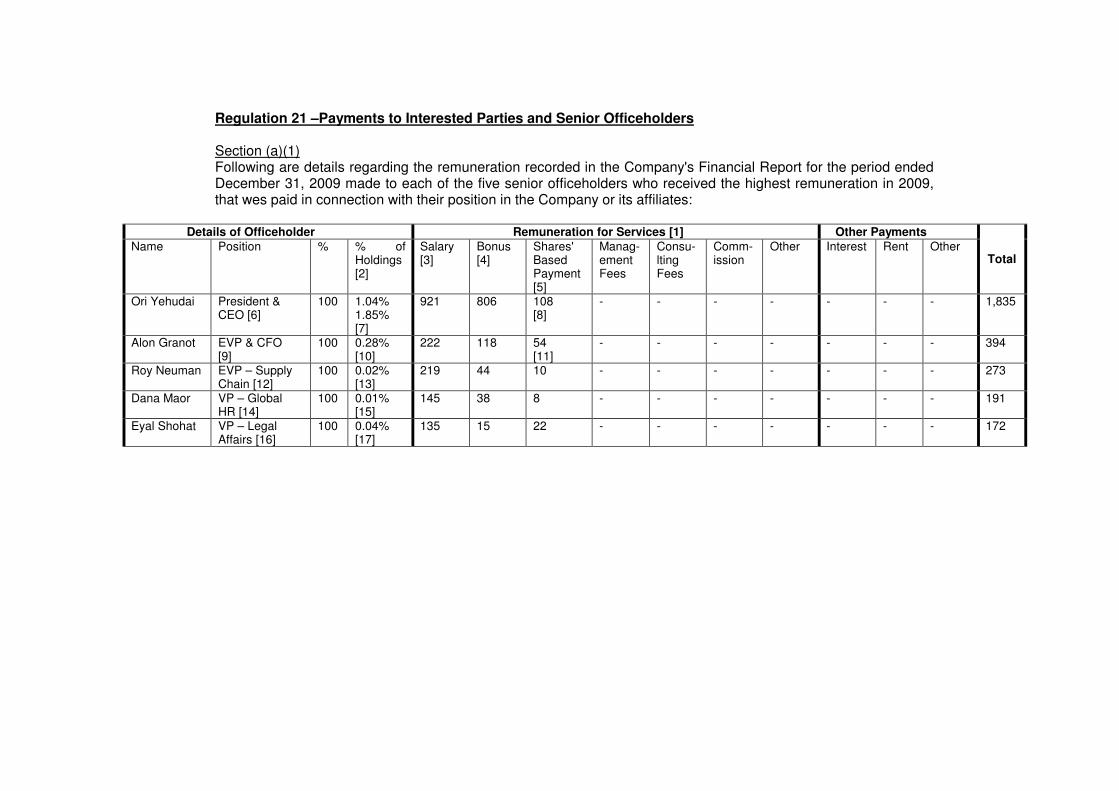
Regulation 21 –Payments to Interested Parties and Senior Officeholders
Section (a)(1) Following are details regarding the remuneration recorded in the Company's Financial Report for the period ended December 31, 2009 made to each of the five senior officeholders who received the highest remuneration in 2009, that wes paid in connection with their position in the Company or its affiliates:
Details of Officeholder Remuneration for Services [1] Other Payments
Name Position % % of Holdings [2]
Salary [3]
Bonus [4]
Shares' Based Payment [5]
Manag-ement Fees
Consu-lting Fees
Comm-ission
Other Interest Rent Other Total
Ori Yehudai President & CEO [6]
100 1.04% 1.85% [7]
921 806 108 [8]
- - - - - - - 1,835
Alon Granot EVP & CFO [9]
100 0.28% [10]
222 118 54 [11]
- - - - - - - 394
Roy Neuman EVP – Supply Chain [12]
100
0.02% [13]
219 44 10
- - - - - - - 273
Dana Maor VP – Global HR [14]
100 0.01% [15]
145 38 8 - - - - - - - 191
Eyal Shohat VP – Legal Affairs [16]
100 0.04% [17]
135 15 22
- - - - - - - 172

Comments to the table above: [1] the remuneration is in US$ thousands and are reflecting the cost to the Company. [2] as at the date of this Report. [3] including fringe benefits (car, telephone, social benefits, provisions for termination of employer-employee relationship, and any other payment made to the senior officeholder). [4] The Company's Board of Directors decides once a year, in accordance with the recommendations of the Compensation Committee, on granting a bonus to senior officeholders in the Company in accordance with the Company's performance in the last year. While deciding upon the annual bonus, the Board of Directors and the Compensation Committee take into account the Company's business and financial performance, the profitability achieved by the Company, the growth achieved by the Company and the personal contribution of the managers to theses achievements. In the opinion of the Company's Board of Directors, the remuneration granted to senior officeholders are fair and reasonable while taking into account the Company's size and complexity, its business accomplishments in recent years, the assignments and the scope of responsibility of the officeholders and their contribution to its achievements. [5] Commencing on 2003, every six months, the board of directors decides the amount of funds allocated to the 2003 Share Option Plan, based on the recommendations of the Compensation Committee. These funds are then used to buy Shares on the TASE, which are held in trust by Frutarom’s wholly owned subsidiary, Frutarom Trust Ltd., until the options to which they relate are exercised. Options granted under the 2003 Share Option Plan are vested over a three year period, one third every year, from the date on which they were granted. The Board of Directors of the Company has the exclusive authority to declare options exercisable as from an earlier date. The exercise price for the options has currently been set by the Board of Directors at one third of the average share price paid by the Company for the Shares. Options granted under the 2003 Share Option Plan expire on the sixth anniversary of the grant date. Any tax consequences arising from the grant or exercise of any options under the plan are the responsibility of the employee. The number of Shares covered by each option granted under the 2003 Share Option Plan, as well as the exercise price, are proportionally increased or decreased by the changes in the Company’s outstanding share capital resulting from a stock split, reverse stock split, stock dividend, combination or reclassification of Shares. Excluding few exceptions, in the event that the employment of an employee holding options granted under the 2003 Share Option Plan is terminated without cause, such employee has the right to exercise all vested options within 90 days from the date of termination. The remaining options which were granted but are unvested expire immediately. If the employment of an employee is terminated for cause, all unexercised options terminate immediately (the "Current Option Plan"). On January 2006, the Company allotted 725,000 non-transferable options exercisable into 725,000 ordinary shares of the Company, to four senior officeholders, of which 350,000 options were granted to Mr. Yehudai and 125,000 options were granted to Mr. Granot. . The options granted to Messrs. Yehudai and Granot are exercisable in three equal portions on January 1, 2008, January 1, 2009 and January 1, 2010. The exercise price is NIS 31.068 per option. The option shares will expire on February 1, 2012 (the "2006 Plan").

The amounts in the table reflect the depreciation recorded in the Company's Financial Reports for the period ended December 31, 2009 for options granted under the 2006 Plan and the Current Plan (for allocations made in 2005 through 2009). [6] Mr. Yehudai has been employed by the Company since 1986 and in 1996 became the President and the CEO. The employment of Mr. Yehudai will terminate with 6 months prior written notice given by either party. Mr. Yehudai is entitled in case of his employment in the Company being terminated within a period of 12 months from the date on which the holding of ICC Handels AG decreases below 26% of the Company's share capital, to continue receiving his salary and benefits from the Company for a twelve month period. Furthermore, upon the occurrence of such a change of control, all options and/or ordinary shares previously granted to Mr. Yehudai (and which are subject to a lock up period) will become immediately exercisable. [7] On a fully diluted basis – Mr. Yehudai holds 479,021 options exercisable into 479,021 ordinary shares of the Company. [8] As at the date of this Report Mr. Yehudai has 350,000 options under the 2006 Plan and 97,690 under the Current Plan. [9] Mr. Granot has been employed by the Company since 2001. The employment of Mr. Granot will terminate with 3 months prior written notice given by either party. Mr. Granot is entitled in case of his employment in the Company being terminated within a period of 12 months from the date on which the holding of ICC Handels AG decreases below 26% of the Company's share capital, to continue receiving his salary and benefits from the Company for a six month period. Furthermore, upon the occurrence of such a change of control, all options and/or ordinary shares previously granted to Mr. Granot (and which are subject to a lock up period) will become immediately exercisable. [10] on a fully diluted basis – Mr. Granot holds 157,865 options exercisable into 157,865 ordinary shares of the Company. [11] As at the date of this Report Mr. Granot has 125,000 options under the 2006 Plan and 32,965 under the Current Plan. [12] Mr. Neuman has been employed by the Company since March 2008. The employment of Mr. Neuman will terminate with 3 months prior written notice given by either party. On March 15, 2010 Mr. Neuman ceased to serve as a senior officeholder and his employment with the Company will terminate on June 2, 2010. [13] On a fully diluted basis – Mr. Neuman holds 12,285 options exercisable into 12,285 ordinary shares of the Company. [14] Mrs. Maor has been employed by the Company since March 2009. The employment of Mrs. Maor will terminate with 3 months prior written notice given by either party. [15] On a fully diluted basis – Mrs. Maor holds 7,250 options exercisable into 7,250 ordinary shares of the Company. [16] Mr. Shohat has been employed by the Company since 2002. The employment of Mr. Shohat will terminate with 30 days prior written notice given by either party. [17] on a fully diluted basis – Mr. Shohat holds 22,524 options exercisable into 22,524 ordinary shares of the Company.

Section (a)(2) There are no senior officeholders in the Company who received higher remuneration from the Company in 2009, not included in the above table. Section (a)(3) There are no interested parties in the Company who received remuneration not mentioned in the above table, except for directors. The remuneration paid to all of the directors in 2009 total US$ 148 thousands. Section (b) No remuneration was given to senior officeholders after December 31, 2009 and prior to the date of this Report. Regulation 22- Transactions with Controlling Parties
Transactions included in Section 270(4) of the Companies Law, 1999 In the Company's December 28, 2004 Annual General Meeting it was resolved:
1. To approve a "Framework Transaction" within its meaning in the Companies Regulation (Exemptions for Related Party Transactions), 2000 for the procurement of D&O Insurance by the Company as part of the ordinary course of business to insure the Company's directors and officers, its subsidiaries' directors and officers and its affiliated companies' directors and officers, who act on behalf of the controlling shareholder in the Company, i.e. ICC Industries Inc., (hereinafter: the
"Future Policies") in accordance with the following terms:
a. In the event that the Company's securities will be listed on a stock
exchange only in Israel - the annual coverage under the Future Policies will not exceed US$ 15 million per event and in total per year. In the event of claims against directors and officers of the Company as well as directors of subsidiaries in amounts exceeding the annual coverage, the amount of indemnification received from the insurance companies will be distributed among the relevant companies in proportion to their contribution to the annual premium. The annual premium for a Future Policy with annual coverage of US$ 15 million will not exceed US$ 75,000. In the event that the annual coverage will be below US$ 15 million, the annual premium for such Future Policy will be adjusted in the same proportion as the change in the annual coverage. Each Future Policy will be procured from an authorized insurer and have similar terms, and to the extent necessary additional terms as will be appropriate for the Company's needs at the time of extending/renewing the insurance policy. Such Future Policy will be approved by the Audit Committee and the Board of Directors, who will confirm that the Future Policy meets the guidelines and all necessary reports will be made.

If the insurance policy will provide collective insurance as described above, the cost of the annual premium will be proportionally divided between the different subsidiaries, in accordance with the decision of the Company's management and taking into account the recommendation of the Company's insurance consultant.
b. In the event that the Company's securities will be listed on an
additional stock exchange outside of Israel - the annual coverage under the Future Policies will not exceed US$ 30 million per event and in total per year. In the event of claims against directors and officers of the Company as well as directors of subsidiaries in amounts exceeding the annual coverage, the amount of indemnification received from the insurance companies will be divided among the companies for their directors and officers in proportion to their contribution to the annual premium. The annual premium for a Future Policy with annual coverage of US$ 30 million will not exceed US$ 200,000. In the event that the annual coverage will be below US$ 30 million, the annual premium for such Future Policy will be adjusted in the same proportion as the change in the annual coverage. Each Future Policy will be procured from an authorized insurer and have similar terms, and to the extent necessary additional terms as will be appropriate for the Company's needs at the time of extending/renewing the insurance policy. Such Future Policy will be approved by the Audit Committee and the Board of Directors, who will confirm that the Future Policy meets the guidelines and all necessary reports will be made. If the insurance policy will provide collective insurance as described above, the cost of the annual premium will be proportionally divided between the different subsidiaries, in accordance with the decision of the Company's management and taking into account the recommendation of the Company's insurance consultant.
The "Framework Transaction" will be for valid a period of ten (10) years until December 31, 2014.
2. The Company entering into indemnification agreements with each of its directors and officers who act on behalf of the controlling party in the Company, ICC Industries Inc.
3. To pay all the directors of the Company the maximum amount permitted under the
Companies Regulations (Rules for Remuneration and Expenses of External Directors) – 2001.
Transactions not included in Section 270(4) of the Companies Law, 1999 In the Company's June 25, 2000 Annual General Meeting it was resolved to approve a toll manufacturing agreement between the Company's wholly owned subsidiary, Frutarom Ltd., and C.S. Azur S.A. ("Azur"), a Romanian company controlled by ICC Industries Inc., the

Company's controlling shareholder, according to which Azur shall act as a sub contractor for Frtuarom Ltd. and will produce in its plant in Romania certain products for Frutarom Ltd. in accordance with a list that will be updated from time to time and in accordance with Frutarom Ltd.'s guidelines and under its supervision. The Company's Board of Directors, in its meeting of November 23, 2009, resolved to renew and update the agreement between Azur and Frutarom Ltd.

Regulation 24 - Holdings of Interested Parties
% of holding % of holding on a fully
diluted basis
Name of Interested party ID Number Share name Number of
share on
exchange
Number of shares
held on
March 11, 2010 Equity Voting
rights
Equity Voting
rights
Clal Finance Ltd. (Nostro) 51-138234-3 Ordinary 1081082 397,277 0.69 0.69 0.68 0.68 Clal Finance Ltd. (Provident Funds)
51-138234-3 Ordinary 1081082 100,836 0.17 0.17 0.17 0.17
Clal Insurance Enterprises Ltd (Participating Life Insurance)
52-003612-0 Ordinary 1081082 2,181,673 3.77 3.77 3.74 3.74
Clal Insurance Enterprises Ltd. (Mutual Funds)
52-003612-0 Ordinary 1081082 3,435,404 5.94 5.94 5.89 5.89
Epsilon Trust Funds (1991) Ltd.1
51-157620-9 Ordinary 1081082 1,000 0.00 0.00 0.00 0.00 Epsilon Provident Funds Ltd.
2 51-354412-2 Ordinary 1081082 12,277 0.02 0.02 0.02 0.02
Psagot Investment House Ltd. (Nostro)
51-376707-9 Ordinary 1081082 293,233 0.51 0.51 0.50 0.50
Psagot Investment House Ltd. (Mutual Funds)
51-376707-9 Ordinary 1081082 2,617,380 4.53 4.53 4.49 4.49
Psagot Investment House Ltd. (Provident Funds)
51-376707-9 Ordinary 1081082 781,770 1.35 1.35 1.34 1.34
Migdal Insurance & Financial Holdings Ltd. (Provident Funds)
52-002998-4 Ordinary 1081082 134,910 0.23 0.23 0.23 0.23
Migdal Insurance & Financial Holdings Ltd. (Mutual Funds)
52-002998-4 Ordinary 1081082 982,918 1.70 1.70 1.69 1.69
Migdal Insurance & Financial Holdings Ltd. (Participating Life Insurance)
52-002998-4 Ordinary 1081082 1,638,674 2.83 2.83 2.81 2.81
Migdal Insurance & Financial Holdings Ltd. (Nostro)
52-002998-4 Ordinary 1081082 101,780 0.18 0.18 0.17 0.17
Frutarom Trust Ltd.3 51-239737-3 Ordinary 1081082 579,839 1.00 1.00 0 0
ICC Industries Inc.4
132653653 Ordinary 1081082 21,308,025 36.85.53 36.85 36.55 36.55 John Oram
5 140036362 Ordinary 1081082 779,171 1.35 1.35 1.34 1.34
Ori Yehudai6
052731569 Ordinary 1081082 600,766 1.04 1.04 1.85 1.85 Hans Abderhalden
7 004817414 Ordinary 1081082 17,439 0.03 0.03 0.04 0.04
1 Epsilon Trust Funds (1991) Ltd. is an interested party in the Company by virtue of its being a company controlled by Koor Industries Ltd., which was acquired by Discount Investment Ltd., which is a company controlled by I.D.B. Development Ltd. I.D.B.

Development Ltd. is a controlling party in Clal Insurance Business Holdings Ltd., which is an interested party in the Company by virtue of its holdings.
2 Epsilon Pension Funds Management Ltd. is an interested party in the Company by virtue of its being a company controlled by Koor Industries Ltd., which was acquired by Discount Investment Ltd., which is a company controlled by I.D.B. Development Ltd. I.D.B. Development Ltd. is a controlling party in Clal Insurance Business Holdings Ltd., which is an interested part in the Company by virtue of its holdings.
3 Frutarom Trust Ltd., a wholly owned subsidiary of the Company, holds shares in trust for the Company's employees. 4 Holds through ICC Industries Inc. and its subsidiaries. The controlling party in ICC Industries Inc., Dr. John J. Farber, also serves as
Chairman of the board of directors of the Company. Dr. Farber’s wife, Maya Farber, serves as a director in the Company. 5 Mr. John L. Oram serves as a director in the Company. 6 Mr. Ori Yehudai serves as the President and Chief Executive Officer of the Company. Mr. Yehudai also holds 479,021options that
may be exercised into 479,021 ordinary shares in the Company. 7 Mr. Hans Abderhalden serves as a director in the Company. Mr. Abderhalden also holds 7,216 options that may be exercised into
7,216 ordinary shares in the Company.

Regulation 24A – Registered and Issued Share Capital and Convertible Securities Registered Share Capital:
NIS 100,000,000 divided into 100,000,000 shares par value NIS 1 each
Issued Share Capital:
NIS 57,826,357divided into 57,826,357 shares par value NIS 1 each
In addition as of the date of this report Frutarom Trust Ltd., a fully owned subsidiary of the Company, is holding 582,715 ordinary shares of the Company. The shares are held in trust for the Company's employees.
Regulation 25A – Registered Office Registered office: 25 HaShaish St., P.O.B. 10067, Haifa Bay 26110, Israel Email: [email protected] Telephone: +972 4 846 2401 Fax: +972 4 872 2517 Regulation 26 – Directors as at the Report Date
A. Dr. John J. Farber, Chairman of the Board
I.D. number: 111-201-362 (U.S.) Year of birth: 1925 Address: 435 E. 52 St., New York, N.Y. 10022, U.S.A. Nationality: American Not a member of committees of the board. Not an external director. Not employed by the company. Chairman of the board of the Company; chairman of ICC Industries Inc., the Company’s majority shareholder. Began service as a director in 1996. Education, professions and fields of education, educational institute at which degree was earned and which degree or certificate held, main occupation during the past 5 years: Academic - Ph.D. in Chemistry from Polytechnic Institute of Brooklyn, New York. Chairman of the Company and of ICC Industries Inc. Director in other companies: chairman of ICC Industries Inc., the Company’s majority shareholder. Serves as director of subsidiaries of ICC Industries Inc. Married to Mrs. M. Farber, director of the Company. Expert Director: Director with financial and accounting expertise. Independent Director: No.

B. Mrs. Maya Farber I.D. number: 152-434-380 (U.S.) Year of birth: 1936 Address: 435 E. 52 St., New York, N.Y. 10022, U.S.A. Nationality: American Not a member of committees of the board. Not an external director. Not employed by the Company. Began service as a director in 1996. Education, professions and fields of education, educational institute at which degree was earned and which degree or certificate held and main occupation during the past 5 years: Academic – BA from Hunter College, New York. Artist. Director in other companies: ICC Industries Inc., the Company’s majority shareholder. Married to Dr. J. J. Farber, chairman of the board. Expert Director: No. Independent Director: No.
C. Mr. John L. Oram I.D. number: 761050695 (British) Year of birth: 1944 Address: POB 533, Bedford Hills, N.Y., U.S.A. Nationality: British Chairman of the Compensation Committee. Not an external director. Not employed by the Company. Began service as director in 1996. Education, professions and fields of education, educational institute at which degree was earned and which degree or certificate held and main occupation during the past 5 years: Academic – BA, Accountant and economist. A fellow of the Institute of Chartered Accountants in England and Wales, President of ICC Industries Inc. through April 30, 2008, consultant through December 31, 2008. Director in other companies: No. Not related to another interested party. Expert Director: Director with financial and accounting expertise. Independent Director: No.
D. Mr. Hans Abderhalden
I.D. number: 004817414 (Swiss) Year of birth: 1939 Address: Lerchenbergstrasse 114, 8703 Erlenbach 8703, Switzerland Nationality: Swiss Not an external director. Director in Frutarom Switzerland Ltd. Began service as a director in 2004.

Education, professions and fields of education, educational institute at which degree was earned and which degree or certificate held and main occupation during the past 5 years: IMD Program for Executive Development from IMD, Switzerland. Director of Emil Flachsmann AG (today Frutarom Switzerland Ltd.). Director in other companies: Frutarom Switzerland Ltd. Not related to another interested party. Expert Director: Director with financial and accounting expertise. Independent Director: No.
F. Mr. Isaac Angel I.D. number: 012735478 (Israeli) Year of birth: 1956 Address: 44 Ravutzki St., Ra'anana Nationality: Israeli Member of Audit, Compensation and Executive Committees of the board. Not employed by the Company. External director. Began service as a director in 2008. Education, professions and fields of education, educational institute at which degree was earned and which degree or certificate held and main occupation during the past 5 years: High school education. Senior vice president at Verifone Inc. until December 31, 2007; president and general manager of Lipman Electronic Engineering Ltd. until 2006. From 2008 began to serve as a business advisor. Director in other companies: Non. Not related to another interested party in the Company. Expert Director: Director with financial and accounting expertise. Independent Director: Yes.
G. Mr. Yacov Elinav I.D. number: 006287338 (Israeli) Year of birth: 1944 Address: 10 Hadudaim St., Herzlia Nationality: Israeli Member of Audit, Compensation and Executive committees of the board. Not employed by the Company. External director. Began service as a director in 2008. Education, professions and fields of education, educational institute at which degree was earned and which degree or certificate held and main occupation during the past 5 years: Academic education - BA in economics and business management from The Hebrew University, Jerusalem. In 2004 began service as chairman of the board of Dash Securities and Investments Ltd. Until 2003 served as vice president of Bank HaPoalim. Director in other companies: Yellow Pages Ltd., the Bank for Industrial Development Ltd., Ayalon Highways Ltd., Delek Real Estate Ltd., Yuvalim

Pension Fund Management Ltd., Elinav Consulting and Services Ltd.; New Kopel Ltd.; Middle East Pipes Ltd.; Tefron Ltd.; Dash Securities and Investments Ltd.; Dash Provident Funds Ltd.; Dash Institutionals Ltd.; Sapiens Ltd.; B.G. Group Ltd.; Polar Communication Ltd.; Phoenix Platinum Ltd.; Phoenix Platinum HR Ltd.; Global Box Ltd. Not related to another interested party in the Company. Expert Director: Director with financial and accounting expertise. Independent Director: Yes.
Regulation 26A - Senior Officeholders as at the Report Date
1. Ori Yehudai President & C.E.O. I.D. number: 052731569 (Israeli) Year of birth: 1954 Serves as director in subsidiaries of the Company. Interested Party. Not related to another officer or interested party in the Company. Education, professions and fields of education, educational institute at which degree was earned and which degree or certificate held and main occupation during the past 5 years: Academic - BA in Economics from Tel Aviv University and MA in Business Administration from Tel Aviv University. President and chief executive officer of the Company. From 2001-2004 served as chairman of the Manufacturers Association in the North of Israel. Since 2008 serves as the chairman of the Economic Committee of the Manufacturers Association. Began service in 1996. (Employed by the Company since 1986.)
2. Alon Granot Executive Vice President & C.F.O. I.D. number: 057210247 (Israeli) Year of birth: 1961 Responsible for market risk management. Serves as a director in subsidiaries of the Company. Not an Interested Party. Not related to another senior officeholder or interested party in the Company. Education, professions and fields of education, educational institute at which degree was earned and which degree or certificate held and main occupation during the past 5 years: Academic - BA in Economics and Business Administration from Haifa University and MA in Economics from the Technion, Haifa. Worked at Kulicke & Sofa Ltd. from 1990-2001. Began service in 2001.

3. Amos Anatot Executive Vice President Global Supply Chain. I.D. number: 51923548 (Israeli) Year of birth: 1953 Does not serve as a director in subsidiaries of the Company. Not an Interested Party. Not related to another senior officeholder or interested party in the Company. Education, professions and fields of education, educational institute at which degree was earned and which degree or certificate held and main occupation during the past 5 years: Academic - B.Sc. Industrial Management, Techninion,. VP Teva Europe, Teva Pharmaceuticals Industries Ltd.. Beginning of service: 2010.
4. Eyal Shohat Vice President – Legal Affairs I.D. number: 025609694 Year of birth: 1973 Serves as a director in subsidiaries of the Company. Not an Interested Party. Not related to another senior officeholder or interested party in the Company. Education, professions and fields of education, educational institute at which degree was earned and which degree or certificate held and main occupation during the past 5 years: Academic – LLB in Law and BA in Accounting from the Tel Aviv University. From 2002-2007 served at Legal Counsel in the Company. Began service in 2006. (Employed by the Company since 2002.)
5. Yoav Barak Internal Auditor I.D. number: 53670352 Year of birth: 1955 Does not serve as a director in subsidiaries of the Company. Not an Interested Party. Not related to another senior officeholder or interested party in the Company. Education, professions and fields of education, educational institute at which degree was earned and which degree or certificate held and main occupation during the past 5 years: Academic – BA in Economics and Accounting from Haifa University. Performs internal auditing for companies, general manager of Rosenthal Ltd., general manager of PT3 Ltd., general manager of Tamor Lighting Ltd., general manager of Fertilizers & Chemicals Ltd., general manager of Zika Electrodes Ltd. Began service in 2004.

6. Guy Gill Vice President – Finance I.D. number: 24223380 Year of birth: 1969 Does not serve as a director in subsidiaries of the Company. Not an Interested Party. Not related to another senior officeholder or interested party in the Company. Education, professions and fields of education, educational institute at which degree was earned and which degree or certificate held and main occupation during the past 5 years: Academic – BA in Economics and Accounting from Haifa University. Financial manager at Ginegar Factory Industries (1996) Ltd. from 2003-2007. Kost Forrer et Gabbay from 2001-2002. From 2006-2007 served as Controller in the Group. Began service in 2006.
7. Dana Maor
Vice President – Finance I.D. number: 22973440 Year of birth: 1967 Does not serve as a director in subsidiaries of the Company. Not an Interested Party. Not related to another senior officeholder or interested party in the Company. Education, professions and fields of education, educational institute at which degree was earned and which degree or certificate held and main occupation during the past 5 years: BA, Psychology and Criminology, Bar-Ilan University. MA, Industrial Psychology, Bar-Ilan University. Assistant Director General HR, Radvision; Consultant for Start-Up companies; Division Assistant Director General HR, Amdocs. Began service in 2006.
Regulation 26B – Independent Signatories None. Regulation 27 – Auditors of the Company
Frutarom Industries Ltd.’s auditors are Kesselman & Kesselman, 1 Nathanson St., Haifa 33034, Israel. To the best of the Company’s knowledge the auditors are not interested parties and/or related to any senior officeholder or interested party in the Company. Regulation 28 – Changes to Memorandum or Articles of Association No changes were made during the report period to the articles of association and/or memorandum.

Regulation 29 – Recommendations and Decisions of the Directors
Recommendations of the Board of Directors to the general meeting and their decisions that do not require the approval of the general meeting: On March 16, 2010 the Board of Directors of the Company resolved to distribute a dividend of NIS 0.18 per share, totaling NIS 10,408,744.
Regulation 29A – Decisions of the Company No decisions were taken by the Company in the matters mentioned. Date: March 16, 2010 Frutarom Industries Ltd. By: ________________________ Signatory: Dr. John Farber Position: Chairman of the Board By: ________________________ Signatory: Ori Yehudai Position: President and Chief Executive Office

BOARD OF DIRECTORS
Dr. John J. Farber
Chairman of Board of Directors
Maya Farber
John L. Oram
Chairman of Compensation Committee
Hans Abderhalden
Yacov Elinav
External Director, Member of Audit Committee, Compensation Committee and Executive Committee
Isaac Angel External Director, Member of Audit Committee, Compensation Committee and Executive Committee