Embed Size (px)
Citation preview
FSNAUFSNAU Nutrition Update, November 2017
November 2017Food Security and Nutrition
Analysis Unit - Somalia
FSNAU
FSNAU Funding AgenciesTechnical Partners
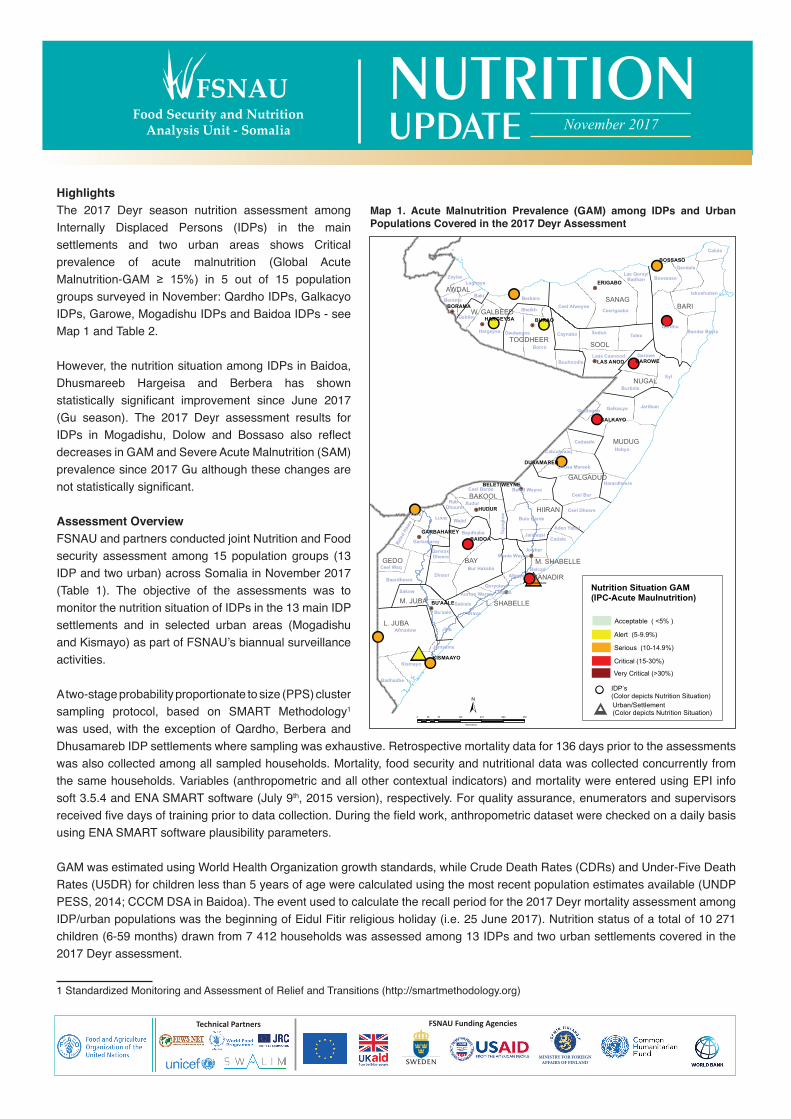
HighlightsThe 2017 Deyr season nutrition assessment among Internally Displaced Persons (IDPs) in the main settlements and two urban areas shows Critical prevalence of acute malnutrition (Global Acute Malnutrition-GAM ≥ 15%) in 5 out of 15 population groups surveyed in November: Qardho IDPs, Galkacyo IDPs, Garowe, Mogadishu IDPs and Baidoa IDPs - see Map 1 and Table 2.
However, the nutrition situation among IDPs in Baidoa, Dhusmareeb Hargeisa and Berbera has shown statistically significant improvement since June 2017 (Gu season). The 2017 Deyr assessment results for IDPs in Mogadishu, Dolow and Bossaso also reflect decreases in GAM and Severe Acute Malnutrition (SAM) prevalence since 2017 Gu although these changes are not statistically significant.
Assessment Overview FSNAU and partners conducted joint Nutrition and Food security assessment among 15 population groups (13 IDP and two urban) across Somalia in November 2017 (Table 1). The objective of the assessments was to monitor the nutrition situation of IDPs in the 13 main IDP settlements and in selected urban areas (Mogadishu and Kismayo) as part of FSNAU’s biannual surveillance activities.
A two-stage probability proportionate to size (PPS) cluster sampling protocol, based on SMART Methodology1 was used, with the exception of Qardho, Berbera and Dhusamareb IDP settlements where sampling was exhaustive. Retrospective mortality data for 136 days prior to the assessments was also collected among all sampled households. Mortality, food security and nutritional data was collected concurrently from the same households. Variables (anthropometric and all other contextual indicators) and mortality were entered using EPI info soft 3.5.4 and ENA SMART software (July 9th, 2015 version), respectively. For quality assurance, enumerators and supervisors received five days of training prior to data collection. During the field work, anthropometric dataset were checked on a daily basis using ENA SMART software plausibility parameters.
GAM was estimated using World Health Organization growth standards, while Crude Death Rates (CDRs) and Under-Five Death Rates (U5DR) for children less than 5 years of age were calculated using the most recent population estimates available (UNDP PESS, 2014; CCCM DSA in Baidoa). The event used to calculate the recall period for the 2017 Deyr mortality assessment among IDP/urban populations was the beginning of Eidul Fitir religious holiday (i.e. 25 June 2017). Nutrition status of a total of 10 271 children (6-59 months) drawn from 7 412 households was assessed among 13 IDPs and two urban settlements covered in the 2017 Deyr assessment. 1 Standardized Monitoring and Assessment of Relief and Transitions (http://smartmethodology.org)
"/
!.
!. !.
!.
!.
!.
!.
!.
!.
!.
!.
!.
!.
!.
!.
!.
!.¹#
¹#
!!
!!
!!
!!
!!
!!
!!
!!
!!
!!
!!
!!
!!
MOGADISHU
BARI
BAY
MUDUG
SANAG
GEDO
SOOL
L. JUBA
HIIRAN
GALGADUD
NUGAL
BAKOOL
TOGDHEER
M. JUBA
W. GALBEED
AWDAL
L. SHABELLE
M. SHABELLE
BANADIR
Hobyo
Eyl
Afmadow
Burco
Qardho
Ceerigaabo
Talex
Galkacyo
Luuq
Iskushuban
Ceel Bur
Bur Hakaba
Hargeysa
Dinsor
Bulo Barde
Xudun
Jariiban
Baardheere
Berbera
Baydhaba
Jilib
Burtinle
Sakow
Ceel Afweyne
Beled Weyne
Garowe
Kismayo
Zeylac
Caynabo
Qandala
Xudur
Dhusa Mareeb
Ceel Dheere
Cadale
Ceel Waq
Sablale
Laas Caanood
Bossaaso
Baki
Bu'aale
Calula
Cadaado
Garbaharey
Ceel Barde
Jowhar
Balcad
Wajid
Jalalaqsi
Badhadhe
Bandar BeylaOwdweyne
Taye
glow
Las Qoray/Badhan
Buuhoodle
Gebiley
Brava
Afgoye
Cabudwaaq
Sheikh
Wanle Weyne
Harardheere
Borama
Lughaye
Aden Yabal
Qoryoley
Bele
d Ha
wa
Dolo
Rab-Dhuure
Jamaame
Qansax Dheere
Goldogob
MarkaKurtun Warrey
HUDUR
BURAO
BAIDOA
GAROWE
BORAMA
BU'AALE
GALKAYO
BOSSASO
ERIGABO
KISMAAYO
LAS ANOD
HARGEYSA
DUSAMAREB
GARBAHAREY
BELET WEYNE
±0 70 140 210 280 35035
Kilometers
DEYR 2017 IDP and Urban Nutrition Assesment Situation in Somalia
Nutrition Situation GAM(IPC-Acute Maulnutrition)
Acceptable ( <5% )
Alert (5-9.9%)
Serious (10-14.9%)
Critical (15-30%)
Very Critical (>30%)
IDP’s (Color depicts Nutrition Situation) !!
## Urban/Settlement(Color depicts Nutrition Situation)
Map 1. Acute Malnutrition Prevalence (GAM) among IDPs and Urban Populations Covered in the 2017 Deyr Assessment
FSNAU
2
FSNAU Nutrition Update, November 2017
Assessment ResultsAcute malnutrition in children aged 6-59 months is a direct outcome indicator of recent changes in nutritional status. The 2017 Deyr season nutrition assessment among Internally Displaced Persons (IDPs) in the main settlements and two urban areas shows Critical GAM prevalence in 5 out of 15 population groups surveyed in November: Qardho IDPs (21.9%), Galkacyo IDPs (21.8%), Garowe (17.6%), Mogadishu IDPs (16.1%) and Baidoa IDPs (15.1%) [See Figure 1 and Table 2].
Serious GAM levels (10-14.9%) were recorded among IDPs in Dolow, Kismayo, Dhusamreeb, Bosaaso, Berbera, Dhobley and in urban Mogadishu. Alert levels of GAM (≥5 % to <10 %) were seen in among IDPs in Burao and Hargeisa and in urban Kismayo.
Deyr 2017 assessment recorded Critical levels of SAM prevalence (≥4-5.6) among IDPs in Mogadishu and Galkacyo. Serious levels of SAM prevalence were recorded among IDPs in Baidoa, Kismayo, Dhusamareeb, Qardho and Garowe. Alert SAM levels were noted among IDPs in Dolow, Bosaaso, Hargeisa, Burao, and Berbera and in urban Kismayo and urban Mogadishu.
Despite the persistence of high prevalence of acute malnutrition, there has been a statistically significant improvement in nutrition situation among IDPs in Baidoa, Dhusmareeb, Hargeisa and Berbera since June 2017 (Gu season). The assessment results for IDPs in Mogadishu, Dolow and Bosasso also reflect decreases in GAM and SAM prevalence since June 2017 although these changes are not statistically significant. The decreases in GAM in GAM Critical to Serious (17.6 % to 13.9 %) in Dolow and (18.6 % to 14.7 %) in Bossaso IDPs respectively.
However, it is concerning that Critical prevalence of acute malnutrition has persisted among some displaced populations: Garowe and Galkacyo IDPs since 2012 Gu and among Qardho and Mogadishu IDPs since 2016 Deyr (November).
The decrease in acute malnutrition prevalence among IDPs in Baidoa (GAM from 29.4 % to 15.1% and SAM from 10.4 % to 3.5 % since June 2017) reflect a statistically significant improvement (P=0.000). Crude Death Rate (CDR) and Under-Five Death Rate (U5DR) have also declined from >1/10 000/day and >2/10 000/day reported in June 2017 (Gu) to <1/10 000/day and <2/10 000/day, respectively, in 2017 Deyr (November). This is mainly attributed declined morbidity and Acute Watery Diarrhea (AWD) outbreaks and the impact of sustained humanitarian interventions. However, GAM prevalence among Baidoa IDPs remains Critical. Potential contributing factors include a high proportion of household with poor food consumption, experiencing hunger and trying to cope with food shortage. Immunization and vitamin A supplementation status are also low among children in Baidoa IDP settlement.
CDR 0.5-<1/10 000/day are seen among IDPs in Hargeisa, Buarao, Dhusamareb, Mogadishu and Baidoa while U5DR 1-<2/10 000/day are seen in Qardho, Dhusamareb, Mogadishu and Baidoa.
The AWD outbreak reported earlier this year has sharply declined compared to six months ago. However morbidity incidences in the two weeks prior to the assessments were high in Galkacyo (48.9%), Dhusmareeb (45%), Mogadishu (44.1%) and Qardho (43.7%).
Table 1. Sampling Details of Deyr 2017 IDP/Urban Nutrition Assessments
Population Groups Number of Clusters
Number of Households
Number of Children
NorthwestHargeisa IDPs 28 560 687Burao IDPs 28 501 528Berbera IDPs Exhaustive 399 487Northeast and CentralBossaso IDPs 27 477 654Qardho IDPs Exhaustive 397 630Garowe IDPs 27 463 723Galkacyo IDPs 28 531 866Dhusamareb IDPs Exhaustive 362 562SouthernMogadishu IDPs 37 675 789Mogadishu Urban 35 447 537Baidoa IDPs 36 648 1,072Dolow IDPs 28 504 562Dhobley IDPs 28 494 706Kismayo IDPs 27 460 718Kismayo Urban 28 494 750Total 357* 7 412 10 271*Excluding the three exhaustive surveys
Table 2. 2017 Deyr Nutrition Situation Among IDP/Urban Population in Somalia
Population Groups GAM (%) SAM (%) CDR (per 10 000 per day)
U5DR (per 10 000 per day) Morbidity (%)
NORTHWESTHargeisa IDPs 8.6 1.7 0.62 0.6 27.6Burao IDPs 8.5 1.7 0.94 0.0 6.8Berbera IDP 10.9 2.3 0.79 0.4 31.1 NORTHEAST AND CENTRALBossaso IDPs 14.7 2.3 0.06 0.11 20.0Qardho IDPs 21.9 2.7 0.34 1.06 43.7Garowe IDPs 17.6 2.9 0.27 0.29 18.8Galkacyo IDPs 21.8 4.8 0.21 0.4 48.9Dhusamreeb IDPs 14.8 3.6 0.73 1.04 45.0 SOUTHERNMogadishu IDPs 16.1 4.1 0.79 1.77 44.1Mogadishu Urban 11.2 1.3 0.26 0.25 37.0Baidoa IDPs 15.1 3.5 0.58 1.01 11.1Dolow IDPs 13.9 2 0.30 0.86 10.2Dobley IDPs 13.3 1.8 0.41 0.83 29.6Kismayo IDPs 13.5 3.6 0.32 0.72 13.6Kismayo Urban 8.8 1.2 0.36 0.62 12.4
FSNAU
3
FSNAU Nutrition Update, November 2017
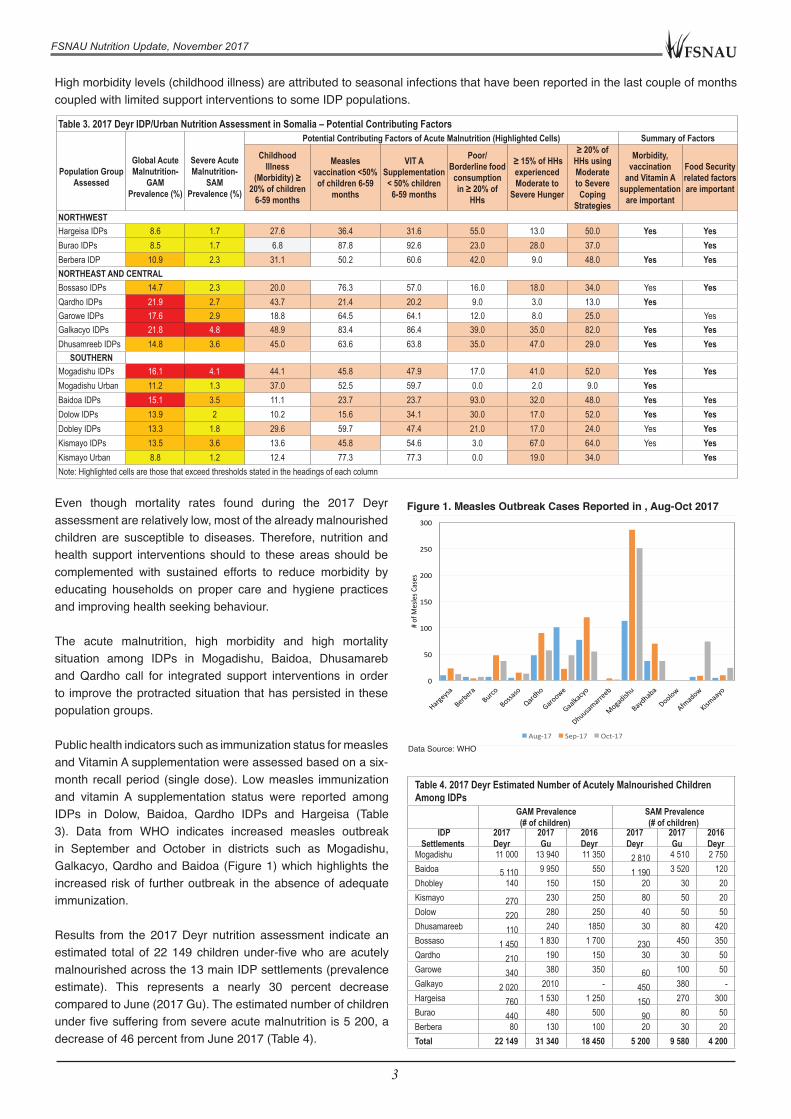
High morbidity levels (childhood illness) are attributed to seasonal infections that have been reported in the last couple of months coupled with limited support interventions to some IDP populations.
Even though mortality rates found during the 2017 Deyr assessment are relatively low, most of the already malnourished children are susceptible to diseases. Therefore, nutrition and health support interventions should to these areas should be complemented with sustained efforts to reduce morbidity by educating households on proper care and hygiene practices and improving health seeking behaviour.
The acute malnutrition, high morbidity and high mortality situation among IDPs in Mogadishu, Baidoa, Dhusamareb and Qardho call for integrated support interventions in order to improve the protracted situation that has persisted in these population groups.
Public health indicators such as immunization status for measles and Vitamin A supplementation were assessed based on a six-month recall period (single dose). Low measles immunization and vitamin A supplementation status were reported among IDPs in Dolow, Baidoa, Qardho IDPs and Hargeisa (Table 3). Data from WHO indicates increased measles outbreak in September and October in districts such as Mogadishu, Galkacyo, Qardho and Baidoa (Figure 1) which highlights the increased risk of further outbreak in the absence of adequate immunization.
Results from the 2017 Deyr nutrition assessment indicate an estimated total of 22 149 children under-five who are acutely malnourished across the 13 main IDP settlements (prevalence estimate). This represents a nearly 30 percent decrease compared to June (2017 Gu). The estimated number of children under five suffering from severe acute malnutrition is 5 200, a decrease of 46 percent from June 2017 (Table 4).
Table 3. 2017 Deyr IDP/Urban Nutrition Assessment in Somalia – Potential Contributing Factors
Population Group
Assessed
Global Acute Malnutrition-
GAM Prevalence (%)
Severe Acute Malnutrition-
SAM Prevalence (%)
Potential Contributing Factors of Acute Malnutrition (Highlighted Cells) Summary of Factors
Childhood Illness
(Morbidity) ≥ 20% of children
6-59 months
Measles vaccination <50% of children 6-59
months
VIT A Supplementation < 50% children
6-59 months
Poor/ Borderline food
consumption in ≥ 20% of
HHs
≥ 15% of HHs experienced Moderate to
Severe Hunger
≥ 20% of HHs using Moderate to Severe Coping
Strategies
Morbidity, vaccination
and Vitamin A supplementation
are important
Food Security related factors are important
NORTHWESTHargeisa IDPs 8.6 1.7 27.6 36.4 31.6 55.0 13.0 50.0 Yes YesBurao IDPs 8.5 1.7 6.8 87.8 92.6 23.0 28.0 37.0 YesBerbera IDP 10.9 2.3 31.1 50.2 60.6 42.0 9.0 48.0 Yes YesNORTHEAST AND CENTRALBossaso IDPs 14.7 2.3 20.0 76.3 57.0 16.0 18.0 34.0 Yes YesQardho IDPs 21.9 2.7 43.7 21.4 20.2 9.0 3.0 13.0 Yes Garowe IDPs 17.6 2.9 18.8 64.5 64.1 12.0 8.0 25.0 YesGalkacyo IDPs 21.8 4.8 48.9 83.4 86.4 39.0 35.0 82.0 Yes YesDhusamreeb IDPs 14.8 3.6 45.0 63.6 63.8 35.0 47.0 29.0 Yes Yes
SOUTHERN Mogadishu IDPs 16.1 4.1 44.1 45.8 47.9 17.0 41.0 52.0 Yes YesMogadishu Urban 11.2 1.3 37.0 52.5 59.7 0.0 2.0 9.0 Yes Baidoa IDPs 15.1 3.5 11.1 23.7 23.7 93.0 32.0 48.0 Yes YesDolow IDPs 13.9 2 10.2 15.6 34.1 30.0 17.0 52.0 Yes YesDobley IDPs 13.3 1.8 29.6 59.7 47.4 21.0 17.0 24.0 Yes YesKismayo IDPs 13.5 3.6 13.6 45.8 54.6 3.0 67.0 64.0 Yes YesKismayo Urban 8.8 1.2 12.4 77.3 77.3 0.0 19.0 34.0 YesNote: Highlighted cells are those that exceed thresholds stated in the headings of each column
0
50
100
150
200
250
300
#ofM
eslesC
ases
Aug-17 Sep-17 Oct-17
Figure 1. Measles Outbreak Cases Reported in , Aug-Oct 2017
Data Source: WHO
Table 4. 2017 Deyr Estimated Number of Acutely Malnourished Children Among IDPs
GAM Prevalence (# of children)
SAM Prevalence (# of children)
IDP Settlements
2017 Deyr
2017 Gu
2016 Deyr
2017 Deyr
2017 Gu
2016 Deyr
Mogadishu 11 000 13 940 11 350 2 810 4 510 2 750Baidoa 5 110 9 950 550 1 190 3 520 120Dhobley 140 150 150 20 30 20Kismayo 270 230 250 80 50 20Dolow 220 280 250 40 50 50Dhusamareeb 110 240 1850 30 80 420Bossaso 1 450 1 830 1 700 230 450 350Qardho 210 190 150 30 30 50Garowe 340 380 350 60 100 50Galkayo 2 020 2010 - 450 380 -Hargeisa 760 1 530 1 250 150 270 300Burao 440 480 500 90 80 50Berbera 80 130 100 20 30 20Total 22 149 31 340 18 450 5 200 9 580 4 200
FSNAU
4
FSNAU Nutrition Update, November 2017
Overall, the nutrition assessments among the IDPs in Somalia indicate a modest improvement of the nutrition situation when compared with results form 2017 Gu season. This is with the exception of Qardho, Garowe, Galkacyo and Mogadishu IDPs which show sustained Critical nutrition situation. The overall median GAM prevalence among IDPs across Somalia in 2017 Deyr season (November) is 14.3 percent, compared to 18.1 percent in June 2017 and 14.4 percent in November 2016.
The Critical nutrition situation among IDPs in Mogadishu, Qardho, Garowe and Galkacyo is partly linked to high morbidity, measles outbreak, low immunization coverage, continuous arrival of new IDPs who are destitute, limited access to humanitarian interventions, and on-going Government evictions particularly among Mogadishu IDPs.
The situation in most of the IDP settlements calls for sustained humanitarian interventions in the form of integrated nutrition and health services and cash/food assistance.
Results from the 2017 Deyr nutrition assessment indicate an estimated total of 22 149 children under-five who are acutely malnourished across the 13 main IDP settlements (prevalence estimate). This represents a nearly 30 percent decrease compared to June (2017 Gu). The estimated number of children under five suffering from severe acute malnutrition is 5 200, a decrease of 46 percent from June 2017 (Table 4).
Overall, the nutrition assessments among the IDPs in Somalia indicate a modest improvement of the nutrition situation when compared with results form 2017 Gu season. This is with the exception of Qardho, Garowe, Galkacyo and Mogadishu IDPs which show sustained Critical nutrition situation. The overall median GAM prevalence among IDPs across Somalia in 2017 Deyr season (November) is 14.3 percent, compared to 18.1 percent in June 2017 and 14.4 percent in November 2016.
The Critical nutrition situation among IDPs in Mogadishu, Qardho, Garowe and Galkacyo is partly linked to high morbidity, measles outbreak, low immunization coverage, continuous arrival of new IDPs who are destitute, limited access to humanitarian interventions, and on-going Government evictions particularly among Mogadishu IDPs.
The situation in most of the IDP settlements calls for sustained humanitarian interventions in the form of integrated nutrition and health services and cash/food assistance.
NUTRITION SITUATION AMONG IDPs IN SOUTH SOMALIA
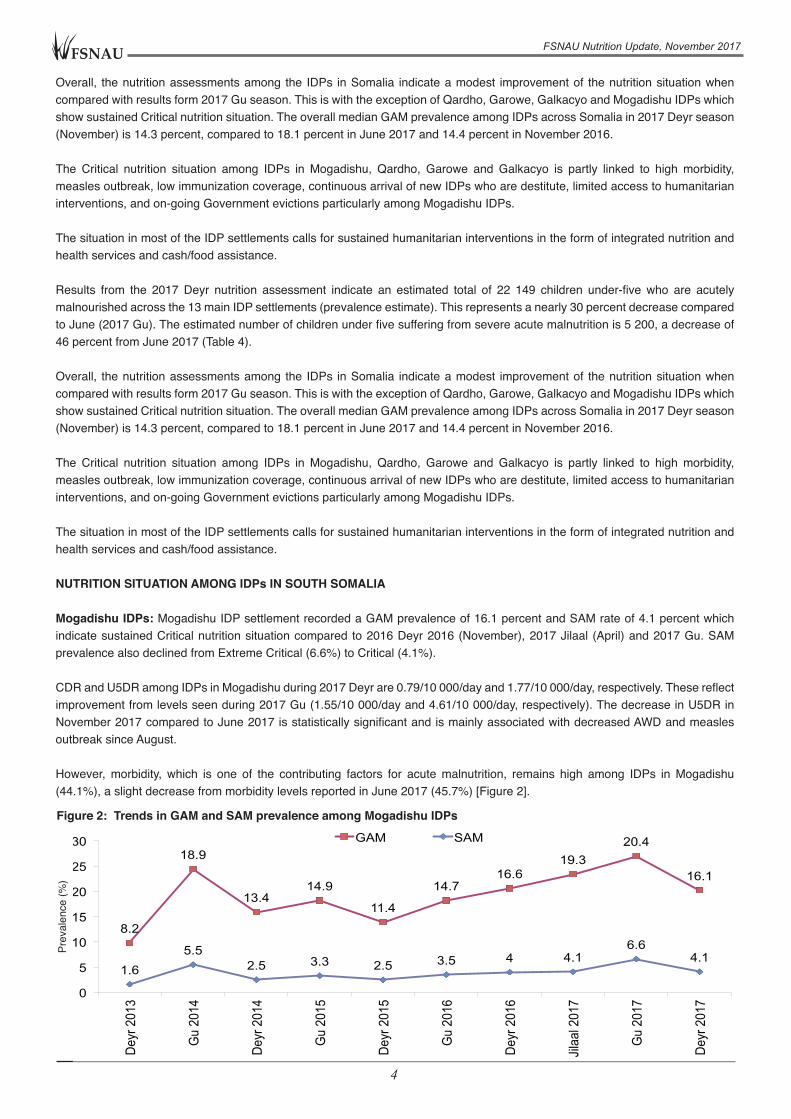
Mogadishu IDPs: Mogadishu IDP settlement recorded a GAM prevalence of 16.1 percent and SAM rate of 4.1 percent which indicate sustained Critical nutrition situation compared to 2016 Deyr 2016 (November), 2017 Jilaal (April) and 2017 Gu. SAM prevalence also declined from Extreme Critical (6.6%) to Critical (4.1%).
CDR and U5DR among IDPs in Mogadishu during 2017 Deyr are 0.79/10 000/day and 1.77/10 000/day, respectively. These reflect improvement from levels seen during 2017 Gu (1.55/10 000/day and 4.61/10 000/day, respectively). The decrease in U5DR in November 2017 compared to June 2017 is statistically significant and is mainly associated with decreased AWD and measles outbreak since August.
However, morbidity, which is one of the contributing factors for acute malnutrition, remains high among IDPs in Mogadishu (44.1%), a slight decrease from morbidity levels reported in June 2017 (45.7%) [Figure 2].
1.6 5.5
2.5 3.3 2.5 3.5 4 4.1 6.6
4.1
8.2
18.9
13.4 14.9
11.4
14.7 16.6
19.3 20.4
16.1
0
5
10
15
20
25
30
Deyr
201
3
Gu
2014
Deyr
201
4
Gu
2015
Deyr
201
5
Gu
2016
Deyr
201
6
Jilaa
l 201
7
Gu
2017
Deyr
201
7
%
GAM SAM
Figure 2: Trends in GAM and SAM prevalence among Mogadishu IDPs
Prev
alen
ce (%
)
FSNAU
5
FSNAU Nutrition Update, November 2017
Mogadishu Urban: assessment results during 2017 Deyr indicate a GAM prevalence of 11.2 percent and a SAM prevalence of 1.3 percent. These figures represent a slight improvement from those reported during 2017 Gu (13.8% GAM, 2.8% SAM). However, morbidity rates have increased from 24.7 percent in June 2017 to 37.0 percent in November 2017.
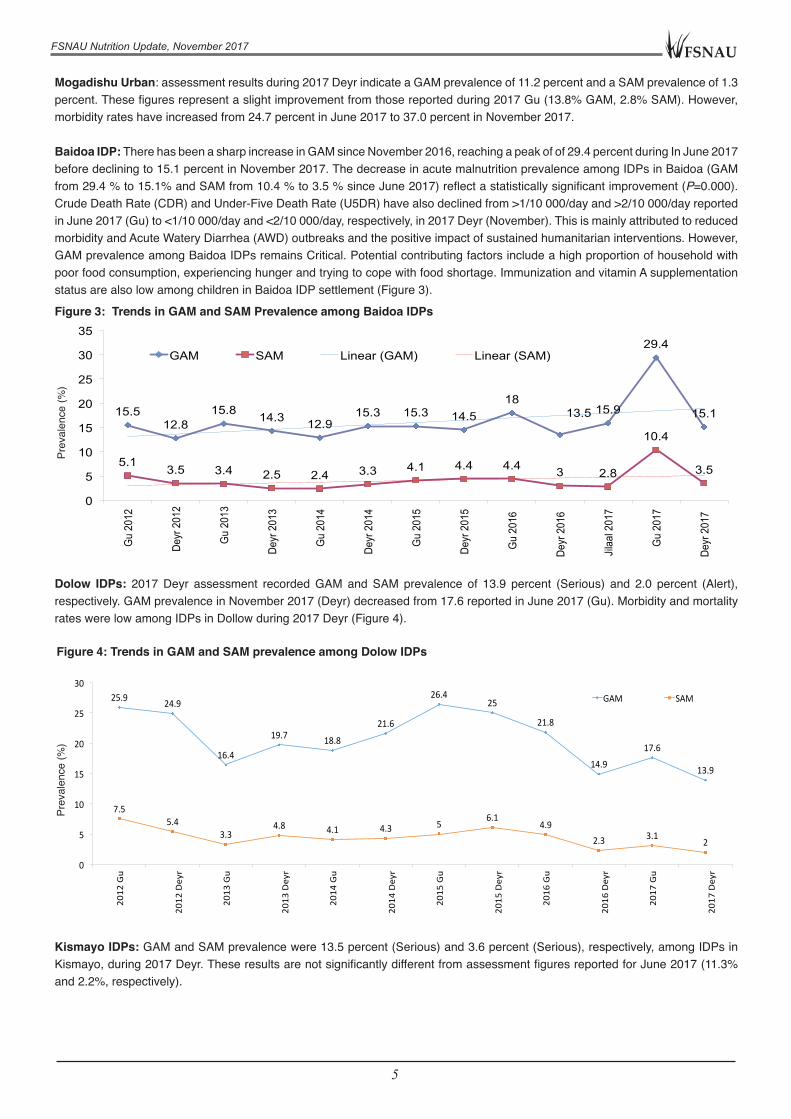
Baidoa IDP: There has been a sharp increase in GAM since November 2016, reaching a peak of of 29.4 percent during In June 2017 before declining to 15.1 percent in November 2017. The decrease in acute malnutrition prevalence among IDPs in Baidoa (GAM from 29.4 % to 15.1% and SAM from 10.4 % to 3.5 % since June 2017) reflect a statistically significant improvement (P=0.000). Crude Death Rate (CDR) and Under-Five Death Rate (U5DR) have also declined from >1/10 000/day and >2/10 000/day reported in June 2017 (Gu) to <1/10 000/day and <2/10 000/day, respectively, in 2017 Deyr (November). This is mainly attributed to reduced morbidity and Acute Watery Diarrhea (AWD) outbreaks and the positive impact of sustained humanitarian interventions. However, GAM prevalence among Baidoa IDPs remains Critical. Potential contributing factors include a high proportion of household with poor food consumption, experiencing hunger and trying to cope with food shortage. Immunization and vitamin A supplementation status are also low among children in Baidoa IDP settlement (Figure 3).
Dolow IDPs: 2017 Deyr assessment recorded GAM and SAM prevalence of 13.9 percent (Serious) and 2.0 percent (Alert), respectively. GAM prevalence in November 2017 (Deyr) decreased from 17.6 reported in June 2017 (Gu). Morbidity and mortality rates were low among IDPs in Dollow during 2017 Deyr (Figure 4).
Kismayo IDPs: GAM and SAM prevalence were 13.5 percent (Serious) and 3.6 percent (Serious), respectively, among IDPs in Kismayo, during 2017 Deyr. These results are not significantly different from assessment figures reported for June 2017 (11.3% and 2.2%, respectively).
15.5 12.8
15.8 14.3 12.9 15.3 15.3 14.5
18 13.5 15.9
29.4
15.1
5.1 3.5 3.4 2.5 2.4 3.3 4.1 4.4 4.4 3 2.8
10.4
3.5
0
5
10
15
20
25
30
35
Gu
2012
Dey
r 201
2
Gu
2013
Deyr
201
3
Gu
2014
Deyr
201
4
Gu
2015
Deyr
201
5
Gu
2016
Deyr
201
6
Jilaa
l 201
7
Gu
2017
Deyr
201
7
GAM SAM Linear (GAM) Linear (SAM)
Figure 3: Trends in GAM and SAM Prevalence among Baidoa IDPs
Prev
alen
ce (%
)
Figure 4: Trends in GAM and SAM prevalence among Dolow IDPs
25.9 24.9
16.4
19.7 18.8
21.6
26.425
21.8
14.9
17.6
13.9
7.55.4
3.34.8 4.1 4.3 5
6.14.9
2.3 3.12
0
5
10
15
20
25
30
201
2Gu
2012
Deyr
201
3Gu
2013
Deyr
201
4Gu
2014
Deyr
201
5Gu
2015
Deyr
201
6Gu
2016
Deyr
201
7Gu
2017
Deyr
%
GAM SAM
Prev
alen
ce (%
)
FSNAU
6
FSNAU Nutrition Update, November 2017
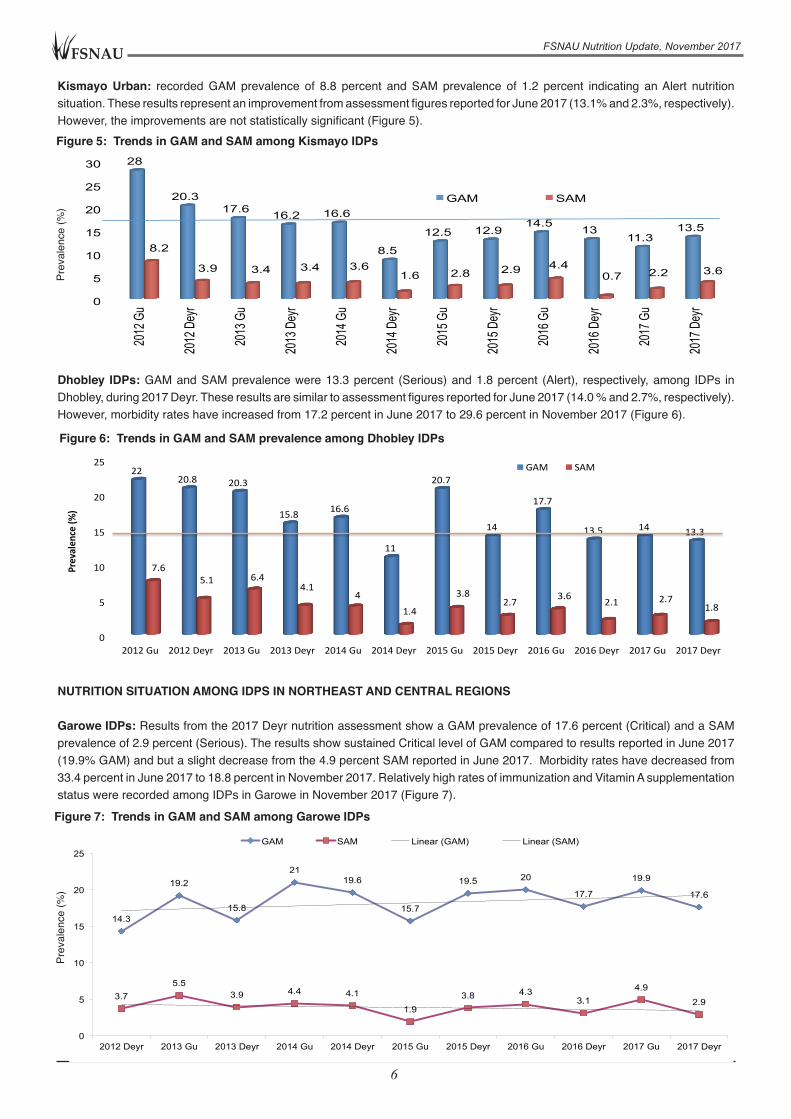
Kismayo Urban: recorded GAM prevalence of 8.8 percent and SAM prevalence of 1.2 percent indicating an Alert nutrition situation. These results represent an improvement from assessment figures reported for June 2017 (13.1% and 2.3%, respectively). However, the improvements are not statistically significant (Figure 5).
Dhobley IDPs: GAM and SAM prevalence were 13.3 percent (Serious) and 1.8 percent (Alert), respectively, among IDPs in Dhobley, during 2017 Deyr. These results are similar to assessment figures reported for June 2017 (14.0 % and 2.7%, respectively). However, morbidity rates have increased from 17.2 percent in June 2017 to 29.6 percent in November 2017 (Figure 6).
NUTRITION SITUATION AMONG IDPS IN NORTHEAST AND CENTRAL REGIONS
Garowe IDPs: Results from the 2017 Deyr nutrition assessment show a GAM prevalence of 17.6 percent (Critical) and a SAM prevalence of 2.9 percent (Serious). The results show sustained Critical level of GAM compared to results reported in June 2017 (19.9% GAM) and but a slight decrease from the 4.9 percent SAM reported in June 2017. Morbidity rates have decreased from 33.4 percent in June 2017 to 18.8 percent in November 2017. Relatively high rates of immunization and Vitamin A supplementation status were recorded among IDPs in Garowe in November 2017 (Figure 7).
0
5
10
15
20
25
30
2012
Gu
2012
Dey
r
2013
Gu
2013
Dey
r
2014
Gu
2014
Dey
r
2015
Gu
2015
Dey
r
2016
Gu
2016
Dey
r
2017
Gu
2017
Dey
r
28
20.3 17.6 16.2 16.6
8.5
12.5 12.9 14.5
13 11.3
13.5
8.2
3.9 3.4 3.4 3.6 1.6 2.8 2.9 4.4
0.7 2.2 3.6 Prev
alenc
e % GAM SAM
Figure 5: Trends in GAM and SAM among Kismayo IDPs
Prev
alen
ce (%
)
14.3
19.2
15.8
21 19.6
15.7
19.5 20
17.7
19.9
17.6
3.7 5.5
3.9 4.4 4.1
1.9 3.8 4.3
3.1 4.9
2.9
0
5
10
15
20
25
2012 Deyr 2013 Gu 2013 Deyr 2014 Gu 2014 Deyr 2015 Gu 2015 Deyr 2016 Gu 2016 Deyr 2017 Gu 2017 Deyr
GAM SAM Linear (GAM) Linear (SAM)
Figure 7: Trends in GAM and SAM among Garowe IDPs
Prev
alen
ce (%
)
DhobleyIDPsGAMTrend
GAM SAM2012Gu 22 7.62012Deyr 20.8 5.12013Gu 20.3 6.42013Deyr 15.8 4.12014Gu 16.6 42014Deyr 11 1.42015Gu 20.7 3.82015Deyr 14 2.72016Gu 17.7 3.62016Deyr 13.5 2.12017Gu 14 2.72017Deyr 13.3 1.8
0
5
10
15
20
25
2012Gu 2012Deyr 2013Gu 2013Deyr 2014Gu 2014Deyr 2015Gu 2015Deyr 2016Gu 2016Deyr 2017Gu 2017Deyr
2220.8 20.3
15.8 16.6
11
20.7
14
17.7
13.5 14 13.3
7.65.1 6.4
4.14
1.4
3.82.7 3.6 2.1 2.7
1.8
Prevalen
ce(%
)
GAM SAM
Figure 6: Trends in GAM and SAM prevalence among Dhobley IDPs
FSNAU
7
FSNAU Nutrition Update, November 2017
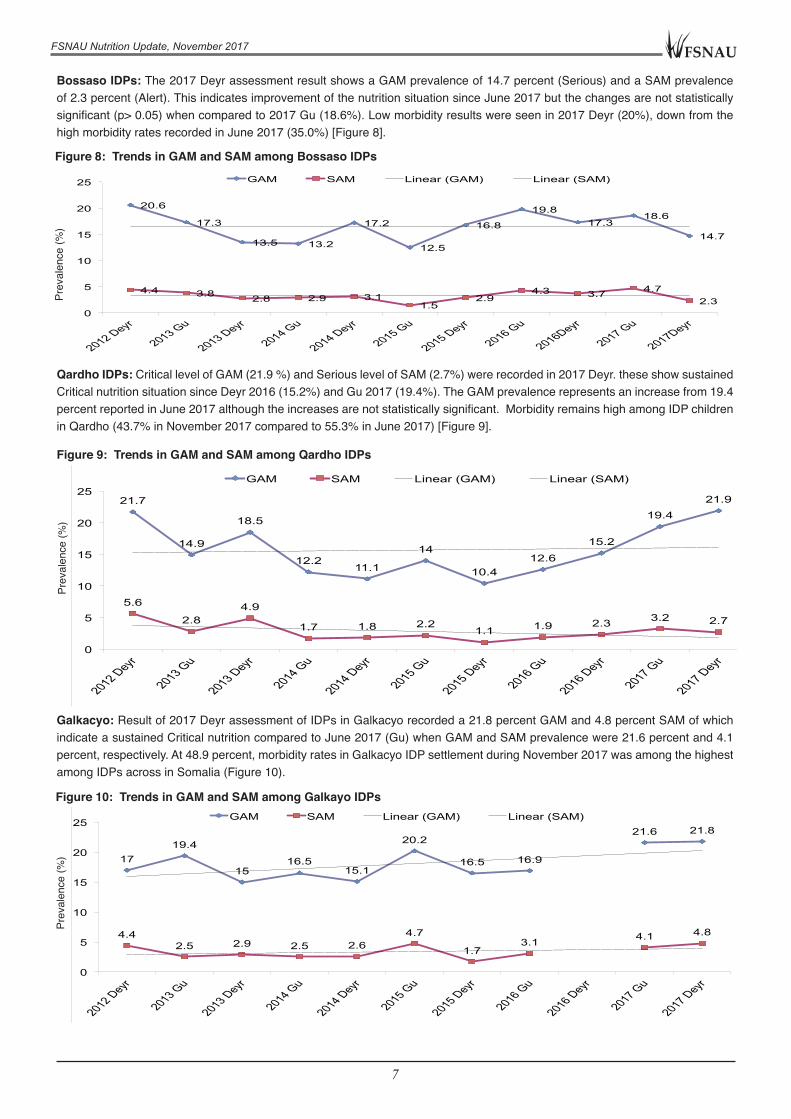
Bossaso IDPs: The 2017 Deyr assessment result shows a GAM prevalence of 14.7 percent (Serious) and a SAM prevalence of 2.3 percent (Alert). This indicates improvement of the nutrition situation since June 2017 but the changes are not statistically significant (p> 0.05) when compared to 2017 Gu (18.6%). Low morbidity results were seen in 2017 Deyr (20%), down from the high morbidity rates recorded in June 2017 (35.0%) [Figure 8].
Qardho IDPs: Critical level of GAM (21.9 %) and Serious level of SAM (2.7%) were recorded in 2017 Deyr. these show sustained Critical nutrition situation since Deyr 2016 (15.2%) and Gu 2017 (19.4%). The GAM prevalence represents an increase from 19.4 percent reported in June 2017 although the increases are not statistically significant. Morbidity remains high among IDP children in Qardho (43.7% in November 2017 compared to 55.3% in June 2017) [Figure 9].
Galkacyo: Result of 2017 Deyr assessment of IDPs in Galkacyo recorded a 21.8 percent GAM and 4.8 percent SAM of which indicate a sustained Critical nutrition compared to June 2017 (Gu) when GAM and SAM prevalence were 21.6 percent and 4.1 percent, respectively. At 48.9 percent, morbidity rates in Galkacyo IDP settlement during November 2017 was among the highest among IDPs across in Somalia (Figure 10).
Figure 10: Trends in GAM and SAM among Galkayo IDPs
17 19.4
15 16.5
15.1
20.2
16.5 16.9
21.6 21.8
4.4 2.5 2.9 2.5 2.6
4.7
1.7 3.1 4.1 4.8
0
5
10
15
20
25 GAM SAM Linear (GAM) Linear (SAM)
Prev
alen
ce (%
)
20.6
17.3
13.5 13.2
17.2
12.5
16.8
19.8 17.3
18.6
14.7
4.4 3.8 2.8 2.9 3.1 1.5
2.9 4.3 3.7 4.7
2.3 0
5
10
15
20
25 GAM SAM Linear (GAM) Linear (SAM)
Figure 8: Trends in GAM and SAM among Bossaso IDPs
Prev
alen
ce (%
)
21.7
14.9
18.5
12.2 11.1
14
10.4 12.6
15.2
19.4 21.9
5.6
2.8 4.9
1.7 1.8 2.2 1.1 1.9 2.3 3.2 2.7
0
5
10
15
20
25 GAM SAM Linear (GAM) Linear (SAM)
Figure 9: Trends in GAM and SAM among Qardho IDPs
Prev
alen
ce (%
)
FSNAU
8
FSNAU Nutrition Update, November 2017
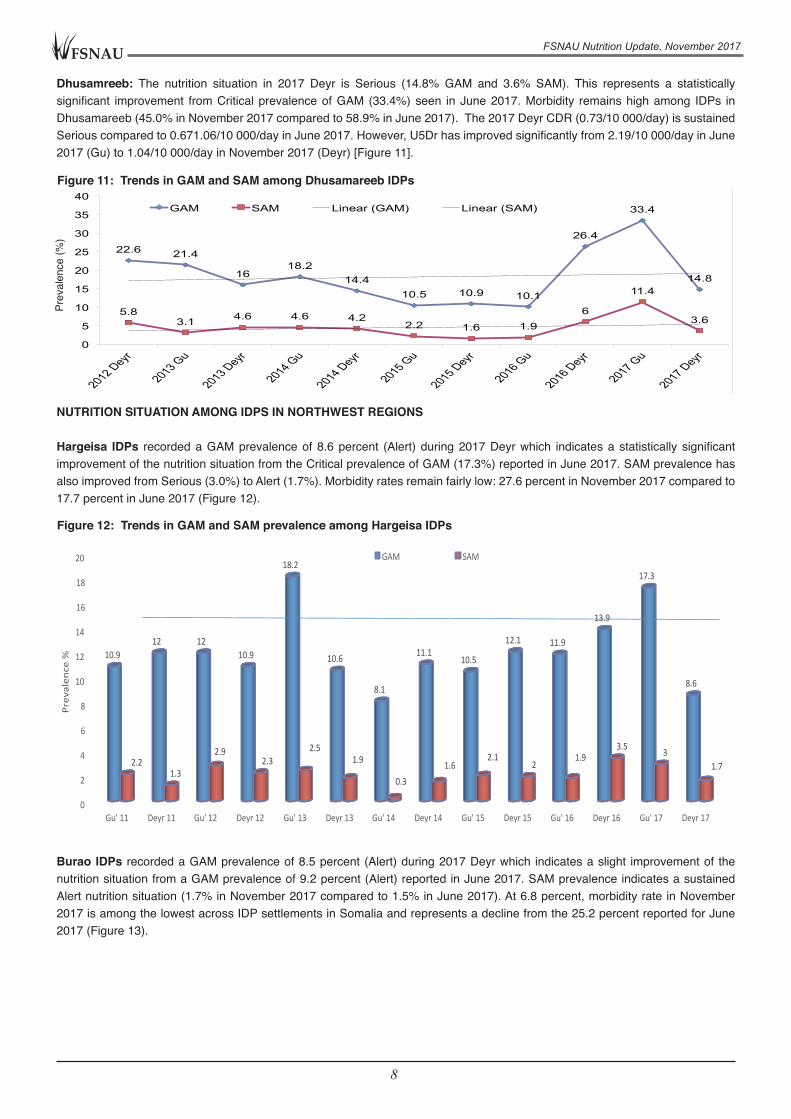
Dhusamreeb: The nutrition situation in 2017 Deyr is Serious (14.8% GAM and 3.6% SAM). This represents a statistically significant improvement from Critical prevalence of GAM (33.4%) seen in June 2017. Morbidity remains high among IDPs in Dhusamareeb (45.0% in November 2017 compared to 58.9% in June 2017). The 2017 Deyr CDR (0.73/10 000/day) is sustained Serious compared to 0.671.06/10 000/day in June 2017. However, U5Dr has improved significantly from 2.19/10 000/day in June 2017 (Gu) to 1.04/10 000/day in November 2017 (Deyr) [Figure 11].
NUTRITION SITUATION AMONG IDPS IN NORTHWEST REGIONS
Hargeisa IDPs recorded a GAM prevalence of 8.6 percent (Alert) during 2017 Deyr which indicates a statistically significant improvement of the nutrition situation from the Critical prevalence of GAM (17.3%) reported in June 2017. SAM prevalence has also improved from Serious (3.0%) to Alert (1.7%). Morbidity rates remain fairly low: 27.6 percent in November 2017 compared to 17.7 percent in June 2017 (Figure 12).
Burao IDPs recorded a GAM prevalence of 8.5 percent (Alert) during 2017 Deyr which indicates a slight improvement of the nutrition situation from a GAM prevalence of 9.2 percent (Alert) reported in June 2017. SAM prevalence indicates a sustained Alert nutrition situation (1.7% in November 2017 compared to 1.5% in June 2017). At 6.8 percent, morbidity rate in November 2017 is among the lowest across IDP settlements in Somalia and represents a decline from the 25.2 percent reported for June 2017 (Figure 13).
0
2
4
6
8
10
12
14
16
18
20
Gu'11 Deyr11 Gu'12 Deyr12 Gu'13 Deyr13 Gu'14 Deyr14 Gu'15 Deyr15 Gu'16 Deyr16 Gu'17 Deyr17
10.912 12
10.9
18.2
10.6
8.1
11.110.5
12.1 11.9
13.9
17.3
8.6
2.21.3
2.92.3
2.51.9
0.31.6
2.12
1.93.5 3
1.7
Prev
alen
ce%
GAM SAM
Figure 12: Trends in GAM and SAM prevalence among Hargeisa IDPs
22.6 21.4
16 18.2
14.4 10.5 10.9 10.1
26.4
33.4
14.8
5.8 3.1 4.6 4.6 4.2
2.2 1.6 1.9 6
11.4
3.6
0
5
10
15
20
25
30
35
40 GAM SAM Linear (GAM) Linear (SAM)
Figure 11: Trends in GAM and SAM among Dhusamareeb IDPs
Prev
alen
ce (%
)

FSNAU
9
FSNAU Nutrition Update, November 2017
Table 5: Nutrition Indicators used for interpretation of Acute Malnutrition
Nutrition Indicators Acceptable Alert Serious Critical Very criticalGAM:WHO/UNICEF <5 % 5-9.9 % 10-14.9 % 15-30 % >30SAM:FSNAU <1% 1.1-2.4% 2.5-4 4-5.6 >5.6CDR:IPC <0.5 0.5- <1 1- <2 2-4.9 % >5%U5DR: IPC <1 1-1.99 2-3.9 4-9.9 % >10%MUAC <12.5:FSNAU <2% 2-5.5% 5.6-8% 8.1-11% >11%MUAC <11.5:FSNAU <1% <1% 1-2% 2.1-3% >3.1
HIS Trends < 5% - Very Low 5-10% - Low 10-<15% - Moderate and
Stable or Low> 15% Highand
Stable > High and
Increasing proportionUnderweight: WHO/UNICEF <10 %-low 10-19.9%-medium 20-29.9%-high > 30% -v high
Stunting: WHO/UNICEF <20 %-low 20-29.9%-medium 30-39.9%-high >40% -v high
19.1 20.3
18.4 15.5 14.2
10
12.4
9.7 7.1 6.4
7
10
9.2 8.5
5.6 4.5 4.3 2.1 2.6
1 1.8 0.6 0.5 0.4 0.4
1.3 1.5 1.7 0
5
10
15
20
25
Gu'
11
Dey
r' 11
Gu'
12
Dey
r' 12
Gu'
13
Dey
r' 13
Gu'
201
4
Dey
r' 14
Gu'
15
Dey
r' 15
Gu'
15
Dey
r'16
Gu'
17
Dey
r'17
% p
reva
lenc
e GAM SAM
Figure 13: Trends in GAM and SAM prevalence among Burao IDPsPr
eval
ence
(%)
Berbera IDPs registered a GAM prevalence of 10.9 percent (Serious) and a SAM prevalence of 2.3 percent (Alert). These figures represent a statistically significant improvement compared to the Critical nutrition situation reported in June 2017 (18.7% GAM and 4.3% SAM). The morbidity rate in 2017 Deyr (November) was 15.5 percent, a decrease from the 31.1 percent reported for June 2017 (Figure 14).
Figure 14: Trends in GAM and SAM prevalence among Barbera IDPs
14.5
18
16.3
19.9
10.8
16.1
10 9.9 7.3
9.9
19.5
9.2
18.7
10.9
3 3.1
3.5
6.6
2 3.6
1.7 1.9 1.1 1.4 3.6
1.7 4.3 2.3
0
5
10
15
20
25
% p
reva
lenc
e
GAM SAM
Prev
alen
ce (%
)
FSNAU
10
FSNAU Nutrition Update, November 2017
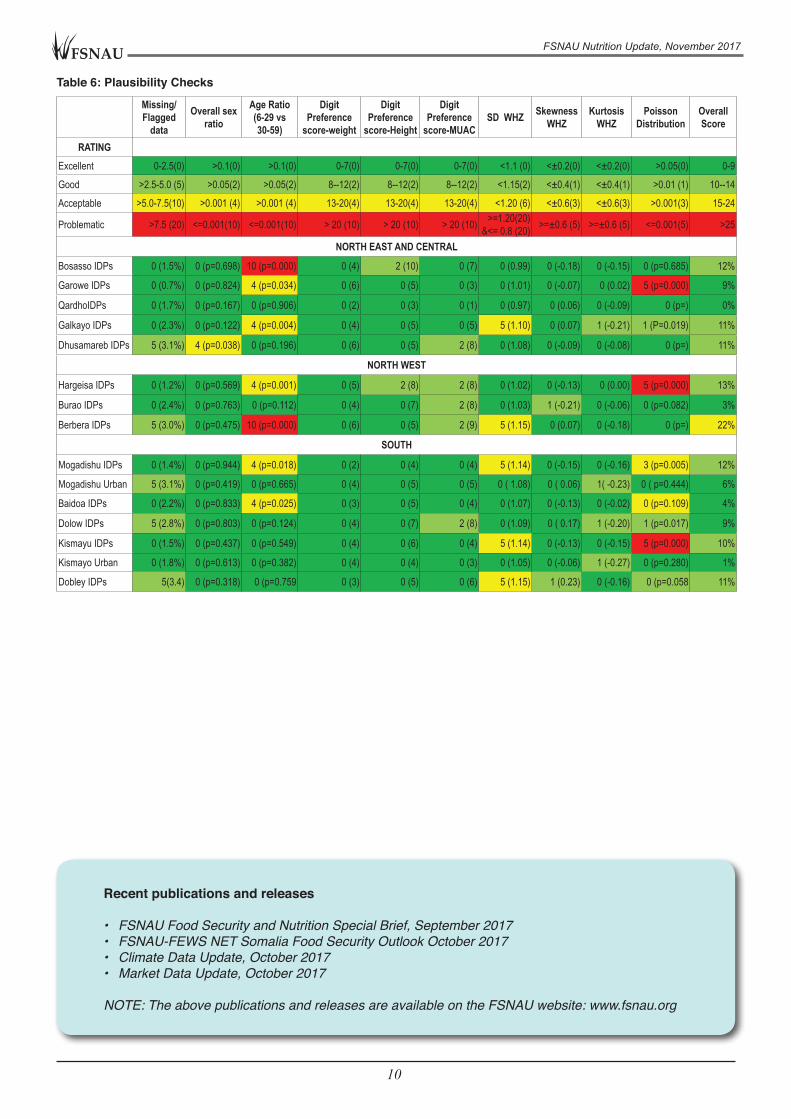
Table 6: Plausibility Checks
Recent publications and releases
• FSNAU Food Security and Nutrition Special Brief, September 2017• FSNAU-FEWS NET Somalia Food Security Outlook October 2017• Climate Data Update, October 2017• Market Data Update, October 2017
NOTE: The above publications and releases are available on the FSNAU website: www.fsnau.org
Missing/ Flagged
data
Overall sex ratio
Age Ratio (6-29 vs 30-59)
Digit Preference
score-weight
Digit Preference
score-Height
Digit Preference
score-MUACSD WHZ Skewness
WHZKurtosis
WHZPoisson
DistributionOverall Score
RATING Excellent 0-2.5(0) >0.1(0) >0.1(0) 0-7(0) 0-7(0) 0-7(0) <1.1 (0) <±0.2(0) <±0.2(0) >0.05(0) 0-9
Good >2.5-5.0 (5) >0.05(2) >0.05(2) 8--12(2) 8--12(2) 8--12(2) <1.15(2) <±0.4(1) <±0.4(1) >0.01 (1) 10--14
Acceptable >5.0-7.5(10) >0.001 (4) >0.001 (4) 13-20(4) 13-20(4) 13-20(4) <1.20 (6) <±0.6(3) <±0.6(3) >0.001(3) 15-24
Problematic >7.5 (20) <=0.001(10) <=0.001(10) > 20 (10) > 20 (10) > 20 (10) >=1.20(20) &<= 0.8 (20) >=±0.6 (5) >=±0.6 (5) <=0.001(5) >25
NORTH EAST AND CENTRAL
Bosasso IDPs 0 (1.5%) 0 (p=0.698) 10 (p=0.000) 0 (4) 2 (10) 0 (7) 0 (0.99) 0 (-0.18) 0 (-0.15) 0 (p=0.685) 12%
Garowe IDPs 0 (0.7%) 0 (p=0.824) 4 (p=0.034) 0 (6) 0 (5) 0 (3) 0 (1.01) 0 (-0.07) 0 (0.02) 5 (p=0.000) 9%
QardhoIDPs 0 (1.7%) 0 (p=0.167) 0 (p=0.906) 0 (2) 0 (3) 0 (1) 0 (0.97) 0 (0.06) 0 (-0.09) 0 (p=) 0%
Galkayo IDPs 0 (2.3%) 0 (p=0.122) 4 (p=0.004) 0 (4) 0 (5) 0 (5) 5 (1.10) 0 (0.07) 1 (-0.21) 1 (P=0.019) 11%
Dhusamareb IDPs 5 (3.1%) 4 (p=0.038) 0 (p=0.196) 0 (6) 0 (5) 2 (8) 0 (1.08) 0 (-0.09) 0 (-0.08) 0 (p=) 11%
NORTH WEST
Hargeisa IDPs 0 (1.2%) 0 (p=0.569) 4 (p=0.001) 0 (5) 2 (8) 2 (8) 0 (1.02) 0 (-0.13) 0 (0.00) 5 (p=0.000) 13%
Burao IDPs 0 (2.4%) 0 (p=0.763) 0 (p=0.112) 0 (4) 0 (7) 2 (8) 0 (1.03) 1 (-0.21) 0 (-0.06) 0 (p=0.082) 3%
Berbera IDPs 5 (3.0%) 0 (p=0.475) 10 (p=0.000) 0 (6) 0 (5) 2 (9) 5 (1.15) 0 (0.07) 0 (-0.18) 0 (p=) 22%
SOUTH
Mogadishu IDPs 0 (1.4%) 0 (p=0.944) 4 (p=0.018) 0 (2) 0 (4) 0 (4) 5 (1.14) 0 (-0.15) 0 (-0.16) 3 (p=0.005) 12%
Mogadishu Urban 5 (3.1%) 0 (p=0.419) 0 (p=0.665) 0 (4) 0 (5) 0 (5) 0 ( 1.08) 0 ( 0.06) 1( -0.23) 0 ( p=0.444) 6%
Baidoa IDPs 0 (2.2%) 0 (p=0.833) 4 (p=0.025) 0 (3) 0 (5) 0 (4) 0 (1.07) 0 (-0.13) 0 (-0.02) 0 (p=0.109) 4%
Dolow IDPs 5 (2.8%) 0 (p=0.803) 0 (p=0.124) 0 (4) 0 (7) 2 (8) 0 (1.09) 0 ( 0.17) 1 (-0.20) 1 (p=0.017) 9%
Kismayu IDPs 0 (1.5%) 0 (p=0.437) 0 (p=0.549) 0 (4) 0 (6) 0 (4) 5 (1.14) 0 (-0.13) 0 (-0.15) 5 (p=0.000) 10%
Kismayo Urban 0 (1.8%) 0 (p=0.613) 0 (p=0.382) 0 (4) 0 (4) 0 (3) 0 (1.05) 0 (-0.06) 1 (-0.27) 0 (p=0.280) 1%
Dobley IDPs 5(3.4) 0 (p=0.318) 0 (p=0.759 0 (3) 0 (5) 0 (6) 5 (1.15) 1 (0.23) 0 (-0.16) 0 (p=0.058 11%


![Fsnau micronutrients-in-somalia-flipchart-english[1]](https://img.pdfslide.net/doc/110x75/58800aa81a28ab421b8b5be3/fsnau-micronutrients-in-somalia-flipchart-english1.jpg)