Embed Size (px)
Citation preview

FT-IR Investigation of Methoxy Substituted Benzenes Adsorbed onSolid Acid CatalystsC. Lucarelli,†,‡ A. Giugni,‡ G. Moroso,† and A. Vaccari*,‡
†Dipartimento di Scienza e Alta Tecnologia, Universita degli Studi dell’Insubria, via Valleggio 11, 22100 Como, Italy‡Dipartimento di Chimica Industriale e dei Materiali, Universita di Bologna, viale Risorgimento 4, 40136 Bologna, Italy
ABSTRACT: The nature of the interaction on two different catalysts (zeolite BEA andγ-alumina) of some aromatic substrates, 1,2-methylendioxybenzene, 1,2-ethylendiox-ybenzene, and 1,2-dimethoxybenzene, have been investigated by FT-IR spectroscopy.FT-IR data suggest that the adsorption of 1,2-methylendioxybenzene occurs throughoxygen atoms and the molecule maintains the original puckered conformation, whereasthe planar structure due to the absence of a fused ring in the case of 1,2-dimethoxybenzene and the twisted conformation of 1,2-ethylendioxybenzene cause anorientation of the molecules parallel to the catalyst surface, with the benzene ringdirectly interacting to it. The puckered conformation of MDB leads the benzene ring tobe electron-deficient, then deactivated toward alkylation, such as confirmed by the obtained catalytic results, which show thatMDB is totally not reactive using the investigated heterogeneous catalysts, while in the traditional homogeneous system shows areactivity comparable to the other considered substrates.
■ INTRODUCTION
Alkylation of aromatic hydrocarbons is one of the most usefulreactions in organic chemistry for the synthesis of petrochem-icals, intermediates, and fine chemical products.1 The high costsin terms of product purification and toxic waste disposal makeit imperative for research to develop new processes based onsolid catalysts. Petrochemical traditional reactions have beenreplaced with new ones based on solid-acid catalysts:2,3
benzene, toluene, biphenyl, and naphthalene alkylations4−10
may be cited as examples. In the field of fine chemicals, most ofthe current processes are still based on homogeneouscatalysts.2,11 5-Substituted benzo[1,3]dioxole derivatives areimportant compounds in the manufacture of fragrances(Piperonal, Helional), drugs (Tadafil, Anolignan A, etc.), andagrochemicals (Piperonyl Butoxide).12−15
In this work, the attention was first focused on Helional (3-[3,4-methylendioxyphenyl]-2-methyl-propionaldehyde), whosesynthesis starting from 1,2-methylenedioxybenzene (MDB) isindustrially carried out in the liquid phase, using Lewis acidcatalysts and operating in batch conditions. The reactivity ofMDB with solid catalysts has not been as thoroughly studied asthat of benzene or toluene;3−6 the only example ofheterogeneous reaction is the acetylation reported by Spagnolet al.16 in the presence of beta zeolite carried out batchwise witha 61% yield.In the literature, many processes are reported for the
alkylation of aromatic substrates with alkenylidenediacetate;these are carried out in the liquid phase by using homogeneouscatalytic systems such as TiCl4 and AlCl3, metal halides, orboron trifluoride-diethylether complexes. These processescould be used for the synthesis of 1-acetoxy-2-methyl-3-(3,4-methylendioxyphenyl)propene (precursor of Helional).17−20
Several authors have suggested some alternative routes for the
synthesis of 5-alkylbenzo[1,3]dioxole avoiding the alkylation ofMDB. In particular, Borzatta et al.21,22 described two multistepprocesses starting from the acylation of MDB or from 4-acylphenol, while Zelle et al.23 described one process startingfrom the reaction of 4-alkyl-catechols with methylene dihalide.A review of the literature3,4,6,7,11 shows that catalytic alkylationsof aromatic hydrocarbons are important reactions and havebeen studied in depth in recent years, with the most studiedreactions being the alkylation of benzene and alkyl-substitutedbenzene.Conversely, for oxygen-containing benzene derivatives no
data on the reactivity with heterogeneous catalytic systems areavailable, thus suggesting that in this case the reaction is muchmore demanding. A detailed look at the step by-step processthrough which the reaction occurs may be an interesting way toverify the effective feasibility of the alkylation. Spectroscopictechniques have been used to study the alkylation of benzene oralkylbenzene derivatives with alkylating agents (methanol,ethylene, propylene, 2-propanol, etc.) on solid-acid catalystsuch as zeolite. The nature of the acid sites of zeolite isunanimously recognized.24−26 A number of papers have beenpublished on the interaction between aromatic substrates andthe catalyst surface, but some debate still exists. The interactionof different classes of aromatic hydrocarbons, such as benzeneand toluene, with the protonic sites of zeolites has been studiedusing IR spectroscopy. In the above-mentioned papers theattention has mainly been focused on the interaction betweenthe molecule and the acid sites, leading to the evaluation oftheir nature and location, without considering the evolution of
Received: March 9, 2012Revised: September 18, 2012Published: September 19, 2012
Article
pubs.acs.org/JPCC
© 2012 American Chemical Society 21308 dx.doi.org/10.1021/jp3023056 | J. Phys. Chem. C 2012, 116, 21308−21317
the properties of aromatic ring.27−32 Nevertheless, theactivation and reactivity of different alkylating agents such asmethyl, propyl, etc. on zeolite catalysts are well-knowntoday.33−39
The aim of this work is to clarify catalytic behavior ofcomplex aromatic substrates using FT-IR spectroscopy. Theexperimental FT-IR spectra were complemented with ab initiocalculations of the IR frequencies to help the assignment of thebands.
■ EXPERIMENTAL SECTION
1,2-Methylendioxybenzene (MDB) (99%), 1,2-ethylendioxy-benzene (EDB) (97% wt %), 1,2-dimethoxybenzene (DEB)(99% wt %), acrolein diethyl acetal (AEA) (96% wt %), 2-propanol (99.5%), 1-bromopropane (99%), sulfuric acid (96%),anhydrous aluminum chloride (≥99.9%), anhydrous sodiumsulfate (≥99.0%), and dichloromethane (≥99.9%) werepurchased from Aldrich Chemicals and used without anyfurther purification. Different commercial solid-acid catalystshave been studied such as γ-Al2O3 (Sasol), acid-treated clay(Engelhard, F-13), and a beta zeolite (Zeocat PB). Before thetests all of the samples were calcined at 500 °C for 6 h. Theheterogeneous gas phase catalytic tests were carried out atatmospheric pressure in a fixed bed continuous-flow reactor(length 390 mm and inner diameter 8 mm) at 300 °C using N2as the carrier gas. The reactor was charged with 1 cm3 (particlesize 40−60 mesh) of fresh catalyst. Aromatic substrates (MDB,EDB, and DEB) were fed in excess to the alkylating agents(acrolein diethyl acetal or 2-propanol) in a molar ratio of 3.The reaction mixture was fed using a syringe pump andvaporized into a preheated flow of N2, set to reach a 9:1 volumeratio of N2 to organic mixture (aromatic substrate andalkylating agent). All runs were performed at a contact timeof 1s. During the catalytic tests the outlet stream wascondensed in HPLC-grade acetone, and cooled in an ice bathat 0 °C for 1 h. Blank tests, without a catalyst, at the samereaction temperature did not show any reaction and/ordecomposition.Liquid phase heterogeneously catalyzed tests were conducted
in a glass batch reactor equipped with reflux condenser, byreacting 2.5 mmol of aromatic substrate in 5 mL of 2-propanolwith 0.1 mg of catalyst at boiling temperature of the alchool for2 h. The obtained mixture was filtered before to be analyzed.Two different procedures were employed in the homoge-
neous tests: (1) 49.0 mmol of aromatic substrate were added to3.0 mmol of anhydrous aluminum chloride. Then 49.0 mmol of1-bromopropane were added dropwise, keeping the mixtureunder stirring for 30 min at 40 °C. A total of 5 mL of cold waterwere added to the solution then organic phase was diluted withCH2Cl2 and dried with anhydrous sodium sulfate beforeanalysis. (2) 2.2 mmol of aromatic substrate were mixed with0.5 mL of 2-propanol then 1 mL of sulfuric acid was addeddropwise keeping the solution into an ice bath. Afterward, themixture was allowed to warm at room temperature and thereaction was pursued for further 10 min. Then, a proceduresimilar to that previously described for AlCl3 was followedbefore the analysis.All of the obtained solutions were analyzed using a Carlo
Erba 4300 gas chromatograph, equipped with FID and a wide-bore OV1 column (length 30 m, i.d. 0.53 mm, film width 0.5μm) and identified by GC-MS analysis using an AgilentTechnology 6890N equipped with a 5973 mass selective
detector and an HP5 column (length 25 m, i.d. 0.25 mm, filmwidth 1.5 μm).The IR spectra after adsorption of reactants were recorded
using a Perkin-Elmer Spectrum One spectrometer. Zeolite andalumina samples were pressed into self-supported wafer andactivated in situ in the IR cell at 500 °C under a vacuum (≤10−7mbar) for 1 h. Before measuring the IR spectra, the activatedsample was contacted with an increasing amount of theadsorbent at room temperature. Desorption spectra wererecorded at temperature increasing from room to 500 °C.For recording spectra, 12 scans were coadded with a resolutionof 1 cm−1 in the region of 4000−450 cm−1.IR frequencies of MDB, EDB, and DEB molecules were
calculated at the MP2(FC) level using the 6311G(d,p) basis setby the Gaussian 09 software package.40 IR frequencies werescaled by a factor of 0.9496.41
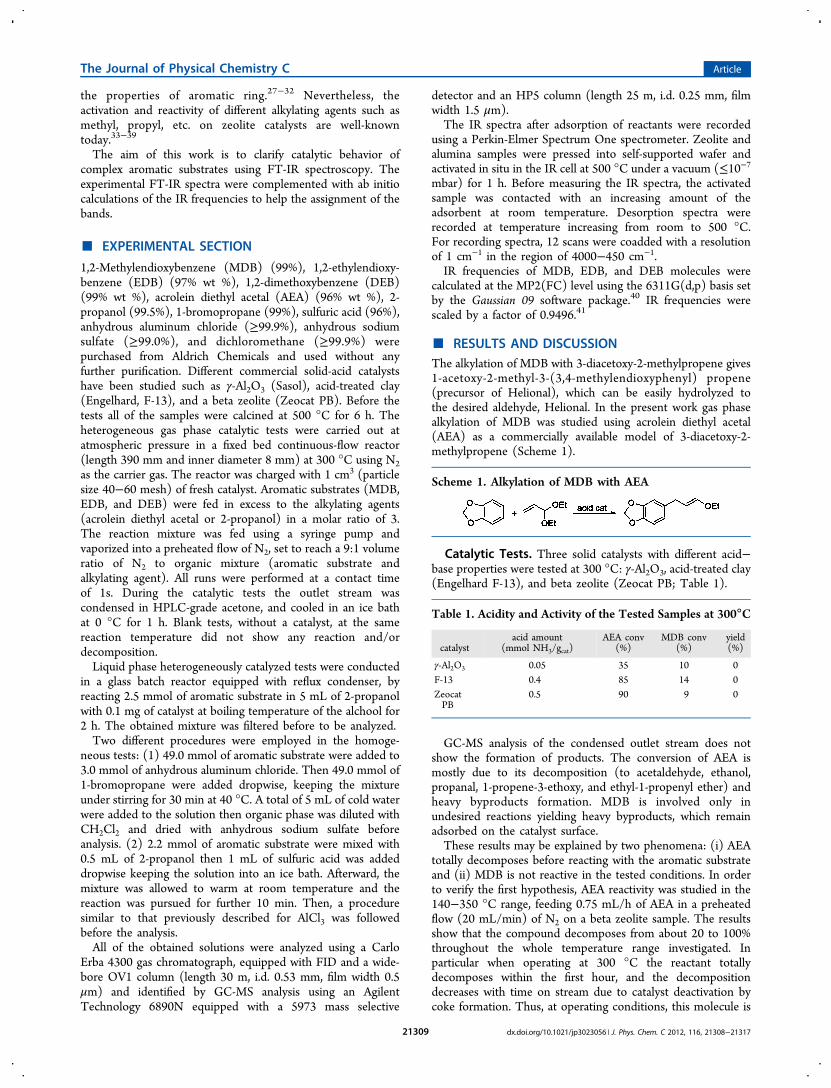
■ RESULTS AND DISCUSSIONThe alkylation of MDB with 3-diacetoxy-2-methylpropene gives1-acetoxy-2-methyl-3-(3,4-methylendioxyphenyl) propene(precursor of Helional), which can be easily hydrolyzed tothe desired aldehyde, Helional. In the present work gas phasealkylation of MDB was studied using acrolein diethyl acetal(AEA) as a commercially available model of 3-diacetoxy-2-methylpropene (Scheme 1).
Catalytic Tests. Three solid catalysts with different acid−base properties were tested at 300 °C: γ-Al2O3, acid-treated clay(Engelhard F-13), and beta zeolite (Zeocat PB; Table 1).
GC-MS analysis of the condensed outlet stream does notshow the formation of products. The conversion of AEA ismostly due to its decomposition (to acetaldehyde, ethanol,propanal, 1-propene-3-ethoxy, and ethyl-1-propenyl ether) andheavy byproducts formation. MDB is involved only inundesired reactions yielding heavy byproducts, which remainadsorbed on the catalyst surface.These results may be explained by two phenomena: (i) AEA
totally decomposes before reacting with the aromatic substrateand (ii) MDB is not reactive in the tested conditions. In orderto verify the first hypothesis, AEA reactivity was studied in the140−350 °C range, feeding 0.75 mL/h of AEA in a preheatedflow (20 mL/min) of N2 on a beta zeolite sample. The resultsshow that the compound decomposes from about 20 to 100%throughout the whole temperature range investigated. Inparticular when operating at 300 °C the reactant totallydecomposes within the first hour, and the decompositiondecreases with time on stream due to catalyst deactivation bycoke formation. Thus, at operating conditions, this molecule is
Scheme 1. Alkylation of MDB with AEA
Table 1. Acidity and Activity of the Tested Samples at 300°C
catalystacid amount
(mmol NH3/gcat)AEA conv
(%)MDB conv
(%)yield(%)
γ-Al2O3 0.05 35 10 0F-13 0.4 85 14 0ZeocatPB
0.5 90 9 0
The Journal of Physical Chemistry C Article
dx.doi.org/10.1021/jp3023056 | J. Phys. Chem. C 2012, 116, 21308−2131721309

not stable enough to alkylate an aromatic substrate. Thus thealkylation of MDB was then studied using 2-propanol, a morestable alkylating agent, whose activity has been studied in depthin gas phase aromatic alkylation.5,6,42 For the sake ofcomparison the same reaction was carried out on ethylendioxyand dimethoxy-substituted benzene derivatives, 1,2-ethyl-endioxybenzene (EDB) and 1,2-dimethoxybenzene (DEB).Tests were conducted over zeolite BEA, γ-alumina, and acidtreated clay samples. MDB shows a conversion lower than 10%and no evidence of products formation over all of the catalystsinvestigated, whereas EDB readily reacts (conversion from 60%to 70%) with 2-propanol to give monoalkylated products whichundergo further polyalkylation to di- and tri-isopropyl-EDB; theproducts distribution depends on the acidity of the testedcatalyst. Finally, in the case of DEB the reaction (conversion∼90% for all of the catalysts) leads to the formation of mono-and dialkylated derivatives which undergo Fries rearrange-ment43 to yield a very complex products mixture.In order to understand if the above-reported results are due
to the heterogeneity of the catalytic system or to operatingconditions (gas or liquid phase) similar tests were performed inliquid phase, both in heterogeneous (alumina and zeolite) andhomogeneous systems (AlCl3 and H2SO4). In the former case,MDB is totally unreactive, whereas EDB reaches conversions of43% and 29% using zeolite and alumina, respectively; DEBshows higher conversion (52 and 38%) with the formation ofmono- and dialkylated products.The tests performed using homogeneous catalysts show
different results: as expected, EDB and DEB are highly reactive,reaching conversion values between 70 and 80%, with goodselectivity values in monoalkylated products. MDB shows acompletely different reactivity compared to the tests with theheterogeneous catalysts. In fact for both homogeneousinvestigated catalysts, a conversion of about 40% is obtained,with formation of mono- and dialkylated products.Summarizing, the three considered molecules show a good
reactivity in well-known homogeneous conditions, while onlyMDB is totally unreactive on solid acidic catalysts. Then thedifferent behaviors in heterogeneous catalysis between thesubstrates studied may be caused by the geometric con-formation of the molecules, which causes a different interactionof the benzene moiety with the catalyst surface. In order toverify this hypothesis the conformational properties of MDB,EDB and DEB were studied and geometry optimizations werecarried out.Molecular Structure. The results indicate that the two
disubstituted species with fused ring show different lowest-energy forms, twisted in the case of EDB (Figure 1a) andpuckered for MDB (Figure 1b). When considering the
molecule with free substituents DEB, according to thecalculations of Dorofeeva et al.,44 it has three stable conformers:anti−anti with a plane backbone, anti−gauche with oneorthogonal, and gauche−gauche with two orthogonal methylgroups. The absolute minimum corresponds to the anti−anticonformer (Figure 1c), but it is lower than the anti−gauche byless than 1 kcal/mol, whereas the gauche−gauche is muchhigher in energy. However, only the planar structure was usedfor IR assignment and frequencies are reported only for thisconformer.These results strongly support the idea that the three
molecules should yield different energetically most favoredadsorption configurations on the catalyst surface, resulting in adifferent activation of the benzene ring. Vibrational spectro-scopic techniques should be suitable for studying theinteraction of the molecules with the catalytic sites. In orderto explain the reactivity differences observed in the catalytictests a FT-IR study of the adsorption of each of the substrateson beta zeolite has been carried out and a comparative analysisusing MDB and EDB was performed on gamma alumina, to besure that the results are not due to the specific texture of thematerials.
Vibrational Assignements. The tables below summarizedthe vibrational frequencies, experimental and calculated, of freepure molecules. Moreover in the same tables are listed thefrequencies related to the adsorption (I, II) on zeolite atincreasing amounts of aromatic substrates and those related tothe desorption step at increasing temperature (room temper-ature and 100, 200, and 500 °C), for the sake of concisionfrequencies for IR spectra on alumina are not listed.Vibrational assignements of experimental infrared spectra
have been made by comparing them with those previouslyreported in the literature45−48 and with the computed ones.The frequencies and the intensities of the experimental infraredspectra of the three molecules are quite nicely predicted by thecalculation, and almost all the computed frequencies are easilyassigned to observed bands even if in some cases this requiresseveral reassignements compared the literature.45−48
H-Beta Zeolite and Gamma Alumina FT-IR Character-ization. The spectrum of calcined zeolite after evacuation at500 °C shows four signals at 3779, 3742, 3660, and 3604 cm−1
(Figure 2, solid line). The two main peaks at 3742 and 3604
Figure 1. Lowest energy forms for (a) EBD, (b) MDB, and (c) DEB.Figure 2. OH spectral pattern of H-BEA (solid spectrum) and γ-Al2O3(dashed spectrum) samples after evacuation at 500 °C for 6 h.
The Journal of Physical Chemistry C Article
dx.doi.org/10.1021/jp3023056 | J. Phys. Chem. C 2012, 116, 21308−2131721310

cm−1 correspond to terminal silanols and bridging frameworkSi−OH−Al groups, respectively. The other two small peaks at3779 and 3660 cm−1 have been attributed respectively both tothe Al−OH species, being near to Si−OH groups generatedwhen Al leaves the framework, and to the hydroxyls associatedwith extra-framework aluminum.24−26 The four OH peaks aresuperimposed on a broad band at 3700−3200 cm−1 due to thehydrogen-bonded bridging OH groups.25
The alumina spectrum after evacuation at 500 °C (Figure 2,dashed line) shows the typical signals attributed to the differenttypes of hydroxyl groups. In particular the main bands at 3792/3778, 3730, and 3688 cm−1 may be attributed to isolatedhydroxyl groups of I, II, and III types, whereas the broad bandcentered around 3580 cm−1 is due to the H-bonded hydroxylgroups.49−53
Interaction of MDB with the Catalysts. The formation ofa hydrogen-bonded adduct is evident after adsorption of MDB,as confirmed by the strong spectral perturbations shown inFigure 3, whereas all vibrational assignments are summarized in
Table 2. On increasing the dosage of MDB, the band at 3742cm−1 is strongly eroded and the other hydroxyl bands (3779,3660, and 3604 cm−1) disappear completely. Simultaneously,an intense band centered at 3530 cm−1 grows and shifts towardlower wavenumbers (3513 cm−1) with increasing MDBcoverage, as shown in Figure 3.The present results show that all hydroxyl groups are
strongly affected by the adsorption of MDB; this stronginteraction is confirmed by the presence of a very intense andirreversible27,54,55 adsorption (the zeolite feature is not totallyrestored after outgassing at 500 °C) due to the formation of anH-bonded complex. Considering the strength of the linkage, itis possible to hypothesize the formation of a strong H-bondbetween the zeolite and the organic substrate (zeoliteO−H•••OMDB) due to a preferential adsorption through oxygenatoms.26,56−59 The changes in relative intensity of some bandafter heating at high temperature may be ascribed to the partialdecomposition of the molecule. Two broad bands near 3090and 2450 cm−1 with a window in the middle, near 2700 cm−1,may be associated with Fermi resonance produced by
interactions of the acidic zeolite OHs with a base, in this caseMDB (Figure 3).26,54,57,60
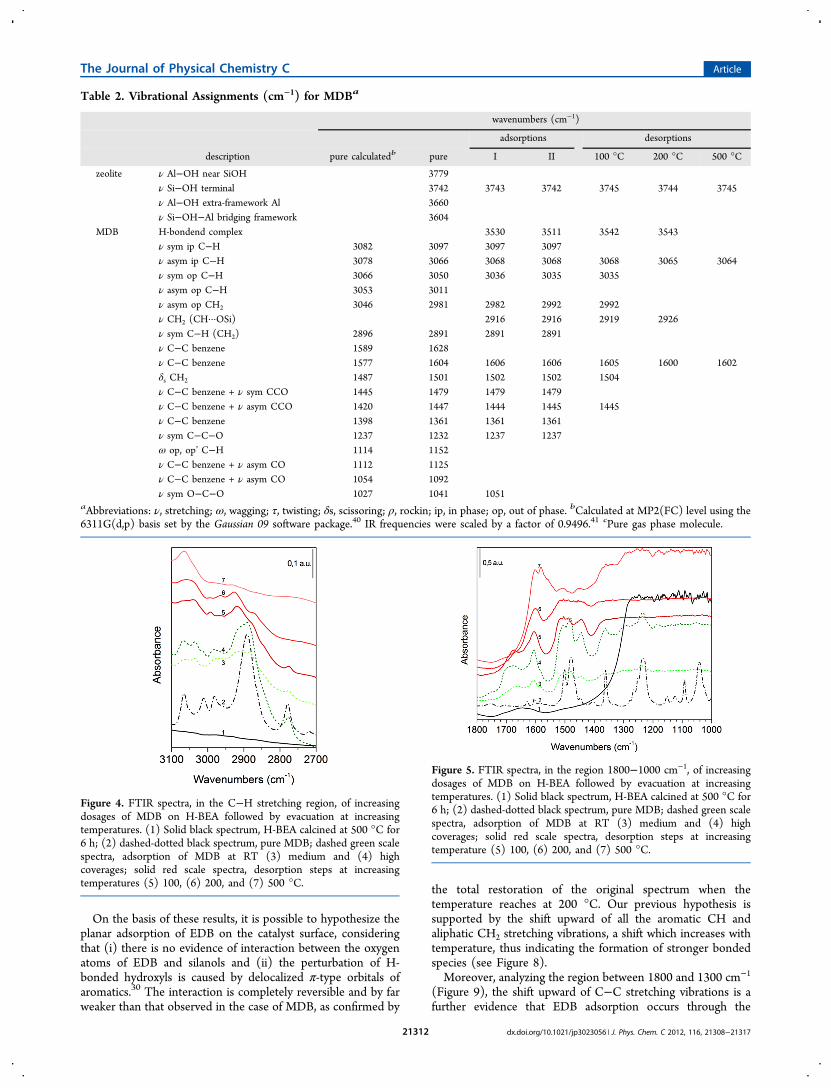
It is difficult to interpret the spectra in the (aliphatic andaromatic) C−H stretching region, shown in Figure 4, as thedifferences in the vibrational properties, caused by interactionwith the zeolite, are rather complex. With regard to thearomatic ring the most evident spectral perturbation is the shiftof the band at 3050 cm−1 toward lower wavenumbers, probablydue to the strong H-bond between oxygen and silanols thatperturbs the electronic cloud of the aromatic ring. Theappearance, in the CH2 stretching region, of a new band at2916 cm−1 may be ascribed to the interaction between thehydrogens of the methylene group and the oxygen of thezeolite lattice. Consequently, the CH2 deformation at 1501cm−1 is also perturbed, resulting in a shift toward higherwavenumbers (Figure 5). Focusing the attention on the spectralregion between 1800 and 1000 cm−1 (Figure 5), it is possible tosee that the bands due to C−C ring vibrations are almostunaffected by adsorption, thus indicating that there is no directinteraction of the aromatic ring with the catalyst. Thevibrational modes of C−O are strongly perturbed, in particularthe C−C−O symmetric and asymmetric stretching at 1479 and1447 cm−1 are shifted toward lower wavenumbers, whereas theC−C−O symmetric stretching at 1232 cm−1 and O−C−Oasymmetric stretching at 1041 cm−1 are shifted toward higherwavenumbers. These latter results confirm that interactionoccurs preferentially through oxygen atoms; the MDBmaintains the puckered conformation after adsorption, resultingin an electronic deactivation of benzene ring.61
A similar behavior has been observed in the case of alumina(Figure 6). Adsorption of MDB strongly perturbs the hydroxylgroups of alumina, resulting in the growth of the strong bandcentered around 3540 cm−1. Changes observed in C−C andC−H stretching vibrations follow the same behavior which hasbeen already observed for zeolite. As in the case of zeolite anegligible shift of the C−C and C−H stretching of benzenering is observed, whereas strong changes in C−O and CH2vibrational modes occur. In particular, aliphatic C−H stretchingat 2891 cm−1 shifts to lower wavenumbers, whereas the bandsattributed to C−C−O vibrations (1479, 1447, and 1232 cm−1)and the one associated to symmetric O−C−O stretching at1041 cm−1 are shifted to higer wavenubers. News bands at 1598and 1497 cm−1 and in the region between 1330 and 1220 cm−1,still detectable after evacuation at 500 °C, may be assigned tothe formation of phenate species due to the partialdecomposition of MDB.62
Interaction of EDB with the Catalysts. A detailedanalysis of FT-IR spectra of adsorbed EDB on zeolite sampleis reported below, whereas the vibrational frequencies arereported in Table 3. As shown in Figure 7, upon increasing theEDB load the silanol band at 3783 cm−1 gradually disappears,with a parallel growth of a small adsorption at 3686 cm−1,which may be attributed to the interaction of the aromatic ringwith silanol groups.24,25 The remaining silanol bands (3746,3667, and 3610 cm−1) are almost unaffected, whereas the broadband at 3700−3200 cm−1 results in an increase in intensity andin a shift toward lower wavenumbers. A shoulder at about 3250cm−1 may be attributed to the H-bonding complex of thebenzene ring and bridging OHs according to Trombetta et al.32
Upon formation of a weak hydrogen bond, in Figure 7 it ispossible to distinguish two broad bands in the region of 2970and 2420 cm−1 with a window at around 2600 cm−1 attributableto the A and B components of Fermi resonance.26,54,57,60
Figure 3. FTIR spectra of increasing dosages of MDB on H-BEAfollowed by evacuation at increasing temperatures. (1) Solid blackspectrum, H-BEA calcined at 500 °C for 6 h; dashed green scalespectra, adsorption of MDB at RT (2) medium and (3) highcoverages; solid red scale spectra, desorption steps at increasingtemperatures (4) 100, (5) 200, and (6) 500 °C.
The Journal of Physical Chemistry C Article
dx.doi.org/10.1021/jp3023056 | J. Phys. Chem. C 2012, 116, 21308−2131721311
On the basis of these results, it is possible to hypothesize theplanar adsorption of EDB on the catalyst surface, consideringthat (i) there is no evidence of interaction between the oxygenatoms of EDB and silanols and (ii) the perturbation of H-bonded hydroxyls is caused by delocalized π-type orbitals ofaromatics.30 The interaction is completely reversible and by farweaker than that observed in the case of MDB, as confirmed by
the total restoration of the original spectrum when thetemperature reaches at 200 °C. Our previous hypothesis issupported by the shift upward of all the aromatic CH andaliphatic CH2 stretching vibrations, a shift which increases withtemperature, thus indicating the formation of stronger bondedspecies (see Figure 8).Moreover, analyzing the region between 1800 and 1300 cm−1
(Figure 9), the shift upward of C−C stretching vibrations is afurther evidence that EDB adsorption occurs through the
Table 2. Vibrational Assignments (cm−1) for MDBa
wavenumbers (cm−1)
adsorptions desorptions
description pure calculatedb pure I II 100 °C 200 °C 500 °C
zeolite ν Al−OH near SiOH 3779ν Si−OH terminal 3742 3743 3742 3745 3744 3745ν Al−OH extra-framework Al 3660ν Si−OH−Al bridging framework 3604
MDB H-bondend complex 3530 3511 3542 3543ν sym ip C−H 3082 3097 3097 3097ν asym ip C−H 3078 3066 3068 3068 3068 3065 3064ν sym op C−H 3066 3050 3036 3035 3035ν asym op C−H 3053 3011ν asym op CH2 3046 2981 2982 2992 2992ν CH2 (CH···OSi) 2916 2916 2919 2926ν sym C−H (CH2) 2896 2891 2891 2891ν C−C benzene 1589 1628ν C−C benzene 1577 1604 1606 1606 1605 1600 1602δs CH2 1487 1501 1502 1502 1504ν C−C benzene + ν sym CCO 1445 1479 1479 1479ν C−C benzene + ν asym CCO 1420 1447 1444 1445 1445ν C−C benzene 1398 1361 1361 1361ν sym C−C−O 1237 1232 1237 1237ω op, op’ C−H 1114 1152ν C−C benzene + ν asym CO 1112 1125ν C−C benzene + ν asym CO 1054 1092ν sym O−C−O 1027 1041 1051
aAbbreviations: ν, stretching; ω, wagging; τ, twisting; δs, scissoring; ρ, rockin; ip, in phase; op, out of phase. bCalculated at MP2(FC) level using the6311G(d,p) basis set by the Gaussian 09 software package.40 IR frequencies were scaled by a factor of 0.9496.41 cPure gas phase molecule.
Figure 4. FTIR spectra, in the C−H stretching region, of increasingdosages of MDB on H-BEA followed by evacuation at increasingtemperatures. (1) Solid black spectrum, H-BEA calcined at 500 °C for6 h; (2) dashed-dotted black spectrum, pure MDB; dashed green scalespectra, adsorption of MDB at RT (3) medium and (4) highcoverages; solid red scale spectra, desorption steps at increasingtemperatures (5) 100, (6) 200, and (7) 500 °C.
Figure 5. FTIR spectra, in the region 1800−1000 cm−1, of increasingdosages of MDB on H-BEA followed by evacuation at increasingtemperatures. (1) Solid black spectrum, H-BEA calcined at 500 °C for6 h; (2) dashed-dotted black spectrum, pure MDB; dashed green scalespectra, adsorption of MDB at RT (3) medium and (4) highcoverages; solid red scale spectra, desorption steps at increasingtemperature (5) 100, (6) 200, and (7) 500 °C.
The Journal of Physical Chemistry C Article
dx.doi.org/10.1021/jp3023056 | J. Phys. Chem. C 2012, 116, 21308−2131721312

benzene ring, then the interaction involves CC π-typeorbitals, as reported by Trombetta et al.30,32 In the same regionan intense band at 1693 cm−1, with a shoulder at 1708 cm−1,and two bands at 1419 and 1370 cm−1 appear. These three
latter bands are due to the formation of a bicoordinated adductin which one of the two methylene carbons interacts with twoadjacent oxygens of the zeolite lattice. This interaction may beascribed to the complex formed by CO2 with zeolite oxygen,
Figure 6. Changes in FTIR spectra of γ-Al2O3 produced by adsorptionof MDB followed by desorption at increasing temperatures. (1) Greendashed spectrum, adsorbed MDB; solid red scale spectra, desorptionsteps at increasing temperatures (2) RT, (3) 200 °C and (4) 500 °C;(5) solid black spectrum, γ-Al2O3 after evacuation at 500 °C for 6 h;(6) dashed-dotted black black spectrum, pure MDB.
Table 3. Vibrational Assignments (cm−1) for EDBa
wavenumbers (cm−1)
adsorptions desorptions
description pure calculatedb pure I II III RT 100 °C 200 °C 500 °C
zeolite ν Al−OH near SiOH 3783 3783 3778ν Si−OH terminal 3746 3746 3746 3746 3745 3744 3744 3742ν Al−OH extra-framework Al 3667 3668 3668 3663 3661ν Si−OH−Al bridging framework 3610 3610 3607 3608 3603
EDB H-bondend silanols 3535 3459 3487 3531ν sym ip C−H 3075 3091ν asym ip C−H 3066 3076 3078 3078 3078 3078ν sym op C−H 3059 3062 3065 3066ν asym op C−H 3049 3043 3047 3047 3047 3048ν asym op CH2 3012 2980 2984 2980 2980 2981 2984ν asym ip CH2 3010 2934 2940 2936 2936 2937 2941ν sym ip CH2 3923 2879 2886 2883 2883 2884 2887polydentate 1708 1708 1708 1704polydentate 1676 1693 1693 1691 1690 1675ν C−C benzene + ν asym CCO 1574 1605 1608 1608 1608 1609ν C−C benzene 1552 1594 1596 1596 1596 1598 1592ν C−C benzene + ν sym CCO 1459 1495 1496 1496 1496 1496 1496 1496δs ip CH2 1435 1467 1467 1467 1467 1467 1468 1468ω ip C−H 1413 1453 1453 1454 1454 1454 1454polydentate 1419 1419 1419 1415ν C−C benzene 1394 1381polydentate 1370 1370 1371 1370 1364 1362ω op CH2 1359 1309 1308 1308 1308 1307τ ip CH2 1263 1279ν sym C−O−C 1234 1251ν asym C−O−C 1162 1194ω op, op’ C−H 1112 1150ω ip, op’ C−H 1080 1112
aAbbreviations: ν, stretching; ω, wagging; τ, twisting; δs, scissoring; ρ, rockin; ip, in phase; op, out of phase. bCalculated at MP2(FC) level using the6311G(d,p) basis set by the Gaussian 09 software package.40 IR frequencies were scaled by a factor of 0.9496.41 cPure gas phase molecule.
Figure 7. FTIR spectra of increasing dosages of EDB on H-BEAfollowed by evacuation at increasing temperatures. (1) Solid blackspectrum, H-BEA calcined at 500 °C for 6 h; dashed green scalespectra, adsorption of EDB at RT (2) low, (3) medium, and (4) highcoverages; solid red scale spectra, desorption steps at increasingtemperatures (5) RT, (6) 100 °C, (7) 200 °C, and (8) 500 °C.
The Journal of Physical Chemistry C Article
dx.doi.org/10.1021/jp3023056 | J. Phys. Chem. C 2012, 116, 21308−2131721313

such as observed by Lavalley63 and Wirawan et al.64 These lastresults confirm that EDB interacts predominately through thebenzene ring and methylene group instead of oxygen,maintaining a planar conformation.The adsorption of EDB on alumina (Figure 10) confirm the
hypothesis of its planar adsorption. In particular the appearanceof the bands at 1701, 1690, 1423, and 1368 cm−1 confirm theformation of the bicoordinated adduct. Also in this casephenate species strongly adsorbed on alumina are formed, suchas confirmed by the presence of bands at 1592 and 1496 cm−1
and in the region 1320−1220 cm−1.62
Interaction of DEB with Zeolite. DEB shows both kindsof interaction already observed separately for EDB and MDB;Table 4 summarizes these results. In particular, as observed forMDB, the formation of a strong H-bond between ether groups
and zeolite hydroxyls leads to the erosion of the two bands at3779 and 3741 cm−1 and the simultaneous formation of a broadband centered at 3469 cm−1.26,56−59 The shoulder at 3588 cm−1
is ascribable to the perturbation of H-bonded silanols caused byinteraction with the benzene ring, as previously evidenced forEDB (Figure 11).24,25 The absence of an additional fused ring,which forces the molecule to stay in a preferentialconformation, leads DEB to interact simultaneously by theoxygen atoms and the benzene ring. Also in this case the twocomponents of Fermi resonance (A and B) may be observedrespectively at 2960 and 2440 cm−1 (Figure 11).26,54,57,60
As shown in Figure 12, peaks attributed to aromatic moietyare shifted slightly upward, such as in the case of EDB,suggesting that a planar adsorption of the benzene ring occurson zeolite, as confirmed by benzene C−C stretchings at 1506and 1592 cm−1, also perturbed (Figure 13).Aliphatic C−H stretching bands are shifted to higher
frequencies and, as in the adsorption of MDB, a splitting ofthe component at 2954 cm−1 is observed (Figure 12). Thislatter result may be attributed to the interaction between thehydrogens of the methyl groups and the oxygens of the zeoliteframework. Therefore, the CH3 deformation bands at 1463 and1442 cm−1 also result in a shift to higher wavenumbers. Theonly partial disappearance of DEB signals, even after desorptionat 500 °C, indicates its strong interaction with the zeolite, as incase of MDB.27,54,55 As expected from previous considerationson EDB, the bands at 1694 (shoulder at 1710 cm−1), 1420, and1368 cm−1 grow due to the formation of polydentatespecies63,64 due to the interaction between CH3 and zeoliteoxygen.
Final Remarks. Comparing the data obtained in thecatalytic tests with the spectroscopic data it is possible topropose different modes of adsorption of the aromaticsubstrates on considered materials. In the case of MDB theFT-IR findings show that the interaction occurs almostexclusively between hydroxyl groups of the catalyst and oxygenatoms of the substrate, thus the adsorbed MDB moleculemaintains the puckered conformation, as shown in Figure 14for zeolite. Figure 15 shows the hypothesized model for theadsorption of EDB on zeolite, for which the twisted geometry
Figure 8. FTIR spectra, in the C−H stretching region, of increasingdosages of EDB on H-BEA followed by evacuation at increasingtemperatures. (1) Solid black spectrum, H-BEA calcined at 500 °C for6 h; (2) dashed-dotted black spectrum, pure EDB; dashed green scalespectra, adsorption of EDB at RT (3) low, (4) medium, and (5) highcoverages; solid red scale spectra, desorption steps at increasingtemperatures (6) RT, (7) 100 °C, (8) 200 °C, and (9) 500 °C.
Figure 9. FTIR spectra, in the region 1800−1300 cm−1, of increasingdosages of EDB on H-BEA followed by evacuation at increasingtemperature. (1) Solid black spectrum, H-BEA calcined at 500 °C for6 h; (2) dashed-dotted black spectrum, pure EDB; dashed green scalespectra, adsorption of EDB at RT (3) low, (4) medium and (5) highcoverages; solid red scale spectra, desorption steps at increasingtemperatures (6) RT, (7) 100 °C, (8) 200 °C, and (9) 500 °C.
Figure 10. Changes in FTIR spectra of γ-Al2O3 produced byadsorption of EDB followed by desorption at increasing temperatures.(1) green dashed spectrum, adsorbed EDB; solid red scale spectra,desorption steps at increasing temperatures (2) RT, (3) 100 °C, (4)200 °C, and (5) 500 °C; (6) solid black spectrum, γ-Al2O3 afterevacuation at 500 °C for 6 h; (7) dashed-dotted black black spectrum,pure EDB.
The Journal of Physical Chemistry C Article
dx.doi.org/10.1021/jp3023056 | J. Phys. Chem. C 2012, 116, 21308−2131721314

of the molecule is suitable for a planar linkage through benzenering and the methylene group without involving the oxygenatom. Also, in this case, the configuration of the free molecule ismaintained after adsorption. The conformational mobility offree methoxy groups allows DEB molecule to maintain a planargeometry during the adsorption, with simultaneous interactionthrough oxygen atoms and benzene ring, as demonstrated byFT-IR analysis.The above results may be useful in clarifying the different
reactivity previously observed in the catalytic tests. All threeinvestigated substrates were reactive in homogeneous con-ditions, in which geometrical conformational changes mayoccur. On the contrary, the same behavior is not possible usingheterogeneous catalysts, on which the molecules are forced tomaintain a specific conformation.The planar orientation in case of EDB and DEB leads the
molecules to react with activated alkylating agents. Conversely,in the case of MDB the molecule remains in the puckeredconformation thus the aromatic ring is electron-deficient, thendeactivated, because the oxygen p-orbital can interactpredominantly with the methylene group orbital as reported
Table 4. Vibrational Assignments (cm−1) for DEBa
wavenumbers (cm−1)
adsorptions desorptions
description pure calculatedb pure I II RT 100 °C 200 °C 500 °C
zeolite ν Al−OH near SiOH 3779 3778ν Si−OH terminal 3741 3745 3744 3743 3741ν Al−OH extraframework Al 3661 3662ν Si−OH−Al bridging framework 3603 3601
DEB H-bondend silanols 3588 3584 3592 3598H-bonded complex 3469 3462 3464 3493 3532ν sym ip C−H 3087 3107 3109 3011 3113 3113ν sym ip C−H 3084 3078ν asym op C−H 3065 3064 3070 3068 3069 3073 3072 3065ν sym op C−H 3049 3045 3047 3048 3049 3049ν asym ip CH3 3039 3000 3004 3002 3002 3007 3005ν asym op CH3 (CH···OSi) 2971 2954 2967 2967 2967 2968 2963ν CH3 2944 2947 2947 2949 2952ν CH3 2934 2936ν CH3 2906 2912 2912 2912 2918ν CH3 2889 2892 2892 2893 2898ν sym op CH3 2898 2835 2842 2840 2840 2846polydentate 1710 1710 1710 1710polydentate 1694 1694 1694 1673 1670ν C−C benzene + ν asym CCO 1563 1592 1596 1595 1595 1599 1599 1598ν C−C benzene + ν asym CCO 1480 1506 1505 1500 1500 1504 1504δs HCH (CH3) 1457 1463 1466 1465 1465 1468 1468δs HCH (CH3) 1435 1442 1444 1444 1444 1446polydentate 1420 1420polydentate 1368 1364 1363δumbrella CH3 1421 1330 1327 1326δumbrella CH3 1399 1286νsymPhO + ν C−C + CH in plane bend 1255 1254νasymPhO + ν C−C + CH in plane bend 1211 1230ρ CH3 1157 1176CH in plane bending 1096 1123ν sym O−CH3 1042 1052ν sym O−CH3 1019 1028
aAbbreviations: ν, stretching; ω, wagging; τ, twisting; δs, scissoring; ρ, rockin; ip, in phase; op, out of phase. bCalculated at MP2(FC) level using the6311G(d,p) basis set by the Gaussian 09 software package.40 IR frequencies were scaled by a factor of 0.9496.41 cPure gas phase molecule.
Figure 11. FTIR spectra of increasing dosages of DEB on H-BEAfollowed by evacuation at increasing temperature. (1) Solid blackspectrum, H-BEA calcined at 500 °C for 6 h; dashed green scalespectra, adsorption of DEB at RT (2) medium and (3) high coverages;solid red scale spectra, desorption steps at increasing temperature (4)RT, (5) 100 °C, (6) 200 °C, and (7) 500 °C.
The Journal of Physical Chemistry C Article
dx.doi.org/10.1021/jp3023056 | J. Phys. Chem. C 2012, 116, 21308−2131721315

by Moon.61 This effect deactivates the benzene ring resulting ina complete chemical inertia of MDB on tested catalysts.
■ CONCLUSIONA deep FT-IR investigation of the adsorption and desorptionbehavior of methoxy substituted benzenes (MDB, EDB, andDEB) on two different acid catalysts (zeolite BEA and γ-alumina) allowed to elucidate the relevant differences observedbetween MDB with the other aromatic substrates (EDB andDEB). The FT-IR analysis were supported by computationalgeometry investigation.
1. The ab initio calculation showed different lowest-energyconformation for the three aromatic substrates studied,in particular puckered for MDB, twisted for EDB andanti−anti for DEB. These results was experimentallyconfirmed by FT-IR spectroscopy; in fact, the calculatedfrequencies are in agreement with the experimental ones.In the case of DEB the calculated bands are quitedifferent from the experimental ones because thesimulation has been done only for the lowest energyconformer.
2. The IR spectra demonstrated that adsorbed moleculesmaintained the geometry of the free ones.
3. The twisted conformation of EDB and anti−anti of DEBallow the aromatic ring to be planar and suited forelectrophilic attack during adsorption.
4. MDB adsorption through oxygen atoms holds themolecule in the puckered conformation, maintainingthe benzene ring electron-deficient, then deactivatedtoward electrophilic alkylation.
5. The obtained results of the reactivity of MDB in ahomogeneous catalytic systems (AlCl3 and H2SO4) maybe explained by the conformational change which ispossible in these conditions while not in a heterogeneousone.
■ AUTHOR INFORMATIONCorresponding Author*Tel.: +39051 20 9 3683. E-mail: [email protected] authors declare no competing financial interest.
■ REFERENCES(1) Patinkin, S. H.; Friedman, B. S. In Friedel-Crafts and RelatedReactions; Olah, G. A., Ed.; Wiley: New York, 1964; Vol. 2.(2) Hoelderich, W. F. Catal. Today 2000, 62, 115−130.(3) Tanabe, K.; Holderich, W. F. Appl. Catal., A 1999, 181, 399−434.(4) Degnan; Thomas, F., J.; Smith, C. M.; Venkat, C. R. Appl. Catal.,A 2001, 221, 283−294.
Figure 12. FTIR spectra, in the C−H stretching region, of increasingdosages of DEB on H-BEA followed by evacuation at increasingtemperatures. (1) solid black spectrum, H-BEA calcined at 500 °C for6 h; (2) dashed-dotted black spectrum, pure DEB; dashed green scalespectra, adsorption of DEB at RT (3) medium and (4) high coverages;solid red scale spectra, desorption steps at increasing temperature (5)RT, (6) 100 °C, (7) 200 °C, and (8) 500 °C.
Figure 13. FTIR spectra, in the region 1800−1300 cm−1, of increasingdosages of DEB on H-BEA followed by evacuation at increasingtemperatures. (1) Solid black spectrum, H-BEA calcined at 500 °C for6 h; (2) dashed-dotted black spectrum, pure DEB; dashed green scalespectra, adsorption of DEB at RT (3) medium and (4) high coverages;solid red scale spectra, desorption steps at increasing temperatures (5)RT, (6) 100 °C, (7) 200 °C, and (8) 500 °C.
Figure 14. Proposed model for MDB adsorption on beta zeolite.
Figure 15. Proposed model for EDB adsorption on beta zeolite.
The Journal of Physical Chemistry C Article
dx.doi.org/10.1021/jp3023056 | J. Phys. Chem. C 2012, 116, 21308−2131721316
(5) Siffert, S.; Gaillard, L.; Su, B.-L. J. Mol. Catal. A: Chem. 2000, 153,267−279.(6) Perego, C.; Ingallina, P. Catal. Today 2002, 73, 3−22.(7) Cejka, J.; Wichterlova, B.; Bednarova, S. Appl. Catal., A 1991, 79,215−226.(8) Brechtelsbauer, C.; Emig, G. Appl. Catal., A 1997, 161, 79−92.(9) Ahedi, R. K.; Tawada, S.; Kubota, Y.; Sugi, Y.; Kim, J. H. J. Mol.Catal. A: Chem 2003, 197, 133−146.(10) Sugi, Y.; Kubota, Y.; Hanaoka, T.-aki; Matsuzaki, T. Catal. Surv.Jpn. 2001, 5, 43−56.(11) Bejblova, M.; Zilkova, N.; Cejka, J. Res. Chem. Intermed. 2008,34, 439−454.(12) Giugni, A.; Impala, D.; Piccolo, O.; Vaccari, A.; Corma, A. Appl.Catal., B 2010, 98, 72−78.(13) Vanelle, P.; Meuche, J.; Maldonado, J.; Crozet, M. P.; Delmas,F.; Timon-David, P. Eur. J. Med. Chem. 2000, 35, 157−162.(14) Borzatta, V.; Capparella, E.; Gobbi, C.; Poluzzi, E. Process forsynthesizing heliotropine and its derivatives. U.S. Patent 7,402,709,2008.(15) Kushiro, M.; Masaoka, T.; Hageshita, S.; Takahashi, Y.; Ide, T.;Sugano, M. J. Nutr. Biochem. 2002, 13, 289−295.(16) Spagnol, M.; Gilbert, L.; Benazzi, E.; Marcilly, C. Process for theacylation of aromatic ethers. U.S. Patent 5,817,878, 1998.(17) Scriabine, I. Bull. Soc. Chim. Fr. 1961, 1197−1198.(18) Valentine, R. H.; Brandman, H. A. Process for the preparation ofdihydrocinnamaldehyde derivates, U.S. Patent 4,389,527, 1983.(19) Shirai, M.; Yoshida, Y.; Sadaike, S. Process for the production of 1-acetoxy-3-(substituted phenyl)propenes, E.P. Patent 1,574,509 (A1),2005.(20) Snowden, R.; Birkbeck, A.; Womack, G.; Firmenich S. A.Catalytic Scriabine reaction, U.S. Patent 7,529,983 (B2), 2009.(21) Borzatta, V.; Brancaleoni, D. Process for the synthesis of 5-(α-hydroxyalkyl)benzo[1,3]dioxols, U.S. Patent 6,342,613, 2000.(22) Borzatta, V.; Brancaleoni, D.; Battistini, C. Process for thesynthesis of 5-alkylbenzodioxoles, E.P. Patent 1,048,664 (B1), 2000.(23) Zelle, R. E.; McClellan, W. J. Tetrahedron Lett. 1991, 32, 2461−2464.(24) Su, B.-L.; Norberg, V. Zeolites 1997, 19, 65−74.(25) Kiricsi, I.; Flego, C.; Pazzuconi, G.; Parker, W.O., J.; Millini, R.;Perego, C.; Bellussi, G. J. Phys. Chem. 1994, 98, 4627−4634.(26) Paze, C.; Bordiga, S.; Lamberti, C.; Salvalaggio, M.; Zecchina,A.; Bellussi, G. J. Phys. Chem. B 1997, 101, 4740−4751.(27) Bjørgen, M.; Bonino, F.; Kolboe, S.; Lillerud, K.-P.; Zecchina,A.; Bordiga, S. J. Am. Chem. Soc. 2003, 125, 15863−15868.(28) Namuangruk, S.; Pantu, P.; Limtrakul, J. J. Catal. 2004, 225,523−530.(29) Rungsirisakun, R.; Jansang, B.; Pantu, P.; Limtrakul, J. J. Mol.Struct. 2005, 733, 239−246.(30) Trombetta, M.; Alejandre, A. G.; Solis, J. R.; Busca, G. Appl.Catal., A 2000, 198, 81−93.(31) Raksakoon, C.; Limtrakul, J. J. Mol. Struct.: THEOCHEM 2003,631, 147−156.(32) Trombetta, M.; Armaroli, T.; Alejandre, A. G.; Solis, J. R.; Busca,G. Appl. Catal., A 2000, 192, 125−136.(33) Ballarini, N.; Cavani, F.; Maselli, L.; Montaletti, A.; Passeri, S.;Scagliarini, D.; Flego, C.; Perego, C. J. Catal. 2007, 251, 423−436.(34) Ballarini, N.; Cavani, F.; Maselli, L.; Passeri, S.; Rovinetti, S. J.Catal. 2008, 256, 215−225.(35) Cavani, F.; Maselli, L.; Passeri, S.; Lercher, J. A. J. Catal. 2010,269, 340−350.(36) Crocella, V.; Cerrato, G.; Magnacca, G.; Morterra, C.; Cavani,F.; Maselli, L.; Passeri, S. Dalton Trans. 2010, 39, 8527−8537.(37) Svelle, S.; Bjørgen, M. J. Phys. Chem. A 2010, 114, 12548−12554.(38) Svelle, S.; Visur, M.; Olsbye, U.; Saepurahman; Bjørgen, M. Top.Catal. 2011, 54, 897−906.(39) Bjorgen, M.; Svelle, S.; Joensen, F.; Nerlov, J.; Kolboe, S.;Bonino, F.; Palumbo, L.; Bordiga, S.; Olsbye, U. J. Catal. 2007, 249,195−207.
(40) Frisch, M. J.; Trucks, G. W.; Schlegel, H. B.; Scuseria, G. E.;Robb, M. A.; Cheeseman, J. R.; Scalmani, G.; Barone, V.; Mennucci,B.; Petersson, G. A.; Nakatsuji, H. et al. Gaussian 09, revision B.01;Gaussian, Inc.: Wallingford, CT, 2010.(41) Scott, A. P.; Radom, L. J. Phys. Chem. 1996, 100, 16502−16513.(42) Perego, C.; Amarilli, S.; Carati, A.; Flego, C.; Pazzuconi, G.;Rizzo, C.; Bellussi, G. Microporous Mesoporous Mater. 1999, 27, 345−354.(43) Amandi, R.; Licence, P.; Ross, S. K.; Aaltonen, O.; Poliakoff, M.Org. Process Res. Dev. 2005, 9, 451−456.(44) Dorofeeva, O. V.; Shishkov, I. F.; Karasev, N. M.; Vilkov, L. V.;Oberhammer, H. J. Mol. Struct. 2009, 933, 132−141.(45) Emanuele, E.; Negri, F.; Orlandi, G. Chem. Phys. 2006, 321, 75−85.(46) Jeon, S.; Choo, J.; Kim, S.; Kwon, Y.; Kim, J.-Y.; Lee, Y.-I.;Chung, H. J. Mol. Struct. 2002, 609, 159−167.(47) Autrey, D.; Yang, J.; Laane, J. J. Mol. Struct. 2003, 661−662, 23−32.(48) Novikov, V. P.; Yarkov, A. V.; Solotnov, A. F.; Raevskii, O. A.Russ. Chem. Bull. 1985, 34, 952−958.(49) Digne, M.; Sautet, P.; Raybaud, P.; Euzen, P.; Toulhoat, H. J.Catal. 2002, 211, 1−5.(50) Tsyganenko, A. A.; Filimonov, V. N. J. Mol. Struct. 1973, 19,579−589.(51) Morterra, C.; Magnacca, G. Catal. Today 1996, 27, 497−532.(52) M. Haaland, D. Surf. Sci. 1981, 102, 405−423.(53) Ballinger, T. H.; Yates, J. T. J. Langmuir 1997, 3041−3045.(54) Bregolato, M.; Bolis, V.; Busco, C.; Ugliengo, P.; Bordiga, S.;Cavani, F.; Ballarini, N.; Maselli, L.; Passeri, S.; Rossetti, I.; Forni, L. J.Catal. 2007, 245, 285−300.(55) Flego, C.; Kiricsi, I.; Perego, C.; Bellussi, G. Stud. Surf. Sci. Catal.1995, 405−412.(56) Skorpa, R.; Bordiga, S.; Bleken, F.; Olsbye, U.; Arstad, B.;Tolchard, J.; Mathisen, K.; Svelle, S.; Bjørgen, M. MicroporousMesoporous Mater. 2011, 141, 146−156.(57) Zecchina, A.; Spoto, G.; Ricchiardi, G.; Bordiga, S.; Bonino, F.;Prestipino, C.; Lamberti, C. In Impact of Zeolites and other PorousMaterials on the new Technologies at the Beginning of the New MillenniumProceedings of the 2nd International FEZA (Federation of the EuropeanZeolite Associations) Conference; Aiello, R., Giordano, G., Testa, F., Eds.;Elsevier: Amsterdam, The Netherlands, 2002; Vol. 142, pp 3−14.(58) Bordiga, S.; Regli, L.; Cocina, D.; Lamberti, C.; Bjørgen, M.;Lillerud, K. P. J. Phys. Chem. B 2005, 109, 2779−2784.(59) Barbera, K.; Bonino, F.; Bordiga, S.; Janssens, T. V. W.; Beato, P.J. Catal. 2011, 280, 196−205.(60) Trombetta, M.; Busca, G.; Storaro, L.; Lenarda, M.; Casagrande,M.; Zambon, A. Phys. Chem. Chem. Phys. 2000, 2, 3529−3537.(61) Moon, S.; Kwon, Y.; Lee, J.; Choo, J. J. Phys. Chem. A 2001, 105,3221−3225.(62) Popov, A.; Kondratieva, E.; Goupil, J. M.; Mariey, L.; Bazin, P.;Gilson, J.-P.; Travert, A.; Mauge, F. J. Phys. Chem. C 2010, 114,15661−15670.(63) Lavalley, J. C. Catal. Today 1996, 27, 377−401.(64) Wirawan, S. K.; Creaser, D. Microporous Mesoporous Mater.2006, 91, 196−205.
The Journal of Physical Chemistry C Article
dx.doi.org/10.1021/jp3023056 | J. Phys. Chem. C 2012, 116, 21308−2131721317