Embed Size (px)
Citation preview

Technical Information
3.1PCB Piezotronics, Inc. Toll-Free in USA 888-684-0004 716-684-0001 www.pcb.com
■ Introduction to force sensors
■ Driving long cable lengths
■ Conversions, article reprints, glossary
■ Force sensor application inquiry form
Highlights
Quartz Force Sensors are well-suited for dynamic force measurement applications. Theyare not interchangeable with strain gage load cells used for static force measurements.
Measurements of dynamic oscillating forces, impact or high speed compression/tensionunder varying conditions may require sensors with special capabilities. Fast response,ruggedness, high stiffness, extended range and the ability to also measure quasi-staticforces are standard features associated with PCB® quartz force sensors.
The following information presents some of the design and operating characteristics of PCB® quartz force sensors to help you better understand how they function, which in turn, will help you make better dynamic measurements.
Types of Quartz Force SensorsThis catalog describes two modes of operation for quartz force sensors manufactured byPCB®. ICP® (IEPE, or voltage output type sensors) feature built-in microelectronicamplifiers, which convert the high-impedance electrostatic charge signal from thecrystals into a low-impedance voltage output signal (ICP® is a registered trademark of PCB Group, Inc.). The other type are charge output force sensors, which directly outputa high-impedance electrostatic charge signal.
Sensor ConstructionBoth modes of operation for PCB® force sensors feature similar mechanical construction.Most are designed with thin quartz crystal discs that are “sandwiched” between upperand lower base plates. An elastic, beryllium-copper stud holds the plates together andpre-loads the crystals (pre-loading assures parts are in intimate contact to ensurelinearity and provide the capability for tensile force measurements). This “sensingelement” configuration is then packaged into a rigid, stainless-steel housing and weldedto assure the internal components are sealed against contamination.
Figure 1 illustrates the cross-section of a typical quartz force sensor. This particularsensor is a general purpose Series 208 compression/tension model with built-in electronics.
When force is applied to this sensor, the quartz crystals generate an electrostatic chargethat is proportional to the input force. This charge output is collected on electrodes thatare sandwiched between the crystals. It is then either routed directly to an externalcharge amplifier or converted to a low-impedance voltage signal within the sensor. Boththese modes of operation will be examined in the following sections.
Introduction To Quartz Force Sensors
Figure 1.Compression-Tension-Impact Series 208

3.2 PCB Piezotronics, Inc. Toll-Free in USA 888-684-0004 716-684-0001 www.pcb.com
Introduction To Force Sensors
A charge output piezoelectric force sensor, when stressed, generates an electrostaticcharge from the crystals. For accurate analysis or recording purposes, this high-impedance charge must be routed through a special low-noise cable to an impedanceconverting amplifier such as a laboratory charge amplifier or source follower. Connectionof the sensor directly to a readout device such as an oscilloscope is possible for high-frequency impact indication, but is not suitable for most quantitative forcemeasurements.
The primary function of the charge or voltage amplifier is to convert the high-impedancecharge output to a usable low-impedance voltage signal for analysis or recordingpurposes. Laboratory charge amplifiers provide added versatility for signal normalization,ranging and filtering. PCB®’s electro-static charge amplifiers have additional inputadjustments for quasi-static measurements, static calibration, and drift-free dynamicoperation. Miniature in-line amplifiers are generally of fixed range and frequency.
Quartz charge output force sensors can be used at operating temperatures up to +400 °F (+204 °C).
When considering the use of charge output systems, remember that the output from thecrystals is a pure electrostatic charge. The internal components of the force sensor andthe external electrical connector maintain a very high (typically >1012 ohm) insulationresistance so that the electrostatic charge generated by the crystals does not “leakaway.” Consequently, any connectors, cables or amplifiers used must also have a veryhigh insulation resistance to maintain signal integrity.
Environmental contaminants such as moisture, dirt, oil, or grease can all contribute toreduced insulation, resulting in signal drift and inconsistent results.
The use of special, low- noise cable is required with charge output force sensors. Standard,two-wire or coaxial cable, when flexed, generates an electrostatic charge between theconductors. This is referred to as “triboelectric noise” and cannot be distinguished from thesensor’s crystal electrostatic output. Low-noise cables have a special graphite lubricantbetween the dielectric shield which minimizes the triboelectric effect.
Figure 2 shows a typical charge output sensor system schematic including: sensor, low-noise cable, and charge amplifier.
If the measurement signal must be transmitted over long distances, PCB® recommendsthe use of an in-line charge converter, placed near the force sensor. This minimizes thechance of noise. In-line charge converters can be operated from the same constant-current excitation power source as ICP® force sensors to minimize system cost.Figure 3 shows two typical charge output systems and their components.
Conventional Charge Output Sensors
q = charge signalC1 = sensor capacitanceC2 = cable capacitanceC3 = amplifier input capacitanceCf = amplifier feedback capacitor
Figure 2.Charge Output Sensor System Schematic
Readout Device
Standard Sensor Cable orOutput Cable*
In-line ChargeConverter
Low-noiseSensorCable
ICP® SensorSignal
Conditioner
Charge OutputForce Sensor
OutputCable
Charge OutputForce Sensor
Low-noiseSensor Cable
ChargeAmplifier
OutputCable
Readout DeviceFigure 3.Charge Output Systems
* Low-noise cable is required to maintain conformance.
Introduction To Force Sensors
3.3PCB Piezotronics, Inc. Toll-Free in USA 888-684-0004 716-684-0001 www.pcb.com
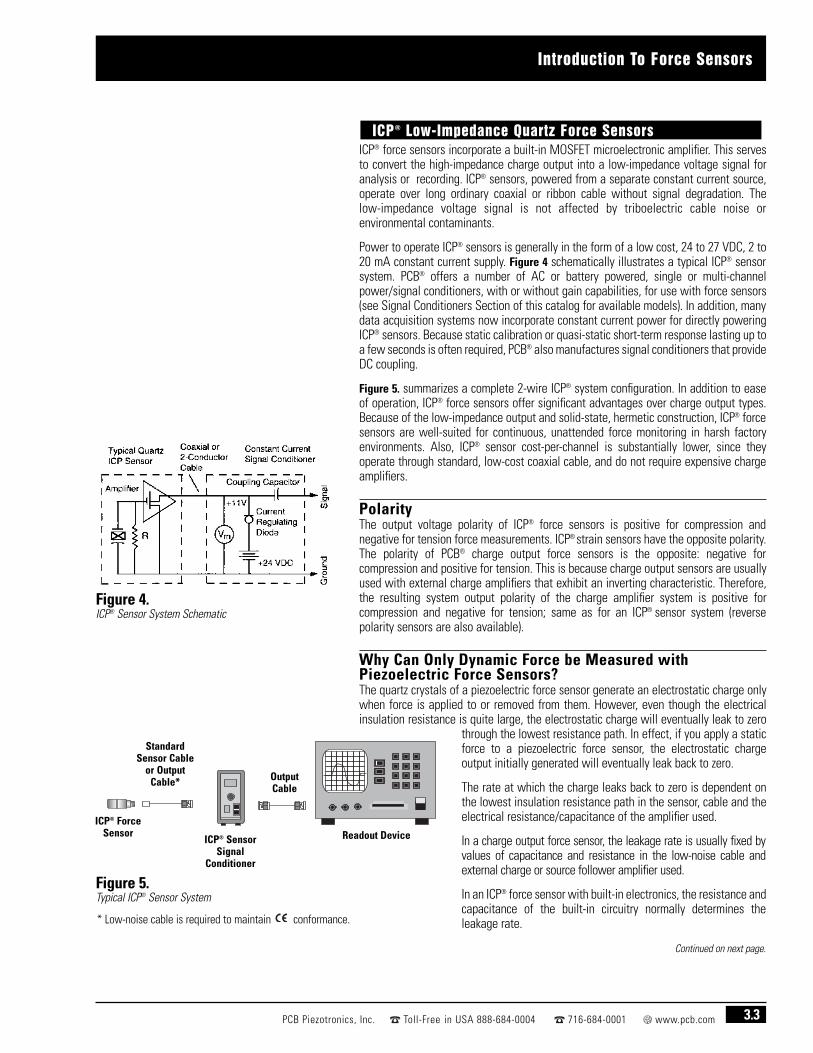
ICP® force sensors incorporate a built-in MOSFET microelectronic amplifier. This servesto convert the high-impedance charge output into a low-impedance voltage signal foranalysis or recording. ICP® sensors, powered from a separate constant current source,operate over long ordinary coaxial or ribbon cable without signal degradation. The low-impedance voltage signal is not affected by triboelectric cable noise orenvironmental contaminants.
Power to operate ICP® sensors is generally in the form of a low cost, 24 to 27 VDC, 2 to20 mA constant current supply. Figure 4 schematically illustrates a typical ICP® sensorsystem. PCB® offers a number of AC or battery powered, single or multi-channelpower/signal conditioners, with or without gain capabilities, for use with force sensors(see Signal Conditioners Section of this catalog for available models). In addition, manydata acquisition systems now incorporate constant current power for directly poweringICP® sensors. Because static calibration or quasi-static short-term response lasting up toa few seconds is often required, PCB® also manufactures signal conditioners that provideDC coupling.
Figure 5. summarizes a complete 2-wire ICP® system configuration. In addition to easeof operation, ICP® force sensors offer significant advantages over charge output types.Because of the low-impedance output and solid-state, hermetic construction, ICP® forcesensors are well-suited for continuous, unattended force monitoring in harsh factoryenvironments. Also, ICP® sensor cost-per-channel is substantially lower, since theyoperate through standard, low-cost coaxial cable, and do not require expensive chargeamplifiers.
PolarityThe output voltage polarity of ICP® force sensors is positive for compression andnegative for tension force measurements. ICP® strain sensors have the opposite polarity.The polarity of PCB® charge output force sensors is the opposite: negative forcompression and positive for tension. This is because charge output sensors are usuallyused with external charge amplifiers that exhibit an inverting characteristic. Therefore,the resulting system output polarity of the charge amplifier system is positive forcompression and negative for tension; same as for an ICP® sensor system (reversepolarity sensors are also available).
Why Can Only Dynamic Force be Measured with Piezoelectric Force Sensors?The quartz crystals of a piezoelectric force sensor generate an electrostatic charge onlywhen force is applied to or removed from them. However, even though the electricalinsulation resistance is quite large, the electrostatic charge will eventually leak to zero
through the lowest resistance path. In effect, if you apply a staticforce to a piezoelectric force sensor, the electrostatic chargeoutput initially generated will eventually leak back to zero.
The rate at which the charge leaks back to zero is dependent onthe lowest insulation resistance path in the sensor, cable and theelectrical resistance/capacitance of the amplifier used.
In a charge output force sensor, the leakage rate is usually fixed byvalues of capacitance and resistance in the low-noise cable andexternal charge or source follower amplifier used.
In an ICP® force sensor with built-in electronics, the resistance andcapacitance of the built-in circuitry normally determines theleakage rate.
Continued on next page.
ICP® Low-Impedance Quartz Force Sensors
Figure 4. ICP® Sensor System Schematic
Readout Device
Standard Sensor Cable
or OutputCable*
ICP® Sensor Signal
Conditioner
ICP® ForceSensor
OutputCable
* Low-noise cable is required to maintain conformance.
Figure 5. Typical ICP® Sensor System

3.4 PCB Piezotronics, Inc. Toll-Free in USA 888-684-0004 716-684-0001 www.pcb.com
Introduction To Force Sensors
When a rapid dynamic force is applied to a piezoelectric force sensor, the electrostaticcharge is generated quickly and, with an adequate discharge time constant, does not leakback to zero. However, there is a point at which a slow speed dynamic force becomesquasi-static and the leakage is faster than the rate of the changing force. Where is thepoint at which the force is too slow for the piezoelectric force sensor to make themeasurement? See the next section on Discharge Time Constant for the answer.
Discharge Time Constant (DTC)When leakage of a charge (or voltage) occurs in a resistive capacitive circuit, the leakagefollows an exponential decay. A piezoelectric force sensor system behaves similarly inthat the leakage of the electrostatic charge through the lowest resistance also occurs atan exponential rate. The value of the electrical capacitance of the system (in farads),multiplied by the value of the lowest electrical resistance (in ohm) is called the DischargeTime Constant (in seconds).
DTC is defined as the time required for a sensor or measuring system to discharge itssignal to 37% of the original value from a step change of measurand. This is true of anypiezoelectric sensor, whether the operation be force, pressure or vibration monitoring.The DTC of a system directly relates to the low frequency monitoring capabilities of asystem and, in the case of force monitoring, becomes very important as it is oftendesired to perform quasi-static measurements.
DTC Charge Output SystemIn a charge output system, the sensors do not contain built-in amplifiers, therefore, theDTC is usually determined by the settings on an external charge amplifier. A feedbackresistor working together with a capacitor on the operational amplifier determines thetime constant. PCB®’s laboratory-style charge amplifiers feature short, medium and longtime constant selections. It is assumed that the electrical insulation resistance of theforce sensor and cable connecting to the charge amplifier are larger than that of thefeedback resistor in the charge amplifier; otherwise, drift will occur. Therefore, to assurethis, the force sensor connection point and cable must be kept clean and dry.
Low Frequency Response of ICP® SystemsWith ICP® force sensors, there are two factors which must be considered when makinglow frequency measurements. These are:
1. The discharge time constant characteristic of the ICP® force sensor.2. The discharge time constant of the AC coupling circuit used in the signal
conditioner (if DC coupling is used, only (1) above needs to be considered).It is important that both factors be readily understood by the user to assure accurate lowfrequency measurements.
DTC in ICP® Force SensorsThe DTC is fixed by the components in an ICP® sensor’s internal amplifier. Specificationsfor the ICP® force sensors shown in this catalog list the DTC for each force sensor.
When testing with ICP® sensors, there are two time constants that must be consideredfor low frequency determination, one being that of the sensor which is a fixed value, andthe other being that of the coupling electrical circuit used in the signal conditioner.
When an ICP® sensor is subjected to a step function input, a quantity of charge, q, isproduced proportional to the mechanical input. According to the law of electrostatics,output voltage is ∆V = ∆q/∆C where C is the total capacitance of the sensing element,amplifier, and ranging capacitor.

Introduction To Force Sensors
3.5PCB Piezotronics, Inc. Toll-Free in USA 888-684-0004 716-684-0001 www.pcb.com
This voltage is then amplified by the MOSFET amplifier to determine final sensorsensitivity. After the initial step input, the charge signal decays according to the equation:
q = Qe-t/RC
where:q = instantaneous charge (C) Q = initial quantity of charge (C) R = bias resistor value (ohm) C = total capacitance (F)e = base of natural log (2.718)t = time elapsed since t0 (sec)
The product of R and C represents the DTC (in seconds) of the sensor. Sensor time constantsvary from just a few seconds to >2000 seconds for standard sensors. Special time constantscan be supplied by altering the resistor value, R, in the sensor’s built-in circuitry.
Most readout instruments have a high input impedance of >1 megohm. For thesesystems, the sensor DTC as previously discussed becomes the dominant value and can be used in determining signal discharge rate. However, for signals coupled to low-impedance readout devices, generally <1 megohm, it is necessary to determine the system time constant. This will be explained further in the following section.
Signal Conditioner and Readout Time ConstantsThe external power supply used with an ICP® force sensor may also have a DTCassociated with it. In some ICP® signal conditioners, which feature internal bufferamplifiers or gain amplifiers, the time constant is fixed by various internal componentsand may be shorter, or longer, than the sensor DTC. In signal conditioners withcapacitive-coupled outputs, the DTC is not fixed. In this case, a capacitor used todecouple an ICP® force sensor bias voltage acts with the input impedance of the readoutdevice to create another time constant.
Check the specifications of the signal conditioner to determine if it has a fixed internalDTC, which sets the low frequency response, or if it has a capacitive-coupled output. Ifthe output is capacitive-coupled, the time constant, when fed into the input of thereadout, can be calculated as follows:
DTC = RCwhere:
R = input impedance of readout device (ohm)C = value of coupling capacitor at output of signal conditioner (F)
Note that the output of some capacitive-coupled ICP® sensor power conditioners featurea shunt resistor that overrides the effects of the input resistance of the readout deviceif it is 1 megohm or greater.
AC coupling in the readout device is also an additional type of DTC. Check specificationsfor the power conditioners and readout instrument to be sure they are suitable for yourparticular dynamic measurement. If you have more than one DTC in the system, a timeconstant that is significantly shorter than the others will usually dominate.Determination of the system DTC for oscillating and transient inputs can be calculatedfrom these equations:
Oscillating inputs: DTC = (R1C1) (R2C2)
√ (R1C1)2 + (R2C2)2
Transient inputs: DTC = (R1C1) (R2C2)
(lasting up to 10% of smaller DTC) (R1C1) + (R2C2)
To avoid potential problems, it is recommended to keep the coupling time constant atleast 10 times longer than the sensor time constant. The system discharge time constantdetermines the low frequency response of the system. It is analogous to a first-order
Continued on next page.
Figure 6. Standard DTC Curve
This equation is also graphicallyrepresented in Figure 6.

3.6 PCB Piezotronics, Inc. Toll-Free in USA 888-684-0004 716-684-0001 www.pcb.com
Introduction To Force Sensors
high-pass RC filter. The system’s theoretical low frequency roll-off is illustrated in Figure 7, and can be calculated from the following relationships:
3 dB down: 0.16/DTC = fc10% down: 0.34/DTC = f-10%5% down: 0.5/DTC = f-5%
Long Duration Events and DTCIt is often desired to measure an input pulse lasting a few seconds in duration. This isespecially true with force sensor applications where static calibration or quasi-staticmeasurements take place. Before performing tests of this nature, it is important to DCcouple the entire monitoring system to prevent rapid signal loss. PCB®’s AC/DC modesignal conditioners are designed for such applications.
The general rule of thumb for such measurements is that the output signal loss and timeelapsed over the first 10% of a DTC have an approximate one to one relationship. If asensor has a 500 second DTC, over the first 50 seconds, 10% of the original input signalwill have decayed. For 1% accuracy, data should be taken in the first 1% of the DTC. If8% accuracy is acceptable, the measurement should be taken within 8% of the DTC, andso forth. Figure 8 graphically demonstrates this event.
Left unchanged, the signal will naturally decay toward zero. This will take approximately5 DTC. You will notice that after the original step impulse signal is removed, the outputsignal dips below the base line reference point (t0 +0.01 TC). This negative value is thesame value as has decayed from the original impulse (shown as 1% in Figure 8). Furtherobservation will reveal that the signal, left untouched, will decay upwards toward zerountil equilibrium in the system is observed.
Force Sensor Natural FrequencyUnlike the low frequency response of the sensor, which is determined electricallythrough the DTC = RC equation, the high frequency response is determined by thesensor’s mechanical configuration (unless electrical low-pass filtering has been added).Each force sensor has an upper frequency limit specification which should be observedwhen determining upper linear limits of operation.
InstallationProper installation of quartz force sensors is essential for accurate dynamicmeasurement results. Although rugged PCB® quartz force sensors are forgiving to somedegree, certain basic procedures should be followed.
Since most PCB® force sensors are designed with quartz compression plates to measureforces applied in an axial direction, aligning the sensor and contact surfaces to preventedge loading or bending moments in the sensor will produce better dynamicmeasurement results.
Having parallelism between the sensor and test structure contact surfaces minimizesbending moments and edge loading. Flatness of mounting surfaces will also affect thequality of the measurement. Using a thin layer of lubricant on mounting surfaces duringinstallation creates better contact between sensor and mounting surface.
The mounting surfaces on PCB® force sensors are lapped during their manufacture toensure that they are flat, parallel and smooth. Ring-style force sensors are supplied withanti-friction washers to minimize shear loading of the sensor surface when torquingbetween two surfaces.
Loading to the entire force sensor sensing surface is also important for goodmeasurements. However, this can be difficult if the surface being brought into contactwith the force sensor is flat but not parallel to the sensor mounting surface. In this case,an intermediate curved surface can lessen edge loading effects (See Figure 9).
Figure 7.Low Frequency Characteristic of a First-order, High-pass Filter
Figure 8. Step Function Response
Figure 9.Edge vs. Central Loading
Introduction To Force Sensors
3.7PCB Piezotronics, Inc. Toll-Free in USA 888-684-0004 716-684-0001 www.pcb.com
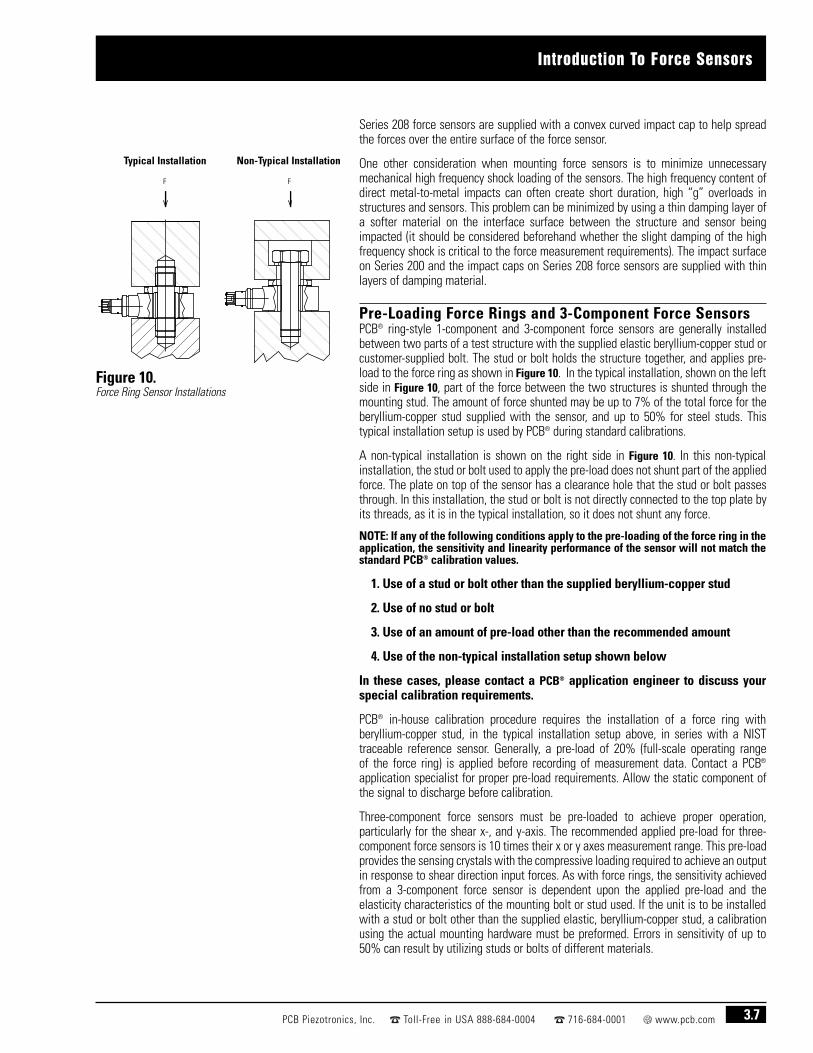
Series 208 force sensors are supplied with a convex curved impact cap to help spreadthe forces over the entire surface of the force sensor.
One other consideration when mounting force sensors is to minimize unnecessarymechanical high frequency shock loading of the sensors. The high frequency content ofdirect metal-to-metal impacts can often create short duration, high “g” overloads instructures and sensors. This problem can be minimized by using a thin damping layer ofa softer material on the interface surface between the structure and sensor beingimpacted (it should be considered beforehand whether the slight damping of the highfrequency shock is critical to the force measurement requirements). The impact surfaceon Series 200 and the impact caps on Series 208 force sensors are supplied with thinlayers of damping material.
Pre-Loading Force Rings and 3-Component Force SensorsPCB® ring-style 1-component and 3-component force sensors are generally installedbetween two parts of a test structure with the supplied elastic beryllium-copper stud orcustomer-supplied bolt. The stud or bolt holds the structure together, and applies pre-load to the force ring as shown in Figure 10. In the typical installation, shown on the leftside in Figure 10, part of the force between the two structures is shunted through themounting stud. The amount of force shunted may be up to 7% of the total force for theberyllium-copper stud supplied with the sensor, and up to 50% for steel studs. Thistypical installation setup is used by PCB® during standard calibrations.
A non-typical installation is shown on the right side in Figure 10. In this non-typicalinstallation, the stud or bolt used to apply the pre-load does not shunt part of the appliedforce. The plate on top of the sensor has a clearance hole that the stud or bolt passesthrough. In this installation, the stud or bolt is not directly connected to the top plate byits threads, as it is in the typical installation, so it does not shunt any force.
NOTE: If any of the following conditions apply to the pre-loading of the force ring in theapplication, the sensitivity and linearity performance of the sensor will not match thestandard PCB® calibration values.
1. Use of a stud or bolt other than the supplied beryllium-copper stud
2. Use of no stud or bolt
3. Use of an amount of pre-load other than the recommended amount
4. Use of the non-typical installation setup shown below
In these cases, please contact a PCB® application engineer to discuss yourspecial calibration requirements.
PCB® in-house calibration procedure requires the installation of a force ring withberyllium-copper stud, in the typical installation setup above, in series with a NISTtraceable reference sensor. Generally, a pre-load of 20% (full-scale operating range of the force ring) is applied before recording of measurement data. Contact a PCB®
application specialist for proper pre-load requirements. Allow the static component ofthe signal to discharge before calibration.
Three-component force sensors must be pre-loaded to achieve proper operation,particularly for the shear x-, and y-axis. The recommended applied pre-load for three-component force sensors is 10 times their x or y axes measurement range. This pre-loadprovides the sensing crystals with the compressive loading required to achieve an outputin response to shear direction input forces. As with force rings, the sensitivity achievedfrom a 3-component force sensor is dependent upon the applied pre-load and theelasticity characteristics of the mounting bolt or stud used. If the unit is to be installedwith a stud or bolt other than the supplied elastic, beryllium-copper stud, a calibrationusing the actual mounting hardware must be preformed. Errors in sensitivity of up to50% can result by utilizing studs or bolts of different materials.
Typical Installation Non-Typical Installation
Figure 10. Force Ring Sensor Installations
F F

3.8 PCB Piezotronics, Inc. Toll-Free in USA 888-684-0004 716-684-0001 www.pcb.com
Introduction To Force Sensors
Typical Piezoelectric System OutputThe output characteristic of piezoelectric sensors is that of an AC coupled system, whererepetitive signals will decay until there is an equal area above and below the originalbase line. As magnitude levels of the monitored event fluctuate, the output will remainstabilized around the base line with the positive and negative areas of the curveremaining equal. Figure 11 represents an AC signal following this curve (output fromsensors operating in DC mode following this same pattern, but over an extended timeframe associated with sensor time constant values).
Example: Assuming a 0 to 3 volt output signal is generated from an AC coupled force applicationwith a one second steady-state pulse rate and one second between pulses. The frequency remainsconstant, but the signal quickly decays negatively until the signal centers around the original baseline (where area A = area B). Peak-to-peak output remains the same.
Repetitive Pulse ApplicationsIn many force monitoring applications, it is desired to monitor a series of zero-to-peakrepetitive pulses that may occur within a short time interval of one another. This outputsignal is often referred to as a “pulse train”. As has been previously discussed, the ACcoupled output signal from piezoelectric sensors will decay towards an equilibriumstate, making it look like the positive force is decreasing. In this scenario, it would bedifficult to accurately monitor a continuous zero-to-peak output signal such as thoseassociated with stamping or pill press applications. With the use of special ICP® sensorsignal conditioning equipment it becomes possible to position an output signal positivegoing above a ground-based zero. Operating in drift-free AC mode, PCB®’s Model 484B02or a Model 410A01 ICP® sensor signal conditioner provides the constant current voltageexcitation to ICP® force sensors and has a zero-based clamping circuit that electronicallyresets each pulse to zero. As outlined in Figure 12, this special circuitry prevents theoutput from drifting negatively, and provides a continuous, positive polarity signal.
Figure 11. Repetitive Pulse, AC Signal
Figure 12. Positive Polarity, Zero-based AC Output
Driving Long Cable Lengths
3.9PCB Piezotronics, Inc. Toll-Free in USA 888-684-0004 716-684-0001 www.pcb.com
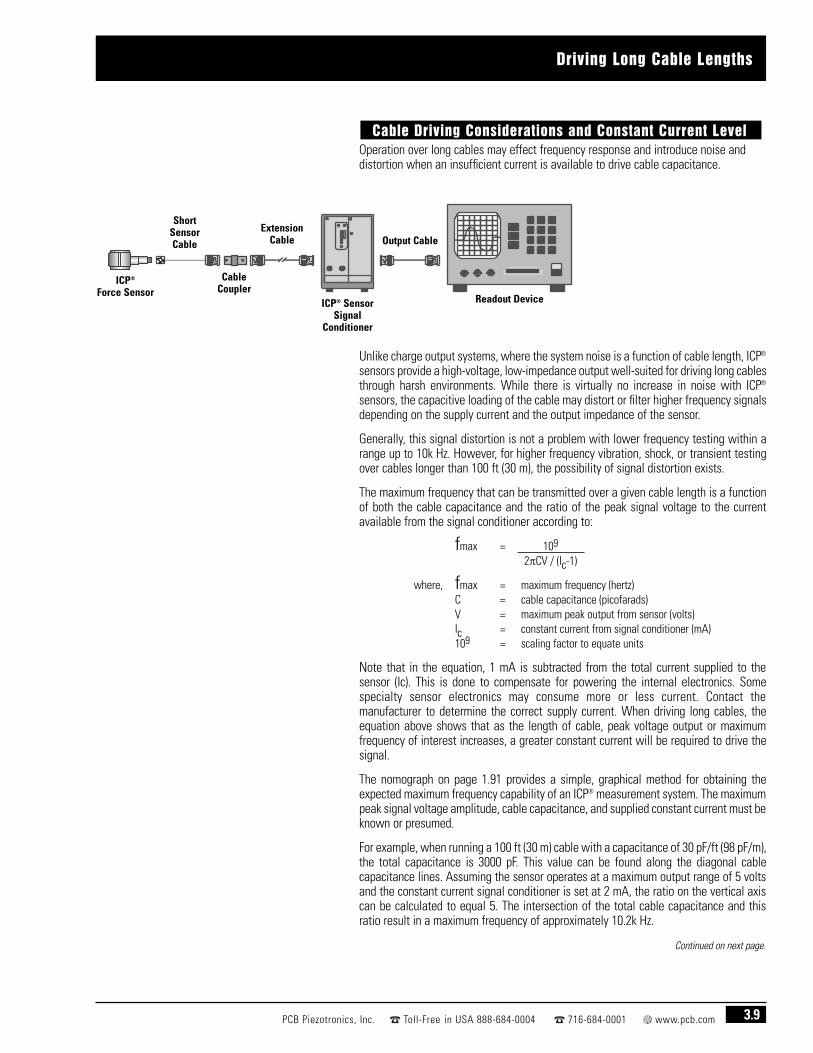
Operation over long cables may effect frequency response and introduce noise and distortion when an insufficient current is available to drive cable capacitance.
Unlike charge output systems, where the system noise is a function of cable length, ICP®
sensors provide a high-voltage, low-impedance output well-suited for driving long cablesthrough harsh environments. While there is virtually no increase in noise with ICP®
sensors, the capacitive loading of the cable may distort or filter higher frequency signalsdepending on the supply current and the output impedance of the sensor.
Generally, this signal distortion is not a problem with lower frequency testing within arange up to 10k Hz. However, for higher frequency vibration, shock, or transient testingover cables longer than 100 ft (30 m), the possibility of signal distortion exists.
The maximum frequency that can be transmitted over a given cable length is a functionof both the cable capacitance and the ratio of the peak signal voltage to the currentavailable from the signal conditioner according to:
fmax = 109
2πCV / (Ic-1)
where, fmax = maximum frequency (hertz)C = cable capacitance (picofarads)V = maximum peak output from sensor (volts)Ic = constant current from signal conditioner (mA)109 = scaling factor to equate units
Note that in the equation, 1 mA is subtracted from the total current supplied to thesensor (Ic). This is done to compensate for powering the internal electronics. Somespecialty sensor electronics may consume more or less current. Contact themanufacturer to determine the correct supply current. When driving long cables, theequation above shows that as the length of cable, peak voltage output or maximumfrequency of interest increases, a greater constant current will be required to drive thesignal.
The nomograph on page 1.91 provides a simple, graphical method for obtaining theexpected maximum frequency capability of an ICP® measurement system. The maximumpeak signal voltage amplitude, cable capacitance, and supplied constant current must beknown or presumed.
For example, when running a 100 ft (30 m) cable with a capacitance of 30 pF/ft (98 pF/m),the total capacitance is 3000 pF. This value can be found along the diagonal cablecapacitance lines. Assuming the sensor operates at a maximum output range of 5 voltsand the constant current signal conditioner is set at 2 mA, the ratio on the vertical axiscan be calculated to equal 5. The intersection of the total cable capacitance and thisratio result in a maximum frequency of approximately 10.2k Hz.
Continued on next page.
Cable Driving Considerations and Constant Current Level
Readout Device
ExtensionCable
CableCoupler
Short SensorCable Output Cable
ICP®
Force SensorICP® Sensor
SignalConditioner

3.10 PCB Piezotronics, Inc. Toll-Free in USA 888-684-0004 716-684-0001 www.pcb.com
Driving Long Cable Lengths
The nomograph does not indicate whether the frequency amplitude response at a pointis flat, rising, or falling. For precautionary reasons, it is good general practice to increasethe constant current (if possible) to the sensor (within its maximum limit) so that thefrequency determined from the nomograph is approximately 1.5 to 2 times greater thanthe maximum frequency of interest.
Note that higher current levels will deplete battery powered signal conditioners at afaster rate. Also, any current not used by the cable goes directly to power the internalelectronics and will create heat. This may cause the sensor to exceed its maximumtemperature specification. For this reason, do not supply excessive current over shortcable runs or when testing at elevated temperatures.
Experimentally Testing Long CablesTo more accurately determine the effect of long cables, it is recommended toexperimentally determine the high frequency electrical characteristics.
The method illustrated below involves connecting the output from a standard signalgenerator into a unity gain, low-output impedance (<5 ohm) instrumentation amplifier inseries with the ICP® sensor. The extremely low output impedance is required to minimizethe resistance change when the signal generator/amplifier is removed from the system.
In order to check the frequency/amplitude response of this system, set the signalgenerator to supply the maximum amplitude of the expected measurement signal.Observe the ratio of the amplitude from the generator to that shown on the scope. If theratio is 1:1, the system is adequate for your test. If necessary, be certain to factor in anygain in the signal conditioner or scope. If the output signal is increasing (+25% forexample), add series resistance to attenuate the signal. Use of a variable 100 ohmresistor will help set the correct resistance more conveniently. Note that this is the onlycondition that requires the addition of resistance. If the signal is decreasing (-25% forexample), the constant current level must be increased or the cable capacitance reduced.
It may be necessary to physically install the cable during cable testing to reflect the actualconditions encountered during data acquisition. This will compensate for potentialinductive cable effects that are partially a function of the geometry of the cable route.
Readout Device
LongExtension
Cable
Model 073A
VariableResistor
Model401A04Sensor
Simulator
SignalGenerator
Short SensorCable
Output Cable
ICP®
SensorSignal
Conditioner

Driving Long Cable Lengths
3.11PCB Piezotronics, Inc. Toll-Free in USA 888-684-0004 716-684-0001 www.pcb.com
VIc - 1
(Ratio of MaximumOutput Voltage fromSensor to AvailableConstant Current)
Frequency (Hz)
fmax = 109
2πCV / (Ic-1)
fmax = maximum frequency (Hz)C = cable capacitance (pF)V = maximum output voltage from sensor (volts)Ic = constant current from power unit (mA)109 = scale factor to equate units
Cable Driving Nomograph

3.12 PCB Piezotronics, Inc. Toll-Free in USA 888-684-0004 716-684-0001 www.pcb.com
Voltage sensitivity of a chargeoutput piezoelectric sensor:
V =
V = voltage sensitivity
q = charge sensitivity
C = capacitance of sensor
Voltage sensitivity of a chargeoutput piezoelectric sensorwith source follower:
V =
C1 = capacitance of sensor
C2 = capacitance of interconnecting cable
C3 = input capacitance of unity gain source follower
Time constant for a first-order,high-pass filter:
t = RC
R = resistance in ohmC = capacitance in faradst = time constant in seconds
Lower corner frequency (-3 dB) for an RC time constant:
fc =
fc = frequency at which signal is attenuated by -3 dB
Lower -5% frequency point foran RC time constant:
f-5% =
f-5% = frequency at which signal is attenuated by 5%
Approximate upper +5%frequency point for single-degree-of-freedommechanical system:
f+5%=
f+5%= frequency at which signal is amplified by 5%
fr = natural (resonant) frequency
Approximating two timeconstants in series foroscillating signals:
(R1C1) (R2C2)
√ (R1C1)2 + (R2C2)2
Approximating two timeconstants in series fortransient inputs lasting up to 10% of the smaller timeconstant value:
(R1C1) (R2C2)(R1C1) + (R2C2)
Rise time of a piezoelectricsensor:
tr =
tr = rise time
fr = natural (resonant) frequency of the sensor
Acceleration:
=
Temperature:
=
Weight:
=
=
=
=
=
Conversion and Useful Formulas
qC
fr5
12 fr
msec2
g9.8
°C(°F-32) 5
9
gmlb
453.59
gmoz
28.35
1 kg 2.204 lb
1 lb 4.448 N
1000 lb 4.448k N
qC1+C2+C3
12 π RC
32 π RC
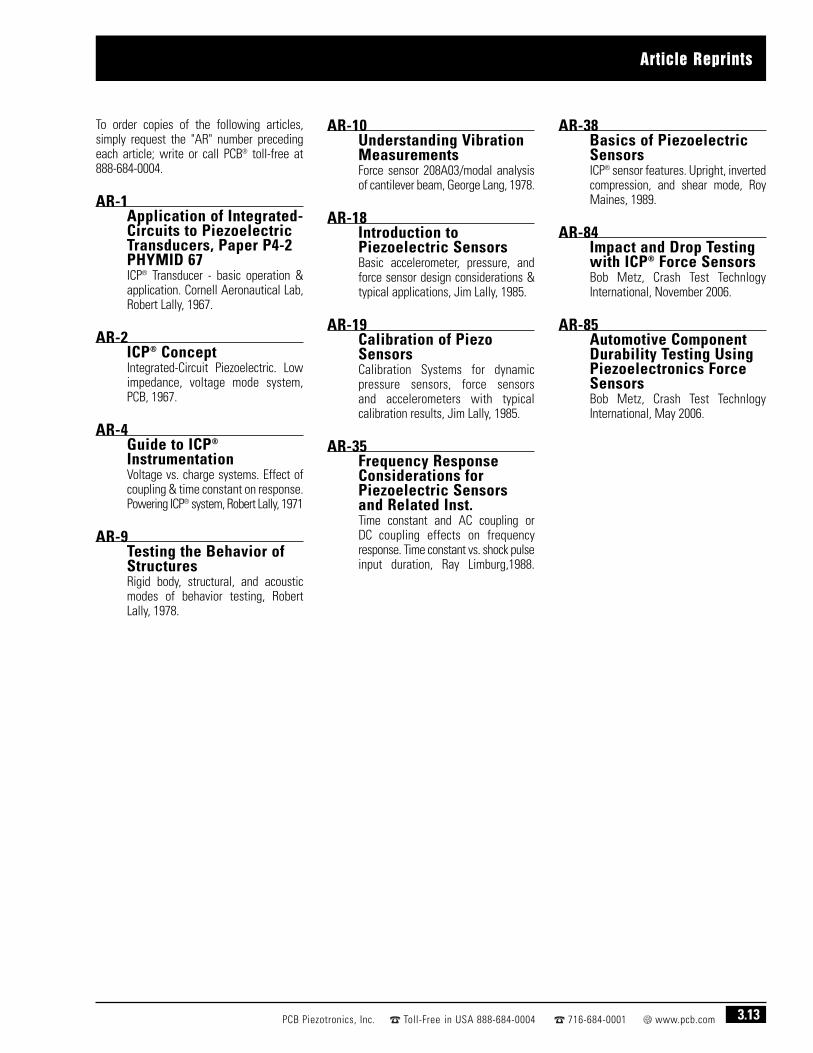
To order copies of the following articles,simply request the "AR" number precedingeach article; write or call PCB® toll-free at888-684-0004.
AR-1Application of Integrated-Circuits to PiezoelectricTransducers, Paper P4-2PHYMID 67ICP® Transducer - basic operation &application. Cornell Aeronautical Lab,Robert Lally, 1967.
AR-2ICP® ConceptIntegrated-Circuit Piezoelectric. Lowimpedance, voltage mode system,PCB, 1967.
AR-4Guide to ICP®
InstrumentationVoltage vs. charge systems. Effect ofcoupling & time constant on response.Powering ICP® system, Robert Lally, 1971
AR-9Testing the Behavior ofStructuresRigid body, structural, and acousticmodes of behavior testing, RobertLally, 1978.
AR-10Understanding VibrationMeasurementsForce sensor 208A03/modal analysisof cantilever beam, George Lang, 1978.
AR-18Introduction toPiezoelectric SensorsBasic accelerometer, pressure, andforce sensor design considerations &typical applications, Jim Lally, 1985.
AR-19Calibration of PiezoSensorsCalibration Systems for dynamicpressure sensors, force sensors and accelerometers with typicalcalibration results, Jim Lally, 1985.
AR-35Frequency ResponseConsiderations forPiezoelectric Sensorsand Related Inst.Time constant and AC coupling or DC coupling effects on frequency response. Time constant vs. shock pulseinput duration, Ray Limburg,1988.
AR-38Basics of PiezoelectricSensorsICP® sensor features. Upright, invertedcompression, and shear mode, RoyMaines, 1989.
AR-84Impact and Drop Testingwith ICP® Force SensorsBob Metz, Crash Test TechnlogyInternational, November 2006.
AR-85Automotive ComponentDurability Testing UsingPiezoelectronics ForceSensorsBob Metz, Crash Test TechnlogyInternational, May 2006.
Article Reprints
3.13PCB Piezotronics, Inc. Toll-Free in USA 888-684-0004 716-684-0001 www.pcb.com
3.14 PCB Piezotronics, Inc. Toll-Free in USA 888-684-0004 716-684-0001 www.pcb.com
Reprinted with permission from ApplicationNote: AN 243-1, “Effective MachineryMeasurements Using Dynamic SignalAnalyzers,” Hewlett-Packard Company,1991. Editing and additions performed byPCB Piezotronics, Depew, NY, 1998.
Acceleration — The time rate of change of velocity. Typicalunits are ft/s2, meters/s2, and G’s (1G =32.17 ft/s2 = 9.81 m/s2). Accelerationmeasurements are usually made withaccelerometers.
Accelerometer — Transducer whose output is directlyproportional to acceleration. Most commonlyuse piezoelectric crystals to produce output.
Aliasing — A phenomenon which can occur whenever asignal is not sampled at greater than twicethe maximum bandwidth of the signal.Causes high frequency signals to appear atlow frequencies. Aliasing is minimized byfiltering the signal to a bandwidth less than fithe sample rate. When the signal starts at 0Hz (baseband signals), bandwidth can beexchanged to maximum frequency in thedefinition above.
Alignment — A condition whereby the axes of machinecomponents are either coincident, parallel,or perpendicular, according to designrequirements.
Amplification Factor(Synchronous) — A measure of the susceptibility of a rotor tovibration amplitude when rotational speed isequal to the rotor natural frequency (impliesa flexible rotor). For imbalance typeexcitation, synchronous amplification factoris calculated by dividing the amplitude valueat the resonant peak by the amplitude valueat a speed well above resonance (asdetermined from a plot of synchronousresponse vs. rpm).
Amplitude — The magnitude of dynamic motion orvibration. Amplitude is expressed in terms ofpeak-to-peak, zero-to-peak, or rms. For puresine waves only, these are related asfollows: rms = 0.707 times zero-to-peak;peak-to-peak = 2 times zero-to-peak. DSAsgenerally read rms for spectral components,and peak for time domain components.
Anti-aliasing Filter — Most commonly a low-pass filter designed tofilter out frequencies higher than 1/2 thesample rate in order to minimize aliasing.
Anti-friction Bearing — See Rolling Element Bearing.
Asymmetrical Support — Rotor support system that does not provideuniform restraint in all radial directions. Thisis typical for most heavy industrial machinerywhere stiffness in one plane may besubstantially different than stiffness in theperpendicular plane. Occurs in bearings bydesign, or from preloads such as gravity ormisalignment.
Asynchronous — Vibration components that are not related torotating speed (also referred to asnonsynchronous).
Attitude Angle (Steady-State) — The angle between the direction of steady-state preload through the bearing centerline,and a line drawn between the shaftcenterline and the bearing centerline.(Applies to fluid-film bearings.)
Auto Spectrum (Power Spectrum) — DSA spectrum display whose magnituderepresents the power at each frequency, andwhich has no phase.
Averaging — In a DSA, digitally averaging severalmeasurements to improve accuracy or toreduce the level of asynchronouscomponents. Refer to definitions of rms,time, and peak-hold averaging.
Axial — In the same direction as the shaft centerline.
Axial Position — The average position, or change in position,of a rotor in the axial direction with respectto some fixed reference position. Ideally thereference is a known position within thethrust bearing axial clearance or float zone,and the measurement is made with adisplacement transducer observing thethrust collar.
Balancing Resonance Speed(s) — A rotative speed that corresponds to anatural resonance frequency.
Balanced Condition — For rotating machinery, a condition where theshaft geometric centerline coincides with themass centerline.
Balancing — A procedure for adjusting the radial massdistribution of a rotor so that the masscenterline approaches the rotor geometriccenterline.
Band-Pass Filter — A filter with a single transmission bandextending from lower to upper cutofffrequencies. The width of the band isnormally determined by the separation offrequencies at which amplitude is attenuatedby 3 dB (a factor 0.707 ).
Bandwidth — The distance between frequency limits atwhich a band-pass filter attenuates thesignal by 3 dB. In a DSA, the measurementbandwidth is equal to [(frequencyspan)/(number of filters) x (window factor)].Window factors are: 1 for uniform, 1.5 forHanning, and 3.4 for flat top (P301) and 3.6for flat top (P401). See flat top for moreinformation.
Baseline Spectrum — A vibration spectrum taken when a machineis in good operating condition; used as areference for monitoring and analysis.
Blade Passing Frequency — A potential vibration frequency on any bladedmachine (turbine, axial compressor, fan, etc.).It is represented by the number of bladestimes shaft-rotating frequency.
Block Size — The number of samples used in a DSA tocompute the Fast Fourier Transform. Also thenumber of samples in a DSA time display.Most DSAs use a block size of 1024. Smallerblock size reduces frequency resolution.
Bode — Rectangular coordinate plot of 1x componentamplitude and phase (relative to a keyphasor)vs. running speed.
BPFO, BPFI — Common abbreviations for ball pass frequencyof defects on outer and inner bearing races,respectively.
Bow — A shaft condition such that the geometriccenterline of the shaft is not straight.
Glossary of Terms
Brinneling (False) — Impressions made by bearing rollingelements on the bearing race; typicallycaused by external vibration when the shaftis stationary.
Calibration — A test during which known values of themeasured variable are applied to thetransducer or readout instrument, and outputreadings varied or adjusted.
Campbell Diagram — A mathematically constructed diagram usedto check for coincidence of vibration sources(i.e. 1 x imbalance, 2 x misalignment) withrotor natural resonances. The form of thediagram is like a spectral map (frequencyversus rpm), but the amplitude is representedby a rectangular plot, the larger theamplitude the larger the rectangle. Alsoknown as an interference diagram.
Cascade Plot — See Spectral Map.
Cavitation — A condition which can occur in liquid-handling machinery (e.g. centrifugal pumps)where a system pressure decrease in thesuction line and pump inlet lowers fluidpressure and vaporization occurs. The resultis mixed flow which may produce vibration.
Center Frequency — For a bandpass filter, the center of thetransmission band, measured in a linear scale.
Charge Amplifier — Amplifier used to convert accelerometeroutput impedance from high to low, makingcalibration much less dependent on cablecapacitance.
Coherence — Measures how much of the output signal isdependent on the input signal in a linear andtime-invariant way. It is an effective meansof determining the similarity of vibration attwo locations, giving insight into thepossibility of cause and effect relationships.
Constant Bandwidth Filter — A band-pass filter whose bandwidth isindependent of center frequency. The filterssimulated digitally by the FFT in a DSA areconstant bandwidth.
Constant PercentageBandwidth — A band-pass filter whose bandwidth is aconstant percentage of center frequency. 1/3octave filters, including those synthesized inDSAs, are constant percentage bandwidth.
Critical Machinery — Machines which are critical to a major partof the plant process. These machines areusually unspared.
Critical Speeds — In general, any rotating speed which isassociated with high vibration amplitude.Often, the rotor speeds which correspond tonatural frequencies of the system.
Critical Speed Map — A rectangular plot of system naturalfrequency (y-axis) versus bearing or supportstiffness (x-axis).
Cross Axis Sensitivity — A measure of off-axis response of velocityand acceleration transducers.
Cycle — One complete sequence of values of aperiodic quantity.
Damping — The quality of a mechanical system thatrestrains the amplitude of motion with eachsuccessive cycle. Damping of shaft motion isprovided by oil in bearings, seals, etc. Thedamping process converts mechanicalenergy to other forms, usually heat.
Damping, Critical — The smallest amount of damping required toreturn the system to its equilibrium positionwithout oscillation.
Decibels (dB) — A logarithmic representation of amplituderatio, defined as 10 times the base tenlogarithm of the ratio of the measured powerto a reference. dBV readings, for example,are referenced to 1 volt rms. dB amplitudescales are required to display the fulldynamic range of a DSA.
Degrees of Freedom — A phrase used in mechanical vibration todescribe the complexity of the system. Thenumber of degrees of freedom is the numberof independent variables describing the stateof a vibrating system.
Digital Filter — A filter which acts on the data after it hasbeen sampled and digitized. Often used inDSAs to provide anti-aliasing protectionbefore internal re-sampling.
Differentiation — Representation in terms of time rate ofchange. For example, differentiating velocityyields acceleration. In a DSA, differentiationis performed by multiplication by jw in thefrequency domain, where w is frequencymultiplied by 2p. (Differentiation can also beused to convert displacement to velocity.)
Discrete Fourier Transform — A procedure for calculating discretefrequency components (filters or lines) fromsampled time data. Since the frequencydomain result is complex (i.e., real andimaginary components), the number offrequency points is equal to half the numberof time samples (for a real FFT). When usingzoom analysis, the FFT uses complex timedata and then the number of frequency linesis equal to the number of time samples.
Displacement — The change in distance or position of anobject relative to a reference.
Displacement Transducer — A transducer whose output is proportional tothe distance between it and the measuredobject (usually the shaft).
DSA — See Dynamic Signal Analyzer.
Dual Probe — A transducer set consisting of displacementand velocity transducers. Combinesmeasurement of shaft motion relative to thedisplacement transducer with velocity of thedisplacement transducer to produce absolutemotion of the shaft.
Dual Voting — Concept where two independent inputs arerequired before action (usually machineshutdown) is taken. Most often used withaxial position measurements, where failureof a single transducer might lead to anunnecessary shutdown.
Dynamic Motion — Vibratory motion of a rotor system caused bymechanisms that are active only when therotor is turning at speeds above slow rollspeed.
Glossary Of Terms
3.15PCB Piezotronics, Inc. Toll-Free in USA 888-684-0004 716-684-0001 www.pcb.com
3.16 PCB Piezotronics, Inc. Toll-Free in USA 888-684-0004 716-684-0001 www.pcb.com
Dynamic Signal Analyzer(DSA) — Vibration analyzer that uses digital signalprocessing and the Fast Fourier Transform todisplay vibration frequency components.DSAs also display the time domain andphase spectrum, and can usually beinterfaced to a computer.
Eccentricity, Mechanical — The variation of the outer diameter of a shaftsurface when referenced to the truegeometric centerline of the shaft. Out-of-roundness.
Eccentricity Ratio — The vector difference between the bearingcenterline and the average steady-statejournal centerline.
Eddy Current — Electrical current which is generated (anddissipated) in a conductive material in thepresence of an electromagnetic field.
Electrical Runout — An error signal that occurs in eddy currentdisplacement measurements when shaftsurface conductivity varies.
Engineering Units — In a DSA, refers to units that are calibratedby the user (e.g., in/s, g’s).
External Sampling — In a DSA, refers to control of data samplingby a multiplied tachometer signal. Provides astationary display of rpm-related peaks withchanging speed.
Fast Fourier Transform (FFT) — A computer (or microprocessor) procedure forcalculating discrete frequency componentsfrom sampled time data. A special case ofthe Discrete Fourier Transform, DFT, wherethe number of samples is constrained to apower of 2 for speed.
Filter — Electronic circuitry designed to pass or rejecta specific frequency band.
Finite Element Modeling — A computer aided design technique forpredicting the dynamic behavior of amechanical system prior to construction.Modeling can be used, for example, topredict the natural frequencies of a flexiblerotor.
Flat Top Filter — FFT window function which provides the bestamplitude accuracy for measuring discretefrequency components. Note: there areseveral different flat top windows. The HPproprietary P401 is the “best” flat topwindow. P301 is the most common.
Fluid-Film Bearing — A bearing which supports the shaft on a thinfilm of oil. The fluid-film layer may begenerated by journal rotation (hydrodynamicbearing), or by externally applied pressure(hydrostatic bearing).
Forced Vibration — The oscillation of a system under the actionof a forcing function. Typically forcedvibration occurs at the frequency of theexciting force.
Free Vibration — Vibration of a mechanical system followingan initial force - typically at one or morenatural frequencies.
Frequency — The repetition rate of a periodic event,usually expressed in cycles per second (Hz),revolutions per minute (rpm), or multiples ofa rotational speed (orders). Compare toorders that are commonly referred to as 1xfor rotational speed, 2x for twice rotationalspeed, etc.
Frequency Response Function — The amplitude and phase responsecharacteristics of a system.
G — The value of acceleration produced by theforce of gravity.
Gear Mesh Frequency — A potential vibration frequency on anymachine that contains gears; equal to thenumber of teeth multiplied by the rotationalfrequency of the gear.
Hanning Window — FFT window function that normally providesbetter frequency resolution than the flat topwindow, but with reduced amplitudeaccuracy.
Harmonic — Frequency component at a frequency that isan integer multiple of the fundamentalfrequency.
Heavy Spot — The angular location of the imbalance vectorat a specific lateral location on a shaft. Theheavy spot typically does not change withrotational speed.
Hertz (Hz) — The unit of frequency represented by cyclesper second.
High Spot — The angular location on the shaft directlyunder the vibration transducer at the point ofclosest proximity. The high spot can movewith changes in shaft dynamics (e.g., fromchanges in speed).
High-Pass Filter — A filter with a transmission band starting ata lower cutoff frequency and extending to(theoretically) infinite frequency.
Hysteresis — Non-uniqueness in the relationship betweentwo variables as a parameter increases ordecreases. Also called deadband, or thatportion of a system’s response where achange in input does not produce a change inoutput.
Imbalance — Unequal radial weight distribution on a rotorsystem; a shaft condition such that the massand shaft geometric center lines do notcoincide.
Impact Test — Response test where the broad frequencyrange produced by an impact is used as thestimulus. Sometimes referred to as a bumptest. See impulse response for moreinformation.
Impedance, Mechanical — The mechanical properties of a machinesystem (mass, stiffness, damping) thatdetermine the response to periodic forcingfunctions.
Impulse Response — The response of a system to an impulse asinput signal. The output then produces theimpulse response that is the time domainequivalent to the Frequency ResponseFunction, FRF.
Influence Coefficients — Mathematical coefficients that describe theinfluence of system loading on systemdeflection.
Glossary Of Terms

Integration — A process producing a result that, whendifferentiated, yields the original quantity.Integration of acceleration, for example,yields velocity. Integration is performed in aDSA by dividing the frequency lines by jw,where w is frequency multiplied by 2p.(Integration is also used to convert velocity todisplacement.)
Journal — Specific portions of the shaft surface fromwhich rotor applied loads are transmitted tobearing supports.
Keyphasor — A signal used in rotating machinerymeasurements, generated by a transducerobserving a once-per-revolution event. Thekeyphasor signal is used in phasemeasurements for analysis and balancing.(Keyphasor is a Bently Nevada trade name.)
Lateral Location — The definition of various points along theshaft axis of rotation.
Lateral Vibration — See Radial Vibration.
Leakage — In DSAs, a result of finite time record lengththat results in smearing of frequencycomponents. Its effects are greatly reducedby the use of weighted time functions suchas Flat top or Hanning windows.
Linearity — The response characteristics of a linearsystem remain constant with input leveland/or excitation signal type. That is, if theresponse to input a is k·a, and the responseto input b is k·b, then the response of a linearsystem to input (a + b) will be (k·a + k·b),independent of the function k. An example ofa non-linear system is one whose responseis limited by mechanical stop, such as occurswhen a bearing mount is loose.
Lines — Common term used to describe the filters ofa DSA produced by the FFT (e.g., 400 lineanalyzer).
Linear Averaging — See Time Averaging.
Low-pass Filter — A filter whose transmission band extendsfrom dc to an upper cutoff frequency.
Mechanical Runout — An error in measuring the position of theshaft centerline with a displacement probethat is caused by out-of-roundness andsurface imperfections.
Micrometer (MICRON) — One millionth (.000001) of a meter. (1 micron= 1 x E-6 meters @ 0.04 mils.)
MIL — One thousandth (0.001) of an inch. (1 mil =25.4 microns)
Modal Analysis — The process of breaking complex vibrationinto its component modes of vibration, verymuch like frequency domain analysis breaksvibration down to component frequencies.
Mode Shape — The resultant deflected shape of a rotor at aspecific rotational speed to an appliedforcing function. A three-dimensionalpresentation of rotor lateral deflection alongthe shaft axis.
Modulation, Amplitude (AM) — The process where the amplitude of a signalis varied as a function of the instantaneousvalue of a another signal. The first signal iscalled the carrier, and the second signal iscalled the modulating signal. Amplitudemodulation always produces a component atthe carrier frequency, with components(sidebands) at the frequency of the carrierfrequency plus minus the modulating signal.
Modulation, Frequency (FM) — The process where the frequency of thecarrier is determined by the amplitude of themodulating signal. Frequency modulationproduces a component at the carrierfrequency, with adjacent components(sidebands) at frequencies around the carrierfrequency related to the modulating signal.The carrier and sidebands are described byBessel functions.
Natural Frequency — The frequency of free vibration of a system.The frequency at which an undamped systemwith a single degree of freedom will oscillateupon momentary displacement from its restposition.
Nodal Point — A point of minimum shaft deflection in aspecific mode shape. May readily changelocation along the shaft axis due to changesin residual imbalance or other forcingfunction, or change in restraint such asincreased bearing clearance.
Noise — Any component of a transducer output signalthat does not represent the variable intendedto be measured.
Nyquist Criterion — Requirement that a sampled system needs tobe sampled at a frequency greater thantwice the bandwidth of the signal to besampled.
Nyquist Plot — A plot of real versus imaginary spectralcomponents that is often used in servoanalysis. Should not be confused with apolar plot of amplitude and phase of 1xvibration.
Octave — The interval between two frequencies with aratio of 2 to 1.
Oil Whirl/Whip — An unstable free vibration whereby a fluid-film bearing has insufficient unit loading.Under this condition, the shaft centerlinedynamic motion is usually circular in thedirection of rotation. Oil whirl occurs at theoil flow velocity within the bearing, usually40 to 49% of shaft speed. Oil whip occurswhen the whirl frequency coincides with(and becomes locked to) a shaft resonantfrequency. (Oil whirl and whip can occur inany case where fluid is between twocylindrical surfaces.)
Orbit — The path of the shaft centerline motion duringrotation. The orbit is observed with anoscilloscope connected to x and y-axisdisplacement transducers. Some dual-channelDSAs also have the ability to display orbits.
Oscillator-demodulator — A signal conditioning device that sends aradio frequency signal to an eddy-currentdisplacement probe, demodulates the probeoutput, and provides output signalsproportional to both the average anddynamic gap distances. (Also referred to asProximitor, a Bently Nevada trade name.)
Glossary Of Terms
3.17PCB Piezotronics, Inc. Toll-Free in USA 888-684-0004 716-684-0001 www.pcb.com
3.18 PCB Piezotronics, Inc. Toll-Free in USA 888-684-0004 716-684-0001 www.pcb.com
Peak Hold — In a DSA, a type of averaging that holds thepeak signal level for each frequencycomponent.
Period — The time required for a complete oscillationor for a single cycle of events. The reciprocalof frequency.
Phase — A measurement of the timing relationshipbetween two signals, or between a specificvibration event and a keyphasor pulse. Phaseis often measured as a function of frequency.
Piezoelectric — Any material which provides a conversionbetween mechanical and electrical energy.For a piezoelectric crystal, if mechanicalstresses are applied on two opposite faces,electrical charges appear on some other pairof faces.
Polar Plot — Polar coordinate representation of the locusof the 1x vector at a specific lateral shaftlocation with the shaft rotational speed as aparameter.
Power Spectrum — See Auto Spectrum.
Pre-load, Bearing — The dimensionless quantity that is typicallyexpressed as a number from zero to onewhere a preload of zero indicates no bearingload upon the shaft, and one indicates themaximum preload (i.e., line contact betweenshaft and bearing).
Pre-load, External — Any of several mechanisms that canexternally load a bearing. This includes “soft”preloads such as process fluids or gravitationalforces as well as “hard” preloads from gearcontact forces, misalignment, rubs, etc.
Proximitor — See Oscillator/Demodulator.
Radial — Direction perpendicular to the shaft centerline.
Radial Position — The average location, relative to the radialbearing centerline, of the shaft dynamicmotion.
Radial Vibration — Shaft dynamic motion or casing vibrationwhich is in a direction perpendicular to theshaft centerline.
Real-time Analyzer — See Dynamic Signal Analyzer.
Real-time Rate — For a DSA, the broadest frequency span atwhich data is sampled continuously. Real-time rate is mostly dependent on FFTprocessing speed. If the definition of real-time rate is “not miss any data”, the real-time rate will be window dependent. Thereal-time rate will decrease when using anyother window than uniform.
Rectangular Window — See Uniform Window.
Relative Motion — Vibration measured relative to a chosenreference. Displacement transducers generallymeasure shaft motion relative to thetransducer mounting.
Repeatability — The ability of a transducer or readoutinstrument to reproduce readings when thesame input is applied repeatedly.
Resolution — The smallest change in stimulus that willproduce a detectable change in theinstrument output.
Resonance — The condition of vibration amplitude andphase change response caused by acorresponding system sensitivity to aparticular forcing frequency. A resonance istypically identified by a substantialamplitude increase, and related phase shift.
Rolling Element Bearing — Bearing whose low friction qualities derivefrom rolling elements (balls or rollers), withlittle lubrication.
Root Mean Square (rms) — Square root of the arithmetical average of aset of squared instantaneous values. DSAsperform rms averaging digitally onsuccessive vibration spectra, frequency lineby frequency line.
Rotor, Flexible — A rotor which operates close enough to, orbeyond its first bending critical speed fordynamic effects to influence rotordeformations. Rotors which cannot beclassified as rigid rotors are considered to beflexible rotors.
Rotor, Rigid — A rotor which operates substantially belowits first bending critical speed. A rigid rotorcan be brought into, and will remain in, astate of satisfactory balance at all operatingspeeds when balanced on any two arbitrarilyselected correction planes.
Runout Compensation — Electronic correction of a transducer outputsignal for the error resulting from slow rollrunout.
Seismic — Refers to an inertially referencedmeasurement or a measurement relative tofree space.
Seismic Transducer — A transducer that is mounted on the case or housing of a machine and measurescasing vibration relative to free space.Accelerometers and velocity transducers areseismic.
Signal Conditioner — A device placed between a signal source anda readout instrument to change the signaland/or bandwidth. Examples: attenuators,preamplifiers, charge amplifiers, filters.
Signature — Term usually applied to the vibrationfrequency spectrum which is distinctive andspecial to a machine or component, systemor subsystem at a specific point in time,under specific machine operating conditions,etc. Used for historical comparison ofmechanical condition over the operating lifeof the machine.
Slow Roll Speed — Low rotative speed at which dynamic motioneffects from forces such as imbalance arenegligible.
Spectral Map — A three-dimensional plot of the vibrationamplitude spectrum versus another variable,usually time or rpm.
Spectrum Analyzer — An instrument which displays the frequencyspectrum of an input signal.
Stiffness —The spring-like quality of mechanical andhydraulic elements to elasticity deform underload.
Glossary Of Terms
Strain — The physical deformation, deflection, orchange in length resulting from stress (forceper unit area).
Subharmonic — Sinusoidal quantity of a frequency that is anintegral submultiple of a fundamentalfrequency.
Subsynchronous — Component(s) of a vibration signal which hasa frequency less than shaft rotativefrequency.
Synchronous Sampling — In a DSA, it refers to the control of theeffective sampling rate of data; whichincludes the processes of external samplingand computed resampling used in ordertracking.
Time Averaging — In a DSA, averaging of time records thatresults in reduction of asynchronouscomponents with reference to the trigger.
Time Record — In a DSA, the sampled time data converted tothe frequency domain by the FFT. Most DSAsuse a time record of 1024 samples.
Torsional Vibration — Amplitude modulation of torque measured indegrees peak-to-peak referenced to the axisof shaft rotation.
Tracking Filter —A low-pass or band-pass filter whichautomatically tracks the input signal versusthe rpm. A tracking filter is usually requiredfor aliasing protection when data sampling iscontrolled externally.
Transducer — A device for translating the magnitude of onequantity into another quantity.
Transient Vibration — Temporarily sustained vibration of amechanical system. It may consist of forcedor free vibration or both. Typically this isassociated with changes in machineoperating condition such as speed, load, etc.
Transverse Sensitivity — See Cross-Axis Sensitivity.
Trigger — Any event which can be used as a timingreference. In a DSA, a trigger can be used toinitiate a measurement.
Unbalance — See Imbalance.
Uniform Window — In a DSA, a window function with uniformweighting across the time record. Thiswindow does not protect against leakage,and should be used only with transientsignals contained completely within the timerecord.
Vector — A quantity which has both magnitude anddirection (phase).
Waterfall Plot — See Spectral Map.
Glossary Of Terms
3.19PCB Piezotronics, Inc. Toll-Free in USA 888-684-0004 716-684-0001 www.pcb.com

The force sensors listed in this catalog represent our most popular sensors, which are only a fraction of the sensors we offer. In addition to ourstandard sensors, PCB® can customize sensors to meet your specific needs. Please fill out this inquiry form with any information available to you,so that we may help you with your dynamic measurement application. If you would like to discuss your application, or if it is not listed, pleasecall, fax, E-mail, or write to PCB® for suggestions.
Name: __________________________________________ Date: ____________________________________________
Company: ________________________________________ Phone: __________________________ Ext.: ____________
Dept.: __________________________________________ Fax: ____________________________________________
Address: ________________________________________ City/State: ______________________ Zip ____________
Country:__________________________________________ Email: ____________________________________________
1. Nature of Request❑ Inquiry ❑ Order ❑ Quotation ❑ Delivery Information ❑ Complaint ❑ Trouble with Equipment
❑ Service or Repair ❑ Equipment Operation ❑ Visit required from PCB® or Sales Representative in your area
2. Describe The Application (check all that apply)
Industry Measurement Type❑ Crimping and Stamping ❑ Laboratory Research ❑ Compression ❑ Force Controlled Vibration
❑ Machine Tool ❑ Biomedical ❑ Tension ❑ Cutting Tool
❑ Automotive ❑ Military ❑ Impact ❑ Engine Mount
❑ Aerospace ❑ Other ❑ Press Monitoring ❑ Biomechanic
❑ Machine Monitoring ❑ Material Strength
❑ Penetration ❑ Drop Testing
❑ Package Testing ❑ Other
3. PhysicalPhysical Design: ❑ General Purpose ❑ Rings ❑ Links ❑ 3-component ❑ Impact ❑ Miniature ❑ Penetration ❑ Strain
Desired Characteristics:Sensitivity __________________________mV/lb or pC/lbt ________________
Maximum Weight ______________grams
Size Limitation ______________H, ________________L, ______________W; ______________or Diameter ______________
4. DynamicWhat is the approximate dynamic force level to be measured? (compression/tension) __________/ ____________lb
What is the maximum force expected to be present? (compression/tension)__________________/ ____________lb
What is the desired resolution? ________________lb
What is the maximum frequency of interest? ________________Hz or ________________CPM
What is the minimum frequency of interest? ________________Hz or ________________CPM
Force Sensor Application Inquiry Form
3.20 PCB Piezotronics, Inc. Toll-Free in USA 888-684-0004 716-684-0001 www.pcb.com

5. Mechanical and EnvironmentalContinuous operating temperature range (min. to max.): ______________to ____________°C, to ______________°F
Will the temperature be cycling? __________________If yes, at what cycling profile?
What is the storage temperature? ______________°C, ______________°F
Describe in detail, operating environment______________________________________________________________________
6. Cabling and Mounting
Electrical Connection Location: ❑ Axial (Top) Exit ❑ Radial (Side) Exit
Connector Type: ❑ 0-32 ❑ 5-44 ❑ Integral Cable ❑ Four-Pin ❑ Other
Cable Type: ❑ Coaxial Cable ❑ Four-Conductor ❑ Other
Other Cable Requirements: ________________________________________________________________________________
Mounting Type: ❑ Removable Stud ❑ Integral Stud ❑ Captive Bolt ❑ Adhesive ❑ Magnetic Base ❑ Other
Thread Size: ❑ 5-40 ❑ 10-32 UNF ❑ 1/4 -28 UNF ❑ Other
7. Electric
What is the readout device? ❑ A to D ❑ Scope ❑ Other (specify)
What is the input impedance of the readout device (if applicable)? ____________________________________________________
Can the readout device supply 24 to 27 VDC and 2 to 20 mA excitation to sensor? ________________________________________
What kind of signal conditioner would you like? Single channel ______Multiple channel ______How many? ____________________
What cable lengths will be driven? Cable length ______ft, ______m Cable Capacitance ______pF/ft, ______pF/m
Will the cable be near electromagnetic interference sources (e.g., AC power lines, radio equipment, motors, and generators)? Describe: ____________________________________________________________________________________________
Is the sensor or cable located near areas prone to electrostatic discharges? ____________________________________________
Should the sensor be: ❑ Ground-isolated ❑ Case-isolated
8. Other Specific Requests or Requirements
__________________________________________________________________________________________________
__________________________________________________________________________________________________
__________________________________________________________________________________________________
__________________________________________________________________________________________________
__________________________________________________________________________________________________
Force Sensor Application Inquiry Form
3.21PCB Piezotronics, Inc. Toll-Free in USA 888-684-0004 716-684-0001 www.pcb.com
PCB® Piezotronics, Inc.3425 Walden Avenue, Depew, NY 14043
Tel: 716-684-0001Fax: 716-684-8877Email: [email protected]: www.pcb.com
3.22 PCB Piezotronics, Inc. Toll-Free in USA 888-684-0004 716-684-0001 www.pcb.com
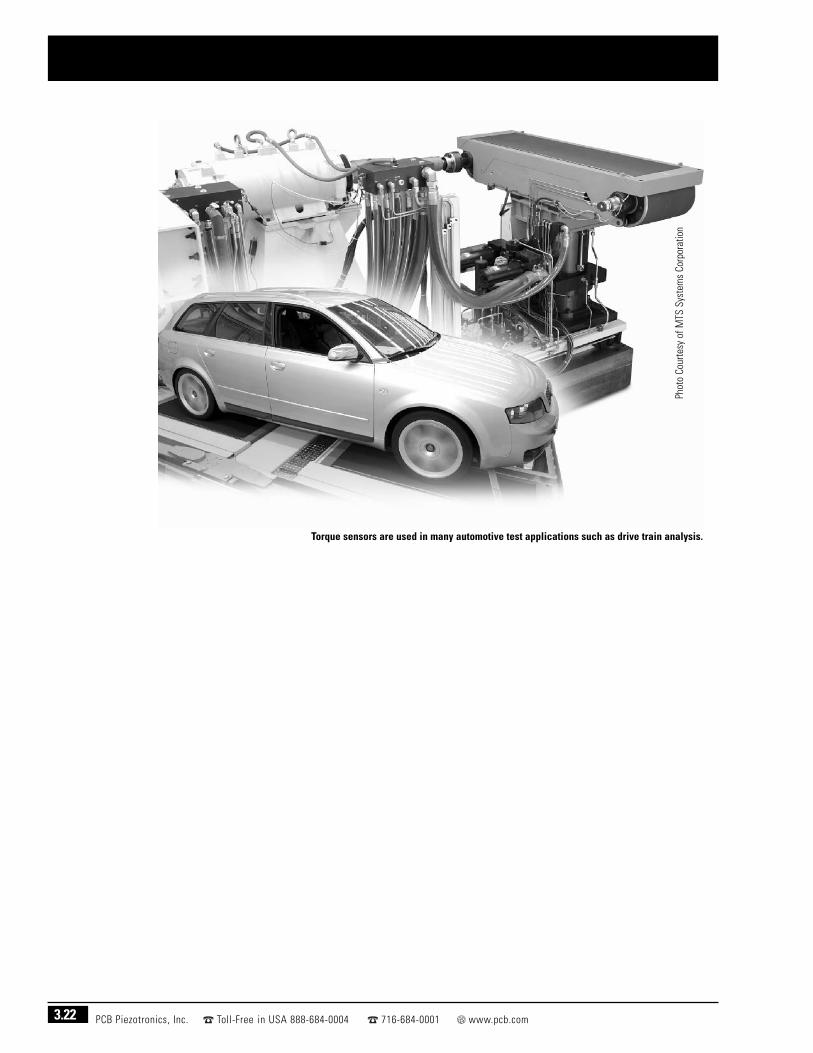
Torque sensors are used in many automotive test applications such as drive train analysis.
Phot
o Co
urte
sy o
f MTS
Sys
tem
s Co
rpor
atio
n