Embed Size (px)
Citation preview

Fuel Capability Demonstration Test Protocol for the
JEA Large-Scale CFB Combustion Demonstration Project
APPENDIX A TO THE DOE PHASE III TEST PLAN
Submitted to U.S. DEPARTMENT OF ENERGY National Energy Technology Laboratory (NETL) Pittsburgh, Pennsylvania 15236 Cooperative Agreement No. DE-FC21-90MC27403
March 1, 2004
Prepared by:

TABLE OF CONTENTS
1.0 INTRODUCTION................................................................................................................................1
2.0 BOILER DESIGN PARAMETERS.....................................................................................................2 2.1 FEEDWATER AND STEAM CONDITIONS................................................................................................2 2.2 PERFORMANCE FUEL SPECIFICATIONS...............................................................................................2 2.3 PERFORMANCE LIMESTONE SPECIFICATIONS......................................................................................3 2.4 PERFORMANCE LIME SPECIFICATIONS................................................................................................4 2.5 AMBIENT CONDITIONS .......................................................................................................................4
3.0 PERFORMANCE TEST DESIGN POINTS .......................................................................................5 3.1 CAPACITY.........................................................................................................................................5 3.2 CFB EFFICIENCY DESIGN POINT........................................................................................................5 3.3 EMISSIONS DESIGN POINT.................................................................................................................6 3.4 STEAM TEMPERATURE DESIGN POINT................................................................................................7 3.5 CALCIUM TO SULFUR (CA:S) RATIO DESIGN POINT.............................................................................7 3.6 MINIMUM STABLE LOAD DEMONSTRATION ..........................................................................................8
4.0 FUEL DEMONSTRATION TEST CALCULATION PROCEDURES.................................................9 4.1 CAPACITY.........................................................................................................................................9 4.2 EFFICIENCY ....................................................................................................................................10 4.3 FLUE GAS EMISSIONS .....................................................................................................................14 4.4 STEAM TEMPERATURE ....................................................................................................................15
5.0 PERFORMANCE TEST RESPONSIBILITY....................................................................................17 5.1 JEA REPRESENTATIVES..................................................................................................................17 5.2 TEST COORDINATOR .......................................................................................................................18 5.3 FUEL GAS TEST/TEST EQUIPMENT/SAMPLE COLLECTION CONTRACTORS..........................................18
6.0 TEST COMPLETION CRITERIA.....................................................................................................19 6.1 TEST REPORT.................................................................................................................................19 6.2 TEST CORRECTIONS .......................................................................................................................19 6.3 MINIMUM STABLE LOAD TEST ..........................................................................................................21
7.0 VALVE ISOLATION.........................................................................................................................22
8.0 PERFORMANCE TEST PREPARATION .......................................................................................23 8.1 PRE-TEST ACTIVITIES .....................................................................................................................23 8.2 INSTRUMENTATION ..........................................................................................................................24 8.3 PROVISIONS FOR COLLECTION OF FUEL, ASH, LIME, AND LIMESTONE ................................................24
9.0 OPERATION, SAMPLING AND DATA COLLECTION ..................................................................26 9.1 INITIAL CONDITIONS ........................................................................................................................26 9.2 OPERATING CONDITIONS.................................................................................................................26 9.3 DATA COLLECTION..........................................................................................................................27 9.4 FUEL SAMPLING..............................................................................................................................27 9.5 LIMESTONE SAMPLING.....................................................................................................................29 9.6 LIME SLURRY SAMPLING..................................................................................................................31 9.7 FLY ASH SAMPLING.........................................................................................................................32 9.8 BED ASH SAMPLING ........................................................................................................................34
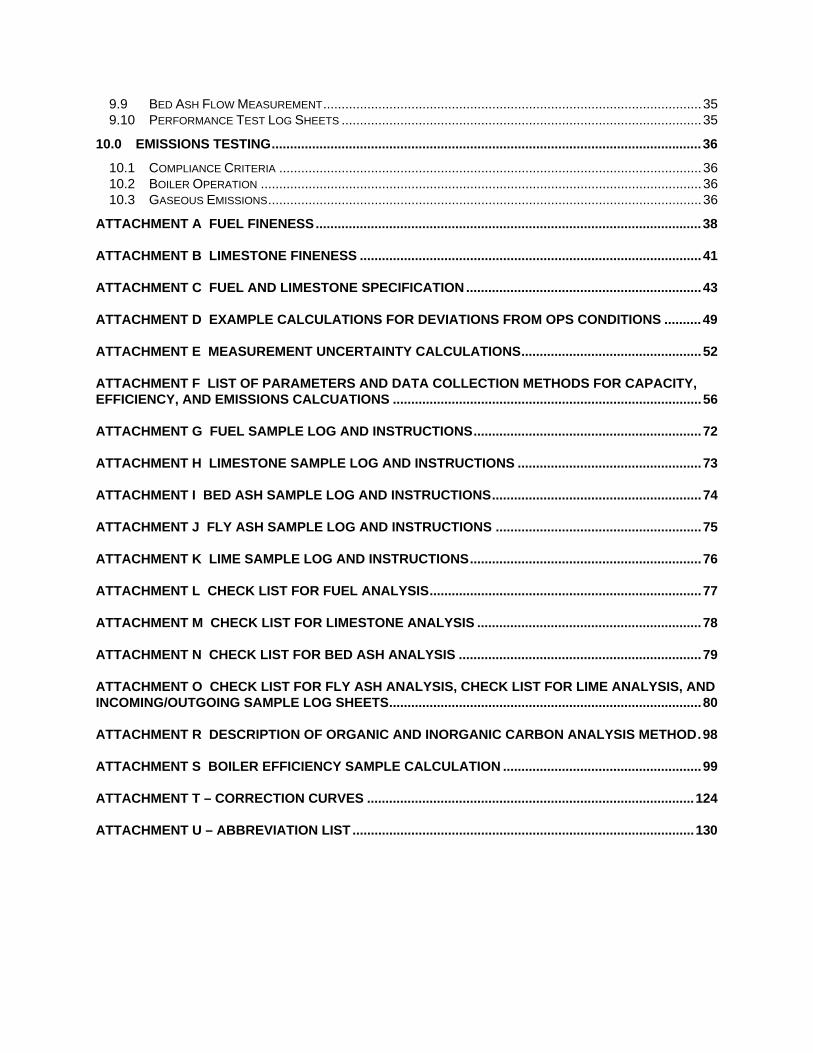
9.9 BED ASH FLOW MEASUREMENT.......................................................................................................35 9.10 PERFORMANCE TEST LOG SHEETS ..................................................................................................35
10.0 EMISSIONS TESTING.....................................................................................................................36 10.1 COMPLIANCE CRITERIA ...................................................................................................................36 10.2 BOILER OPERATION ........................................................................................................................36 10.3 GASEOUS EMISSIONS......................................................................................................................36
ATTACHMENT A FUEL FINENESS.........................................................................................................38
ATTACHMENT B LIMESTONE FINENESS .............................................................................................41
ATTACHMENT C FUEL AND LIMESTONE SPECIFICATION ................................................................43
ATTACHMENT D EXAMPLE CALCULATIONS FOR DEVIATIONS FROM OPS CONDITIONS ..........49
ATTACHMENT E MEASUREMENT UNCERTAINTY CALCULATIONS.................................................52
ATTACHMENT F LIST OF PARAMETERS AND DATA COLLECTION METHODS FOR CAPACITY, EFFICIENCY, AND EMISSIONS CALCUATIONS ....................................................................................56
ATTACHMENT G FUEL SAMPLE LOG AND INSTRUCTIONS..............................................................72
ATTACHMENT H LIMESTONE SAMPLE LOG AND INSTRUCTIONS ..................................................73
ATTACHMENT I BED ASH SAMPLE LOG AND INSTRUCTIONS.........................................................74
ATTACHMENT J FLY ASH SAMPLE LOG AND INSTRUCTIONS ........................................................75
ATTACHMENT K LIME SAMPLE LOG AND INSTRUCTIONS...............................................................76
ATTACHMENT L CHECK LIST FOR FUEL ANALYSIS..........................................................................77
ATTACHMENT M CHECK LIST FOR LIMESTONE ANALYSIS .............................................................78
ATTACHMENT N CHECK LIST FOR BED ASH ANALYSIS ..................................................................79
ATTACHMENT O CHECK LIST FOR FLY ASH ANALYSIS, CHECK LIST FOR LIME ANALYSIS, AND INCOMING/OUTGOING SAMPLE LOG SHEETS.....................................................................................80
ATTACHMENT R DESCRIPTION OF ORGANIC AND INORGANIC CARBON ANALYSIS METHOD.98
ATTACHMENT S BOILER EFFICIENCY SAMPLE CALCULATION ......................................................99
ATTACHMENT T – CORRECTION CURVES .........................................................................................124
ATTACHMENT U – ABBREVIATION LIST .............................................................................................130

TABLES Table 1 - REFERENCE FEEDWATER AND STEAM CONDITIONS ..........................................................2 Table 2 - ULTIMATE ANALYSIS OF PERFORMANCE FUEL .....................................................................3 Table 3 - REFERENCE LIMESTONE COMPOSITION................................................................................3 Table 4 - REFERENCE LIME COMPOSITION ............................................................................................4 Table 5 - TEST CHARACTERISTICS ..........................................................................................................5 Table 6 - TEST CORRECTIONS ................................................................................................................19 Table 7 - MEASUREMENT UNCERTAINTY..............................................................................................20
FIGURES Figure 1 - TEST ORGANIZATION CHART ................................................................................................17
JEA Large-Scale CFB Combustion Demonstration Project
Fuel Capability Demonstration Test Protocol p-1
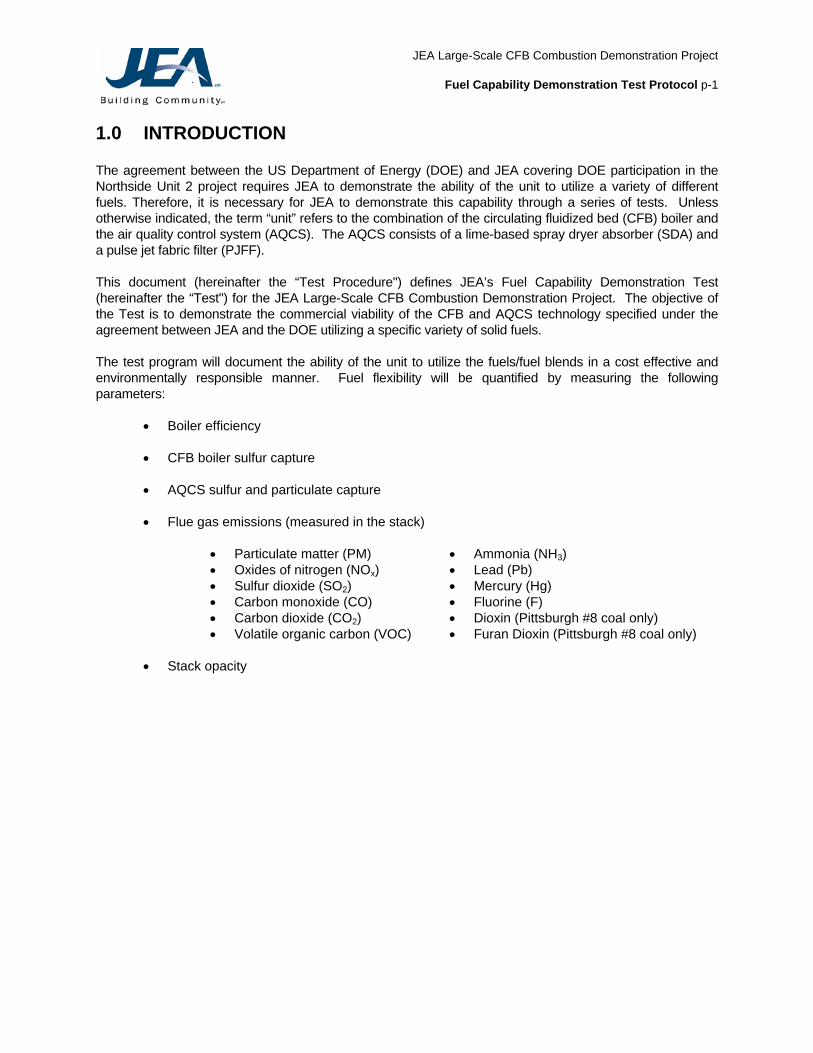
1.0 INTRODUCTION The agreement between the US Department of Energy (DOE) and JEA covering DOE participation in the Northside Unit 2 project requires JEA to demonstrate the ability of the unit to utilize a variety of different fuels. Therefore, it is necessary for JEA to demonstrate this capability through a series of tests. Unless otherwise indicated, the term “unit” refers to the combination of the circulating fluidized bed (CFB) boiler and the air quality control system (AQCS). The AQCS consists of a lime-based spray dryer absorber (SDA) and a pulse jet fabric filter (PJFF).
This document (hereinafter the “Test Procedure") defines JEA’s Fuel Capability Demonstration Test (hereinafter the “Test") for the JEA Large-Scale CFB Combustion Demonstration Project. The objective of the Test is to demonstrate the commercial viability of the CFB and AQCS technology specified under the agreement between JEA and the DOE utilizing a specific variety of solid fuels.
The test program will document the ability of the unit to utilize the fuels/fuel blends in a cost effective and environmentally responsible manner. Fuel flexibility will be quantified by measuring the following parameters:
• Boiler efficiency
• CFB boiler sulfur capture
• AQCS sulfur and particulate capture
• Flue gas emissions (measured in the stack)
• Particulate matter (PM) • Ammonia (NH3) • Oxides of nitrogen (NOx) • Lead (Pb) • Sulfur dioxide (SO2) • Mercury (Hg) • Carbon monoxide (CO) • Fluorine (F) • Carbon dioxide (CO2) • Dioxin (Pittsburgh #8 coal only) • Volatile organic carbon (VOC) • Furan Dioxin (Pittsburgh #8 coal only)
• Stack opacity

JEA Large-Scale CFB Combustion Demonstration Project
Fuel Capability Demonstration Test Protocol p-2
2.0 BOILER DESIGN PARAMETERS 2.1 Feedwater and Steam Conditions
Table 1, shown below, describes the steam and feedwater conditions expected during the execution of the Test. Any deviation from these conditions observed during the Test will be identified and the impact described.
Table 1 - REFERENCE FEEDWATER AND STEAM CONDITIONS
Main Steam (Turbine Inlet)
Maximum-Continuous Rating (MCR)
Flow (lb/hr) 1,993,591 Pressure (psig) 2,500 Temperature (°F) 1,000
Reheat Steam (Turbine Inlet) Flow (lb/hr) 1,773,263 Pressure (psia) 547.7 Temperature (°F) 1,000
Reheat Steam (HP Turbine Exhaust) Flow (lb/hr) 1,773,263 Pressure (psia) 608.6 Enthalpy (Btu/lb) 1304.5
Feedwater to Economizer Temperature (°F) 487.5
2.2 Performance Fuel Specifications 2.2.1 Fuel Composition
Fuel flexibility testing shall be performed in four distinct test periods while burning four different fuel/fuel blends. The design analysis for the fuel/fuel blends to be examined during the operational test periods is as shown in Table 2 below. Fuel blend ratios are on a percent mass basis. Complete analysis is included in Attachment C.

JEA Large-Scale CFB Combustion Demonstration Project
Fuel Capability Demonstration Test Protocol p-3
Table 2 - ULTIMATE ANALYSIS OF PERFORMANCE FUEL (AS-RECEIVED)
Pittsburgh 8
80/20 Blend Petroleum Coke/
Pittsburgh 8
50/50 Blend Pet Coke/
Pittsburgh 8
Illinois 6 Carbon % 68.6 76.92 73.8 64.48 Hydrogen % 4.6 3.8 4.1 4.40 Sulfur % 3.3 6.02 5 2.71 Nitrogen % 1.3 1.06 1.15 1.24 Chlorine % 0.09 0.02 0.05 0.15 Oxygen % 4.11 1.06 2.20 7.34 Ash % 12.8 2.88 6.6 8.57 Moisture % 5.2 8.24 7.1 11.11 HHV (Btu/lb) 12,690 13,738 13,345 11,603
2.2.2 Fuel Size Distribution
There shall be no performance adjustment for fuel size, but the as-fired material shall be within the specified design range (see Attachment A). The size distribution shall be based on dry sieve analysis in accordance with ASTM D 4749.
2.3 Performance Limestone Specifications 2.3.1 Limestone Composition
The Limestone to be utilized during the execution of the Test is expected to be in accordance with the following table and as shown in Attachment C. Any deviation will be identified and the impact of the deviation described in the subsequent Test Report.
Table 3 - REFERENCE LIMESTONE COMPOSITION
Characteristic
% by Weight. Design Range
CaCO3 92.0 85.0 – 99.0 MgCO3 3.0 0.2 – 5.0 Inerts 4.0 Max = 15.0 Total Moisture* 1.0 Max = 10.0** * Includes inherent, surface and residual moisture ** 10% is the maximum as received moisture content in the limestone – it is dried to a design value of 1% moisture in the limestone preparation system prior to injection into the boiler
2.3.2 Limestone Size Distribution
There shall be no performance adjustment for limestone size, but the limestone injected into the boiler shall be compared with the specified design range (See Attachment B). The size distribution shall be based on dry sieve analysis in accordance with ASTM D 4749.
JEA Large-Scale CFB Combustion Demonstration Project
Fuel Capability Demonstration Test Protocol p-4
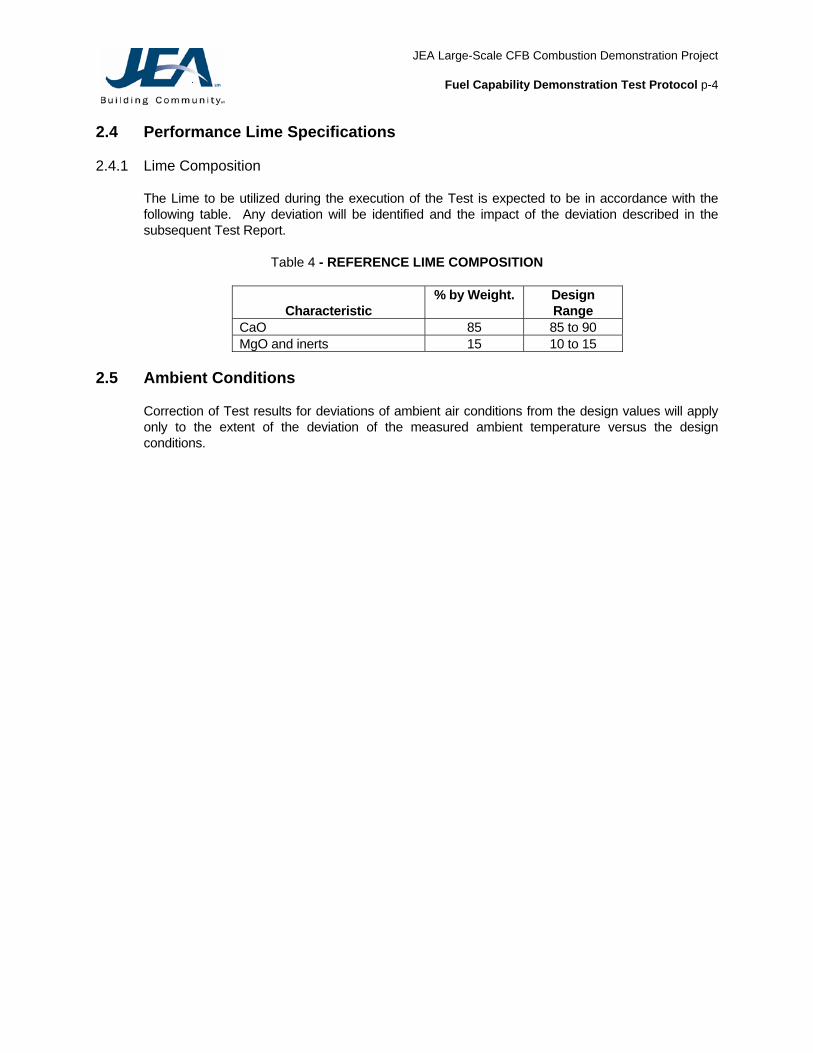
2.4 Performance Lime Specifications 2.4.1 Lime Composition
The Lime to be utilized during the execution of the Test is expected to be in accordance with the following table. Any deviation will be identified and the impact of the deviation described in the subsequent Test Report.
Table 4 - REFERENCE LIME COMPOSITION
Characteristic % by Weight. Design
Range CaO 85 85 to 90 MgO and inerts 15 10 to 15
2.5 Ambient Conditions
Correction of Test results for deviations of ambient air conditions from the design values will apply only to the extent of the deviation of the measured ambient temperature versus the design conditions.
JEA Large-Scale CFB Combustion Demonstration Project
Fuel Capability Demonstration Test Protocol p-5
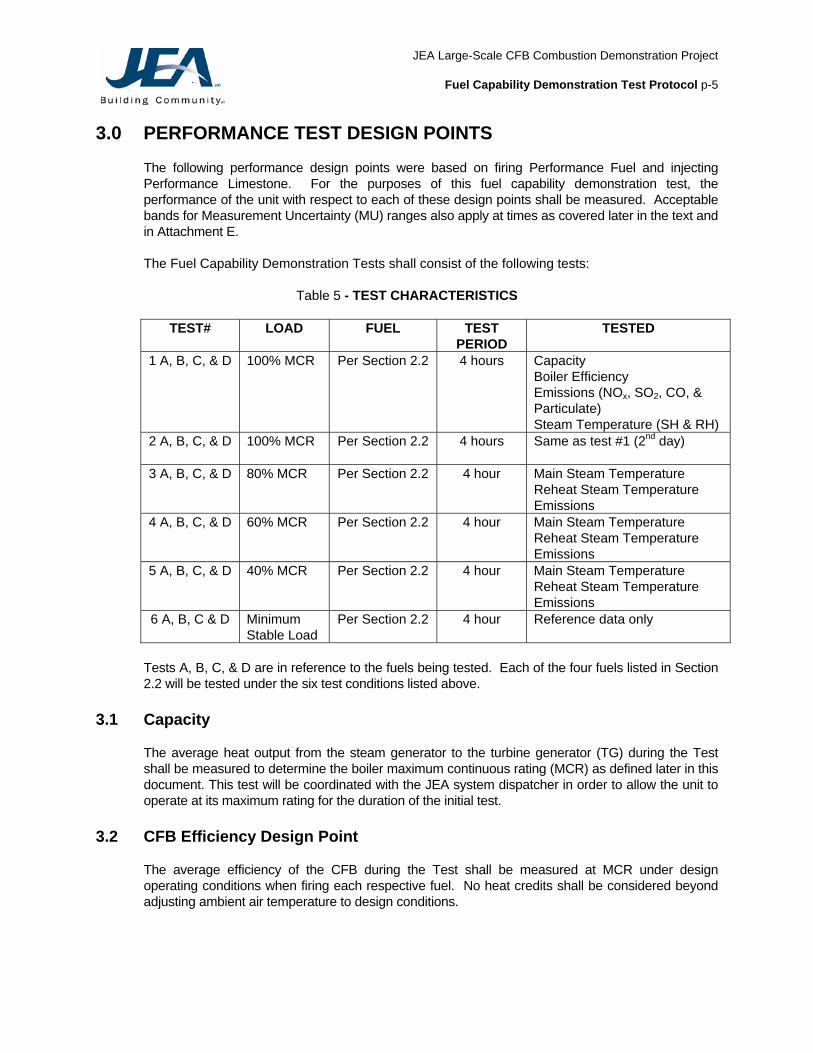
3.0 PERFORMANCE TEST DESIGN POINTS The following performance design points were based on firing Performance Fuel and injecting Performance Limestone. For the purposes of this fuel capability demonstration test, the performance of the unit with respect to each of these design points shall be measured. Acceptable bands for Measurement Uncertainty (MU) ranges also apply at times as covered later in the text and in Attachment E.
The Fuel Capability Demonstration Tests shall consist of the following tests:
Table 5 - TEST CHARACTERISTICS
TEST# LOAD FUEL TEST
PERIOD TESTED
1 A, B, C, & D 100% MCR Per Section 2.2 4 hours Capacity Boiler Efficiency Emissions (NOx, SO2, CO, & Particulate) Steam Temperature (SH & RH)
2 A, B, C, & D 100% MCR Per Section 2.2 4 hours Same as test #1 (2nd day)
3 A, B, C, & D 80% MCR
Per Section 2.2 4 hour Main Steam Temperature Reheat Steam Temperature Emissions
4 A, B, C, & D 60% MCR Per Section 2.2 4 hour Main Steam Temperature Reheat Steam Temperature Emissions
5 A, B, C, & D 40% MCR Per Section 2.2 4 hour Main Steam Temperature Reheat Steam Temperature Emissions
6 A, B, C & D Minimum Stable Load
Per Section 2.2 4 hour Reference data only
Tests A, B, C, & D are in reference to the fuels being tested. Each of the four fuels listed in Section 2.2 will be tested under the six test conditions listed above.
3.1 Capacity
The average heat output from the steam generator to the turbine generator (TG) during the Test shall be measured to determine the boiler maximum continuous rating (MCR) as defined later in this document. This test will be coordinated with the JEA system dispatcher in order to allow the unit to operate at its maximum rating for the duration of the initial test.
3.2 CFB Efficiency Design Point
The average efficiency of the CFB during the Test shall be measured at MCR under design operating conditions when firing each respective fuel. No heat credits shall be considered beyond adjusting ambient air temperature to design conditions.
JEA Large-Scale CFB Combustion Demonstration Project
Fuel Capability Demonstration Test Protocol p-6
3.3 Emissions Design Point
The Unit 2 AQCS consists of a single SDA and a multi-compartment PJFF. The SDA has sixteen independent dual-fluid atomizers. The fabric filter has eight isolatable compartments. The AQCS system also uses reagent preparation and byproduct handling subsystems. The SDA byproduct solids/fly ash (herein after referred to as fly ash) collected by the PJFF is pneumatically transferred from the PJFF hoppers to either the Unit 2 fly ash silo or the Unit 2 AQCS recycle bin. Fly ash from the recycle bin is slurried and reused as the primary reagent by the SDA spray atomizers. The reagent preparation system converts quicklime (CaO), which is delivered dry to the station, into a hydrated lime [Ca(OH)2] slurry, which is fed to the atomizers as a supplemental reagent.
It is intended that during the flexibility tests, all sixteen SDA atomizers will be in service at all times; however, on-line replacement of any atomizer that fails during a test will not be sufficient cause for aborting a test. Normal on-line maintenance to all equipment will be performed during the test program. Installed spares may be used during a component failure, but may not be used to supplement normally operating equipment.
The fabric filter is designed for either on-line or off-line filter bag cleaning with one compartment out of service. Therefore, isolation of one compartment for maintenance will not be sufficient cause for aborting a test. Normal on-line maintenance of all fabric filter components will be performed during the test program. Installed spares may be used during a component failure, but may not be used to supplement normally operating equipment.
The reagent preparation subsystem, including the fly ash recycle equipment, will operate throughout the test. The operation of the AQCS, including the amounts of lime and fly ash recycle used and filter bag cleaning, will be automatically regulated by the AQCS control system to meet the air quality permit’s SO2 emission and opacity limits.
3.3.1 NOx / SO2 / Particulate Emission Design Points
The following gaseous emissions shall be measured for each 4-hour interval during the Test (EPA Permit averaging period).
a. Nitrogen oxides (NOx) in the flue gas are expected to be less than 0.09 lb/MMBtu HHV
fuel heat input. The hourly average lb/MMbtu value reported by the Continuous Emissions Monitoring (CEM) system shall be used as the measure of NOx in the flue gas over the course of each fuel test.
b. Sulfur dioxide (SO2) in the flue gas out of the air heater is expected to be not over 0.939
lb/MMbtu when firing performance petroleum coke and not over 0.183 lb/MMBtu when firing performance coal. The SO2 emissions from the stack during the execution of the Tests are expected to be less than 0.015 lb/MMBtu. The hourly average lb/MMbtu value reported by the CEM shall be used as the measure of SO2 emissions for each respective fuel test.
c. Solid particulate matter in the flue gas at the baghouse outlet is expected to be
maintained at less than 0.011 lb/MMBtu HHV fuel heat input, based on EPA Method 17 or Method 5.

JEA Large-Scale CFB Combustion Demonstration Project
Fuel Capability Demonstration Test Protocol p-7
3.3.2 CO Emissions Design Point Carbon monoxide (CO) in the flue gas is expected to be less than or equal to 0.22 lb/MMBtu HHV fuel heat input at 100% MCR. This design point applies when firing Performance Coke or Performance Coal and shall be measured for each respective test.
3.3.3 SO3 Emissions Design Point Sulfur Trioxide (SO3) in the flue gas is assumed to be zero. No testing will be done for SO3. See Section 4.2.3 for rationale.
3.3.4 NH3/ Lead/ Mercury/ Fluorine Emissions Design Points NH3, Lead, Mercury, and Fluorine gaseous emissions shall be measured for each 4-hour interval during the Test (EPA Permit averaging period). Quantities in the flue gas and removal efficiency expectations are unknown and will be determined by testing at the 100% load point only. Mercury sampling and analysis will be performed at the inlet to the AQCS system in addition to the sample taken at the stack. Lead, ammonia and Fluorine will be sampled only at the stack.
3.3.5 Dioxin and Furan Emissions Design Points Dioxin and Furan gaseous emissions shall be measured for each 4-hour interval during the Test (EPA Permit averaging period) for 100% Pittsburgh 8 (Pitt 8) coal only. Quantities in the flue gas and removal efficiency expectations are unknown and will be determined by testing at the 100% load point only.
3.3.6 Opacity
The opacity shall not exceed 10% over a six minute block average.
3.4 Steam Temperature Design Point The average steam temperatures during the Test shall be within the limits described in the following sections. The average of the readings recorded every minute shall be determined to be the Test average:
a. Main steam temperature 1000 °F +10/-0 °F at the turbine throttle valve inlet from 75 to 100% of turbine MCR and 1000 °F +/-10 °F at the turbine throttle valve inlet from 60 to 75% of turbine MCR.
b. Hot reheat steam temperature 1000 °F +10/-0 °F at the turbine intercept valve inlet from
75 to 100% of turbine MCR and 1000 °F +/-10 °F at the turbine intercept valve inlet from 60 to 75% of turbine MCR.
3.5 Calcium to Sulfur (Ca:S) Ratio Design Point
The average calcium to sulfur molar ratio during the Test is expected to not exceed 2.093 while firing the pet coke blends and 2.88 when firing coal only and injecting Performance Limestone while meeting the SO2 emission design value.
JEA Large-Scale CFB Combustion Demonstration Project
Fuel Capability Demonstration Test Protocol p-8
3.6 Minimum Stable Load Demonstration The minimum stable operating load without firing startup fuel will be demonstrated. No performance calculations or test corrections will be provided from this test. Reference data will be gathered using the plant PI data historian. This will include all of the data points shown in Table F-3. Valve isolation will not be required during this test. The operator will be allowed to take what ever actions are necessary to safely maintain a stable load on the unit with the exception of utilization of start up fuel. It is expected that this test will be demonstrated by the 40% MCR test.
JEA Large-Scale CFB Combustion Demonstration Project
Fuel Capability Demonstration Test Protocol p-9
4.0 FUEL DEMONSTRATION TEST CALCULATION PROCEDURES 4.1 Capacity
The capacity of the boiler shall be calculated in terms of percent of the MCR design heat output as described below. Note that this is a delivered thermal power criterion and not a temperature or pressure design point. The former parameter is covered by the Steam Temperature design point, and the latter one is set by the feedwater supply system.
4.1.1 Calculation Method and Measurement Instrumentation
% MCRAS-MEASURED = 100 * ((WMS *(HMS-hFW) + WRH * (HHRH - HCRH)) / ((1,993,591 x (1457.111 - 470.491) + 1,773,000 x (1521.647 - 1303.793)) = (WMS * (HMS - hFW) + WPS * (HPS - hFW) + WRH * (HHRH - HCRH)/2,353,171,429
Where: HCRH = Cold reheat steam enthalpy at the boiler outlet, Btu/lb*
hFW = Feedwater enthalpy entering the economizer, Btu/lb HHRH = Hot reheat steam enthalpy at the boiler outlet, Btu/lb* HMS = Main steam enthalpy at the boiler outlet, Btu/lb* WMS = Main steam flow, lb/hr, = feedwater flow to CFB (QF-34-FT-501) +
SH attemperation water (QF-34-FT-500), i.e. all vents, drains, blowdowns and bypasses closed
WRH = Reheat steam flow, lb/hr, = Main steam flow - (TG leak-offs (TG Manufacturer’s data) + extraction to top (#1) heater** + RH attemperation water (FI-0546)
* = ASME steam tables will be used in all cases to determine enthalpy values (1967 revision is referenced as the document of record). ** = Determined by heat balance, i.e. feedwater flow x enthalpy rise per lb = extraction flow x enthalpy loss per lb, all measurements using plant instrumentation except as noted later in this document. That is,
WFWH (feedwater flow at heaters) = QF-34-FT-501 (feedwater to CFB) + QF-34-FT-500 (SH attemperation) + SE-34-FT-582 (RH attemperation), and
WEXTR1 = WFWH * (h#1OUTFW - h#1INFW) / (HEXTR1 - h#1DRN) Where:
WFWH = feedwater flow at heaters h#1OUTFW = BFW enthalpy at heater #1 outlet h#1INFW = BFW enthalpy at heater #1 inlet WEXTR1 = Extraction flow to heater #1 HEXTR1 = Enthalpy of extraction to #1 heater h#1DRN = Enthalpy of drain from #1 heater
JEA Large-Scale CFB Combustion Demonstration Project
Fuel Capability Demonstration Test Protocol p-10
The formula presented above ignores differences between water temperatures at the economizer inlet, superheater spray and reheat spray locations, which should be minimal since these streams all are drawn from downstream of the top heater outlet.
4.1.2 Corrections
MCRCORR shall be used for Test capacity design point compliance purposes, being MCRAS-MEASURED with adjustment for deviations from design operating conditions (ref. Section 6.2.1, Attachment D and mutually agreed MU per section 6.2.4). The main steam flow calculation will be based on CFB feedwater flow measurement as described above rather than the TG first-stage shell pressure criterion for the purpose of minimizing MU.
4.1.3 Frequency, Averaging and Interpretation of Measurements
The data of Attachment F, Table F-3 shall be logged continuously for instruments tied to the DCS, and manually obtained readings shall be logged every 30 minutes or more frequently if required by the Test Manager. Samples and performance data shall be obtained as specified in the related portions of this Procedure.
MCRAS-MEASURED and MCRCORR data points for the purpose of ultimately determining the average capacity attained during the Test shall be calculated for the Test period specified. Average readings shall be used for each parameter involved in determining the four-hour MCR data.
The individual data points recorded in this fashion will be documented by the Test Coordinator at the end of each test. A written acknowledgement of stable conditions will be signed-off by the Test Coordinator at the end of each test to acknowledge the stabilized test conditions. This documentation will then be provided to the Test Manager.
4.2 Efficiency 4.2.1 Calculation Method
The boiler efficiency calculation method utilized shall be the abbreviated heat loss method as defined by ASME Power Test Code (PTC) 4.1 (1974, reaffirmed 1991), modified to account for the heat of calcination and sulfation. The heat losses, which are included, are:
• Heat loss due to heat in dry flue gas • Heat loss due to moisture in "as fired" fuel • Heat loss due to moisture from the combustion of hydrogen in the fuel • Heat loss due to unburned carbon in Bed Ash • Heat loss due to unburned carbon in flyash • Heat loss due to radiation • Heat loss/gain due to calcination/sulfation • Heat loss due to moisture in air

JEA Large-Scale CFB Combustion Demonstration Project
Fuel Capability Demonstration Test Protocol p-11
• Heat loss due to sensible heat in Bed Ash leaving boiler (outlet of rotary valve) • Heat loss due to sensible heat in flyash at airheater outlet
The ASME calculation procedure has been modified slightly to account for process differences between conventional and fluidized bed boilers (i.e., limestone addition). These modifications account for difference in the dry gas quantity and additional heat loss/gain due to calcination/sulfation. The additional/modified calculation procedures to be used are described below.
4.2.2 Dry Gas Quantity
This parameter is conventionally calculated by deriving the lbs of dry gas/lb of carbon burned from measured oxygen and multiplying it by lb of carbon burned/lb of fuel fired. The resultant quantity is the lbs of dry gas per lb of fuel fired. Two factors complicate this approach for fluidized bed boilers. First, a noticeable amount of CO2 is evolved from the calcination of the limestone. Second, the sulfation reaction removes part of the SO2 and O2 from the flue gas. To account for these factors, the following method has been derived for calculating the dry gas quantity:
lb Dry Gas lb As-Fired (A.F.) Fuel
=Cb' * MWCO2 (CO2)+MWO2(O2)+MWN2(N2)+MWCO(CO)+MWSO2(SO2) MWC (CO2+CO) = Cb' * 44.01(CO2)+32(O2)+28.02(N2)+28.01(CO)+64.06(SO2) 12.01 (CO2+CO) Where:
CO2, CO, O2, N2 and SO2 are the volumetric concentrations (in percent) in the dry flue gas at the airheater outlet
MWX = Molecular weight of respective elements Cb' = Cb + Wl x Cx
Wfe Cx = MWC(CaCO3) + MWC(MgCO3) = lb Carbon
MWCaCO3 MWMgCO3 lb limestone
12.01(CaCO3) + 12.01(MgCO3) = lb Carbon 100.09 84.32 lb limestone Wl = Limestone feed rate (lb/hr) Wfe = Fuel feed rate (lb/hr) Cb = Pounds of carbon per pound of “as-fired” fuel
Cb' = Total equivalent carbon including limestone carbon per pound of fuel
JEA Large-Scale CFB Combustion Demonstration Project
Fuel Capability Demonstration Test Protocol p-12
4.2.3 Percent SO2 Removal in CFB
Determination of the amount of SO2 removal in the CFB is necessary for the calculation of the heat of sulfation. The process control continuous emissions analyzer located at the inlet to the AQCS equipment will provide the amount of SO2 in the flue gas in lb/MMbtu and ppm. The amount of fuel fired can be calculated by an iterative process by using the gravimetric feeder data as the starting condition for the iteration. The amount of SO2 formed from combustion of the fuel can be determined readily from the ultimate analysis of the fuel. During the 100% MCR tests the O2 and SO2 content of the flue gas at the SDA inlet will be measured by stack testing methods. This data will be used in place of plant analyzer data. With this data a correlation between O2 and SO2 instrumentation and stack test results will be developed and applied to the readings from the installed O2 and SO2 analyzers. The readings from the installed analyzers will be used with the correction factor on the 40%, 60% and 80% MCR tests The CFB boiler capture is defined as the fraction of the total sulfur input to the boiler from the fuel that leaves the boiler as either gaseous SO2 or SO3. Although sulfur also leaves the CFB boiler as part of the fly ash, for purposes of these calculations, this fraction of the fuel sulfur input will be considered to have been captured in the boiler.
The SO3 level in the flue gas leaving a CFB boiler is generally very low (2 ppmdv) because of the reaction between SO3 and calcium in the bed reagent. In addition, when a selective non-catalytic reduction system (SNCR) is used for control of NOx emissions, this low level of SO3 is extremely difficult to accurately measure. The residual ammonia from the SNCR system reacts with the SO3 to form ammonium bisulfate in the test probes. As a result of its expected low concentration and difficulty in accurate measurement, SO3 term will be neglected in the boiler sulfur capture calculation.
The calculation procedure is as follows:
SO2, lb/hr from = Wfe as-fired fuel * Sf * 64.06 Combustion 32.06 Sf = Wt. fraction of sulfur in fuel, as-fired SO2, lb/hr = WSO2 (From CEM or Stack Test Data) flue gas Fractional SO2 Removal = 1 - WSO2 (XSO2) Wfe * Sf * 64.06 32.06
4.2.4 Heat Loss Due to Calcination/Sulfation
The limestone fed to the furnace undergoes an endothermic reaction (requires heat addition) known as calcination prior to reacting with the SO2 in an exothermic reaction known as sulfation. The reactions involved in the calcination step can be written as follows:
Calcium Carbonate (h = 785.87 Btu/lb of CaCO3) CaCO3(s) CaO(s) + CO2(g) Magnesium carbonate (h = 512.61 Btu/lb of MgCO3)

JEA Large-Scale CFB Combustion Demonstration Project
Fuel Capability Demonstration Test Protocol p-13
MgCO3(s) MgO(s) + CO2(g) The heats of reaction were calculated from standard heats of formation listed in Perry's Chemical Engineers Handbook (Sixth Edition).
The limestone calcination heat loss can, therefore, be calculated as follows:
Heat loss due to calcination, Btu/lb A.F. fuel = lb limestone * (CaCO3 * 785.87 + MgCO3 * 512.61) lb A.F. Fuel Where: CaCO3 = wt. fraction CaCO3 in limestone MgCO3 = wt. fraction MgCO3 in limestone
The lime (CaO) formed from the calcination of limestone reacts with part of the SO2 in the flue gas to form calcium sulfate (CaSO4) accompanied by an evolution of heat (exothermic reaction). The reaction can be expressed as follows:
CaO(s) + SO2(g) + ½O2(g) CaSO4(s)
h = -1534.9 Btu/lb of CaSO4
The heat of reaction was calculated from the same data source and in the same manner as the heat of calcination stated above. It is obvious from the above reaction that the amount of CaSO4 formed is related to the amount of SO2 removal. Therefore, the heat gain from sulfation can be calculated as:
Heat gain due to Sulfation, Btu/lb A.F. Fuel = Sf * XSO2 * MWCaSO4 * 1534.9 MWS = Sf * XSO2 * 136.12 * 1534.9 32.06 where: Sf = Wt. fraction of sulfur in fuel, as-fired
The net heat loss due to the calcination/sulfation reaction is calculated as follows: Btu = Heat Loss - Heat Gain lb A.F. Fuel due to Calcination due to Sulfation
4.2.5 Radiation Loss
The radiation loss used in the calculation will be 0.18%, based on Figure 8 of PTC 4.1.
4.2.6 Corrections and Measurement Uncertainty Values
The efficiency as calculated above shall be termed "as-measured". Corrections for deviations from design-point operating conditions shall be applied per section 6.2.1 below, in addition to which the acceptance band shall be expanded by measurement uncertainty effects per part 6.2.4 (Attachment E).
JEA Large-Scale CFB Combustion Demonstration Project
Fuel Capability Demonstration Test Protocol p-14
Corrected efficiency values within this range of the design point will be deemed to demonstrate the ability to utilize the specific fuel. Corrected efficiency which falls below the range identified will be noted in the test report.
4.2.7 Frequency, Averaging and Interpretation of Measurements
Data collection and interpretation shall be the same as described in section 4.1.3 above.
4.3 Flue Gas Emissions 4.3.1 Sequence of Testing and Averaging of Readings
The CEM Certification Test has already been performed and documented. Therefore, data from the certified and calibrated CEM system shall be used for the as-tested emissions design point compliance purposes. The exception is particulate matter which will be measured using PM testing at full load and opacity on part loads. PM will be measured by EPA test methods at full load only, and related to opacity. That relationship will be used to infer PM from opacity measurements for the part load tests. Test data shall be averaged for all parameters including opacity to produce (approximately) every-four-hours data points for Test reporting (EPA reporting period). MU shall not apply for CEM based emissions guarantee compliance demonstrations since the certification procedure for these items includes the applicable bias and precision analyses. Official data points shall be promptly signed-off by the Test Manager after each run. The final values for CEM measured emissions reporting purposes shall be the average of the acceptable four-hour data points accumulated during the test period.
4.3.2 Stack Emissions
a. Nitrogen Oxides The CEMS readout will be used to demonstrate compliance with the NOx emission design point.
b. Sulfur Oxides The AQCS sulfur capture is a measure of SO2 and SO3 removal that occurs between the inlet to SDA module and the outlet of the PJFF. For the same reasons discussed above, SO3 in the flue gas is very difficult to accurately measure. Therefore, SO3 will be neglected in the determination of AQCS sulfur capture and the following equation will be used.
%100)(2
)(2)(2)( ×
−=
inlet
stackinletAQCS SO
SOSOCaptureS
Where: S Capture(AQCS) = Sulfur capture by the AQCS, % SO2(inlet) = SO2 in the AQCS inlet (lb/MBtu) SO2(stack) = SO2 in the stack (lb/MBtu)
JEA Large-Scale CFB Combustion Demonstration Project
Fuel Capability Demonstration Test Protocol p-15
The flue gas SO2 content at the AQCS inlet and in the stack is continuously monitored by plant instrumentation in those locations. The existing data logging equipment continuously calculates and records SO2 removal between these two points.
The data from the CEMS readout will be used to demonstrate compliance with the SO2 emissions design point. Note the SO2 measurement at the AQCS inlet does not go to the CEM; it goes directly to the DCS.
c. Carbon Monoxide
The CEMS readout will be used to demonstrate compliance with the CO emission design point.
4.3.3 Particulates Design Point
A one time test for particulate loading at the outlet of the baghouse will be done utilizing EPA Method 17 or Method 5 of Attachment A to Part 60 of the Federal Register. This particulate test shall consist of a minimum of three sampling runs. The average of these three sampling runs shall be used for determining the compliance with the particulate emissions design point. The particulate test shall be performed on any one day mutually agreed upon or concurrent with the two(2) 4-hour performance tests at MCR. PM will be measured by EPA test methods at full load only and related to opacity. That relationship will be used to infer PM from opacity measurements for the part load tests.
4.3.4 Type and Frequency of Testing
The method and frequency of data collection shall be based on the CEMS.
4.4 Steam Temperature 4.4.1 Measurement Location and Averaging of Readings
Measurements shall be taken using the following permanently installed instrumentation:
• Main steam at SH Outlet: SI-34-TE-556 & 557 • Main Steam at turbine throttle valve inlet: SJ-34-TE-509
• Hot reheat steam at Boiler Outlet: SH-34-TE-510 & 511
• Reheat steam at turbine intercept valve inlet: SJ-34-TE507
4.4.2 Measurement Uncertainty
The Measurement Uncertainty (MU) value applicable for this parameter is specified in 6.2.4.
4.4.3 Frequency, Averaging and Interpretation of Measurements
Data collection and interpretation shall be the same as for the Capacity Test per section 4.1.3 above.

JEA Large-Scale CFB Combustion Demonstration Project
Fuel Capability Demonstration Test Protocol p-16
JEA Large-Scale CFB Combustion Demonstration Project
Fuel Capability Demonstration Test Protocol p-17
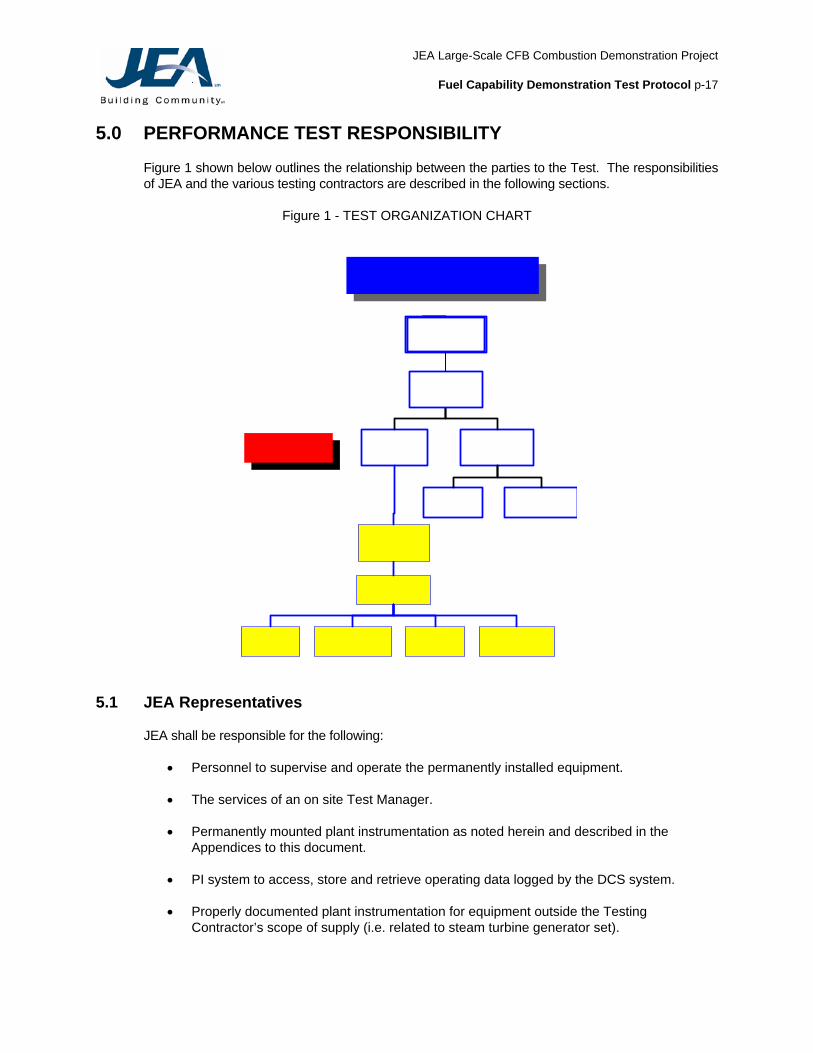
5.0 PERFORMANCE TEST RESPONSIBILITY Figure 1 shown below outlines the relationship between the parties to the Test. The responsibilities of JEA and the various testing contractors are described in the following sections.
Figure 1 - TEST ORGANIZATION CHART
5.1 JEA Representatives JEA shall be responsible for the following:
• Personnel to supervise and operate the permanently installed equipment.
• The services of an on site Test Manager.
• Permanently mounted plant instrumentation as noted herein and described in the Appendices to this document.
• PI system to access, store and retrieve operating data logged by the DCS system. • Properly documented plant instrumentation for equipment outside the Testing
Contractor’s scope of supply (i.e. related to steam turbine generator set).
JEA Large-Scale CFB Combustion Demonstration Project
Fuel Capability Demonstration Test Protocol p-18
• Electricity, fuel, service water, fire fighting water, boiler feedwater, limestone, water treatment chemicals, lube oil and hydraulic oil and any other materials normally required to safely operate the plant.
5.2 Test Coordinator
The Test Coordinator shall be responsible for the following:
• Test Instructions, based on and including this document.
• Preparation and presentation to JEA of a daily report for the purpose of acceptance by JEA
of the previous day’s test data with regard to the stable conditions.
• Technical consultation regarding test conditions, requirements and execution as required by JEA.
• Creation of a critical instruments list defining the specific instruments requiring calibration by
the Test Contractor in order to achieve the measurement uncertainty requirements.
• Final written Test Report.
5.3 Fuel Gas Test/Test Equipment/Sample Collection Contractors The Fuel Gas Test/Test Equipment/Sample Collection Contractor(s) shall be responsible for the following:
• Personnel to technically coordinate with the Test Coordinator for performance of the Test.
Detailed personnel assignments are not covered herein but will be developed prior to the Test.
• Special, temporary instrumentation as required per this procedure (ref. Attachment F). This
includes calibration, installation, operation and removal of the temporary instrumentation at the completion of testing.
• Staff to obtain the samples and the equipment necessary to obtain the samples in
accordance with the appropriate procedures described herein. This includes fuel, ash and limestone samples.
• Third-party laboratory analysis of fuel, limestone, lime, and, ash samples as described in
this procedure.
• Sample containers, labels and shipping.
• Test and Lab Analysis Reports.
• Calibration of installed plant instrumentation as required to meet test uncertainty requirements.

JEA Large-Scale CFB Combustion Demonstration Project
Fuel Capability Demonstration Test Protocol p-19
6.0 TEST COMPLETION CRITERIA 6.1 Test Report
As measured results of the tests on each fuel/fuel blend will be compiled and submitted by the various Test Contractors, to the Test Coordinator and JEA. The as-measured test results will be provided in a draft format to allow the Test Coordinator and JEA the opportunity to review the findings and provide additional comment or input. After a period of review and comment, the Test Contractors will provide a final version of the as-measured test report. The Test Coordinator will review the as-measured test results for completeness, apply test corrections and measurement uncertainties to the as-measured test results, and compare the corrected test results to the design values. The Test Coordinator will prepare a report summarizing the test results on each fuel/fuel blend, and submit it to JEA for review. The Test Coordinator will provide the draft summary report to JEA within ten (10) working days of the receipt of the Flue Gas Test Contractor’s final as-measured test report and laboratory results for each set of tests. A set of tests will consist of all tests associated with each fuel blend. JEA review comments will be due within ten (10) working days of receipt of the draft report. Within five (5) working days of receipt of JEA comments, the final report for that set of tests will be issued by the Test Coordinator to JEA. JEA will then be responsible for submission of the test report to DOE.
6.2 Test Corrections
The following Test Corrections apply in addition to those cited earlier. These corrections will be specifically addressed in the test report. As such they generally will not be available to review immediately after the test.
6.2.1 Corrections for Deviations from Design Operating Conditions
Test results will be corrected to design conditions for variations in operating conditions as described below.
Table 6 - TEST CORRECTIONS
Design Point
Correction for deviation of
Boiler Efficiency Fuel moisture content Fuel hydrogen content Fuel Higher Heating Value Ambient air temperature Moisture in air
Main Steam Flow Feedwater temperature to boiler Main Steam Temp Feedwater temperature to boiler Hot Reheat Steam Temp Cold Reheat Steam temp to boiler
Corrections will be applied where applicable per methods described in ASME PTC 4.1. See Attachment D for sample calculations.
JEA Large-Scale CFB Combustion Demonstration Project
Fuel Capability Demonstration Test Protocol p-20
6.2.2 Duration There shall be two (2) performance tests at 100% MCR (one test per day) each test for a period of four hours duration. Other Performance tests at 80%, 60% and 40% MCR shall be for a period of four hours at each load. Actual time elapsed between tests will depend largely on the need to achieve stabilized operation prior to each test, and the point at which this criterion is satisfied shall be established in each case by the Test Manager. A schedule and test sequence will be developed by the Test Coordinator and provided to the Test Manager for acceptance. This test schedule will take into account each of the following.
• the duration of each test • the required stabilization time between tests • JEA system dispatch needs • work schedules and relief needs of the testing staff • the probability of extending selected tests to ensure stable operating conditions (see
Section 6.2.3 below) Based on the above, the execution of the full set of tests on each fuel/fuel blend is expected to require approximately six (6) working days, plus an additional three (3) days of operation on the test fuel prior to the start of the tests to “season” the boiler on the test fuel.
6.2.3 Upsets
Operating upsets or deviations from normal, steady-state conditions which are experienced during the Test, such as feeder pluggages, or feedwater changes (but not equipment failures, ref. section 3 above) shall be recorded and removed from the pertinent four-hour-averaged Test data. If more than two cumulative hours must be removed from the four-hour-averaged results the test shall be repeated. If the cumulative time to be removed is less than two hours the test duration shall be extended such that four hours of data are available. Tests can be extended at the Test Manager’s discretion in order to achieve acceptable test conditions.
6.2.4 Measurement Uncertainty
Based on the review of the instrumentation planned for use during the Test, the following MU values will apply for the Test:
Table 7 - MEASUREMENT UNCERTAINTY Boiler Efficiency + / - 0.90% Capacity (Main steam flow) + / - 1.90% Main Steam Temperature + / - 0.50% Reheat Steam Temperature + / - 0.50%

JEA Large-Scale CFB Combustion Demonstration Project
Fuel Capability Demonstration Test Protocol p-21
6.3 Minimum Stable Load Test The test corrections noted above are not applicable to the Minimum Stable Load Test. Therefore the report will provide documentation of the achievement of minimum load and commentary on the specific load and conditions observed during the test.

JEA Large-Scale CFB Combustion Demonstration Project
Fuel Capability Demonstration Test Protocol p-22
7.0 VALVE ISOLATION The performance test must be performed under isolated conditions as follows:
• The turbine bypass valves (12PV-509 and 12PV-507) must be closed (but available for automatic operation) as well as the bypass spray control and block valves (12F-517, 12TV-537, 12FV-540, AND 12TV-510).
• All boiler, main steam, cold reheat, hot reheat, and feedwater startup vents and drains must
be closed.
• The boiler mass and continuous blowdown valves shall be closed (BK-14-694, BK-14-695, and BK-14-770).
• The boiler economizer recirculation valves shall be closed (BK-12-510 and BK-12-512).
• Reheat temperature shall be controlled by the gas biasing dampers and the reheat spray
control and block valves shall be closed (SE12-FV-550 & SE12-TV-550) but available for automatic operation.
• Feedwater Heater #1 bypass valve shall be closed but available for automatic operation.
• The sootblowing system shall NOT be isolated. However, sootblowing during the test
should be limited as described in section 9.2.
The remainder of the system valves shall be maintained in their normal operational valve position for the test. A plant walk-down is recommended prior to the test to confirm the valves to be closed for isolation.
JEA Large-Scale CFB Combustion Demonstration Project
Fuel Capability Demonstration Test Protocol p-23
8.0 PERFORMANCE TEST PREPARATION Appropriate preparatory tasks shall be completed prior to Test commencement. Since some of these preparations require the scheduling of services and equipment from outside firms, ample lead-time should be allowed to accomplish these requirements.
8.1 Pre-Test Activities
The following activities shall be completed prior to the Test. Unless stated to the contrary, the Test Manager will verify and document each of the following.
1. A tentative schedule will be determined by the Test Coordinator. This tentative test
schedule will be reviewed and approved by the Test Manager. Once approved, this schedule will be communicated to the Test Contractor (through the Test Coordinator), any sub-contractors, JEA system dispatching, and the DOE. The tentative schedule will be completed and communicated at least two (2) calendar weeks in advance of the commencement of the Test.
2. Final Notification of the Test and Test arrangements will be provided by the Test Manager to the Test Coordinator no later than two (2) days prior to the commencement of the Test.
3. The unit shall be operated by JEA using the appropriate test fuel or fuel blend for at least
seventy-two (72) hours prior to the beginning of the test stabilization period.
4. The boiler shall be operated by JEA at higher than 95% MCR load to maintain a substantially stabilized heat output and process conditions for at least five (5) hours immediately prior to the start of the Test. During this stabilization period, major operating parameters of concern as listed below shall be monitored via the plant data historian:
• Steam flow • Feedwater flow • Fuel flow • Limestone flow • Emissions (SO2, NOx, CO) • Bed temperature • Cyclone inlet temperature • Bed pressure • Bed ash flow rate
The Test Coordinator will verify the above major operating parameters are stabilized. Notification of such will be provided to the Test Manager by the Test Coordinator.
JEA Large-Scale CFB Combustion Demonstration Project
Fuel Capability Demonstration Test Protocol p-24
5. Verify that the data collection program (PI) for collecting test data obtained from plant
instruments monitored by the plant DCS system is operating. Such verification will include the data listed in Section 9 and Attachment F.
6. As a minimum, a ten (10) day supply of the test fuel should be available prior to the Test to
ensure an adequate supply of fuel for the entire Test period. 7. A minimum of a ten (10) day supply of limestone should be available prior to the Test to
ensure an adequate supply for the entire Test period.
8. The Bitter Water Storage Tank should be at least 85% full to help ensure an adequate supply of demineralized water for the test period.
9. Boiler feedwater purity shall be confirmed as being within the required design limits. Prior
to the start of the Test, drum blowdown shall be adjusted to achieve a boiler water solids concentration within recommended guidelines and the blowdown flow rate shall be identified.
10. A sootblowing cycle shall be completed within two hours of commencing each Test run to
allow best possible compliance with the requirement that operating conditions be held constant.
11. The Bed Ash Storage Silo and Fly ash Storage Silo should be suitably low at the start of the
Test so that any interruption in removal of ash does not imperil Test completion.
12. Controls tuning and/or configuration should be suspended during the Test. Maintenance activity in the areas of critical instrumentation (such as drum level transmitters) should be suspended during the Test.
13. Approximately two hours before the start of the Test the unit shall be "walked-down" by the
Test Manager and Test Coordinator to ensure that the plant valving is configured according to the valve line-up requirements (ref. Section 7) and that all else is in readiness as well.
8.2 Instrumentation
Instruments to collect the Test data shall be installed, calibrated and in service. Calibrations performed and documented at the factory or in the field will be acceptable. Any required field calibrations shall be performed using test equipment of demonstrable accuracy (i.e. traceable to the National Institute of Standards and Technology) consistent with the measurement uncertainty (MU) intervals identified in Section 6.2.4.
8.3 Provisions for Collection of Fuel, Ash, Lime, and Limestone
The testing contractor shall be responsible for collection of samples and laboratory analyses to ASME/ASTM standards on the various samples gathered during the Test. The following paragraphs describe the various sampling activities, procedures, and laboratory analyses required for the Test. Each sample shall be collected in an appropriate container, such as double bagged or in an uncoated paint can, and sealed tightly immediately upon collection. It is very important that the

JEA Large-Scale CFB Combustion Demonstration Project
Fuel Capability Demonstration Test Protocol p-25
samples be tightly sealed and clearly and legibly labeled. The labeling shall be as shown in Appendices G - K. Each sampling point shall be inspected prior to the Test to ensure that the available ports provide acceptable samples. Each sampling location shall be clearly labeled prior to the Test to facilitate sample collection. Refer to appendices as listed below for sampling log and instructions for preparing composite samples:
• Fuel Attachment L • Limestone Attachment M • Bed ash Attachment N • Fly ash Attachment O • Lime Attachment P
JEA Large-Scale CFB Combustion Demonstration Project
Fuel Capability Demonstration Test Protocol p-26
9.0 OPERATION, SAMPLING AND DATA COLLECTION 9.1 Initial Conditions
Prior to commencement of the Tests, all operating conditions described in Sections 1.0 through 8.0 shall have been established. In addition, necessary personnel to perform support functions during the Test shall be present and trained. These personnel will be supplied by the Testing Contractor or by JEA per Section 5 above and shall perform the following functions:
1. Collect operating data during the Test. Attachment F provides a list of parameters that are
directly involved in the fuel flexibility demonstrations. 2. Collect samples of fuel, lime, limestone and ash as outlined in Section 8.3 of this document.
3. Install, calibrate and operate temporary instrumentation. Refer to Attachment F for the list
of instruments. 4. Ensure that ample supplies of fuel, lime, and limestone are available to complete the Test
without interruption. All fuel constituents should be within the boiler design range and as close as possible to the Performance Fuel defined in Section 2.
5. Ensure that water treatment equipment is ready to supply continuous makeup water supply
for the duration of the Test.
6. Set-up the PI system to access the DCS data and printout every hour during the Test. The data printout shall be a digital table rather than a graphical display. Printouts shall be marked as an attachment and included in the test report for each fuel.
9.2 Operating Conditions
The boiler shall be operated at loads specified for each Performance Test, for the duration of the Test. Operation at less than specified load as a result of dispatcher requirements will be considered to be operation at test load and count towards successful completion of the Test, as long as the boiler and air quality control equipment operate satisfactorily through the period to supply the steam required. The boiler will be operated at 100% MCR load during the Boiler Performance portion of the Test and at the previously-defined part-load levels for the rest of the Operational Tests. Automatic control shall be used. Normally the sootblowers will not be operated during any of the four-hour Test runs. A full sootblowing cycle shall be completed within two hours prior to the start of each Test run. Additional sootblowing shall be done selectively on areas which indicate fouling. Sootblowing shall be performed during a four-hour Test run if the back end temperature increases in excess of 20°F over this period as observed during pre-testing. However, the duration of sootblowing shall not extend beyond two hours for a four-hour Test run. In this case, the Test run shall be extended by two hours or a shorter interval of time as may be decided by the Test Manager.
JEA Large-Scale CFB Combustion Demonstration Project
Fuel Capability Demonstration Test Protocol p-27
Boiler blowdown (continuous and surface) will be off for the Test unless boiler water conductivity exceeds the maximum recommended level. During the four-hour period prior to the commencement of the Test, the continuous blowdown rate should be increased to reduce boiler water solids to as low a level as is practical. This condition will also reduce the residual treatment chemical levels in the boiler water below normal control ranges. Additional chemicals should not be added as these residuals will increase through concentration mechanisms once the blowdown flow is stopped. Should boiler blowdown be necessary during the Test due to high conductivity or iron levels in the boiler water, the control operators should notify the Test Coordinator and the Test Manager who will then determine the most appropriate action based on the circumstances at the time.
9.3 Data Collection
An organized data collection effort will be required throughout the Test. The following items describe the tasks to be accomplished:
1. Log PI and CEMS Data. The PI system and CEMS test logs will be printed hourly. The
logs will consist of sixty (60) one-minute averages plus the hourly average. The printed logs will be retained by the Test Manager, and copies provided to the Test Coordinator and to the Testing Contractor. The logs shall also be saved to a removable media on an hourly basis. The logs will be saved in a format which can be readily utilized using Microsoft® Excel.
2. Log manually collected data every 30 minutes.
3. Collect fuel samples per Attachment L.
4. Collect limestone samples per Attachment M.
5. Collect bed ash samples per Attachment N.
6. Collect fly ash samples per Attachment O.
7. Collect lime samples per Attachment P.
8. Measure fly ash flow rate based on isokinetic particulate test at SDA inlet and stoichiometric
calculation of the flue gas flow rate.
9. Log CEMS data. See item 1 above. 9.4 Fuel Sampling
Fuel samples will be taken and analyzed according to the following schedule:
• 100% Load Test – at the start of the test and at the start of each hour of the test
(applicable for both of the four-hour tests).
The fuel will not be sampled during the 40%, 60%, and 80% load tests. Two (2) one-gallon samples will be taken from the sample port at the discharge end of each fuel feeder. The samples shall be collected using the coal scoop assembly provided with the feeders. One (1) of the one-gallon samples from each feeder will be sent to the test laboratory. The second
JEA Large-Scale CFB Combustion Demonstration Project
Fuel Capability Demonstration Test Protocol p-28
fuel sample from each feeder will be retained in a mutually acceptable location until all parties have accepted the final test report. An independent laboratory approved by the Test Manager will be used for the analysis of the fuel samples. All fuel samples will be stored in airtight containers to retain the moisture level in the fuel. Double bagging of the samples in plastic bags is recommended. Each of the bags shall be taped tightly shut. The samples shall be sealed immediately following collection. The individual fuel samples will be identified using the label shown in Attachment G. Each fuel sample will have a sample number assigned using the methodology given on the bottom of the Fuel Sample Label sheet. The sample label shall be securely taped to the outside of the inner bag if the fuel samples are double bagged. The individual fuel samples will also be logged on the Incoming/Outgoing Sample Log Sheets shown in Attachment Q. The fuel samples will be sent to the laboratory as soon as possible following the completion of the load tests. Each of the fuel samples taken for a given time period will be composited by the test laboratory into a single fuel sample for that time period.
9.4.1 Laboratory analyses to be performed
The laboratory shall prepare the following fuel analysis data for each composited sample:
1. Proximate Analysis – The as-received proximate analysis of each composite fuel sample
shall be determined according to ASTM D3172. This shall determine the following:
• Moisture (% wt) • Ash (% wt) • Volatile Matter (% wt) • Fixed Carbon (% wt) • Sulfur
2. Higher Heating Value – The dry basis Higher Heating Value (Btu/lb) of each composite fuel
sample shall be determined according to ASTM D1989.
Note: Fuels containing high ash or low volatile content do not completely burn in the bomb calorimeter, which affects the accuracy of the HHV result obtained. This poor combustion in the calorimeter does not affect normal monitoring of the plant performance, but boiler testing requires more accurate measurement. Therefore the ash/residue from the bomb calorimeter shall be analyzed for organic and inorganic carbon content, similar to the methods used for bed ash/fly ash. A correction shall be added to the calorimeter measured heating value based on a heating value of 14,500 Btu/lb of organic carbon in the residue.
3. Ultimate Analysis – The as-received ultimate analysis of each composite fuel sample shall
be determined according to ASTM D3176. This shall determine the following:
• Carbon • Hydrogen • Nitrogen • Oxygen • Ash • Moisture • Sulfur
JEA Large-Scale CFB Combustion Demonstration Project
Fuel Capability Demonstration Test Protocol p-29
Fuel shall also be analyzed for chlorine, fluorine, mercury, and lead. Testing for chlorine shall be according to ASTM D4208. Testing for fluorine shall be according to D3761. Testing for mercury shall be according to ASTM D3684. Testing for lead shall be according to ASTM D3683.
4. Fuel Ash Analysis – A fuel ash analysis of each composite fuel sample shall be completed
according to ASTM D3682. This analysis shall determine the following ash constituents:
• V • SO3 • Ni • P2O5 • Fe • Al2O3 • Na2O • TiO2 • SiO2 • CaO • K2O • Fe2O3 • MgO
5. Sieve Analysis – A complete dry sieve analysis shall be performed on the samples to
determine size distribution. A sieve analysis on both a dry basis and a wet method basis shall be completed according to ASTM D4749. The analyses shall determine the percent passing through the mesh sizes shown in Attachment F, Table F-2.
9.4.2 Analysis Checklist
Attachment L provides a checklist that shall be used in requesting analysis of fuel samples by external labs.
9.5 Limestone Sampling
Limestone samples will be taken and analyzed according to the following schedule:
• 100% Load Test – at the start of the test and at the start of each hour of the test
The limestone will not be sampled during the 40%, 60%, and 80% load tests. Two (2) one-gallon samples will be taken from the outlet of each operating limestone rotary feeders. The samples shall be collected using the scoop assembly provided with the feeders. One (1) of the one-gallon samples from each feeder will be sent to the test laboratory. The second limestone sample from each feeder will be retained in a mutually acceptable location until all parties have accepted the final test report. An independent laboratory approved by the Test Manager will be used for the analysis of the limestone samples. All limestone samples will be stored in airtight containers. Double bagging of the samples in plastic bags is recommended. Each of the bags shall be taped tightly shut. The samples shall be sealed immediately following collection. The individual limestone samples will be identified using the label shown in Attachment H. Each limestone sample will have a sample number assigned using the methodology given on the bottom of the Limestone Sample Label sheet. The sample label shall be securely taped to the outside of the inner bag if the limestone samples are double bagged. The individual limestone samples will also be logged on the Incoming/Outgoing Sample Log Sheets shown in Attachment Q. The

JEA Large-Scale CFB Combustion Demonstration Project
Fuel Capability Demonstration Test Protocol p-30
limestone samples will be sent to the laboratory as soon as possible following the completion of the load tests.

JEA Large-Scale CFB Combustion Demonstration Project
Fuel Capability Demonstration Test Protocol p-31
Each set of limestone samples taken for a given time period will be composited by the test laboratory into a single limestone sample for that time period.
9.5.1 Laboratory analyses to be performed
The laboratory shall prepare the following limestone analysis data for each composited sample:
1. % by weight CaCO3 – by x-ray fluorescence according to ASTM D4326-94, “Ash Chemical Analysis by X-Ray Fluorescence”.
2. % by weight MgCO3 – by x-ray fluorescence according to ASTM D4326-94, “Ash Chemical Analysis by X-Ray Fluorescence”.
3. % by weight of Moisture – by oven drying to constant weight.
4. % by weight of Inerts – by difference.
5. Elemental analysis for lead, mercury, chlorine, fluorine, and alkali metals - Testing for
chlorine shall be according to ASTM D4208. Testing for fluorine shall be according to D3761. Testing for mercury shall be according to ASTM D3684. Testing for lead shall be according to ASTM D3683. Testing for alkali metals shall be according to ASTM D2576.
6. TGA sorption test (Optional) – At JEA’s discretion, samples shall be forwarded to an
appropriate laboratory where a TGA Reactivity Index shall be determined using the laboratories recommended test methodology.
7. Sieve Analysis – A complete sieve analysis shall be performed on the composite limestone
samples to determine size distribution. A sieve analysis on both a dry and wet method basis shall be completed according to ASTM D4749. The analyses shall determine the percent passing through the mesh sizes shown in Attachment F, Table F-2.
Attachment M provides a checklist which shall be used in requesting analysis of limestone samples by external labs.
9.6 Lime Slurry Sampling Lime slurry samples will be taken and analyzed according to the following schedule:
• 100% Load Test – at the start of the test and at the start of each hour of the test
The lime slurry will not be sampled during the 40%, 60%, and 80% load tests. The lime slurry feed rate to the atomizers will be measured concurrently with the lime slurry samples. Lime slurry samples will be taken from the sample valve located on the discharge line from the slurry transfer pump (N01-RL-FV546). Two (2) samples of approximately 500 ml will be taken at each sampling event. Extreme care must be taken during sampling to protect skin and eyes from contact with the lime slurry. One (1) set of lime slurry samples will be sent to the test laboratory. The second set of samples will be retained in a mutually acceptable location until all parties have accepted the final test report. An
JEA Large-Scale CFB Combustion Demonstration Project
Fuel Capability Demonstration Test Protocol p-32
independent laboratory approved by the Test Manager will be used for the analysis of the limestone samples. The individual lime samples will be stored in a glass sample container with a screw type top. Each lime sample will have a sample number assigned using the methodology given on the bottom of the Lime Sample Label sheet. The sample label shall be securely taped to the outside of the sample bottle. The individual lime samples will also be logged on the Incoming/Outgoing Sample Log Sheets shown in Attachment Q. The lime slurry samples will be sent to the laboratory as soon as possible following the completion of the load tests. The flow of lime into the SDA system as measured by the flow transmitter on the lime slurry line to the feed slurry transfer pumps (N01-RL34-FT535) will be recorded at the same time as the lime samples are taken.
9.6.1 Laboratory analyses to be performed:
The laboratory shall prepare the following lime analysis data for each composited sample:
1. % by weight CaO – ASTM C25-99 2. % by weight of solids – by oven drying to constant weight 3. % by weight inerts – by difference 4. Elemental analysis for lead, mercury, chlorine, fluorine, and alkali metals - Testing for
chlorine shall be according to ASTM D4208. Testing for fluorine shall be according to D3761. Testing for mercury shall be according to ASTM D3684. Testing for lead shall be according to ASTM D3683. Testing for alkali metals shall be according to ASTM D2576.
9.6.2 Analysis Checklist
Attachment P provides a checklist which shall be used in requesting analysis of lime samples by external labs.
9.7 Fly Ash Sampling During the 100% MCR Load Test, isokinetic sampling will be performed at the inlet to the SDA in order to determine ash loading rates and obtain samples for analysis. Also, ash will be sampled at the midpoint of the test at a single air heater and fabric filter hopper. Isokinetic sampling will not be performed during the 40%, 60%, and 80% Load Tests. Fly ash sampling and flow rate will be determined by isokinetic sampling in accordance with EPA Method 17. Four one-hour traverses will be completed during each 100% MCR Load Test. Samples for determination of the unburned carbon level in the fly ash will be taken using two Cegrit samplers located 180 degrees apart. Based on preliminary estimates of fly ash flow, Cegrit samples will be taken continuously throughout each one-hour Method 17 traverse. The samples from the two opposing Cegrit analyzers will be combined to form a single composite sample for the sample period. One half of the composite sample will be sent to the test laboratory. The remaining half of the composite sample will be retained in a location acceptable to all parties of

JEA Large-Scale CFB Combustion Demonstration Project
Fuel Capability Demonstration Test Protocol p-33
the test. An independent laboratory approved by the Test Manager will be used for the analysis of the fly ash samples. All fly ash samples will be stored in airtight containers. Clean, unused, unpainted one-gallon paint cans are the recommended containers. The individual fly ash samples will be identified using the label shown in Attachment J. Each fly ash sample will have a sample number assigned using the methodology given on the bottom of the Fly Ash Sample Label sheet. The sample label shall be securely taped to the outside of the ash sample containers. The individual fly ash samples will also be logged on the Incoming/Outgoing Sample Log Sheets shown in Attachment Q. The fly ash samples will be sent to the laboratory as soon as possible following the completion of the load tests. Each set of fly ash samples taken for a given time period will be composited by the test laboratory into a single ash sample for that time period.
9.7.1 Laboratory analyses to be performed
The laboratory shall prepare the following fly ash analysis data for each composited sample:
1. Total Carbon in fly ash (% by weight) - Total carbon in the fly ash shall be determined using
a LECO CHN 600 Analyzer (or equal) according to ASTM D3178. See Attachment R for a detailed description of the analytical method for determining organic and inorganic carbon.
2. Organic Carbon in fly ash (% by weight) – The organic carbon in the fly ash shall be
determined using an HCl treated sample with a LECO CHN 600 Analyzer (or equal) according to ASTM D3178. See Attachment R for a detailed description of the analytical method for determining organic and inorganic carbon.
3. Calcium – The total calcium in the fly ash (% by weight) shall be determined according to
ASTM D4326.
4. Sulfur – The total sulfur in the fly ash (% by weight) shall be determined according to ASTM D4239.
5. Ash Analysis – An ash analysis of each composite sample shall be completed according to
ASTM D3682. This analysis shall determine the following ash constituents:
• Vanadium • Nickel • Na2O • Fe • SiO2 • K2O • MgO • Fe2O2 • SO3
6. Sieve Analysis – A complete sieve analyses shall be performed on the composite fly ash
samples to determine size distribution. A sieve analysis on both a dry and wet method basis shall be completed according to ASTM D4749. The analyses shall determine the percent passing through the mesh sizes shown in Attachment F, Table F-2.
JEA Large-Scale CFB Combustion Demonstration Project
Fuel Capability Demonstration Test Protocol p-34
9.7.2 Analysis Checklist
Attachment O provides a checklist that shall be used in requesting analysis of fly ash samples by external labs.
9.8 Bed Ash Sampling
Bed Ash samples will be taken and analyzed according to the following schedule:
• 100% Load Test – at the start of the test and at the start of each hour of the test
The bed ash will not be sampled during the 40%, 60%, and 80% load tests. Two one-gallon samples will be taken from each of the operating stripper cooler rotary valves outlets through the 4 inch test port at each of these locations. One of the one-gallon samples from each stripper cooler will be sent to the test laboratory. The second sample from each stripper cooler will be retained in a mutually acceptable location until all parties have accepted the final test report. An independent laboratory approved by the Test Manager will be used for the analysis of the bed ash samples. All bed ash samples will be stored in airtight containers. Clean, unused, unpainted one-gallon paint cans are the recommended containers The individual bed ash samples will be identified using the label shown in Attachment I. Each bed ash sample will have a sample number assigned using the methodology given on the bottom of the Bed Ash Sample Label sheet. The sample label shall be securely taped to the outside of the ash sample containers. The individual bed ash samples will also be logged on the Incoming/Outgoing Sample Log Sheets shown in Attachment Q. The bed ash samples will be sent to the laboratory as soon as possible following the completion of the load tests. Each set of bed ash samples taken for a given time period will be composited by the test laboratory into a single limestone sample for that time period.
9.8.1 Laboratory analyses to be performed
The laboratory shall prepare the following bed ash analysis data for each composited sample:
1. Total Carbon in bed ash (% by weight) - Total carbon in the bed ash shall be determined using a LECO CHN 600 Analyzer (or equal) according to ASTM D3178. See Attachment R for a detailed description of the analytical method for determining organic and inorganic carbon.
2. Organic Carbon in bed ash (% by weight) – The organic carbon in the bed ash shall be
determined using an HCl treated sample with a LECO CHN 600 Analyzer (or equal) according to ASTM D3178. See Attachment R for a detailed description of the analytical method for determining organic and inorganic carbon.
3. Calcium – The total calcium in the bed ash (% by weight) shall be determined according to
ASTM D3682.
4. Sulfur – The total sulfur in the bed ash (% by weight) shall be determined according to
JEA Large-Scale CFB Combustion Demonstration Project
Fuel Capability Demonstration Test Protocol p-35
ASTM D4239.
5. Ash Analysis – An ash analysis of each composite sample shall be completed according to ASTM D3682. This analysis shall determine the following ash constituents:
• Vanadium • Nickel • Na2O • Fe • SiO2 • K2O • MgO • Fe2O2 • SO3
6. Sieve Analysis – A complete sieve analyses shall be performed on the composite bed ash
samples to determine size distribution. A sieve analysis on both a dry and wet method basis shall be completed according to ASTM D4749. The analyses shall determine the percent passing through the mesh sizes shown in Attachment F, Table F-2.
9.8.2 Analysis Checklist
Attachment N provides a checklist which shall be used in requesting analysis of bed ash samples by external labs.
9.9 Bed Ash Flow Measurement
The Bed Ash flow rate is calculated as the difference between the total ash and fly ash. Fly ash will be collected during the Test by isokinetic sampling at the inlet to the SDA to determine the dust loading in the flue gas. The oxygen concentration at the SDA inlet will be simultaneously measured by multipoint traverse. The fuel flow is measured by gravimetric feeders. The flue gas flow rate will be identified from this information using stoichiometric calculations. The flue gas flow rate and the dust loading will provide the fly ash flow rate. The total ash flow rate is obtained from the heat and mass balance calculations associated with the boiler efficiency calculation.
9.10 Performance Test Log Sheets
Log sheets for test data collection shall be prepared onsite by the testing contractor and approved by the Test Coordinator based on the final DCS data acquisition format established for testing and also showing the designations applied for temporary Test instrumentation.
JEA Large-Scale CFB Combustion Demonstration Project
Fuel Capability Demonstration Test Protocol p-36
10.0 EMISSIONS TESTING
The following requirements shall apply for testing gaseous emissions.
10.1 Compliance Criteria
The compliance criteria will be based upon the design values set forth in Section 3.3 of this procedure.
10.2 Boiler Operation
Boiler operation and data collection requirements are the same as detailed in Section 9 above.
10.3 Gaseous Emissions
Gaseous emissions during the emissions test will be measured by certified calibrated continuous analyzers.

JEA Large-Scale CFB Combustion Demonstration Project
Fuel Capability Demonstration Test Protocol p-37
ATTACHMENTS
JEA Large-Scale CFB Combustion Demonstration Project
Fuel Capability Demonstration Test Protocol p-38
Attachment A
Fuel Fineness
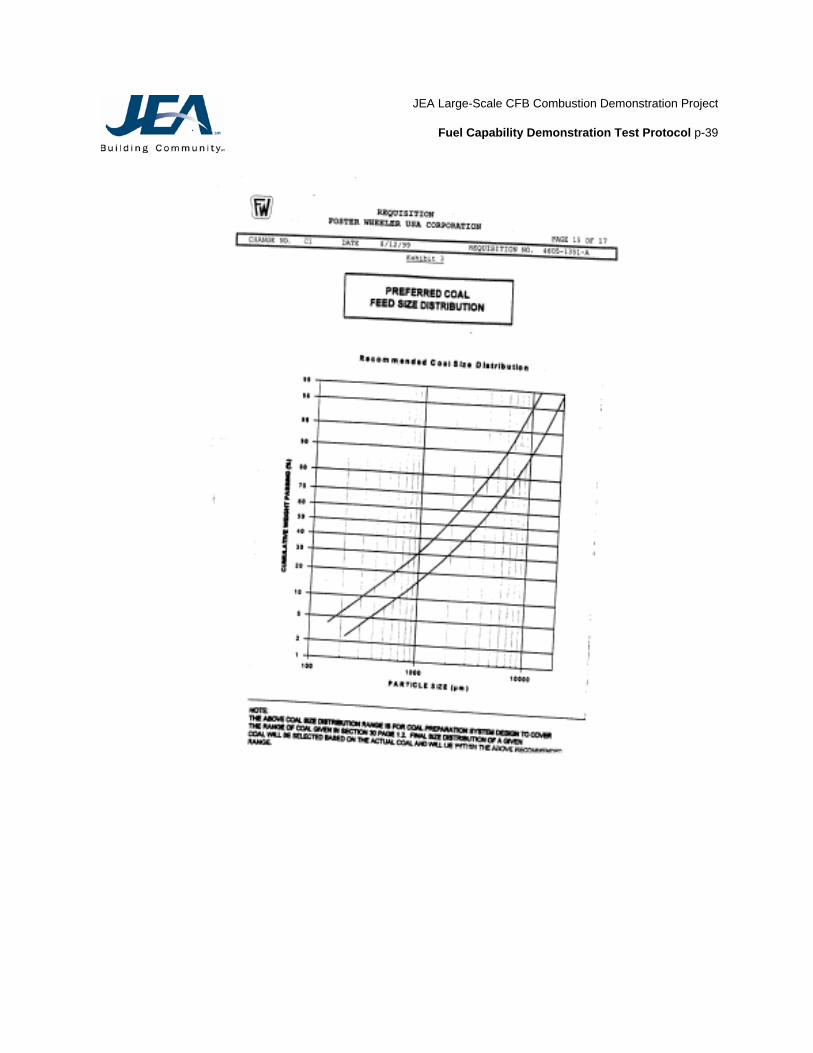
JEA Large-Scale CFB Combustion Demonstration Project
Fuel Capability Demonstration Test Protocol p-39

JEA Large-Scale CFB Combustion Demonstration Project
Fuel Capability Demonstration Test Protocol p-40

JEA Large-Scale CFB Combustion Demonstration Project
Fuel Capability Demonstration Test Protocol p-41
Attachment B
Limestone Fineness
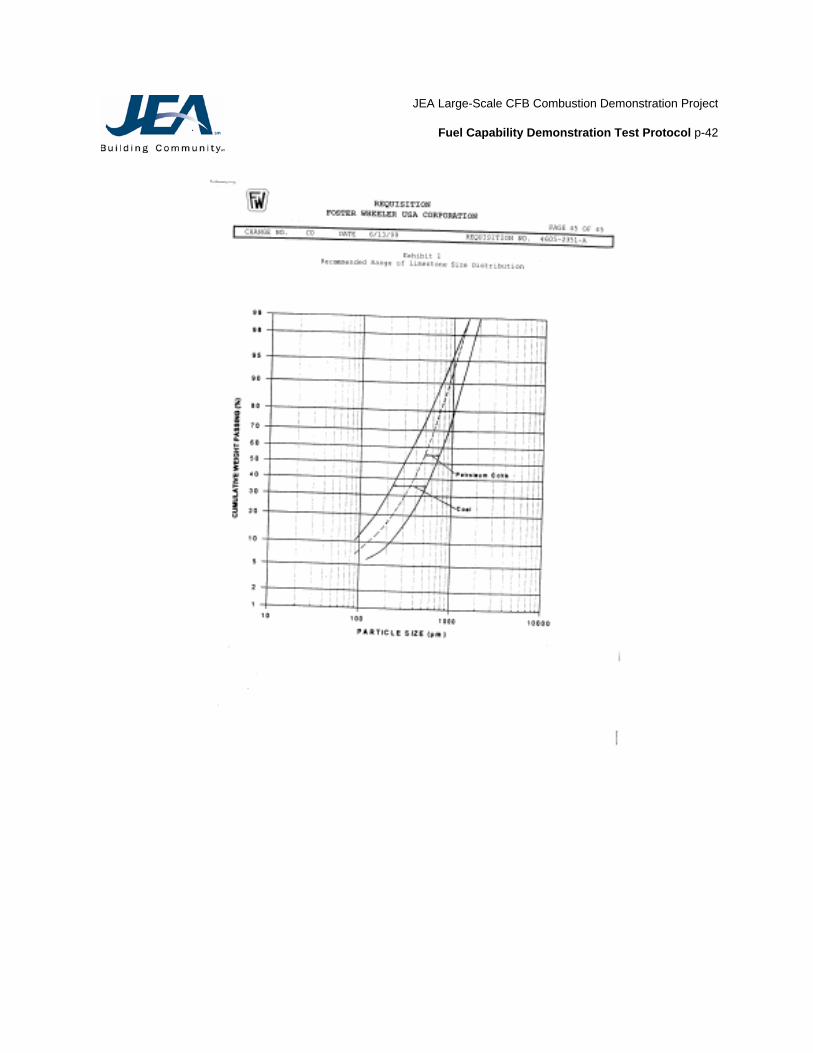
JEA Large-Scale CFB Combustion Demonstration Project
Fuel Capability Demonstration Test Protocol p-42

JEA Large-Scale CFB Combustion Demonstration Project
Fuel Capability Demonstration Test Protocol p-43
Attachment C
Fuel and Limestone Specification
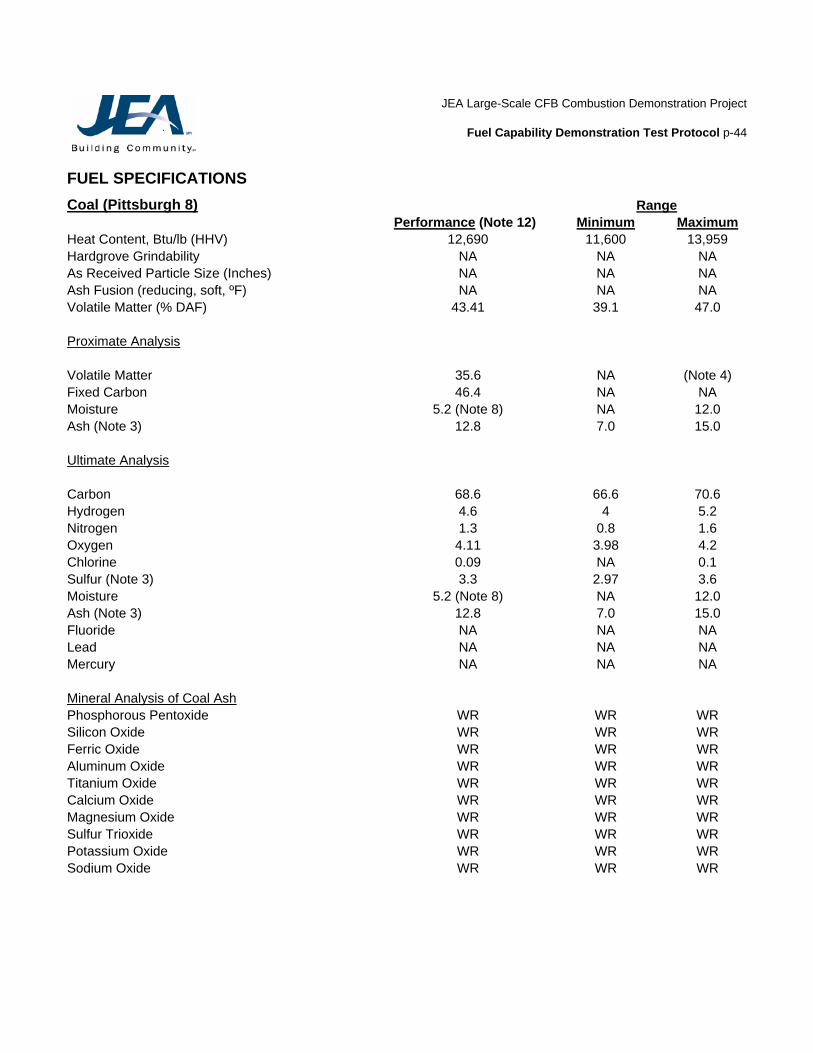
JEA Large-Scale CFB Combustion Demonstration Project
Fuel Capability Demonstration Test Protocol p-44
FUEL SPECIFICATIONS Coal (Pittsburgh 8) Range Performance (Note 12) Minimum Maximum Heat Content, Btu/lb (HHV) 12,690 11,600 13,959 Hardgrove Grindability NA NA NA As Received Particle Size (Inches) NA NA NA Ash Fusion (reducing, soft, ºF) NA NA NA Volatile Matter (% DAF) 43.41 39.1 47.0 Proximate Analysis Volatile Matter 35.6 NA (Note 4) Fixed Carbon 46.4 NA NA Moisture 5.2 (Note 8) NA 12.0 Ash (Note 3) 12.8 7.0 15.0 Ultimate Analysis Carbon 68.6 66.6 70.6 Hydrogen 4.6 4 5.2 Nitrogen 1.3 0.8 1.6 Oxygen 4.11 3.98 4.2 Chlorine 0.09 NA 0.1 Sulfur (Note 3) 3.3 2.97 3.6 Moisture 5.2 (Note 8) NA 12.0 Ash (Note 3) 12.8 7.0 15.0 Fluoride NA NA NA Lead NA NA NA Mercury NA NA NA Mineral Analysis of Coal Ash Phosphorous Pentoxide WR WR WR Silicon Oxide WR WR WR Ferric Oxide WR WR WR Aluminum Oxide WR WR WR Titanium Oxide WR WR WR Calcium Oxide WR WR WR Magnesium Oxide WR WR WR Sulfur Trioxide WR WR WR Potassium Oxide WR WR WR Sodium Oxide WR WR WR

JEA Large-Scale CFB Combustion Demonstration Project
Fuel Capability Demonstration Test Protocol p-45
FUEL SPECIFICATIONS (cont’d) Coal (Illinois 6) Range Performance Minimum Maximum Heat Content, Btu/lb (HHV) 11,603 11,499 11,738 Hardgrove Grindability 53.13 50 57 Ash Fusion (reducing, soft, ºF) 2051 2020 2130 Proximate Analysis Volatile Matter 36.33 35.55 36.88 Fixed Carbon 43.99 43.35 44.50 Moisture 11.11 10.64 11.96 Ash 8.57 7.79 8.85 Ultimate Analysis, Dry Carbon 72.54 71.44 73.20 Hydrogen 4.55 4.70 5.22 Nitrogen 1.39 1.25 1.48 Oxygen 8.42 7.73 9.29 Chlorine 0.17 0.13 0.18 Sulfur 3.05 2.89 3.19 Ash 9.64 8.77 9.96 Mineral Analysis of Coal Ash Phosphorous Pentoxide 0.39 0.26 0.48 Silicon Oxide 49.26 48.36 50.82 Ferric Oxide 20.09 18.32 21.98 Aluminum Oxide 19.92 18.59 21.20 Titanium Oxide 1.01 0.94 1.10 Calcium Oxide 3.05 2.77 3.53 Magnesium Oxide 0.91 0.73 1.06 Sulfur Trioxide 1.93 1.59 2.25 Potassium Oxide 2.46 2.23 2.65 Sodium Oxide 0.80 0.70 0.90
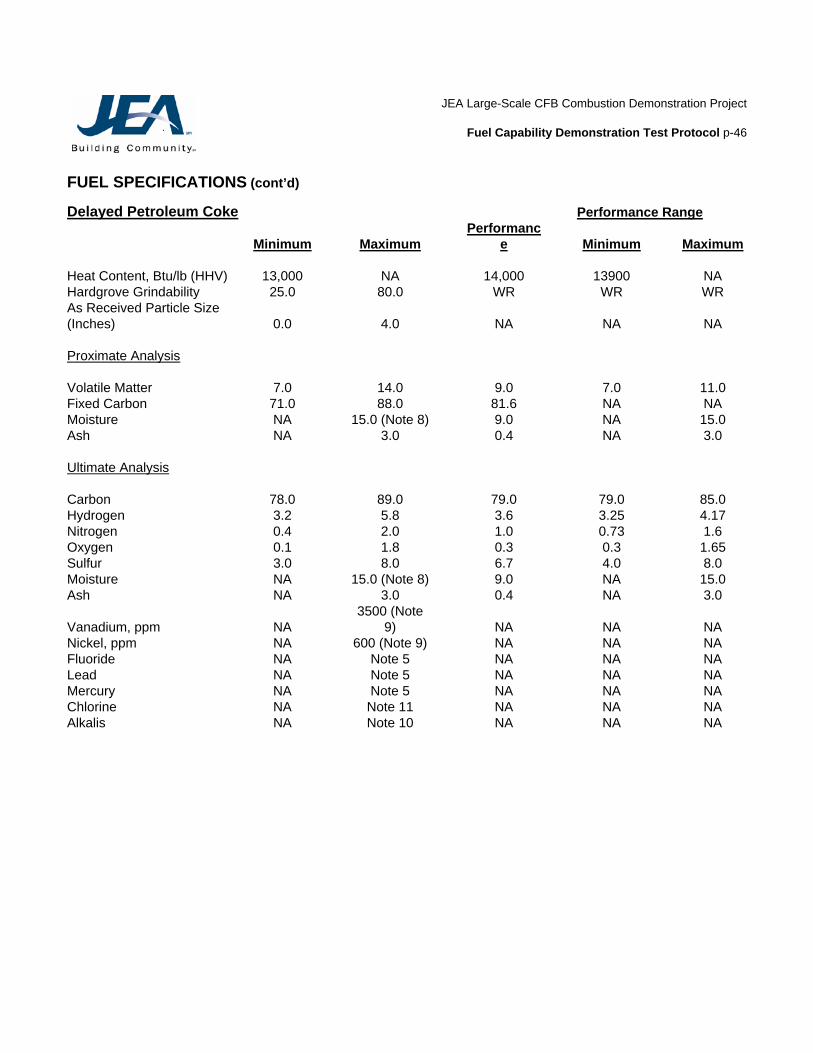
JEA Large-Scale CFB Combustion Demonstration Project
Fuel Capability Demonstration Test Protocol p-46
FUEL SPECIFICATIONS (cont’d) Delayed Petroleum Coke Performance Range
Minimum Maximum Performanc
e Minimum Maximum Heat Content, Btu/lb (HHV) 13,000 NA 14,000 13900 NA Hardgrove Grindability 25.0 80.0 WR WR WR As Received Particle Size (Inches) 0.0 4.0 NA NA NA Proximate Analysis Volatile Matter 7.0 14.0 9.0 7.0 11.0 Fixed Carbon 71.0 88.0 81.6 NA NA Moisture NA 15.0 (Note 8) 9.0 NA 15.0 Ash NA 3.0 0.4 NA 3.0 Ultimate Analysis Carbon 78.0 89.0 79.0 79.0 85.0 Hydrogen 3.2 5.8 3.6 3.25 4.17 Nitrogen 0.4 2.0 1.0 0.73 1.6 Oxygen 0.1 1.8 0.3 0.3 1.65 Sulfur 3.0 8.0 6.7 4.0 8.0 Moisture NA 15.0 (Note 8) 9.0 NA 15.0 Ash NA 3.0 0.4 NA 3.0
Vanadium, ppm NA 3500 (Note
9) NA NA NA Nickel, ppm NA 600 (Note 9) NA NA NA Fluoride NA Note 5 NA NA NA Lead NA Note 5 NA NA NA Mercury NA Note 5 NA NA NA Chlorine NA Note 11 NA NA NA Alkalis NA Note 10 NA NA NA

JEA Large-Scale CFB Combustion Demonstration Project
Fuel Capability Demonstration Test Protocol p-47
Note:
1. NA = no limit available
2. All data is for fuel "as received" on a percent mass basis unless noted. 3. Coal minimum sulfur content is 0.5% given at least 12.0% ash. Coal minimum ash content is 7.0% given
at least 1.0% sulfur. For coals with sulfur content between 0.5% and 1.0% and ash content between 7% and 12%, the minimum coal ash content as a function of sulfur content shall be as shown in Figure 2.5.
4. The maximum coal volatile matter is 47% on a dry-ash free basis. 5. The emissions guarantee shall be based upon uncontrolled emissions as resulting from the combined
inputs from fuel and limestone that do not exceed the following values: Lead - 0.00278 lb/Mbtu (HHV) Mercury - 0.0000174 lb/Mbtu (HHV) Fluorine (as HF) - 0.0106 lb/Mbtu (HHV)
6. WR = within range 7. Not Used. 8. Surface moisture of the crushed fuel should be below 10% to avoid conveying and feeding hang-ups. 9. The total vanadium and nickel content in the fuel should not exceed 2,000 ppm. Operation at higher
levels than 2,000 ppm will result in increased outages for unit cleaning and repairs. 10. The fuels fired in the boiler should have a combined acetic acid soluble sodium (Na) and potassium (K)
content less than 0.05% (500 ppm) on a dry fuel basis to prevent bed sintering and agglomeration. 11. The chlorine levels in the fuel should be less than 0.1% on a dry fuel basis to avoid corrosion and
agglomeration problems. 12. Performance coal will be Eastern US coal. 13. Not Used.

JEA Large-Scale CFB Combustion Demonstration Project
Fuel Capability Demonstration Test Protocol p-48
Performance Limestone Properties The limestone sizing as delivered at the limestone preparation building will be as per ASTM-33-93 for sizes 57, 67, 7, or 8, and a Bond Work Index of 12.
Performance (Note 1)
Minimum Maximum
CaCO3, % by weight 92.0 85.0 99.0 MgCO3, % by weight 3.0 0.2 5.0 Inerts, % by weight 4.0 NA 15.0 Moisture, % by weight 1.0 NA 10.0 Trace Elements, Max Content
Fluorine, mg/kg NA NA Note 2 Lead, mg/kg NA NA Note 2 Mercury, mg/kg NA NA Note 2 Chlorine, ppm NA NA 1,200
Note 1: When firing petroleum coke, the limestone must be "land" based type. Note 2: The above indicated lead, mercury, and fluorine contents are provided as the expected concentrations. The emissions guarantee shall be based upon uncontrolled emissions as resulting from the combined inputs from fuel and limestone that do not exceed the following values:
Lead - 0.00278 lb/Mbtu (HHV) Mercury - 0.0000174 lb/Mbtu (HHV) Fluorine (as HF) - 0.0106 lb/Mbtu (HHV)
Note 3: Performance moisture listed in this table is the moisture level measured at the boiler Note 4: The 10% maximum moisture content listed in the Table is the maximum as received moisture content in the limestone – it is dried to a design value of 1% moisture in the limestone preparation system, prior to injection into the boiler.

JEA Large-Scale CFB Combustion Demonstration Project
Fuel Capability Demonstration Test Protocol p-49
Attachment D
Example Calculations for Deviations from Operating Conditions
JEA Large-Scale CFB Combustion Demonstration Project
Fuel Capability Demonstration Test Protocol p-50
Boiler Efficiency Spreadsheets detailing the method used to compute boiler efficiency are included in Attachment S. The comments column of the spreadsheet describes the calculation methods used in detail. The spreadsheet uses the heat loss method to compute boiler efficiency. The boiler losses evaluated by the spreadsheet are as follows:
a. Dry Flue Gas Loss – This loss is evaluated using the gas temperature leaving the airheater and the reference air temperature based on the actual test conditions. The loss is corrected to design point conditions by using the Performance Fuel properties for HHV and for the pounds of dry flue gas per pound of fuel.
b. Loss Due to Moisture in Fuel – This loss is evaluated using the gas temperature leaving the airheater and
the reference air temperature based on the actual test conditions. The loss is corrected to design point conditions by using the Performance Fuel properties for HHV and for the fuel moisture content.
c. Loss Due to Moisture from Combustion of Hydrogen – This loss is evaluated using the gas temperature
leaving the airheater and the reference air temperature based on the actual test conditions. The loss is corrected to design point conditions by using the Performance Fuel properties for HHV and the fuel hydrogen content.
d. Combustible Loss – This loss is evaluated using the unburned carbon content of the bed ash and the fly
ash measured during the test.
e. Carbon Monoxide Loss – This is assumed to be zero.
f. Sensible Heat in Ash – The measured value from the 100% load test is to be used and will also be used as the basis for estimating the sensible heat in ash at the other loads.
g. Calcination/Sulfation – The methodology in 4.2.4 for the 100% load test will be used. This value will also
be the basis for estimating the calcination/sulfation at the other loads.
h. Moisture in Air Loss – This loss is evaluated using the gas temperature leaving the airheater and the reference air temperature based on the actual test conditions. The design value for pounds of moisture per pound of dry air is utilized.
The design boiler efficiency will also be corrected for deviation from design boiler feedwater temperature using Figure 3.5.1 which is included in Attachment T.
Corrected Efficiency = Test Efficiency Corrected to Guarantee Conditions + Correction from Figure 3.5.1
Correction to Main Steam Flow for Deviation in Feedwater Temperature Main steam flow will be corrected for deviation from the design feedwater temperature using Figure 3.5.2 which is included in Attachment T.
Corrected Steam Flow = Test Steam Flow x Capacity Factor from Figure 3.5.2

JEA Large-Scale CFB Combustion Demonstration Project
Fuel Capability Demonstration Test Protocol p-51
Correction to Hot Reheat Steam Temperature for Deviation in Cold Reheat Temperature Hot reheat steam temperature will be corrected for deviation from the design cold reheat steam temperature using Figure 3.5.3 which is included in Attachment T.
Corrected HRH Steam Temperature = Test HRH Steam Temperature + Correction from Figure 3.5.3.
Correction to Main Steam Temperature for Deviation in Feedwater Temperature Main steam temperature will be corrected for deviation from the design feedwater temperature using Figure 3.5.4 which is included in Attachment T.
Corrected Main Steam Temperature = Test Main Steam Temperature + Correction from Figure 3.5.4
Correction to Mercury, Lead, and HF Emissions for Excess Uncontrolled Emissions If the uncontrolled emissions of any of these constituents exceed the limits detailed in section 3.3, the test emissions values shall be corrected for variation from the Reference Condition as follows:
Corrected Emissions = Test Emissions x (Reference Uncontrolled Emissions/Test Uncontrolled Emissions)
JEA Large-Scale CFB Combustion Demonstration Project
Fuel Capability Demonstration Test Protocol p-52
Attachment E
Measurement Uncertainty Calculations
PERFORMANCE TEST
The mutually agreed measurement uncertainty values for all the performance guarantees related to the Performance Test are specified in Section 6.2.4 of this Test Procedure. Based on these MU values, the following three tables (1, 2, & 3) have been developed. A copy of these tables is included in this Attachment.
TABLE 1 WORK SHEET FOR CALCULATION Table 1 is an “Excel” work sheet file for the Fuel Capability Demonstration Test measurement uncertainty calculations. This table shows the following parameters starting with the column on the left:
Column # Description
1 Design Point description 2 “Design Point Value” for each parameter 3 “Units” on which the design values are specified 4 “MU Adjusted Acceptable Measured Low Value” of the design value 5 “MU Adjusted Acceptable Measured High Value” of the design value 6 “MU Value” mutually agreed for each design value 7 “Test Results Average Value” input 8 “Test Results” rounded off to the same decimal place as for each design value 9 “MET” or “NOT MET” evaluation of the Test results
The logic used in the MET/NOT MET evaluation is:
For the Capacity and efficiency If the Test result average value is equal to or higher than the minimum acceptable MU adjusted low value, then the Test “MET” that particular design point.
For the Emissions It is not appropriate to use the MU adjusted low value in all cases since MU is not applied to emissions test results. Therefore, in these cases the low and high values are identical.
For the Steam Temperatures If the Test result average value is lower than the minimum acceptable MU adjusted low value, then the Test “NOT MET” that particular design value. In all the cases, Test results (average values) will be rounded off to the same decimal place as shown in the Contract for each corresponding design point.
TABLE 2 EXAMPLE WORK SHEET SHOWING ALL “MET”
Table 2 gives example calculations to demonstrate the use of Table 1. This table shows the worst Test values that demonstrate successfully meeting each performance design value.
TABLE 3 EXAMPLE WORK SHEET SHOWING ALL “NOT MET”
Table 3 also gives example calculations to demonstrate the use of Table 1. This table shows the best Test values that demonstrate failure meeting each performance design value.
JEA Large-Scale CFB Combustion Demonstration Project
Fuel Capability Demonstration Test Protocol p-53
TABLE 1
WORK SHEET FOR DESIGN POINT 'MET" OR "NOT MET" EVALUATION DURING PERFORMANCE TEST IN CONSIDERATION OF MEASUREMENT UNCERTAINTY AND ROUNDING OFF OF TEST RESULTS
ENTER TEST DATA WITH ONE MORE DECIMAL PLACE THAN THE CORRESPONDING GUARANTEE
Performance Design
Point Value Units
MU Adjusted Acceptable Measured Low Value
MU Adjusted Acceptable Measured
High ValueMU Value (relative)
Test Results Average
Value
Test Results Average
Value Rounded
Perf Test Guarantee "MET" or
"NOT MET"Efficiency Design Point 90.07 % 89.27 90.89 0.0090
Test result 0.00 NOT MET
Capacity GuaranteeMaximum (100% MCR) 1,993,591 lb/hr 1,956,419 2,032,203 0.0190 NOT MET
Test result lb/hr 0Emissions
NOx Value 0.09 lb/MMbtu 0.09 0.09 0.0000 METTest result -
SO2 in flue gas 0.015 lb/MMbtu 0.015 0.015 0.0000 METTest result -
Particulate 0.011 lb/MMbtu 0.011 0.011 0.0000 METTest result -
Main Steam Temperature Load > 75% MCR
Target Temp 1,000 F 995 1,015 0.0050High Range (+10F) 1,010 F NOT MET
Low Range (-0F) 1,000 FTest result 0
Load < 75% MCRTarget Temp 1,000 F 985 1,015 0.0050
High Range (+10F) 1,010 F NOT METLow Range (-10F) 990 F
Test result 0
Reheat Steam TemperatureLoad > 75% MCR
Target Temp: 1,000 F 995 1,015 0.0050High Range (+10F): 1,010 F NOT MET
Low Range (-0F): 1,000 FTest result 0
Load < 75% MCRTarget Temp 1,000 F 985 1,015 0.0050
High Range (+10F) 1,010 F NOT METLow Range (-10F) 990 F
Test result 0
JEA NORTHSIDE UNIT 2 FUEL CAPABILITY DEMONSTRATION TEST
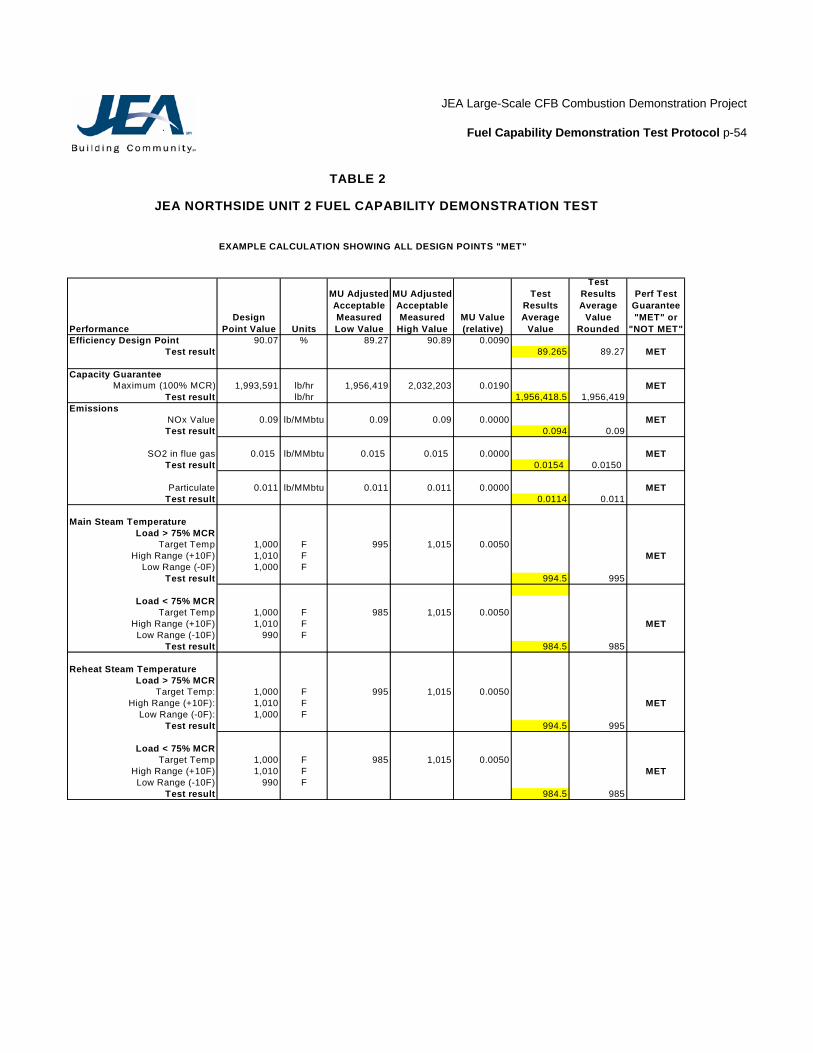
JEA Large-Scale CFB Combustion Demonstration Project
Fuel Capability Demonstration Test Protocol p-54
TABLE 2
EXAMPLE CALCULATION SHOWING ALL DESIGN POINTS "MET"
Performance Design
Point Value Units
MU Adjusted Acceptable Measured Low Value
MU Adjusted Acceptable Measured
High ValueMU Value (relative)
Test Results Average
Value
Test Results Average
Value Rounded
Perf Test Guarantee "MET" or
"NOT MET"Efficiency Design Point 90.07 % 89.27 90.89 0.0090
Test result 89.265 89.27 MET
Capacity GuaranteeMaximum (100% MCR) 1,993,591 lb/hr 1,956,419 2,032,203 0.0190 MET
Test result lb/hr 1,956,418.5 1,956,419Emissions
NOx Value 0.09 lb/MMbtu 0.09 0.09 0.0000 METTest result 0.094 0.09
SO2 in flue gas 0.015 lb/MMbtu 0.015 0.015 0.0000 METTest result 0.0154 0.0150
Particulate 0.011 lb/MMbtu 0.011 0.011 0.0000 METTest result 0.0114 0.011
Main Steam Temperature Load > 75% MCR
Target Temp 1,000 F 995 1,015 0.0050High Range (+10F) 1,010 F MET
Low Range (-0F) 1,000 FTest result 994.5 995
Load < 75% MCRTarget Temp 1,000 F 985 1,015 0.0050
High Range (+10F) 1,010 F METLow Range (-10F) 990 F
Test result 984.5 985
Reheat Steam TemperatureLoad > 75% MCR
Target Temp: 1,000 F 995 1,015 0.0050High Range (+10F): 1,010 F MET
Low Range (-0F): 1,000 FTest result 994.5 995
Load < 75% MCRTarget Temp 1,000 F 985 1,015 0.0050
High Range (+10F) 1,010 F METLow Range (-10F) 990 F
Test result 984.5 985
JEA NORTHSIDE UNIT 2 FUEL CAPABILITY DEMONSTRATION TEST
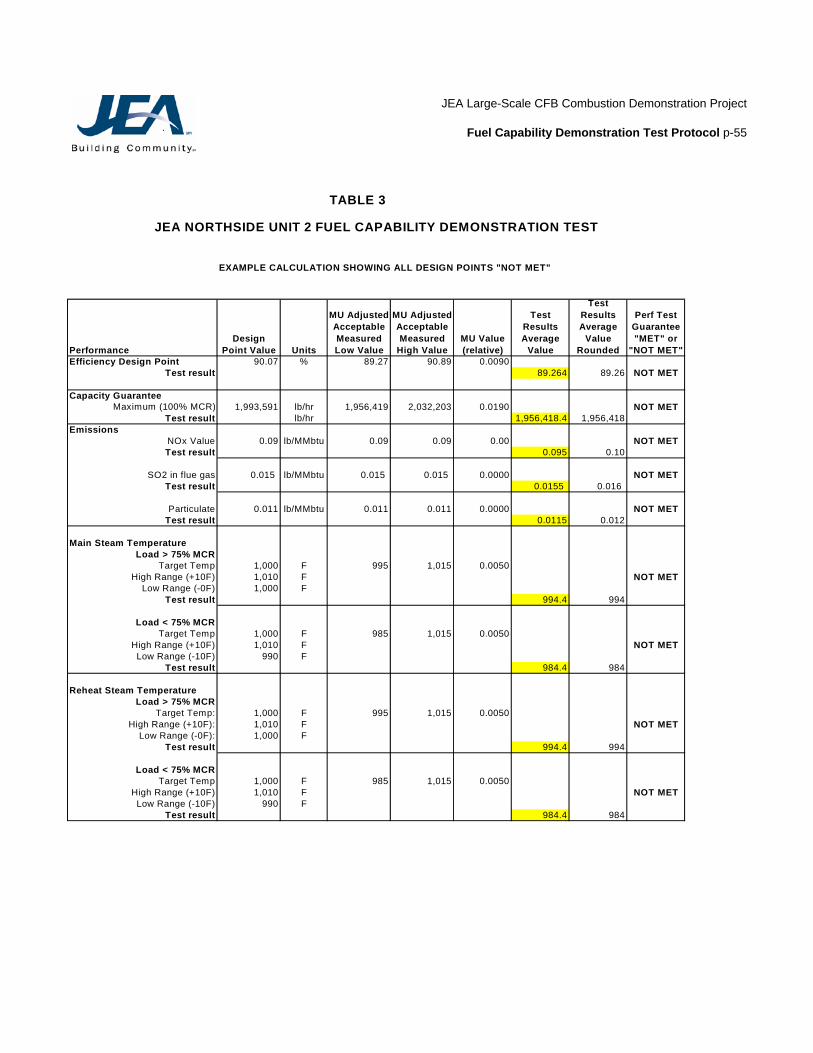
JEA Large-Scale CFB Combustion Demonstration Project
Fuel Capability Demonstration Test Protocol p-55
TABLE 3
EXAMPLE CALCULATION SHOWING ALL DESIGN POINTS "NOT MET"
Performance Design
Point Value Units
MU Adjusted Acceptable Measured Low Value
MU Adjusted Acceptable Measured
High ValueMU Value (relative)
Test Results Average
Value
Test Results Average
Value Rounded
Perf Test Guarantee "MET" or
"NOT MET"Efficiency Design Point 90.07 % 89.27 90.89 0.0090
Test result 89.264 89.26 NOT MET
Capacity GuaranteeMaximum (100% MCR) 1,993,591 lb/hr 1,956,419 2,032,203 0.0190 NOT MET
Test result lb/hr 1,956,418.4 1,956,418Emissions
NOx Value 0.09 lb/MMbtu 0.09 0.09 0.00 NOT METTest result 0.095 0.10
SO2 in flue gas 0.015 lb/MMbtu 0.015 0.015 0.0000 NOT METTest result 0.0155 0.016
Particulate 0.011 lb/MMbtu 0.011 0.011 0.0000 NOT METTest result 0.0115 0.012
Main Steam Temperature Load > 75% MCR
Target Temp 1,000 F 995 1,015 0.0050High Range (+10F) 1,010 F NOT MET
Low Range (-0F) 1,000 FTest result 994.4 994
Load < 75% MCRTarget Temp 1,000 F 985 1,015 0.0050
High Range (+10F) 1,010 F NOT METLow Range (-10F) 990 F
Test result 984.4 984
Reheat Steam TemperatureLoad > 75% MCR
Target Temp: 1,000 F 995 1,015 0.0050High Range (+10F): 1,010 F NOT MET
Low Range (-0F): 1,000 FTest result 994.4 994
Load < 75% MCRTarget Temp 1,000 F 985 1,015 0.0050
High Range (+10F) 1,010 F NOT METLow Range (-10F) 990 F
Test result 984.4 984
JEA NORTHSIDE UNIT 2 FUEL CAPABILITY DEMONSTRATION TEST
JEA Large-Scale CFB Combustion Demonstration Project
Fuel Capability Demonstration Test Protocol p-56
Attachment F
List of Parameters and Data Collection Methods for Capacity, Efficiency, and Emissions Calculations
JEA Large-Scale CFB Combustion Demonstration Project
Fuel Capability Demonstration Test Protocol p-57
Table F-1
Laboratory and Manual Test Sampling Procedures
Sample Sampling Location
Sample Type1
Sample Size Frequency / Duration Sampling Procedures
Fuel Fuel feeder outlets grab 2 – 1 gallon samples
1/hr during 100% MCR test, 2 total for each reduced load test
Manually composite grab samples
Limestone Limestone rotary feeder outlets
grab 2 -1 gallon samples
1/hr during 100% MCR test, no samples during reduced load test
Manually composite grab samples
Bed Ash Stripper cooler rotary valve outlets
grab 2 - 1 gallon samples
1/hr 100% MCR test, 1 at midpoint each reduced load test
Manually composite grab samples
Fly Ash AH outlet duct Cegrit sampling and air heater economizer, economizer, and fabric filter hopper samples
Cegrit and hopper grabs
2 - 1 gallon samples
1 Cegrit sample /hr during 100% MCR test, & 1 hopper sample at midpoint test
Manually composite grab samples
Lime Lime feeder A or B grab 1 lb 1/hr when slaking Manually composite grab samples
Flue Gas SDA inlet ductwork test ports
composite NA 3 tests per run Temporary duct test probes.
SDA inlet ductwork
CEM NA Continuous
Stack CEM NA Continuous Stack OM NA Continuous 6-min average Stack sampling
ports composite NA 3 tests per run Temporary stack test
probes 1 CEM – continuous emissions monitor, OM – opacity monitor

JEA Large-Scale CFB Combustion Demonstration Project
Fuel Capability Demonstration Test Protocol p-58
Table F-2
Laboratory Test Procedures
Sample
Parameter Test
Procedure Testing
Organization Fuel Proximate analysis –
moisture, ash, volatiles, fixed carbon, sulfur ASTM D3172
Higher heating value ASTM D1989 (ASTM D3286 if HHV < 10,000 Btu/lb) Ultimate analysis –
carbon, hydrogen, sulfur, nitrogen, oxygen ASTM D3176
Chlorine ASTM D4208 Fluorine ASTM D3761 Mercury ASTM D3684 Lead ASTM D3683 Moisture By oven drying to constant weight Ash elemental analysis – V, Ni, Fe, Na2O, SiO2,
K2O, MgO, SO3, P2O5, Al2O3, TiO2, CaO, Fe2O3 ASTM D3682
Particulate size distribution - ½”, ¼”, #4, #8, #14, #28, #48, #100 Tyler mesh
ASTM D4749 Dry Sieve above #100 mesh (note: particle size distribution testing for particles #100 mesh and smaller shall be done by laser particle size testing.)
Limestone CaCO3, MgCO3 ASTM D4326 Moisture Oven drying to constant weight Inerts By difference Chlorine ASTM D4208 Fluorine ASTM D3761 Mercury ASTM D3684 Lead ASTM D3683 Na K
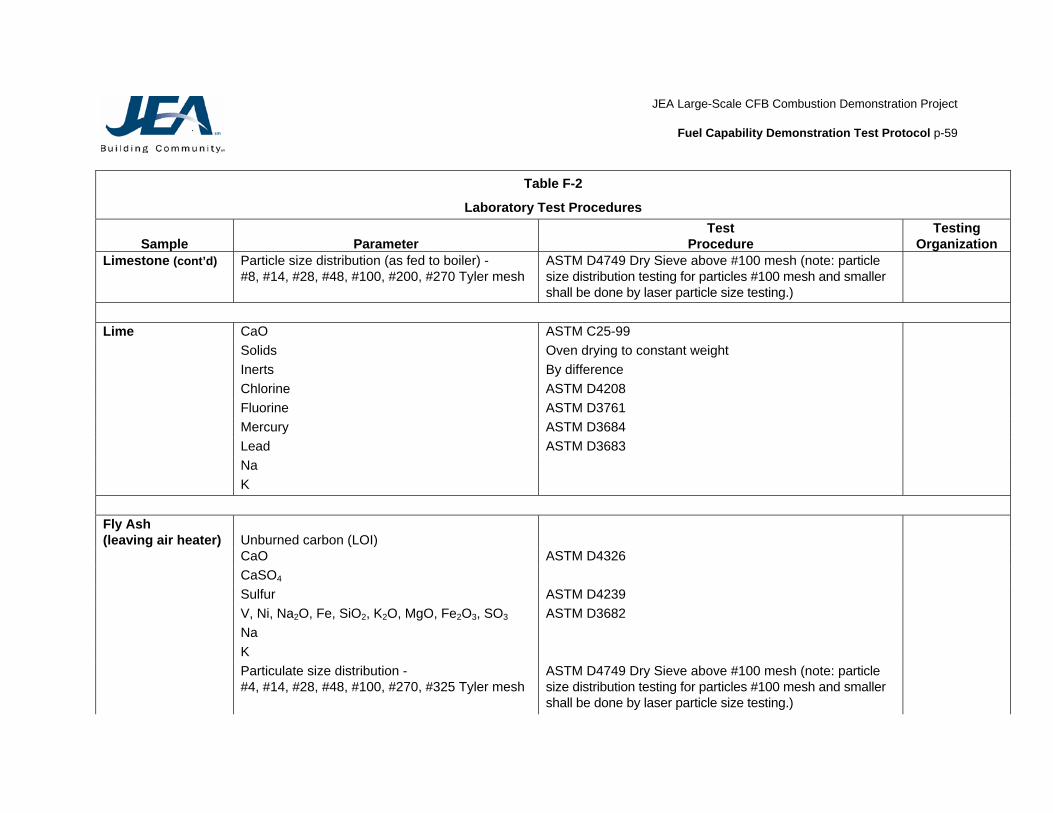
JEA Large-Scale CFB Combustion Demonstration Project
Fuel Capability Demonstration Test Protocol p-59
Table F-2
Laboratory Test Procedures
Sample
Parameter Test
Procedure Testing
Organization Limestone (cont’d) Particle size distribution (as fed to boiler) -
#8, #14, #28, #48, #100, #200, #270 Tyler mesh
ASTM D4749 Dry Sieve above #100 mesh (note: particle size distribution testing for particles #100 mesh and smaller shall be done by laser particle size testing.)
Lime CaO ASTM C25-99 Solids Oven drying to constant weight Inerts By difference Chlorine ASTM D4208 Fluorine ASTM D3761 Mercury ASTM D3684 Lead ASTM D3683 Na K Fly Ash (leaving air heater) Unburned carbon (LOI)
CaO ASTM D4326 CaSO4 Sulfur ASTM D4239 V, Ni, Na2O, Fe, SiO2, K2O, MgO, Fe2O3, SO3 ASTM D3682 Na K Particulate size distribution -
#4, #14, #28, #48, #100, #270, #325 Tyler mesh
ASTM D4749 Dry Sieve above #100 mesh (note: particle size distribution testing for particles #100 mesh and smaller shall be done by laser particle size testing.)
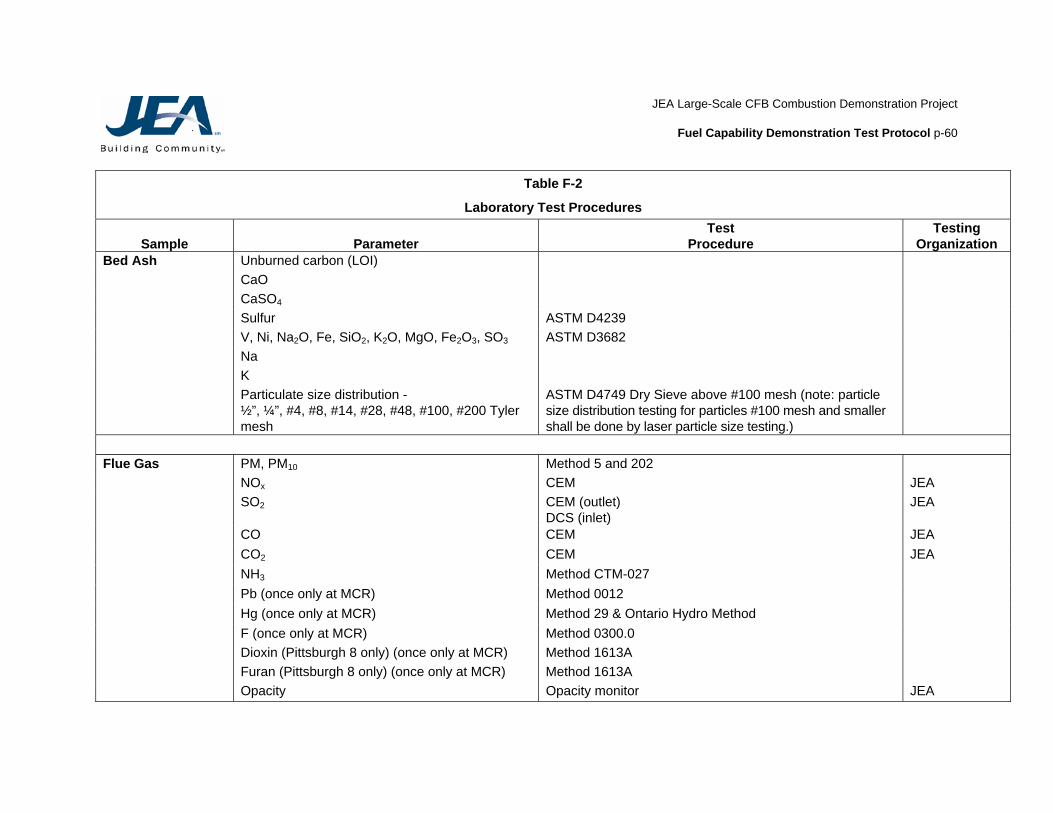
JEA Large-Scale CFB Combustion Demonstration Project
Fuel Capability Demonstration Test Protocol p-60
Table F-2
Laboratory Test Procedures
Sample
Parameter Test
Procedure Testing
Organization Bed Ash Unburned carbon (LOI) CaO CaSO4 Sulfur ASTM D4239 V, Ni, Na2O, Fe, SiO2, K2O, MgO, Fe2O3, SO3 ASTM D3682 Na K Particulate size distribution -
½”, ¼”, #4, #8, #14, #28, #48, #100, #200 Tyler mesh
ASTM D4749 Dry Sieve above #100 mesh (note: particle size distribution testing for particles #100 mesh and smaller shall be done by laser particle size testing.)
Flue Gas PM, PM10 Method 5 and 202 NOx CEM JEA
SO2 CEM (outlet) DCS (inlet)
JEA
CO CEM JEA CO2 CEM JEA NH3 Method CTM-027 Pb (once only at MCR) Method 0012 Hg (once only at MCR) Method 29 & Ontario Hydro Method
F (once only at MCR) Method 0300.0 Dioxin (Pittsburgh 8 only) (once only at MCR) Method 1613A Furan (Pittsburgh 8 only) (once only at MCR) Method 1613A Opacity Opacity monitor JEA
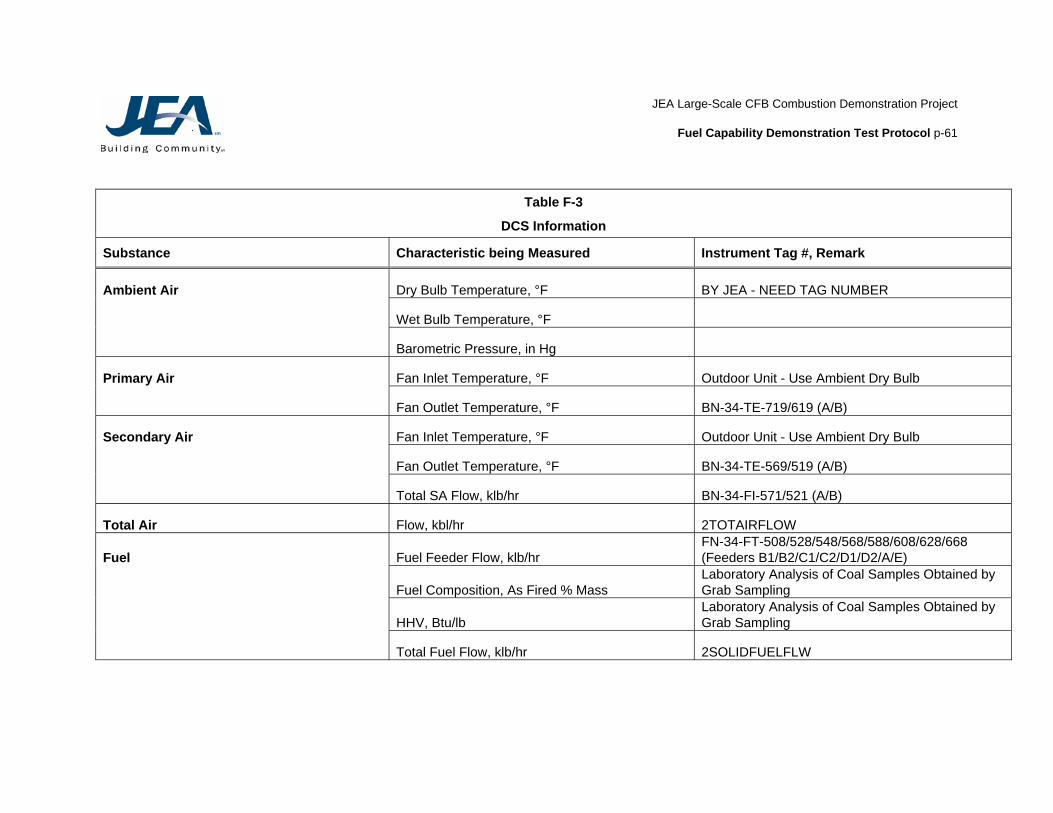
JEA Large-Scale CFB Combustion Demonstration Project
Fuel Capability Demonstration Test Protocol p-61
Table F-3
DCS Information
Substance Characteristic being Measured Instrument Tag #, Remark
Ambient Air Dry Bulb Temperature, °F BY JEA - NEED TAG NUMBER
Wet Bulb Temperature, °F
Barometric Pressure, in Hg
Primary Air Fan Inlet Temperature, °F Outdoor Unit - Use Ambient Dry Bulb
Fan Outlet Temperature, °F BN-34-TE-719/619 (A/B)
Secondary Air Fan Inlet Temperature, °F Outdoor Unit - Use Ambient Dry Bulb
Fan Outlet Temperature, °F BN-34-TE-569/519 (A/B)
Total SA Flow, klb/hr BN-34-FI-571/521 (A/B)
Total Air Flow, kbl/hr 2TOTAIRFLOW
Fuel Fuel Feeder Flow, klb/hr FN-34-FT-508/528/548/568/588/608/628/668 (Feeders B1/B2/C1/C2/D1/D2/A/E)
Fuel Composition, As Fired % Mass Laboratory Analysis of Coal Samples Obtained by Grab Sampling
HHV, Btu/lb Laboratory Analysis of Coal Samples Obtained by Grab Sampling
Total Fuel Flow, klb/hr 2SOLIDFUELFLW

JEA Large-Scale CFB Combustion Demonstration Project
Fuel Capability Demonstration Test Protocol p-62
Table F-3
DCS Information
Substance Characteristic being Measured Instrument Tag #, Remark
Flue Gas SAH Gas In Temperature, °F BO-34-TE-516/517 (A/B)
PAH Gas In Temperature, °F BO-34-TE-518/519 (A/B)
SAHTR Gas Out, °F BO-34-TE-527/528/529 (A SIDE) BO-34-TE-530/531/532 (B SIDE)
PAHTR Gas Out, °F BO-34-TE-537/538/539 (A SIDE) BO-34-TE-540/541/542 (B SIDE)
Bed Pressure, in wg BB-34-PT-423/473/483
Bed Temperature, °F
BB-34-TE-412-417/406-411 (LEFT) BB-34-TE-400-405/462-467 (CENTER) BB-34-TE-456-461/450-455 (RIGHT)
Furnace Bed Average Temperature, °F 2AVGFBTMP
Boiler Exit O2, % Wet BO-34-AT-510/511
SAHTR Exit O2, % Wet Plant Instrument AIT0800D
Stripper/ Cooler A Rotary Valve Speed, % NB-34-ST-552
SC-A Bed 3 Temperature Leaving SC, °F NB-34-TE-553/554
SC-A Bed 3 Temperature Entering SC, °F NB-34-TE-550
Stripper/ Cooler B Rotary Valve Speed, % NB-34-ST-662
SC-B Bed 3 Temperature Leaving SC, °F NB-34-TE-653/654
SC-B Bed 3 Temperature Entering SC, °F NB-34-TE-650
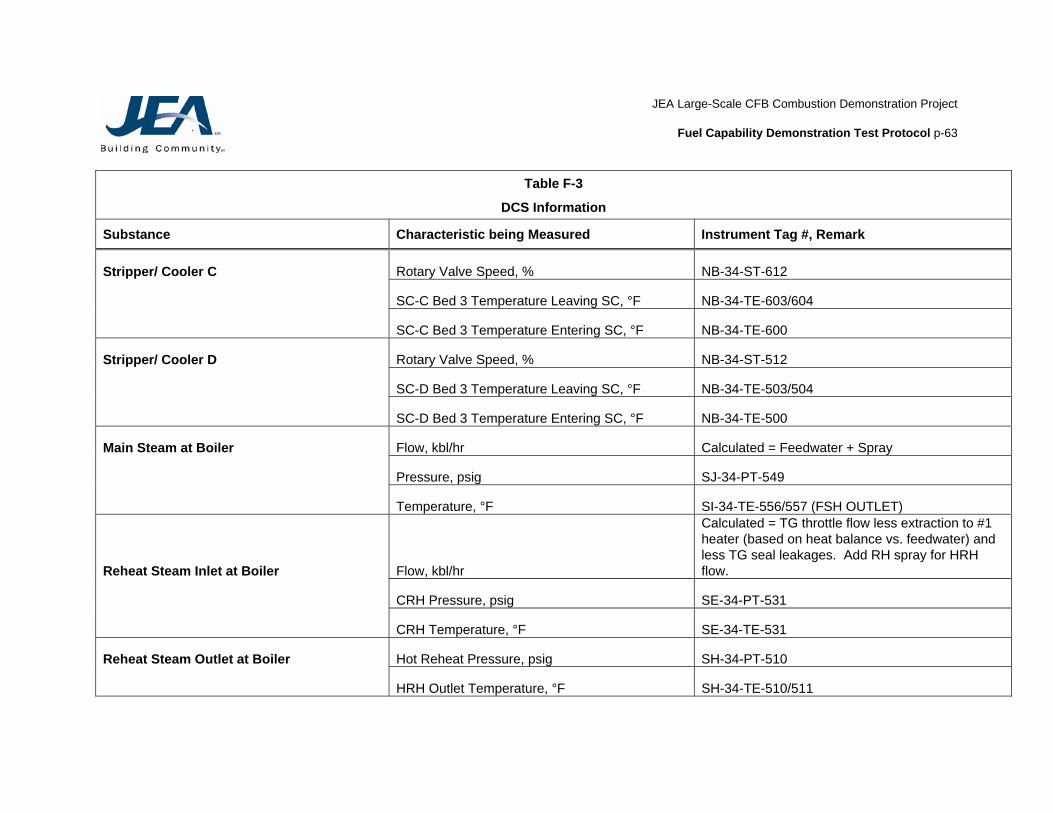
JEA Large-Scale CFB Combustion Demonstration Project
Fuel Capability Demonstration Test Protocol p-63
Table F-3
DCS Information
Substance Characteristic being Measured Instrument Tag #, Remark
Stripper/ Cooler C Rotary Valve Speed, % NB-34-ST-612
SC-C Bed 3 Temperature Leaving SC, °F NB-34-TE-603/604
SC-C Bed 3 Temperature Entering SC, °F NB-34-TE-600
Stripper/ Cooler D Rotary Valve Speed, % NB-34-ST-512
SC-D Bed 3 Temperature Leaving SC, °F NB-34-TE-503/504
SC-D Bed 3 Temperature Entering SC, °F NB-34-TE-500
Main Steam at Boiler Flow, kbl/hr Calculated = Feedwater + Spray
Pressure, psig SJ-34-PT-549
Temperature, °F SI-34-TE-556/557 (FSH OUTLET)
Reheat Steam Inlet at Boiler Flow, kbl/hr
Calculated = TG throttle flow less extraction to #1 heater (based on heat balance vs. feedwater) and less TG seal leakages. Add RH spray for HRH flow.
CRH Pressure, psig SE-34-PT-531
CRH Temperature, °F SE-34-TE-531
Reheat Steam Outlet at Boiler Hot Reheat Pressure, psig SH-34-PT-510
HRH Outlet Temperature, °F SH-34-TE-510/511
JEA Large-Scale CFB Combustion Demonstration Project
Fuel Capability Demonstration Test Protocol p-64
Table F-3
DCS Information
Substance Characteristic being Measured Instrument Tag #, Remark
Feedwater at Boiler Flow Economizer Inlet, klb/hr QF-34-FT-501
Pressure at Economizer Inlet, psig QF-34-PT-510
Temperature at Economizer Inlet, °F QF-34-TE-510
Continuous Blowdown Pressure, psig (Drum Pressure) BB-34-PT-500/501/502
Temperature, °F (At Drum Pressure) Calculated
Flow Rate, lb/hr Calculated based on Valve Position
DSH Spray Water Flow, klb/hr QF-34-FT-500
Pressure, psig QF-34-PT-500
Temperature, °F QF-34-TE-500
RH Spray Water Flow, klb/hr SE-34-FT-582
Pressure, psig SE-34-PT-542
Temperature, °F SE-34-TE-542
Bottom Ash Envelope Boundary Temperature, °F
Composition, %Mass Laboratory Analysis of Bottom Ash Samples Obtained by Grab Sampling
Fly Ash Composition, %Mass Laboratory Analysis of Fly Ash Samples Obtained by Grab Sampling
Flow, lb/hr Isokinetic Sample Collection
JEA Large-Scale CFB Combustion Demonstration Project
Fuel Capability Demonstration Test Protocol p-65
Table F-3
DCS Information
Substance Characteristic being Measured Instrument Tag #, Remark
Main Steam at Turbine Flow, klb/hr 2SF_KLB_H
Pressure, psig 2IP-PSJ-34-PT-509/599 (BYPASS)
Temperature, °F SJ-34-TE-066/067 (GE) SJ-34-TE-509 (BYPASS)
Hot Reheat Steam at Turbine Pressure, psig 2HRHP-PSJ-34-PT-507 (BYPASS)
Temperature, °F 2TT-RHS-1/2 SJ-34-TE-507 (BYPASS)
Feedwater Heater #1 Extraction Pressure, psig SD-34-PT-001
Temperature, °F SD-34-TE-001
Feedwater Heater #1 Drain Pressure, psig Use Extraction Pressure
Temperature, °F HK-34-TE-001
Feedwater Heater #1 Feedwater Entering Pressure, psig QF-34-PT-510 (FEEDWATER)
Temperature, °F QF-34-TE-001
Feedwater Heater #1 Feedwater Leaving Pressure, psig QF-34-PT-510 (FEEDWATER)
Temperature, °F QF-34-TE-510
AQC Inlet SO2 Concentration, lb/Mbtu BO-34-AT-512/513
Pressure, psig RA-34-PT-502
Temperature, °F RA-34-TE-501
JEA Large-Scale CFB Combustion Demonstration Project
Fuel Capability Demonstration Test Protocol p-66
Table F-3
DCS Information
Substance Characteristic being Measured Instrument Tag #, Remark
Scrubber Outlet Pressure, psig RA-34-PT-503
Temperature, °F RA-34-TE-505/506/507/508
Baghouse Outlet Pressure, psig RB-34-PT-900
Temperature, °F RB-34-TE-901
Economizer Outlet - Sample Extraction O2, % wv Temporary Test Instrument
SO2 Concentration, ppm dv Temporary Test Instrument
NOx, ppm dv Temporary Test Instrument
CO, ppm dv Temporary Test Instrument
Particulate, mg/Nm3 Temporary Test Instrument
Stack Emission - CEMS SO2 Concentration, ppm wv LB-34-AY-534
SO2 Emission, lb/Mbtu LB-34-AY-535
NOx Concentration, ppm wv LB-34-AY-532
NOx Emission, lb/Mbtu LB-34-AY-533
Opacity, % LB-34-AT-540
CO2, % wv LB-34-AT-538
CO, ppm wv LB-34-AT-536
Flue Gas Flow, kscfm LB-34-FT-550
DeNOx Ammonia Flow, GPH UR-34-FT-522

JEA Large-Scale CFB Combustion Demonstration Project
Fuel Capability Demonstration Test Protocol p-67
Table F-3
DCS Information
Substance Characteristic being Measured Instrument Tag #, Remark
Boiler Drum Pressure, psig BB-34-PT-500/501/502
Level, in BB-34-LT-500/501/502
Boiler Economizer Outlet Temperature, °F QF-34-TE-512/514
PA Booster Fan Flow, klb/hr BN-34-FI-675/655/635 (A/B/C)
Primary Air Duct to Plenum Flow, klb/hr BN-43-FI-630/650/670
Total FW Fuel Feed PA (Transport Air) Flow, klb/hr BN-34-FI-623/625
Primary Air to SC A Flow, klb/hr
2S_CAHTPA_FL 2S_CACLR12_FL 2S_CACLR3_FL
Primary Air to SC B Flow, klb/hr
2S_CBHTPA_FL 2S_CBCLR12_FL 2S_CBCLR3_FL
Primary Air to SC C Flow, klb/hr
2S_ CCHTPA_FL 2S_CCCLR12_FL 2S_CCCLR3_FL
Primary Air to SC D Flow, klb/hr
2S_CDHTPA_FL 2S_CDCLR12_FL 2S_CDCLR3_FL
PA Flow to Intrex A Flow, klb/hr SI-34-FT-870/878
PA Flow to Intrex B Flow, klb/hr SI-34-FT-770/778
PA Flow to Intrex C Flow, klb/hr SI-34-FT-670/678
Seal Pot Blower Air Flow to Intrex A Flow, klb/hr SI-34-FT-856/840/843/846
JEA Large-Scale CFB Combustion Demonstration Project
Fuel Capability Demonstration Test Protocol p-68
Table F-3
DCS Information
Substance Characteristic being Measured Instrument Tag #, Remark
Seal Pot Blower Air Flow to Intrex B Flow, klb/hr SI-34-FT-756/740/743/746
Seal Pot Blower Air Flow to Intrex C Flow, klb/hr SI-34-FT-656/640/643/646
Intrex Blower Air Flow to Intrex A Flow, klb/hr SI-34-FT-816/800
Intrex Blower Air Flow to Intrex B Flow, klb/hr SI-34-FT-716/700
Intrex Blower Air Flow to Intrex C Flow, klb/hr SI-34-FT-616/600
Furnace Plenum Pressure, psig BN-34-PT-520/521/522
Primary Air Fan Outlet Pressure, psig BN-34-PT-719/619 (A/B)
Primary Air Heater Air Outlet Temperature, °F BN-34-TE-721/621 (A/B)
Total SA Flow, klb/hr BN-34-FI-521/571
Lower Overfire Air FW Flow, klb/hr BN-34-FI-533/589
Upper Overfire Air FW Flow, klb/hr BN-34-FI-539/583
Lower Overfire Air RW Flow, klb/hr BN-34-FI-527/577
SA Fan Outlet Pressure, in wg BN-34-PT-569/519 (A/B)
SA Fan Outlet Temperature, °F BN-34-TE-569/519 (A/B)
SA Airheater Air Out Temperature, °F BN-34-TE-571/521 (A/B)
Inlet Vane A Position, % SI-34-ZT-570
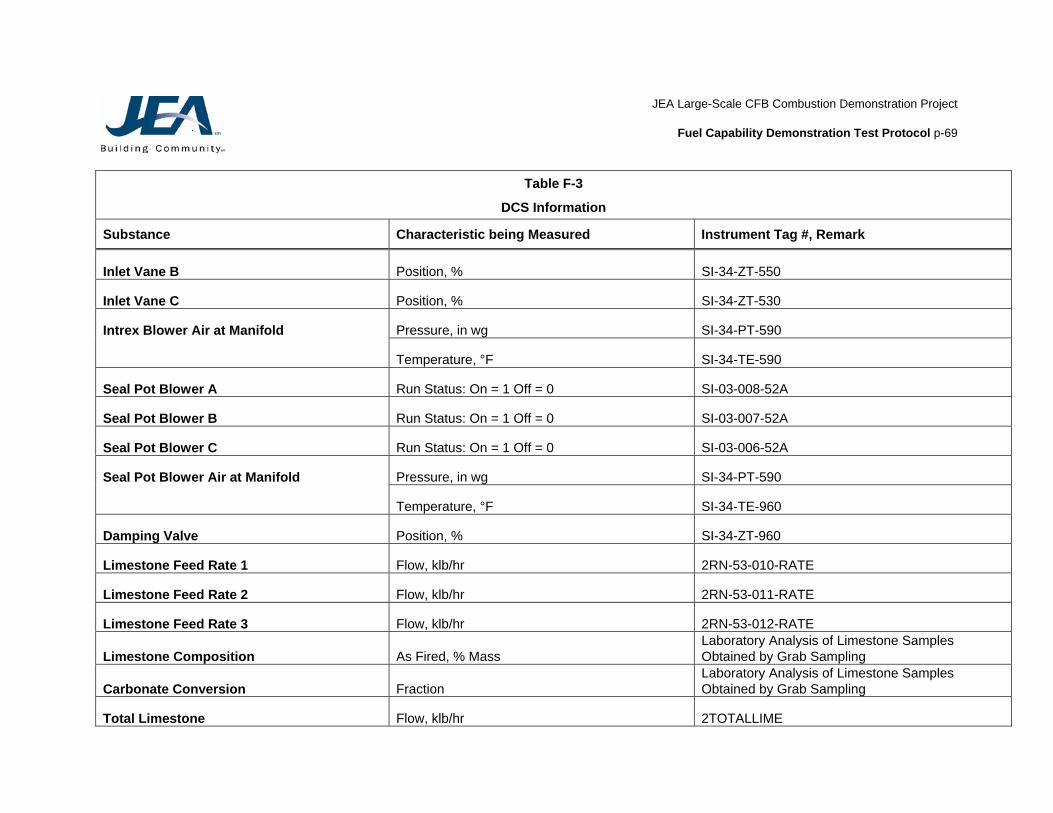
JEA Large-Scale CFB Combustion Demonstration Project
Fuel Capability Demonstration Test Protocol p-69
Table F-3
DCS Information
Substance Characteristic being Measured Instrument Tag #, Remark
Inlet Vane B Position, % SI-34-ZT-550
Inlet Vane C Position, % SI-34-ZT-530
Intrex Blower Air at Manifold Pressure, in wg SI-34-PT-590
Temperature, °F SI-34-TE-590
Seal Pot Blower A Run Status: On = 1 Off = 0 SI-03-008-52A
Seal Pot Blower B Run Status: On = 1 Off = 0 SI-03-007-52A
Seal Pot Blower C Run Status: On = 1 Off = 0 SI-03-006-52A
Seal Pot Blower Air at Manifold Pressure, in wg SI-34-PT-590
Temperature, °F SI-34-TE-960
Damping Valve Position, % SI-34-ZT-960
Limestone Feed Rate 1 Flow, klb/hr 2RN-53-010-RATE
Limestone Feed Rate 2 Flow, klb/hr 2RN-53-011-RATE
Limestone Feed Rate 3 Flow, klb/hr 2RN-53-012-RATE
Limestone Composition As Fired, % Mass Laboratory Analysis of Limestone Samples Obtained by Grab Sampling
Carbonate Conversion Fraction Laboratory Analysis of Limestone Samples Obtained by Grab Sampling
Total Limestone Flow, klb/hr 2TOTALLIME

JEA Large-Scale CFB Combustion Demonstration Project
Fuel Capability Demonstration Test Protocol p-70
Table F-3
DCS Information
Substance Characteristic being Measured Instrument Tag #, Remark
Furnace Freeboard Pressure Differential, in wg BB-34-PT-422/472/482
Furnace Exit Pressure, in wg BB-34-PT-424/425/426
Cyclone A Gas Inlet Temperature, °F SK-34-TE-490/491
Cyclone B Gas Inlet Temperature, °F SK-34-TE-470/471
Cyclone C Gas Inlet Temperature, °F SK-34-TE-450/451
Cyclone A Gas Discharge Temperature, °F SK-34-TE-492
Cyclone B Gas Discharge Temperature, °F SK-34-TE-472
Cyclone C Gas Discharge Temperature, °F SK-34-TE-452
SDA Hopper Temperature, °F RA-34-TE-582
SDA Hopper Differential Temperature, °F 2TDI-582
Recycle Slurry Mix Tank Level, % RA-34-LT-601
Recycle Slurry Storage Tank Level, % RA-34-LT-701
Recycle Mix Tank Lime Slurry Flow, GPM RL-34-FT-545
Heater Recycle Water Flow, GPM RL-34-FT-920
Recycle Slurry Density, lb/ft3 RA-34-DT-630
Lime Slurry to Feed Slurry Transfer Pump Flow, GPM RA-34-FT-535

JEA Large-Scale CFB Combustion Demonstration Project
Fuel Capability Demonstration Test Protocol p-71
Table F-3
DCS Information
Substance Characteristic being Measured Instrument Tag #, Remark
SDA Feed Slurry Flow, GPM RA-34-FT-530
Fabric Filter Differential Pressure, in wg 2PDI504-OUTL
SDA Differential Pressure, in wg 2PDI504-INL
Condensate Cooling Water Temp to Stripper Cooler, °F HF34-TE-607
Condensate Cooling Water Outlet Temp Stripper Cooler A, °F HF34-TE-606
Stripper Cooler B, °F HF34-TE-616
Stripper Cooler C, °F HF34-TE-611
Stripper Cooler D, °F HF34-TE-601
Condensate Cooling Water Flow To Stripper Coolers, gpm HF34-FT-004
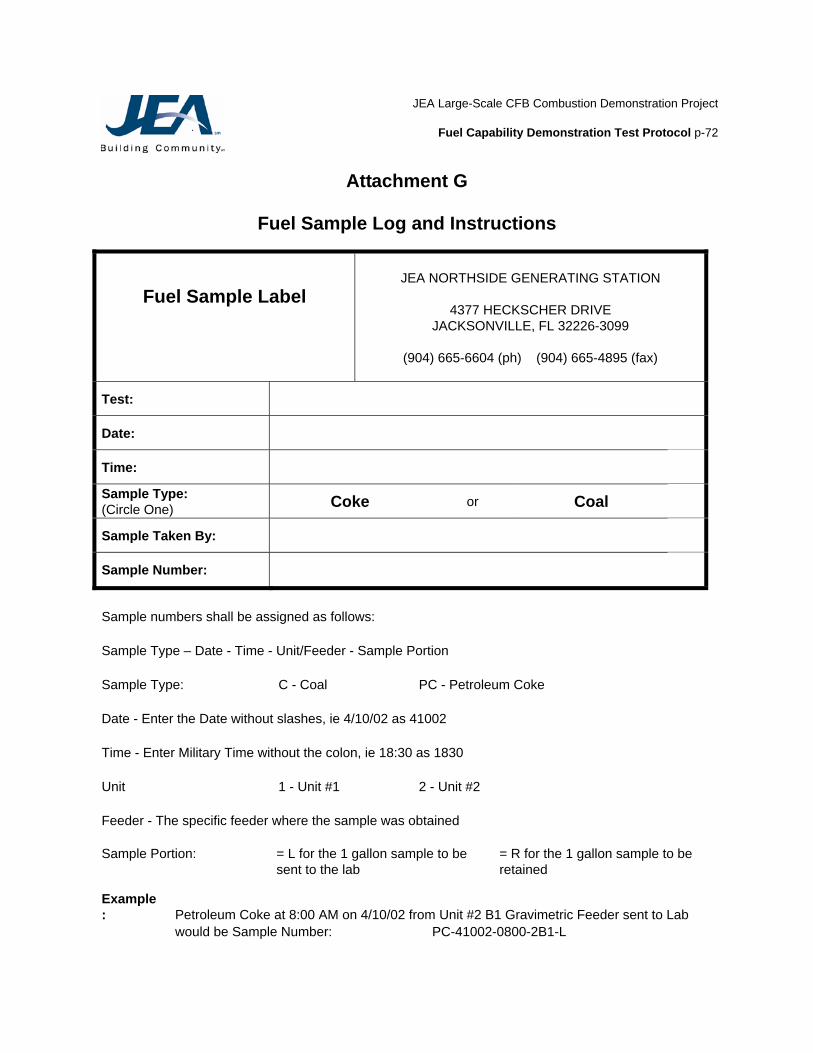
JEA Large-Scale CFB Combustion Demonstration Project
Fuel Capability Demonstration Test Protocol p-72
Attachment G
Fuel Sample Log and Instructions
Fuel Sample Label
JEA NORTHSIDE GENERATING STATION
4377 HECKSCHER DRIVE
JACKSONVILLE, FL 32226-3099
(904) 665-6604 (ph) (904) 665-4895 (fax)
Test:
Date:
Time: Sample Type: (Circle One) Coke or Coal
Sample Taken By:
Sample Number: Sample numbers shall be assigned as follows: Sample Type – Date - Time - Unit/Feeder - Sample Portion Sample Type: C - Coal PC - Petroleum Coke Date - Enter the Date without slashes, ie 4/10/02 as 41002 Time - Enter Military Time without the colon, ie 18:30 as 1830 Unit 1 - Unit #1 2 - Unit #2 Feeder - The specific feeder where the sample was obtained Sample Portion:
= L for the 1 gallon sample to be sent to the lab
= R for the 1 gallon sample to be retained
Example: Petroleum Coke at 8:00 AM on 4/10/02 from Unit #2 B1 Gravimetric Feeder sent to Lab would be Sample Number: PC-41002-0800-2B1-L
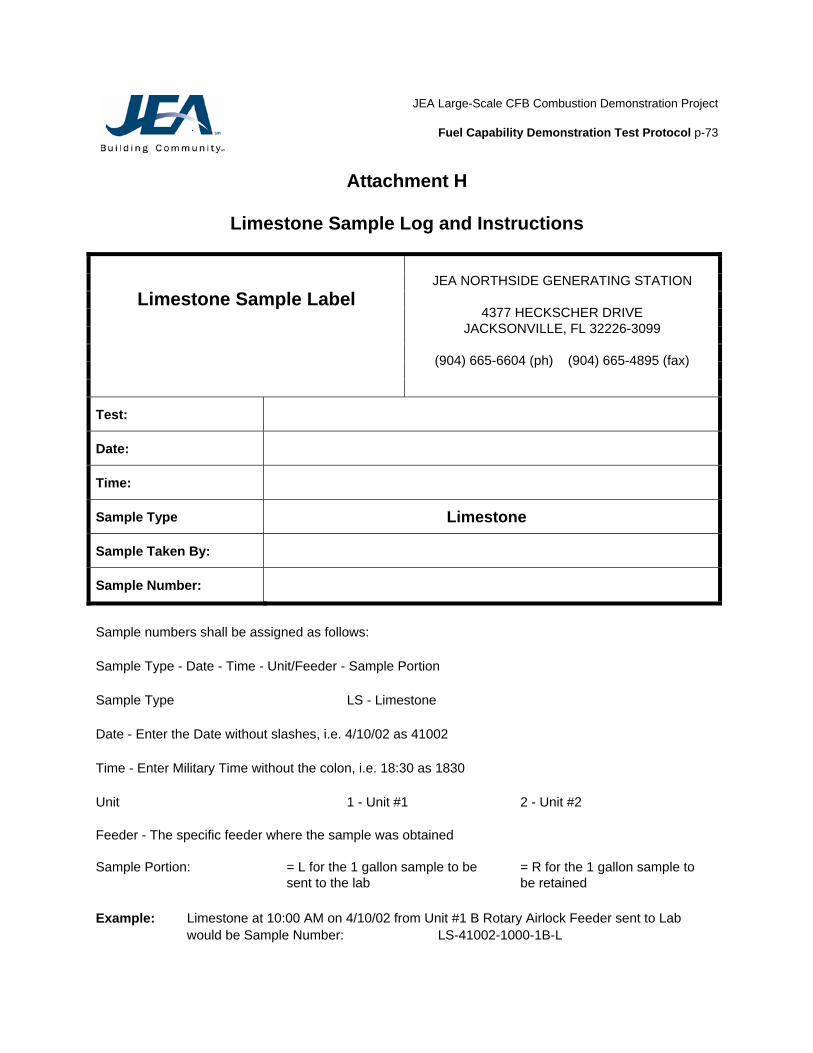
JEA Large-Scale CFB Combustion Demonstration Project
Fuel Capability Demonstration Test Protocol p-73
Attachment H
Limestone Sample Log and Instructions
Limestone Sample Label
JEA NORTHSIDE GENERATING STATION
4377 HECKSCHER DRIVE
JACKSONVILLE, FL 32226-3099
(904) 665-6604 (ph) (904) 665-4895 (fax)
Test:
Date:
Time:
Sample Type Limestone
Sample Taken By:
Sample Number: Sample numbers shall be assigned as follows: Sample Type - Date - Time - Unit/Feeder - Sample Portion Sample Type LS - Limestone Date - Enter the Date without slashes, i.e. 4/10/02 as 41002 Time - Enter Military Time without the colon, i.e. 18:30 as 1830 Unit 1 - Unit #1 2 - Unit #2 Feeder - The specific feeder where the sample was obtained Sample Portion:
= L for the 1 gallon sample to be sent to the lab
= R for the 1 gallon sample to be retained
Example: Limestone at 10:00 AM on 4/10/02 from Unit #1 B Rotary Airlock Feeder sent to Lab would be Sample Number: LS-41002-1000-1B-L
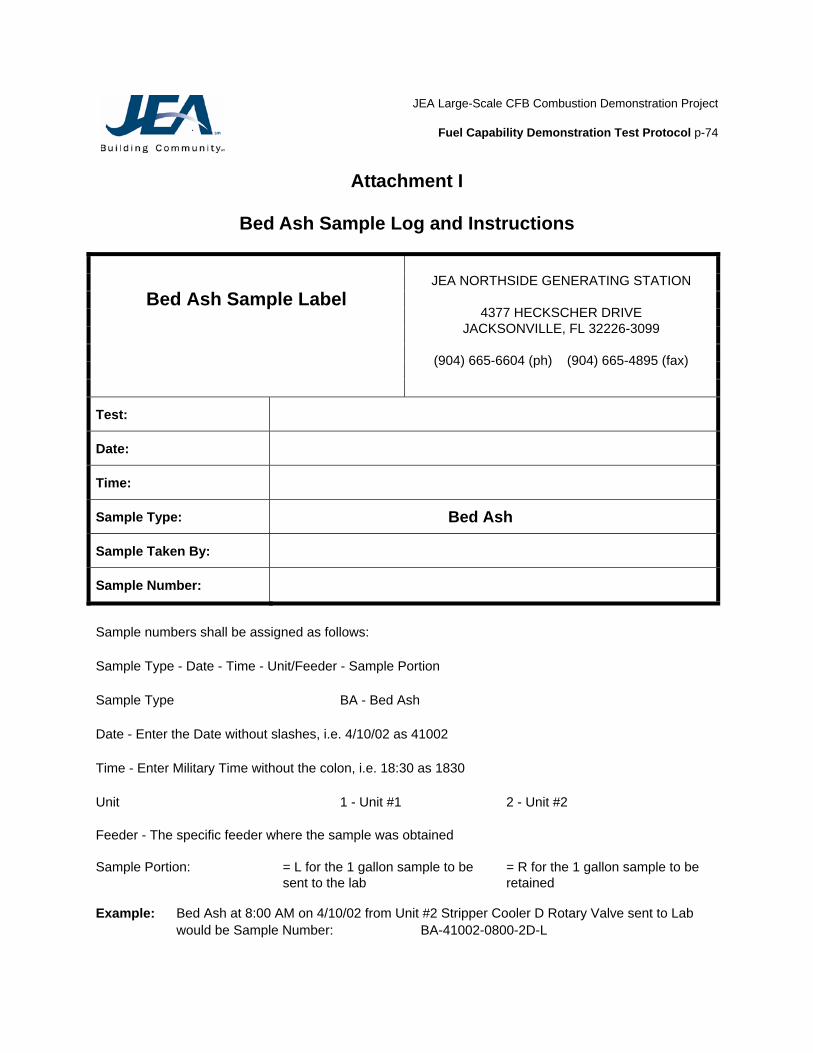
JEA Large-Scale CFB Combustion Demonstration Project
Fuel Capability Demonstration Test Protocol p-74
Attachment I
Bed Ash Sample Log and Instructions
Bed Ash Sample Label
JEA NORTHSIDE GENERATING STATION
4377 HECKSCHER DRIVE
JACKSONVILLE, FL 32226-3099
(904) 665-6604 (ph) (904) 665-4895 (fax)
Test:
Date:
Time:
Sample Type: Bed Ash
Sample Taken By:
Sample Number: Sample numbers shall be assigned as follows: Sample Type - Date - Time - Unit/Feeder - Sample Portion Sample Type BA - Bed Ash Date - Enter the Date without slashes, i.e. 4/10/02 as 41002 Time - Enter Military Time without the colon, i.e. 18:30 as 1830 Unit 1 - Unit #1 2 - Unit #2 Feeder - The specific feeder where the sample was obtained Sample Portion:
= L for the 1 gallon sample to be sent to the lab
= R for the 1 gallon sample to be retained
Example: Bed Ash at 8:00 AM on 4/10/02 from Unit #2 Stripper Cooler D Rotary Valve sent to Lab would be Sample Number: BA-41002-0800-2D-L
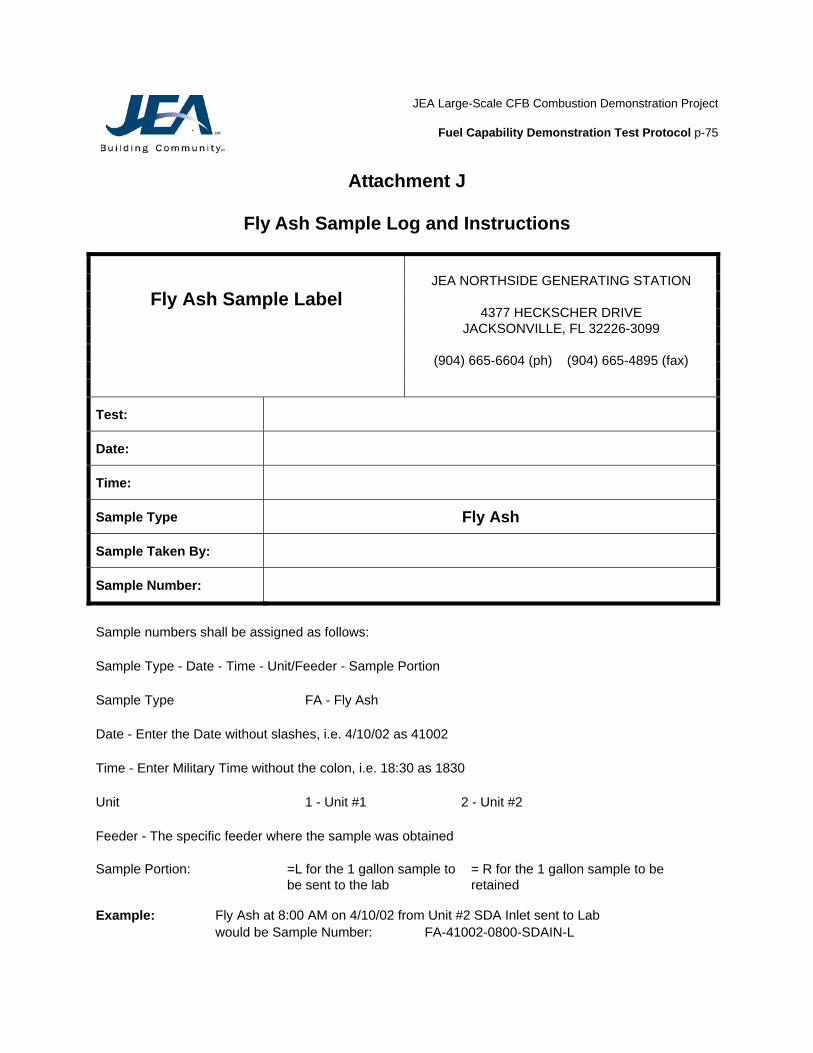
JEA Large-Scale CFB Combustion Demonstration Project
Fuel Capability Demonstration Test Protocol p-75
Attachment J
Fly Ash Sample Log and Instructions
Fly Ash Sample Label
JEA NORTHSIDE GENERATING STATION
4377 HECKSCHER DRIVE
JACKSONVILLE, FL 32226-3099
(904) 665-6604 (ph) (904) 665-4895 (fax)
Test:
Date:
Time:
Sample Type Fly Ash
Sample Taken By:
Sample Number: Sample numbers shall be assigned as follows: Sample Type - Date - Time - Unit/Feeder - Sample Portion Sample Type FA - Fly Ash Date - Enter the Date without slashes, i.e. 4/10/02 as 41002 Time - Enter Military Time without the colon, i.e. 18:30 as 1830 Unit 1 - Unit #1 2 - Unit #2 Feeder - The specific feeder where the sample was obtained Sample Portion:
=L for the 1 gallon sample to be sent to the lab
= R for the 1 gallon sample to be retained
Example: Fly Ash at 8:00 AM on 4/10/02 from Unit #2 SDA Inlet sent to Lab would be Sample Number: FA-41002-0800-SDAIN-L
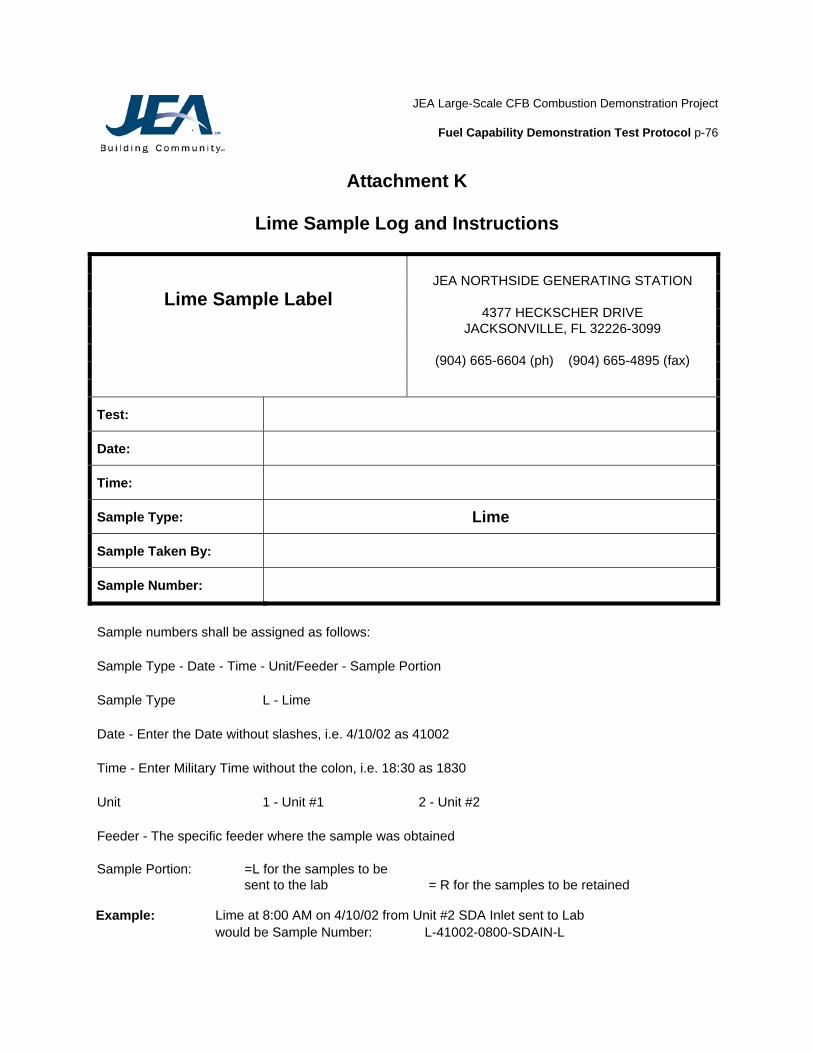
JEA Large-Scale CFB Combustion Demonstration Project
Fuel Capability Demonstration Test Protocol p-76
Attachment K
Lime Sample Log and Instructions
Lime Sample Label
JEA NORTHSIDE GENERATING STATION
4377 HECKSCHER DRIVE
JACKSONVILLE, FL 32226-3099
(904) 665-6604 (ph) (904) 665-4895 (fax)
Test:
Date:
Time:
Sample Type: Lime
Sample Taken By:
Sample Number: Sample numbers shall be assigned as follows: Sample Type - Date - Time - Unit/Feeder - Sample Portion Sample Type L - Lime Date - Enter the Date without slashes, i.e. 4/10/02 as 41002 Time - Enter Military Time without the colon, i.e. 18:30 as 1830 Unit 1 - Unit #1 2 - Unit #2 Feeder - The specific feeder where the sample was obtained Sample Portion:
=L for the samples to be sent to the lab = R for the samples to be retained
Example: Lime at 8:00 AM on 4/10/02 from Unit #2 SDA Inlet sent to Lab would be Sample Number: L-41002-0800-SDAIN-L
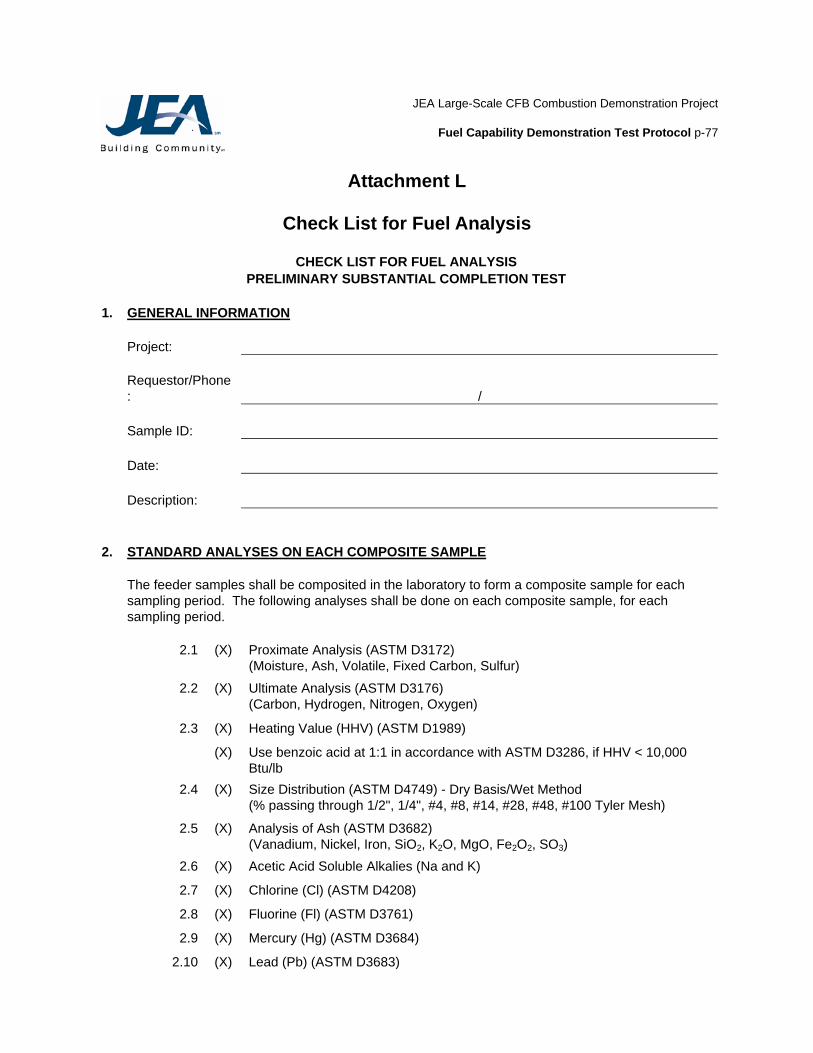
JEA Large-Scale CFB Combustion Demonstration Project
Fuel Capability Demonstration Test Protocol p-77
Attachment L
Check List for Fuel Analysis
CHECK LIST FOR FUEL ANALYSIS PRELIMINARY SUBSTANTIAL COMPLETION TEST
1. GENERAL INFORMATION Project:
Requestor/Phone: /
Sample ID: Date: Description: 2. STANDARD ANALYSES ON EACH COMPOSITE SAMPLE
The feeder samples shall be composited in the laboratory to form a composite sample for each sampling period. The following analyses shall be done on each composite sample, for each sampling period.
2.1 (X) Proximate Analysis (ASTM D3172) (Moisture, Ash, Volatile, Fixed Carbon, Sulfur)
2.2 (X) Ultimate Analysis (ASTM D3176) (Carbon, Hydrogen, Nitrogen, Oxygen)
2.3 (X) Heating Value (HHV) (ASTM D1989)
(X) Use benzoic acid at 1:1 in accordance with ASTM D3286, if HHV < 10,000
Btu/lb
2.4 (X) Size Distribution (ASTM D4749) - Dry Basis/Wet Method (% passing through 1/2", 1/4", #4, #8, #14, #28, #48, #100 Tyler Mesh)
2.5 (X) Analysis of Ash (ASTM D3682)
(Vanadium, Nickel, Iron, SiO2, K2O, MgO, Fe2O2, SO3)
2.6 (X) Acetic Acid Soluble Alkalies (Na and K)
2.7 (X) Chlorine (Cl) (ASTM D4208)
2.8 (X) Fluorine (Fl) (ASTM D3761)
2.9 (X) Mercury (Hg) (ASTM D3684)
2.10 (X) Lead (Pb) (ASTM D3683)

JEA Large-Scale CFB Combustion Demonstration Project
Fuel Capability Demonstration Test Protocol p-78
Attachment M
Check List for Limestone Analysis
CHECK LIST FOR LIMESTONE ANALYSIS PRELIMINARY SUBSTANTIAL COMPLETION TEST
1. GENERAL INFORMATION Project:
Requestor/Phone: /
Sample ID: Date: Description: 2. STANDARD ANALYSES ON EACH COMPOSITE SAMPLE
The feeder samples shall be composited in the laboratory to form a composite sample for each sampling period. The following analyses shall be done on each composite sample, for each sampling period.
2.1 (X) % By Weight CaCO3 (ASTM D4326)
2.2 (X) % By Weight MgCO3 (ASTM D4326)
2.3 (X) % By Weight Moisture - By oven drying to constant weight
2.4 (X) % By Weight Inerts - By difference
2.5 (X) Size Distribution (ASTM D4749) Wet/Dry Sieve
(#8, #14, #28, #48, #100, #200, #270 Tyler Mesh)
2.6 (X) Deleted
2.7 (X) Fluorine (Fl) (ASTM D3671)
2.8 (X) Mercury (Hg) (ASTM D3684)
2.9 (X) Lead (Pb) (ASTM D3683) 3. STANDARD ANALYSES ON COMPOSITE TEST SAMPLE
A one-gallon portion of the composite sample for each two-hour time period shall be forwarded to Foster Wheeler's laboratories for testing as follows:
3.1 (X) TGA Reactivity index

JEA Large-Scale CFB Combustion Demonstration Project
Fuel Capability Demonstration Test Protocol p-79
Attachment N
Check List for Bed Ash Analysis
CHECK LIST FOR BED ASH ANALYSIS PRELIMINARY SUBSTANTIAL COMPLETION TEST
1. GENERAL INFORMATION Project:
Requestor/Phone: /
Sample ID: Date: Description: 2. STANDARD ANALYSES ON EACH COMPOSITE SAMPLE (DRY BASIS)
2.1 (X) Total Carbon (% By Weight) using LECO CHN 600 Analyzer (or equal) according to ASTM D3178. See Attachment R for a detailed description.
2.2 (X) Organic Carbon (% By Weight) using HCl treated sample and LECO CHN 600 Analyzer (or equal) according to ASTM D3178. See Attachment R for a detailed description.
2.3 (X) Total Calcium (% By Weight) (ASTM D3682) 2.4 (X) Total Sulfur (% By Weight) (ASTM D4239)
2.5 (X) Size Distribution by Sieve Analysis.
(1/2", 1/4", #4, #8, #14, #28, #48, #100, #200, Tyler Mesh) 2.6 (X) Bulk Density (lb/ft3)

JEA Large-Scale CFB Combustion Demonstration Project
Fuel Capability Demonstration Test Protocol p-80
Attachment O
Check List for Fly Ash Analysis
CHECK LIST FOR FLY ASH ANALYSIS PRELIMINARY SUBSTANTIAL COMPLETION TEST
1. GENERAL INFORMATION Project:
Requestor/Phone: /
Sample ID: Date: Description: 2. STANDARD ANALYSES ON EACH COMPOSITE SAMPLE (DRY BASIS)
2.1 (X) Total Carbon (% By Weight) using LECO CHN 600 Analyzer (or equal) according to ASTM D3178. See Attachment R for a detailed description.
2.2 (X) Organic Carbon (% By Weight) using HCl treated sample and LECO CHN 600 Analyzer (or equal) according to ASTM D3178. See Attachment R for a detailed description.
2.3 (X) Total Calcium (% By Weight) (ASTM D3682) 2.4 (X) Total Sulfur (% By Weight) (ASTM D4239)
2.5 (X) Size Distribution by Sieve Analysis.
(#4, #14, #28, #48, #100, #270, #325 Tyler Mesh) 2.6 (X) Bulk Density (lb/ft3)
2.7 (X) Available Ca (% By Weight)
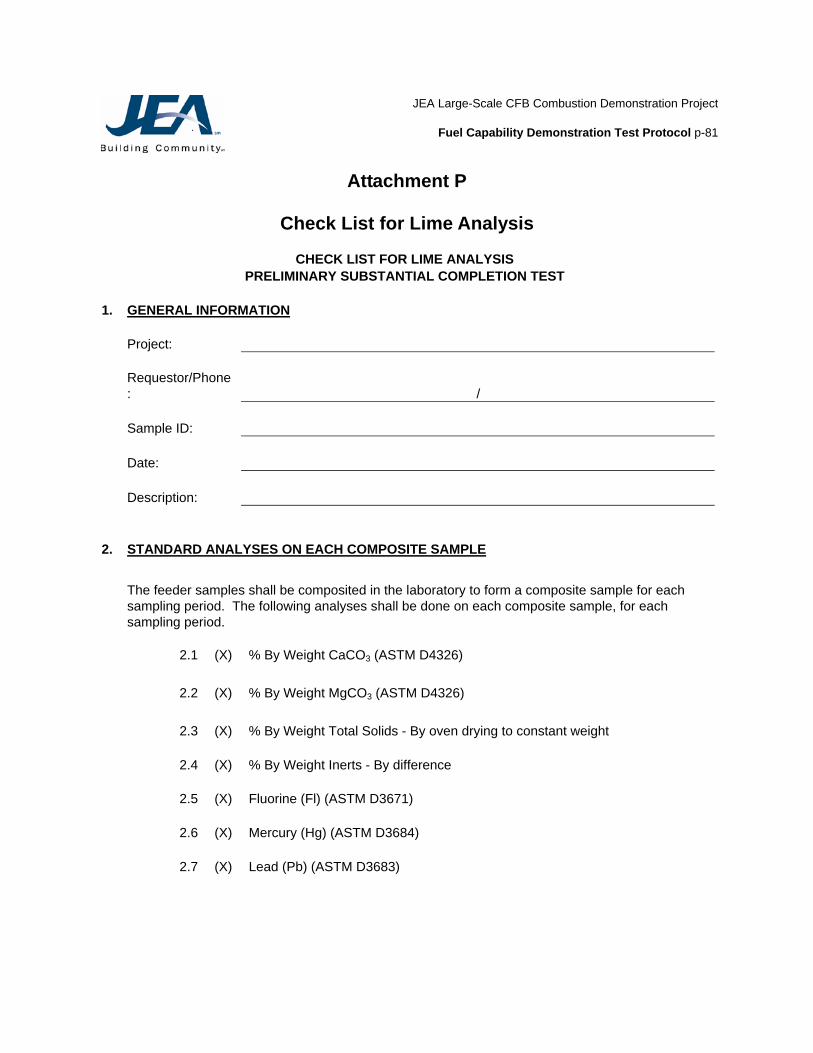
JEA Large-Scale CFB Combustion Demonstration Project
Fuel Capability Demonstration Test Protocol p-81
Attachment P
Check List for Lime Analysis
CHECK LIST FOR LIME ANALYSIS PRELIMINARY SUBSTANTIAL COMPLETION TEST
1. GENERAL INFORMATION Project:
Requestor/Phone: /
Sample ID: Date: Description: 2. STANDARD ANALYSES ON EACH COMPOSITE SAMPLE
The feeder samples shall be composited in the laboratory to form a composite sample for each sampling period. The following analyses shall be done on each composite sample, for each sampling period.
2.1 (X) % By Weight CaCO3 (ASTM D4326) 2.2 (X) % By Weight MgCO3 (ASTM D4326) 2.3 (X) % By Weight Total Solids - By oven drying to constant weight 2.4 (X) % By Weight Inerts - By difference 2.5 (X) Fluorine (Fl) (ASTM D3671) 2.6 (X) Mercury (Hg) (ASTM D3684) 2.7 (X) Lead (Pb) (ASTM D3683)

JEA Large-Scale CFB Combustion Demonstration Project
Fuel Capability Demonstration Test Protocol p-82
Attachment Q
Incoming/Outgoing Sample Log Sheets
JEA Large-Scale CFB Combustion Demonstration Project
Fuel Capability Demonstration Test Protocol p-83
JEA LARGE-SCALE CFB COMBUSTION DEMONSTRATION PROJECT FUEL CAPABILITY DEMONSTRATION TEST PROTOCOL
BED ASH SAMPLE LOG SHEET JANUARY 12-16, 2004
DATE TO
LAB/STORAGE SAMPLE NUMBER TEST
ID SAMPLE
TAKEN BY LAB STORAGE
ANALYSIS RECEIVED FROM LAB
(DATE)
COMMENTS
BA – 041002 – 0800 – 2 B - L
(2) ONE-GALLON SAMPLES OF BED ASH TO BE TAKEN AT 100% LOAD TEST ONLY page 1 of 1 AT START OF THE TEST AND AT THE START OF EACH HOUR OF THE TEST. STRIPPER COOLER B

JEA Large-Scale CFB Combustion Demonstration Project
Fuel Capability Demonstration Test Protocol p-84
JEA LARGE-SCALE CFB COMBUSTION DEMONSTRATION PROJECT FUEL CAPABILITY DEMONSTRATION TEST PROTOCOL
BED ASH SAMPLE LOG SHEET JANUARY 12-16, 2004
DATE TO
LAB/STORAGE SAMPLE NUMBER TEST
ID SAMPLE
TAKEN BY LAB STORAGE
ANALYSIS RECEIVED FROM LAB
(DATE)
COMMENTS
BA – 041002 – 0800 – 2 C - L
(2) ONE-GALLON SAMPLES OF BED ASH TO BE TAKEN AT 100% LOAD TEST ONLY page 1 of 1 AT START OF THE TEST AND AT THE START OF EACH HOUR OF THE TEST. STRIPPER COOLER C

JEA Large-Scale CFB Combustion Demonstration Project
Fuel Capability Demonstration Test Protocol p-85
JEA LARGE-SCALE CFB COMBUSTION DEMONSTRATION PROJECT FUEL CAPABILITY DEMONSTRATION TEST PROTOCOL
BED ASH SAMPLE LOG SHEET JANUARY 12-16, 2004
DATE TO
LAB/STORAGE SAMPLE NUMBER TEST
ID SAMPLE
TAKEN BY LAB STORAGE
ANALYSIS RECEIVED FROM LAB
(DATE)
COMMENTS
BA – 041002 – 0800 – 2 D - L
(2) ONE-GALLON SAMPLES OF BED ASH TO BE TAKEN AT 100% LOAD TEST ONLY page 1 of 1 AT START OF THE TEST AND AT THE START OF EACH HOUR OF THE TEST. STRIPPER COOLER D

JEA Large-Scale CFB Combustion Demonstration Project
Fuel Capability Demonstration Test Protocol p-86
JEA LARGE-SCALE CFB COMBUSTION DEMONSTRATION PROJECT FUEL CAPABILITY DEMONSTRATION TEST PROTOCOL
FLY ASH SAMPLE LOG SHEET JANUARY 12-16, 2004
DATE TO
LAB/STORAGE SAMPLE NUMBER TEST
ID SAMPLE
TAKEN BY LAB STORAGE
ANALYSIS RECEIVED FROM LAB
(DATE)
COMMENTS
FA – 041002 – 0800 – SDA IN - L
page 1 of 1 SAMPLES TAKEN PER ARTICLE 907 OF THE TEST PROTOCOL. SDA INLET
JEA Large-Scale CFB Combustion Demonstration Project
Fuel Capability Demonstration Test Protocol p-87
JEA LARGE-SCALE CFB COMBUSTION DEMONSTRATION PROJECT FUEL CAPABILITY DEMONSTRATION TEST PROTOCOL
FLY ASH SAMPLE LOG SHEET JANUARY 12-16, 2004
DATE TO
LAB/STORAGE SAMPLE NUMBER TEST
ID SAMPLE
TAKEN BY LAB STORAGE
ANALYSIS RECEIVED FROM LAB
(DATE)
COMMENTS
FA – 041002 – 0800 – AH HPR - L
page 1 of 1 SAMPLES TAKEN PER ARTICLE 907 OF THE TEST PROTOCOL. AIR HTR HPR

JEA Large-Scale CFB Combustion Demonstration Project
Fuel Capability Demonstration Test Protocol p-88
JEA LARGE-SCALE CFB COMBUSTION DEMONSTRATION PROJECT FUEL CAPABILITY DEMONSTRATION TEST PROTOCOL
FLY ASH SAMPLE LOG SHEET JANUARY 12-16, 2004
DATE TO
LAB/STORAGE SAMPLE NUMBER TEST
ID SAMPLE
TAKEN BY LAB STORAGE
ANALYSIS RECEIVED FROM LAB
(DATE)
COMMENTS
FA – 041002 – 0800 – FF HPR - L
page 1 of 1 SAMPLES TAKEN PER ARTICLE 907 OF THE TEST PROTOCOL. FAB FLTR HPR
JEA Large-Scale CFB Combustion Demonstration Project
Fuel Capability Demonstration Test Protocol p-89
JEA LARGE-SCALE CFB COMBUSTION DEMONSTRATION PROJECT FUEL CAPABILITY DEMONSTRATION TEST PROTOCOL
FUEL SAMPLE LOG SHEET JANUARY 12-16, 2004
DATE TO
LAB/STORAGE SAMPLE NUMBER TEST
ID SAMPLE
TAKEN BY LAB STORAGE
ANALYSIS RECEIVED FROM LAB
(DATE)
COMMENTS
C – 041002 – 0800 – 2 C1 – L
(2) ONE-GALLON FUEL SAMPLES TAKEN AT 100% LOAD TEST ONLY page 1 of 1 AT START OF THE TEST AND AT THE START OF EACH HOUR OF THE TEST. FEEDER C1

JEA Large-Scale CFB Combustion Demonstration Project
Fuel Capability Demonstration Test Protocol p-90
JEA LARGE-SCALE CFB COMBUSTION DEMONSTRATION PROJECT FUEL CAPABILITY DEMONSTRATION TEST PROTOCOL
FUEL SAMPLE LOG SHEET JANUARY 12-16, 2004
DATE TO
LAB/STORAGE SAMPLE NUMBER TEST
ID SAMPLE
TAKEN BY LAB STORAGE
ANALYSIS RECEIVED FROM LAB
(DATE)
COMMENTS
C – 041002 – 0800 – 2 C2 – L
(2) ONE-GALLON FUEL SAMPLES TAKEN AT 100% LOAD TEST ONLY page 1 of 1 AT START OF THE TEST AND AT THE START OF EACH HOUR OF THE TEST. FEEDER C2

JEA Large-Scale CFB Combustion Demonstration Project
Fuel Capability Demonstration Test Protocol p-91
JEA LARGE-SCALE CFB COMBUSTION DEMONSTRATION PROJECT FUEL CAPABILITY DEMONSTRATION TEST PROTOCOL
FUEL SAMPLE LOG SHEET JANUARY 12-16, 2004
DATE TO
LAB/STORAGE SAMPLE NUMBER TEST
ID SAMPLE
TAKEN BY LAB STORAGE
ANALYSIS RECEIVED FROM LAB
(DATE)
COMMENTS
C – 041002 – 0800 – 2 D1 – L
(2) ONE-GALLON FUEL SAMPLES TAKEN AT 100% LOAD TEST ONLY page 1 of 1 AT START OF THE TEST AND AT THE START OF EACH HOUR OF THE TEST. FEEDER D1

JEA Large-Scale CFB Combustion Demonstration Project
Fuel Capability Demonstration Test Protocol p-92
JEA LARGE-SCALE CFB COMBUSTION DEMONSTRATION PROJECT FUEL CAPABILITY DEMONSTRATION TEST PROTOCOL
FUEL SAMPLE LOG SHEET JANUARY 12-16, 2004
DATE TO
LAB/STORAGE SAMPLE NUMBER TEST
ID SAMPLE
TAKEN BY LAB STORAGE
ANALYSIS RECEIVED FROM LAB
(DATE)
COMMENTS
C – 041002 – 0800 - 2 D2 – L
(2) ONE-GALLON FUEL SAMPLES TAKEN AT 100% LOAD TEST ONLY page 1 of 1 AT START OF THE TEST AND AT THE START OF EACH HOUR OF THE TEST. FEEDER D2

JEA Large-Scale CFB Combustion Demonstration Project
Fuel Capability Demonstration Test Protocol p-93
JEA LARGE-SCALE CFB COMBUSTION DEMONSTRATION PROJECT FUEL CAPABILITY DEMONSTRATION TEST PROTOCOL
FUEL SAMPLE LOG SHEET JANUARY 12-16, 2004
DATE TO
LAB/STORAGE SAMPLE NUMBER TEST
ID SAMPLE
TAKEN BY LAB STORAGE
ANALYSIS RECEIVED FROM LAB
(DATE)
COMMENTS
C – 041002 – 0800 – 2 E1 – L
(2) ONE-GALLON FUEL SAMPLES TAKEN AT 100% LOAD TEST ONLY page 1 of 1 AT START OF THE TEST AND AT THE START OF EACH HOUR OF THE TEST. FEEDER E1

JEA Large-Scale CFB Combustion Demonstration Project
Fuel Capability Demonstration Test Protocol p-94
JEA LARGE-SCALE CFB COMBUSTION DEMONSTRATION PROJECT FUEL CAPABILITY DEMONSTRATION TEST PROTOCOL
LIME SAMPLE LOG SHEET JANUARY 12-16, 2004
DATE TO
LAB/STORAGE SAMPLE NUMBER TEST
ID SAMPLE
TAKEN BY LAB STORAGE
ANALYSIS RECEIVED FROM LAB
(DATE)
COMMENTS
L – 041002 – 0800 – SDA IN – L
(2) ONE-GALLON LIME SLURRY SAMPLES TAKEN AT 100% LOAD TEST ONLY page 1 of 1 AT START OF THE TEST AND AT THE START OF EACH HOUR OF THE TEST. SDA INLET

JEA Large-Scale CFB Combustion Demonstration Project
Fuel Capability Demonstration Test Protocol p-95
JEA LARGE-SCALE CFB COMBUSTION DEMONSTRATION PROJECT FUEL CAPABILITY DEMONSTRATION TEST PROTOCOL
LIMESTONE SAMPLE LOG SHEET JANUARY 12-16, 2004
DATE TO
LAB/STORAGE SAMPLE NUMBER TEST
ID SAMPLE
TAKEN BY LAB STORAGE
ANALYSIS RECEIVED FROM LAB
(DATE)
COMMENTS
LS – 041002 – 0800 – 2 A – L
(2) ONE-GALLON LIMESTONE SAMPLES TAKEN AT 100% LOAD TEST ONLY page 1 of 1 AT START OF THE TEST AND AT THE START OF EACH HOUR OF THE TEST. FEEDER A
JEA Large-Scale CFB Combustion Demonstration Project
Fuel Capability Demonstration Test Protocol p-96
JEA LARGE-SCALE CFB COMBUSTION DEMONSTRATION PROJECT FUEL CAPABILITY DEMONSTRATION TEST PROTOCOL
LIMESTONE SAMPLE LOG SHEET JANUARY 12-16, 2004
DATE TO
LAB/STORAGE SAMPLE NUMBER TEST
ID SAMPLE
TAKEN BY LAB STORAGE
ANALYSIS RECEIVED FROM LAB
(DATE)
COMMENTS
LS – 041002 – 0800 – 2 B – L
(2) ONE-GALLON LIMESTONE SAMPLES TAKEN AT 100% LOAD TEST ONLY page 1 of 1 AT START OF THE TEST AND AT THE START OF EACH HOUR OF THE TEST. FEEDER B

JEA Large-Scale CFB Combustion Demonstration Project
Fuel Capability Demonstration Test Protocol p-97
JEA LARGE-SCALE CFB COMBUSTION DEMONSTRATION PROJECT FUEL CAPABILITY DEMONSTRATION TEST PROTOCOL
LIMESTONE SAMPLE LOG SHEET JANUARY 12-16, 2004
DATE TO
LAB/STORAGE SAMPLE NUMBER TEST
ID SAMPLE
TAKEN BY LAB STORAGE
ANALYSIS RECEIVED FROM LAB
(DATE)
COMMENTS
LS – 041002 – 0800 – 2 C – L
(2) ONE-GALLON LIMESTONE SAMPLES TAKEN AT 100% LOAD TEST ONLY page 1 of 1 AT START OF THE TEST AND AT THE START OF EACH HOUR OF THE TEST. FEEDER C
JEA Large-Scale CFB Combustion Demonstration Project
Fuel Capability Demonstration Test Protocol p-98
Attachment R
Description of Organic and Inorganic Carbon Analysis Method Efficient combustion of fuel results normally in very low percentage of carbon content in the fly ash and bottom ash. The sorbent introduces a certain percentage of carbonate carbon in the ash samples. A preferred method of reliably measuring the organic and inorganic carbon in the ash samples is described below:
Total Carbon (Ct) Use Leco CHN 600 or equivalent analyzer to find the total carbon in the sample. Organic Carbon
Treat the ash sample with hydrochloric acid to remove the carbonate carbon and use Leco CHN 600 or equivalent analyzer to measure the remaining organic carbon, as described below:
− Weigh 5 grams of sample into a decanter
− First add 200 ml of distilled water and then add 20 ml of concentrated HCl. Cover the decanter.
− Keep the sample on a heating plate for at least two (2) hours. Stir the sample a few times.
− Weigh a membrane filter (pore size 1.2 micron) and a suitable dish for drying the filter.
− Filter the sample under partial vacuum and wash well with distilled water.
− Dry at 105oC the filtered residue with membrane filter.
− Cool in a desiccators and weigh.
− Use Leco CHN 600 or equivalent analyzer to measure (organic) carbon. Co = C% * Ws Wo Where: Co = Organic carbon in the ash sample (dry basis). C% = Carbon content in the HCl treated sample. Ws = Weight of HCl treated and dried residue. Wo = Original weight of sample before HCl treatment. Inorganic Carbon CIC = CT - Co Where: CIC = Inorganic carbon in the ash sample (dry basis). CT = Total carbon in the ash sample. Co = Organic carbon in the ash sample.

JEA Large-Scale CFB Combustion Demonstration Project
Fuel Capability Demonstration Test Protocol p-99
Attachment S
Boiler Efficiency Sample Calculation

JEA Large-Scale CFB Combustion Demonstration Project
Fuel Capability Demonstration Test Protocol p-100
JEA Unit Tested: Northside Unit 2 Test Date: Test Start Time: Test End Time: Test Duration, hours: 1 Enter all data required in Section 1 - Note: Some cells are identified as calculated valuesDO NOT enter values in these cells, imbedded formulas calculate values. Enter an assumed value for bottom ash flow in cell B52 - recommend a value of XXX
Enter an assumed value for coal flow in cell B159 - recommend a value of XXXXXX.
Enter an assumed value for sulfur emissions in cell B161 - recommend a value of 0.15 - Note: Assumed value must be less than 1. Enter an assumed value for the calcium to sulfur ratio in cell B181 - recommend a value of 2.5. Enter an assumed value for excess air leaving the air heater in cell B214 - recommend a value of 20.
Enter an assumed value for excess air entering the air heater in cell B284 - recommend a value of 20.
Enter an assumed value for the excess air at the CEM sample extraction location in cell B252 - recommend a value of 20. Iterate the calculation to achieve closure using iteration macro - press "Ctrl a" at least FIVE times. DATA INPUT SECTION - INPUT ALL DATA REQUESTED IN SECTION 1 EXCEPT AS NOTED
1. DATA REQUIRED FOR BOILER EFFICIENCY DETERMINATION
AS - TESTED
Average Value Units Symbol1.1 Fuel
1.1.1 Feed Rate, lb/h 497,646 lb/h Wfe - Summation feeder feed rates - FN-34-FT-508, 528, 548, 568, 588, 608, 628, 668
Composition ("as fired") 1.1.2 Carbon, fraction 0.6066 lb/lb AF fuel Cf - Laboratory analysis of coal samples obtained by grab 1.1.3 Hydrogen, fraction 0.0444 lb/lb AF fuel Hf - Laboratory analysis of coal samples obtained by grab 1.1.4 Oxygen, fraction 0.0663 lb/lb AF fuel Of - Laboratory analysis of coal samples obtained by grab 1.1.5 Nitrogen, fraction 0.0120 lb/lb AF fuel Nf - Laboratory analysis of coal samples obtained by grab 1.1.6 Sulfur, fraction 0.0244 lb/lb AF fuel Sf - Laboratory analysis of coal samples obtained by grab 1.1.7 Ash, fraction 0.1118 lb/lb AF fuel Af - Laboratory analysis of coal samples obtained by grab 1.1.8 Moisture, fraction 0.1346 lb/lb AF fuel H2Of - Laboratory analysis of coal samples obtained by 1.1.9 Calcium, fraction 0.0000 lb/lb AF fuel
Caf - Laboratory analysis of coal samples obtained by grab sampling - assume a value of zero if not reported.
1.1.10 HHV 10,944 Btu/lb HHV - Laboratory analysis of coal samples obtained by 1.2 Limestone 1.2.1 Feed Rate, lb/h 100,524 lb/h Wle - Summation feeder feed rates - 2RN-53-010-Rate,
Composition ("as fired") 1.2.2 CaCO3, fraction 0.9403 lb/lb limestone CaCO3l - Laboratory analysis of limestone samples 1.2.3 MgCO3, fraction 0.0126 lb/lb limestone MgCO3l - Laboratory analysis of limestone samples 1.2.4 Inerts, fraction 0.0465 lb/lb limestone Il - Laboratory analysis of limestone samples obtained by 1.2.5 Moisture, fraction 0.0006 lb/lb limestone H2Ol - Laboratory analysis of limestone samples obtained
1.2.6 Carbonate Conversion, fraction 0.95 XCO2 - Laboratory analysis of limestone samples obtained by grab sampling - assume value of 1 if not
1.3 Bottom Ash 1.3.1 Temperature, °F at envelope 1499 °F tba - Plant instrument.
Composition 1.3.2 Organic Carbon, wt fraction 0.0015 lb/lb BA Cbao - Laboratory analysis of bottom ash samples 1.3.3 Inorganic Carbon, wt fraction 0.0015 lb/lb BA Cbaio - Laboratory analysis of bottom ash samples 1.3.4
Total Carbon, wt fraction - CALCULATED VALUE DO NOT ENTER 0.0029 lb/lb BA Cba = Cbao + Cbaio
1.3.5 Calcium, wt fraction 0.1166 lb/lb BA Caba - Laboratory analysis of bottom ash samples 1.3.6 Carbonate as CO2, wt fraction 0.0015 lb/lb BA CO2ba - Laboratory analysis of bottom ash samples 1.3.7
Bottom Ash Flow By Iterative Calculation - ENTER ASSUMED VALUE 85,311 lb/h Wbae
JEA Large-Scale CFB Combustion Demonstration Project
Fuel Capability Demonstration Test Protocol p-101
1.4 Fly Ash Composition
1.4.1 Organic Carbon, wt fraction 0.1166 lb/lb FA Cfao - Laboratory analysis of fly ash samples obtained by 1.4.2 Inorganic Carbon, wt fraction 0.0015 lb/lb FA Cfaio - Laboratory analysis of fly ash samples obtained by
1.4.3 Carbon, wt fraction - CALCULATED VALUE DO NOT ENTER 0.1181 lb/lb FA Cfa = Cfao + Cfaio
1.4.4 Calcium, wt fraction 0.1166 lb/lb FA Cafa - Laboratory analysis of fly ash samples obtained by 1.4.5 Carbonate as CO2, wt fraction 0.0015 lb/lb FA CO2fa - Laboratory analysis of fly ash samples obtained 1.4.6 Fly Ash Flow 14,479 lb/hr Wfam - Weight of fly ash from isokenetic sample
1.5 Combustion Air Primary Air
Hot1.5.1 Flow Rate, lb/h 14 lb/h Wpae - Plant instrument.1.5.2 Air Heater Inlet Temperature, °F 134 °F tpa
Cold1.5.3 Flow Rate, lb/h 4 lb/hr1..5.4 Fan Outlet Temperature, oF 134 °F
Secondary Air1.5.5 Flow Rate, lb/h 1 lb/h Wsae - Plant instrument.1.5.6 Air Heater Inlet Temperature, °F 115 °F tsa
Intrex Blower1.5.7 Flow Rate, lb/h 6 lb/h Wib - Plant instrument1.5.8 Blower Outlet Temperature, oF 134 oF tib
Seal Pot Blowers 1.5.9 Flow Rate, lb/h 12 lb/h Wspb - Plant instrument1.5.10 Blower Outlet Temperature, oF 115 oF tspb
1.6 Ambient Conditions1.6.1 Ambient dry bulb temperature, °F 94.67 °F ta1.6.2 Ambient wet bulb temperature, °F 75.55 °F tawb1.6.3 Barometric pressure, inches Hg 29.82278 inches Hg Patm
1.6.4 Moisture in air, lbH2O/lb dry air 0.0147 lbH2O/lb dry airCalculated: H2OA - From psychometric chart at temperatures ta and tawb adjusted to test Patm.
1.7 Flue GasAt Air Heater Outlet
1.7.1 Temperature (measured), °F 322.7529 °F
Tg15 - Weighted average from AH outlet plant instruments (based on PA and SA flow rates) THIS MAY NEED TO BE DETERMINED BY TEST EQUIPMENT
1.7.2 Temperature (unmeasured), °F Calculated Composition (wet)
1.7.3 O2 0.0558 percent volume O2 - Weighted average from test instrument, may not have to weight depending on location of probes
1.7.4 CO2 Not Measured percent volume CO21.7.5 CO Not Measured percent volume CO1.7.6 SO2 Not Measured percent volume SO2
At Air Heater Inlet1.7.7 Temperature, °F 628.22 °F tG14 - Plant Instrument
Composition (wet)1.7.8 O2 0.0396 percent volume1.7.9 CO2 Not Measured percent volume1.7.10 CO Not Measured percent volume1.7.11 SO2 0.0001 percent volume measurement is in ppm

JEA Large-Scale CFB Combustion Demonstration Project
Fuel Capability Demonstration Test Protocol p-102
CEM Sample Extraction At Outlet Of Composition
1.7.12 O2, percent - WET basis 2.90 percent volume O2stk1.7.13 SO2, ppm - dry basis 114.9 ppm SO2stk1.7.14 NOx, ppm - dry basis Not Measured ppm Noxstk1.7.15 CO, ppm - dry basis Not Measured ppm Costk1.7.16 Particulate, mg/Nm³ Not Meausred mg/Nm³ - 25° C PARTstk
1.8 Feedwater1.8.1 Pressure, psig 2617 psig pfw - Plant instrument.1.8.2 Temperature, °F 483 °F tfw - Plant instrument.1.8.3 Flow Rate, lb/h 4,059,088 lb/h FW - Plant instrument.
1.9 Continuous Blow Down1.9.1 Pressure, psig (drum pressure) 2,586.08 psig pbd - Plant instrument1.9.2 Temperature, °F (sat. temp. @ drum 675.10 °F tba - Saturated water temperature from steam table at 1.9.3 Flow Rate, lb/h 0.00 lb/h BD - Estimated using flow characteristic of valve and
1.10 Sootblowing1.10.1 Flow Rate, lb/hr 0.00 lb/hr SB - Plant instrument1.10.2 Pressure, psig 0.00 psig psb - Plant instrument1.10.3 Temperature, F 0.00 F tsb - plant instrument
1.11 Main Steam Desuperheating Water1.11.1 Pressure, psig 2,666.89 psig pdsw - Plant instrument.1.11.2 Temperature, °F 404.20 °F tdsw - Plant instrument.1.11.3 Flow Rate, lb/h 28,559.18 lb/h DSW - Plant instrument.
1.12 Main Steam1.12.1 Pressure, psig (superheater outlet) 2,463.26 pisg pms - Plant instrument.1.12.2 Temperature, °F 1,004.76 °F tms - Plant instrument.
1.12.3 Flow Rate, lb/h 4,087,647 lb/h MS - Plant instrument - Not required to determine boiler efficiency - For information only.
1.13 Reheat Steam Desuperheating Water1.13.1 Pressure, psig 1,000.00 psig pdswrh - Plant instrument.1.13.2 Temperature, °F 399.20 °F tdswrh - Plant instrument.1.13.3 Flow Rate, lb/h 0.00 lb/h DSWrh - Plant instrument.
1.14 Reheat Steam1.14.1 Inlet Pressure, psig 600.87 psig prhin - Plant instrument.1.14.2 Inlet Temperature, °F 647.40 °F trhin - Plant instrument.1.14.3 Outlet Pressure, psig 580.29 psig prhout - Plant instrument.1.14.4 Outlet Temperature, °F 1,011.31 °F trhout - Plant instrument.1.14.5 Inlet Flow, lb/hr #NAME? lb/hr RHin - From turbine heat.
JEA Large-Scale CFB Combustion Demonstration Project
Fuel Capability Demonstration Test Protocol p-103
CALCULATION SECTION - ALL VALUES BELOW CALCULATED BY EMBEDDED FORMULASDO NOT ENTER DATA BELOW THIS LINE - EXCEPT ASSUMED VALUES FOR ITERATIVE CALCULATIONS
2. REFERENCE TEMPERATURES
2.1 Average Air Heater Inlet Temperature 132.97
3. SULFUR CAPTURE
instrument inaccuracies.
of the value of the calculated fuel flow
3.1 ASSUMED FUEL FLOW RATE, lb/h 471,330 lb/h
3.2 ASSUMED SULFUR EMISSIONS, fraction 0.0498 fraction Can get reading from CEMS system3.3 Sulfur Capture, fraction 0.9502
4. ASH PRODUCTION AND LIMESTONE CONSUMPTION
4.1 Accumulation of Bed Inventory 0 lb/h
4.2 Corrected Ash Carbon Content4.2.1 Bottom Ash, fraction 0.0025 lb/lb BA4.2.2 Fly Ash, fraction 0.1177 lb/lb FA
4.3 Bottom Ash Flow Rate4.3.1 Total bottom ash including bed ############# lb/h
4.4 Limestone Flow Rate
4.4.1 Assumed Calcium to Sulfur Ratio 0.806582666 mole Ca/mole S
4.4.2
Solids From Limestone - estimated 1.465477239 lb/lb limestone al = (CaCO3l * (56.0794/100.08935)) + ((CaCO3l/CaS) * (80.0622/100.08935) * XSO2) + ((40.2114/84.22135) * MgCO3l) + Il
4.4.3 Limestone Flow Rate - estimated 30844.10107 lb/h Wle = ((Wfea * af * ((Caf - (Cafa/(1 - Cfai)))) + Wbae' * (1 -
Cba') * ((Cafa/(1 - Cfa)) - Caba))/((Cafa/(1 - Cfa')) - (0.4 * 4.4.4 Calculated Calcium to Sulfur Ratio 0.806578489 mole Ca/mole S
4.4.5 Difference Estimated vs Assumed - Ca:S -0.000517839 percent
4.4.6 Calculated Fly Ash Flow Rate 14,479 lb/h
4.4.7 Difference Calculated vs Measured 0.0004917238 percent
4.5 Total Dry Refuse4.5.1 Total Dry Refuse Hourly Flow Rate 99,790 lb/h4.5.2 Total Dry Refuse Per Pound Fuel 0.2117 lb/lb AF fuel
limestone used and the effect of the limestone reaction on the boiler efficiency. The resulting boiler efficiency is used to calculate a flow rate. If the calculated flow rate is more than 1 percent different than the assumed flow rate, a new value for fuel flow rate is selected calculation is repeated. This process is repeated until the assumed value for fuel flow and the calculated value for fuel flow differ by less
Iterate to determine calcium to sulfur ratio and limestone flow rate. Enter an assumed value for the calcium to sulfur ratio. Compare resulting calculated calcium to sulfur ratio to assumed value. Change assumed value until the difference between the assumed value and the calculated value is less than 1 percent of the assumed value.
The calculation of efficiency for a circulating fluid bed steam generator that includes injection of a reactive sorbent material, such as sulfur dioxide emissions is an iterative calculation to minimize the number of parameters that have to be measured and the number of analyses that must be performed. This both reduces the cost of the test and increases the accuracy by minimizing the impact of field
To begin the process, assume a fuel flow rate. The fuel flow rate is required to complete the material balances necessary to determine
JEA Large-Scale CFB Combustion Demonstration Project
Fuel Capability Demonstration Test Protocol p-104
4.6 Heating Value Of Total Dry Refuse
4.6.1 Average Carbon Content Of Ash 0.0192 fraction4.6.2 Heating Value Of Dry Refuse 278.62 Btu/lb
5. HEAT LOSS DUE TO DRY GAS
5.1 Carbon Burned Adjusted For Limestone5.1.1 Carbon Burned 0.6025 lb/lb AF fuel5.1.2 Carbon Adjusted For Limestone 0.6096 lb/lb AF fuel
Determine Amount Of Flue Gas
5.2 Air Heater Outlet
5.2.1 Assumed Excess Air At Air Heater Outlet 35.96820373 percent
5.2.2 Corrected Stoichiometric O2, lb/lb fuel 1.9211 lb/lb AF fuel
O2stoich = (31.9988/12.01115) * Cb + (15.9994/2.01594) * Hf + (31.9998/32.064) * Sf - Of + (((Sf * 31.9988/32.064) * (XSO2) * 31.9988 * 0.5/64.0128)
5.2.3 Corrected Stoichiometric N2, lb/lb fuel 6.3809 lb/lb AF fuel
5.2.4Flue Gas Composition, Weight Basis, lb/lb AF Fuel
5.2.4.1 Carbon Dioxide, weight fraction 2.2337 lb/lb AF fuel5.2.4.2 Sulfur Dioxide, weight fraction 0.0024 lb/lb AF fuel
5.2.4.3 Oxygen from air less oxygen to sulfur capture, weight fraction 0.6794 lb/lb AF fuel
5.2.4.4 Nitrogen from air, weight fraction 8.6760 lb/lb AF fuel5.2.4.5 Nitrogen from fuel, weight fraction 0.0120 lb/lb AF fuel5.2.4.6 Moisture from fuel, weight fraction 0.1346 lb/lb AF fuel
5.2.4.7 Moisture from hydrogen in fuel, weight fraction 0.3964 lb/lb AF fuel
5.2.4.8 Moisture from limestone, weight fraction 0.0000 lb/lb AF fuel
5.2.4.9 Moisture from combustion air, weight fraction 0.1657 lb/lb AF fuel
5.2.5Weight of DRY Products of Combustion - Air Heater OUTLET 11.6036 lb/lb AF fuel
5.2.6Molecular Weight, lb/lb mole DRY FG - Air Heater OUTLET 30.4924 lb/lb mole
MWahoutdry = Wgcalc/((CO2calc/44.0095) + (SO2calc/64.0629) + (O2calc/31.9988) + (N2acalc/28.161) + (Nf/28.0134))
5.2.7Weight of WET Products of Combustion - Air Heater OUTLET 12.3003 lb/lb AF fuel
5.2.8 Molecular Weight, lb/lb mole WET FG - Air Heater OUTLET 29.3414 lb/lb AF fuel
g (( )(SO2calc/64.0629) + (O2calc/31.9988) + (N2acalc/28.161) + (Nf/28.0134) + ((H2Of + H2Oh2 + H2Ol/f + H2Oair)/18.01534)) Note: Molecular weight of nitrogen in air (N2a) is 28.161 lb/lb mole per PTC 4 Sub-Section 5.11.1 to account for trace gases in air.
Iterate to determine carbon dioxide volumetric content of dry flue gas. Enter an assumed value for excess air. Compare resulting calculated oxygen content to the measure oxygen content. Change assumed value of excess air until the the calculated oxygen content value and the measured value oxygen content value is less than 1 percent of the assumed value. Use the calculated carbon dioxide value in subsequent calculations.
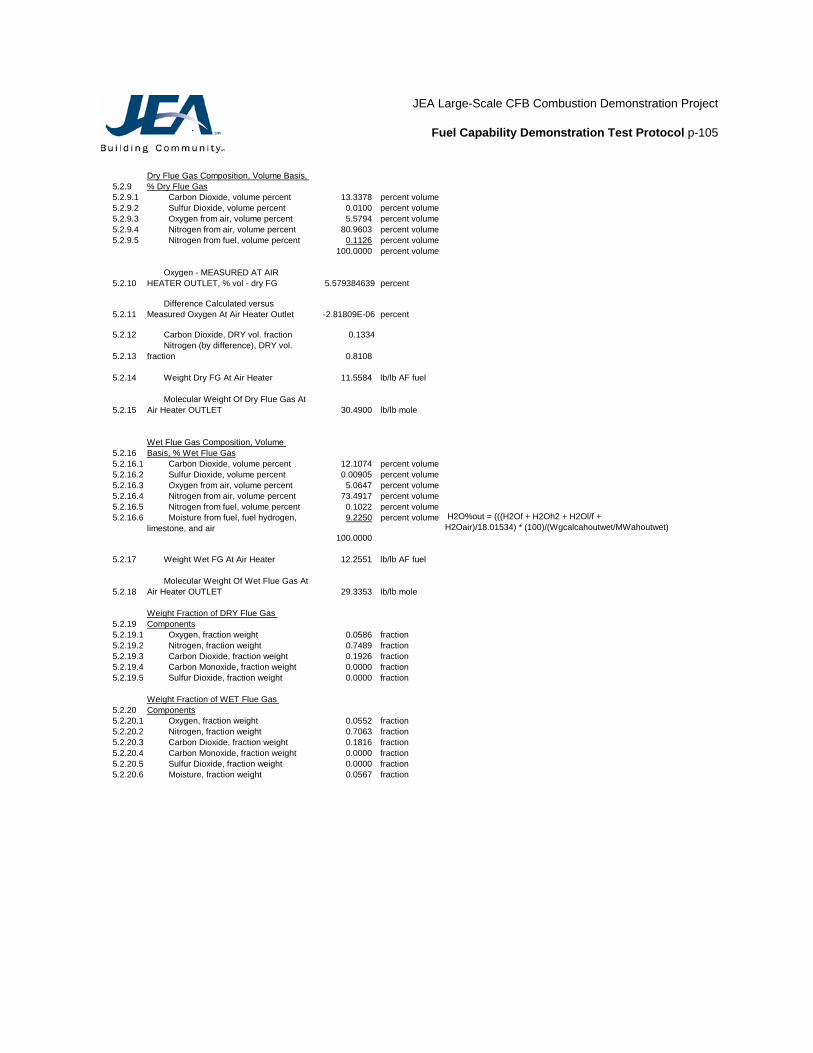
JEA Large-Scale CFB Combustion Demonstration Project
Fuel Capability Demonstration Test Protocol p-105
5.2.9Dry Flue Gas Composition, Volume Basis, % Dry Flue Gas
5.2.9.1 Carbon Dioxide, volume percent 13.3378 percent volume5.2.9.2 Sulfur Dioxide, volume percent 0.0100 percent volume5.2.9.3 Oxygen from air, volume percent 5.5794 percent volume5.2.9.4 Nitrogen from air, volume percent 80.9603 percent volume5.2.9.5 Nitrogen from fuel, volume percent 0.1126 percent volume
100.0000 percent volume
5.2.10 Oxygen - MEASURED AT AIR HEATER OUTLET, % vol - dry FG 5.579384639 percent
5.2.11 Difference Calculated versus Measured Oxygen At Air Heater Outlet -2.81809E-06 percent
5.2.12 Carbon Dioxide, DRY vol. fraction 0.1334
5.2.13 Nitrogen (by difference), DRY vol. fraction 0.8108
5.2.14 Weight Dry FG At Air Heater 11.5584 lb/lb AF fuel
5.2.15 Molecular Weight Of Dry Flue Gas At Air Heater OUTLET 30.4900 lb/lb mole
5.2.16Wet Flue Gas Composition, Volume Basis, % Wet Flue Gas
5.2.16.1 Carbon Dioxide, volume percent 12.1074 percent volume5.2.16.2 Sulfur Dioxide, volume percent 0.00905 percent volume5.2.16.3 Oxygen from air, volume percent 5.0647 percent volume5.2.16.4 Nitrogen from air, volume percent 73.4917 percent volume5.2.16.5 Nitrogen from fuel, volume percent 0.1022 percent volume5.2.16.6 Moisture from fuel, fuel hydrogen,
limestone, and air9.2250 percent volume H2O%out = (((H2Of + H2Oh2 + H2Ol/f +
H2Oair)/18.01534) * (100)/(Wgcalcahoutwet/MWahoutwet)100.0000
5.2.17 Weight Wet FG At Air Heater 12.2551 lb/lb AF fuel
5.2.18 Molecular Weight Of Wet Flue Gas At Air Heater OUTLET 29.3353 lb/lb mole
5.2.19Weight Fraction of DRY Flue Gas Components
5.2.19.1 Oxygen, fraction weight 0.0586 fraction5.2.19.2 Nitrogen, fraction weight 0.7489 fraction5.2.19.3 Carbon Dioxide, fraction weight 0.1926 fraction5.2.19.4 Carbon Monoxide, fraction weight 0.0000 fraction5.2.19.5 Sulfur Dioxide, fraction weight 0.0000 fraction
5.2.20Weight Fraction of WET Flue Gas Components
5.2.20.1 Oxygen, fraction weight 0.0552 fraction5.2.20.2 Nitrogen, fraction weight 0.7063 fraction5.2.20.3 Carbon Dioxide, fraction weight 0.1816 fraction5.2.20.4 Carbon Monoxide, fraction weight 0.0000 fraction5.2.20.5 Sulfur Dioxide, fraction weight 0.0000 fraction5.2.20.6 Moisture, fraction weight 0.0567 fraction

JEA Large-Scale CFB Combustion Demonstration Project
Fuel Capability Demonstration Test Protocol p-106
5.3 Air Heater Inlet
5.3.1 Assumed Excess Air At Air Heater INLET 23.28818989 percent
5.3.2Flue Gas Composition, Weight Basis, lb/lb AF Fuel
5.3.2.1 Carbon Dioxide, weight fraction 2.2337 lb/lb AF fuel5.3.2.2 Sulfur Dioxide, weight fraction 0.0024 lb/lb AF fuel
5.3.2.3 Oxygen from air less oxygen to sulfur capture, weight fraction 0.4358 lb/lb AF fuel
5.3.2.4 Nitrogen from air, weight fraction 7.8669 lb/lb AF fuel5.3.2.5 Nitrogen from fuel, weight fraction 0.0120 lb/lb AF fuel5.3.2.6 Moisture from fuel, weight fraction 0.1346 lb/lb AF fuel
5.3.2.7 Moisture from hydrogen in fuel, weight fraction 0.3964 lb/lb AF fuel
5.3.2.8 Moisture from limestone, weight fraction 0.0000 lb/lb AF fuel
5.3.2.9 Moisture from combustion air, weight fraction 0.1502 lb/lb AF fuel
5.3.3 Weight of DRY Products of Combustion - Air Heater INLET 10.5509 lb/lb AF fuel
5.3.4 Molecular Weight, lb/lb mole DRY FG - Air Heater INLET 30.6537 lb/lb mole
5.3.5 Weight of WET Products of Combustion - Air Heater INLET 11.2321 lb/lb AF fuel
5.3.6 Molecular Weight, lb/lb mole WET FG - Air Heater INLET 29.4027 lb/lb AF fuel
Volume Basis
5.3.7Flue Gas Composition, Volume Basis, % DRY Flue Gas % Dry Flue Gas
5.3.7.1 Carbon Dioxide, volume percent 14.7461 percent volume5.3.7.2 Sulfur Dioxide, volume percent 0.0110 percent volume5.3.7.3 Oxygen from air, volume percent 3.9568 percent volume5.3.7.4 Nitrogen from air, volume percent 81.1616 percent volume5.3.7.5 Nitrogen from fuel, volume percent 0.1245 percent volume
100.0000 percent volume
5.3.8 Oxygen - MEASURED AT AIR HEATER INLET, % vol - dry FG 3.956815104 percent
5.3.9 Difference Calculated versus Measured Oxygen At Air Heater Inlet -8.89245E-06 percent
5.3.10 Carbon Dioxide, DRY vol. fraction 0.1475
5.3.11 Nitrogen (by difference), DRY vol. fraction 0.8129
5.3.12 Weight Dry FG At Air Heater INLET 10.5104 lb/lb AF fuel
5.3.13 Molecular Weight Of Dry Flue Gas At Air Heater INLET 30.6556 lb/lb mole
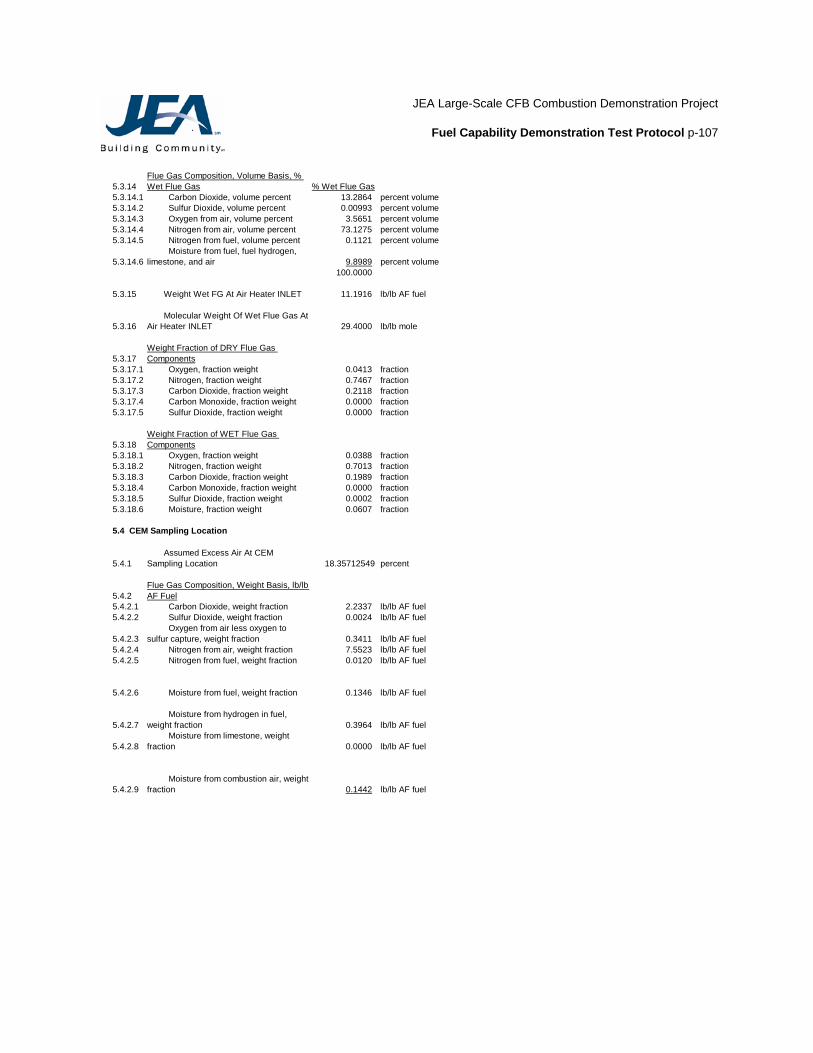
JEA Large-Scale CFB Combustion Demonstration Project
Fuel Capability Demonstration Test Protocol p-107
5.3.14Flue Gas Composition, Volume Basis, % Wet Flue Gas % Wet Flue Gas
5.3.14.1 Carbon Dioxide, volume percent 13.2864 percent volume5.3.14.2 Sulfur Dioxide, volume percent 0.00993 percent volume5.3.14.3 Oxygen from air, volume percent 3.5651 percent volume5.3.14.4 Nitrogen from air, volume percent 73.1275 percent volume5.3.14.5 Nitrogen from fuel, volume percent 0.1121 percent volume
5.3.14.6 Moisture from fuel, fuel hydrogen, limestone, and air 9.8989 percent volume
100.0000
5.3.15 Weight Wet FG At Air Heater INLET 11.1916 lb/lb AF fuel
5.3.16 Molecular Weight Of Wet Flue Gas At Air Heater INLET 29.4000 lb/lb mole
5.3.17Weight Fraction of DRY Flue Gas Components
5.3.17.1 Oxygen, fraction weight 0.0413 fraction5.3.17.2 Nitrogen, fraction weight 0.7467 fraction5.3.17.3 Carbon Dioxide, fraction weight 0.2118 fraction5.3.17.4 Carbon Monoxide, fraction weight 0.0000 fraction5.3.17.5 Sulfur Dioxide, fraction weight 0.0000 fraction
5.3.18Weight Fraction of WET Flue Gas Components
5.3.18.1 Oxygen, fraction weight 0.0388 fraction5.3.18.2 Nitrogen, fraction weight 0.7013 fraction5.3.18.3 Carbon Dioxide, fraction weight 0.1989 fraction5.3.18.4 Carbon Monoxide, fraction weight 0.0000 fraction5.3.18.5 Sulfur Dioxide, fraction weight 0.0002 fraction5.3.18.6 Moisture, fraction weight 0.0607 fraction
5.4 CEM Sampling Location
5.4.1 Assumed Excess Air At CEM Sampling Location 18.35712549 percent
5.4.2Flue Gas Composition, Weight Basis, lb/lb AF Fuel
5.4.2.1 Carbon Dioxide, weight fraction 2.2337 lb/lb AF fuel5.4.2.2 Sulfur Dioxide, weight fraction 0.0024 lb/lb AF fuel
5.4.2.3 Oxygen from air less oxygen to sulfur capture, weight fraction 0.3411 lb/lb AF fuel
5.4.2.4 Nitrogen from air, weight fraction 7.5523 lb/lb AF fuel5.4.2.5 Nitrogen from fuel, weight fraction 0.0120 lb/lb AF fuel
5.4.2.6 Moisture from fuel, weight fraction 0.1346 lb/lb AF fuel
5.4.2.7 Moisture from hydrogen in fuel, weight fraction 0.3964 lb/lb AF fuel
5.4.2.8 Moisture from limestone, weight fraction 0.0000 lb/lb AF fuel
5.4.2.9 Moisture from combustion air, weight fraction 0.1442 lb/lb AF fuel
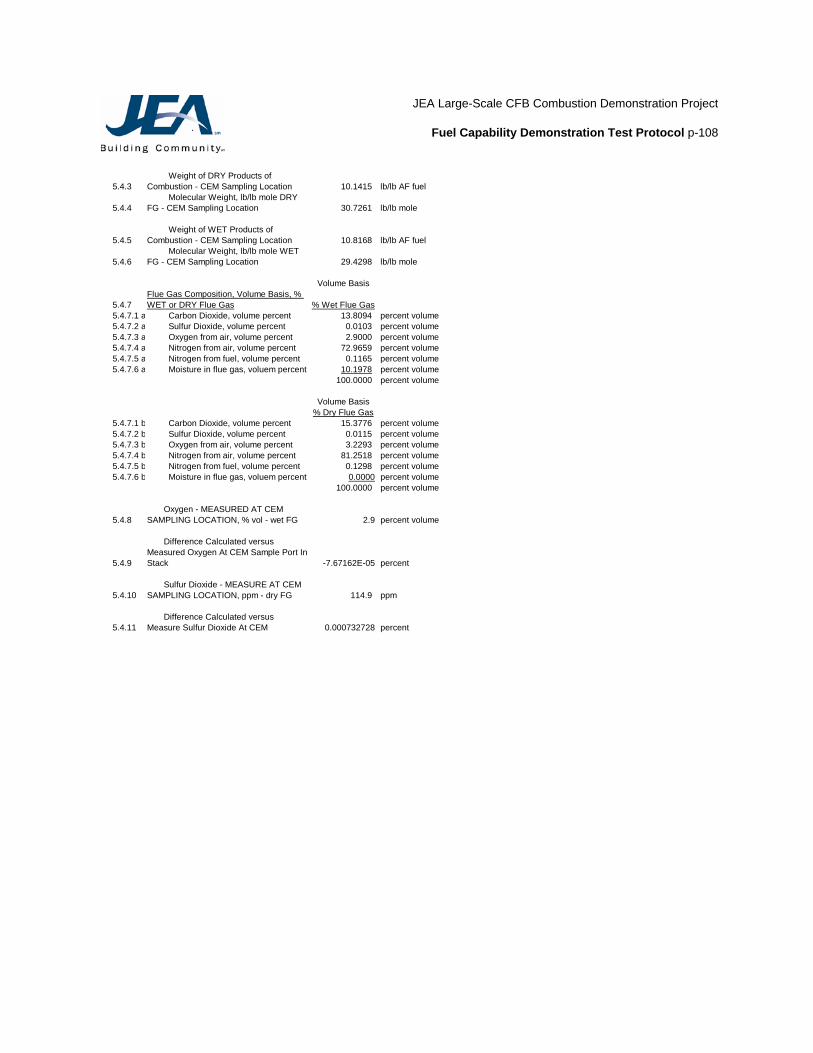
JEA Large-Scale CFB Combustion Demonstration Project
Fuel Capability Demonstration Test Protocol p-108
5.4.3 Weight of DRY Products of Combustion - CEM Sampling Location 10.1415 lb/lb AF fuel
5.4.4 Molecular Weight, lb/lb mole DRY FG - CEM Sampling Location 30.7261 lb/lb mole
5.4.5 Weight of WET Products of Combustion - CEM Sampling Location 10.8168 lb/lb AF fuel
5.4.6 Molecular Weight, lb/lb mole WET FG - CEM Sampling Location 29.4298 lb/lb mole
Volume Basis
5.4.7Flue Gas Composition, Volume Basis, % WET or DRY Flue Gas % Wet Flue Gas
5.4.7.1 a Carbon Dioxide, volume percent 13.8094 percent volume5.4.7.2 a Sulfur Dioxide, volume percent 0.0103 percent volume5.4.7.3 a Oxygen from air, volume percent 2.9000 percent volume5.4.7.4 a Nitrogen from air, volume percent 72.9659 percent volume5.4.7.5 a Nitrogen from fuel, volume percent 0.1165 percent volume5.4.7.6 a Moisture in flue gas, voluem percent 10.1978 percent volume
100.0000 percent volume
Volume Basis% Dry Flue Gas
5.4.7.1 b Carbon Dioxide, volume percent 15.3776 percent volume5.4.7.2 b Sulfur Dioxide, volume percent 0.0115 percent volume5.4.7.3 b Oxygen from air, volume percent 3.2293 percent volume5.4.7.4 b Nitrogen from air, volume percent 81.2518 percent volume5.4.7.5 b Nitrogen from fuel, volume percent 0.1298 percent volume5.4.7.6 b Moisture in flue gas, voluem percent 0.0000 percent volume
100.0000 percent volume
5.4.8 Oxygen - MEASURED AT CEM SAMPLING LOCATION, % vol - wet FG 2.9 percent volume
5.4.9
Difference Calculated versus Measured Oxygen At CEM Sample Port In Stack -7.67162E-05 percent
5.4.10 Sulfur Dioxide - MEASURE AT CEM SAMPLING LOCATION, ppm - dry FG 114.9 ppm
5.4.11 Difference Calculated versus Measure Sulfur Dioxide At CEM 0.000732728 percent
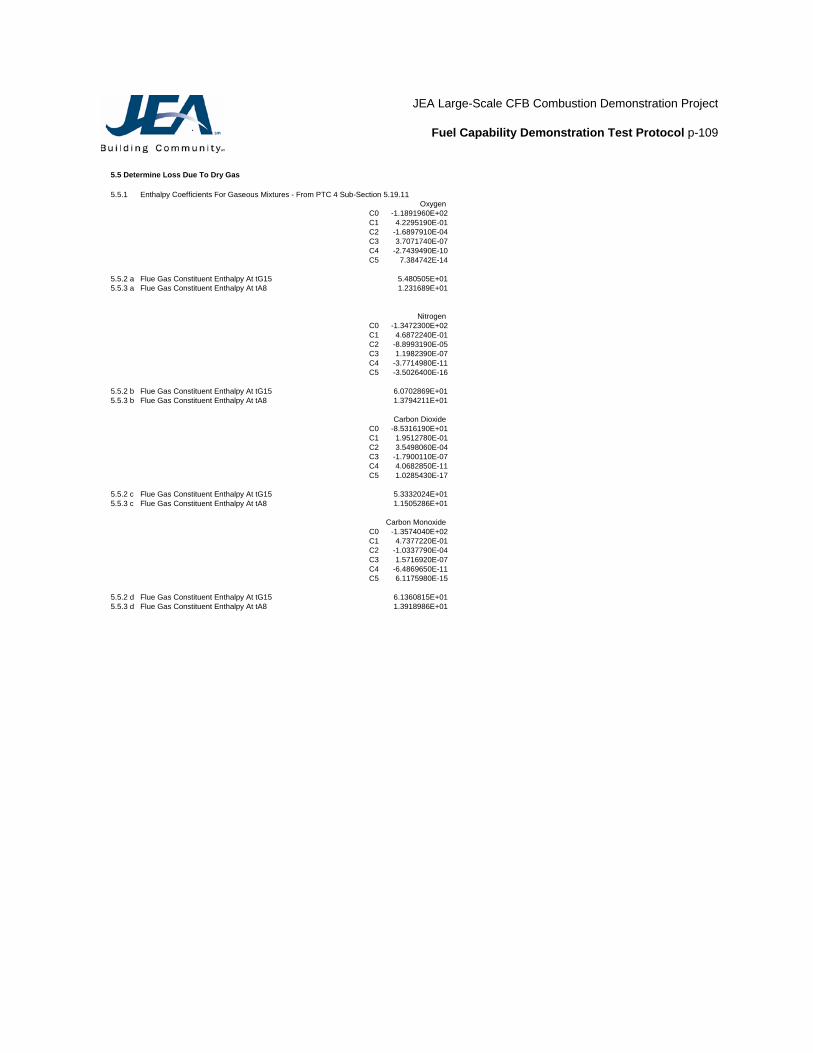
JEA Large-Scale CFB Combustion Demonstration Project
Fuel Capability Demonstration Test Protocol p-109
5.5 Determine Loss Due To Dry Gas
5.5.1 Enthalpy Coefficients For Gaseous Mixtures - From PTC 4 Sub-Section 5.19.11Oxygen
C0 -1.1891960E+02C1 4.2295190E-01C2 -1.6897910E-04C3 3.7071740E-07C4 -2.7439490E-10C5 7.384742E-14
5.5.2 a Flue Gas Constituent Enthalpy At tG15 5.480505E+015.5.3 a Flue Gas Constituent Enthalpy At tA8 1.231689E+01
Nitrogen C0 -1.3472300E+02C1 4.6872240E-01C2 -8.8993190E-05C3 1.1982390E-07C4 -3.7714980E-11C5 -3.5026400E-16
5.5.2 b Flue Gas Constituent Enthalpy At tG15 6.0702869E+015.5.3 b Flue Gas Constituent Enthalpy At tA8 1.3794211E+01
Carbon Dioxide C0 -8.5316190E+01C1 1.9512780E-01C2 3.5498060E-04C3 -1.7900110E-07C4 4.0682850E-11C5 1.0285430E-17
5.5.2 c Flue Gas Constituent Enthalpy At tG15 5.3332024E+015.5.3 c Flue Gas Constituent Enthalpy At tA8 1.1505286E+01
Carbon Monoxide C0 -1.3574040E+02C1 4.7377220E-01C2 -1.0337790E-04C3 1.5716920E-07C4 -6.4869650E-11C5 6.1175980E-15
5.5.2 d Flue Gas Constituent Enthalpy At tG15 6.1360815E+015.5.3 d Flue Gas Constituent Enthalpy At tA8 1.3918986E+01
JEA Large-Scale CFB Combustion Demonstration Project
Fuel Capability Demonstration Test Protocol p-110
Sulfur DioxideC0 -6.7416550E+01C1 1.8238440E-01C2 1.4862490E-04C3 1.2737190E-08C4 -7.3715210E-11C5 2.8576470E-14
5.5.2 e Flue Gas Constituent Enthalpy At tG15 3.8807190E+015.5.3 e Flue Gas Constituent Enthalpy At tA8 8.4475868E+00
General equation for constituent enthalpy: h = C0 + C1 * T + C2 * T² + C3 * T³ + C4 * T * T³ + C5 * T² * T³ T = degrees Kelvin = (°F + 459.7)/1.8
5.5.4 Flue Gas Enthalpy5.5.5 At Measured AH Outlet Temp - tG15 58.94 Btu/lb5.5.6 At Measured AH Air Inlet Temp - tA8 13.27 Btu/lb
5.5.7 Dry Flue Gas Loss, as tested 527.89 Btu/lb AF fuel
5.6 HHV Percent Loss, as tested 4.82 percent
6. HEAT LOSS DUE TO MOISTURE CONTENT IN FUEL
6.1 Water Vapor Enthalpy at tG15 & 1 psia 1206.04 Btu/lb6.2 Saturated Water Enthalpy at tA8 100.97 Btu/lb
6.3 Fuel Moisture Heat Loss, as tested 148.70 Btu/lb AF fuel
6.4 HHV Percent Loss, as tested 1.36 percent
7. HEAT LOSS DUE TO H2O FROM COMBUSTION OF H2 IN FUEL
7.1 H2O From H2 Heat Loss, as tested 438.10 Btu/lb AF fuel
7.2 HHV Percent Loss, as tested 4.00 percent
8. HEAT LOSS DUE TO COMBUSTIBLES (UNBURNED CARBON) IN ASH
8.1 Unburned Carbon In Ash Heat Loss 58.99 Btu/lb AF fuel
8.2 HHV Percent Loss, as tested 0.54 percent
hwvtG15 = 0.4329 * tG15 + 3.958E-05 * (tG
hFGtG15 = O2wt * hO2 + N2wt * hN2 + COhFGtA8 = O2wt * hO2 + N2wt * hN2 + CO2
JEA Large-Scale CFB Combustion Demonstration Project
Fuel Capability Demonstration Test Protocol p-111
9. HEAT LOSS DUE TO SENSIBLE HEAT IN TOTAL DRY REFUSE
9.1 Determine Dry Refuse Heat Loss Per Pound Of AF Fuel
9.1.1 Bottom Ash Heat Loss, as tested 61.82 Btu/lb AF fuel9.1.2 Fly Ash Heat Loss, as tested 1.17 Btu/lb AF fuel
9.2 Total Dry Refuse Heat Loss, as tested 62.99 Btu/lb AF fuel
9.3 HHV Percent Loss, as tested 0.58 percent
10. HEAT LOSS DUE TO MOISTURE IN ENTERING AIR
10.1 Determine Air Flow
10.1.1 Dry Air Per Pound Of AF Fuel 11.56 lb/lb AF fuel
10.2 Heat Loss Due To Moisture In Entering Air
10.2.1 Enthalpy Of Leaving Water Vapor 160.20 Btu/lb AF fuel10.2.2 Enthalpy Of Entering Water Vapor 65.32 Btu/lb AF fuel
10.2.3 Air Moisture Heat Loss, as tested 16.09 Btu/lb
10.3 HHV Percent Loss, as tested 0.15 percent
11. HEAT LOSS DUE TO LIMESTONE CALCINATION/SULFATION REACTIONS
11.1 Loss To Calcination
11.1.1 Limestone Calcination Heat Loss 45.29 Btu/lb AF Fuel
11.2 Loss To Moisture In Limestone
11.2.1 Limestone Moisture Heat Loss 0.05 Btu/lb AF Fuel
11.3 Loss From Sulfation
11.3.1 Sulfation Heat Loss -156.35 Btu/lb AF Fuel
11.4 Net Loss To Calcination/Sulfation
11.4.1 Net Limestone Reaction Heat Loss -111.02 Btu/lb AF Fuel
11.5 HHV Percent Loss -1.01 percent
12. HEAT LOSS DUE TO SURFACE RADIATION & CONVECTION
12.1 HHV Percent Loss #NAME? percent
12.1.1 Radiation & Convection Heat Loss #NAME? Btu/lb AF fuel

JEA Large-Scale CFB Combustion Demonstration Project
Fuel Capability Demonstration Test Protocol p-112
13. SUMMARY OF LOSSES - AS TESTED/GUARANTEE BASIS
As TestedBtu/lb AF Fuel
13.1.1 527.8913.1.2 148.7013.1.3 438.1013.1.4 58.9913.1.5 62.9913.1.6 16.0913.1.7 -111.0213.1.8 #NAME?
#NAME?
As TestedPercent Loss
13.1.9 Dry Flue Gas 4.8213.1.10 Moisture In Fuel 1.3613.1.11 H2O From H2 In Fuel 4.0013.1.12 Unburned Combustibles In Refuse 0.5413.1.13 Dry Refuse 0.5813.1.14 Moisture In Combustion Air 0.1513.1.15 Calcination/Sulfation -1.0113.1.16 Radiation & Convection #NAME?
#NAME?
13.2 Boiler Efficiency (100 - Total Losses), percent #NAME?
14. HEAT INPUT TO WATER & STEAM
14.1 Enthalpies14.1.1 Feedwater, Btu/lb 468.37 Btu/lb14.1.2 Blow Down, Btu/lb 741.19 Btu/lb14.1.3 Sootblowing, Btu/lb 0.00 Btu/lb
14.1.4 Desuperheating Spray Water - Main Steam, Btu/lb 382.33 Btu/lb
14.1.5 Main Steam, Btu/lb 1462.28 Btu/lb
14.1.6 Desuperheating Spray Water - Reheat Steam, Btu/lb 375.00 Btu/lb
14.1.7 Reheat Steam - Reheater Inlet, 1318.59 Btu/lb14.1.8 Reheat Steam - Reheater Outlet, 1522.96 Btu/lb
14.2 Heat Output #NAME? Btu/h#NAME?
15. HIGHER HEATING VALUE FUEL HEAT INPUT
15.1 Determine Fuel Heat Input Based on Calculated Efficiency
15.1.1 Fuel Heat Input #NAME? Btu/h
15.1.2 Fuel Burned - CALCULATED #NAME? lb/h
15.1.3 Difference Assumed versus #NAME? percent
JEA Large-Scale CFB Combustion Demonstration Project
Fuel Capability Demonstration Test Protocol p-113
OUTPUTJacksonville Electric Authority Unit Tested: Northside Unit 2 Test Date: Test Start Time: Test End Time: Test Duration, hours:
Parameter As-Tested Units
1.0 Feedwater1.1 Flow Rate, lb/hr 4,059,088 lb/hr FW - Plant instrument.1.2 Pressure, psig 2,616.9 psig pfw - Plant instrument.1.3 Temperature, F 483.2 F tfw - Plant instrument.
1.4 Enthalpy #NAME? Btu/lbhfw - Steam Properties Microcomputer Program - University of Texas at
Austin - Center for Energy Studies - September 19811.5 Heat available #NAME? Btu/hr hfw x FW
2.0 Mainsteam Desuperheating2.1 Flow Rate 28,559 lb/hr DSW - Plant instrument.2.2 Pressure 2,666.9 psig pdsw - Plant instrument.2.3 Temperature 404.2 F tdsw - Plant instrument.
2.4 Enthalpy #NAME? Btu/lbhdsw - Steam Properties Microcomputer Program - University of Texas at
Austin - Center for Energy Studies - September 19812.5 Heat available #NAME? Btu/hr hdsw x DSW
3.0 Continuous Blowdown3.1 Flow Rate 0 lb/h BD - Estimated using flow characteristic of valve and number of turns open.3.2 Pressure 2,586.1 psig pbd - Plant instrument3.3 Temperature 675.1 °F tba - Saturated water temperature from steam table at drum pressure.
3.4 Enthalpy #NAME? Btu/lbhcbd - Steam Properties Microcomputer Program - University of Texas at
Austin - Center for Energy Studies - September 19813.5 Heat available #NAME? Btu/hr hcbd x BD
4.0 Sootblowing4.1 Flow Rate, lb/hr 0 lb/hr SB - Plant instrument4.2 Pressure, psig 0 psig psb - Plant instrument4.3 Temperature, F 0 F tsb - plant instrument
4.4 Enthalpy 0.00 Btu/lbhsb - Steam Properties Microcomputer Program - University of Texas at
Austin - Center for Energy Studies - September 19814.5 Heat available 0 Btu/hr hsb x SB
5.0 Main Steam5.1 Flow Rate 4,087,647 lb/hr MS = FW + DSW - CBD - SB5.2 Pressure 2,463.26 pisg pms - Plant instrument.5.3 Temperature 1,004.76 °F tms - Plant instrument.
5.4 Enthalpy #NAME? Btu/lbhms - Steam Properties Microcomputer Program - University of Texas at
Austin - Center for Energy Studies - September 19815.5 Heat available #NAME? Btu/hr hms x MS
6.0 Reheat Desuperheating6.1 Flow Rate 0.00 lb/h DSWrh - Plant instrument.6.2 Pressure 1000.00 psig pdswrh - Plant instrument.6.3 Temperature 399.20 °F tdswrh - Plant instrument.
6.4 Enthalpy #NAME? Btu/lbhdswrh - Steam Properties Microcomputer Program - University of Texas at
Austin - Center for Energy Studies - September 19816.5 Heat available #NAME? Btu/hr hdswrh x DSWrh
JEA Large-Scale CFB Combustion Demonstration Project
Fuel Capability Demonstration Test Protocol p-114
7.0 Heater No. 1 Heat Balance7.1 Feedwater flow to heaters 4,087,647 lb/hr FW + DSW + DSWrh7.2 Feedwater @ Inlet
7.2.1 Pressure 2,666.9 psig ph1fwi - Plant instrument.7.2.2 Temperature 453.2 F th1fwi - Plant instrument.7.2.3 Enthalpy #NAME? Btu/lb
7.3 Feedwater @ Outlet7.3.1 Pressure 2,616.9 psig ph1fwo - Plant instrument.7.3.2 Temperature 483.2 F th1fwo - Plant instrument.7.3.3 Enthalpy #NAME? Btu/lb
7.4 Heater Drain7.4.1 Pressure 550.9 psig ph1dr - Plant instrument.7.4.2 Temperature 497.4 F th1dr - Plant instrument.7.4.3 Enthalpy #NAME? Btu/lb
7.5 Turbine Extraction7.5.1 Pressure 600.9 psig ph1ext - Plant instrument.7.5.2 Temperature 647.4 F th1ext - Plant instrument.7.5.3 Enthalpy #NAME? Btu/lb
7.6 Extraction Flow #NAME? lb/hr Ext = heat balance around heater
8.0 Cold Reheat 8.1 TG Leaks 0.00 lb/hr tgl8.2 CRH Flow Rate #NAME? lb/hr CRH = MS - tgl - Ext - SB8.3 Pressure 600.87 psig prhin - Plant instrument.8.4 Temperature 647.40 °F trhin - Plant instrument.8.5 Enthalpy #NAME? Btu/lb hcrh8.6 Heat available #NAME? Btu/hr hcrh x CRH
9.0 Hot Reheat 9.1 HRH Flow Rate #NAME? lb/hr HRH = CRH + DSWrh9.2 Pressure 580.29 psig prhout - Plant instrument.9.3 Temperature 1011.31 °F trhout - Plant instrument.9.4 Enthalpy #NAME? Btu/lb hhrh9.5 Heat available #NAME? Btu/hr hhrh x HRH
10.0 TOTAL OUTPUT10.1 Heat to Main Steam #NAME? Btu/hr HTMS = MS*hms + BD*hcbd - DSW*hdsw - FW*hfw - SB*hsb10.2 Heat to Reheat Steam #NAME? Btu/hr HTRH = HRH*hhrh- CRH*hcrh- DSWrh*hdswrh10.3 TOTAL HEAT OUTPUT #NAME? Btu/hr HTMS + HTRH

JEA Large-Scale CFB Combustion Demonstration Project
Fuel Capability Demonstration Test Protocol p-115
OUTPUT UNCERTAINTY WORK SHEET NO. 1A
1 2 3 4 5 6 7 8 9Measured Average Standard No. of Precision Degrees IncrementalParameter Data Form Value Deviation Bias Readings Index of Percent Change*(from Data) Number (Item [2] on (Item [3] on Sheet (Item [1] on (([2]^2)/[5])^1/2 Freedom Change [8]x[1]/100
Data2 form) Data2 form) No. % Unit % Unit Data2 form) [5]-1
ab FEEDWATER FLOW, lb/hr x 1,000 101 4059 8.70 3C 2.85 0.00 2.85 0.00 24 1.78 23 1.00 40.59088c FEEDWATER TEMPERATURE, F 102 483.21 0.2865 1D 0.14 3.01 0.14 3.01 24 0.06 23 1.00 4.83d FEEDWATER PRESSURE, psig 102A 2616.89 0.5086 2A 0.17 0.00 0.17 0.00 24 0.10 23 1.00 26.17ef SH-1 SPRAY FLOW, lb/hr x 1,000 103 29 3.26 3D 2.85 0.00 2.85 0.00 24 0.67 23 1.00 0.285592g SH-1 SPRAY TEMPERATURE, F 104 404.20 0.1858 1C 0.14 3.01 0.14 3.01 24 0.04 23 1.00 4.04h SH-1 SPRAY PRESSURE, psig 104A 2666.89 0.5086 2A 0.17 0.00 0.17 0.00 24 0.10 23 1.00 26.67ij BLOWDOWN FLOW, lb/hr x 1,000 105 0.0 0.00 3D 2.85 0.00 2.85 0.00 2 0.00 1 1.00 0.00k DRUM PRESSURE, psig 106 2586.08 0.80 2A 0.17 0.00 0.17 0.00 24 0.16 23 1.00 25.86l
m MAIN STEAM TEMPERATURE, F 109 1004.8 0.32 3E 2.93 0.00 2.93 0.00 24 0.07 23 1.00 10.05n MAIN STEAM PRESSURE, psig 110 2463.26 0.46 2A 0.17 0.00 0.17 0.00 24 0.09 23 1.00 24.63o
pSOOTBLOWING STEAM FLOW, lb/hr x 1,000 107 0.0 0.00 3E 2.93 0.00 2.93 0.00 2 0.00 1 1.00 0.00
qSOOTBLOWING STEAM TEMPERATURE, F 108 0.00 0.00 1C 0.14 3.01 0.14 3.01 2 0.00 1 1.00 0.00
r psig 108A 0.00 0.00 2A 0.17 0.00 0.17 0.00 2 0.00 1 1.00 0.00s
tHEATER 1 FW ENTERING TEMPERATURE, F 118 403 0.20 1D 0.14 3.01 0.14 3.01 24 0.04 23 1.00 4.03
u HEATER 1 FW ENT PRESSURE, psig 118A 2666.89 0.5086 2A 0.17 0.00 0.17 0.00 24 0.10 23 1.00 26.67
vHEATER 1 FW LEAVING TEMPERATURE, F 119 482.36 0.2189 1D 0.14 3.01 0.14 3.01 24 0.04 23 1.00 4.82
w HEATER 1 FW LVG PRESSURE, psig 120 2642 0.51 2A 0.17 0.00 0.17 0.00 24 0.10 23 1.00 26.42
xHEATER 1 EXTRACTION STEAM TEMPERATURE, F 121 644.47 0.3086 1C 0.14 3.01 0.14 3.01 24 0.06 23 1.00 6.44
zHEATER 1 EXTRACTION STEAM PRESSURE, psig 122 596.18 0.8929 2A 0.17 0.00 0.17 0.00 24 0.18 23 1.00 5.96
y HEATER 1 DRAIN TEMPERATURE, F 123 418.7 0.22 1D 0.14 3.01 0.14 3.01 24 0.04 23 1.00 4.19aa HEATER 1 DRAIN PRESSURE, psig 124 0.00 0.00 2B 0.14 10.00 0.14 10.00 2 0.00 1 1.00 0.00abac
* The value used for incremental change can be any increment of the average value. The recommended increment is 1.0 percent (0.01 times the average value). If the average value of the measured parameter is zero, use any small incremental change. It is important to note that the incremental change must be in the same units as the average value.
NAME OF PLANT ASME PTC 4 MASTER FORM UNIT NO TEST NO. DATE: LOAD TIME START: END: CALC BY
DATE SHEET OF
Total Positive Bias Limit
BIAS form
Bias Limit (Item [2] on
BIAS form
Total Negative
(Item [2] on
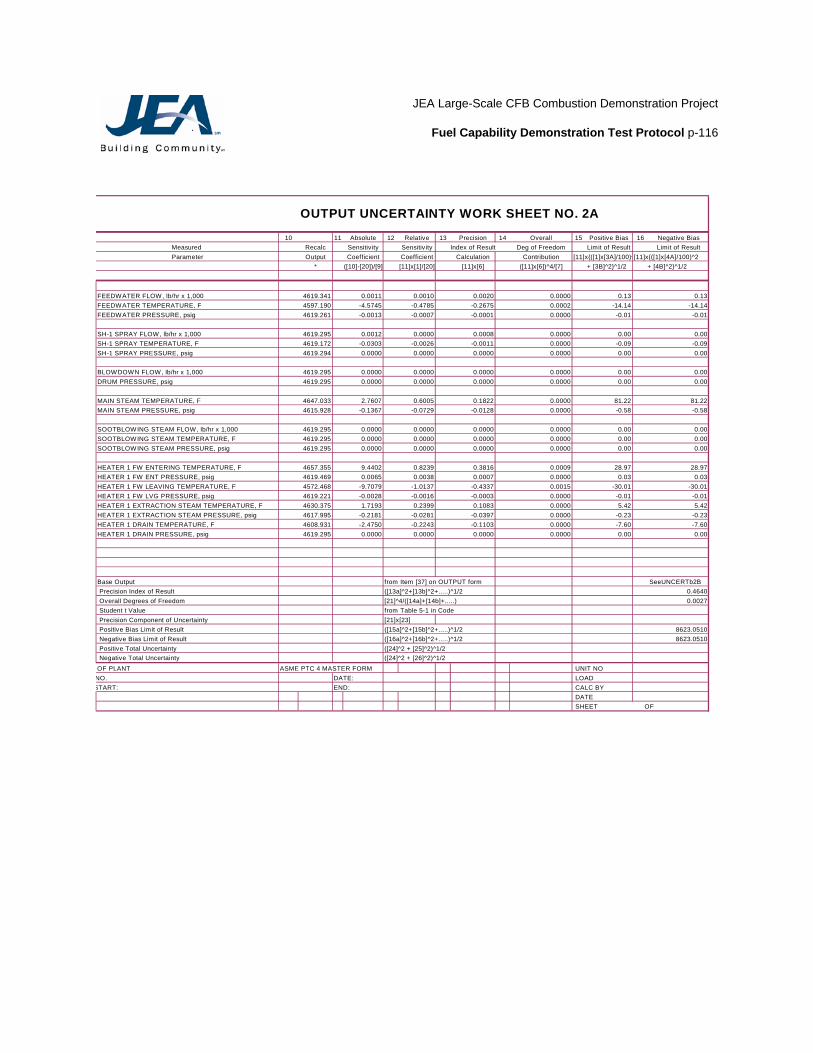
JEA Large-Scale CFB Combustion Demonstration Project
Fuel Capability Demonstration Test Protocol p-116
OUTPUT UNCERTAINTY WORK SHEET NO. 2A
10 11 Absolute 12 Relative 13 Precision 14 Overall 15 Positive Bias 16 Negative BiasMeasured Recalc Sensitivity Sensitivity Index of Result Deg of Freedom Limit of Result Limit of ResultParameter Output Coefficient Coefficient Calculation Contribution [11]x{([1]x[3A]/100) [̂11]x{([1]x[4A]/100)^2
* ([10]-[20])/[9] [11]x[1]/[20] [11]x[6] ([11]x[6])^4/[7] + [3B]^2}^1/2 + [4B]^2}^1/2
FEEDWATER FLOW, lb/hr x 1,000 4619.341 0.0011 0.0010 0.0020 0.0000 0.13 0.13FEEDWATER TEMPERATURE, F 4597.190 -4.5745 -0.4785 -0.2675 0.0002 -14.14 -14.14FEEDWATER PRESSURE, psig 4619.261 -0.0013 -0.0007 -0.0001 0.0000 -0.01 -0.01
SH-1 SPRAY FLOW, lb/hr x 1,000 4619.295 0.0012 0.0000 0.0008 0.0000 0.00 0.00SH-1 SPRAY TEMPERATURE, F 4619.172 -0.0303 -0.0026 -0.0011 0.0000 -0.09 -0.09SH-1 SPRAY PRESSURE, psig 4619.294 0.0000 0.0000 0.0000 0.0000 0.00 0.00
BLOWDOWN FLOW, lb/hr x 1,000 4619.295 0.0000 0.0000 0.0000 0.0000 0.00 0.00DRUM PRESSURE, psig 4619.295 0.0000 0.0000 0.0000 0.0000 0.00 0.00
MAIN STEAM TEMPERATURE, F 4647.033 2.7607 0.6005 0.1822 0.0000 81.22 81.22MAIN STEAM PRESSURE, psig 4615.928 -0.1367 -0.0729 -0.0128 0.0000 -0.58 -0.58
SOOTBLOWING STEAM FLOW, lb/hr x 1,000 4619.295 0.0000 0.0000 0.0000 0.0000 0.00 0.00SOOTBLOWING STEAM TEMPERATURE, F 4619.295 0.0000 0.0000 0.0000 0.0000 0.00 0.00SOOTBLOWING STEAM PRESSURE, psig 4619.295 0.0000 0.0000 0.0000 0.0000 0.00 0.00
HEATER 1 FW ENTERING TEMPERATURE, F 4657.355 9.4402 0.8239 0.3816 0.0009 28.97 28.97HEATER 1 FW ENT PRESSURE, psig 4619.469 0.0065 0.0038 0.0007 0.0000 0.03 0.03HEATER 1 FW LEAVING TEMPERATURE, F 4572.468 -9.7079 -1.0137 -0.4337 0.0015 -30.01 -30.01HEATER 1 FW LVG PRESSURE, psig 4619.221 -0.0028 -0.0016 -0.0003 0.0000 -0.01 -0.01HEATER 1 EXTRACTION STEAM TEMPERATURE, F 4630.375 1.7193 0.2399 0.1083 0.0000 5.42 5.42HEATER 1 EXTRACTION STEAM PRESSURE, psig 4617.995 -0.2181 -0.0281 -0.0397 0.0000 -0.23 -0.23HEATER 1 DRAIN TEMPERATURE, F 4608.931 -2.4750 -0.2243 -0.1103 0.0000 -7.60 -7.60HEATER 1 DRAIN PRESSURE, psig 4619.295 0.0000 0.0000 0.0000 0.0000 0.00 0.00
Base Output from Item [37] on OUTPUT form SeeUNCERTb2B Precision Index of Result ([13a]^2+[13b]^2+.....)^1/2 0.4640 Overall Degrees of Freedom [21]^4/([14a]+[14b]+.....) 0.0027 Student t Value from Table 5-1 in Code Precision Component of Uncertainty [21]x[23] Positive Bias Limit of Result ([15a]^2+[15b]^2+.....)^1/2 8623.0510 Negative Bias Limit of Result ([16a]^2+[16b]^2+.....)^1/2 8623.0510 Positive Total Uncertainty ([24]^2 + [25]^2)^1/2 Negative Total Uncertainty ([24]^2 + [26]^2)^1/2
OF PLANT ASME PTC 4 MASTER FORM UNIT NONO. DATE: LOADSTART: END: CALC BY
DATE SHEET OF
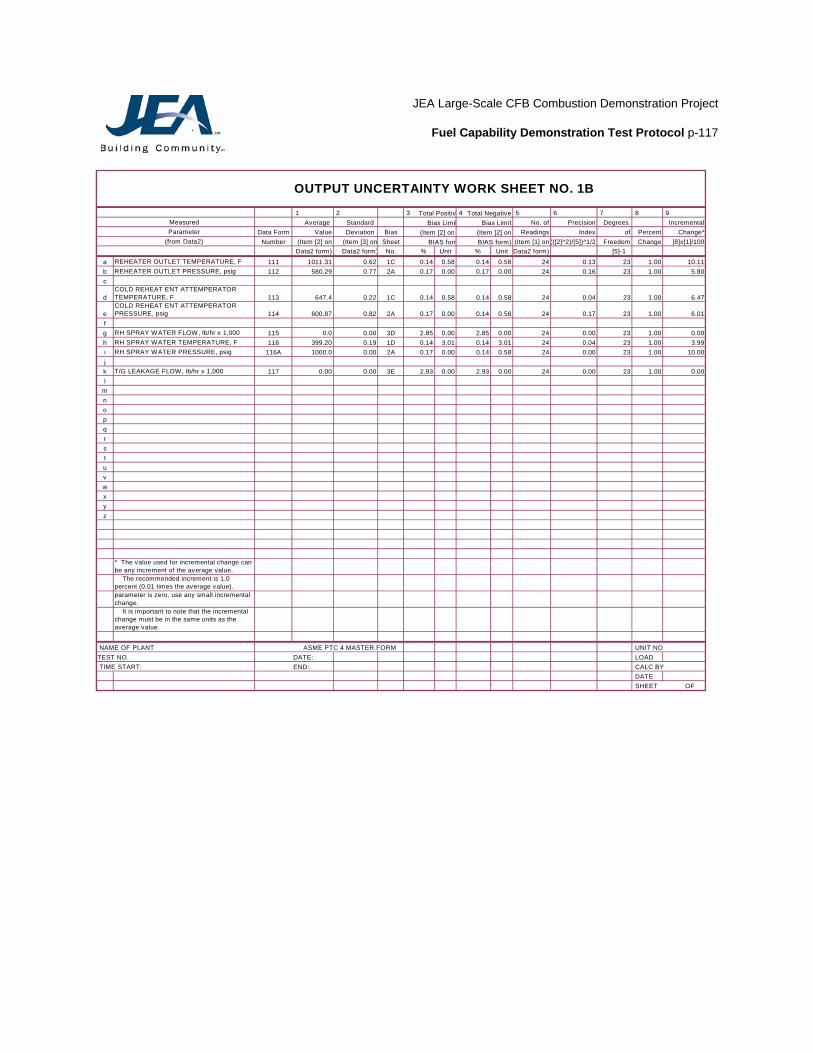
JEA Large-Scale CFB Combustion Demonstration Project
Fuel Capability Demonstration Test Protocol p-117
OUTPUT UNCERTAINTY WORK SHEET NO. 1B
1 2 3 4 5 6 7 8 9Measured Average Standard No. of Precision Degrees IncrementalParameter Data Form Value Deviation Bias Readings Index of Percent Change*
(from Data2) Number (Item [2] on (Item [3] on Sheet (Item [1] on (([2]^2)/[5])^1/2 Freedom Change [8]x[1]/100Data2 form) Data2 form) No. % Unit % Unit Data2 form) [5]-1
a REHEATER OUTLET TEMPERATURE, F 111 1011.31 0.62 1C 0.14 0.58 0.14 0.58 24 0.13 23 1.00 10.11b REHEATER OUTLET PRESSURE, psig 112 580.29 0.77 2A 0.17 0.00 0.17 0.00 24 0.16 23 1.00 5.80c
dCOLD REHEAT ENT ATTEMPERATOR TEMPERATURE, F 113 647.4 0.22 1C 0.14 0.58 0.14 0.58 24 0.04 23 1.00 6.47
eCOLD REHEAT ENT ATTEMPERATOR PRESSURE, psig 114 600.87 0.82 2A 0.17 0.00 0.14 0.58 24 0.17 23 1.00 6.01
fg RH SPRAY WATER FLOW, lb/hr x 1,000 115 0.0 0.00 3D 2.85 0.00 2.85 0.00 24 0.00 23 1.00 0.00h RH SPRAY WATER TEMPERATURE, F 116 399.20 0.19 1D 0.14 3.01 0.14 3.01 24 0.04 23 1.00 3.99i RH SPRAY WATER PRESSURE, psig 116A 1000.0 0.00 2A 0.17 0.00 0.14 0.58 24 0.00 23 1.00 10.00jk T/G LEAKAGE FLOW, lb/hr x 1,000 117 0.00 0.00 3E 2.93 0.00 2.93 0.00 24 0.00 23 1.00 0.00l
mnopqrstuvwxyz
* The value used for incremental change can be any increment of the average value. The recommended increment is 1.0 percent (0.01 times the average value).parameter is zero, use any small incremental change. It is important to note that the incremental change must be in the same units as the average value.
NAME OF PLANT ASME PTC 4 MASTER FORM UNIT NOTEST NO. DATE: LOAD TIME START: END: CALC BY
DATE SHEET OF
(Item [2] on (Item [2] on BIAS form BIAS form)
Total Positiv Total Negative Bias Limit Bias Limit
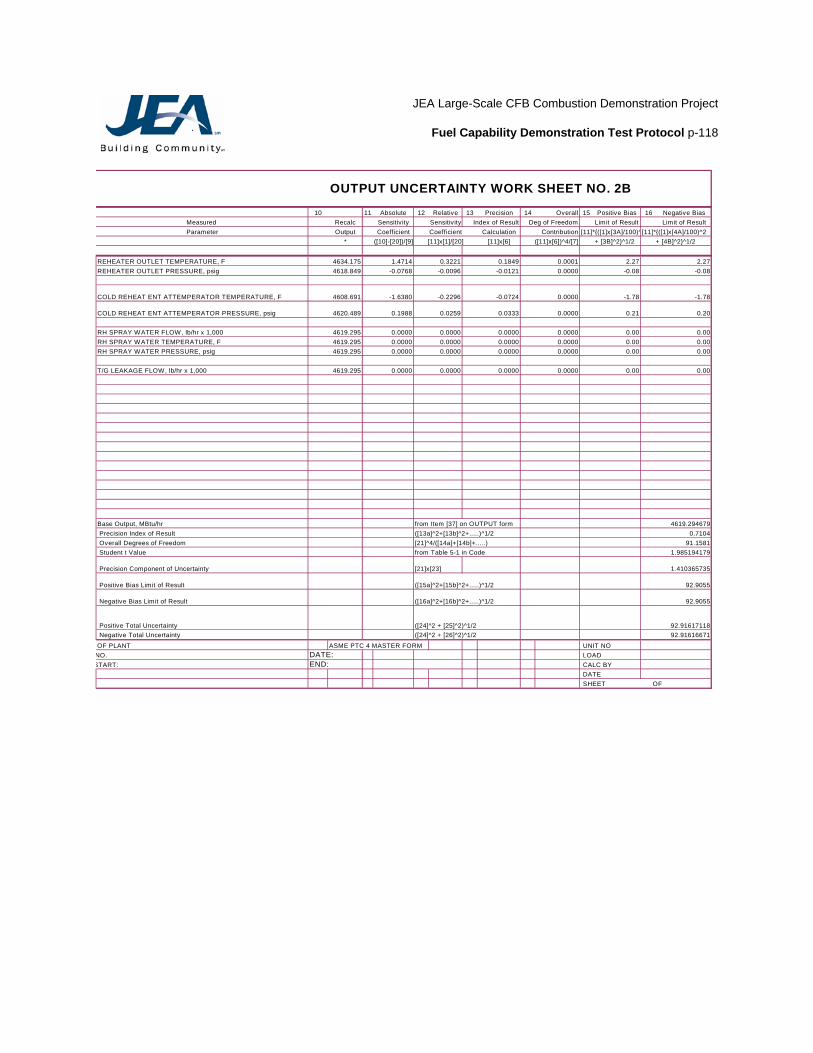
JEA Large-Scale CFB Combustion Demonstration Project
Fuel Capability Demonstration Test Protocol p-118
OUTPUT UNCERTAINTY WORK SHEET NO. 2B
10 11 Absolute 12 Relative 13 Precision 14 Overall 15 Positive Bias 16 Negative BiasMeasured Recalc Sensitivity Sensitivity Index of Result Deg of Freedom Limit of Result Limit of ResultParameter Output Coefficient Coefficient Calculation Contribution [11]*{([1]x[3A]/100)^[11]*{([1]x[4A]/100)^2
* ([10]-[20])/[9] [11]x[1]/[20] [11]x[6] ([11]x[6])^4/[7] + [3B]^2}^1/2 + [4B]^2}^1/2
REHEATER OUTLET TEMPERATURE, F 4634.175 1.4714 0.3221 0.1849 0.0001 2.27 2.27REHEATER OUTLET PRESSURE, psig 4618.849 -0.0768 -0.0096 -0.0121 0.0000 -0.08 -0.08
COLD REHEAT ENT ATTEMPERATOR TEMPERATURE, F 4608.691 -1.6380 -0.2296 -0.0724 0.0000 -1.78 -1.78
COLD REHEAT ENT ATTEMPERATOR PRESSURE, psig 4620.489 0.1988 0.0259 0.0333 0.0000 0.21 0.20
RH SPRAY WATER FLOW, lb/hr x 1,000 4619.295 0.0000 0.0000 0.0000 0.0000 0.00 0.00RH SPRAY WATER TEMPERATURE, F 4619.295 0.0000 0.0000 0.0000 0.0000 0.00 0.00RH SPRAY WATER PRESSURE, psig 4619.295 0.0000 0.0000 0.0000 0.0000 0.00 0.00
T/G LEAKAGE FLOW, lb/hr x 1,000 4619.295 0.0000 0.0000 0.0000 0.0000 0.00 0.00
Base Output, MBtu/hr from Item [37] on OUTPUT form 4619.294679 Precision Index of Result ([13a]^2+[13b]^2+.....)^1/2 0.7104 Overall Degrees of Freedom [21]^4/([14a]+[14b]+.....) 91.1581 Student t Value from Table 5-1 in Code 1.985194179
Precision Component of Uncertainty [21]x[23] 1.410365735
Positive Bias Limit of Result ([15a]^2+[15b]^2+.....)^1/2 92.9055
Negative Bias Limit of Result ([16a]^2+[16b]^2+.....)^1/2 92.9055
Positive Total Uncertainty ([24]^2 + [25]^2)^1/2 92.91617118 Negative Total Uncertainty ([24]^2 + [26]^2)^1/2 92.91616671
OF PLANT ASME PTC 4 MASTER FORM UNIT NONO. DATE: LOADSTART: END: CALC BY
DATE SHEET OF
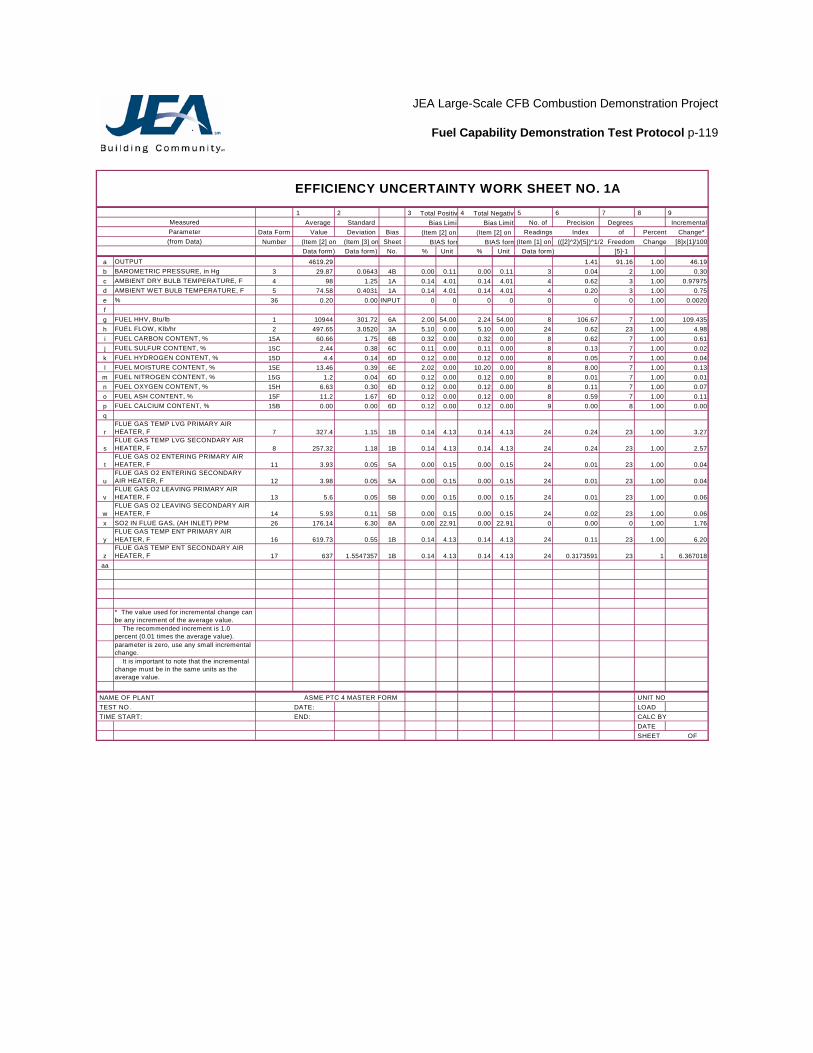
JEA Large-Scale CFB Combustion Demonstration Project
Fuel Capability Demonstration Test Protocol p-119
EFFICIENCY UNCERTAINTY WORK SHEET NO. 1A
1 2 3 4 5 6 7 8 9Measured Average Standard No. of Precision Degrees IncrementalParameter Data Form Value Deviation Bias Readings Index of Percent Change*(from Data) Number (Item [2] on (Item [3] on Sheet (Item [1] on (([2]^2)/[5])^1/2 Freedom Change [8]x[1]/100
Data form) Data form) No. % Unit % Unit Data form) [5]-1
a OUTPUT 4619.29 1.41 91.16 1.00 46.19b BAROMETRIC PRESSURE, in Hg 3 29.87 0.0643 4B 0.00 0.11 0.00 0.11 3 0.04 2 1.00 0.30c AMBIENT DRY BULB TEMPERATURE, F 4 98 1.25 1A 0.14 4.01 0.14 4.01 4 0.62 3 1.00 0.97975d AMBIENT WET BULB TEMPERATURE, F 5 74.58 0.4031 1A 0.14 4.01 0.14 4.01 4 0.20 3 1.00 0.75e % 36 0.20 0.00 INPUT 0 0 0 0 0 0 0 1.00 0.0020fg FUEL HHV, Btu/lb 1 10944 301.72 6A 2.00 54.00 2.24 54.00 8 106.67 7 1.00 109.435h FUEL FLOW, Klb/hr 2 497.65 3.0520 3A 5.10 0.00 5.10 0.00 24 0.62 23 1.00 4.98i FUEL CARBON CONTENT, % 15A 60.66 1.75 6B 0.32 0.00 0.32 0.00 8 0.62 7 1.00 0.61j FUEL SULFUR CONTENT, % 15C 2.44 0.38 6C 0.11 0.00 0.11 0.00 8 0.13 7 1.00 0.02k FUEL HYDROGEN CONTENT, % 15D 4.4 0.14 6D 0.12 0.00 0.12 0.00 8 0.05 7 1.00 0.04l FUEL MOISTURE CONTENT, % 15E 13.46 0.39 6E 2.02 0.00 10.20 0.00 8 8.00 7 1.00 0.13
m FUEL NITROGEN CONTENT, % 15G 1.2 0.04 6D 0.12 0.00 0.12 0.00 8 0.01 7 1.00 0.01n FUEL OXYGEN CONTENT, % 15H 6.63 0.30 6D 0.12 0.00 0.12 0.00 8 0.11 7 1.00 0.07o FUEL ASH CONTENT, % 15F 11.2 1.67 6D 0.12 0.00 0.12 0.00 8 0.59 7 1.00 0.11p FUEL CALCIUM CONTENT, % 15B 0.00 0.00 6D 0.12 0.00 0.12 0.00 9 0.00 8 1.00 0.00q
rFLUE GAS TEMP LVG PRIMARY AIR HEATER, F 7 327.4 1.15 1B 0.14 4.13 0.14 4.13 24 0.24 23 1.00 3.27
sFLUE GAS TEMP LVG SECONDARY AIR HEATER, F 8 257.32 1.18 1B 0.14 4.13 0.14 4.13 24 0.24 23 1.00 2.57
tFLUE GAS O2 ENTERING PRIMARY AIR HEATER, F 11 3.93 0.05 5A 0.00 0.15 0.00 0.15 24 0.01 23 1.00 0.04
uFLUE GAS O2 ENTERING SECONDARY AIR HEATER, F 12 3.98 0.05 5A 0.00 0.15 0.00 0.15 24 0.01 23 1.00 0.04
vFLUE GAS O2 LEAVING PRIMARY AIR HEATER, F 13 5.6 0.05 5B 0.00 0.15 0.00 0.15 24 0.01 23 1.00 0.06
wFLUE GAS O2 LEAVING SECONDARY AIR HEATER, F 14 5.93 0.11 5B 0.00 0.15 0.00 0.15 24 0.02 23 1.00 0.06
x SO2 IN FLUE GAS, (AH INLET) PPM 26 176.14 6.30 8A 0.00 22.91 0.00 22.91 0 0.00 0 1.00 1.76
yFLUE GAS TEMP ENT PRIMARY AIR HEATER, F 16 619.73 0.55 1B 0.14 4.13 0.14 4.13 24 0.11 23 1.00 6.20
zFLUE GAS TEMP ENT SECONDARY AIR HEATER, F 17 637 1.5547357 1B 0.14 4.13 0.14 4.13 24 0.3173591 23 1 6.367018
aa
* The value used for incremental change can be any increment of the average value. The recommended increment is 1.0 percent (0.01 times the average value).parameter is zero, use any small incremental change. It is important to note that the incremental change must be in the same units as the average value.
NAME OF PLANT ASME PTC 4 MASTER FORM UNIT NO TEST NO. DATE: LOAD TIME START: END: CALC BY
DATE SHEET OF
(Item [2] on (Item [2] on BIAS form BIAS form
Total Positiv Total Negativ Bias Limit Bias Limit
JEA Large-Scale CFB Combustion Demonstration Project
Fuel Capability Demonstration Test Protocol p-120
EFFICIENCY UNCERTAINTY WORK SHEET NO. 2A
10 11 Absolute 12 Relative 13 Precision 14 Overall 15 Positive Bias 16 Negative BiasMeasured Recalc Sensitivity Sensitivity Index of Result Deg of Freedom Limit of Result Limit of ResultParameter Efficiency Coefficient Coefficient Calculation Contribution [11]x{([1]x[3A]/100) ̂ [11]x{([1]x[4A]/100)^2
* ([10]-[20])/[9] [11]x[1]/[20] [11]x[6] ([11]x[6])^4/[7] + [3B]^2}^1/2 + [4B]^2}^1/2
a OUTPUT 85.318 -0.0901 -4.6531 -0.1271 0.0000 0.00 0.00b BAROMETRIC PRESSURE, in Hg 89.482 0.0000 0.0000 0.0000 0.0000 0.00 0.00c AMBIENT DRY BULB TEMPERATURE, F 89.482 0.0000 0.0000 0.0000 0.0000 0.00 0.00d AMBIENT WET BULB TEMPERATURE, F 89.482 0.0000 0.0000 0.0000 0.0000 0.00 0.00e SURFACE RADIATION AND CONVECTION, % 89.480 -1.0000 -0.0022 0.0000 0.0000 0.00 0.00fg FUEL HHV, Btu/lb 89.585 0.0009 0.1157 0.1009 0.0000 0.21 0.24h FUEL FLOW, Klb/hr 89.482 0.0000 0.0000 0.0000 0.0000 0.00 0.00i FUEL CARBON CONTENT, % 89.440 -0.0699 -0.0474 -0.0432 0.0000 -0.01 -0.01j FUEL SULFUR CONTENT, % 89.496 0.5813 0.0159 0.0782 0.0000 0.00 0.00k FUEL HYDROGEN CONTENT, % 89.435 -1.0644 -0.0528 -0.0527 0.0000 -0.01 -0.01l FUEL MOISTURE CONTENT, % 89.468 -0.1010 -0.0152 -0.8078 0.0608 -0.03 -0.14
m FUEL NITROGEN CONTENT, % 89.482 -0.0006 0.0000 0.0000 0.0000 0.00 0.00n FUEL OXYGEN CONTENT, % 89.482 0.0029 0.0002 0.0003 0.0000 0.00 0.00o FUEL ASH CONTENT, % 89.437 -0.4016 -0.0502 -0.2367 0.0004 -0.01 -0.01p FUEL CALCIUM CONTENT, % 89.482 0.0000 0.0000 0.0000 0.0000 0.00 0.00q
r FLUE GAS TEMP LVG PRIMARY AIR HEATER, F 89.394 -0.0269 -0.0984 -0.0063 0.0000 -0.11 -0.11
s FLUE GAS TEMP LVG SECONDARY AIR HEATER, F 89.477 -0.0019 -0.0055 -0.0005 0.0000 -0.01 -0.01
t FLUE GAS O2 ENTERING PRIMARY AIR HEATER, F 89.482 0.0000 0.0000 0.0000 0.0000 0.00 0.00
u FLUE GAS O2 ENTERING SECONDARY AIR HEATER, F 85.279 -105.5475 -4.6964 -1.1283 0.0705 -15.83 -15.83
v FLUE GAS O2 LEAVING PRIMARY AIR HEATER, F 89.482 0.0003 0.0000 0.0000 0.0000 0.00 0.00
w FLUE GAS O2 LEAVING SECONDARY AIR HEATER, F 85.271 -71.0266 -4.7063 -1.5244 0.2348 -10.65 -10.65x SO2 IN FLUE GAS, (AH INLET) PPM 85.278 -2.3866 -4.6978 0.0000 0.0000 -54.68 -54.68
y FLUE GAS TEMP ENT PRIMARY AIR HEATER, F 89.482 0.0000 0.0000 0.0000 0.0000 0.00 0.00
z FLUE GAS TEMP ENT SECONDARY AIR HEATER, F 85.27865 -0.6602 -4.6973 -0.2095 0.0001 -2.79 -2.79aa20 Base Efficiency from Item [100] on EFFb form See UNCERT2C21 Precision Index of Result ([13a]^2+[13b]^2+.....)^1/2 4.386522 Overall Degrees of Freedom [21]^4/([14a]+[14b]+.....) 0.366623 Student t Value from Table 5-1 in Code
24 Precision Component of Uncertainty [21]x[23]
25 Positive Bias Limit of Result ([15a]^2+[15b]^2+.....)^1/2 3362.2527
26 Negative Bias Limit of Result ([16a]^2+[16b]^2+.....)^1/2 3362.2819
27 Positive Total Uncertainty ([24]^2 + [25]^2)^1/228 Negative Total Uncertainty ([24]^2 + [26]^2)^1/2
NAME OF PLANT ASME PTC 4 MASTER FORM UNIT NO TEST NO. DATE: LOAD TIME START: END: CALC BY
DATE SHEET OF

JEA Large-Scale CFB Combustion Demonstration Project
Fuel Capability Demonstration Test Protocol p-121
EFFICIENCY UNCERTAINTY WORK SHEET NO. 1B
1 2 3 4 5 6 7 8 9Measured Average Standard No. of Precision Degrees IncrementalParameter Data Form Value Deviation Bias Readings Index of Percent Change*
(from Data2) Number (Item [2] on (Item [3] on Sheet (Item [1] on (([2]^2)/[5])^1/2 Freedom Change [8]x[1]/100Data2 form) Data form) No. % Unit % Unit Data2 form) [5]-1
a FEEDWATER FLOW, lb/hr x 1,000 101 4059088 8.6995 3C 2.85 0.00 2.85 0.00 24 1.78 23 1.00 40590.88b FEEDWATER TEMPERATURE, F 102 483 0.29 1D 0.14 3.01 0.14 3.01 24 0.06 23 1.00 4.832083c FEEDWATER PRESSURE, psig 102A 2616.89 0.5086 2A 0.17 0.00 0.17 0.00 24 0.10 23 1.00 26.17d SH-1 SPRAY FLOW, lb/hr x 1,000 103 28559.18 3.2581 3D 2.85 0.00 2.85 0.00 24 0.67 23 1.00 285.59e SH-1 SPRAY TEMPERATURE, F 104 404 0.19 1D 0.14 3.01 0.14 3.01 24 0.04 23 1.00 4.04195f SH-1 SPRAY PRESSURE, psig 104A 2666.89 0.5086 2A 0.17 0.00 0.17 0.00 24 0.10 23 1.00 26.67g BLOW DOWN FLOW , lb/hr x 1,000 105 0.00 0.0000 3E 2.93 0.00 2.93 0.00 2 0.00 1 1.00 0.00h DRUM PRESSURE, psig 106 2586.1 0.80 2A 0.17 0.00 0.17 0.00 24 0.16 23 1.00 25.86i MAIN STEAM TEMPERATURE, F 109 1004.76 0.32 1C 0.14 0.58 0.14 0.58 24 0.07 23 1.00 10.05j MAIN STEAM PRESSURE, psig 110 2463.26 0.46 2A 0.17 0.00 0.17 0.00 24 0.09 23 1.00 24.63k REHEATER OUTLET TEMPERATURE, F 111 1011.3 0.62 1C 0.14 0.58 0.14 0.58 24 0.13 23 1.00 10.11l REHEATER OUTLET PRESSURE, psig 112 580.29 0.77 2A 0.17 0.00 0.17 0.00 24 0.16 23 1.00 5.80
mCOLD REHEAT ENT ATTEMPERATOR TEMPERATURE, F 113 647.40 0.22 1C 0.141 0.58 0.14 0.58 24 0.04 23 1.00 6.47
nCOLD REHEAT ENT ATTEMPERATOR PRESSURE, psig 114 600.87 0.82 2A 0.17 0.00 0.17 0.00 24 0.17 23 1.00 6.01
o RH SPRAY WATER FLOW, lb/hr x 1,000 115 0.0 0.00 3D 2.85 0.00 2.85 0.00 24 0.00 23 1.00 0.00p RH SPRAY WATER TEMPERATURE, F 116 399.20 0.19 1D 0.14 3.01 0.14 3.01 24 0.04 23 1.00 3.99q RH SPRAY WATER PRESSURE, psig 116A 1000.00 0.00 2A 0.17 0.00 0.17 0.00 24 0.00 23 1.00 10.00rst TOTAL SA FLOW , KLB/HR 6 1000.00 0.00 3H 5.12 0.00 5.12 0.00 2 0.00 1 1.00 10.00
uCOMB AIR TEMP LVG PRIMARY AIR HEATER, F 18 541 0.8945791 1A 0.14 4.01 0.14 4.01 24 0.1826052 23 1 5.406875
vCOMB AIR TEMP LVG SECONDARY AIR HEATER, F 19 581 0.5262403 1A 0.14 4.01 0.14 4.01 24 0.1074183 23 1 5.807323
adCOMB AIR FLOW ENT PRIMARY AIR HEATER, LB/HR 9A 133.89 0.83 3H 5.12 0.00 5.12 0.00 24 0.17 23 1.00 1.34
xCOMB AIR TEMP ENT PRIMARY AIR HEATER, F 9B 133.89 0.83 1A 0.14 4.01 0.14 4.01 24 0.17 23 1.00 1.34
yCOMB AIR FLOW BYPASSING PRIMARY AIR HEATER, LB/HR 10A 114.66 2.70 3H 5.12 0.00 5.12 0.00 24 0.55 23 1.00 1.15
zCOMB AIR TEMP ENT SECONDARY AIR HEATER, F 10B 114.7 2.70 1A 0.14 4.01 0.14 4.01 24 0.55 23 1.00 1.15
aa
* The value used for incremental change can be any increment of the average value. The recommended increment is 1.0 percent (0.01 times the average value).parameter is zero, use any small incremental change. It is important to note that the incremental change must be in the same units as the average value.
NAME OF PLANT ASME PTC 4 MASTER FORM UNIT NO TEST NO. DATE: LOAD TIME START: END: CALC BY
DATE SHEET OF
Total Positiv Total Negativ Bias Limit Bias Limit (Item [2] on (Item [2] on BIAS form BIAS form
JEA Large-Scale CFB Combustion Demonstration Project
Fuel Capability Demonstration Test Protocol p-122
EFFICIENCY UNCERTAINTY WORK SHEET NO. 2B
10 11 Absolute 12 Relative 13 Precision 14 Overall 15 Positive Bias 16 Negative BiasMeasured Recalc Sensitivity Sensitivity Index of Result Deg of Freedom Limit of Result Limit of ResultParameter Efficiency Coefficient Coefficient Calculation Contribution [11]x{([1]x[3A]/100) [11]x{([1]x[4A]/100)^2
* ([10]-[20])/[9] [11]x[1]/[20] [11]x[6] ([11]x[6])^4/[7] + [3B]^2}^1/2 + [4B]^2}^1/2
a FEEDWATER FLOW, lb/hr x 1,000 89.482 0.0000 0.0000 0.0000 0.0000 0.00 0.00b FEEDWATER TEMPERATURE, F 89.482 0.0000 0.0000 0.0000 0.0000 0.00 0.00c FEEDWATER PRESSURE, psig 89.482 0.0000 0.0000 0.0000 0.0000 0.00 0.00d SH-1 SPRAY FLOW, lb/hr x 1,000 89.482 0.0000 0.0000 0.0000 0.0000 0.00 0.00e SH-1 SPRAY TEMPERATURE, F 89.482 0.0000 0.0000 0.0000 0.0000 0.00 0.00f SH-1 SPRAY PRESSURE, psig 89.482 0.0000 0.0000 0.0000 0.0000 0.00 0.00g BLOWDOWN FLOW, lb/hr x 1,000 89.482 0.0000 0.0000 0.0000 0.0000 0.00 0.00h DRUM PRESSURE, psig 89.482 0.0000 0.0000 0.0000 0.0000 0.00 0.00i MAIN STEAM TEMPERATURE, F 89.482 0.0000 0.0000 0.0000 0.0000 0.00 0.00j MAIN STEAM PRESSURE, psig 89.482 0.0000 0.0000 0.0000 0.0000 0.00 0.00k REHEATER OUTLET TEMPERATURE, F 89.482 0.0000 0.0000 0.0000 0.0000 0.00 0.00l REHEATER OUTLET PRESSURE, psig 89.482 0.0000 0.0000 0.0000 0.0000 0.00 0.00
m COLD REHEAT ENT ATTEMPERATOR TEMPERATURE, F 89.482 0.0000 0.0000 0.0000 0.0000 0.00 0.00
n COLD REHEAT ENT ATTEMPERATOR PRESSURE, psig 89.482 0.0000 0.0000 0.0000 0.0000 0.00 0.00o RH SPRAY WATER FLOW, lb/hr x 1,000 89.482 0.0000 0.0000 0.0000 0.0000 0.00 0.00p RH SPRAY WATER TEMPERATURE, F 89.482 0.0000 0.0000 0.0000 0.0000 0.00 0.00q RH SPRAY WATER PRESSURE, psig 89.482 0.0000 0.0000 0.0000 0.0000 0.00 0.00rst TOTAL SA FLOW, KLB/HR 89.298 -0.0184 -0.2059 0.0000 0.0000 -0.94 -0.94
u COMB AIR TEMP LVG PRIMARY AIR HEATER, F 85.268 -0.7793 -4.7091 -0.1423 0.0000 -3.1824 -3.182436753
v COMB AIR TEMP LVG SECONDARY AIR HEATER, F 85.279 -0.7238 -4.6973 -0.0777 0.0000 -2.9635 -2.96349125
ad COMB AIR FLOW ENT PRIMARY AIR HEATER, LB/HR 89.484 0.0013 0.0019 0.0002 0.0000 0.01 0.01
x COMB AIR TEMP ENT PRIMARY AIR HEATER, F 89.510 0.0208 0.0311 0.0035 0.0000 0.08 0.08
y COMB AIR FLOW BYPASSING PRIMARY AIR HEATER, LB/HR 89.482 0.0000 0.0000 0.0000 0.0000 0.00 0.00
z COMB AIR TEMP ENT SECONDARY AIR HEATER, F 89.484 0.0015 0.0019 0.0008 0.0000 0.01 0.01aa20 Base Efficiency from Item [100] on EFFb form See UNCERT2C21 Precision Index of Result ([13a]^2+[13b]^2+.....)^1/2 0.026322 Overall Degrees of Freedom [21]^4/([14a]+[14b]+.....) 0.000023 Student t Value from Table 5-1 in Code
24 Precision Component of Uncertainty [21]x[23]
25 Positive Bias Limit of Result ([15a]^2+[15b]^2+.....)^1/2 19.8083
26 Negative Bias Limit of Result ([16a]^2+[16b]^2+.....)^1/2 19.8083
27 Positive Total Uncertainty ([24]^2 + [25]^2)^1/228 Negative Total Uncertainty ([24]^2 + [26]^2)^1/2
NAME OF PLANT ASME PTC 4 MASTER FORM UNIT NO TEST NO. DATE: LOAD TIME START: END: CALC BY
DATE SHEET OF
JEA Large-Scale CFB Combustion Demonstration Project
Fuel Capability Demonstration Test Protocol p-123
EFFICIENCY UNCERTAINTY WORK SHEET NO. 1C
1 2 3 4 5 6 7 8 9Measured Average Standard No. of Precision Degrees IncrementalParameter Data Form Value Deviation Bias Readings Index of Percent Change*(from Data) Number (Item [2] on (Item [3] on Sheet (Item [1] on (([2]^2)/[5])^1/2 Freedom Change [8]x[1]/100
Data form) Data form) No. % Unit % Unit Data form) [5]-1
a SEAL POT BLOWER AIR FLOW, LB/HR 38 115 2.7021 3H 5.12 0.00 5.12 0.00 24 0.55 23 1.00 1.15b SEAL POT BLOWER EXIT AIR TEMP, F 40 115 2.70 1A 0.14 4.01 0.14 4.01 24 0.55 23 1.00 1.146643c INTREX BLOWER AIR FLOW, LB/HR 37 133.89 0.8336 3H 5.12 0.00 5.12 0.00 24 0.17 23 1.00 1.34d INTREX BLOWER EXIT AIR TEMP, F 39 133.89 0.8336 1A 0.14 4.01 0.14 4.01 24 0.17 23 1.00 1.34ef FLY ASH FLOW RATE, KLB/HR 20 0.00 0.0000 3G 7.00 0.00 7.00 0.00 2 0.00 1 1.00 0.00g ORGANIC CARBON IN FLY ASH, % 22A 11.66 1.13 7A 5.01 0.00 5.01 0.00 8 0.40 7 1.00 0.12h INORGANIC CARBON IN FLY ASH, % 22B 0.15 0.17 7A 5.01 0.00 5.01 0.00 8 0.06 7 1.00 0.00i CALCIUM IN FLY ASH, % 22C 11.7 1.13 7A 5.01 0.00 5.01 0.00 8 0.40 7 1.00 0.12j CARBONATE IN FLY ASH AS CO2, % 22D 0.15 0.17 7A 5.01 0.00 5.01 0.00 8 0.06 7 1.00 0.00k
lBOTTOM ASH INORGANIC CARBON CONTENT, % 23B 0.15 0.17 7A 5.01 0.00 5.01 0.00 8 0.06 7 1.00 0.00
m BOTTOM ASH TEMPERATURE, F 21 1499.19 10.82 1B 0.14 4.13 0.14 4.13 24 2.21 23 1.00 14.99
nBOTTOM ASH ORGANIC CARBON CONTENT, % 23A 0.15 0.1687 7A 5.01 0.00 5.01 0.00 8 0.06 7 1.00 0.00
o BOTTOM ASH CALCIUM CONTENT, % 23C 12 1.125902 7A 5.01 0.00 5.01 0.00 8 0.3980665 7 1 0.116638p BOTTOM ASH CARBONATE AS CO2, % 23D 0 0.1686872 7A 5.01 0.00 5.01 0.00 8 0.0596399 7 1 0.001463qr LIMESTONE FLOW, lb/hr 25 100.5 0.62 3B 7.00 0.00 7.00 0.00 24 0.13 23 1.00 1.01s CaCO3 IN LIMESTONE, % mass 28 94.03 0.75 9A 2.00 0.16 2.00 0.16 0 0.00 0 1.00 0.94t Ca(OH)2 IN LIMESTONE, % mass 29 0.00 0.00 9A 2.00 0.16 2.00 0.16 0 0.00 0 1.00 0.00u MgCO3 IN LIMESTONE, % mass 30 1.3 0.11 9B 2.00 0.11 2.00 0.11 0 0.00 0 1.00 0.01
vLIMESTONE CARBONATE CONVERSION FRACTION, % 31 95.00 0.00 9B 2.00 0.11 2.00 0.11 0 0.00 0 1.00 0.95
w MOISTURE IN LIMESTONE, % mass 32 0.1 0.06 9C 5.39 0.00 5.39 0.00 0 0.00 0 1.00 0.00x INERT MATERIAL IN LIMESTONE, % mass 33 4.65 0.71 9D 14.28 0.00 10.20 0.00 0 0.00 0 1.00 0.05yz
aa
* The value used for incremental change can be any increment of the average value. The recommended increment is 1.0 percent (0.01 times the average value).parameter is zero, use any small incremental change. It is important to note that the incremental change must be in the same units as the average value.
NAME OF PLANT ASME PTC 4 MASTER FORM UNIT NO TEST NO. DATE: LOAD TIME START: END: CALC BY
DATE SHEET OF
(Item [2] on (Item [2] on BIAS form BIAS form
Total Positiv Total Negativ Bias Limit Bias Limit

JEA Large-Scale CFB Combustion Demonstration Project
Fuel Capability Demonstration Test Protocol p-124
EFFICIENCY UNCERTAINTY WORK SHEET NO. 2C
10 11 Absolute 12 Relative 13 Precision 14 Overall 15 Positive Bias 16 Negative BiasMeasured Recalc Sensitivity Sensitiv ity Index of Result Deg of Freedom Limit of Result Limit of ResultParameter Efficiency Coefficient Coefficient Calculation Contribution [11]x{([1]x[3A]/100) [11]x{([1]x[4A]/100)^2
* ([10]-[20])/[9] [11]x[1]/[20] [11]x[6] ([11]x[6])^4/[7] + [3B]^2}^1/2 + [4B]^2}^1/2
a SEAL POT BLOWER AIR FLOW, LB/HR 89.482 0.0000 0.0000 0.0000 0.0000 0.00 0.00b SEAL POT BLOWER EXIT AIR TEMP, F 89.482 0.0000 0.0000 0.0000 0.0000 0.00 0.00c INTREX BLOWER AIR FLOW, LB/HR 89.484 0.0013 0.0019 0.0002 0.0000 0.01 0.01d INTREX BLOWER EXIT AIR TEMP, F 89.494 0.0089 0.0133 0.0015 0.0000 0.04 0.04ef FLY ASH FLOW RATE, KLB/HR 89.482 0.0000 0.0000 0.0000 0.0000 0.00 0.00g ORGANIC CARBON IN FLY ASH, % 89.482 0.0000 0.0000 0.0000 0.0000 0.00 0.00h INORGANIC CARBON IN FLY ASH, % 89.482 0.0000 0.0000 0.0000 0.0000 0.00 0.00i CALCIUM IN FLY ASH, % 89.476 -0.0544 -0.0071 -0.0217 0.0000 -0.03 -0.03j CARBONATE IN FLY ASH AS CO2, % 89.482 0.0000 0.0000 0.0000 0.0000 0.00 0.00k
l BOTTOM ASH INORGANIC CARBON CONTENT, % 89.482 0.0000 0.0000 0.0000 0.0000 0.00 0.00m BOTTOM ASH TEMPERATURE, F 89.476 -0.0004 -0.0069 -0.0009 0.0000 0.00 0.00
n BOTTOM ASH ORGANIC CARBON CONTENT, % 89.482 0.0000 0.0000 0.0000 0.0000 0.00 0.00o BOTTOM ASH CALCIUM CONTENT, % 89.445 -0.3163 -0.0412 -0.1259 0.0000 -0.18 -0.18p BOTTOM ASH CARBONATE AS CO2, % 89.482 0.0000 0.0000 0.0000 0.0000 0.00 0.00qr LIMESTONE FLOW, lb/hr 89.482 0.0000 0.0000 0.0000 0.0000 0.00 0.00s CaCO3 IN LIMESTONE, % mass 89.483 0.0015 0.0016 0.0000 0.0000 0.00 0.00t Ca(OH)2 IN LIMESTONE, % mass 85.279 0.0000 0.0000 0.0000 0.0000 0.00 0.00u MgCO3 IN LIMESTONE, % mass 89.482 -0.0169 -0.0002 0.0000 0.0000 0.00 0.00
v LIMESTONE CARBONATE CONVERSION FRACTION, % 85.279 -4.4245 -4.6973 0.0000 0.0000 -8.42 -8.42w MOISTURE IN LIMESTONE, % mass 89.482 -0.0066 0.0000 0.0000 0.0000 0.00 0.00x INERT MATERIAL IN LIMESTONE, % mass 89.481 -0.0263 -0.0014 0.0000 0.0000 -0.02 -0.01yz
aa20 Base Efficiency from Item [100] on EFFb form 89.4818915321 Precision Index of Result ([13a]^2+[13b]^2+.....)^1/2 2.104522 Overall Degrees of Freedom [21]^4/([14a]+[14b]+.....) 53.496723 Student t Value from Table 5-1 in Code 2.00422994
24 Precision Component of Uncertainty [21]x[23] 4.217993169
25 Positive Bias Limit of Result ([15a]^2+[15b]^2+.....)^1/2 58.7623
26 Negative Bias Limit of Result ([16a]^2+[16b]^2+.....)^1/2 58.7625
27 Positive Total Uncertainty ([24]^2 + [25]^2)^1/2 58.913453628 Negative Total Uncertainty ([24]^2 + [26]^2)^1/2 58.91369995
NAME OF PLANT ASME PTC 4 MASTER FORM UNIT NO TEST NO. DATE: LOAD TIME START: END: CALC BY
DATE SHEET OF

JEA Large-Scale CFB Combustion Demonstration Project
Fuel Capability Demonstration Test Protocol p-125
Attachment T – Correction Curves

JEA Large-Scale CFB Combustion Demonstration Project
Fuel Capability Demonstration Test Protocol p-126

JEA Large-Scale CFB Combustion Demonstration Project
Fuel Capability Demonstration Test Protocol p-127
JEA Large-Scale CFB Combustion Demonstration Project
Fuel Capability Demonstration Test Protocol p-128
JEA Large-Scale CFB Combustion Demonstration Project
Fuel Capability Demonstration Test Protocol p-129
JEA Large-Scale CFB Combustion Demonstration Project
Fuel Capability Demonstration Test Protocol p-130
Attachment U – Abbreviation List Following is a definition of abbreviations used in this report. Note that at their first use, these terms are fully defined in the text of the report, followed by the abbreviation in the parenthesis. Subsequent references use the abbreviation only.
Abbreviation Definition
A.F. As-Fired
AQCS Air Quality Control System
BA Bed Ash
BOP Balance of Plant
btu British Thermal Unit
C Coal
CaCO3 wt. fraction CaCO3 in limestone
Ca:S Calcium to Sulfur Ration
CaO Lime
Cb Pounds of carbon per pound of “as-fired” fuel
CEM Continuous Emissions Monitoring
CFB Circulating Fluidized Bed
CO Carbon Monoxide
CO2 Carbon Dioxide
DCS Distributed Control System
DOE Department of Energy
F Fluorine or Degrees Farenheit
FA Fly ash
FF Fabric Filter
gpm gallons per minute
gr/acf grains per actual cubic foot
gr/dscf grains per dry standard cubic foot
h#1DRN Enthalpy of drain from #1 heater
JEA Large-Scale CFB Combustion Demonstration Project
Fuel Capability Demonstration Test Protocol p-131
h#1INFW BFW enthalpy at heater #1 inlet
h#1OUTFW BFW enthalpy at heater #1 outlet
HEXTR1 Enthalpy of extraction to #1 heater
Hg Mercury
HHV Higher Heating Value
HP High-Pressure
HCRH Cold reheat steam enthalpy at the boiler outlet, Btu/lb
hFW Feedwater enthalpy entering the economizer, Btu/lb
HHRH Hot reheat steam enthalpy at the boiler outlet, Btu/lb
HMS Main steam enthalpy at the boiler outlet, Btu/lb
L Lime
lb/hr Pounds per hour
lb/MMBtu pounds per million Btu
LS Limestone
MBtu Million Btu
MCR Maximum Continuous Rating
MgCO3 wt. fraction MgCO3 in limestone
MU Measurement Uncertainty
MWX Molecular weight of respective elements
NGS Northside Generating Station
NH3 Ammonia
NOx Oxides of Nitrogen
NS Northside
Pb Lead
PC Petroleum Coke
pcf pounds per cubic foot
Pitt 8 Pittsburgh 8

JEA Large-Scale CFB Combustion Demonstration Project
Fuel Capability Demonstration Test Protocol p-132
PJFF Pulse Jet Fabric Filter
PM Particulate Matter
ppm parts per million
ppmdv Pounds per million, dry volume
psia Pounds per square inch pressure absolute
psig pounds per square inch pressure gauge
PTC Power Test Code
RH Reheat
S Capture(AQCS) Sulfur capture by the AQCS, %
SDA Spray Dryer Absorber
Sf Wt. fraction of sulfur in fuel, as-fired
SH Superheat
SNCR Selective Non-Catalytic Reduction
SO2 Sulfur Dioxide
SO2(inlet) SO2 in the AQCS inlet (lb/MBtu)
SO2(stack) SO2 in the stack (lb/MBtu)
SO3 Sulfur Trioxide
TG Turbine Generator
tph tons per hour
VOC Volatile Organic Carbon
Wl Limestone feed rate (lb/hr)
WEXTR1 Extraction flow to heater #1
Wfe Fuel feed rate (lb/hr)
WFWH feedwater flow at heaters
WMS Main steam flow, lb/hr
WRH Reheat steam flow, lb/hr
wt % weight percentage

JEA Large-Scale CFB Combustion Demonstration Project
Fuel Capability Demonstration Test Protocol p-133
JEA Tag Number Conventions are as follows: AA-BB-CC-xxx AA designates GEMS Group/System, as follows: BK = Boiler Vent and Drains
QF = Feedwater Flow SE = Reheat Piping SH = Reheat Superheating SI = Secondary Superheating SJ = Main Street Piping BB designates major equipment codes, as follows: 12 = Control Valve 14 = Manual Valve 34 = Instrument CC designates instrument type, as follows: FT = Flow transmitter FI = Flow indicator TE = Temperature element xxx designates numerical sequence number