Embed Size (px)
Citation preview
i
Fuel Cell and Micro Gas Turbine
Integrated Design
Endale Woldesilassie

ii
Master of Science Thesis EGI 2013:xxx
Fuel Cell and Micro Gas turbine Integrated Design
Endale Woldesilassie
Approved
Date
Examiner
Torsten Fransson
Supervisor
Anders Malmquist
Hina Noor
Commissioner
Contact person

iii
Abstract
This work represents the integration of a hybrid system based on Micro Gas Turbine system available at
the division of Heat and Power Technology at KTH and Solid Oxide Fuel Cell. The MGT available is an
externally fired recuperated and the SOFC is of planar type. Before the integration, these two different
candidates of environmentally friendly power generation systems are discussed separately. The advantages
and performances of the two separate systems are presented. The operation conditions as pressure and
temperature are fixed at different stations based on the previous experiments. Keeping the parameters
constant a reduction of fuel to the combustor could be achieved. Finally, layout of the hybrid system
diagram is suggested and orientation of a computer designed layout is also presented. An efficiency of
65% from SOFC has been achieved and reductions of the fuel by more than 50% to the MGT are
noteworthy.
Keywords: Micro Gas Turbine, Solid Oxide Fuel Cell, Hybrid system, Integration, efficiency and Layout

iv
ACKNOWLEDGEMENTS
I would like to express my sincere gratitude to Dr. Anders Malmquist for giving me this opportunity to
complete my mater thesis, for his uninterrupted support, encouragement and guidance at difficult time.
I would like to express my appreciation and gratitude to my co supervisor Hina Noor for her clear follow
ups; challenge contribution in making me understand the subject, for her kind tolerance and
encouragement.
Special thanks to Dr. Bin Zhu for assigning such a great co-worker Muhammad Afzal, who guided me,
taught me, helped and controlled my understanding and lead me to learn deeper about the fuel cell part.
I would like to express my greatest appreciations to my wife and children for their unconditional love and
support as well as for being by my side regardless of the situation.
Last but not least, I would like to thank Dr. Catharina Erlich for giving me wise and logical advices when I
needed them, for encouraging and supporting me in my whole stay at KTH, and to my classmates Sven
Wolf and Jonathan Linder Gottfriedz for their support during our studies, for believing in me and
encouraging me to succeed in my studies.

v
Table of Contents
Abstract .......................................................................................................................................................................... iii
Acknowledgements ...................................................................................................................................................... iv
List of Figures .............................................................................................................................................................. vii
LIST OF TABLES .....................................................................................................................................................viii
NOMENCLATURE ................................................................................................................................................... ix
SYMBOLS ...................................................................................................................................................................... x
1 Scope and Limitations ......................................................................................................................................... 1
2 Introduction .......................................................................................................................................................... 1
3 Objectives .............................................................................................................................................................. 2
4 Methodology ......................................................................................................................................................... 2
5 Literature Review ................................................................................................................................................. 3
5.1 History of Fuel Cells ................................................................................................................................... 3
5.2 What are Fuel Cells? ................................................................................................................................... 4
5.3 Components of Fuel Cells ......................................................................................................................... 5
5.3.1 Anode ....................................................................................................................................................... 6
5.3.2 Cathode .................................................................................................................................................... 6
5.3.3 Electrolytes .............................................................................................................................................. 6
5.3.4 Interconnects ........................................................................................................................................... 6
5.4 Classification of Fuel Cells ........................................................................................................................ 6
5.4.1 Proton Exchange Membrane Fuel Cells (PEMFC) .......................................................................... 8
5.4.2 Alkaline Electrolyte Fuel Cell (AFC) ................................................................................................... 8
5.4.3 Phosphoric Acid Fuel Cells (PAFC).................................................................................................... 9
5.4.4 Molten Carbonate Fuel Cells (MCFC) ..............................................................................................10
5.4.5 Solid Oxide Fuel Cells (SOFC) ..........................................................................................................11
5.5 The Applications, Advantages and Disadvantages of Fuel Cells ......................................................13
6 Geometry of SOFC ...........................................................................................................................................16
6.1 Single Cell ...................................................................................................................................................16
6.1.1 Configuration of SOFC stack .............................................................................................................17
6.2 Operating principles of Fuel Cells ..........................................................................................................20
6.3 Performance of Fuel Cells .......................................................................................................................22
6.3.1 Activation loss: ......................................................................................................................................23
6.3.2 Fuel Cross Over: ...................................................................................................................................24
6.3.3 Ohmic Loss ...........................................................................................................................................24
6.3.4 Mass transport loss: ..............................................................................................................................24
7 Fuel for Fuel Cells ..............................................................................................................................................25
7.1 Steam Reforming Reaction ......................................................................................................................25

vi
7.2 Water - Gas Shift Reaction ......................................................................................................................26
7.3 Partial Oxidation .......................................................................................................................................26
7.4 Auto-thermal Reforming .........................................................................................................................27
8 Fuel utilization ....................................................................................................................................................27
9 Micro Gas Turbine ( GT ) .............................................................................................................................29
9.1 Compressor ................................................................................................................................................30
9.2 Turbine .......................................................................................................................................................31
9.3 Combustor or Combustion chamber .....................................................................................................32
9.4 Recuperator ................................................................................................................................................35
10 Model Description .............................................................................................................................................36
10.1 Starting-up the SOFC system ..................................................................................................................42
10.2 Shutting down the SOFC ........................................................................................................................42
10.3 Starting up the hybrid system ..................................................................................................................42
10.4 Shutting down the System .......................................................................................................................43
11 Economy of the SOFC system ........................................................................................................................43
12 Practical work in the Laboratory......................................................................................................................44
13 Results and Discussion ......................................................................................................................................45
14 Conclusion ...........................................................................................................................................................52
15 Recommendations ..............................................................................................................................................53
APPENDIX 2 – schematics for the mass flow pressure and ..............................................................................56
temperature used .........................................................................................................................................................56
Appendix 3 – calculations ..........................................................................................................................................57
Bibliography: ................................................................................................................................................................65

vii
LIST OF FIGURES
Figure 1. Schematic of a hydrogen fuel cell in operation (Kulikovsky, 2010) ..................................................................... 5
Figure 2. Overview of the chemical reaction in Fuel cell types (Bewag, 2001).................................................................... 7
Figure 3. Schematics of Proton exchange membrane fuel cells (Energy, 2011) ................................................................... 8
Figure 4. Simple schematics of alkaline fuel cells (Energy, 2011) ...................................................................................... 9
Figure 5. Schematics of Phosphoric Acid Fuel Cells (Energy, 2011) ..............................................................................10
Figure 6. Schematics of Molten Carbonate Fuel Cells (Energy, 2011) ............................................................................10
Figure 7. The operation principles of solid oxide fuel cell (De Guire, 2003) ....................................................................11
Figure 8. Different sectors where power generated from fuel cells are applicable (Today, 2012) ........................................13
Figure 9. Schematics of co and cross-flow monolithic SOFC (Minh, et al., 1995) ..........................................................18
Figure 10. Schematics of Air electrode supported tubular SOFC (Veyo, 2003) ..............................................................18
Figure 11. Schematic for a Planar SOFC (Zou, et al., 2012) ......................................................................................19
Figure 12. Ideal and actual Cell voltage/current characteristics (EG&G, 2002) .............................................................22
Figure 13. Schematic representation of direct and indirect reforming (Larminie, et al., 2003) .........................................26
Figure 14. Micro Gas Turbine components (Hamilton, 2003) ......................................................................................30
Figure 15. Appearance of Turbine and Compressor in an Micro Gas Turbine (Compower, 2010) ..............................32
Figure 16. Simple schematic of inflow and outflow into and out of combustor .....................................................................33
Figure 17. The suggested layout of integrated system from GT and SOFC ..................................................................37
Figure 18 . Schematic diagram for Inflow and outflow around three way plug ....................................................................40
Figure 19. Schematic diagram of inflows and outflows around the combustor .....................................................................41
Figure 20 . Some of the chemicals materials used for preparation of electrodes and electrolytes .............................................45
Figure 21 . Performance of Single Layer Device LiNiCuSDC .........................................................................................47
Figure 22 . Plot of Real and Imaginary Impedance for Three Layer Device .......................................................................48
Figure 23 . Plot of Phase of Impedance against Frequency for Three Layer Device ............................................................48
Figure 24 . The Performance of Three Layer Device .........................................................................................................49
Figure 25 .CAD orientation layout .................................................................................................................................50
Figure 26 . Layout of an improvemen to suggest................................................................................................................52

viii
LIST OF TABLES
Table 1 . Description of advantages and disadvantages of fuel cells over conventional power generation in general ................14
Table 2 . Characteristics of five major types of fuel Cells (Brouwer, 2006) ......................................................................14
Table 3 . Fuel cell comparison chart adopted from US Department of Energy (Energy, 2011) .......................................15
Table 4. single Cells in electrochemical energy conversion and storage system .......................................................................16
Table 5 . Features of planar single cell configurations (Singhal, et al., 2003) ..................................................................19
Table 6 . Main characteristics of Tubular and Planar SOFC (Bove, 2005) ................................................................20
Table 7 . Gibbs free energy for the water formation reaction at various Temperatures with maximum voltage and limited
efficiency (Rayment, et al., 2003) .........................................................................................................................22
Table 8 . The fuel requirements for the principal types of fuel cells (Larminie, et al., 2003) ............................................25
Table 9 . Summary of the constants used from Shomate equation in this work (Linstrom, et al., 2013) .........................39
Table 10 . Results obtained before Integration of MGT and SOFC systems .....................................................................46
Table 11 . Table showing the performance of Three Layer Device ......................................................................................49
Table 12 . Results obtained from integrated system ...........................................................................................................51
ix
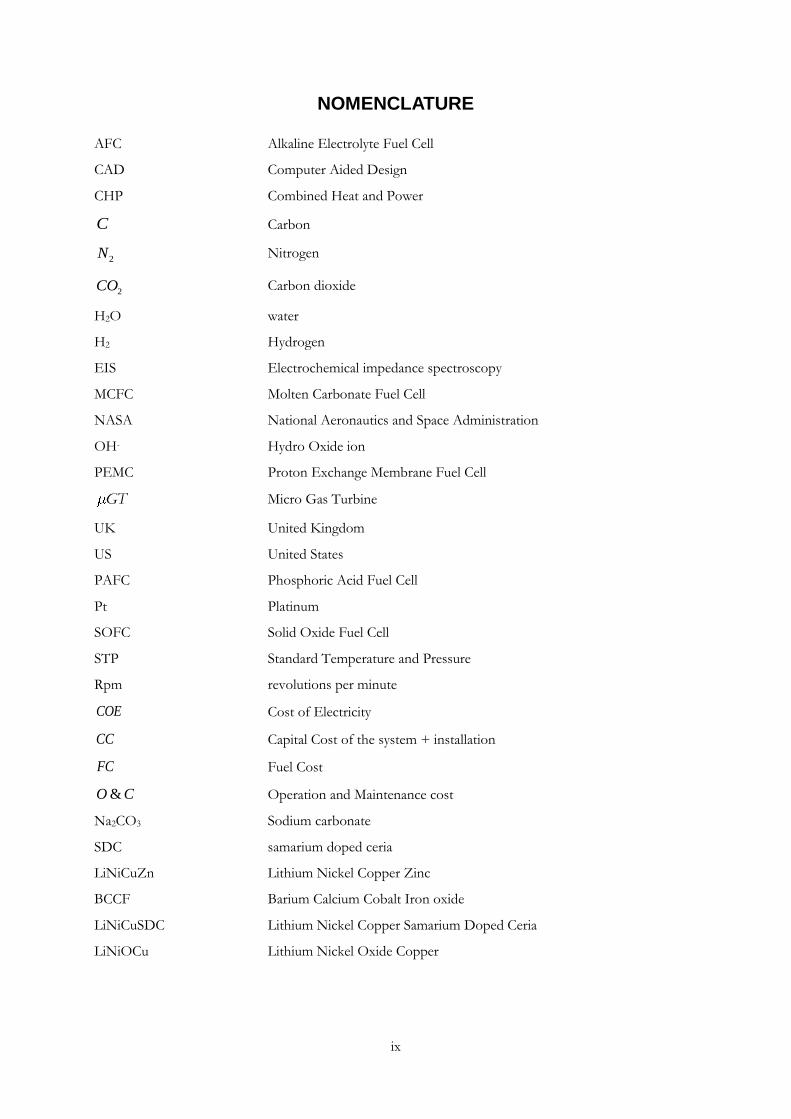
NOMENCLATURE
AFC Alkaline Electrolyte Fuel Cell
CAD Computer Aided Design
CHP Combined Heat and Power
C Carbon
2N Nitrogen
2CO Carbon dioxide
H2O water
H2 Hydrogen
EIS Electrochemical impedance spectroscopy
MCFC Molten Carbonate Fuel Cell
NASA National Aeronautics and Space Administration
OH- Hydro Oxide ion
PEMC Proton Exchange Membrane Fuel Cell
GT Micro Gas Turbine
UK United Kingdom
US United States
PAFC Phosphoric Acid Fuel Cell
Pt Platinum
SOFC Solid Oxide Fuel Cell
STP Standard Temperature and Pressure
Rpm revolutions per minute
COE Cost of Electricity
CC Capital Cost of the system + installation
FC Fuel Cost
&O C Operation and Maintenance cost
Na2CO3 Sodium carbonate
SDC samarium doped ceria
LiNiCuZn Lithium Nickel Copper Zinc
BCCF Barium Calcium Cobalt Iron oxide
LiNiCuSDC Lithium Nickel Copper Samarium Doped Ceria
LiNiOCu Lithium Nickel Oxide Copper

x
SYMBOLS
e- Electron ion
0C Degree Centigrade
AC Alternative Current
DC Direct Current
% Percent
bC Concentration at the Triple point
A The total area of the heat exchanger where heat transfers through
Specific fuel consumption
f The Stoichiometric air to fuel ration
outputE Voltage output
,out afterQ Heat released after the integration of the system
,out beforeQ Heat released after the integration of the system
X Gas content
Dh Enthalpy difference at different temperature
F Faraday Constant
FC Fuel Cell
iG Free energy species i for the product
jG Free energy species i for the Reactant
I Current
T Temperature
G Change in Gibb´s free energy
H Change in enthalpy
S Change in entropy
lossE Total voltage loss
Eact
Activation loss
Eohm
Ohmic loss
Econc
Concentration loss
V Volt
OCVE Open Circuit Voltage or Reversible Voltage

xi
,OCV AE Reversible voltage at the Anode
,OCV CE Reversible voltage at the Cathode
ohmE Ohmic loss
,SOFC elP Net power from SOFC
U The overall heat transfer coefficient
id Ideal efficiency
act Activation polarization
Ai Anodic current
Ci Cathodic current
H Annual operating hours
TBP Triple Phase Boundary
,SOFC system The average efficiency of the SOFC system
2U
H Fuel hydrogen utilization factor
2,Hn
consumed Moles of Hydrogen consumed
2,nH Supplied
Moles of Hydrogen supplied
2U
O Oxygen utilization factor
2,nO consumed
Moles of Oxygen consumed
2, nO Air supplied
Moles of oxygen supplied
,Comp outletP Outlet Compressor Pressure
,Comp inletP Inlet Compressor Pressure
The specific heat ratio at the Compressor
,isent C Isentropic efficiency of compressor
, ,Comp outlet isenth Isentropic enthalpy heat at the outlet
,Comp outleth Enthalpy heat at the outlet
,Comp inleth Enthalpy heat at the inlet
,P in outC Specific heat capacity of the compressed air at the inlet and out let
,Comp outletT Outlet temperature from the Compressor
,Comp inletT Inlet temperature to the Compressor
TP Total power produced by the turbine
,GT elP Electrical power generated by the turbine
m Mechanical efficiency of the turbine
G Efficiency of the generator

xii
,10Airm
Mass flow of ambient air at the combustion entry
,10Airh Enthalpy of ambient air at the combustion entry
,9fuelm
Mass flow of fuel at the combustion entry
,9fuelh Enthalpy of the fuel at the combustion entry
2Hm
Mass flow of hydrogen
2,unused Hm
Mass flow of unused hydrogen at the combustion entry
2,unused Hh Enthalpy of the unused hydrogen at the combustion entry
,11Exhaustm
Mass flow of flue air at exit of the combustor
,11Exhausth Enthalpy of exhaust air at the exit of combustor
Recup Effectiveness of the recuperator
maxq The maximum theoretical heat transfer rate occurs in a counter flow
t temperature in degree centigrade
K temperature in degree kelvin
,P comb gC Specific heat ratio of combusted gas
cgm Mass of combusted gas
,P airC Specific heat ratio of air
2, 4H CH
Wm mass flow of water vapor from the combustion of hydrogen and methane
in the combustor
2, 4
2
H CH
COm Mass flow of carbon dioxide from the combustion of hydrogen and
Methane in the combustor
2
12
,H unusedm Mass flow of unused hydrogen at station 12
4
ref
CHLHV Lower Heating Value of methane at the reference temperature
2
ref
HLHV Lower Heating Value of hydrogen at the reference temperature

xiii
refh Enthalpy at the reference temperature
12h Enthalpy at the temperature of station 12
13h Enthalpy at the temperature of station 13
14h Enthalpy of air at station 14
15h Enthalpy at the temperature of station 15
1
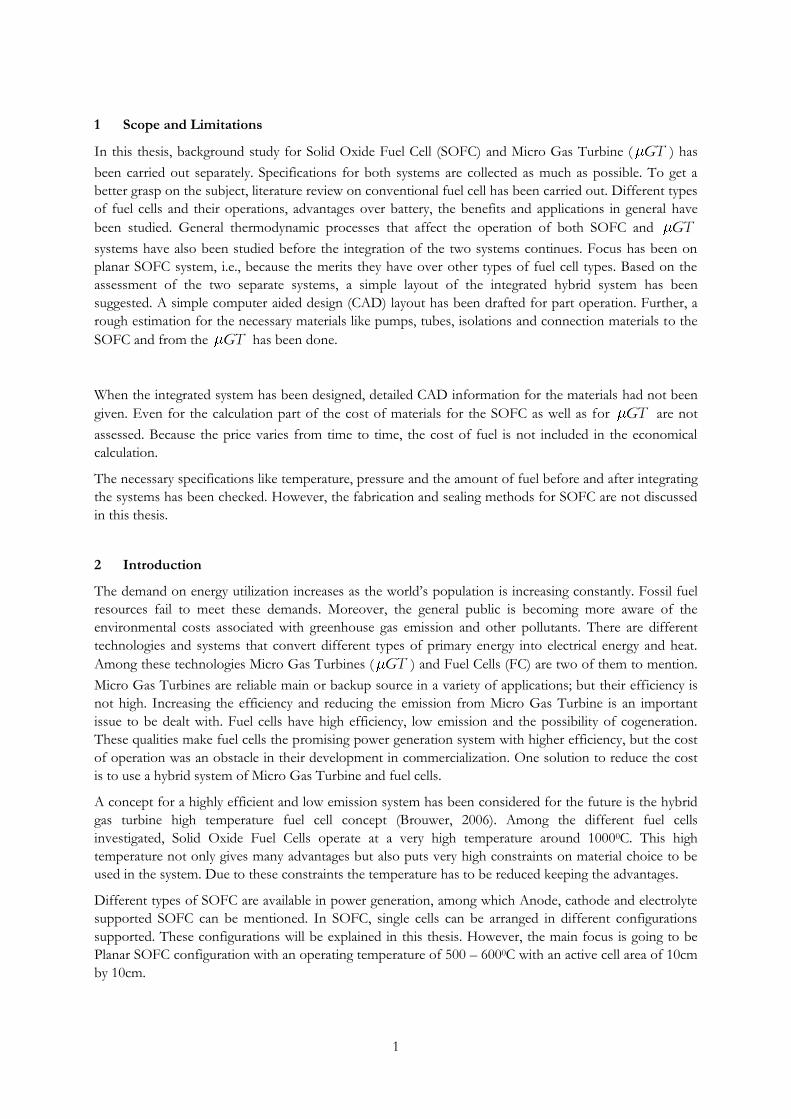
1 Scope and Limitations
In this thesis, background study for Solid Oxide Fuel Cell (SOFC) and Micro Gas Turbine ( GT ) has
been carried out separately. Specifications for both systems are collected as much as possible. To get a
better grasp on the subject, literature review on conventional fuel cell has been carried out. Different types
of fuel cells and their operations, advantages over battery, the benefits and applications in general have
been studied. General thermodynamic processes that affect the operation of both SOFC and GT
systems have also been studied before the integration of the two systems continues. Focus has been on
planar SOFC system, i.e., because the merits they have over other types of fuel cell types. Based on the
assessment of the two separate systems, a simple layout of the integrated hybrid system has been
suggested. A simple computer aided design (CAD) layout has been drafted for part operation. Further, a
rough estimation for the necessary materials like pumps, tubes, isolations and connection materials to the
SOFC and from the GT has been done.
When the integrated system has been designed, detailed CAD information for the materials had not been
given. Even for the calculation part of the cost of materials for the SOFC as well as for GT are not
assessed. Because the price varies from time to time, the cost of fuel is not included in the economical
calculation.
The necessary specifications like temperature, pressure and the amount of fuel before and after integrating
the systems has been checked. However, the fabrication and sealing methods for SOFC are not discussed
in this thesis.
2 Introduction
The demand on energy utilization increases as the world’s population is increasing constantly. Fossil fuel
resources fail to meet these demands. Moreover, the general public is becoming more aware of the
environmental costs associated with greenhouse gas emission and other pollutants. There are different
technologies and systems that convert different types of primary energy into electrical energy and heat.
Among these technologies Micro Gas Turbines ( GT ) and Fuel Cells (FC) are two of them to mention.
Micro Gas Turbines are reliable main or backup source in a variety of applications; but their efficiency is
not high. Increasing the efficiency and reducing the emission from Micro Gas Turbine is an important
issue to be dealt with. Fuel cells have high efficiency, low emission and the possibility of cogeneration.
These qualities make fuel cells the promising power generation system with higher efficiency, but the cost
of operation was an obstacle in their development in commercialization. One solution to reduce the cost
is to use a hybrid system of Micro Gas Turbine and fuel cells.
A concept for a highly efficient and low emission system has been considered for the future is the hybrid
gas turbine high temperature fuel cell concept (Brouwer, 2006). Among the different fuel cells
investigated, Solid Oxide Fuel Cells operate at a very high temperature around 10000C. This high
temperature not only gives many advantages but also puts very high constraints on material choice to be
used in the system. Due to these constraints the temperature has to be reduced keeping the advantages.
Different types of SOFC are available in power generation, among which Anode, cathode and electrolyte
supported SOFC can be mentioned. In SOFC, single cells can be arranged in different configurations
supported. These configurations will be explained in this thesis. However, the main focus is going to be
Planar SOFC configuration with an operating temperature of 500 – 6000C with an active cell area of 10cm
by 10cm.
2
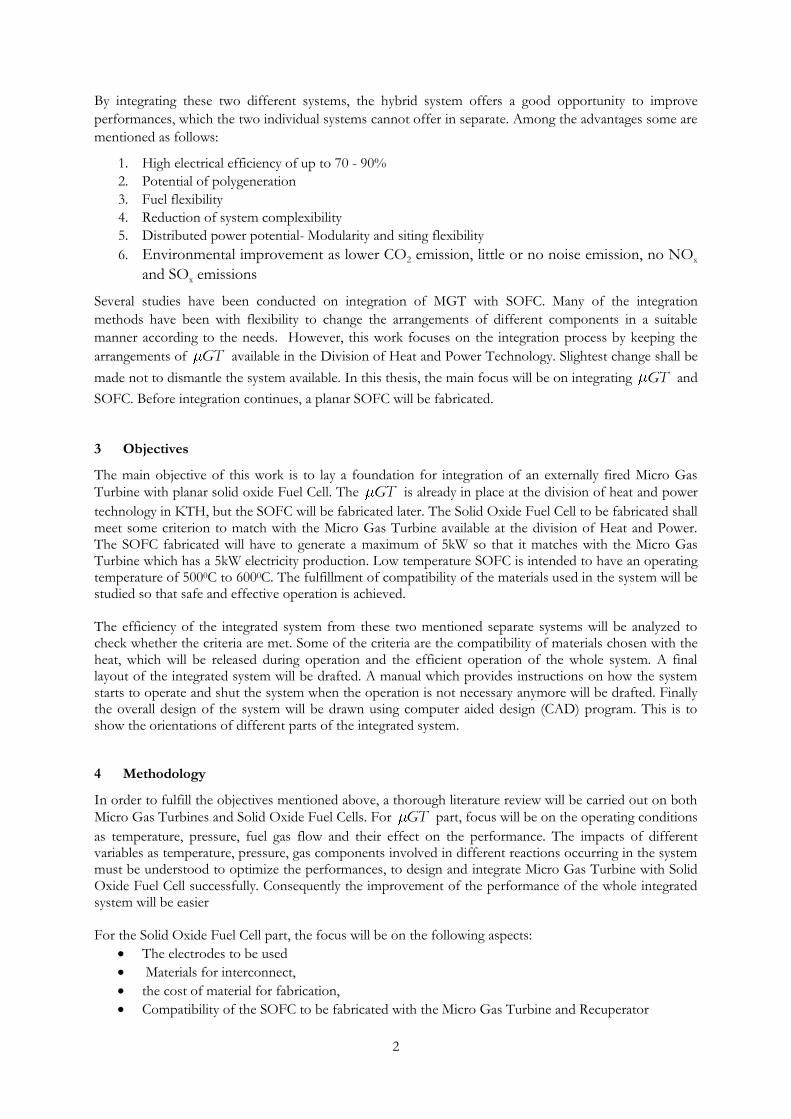
By integrating these two different systems, the hybrid system offers a good opportunity to improve
performances, which the two individual systems cannot offer in separate. Among the advantages some are
mentioned as follows:
1. High electrical efficiency of up to 70 - 90%
2. Potential of polygeneration
3. Fuel flexibility
4. Reduction of system complexibility
5. Distributed power potential- Modularity and siting flexibility
6. Environmental improvement as lower CO2 emission, little or no noise emission, no NOx
and SOx emissions
Several studies have been conducted on integration of MGT with SOFC. Many of the integration
methods have been with flexibility to change the arrangements of different components in a suitable
manner according to the needs. However, this work focuses on the integration process by keeping the
arrangements of GT available in the Division of Heat and Power Technology. Slightest change shall be
made not to dismantle the system available. In this thesis, the main focus will be on integrating GT and
SOFC. Before integration continues, a planar SOFC will be fabricated.
3 Objectives
The main objective of this work is to lay a foundation for integration of an externally fired Micro Gas
Turbine with planar solid oxide Fuel Cell. The GT is already in place at the division of heat and power
technology in KTH, but the SOFC will be fabricated later. The Solid Oxide Fuel Cell to be fabricated shall meet some criterion to match with the Micro Gas Turbine available at the division of Heat and Power. The SOFC fabricated will have to generate a maximum of 5kW so that it matches with the Micro Gas Turbine which has a 5kW electricity production. Low temperature SOFC is intended to have an operating temperature of 5000C to 6000C. The fulfillment of compatibility of the materials used in the system will be studied so that safe and effective operation is achieved. The efficiency of the integrated system from these two mentioned separate systems will be analyzed to check whether the criteria are met. Some of the criteria are the compatibility of materials chosen with the heat, which will be released during operation and the efficient operation of the whole system. A final layout of the integrated system will be drafted. A manual which provides instructions on how the system starts to operate and shut the system when the operation is not necessary anymore will be drafted. Finally the overall design of the system will be drawn using computer aided design (CAD) program. This is to show the orientations of different parts of the integrated system.
4 Methodology
In order to fulfill the objectives mentioned above, a thorough literature review will be carried out on both
Micro Gas Turbines and Solid Oxide Fuel Cells. For GT part, focus will be on the operating conditions
as temperature, pressure, fuel gas flow and their effect on the performance. The impacts of different variables as temperature, pressure, gas components involved in different reactions occurring in the system must be understood to optimize the performances, to design and integrate Micro Gas Turbine with Solid Oxide Fuel Cell successfully. Consequently the improvement of the performance of the whole integrated system will be easier For the Solid Oxide Fuel Cell part, the focus will be on the following aspects:
The electrodes to be used
Materials for interconnect,
the cost of material for fabrication,
Compatibility of the SOFC to be fabricated with the Micro Gas Turbine and Recuperator

3
Dimensions will be assigned for the materials that are necessary to be fabricated.
Having studied the necessary arrangements to set components for the whole combined system, overall layout of the combined lab rig will be recommended. Based on the first and second laws of thermodynamics and from the economical point of view, it is important to make assumptions necessary both for the integration part of the system and for the cost analysis. Those assumptions are described below in two categories.
1. For the system and its integration:
Distribution of feed gas among various channels of the system including cell stack should be uniform and steady
Heat transfer through radiation between gases and solid is neglected
All the exterior walls of the integrated system are assumed to be in adiabatic conditions.
The current collectors are considered to be equipotential plates
Dimensions and characteristics of materials are as of the appendix
Fluids are considered as compressible and one dimensional
Only convectional heat flow is considered in the direction of gas flow
Cell voltages are to be considered uniform
All the shift reactions are always in an equilibrium state of condition
The cell temperature is considered to be uniform.
2. For the cost Analysis:
Operation and maintenance cost
The change in exchange rate of dollar, euro and British pounds to Swedish crowns and the vice versa has been assumed to be constant.
Only labor cost for fabrication and assembling the rig is taken into consideration.
Materials, which cannot be bought here in Sweden, to be imported. In such cases where import is necessary, only 20% of custom taxes are to be added. For instance powder like Samarium Ceria Oxide to be bought from sigma Aldrich.
5 Literature Review
5.1 History of Fuel Cells
The discovery of fuel cells dates back to 1839 and is attributed to Sir William Grove often referred to as
“the father of Cell” (Hoogers, 2003). He discovered the possibility of generating electricity by reversing
electrolysis of water. However it was the researchers, Charles Langer and Ludwig Mond, who conceived the term ”Fuel Cell” in their research to find the first practical prototype fuel cell by using air and coal gas
(Hoogers, 2003). It was Friedrich Wilhelm Ostwald, the founder of the field of physical chemistry, who experimentally determined the relationship between the different components of the cell, including the electrodes,
electrolyte, oxidizing and reducing agent, anions and cations (Rayment, et al., 2003). The first successful fuel cell device was developed by Francis Bacon in 1932 with hydrogen-oxygen fuel cell using alkaline electrolytes and nickel electrodes which was less expensive than Ludwig Mond and
Langer´s catalyst (Hoogers, 2003).Until 1959 it was technically difficult to demonstrate the first 5kW fuel cell, but Harry Karl King Ihrig could present the first famous 15kW fuel cell powered vehicle which had enough power to pull a weight of about 1.12 tons. The constructed fuel cell had 1108 cell stacks of 1
volt each with potassium hydroxide electrolyte (Andújar, et al., 2009). In 1960 General Electric could begin building a compact electricity generator for space mission using a principle found in the “Bacon
Cell”. Today electricity and drinking water are generated in space shuttles from fuel cells (Today, 2012).
4
While researchers continue to develop fuel cells in the West, researchers in the Soviet Union could develop fuel cells for specific classified military applications in secret which laid a foundation for the application in submarines and eventually for space programs manned by the Soviet Union (Bogotsky, 2008). Since the 1970s when an awareness of environmental changes among governments began to emerge and specific concerns over air pollution were prompted, clean air and energy efficiency have become principal driving factors for development of fuel cell. Even the first oil crisis in 1973, was a contributing factor for the development of fuel cells, as it encouraged research in finding an alternative energy source to meet the world´s increasing demand for energy. Energy security in recent years has become an additional driving factor for the development of fuel cells. In the 1980s researchers continued to develop different types of fuel cell with improved quality and more diverse. In the United States Navy commissioned studies in the use of fuel cells in submarines where highly efficient zero emission, near silent running offered considerable operational advantages. Technologies on Small-scale stationary applications of Proton Exchange Membrane Fuel Cells (PEMFC) and SOFC could attract attention in Germany, Japan and the United Kingdom due to the significant funding by the respective governments to develop these technologies for residential micro-combined heat and power (CHP) application (Bagotsky, 2008).
5.2 What are Fuel Cells?
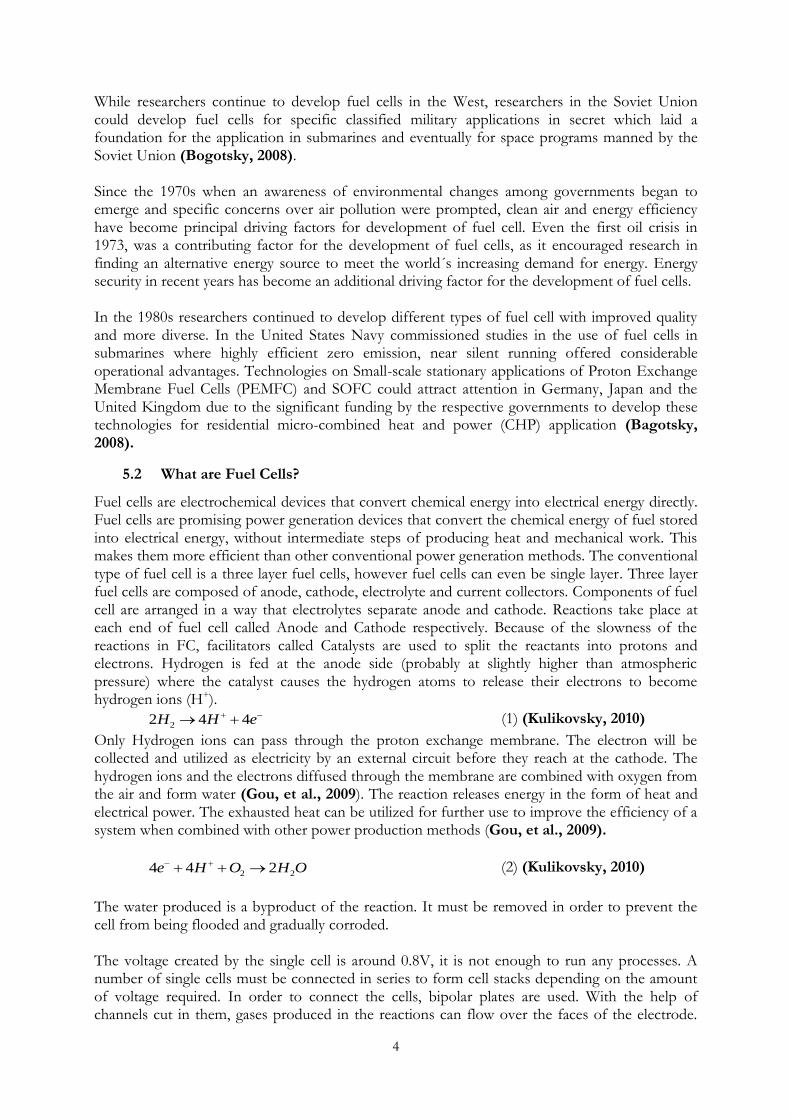
Fuel cells are electrochemical devices that convert chemical energy into electrical energy directly. Fuel cells are promising power generation devices that convert the chemical energy of fuel stored into electrical energy, without intermediate steps of producing heat and mechanical work. This makes them more efficient than other conventional power generation methods. The conventional type of fuel cell is a three layer fuel cells, however fuel cells can even be single layer. Three layer fuel cells are composed of anode, cathode, electrolyte and current collectors. Components of fuel cell are arranged in a way that electrolytes separate anode and cathode. Reactions take place at each end of fuel cell called Anode and Cathode respectively. Because of the slowness of the reactions in FC, facilitators called Catalysts are used to split the reactants into protons and electrons. Hydrogen is fed at the anode side (probably at slightly higher than atmospheric pressure) where the catalyst causes the hydrogen atoms to release their electrons to become hydrogen ions (H+).
22 4 4H H e (1) (Kulikovsky, 2010)
Only Hydrogen ions can pass through the proton exchange membrane. The electron will be collected and utilized as electricity by an external circuit before they reach at the cathode. The hydrogen ions and the electrons diffused through the membrane are combined with oxygen from the air and form water (Gou, et al., 2009). The reaction releases energy in the form of heat and electrical power. The exhausted heat can be utilized for further use to improve the efficiency of a system when combined with other power production methods (Gou, et al., 2009).
2 24 4 2e H O H O (2) (Kulikovsky, 2010)
The water produced is a byproduct of the reaction. It must be removed in order to prevent the cell from being flooded and gradually corroded. The voltage created by the single cell is around 0.8V, it is not enough to run any processes. A number of single cells must be connected in series to form cell stacks depending on the amount of voltage required. In order to connect the cells, bipolar plates are used. With the help of channels cut in them, gases produced in the reactions can flow over the faces of the electrode.
5
These plates must be made to make a good electrical contact with the surface of each electrode at the respective ends. Electrodes of a simple fuel cell are distant from each other, because of which the resistance through the electrolytes is high. A simple schematic of the above explained work of fuel cells can be demonstrated in figure 1.
Figure 1. Schematic of a hydrogen fuel cell in operation (Kulikovsky, 2010)
Both fuel cell and batteries are galvanic cells. There are many resemblances between fuel cells and batteries. Each of them is composed of anode and cathode that are in contact with either side of an electrolyte. Both generate electrical energy by converting chemical energy from a higher state of energy to the lower state through electrical reaction. Each single fuel cell and each single battery cell generate small DC voltage and need to be connected in series or parallel to achieve substantial voltage and power capacities required for the application. Additional resemblance between fuel cells and batteries is that they both need reductants and oxidants to produce a power. FC must be continuously replenished with fuel to have a continuous operation. Some fuel cells operate in reverse as electrolyzers, yielding a reversible cell that can be used for energy storage (EG&G, 2004). Even if fuel cells and batteries have many similarities, they differ from each other in many ways too. Fuel cells differ from batteries in that as long as the reactants are supplied, fuel cells produce direct current (DC) electricity continuously as the main product while water and heat as byproducts. This means all chemical energy stored in batteries is converted when needed while in fuel cells there is a constant conversion into electricity and exhaust heat as long as fuel is supplied. However, batteries need to be charged until their lifetime is finished to produce electricity. Fuel cells differ also from other generation system because they do not have thermodynamic limitations of heat engines such as the Carnot efficiency. There is no combustion in fuel cells which makes them advantageous over conventional systems in that pollution is very little or very limited. The chemical reactants in fuel cell are supplied from external source due to which there is no need of recharging fuel cells, like batteries demand charging inorder to operate. When the reactants stored in the battery are consumed, the whole battery must be replaced by another new battery.
5.3 Components of Fuel Cells
The main components of fuel cells are anode, cathode, electrolyte and interconnects. Interconnects are also called Current Collectors. Regardless of the type of fuel cell, two separate reactions occur in different sides of the fuel cell called Anode and Cathode. Each of the reactions is called half-cell reactions. They are even called an oxidation half reaction and a reduction half
6
reaction respectively. These two reactions are normally slow when carried out at low temperature, which in return demands higher activation energy for the reactions to take place. This can be accomplished with a catalyst, which never participates in the reactions, but lowers the activation energy. In other words Catalysts facilitate reactions to proceed more quickly than before.
5.3.1 Anode
Anode is a negative electrode where the fuel is oxidized and splits into positively and negatively
charged ions. The anode must meet certain requirements, so that efficient reactions can take
place. These requirements are high electric and ionic conductivity, resistance to thermal cycling,
chemical stability in contact with the two electrodes, optimized porous structure for the mass
transport of the gas species, thermal expansion compatibility with other fuel cell components and
high catalytic activity. Moreover the choice of low cost material and manufacturing process are
required for realizing a low cost fuel cell. Anode must be stable in the reducing environment.
5.3.2 Cathode
Cathode is the positive electrode in a fuel cell where the reduction occurs. Cathode is a porous
layer that facilitates the transport of oxygen to the reaction zone, conduct electrons and heat
from the reaction zone. The doped Lanthanum strontium manganite (La 1-x Sr x MnO 3- ) is the
commonly used cathode material (Carlson, 2004). The variable x is a doping level that varies
between 0 and 1. Electrons are released during oxidation process at the cathode. Cathodes must
meet the same requirements as it is explained for the anode requirement except that they must be
stable in an oxidizing environment. This is because reduction takes place only at the cathode
where the reactant meets the supplied.
5.3.3 Electrolytes
Electrolytes are substances that separate different reactants, preventing electric conduction but
allow ions to pass through them, causing a voltage difference between the anode and cathode
when an electric current passes through an external load. Electrolytes can be liquid or solid with
variable working temperature. The use of solid electrolyte in ceramic fuel cells eliminates the
material corrosion and electrolyte management problem (Minh, 1993) . The general
requirements for an electrolyte are high ionic conductivity, low electric conductivity, stability in
both oxidizing and reducing environments, good mechanical properties and long-term stability
with respect to dopant segregation. (Jacobson, 2009) Additional requirements for electrolyte to
meet are low cost, resistance to thermal cycling and chemical stability when they come in contact
with the other two electrodes.
5.3.4 Interconnects
The interconnection requires two interconnects which are often combined into a single material
that makes contact with the anode on one side and the cathode on the other side. The choice of
interconnection materials must meet some requirements. It must have high electronic
conductivity, mechanical and chemical stability on either side of the electrodes, thermal
expansion compatibility with other components of the cell. Either inexpensive perovskite
structured oxide (ABO3) layers or lanthanum chromite material can be used as an interconnection
(Mugerwa, et al., 1993).
5.4 Classification of Fuel Cells
Fuel cells are classified in a variety of different ways, depending on the criteria used. Among these
7
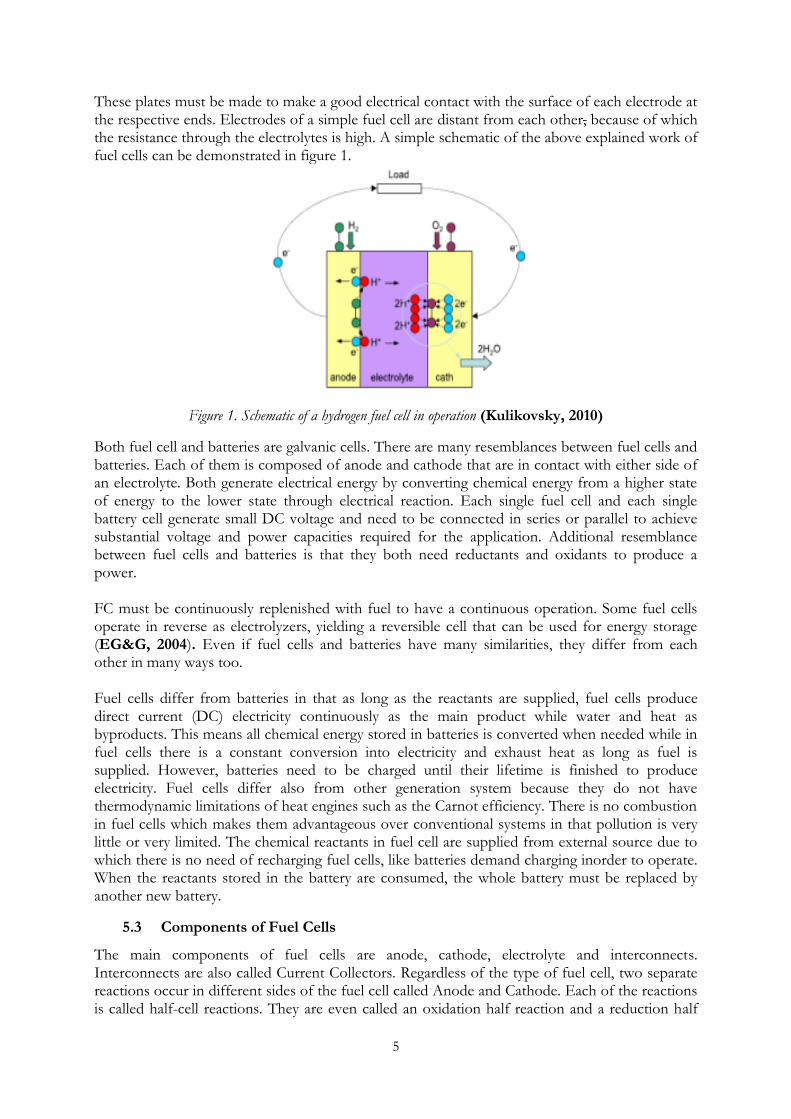
criteria, the area of application, operating temperature and pressure, direct or indirect use of primary fuels and oxidants, the nature of electrolyte fuel cells use, type of ion transferred through the electrolyte, type of reactants are very important ones to be mentioned. Based on the application, fuel cells are categorized a portable, stationary power and transportation fuel cells. Different application areas will be explained later. Depending on the operating temperature, fuel cells can be classified into five main groups. Fuel cells operating at a temperature below 2000C are classified as low temperature fuel cells where as those operating above 6000C are high temperature fuel cells. Fuel cells can also be categorized depending on electrolytes they use, which can either be liquid or solid. As mentioned below the first three are low temperature fuel cells with liquid electrolytes. The last two are high temperature fuel cells which use solid electrolytes. These five main categories of fuel cells with an overview can be listed below followed by figure 2 as follows:
I. Proton Exchange Membrane Fuel Cell PEMFC) II. Alkaline Fuel Cell (AFC)
III. Phosphoric Acid Fuel Cell (PAFC) IV. Molten Carbonate Fuel Cell (MCFC) V. Solid Oxide Fuel Cell (SOFC)
Since modern technology made it possible to lower the operating temperature of SOFC to around 3000C -6000C, classification of fuel cells by the operating temperature has become more blurred. However, the present SOFC research focuses to lower the operating temperature to improve start-up time, cost and durability, while for PEMFC; the research is to increase the operating temperature up to more than 1200C to improve waste heat management and water rejection (Mench, 2008). Low temperature fuel cells utilize hydrogen as a fuel, while high temperature fuel cells like SOFC are fuel flexible. It is even possible for high temperature fuel cells to use hydrogen rich fuels like methane. Hydrogen can be extracted through a reformation process either internally or externally.
Figure 2. Overview of the chemical reaction in Fuel cell types (Bewag, 2001)
8
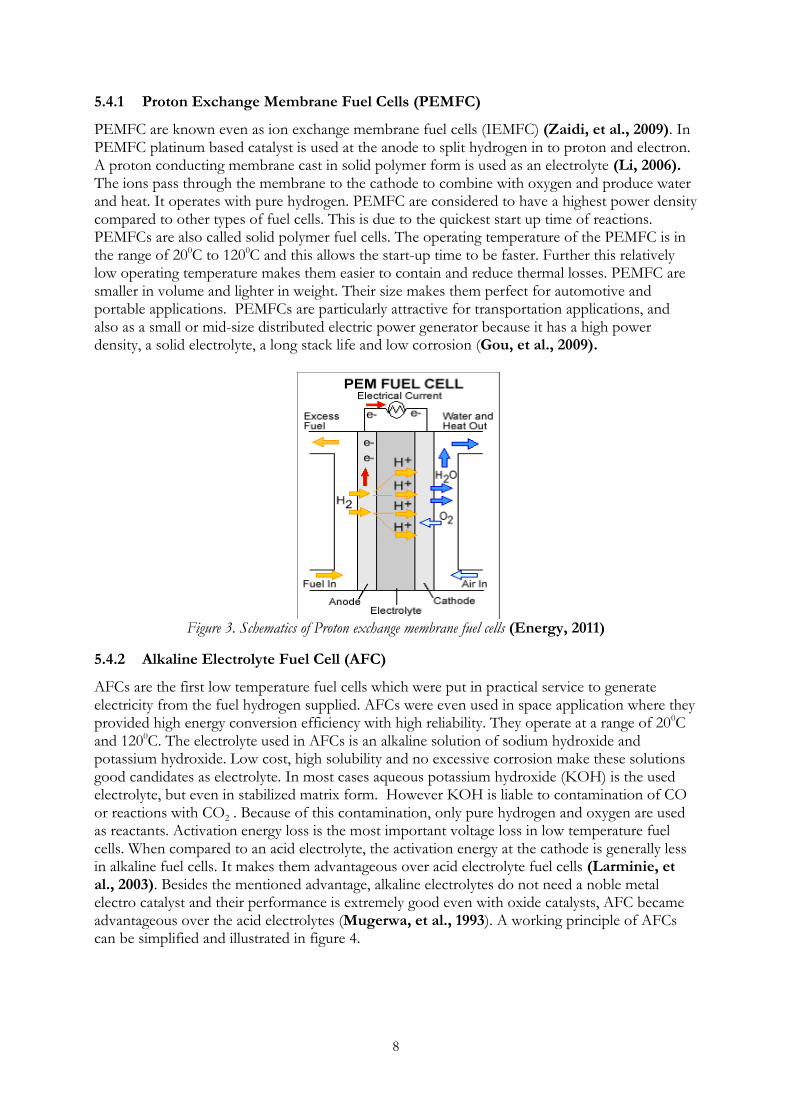
5.4.1 Proton Exchange Membrane Fuel Cells (PEMFC)
PEMFC are known even as ion exchange membrane fuel cells (IEMFC) (Zaidi, et al., 2009). In PEMFC platinum based catalyst is used at the anode to split hydrogen in to proton and electron. A proton conducting membrane cast in solid polymer form is used as an electrolyte (Li, 2006). The ions pass through the membrane to the cathode to combine with oxygen and produce water and heat. It operates with pure hydrogen. PEMFC are considered to have a highest power density compared to other types of fuel cells. This is due to the quickest start up time of reactions. PEMFCs are also called solid polymer fuel cells. The operating temperature of the PEMFC is in the range of 200C to 1200C and this allows the start-up time to be faster. Further this relatively low operating temperature makes them easier to contain and reduce thermal losses. PEMFC are smaller in volume and lighter in weight. Their size makes them perfect for automotive and portable applications. PEMFCs are particularly attractive for transportation applications, and also as a small or mid-size distributed electric power generator because it has a high power density, a solid electrolyte, a long stack life and low corrosion (Gou, et al., 2009).
Figure 3. Schematics of Proton exchange membrane fuel cells (Energy, 2011)
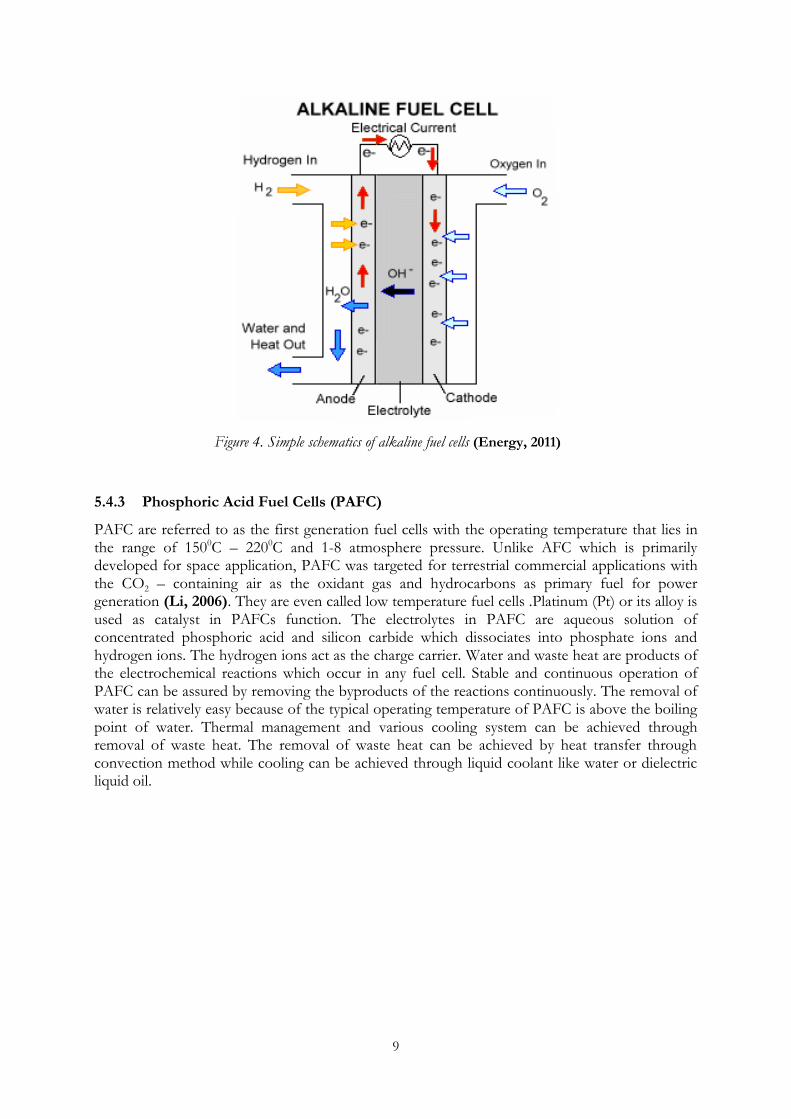
5.4.2 Alkaline Electrolyte Fuel Cell (AFC)
AFCs are the first low temperature fuel cells which were put in practical service to generate electricity from the fuel hydrogen supplied. AFCs were even used in space application where they provided high energy conversion efficiency with high reliability. They operate at a range of 200C and 1200C. The electrolyte used in AFCs is an alkaline solution of sodium hydroxide and potassium hydroxide. Low cost, high solubility and no excessive corrosion make these solutions good candidates as electrolyte. In most cases aqueous potassium hydroxide (KOH) is the used electrolyte, but even in stabilized matrix form. However KOH is liable to contamination of CO or reactions with CO2 . Because of this contamination, only pure hydrogen and oxygen are used as reactants. Activation energy loss is the most important voltage loss in low temperature fuel cells. When compared to an acid electrolyte, the activation energy at the cathode is generally less in alkaline fuel cells. It makes them advantageous over acid electrolyte fuel cells (Larminie, et al., 2003). Besides the mentioned advantage, alkaline electrolytes do not need a noble metal electro catalyst and their performance is extremely good even with oxide catalysts, AFC became advantageous over the acid electrolytes (Mugerwa, et al., 1993). A working principle of AFCs can be simplified and illustrated in figure 4.
9
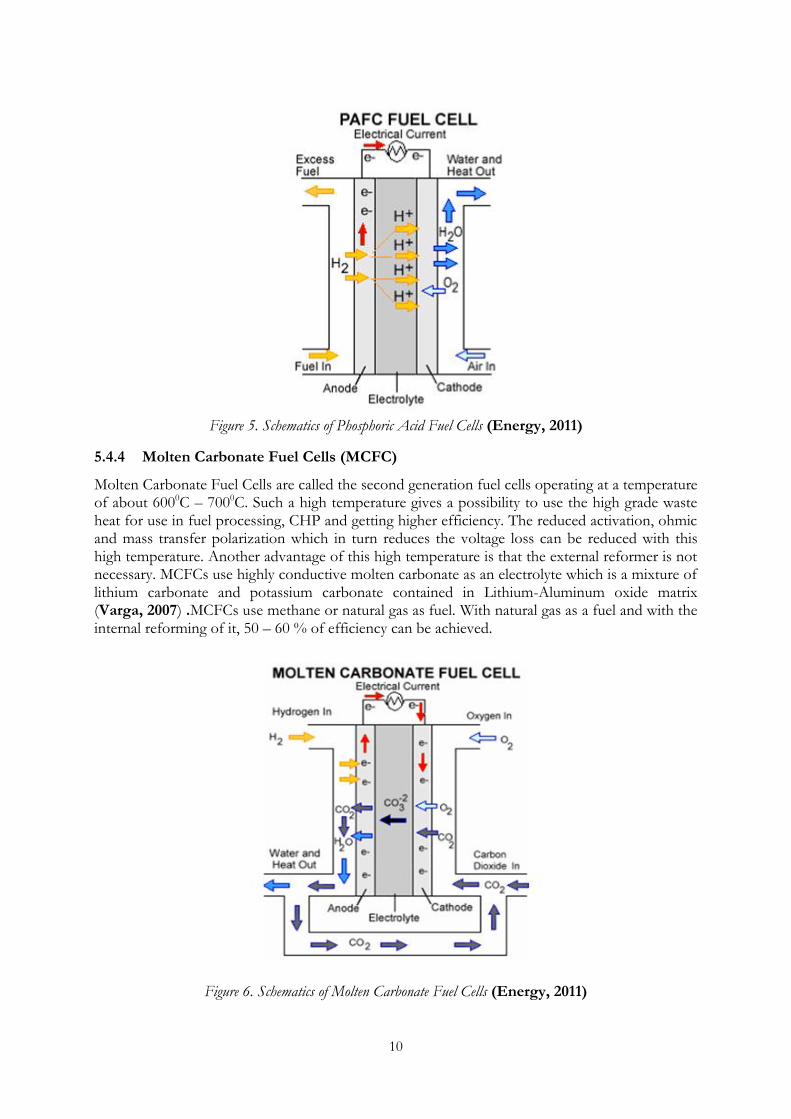
5.4.3 Phosphoric Acid Fuel Cells (PAFC)
PAFC are referred to as the first generation fuel cells with the operating temperature that lies in the range of 1500C – 2200C and 1-8 atmosphere pressure. Unlike AFC which is primarily developed for space application, PAFC was targeted for terrestrial commercial applications with the CO2 – containing air as the oxidant gas and hydrocarbons as primary fuel for power generation (Li, 2006). They are even called low temperature fuel cells .Platinum (Pt) or its alloy is used as catalyst in PAFCs function. The electrolytes in PAFC are aqueous solution of concentrated phosphoric acid and silicon carbide which dissociates into phosphate ions and hydrogen ions. The hydrogen ions act as the charge carrier. Water and waste heat are products of the electrochemical reactions which occur in any fuel cell. Stable and continuous operation of PAFC can be assured by removing the byproducts of the reactions continuously. The removal of water is relatively easy because of the typical operating temperature of PAFC is above the boiling point of water. Thermal management and various cooling system can be achieved through removal of waste heat. The removal of waste heat can be achieved by heat transfer through convection method while cooling can be achieved through liquid coolant like water or dielectric liquid oil.
Figure 4. Simple schematics of alkaline fuel cells (Energy, 2011)
10
Figure 5. Schematics of Phosphoric Acid Fuel Cells (Energy, 2011)
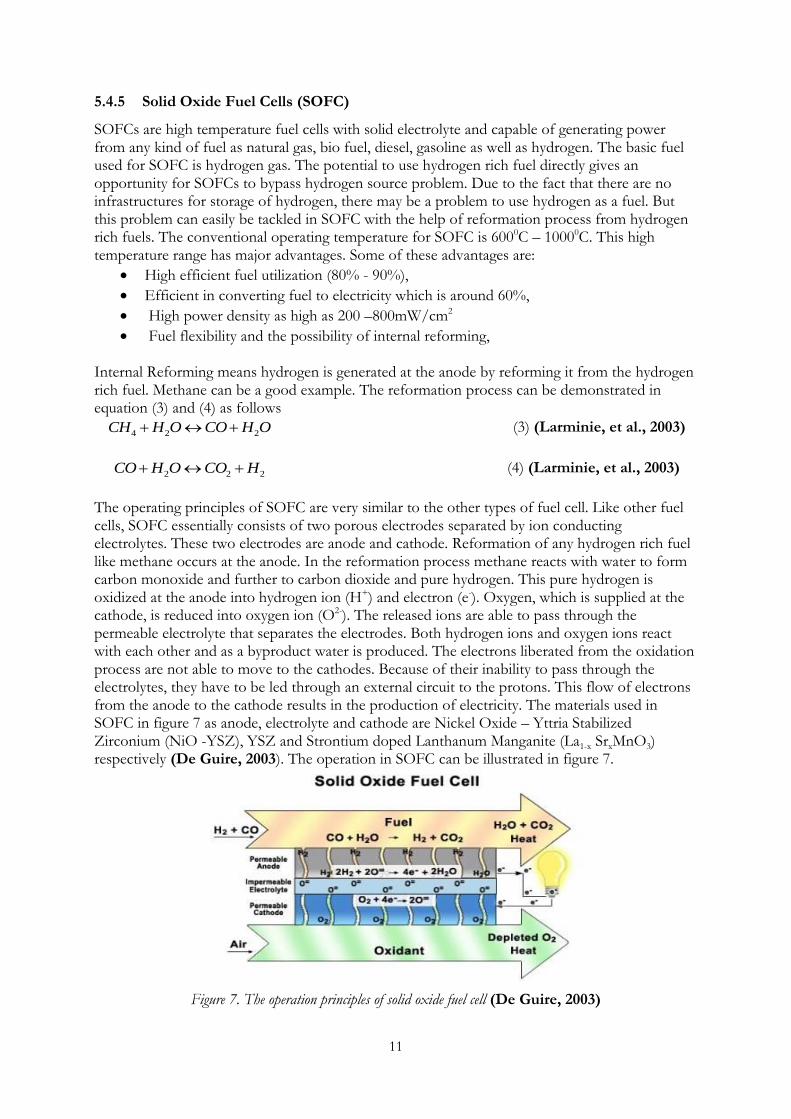
5.4.4 Molten Carbonate Fuel Cells (MCFC)
Molten Carbonate Fuel Cells are called the second generation fuel cells operating at a temperature of about 6000C – 7000C. Such a high temperature gives a possibility to use the high grade waste heat for use in fuel processing, CHP and getting higher efficiency. The reduced activation, ohmic and mass transfer polarization which in turn reduces the voltage loss can be reduced with this high temperature. Another advantage of this high temperature is that the external reformer is not necessary. MCFCs use highly conductive molten carbonate as an electrolyte which is a mixture of lithium carbonate and potassium carbonate contained in Lithium-Aluminum oxide matrix (Varga, 2007) .MCFCs use methane or natural gas as fuel. With natural gas as a fuel and with the internal reforming of it, 50 – 60 % of efficiency can be achieved.
Figure 6. Schematics of Molten Carbonate Fuel Cells (Energy, 2011)
11
5.4.5 Solid Oxide Fuel Cells (SOFC)
SOFCs are high temperature fuel cells with solid electrolyte and capable of generating power from any kind of fuel as natural gas, bio fuel, diesel, gasoline as well as hydrogen. The basic fuel used for SOFC is hydrogen gas. The potential to use hydrogen rich fuel directly gives an opportunity for SOFCs to bypass hydrogen source problem. Due to the fact that there are no infrastructures for storage of hydrogen, there may be a problem to use hydrogen as a fuel. But this problem can easily be tackled in SOFC with the help of reformation process from hydrogen rich fuels. The conventional operating temperature for SOFC is 6000C – 10000C. This high temperature range has major advantages. Some of these advantages are:
High efficient fuel utilization (80% - 90%),
Efficient in converting fuel to electricity which is around 60%,
High power density as high as 200 –800mW/cm2
Fuel flexibility and the possibility of internal reforming,
Internal Reforming means hydrogen is generated at the anode by reforming it from the hydrogen rich fuel. Methane can be a good example. The reformation process can be demonstrated in equation (3) and (4) as follows
4 2 2CH H O CO H O (3) (Larminie, et al., 2003)
2 2 2CO H O CO H (4) (Larminie, et al., 2003)
The operating principles of SOFC are very similar to the other types of fuel cell. Like other fuel cells, SOFC essentially consists of two porous electrodes separated by ion conducting electrolytes. These two electrodes are anode and cathode. Reformation of any hydrogen rich fuel like methane occurs at the anode. In the reformation process methane reacts with water to form carbon monoxide and further to carbon dioxide and pure hydrogen. This pure hydrogen is oxidized at the anode into hydrogen ion (H+) and electron (e-). Oxygen, which is supplied at the cathode, is reduced into oxygen ion (O2-). The released ions are able to pass through the permeable electrolyte that separates the electrodes. Both hydrogen ions and oxygen ions react with each other and as a byproduct water is produced. The electrons liberated from the oxidation process are not able to move to the cathodes. Because of their inability to pass through the electrolytes, they have to be led through an external circuit to the protons. This flow of electrons from the anode to the cathode results in the production of electricity. The materials used in SOFC in figure 7 as anode, electrolyte and cathode are Nickel Oxide – Yttria Stabilized Zirconium (NiO -YSZ), YSZ and Strontium doped Lanthanum Manganite (La1-x SrxMnO3) respectively (De Guire, 2003). The operation in SOFC can be illustrated in figure 7.
Figure 7. The operation principles of solid oxide fuel cell (De Guire, 2003)
12
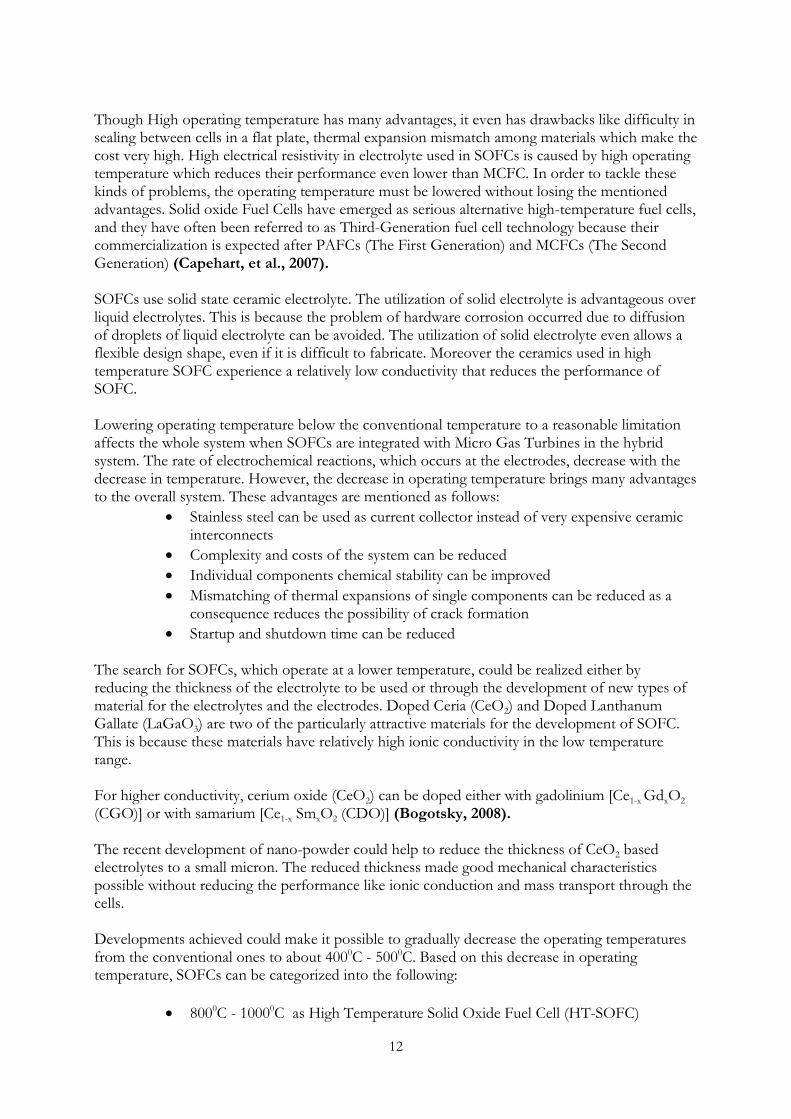
Though High operating temperature has many advantages, it even has drawbacks like difficulty in sealing between cells in a flat plate, thermal expansion mismatch among materials which make the cost very high. High electrical resistivity in electrolyte used in SOFCs is caused by high operating temperature which reduces their performance even lower than MCFC. In order to tackle these kinds of problems, the operating temperature must be lowered without losing the mentioned advantages. Solid oxide Fuel Cells have emerged as serious alternative high-temperature fuel cells, and they have often been referred to as Third-Generation fuel cell technology because their commercialization is expected after PAFCs (The First Generation) and MCFCs (The Second Generation) (Capehart, et al., 2007). SOFCs use solid state ceramic electrolyte. The utilization of solid electrolyte is advantageous over liquid electrolytes. This is because the problem of hardware corrosion occurred due to diffusion of droplets of liquid electrolyte can be avoided. The utilization of solid electrolyte even allows a flexible design shape, even if it is difficult to fabricate. Moreover the ceramics used in high temperature SOFC experience a relatively low conductivity that reduces the performance of SOFC. Lowering operating temperature below the conventional temperature to a reasonable limitation affects the whole system when SOFCs are integrated with Micro Gas Turbines in the hybrid system. The rate of electrochemical reactions, which occurs at the electrodes, decrease with the decrease in temperature. However, the decrease in operating temperature brings many advantages to the overall system. These advantages are mentioned as follows:
Stainless steel can be used as current collector instead of very expensive ceramic interconnects
Complexity and costs of the system can be reduced
Individual components chemical stability can be improved
Mismatching of thermal expansions of single components can be reduced as a consequence reduces the possibility of crack formation
Startup and shutdown time can be reduced
The search for SOFCs, which operate at a lower temperature, could be realized either by reducing the thickness of the electrolyte to be used or through the development of new types of material for the electrolytes and the electrodes. Doped Ceria (CeO2) and Doped Lanthanum Gallate (LaGaO3) are two of the particularly attractive materials for the development of SOFC. This is because these materials have relatively high ionic conductivity in the low temperature range. For higher conductivity, cerium oxide (CeO2) can be doped either with gadolinium [Ce1-x GdxO2
(CGO)] or with samarium [Ce1-x SmxO2 (CDO)] (Bogotsky, 2008). The recent development of nano-powder could help to reduce the thickness of CeO2 based electrolytes to a small micron. The reduced thickness made good mechanical characteristics possible without reducing the performance like ionic conduction and mass transport through the cells. Developments achieved could make it possible to gradually decrease the operating temperatures from the conventional ones to about 4000C - 5000C. Based on this decrease in operating temperature, SOFCs can be categorized into the following:
8000C - 10000C as High Temperature Solid Oxide Fuel Cell (HT-SOFC)
13
6500C - 8000C as Intermediate Temperature Solid Oxide Fuel Cell (IT-SOFC)
Below 6000C as Low Temperature Solid Oxide Fuel Cell (LT-SOFC)
5.5 The Applications, Advantages and Disadvantages of Fuel Cells
Power produced from fuel cells varies from a single watt to around 11MW. As described in the
earlier discussion, different types of fuel cell have unique conventional operating temperature.
Power produced from these different fuel cells also differs from one another based on their
application. The major application for fuel cells are stationary electric power plants, including
cogeneration units; as motive power for vehicles; and as on-board electric power for space
vehicles or other closed environments (EG&G, 2000).
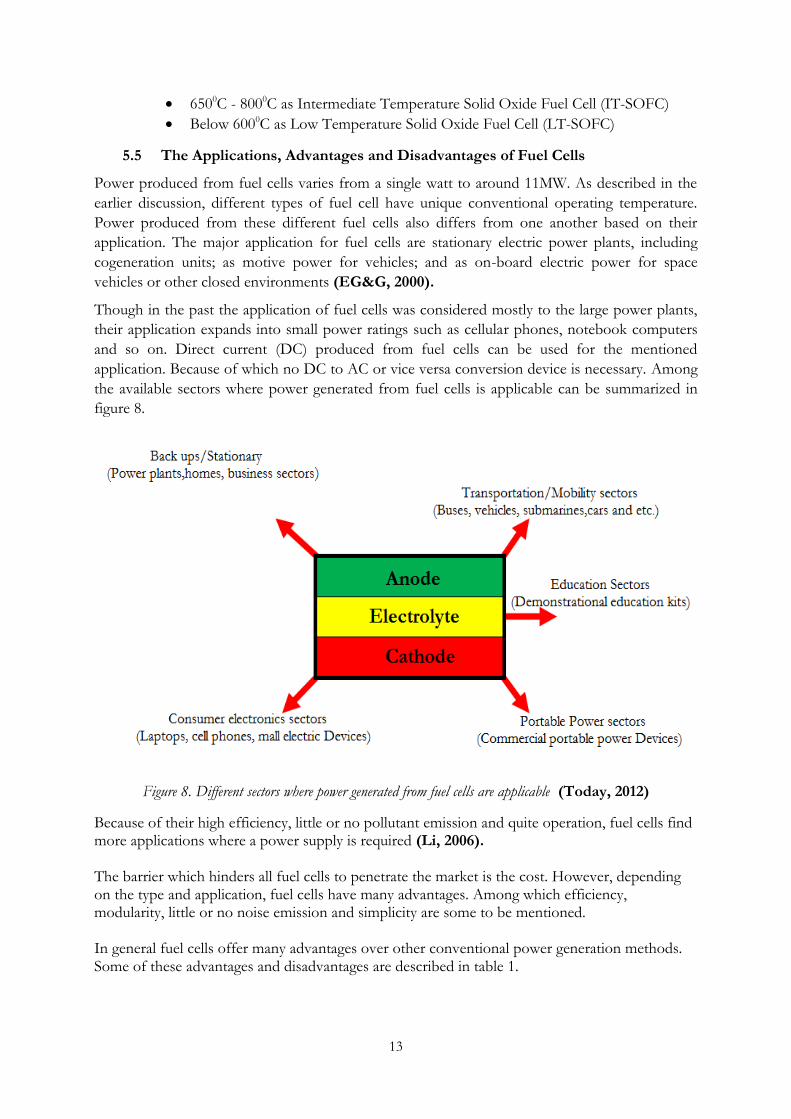
Though in the past the application of fuel cells was considered mostly to the large power plants,
their application expands into small power ratings such as cellular phones, notebook computers
and so on. Direct current (DC) produced from fuel cells can be used for the mentioned
application. Because of which no DC to AC or vice versa conversion device is necessary. Among
the available sectors where power generated from fuel cells is applicable can be summarized in
figure 8.
Figure 8. Different sectors where power generated from fuel cells are applicable (Today, 2012)
Because of their high efficiency, little or no pollutant emission and quite operation, fuel cells find more applications where a power supply is required (Li, 2006). The barrier which hinders all fuel cells to penetrate the market is the cost. However, depending on the type and application, fuel cells have many advantages. Among which efficiency, modularity, little or no noise emission and simplicity are some to be mentioned. In general fuel cells offer many advantages over other conventional power generation methods. Some of these advantages and disadvantages are described in table 1.
14
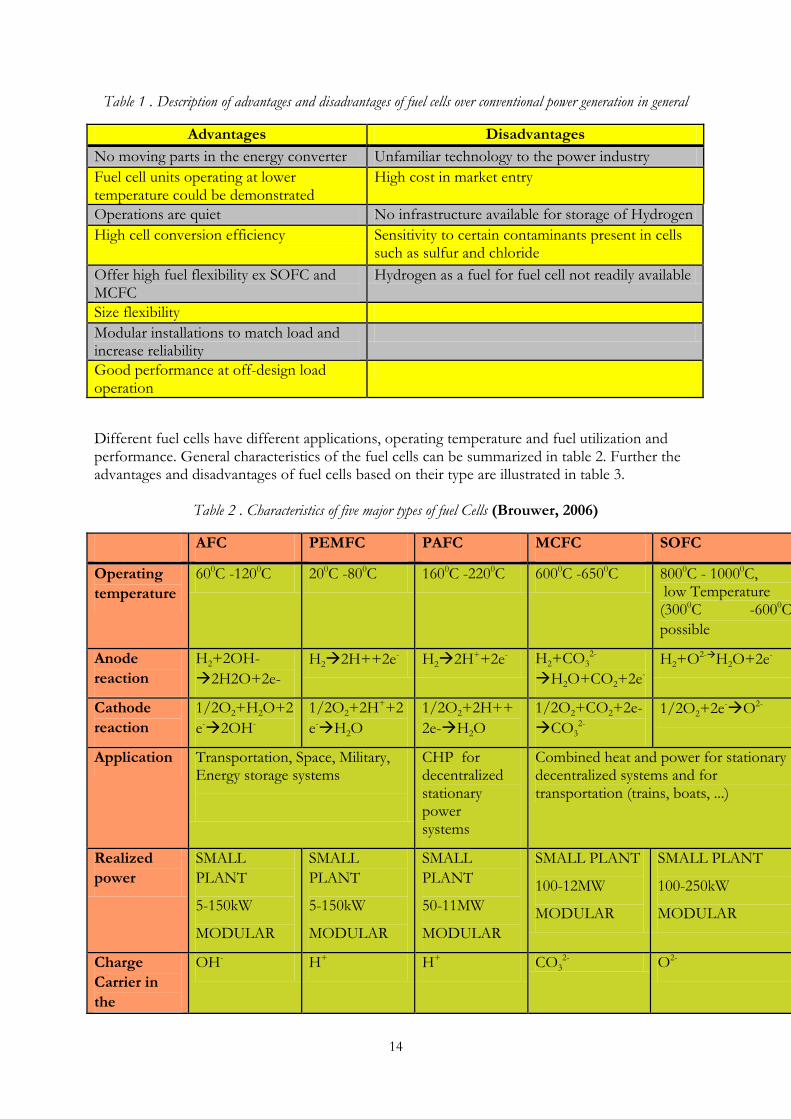
Table 1 . Description of advantages and disadvantages of fuel cells over conventional power generation in general
Advantages Disadvantages
No moving parts in the energy converter Unfamiliar technology to the power industry
Fuel cell units operating at lower temperature could be demonstrated
High cost in market entry
Operations are quiet No infrastructure available for storage of Hydrogen
High cell conversion efficiency Sensitivity to certain contaminants present in cells such as sulfur and chloride
Offer high fuel flexibility ex SOFC and MCFC
Hydrogen as a fuel for fuel cell not readily available
Size flexibility
Modular installations to match load and increase reliability
Good performance at off-design load operation
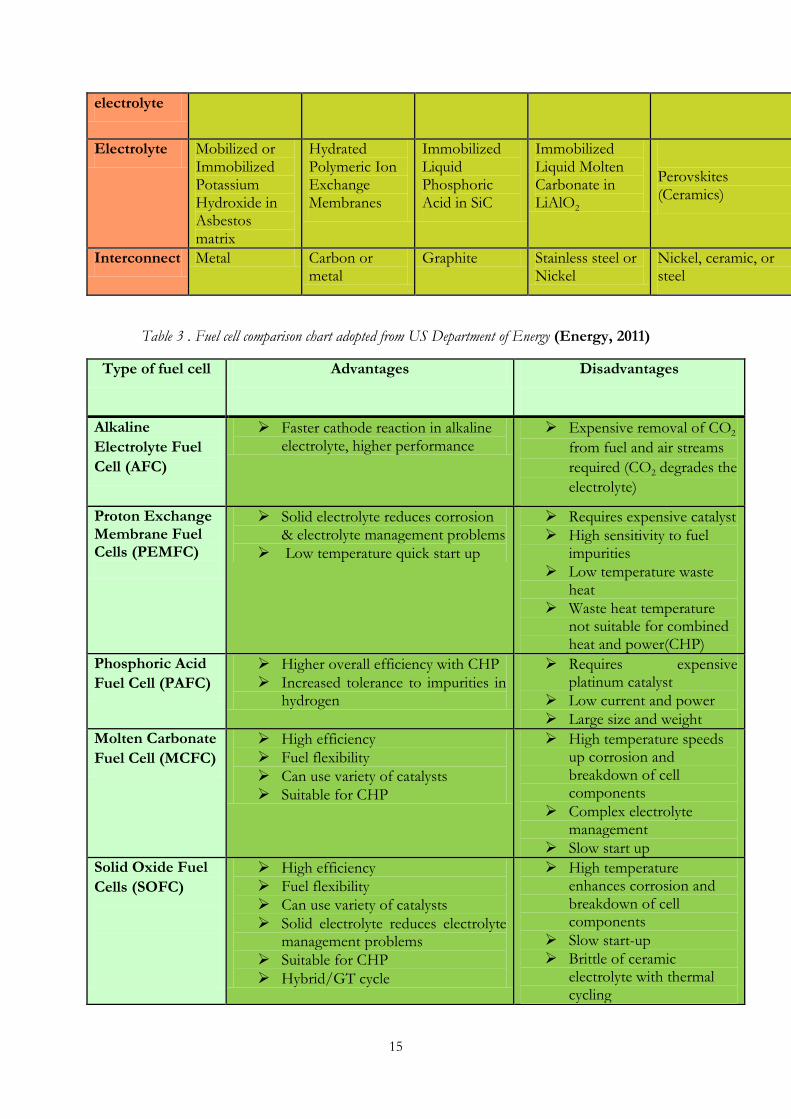
Different fuel cells have different applications, operating temperature and fuel utilization and performance. General characteristics of the fuel cells can be summarized in table 2. Further the advantages and disadvantages of fuel cells based on their type are illustrated in table 3.
Table 2 . Characteristics of five major types of fuel Cells (Brouwer, 2006)
AFC PEMFC PAFC MCFC SOFC
Operating
temperature
600C -1200C 200C -800C 1600C -2200C 6000C -6500C 8000C - 10000C, low Temperature (3000C -6000C)
possible
Anode
reaction
H2+2OH-
2H2O+2e-
H22H++2e- H22H++2e- H2+CO32-
H2O+CO2+2e-
H2+O2-H2O+2e-
Cathode
reaction
1/2O2+H2O+2
e-2OH-
1/2O2+2H++2
e-H2O
1/2O2+2H++
2e-H2O
1/2O2+CO2+2e-
CO32-
1/2O2+2e-O2-
Application Transportation, Space, Military, Energy storage systems
CHP for decentralized stationary power systems
Combined heat and power for stationary decentralized systems and for transportation (trains, boats, ...)
Realized
power
SMALL
PLANT
5-150kW
MODULAR
SMALL
PLANT
5-150kW
MODULAR
SMALL
PLANT
50-11MW
MODULAR
SMALL PLANT
100-12MW
MODULAR
SMALL PLANT
100-250kW
MODULAR
Charge
Carrier in
the
OH- H+ H+ CO32- O2-
15
electrolyte
Electrolyte Mobilized or Immobilized Potassium Hydroxide in Asbestos matrix
Hydrated Polymeric Ion Exchange Membranes
Immobilized Liquid Phosphoric Acid in SiC
Immobilized Liquid Molten Carbonate in LiAlO2
Perovskites (Ceramics)
Interconnect Metal Carbon or metal
Graphite Stainless steel or Nickel
Nickel, ceramic, or steel
Table 3 . Fuel cell comparison chart adopted from US Department of Energy (Energy, 2011)
Type of fuel cell Advantages Disadvantages
Alkaline
Electrolyte Fuel
Cell (AFC)
Faster cathode reaction in alkaline electrolyte, higher performance
Expensive removal of CO2
from fuel and air streams
required (CO2 degrades the
electrolyte)
Proton Exchange Membrane Fuel Cells (PEMFC)
Solid electrolyte reduces corrosion & electrolyte management problems
Low temperature quick start up
Requires expensive catalyst
High sensitivity to fuel impurities
Low temperature waste heat
Waste heat temperature not suitable for combined heat and power(CHP)
Phosphoric Acid
Fuel Cell (PAFC)
Higher overall efficiency with CHP
Increased tolerance to impurities in hydrogen
Requires expensive platinum catalyst
Low current and power
Large size and weight
Molten Carbonate
Fuel Cell (MCFC)
High efficiency
Fuel flexibility
Can use variety of catalysts
Suitable for CHP
High temperature speeds up corrosion and breakdown of cell components
Complex electrolyte management
Slow start up
Solid Oxide Fuel
Cells (SOFC)
High efficiency
Fuel flexibility
Can use variety of catalysts
Solid electrolyte reduces electrolyte management problems
Suitable for CHP
Hybrid/GT cycle
High temperature enhances corrosion and breakdown of cell components
Slow start-up
Brittle of ceramic electrolyte with thermal cycling
16
6 Geometry of SOFC
6.1 Single Cell
The two most dominant factors that determine the performance of a fuel cell are cell potential
and current density. Because of the scaling up of a cell, the performance varies slightly in the cell
stack for many reasons. Among them are temperature variations from cell to cell, variation in
flow patterns of reactant gases from cell to cell, and byproduct water rejection problem which
can be accompanied by flooding.
Water is a byproduct of reactions in fuel cell. It has to be ejected from the cell otherwise it will
flood the cell. Thermodynamic Reversible potentials for reactions at the anode and cathode, for
the single cells in electrochemical energy conversion and storage system are described in table 4.
Table 4. single cells in electrochemical energy conversion and storage system
Electrochemical energy converter/storer
Methane/Oxygen
Electrolyte Acid
Anodic reaction 4 2 22 8 8CH H O CO H e
,OCV AE (v) 0,17
Cathodic reaction 2 24 4 2O H e H O
,OCV CE (v) 1,23
G (v) -229KJ/mole
Fuel cell 1,06
Significant power cannot be produced from a single cell, because the power produced is directly
proportional to the active cell area, which is very small. In order to produce the desired higher
output voltage, many fuel cells of the same kind shall be stacked in the form of sandwich in
series. SOFC stacks can be designed and configured in three different groups namely Monolithic,
Tubular and Planar design. The configuration of fuel cell can be classified into two broad
categories as self supporting and external supporting (Minh, 2004).
In order to calculate how many single cells are required for the integration system in this study, it
is important to start with the aimed power produced from the SOFC system, active cell area of
the chosen current density. The cell stack contains interconnects on both anode and cathode side
and electrolyte in the middle. From the aimed 5kWpower and assumed open circuit voltage of
0.82V, the current (I) by the system can be calculated theoretically. The current achieved from
the system, the current density (0.8A/cm2) and active cell area (10cm by 10cm) leads to calculate
the number of cells as follows:
, 56097,56
0,82
SOFC elP kWI A
E V
2
2
current 6097,67621,95
current density800
AArea cm
mA
cm
17
2
2
7621,95Number of cells = 76
active cell area 100
Area cmcells
cm
Number of cells 76cellNumber of stacks 15,2stack
cellsNumber of cells5
stackstack
ss
Where ,SOFC elP - Net power from SOFC
I - Total current required
From the above calculation, it can be seen that for the integration process around 75 single cells
in 15 cell stacks are required. In the cell stack two interconnects, both on the anode side and
cathode side, are attached to collect the electrons released in the reaction.
It is important to mention that the parameters are not chosen from the practical test. However
the above method gives an indication on how to calculate the number of cells required. However,
the number of cells as well as the number of stacks can be different from the calculated. This can
be because of the change in any of the parameters during the practical test.
6.1.1 Configuration of SOFC stack
In self supporting categories, the single cell can be designed as anode-supported, cathode
supported or electrolyte supported. These designs are characterized by the thick layer of the
supporting material.
A fuel cell stack is the heart of the SOFC. However, the stack itself would not be very useful
without the supporting equipment. The SOFC system typically involves the following system:
Oxidant supply
Fuel supply (hydrogen or hydrogen rich gas)
Heat treatment
Power conditioning
Water treatment
Instrumentation and controls
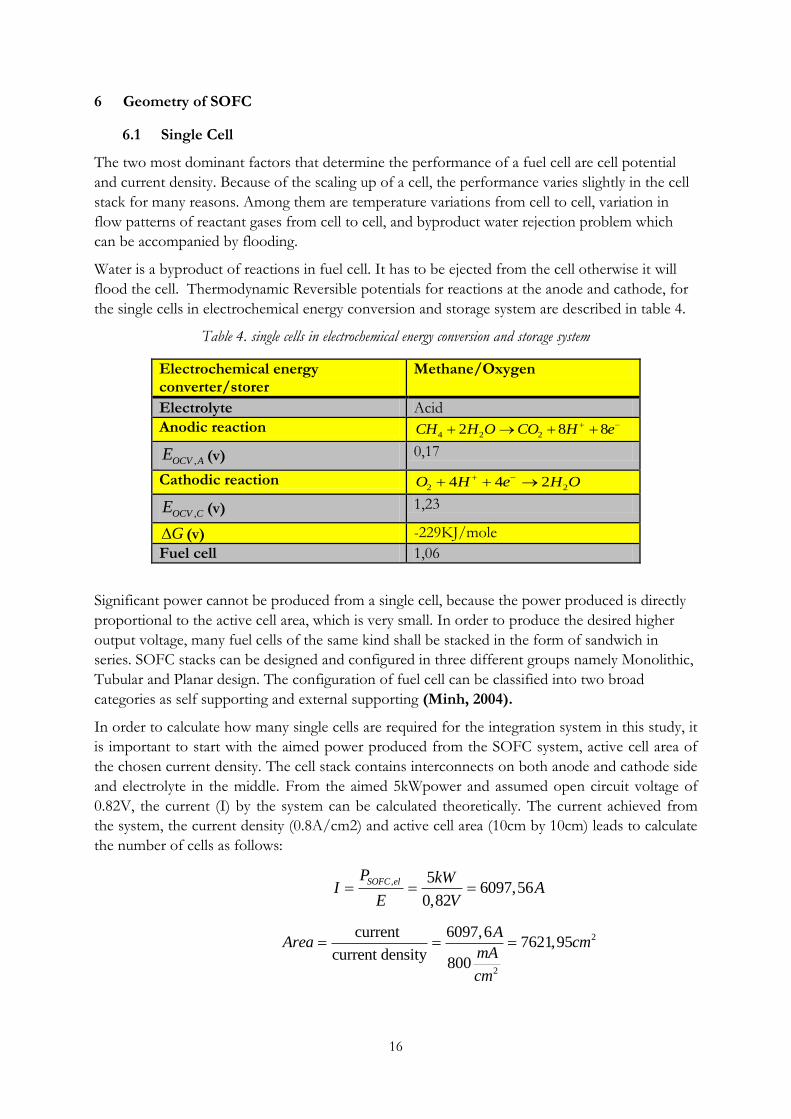
6.1.1.1 Monolithic
Monolithic design consists of thin cell components formed into a compact corrugated structure
of either gas co-flow or cross-flow configuration (Minh, 2004). In co-flow arrangement the fuel
and oxidant flow parallel to each other in the corrugated channels formed by the anode,
electrolyte, cathode and interconnection multilayer connections.
In cross-flow Monolithic SOFC configuration, three layers of anode- electrolyte-cathode are
combined in a sequence, with the center layer containing corrugated anodes and cathodes to
allow the flow of fuel and air. The arrangements of the corrugated electrodes are configured in
such a way that the flow of air and oxidants are crossing each other without any contact with one
another. Higher power density, small cell size and no need of seal are the key advantages of
monolithic design. Reduction of ohmic losses and the increased active cell area is due to their
small size which in turn contributes to the advantages in Monolithic SOFC. But the drawback of
18
monolithic design is the difficulty to fabricate the corrugated structure. These two different
arrangements can be illustrated in figures 9.
Figure 9. Schematics of co and cross-flow monolithic SOFC (Minh, et al., 1995)
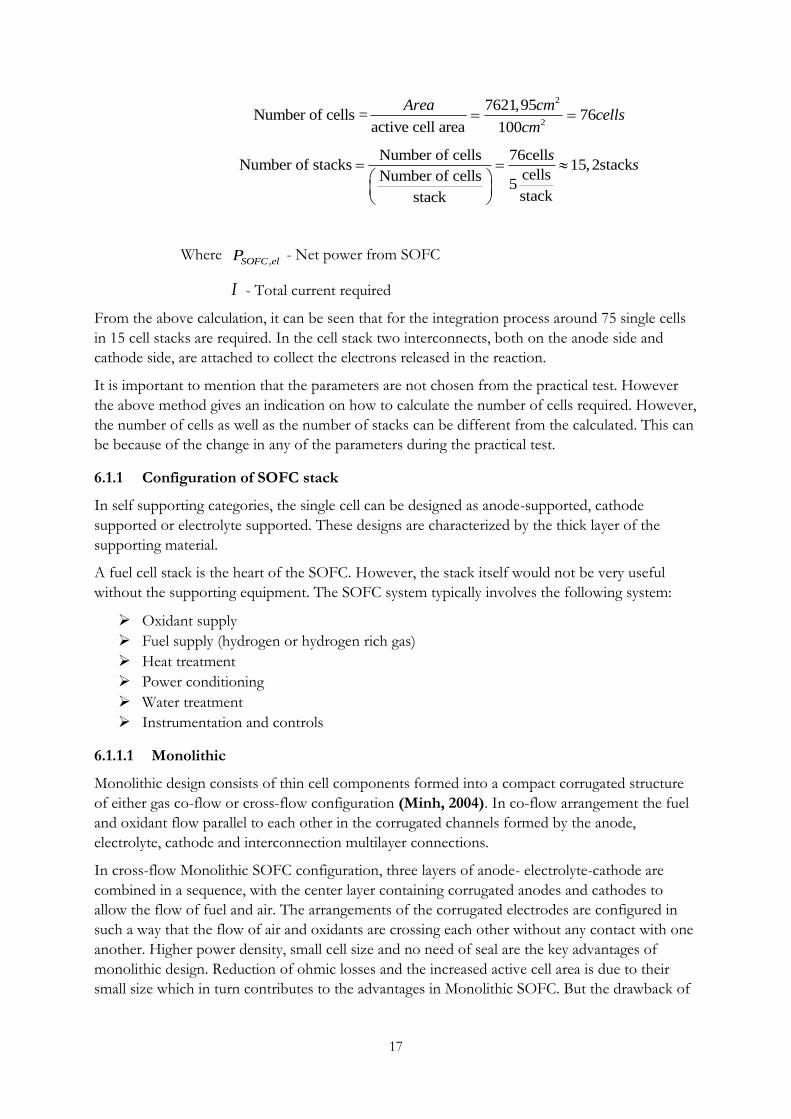
6.1.1.2 Tubular
Tubular designed SOFC consists of a tubular support tube which covers the cathode, electrolyte,
anode and interconnect. In this configuration the fuel flows at the outside of the surfaces of the
bundle of tubes, and the oxidant is introduced through the center of the support tube. The main
advantage of this configuration is the elimination of the gas-tight seal problem because there is
no need of seal between each cell. Tubular SOFCs operate at high temperature and severe
thermal cycling conditions require that each layer of cell components must have similar thermal
expansion coefficient to avoid thermal cracking and deformation (Li, 2006). But this design has
disadvantages as the cell internal resistance and the gas diffusion limitation. A simple layout for
this configuration van be seen in figure 10.
Figure 10. Schematics of Air electrode supported tubular SOFC (Veyo, 2003)
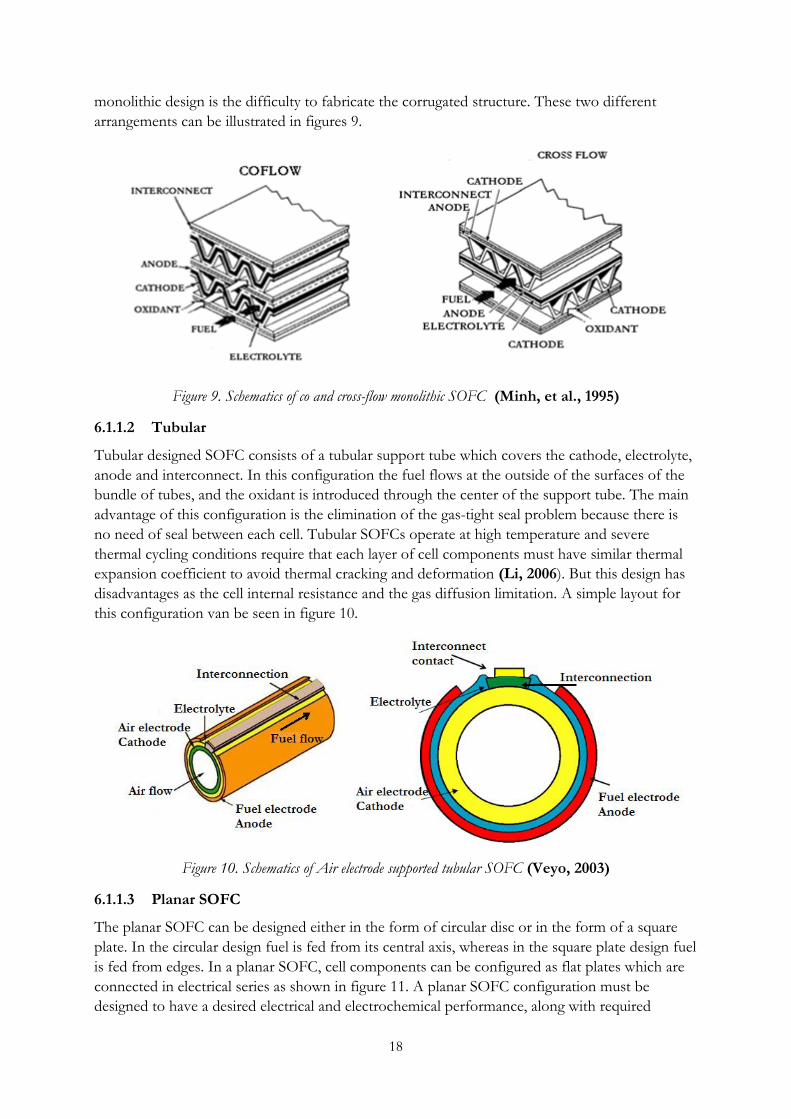
6.1.1.3 Planar SOFC
The planar SOFC can be designed either in the form of circular disc or in the form of a square
plate. In the circular design fuel is fed from its central axis, whereas in the square plate design fuel
is fed from edges. In a planar SOFC, cell components can be configured as flat plates which are
connected in electrical series as shown in figure 11. A planar SOFC configuration must be
designed to have a desired electrical and electrochemical performance, along with required
19
thermal management and mechanincal/structural integrity to meet the operating requirements of
specified power generation applications (Singhal, et al., 2003).
Figure 11. Schematic for a Planar SOFC (Zou, et al., 2012)
Figure 11 demonstrates the planar configuration where each cell is stacked in series to get the
desired amount of power. The planar cell configuration is very commonly used. It is also of great
interest in this thesis.
Planar SOFC can be categorized either as self-supporting or external supporting. In self-
supporting configuration, one of the cell components (often the thickest layer) acts as the cell
structural support. In external-supporting configuration, the single cell is configured as thin layer
on interconnects or a porous substrate. The advantages and disadvantages of these two
configurations can be summarized in table 5.
Table 5 . Features of planar single cell configurations (Singhal, et al., 2003)
Cell
configuration
Advantage Disadvantage
Self-supporting
Electrolyte
supported Relatively strong structural
support from dense
electrolyte
Less susceptible to failure
due to anode re-oxidation
High resistance due to low
electrolyte conductivity
Higher operating
temperatures required to
minimize electrolyte ohmic
losses
Anode supported Highly conductive anode
Lower operating
temperature via use of thin
electrolytes
Potential anode and re-
oxidation
Mass transport limitation
due to thick anodes
20
Cathode supported No oxidation issues
Lower operating
temperature via use of thin
electrolyte
Lower conductivity
Mass transport limitation
due to thick cathodes
External supporting
Interconnect
supported Thin cell components for
lower operating temperature
Strong structures from
metallic interconnects
Interconnect oxidation
Flow field design limitation
due to cell support
requirement
Porous substrate Thin cell components for
lower operating temperature
Potential for use of non-cell
material for support to
improve properties
Increased complexity due to
addition of new materials
Potential electrical shorts
with porous metallic
substrate due to uneven
surface
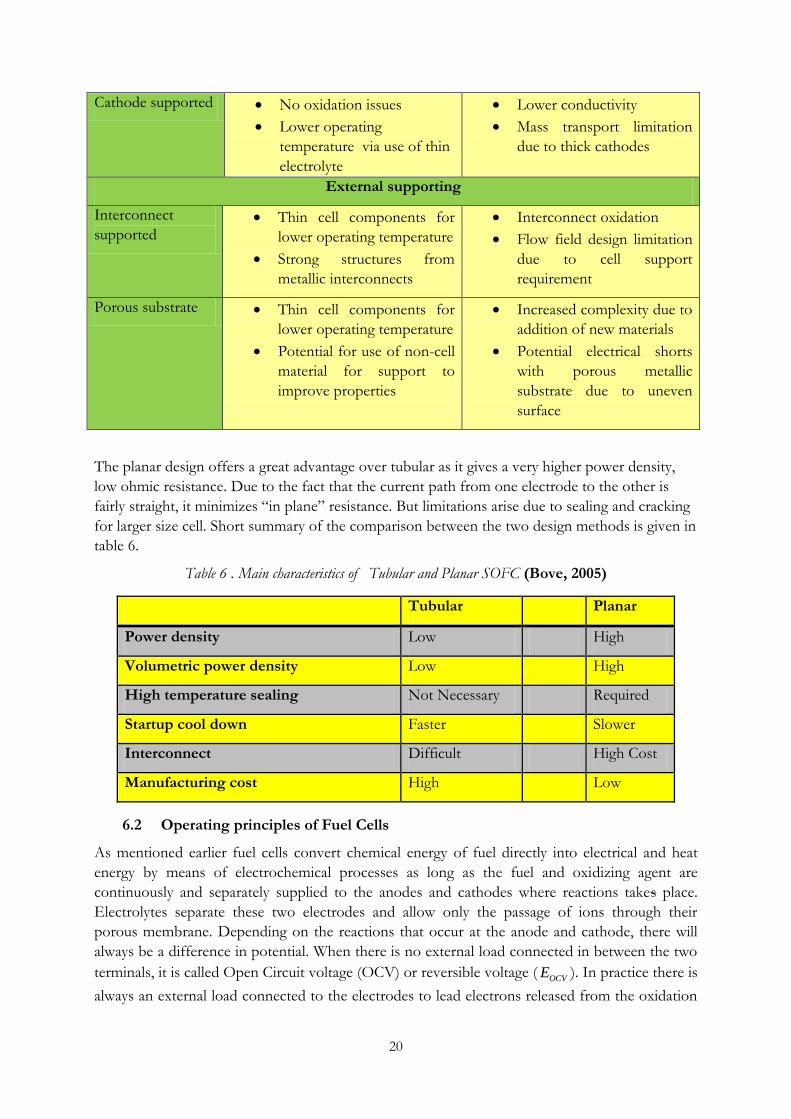
The planar design offers a great advantage over tubular as it gives a very higher power density,
low ohmic resistance. Due to the fact that the current path from one electrode to the other is
fairly straight, it minimizes “in plane” resistance. But limitations arise due to sealing and cracking
for larger size cell. Short summary of the comparison between the two design methods is given in
table 6.
Table 6 . Main characteristics of Tubular and Planar SOFC (Bove, 2005)
Tubular Planar
Power density Low High
Volumetric power density Low High
High temperature sealing Not Necessary Required
Startup cool down Faster Slower
Interconnect Difficult High Cost
Manufacturing cost High Low
6.2 Operating principles of Fuel Cells
As mentioned earlier fuel cells convert chemical energy of fuel directly into electrical and heat
energy by means of electrochemical processes as long as the fuel and oxidizing agent are
continuously and separately supplied to the anodes and cathodes where reactions takes place.
Electrolytes separate these two electrodes and allow only the passage of ions through their
porous membrane. Depending on the reactions that occur at the anode and cathode, there will
always be a difference in potential. When there is no external load connected in between the two
terminals, it is called Open Circuit voltage (OCV) or reversible voltage (OCVE ). In practice there is
always an external load connected to the electrodes to lead electrons released from the oxidation
21
of hydrogen to the cathode. The cell can be considered as a system and the energy contained in
the system which is available to do the useful work is called Gibbs free energy. The amount of
energy released during the conversion process is due to the change in Gibbs free energy which is
expressed in per mole quantities as follows:
Products Reactants
i jG G G (5) (Li, et al., 2010)
where iG and
jG are the free energy species i for the products and j for the reactants.
G can be completely changed in a reversible process, i.e.,
OCVG nFE (6) (Li, et al., 2010)
where n is the number of transferred electrons in the reaction, F is a Faraday constant which is
equal to 96,495 Coulombs per mole OCVE is the reversible voltage of the cell at the cathode and
anode respectively at a standard temperature and pressure (STP) condition meaning at 250C and 1atm pressure, The negative sign indicates that a positive cell potential implies a negative free energy change as the cell reaction proceed to the product side. The open circuit (reversible) voltage of a cell can be expressed as:
OCV
GE
nF
(7) (Li, et al., 2010)
where G is the change in Gibbs free energy at STP conditions and its value expresses the
maximum useful work that a system can do. G is a useful work done by fuel cell and expressed as:
G H T S (8) (Li, et al., 2010)
Where:
H and S are the changes in enthalpy and entropy respectively T is absolute temperature in the reaction
The “ideal “efficiency ( ideal ) of a reversible cell is dependent on the enthalpy of the cell reaction
and it can be calculated by equation (9):
1id
G ST
H H
(9) (Li, et al., 2010)
The change in free energy and thus cell voltage in a chemical reaction is a function of the activities of the solution species and their partial pressure. The reactants are hydrogen fuel at the anode and oxygen supplied from the air at the cathode. The dependence of cell voltage on the reactant activities based on partial pressure is expressed as
2 2
12
2
lnH O
OCV
P PRT
E EnF H O
(10) (Li, et al., 2010)
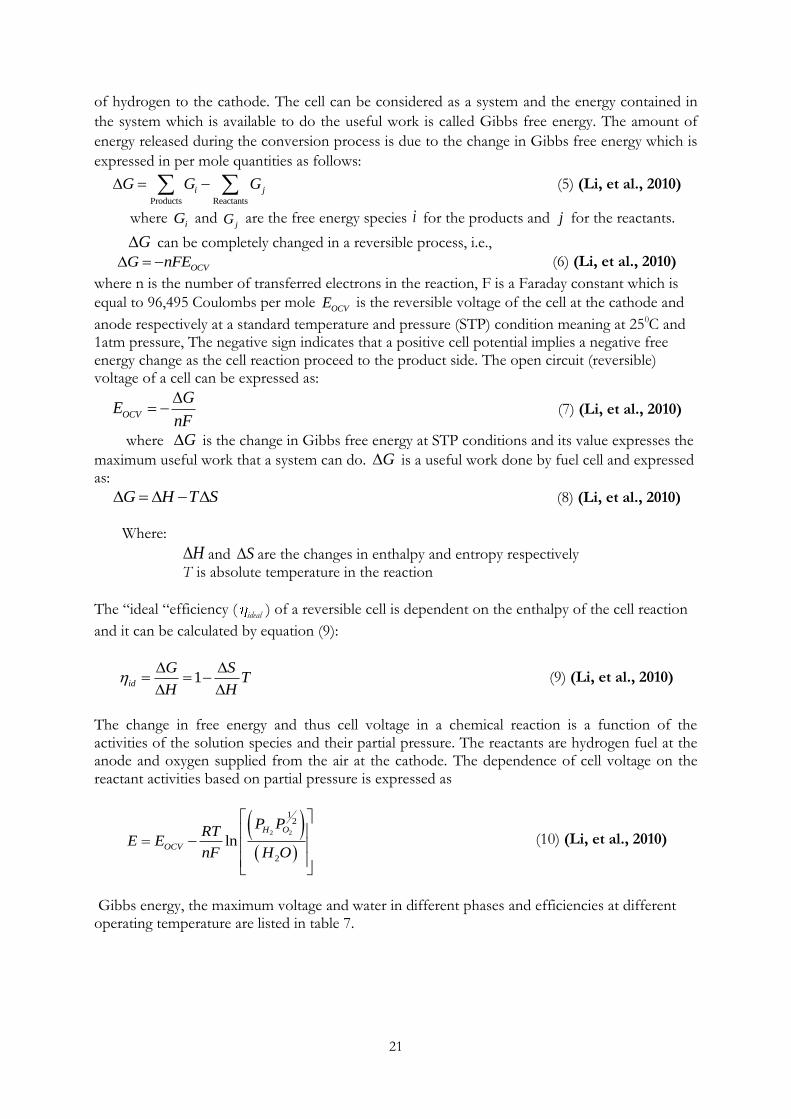
Gibbs energy, the maximum voltage and water in different phases and efficiencies at different operating temperature are listed in table 7.
22
Table 7 . Gibbs free energy for the water formation reaction at various Temperatures with maximum voltage and limited efficiency (Rayment, et al., 2003)
Form of water product
Temperature(0C) G(KJmol-1)
Max voltage (V)
Efficiency limit (%)
Liquid 25 −237,2 1,23 83
Liquid 80 −228,2 1,18 80
Gas 100 −225,2 1,17 79
Gas 200 −220,4 1,14 77
Gas 400 −210,3 1,09 74
Gas 600 −199,6 1,04 70
Gas 800 −188,6 0,98 66
Gas 1000 −177,4 0,92 62
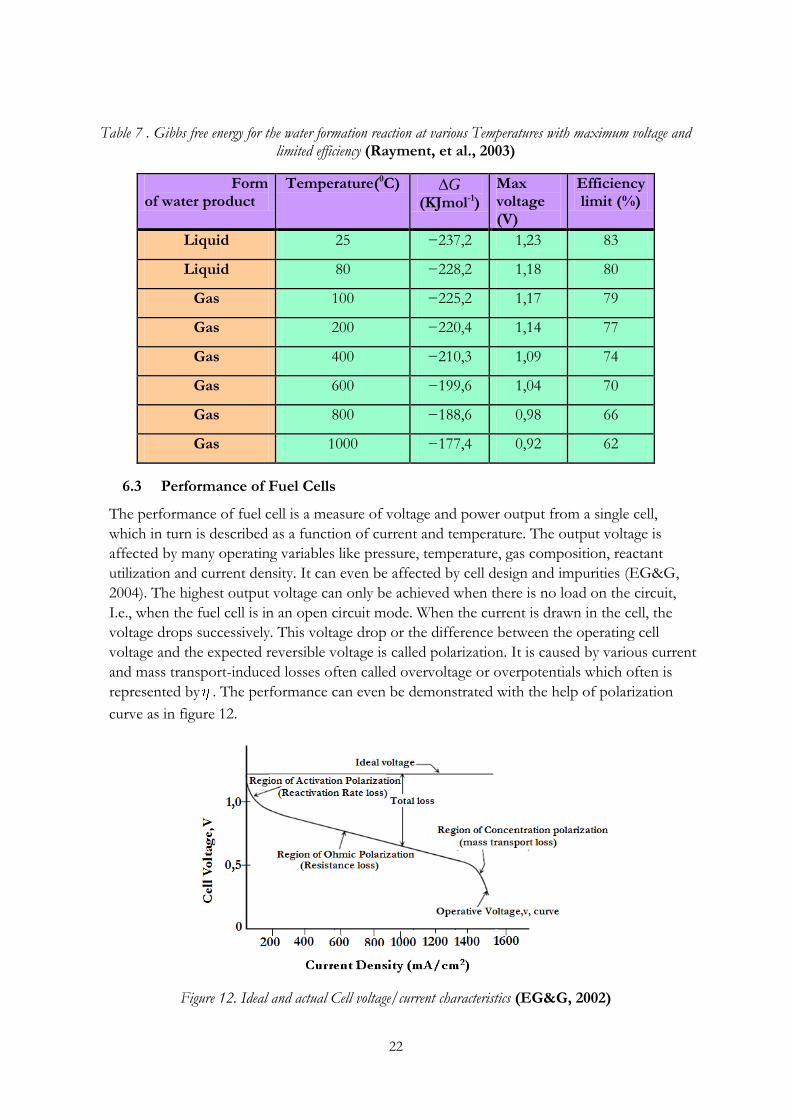
6.3 Performance of Fuel Cells
The performance of fuel cell is a measure of voltage and power output from a single cell,
which in turn is described as a function of current and temperature. The output voltage is
affected by many operating variables like pressure, temperature, gas composition, reactant
utilization and current density. It can even be affected by cell design and impurities (EG&G,
2004). The highest output voltage can only be achieved when there is no load on the circuit,
I.e., when the fuel cell is in an open circuit mode. When the current is drawn in the cell, the
voltage drops successively. This voltage drop or the difference between the operating cell
voltage and the expected reversible voltage is called polarization. It is caused by various current
and mass transport-induced losses often called overvoltage or overpotentials which often is
represented by . The performance can even be demonstrated with the help of polarization
curve as in figure 12.
Figure 12. Ideal and actual Cell voltage/current characteristics (EG&G, 2002)
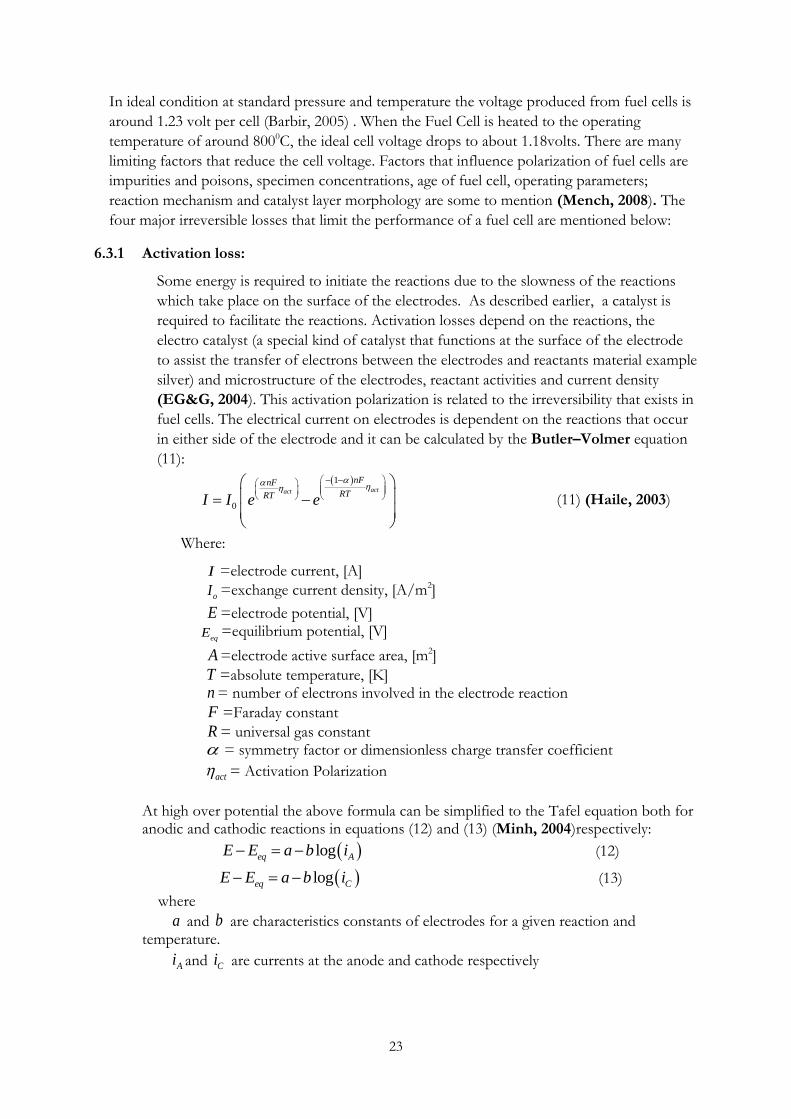
23
In ideal condition at standard pressure and temperature the voltage produced from fuel cells is
around 1.23 volt per cell (Barbir, 2005) . When the Fuel Cell is heated to the operating
temperature of around 8000C, the ideal cell voltage drops to about 1.18volts. There are many
limiting factors that reduce the cell voltage. Factors that influence polarization of fuel cells are
impurities and poisons, specimen concentrations, age of fuel cell, operating parameters;
reaction mechanism and catalyst layer morphology are some to mention (Mench, 2008). The
four major irreversible losses that limit the performance of a fuel cell are mentioned below:
6.3.1 Activation loss:
Some energy is required to initiate the reactions due to the slowness of the reactions
which take place on the surface of the electrodes. As described earlier, a catalyst is
required to facilitate the reactions. Activation losses depend on the reactions, the
electro catalyst (a special kind of catalyst that functions at the surface of the electrode
to assist the transfer of electrons between the electrodes and reactants material example
silver) and microstructure of the electrodes, reactant activities and current density
(EG&G, 2004). This activation polarization is related to the irreversibility that exists in
fuel cells. The electrical current on electrodes is dependent on the reactions that occur
in either side of the electrode and it can be calculated by the Butler–Volmer equation
(11):
1
0
actact
nFnF
RTRTI I e e
(11) (Haile, 2003)
Where:
I =electrode current, [A]
oI =exchange current density, [A/m2]
E =electrode potential, [V]
eqE =equilibrium potential, [V]
A =electrode active surface area, [m2]
T =absolute temperature, [K] n = number of electrons involved in the electrode reaction
F =Faraday constant
R = universal gas constant = symmetry factor or dimensionless charge transfer coefficient
act = Activation Polarization
At high over potential the above formula can be simplified to the Tafel equation both for anodic and cathodic reactions in equations (12) and (13) (Minh, 2004)respectively:
logeq AE E a b i (12)
logeq CE E a b i (13)
where
a and b are characteristics constants of electrodes for a given reaction and temperature.
Ai and Ci are currents at the anode and cathode respectively
24
6.3.2 Fuel Cross Over:
Fuel crossover and internal current: Theoretically only ions shall be transported in electrolytes. However, in practice even waste fuel passes through electrolyte. When this passage of fuel occurs, it causes further voltage losses in fuel cells. Though these losses are very small, it is important to consider in low temperature fuel cells. There can also be an internal current loss due to electrons leaking through electrodes (Rayment, et al., 2003)
6.3.3 Ohmic Loss
As the electrons flow through the electrodes of the cell and different parts of the
interconnections, resistance to the flow causes further voltage loss called Ohmic loss. These
losses or voltage drops are proportional to the current density. These losses are even called
Resistive losses and it can be calculated by equation 14 as:
ohm ohmE IR (14)
6.3.4 Mass transport loss:
Mass transport losses are sometimes called as concentration losses. These losses occur when the
non-reacted gases diffusion in the diffusion layer and the reacting diffusion in the electrode layer
are not in balance. As the reaction is carried out, the concentration of the reactants decrease
while the products increase. The products must be removed continuously to ensure proper fuel
and oxidant at the catalyst layers to maintain high fuel efficiency (Spiegel, 2008). When
unbalance occurs, it causes mass transfer resistance to the flows of reactants and products. This
resistance leads to the concentration gradient which, in turn, changes the partial pressure of the
reactants. The change in partial pressure creates even further loss in cell voltage called mass
transport or concentration loss. The effects of these losses are most pronounced at high current
densities (>500 mA/cm2) (Ramani, 2006).Concentration voltage loss occurs due to the mass
transfer resistance to the flow of the reactants and the products through the porous electrodes.
Concentration voltage loss can be calculated from equation 15 (Gebregergis, et al., 2009)
ln bcon
CRTE
nF C
(15) (Gebregergis, et al., 2009)
Where: N is the number of moles of electrons participating in the reaction
bC and C are the concentrations at the triple-phase boundary(TBP)
Triple phase boundary is a place in fuel cell where the gas, electrolyte and electrode meet
The voltage losses can be summed up as lossE where it is expressed in equation (16):
E E Eloss act ohm conc
E (16) (Gebregergis, et al., 2009)
Where :
lossE - Total voltage loss
Eact
- Activation loss
Eohm
- Ohmic loss
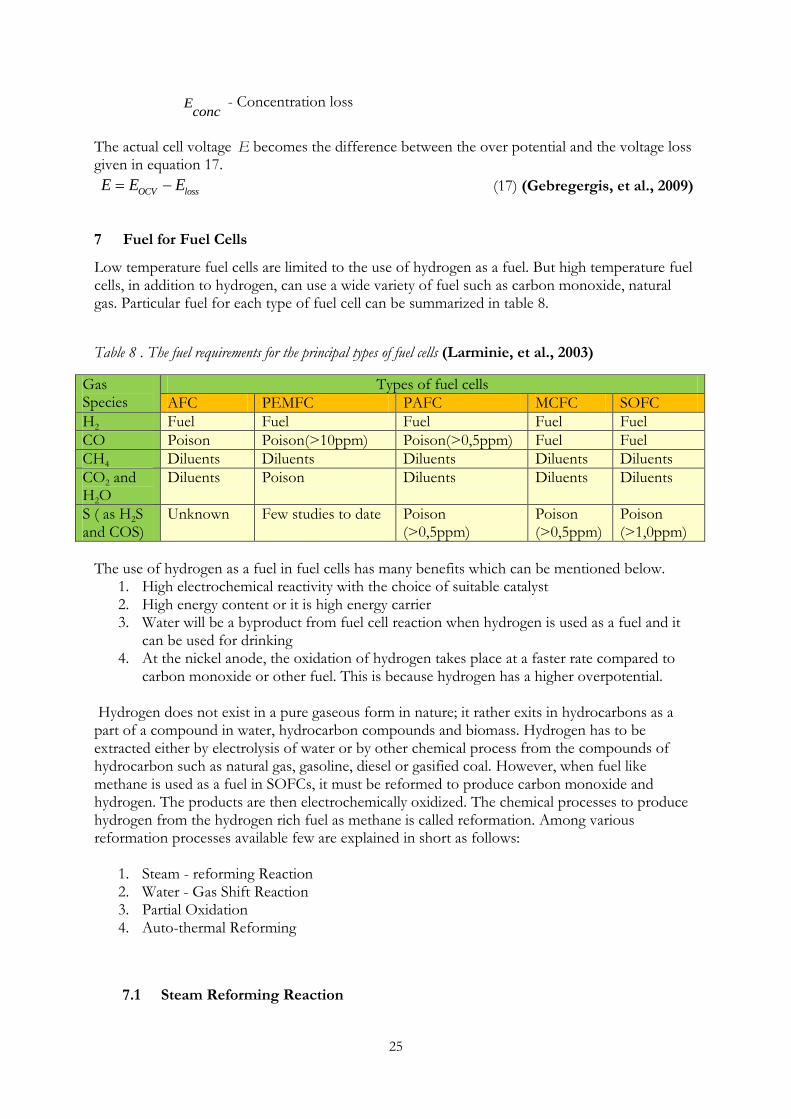
25
Econc
- Concentration loss
The actual cell voltage E becomes the difference between the over potential and the voltage loss given in equation 17.
OCV lossE E E (17) (Gebregergis, et al., 2009)
7 Fuel for Fuel Cells
Low temperature fuel cells are limited to the use of hydrogen as a fuel. But high temperature fuel cells, in addition to hydrogen, can use a wide variety of fuel such as carbon monoxide, natural gas. Particular fuel for each type of fuel cell can be summarized in table 8.
Table 8 . The fuel requirements for the principal types of fuel cells (Larminie, et al., 2003)
Gas Species
Types of fuel cells
AFC PEMFC PAFC MCFC SOFC
H2 Fuel Fuel Fuel Fuel Fuel
CO Poison Poison(>10ppm) Poison(>0,5ppm) Fuel Fuel
CH4 Diluents Diluents Diluents Diluents Diluents
CO2 and H2O
Diluents Poison Diluents Diluents Diluents
S ( as H2S and COS)
Unknown Few studies to date Poison (>0,5ppm)
Poison (>0,5ppm)
Poison (>1,0ppm)
The use of hydrogen as a fuel in fuel cells has many benefits which can be mentioned below.
1. High electrochemical reactivity with the choice of suitable catalyst 2. High energy content or it is high energy carrier 3. Water will be a byproduct from fuel cell reaction when hydrogen is used as a fuel and it
can be used for drinking 4. At the nickel anode, the oxidation of hydrogen takes place at a faster rate compared to
carbon monoxide or other fuel. This is because hydrogen has a higher overpotential.
Hydrogen does not exist in a pure gaseous form in nature; it rather exits in hydrocarbons as a part of a compound in water, hydrocarbon compounds and biomass. Hydrogen has to be extracted either by electrolysis of water or by other chemical process from the compounds of hydrocarbon such as natural gas, gasoline, diesel or gasified coal. However, when fuel like methane is used as a fuel in SOFCs, it must be reformed to produce carbon monoxide and hydrogen. The products are then electrochemically oxidized. The chemical processes to produce hydrogen from the hydrogen rich fuel as methane is called reformation. Among various reformation processes available few are explained in short as follows:
1. Steam - reforming Reaction 2. Water - Gas Shift Reaction 3. Partial Oxidation 4. Auto-thermal Reforming
7.1 Steam Reforming Reaction
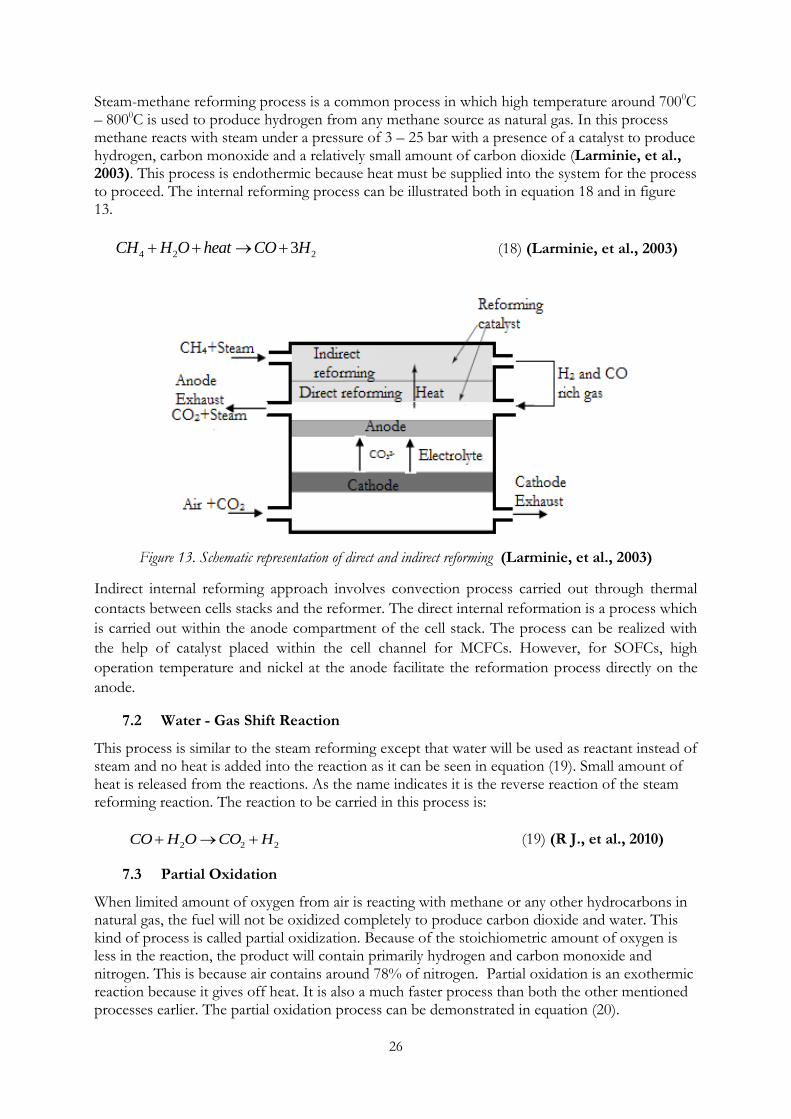
26
Steam-methane reforming process is a common process in which high temperature around 7000C – 8000C is used to produce hydrogen from any methane source as natural gas. In this process methane reacts with steam under a pressure of 3 – 25 bar with a presence of a catalyst to produce hydrogen, carbon monoxide and a relatively small amount of carbon dioxide (Larminie, et al., 2003). This process is endothermic because heat must be supplied into the system for the process to proceed. The internal reforming process can be illustrated both in equation 18 and in figure 13.
4 2 23CH H O heat CO H (18) (Larminie, et al., 2003)
Figure 13. Schematic representation of direct and indirect reforming (Larminie, et al., 2003)
Indirect internal reforming approach involves convection process carried out through thermal
contacts between cells stacks and the reformer. The direct internal reformation is a process which
is carried out within the anode compartment of the cell stack. The process can be realized with
the help of catalyst placed within the cell channel for MCFCs. However, for SOFCs, high
operation temperature and nickel at the anode facilitate the reformation process directly on the
anode.
7.2 Water - Gas Shift Reaction
This process is similar to the steam reforming except that water will be used as reactant instead of steam and no heat is added into the reaction as it can be seen in equation (19). Small amount of heat is released from the reactions. As the name indicates it is the reverse reaction of the steam reforming reaction. The reaction to be carried in this process is:
2 2 2CO H O CO H (19) (R J., et al., 2010)
7.3 Partial Oxidation
When limited amount of oxygen from air is reacting with methane or any other hydrocarbons in natural gas, the fuel will not be oxidized completely to produce carbon dioxide and water. This kind of process is called partial oxidization. Because of the stoichiometric amount of oxygen is less in the reaction, the product will contain primarily hydrogen and carbon monoxide and nitrogen. This is because air contains around 78% of nitrogen. Partial oxidation is an exothermic reaction because it gives off heat. It is also a much faster process than both the other mentioned processes earlier. The partial oxidation process can be demonstrated in equation (20).
27
4 2 2
12
2CH O CO H (20) (Larminie, et al., 2003)
The reforming process can be configured either internal or external reformation depending on the operating temperature and type of fuel cell. In the internal configuration the reformation process will be carried out inside the SOFC stack with the help of waste heat produced from electrochemical oxidation. Careful thermal management is necessary to avoid the cooling of stacks. Internal reforming can either be directly inside SOFC stack on the anode or indirectly in a separate reactor attached to the stack using the heat from the stack itself. But in external reforming an independent reactor must be used. This adds external cost to the system because of additional reactor which even needs additional heat input apart from the reactants.
7.4 Auto-thermal Reforming
Auto thermal reforming is another process that is commonly used for fuel processing. It is an
energy efficient process which uses heat released from partial oxidation and catalytic steam
reformation. In this reformation process both steam and oxidant are fed into a catalytic reactor
together with the fuel. It can be considered as both partial oxidation and steam reformation. It
can also be both endothermic exothermic reactions, which is advantageous because no heat is
supplied or removed (Larminie, et al., 2003).
Regardless of the type of fuel reformation in fuel cells, there is always a drawback in the process. One of them is the requirement of a large amount of energy for processing the fuel. The required energy for the process can be estimated from the relation:
H H H H Hrxn vap cptotal loss (21)
rxnH - The enthalpy of reforming reaction
vapH - The enthalpy of vaporization of the liquid feedstock
cpH - The enthalpy required to heat the vaporized feedstock to the reforming
temperature
lossH - The heat lost to the ambient which can be minimized with adequate
insulation
8 Fuel utilization
SOFCs are fuel flexible devices. Any fuel can be utilized, but hydrogen and carbon monoxide are two major commonly used types of fuel for SOFC. Whenever hydrogen is supplied to fuel cells, it is important to know the utilization of the fuel. The main difference between SOFC and other types of fuel cell is that SOFCs have advantage of the direct utilization of many types of fuels including CO. Other types of fuel cells cannot use carbon monoxide, because CO is poisonous in low temperature fuel cells. The direct utilization of these fuels has its own difficulties. Those difficulties are associated with very low rates of electrochemical oxidization and the presence of various contaminants. The contaminants hinder or block chemical reactions in most of fuel cell types. SOFCs are very tolerant to impurities and the mentioned problems are avoided in SOFC operation. As the gas mixture of hydrogen and carbon monoxide is in contact with the cell, the hydrogen participates in the reaction. The other components pass through without being converted. During the reaction the concentration of hydrogen minimizes because hydrogen is
28
electrochemically oxidized at the anode. As a consequence, the carbon monoxide gas becomes more dominant together with the steam. The partial pressure of hydrogen decreases and in turn the cell voltage becomes low. Theoretically, 0.03kg or 357 l f hydrogen (at a pressure of 1bar and a temperature of 250C) is needed to produce 1kwh of electrical energy. Practically, because of Ohmic and polarization losses, when the working voltage of the fuel cell is 0.8 V, for example, 0.046 kg or 548 L of hydrogen is needed (Bagotsky, 2008). The hydrogen fuel fed to the SOFC cannot be consumed completely in the reaction with oxygen supplied at the cathode. The supplied oxygen will not be consumed in the reaction either. Some of the unused fuel and oxygen will be rejected from the fuel cell. In integrating the system, the rejected fuel can be used in the combustor for further utilization to improve the efficiency of the overall system. Even though Bogotsky gave in the literature referred in this thesis an indication of how much hydrogen is needed to produce 1 kWh, it is not applicable to the specific purpose used here in this thesis However it is a good indication to estimate how much fuel to be used in this practical work. Efficiency of the fuel cell is dependent on how much of the reactants reacted with
each other, operating temperature and pressure. The utilization of fuel hydrogen ( fU ) is assumed
to be 85% and the amount of hydrogen fuel needed can be calculated from equation (22):
2 22 2
,
*
SOFC el
H HH H
SOFC rxn
QM M
Hm n
(22)
Where :
rxnH - the enthalpy from the reaction of hydrogen and oxygen in fuel cell
2Hm - mass flow of hydrogen
,SOFC elQ
- Desired electric power from SOFC
2HM - Molecular mass of hydrogen
From equation (22), it can be calculated how much unused fuel is to be fed to the combustor. A simple calculation can be illustrated in equation (23):
22 2,
1 HH unuesd HUm m
(23)
The fuel and oxygen utilization factor are defined as follows in equations (24) and (25) respectively
2, 2,
2,
2,
2 2,
suplied
su
H H cons
pli
umed
H ed
nH consumedU
H nH Supplied
(24)
2,
2 2,
nO consumedU
O nO Air supplied (25)
Where
2U
H - Fuel hydrogen utilization factor
2,nH consumed
- Mole of Hydrogen consumed
2,nH Supplied
- Moles of Hydrogen supplied
29
2U
O - Oxygen utilization factor
2,nO consumed
- Moles of Oxygen consumed
2, nO Air supplied
- Moles of oxygen supplied
9 Micro Gas Turbine ( GT )
Micro Gas Turbines are small combustion turbines that produce heat and power from around few kilowatts to about 500kW. MGTs are low pressure ratio gas turbines. MGTs are working with low pressure ratios between 3:1 and 7:1 (Bohn, 2005). Most of the MGTs available in the market are single stage, radial flow device with a very high rotating speed of about 90 000 to around 180 000 revolutions per minutes and with a variable frequency of 1300 to 3000 Hz. Alternative Current (AC) power may be converted to Direct Current (DC) power and later re-converted via inverters in to single phase or 3-phase AC power at 230 V or 400 V and 50 Hz or 230/400 V, 60Hz.
The operation principle of micro gas turbines is the same as the large gas turbines except that the compressor inlet air flow is kept as low as possible. The operation is the same as the Brayton thermodynamic cycle except MGTs operate at lower temperatures than large turbines (Hamilton, 2003). In this cycle, atmospheric air compressed, heated at constant temperature and then expanded in the turbine. Part of the power produced by the turbine is consumed as mechanical work by the rotating shaft to drive the compressor and some of it is consumed by the compressor to compress the air and some of it by the generator to generate electricity. The conversion of the chemical energy stored in fuels into mechanical energy is done by the turbine which, in turn, drives the compressor and the generator. Considerable amount of exhaust heat is available in the process of conversion. This potential of exhaust heat when used in cogeneration makes GT s a good candidate for the combined heat and power system
(CHP). Micro gas turbines offer many beneficial characteristics depending on the customer´s needs and particular application desired. Most micro gas turbines run on natural gas. The ability of micro gas turbines to operate on a variety of renewable and waste fuels as well as diesel and propane makes them more flexible. The ability of burning waste fuel contributes to the improvement of the economy and environment (Hamilton, 2003). Micro gas turbine components typically consist of a centrifugal compressor and a radial turbine component mounted on the same shaft, a combustor and recuperator. In some designs a separate turbine wheel, a power turbine wheel is also provided (Giampaolo, 2006). The flexibility of GT s in connection methods, the ability to provide stable and reliable
power with low emission makes them ideally suitable for distributed generation applications. Some of these applications can be as follows:
Combined heat and power
Distributed generation- Stand alone and on- site application
Backup/standby power
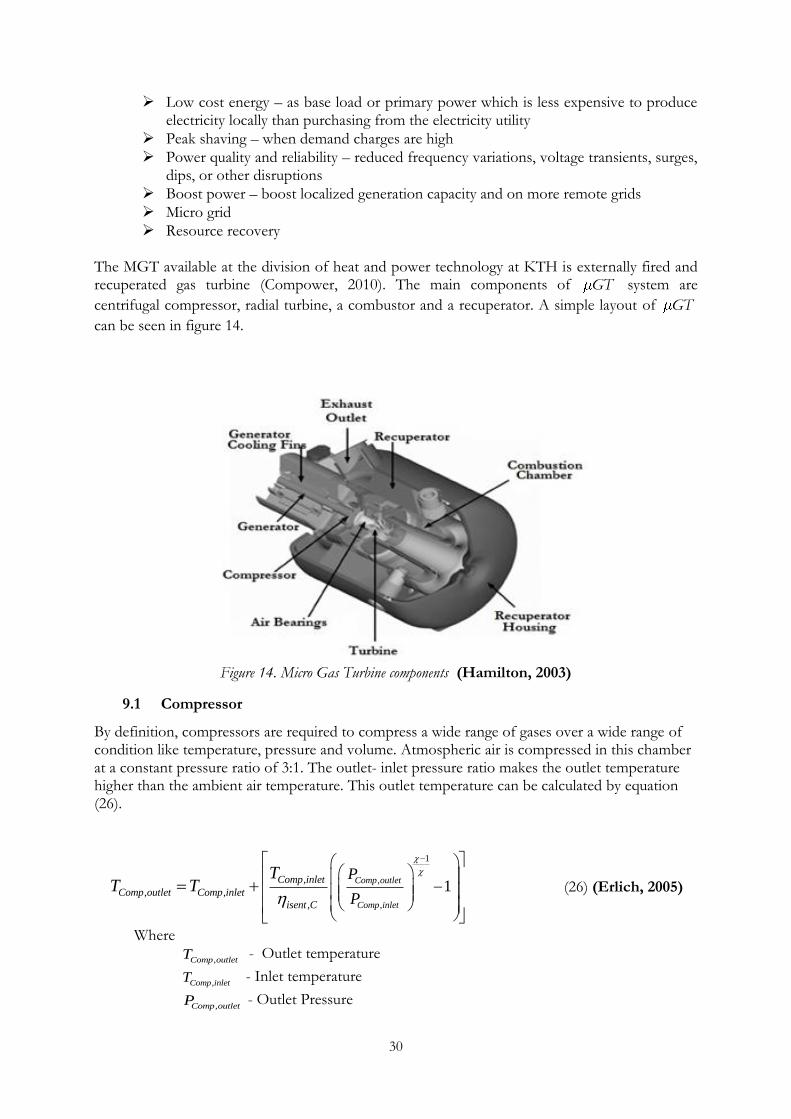
30
Low cost energy – as base load or primary power which is less expensive to produce electricity locally than purchasing from the electricity utility
Peak shaving – when demand charges are high
Power quality and reliability – reduced frequency variations, voltage transients, surges, dips, or other disruptions
Boost power – boost localized generation capacity and on more remote grids
Micro grid
Resource recovery The MGT available at the division of heat and power technology at KTH is externally fired and recuperated gas turbine (Compower, 2010). The main components of GT system are
centrifugal compressor, radial turbine, a combustor and a recuperator. A simple layout of GT
can be seen in figure 14.
Figure 14. Micro Gas Turbine components (Hamilton, 2003)
9.1 Compressor
By definition, compressors are required to compress a wide range of gases over a wide range of condition like temperature, pressure and volume. Atmospheric air is compressed in this chamber at a constant pressure ratio of 3:1. The outlet- inlet pressure ratio makes the outlet temperature higher than the ambient air temperature. This outlet temperature can be calculated by equation (26).
1
,
,
,
, ,
,
1Comp outlet
Comp inlet
Comp inlet
Comp outlet Comp inlet
isent C
P
P
TT T
(26) (Erlich, 2005)
Where
,Comp outletT - Outlet temperature
,Comp inletT - Inlet temperature
,Comp outletP - Outlet Pressure
31
,Comp inletP - Inlet Pressure
- The specific heat ratio, the average value between inlet and outlet
temperature
,isent C - Isentropic efficiency of compressor
The efficiency of a compressor is often described as isentropic efficiency (Hanlon, 2001). The isentropic efficiency of the compression process defined as the work required compressing the gas in an isentropic process divided by the actual work used to compress the gas.
, , ,
,
, ,
Ideal change in enthalpy
actual change in enthalpy
Comp outlet isent Comp inlet
isent C
Comp outlet Comp inlet
h h
h h
(27) (Erlich, 2005)
Where
, ,Comp outlet isenth - Isentropic enthalpy heat at the outlet
,Comp outleth - Enthalpy heat at the outlet
,Comp inleth - Enthalpy heat at the inlet
The power produced through compressor work is described by the equation (28) or (29) Where
, , ,P in outCompr Comp outlet Comp inletP C T Tm
(28) (Erlich, 2005)
2, 1.outlet inletCompr h hP m
(29) (Erlich, 2005)
where
comprP - Power produced by the compressor
m
- Mass flow rate of the compressed air
,P in outC -Specific heat capacity of the compressed air at the inlet and out let
,Comp outletT - Outlet temperature from the compressor
,Comp inletT -Inlet temperature to the compressor
1,inleth - Enthalpy at the inlet of compressor
2,outleth - Enthalpy at the outlet of compressor
9.2 Turbine
Micro gas turbines employ the radial inflow turbine wheel design that looks very much like compressor component as it can be seen in figure (17). The turbine section has the task of producing useful output shaft power, power to drive the compressor and all other engine accessories. This will be accomplished by expanding the high temperature, pressure and velocity of the gas used as media and converting its gaseous energy into mechanical energy.
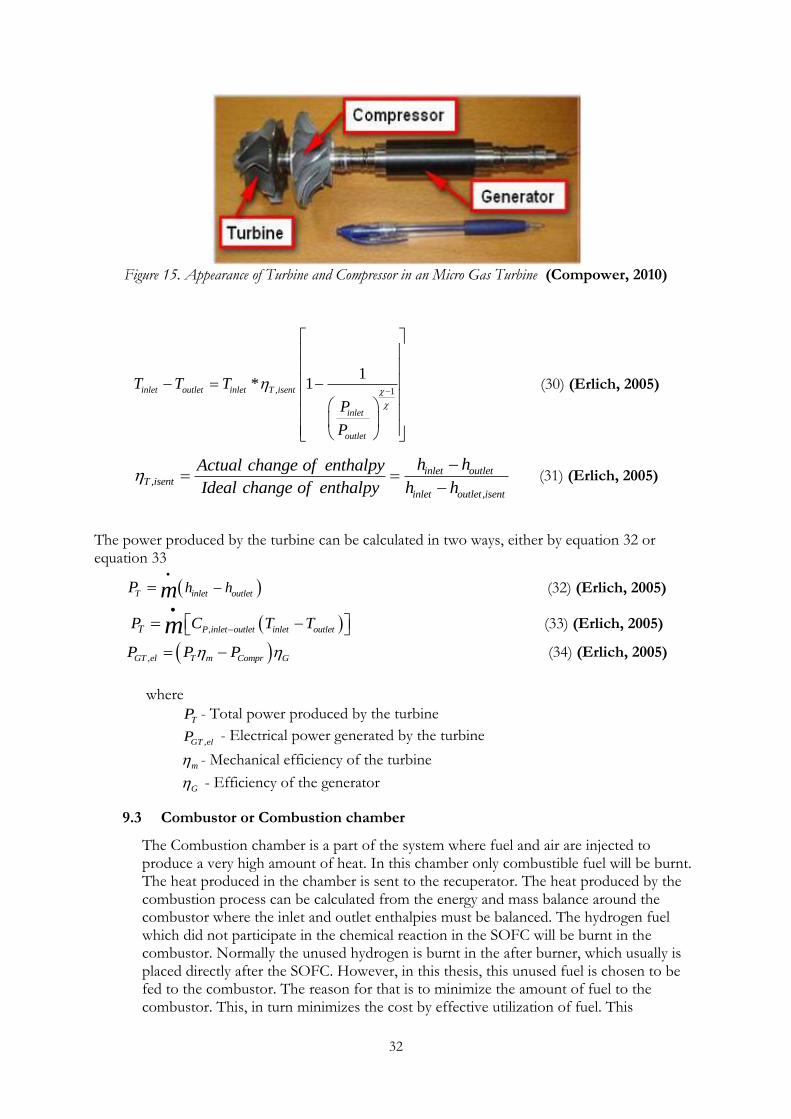
32
Figure 15. Appearance of Turbine and Compressor in an Micro Gas Turbine (Compower, 2010)
, 1
1* 1inlet outlet inlet T isent
inlet
outlet
T T T
P
P
(30) (Erlich, 2005)
,
,
inlet outlet
T isent
inlet outlet isent
Actual change of enthalpy
Ideal change of enthalp
h h
h hy
(31) (Erlich, 2005)
The power produced by the turbine can be calculated in two ways, either by equation 32 or equation 33
T inlet outleth hP m
(32) (Erlich, 2005)
,P inlet outlet inlet outletTP C T Tm
(33) (Erlich, 2005)
,GT el T m Compr GP P P (34) (Erlich, 2005)
where
TP - Total power produced by the turbine
,GT elP - Electrical power generated by the turbine
m - Mechanical efficiency of the turbine
G - Efficiency of the generator
9.3 Combustor or Combustion chamber
The Combustion chamber is a part of the system where fuel and air are injected to produce a very high amount of heat. In this chamber only combustible fuel will be burnt. The heat produced in the chamber is sent to the recuperator. The heat produced by the combustion process can be calculated from the energy and mass balance around the combustor where the inlet and outlet enthalpies must be balanced. The hydrogen fuel which did not participate in the chemical reaction in the SOFC will be burnt in the combustor. Normally the unused hydrogen is burnt in the after burner, which usually is placed directly after the SOFC. However, in this thesis, this unused fuel is chosen to be fed to the combustor. The reason for that is to minimize the amount of fuel to the combustor. This, in turn minimizes the cost by effective utilization of fuel. This
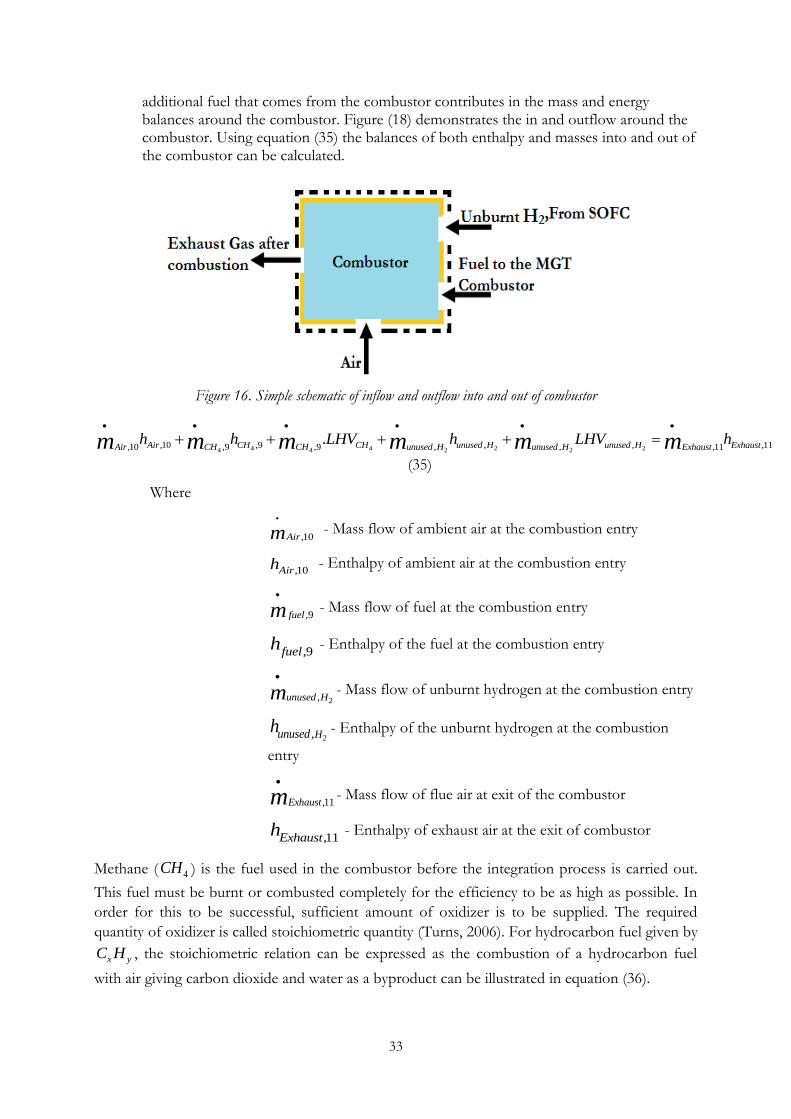
33
additional fuel that comes from the combustor contributes in the mass and energy balances around the combustor. Figure (18) demonstrates the in and outflow around the combustor. Using equation (35) the balances of both enthalpy and masses into and out of the combustor can be calculated.
Figure 16. Simple schematic of inflow and outflow into and out of combustor
4 4 2 24 4 2 2,10 ,9 , , ,11,10 ,9 ,9 , , ,11
.Air CH CH unused H unused H ExhaustAir CH CH unused H unused H Exhausth h LHV h LHV hm m m m m m
(35)
Where
,10Airm
- Mass flow of ambient air at the combustion entry
,10Airh - Enthalpy of ambient air at the combustion entry
,9fuelm
- Mass flow of fuel at the combustion entry
,9fuelh - Enthalpy of the fuel at the combustion entry
2,unused Hm
- Mass flow of unburnt hydrogen at the combustion entry
2,Hunusedh - Enthalpy of the unburnt hydrogen at the combustion
entry
,11Exhaustm
- Mass flow of flue air at exit of the combustor
,11Exhausth - Enthalpy of exhaust air at the exit of combustor
Methane ( 4CH ) is the fuel used in the combustor before the integration process is carried out.
This fuel must be burnt or combusted completely for the efficiency to be as high as possible. In
order for this to be successful, sufficient amount of oxidizer is to be supplied. The required
quantity of oxidizer is called stoichiometric quantity (Turns, 2006). For hydrocarbon fuel given by
x yC H , the stoichiometric relation can be expressed as the combustion of a hydrocarbon fuel
with air giving carbon dioxide and water as a byproduct can be illustrated in equation (36).
34
2 2 2 2 23.76 3.762
x y
yC H a O N xCO H O N
(36) (Turns, 2006)
Where:
4
ya x is mole coefficient for respective component
For the specific fuel used, methane, the balanced equation for the combustion in air to acquire
the stoichiometric air fuel ratio equation (37) can be derived and the balanced equation is as in
equation (37).
4 2 2 2 2 22( 3.76 ) 2 7.52CH O N CO H O N (37) (Turns, 2006)
Before the systems are integrated and additional unreacted hydrogen fuel is sent in to the
combustor, it is known how much methane fuel is to be supplied. In order to keep all the
parameters supplied by the experiment and calculate the amount of fuel to be fed after
integration, it is assumed that the efficiency of the combustor is ideal without losses. However, in
a real situation there are always losses. It is also assumed that the efficiencies and heat from the
flue gas will not change before and after integration. In other words , ,out before out afterQ Q and
, , 100%combustor before combustor after . After the system is integrated, the fuel to be supplied can be
calculated from equation (38).
4 4 24 4 2(1) ,10 (1),9 (1) ,10 (2),9 ,(1),10, (1),9 (2),10, (2),9 ,Air CH Air CH unused HAir CH Air CH unused H
h LHV h LHV LHVm m m m m
(38)
The subscripts (1) and (2) represent before and after the unused hydrogen is supplied as an extra
fuel for the effective utilization of the fuel from the SOFC, which otherwise is wasted.
In obtaining the enthalpies of the exhaust flue gas, during combustion of methane with air, the
stoichiometric air to fuel ratio ( f ) the gas content ( X ) and specific fuel consumption ( ) are
necessary and can be obtained from equations (39) and respectively (40).
(1 )*
1X f
(39) (Erlich, 2005)
fuel
Air
m
m
(40) (Erlich, 2005)
There will always be a difference in enthalpy which has to be considered as the exhausted gas is a
mixture of gas and warm air. From tables the differences in enthalpy ( Dh ) can be extracted and
added to get the enthalpy after the combustion process is carried out.
,Exhaust Gas Airh h Dh (41) (Erlich, 2005)
In the hotter regions of combustion reaction zone of the combustion chamber, oxides of
nitrogen are produced primarily as nitric oxide. In combustion of hydrocarbon rich fuel,
35
Nitrogen oxides (NOx), will be produced because of two mechanisms called Mechanisms of
Thermal NOx and Organic NOx. The formation of NOx in the combustors is predominantly
dependent on the following predominant factors as:
1. The reaction temperature
2. The resident time at high temperature
3. Air fuel ratio in and after the combustion reaction zone
4. The combustor geometry
5. The mixing pattern in the combustor
Because of the fact that Thermal NOx is extremely temperature dependent, it is produced in the
hottest regions of the combustor. But Organic NOx is formed during the combustion by
chemical combination of the nitrogen atoms, which are part of the fuel molecule, and the oxygen
in the air (Giampaolo, 2006).
Generally the emission of nitrogen oxide increases in direct proportion to the increase in
combustion temperature.
9.4 Recuperator
A recuperator is a type of heat exchanger used in power plants to improve the specific fuel consumption by transferring waste heat from the exhaust gases to the combustion air to heat such air prior to its entry to the combustion chamber. Inside recuperators, the transfer of gas and air occur through the passage walls; where extremely hot exhaust gas on the upper part and cool compressed air on the bottom side of the recuperor (Giampaolo, 2006). Both the extremely hot gas and compressed air pass in a direction opposite to each other. This kind of flow is called counter flow. The recuperator is used to capture exhaust waste heat to heat up compressed discharge air. Heating the
compressor discharge air reduces the fuel consumption, which reduces xNO formation
and increase the overall efficiency of the micro gas turbine (Giampaolo, 2006). In other words recuperators are most essential to achieve an increased efficiency from micro turbines. The ratio of the actual heat transferred to the maximum achievable heat transferred is referred to as effectiveness of the heat exchanger. A recuperator contributes much to increase the electricity of a micro turbine from about 14% to about 26% for a typical turbine depending on the component details. However, incorporation of recuperator results in pressure loss through the recupreator itself and in the ducting that connects it to the other components. The pressure loss essentially reduces the pressure ratio available to the turbine, affecting both power output and system efficiency. Typically, these pressure losses result in 10% to 15% less power being produced by the micro gas turbine and the corresponding loss of a few points in efficiency compared with an ideal recuperator with a zero pressure drop (Soares, 2007). The maximum theoretical heat transfer rate occurs in a counter flow with infinite heat transfer area. The effectiveness can be calculated in equation (42).
max
recup
q
q (42) (Wetley, et al., 2008)
36
Re
1 exp 1
1 exp 1
r
cup
r r
C NTU
C C NTU
(43) (Wetley, et al., 2008)
min,
r r r r
air P air
U A U ANTU
Cm C (44) (Wetley, et al., 2008)
, min
, max
air P air
r
cg P comb g
m C CC
m C C
(45) (Wetley, et al., 2008)
where
Recup - Effectiveness of the recuperator
maxq - The maximum theoretical heat transfer rate occurs in a counter
flow
q - The actual heat transferred
rU - The overall heat transfer coefficient
,P comb gC - Specific heat ratio of combusted gas
cgm - Mass of combusted gas
,P airC - Specific heat ratio of air
10 Model Description
The hybrid SOFC/ GT system to be integrated as a subject of this thesis is intended as
an auxiliary power unit (APU) for research studies in the Polygeneration lab of the
Division of Heat and Power technology in KTH. The system to be designed is intended
to have an electrical power rated around 5kW from a planar SOFC in combination with
micro gas turbine GT . The utility of a single shaft MGT and a planar SOFC are studied
separately in achieving efficient steady state operation and smooth transport of fuel and
air to and from the SOFC system. The fuel cell and the micro gas turbine can be
configured in several different fashions. However, in this thesis, the model is suggested to
have a layout as in figure 17. In this model, air and methane fuel are fed into the
combustor, while hydrogen is fed into the SOFC. The arrangements of the micro gas
turbine ( GT ) will not be changed from a previous design, in order to maintain to the
working conditions such as temperature and pressure.
The advantage of this layout is that the expanded hot air fed from the turbine to the
SOFC at the cathode is clean. Even if it is not warm enough to start the operation of the
SOFC, it contributes much. To raise this temperature to the SOFC operation
temperature, electricity is supplied to a heater to raise temperature to the desired
operation temperature continuously as long as the operation is necessary. With the help
of this heated-up air and the exhaust heat formed due to the irreversibility of
electrochemical processes, a direct reformation process can be carried out if the fuel used
in SOFC is methane. If methane is used as fuel, a reformer is required to reform the fuel
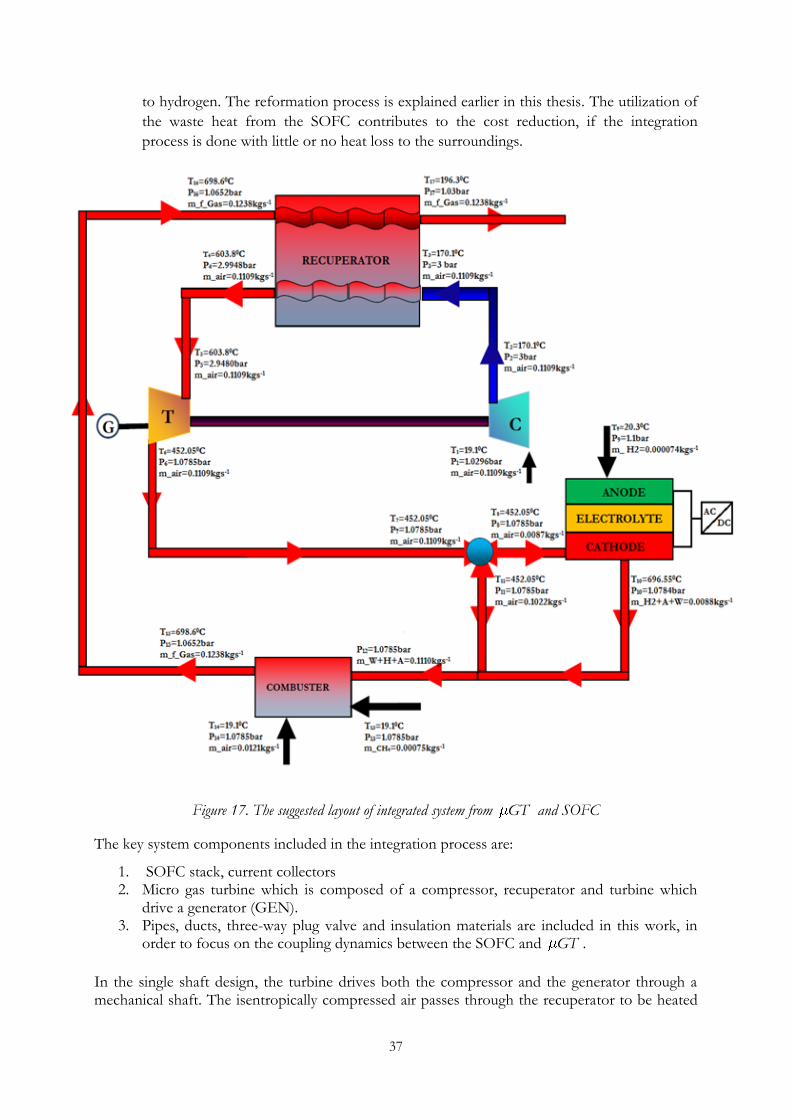
37
to hydrogen. The reformation process is explained earlier in this thesis. The utilization of
the waste heat from the SOFC contributes to the cost reduction, if the integration
process is done with little or no heat loss to the surroundings.
Figure 17. The suggested layout of integrated system from GT and SOFC
The key system components included in the integration process are:
1. SOFC stack, current collectors 2. Micro gas turbine which is composed of a compressor, recuperator and turbine which
drive a generator (GEN). 3. Pipes, ducts, three-way plug valve and insulation materials are included in this work, in
order to focus on the coupling dynamics between the SOFC and GT .
In the single shaft design, the turbine drives both the compressor and the generator through a mechanical shaft. The isentropically compressed air passes through the recuperator to be heated
38
up before entering into the turbine. The warmer compressed air expands in the turbine and led to the cathode side of the SOFC. Before it enters into the SOFC, it is important to reduce the amount of air to a satisfactory level for the fuel cell. This reduction avoids unnecessary wastage of heat to heat up the air in the SOFC. In order to regulate the air flow to the SOFC, a three way plug valve is used. Some of the expanded air is fed to the combustor and some of it to the SOFC. With the heated up air and with electrical heat supply from the external source, the SOFC is activated and starts its operation. External electrical heat supply is required continuously to raise the temperature to the SOFC operation temperature. This is because the operation is around 500-6000C and the heated air to the cathode is 452,10C. When the operation temperature is around 5500C, hydrogen fuel is fed to the SOFC at the anode. At the anode, the fuel hydrogen is split into hydrogen ion and electron. The released hydrogen passes through the electrolyte towards the oxygen ion (proton). The proton is liberated from the reduction of oxygen from the air at the cathode. The electrons liberated from the reaction cannot pass through the electrolyte like ions do. So they are led through external circuit and as a result electricity is produced. When the two ions meet, water will be produced as a byproduct. Heat is also another byproduct from the reactions in SOFC. The fuel fed at the anode will not react completely even if it is desired. The amount of hydrogen that did not react will be sent into the combustor so that it will be combusted completely. The water produced in this system is in the form of water vapor or steam with high temperature. It is wise to manage the heat from the steam. In this integration system it is fed into the combustor. The heat released from the SOFC is used to:
1. Heat up the hydrogen fuel from 20,30C to 554,30C so that the reaction starts 2. Raise the temperature of the air from the turbine from 452,10C to 554,30C 3. Raise the temperature of the unused hydrogen from 554,30C to 656,50C 4. Raise the temperature of the water vapor (steam) from 554,30C to 656,50C 5. Raise the temperature of the air that does not participate in the reaction with hydrogen
from 554,30C to 656,50C The unused hydrogen, the heat released from the SOFC and heat from the steam could contribute to the overall efficiency of the system. The amount of fuel to be used in the combustor will be reduced, when all contributions from the SOFC and from the turbine are managed properly. However, in this thesis, the amount of fuel to the combustor is not much. This is because assumptions are made to maintain the working conditions (pressure and temperature) constant. At this stage, it is not possible to control and measure changes if changes are allowed. In other words, in this integration process, the conditions after the combustor are kept constant. In order to calculate the changes in enthalpy at different stages, Shomate equation is used with some modification. The reason for this is it is difficult to find enthalpy changes in air which is assumed to be 79% nitrogen and 21% oxygen on molar basis.
2 3 40 0
298.132 3 4
t t t EH H At B C D F H
t (46) (Linstrom, et al., 2013)
Where: 0H - Standard enthalpy t - Temperature (K)/1000 The constants used in equation (46) are different at different stages of process in changing enthalpies as described earlier to manage the waste heat. These constants are summarized in table (9).
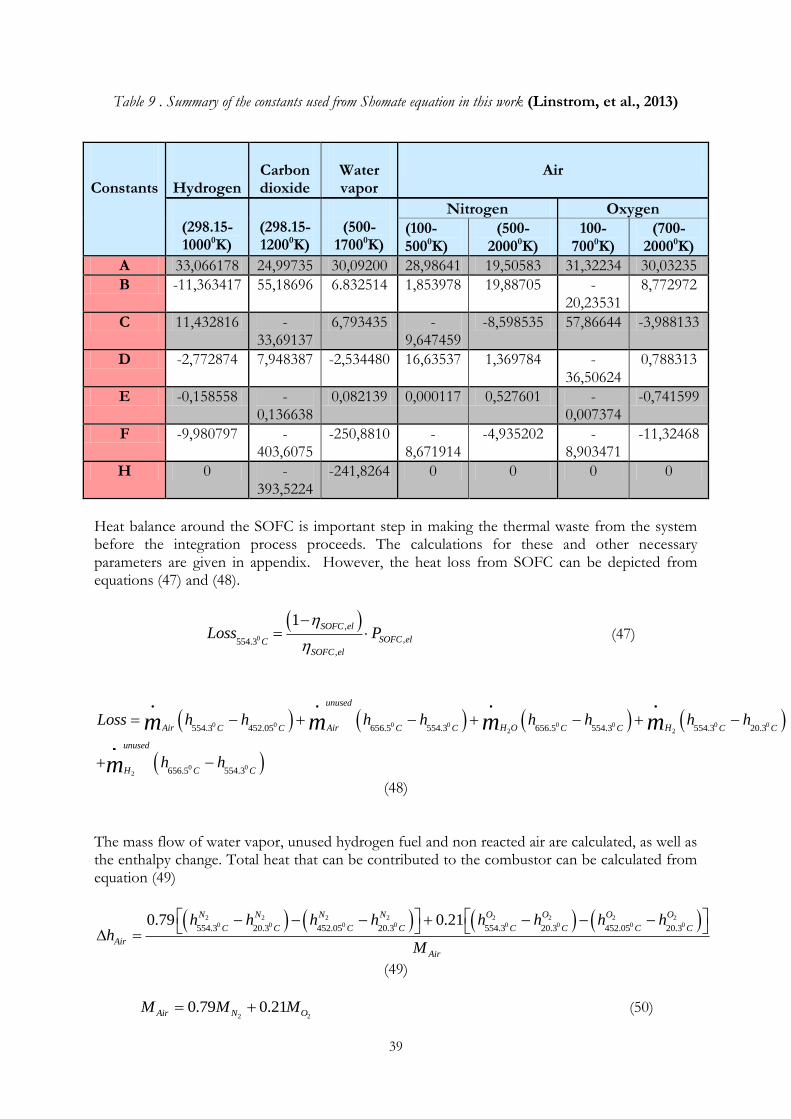
39
Table 9 . Summary of the constants used from Shomate equation in this work (Linstrom, et al., 2013)
Constants
Hydrogen
Carbon dioxide
Water vapor
Air
(298.15-10000K)
(298.15- 12000K)
(500-
17000K)
Nitrogen Oxygen
(100-5000K)
(500-20000K)
100-7000K)
(700-20000K)
A 33,066178 24,99735 30,09200 28,98641 19,50583 31,32234 30,03235
B -11,363417 55,18696 6.832514 1,853978 19,88705 -20,23531
8,772972
C 11,432816 -33,69137
6,793435 -9,647459
-8,598535 57,86644 -3,988133
D -2,772874 7,948387 -2,534480 16,63537 1,369784 -36,50624
0,788313
E -0,158558 -0,136638
0,082139 0,000117 0,527601 -0,007374
-0,741599
F -9,980797 -403,6075
-250,8810 -8,671914
-4,935202 -8,903471
-11,32468
H 0 -393,5224
-241,8264 0 0 0 0
Heat balance around the SOFC is important step in making the thermal waste from the system before the integration process proceeds. The calculations for these and other necessary parameters are given in appendix. However, the heat loss from SOFC can be depicted from equations (47) and (48).
0
,
,554.3,
1 SOFC el
SOFC elCSOFC el
Loss P
(47)
0 0 0 0 0 0 0 02 2
0 02
554.3 452.05 656.5 554.3 656.5 554.3 554.3 20.3
656.5 554.3
unused
Air Air H O HC C C C C C C C
unused
H C C
Loss h h h h h h h h
h h
m m m m
m
(48) The mass flow of water vapor, unused hydrogen fuel and non reacted air are calculated, as well as the enthalpy change. Total heat that can be contributed to the combustor can be calculated from equation (49)
2 2 2 2 2 2 2 20 0 0 0 0 0 0 0554.3 20.3 452.05 20.3 554.3 20.3 452.05 20.3
0.79 0.21N N N N O O O O
C C C C C C C C
Air
Air
h h h h h h h hh
M
(49)
2 20.79 0.21Air N OM M M (50)
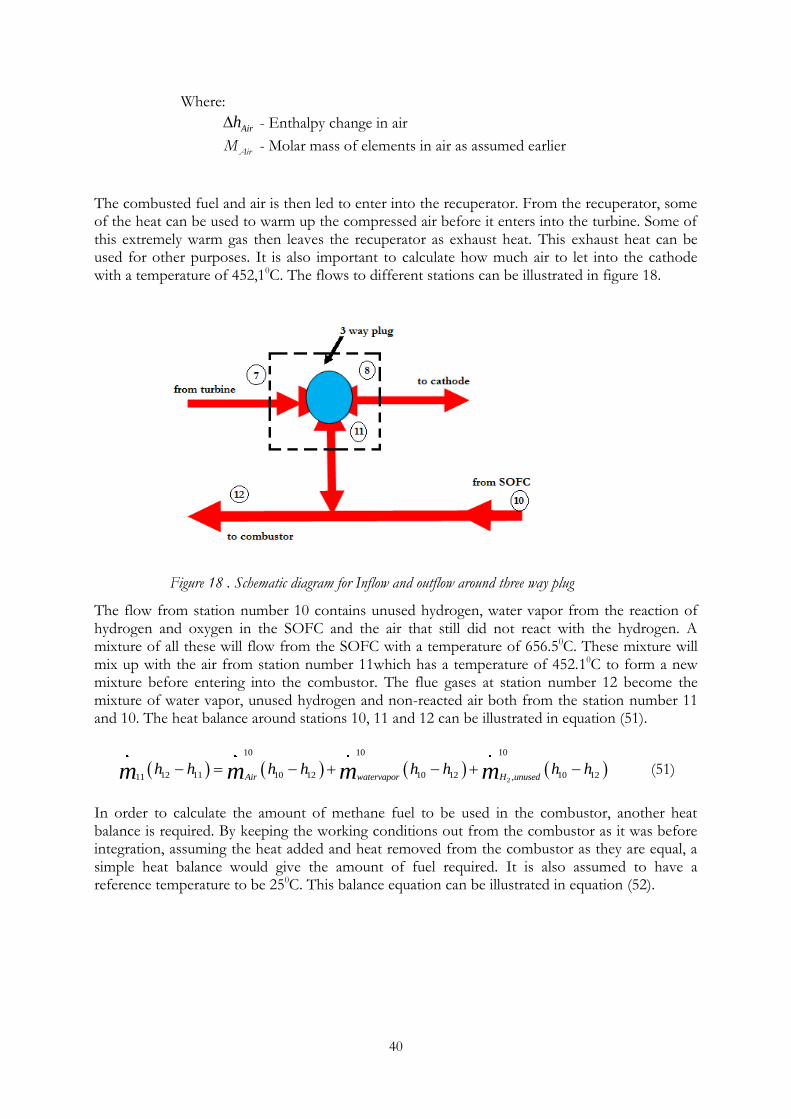
40
Where:
Airh - Enthalpy change in air
AirM - Molar mass of elements in air as assumed earlier
The combusted fuel and air is then led to enter into the recuperator. From the recuperator, some of the heat can be used to warm up the compressed air before it enters into the turbine. Some of this extremely warm gas then leaves the recuperator as exhaust heat. This exhaust heat can be used for other purposes. It is also important to calculate how much air to let into the cathode with a temperature of 452,10C. The flows to different stations can be illustrated in figure 18.
The flow from station number 10 contains unused hydrogen, water vapor from the reaction of hydrogen and oxygen in the SOFC and the air that still did not react with the hydrogen. A mixture of all these will flow from the SOFC with a temperature of 656.50C. These mixture will mix up with the air from station number 11which has a temperature of 452.10C to form a new mixture before entering into the combustor. The flue gases at station number 12 become the mixture of water vapor, unused hydrogen and non-reacted air both from the station number 11 and 10. The heat balance around stations 10, 11 and 12 can be illustrated in equation (51).
2
10 10 10
12 11 10 12 10 12 10 1211 ,Air watervapor H unusedh h h h h h h hm m m m (51)
In order to calculate the amount of methane fuel to be used in the combustor, another heat balance is required. By keeping the working conditions out from the combustor as it was before integration, assuming the heat added and heat removed from the combustor as they are equal, a simple heat balance would give the amount of fuel required. It is also assumed to have a reference temperature to be 250C. This balance equation can be illustrated in equation (52).
Figure 18 . Schematic diagram for Inflow and outflow around three way plug
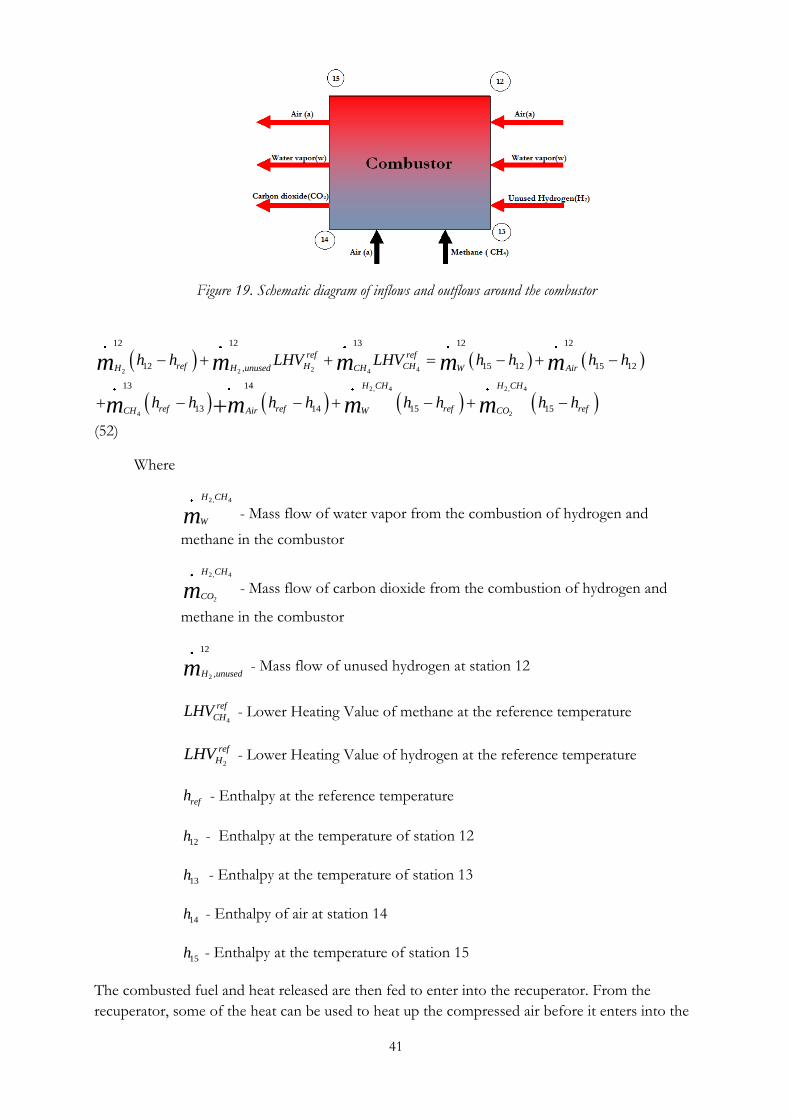
41
2 42 2 4
2, 4 2, 4
4 2
12 12 13 12 12
12 15 12 15 12,
13 14
13 14 15 15
ref ref
ref H CHH H unused CH W Air
H CH H CH
ref ref ref refCH Air W CO
h h LHV LHV h h h h
h h h h h h h h
m m m m m
m m m m
(52)
Where
2, 4H CH
Wm - Mass flow of water vapor from the combustion of hydrogen and
methane in the combustor
2, 4
2
H CH
COm - Mass flow of carbon dioxide from the combustion of hydrogen and
methane in the combustor
2
12
,H unusedm - Mass flow of unused hydrogen at station 12
4
ref
CHLHV - Lower Heating Value of methane at the reference temperature
2
ref
HLHV - Lower Heating Value of hydrogen at the reference temperature
refh - Enthalpy at the reference temperature
12h - Enthalpy at the temperature of station 12
13h - Enthalpy at the temperature of station 13
14h - Enthalpy of air at station 14
15h - Enthalpy at the temperature of station 15
The combusted fuel and heat released are then fed to enter into the recuperator. From the
recuperator, some of the heat can be used to heat up the compressed air before it enters into the
Figure 19. Schematic diagram of inflows and outflows around the combustor
42
turbine. Some of this extremely warm gas that leaves the recuperator as an exhaust heat. This
exhaust heat can be used for other purposes depending on the needs.
10.1 Starting-up the SOFC system
Safe operation is necessary in achieving the desired improvement of the overall efficiency of the
SOFC. Though high operating temperature is the advantage of SOFC, it is also disadvantage
from the quick start-up point of view. This is because SOFC needs to be activated to a higher
temperature as 5500C. The following sequences are important to be followed for its safe
operation.
1. Decide how long the system is going to be in operation and make sure that the
fuel to be used is adequate so that the system will not run out of fuel. As a
consequence system damage occurs
2. Make sure that the fuel hydrogen is ready before operation by bringing the
cylinder into the lab from where it is stored
3. Prepare the SOFC cell and mount it into the furnace for the operation.
4. Connect the fuel and air supply to the sample holder
5. Make an inspection with the sensor to make sure that there is no leakage of
fuel
6. Wait until SOFC reaches its operation temperature and start supplying the fuel
when temperature is around 5500C.
7. Switch on the electrical load
8. When the operating temperature is achieved, the SOFC will be activated and
measurements as open current voltage (OCV), current (I) and other necessary
details like impedance can be taken.
9. Make sure the byproduct water leaves the SOFC in a safe way.
10.2 Shutting down the SOFC
After the necessary operation is carried out in a safe and satisfying manner, and it is not necessary
anymore to continue with the operation, a very careful assessment must be carried out to shut the
system. The following are important assessments:
1. Shut off the fuel supply
2. Stop the air supply to the stacks
3. Disconnect the electrical load
4. Open the anode outlet and make it clean for the next use
5. Because of the high operating temperature, water vapor vanishes from the
SOFC. However it is important to make sure that no water vapor remains in
the SOFC. In other words make sure no water shall be condensated from the
steam.
10.3 Starting up the hybrid system
As the system is an integration of two systems, the starting system differs a bit from individual
systems of MGT and SOFC. As mentioned earlier SOFC does not start its operation unless it is
activated to its operation temperature. When SOFC is used for power generation independently,
the activation heat is supplied from external electricity. But in this integrated system, the heat to
activate the fuel cell can be achieved from the turbine outlet. This heat speeds up the activation
43
so that start-up time is to be minimized. It is advantageous to start the micro gas turbine first and
when the required temperature at the exit of the turbine is achieved the SOFC will start its
operation. In the beginning the micro gas turbine itself has to be supplied with power from the
grid connection at 3*400V, 50Hz and 32A fuse. Once power is supplied, MGT starts quickly. A
simple the start-up method can be done as follows:
1. Check the installation of compressor and gas are done by experienced
laboratory technician
2. Make a visual inspection to check for damaged connections and fire hazardous
materials to be removed from vicinity
3. Inspect any leakage from the compressed air and fuel containers. If there is any,
take the necessary precautions to avoid danger
4. Decide how long the system shall run and if the fuel methane and the
compressed are available and enough to run the operation
5. Make sure that valve for supply of gas and air and removal of water from the
operation are in working conditions as desired
6. Know the working conditions of parts of the system as pressure and
temperature, do according to the instructions
7. Make sure the probe for gas leakage is working before operation and connect it
before the gas bottle is connected to detect any leakage during operation.
8. Once the necessary control is done, switch on the main switch to supply the
required power for the MGT to start its operation
9. When the turbine outlet temperature is achieved, allow the flow to the SOFC.
10.4 Shutting down the System
The safe and proper operation continues until the desired system gives the desired result. When
the system has to be stopped, it is important to shut off the supply from the MGT. This
interruption gives effective utilization of the fuel left in the system, which, in turn gives a
possibility for the SOFC to carry out its operation. Some simple steps to be followed are:
1. Stop the supply of compressed air
2. Shut the valves for the fuel supply
3. Shut the main switch
11 Economy of the SOFC system
The relationships between the desired outcomes, such as power and efficiency and
controllable inputs such as stack voltage and fuel flow, must be carefully studied to derive the
maximum potential from the operation of the SOFC (Khandkar, 2000). The mentioned
relationships must be evaluated in the system design stage, so that the system can be
optimized at a reasonable cost of the major components. Before the system is built, a capital
cost is to be fixed by following the operating conditions and factors that affect the effective
operation of the system.
The major components of the cost to be considered are as follows:
1. Material and fabrication cost
2. Cost of operation and maintenance
3. Installation cost
44
4. Fuel cost
5. The Cost of electricity
Manufacturing cost includes the labor cost to fabricate the major components of the
SOFC like cells, stacks and interconnects
Installation cost includes the assembly of SOFC components, pipes to and from
SOFC for fuel to the anode and air to the cathode and the reformer needed for
internal reformation.
Cost of operation and maintenance is for the total amount of hours in a year where
the SOFC operate at the desired operating condition and the cost to replace the
defected materials and maintain the necessary operation
The cost of electricity can be calculated from capital cost, fuel cost and annual
operating hours in equation (46) :
3.412 &
system
CC FC O MCOE
H H (53) (Lipman, 2004)
Where
COE - Cost of Electricity ($/MWh)
CC - Capital Cost of the system and installation cost ($/kW)
FC - Fuel Cost ($/GJ)
&O M - Operation and Maintenance ($/kW-year)
H - Annual operating hours
system - The average efficiency of the system (0 – 1, 0)
12 Practical work in the Laboratory
In order to choose and suggest the best material for anode and cathode as well as for the
electrolyte, different materials supplied from the fuel cell team were tested in the fuel cell test rig
available. During the test, under supervision and assistance of the researcher Afzal, the fuel cell
was prepared at the spot. To prepare the fuel cells, Nickel foam with a diameter of 13mm was
used as a base material. The cells tested were single layer, two layer and three layer devices with
different mass composition. The chemicals were grinded to a very fine particle and mixed up
before arranging the desired fuel cell. The next step was to put the arranged layer under a
pressure of 250 Mpa for 5 to 10 minutes. Precautions were taken to avoid short circuit. Silver
paste was painted, both on the cell surface and on the sample holder before the cell is put in the
furnace. The reason for this painting method was to collect the current.
Symmetrical and asymmetrical fuel cells were also tested. In the symmetrical fuel cell type two
different methods were done to check the behavior and performance of the fuel cells.
Symmetrical fuel cell is a type of fuel cell with the same material used both as anode and cathode.
To check the behavior of the chosen symmetrical cells, different mass composition on either side
was tested. For the asymmetrical part, as the name indicates, materials used as electrodes are
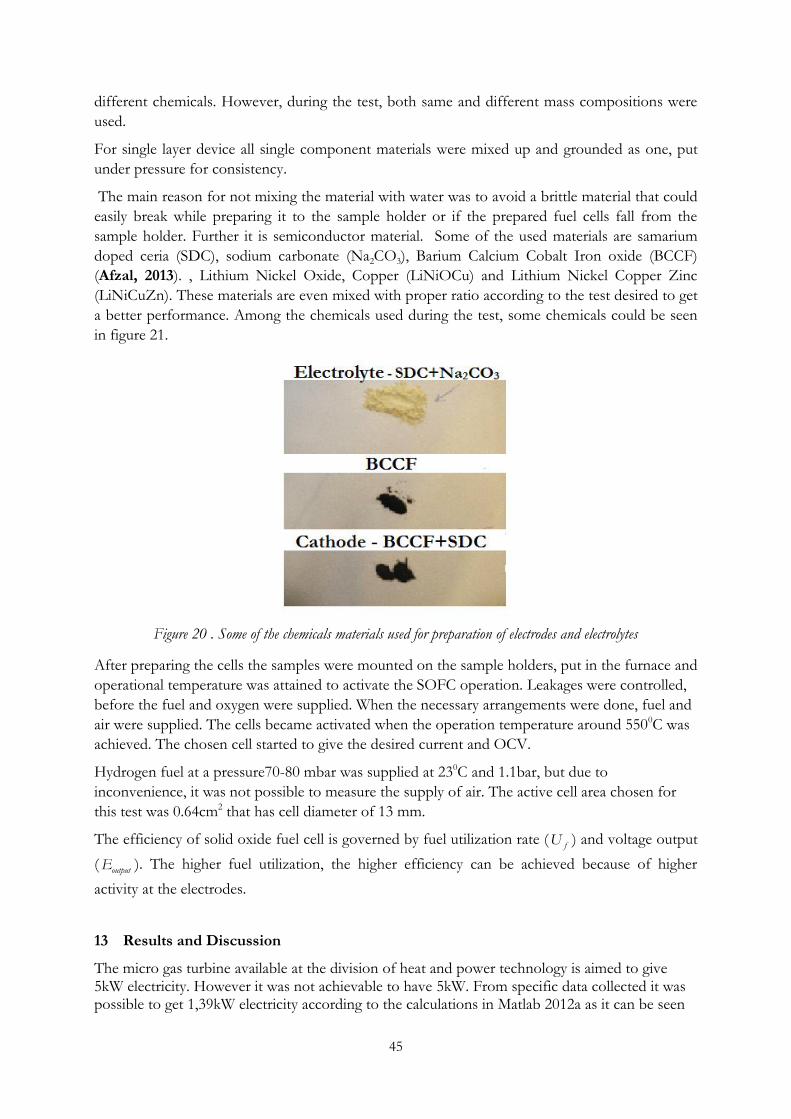
45
different chemicals. However, during the test, both same and different mass compositions were
used.
For single layer device all single component materials were mixed up and grounded as one, put
under pressure for consistency.
The main reason for not mixing the material with water was to avoid a brittle material that could
easily break while preparing it to the sample holder or if the prepared fuel cells fall from the
sample holder. Further it is semiconductor material. Some of the used materials are samarium
doped ceria (SDC), sodium carbonate (Na2CO3), Barium Calcium Cobalt Iron oxide (BCCF)
(Afzal, 2013). , Lithium Nickel Oxide, Copper (LiNiOCu) and Lithium Nickel Copper Zinc
(LiNiCuZn). These materials are even mixed with proper ratio according to the test desired to get
a better performance. Among the chemicals used during the test, some chemicals could be seen
in figure 21.
Figure 20 . Some of the chemicals materials used for preparation of electrodes and electrolytes
After preparing the cells the samples were mounted on the sample holders, put in the furnace and
operational temperature was attained to activate the SOFC operation. Leakages were controlled,
before the fuel and oxygen were supplied. When the necessary arrangements were done, fuel and
air were supplied. The cells became activated when the operation temperature around 5500C was
achieved. The chosen cell started to give the desired current and OCV.
Hydrogen fuel at a pressure70-80 mbar was supplied at 230C and 1.1bar, but due to
inconvenience, it was not possible to measure the supply of air. The active cell area chosen for
this test was 0.64cm2 that has cell diameter of 13 mm.
The efficiency of solid oxide fuel cell is governed by fuel utilization rate (fU ) and voltage output
(outputE ). The higher fuel utilization, the higher efficiency can be achieved because of higher
activity at the electrodes.
13 Results and Discussion
The micro gas turbine available at the division of heat and power technology is aimed to give 5kW electricity. However it was not achievable to have 5kW. From specific data collected it was possible to get 1,39kW electricity according to the calculations in Matlab 2012a as it can be seen
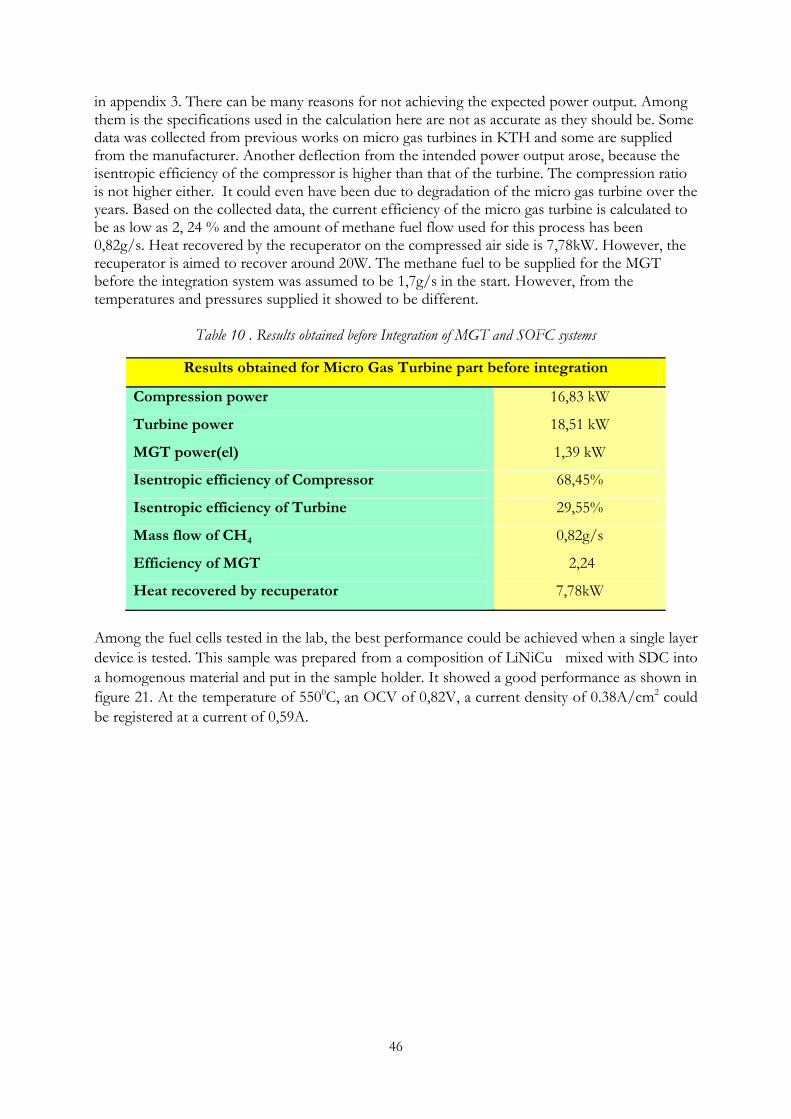
46
in appendix 3. There can be many reasons for not achieving the expected power output. Among them is the specifications used in the calculation here are not as accurate as they should be. Some data was collected from previous works on micro gas turbines in KTH and some are supplied from the manufacturer. Another deflection from the intended power output arose, because the isentropic efficiency of the compressor is higher than that of the turbine. The compression ratio is not higher either. It could even have been due to degradation of the micro gas turbine over the years. Based on the collected data, the current efficiency of the micro gas turbine is calculated to be as low as 2, 24 % and the amount of methane fuel flow used for this process has been 0,82g/s. Heat recovered by the recuperator on the compressed air side is 7,78kW. However, the recuperator is aimed to recover around 20W. The methane fuel to be supplied for the MGT before the integration system was assumed to be 1,7g/s in the start. However, from the temperatures and pressures supplied it showed to be different.
Table 10 . Results obtained before Integration of MGT and SOFC systems
Results obtained for Micro Gas Turbine part before integration
Compression power 16,83 kW
Turbine power 18,51 kW
MGT power(el) 1,39 kW
Isentropic efficiency of Compressor 68,45%
Isentropic efficiency of Turbine 29,55%
Mass flow of CH4 0,82g/s
Efficiency of MGT 2,24
Heat recovered by recuperator 7,78kW
Among the fuel cells tested in the lab, the best performance could be achieved when a single layer
device is tested. This sample was prepared from a composition of LiNiCu mixed with SDC into
a homogenous material and put in the sample holder. It showed a good performance as shown in
figure 21. At the temperature of 5500C, an OCV of 0,82V, a current density of 0.38A/cm2 could
be registered at a current of 0,59A.
47
0 50 100 150 200 250 300 350 400 450 5000
0.2
0.4
0.6
0.8
1
Voltage (
V)
Current (mA/cm2)
Performance of single layer device LiNiCu+SDC
0 50 100 150 200 250 300 350 400 450 5000
50
100
150
200
250
X: 380
Y: 225.6
Pow
er
density (
mW
/cm
2)
Polarization curve
power curve
The efficiency of this single layer device was about 65.4%. This efficiency could be achieved by
combining equations (5), (6) and (9). In addition to these, the definition of efficiency is applied.
2
2
2 2
0
2
1................ 241, /
2
12 2 ......... 241, 795 /
2
2 * 96450 * 0,82 158,178 /
158, 2520, 654
241, 795
2 ........... 0 /
795k
rxn
SOFC
O O G J kmole
O H e H O G kJ kmole
G nFE kJ kmole
H H e G kJ kmole
(54)
A three layer device with the composition of CuOSDC Na2CO3 as anode, LiNiOSDCNa2CO3 as
a cathode and SDC Na2CO3 as an electrolyte was also tested. This sample was also tested by
electrochemical impedance spectroscopy (EIS) and the plot for the test is given in figure 22. This
test could show the imaginary and real impedances as well as charges transferred during the
electrochemical reaction. Both real and imaginary impedance plot was done by the EIS analysis.
Further a plot of phase for impedance against frequency is plotted in figure 22 and figure 23.
OCV=0,88 V, I= 530 mA, operating temperature 5650C
Figure 21 . Performance of Single Layer Device LiNiCuSDC
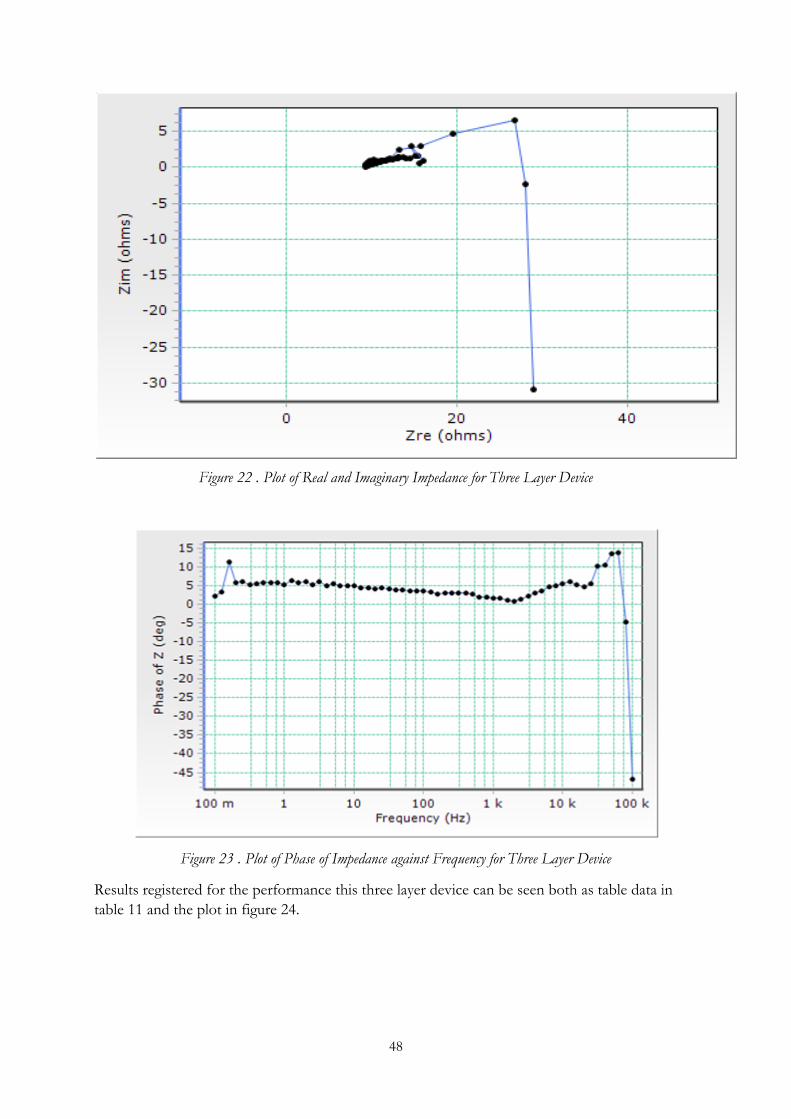
48
Figure 22 . Plot of Real and Imaginary Impedance for Three Layer Device
Figure 23 . Plot of Phase of Impedance against Frequency for Three Layer Device
Results registered for the performance this three layer device can be seen both as table data in
table 11 and the plot in figure 24.
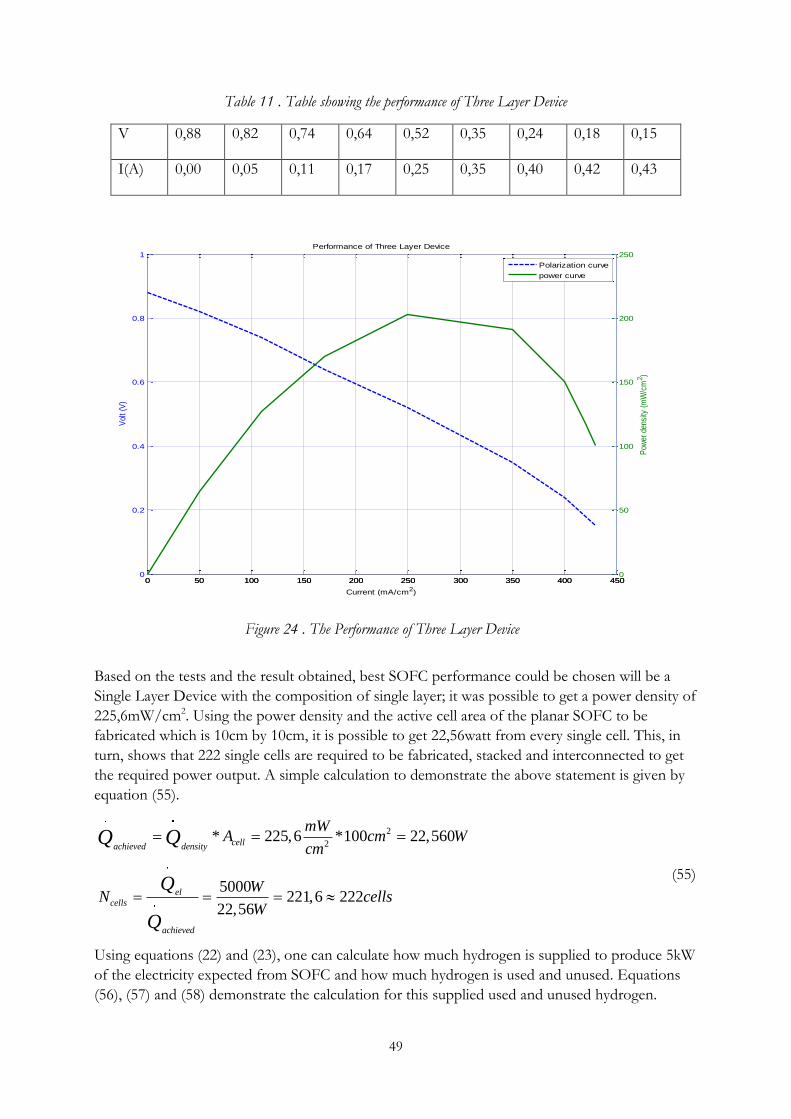
49
0 50 100 150 200 250 300 350 400 4500
0.2
0.4
0.6
0.8
1
Vol
t (V
)
Current (mA/cm2)
Performance of Three Layer Device
0 50 100 150 200 250 300 350 400 4500
50
100
150
200
250
Pow
er d
ensi
ty (
mW
/cm
2 )
Polarization curve
power curve
Table 11 . Table showing the performance of Three Layer Device
V 0,88 0,82 0,74 0,64 0,52 0,35 0,24 0,18 0,15
I(A) 0,00 0,05 0,11 0,17 0,25 0,35 0,40 0,42 0,43
Based on the tests and the result obtained, best SOFC performance could be chosen will be a
Single Layer Device with the composition of single layer; it was possible to get a power density of
225,6mW/cm2. Using the power density and the active cell area of the planar SOFC to be
fabricated which is 10cm by 10cm, it is possible to get 22,56watt from every single cell. This, in
turn, shows that 222 single cells are required to be fabricated, stacked and interconnected to get
the required power output. A simple calculation to demonstrate the above statement is given by
equation (55).
2
2* 225,6 *100 22,560
5000221,6 222
22,56
cellachieved density
el
cells
achieved
mWA cm W
cm
WN cells
W
Q
Q
Q Q
(55)
Using equations (22) and (23), one can calculate how much hydrogen is supplied to produce 5kW
of the electricity expected from SOFC and how much hydrogen is used and unused. Equations
(56), (57) and (58) demonstrate the calculation for this supplied used and unused hydrogen.
Figure 24 . The Performance of Three Layer Device
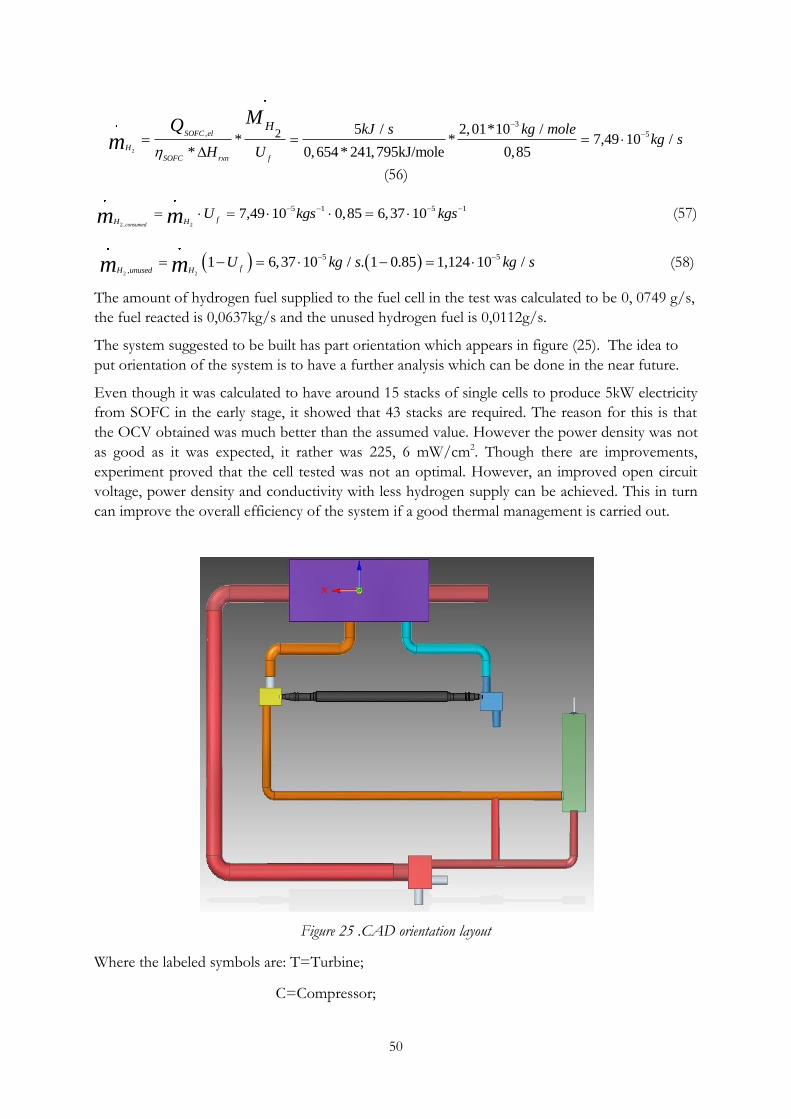
50
2
3
, 52 5 / 2,01*10 /* * 7,49 10 /
* 0,654 * 241,795kJ/mole 0,85
SOFC el
H
SOFC rxn f
H kJ s kg molekg s
H U
Q M
m
(56)
2 , 2
5 1 5 17,49 10 0,85 6,37 10
consumedfH H
U kgs kgsm m
(57)
2 2
5 5
,1 6,37 10 / . 1 0.85 1,124 10 /
fH unused HU kg s kg sm m
(58)
The amount of hydrogen fuel supplied to the fuel cell in the test was calculated to be 0, 0749 g/s,
the fuel reacted is 0,0637kg/s and the unused hydrogen fuel is 0,0112g/s.
The system suggested to be built has part orientation which appears in figure (25). The idea to
put orientation of the system is to have a further analysis which can be done in the near future.
Even though it was calculated to have around 15 stacks of single cells to produce 5kW electricity
from SOFC in the early stage, it showed that 43 stacks are required. The reason for this is that
the OCV obtained was much better than the assumed value. However the power density was not
as good as it was expected, it rather was 225, 6 mW/cm2. Though there are improvements,
experiment proved that the cell tested was not an optimal. However, an improved open circuit
voltage, power density and conductivity with less hydrogen supply can be achieved. This in turn
can improve the overall efficiency of the system if a good thermal management is carried out.
Figure 25 .CAD orientation layout
Where the labeled symbols are: T=Turbine;
C=Compressor;
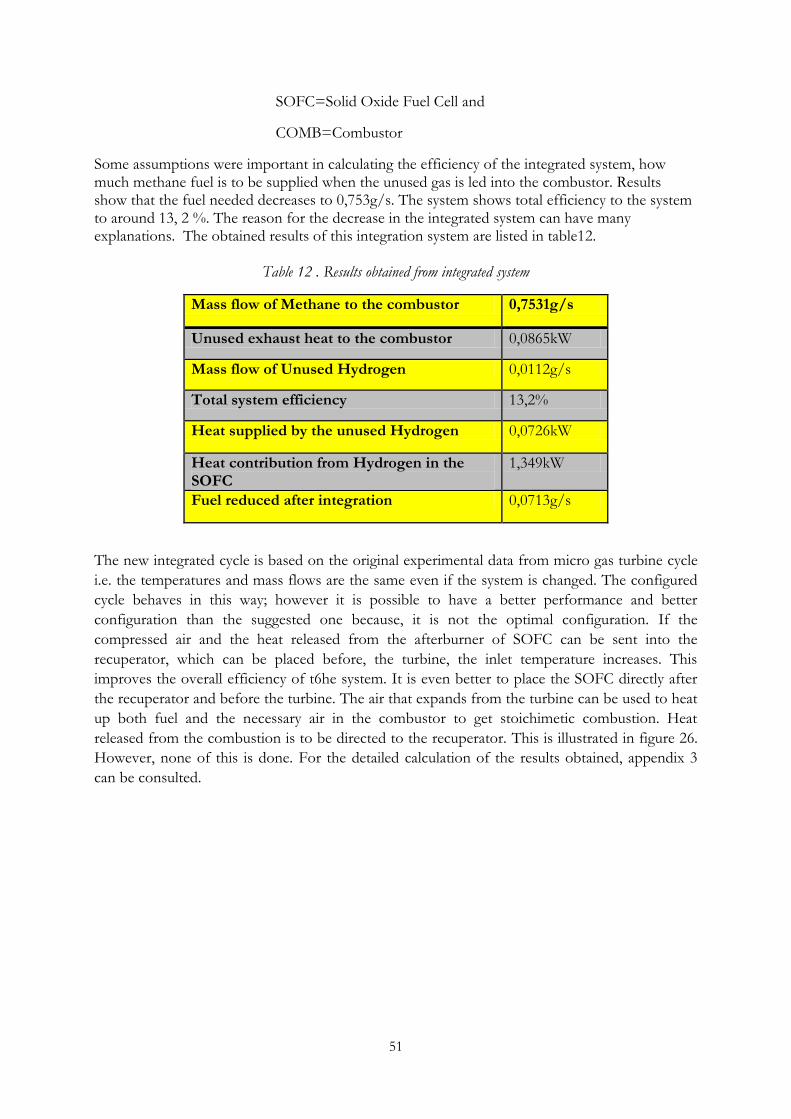
51
SOFC=Solid Oxide Fuel Cell and
COMB=Combustor
Some assumptions were important in calculating the efficiency of the integrated system, how much methane fuel is to be supplied when the unused gas is led into the combustor. Results show that the fuel needed decreases to 0,753g/s. The system shows total efficiency to the system to around 13, 2 %. The reason for the decrease in the integrated system can have many explanations. The obtained results of this integration system are listed in table12.
Table 12 . Results obtained from integrated system
Mass flow of Methane to the combustor 0,7531g/s
Unused exhaust heat to the combustor 0,0865kW
Mass flow of Unused Hydrogen 0,0112g/s
Total system efficiency 13,2%
Heat supplied by the unused Hydrogen 0,0726kW
Heat contribution from Hydrogen in the SOFC
1,349kW
Fuel reduced after integration 0,0713g/s
The new integrated cycle is based on the original experimental data from micro gas turbine cycle
i.e. the temperatures and mass flows are the same even if the system is changed. The configured
cycle behaves in this way; however it is possible to have a better performance and better
configuration than the suggested one because, it is not the optimal configuration. If the
compressed air and the heat released from the afterburner of SOFC can be sent into the
recuperator, which can be placed before, the turbine, the inlet temperature increases. This
improves the overall efficiency of t6he system. It is even better to place the SOFC directly after
the recuperator and before the turbine. The air that expands from the turbine can be used to heat
up both fuel and the necessary air in the combustor to get stoichimetic combustion. Heat
released from the combustion is to be directed to the recuperator. This is illustrated in figure 26.
However, none of this is done. For the detailed calculation of the results obtained, appendix 3
can be consulted.
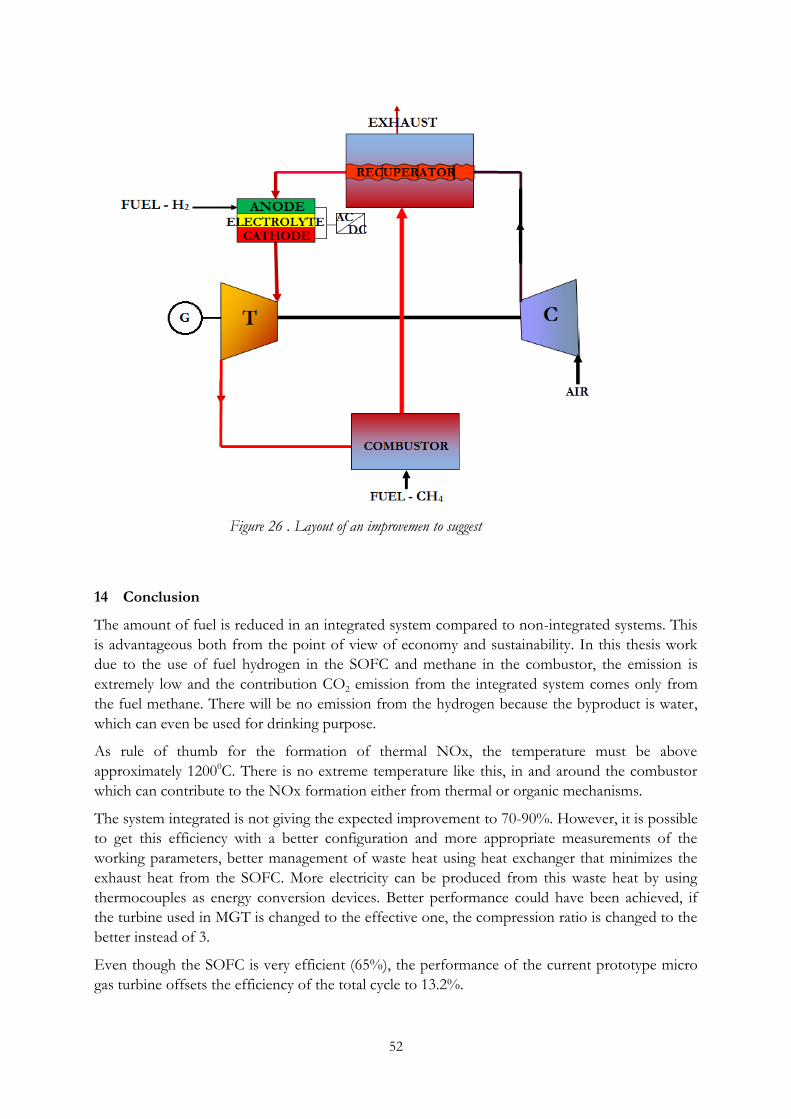
52
14 Conclusion
The amount of fuel is reduced in an integrated system compared to non-integrated systems. This
is advantageous both from the point of view of economy and sustainability. In this thesis work
due to the use of fuel hydrogen in the SOFC and methane in the combustor, the emission is
extremely low and the contribution CO2 emission from the integrated system comes only from
the fuel methane. There will be no emission from the hydrogen because the byproduct is water,
which can even be used for drinking purpose.
As rule of thumb for the formation of thermal NOx, the temperature must be above
approximately 12000C. There is no extreme temperature like this, in and around the combustor
which can contribute to the NOx formation either from thermal or organic mechanisms.
The system integrated is not giving the expected improvement to 70-90%. However, it is possible
to get this efficiency with a better configuration and more appropriate measurements of the
working parameters, better management of waste heat using heat exchanger that minimizes the
exhaust heat from the SOFC. More electricity can be produced from this waste heat by using
thermocouples as energy conversion devices. Better performance could have been achieved, if
the turbine used in MGT is changed to the effective one, the compression ratio is changed to the
better instead of 3.
Even though the SOFC is very efficient (65%), the performance of the current prototype micro
gas turbine offsets the efficiency of the total cycle to 13.2%.
Figure 26 . Layout of an improvemen to suggest

53
Though it could not be proved in this integrated system, it does not mean that the hybrid system
does not have advantages. Integrating the two environmentally friendly systems have many
advantages. The hybrid system helps to increase reliability and efficiency, reduce carbon
footprint.
15 Recommendations
The arrangements of the system have to change to get a better performance for the mentioned
reason. For example if the SOFC and Combustor are placed before the turbine. The temperature
of both fuel and air to the SOFC can be heated by electrical supply or by the heat from the
recuperator. This can be an arrangement that increases the turbine inlet temperature; the fuel
used can be heated in the recuperator and sent into the combustor so that the efficiency can be
improved. By doing so the heat entering into the combustor that reduced the overall efficiency of
the system is to be improved. Apart from this, it is also advisable to have clear and more
accurate measurement data available when designing the integrated systems. The source of error
must be eliminated to ensure more accurate results.
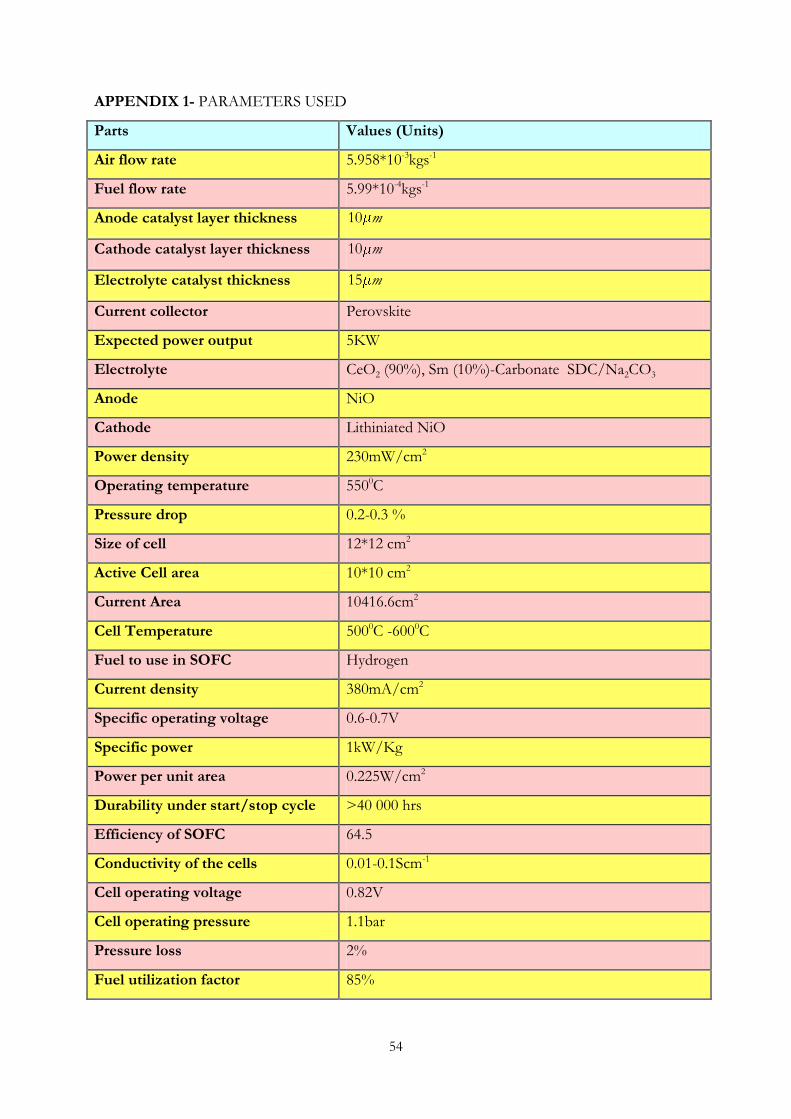
54
APPENDIX 1- PARAMETERS USED
Parts Values (Units)
Air flow rate 5.958*10-3kgs-1
Fuel flow rate 5.99*10-4kgs-1
Anode catalyst layer thickness 10 m
Cathode catalyst layer thickness 10 m
Electrolyte catalyst thickness 15 m
Current collector Perovskite
Expected power output 5KW
Electrolyte CeO2 (90%), Sm (10%)-Carbonate SDC/Na2CO3
Anode NiO
Cathode Lithiniated NiO
Power density 230mW/cm2
Operating temperature 5500C
Pressure drop 0.2-0.3 %
Size of cell 12*12 cm2
Active Cell area 10*10 cm2
Current Area 10416.6cm2
Cell Temperature 5000C -6000C
Fuel to use in SOFC Hydrogen
Current density 380mA/cm2
Specific operating voltage 0.6-0.7V
Specific power 1kW/Kg
Power per unit area 0.225W/cm2
Durability under start/stop cycle >40 000 hrs
Efficiency of SOFC 64.5
Conductivity of the cells 0.01-0.1Scm-1
Cell operating voltage 0.82V
Cell operating pressure 1.1bar
Pressure loss 2%
Fuel utilization factor 85%

55
Air fuel stoichiometric ratio 2
Number of cells 222
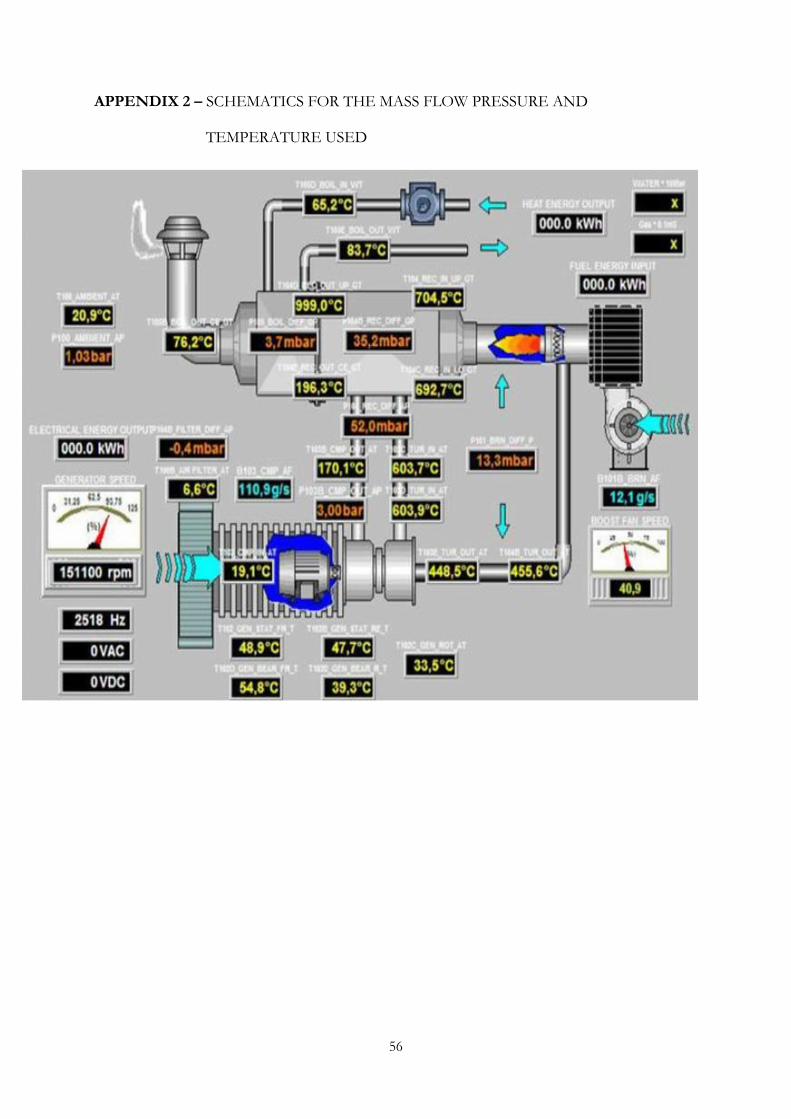
56
APPENDIX 2 – SCHEMATICS FOR THE MASS FLOW PRESSURE AND
TEMPERATURE USED
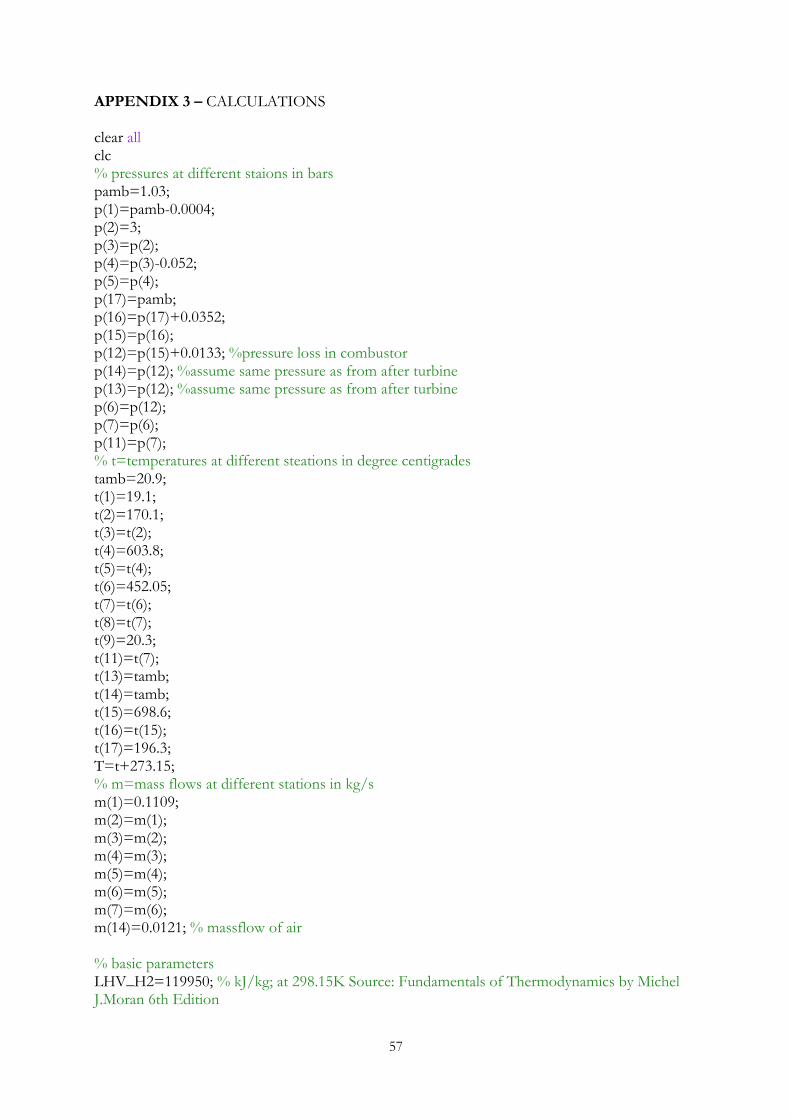
57
APPENDIX 3 – CALCULATIONS
clear all clc % pressures at different staions in bars pamb=1.03; p(1)=pamb-0.0004; p(2)=3; p(3)=p(2); p(4)=p(3)-0.052; p(5)=p(4); p(17)=pamb; p(16)=p(17)+0.0352; p(15)=p(16); p(12)=p(15)+0.0133; %pressure loss in combustor p(14)=p(12); %assume same pressure as from after turbine p(13)=p(12); %assume same pressure as from after turbine p(6)=p(12); p(7)=p(6); p(11)=p(7); % t=temperatures at different steations in degree centigrades tamb=20.9; t(1)=19.1; t(2)=170.1; t(3)=t(2); t(4)=603.8; t(5)=t(4); t(6)=452.05; t(7)=t(6); t(8)=t(7); t(9)=20.3; t(11)=t(7); t(13)=tamb; t(14)=tamb; t(15)=698.6; t(16)=t(15); t(17)=196.3; T=t+273.15; % m=mass flows at different stations in kg/s m(1)=0.1109; m(2)=m(1); m(3)=m(2); m(4)=m(3); m(5)=m(4); m(6)=m(5); m(7)=m(6); m(14)=0.0121; % massflow of air % basic parameters LHV_H2=119950; % kJ/kg; at 298.15K Source: Fundamentals of Thermodynamics by Michel J.Moran 6th Edition

58
LHV_CH4=50020;% kJ/kg; at 298.15K Source: Fundamentals of Thermodynamics by Michel J.Moran 6th Edition M_H2=2.016;%g/mole Molar mass of hydrogen M_H2O=18.015;%g/mole Molar mass of hydrogen M_O=M_H2O-M_H2;%g/mole Molar mass of oxygen atom M_O2=2*M_O;%g/mole Molar mass of oxygen M_N2=28.0134;%g/mole Molar mass of nitrogen M_a=0.79*M_N2+0.21*M_O2; % g/mole Molar mass or air approximation M_CH4=2*M_H2+12.0107; % g/mole Molar mass of methane M_CO2=M_O2+12.0107; % g/mole Molar mass of carbon dioxide % Shomate eq. parameters, Gas phase thermochemistry data Source :http://webbook.nist.gov/cgi/cbook.cgi?ID=C7727379&Units=SI&Mask=1#Thermo-Gas % hydrogento suffix h represents hydrogen,to calculate enthalpy differences at different temperature A_h=33.066178; B_h=-11.363417; C_h=11.432816; D_h=-2.772874; E_h=-0.158558; F_h=-9.980797; H_h=0; % water vapour, suffix w represents water vapour, to calculate enthalpy A_w=30.09200; B_w=6.832514; C_w=6.793435; D_w=-2.534480; E_w=0.082139; F_w=-250.8810; H_w=-241.8264; % air (79% N2 and 21%O2), suffix n represents Nitrogen and o represents % oxygen A_n=19.50583; B_n=19.88705; C_n=-8.598535; D_n=1.369784; E_n=0.527601; F_n=-4.935202; H_n=0; A_o=30.03235; B_o=8.772972; C_o=-3.988133; D_o=0.788313; E_o=-0.741599; F_o=-11.32468; H_o=0.0;
%air(valid for 100K<Oxygen<700K & 100K<Nitrogen<500K) A_n15=28.98641;

59
B_n15=1.853978; C_n15=-9.647459; D_n15=16.63537; E_n15=0.000117; F_n15=-8.671914; H_n15=0.0;
A_o17=31.32234; B_o17=-20.23531; C_o17=57.86644; D_o17=-36.50624; E_o17=-0.007374; F_o17=-8.903471; H_o17=0.0;
% CO2 (valid for 298.15K<CO2<1200K) A_c=24.99735; B_c=55.18696; C_c=-33.69137; D_c=7.948387; E_c=-0.136638; F_c=-403.6075; H_c=-393.5224;
%%% Comressor / turbine %%% eta_m=0.98; % assumed value eta_el=0.99; %assumed value kC=1.395;%Sustainable Power Generation formulas and tables on p. 23 kT=1.355; %SPG fs. p. 23
%enthalpies based on Sustainable Power Generation course table of formulas h(1)=19.2; h(2)=171.7; h(5)=633.5; h(6)=467.0; % compressor and turbine power P_C=m(1)*(h(2)-h(1)); %kW - power from the compressor P_T=m(5)*(h(5)-h(6));%kW - power from the turbine
P_GTel=(P_T*eta_m-P_C)*eta_el; % kW - power from the MGT
piC=p(2)/p(1); % compression pressure ratio ratio piT=p(5)/p(6); %turbine expansion pressure ratio
eta_isC=T(1)/(T(2)-T(1))*(piC^((kC-1)/kC)-1); % isentropic compressor
efficiency eta_isT=(T(5)-T(6))/T(5)*(piT^((kT-1)/kT)/(piT^((kT-1)/kT)^-1)); %
isentropic turbine efficiency
config=input('For MGT cycle, enter "1" and for MGT-SOFC cycle, enter "2"');
if config==1;
P_SOFCel=0;%kW
m(8)=0; m(9)=0; m(10)=0; m(11)=m(7)-m(8);

60
m(12)=m(11)+m(10); t(12)=t(11); t(10)=tamb; %not really relevant T(12)=t(12)+273.15; t12=T(12)/1000; p(8)=pamb; p(9)=pamb; p(10)=pamb;
mH2=m(9); % by definition mH2rest=0; % unused hydrogen kg/s m_w=0;
elseif config==2
P_SOFCel=5;%kW; Desired
% H2 flow calculations for SOFC UF=0.85; % Assumed fuel utilization factor n=2;% stoichiometric ratio of H2 vs O2 F=96450; % C/s; Faraday's constant Eo=0.82;% Tested open circuit voltage (OCV) Delta_H_rxn=-241.795; % %kJ/mole Enthalpy of formation for water at
554.3degC, fs p. 632in introduction to Combustion,2nd Edition By Stephen
R.Turns Delta_G=(-n*F*Eo)/1000; eta_SOFCel=Delta_G/Delta_H_rxn; % SOFC efficiency nH2=P_SOFCel/(eta_SOFCel*-Delta_H_rxn);%mole/s (H2 consumtion/reaction
rate) mH2react=(nH2*M_H2)/1000; %kg/s massflow of reacted hydrogen mH2=(mH2react/UF); %kg/s massflow of hydrogen in total mH2rest=(mH2-mH2react); %kg/s massflow of unused hydrogen
% Heat balance calculations for SOFC t_op=554.3; % Degree centigrade, operating temperature in SOFC t(10)=2*t_op-t(8);
% enthalphy for SOFC heat balance
T(8)=t(8)+273.15; T_op=t_op+273.15; T(10)=t(10)+273.15;
t8=T(8)/1000; top=T_op/1000; t10=T(10)/1000; t9_XX=(25+(25-t(9))+273.15)/1000; % dummy temperature to fit Shomate
equation. Idea: -[h(29.7C)-h(25C)]=h(20.3C)-h(25C)
% hydrogen Dh_h2= A_h*top + B_h*(top^2)/2 + C_h*(top^3)/3 + D_h*(top^4)/4 - E_h/top +
F_h - H_h; Dh_h1= A_h*t9_XX + B_h*(t9_XX^2)/2 + C_h*(t9_XX^3)/3 + D_h*(t9_XX^4)/4 -
E_h/t9_XX + F_h - H_h; dh_h=(Dh_h2 + Dh_h1)/M_H2*1000; %hydrogen h(554.3)-h(20.3)
Dh_hr2= A_h*t10 + B_h*(t10^2)/2 + C_h*(t10^3)/3 + D_h*(t10^4)/4 - E_h/t10 +
F_h - H_h;

61
Dh_hr1= A_h*top + B_h*(top^2)/2 + C_h*(top^3)/3 + D_h*(top^4)/4 - E_h/top +
F_h - H_h; dh_hr=(Dh_hr2 - Dh_hr1)/M_H2*1000; %hydrogen h(656.55)-h(554.3)
% water vapour Dh_w2= A_w*t10 + B_w*(t10^2)/2 + C_w*(t10^3)/3 + D_w*(t10^4)/4 - E_w/t10 +
F_w - H_w; Dh_w1= A_w*top + B_w*(top^2)/2 + C_w*(top^3)/3 + D_w*(top^4)/4 - E_w/top +
F_w - H_w; dh_w=(Dh_w2 - Dh_w1)/M_H2O*1000; %water vapour h(656.55)-h(554.3)
% air assumed to be composed of 79% N2 and 21%O2
Dh_an2= A_n*top + B_n*(top^2)/2 + C_n*(top^3)/3 + D_n*(top^4)/4 - E_n/top +
F_n - H_n; Dh_an1= A_n*t8 + B_n*(t8^2)/2 + C_n*(t8^3)/3 + D_n*(t8^4)/4 - E_n/t8 + F_n
- H_n; Dh_ao2= A_o*top + B_o*(top^2)/2 + C_o*(top^3)/3 + D_o*(top^4)/4 - E_o/top +
F_o - H_o; Dh_ao1= A_o*t8 + B_o*(t8^2)/2 + C_o*(t8^3)/3 + D_o*(t8^4)/4 - E_o/t8 + F_o
- H_o; dh_a=(0.79*(Dh_an2 - Dh_an1)+0.21*(Dh_ao2 - Dh_ao1))/M_a*1000; % air
h(554.3)-h(452.05)
Dh_arn2= A_n*t10 + B_n*(t10^2)/2 + C_n*(t10^3)/3 + D_n*(t10^4)/4 - E_n/t10
+ F_n - H_n; Dh_arn1= A_n*top + B_n*(top^2)/2 + C_n*(top^3)/3 + D_n*(top^4)/4 - E_n/top
+ F_n - H_n; Dh_aro2= A_o*t10 + B_o*(t10^2)/2 + C_o*(t10^3)/3 + D_o*(t10^4)/4 - E_o/t10
+ F_o - H_o; Dh_aro1= A_o*top + B_o*(top^2)/2 + C_o*(top^3)/3 + D_o*(top^4)/4 - E_o/top
+ F_o - H_o; dh_ar=(0.79*(Dh_arn2 - Dh_arn1)+0.21*(Dh_aro2 - Dh_aro1))/M_a*1000; %
air h(656.55)-h(554.3)
% mass balance for SOFC configuration m_o=mH2react*M_O/M_H2; m_w=mH2react*M_H2O/M_H2; Loss=P_SOFCel*(1-eta_SOFCel)/eta_SOFCel; m(9)=mH2; m(8)=(Loss + m_o*dh_ar - m_w*dh_w - m(9)*dh_h - mH2rest*dh_hr) / (dh_a+dh_ar); m(10)=m(8)+m(9); m(11)=m(7)-m(8); m(12)=m(11)+m(10); % temperature and enthalpy calculations at stations 10,11,12 T(11)=t(11)+273.15; t11=T(11)/1000; t(12)=t(11); %initial guess Qout=100; % to get loop started Qin=1+Qout; %to get loop started while Qin>Qout t(12)=t(12)+0.01; %Rise temperature with 0.10C

62
T(12)=t(12)+273.15; t12=T(12)/1000; %air Dh_an2= A_n*t10 + B_n*(t10^2)/2 + C_n*(t10^3)/3 + D_n*(t10^4)/4 - E_n/t10 + F_n - H_n; Dh_an1= A_n*t12 + B_n*(t12^2)/2 + C_n*(t12^3)/3 + D_n*(t12^4)/4 - E_n/t12 + F_n - H_n; Dh_ao2= A_o*t10 + B_o*(t10^2)/2 + C_o*(t10^3)/3 + D_o*(t10^4)/4 - E_o/t10 + F_o - H_o; Dh_ao1= A_o*t12 + B_o*(t12^2)/2 + C_o*(t12^3)/3 + D_o*(t12^4)/4 - E_o/t12 + F_o - H_o; dh_a1012=(0.79*(Dh_an2 - Dh_an1)+0.21*(Dh_ao2 - Dh_ao1))/M_a*1000; % air h(t(10)-h(t(12)) Dh_an2= A_n*t12 + B_n*(t12^2)/2 + C_n*(t12^3)/3 + D_n*(t12^4)/4 - E_n/t12 + F_n - H_n; Dh_an1= A_n*t11 + B_n*(t11^2)/2 + C_n*(t11^3)/3 + D_n*(t11^4)/4 - E_n/t11 + F_n - H_n; Dh_ao2= A_o*t12 + B_o*(t12^2)/2 + C_o*(t12^3)/3 + D_o*(t12^4)/4 - E_o/t12 + F_o - H_o; Dh_ao1= A_o*t11 + B_o*(t11^2)/2 + C_o*(t11^3)/3 + D_o*(t11^4)/4 - E_o/t11 + F_o - H_o; dh_a1211=(0.79*(Dh_an2 - Dh_an1)+0.21*(Dh_ao2 - Dh_ao1))/M_a*1000; % air h(t(12)-h(t(11)) % water vapour Dh_w2= A_w*t10 + B_w*(t10^2)/2 + C_w*(t10^3)/3 + D_w*(t10^4)/4 - E_w/t10 + F_w - H_w; Dh_w1= A_w*t12 + B_w*(t12^2)/2 + C_w*(t12^3)/3 + D_w*(t12^4)/4 - E_w/t12 + F_w - H_w; dh_w1012=(Dh_w2 - Dh_w1)/M_H2O*1000; %water vapour h(t(10))-h(t(12)) % hydrogen Dh_h2= A_h*t10 + B_h*(t10^2)/2 + C_h*(t10^3)/3 + D_h*(t10^4)/4 - E_h/t10 + F_h - H_h; Dh_h1= A_h*t12 + B_h*(t12^2)/2 + C_h*(t12^3)/3 + D_h*(t12^4)/4 - E_h/t12 + F_h - H_h; dh_h1012=(Dh_hr2 - Dh_hr1)/M_H2*1000; %hydrogen h(t(10))-h(t(12)) %heat balance Qout=m(11)*dh_a1211; Qin=(m(10)-mH2rest-m_w)*dh_a1012 + m_w*dh_w1012+mH2rest*dh_h1012; % pressure p(8)=p(7); p(9)=1.1; p(10)=(p(8)+p(9))/2*0.99; % 1 percent pressure loss of average inlet pressure end

63
else disp('you did not enter a correct number for desired operation') return end % Combustor calculations % T(13)=t(13)+273.15; T(14)=t(14)+273.15; T(15)=t(15)+273.15; t13=T(13)/1000; t14=T(14)/1000; t15=T(15)/1000; mCH4=0; % initial guess Qadd=0; % dummy to start loop Qrem=Qadd+1; % dummy to start loop while Qadd<Qrem mCH4=mCH4+1E-7;% kg/s % hydrogen to the combustor dh_h=(A_h*t12 + B_h*(t12^2)/2 + C_h*(t12^3)/3 + D_h*(t12^4)/4 - E_h/t12 + F_h - H_h)/M_H2*1000; %hydrogen h(t(12))-h(25) % water vapour generated in SOFC Dh_w2= A_w*t15 + B_w*(t15^2)/2 + C_w*(t15^3)/3 + D_w*(t15^4)/4 - E_w/t15 + F_w - H_w; Dh_w1= A_w*t12 + B_w*(t12^2)/2 + C_w*(t12^3)/3 + D_w*(t12^4)/4 - E_w/t12 + F_w - H_w; dh_w=(Dh_w2 - Dh_w1)/M_H2O*1000; %water vapour h(t(15))-h(t(12)) %air calculations Dh_an2= A_n*t15 + B_n*(t15^2)/2 + C_n*(t15^3)/3 + D_n*(t15^4)/4 - E_n/t15 + F_n - H_n; Dh_an1= A_n*t12 + B_n*(t12^2)/2 + C_n*(t12^3)/3 + D_n*(t12^4)/4 - E_n/t12 + F_n - H_n; Dh_ao2= A_o*t15 + B_o*(t15^2)/2 + C_o*(t15^3)/3 + D_o*(t15^4)/4 - E_o/t15 + F_o - H_o; Dh_ao1= A_o*t12 + B_o*(t12^2)/2 + C_o*(t12^3)/3 + D_o*(t12^4)/4 - E_o/t12 + F_o - H_o; dh_a1512=(0.79*(Dh_an2 - Dh_an1)+0.21*(Dh_ao2 - Dh_ao1))/M_a*1000; % air h(t(15)-h(t(12)) %air calculations Dh_an= A_n15*t14 + B_n15*(t14^2)/2 + C_n15*(t14^3)/3 + D_n15*(t14^4)/4 - E_n15/t14 + F_n15 - H_n15;

64
Dh_ao= A_o17*t14 + B_o17*(t14^2)/2 + C_o17*(t14^3)/3 + D_o17*(t14^4)/4 - E_o17/t14 + F_o17 - H_o17; dh_a14ref=abs((0.79*Dh_an+0.21*Dh_ao)/M_a*1000); % air h(t(ref)-h(t(14)) % Flue gas from H2 and CH4 combustion m_wH2CH4= mH2rest/M_H2*M_H2O + 2*mCH4/M_CH4*M_H2O ; % massflow of water vapour from combustion m_cCH4= mCH4/M_CH4*M_CO2 ; % massflow of carbon dioxide from combustion m_aref15=m(14) - 0.5*m_wH2CH4/M_H2O*M_O2 - m_cCH4/M_CO2*M_O2; %massflow of unreacted air (total air from 14 - oxygen needed for CO2 and H2O) % water from H2 and CH4 combustion Dh_w= A_w*t15 + B_w*(t15^2)/2 + C_w*(t15^3)/3 + D_w*(t15^4)/4 - E_w/t15 + F_w - H_w; dh_wref15=Dh_w/M_H2O*1000; %water vapour h(t(15))-href % CO2 from CH4 combustion Dh_c2= A_c*t15 + B_c*(t15^2)/2 + C_c*(t15^3)/3 + D_c*(t15^4)/4 - E_c/t15 + F_c - H_c; dh_cref15=Dh_c2 /M_CO2*1000; %carbon dioxide h(t(15))-href % heat to heat up unreacted air fed into combustor from tref to t15; Dh_an= A_n*t15 + B_n*(t15^2)/2 + C_n*(t15^3)/3 + D_n*(t15^4)/4 - E_n/t15 + F_n - H_n; Dh_ao= A_o*t15 + B_o*(t15^2)/2 + C_o*(t15^3)/3 + D_o*(t15^4)/4 - E_o/t15 + F_o - H_o; dh_aref15=(0.79*Dh_an +0.21*Dh_ao)/M_a*1000; % air h(t(15)-href % heat balance Qadd=mH2rest*LHV_H2 + mCH4*LHV_CH4 + mH2rest*dh_h; Qrem= m_w*dh_w + (m(12)-m_w-mH2rest)*dh_a1512 + m(14)*dh_a14ref + m_wH2CH4*dh_wref15 + m_cCH4*dh_cref15 + m_aref15*dh_aref15; end % mass flow through nodes m(13)=mCH4; m(15)=m(12)+m(13)+m(14); m(16)=m(15); m(17)=m(16); %%% cycle data %%%% P_GTel P_SOFCel Q_CH4=mCH4*LHV_CH4 %kW Q_H2=mH2*LHV_H2 %kW etaCYCLE=(P_SOFCel+P_GTel)/(Q_H2+Q_CH4)*100 % Total efficiency of the integrated system in percent % node/Stations specifications m=m' t=t' p=p'

65
BIBLIOGRAPHY:
Afzal, Muhammad. 2013. Nanocomposite Materials for New Energy Conversion Device. Stockholm :
Muhammad Afzal, 2013.
66
Allied-signal Aerospace Company. 1989. Yttria-Stabilized Zircnia Solid Oxide Electrolyte Fuel Cells,
Monolithic Solid Oxide Fuel Cells. Morgantown Energy Technology Center : University of Chicago,
1989.
Andújar, J M. and Segura, F. 2009. Fuel cells: History and updating. A walk along two centuries. Palos
de la Fra, Huelva, Spain : Elsevier Ltd, 2009.
Bagotsky, Vladimir S. 2008. Fuel Cells: Problems and Solutions. s.l. : John Wiley & Sons Inc, 2008.
Barbir, Frano. 2005. PEM Fuel Cells: Thoery and Practice. San Diego, California : Elsevier Inc,
2005. ISBN-10: 0-12-078142-5.
Bewag. 2001. The Fuel cell: A Tecnical Report. Berlin : s.n., 2001. A technical report.
Bogotsky, Vladmir s. 2008. Fuel Cell:Problems and Solutions. s.l. : John Wiley & Sons, Inc, 2008.
Bohn, Dieter. 2005. Micro Gas Turbine and Fuel Cell-A hybrid Energy Conversion System with High
Potential. Aachen, Germany : Aachen University, 2005.
Bove, Roberto. 2005. Solid Oxide Fuel Cells: Principles, Designs and State of The Art in Industries.
Petten,The Netherlands : D4-Joint Research Centre, Institute for Energy, 2005.
Brouwer, Jack. 2006. Hybrid Gas Turbine Fuel Cell System. Virginia : National Fuel Cell research
Center,University of California, 2006.
—. 2006. The Gas Turbine Handbook. Morgantown, West Virginia : s.n., 2006.
Capehart, L and Darney. 2007. Encyclopedia of Energy Engineering and Technology. s.l. : Taylor &
Francis Group, 2007. ISBN:978-0-8493-3653-0.
Carlson. 2004. Simulating Relationships between Performance, manufacturing, and Cost of Production. s.l. :
U:S: Department of Energy, 2004.
Compower. 2010. Micro Gas Turbine. Energy Department , Applied Heat and Power Division.
Stockholm : KTH University , 2010.
De Guire, Eileen J. 2003. Solid Oxide Fuel Cell. Review Article. 2003. Taken from site
http://www.seca.doe.gov and source is given.
Dieter, Bohn. Micro Gas Turbine and Fuel Cell-AHybrid Energy Conversion system with high potential.
Aachen Germany : Insitute of Steam and Gas Turbines.
EG&G. 2002. Fuel Cell HandBook. Morgantown, West Virginia : US Department of Energy,
2002.
—. 2004. Fuel Cell HandBook, 7th edition. 2004.
—. 2000. Fuel Cells HandBook. Morgantown, West Virginia : U.S. Department of Energy, 2000.
Vol. Fifth Edition.
EG&G, Technical services. 2004. Fuel Cell Hand Book. Morgantown, West verginia : s.n., 2004.
Vol. 7th Edition.
EG&G, Technical Services. 2004. Fuel Cells HandBook. Morgantown, West Virginia : U:S:
Department of Energy, 2004.
Energy, US Department of. 2011. FUEL CELL TECHNOLOGIES PROGRAM. [Online]
March 09, 2011. [Cited: 03 12, 2013.] http://www.hydrogenandfuelcells.energy.gov..

67
Erlich, Catharina. 2005. COMPEDUHPT. [Online] 2005. [Cited: 04 02, 2013.] MJ2405
Sustainable Power Generation - course material. www.compedu.net.
Gebregergis, Abrham, et al. 2009. Solid Oxide Fuel Cell Modeling. 2009. Vol. 56.
Giampaolo, Tony. 2006. Gas Turbine Handbook:Principles and Prctices. Boca Raton, USA : The
Fairmont Press,Inc, 2006. Vol. 3rd Edition.
Gou, Bei, Ki Na, Woon and Diong Bill. 2009. Fuel Cells Modeling, Control, and Application. s.l. :
Taylor and Francis Group, 2009.
Haile, Sossina M. 2003. Fuel cell materials and components. Pasadena : Elsevier Ltd, 2003. Available
on Sciencediect.com.
Hamilton, Stephanie L. 2003. The Handbook of microturbine generators. Oklahoma : PennWell
Corporation, 2003.
Handbook, Fuel Cell. 2000. Fuel Cell Handbook. Morgantown, West Virginia : U.S. Department
of Energy, 2000. Vol. Fifth Edition.
Hanlon, Paul C. 2001. Compressor Handbook. Compressor Handbook. MADrid, Mexico, sidney,
Tokyo, Toronto, Montral : The McGraw-Hill Companies, Inc., 2001.
Hoogers. 2003. Fuel Cell Technology HandBook. Washington,D.C : CRC Press LLC, 2003.
—. 2003. Fuel Cell Technology HandBook. Washington,D:C : CRC Press LLC, 2003.
Huang, Kevin and Goodenough, John B. 2009. Solid oxide fuel cell technology:Principles, performance
and operation. Boca, Raton, Boston, New York, Washington : CRC Press, 2009.
International, SAE. History of Hydrogen.
Kakac, Sadik, Liu , Hongtan and Pramuanjaroenkij, Anchasa. 2012. HEAT
EXCHANGERS:Selection, Rating, and Thermal Design. Boca Raton, FL : CRC Press Taylor and
Francis Group, 2012.
Kasagi, Shinji Kimijima and Nobuhide. 2002. Performance evaluation of gas turbine -fuel cell Hybrid
Micro Generation System. Japan : The University of Tokyo, 2002.
Khandkar. 2000. A techno-economic model for SOFC power systems. Salt lake city :
Elsevire.com, 2000.
Kulikovsky, Andrei A. 2010. Analytical Modelling of Fuel Cells. Amsterdam : Elsevier B.V, 2010.
Larminie, James and Dicks, Andrew. 2003. "Fuel Cell System Explained". s.l. : John Wiley &
Sons, 2003.
Li, Hui, et al. 2010. Prototn Exchange Membrane Fuel Cells Contamination and Mitigation Strategies.
Boca Raton : CRC Press Taylor & Francis Group, 2010. Vols. ISBN-978-1-4398-0678-4.
Li, Xianguo. 2006. Principles of Fuel cells. New York : Taylor & Francis Group, 2006.
Linstrom, P. J. and Mallard, W. G. 2013. NIST Chemistry WebBook. s.l. : National Institute of
Standard and Technology, 2013. Vol. NIST Standard Reference Database Number 69, retrieved
May 31, 2013.
Lipman, Timothy. 2004. FUEL CELL SYSTEM ECONOMICS: COMPARING THECOSTS
OF GENERATING POWER WITH STATIONARYAND MOTOR VEHICLE PEM FUEL
CELL SYSTEMS. California : University of California, 2004. Vol. 32.

68
Materials for Solid Oxide Fuel Cells. Jacobson, Allan J. 2009. Houston, Texas : Department of
Chemistry, University of Houston, 2009.
Mench, Matthew M. 2008. Fuel cell Engines. New Jersey : John Wiley & Sons.Inc., 2008.
Minh, N.Q and Takahashi, T. 1995. Science and Technology of Ceramic Fuel Cells. Amsterdam, The
Netherlands : Elsevier Science.B.V., 1995.
Minh, Nguyen Q. 1993. Ceramic Fuel cell. Los Angeles : Journal of the American Ceramic
Society, 1993.
Minh, Nguyen Q. 2004. Solid oxide fuel cell technology - features and application. Torrance, CA :
Elsevier B.V., 2004. Vol. 174.
Minh, Nguyen QUANG. 2004. Solid oxide fuel cell technology—features and Application.
Torrance CA : Elsevier, 2004, Vol. 174.
Mugerwa, N., J.M., Leo and Blomen and Michael, J. 1993. Fuel Cell System. New York : s.n.,
1993.
Parsons, EG&G Services. Fuel Cell HandBook, Fifth Edition. Morgantown, West Virginia :
Science Applications International Corporation.
R J., Byron Smith, Loganathan, Muruganandam and Shantha, Shekhar Murthy. 2010. A
Review of the Water Gas Shift Reaction Kinetics. s.l. : The Bekeley Electronic Press, 2010. Vol. 8, ISSN
1542-6580. Review R4.
Ramani, Vijay. 2006. Fuel Cell. u.o. : The Electrochemical Society Interface, 2006.
Rayment, Chris and Sherwin, Scott. 2003. Introduction to Fuel Cell Technology. Notre Dame,
USA : University of Notre, Department of Aerospace and Mechanical Engineering, 2003.
—. 2003. Introduction to Fuel Cell Technology. Notre Dame, U.S.A. : Department of Aerospace and
Mechanical Engineering, 2003.
Singhal, Subhash C and Kendall, Kevin. 2003. High Temperature Solid Oxide Fuel
cells:Fundamentals,Design and Application. Kidlington,UK : Elsevier Advanced Technology,, 2003.
Soares, Claire. 2007. Microturbines : Applications for Distributed Energy Systems. London : Elsevier
Inc, 2007.
Spiegel, Colleen. 2008. PEM Fuel Cell Modeling and Simulation Using MATLAB. ISBN 978-0-12-
374259-9. Amsterdam,Boston,Heidelberg,Tokyo : Elsevier, 2008.
The Hydrogen fuel cell power system. u.o. : http://brucelin.ca/scooters/pdf/ch3c.pdf.
Today, Fuel cell. 2012. Histroy. 2012. Adopted from webpage about the history of Fuel cells
and othermaterials.
Turns, Stephen R. 2006. An introduction to Combustion. Singapore : McGraw-Hill, 2006. Vol. 2nd
Edition. ISBN: 978-007-126072-5.
Varga, Aron. 2007. Introduction to Fuel cell Technology. MA, Cambridge,USA : Department of
Material Science and Engineering,MIT, 2007. FUEL CELL ELECTRONICS PACKAGING,
Vols. e-ISBN-13: 978-0-387-47324-6.

69
Veyo, Stephen E. 2003. Tubular SOFC Hybrid Power System. Newport Beach,CA : Siemens
Westinghouse Power Corporation, 2003. Third DOE/UN International Conference and
Workshop.
Wetley, James R, et al. 2008. Fundamentals of Momentum, Heat, and Mass Transfer. Rosewood
Drive : John Wiley & Sons, Inc., 2008. Vol. 5th Edition, ISBN-13 978-0470128688.
Zaidi, S.M. Javaid and Matsuura, Takeshi. 2009. Polymer Membranes for Fuel Cells. New York :
Springer Science + Business Media, LLC, 2009.
Zou, Chendong, Liu, Mingfei and Liu, Melin. 2012. Solid Oxide Fuel Cells. Advances in Sol-
Gel Derived Materials and Technologies. Atlanta : Center for Innovative Fuel Cell and Battery
Technologies, 2012, 2. Adopted from Sol-Gel Processing for Conventional and Alternative
Energy.


![Dual Fuel Gas Turbine[1]](https://img.pdfslide.net/doc/110x75/551502d84a7959d2028b511e/dual-fuel-gas-turbine1.jpg)