Embed Size (px)
Citation preview
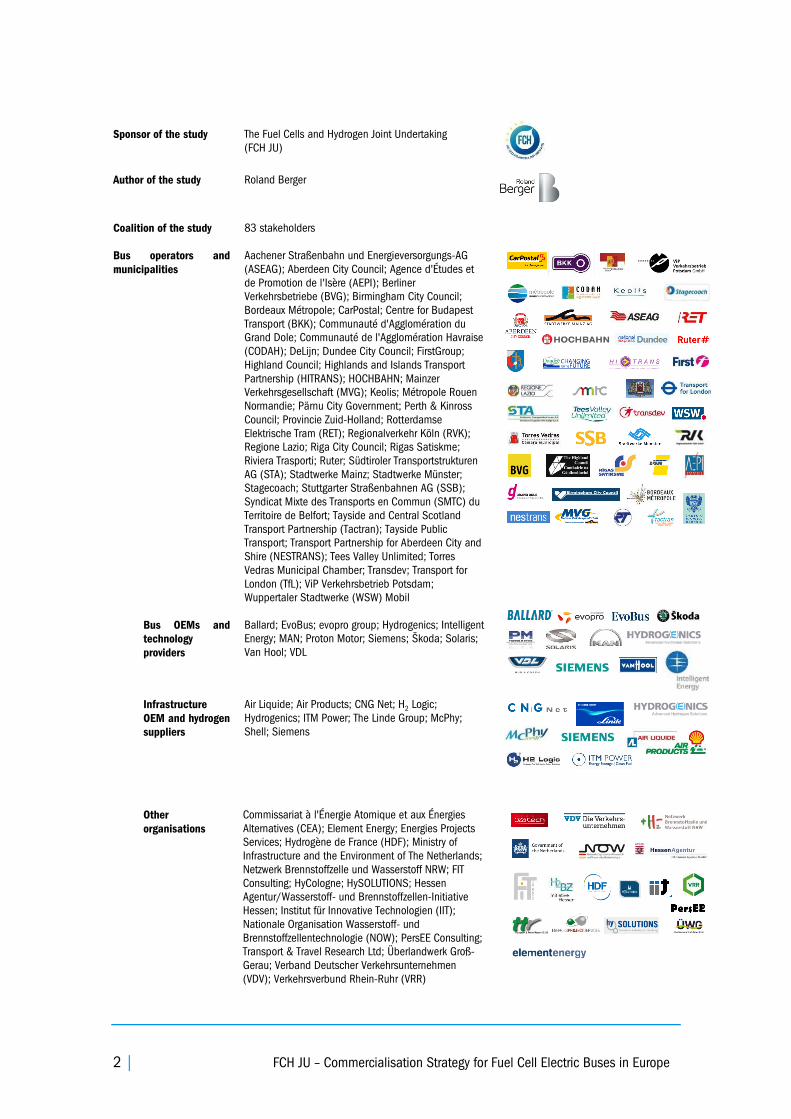
Fuel Cell Electric Buses –
Potential for Sustainable
Public Transport in Europe
A Study for the Fuel Cells and Hydrogen Joint
Undertaking
2 | FCH JU – Commercialisation Strategy for Fuel Cell Electric Buses in Europe
Sponsor of the study The Fuel Cells and Hydrogen Joint Undertaking
(FCH JU)
Author of the study Roland Berger
Coalition of the study 83 stakeholders
Bus operators and
municipalities
Aachener Straßenbahn und Energieversorgungs-AG
(ASEAG); Aberdeen City Council; Agence d'Études et
de Promotion de l'Isère (AEPI); Berliner
Verkehrsbetriebe (BVG); Birmingham City Council;
Bordeaux Métropole; CarPostal; Centre for Budapest
Transport (BKK); Communauté d'Agglomération du
Grand Dole; Communauté de l'Agglomération Havraise
(CODAH); DeLijn; Dundee City Council; FirstGroup;
Highland Council; Highlands and Islands Transport
Partnership (HITRANS); HOCHBAHN; Mainzer
Verkehrsgesellschaft (MVG); Keolis; Métropole Rouen
Normandie; Pärnu City Government; Perth & Kinross
Council; Provincie Zuid-Holland; Rotterdamse
Elektrische Tram (RET); Regionalverkehr Köln (RVK);
Regione Lazio; Riga City Council; Rigas Satiskme;
Riviera Trasporti; Ruter; Südtiroler Transportstrukturen
AG (STA); Stadtwerke Mainz; Stadtwerke Münster;
Stagecoach; Stuttgarter Straßenbahnen AG (SSB);
Syndicat Mixte des Transports en Commun (SMTC) du
Territoire de Belfort; Tayside and Central Scotland
Transport Partnership (Tactran); Tayside Public
Transport; Transport Partnership for Aberdeen City and
Shire (NESTRANS); Tees Valley Unlimited; Torres
Vedras Municipal Chamber; Transdev; Transport for
London (TfL); ViP Verkehrsbetrieb Potsdam;
Wuppertaler Stadtwerke (WSW) Mobil
Bus OEMs and
technology
providers
Ballard; EvoBus; evopro group; Hydrogenics; Intelligent
Energy; MAN; Proton Motor; Siemens; Škoda; Solaris;
Van Hool; VDL
Infrastructure
OEM and hydrogen
suppliers
Air Liquide; Air Products; CNG Net; H2 Logic;
Hydrogenics; ITM Power; The Linde Group; McPhy;
Shell; Siemens
Other
organisations
Commissariat à l'Énergie Atomique et aux Énergies
Alternatives (CEA); Element Energy; Energies Projects
Services; Hydrogène de France (HDF); Ministry of
Infrastructure and the Environment of The Netherlands;
Netzwerk Brennstoffzelle und Wasserstoff NRW; FIT
Consulting; HyCologne; HySOLUTIONS; Hessen
Agentur/Wasserstoff- und Brennstoffzellen-Initiative
Hessen; Institut für Innovative Technologien (IIT);
Nationale Organisation Wasserstoff- und
Brennstoffzellentechnologie (NOW); PersEE Consulting;
Transport & Travel Research Ltd; Überlandwerk Groß-
Gerau; Verband Deutscher Verkehrsunternehmen
(VDV); Verkehrsverbund Rhein-Ruhr (VRR)

A Study for the Fuel Cells and Hydrogen Joint Undertaking by Roland Berger | 3
Legal notice:
Roland Berger GmbH
Sederanger 1
80538 München
Contact: Heiko Ammermann: [email protected]
Authors: Heiko Ammermann, Yvonne Ruf, Simon Lange, Dragos Fundulea, André Martin
Date of publication: September 2015
Front cover pictures provided by: Daimler (EvoBus), DeLijn, Hydrogenics, Ruter
4 | FCH JU – Commercialisation Strategy for Fuel Cell Electric Buses in Europe
Executive Summary
The European Union and pioneering cities are establishing the public transport
systems of the future
The European Union is pursuing an emissions reduction agenda as well as measures to
preserve local air quality and to reduce harmful noise levels in public transport. With its
Directives on Ambient Air Quality and Cleaner Air for Europe (2008) as well as on the Promotion
of Clean and Energy-Efficient Road Transport Vehicles (2009) the EU has set first regulatory
standards in this regard. Numerous European cities and regions have started initiating change in
their public transport systems, for example with the European Climate Change Statement 2015
or in the Clean Bus Declaration of the C40 Cities Initiative.
Seeking alternatives to diesel buses is crucial for realising the emissions reduction agenda
in public transport. Although some improvements in terms of reducing harmful environmental
effects have been made with the EURO VI standard, it is expected that there is a limit to the
"cleaning" of diesel buses. Hence, cities and bus operators are under pressure to shift to electric
zero emission powertrains such as tramways, trolley, battery and fuel cell electric buses (FC
buses). Diesel buses currently dominate the public transport market due to their high
productivity, low deployment costs, technological maturity, operational reliability and flexibility,
e.g. high daily ranges, fast refuelling and no infrastructure requirement along the routes. Many
cities and bus operators are struggling with the currently conflicting objectives of shifting to zero
emission public transport while keeping operational flexibility and maintaining budgets under
control.
Fuel cell electric buses are crucial for reducing emissions while meeting
operational requirements
The potential for greening urban mobility and associated benefits is enormous. FC buses
reduce the external environmental and health costs induced by public transport. With lower
noise levels, air quality improvement and vibration mitigation, cities can cut costs, increase
property values and benefit from a "green" and modern image. Promoting the technology also
contributes to reducing the dependency on fossil fuels and securing the high-tech industrial
base and jobs in Europe.
Environmental benefits extend well beyond zero local emissions. Hydrogen as a road fuel
yields significant potential for carbon neutrality on a well-to-wheel basis along the entire
hydrogen value chain, including production and means of delivery. Hydrogen can be produced
with electricity from 100% renewable energy sources. Hence, operating FC buses can be
achieved with zero CO2 emissions along the entire hydrogen value chain. By using hydrogen
produced from renewable energy sources only, one standard FC bus would save approximately
800 tonnes of CO2 in its lifetime of 12 years compared to a conventional diesel bus.
A Study for the Fuel Cells and Hydrogen Joint Undertaking by Roland Berger | 5
FC buses offer the best productivity and operational flexibility compared to other zero
emission concepts. FC buses use power from a fuel cell stack and a battery and run on
hydrogen which can be stored and refuelled at bus depots. In terms of costs, it is expected that
FC buses compare similarly with other zero emission powertrains in the long run. However, they
are superior in terms of operational performance: With ranges of 300-450 kilometres, refuelling
times below 10 minutes and no infrastructure requirements on the routes, FC buses can be
operated like conventional diesel buses while offering all the above mentioned advantages of
electric vehicles. Hence, FC buses are the most flexible zero emission alternative.
FC buses have been operated on about 8 million kilometres in daily service in a number of
European cities over the last 10 years, demonstrating that the technology is flexible in operation
and safe. At the time of this writing, 84 FC buses are in service or about to start operations in
17 cities and regions in 8 European countries.
FC bus costs are expected to drop significantly and become increasingly
competitive
The purchase price of FC buses has come down considerably by about 75% since the
introduction of first prototypes in the 1990s. However, to enable a sustainable market-based
commercialisation all stakeholders need to push for better and cheaper FC buses, larger scale
projects as well as for an environment conducive to FC buses:
1. All stakeholders need to engage to rapidly increase the total number of units on the
roads. This is a precondition for reaching the scale effects as well as the associated
technological maturity and cost reductions.
2. The industry needs to work on further reducing FC bus as well as infrastructure and
hydrogen costs significantly. Future FC bus costs will depend on the technology pathway
followed. In a technology pathway that seizes synergies with the FC passenger car market
overall FC bus deployment costs can reduce fairly quickly with a volume uptake of FC cars.
In this case, costs could be on par with diesel buses within the next decade. Infrastructure
OEMs and hydrogen providers need to take the necessary steps to realise acceptable
costs.
3. Bus operators need to be prepared to implement large-scale demonstration projects in
the next years. In order to further mature the technology, gather operational experience
with larger FC bus fleets and stimulate market development, European bus operators and
public transport authorities need to actively engage. Several deployment projects with 20
or more FC buses by location are expected to be realised in the framework of the FC bus
coalition. Other interested bus operators and public transport authorities can benefit from
participating in the coalition, e.g. by gaining useful information and tools and preparing for
projects in cooperation with other committed locations.
4. A supportive public framework is needed. In order to support pioneering bus operators in
carrying the costs of early technology deployment, respective funding mechanisms are
required on European and national levels. Furthermore, levelling the playing field for fuel
6 | FCH JU – Commercialisation Strategy for Fuel Cell Electric Buses in Europe
costs can support FC bus rollout, as subsidies and tax exemptions currently favour the use
of diesel fuel for some operators.
A broad coalition of stakeholders supports the commercialisation of FC buses
in Europe
The European FC bus coalition aims at kick-starting the market rollout. The FC bus coalition
has been established in order to identify the required number of FC buses to be deployed to
bridge the gap towards commercialisation by reaching scale effects and reducing current costs.
It has developed a common understanding of buyers and sellers of FC buses on the required
roll-out in the next years and actively works on realising this roll-out. The coalition currently plans
to implement large-scale demonstration projects with a total of approximately 300 to 400 FC
buses in Europe by 2020. Currently, 45 public transport authorities and bus operators
representing 35 cities and regions from 12 European countries are participating in the
commercialisation initiative. The results of the first phase of this initiative are presented in this
report. In the next phases of the initiative, the coalition will continue to foster commercialisation
of FC buses. The great commitment to FC buses has been documented in a joint Letter of
Understanding of public transport authorities and bus operators which has been handed over to
the EU Commissioner of Transport at the TEN-T Days in Riga on June 23, 2015.
The industry partners are firmly committed to the initiative. Five FC bus manufacturers
participating in the coalition have signed a Letter of Understanding underlining their commitment
to the commercialisation of the technology. Participating hydrogen infrastructure OEMs and
suppliers are currently working on solutions for large-capacity infrastructure for up to 200 buses
to cater for large bus depots. In addition, the Fuel Cells and Hydrogen Joint Undertaking (FCH
JU) supports the initiative for commercialising FC buses in urban transport. It is a public-private
partnership of the European Commission, industry partners and research institutions. It
envisages putting a European funding scheme in place which will need to be supplemented by
national or local programs and funds.
Interested European cities and regions are invited to join the initiative at any time. The
coalition encourages interested bus operators and public transport authorities to engage in the
commercialisation initiative and to bring forward the change to zero emission public transport in
their cities. Becoming a partner is possible at any time.
This report provides an outlook for jointly achieving a commercialisation pathway. Building
on the findings of the 2012 FCH JU technology study on alternative powertrains for urban
buses1, this report provides an assessment of the commercialisation pathway from an
operational perspective. It reflects the actual situation in which operators deploy large scale
demonstration projects in the next years from a rather conservative angle and argues why it
makes sense to deploy FC buses now. The insights are based on first-hand data and
assessments of the coalition members from the hydrogen and fuel cell industry as well as local
governments and public transport operators in Europe.
1 Available at http://www.fch.europa.eu.
A Study for the Fuel Cells and Hydrogen Joint Undertaking by Roland Berger | 7
Table of Contents
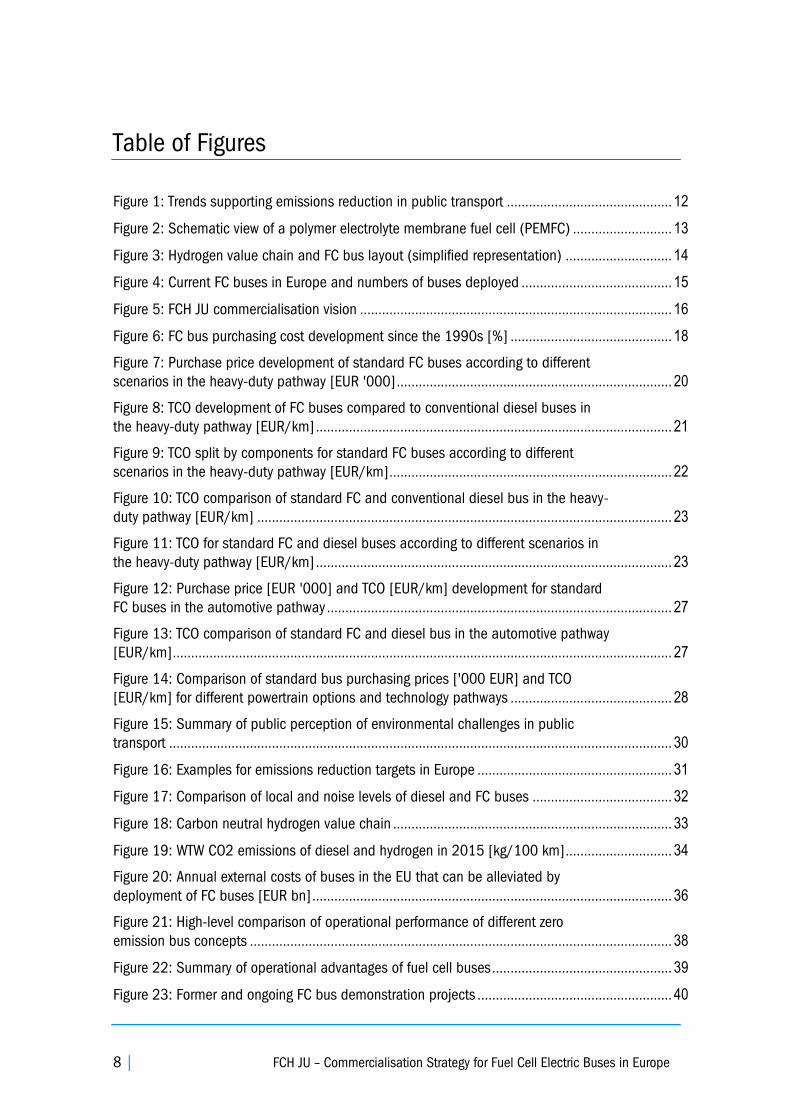
Executive Summary ........................................................................................................................ 4
Table of Contents ........................................................................................................................... 7
Table of Figures .............................................................................................................................. 8
Acronyms ..................................................................................................................................... 10
The Potential of Fuel Cell Electric Buses ...................................................................................... 11
A. Introduction – The importance of FC buses for the future of public transport ............. 11
B. Fuel cell electric buses and their projected costs .......................................................... 17
1. Future FC bus cost developments in the heavy-duty technology pathway .......................... 18
2. Future FC bus cost developments in the automotive technology pathway .......................... 25
C. Benefits of investing in FC buses now .............................................................................. 29
1. Politically – There is a push for reducing emissions in public transport in Europe .............. 29
2. Environmentally – FC buses are electric buses which significantly reduce emissions ......... 32
3. Economically – FC buses reduce external costs of public transport .................................... 36
4. Operationally – FC buses are the most flexible zero emission option ................................. 38
D. FC bus coalition and expected deployment of FC buses ................................................. 42
E. Next steps and how to get involved in the FC bus coalition ........................................... 49
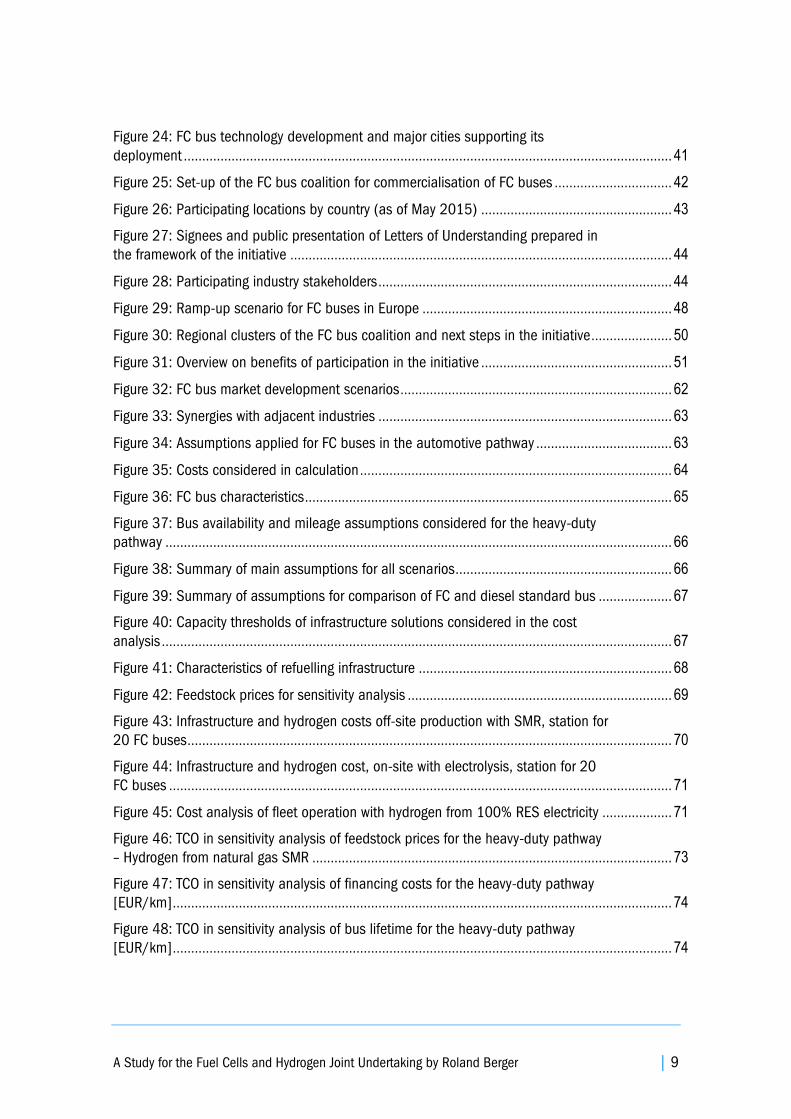
Annex ........................................................................................................................................... 52
Annex 1 – Letter of Understanding of Public Transport Operators and Public Authorities ............ 53
Annex 2 – Letter of Understanding of bus OEMs .......................................................................... 58
Annex 3 – Cost analysis principles, methodology and assumptions............................................ 61
Annex 4 – Detailed cost results infrastructure and hydrogen ....................................................... 70
Annex 5 – Sensitivity analysis ...................................................................................................... 73
8 | FCH JU – Commercialisation Strategy for Fuel Cell Electric Buses in Europe
Table of Figures
Figure 1: Trends supporting emissions reduction in public transport ............................................. 12
Figure 2: Schematic view of a polymer electrolyte membrane fuel cell (PEMFC) ........................... 13
Figure 3: Hydrogen value chain and FC bus layout (simplified representation) ............................. 14
Figure 4: Current FC buses in Europe and numbers of buses deployed ......................................... 15
Figure 5: FCH JU commercialisation vision ..................................................................................... 16
Figure 6: FC bus purchasing cost development since the 1990s [%] ............................................ 18
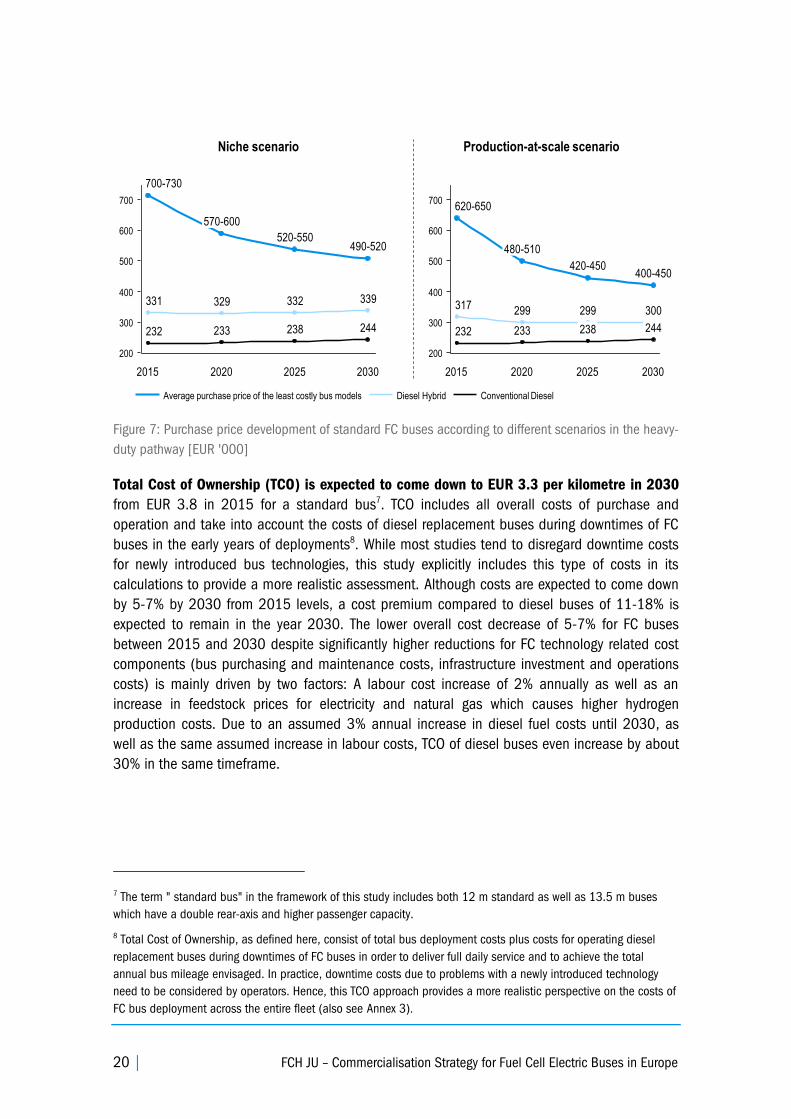
Figure 7: Purchase price development of standard FC buses according to different
scenarios in the heavy-duty pathway [EUR '000] ........................................................................... 20
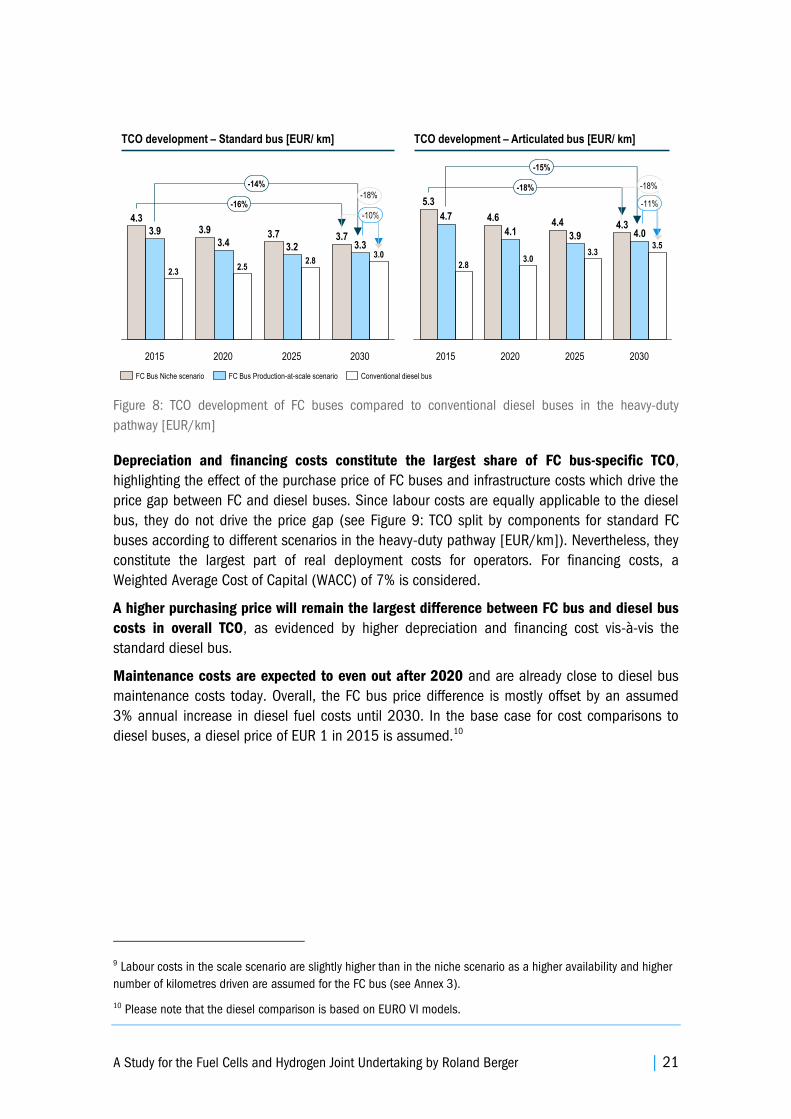
Figure 8: TCO development of FC buses compared to conventional diesel buses in
the heavy-duty pathway [EUR/km] ................................................................................................. 21
Figure 9: TCO split by components for standard FC buses according to different
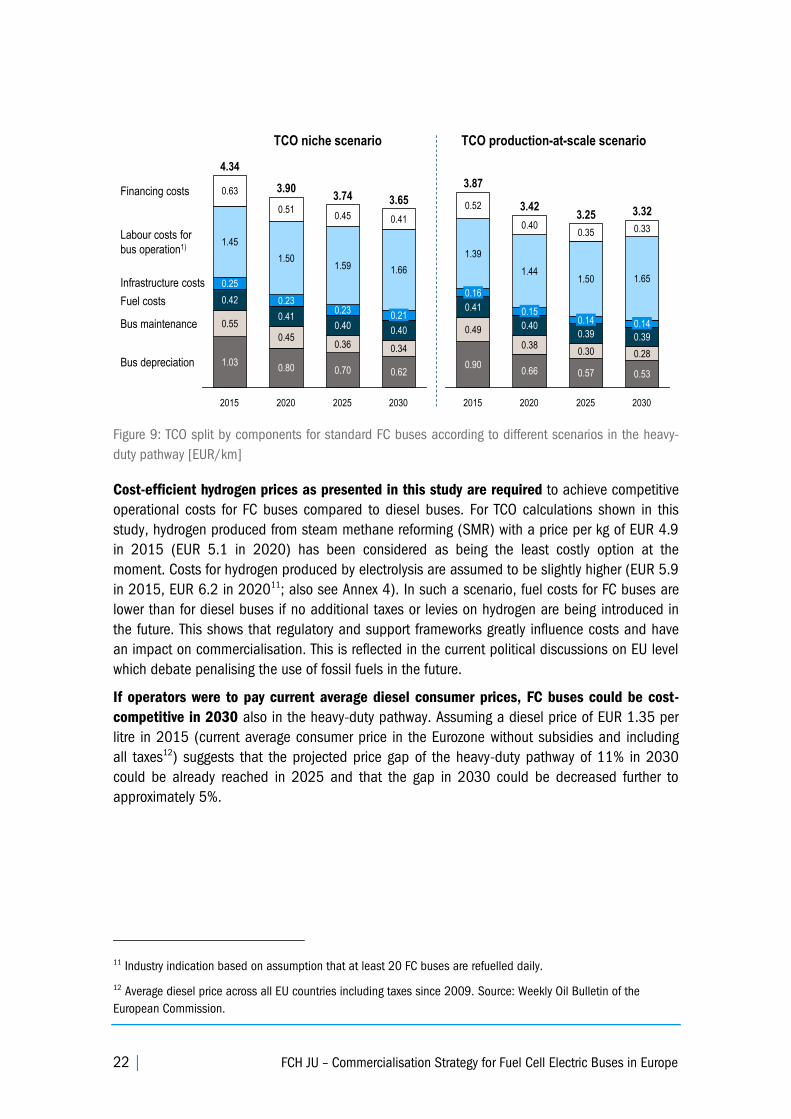
scenarios in the heavy-duty pathway [EUR/km] ............................................................................. 22
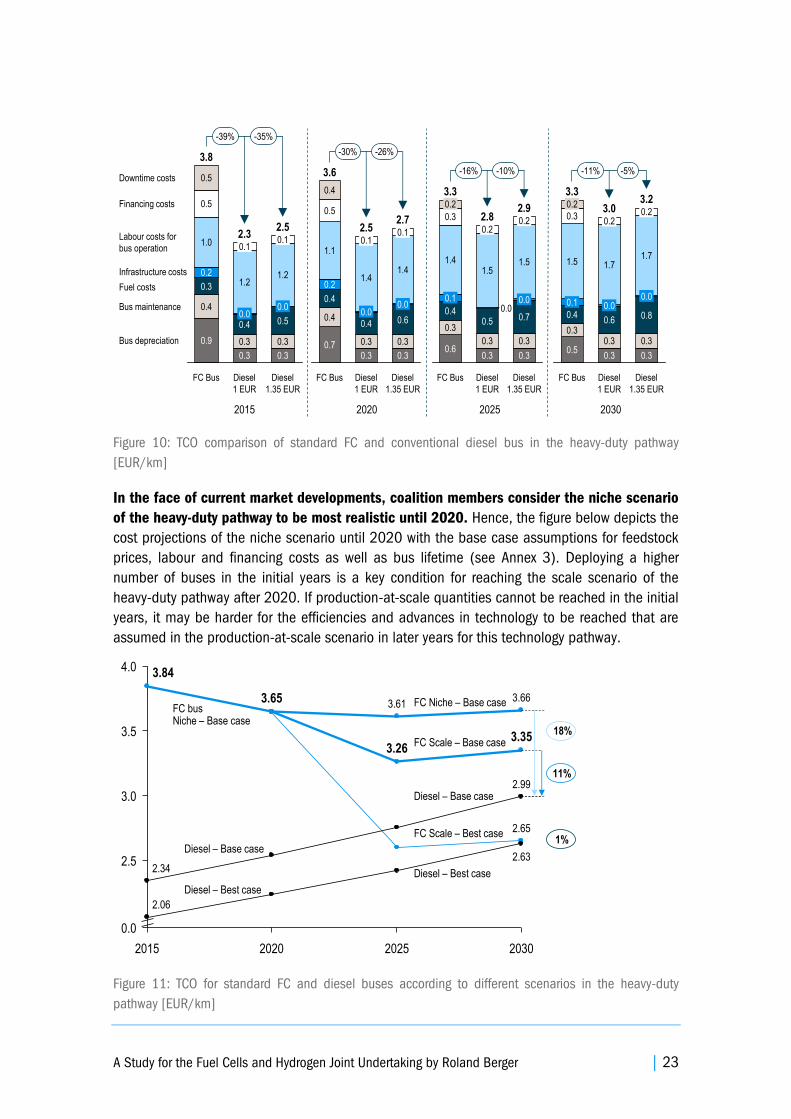
Figure 10: TCO comparison of standard FC and conventional diesel bus in the heavy-
duty pathway [EUR/km] ................................................................................................................. 23
Figure 11: TCO for standard FC and diesel buses according to different scenarios in
the heavy-duty pathway [EUR/km] ................................................................................................. 23
Figure 12: Purchase price [EUR '000] and TCO [EUR/km] development for standard
FC buses in the automotive pathway .............................................................................................. 27
Figure 13: TCO comparison of standard FC and diesel bus in the automotive pathway
[EUR/km] ........................................................................................................................................ 27
Figure 14: Comparison of standard bus purchasing prices ['000 EUR] and TCO
[EUR/km] for different powertrain options and technology pathways ............................................ 28
Figure 15: Summary of public perception of environmental challenges in public
transport ......................................................................................................................................... 30
Figure 16: Examples for emissions reduction targets in Europe ..................................................... 31
Figure 17: Comparison of local and noise levels of diesel and FC buses ...................................... 32
Figure 18: Carbon neutral hydrogen value chain ............................................................................ 33
Figure 19: WTW CO2 emissions of diesel and hydrogen in 2015 [kg/100 km] ............................. 34
Figure 20: Annual external costs of buses in the EU that can be alleviated by
deployment of FC buses [EUR bn] .................................................................................................. 36
Figure 21: High-level comparison of operational performance of different zero
emission bus concepts ................................................................................................................... 38
Figure 22: Summary of operational advantages of fuel cell buses ................................................. 39
Figure 23: Former and ongoing FC bus demonstration projects ..................................................... 40
A Study for the Fuel Cells and Hydrogen Joint Undertaking by Roland Berger | 9
Figure 24: FC bus technology development and major cities supporting its
deployment ..................................................................................................................................... 41
Figure 25: Set-up of the FC bus coalition for commercialisation of FC buses ................................ 42
Figure 26: Participating locations by country (as of May 2015) .................................................... 43
Figure 27: Signees and public presentation of Letters of Understanding prepared in
the framework of the initiative ........................................................................................................ 44
Figure 28: Participating industry stakeholders ................................................................................ 44
Figure 29: Ramp-up scenario for FC buses in Europe .................................................................... 48
Figure 30: Regional clusters of the FC bus coalition and next steps in the initiative ...................... 50
Figure 31: Overview on benefits of participation in the initiative .................................................... 51
Figure 32: FC bus market development scenarios .......................................................................... 62
Figure 33: Synergies with adjacent industries ................................................................................ 63
Figure 34: Assumptions applied for FC buses in the automotive pathway ..................................... 63
Figure 35: Costs considered in calculation ..................................................................................... 64
Figure 36: FC bus characteristics .................................................................................................... 65
Figure 37: Bus availability and mileage assumptions considered for the heavy-duty
pathway .......................................................................................................................................... 66
Figure 38: Summary of main assumptions for all scenarios ........................................................... 66
Figure 39: Summary of assumptions for comparison of FC and diesel standard bus .................... 67
Figure 40: Capacity thresholds of infrastructure solutions considered in the cost
analysis ........................................................................................................................................... 67
Figure 41: Characteristics of refuelling infrastructure ..................................................................... 68
Figure 42: Feedstock prices for sensitivity analysis ........................................................................ 69
Figure 43: Infrastructure and hydrogen costs off-site production with SMR, station for
20 FC buses .................................................................................................................................... 70
Figure 44: Infrastructure and hydrogen cost, on-site with electrolysis, station for 20
FC buses ......................................................................................................................................... 71
Figure 45: Cost analysis of fleet operation with hydrogen from 100% RES electricity ................... 71
Figure 46: TCO in sensitivity analysis of feedstock prices for the heavy-duty pathway
– Hydrogen from natural gas SMR .................................................................................................. 73
Figure 47: TCO in sensitivity analysis of financing costs for the heavy-duty pathway
[EUR/km] ........................................................................................................................................ 74
Figure 48: TCO in sensitivity analysis of bus lifetime for the heavy-duty pathway
[EUR/km] ........................................................................................................................................ 74
10 | FCH JU – Commercialisation Strategy for Fuel Cell Electric Buses in Europe
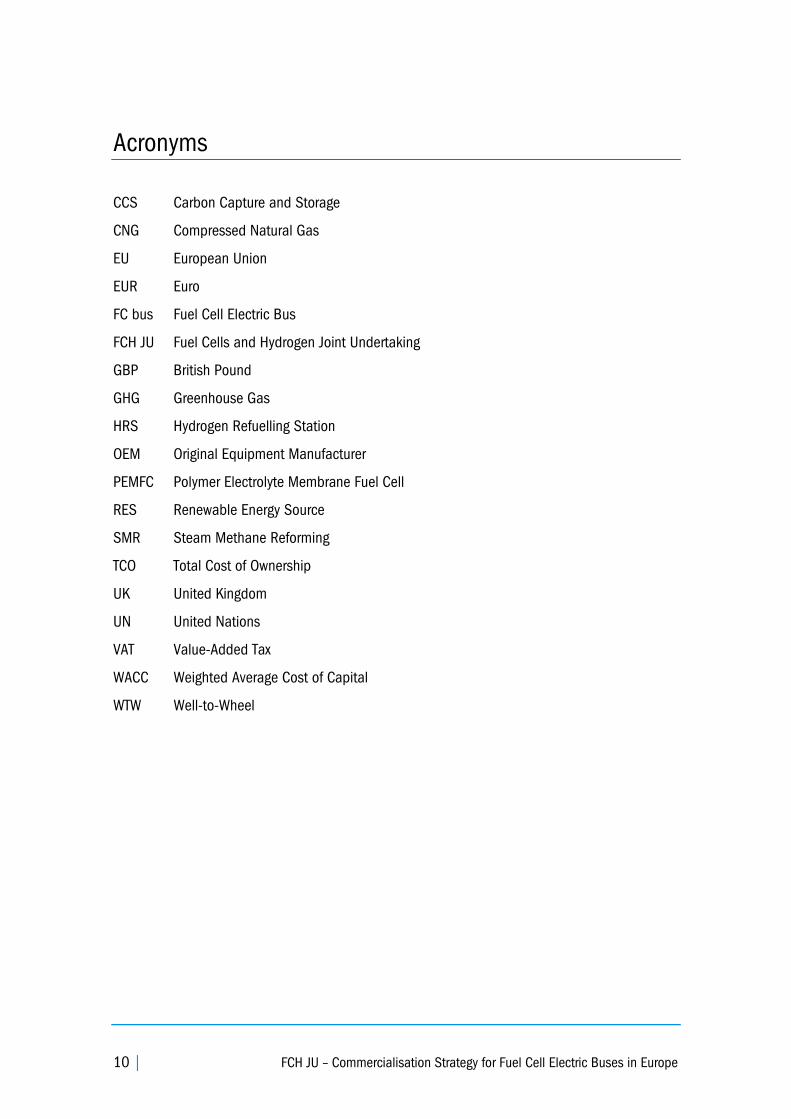
Acronyms
CCS Carbon Capture and Storage
CNG Compressed Natural Gas
EU European Union
EUR Euro
FC bus Fuel Cell Electric Bus
FCH JU Fuel Cells and Hydrogen Joint Undertaking
GBP British Pound
GHG Greenhouse Gas
HRS Hydrogen Refuelling Station
OEM Original Equipment Manufacturer
PEMFC Polymer Electrolyte Membrane Fuel Cell
RES Renewable Energy Source
SMR Steam Methane Reforming
TCO Total Cost of Ownership
UK United Kingdom
UN United Nations
VAT Value-Added Tax
WACC Weighted Average Cost of Capital
WTW Well-to-Wheel
A Study for the Fuel Cells and Hydrogen Joint Undertaking by Roland Berger | 11
The Potential of Fuel Cell
Electric Buses
A. Introduction – The importance of FC buses for the future
of public transport
There is a regulatory push for reducing emissions in public transport in Europe
The European Union has set itself ambitious targets for reducing emissions in the years
ahead. For 2050, EU leaders have defined the goal of reducing Europe's greenhouse gas (GHG)
emissions by 80% compared to 1990 levels; by 2030, a reduction of at least 40% of domestic
GHG emissions shall be reached2. In order to meet these overall climate targets, the European
Commission stipulated in its 2011 White Paper that GHG emissions from transport will have to
be cut by at least 60% by 2050 compared to 19903. Emissions reduction and energy
sustainability are also key pillars of the European Energy Union that the European Council
decided to create in 2014. At the same time, improvement of local air quality and reduction of
noise pollution are important goals for the EU and its member states, as for example stated in
the Directive on Ambient Air Quality and Cleaner Air for Europe (2008). With the introduction of
the EURO VI standard for buses, significant improvements for reducing local emissions have
been reached; however, such emissions are still not completely avoided. Therefore, stricter
regulations are expected to be introduced on European, national and local levels that require
further emissions reductions or penalise the cause of CO2 and local emissions.
European countries are rethinking public transportation. Promoted by trends such as
urbanisation, a shift in societal values towards more sustainability and the need to increase
energy security as well as a more holistic perspective on costs, reducing emissions in public
transport is placed firmly on the agenda of national and local governments in Europe. Some
countries, e.g. the Netherlands, have already adopted national targets for reducing public
transport emissions. Numerous European cities and regions have committed to initiate change
in their public transport systems, for example with the European Climate Change Statement
2015 or in the Clean Bus Declaration of the C40 Cities Initiative.
2 European Council Conclusions on the 2030 Climate and Energy Policy Framework (23 and 24 October 2014). 3 Roadmap to a Single European Transport Area – Towards a competitive and resource efficient transport system
(2011).
12 | FCH JU – Commercialisation Strategy for Fuel Cell Electric Buses in Europe
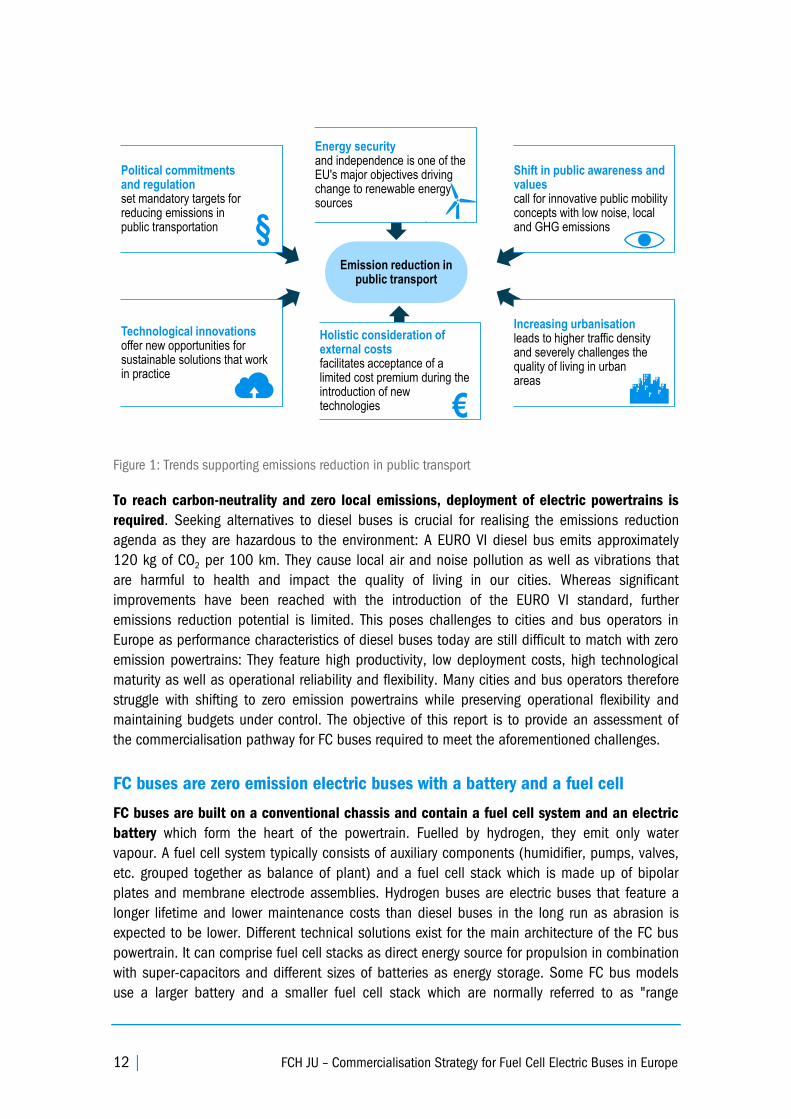
Figure 1: Trends supporting emissions reduction in public transport
To reach carbon-neutrality and zero local emissions, deployment of electric powertrains is
required. Seeking alternatives to diesel buses is crucial for realising the emissions reduction
agenda as they are hazardous to the environment: A EURO VI diesel bus emits approximately
120 kg of CO2 per 100 km. They cause local air and noise pollution as well as vibrations that
are harmful to health and impact the quality of living in our cities. Whereas significant
improvements have been reached with the introduction of the EURO VI standard, further
emissions reduction potential is limited. This poses challenges to cities and bus operators in
Europe as performance characteristics of diesel buses today are still difficult to match with zero
emission powertrains: They feature high productivity, low deployment costs, high technological
maturity as well as operational reliability and flexibility. Many cities and bus operators therefore
struggle with shifting to zero emission powertrains while preserving operational flexibility and
maintaining budgets under control. The objective of this report is to provide an assessment of
the commercialisation pathway for FC buses required to meet the aforementioned challenges.
FC buses are zero emission electric buses with a battery and a fuel cell
FC buses are built on a conventional chassis and contain a fuel cell system and an electric
battery which form the heart of the powertrain. Fuelled by hydrogen, they emit only water
vapour. A fuel cell system typically consists of auxiliary components (humidifier, pumps, valves,
etc. grouped together as balance of plant) and a fuel cell stack which is made up of bipolar
plates and membrane electrode assemblies. Hydrogen buses are electric buses that feature a
longer lifetime and lower maintenance costs than diesel buses in the long run as abrasion is
expected to be lower. Different technical solutions exist for the main architecture of the FC bus
powertrain. It can comprise fuel cell stacks as direct energy source for propulsion in combination
with super-capacitors and different sizes of batteries as energy storage. Some FC bus models
use a larger battery and a smaller fuel cell stack which are normally referred to as "range
Emission reduction in public transport
Political commitments and regulation set mandatory targets for reducing emissions in public transportation
Holistic consideration of external costs facilitates acceptance of a limited cost premium during the introduction of new technologies €
Shift in public awareness and values call for innovative public mobility concepts with low noise, local and GHG emissions
Increasing urbanisation leads to higher traffic density and severely challenges the quality of living in urban areas
Technological innovations offer new opportunities for sustainable solutions that work in practice
Energy security and independence is one of the EU's major objectives driving change to renewable energy sources
A Study for the Fuel Cells and Hydrogen Joint Undertaking by Roland Berger | 13
extenders"; the analysis presented in this report focused on fuel-cell dominant powertrains only.
The specific technical solutions used will largely determine the future cost development. Below
we depict cost projections for two technological pathways; however, other approaches might
emerge in the future as well.
The fuel cell converts chemical energy of hydrogen into electrical energy. The general
operating principle is as follows: Hydrogen is fed into the fuel cell anode where it is split into
protons (H+) and electrons (e-) by means of a catalyst. The membrane lets only protons (H+)
pass; the electrons (e-) are forced to follow an external circuit, creating a flow of electricity.
Oxygen from ambient air is fed into the fuel cell at the cathode. Oxygen, electrons from the
external circuit and protons combine to form water and heat. To achieve sufficient electrical
power to propel a vehicle, multiple cells have to be compiled into a fuel cell stack. The leading
fuel cell type for automotive applications is the polymer electrolyte membrane fuel cell (PEMFC).
Figure 2: Schematic view of a polymer electrolyte membrane fuel cell (PEMFC)
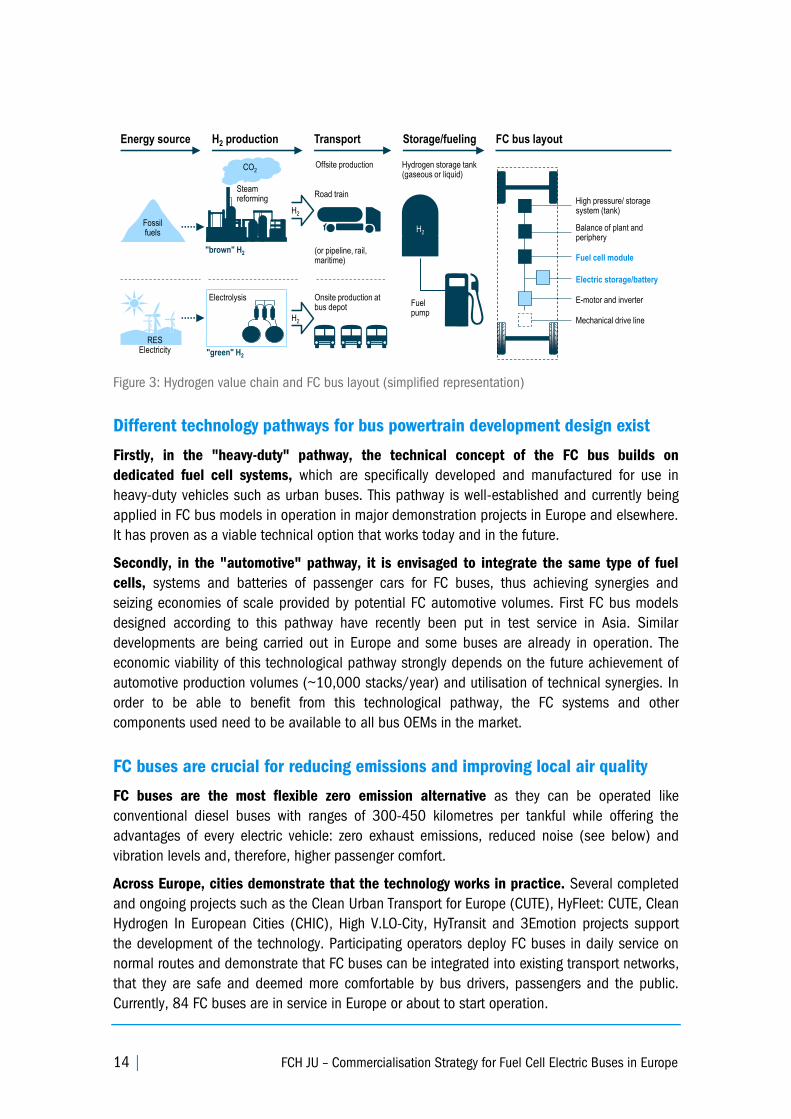
Hydrogen can be produced from various sources with steam methane reforming and water
electrolysis being investigated in this study: Steam methane reforming is based on gas as
feedstock (e.g. natural gas, methane gas, biogas, etc.) while water electrolysis uses electricity as
feedstock. Hydrogen can be trucked in by suppliers or produced on site with electrolysers at bus
depots. Aboard the buses, hydrogen is normally stored in tanks on the roof. Hydrogen refuelling
and storage infrastructure for the whole fleet is typically situated at bus depots. Further
information on hydrogen production can be found in Chapter C.
Net reaction: 2H2 + O2➨ 2H2O
1 Hydrogen is fed to the anode of the fuel cell
At the cathode side, oxygen from the air, electrons
from the external circuit and protons combine to form
water and heat
Hydrogen is distributed to the gas diffusion layer with
the catalyst2
Hydrogen comes into contact with the catalyst where
the hydrogen is split into protons and electrons3
Only the protons pass through the membrane; the
electrons are retained and forced to follow an
external circuit, creating a flow of electricity
4
Oxygen is fed to the cathode of the fuel cell5
6
Bi-polar
plate (BPP)
(Anode)
Gas diffusion layer
(GDL) with
catalyst layer
Polymer
electrolyte
membrane (PEM)1)
Gas diffusion layer
(GDL) with
catalyst layer
Bi-polar
plate (BPP)
(Cathode)
–e
–e –e
–e
Hydrogen in Oxygen in
–e
–e
–e +H–O–
–O–
Heat &
water out
1
2 3
5
Electrical energy
–e+H
–e
➨
Excess
hydrogen out
Electron flow
1) Also: proton exchange membrane
Membrane electrode assembly (MEA)
6
2H2
Reduction: O2 + 4H+ + 4e–➨ 2H2OOxidation: 2H2➨ 4H+ + 4e–
+H+H
4
O2
14 | FCH JU – Commercialisation Strategy for Fuel Cell Electric Buses in Europe
Figure 3: Hydrogen value chain and FC bus layout (simplified representation)
Different technology pathways for bus powertrain development design exist
Firstly, in the "heavy-duty" pathway, the technical concept of the FC bus builds on
dedicated fuel cell systems, which are specifically developed and manufactured for use in
heavy-duty vehicles such as urban buses. This pathway is well-established and currently being
applied in FC bus models in operation in major demonstration projects in Europe and elsewhere.
It has proven as a viable technical option that works today and in the future.
Secondly, in the "automotive" pathway, it is envisaged to integrate the same type of fuel
cells, systems and batteries of passenger cars for FC buses, thus achieving synergies and
seizing economies of scale provided by potential FC automotive volumes. First FC bus models
designed according to this pathway have recently been put in test service in Asia. Similar
developments are being carried out in Europe and some buses are already in operation. The
economic viability of this technological pathway strongly depends on the future achievement of
automotive production volumes (~10,000 stacks/year) and utilisation of technical synergies. In
order to be able to benefit from this technological pathway, the FC systems and other
components used need to be available to all bus OEMs in the market.
FC buses are crucial for reducing emissions and improving local air quality
FC buses are the most flexible zero emission alternative as they can be operated like
conventional diesel buses with ranges of 300-450 kilometres per tankful while offering the
advantages of every electric vehicle: zero exhaust emissions, reduced noise (see below) and
vibration levels and, therefore, higher passenger comfort.
Across Europe, cities demonstrate that the technology works in practice. Several completed
and ongoing projects such as the Clean Urban Transport for Europe (CUTE), HyFleet: CUTE, Clean
Hydrogen In European Cities (CHIC), High V.LO-City, HyTransit and 3Emotion projects support
the development of the technology. Participating operators deploy FC buses in daily service on
normal routes and demonstrate that FC buses can be integrated into existing transport networks,
that they are safe and deemed more comfortable by bus drivers, passengers and the public.
Currently, 84 FC buses are in service in Europe or about to start operation.
CO2
Steamreforming
"brown" H2
Road train
H2
Hydrogen storage tank (gaseous or liquid)
Fuelpump
Electrolysis
(or pipeline, rail, maritime)
H2
Fossilfuels
H2
"green" H2
RES Electricity
Offsite production
Onsite production at bus depot
Energy source FC bus layoutH2 production Transport Storage/fueling
High pressure/ storage system (tank)
Fuel cell module
E-motor and inverter
Mechanical drive line
Electric storage/battery
Balance of plant and periphery
A Study for the Fuel Cells and Hydrogen Joint Undertaking by Roland Berger | 15
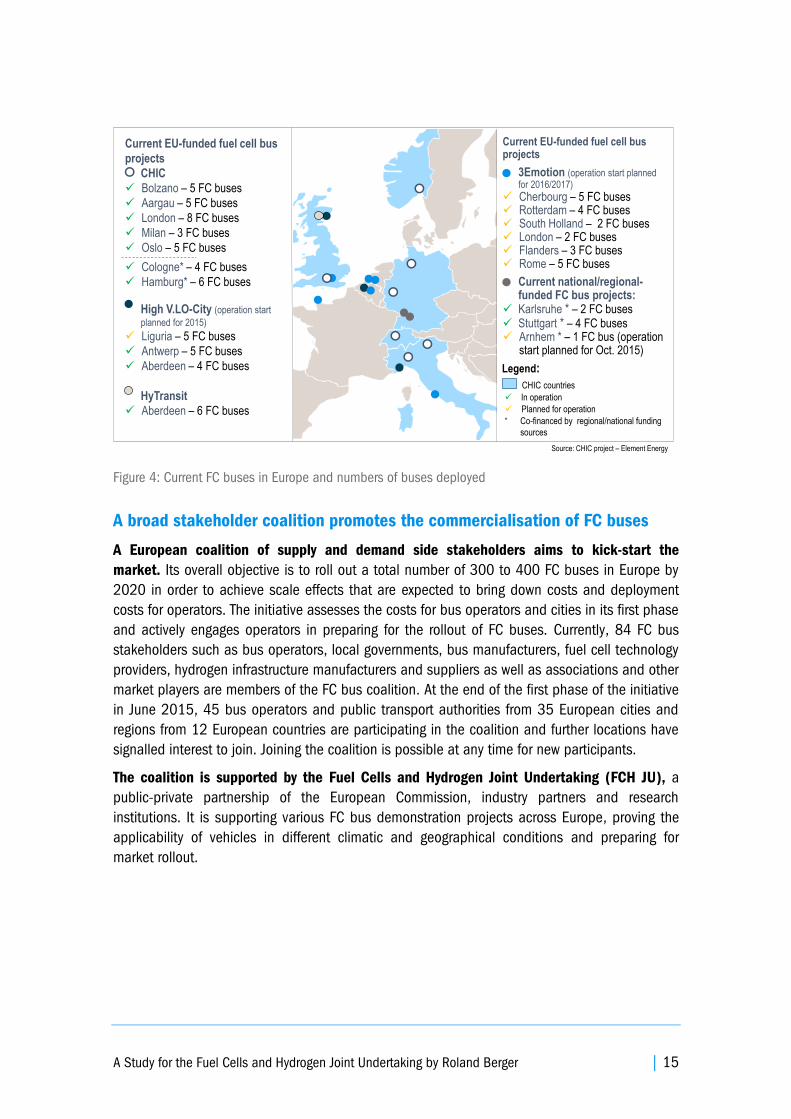
Figure 4: Current FC buses in Europe and numbers of buses deployed
A broad stakeholder coalition promotes the commercialisation of FC buses
A European coalition of supply and demand side stakeholders aims to kick-start the
market. Its overall objective is to roll out a total number of 300 to 400 FC buses in Europe by
2020 in order to achieve scale effects that are expected to bring down costs and deployment
costs for operators. The initiative assesses the costs for bus operators and cities in its first phase
and actively engages operators in preparing for the rollout of FC buses. Currently, 84 FC bus
stakeholders such as bus operators, local governments, bus manufacturers, fuel cell technology
providers, hydrogen infrastructure manufacturers and suppliers as well as associations and other
market players are members of the FC bus coalition. At the end of the first phase of the initiative
in June 2015, 45 bus operators and public transport authorities from 35 European cities and
regions from 12 European countries are participating in the coalition and further locations have
signalled interest to join. Joining the coalition is possible at any time for new participants.
The coalition is supported by the Fuel Cells and Hydrogen Joint Undertaking (FCH JU), a
public-private partnership of the European Commission, industry partners and research
institutions. It is supporting various FC bus demonstration projects across Europe, proving the
applicability of vehicles in different climatic and geographical conditions and preparing for
market rollout.
Current EU-funded fuel cell bus projects
3Emotion (operation start planned for 2016/2017)
Cherbourg – 5 FC buses Rotterdam – 4 FC buses South Holland – 2 FC buses London – 2 FC buses Flanders – 3 FC buses Rome – 5 FC buses
Current national/regional-funded FC bus projects:
Karlsruhe * – 2 FC buses Stuttgart * – 4 FC buses Arnhem * – 1 FC bus (operation
start planned for Oct. 2015)
Current EU-funded fuel cell bus
projects
CHIC
Bolzano – 5 FC buses
Aargau – 5 FC buses
London – 8 FC buses
Milan – 3 FC buses
Oslo – 5 FC buses
Cologne* – 4 FC buses
Hamburg* – 6 FC buses
High V.LO-City (operation start
planned for 2015)
Liguria – 5 FC buses
Antwerp – 5 FC buses
Aberdeen – 4 FC buses
HyTransit
Aberdeen – 6 FC buses In operation
Legend:
* Co-financed by regional/national funding
sources
Planned for operation
CHIC countries
Source: CHIC project – Element Energy
16 | FCH JU – Commercialisation Strategy for Fuel Cell Electric Buses in Europe
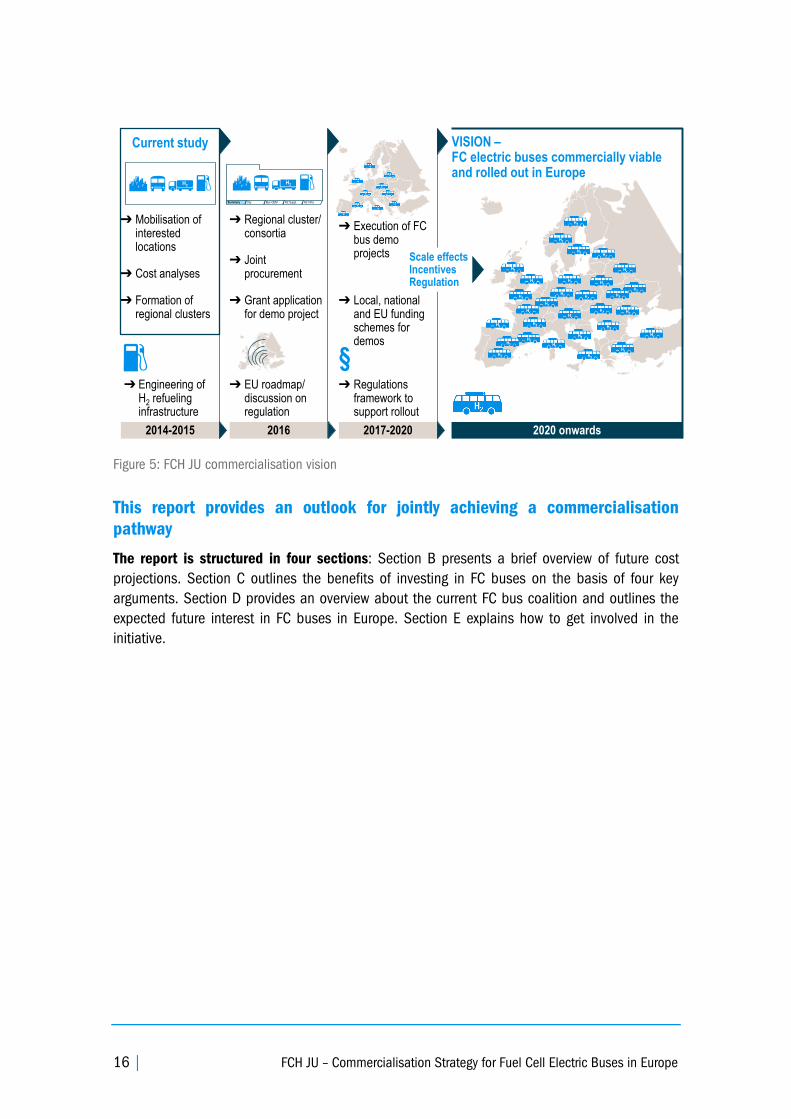
Figure 5: FCH JU commercialisation vision
This report provides an outlook for jointly achieving a commercialisation
pathway
The report is structured in four sections: Section B presents a brief overview of future cost
projections. Section C outlines the benefits of investing in FC buses on the basis of four key
arguments. Section D provides an overview about the current FC bus coalition and outlines the
expected future interest in FC buses in Europe. Section E explains how to get involved in the
initiative.
2014-2015
➔ Cost analyses
➔ Engineering of H2 refuelinginfrastructure
➔ Regional cluster/ consortia
➔ EU roadmap/ discussion on regulation
2016 2017-2020 2020 onwards
➔ Grant application for demo project
➔ Execution of FC bus demo projects
VISION –FC electric buses commercially viable and rolled out in Europe
H2 InfraH2 Suppl.Bus OEMCitySummary
H2
Scale effectsIncentivesRegulation
➔ Regulations
framework to support rollout
H2
Current study
➔ Formation of regional clusters
➔ Local, national and EU funding schemes for demos
➔ Mobilisation of interested locations
➔ Joint procurement
A Study for the Fuel Cells and Hydrogen Joint Undertaking by Roland Berger | 17
B. Fuel cell electric buses and their projected costs
Future FC bus costs are expected to decrease significantly
In 2012 the FCH JU published a detailed cost-based comparison of alternative powertrains
for urban buses (Urban buses: Alternative powertrains for Europe)4. The current initiative focuses
on promoting FC buses and provides an updated cost projection for the coming years. It also
aims at supporting operators in assessing their location-specific costs and preparing for FC bus
rollout. The cost analysis is based on proprietary industry data. Further information on the
methodology and assumptions as well as on detailed results can be found in Annex 3 of this
report.
The following sections present an overview of expected cost developments for both different
technology pathways. As the main cost drivers of FC buses are powertrain components and the
system integration, different pathways can have a high impact on FC bus purchasing prices and
thereby also on the total costs of FC bus operation.
4 Available at http://www.fch.europa.eu.
KEY MESSAGES
• Future FC bus costs are expected to decrease significantly, provided the required
production volumes can be achieved
• A conducive regulatory framework for fuel taxation would aid FC bus
commercialisation
• Operating costs can be reduced further depending on local conditions
18 | FCH JU – Commercialisation Strategy for Fuel Cell Electric Buses in Europe
1. Future FC bus cost developments in the heavy-duty technology
pathway
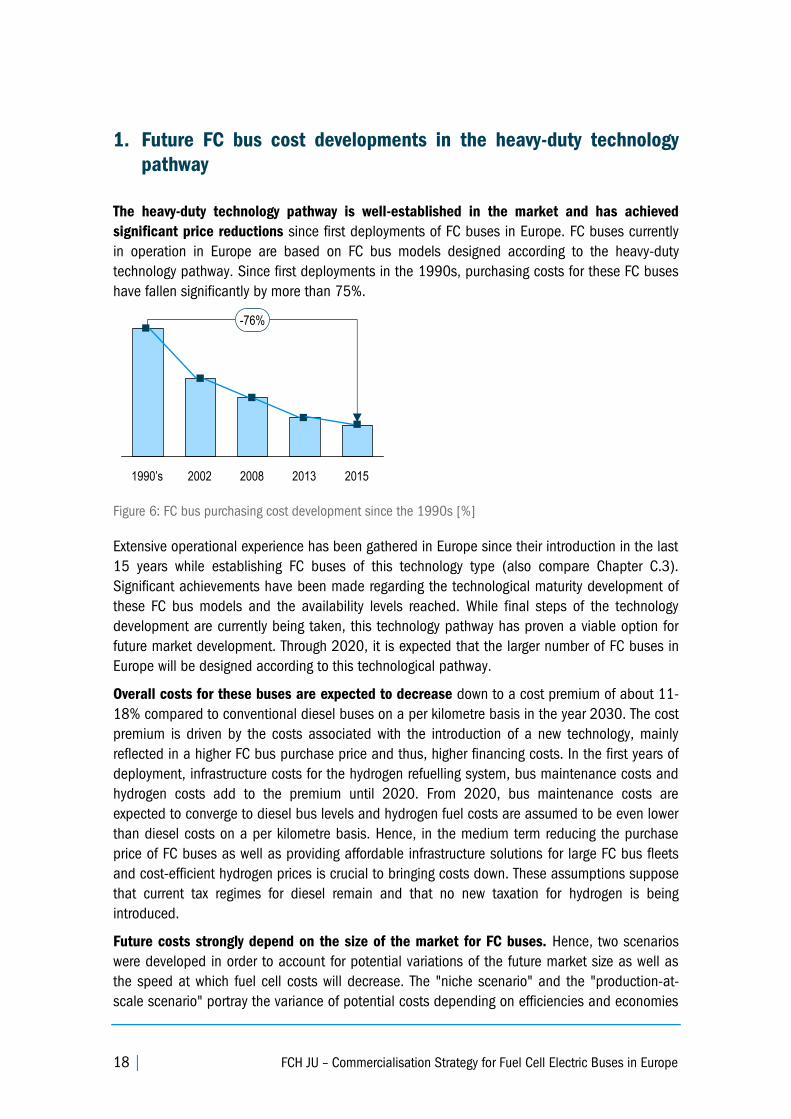
The heavy-duty technology pathway is well-established in the market and has achieved
significant price reductions since first deployments of FC buses in Europe. FC buses currently
in operation in Europe are based on FC bus models designed according to the heavy-duty
technology pathway. Since first deployments in the 1990s, purchasing costs for these FC buses
have fallen significantly by more than 75%.
Figure 6: FC bus purchasing cost development since the 1990s [%]
Extensive operational experience has been gathered in Europe since their introduction in the last
15 years while establishing FC buses of this technology type (also compare Chapter C.3).
Significant achievements have been made regarding the technological maturity development of
these FC bus models and the availability levels reached. While final steps of the technology
development are currently being taken, this technology pathway has proven a viable option for
future market development. Through 2020, it is expected that the larger number of FC buses in
Europe will be designed according to this technological pathway.
Overall costs for these buses are expected to decrease down to a cost premium of about 11-
18% compared to conventional diesel buses on a per kilometre basis in the year 2030. The cost
premium is driven by the costs associated with the introduction of a new technology, mainly
reflected in a higher FC bus purchase price and thus, higher financing costs. In the first years of
deployment, infrastructure costs for the hydrogen refuelling system, bus maintenance costs and
hydrogen costs add to the premium until 2020. From 2020, bus maintenance costs are
expected to converge to diesel bus levels and hydrogen fuel costs are assumed to be even lower
than diesel costs on a per kilometre basis. Hence, in the medium term reducing the purchase
price of FC buses as well as providing affordable infrastructure solutions for large FC bus fleets
and cost-efficient hydrogen prices is crucial to bringing costs down. These assumptions suppose
that current tax regimes for diesel remain and that no new taxation for hydrogen is being
introduced.
Future costs strongly depend on the size of the market for FC buses. Hence, two scenarios
were developed in order to account for potential variations of the future market size as well as
the speed at which fuel cell costs will decrease. The "niche scenario" and the "production-at-
scale scenario" portray the variance of potential costs depending on efficiencies and economies
1990’s 201320082002 2015
-76%
A Study for the Fuel Cells and Hydrogen Joint Undertaking by Roland Berger | 19
of scale achieved with varying market sizes and the related overall technological progress in the
framework of the heavy-duty technology pathway. The scenarios reflect the effect that different
economies of scale have on cost-down curves and prices. For the niche scenario to materialise,
a cumulative number of 1,200-1,800 FC buses needs to be deployed on Europe's roads in total
until 2025. For the production-at-scale scenario, a total cumulative volume of 8,000-10,000 FC
buses is required until 2025. The latter represents about 7-9% of the expected total cumulative
urban bus purchases in Europe in the period 2015-20255 (see Annex 3). The costs displayed in
the following are applicable to the specified year only. They do not depict the average costs over
the entire lifetime of an FC bus.
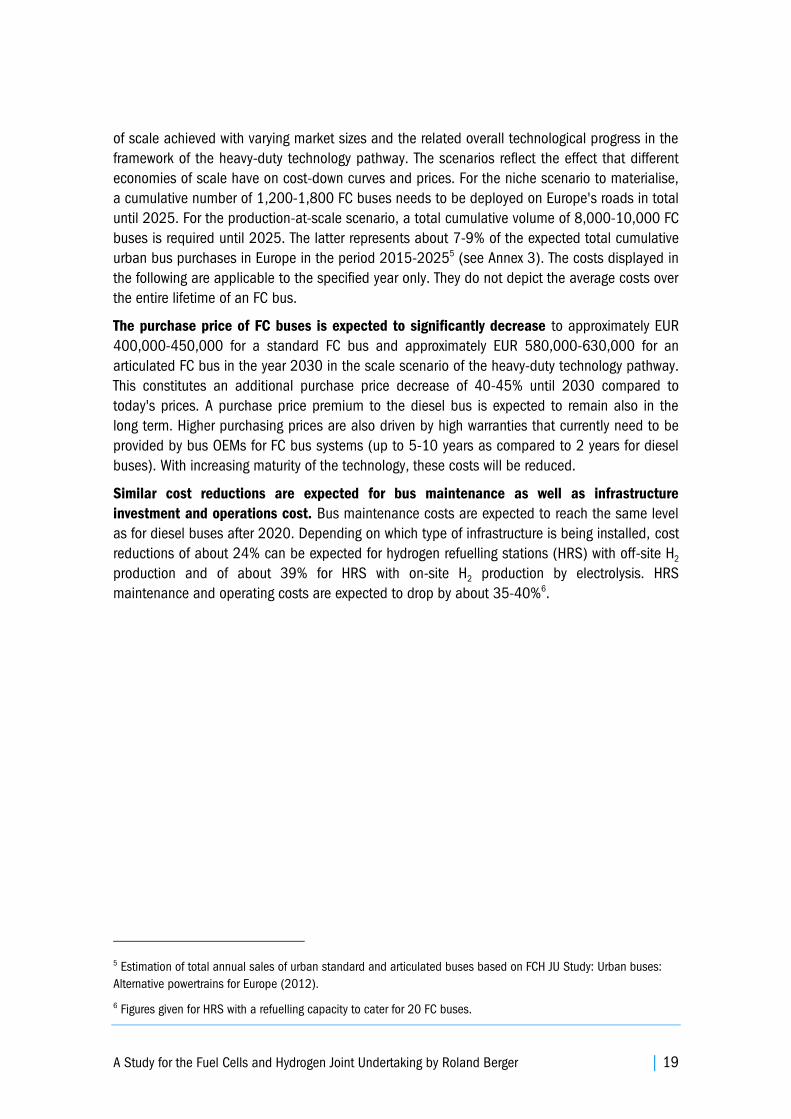
The purchase price of FC buses is expected to significantly decrease to approximately EUR
400,000-450,000 for a standard FC bus and approximately EUR 580,000-630,000 for an
articulated FC bus in the year 2030 in the scale scenario of the heavy-duty technology pathway.
This constitutes an additional purchase price decrease of 40-45% until 2030 compared to
today's prices. A purchase price premium to the diesel bus is expected to remain also in the
long term. Higher purchasing prices are also driven by high warranties that currently need to be
provided by bus OEMs for FC bus systems (up to 5-10 years as compared to 2 years for diesel
buses). With increasing maturity of the technology, these costs will be reduced.
Similar cost reductions are expected for bus maintenance as well as infrastructure
investment and operations cost. Bus maintenance costs are expected to reach the same level
as for diesel buses after 2020. Depending on which type of infrastructure is being installed, cost
reductions of about 24% can be expected for hydrogen refuelling stations (HRS) with off-site H2
production and of about 39% for HRS with on-site H2 production by electrolysis. HRS
maintenance and operating costs are expected to drop by about 35-40%6.
5 Estimation of total annual sales of urban standard and articulated buses based on FCH JU Study: Urban buses:
Alternative powertrains for Europe (2012).
6 Figures given for HRS with a refuelling capacity to cater for 20 FC buses.
20 | FCH JU – Commercialisation Strategy for Fuel Cell Electric Buses in Europe
Figure 7: Purchase price development of standard FC buses according to different scenarios in the heavy-
duty pathway [EUR '000]
Total Cost of Ownership (TCO) is expected to come down to EUR 3.3 per kilometre in 2030
from EUR 3.8 in 2015 for a standard bus7. TCO includes all overall costs of purchase and
operation and take into account the costs of diesel replacement buses during downtimes of FC
buses in the early years of deployments8. While most studies tend to disregard downtime costs
for newly introduced bus technologies, this study explicitly includes this type of costs in its
calculations to provide a more realistic assessment. Although costs are expected to come down
by 5-7% by 2030 from 2015 levels, a cost premium compared to diesel buses of 11-18% is
expected to remain in the year 2030. The lower overall cost decrease of 5-7% for FC buses
between 2015 and 2030 despite significantly higher reductions for FC technology related cost
components (bus purchasing and maintenance costs, infrastructure investment and operations
costs) is mainly driven by two factors: A labour cost increase of 2% annually as well as an
increase in feedstock prices for electricity and natural gas which causes higher hydrogen
production costs. Due to an assumed 3% annual increase in diesel fuel costs until 2030, as
well as the same assumed increase in labour costs, TCO of diesel buses even increase by about
30% in the same timeframe.
7 The term " standard bus" in the framework of this study includes both 12 m standard as well as 13.5 m buses
which have a double rear-axis and higher passenger capacity.
8 Total Cost of Ownership, as defined here, consist of total bus deployment costs plus costs for operating diesel
replacement buses during downtimes of FC buses in order to deliver full daily service and to achieve the total
annual bus mileage envisaged. In practice, downtime costs due to problems with a newly introduced technology
need to be considered by operators. Hence, this TCO approach provides a more realistic perspective on the costs of
FC bus deployment across the entire fleet (also see Annex 3).
19
INTERNAL DOCUMENT – NOT FOR DISSEMINATION
Compared to the prior study, the price of a 12 m bus is expected to be lower in niche scenario and slightly higher in production-at-scale
500
400
300
700
600
200
232
331
700-730
2015 2030
244
339
490-520
2025
238
332
520-550
2020
233
329
570-600
Conventional Diesel Diesel HybridAverage purchase price of the least costly bus models
Niche scenario Production-at-scale scenario
600
700
400
500
300
200
620-650
233
299
480-510
2015
232
2030
244
300
400-450
2025
238
299
420-450
2020
317
Results buses NEU
A Study for the Fuel Cells and Hydrogen Joint Undertaking by Roland Berger | 21
Figure 8: TCO development of FC buses compared to conventional diesel buses in the heavy-duty
pathway [EUR/km]
Depreciation and financing costs constitute the largest share of FC bus-specific TCO,
highlighting the effect of the purchase price of FC buses and infrastructure costs which drive the
price gap between FC and diesel buses. Since labour costs are equally applicable to the diesel
bus, they do not drive the price gap (see Figure 9: TCO split by components for standard FC
buses according to different scenarios in the heavy-duty pathway [EUR/km]). Nevertheless, they
constitute the largest part of real deployment costs for operators. For financing costs, a
Weighted Average Cost of Capital (WACC) of 7% is considered.9
A higher purchasing price will remain the largest difference between FC bus and diesel bus
costs in overall TCO, as evidenced by higher depreciation and financing cost vis-à-vis the
standard diesel bus.
Maintenance costs are expected to even out after 2020 and are already close to diesel bus
maintenance costs today. Overall, the FC bus price difference is mostly offset by an assumed
3% annual increase in diesel fuel costs until 2030. In the base case for cost comparisons to
diesel buses, a diesel price of EUR 1 in 2015 is assumed.10
9 Labour costs in the scale scenario are slightly higher than in the niche scenario as a higher availability and higher
number of kilometres driven are assumed for the FC bus (see Annex 3).
10 Please note that the diesel comparison is based on EURO VI models.
-10%
-14%
-16%
2030
3.03.3
3.7
2025
2.8
3.2
3.7
2020
2.5
3.4
3.9
2015
2.3
3.9
4.3
Conventional diesel busFC Bus Production-at-scale scenarioFC Bus Niche scenario
TCO development – Standard bus [EUR/ km]
-11%
-15%
-18%
2030
3.5
4.04.3
2025
3.3
3.9
4.4
2020
3.0
4.1
4.6
2015
2.8
4.7
5.3
TCO development – Articulated bus [EUR/ km]
-18%-18%
22 | FCH JU – Commercialisation Strategy for Fuel Cell Electric Buses in Europe
Figure 9: TCO split by components for standard FC buses according to different scenarios in the heavy-
duty pathway [EUR/km]
Cost-efficient hydrogen prices as presented in this study are required to achieve competitive
operational costs for FC buses compared to diesel buses. For TCO calculations shown in this
study, hydrogen produced from steam methane reforming (SMR) with a price per kg of EUR 4.9
in 2015 (EUR 5.1 in 2020) has been considered as being the least costly option at the
moment. Costs for hydrogen produced by electrolysis are assumed to be slightly higher (EUR 5.9
in 2015, EUR 6.2 in 202011
; also see Annex 4). In such a scenario, fuel costs for FC buses are
lower than for diesel buses if no additional taxes or levies on hydrogen are being introduced in
the future. This shows that regulatory and support frameworks greatly influence costs and have
an impact on commercialisation. This is reflected in the current political discussions on EU level
which debate penalising the use of fossil fuels in the future.
If operators were to pay current average diesel consumer prices, FC buses could be cost-
competitive in 2030 also in the heavy-duty pathway. Assuming a diesel price of EUR 1.35 per
litre in 2015 (current average consumer price in the Eurozone without subsidies and including
all taxes12
) suggests that the projected price gap of the heavy-duty pathway of 11% in 2030
could be already reached in 2025 and that the gap in 2030 could be decreased further to
approximately 5%.
11 Industry indication based on assumption that at least 20 FC buses are refuelled daily.
12 Average diesel price across all EU countries including taxes since 2009. Source: Weekly Oil Bulletin of the
European Commission.
Bus maintenance
Fuel costs
Infrastructure costs
Labour costs for
bus operation1)
Financing costs
2030
3.65
0.62
0.34
0.40
0.21
1.66
0.41
2025
3.74
0.70
0.36
0.40
Bus depreciation
1.59
0.45
2020
3.90
0.80
0.45
0.41
0.23
1.50
0.51
2015
4.34
1.03
0.55
0.42
0.25
1.45
0.63
0.23
2030
3.32
0.53
0.28
0.39
0.14
1.65
0.33
2025
3.25
0.57
0.30
0.39
0.14
1.50
0.35
2020
3.42
0.66
0.38
0.40
0.15
1.44
0.40
2015
3.87
0.90
0.49
0.41
0.16
1.39
0.52
TCO niche scenario TCO production-at-scale scenario
A Study for the Fuel Cells and Hydrogen Joint Undertaking by Roland Berger | 23
Figure 10: TCO comparison of standard FC and conventional diesel bus in the heavy-duty pathway
[EUR/km]
In the face of current market developments, coalition members consider the niche scenario
of the heavy-duty pathway to be most realistic until 2020. Hence, the figure below depicts the
cost projections of the niche scenario until 2020 with the base case assumptions for feedstock
prices, labour and financing costs as well as bus lifetime (see Annex 3). Deploying a higher
number of buses in the initial years is a key condition for reaching the scale scenario of the
heavy-duty pathway after 2020. If production-at-scale quantities cannot be reached in the initial
years, it may be harder for the efficiencies and advances in technology to be reached that are
assumed in the production-at-scale scenario in later years for this technology pathway.
Figure 11: TCO for standard FC and diesel buses according to different scenarios in the heavy-duty
pathway [EUR/km]
Infrastructure costs
Labour costs for
bus operation
Financing costs
Downtime costs
Diesel
1.35 EUR
2.5
0.3
0.3
0.5
0.0
Diesel
1 EUR
2.3
1.2
-35%
FC Bus
3.8
0.9
0.4
0.3
0.2
1.0
0.5
0.5
0.3
-39%
0.3
0.1
1.2
0.00.4
Bus depreciation
Bus maintenance
Fuel costs
0.1
-26%-30%
Diesel
1.35 EUR
2.7
0.3
0.3
0.6
0.0
1.4
0.1
Diesel
1 EUR
2.5
0.3
0.3
0.4
0.0
1.4
0.1
FC Bus
3.6
0.7
0.4
0.4
0.2
1.1
0.5
0.4
-10%-16%
Diesel
1.35 EUR
2.9
0.3
0.3
0.7
0.0
1.5
0.2
Diesel
1 EUR
2.8
0.3
0.3
0.5
0.0
1.5
0.2
FC Bus
3.3
0.6
0.3
0.4
0.1
1.4
0.3
0.2
0.0
1.7
0.2
Diesel
1 EUR
3.0
0.3
0.3
0.6
0.0
1.7
0.2
3.3
0.5
0.3
0.4
0.1
1.5
0.3
0.2
-5%-11%
Diesel
1.35 EUR
3.2
0.3
0.3
0.8
FC Bus
2015 2020 2025 2030
3.5
2015 2020 2025 2030
0.0
2.5
3.0
4.0
2.63
2.99
2.65
3.35
3.66
3.26
3.613.65
2.06
2.34
3.84
FC bus Niche – Base case
FC Scale – Base case
FC Niche – Base case
FC Scale – Best case
Diesel – Base case
Diesel – Best case
11%
18%
Diesel – Base case
Diesel – Best case
1%
24 | FCH JU – Commercialisation Strategy for Fuel Cell Electric Buses in Europe
The costs may be significantly lower for some operators. Indicated cost projections above are
applicable to the average European bus operator. However, the actual cost development
depends strongly on operators' local conditions, which can change the case entirely. In order to
demonstrate the influence of different cost drivers, a sensitivity analysis was performed. In a
best case scenario with low feedstock/hydrogen prices, low financing costs and a longer bus
lifetime, the overall costs of FC buses in the heavy-duty pathway can be on a par with diesel in
the medium term. Lower electricity or natural gas and, thus, hydrogen prices can reduce TCO
(see Annex 5 for details). A Weighted Average Cost of Capital (WACC) of 5% can further reduce
TCO. With currently low interest rates, some public operators in particular should be able to
achieve such financing rates. Assuming a bus lifetime of 18 years, there could be a TCO
reduction almost closing the gap to the diesel bus. As mentioned above, assuming a longer
lifetime of FC buses vs. diesel buses is a realistic expectation in general, if the drive train of FC
buses proves the anticipated lower abrasion and, thus, lasts longer. Out of the three mentioned
parameters, a longer bus lifetime carries the greatest potential for a reduction of overall TCO
(see Annex 5). The sensitivity analysis demonstrates that costs can significantly differ from the
average projections presented in this study. Interested bus operators and local governments will
need to assess carefully how their specific local framework conditions influence the cost
projections applicable to them in order to make an informed decision on deploying FC buses.
A comprehensive cost assessment tool has been developed in the framework of the study to
help operators to analyse their actual FC bus deployment costs. The tool is available to all
participants and allows for customised cost calculations using specific local costs (e.g. for
labour or feedstock) as well as individual deployment schedules.
A Study for the Fuel Cells and Hydrogen Joint Undertaking by Roland Berger | 25
2. Future FC bus cost developments in the automotive technology
pathway
Further cost reduction potential might arise from realising technical synergies and scale
effects with the FC passenger car market. Currently, some OEMs are developing their next
generation of FC buses intending to integrate the same type of fuel cell stacks and batteries in
FC buses as in FC passenger cars. With this technology pathway, it is expected that additional
cost reduction potential can be seized, if synergies with the FC passenger car market can be
realised. First FC bus models constructed following this technological pathway have recently
been put into test service by Toyota (Hino) in Asia. In Europe, 23 FC buses using passenger car
FC stacks have been deployed in the CHIC and NaBuZ ("Nachhaltiges Bussystem der Zukunft " –
"Sustainable bus system of the future" in Hamburg) projects. Paving the way towards this
technological pathway, they have gathered substantial operational experience of over more than
700.000 km.
The cost reductions to be achieved in this technological pathway are highly dependent on
the development pace of the FC passenger car market. Commercialisation activities for FCEVs
are currently being realised in Europe and plans for the establishment of the required hydrogen
refuelling infrastructure are being implemented in several countries. The pace and duration of FC
passenger car uptake depends on a number of factors, e.g. the roll-out pace of the required
hydrogen refuelling station network. Hence, it is difficult to predict when and to which extent this
technology pathway will materialise for FC buses. Therefore, cost projections for the automotive
technology pathway presented in the following are based on required production volumes of FC
stacks for passenger cars only and do not refer to specific years in which these costs are
expected to emerge. However, a number of OEMs are planning to launch FC passenger cars from
series production in the European market from 2018 onwards so that annual sales of a few
thousand vehicles can be expected before 2020. When considering current projections made by
the industry in further FCEV market development, the FC passenger car production volumes
required for the automotive technology pathway of FC buses to materialise may be reached in
the 2020 – 2025 period. Additional to the required FC passenger car market development,
significant annual production volumes for FC buses per OEM need to be reached to create
sustainable demand for the industry, i.e. annual production volumes as projected in the heavy-
duty pathway.
Below, respective cost projections are presented based on the assumption that this large-scale
rollout of passenger cars materialises. In order to be able to benefit from this technological
pathway, the FC systems and other components used need to be available to all bus OEMs in
the market. Hence, the broad application of this pathway in the future FC bus market also
depends on the establishment of an independent supply of such systems.
The main cost drivers of FC buses are the powertrain components and system integration,
whereas the production costs for the base vehicle are expected to remain rather constant.
Therefore, if significant component cost reductions from FC passenger car synergies can be
realised, it can be expected that FC bus purchasing costs can decrease below the levels
projected for the heavy-duty technology pathway. The potential for these cost reductions has
26 | FCH JU – Commercialisation Strategy for Fuel Cell Electric Buses in Europe
been analysed by several specific technology and cost assessments carried out by TIAX, the U.S.
DoE and in the framework of European projects funded by the FCH JU, such as AutoStack and
AutoStack-Core.
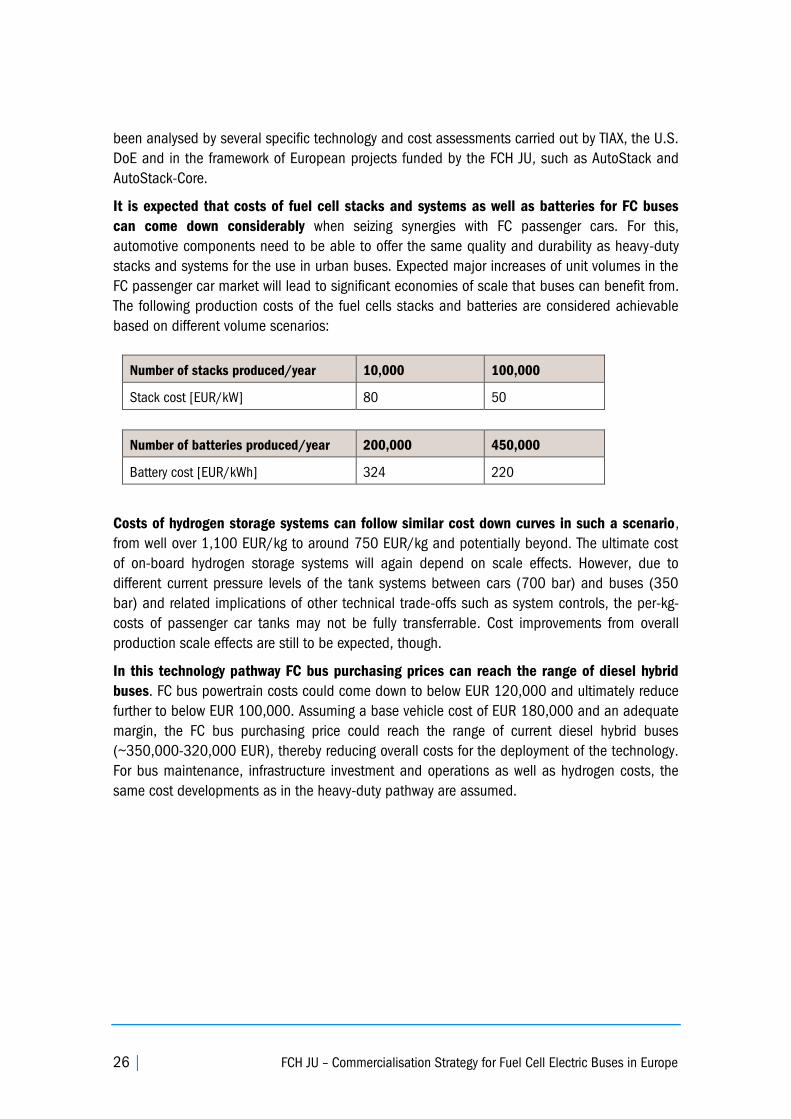
It is expected that costs of fuel cell stacks and systems as well as batteries for FC buses
can come down considerably when seizing synergies with FC passenger cars. For this,
automotive components need to be able to offer the same quality and durability as heavy-duty
stacks and systems for the use in urban buses. Expected major increases of unit volumes in the
FC passenger car market will lead to significant economies of scale that buses can benefit from.
The following production costs of the fuel cells stacks and batteries are considered achievable
based on different volume scenarios:
Number of stacks produced/year 10,000 100,000
Stack cost [EUR/kW] 80 50
Number of batteries produced/year 200,000 450,000
Battery cost [EUR/kWh] 324 220
Costs of hydrogen storage systems can follow similar cost down curves in such a scenario,
from well over 1,100 EUR/kg to around 750 EUR/kg and potentially beyond. The ultimate cost
of on-board hydrogen storage systems will again depend on scale effects. However, due to
different current pressure levels of the tank systems between cars (700 bar) and buses (350
bar) and related implications of other technical trade-offs such as system controls, the per-kg-
costs of passenger car tanks may not be fully transferrable. Cost improvements from overall
production scale effects are still to be expected, though.
In this technology pathway FC bus purchasing prices can reach the range of diesel hybrid
buses. FC bus powertrain costs could come down to below EUR 120,000 and ultimately reduce
further to below EUR 100,000. Assuming a base vehicle cost of EUR 180,000 and an adequate
margin, the FC bus purchasing price could reach the range of current diesel hybrid buses
(~350,000-320,000 EUR), thereby reducing overall costs for the deployment of the technology.
For bus maintenance, infrastructure investment and operations as well as hydrogen costs, the
same cost developments as in the heavy-duty pathway are assumed.
A Study for the Fuel Cells and Hydrogen Joint Undertaking by Roland Berger | 27
Figure 12: Purchase price [EUR '000] and TCO [EUR/km] development for standard FC buses in the
automotive pathway
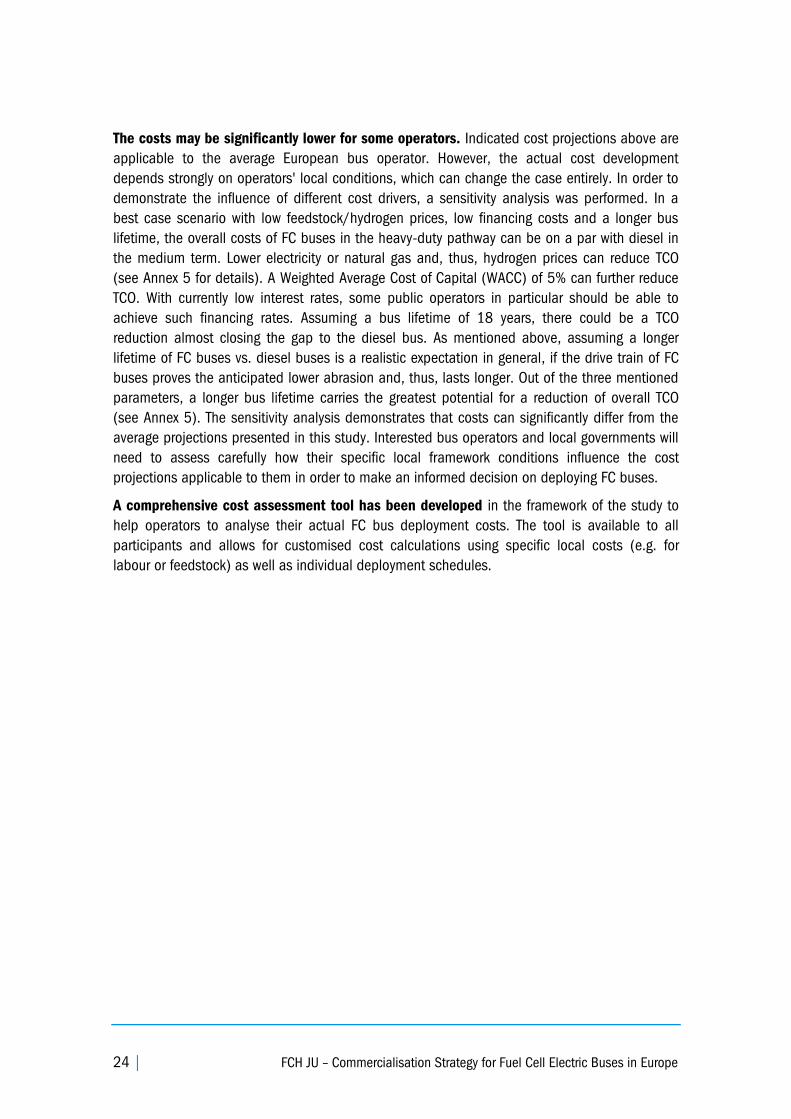
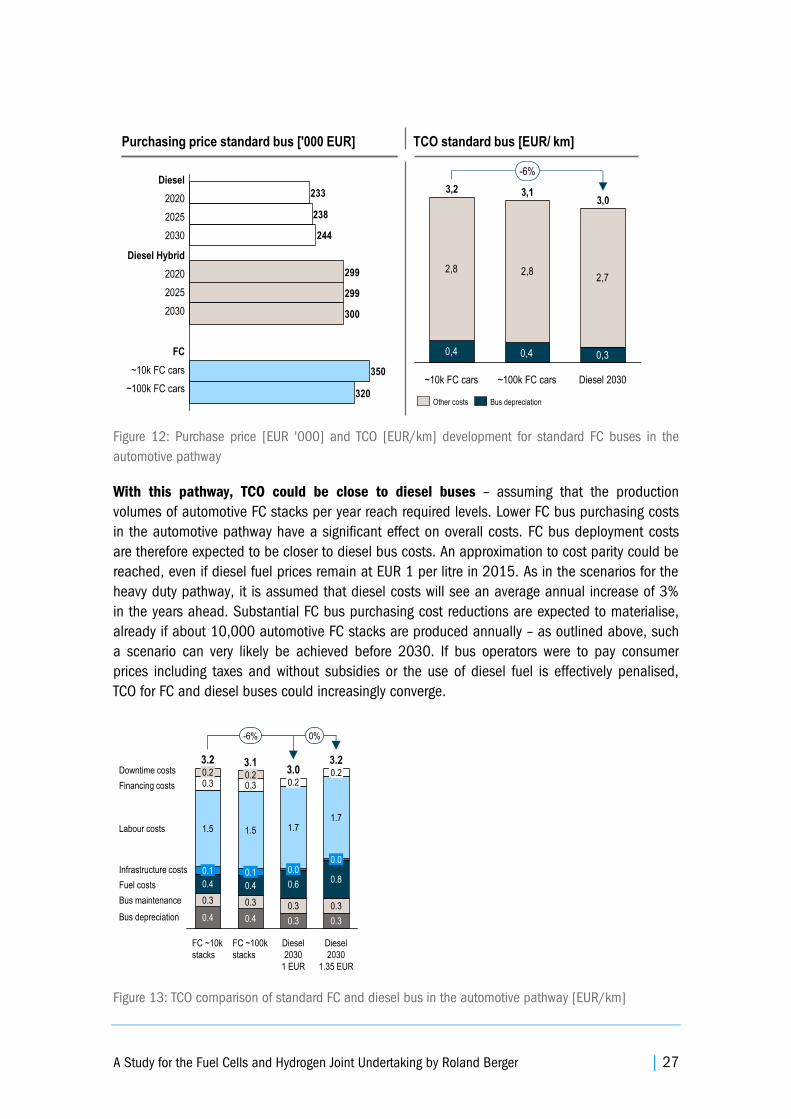
With this pathway, TCO could be close to diesel buses – assuming that the production
volumes of automotive FC stacks per year reach required levels. Lower FC bus purchasing costs
in the automotive pathway have a significant effect on overall costs. FC bus deployment costs
are therefore expected to be closer to diesel bus costs. An approximation to cost parity could be
reached, even if diesel fuel prices remain at EUR 1 per litre in 2015. As in the scenarios for the
heavy duty pathway, it is assumed that diesel costs will see an average annual increase of 3%
in the years ahead. Substantial FC bus purchasing cost reductions are expected to materialise,
already if about 10,000 automotive FC stacks are produced annually – as outlined above, such
a scenario can very likely be achieved before 2030. If bus operators were to pay consumer
prices including taxes and without subsidies or the use of diesel fuel is effectively penalised,
TCO for FC and diesel buses could increasingly converge.
Figure 13: TCO comparison of standard FC and diesel bus in the automotive pathway [EUR/km]
Purchasing price standard bus ['000 EUR] TCO standard bus [EUR/ km]
299
233
350
299
238
320
300
244
Diesel Hybrid
2020
2025
2030
Diesel
2020
2025
2030
FC
~10k FC cars
~100k FC cars
0,4
2,8 2,82,7
0,30,4
~100k FC cars
3,0
Diesel 2030
-6%
~10k FC cars
3,13,2
Bus depreciationOther costs
1.5
0.30.2
FC ~10k
stacks
3.2
0.4
0.3
0.4
0.1
1.5
0.30.2
Bus depreciation
Infrastructure costs
Labour costs
Fuel costs
Bus maintenance
Financing costs
Downtime costs3.1
1.7
3.03.2
Diesel
2030
1 EUR
0.8
0.3
0.3
0.0
0.2
0.6
0.4
1.7
0.0
0.3
0.3
FC ~100k
stacks
0.2
Diesel
2030
1.35 EUR
0%
0.3
0.4
0.1
-6%
28 | FCH JU – Commercialisation Strategy for Fuel Cell Electric Buses in Europe
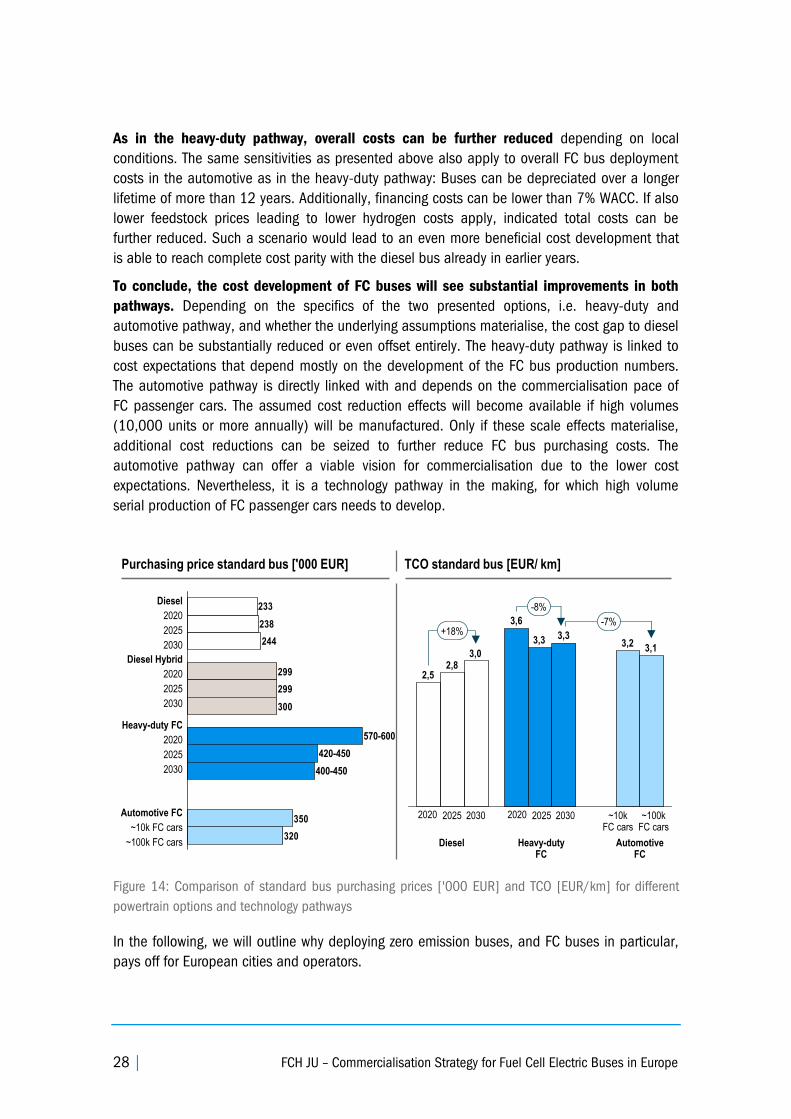
As in the heavy-duty pathway, overall costs can be further reduced depending on local
conditions. The same sensitivities as presented above also apply to overall FC bus deployment
costs in the automotive as in the heavy-duty pathway: Buses can be depreciated over a longer
lifetime of more than 12 years. Additionally, financing costs can be lower than 7% WACC. If also
lower feedstock prices leading to lower hydrogen costs apply, indicated total costs can be
further reduced. Such a scenario would lead to an even more beneficial cost development that
is able to reach complete cost parity with the diesel bus already in earlier years.
To conclude, the cost development of FC buses will see substantial improvements in both
pathways. Depending on the specifics of the two presented options, i.e. heavy-duty and
automotive pathway, and whether the underlying assumptions materialise, the cost gap to diesel
buses can be substantially reduced or even offset entirely. The heavy-duty pathway is linked to
cost expectations that depend mostly on the development of the FC bus production numbers.
The automotive pathway is directly linked with and depends on the commercialisation pace of
FC passenger cars. The assumed cost reduction effects will become available if high volumes
(10,000 units or more annually) will be manufactured. Only if these scale effects materialise,
additional cost reductions can be seized to further reduce FC bus purchasing costs. The
automotive pathway can offer a viable vision for commercialisation due to the lower cost
expectations. Nevertheless, it is a technology pathway in the making, for which high volume
serial production of FC passenger cars needs to develop.
Figure 14: Comparison of standard bus purchasing prices ['000 EUR] and TCO [EUR/km] for different
powertrain options and technology pathways
In the following, we will outline why deploying zero emission buses, and FC buses in particular,
pays off for European cities and operators.
Purchasing price standard bus ['000 EUR] TCO standard bus [EUR/ km]
299
233
350
299
238
320
300
244
400-450
420-450
570-600
Diesel Hybrid
2020
2025
2030
Diesel
2020
2025
2030
Heavy-duty FC
2020
2025
2030
Automotive FC
~10k FC cars
~100k FC cars
2,5
3,23,3
2,8
3,13,0
3,3
3,6+18%
-7%
-8%
~10kFC cars
~100kFC cars
2025 20302020 2025 20302020
Diesel Heavy-dutyFC
Automotive FC
A Study for the Fuel Cells and Hydrogen Joint Undertaking by Roland Berger | 29
C. Benefits of investing in FC buses now
Deploying zero emission powertrains is a paradigm shift marking the future of European
transport. The following section presents four compelling reasons why FC buses can contribute
to enhancing the quality of life in European cities, cut costs and safeguard Europe's energy
future, thus inducing enormous direct and systemic benefits.
1. Politically – There is a push for reducing emissions in public
transport in Europe
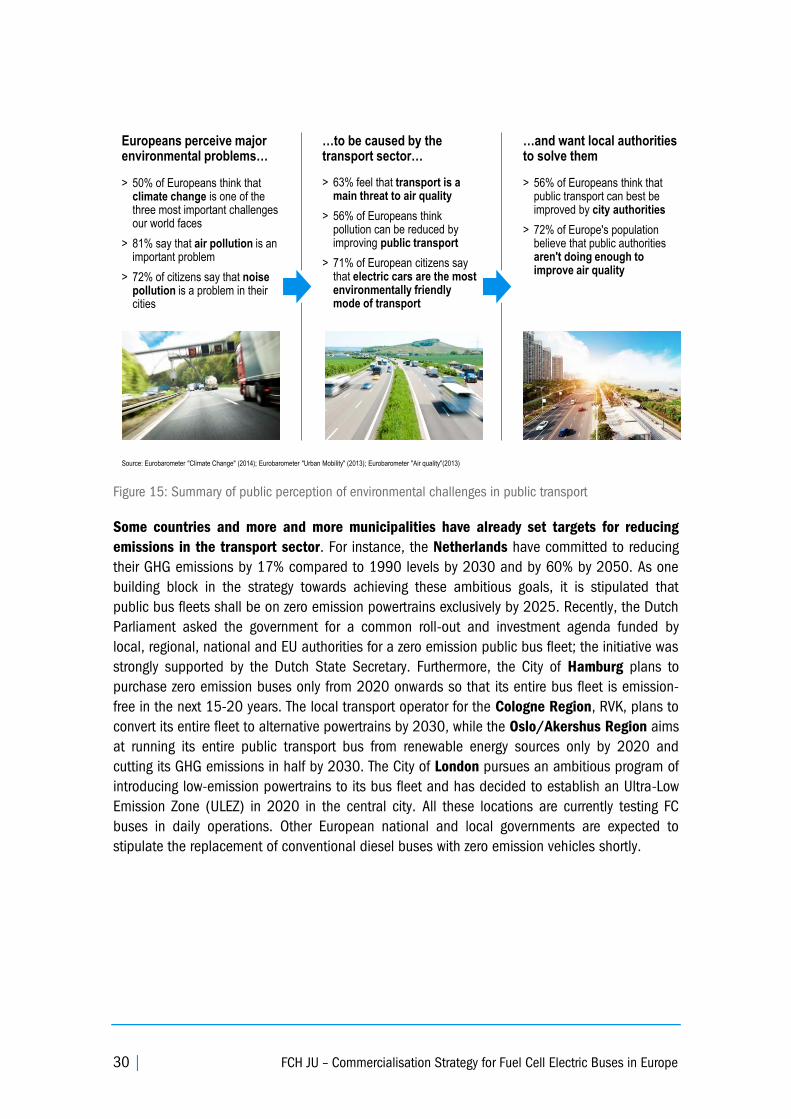
There is a political pressure to shift to lower GHG and local emissions in public transport.
Driven by the detrimental impact on the environment, the limited availability of fossil fuels and
the dependency on energy supplies from abroad, Europe's societal values and political decision
makers are increasingly moving towards a low-carbon future. Regulation has been put in place
with more concrete and stricter legislation expected in the years ahead. As mentioned above,
the European Commission is committed to reducing its GHG emissions from transport by at least
60% by 2050 compared to 1990 levels. This target is expected to become binding for the
member states in the near future. As it concerns local emissions, the EU Directive on Ambient
Air Quality and Cleaner Air for Europe stipulates for example limits for harmful pollutants for
cities above 250,000 inhabitants. Recently, the EU has launched legal proceedings (incl. fines)
against countries that have violated the Directive.
KEY MESSAGES
Investing in FC buses bears significant benefits for four reasons:
1. Politically – There is a push for reducing emissions in public transport in Europe
2. Environmentally – FC buses help to reduce noise levels and to green cities and
public transport
3. Economically – FC buses reduce external costs of public transport
4. Operationally – FC buses are the most flexible zero emission option
30 | FCH JU – Commercialisation Strategy for Fuel Cell Electric Buses in Europe
Figure 15: Summary of public perception of environmental challenges in public transport
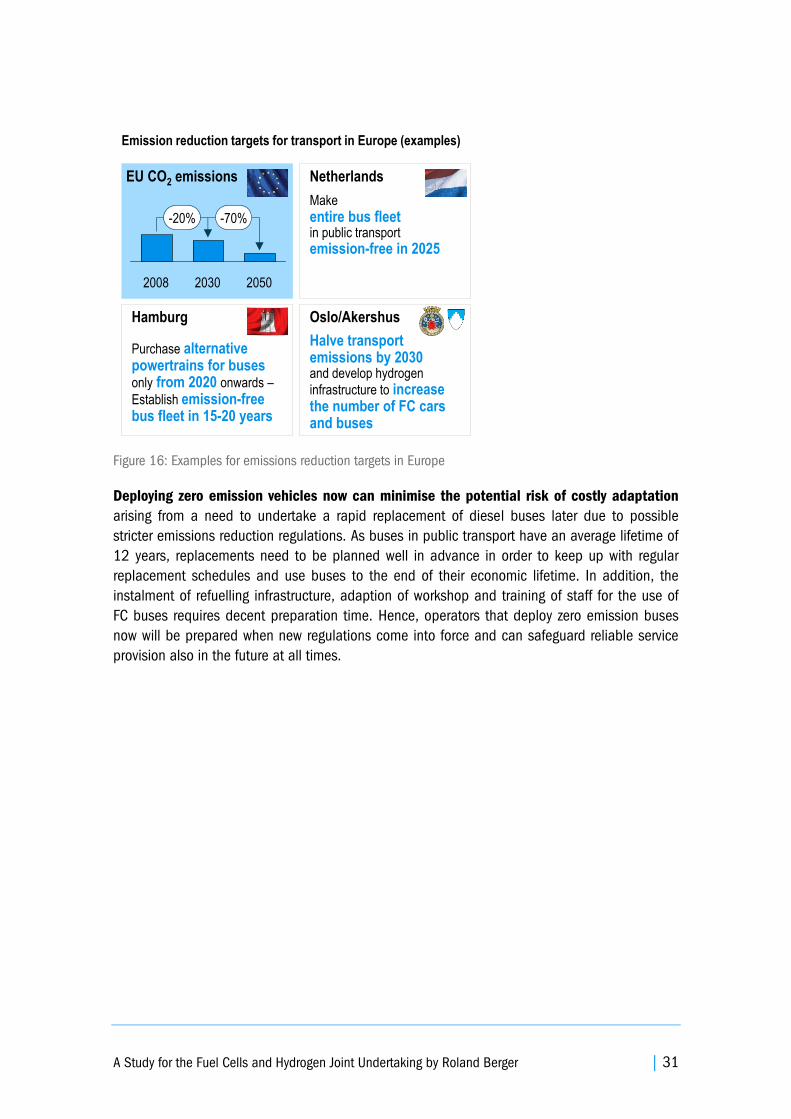
Some countries and more and more municipalities have already set targets for reducing
emissions in the transport sector. For instance, the Netherlands have committed to reducing
their GHG emissions by 17% compared to 1990 levels by 2030 and by 60% by 2050. As one
building block in the strategy towards achieving these ambitious goals, it is stipulated that
public bus fleets shall be on zero emission powertrains exclusively by 2025. Recently, the Dutch
Parliament asked the government for a common roll-out and investment agenda funded by
local, regional, national and EU authorities for a zero emission public bus fleet; the initiative was
strongly supported by the Dutch State Secretary. Furthermore, the City of Hamburg plans to
purchase zero emission buses only from 2020 onwards so that its entire bus fleet is emission-
free in the next 15-20 years. The local transport operator for the Cologne Region, RVK, plans to
convert its entire fleet to alternative powertrains by 2030, while the Oslo/Akershus Region aims
at running its entire public transport bus from renewable energy sources only by 2020 and
cutting its GHG emissions in half by 2030. The City of London pursues an ambitious program of
introducing low-emission powertrains to its bus fleet and has decided to establish an Ultra-Low
Emission Zone (ULEZ) in 2020 in the central city. All these locations are currently testing FC
buses in daily operations. Other European national and local governments are expected to
stipulate the replacement of conventional diesel buses with zero emission vehicles shortly.
> 50% of Europeans think that climate change is one of the three most important challenges our world faces
> 81% say that air pollution is an important problem
> 72% of citizens say that noise pollution is a problem in their cities
> 63% feel that transport is a main threat to air quality
> 56% of Europeans think pollution can be reduced by improving public transport
> 71% of European citizens say that electric cars are the most environmentally friendly mode of transport
> 56% of Europeans think that public transport can best be improved by city authorities
> 72% of Europe's population believe that public authorities aren't doing enough to improve air quality
Source: Eurobarometer "Climate Change" (2014); Eurobarometer "Urban Mobility" (2013); Eurobarometer "Air quality"(2013)
…and want local authoritiesto solve them
Europeans perceive major environmental problems…
…to be caused by the transport sector…
A Study for the Fuel Cells and Hydrogen Joint Undertaking by Roland Berger | 31
Figure 16: Examples for emissions reduction targets in Europe
Deploying zero emission vehicles now can minimise the potential risk of costly adaptation
arising from a need to undertake a rapid replacement of diesel buses later due to possible
stricter emissions reduction regulations. As buses in public transport have an average lifetime of
12 years, replacements need to be planned well in advance in order to keep up with regular
replacement schedules and use buses to the end of their economic lifetime. In addition, the
instalment of refuelling infrastructure, adaption of workshop and training of staff for the use of
FC buses requires decent preparation time. Hence, operators that deploy zero emission buses
now will be prepared when new regulations come into force and can safeguard reliable service
provision also in the future at all times.
Netherlands
Make
entire bus fleet in public transport
emission-free in 2025
Hamburg
Purchase alternative powertrains for buses only from 2020 onwards –
Establish emission-free bus fleet in 15-20 years
Oslo/Akershus
Halve transport emissions by 2030 and develop hydrogen
infrastructure to increase the number of FC cars and buses
EU CO2 emissions
Emission reduction targets for transport in Europe (examples)
-70%
205020302008
-20%
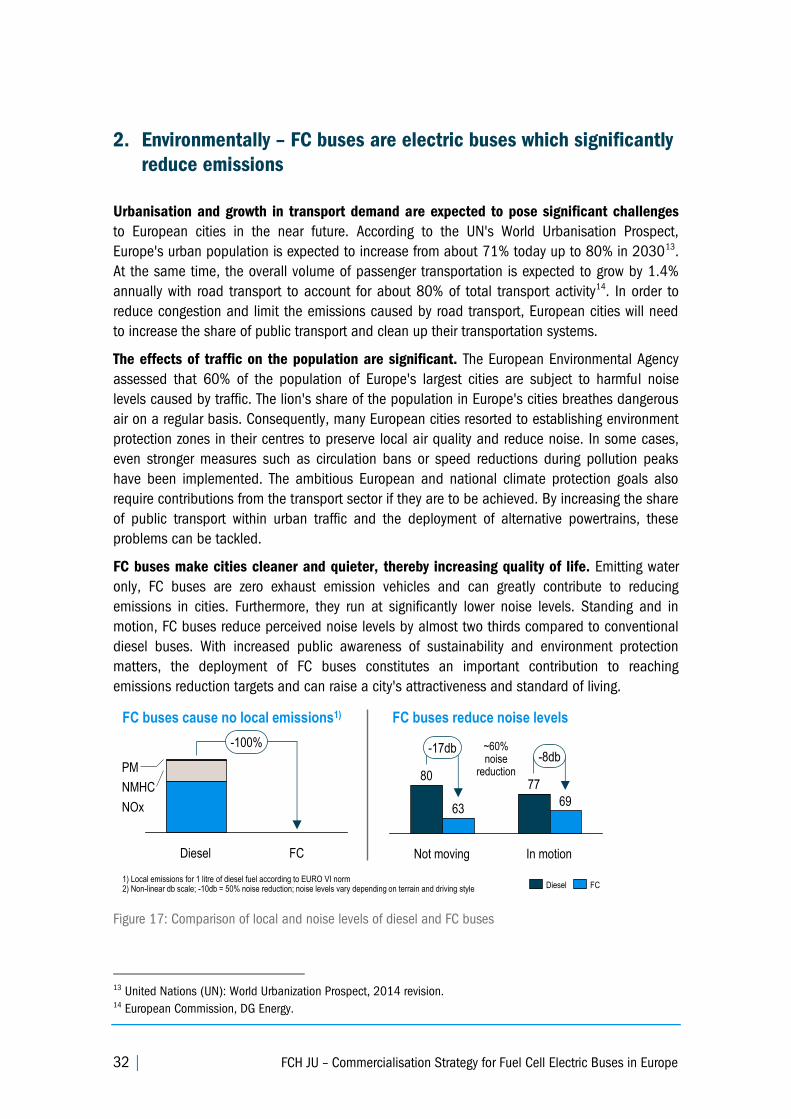
32 | FCH JU – Commercialisation Strategy for Fuel Cell Electric Buses in Europe
2. Environmentally – FC buses are electric buses which significantly
reduce emissions
Urbanisation and growth in transport demand are expected to pose significant challenges
to European cities in the near future. According to the UN's World Urbanisation Prospect,
Europe's urban population is expected to increase from about 71% today up to 80% in 203013
.
At the same time, the overall volume of passenger transportation is expected to grow by 1.4%
annually with road transport to account for about 80% of total transport activity14
. In order to
reduce congestion and limit the emissions caused by road transport, European cities will need
to increase the share of public transport and clean up their transportation systems.
The effects of traffic on the population are significant. The European Environmental Agency
assessed that 60% of the population of Europe's largest cities are subject to harmful noise
levels caused by traffic. The lion's share of the population in Europe's cities breathes dangerous
air on a regular basis. Consequently, many European cities resorted to establishing environment
protection zones in their centres to preserve local air quality and reduce noise. In some cases,
even stronger measures such as circulation bans or speed reductions during pollution peaks
have been implemented. The ambitious European and national climate protection goals also
require contributions from the transport sector if they are to be achieved. By increasing the share
of public transport within urban traffic and the deployment of alternative powertrains, these
problems can be tackled.
FC buses make cities cleaner and quieter, thereby increasing quality of life. Emitting water
only, FC buses are zero exhaust emission vehicles and can greatly contribute to reducing
emissions in cities. Furthermore, they run at significantly lower noise levels. Standing and in
motion, FC buses reduce perceived noise levels by almost two thirds compared to conventional
diesel buses. With increased public awareness of sustainability and environment protection
matters, the deployment of FC buses constitutes an important contribution to reaching
emissions reduction targets and can raise a city's attractiveness and standard of living.
Figure 17: Comparison of local and noise levels of diesel and FC buses
13 United Nations (UN): World Urbanization Prospect, 2014 revision. 14 European Commission, DG Energy.
1) Local emissions for 1 litre of diesel fuel according to EURO VI norm2) Non-linear db scale; -10db = 50% noise reduction; noise levels vary depending on terrain and driving style
FCDiesel
NMHC
-100%
PM
NOx
FC buses cause no local emissions1) FC buses reduce noise levels
-8db-17db
In motion
69
77
Not moving
63
80
FCDiesel
~60% noise
reduction
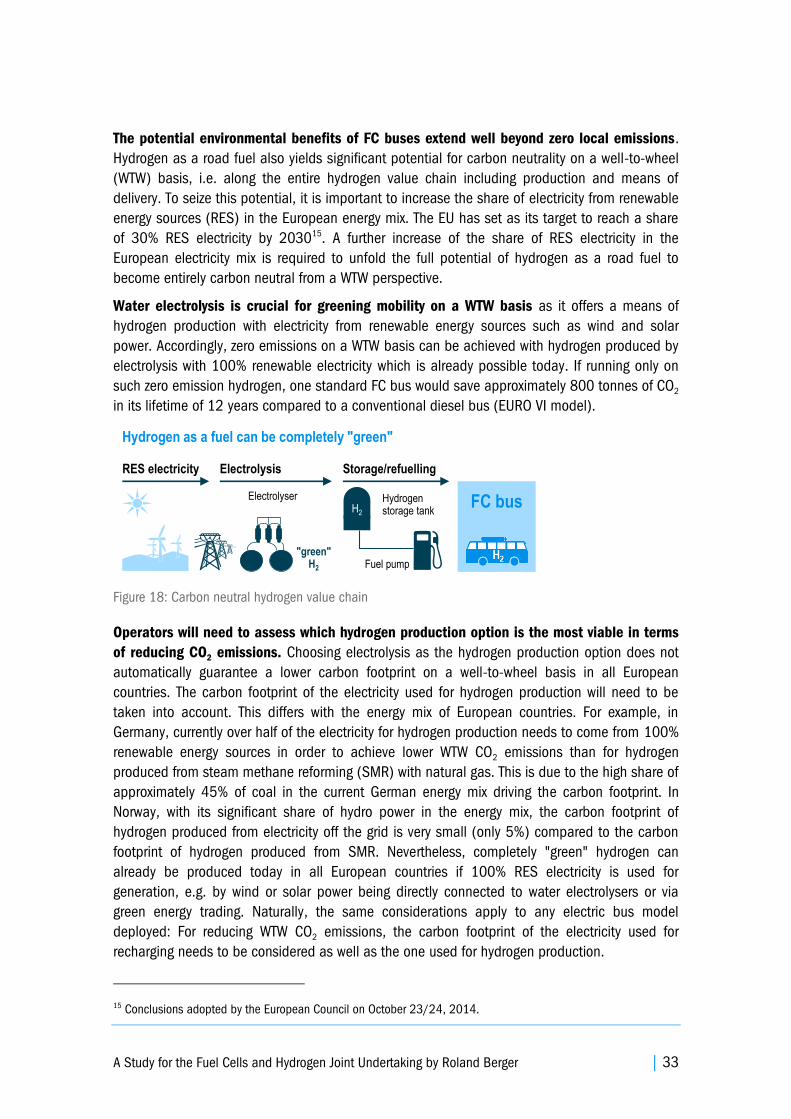
A Study for the Fuel Cells and Hydrogen Joint Undertaking by Roland Berger | 33
The potential environmental benefits of FC buses extend well beyond zero local emissions.
Hydrogen as a road fuel also yields significant potential for carbon neutrality on a well-to-wheel
(WTW) basis, i.e. along the entire hydrogen value chain including production and means of
delivery. To seize this potential, it is important to increase the share of electricity from renewable
energy sources (RES) in the European energy mix. The EU has set as its target to reach a share
of 30% RES electricity by 203015
. A further increase of the share of RES electricity in the
European electricity mix is required to unfold the full potential of hydrogen as a road fuel to
become entirely carbon neutral from a WTW perspective.
Water electrolysis is crucial for greening mobility on a WTW basis as it offers a means of
hydrogen production with electricity from renewable energy sources such as wind and solar
power. Accordingly, zero emissions on a WTW basis can be achieved with hydrogen produced by
electrolysis with 100% renewable electricity which is already possible today. If running only on
such zero emission hydrogen, one standard FC bus would save approximately 800 tonnes of CO2
in its lifetime of 12 years compared to a conventional diesel bus (EURO VI model).
Figure 18: Carbon neutral hydrogen value chain
Operators will need to assess which hydrogen production option is the most viable in terms
of reducing CO2 emissions. Choosing electrolysis as the hydrogen production option does not
automatically guarantee a lower carbon footprint on a well-to-wheel basis in all European
countries. The carbon footprint of the electricity used for hydrogen production will need to be
taken into account. This differs with the energy mix of European countries. For example, in
Germany, currently over half of the electricity for hydrogen production needs to come from 100%
renewable energy sources in order to achieve lower WTW CO2 emissions than for hydrogen
produced from steam methane reforming (SMR) with natural gas. This is due to the high share of
approximately 45% of coal in the current German energy mix driving the carbon footprint. In
Norway, with its significant share of hydro power in the energy mix, the carbon footprint of
hydrogen produced from electricity off the grid is very small (only 5%) compared to the carbon
footprint of hydrogen produced from SMR. Nevertheless, completely "green" hydrogen can
already be produced today in all European countries if 100% RES electricity is used for
generation, e.g. by wind or solar power being directly connected to water electrolysers or via
green energy trading. Naturally, the same considerations apply to any electric bus model
deployed: For reducing WTW CO2 emissions, the carbon footprint of the electricity used for
recharging needs to be considered as well as the one used for hydrogen production.
15 Conclusions adopted by the European Council on October 23/24, 2014.
RES electricity
FC bus
Electrolysis
Hydrogen storage tank
Storage/refuelling
Electrolyser
Fuel pump
Hydrogen as a fuel can be completely "green"
"green" H2
H2

34 | FCH JU – Commercialisation Strategy for Fuel Cell Electric Buses in Europe
Figure 19: WTW CO2 emissions of diesel and hydrogen in 2015 [kg/100 km]
Currently, FC buses running on hydrogen from SMR have the advantage of zero local
emissions while they have slightly reduced CO2 emissions compared to diesel buses (EURO VI
models): With 108 kg per 100 kilometres driven, FC buses with SMR hydrogen account for 14
kg less CO2 emissions than conventional diesel buses with 122 kg on a WTW basis16
. Carbon
Capture and Storage (CCS) technology is currently in development which can further reduce the
carbon footprint of SMR hydrogen by 68%17
. However, the use of CCS comes with additional
risks and costs which need to be analysed thoroughly. Further CO2 reduction for SMR hydrogen
also exists with the use of biogas as feedstock. The use of hydrogen produced from SMR can be
an important first step in the early years of deployment from a cost perspective. In the long run,
it can be replaced by hydrogen produced from electrolysis with RES electricity to reach full
carbon neutrality from a WTW perspective and to significantly reduce CO2 emissions of cities in
Europe.
From a current economic point of view, SMR plays a role for the commercialisation of the
technology and for advancing FC buses in the years ahead. The price of hydrogen from SMR is
currently approximately 20% lower than hydrogen from electrolysis. As the least costly hydrogen
production option in the coming years, it can support bus operators in rolling out zero emission
FC buses and achieving the greening of urban transport in the near term while offering the
potential for transitioning to zero emissions on a WTW basis in the long run. The hydrogen price
from offsite centralised production with electrolysis could be within the range of SMR hydrogen,
if low-priced spot electricity and the benefits from offering load balancing services can be
seized. The technology to achieve such prices exists and, with a large-scale FC bus rollout, this
can become an alternative for bus operators. Water electrolysis is currently the production
option of choice in many bus depots where hydrogen is produced on site.
The commercialisation of FC buses can also support the systematic linking of energy and
transport systems, as it can give a push to establishing hydrogen as a storage medium for
electricity from renewable energy sources. Specifically hydrogen produced from electrolysis can
16 For CO2 emissions of diesel buses see FCH JU Study: Urban buses: Alternative powertrains for Europe (2012) and
Concawe/ EUCAR/ EC Joint Research Centre: Well-To-Wheels Analysis of Future Automotive Fuels and Powertrains
in the European Context (2007).
17 Urban buses: Alternative powertrains for Europe (2012).
CO2 footprint of electricity is crucial
0
8
31
180
225
108
122
201
H2 electrolysis grid electricity Germany
H2 electrolysis grid electricity NorwayH2 electrolysis from RES
H2 electrolysis grid electricity Netherlands
H2 steam reforming natural gasDiesel
H2 electrolysis grid electricity UK
H2 electrolysis grid electricity France
CO2 emissions of bus fuel (well-to-wheel) in 2015 [kg/100 km]
A Study for the Fuel Cells and Hydrogen Joint Undertaking by Roland Berger | 35
be a flexible mode of production, ramped up and down on short timescales. This can help to
balance electricity grids, particularly in the face of challenges associated with an increasing
penetration of intermittent renewable energy sources such as solar or wind power. Several
"power-to-gas" projects producing hydrogen from peak electricity from renewables are currently
under implementation in Europe.
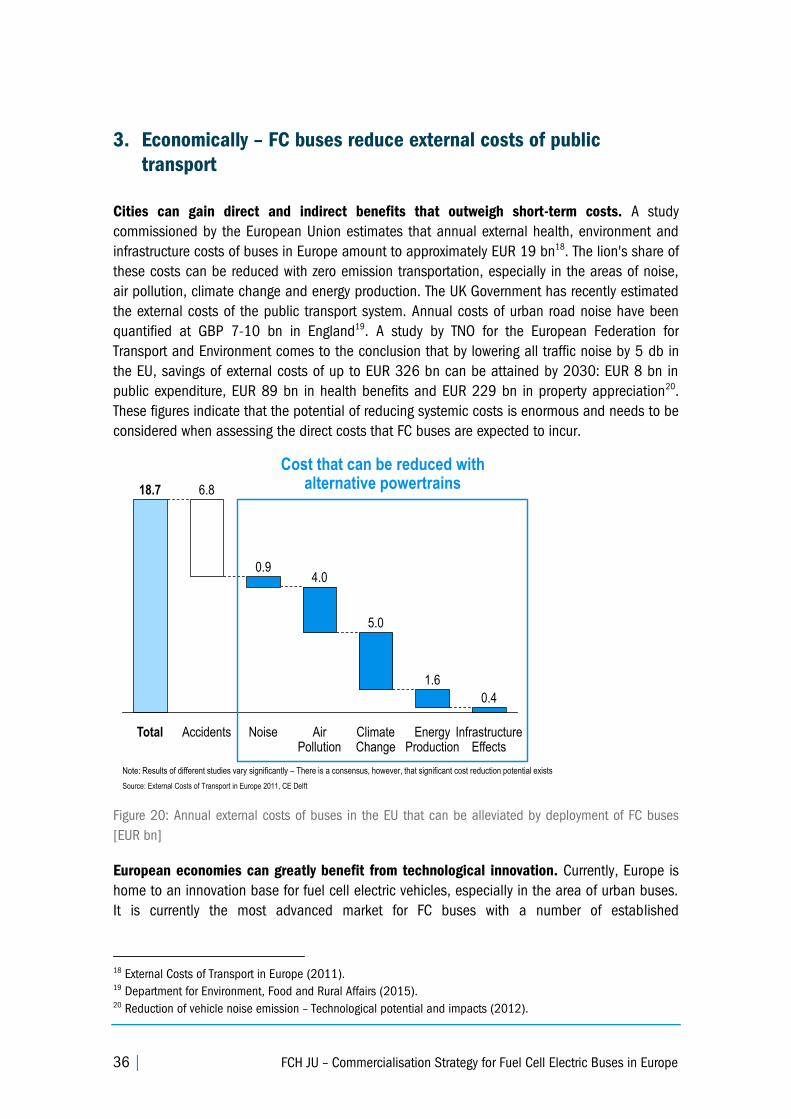
36 | FCH JU – Commercialisation Strategy for Fuel Cell Electric Buses in Europe
3. Economically – FC buses reduce external costs of public
transport
Cities can gain direct and indirect benefits that outweigh short-term costs. A study
commissioned by the European Union estimates that annual external health, environment and
infrastructure costs of buses in Europe amount to approximately EUR 19 bn18
. The lion's share of
these costs can be reduced with zero emission transportation, especially in the areas of noise,
air pollution, climate change and energy production. The UK Government has recently estimated
the external costs of the public transport system. Annual costs of urban road noise have been
quantified at GBP 7-10 bn in England19
. A study by TNO for the European Federation for
Transport and Environment comes to the conclusion that by lowering all traffic noise by 5 db in
the EU, savings of external costs of up to EUR 326 bn can be attained by 2030: EUR 8 bn in
public expenditure, EUR 89 bn in health benefits and EUR 229 bn in property appreciation20
.
These figures indicate that the potential of reducing systemic costs is enormous and needs to be
considered when assessing the direct costs that FC buses are expected to incur.
Figure 20: Annual external costs of buses in the EU that can be alleviated by deployment of FC buses
[EUR bn]
European economies can greatly benefit from technological innovation. Currently, Europe is
home to an innovation base for fuel cell electric vehicles, especially in the area of urban buses.
It is currently the most advanced market for FC buses with a number of established
18 External Costs of Transport in Europe (2011). 19 Department for Environment, Food and Rural Affairs (2015). 20 Reduction of vehicle noise emission – Technological potential and impacts (2012).
Source: External Costs of Transport in Europe 2011, CE Delft
18,7Air
PollutionInfrastructure
Effects
0.4
Climate Change
1.6
Energy Production
5.0
4.0
Noise
0.9
Accidents
6.8
Total
18.7
Cost that can be reduced withalternative powertrains
Note: Results of different studies vary significantly – There is a consensus, however, that significant cost reduction potential exists
A Study for the Fuel Cells and Hydrogen Joint Undertaking by Roland Berger | 37
manufacturers developing the technology. However, US, Chinese, Japanese and South Korean
companies are catching up very swiftly and have launched some new technological concepts
recently. Promoting the commercialisation of FC buses contributes to securing Europe's
technological innovation and high-tech industrial base and related economic benefits. The
rollout of fuel cell electric vehicles can trigger long-term positive economic benefits and the
associated creation of employment in Europe.
In Germany, FC vehicles rollout is estimated to create an economic value added of EUR 2.3
bn until the year 2020, generating approximately 31,000 additional jobs annually in the
automotive industry alone21
. These figures could be further increased by exporting FC and
hydrogen-related technology. A study commissioned by the UK Government produced similar
findings estimating that "switching from imported fossil fuels to hydrogen made in the UK would
deliver a GBP 1.3 billion annual benefit to the UK economy by 2030"22
. Hence, promoting the
FC industry in Europe can strengthen its position as the leading market and leading supplier of
this technology.
Furthermore, FC buses can help reduce the dependency on fossil fuels. Crude oil imports
amounted to more than EUR 305 bn in the year 2013 for the EU 27 countries23
– a large part of
them having been used as fuel in the transport sector. The finite nature and instability of fossil
fuel supplies from politically unstable regions constitute a major business risk for the European
transport sector. Switching to sustainable fuels produced in Europe safeguards secure fuel
supply and counteracts increasing diesel prices.
21 Approaches for Successful Commercialisation of Hydrogen Mobility in Germany (2012). 22 UK H2 Mobility - Phase 1 Results (2013). 23 Eurostat.
38 | FCH JU – Commercialisation Strategy for Fuel Cell Electric Buses in Europe
4. Operationally – FC buses are the most flexible zero emission
option
Several complementary zero emission powertrains are currently available in the market.
Besides FC buses, battery overnight, battery opportunity and trolley buses are zero emission
options currently available in the market. Trolley buses are continuously powered with electricity
by overhead lines along their entire routes across the city. Battery overnight buses are equipped
with a large battery that is fully charged during the night at the depot to power the bus during
daily operations. Battery opportunity buses have smaller batteries and are charged during the
night at the depot as well as during the day at certain points along their routes by conductive or
inductive fast charging stations. Depending on their respective operational needs, European
cities and regions will need to decide which solution fits best for them. Taking into account their
specific characteristics, FC and other zero emission powertrains are to be considered as
complementary.
Figure 21: High-level comparison of operational performance of different zero emission bus concepts
FC buses offer highest operational flexibility and productivity
FC buses offer daily ranges of up to 450 km a day, thus being able to reach the same daily
mileage as conventional diesel buses in urban bus systems in Europe. Battery overnight buses
only serve significantly reduced daily mileages with one overnight charge of about 180-250 km.
Battery opportunity buses can reach higher daily mileages, but only with frequent recharges
during the day. Also trolley buses can serve higher ranges, but require overhead lines along their
entire routes for constant electricity supply.
FC buses have full route flexibility, as they do not require any infrastructure along the route.
On the other hand, trolley buses and battery opportunity buses require recharging infrastructure
along their routes, which limits their route flexibility. Additionally, heavy investments in
recharging infrastructure across the entire public transport network are required which also has a
detrimental impact on the city landscape. City planning and permitting considerations can
complicate the installation of city-wide recharging infrastructure.
Fuel Cell ++ ++
Daily range Route flexibilityRefuelling/ recharging time ProductivityZero emission option
-+ - -Opportunity E-Bus
Overnight E-Bus
Trolley
--- +
+++ -
✓
A Study for the Fuel Cells and Hydrogen Joint Undertaking by Roland Berger | 39
FC buses require short refuelling times of below 10 minutes which are significantly lower than
for battery bus concepts: Battery overnight buses need to be recharged at night for several
hours. Battery opportunity buses need limited recharging during the night, but require frequent
recharging stops of up to 15 minutes during the day. This limits the total daily operating time
which can be achieved with these buses as compared to FC buses. Trolley buses require no
refuelling time as they are constantly supplied with electricity by overhead wires.
Due to their operational advantages, FC buses offer increased productivity compared to
battery bus concepts. Because of their short refuelling times they can be operated in passenger
service the largest part of the day, whereas battery buses require significant time for recharging.
Compared to battery opportunity buses they also require no time for refuelling/recharging during
the day: As battery opportunity buses need to be recharged regularly during the day, they cannot
be in passenger service during these timeframes which lowers their productivity. If the same
frequency of schedule needs to be kept as today, it might even be necessary to deploy
additional buses on battery opportunity lines, thus driving costs significantly.
Figure 22: Summary of operational advantages of fuel cell buses
Thus, FC buses can be operated like conventional diesel buses. FC buses offer the best
operational performance compared to other zero emission options. In terms of acceleration,
speed and gradeability, FC buses perform like conventional buses. Due to very low noise and
vibration levels, they offer a smooth driving experience and a high degree of passenger comfort.
Hence, FC buses have all the advantages of an electric vehicle, but combine these with the
operational flexibility of conventional diesel buses.
Pioneering operators show that the technology works in practice
Extensive operational experience with FC buses in regular service has been gathered in the
last 15 years. Pioneering bus operators and cities have been operating FC buses on about 8 m
High daily ranges … of up to 450 km without refuelling – Extension possible
Performance … comparable to diesel buses, e.g. acceleration, speed or gradeability
High passenger comfort … due to reduced noise levels and smooth driving experience
Full route flexibility… not bound to any required infrastructure on the route
Fast refuelling … less than 10 minutes possible – Also several refuelling cycles per day possible
Close to technology maturity … with more than 15 years and 8 m km of operational experience in Europe
40 | FCH JU – Commercialisation Strategy for Fuel Cell Electric Buses in Europe
driven kilometres in the last 15 years in Europe and demonstrate that the technology works in
practice and is safe. Currently, four FC bus projects supported by the FCH JU are ongoing (CHIC,
High V.LO-City, HyTransit and 3Emotion). In these and other ongoing demonstration projects, a
total of 84 FC buses are being operated or about to start operation in 17 cities and regions in 8
European countries. This number would be significantly enhanced by additional large-scale
demonstration projects which are envisaged to be realised until 2020 in the framework of the
FCH JU's commercialisation initiative. Whereas in most current battery bus demonstration
projects buses are operated on selected or customised routes only which fit to the operational
capabilities of these buses, FC buses have proven that they can be operated on normal routes
in regular passenger service.
Figure 23: Former and ongoing FC bus demonstration projects
FC buses have reached an advanced stage of technology development since the first
deployments in Europe more than 15 years ago. In contrast to first FC bus models, today's FC
buses have a hybrid powertrain architecture including a fuel cell and a battery for improved
energy management as well as breaking recuperation systems. Thereby, daily ranges could be
extended from 60 to 300 and up to 450 km. Fuel efficiency has increased significantly from a
consumption of about 25 kg H2/ 100 km to 8-9 kg today. Required refuelling times have
dropped from 25 min on average to below 10 minutes at the moment. Refuelling station
availability also has improved significantly. The CHIC project is currently tackling remaining
technical issues to improve FC bus availability which are systematically being addressed.
Thereby, bus availability levels are now reaching the project target; nevertheless, further
improvements are required for commercialisation. With regards to other zero emission
powertrains, trolley buses are the most mature and established technology. Battery bus
concepts are relatively new to the market and currently being tested in a number of first
demonstration projects, in which good availability levels have been reached – even though such
buses normally operate in selected or customised routes only which match their operational
> Antwerp/Flanders (DeLijn)
> Aberdeen (FirstGroup)
> San Remo (Riviera Trasporti)
> Bolzano (STA)
> Milan (ATM)
> Aargau (Postauto)
> Hamburg (Hochbahn)
> Oslo (Ruter)
> Cologne (RVK)
> London (TfL)
> Berlin (BVG)
> Whistler (BC Transit/Whistler Transit)
> Reykjavik (Strætó)
> London (TfL)
> Amsterdam (GVB)
> Porto (STCP)
> Madrid (EMT)
> Barcelona (TMB)
> Luxembourg (FLEAA)
> Stuttgart (SSB)
> Hamburg (Hochbahn)
> Stockholm (SL/Busslink)
> Aberdeen (Stagecoach)
CUTE CHIC High V.LO-City HyTransit
2001 2019
HyFLEET:CUTE
> Reykjavik (Strætó)
> London (TfL)
> Amsterdam (GVB)
> Madrid (EMT)
> Barcelona (TMB)
> Luxembourg (FLEAA)
> Hamburg (Hochbahn)
> Berlin (BVG)
3Emotion
> Cherbourg
> Rotterdam (RET)
> South Holland Province
> London (TfL)
> Flanders (DeLijn)
> Rome (RegioneLazio/Cotral SpA)
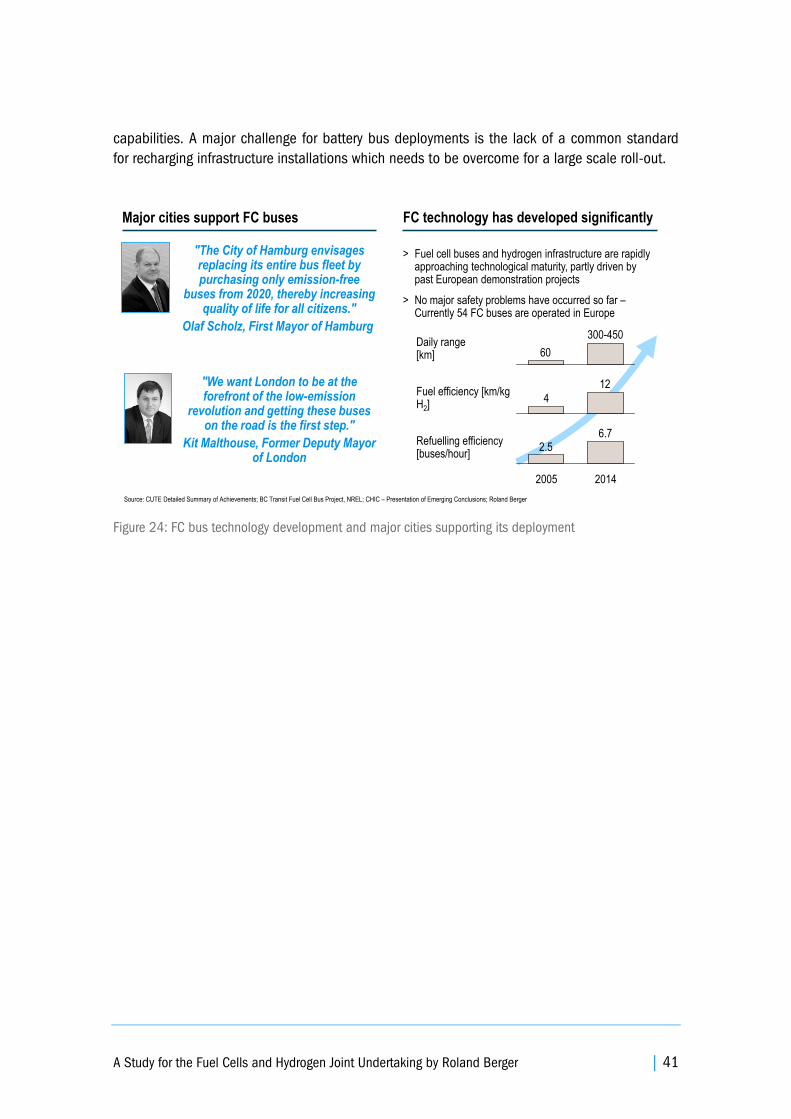
A Study for the Fuel Cells and Hydrogen Joint Undertaking by Roland Berger | 41
capabilities. A major challenge for battery bus deployments is the lack of a common standard
for recharging infrastructure installations which needs to be overcome for a large scale roll-out.
Figure 24: FC bus technology development and major cities supporting its deployment
"The City of Hamburg envisages replacing its entire bus fleet by purchasing only emission-free
buses from 2020, thereby increasing quality of life for all citizens."
Olaf Scholz, First Mayor of HamburgDaily range [km]
Fuel efficiency [km/kg H2]
Refuelling efficiency [buses/hour]
60
300-450
2.56.7
12
4
2005 2014
> Fuel cell buses and hydrogen infrastructure are rapidly approaching technological maturity, partly driven by past European demonstration projects
> No major safety problems have occurred so far –Currently 54 FC buses are operated in Europe
Source: CUTE Detailed Summary of Achievements; BC Transit Fuel Cell Bus Project, NREL; CHIC – Presentation of Emerging Conclusions; Roland Berger
"We want London to be at the forefront of the low-emission
revolution and getting these buses on the road is the first step."
Kit Malthouse, Former Deputy Mayor of London
Major cities support FC buses FC technology has developed significantly
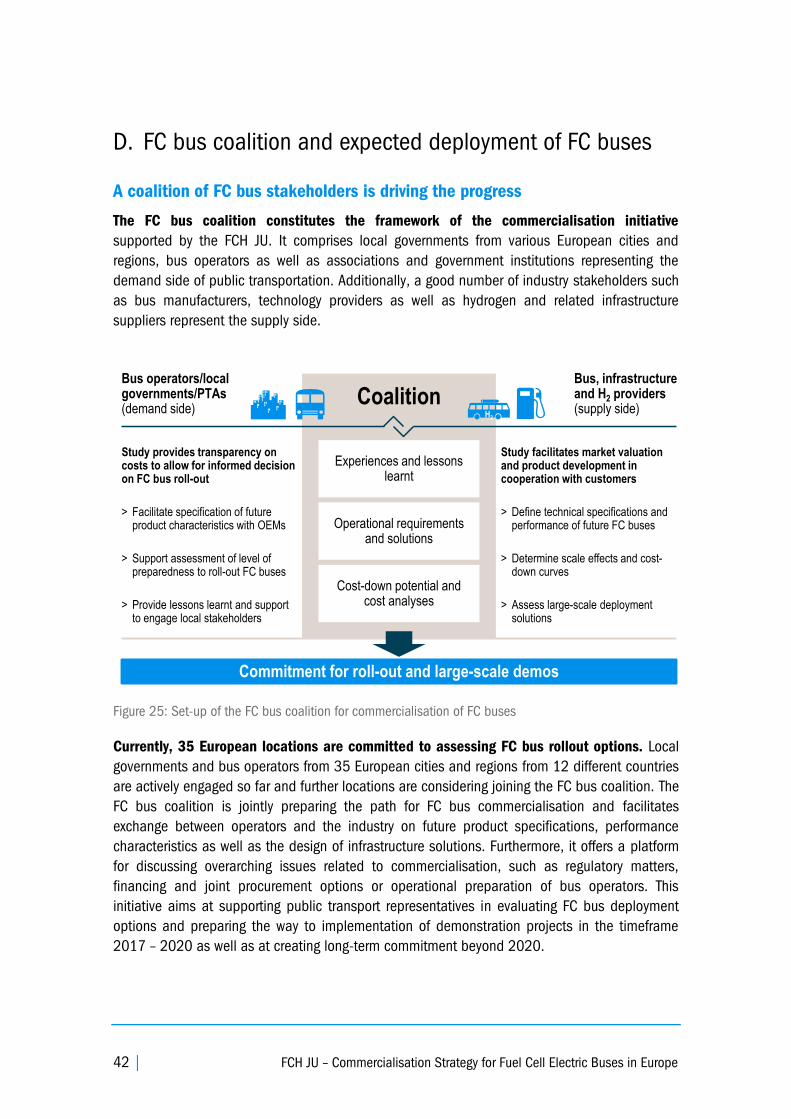
42 | FCH JU – Commercialisation Strategy for Fuel Cell Electric Buses in Europe
D. FC bus coalition and expected deployment of FC buses
A coalition of FC bus stakeholders is driving the progress
The FC bus coalition constitutes the framework of the commercialisation initiative
supported by the FCH JU. It comprises local governments from various European cities and
regions, bus operators as well as associations and government institutions representing the
demand side of public transportation. Additionally, a good number of industry stakeholders such
as bus manufacturers, technology providers as well as hydrogen and related infrastructure
suppliers represent the supply side.
Figure 25: Set-up of the FC bus coalition for commercialisation of FC buses
Currently, 35 European locations are committed to assessing FC bus rollout options. Local
governments and bus operators from 35 European cities and regions from 12 different countries
are actively engaged so far and further locations are considering joining the FC bus coalition. The
FC bus coalition is jointly preparing the path for FC bus commercialisation and facilitates
exchange between operators and the industry on future product specifications, performance
characteristics as well as the design of infrastructure solutions. Furthermore, it offers a platform
for discussing overarching issues related to commercialisation, such as regulatory matters,
financing and joint procurement options or operational preparation of bus operators. This
initiative aims at supporting public transport representatives in evaluating FC bus deployment
options and preparing the way to implementation of demonstration projects in the timeframe
2017 – 2020 as well as at creating long-term commitment beyond 2020.
Commitment for roll-out and large-scale demos
Study provides transparency on costs to allow for informed decision on FC bus roll-out
> Facilitate specification of future product characteristics with OEMs
> Support assessment of level of preparedness to roll-out FC buses
> Provide lessons learnt and support to engage local stakeholders
CoalitionBus operators/local governments/PTAs(demand side)
Bus, infrastructure and H2 providers(supply side)
Study facilitates market valuation and product development in cooperation with customers
> Define technical specifications and performance of future FC buses
> Determine scale effects and cost-down curves
> Assess large-scale deployment solutions
Experiences and lessons learnt
Operational requirements and solutions
Cost-down potential andcost analyses
H2
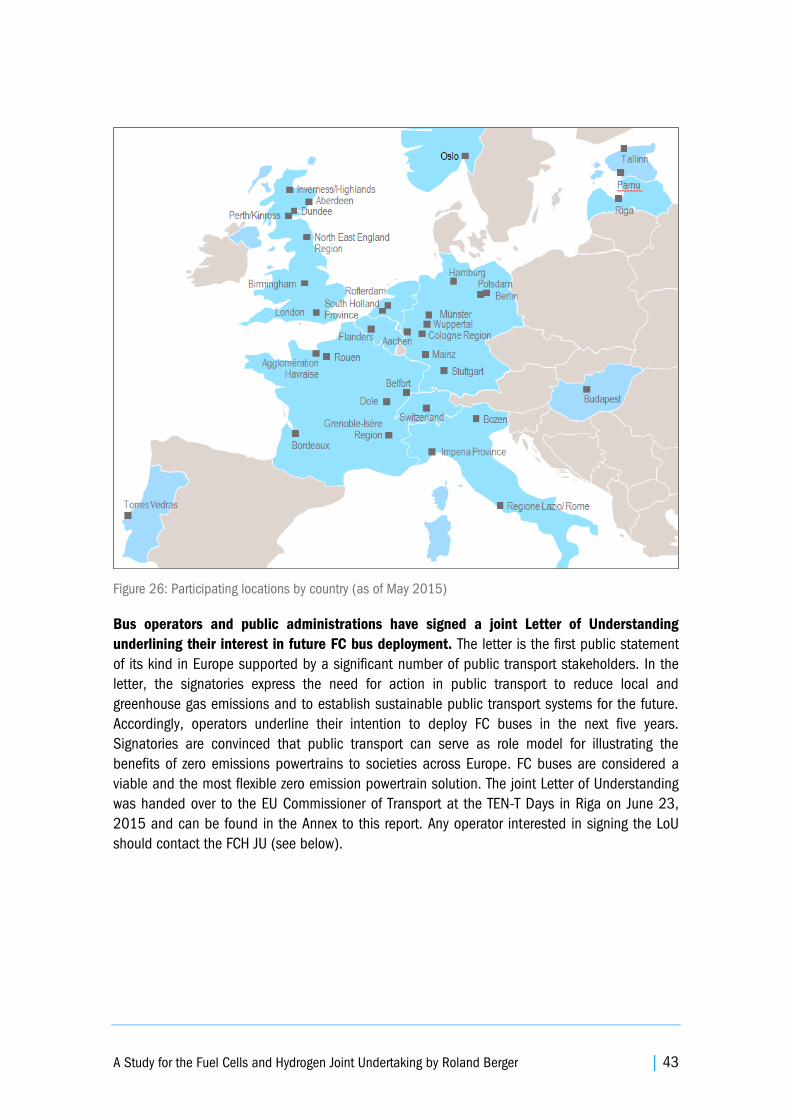
A Study for the Fuel Cells and Hydrogen Joint Undertaking by Roland Berger | 43
Figure 26: Participating locations by country (as of May 2015)
Bus operators and public administrations have signed a joint Letter of Understanding
underlining their interest in future FC bus deployment. The letter is the first public statement
of its kind in Europe supported by a significant number of public transport stakeholders. In the
letter, the signatories express the need for action in public transport to reduce local and
greenhouse gas emissions and to establish sustainable public transport systems for the future.
Accordingly, operators underline their intention to deploy FC buses in the next five years.
Signatories are convinced that public transport can serve as role model for illustrating the
benefits of zero emissions powertrains to societies across Europe. FC buses are considered a
viable and the most flexible zero emission powertrain solution. The joint Letter of Understanding
was handed over to the EU Commissioner of Transport at the TEN-T Days in Riga on June 23,
2015 and can be found in the Annex to this report. Any operator interested in signing the LoU
should contact the FCH JU (see below).
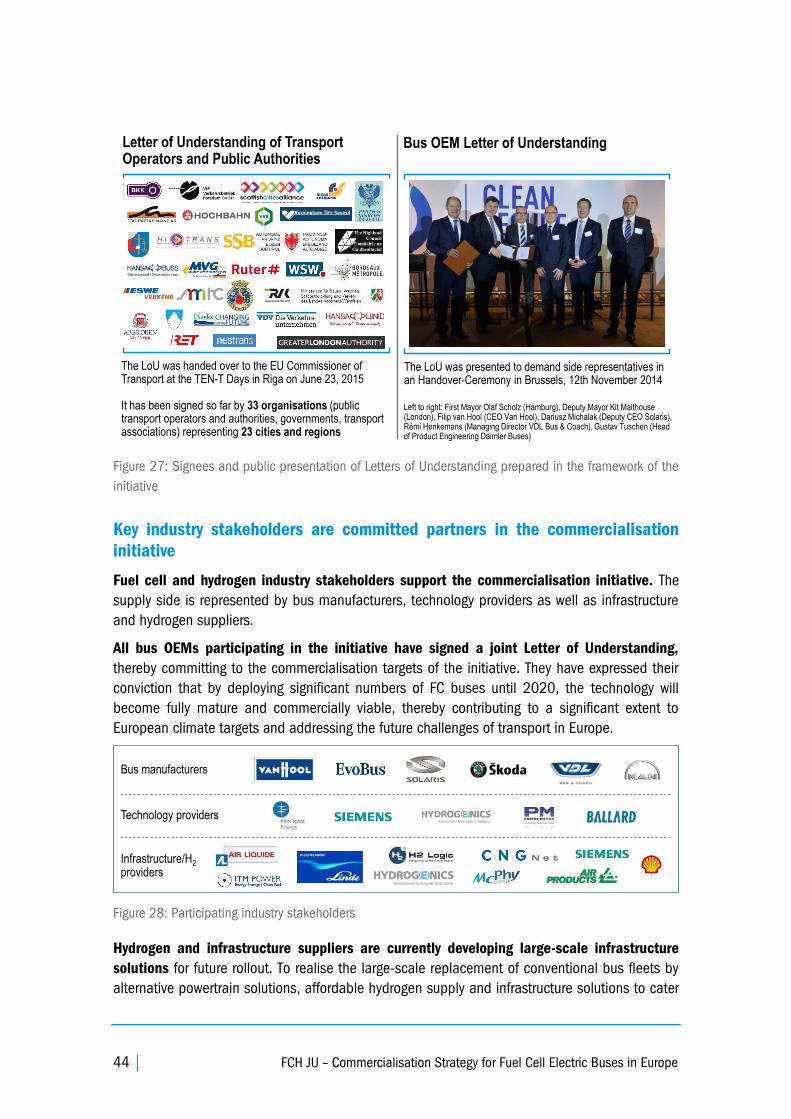
44 | FCH JU – Commercialisation Strategy for Fuel Cell Electric Buses in Europe
Figure 27: Signees and public presentation of Letters of Understanding prepared in the framework of the
initiative
Key industry stakeholders are committed partners in the commercialisation
initiative
Fuel cell and hydrogen industry stakeholders support the commercialisation initiative. The
supply side is represented by bus manufacturers, technology providers as well as infrastructure
and hydrogen suppliers.
All bus OEMs participating in the initiative have signed a joint Letter of Understanding,
thereby committing to the commercialisation targets of the initiative. They have expressed their
conviction that by deploying significant numbers of FC buses until 2020, the technology will
become fully mature and commercially viable, thereby contributing to a significant extent to
European climate targets and addressing the future challenges of transport in Europe.
Figure 28: Participating industry stakeholders
Hydrogen and infrastructure suppliers are currently developing large-scale infrastructure
solutions for future rollout. To realise the large-scale replacement of conventional bus fleets by
alternative powertrain solutions, affordable hydrogen supply and infrastructure solutions to cater
Bus OEM Letter of Understanding
The LoU was presented to demand side representatives in an Handover-Ceremony in Brussels, 12th November 2014
Left to right: First Mayor Olaf Scholz (Hamburg), Deputy Mayor Kit Malthouse (London), Filip van Hool (CEO Van Hool), Dariusz Michalak (Deputy CEO Solaris), Rémi Henkemans (Managing Director VDL Bus & Coach), Gustav Tuschen (Head of Product Engineering Daimler Buses)
Letter of Understanding of Transport Operators and Public Authorities
The LoU was handed over to the EU Commissioner of Transport at the TEN-T Days in Riga on June 23, 2015
It has been signed so far by 33 organisations (public transport operators and authorities, governments, transport associations) representing 23 cities and regions
Bus manufacturers
Infrastructure/H2
providers
Technology providers
A Study for the Fuel Cells and Hydrogen Joint Undertaking by Roland Berger | 45
for large FC bus depots will need to be developed. The FCH JU is supporting the technical design
of such solutions by making dedicated infrastructure grants available and industry partners are
investing at the same time in bringing forward large-scale solutions needed for full market
introduction. Currently, a study on the future engineering design is ongoing.
Many bus operators and cities have already taken important steps to prepare
for FC bus rollout
On average, the level of preparedness for FC bus rollout is well developed. Some locations
already have FC buses in service and have already completed the most important planning and
rollout steps, others are beginning to explore FC bus deployment options. Several areas have
been identified in which participating locations currently see challenges for their rollout
preparations: Assessing and complying with regulatory and safety requirements, identifying the
most suitable infrastructure solution, securing local stakeholder support to switch to a potentially
more costly technology as well as acquiring funding to close the expected financing gap to the
diesel bus.
Operators and cities with experience in FC bus rollout demonstrate that challenges can be
overcome. There are a number of coalition members who are well advanced in preparing for a
large-scale rollout. For example, they have successfully fulfilled all requirements for the safe
operation of FC buses and have successfully undertaken permitting processes to acquire new
land for a large-capacity infrastructure in densely populated urban areas. In these locations,
local governments are firmly committed to the rollout and have allocated funding to support
operators in closing the cost gap. Other bus operators and local governments can benefit from
their experiences in the framework of the initiative.
Within the coalition, several regional clusters of 5-10 cities and regions have been formed
to jointly prepare large-scale FC bus demonstration projects. As framework conditions in terms
of regulatory regimes, the structure of public transport as well as procurement systems differ
between the European countries, the formation of regional clusters on a national level has been
identified as a viable approach for the preparation of demonstration of FC bus projects within
the coalition. Within the clusters, participants jointly work on mobilising and combining local,
national and European (FCH JU) co-financing. Regional clusters with operators/local
governments and, partly, with industry representatives are currently established for France,
Germany, the Netherlands/Belgium, UK/Scotland and the North East of Europe. Interested
locations are invited to join the regional clusters, but also individual locations from outside these
regional clusters are welcome (see details at the end of this report).
Jointly procuring FC buses is expected to achieve price reductions. On the one hand, joint
large orders provide the necessary volumes for the industry to further develop the technology
and realise significant price reductions. On the other hand, joint large orders are expected to
have a favourable impact on competition in the market and to create an additional incentive for
the industry to reduce prices. While joint procurement on national or European levels is
enshrined in European legislation and is encouraged by the European Commission specifically
for the procurement of alternative powertrain vehicles, several practical questions are currently
being solved by the participants. This concerns, for example, the standardisation of bus
46 | FCH JU – Commercialisation Strategy for Fuel Cell Electric Buses in Europe
specifications, the harmonisation of bus procurement schedules as well as the
conceptualisation of a contractual framework for joint procurement. These questions are
currently being discussed in the regional clusters and approaches for implementation will be
further developed with the support of the FCH JU during the next phase of the initiative.
Current planning for FC bus rollout within the coalition underlines the interest
in the technology
Cities and regions currently represented in the coalition constitute a significant market
potential for FC buses in the coming years. In total, all participating locations currently operate
about 30,000 buses in their public transport systems. This represents approximately 8-10% of
the current estimated total bus fleet in the EU 28, Switzerland and Norway, thereby constituting
a significant share of the bus market in Europe24
. Assuming a standard bus lifetime of 12 years,
approximately 2,500 buses need to be replaced annually in the bus fleets of participating
locations. If all the buses in the participants' bus fleets were to be replaced by FC buses using
hydrogen produced from 100% RES electricity, about 2 m tonnes of CO2 could be saved
annually.
Currently, some of the participating locations envisage deploying between 20 or more FC
buses by 2020. The envisaged size of future potential FC bus fleets differs between the
participating locations, depending on their prior experience with alternative powertrains and the
political commitment of their respective local governments. A part of the current coalition
members plans to deploy 20 or more FC buses by 2020. Hence, a number of 300-400 FC
buses could be achieved, provided that already engaged cities and operators obtain the
required funding support from different sources to roll out FC buses.
The initiative will give a major push to further market development by quadrupling the current
number of FC buses in operation in Europe. At the same time, such a large-scale deployment of
FC buses will support scale effects and cost reductions as expected in the niche scenario of the
heavy-duty pathway. This is an important contribution to the future development of the market.
By creating sustainable and sufficient demand for the FC buses, the further technology
development to full maturity and significant cost reductions will be supported. The initiative
constitutes an important step towards reaching commercialisation in the sense of serial
production, improved cost competitiveness and sustainable demand without public subsidies.
The development of a fully commercial market will however require additional future efforts by all
market stakeholders. The study and coalition offer a systematic approach to FC bus rollout and,
thereby, lay the foundations for supporting the transition process so that commercialisation can
be achieved.
Current trends in public transport drive the change to zero emission powertrains in the next
years worldwide and in Europe in particular. In the last years, several new powertrain options
24 Estimation based on Eurostat data and European Commission: Study of passenger transport by coach (2009).
Eurostat data indicates that size of bus fleet overall remained stable since 2009. Estimation excludes coaches.
Please note that definitions of buses and coaches differ. Overall data availability is very limited; hence, estimation
is very preliminary only.
A Study for the Fuel Cells and Hydrogen Joint Undertaking by Roland Berger | 47
and alternative fuels have become available in the market offering new opportunities for
greening public transport systems: Biofuels (biodiesel, biogas and bioethanol) as well as hybrid,
plug-in hybrid, battery and fuel cell bus models. Ongoing FC bus demonstration activities
currently take place in 14 European cities in FCH JU-funded projects; further individual small-
scale demonstration projects are also ongoing. In the Zero Emission Urban Bus System (ZeEUS)
project, 10 European locations are testing different battery and plug-in hybrid bus concepts.
Numerous other cities and regions are investing in hybrid, plug-in hybrid and electric buses at
the moment. Currently, the deployment of all of these solutions incurs a cost premium compared
to conventional diesel buses. These initiatives illustrate the readiness to invest in alternative
powertrains and to attain immediate environmental benefits despite partly severe funding
constraints in public transport. Additionally, many cities invest in upgrading their public transport
system to provide better service quality to their citizens, for example by installing BRT (Bus Rapid
Transit) services or tramway systems. In principle, these cities also constitute a market potential
for zero emission powertrains offering environmental benefits and an improved customer
experience.
The market share of zero emission powertrains is expected to grow significantly until 2020.
The total bus market in Europe is expected to grow about 3-5% annually until 2020. Whereas
the share of zero emission powertrains is difficult to estimate and is dependent on several
important framework conditions (e.g. regulation, public transport financing, technology
development), all currently available market analyses expect a significant increase in the share
of zero emission powertrains in future bus orders. Findings from a UITP survey from 2013 among
63 cities in 24 European countries indicate that that 60% of the respondents are willing to
renew their fleet's composition and that 40% would like to invest in electric powertrains (hybrid
and fully electric vehicles).25
Required deployment levels for commercialisation can be reached in a European ramp-up
scenario. This scenario considers deployment plans of operators in the coalition as well as
operators that yet need to be mobilised. The framework of this scenario is the assumed total
cumulative volume of 8,000-10,000 FC buses required until 2025 to reach the cost projections
of the production-at-scale scenario of the heavy-duty pathway. The 35 currently participating
locations of the FC bus coalition are committed to deploying 300 to 400 FC buses until 2020 in
the framework of this initiative. These are included in the ramp-up scenario. Beyond 2020, it is
assumed that these locations start replacing larger parts of their fleet with FC buses within their
regular annual replacement schedules: It is assumed that these pioneering locations deploy 20
FC buses each in 2021 and continue to deploy up to 40 FC buses each year until 2025. This
would sum up to 1,400 FC buses in 2025. In order to reach the target number of 8,000 buses,
further locations willing to deploy FC buses need to be engaged. For the ramp-up scenario as
shown below, it has been assumed that from 2015 onwards each year 15 new locations can be
attracted which intend to deploy FC buses in the future. This number conservatively reflects the
growth rate of the existing coalition in its first year. If these additionally mobilised locations start
deploying FC buses from 2021 onwards with a modest annual deployment schedule of 10 FC
buses going up to 15 buses in 2025, significant volumes of FC buses can be reached (see
25 UITP (2013).
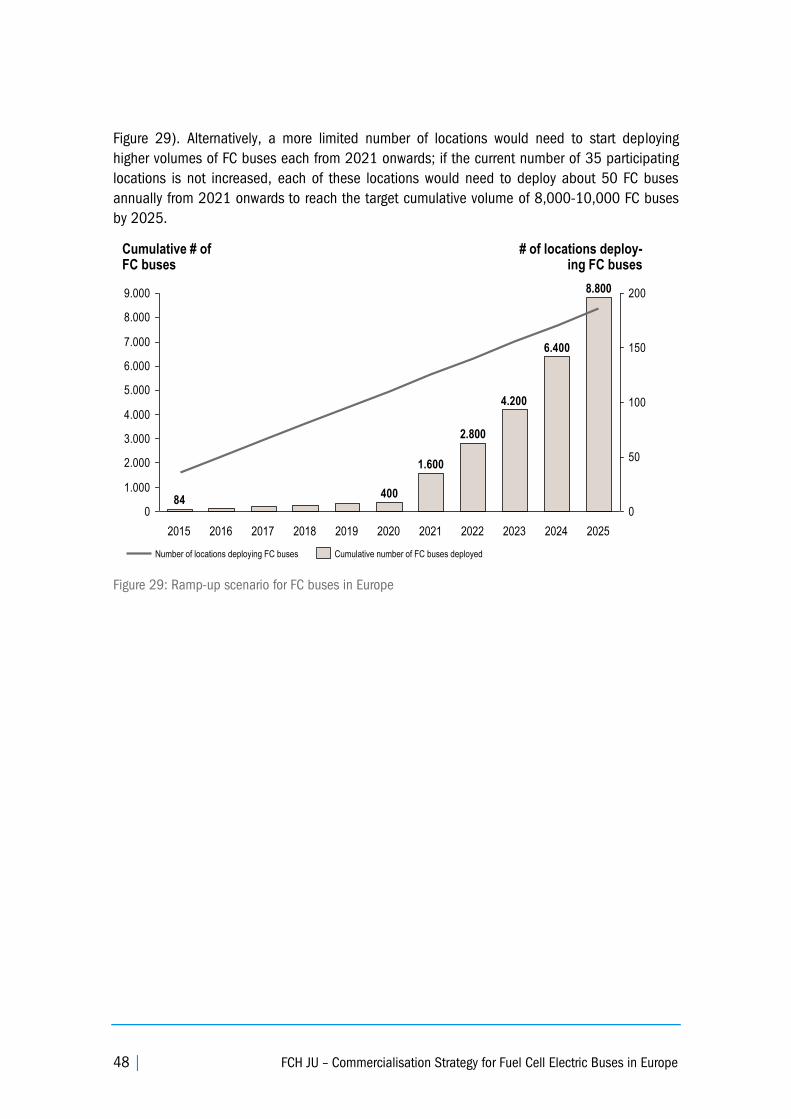
48 | FCH JU – Commercialisation Strategy for Fuel Cell Electric Buses in Europe
Figure 29). Alternatively, a more limited number of locations would need to start deploying
higher volumes of FC buses each from 2021 onwards; if the current number of 35 participating
locations is not increased, each of these locations would need to deploy about 50 FC buses
annually from 2021 onwards to reach the target cumulative volume of 8,000-10,000 FC buses
by 2025.
Figure 29: Ramp-up scenario for FC buses in Europe
6.400
4.200
1.600
40084
0
1.000
2.000
3.000
4.000
5.000
6.000
7.000
8.000
9.000
0
50
100
150
200
2015
8.800
2.800
2019 2020 2021 2022 2023 2024 20252016 2017 2018
Cumulative number of FC buses deployedNumber of locations deploying FC buses
Cumulative # ofFC buses
# of locations deploy-ing FC buses
A Study for the Fuel Cells and Hydrogen Joint Undertaking by Roland Berger | 49
E. Next steps and how to get involved in the FC bus coalition
The pathway to clean transport has been prepared – now is the time to engage
The FC bus coalition is committed to taking the next step in market development. 45 local
governments and public transport operators from 35 European cities and regions have formed a
strong coalition with the industry to prepare and implement large-scale demonstration projects.
Extensive operational experience has been gathered and high technology maturity has been
reached with ongoing demonstration projects. Now is the right time to act - a strong European
network and EU support scheme are available to provide funding support and share
accumulated knowledge and lessons learnt.
The FCH JU manages a dedicated funding program to support commercialisation of
hydrogen and FC technologies. During the period 2014-2020 approximately EUR 650 m have
been allocated to realise all FCH JU projects. A part of these funds is expected to be allocated
for large-scale FC bus demonstration projects. Locations willing to go forward with FC bus rollout
shall have the opportunity to apply for FCH JU grants to co-fund their projects.
The zero emission future is coming – act now to be prepared. Early engagement allows to
realize the benefits of zero emissions today, to build up in-house knowledge and practical
experience as well as is an active contribution to taking responsibility for preparing the future of
our public transport systems. Acting now avoids the risks associated with making a rapid shift
later when stricter regulation has come into force.
All stakeholders need to engage in a joint effort to reach commercialisation
The industry needs to further develop their products and offer competitive prices in order to
allow for large-scale deployments of FC buses. Significant cost reductions both for FC buses and
related infrastructure in terms of investment and operations costs are required to reduce overall
costs. Similarly, the cost-efficient hydrogen prices as presented in this study are required to
achieve competitive operational costs of FC buses. Additionally, products need to be developed
further to reach full technological maturity and improved reliability. Suitable service support
needs to be in place to allow for operation of larger fleets.
Making large-scale demonstration projects to foster commercialisation requires support
from local and national authorities. This involves, firstly, financing parts of the cost premium in
comparison to conventional diesel buses, and, secondly, assessing which regulation promotes
alternative powertrains best, e.g. reducing subsidies for the operation of diesel buses, ensuring a
competitive tax regime for hydrogen as a fuel, simplifying permitting procedures for the
construction of new refuelling infrastructure and bus depots, etc. During the next phase of the
initiative, participating locations and regional clusters will need to mobilise the required match
funding at national and local levels.
Further cities and operators need to engage and jointly prepare for large-scale deployment
projects. Preparing joint procurement of FC buses is expected to stand at the centre of the work
in regional clusters. Jointly procuring FC buses in cooperation with other bus operators and/or
public transport authorities in the same region can help to achieve the scale effects required for
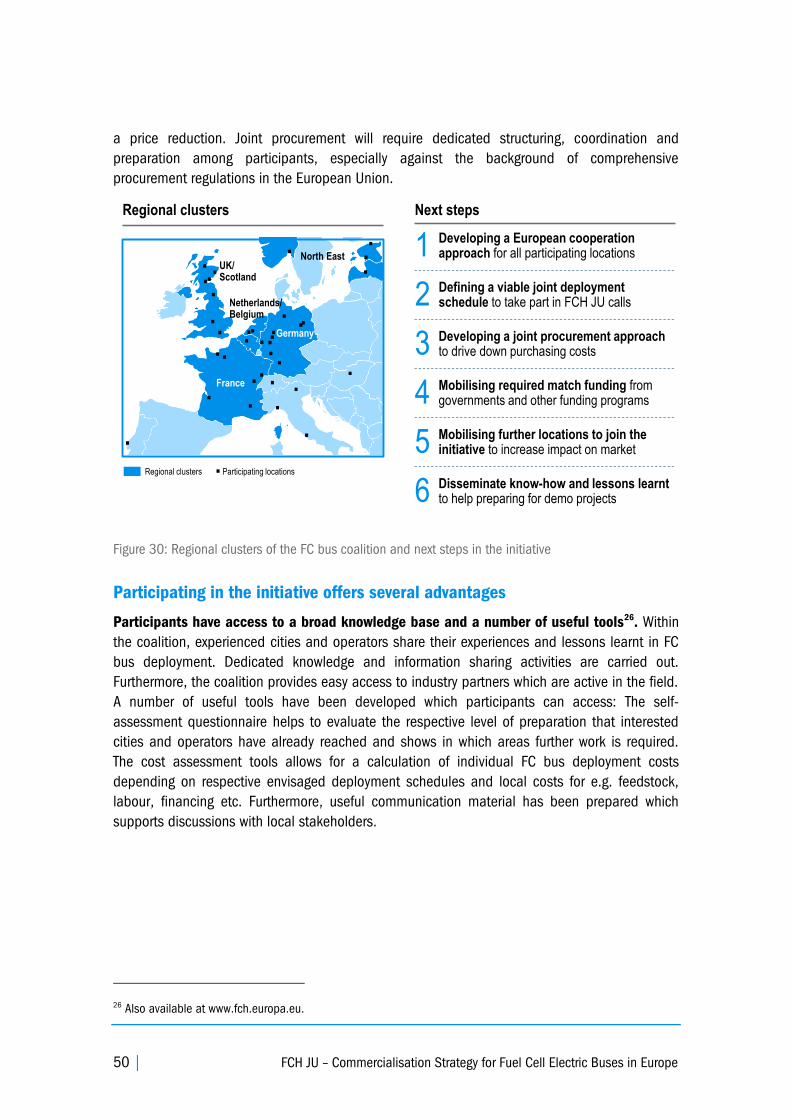
50 | FCH JU – Commercialisation Strategy for Fuel Cell Electric Buses in Europe
a price reduction. Joint procurement will require dedicated structuring, coordination and
preparation among participants, especially against the background of comprehensive
procurement regulations in the European Union.
Figure 30: Regional clusters of the FC bus coalition and next steps in the initiative
Participating in the initiative offers several advantages
Participants have access to a broad knowledge base and a number of useful tools26
. Within
the coalition, experienced cities and operators share their experiences and lessons learnt in FC
bus deployment. Dedicated knowledge and information sharing activities are carried out.
Furthermore, the coalition provides easy access to industry partners which are active in the field.
A number of useful tools have been developed which participants can access: The self-
assessment questionnaire helps to evaluate the respective level of preparation that interested
cities and operators have already reached and shows in which areas further work is required.
The cost assessment tools allows for a calculation of individual FC bus deployment costs
depending on respective envisaged deployment schedules and local costs for e.g. feedstock,
labour, financing etc. Furthermore, useful communication material has been prepared which
supports discussions with local stakeholders.
26 Also available at www.fch.europa.eu.
4 Mobilising required match funding from governments and other funding programs
5 Mobilising further locations to join the initiative to increase impact on market
Next steps
6 Disseminate know-how and lessons learnt to help preparing for demo projects
1 Developing a European cooperation approach for all participating locations
Regional clusters
3 Developing a joint procurement approach to drive down purchasing costs
2 Defining a viable joint deployment schedule to take part in FCH JU calls
Regional clusters Participating locations
France
Netherlands/ Belgium
Germany
UK/ Scotland
North East
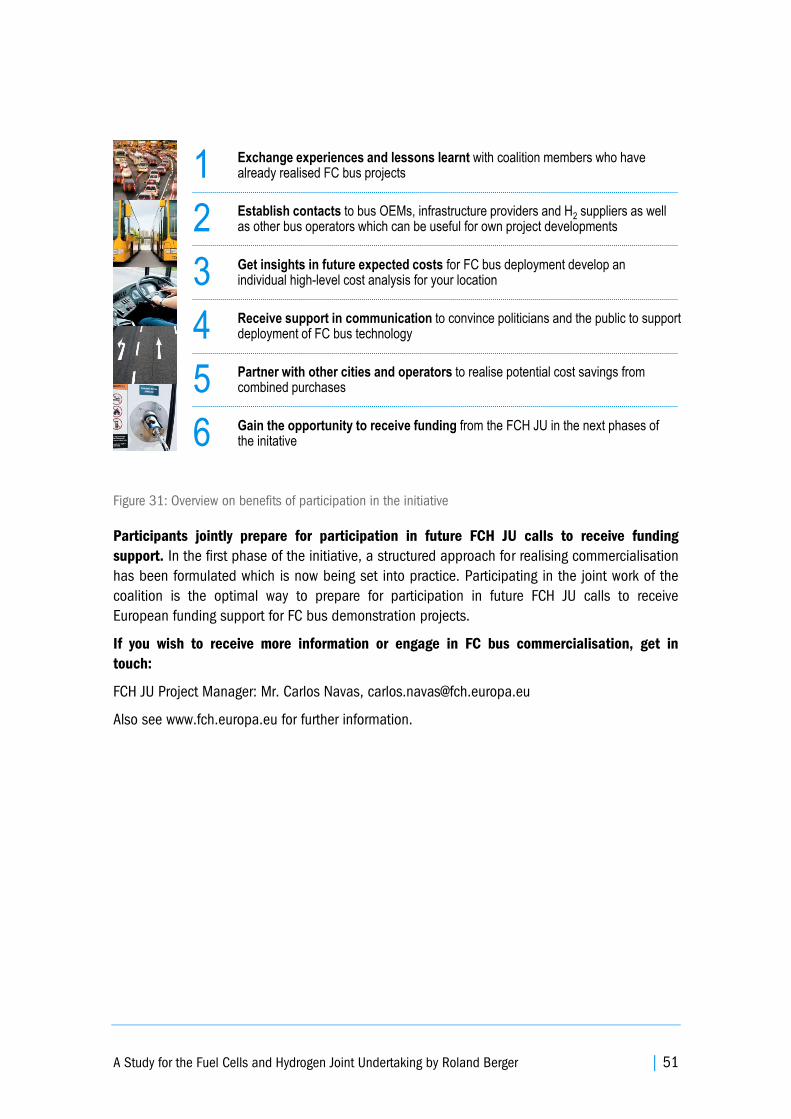
A Study for the Fuel Cells and Hydrogen Joint Undertaking by Roland Berger | 51
Figure 31: Overview on benefits of participation in the initiative
Participants jointly prepare for participation in future FCH JU calls to receive funding
support. In the first phase of the initiative, a structured approach for realising commercialisation
has been formulated which is now being set into practice. Participating in the joint work of the
coalition is the optimal way to prepare for participation in future FCH JU calls to receive
European funding support for FC bus demonstration projects.
If you wish to receive more information or engage in FC bus commercialisation, get in
touch:
FCH JU Project Manager: Mr. Carlos Navas, [email protected]
Also see www.fch.europa.eu for further information.
1 Exchange experiences and lessons learnt with coalition members who have already realised FC bus projects
2 Establish contacts to bus OEMs, infrastructure providers and H2 suppliers as well as other bus operators which can be useful for own project developments
3 Get insights in future expected costs for FC bus deployment develop an individual high-level cost analysis for your location
4 Receive support in communication to convince politicians and the public to support deployment of FC bus technology
5 Partner with other cities and operators to realise potential cost savings from combined purchases
6 Gain the opportunity to receive funding from the FCH JU in the next phases of the initative

52 | FCH JU – Commercialisation Strategy for Fuel Cell Electric Buses in Europe
Annex
A Study for the Fuel Cells and Hydrogen Joint Undertaking by Roland Berger | 53
Annex 1 – Letter of Understanding of Public Transport
Operators and Public Authorities
54 | FCH JU – Commercialisation Strategy for Fuel Cell Electric Buses in Europe
A Study for the Fuel Cells and Hydrogen Joint Undertaking by Roland Berger | 55
56 | FCH JU – Commercialisation Strategy for Fuel Cell Electric Buses in Europe
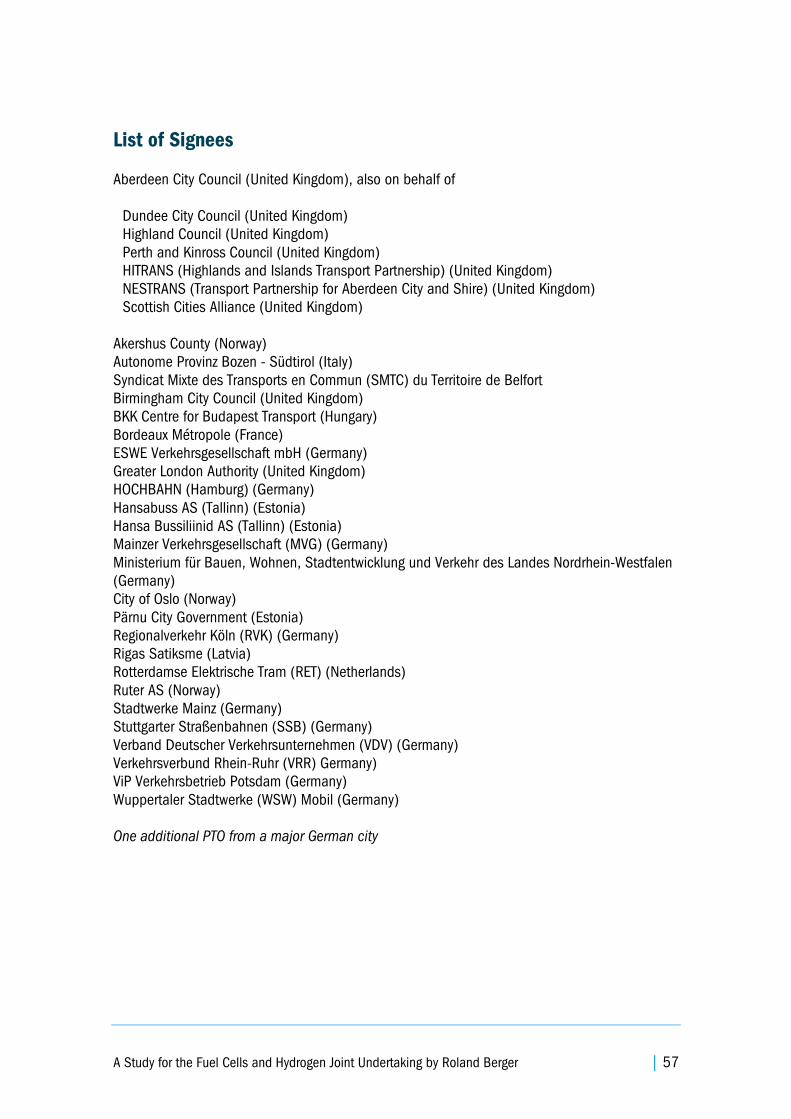
A Study for the Fuel Cells and Hydrogen Joint Undertaking by Roland Berger | 57
List of Signees
Aberdeen City Council (United Kingdom), also on behalf of
Dundee City Council (United Kingdom)
Highland Council (United Kingdom)
Perth and Kinross Council (United Kingdom)
HITRANS (Highlands and Islands Transport Partnership) (United Kingdom)
NESTRANS (Transport Partnership for Aberdeen City and Shire) (United Kingdom)
Scottish Cities Alliance (United Kingdom)
Akershus County (Norway)
Autonome Provinz Bozen - Südtirol (Italy)
Syndicat Mixte des Transports en Commun (SMTC) du Territoire de Belfort
Birmingham City Council (United Kingdom)
BKK Centre for Budapest Transport (Hungary)
Bordeaux Métropole (France)
ESWE Verkehrsgesellschaft mbH (Germany)
Greater London Authority (United Kingdom)
HOCHBAHN (Hamburg) (Germany)
Hansabuss AS (Tallinn) (Estonia)
Hansa Bussiliinid AS (Tallinn) (Estonia)
Mainzer Verkehrsgesellschaft (MVG) (Germany)
Ministerium für Bauen, Wohnen, Stadtentwicklung und Verkehr des Landes Nordrhein-Westfalen
(Germany)
City of Oslo (Norway)
Pärnu City Government (Estonia)
Regionalverkehr Köln (RVK) (Germany)
Rigas Satiksme (Latvia)
Rotterdamse Elektrische Tram (RET) (Netherlands)
Ruter AS (Norway)
Stadtwerke Mainz (Germany)
Stuttgarter Straßenbahnen (SSB) (Germany)
Verband Deutscher Verkehrsunternehmen (VDV) (Germany)
Verkehrsverbund Rhein-Ruhr (VRR) Germany)
ViP Verkehrsbetrieb Potsdam (Germany)
Wuppertaler Stadtwerke (WSW) Mobil (Germany)
One additional PTO from a major German city
58 | FCH JU – Commercialisation Strategy for Fuel Cell Electric Buses in Europe
Annex 2 – Letter of Understanding of bus OEMs
A Study for the Fuel Cells and Hydrogen Joint Undertaking by Roland Berger | 59
60 | FCH JU – Commercialisation Strategy for Fuel Cell Electric Buses in Europe
A Study for the Fuel Cells and Hydrogen Joint Undertaking by Roland Berger | 61
Annex 3 – Cost analysis principles, methodology and
assumptions
Cost projections for FC buses in Europe have been developed in an interactive
process
Reliable cost projections for FC buses are crucial to the commercialisation initiative. In view
of limited public budgets of many municipalities and public bus operators as well as the tight
cost planning of private operators, making available cost projections for purchasing and
operating costs of FC buses are crucial to inform the decision-making process to rollout FC
buses. The cost projections presented in this report provide a first high-level indication to
operators. They have been developed in an interactive process and joint exercise with the
coalition industry partners, i.e. bus manufacturers, technology providers, infrastructure
manufacturers and hydrogen suppliers.
The study follows six guiding principles for the cost analysis
1. Market orientation – Technological solutions considered and prices presented are
available on the market and reflect industry expectations. Not only did the Clean Team ensure
the validity of the data points obtained, they also verified that they are based on assumptions
which are reasonable for market conditions.
2. Least costly option – Overall, the study presents the least costly options. In order to show
the potential of the technological solutions, the Clean Team identified, compiled and presented
the lowest data points provided to arrive at the final figures while ensuring the figures are
reliable.
3. Comparability – Comparability of the data presented is ensured by verifying that figures
provided and presented are based on the same assumptions. Not only was this methodology
used when calculating the least costly option of data points, but also when considering
underlying macroeconomic factors as well as comparing costs of FC buses with those of diesel
buses.
4. Technological development –Increasing efficiency is dynamically reflected in the data
presented. For example, technological gains in FC bus availability and fuel consumption are
considered. A bus purchased in 2015 is considered to have a lower availability throughout its
lifetime than a bus purchased in 2020 or later. Additionally, the overall fuel consumption of FC
buses is expected to decrease as new bus models are brought to the market and the overall
technology develops.
5. Sensitivities – The effect of influencing factors have been assessed in a sensitivities
analysis. Besides the base case calculations, sensitivity analyses were performed to help
operators envisage the potential effects of varying different base assumptions. Overall, this
approach allows the study to portray a realistic base case and show more optimistic and
conservative scenarios. Sensitivity analyses were performed for three parameters: Feedstock
prices (electricity and natural gas), financing costs and bus lifetime.
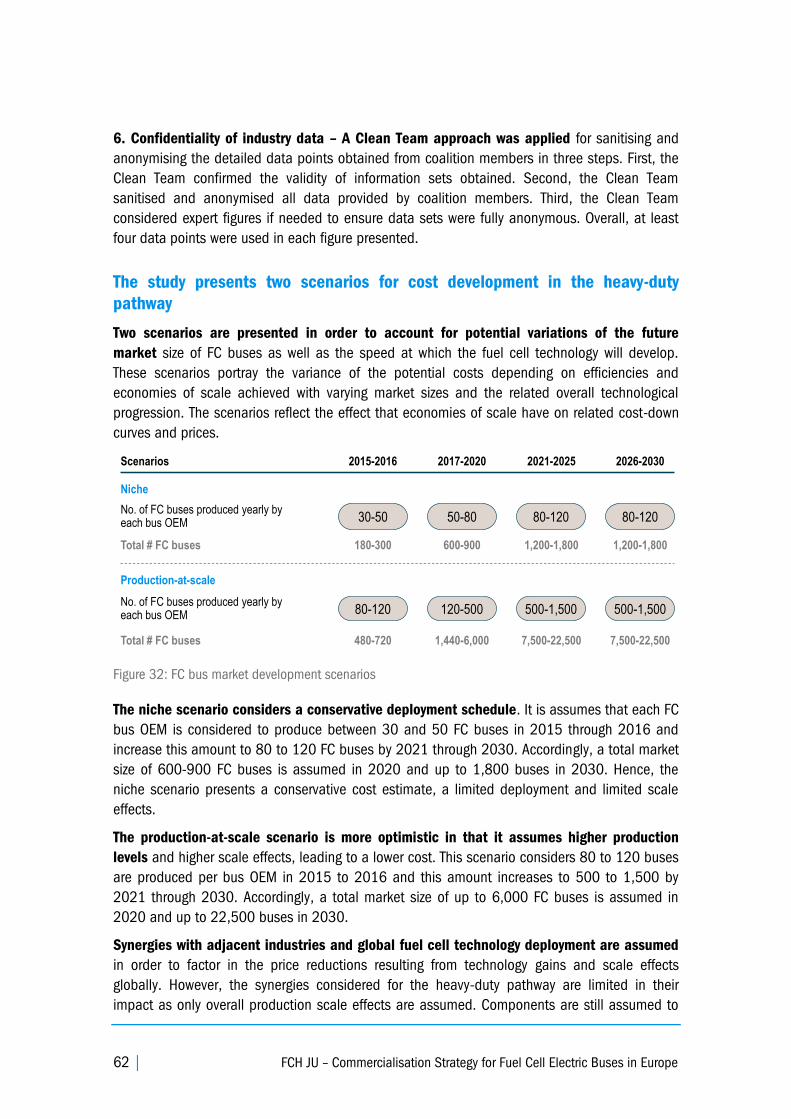
62 | FCH JU – Commercialisation Strategy for Fuel Cell Electric Buses in Europe
6. Confidentiality of industry data – A Clean Team approach was applied for sanitising and
anonymising the detailed data points obtained from coalition members in three steps. First, the
Clean Team confirmed the validity of information sets obtained. Second, the Clean Team
sanitised and anonymised all data provided by coalition members. Third, the Clean Team
considered expert figures if needed to ensure data sets were fully anonymous. Overall, at least
four data points were used in each figure presented.
The study presents two scenarios for cost development in the heavy-duty
pathway
Two scenarios are presented in order to account for potential variations of the future
market size of FC buses as well as the speed at which the fuel cell technology will develop.
These scenarios portray the variance of the potential costs depending on efficiencies and
economies of scale achieved with varying market sizes and the related overall technological
progression. The scenarios reflect the effect that economies of scale have on related cost-down
curves and prices.
Figure 32: FC bus market development scenarios
The niche scenario considers a conservative deployment schedule. It is assumes that each FC
bus OEM is considered to produce between 30 and 50 FC buses in 2015 through 2016 and
increase this amount to 80 to 120 FC buses by 2021 through 2030. Accordingly, a total market
size of 600-900 FC buses is assumed in 2020 and up to 1,800 buses in 2030. Hence, the
niche scenario presents a conservative cost estimate, a limited deployment and limited scale
effects.
The production-at-scale scenario is more optimistic in that it assumes higher production
levels and higher scale effects, leading to a lower cost. This scenario considers 80 to 120 buses
are produced per bus OEM in 2015 to 2016 and this amount increases to 500 to 1,500 by
2021 through 2030. Accordingly, a total market size of up to 6,000 FC buses is assumed in
2020 and up to 22,500 buses in 2030.
Synergies with adjacent industries and global fuel cell technology deployment are assumed
in order to factor in the price reductions resulting from technology gains and scale effects
globally. However, the synergies considered for the heavy-duty pathway are limited in their
impact as only overall production scale effects are assumed. Components are still assumed to
No. of FC buses produced yearly by each bus OEM
Scenarios
Niche
Production-at-scale
500-1,500
Total # FC buses
2015-2016
480-720
180-300
2017-2020
1,440-6,000
600-900
2021-2025
7,500-22,500
1,200-1,800
2026-2030
7,500-22,500
1,200-1,800
500-1,500120-50080-120
80-120 80-12050-8030-50
Total # FC buses
No. of FC buses produced yearly by each bus OEM
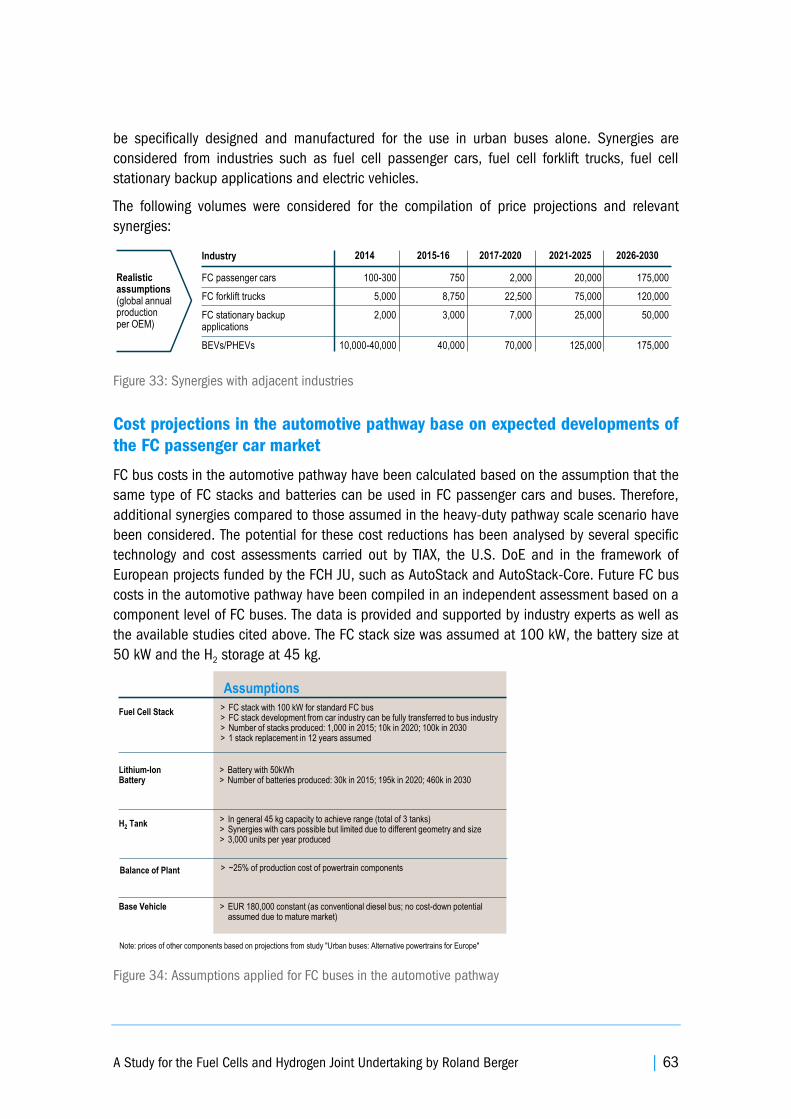
A Study for the Fuel Cells and Hydrogen Joint Undertaking by Roland Berger | 63
be specifically designed and manufactured for the use in urban buses alone. Synergies are
considered from industries such as fuel cell passenger cars, fuel cell forklift trucks, fuel cell
stationary backup applications and electric vehicles.
The following volumes were considered for the compilation of price projections and relevant
synergies:
Figure 33: Synergies with adjacent industries
Cost projections in the automotive pathway base on expected developments of
the FC passenger car market
FC bus costs in the automotive pathway have been calculated based on the assumption that the
same type of FC stacks and batteries can be used in FC passenger cars and buses. Therefore,
additional synergies compared to those assumed in the heavy-duty pathway scale scenario have
been considered. The potential for these cost reductions has been analysed by several specific
technology and cost assessments carried out by TIAX, the U.S. DoE and in the framework of
European projects funded by the FCH JU, such as AutoStack and AutoStack-Core. Future FC bus
costs in the automotive pathway have been compiled in an independent assessment based on a
component level of FC buses. The data is provided and supported by industry experts as well as
the available studies cited above. The FC stack size was assumed at 100 kW, the battery size at
50 kW and the H2 storage at 45 kg.
Figure 34: Assumptions applied for FC buses in the automotive pathway
28
INTERNAL DOCUMENT – NOT FOR DISSEMINATION
The following assumptions for potential synergies were considered relevant for FC buses in creating the respective scenarios presented
2014 2015-16 2017-2020 2021-2025Industry
FC forklift trucks 5,000 8,750 22,500 75,000 120,000
Realistic assumptions(global annual production per OEM)
2026-2030
FC stationary backup applications
2,000 3,000 7,000 25,000 50,000
FC passenger cars 100-300 750 2,000 20,000 175,000
BEVs/PHEVs 10,000-40,000 40,000 70,000 125,000 175,000
Synergies for FC buses provided as reference by RB
BackupPrinciples and methodology
Assumptions
H2 Tank > In general 45 kg capacity to achieve range (total of 3 tanks)> Synergies with cars possible but limited due to different geometry and size> 3,000 units per year produced
Lithium-Ion Battery
> Battery with 50kWh> Number of batteries produced: 30k in 2015; 195k in 2020; 460k in 2030
Fuel Cell Stack> FC stack with 100 kW for standard FC bus> FC stack development from car industry can be fully transferred to bus industry> Number of stacks produced: 1,000 in 2015; 10k in 2020; 100k in 2030> 1 stack replacement in 12 years assumed
Balance of Plant > ~25% of production cost of powertrain components
Base Vehicle > EUR 180,000 constant (as conventional diesel bus; no cost-down potential assumed due to mature market)
Note: prices of other components based on projections from study "Urban buses: Alternative powertrains for Europe"
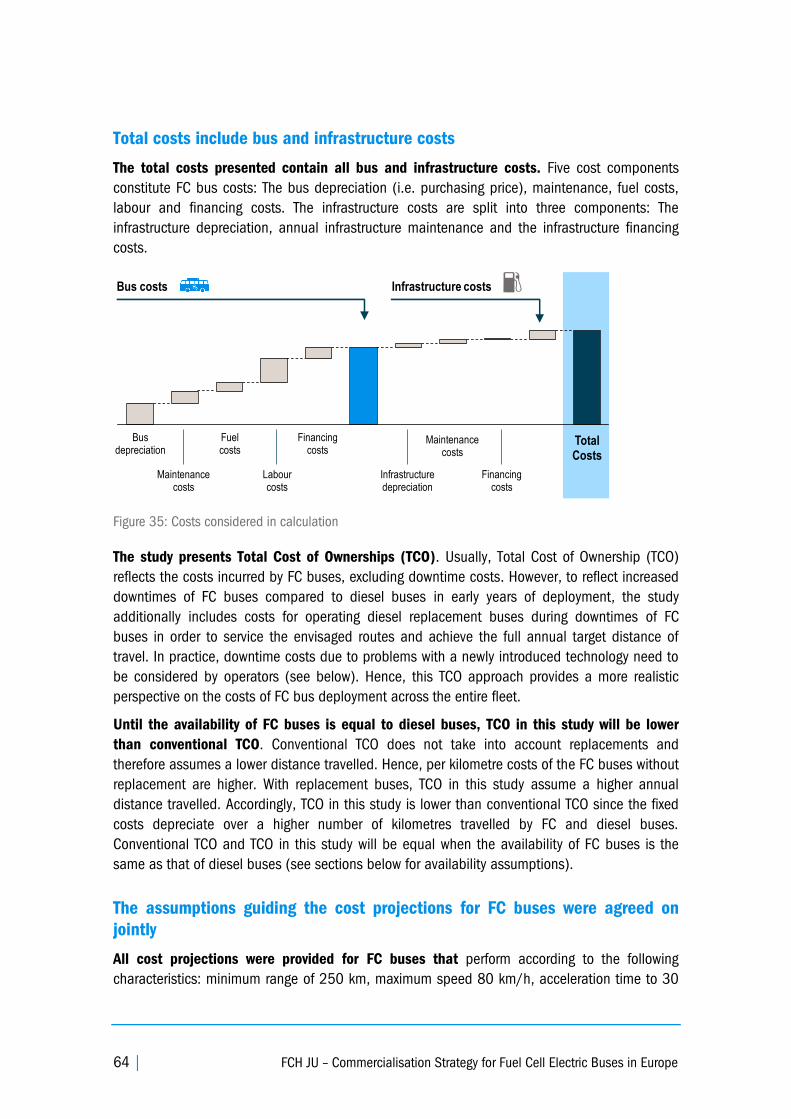
64 | FCH JU – Commercialisation Strategy for Fuel Cell Electric Buses in Europe
Total costs include bus and infrastructure costs
The total costs presented contain all bus and infrastructure costs. Five cost components
constitute FC bus costs: The bus depreciation (i.e. purchasing price), maintenance, fuel costs,
labour and financing costs. The infrastructure costs are split into three components: The
infrastructure depreciation, annual infrastructure maintenance and the infrastructure financing
costs.
Figure 35: Costs considered in calculation
The study presents Total Cost of Ownerships (TCO). Usually, Total Cost of Ownership (TCO)
reflects the costs incurred by FC buses, excluding downtime costs. However, to reflect increased
downtimes of FC buses compared to diesel buses in early years of deployment, the study
additionally includes costs for operating diesel replacement buses during downtimes of FC
buses in order to service the envisaged routes and achieve the full annual target distance of
travel. In practice, downtime costs due to problems with a newly introduced technology need to
be considered by operators (see below). Hence, this TCO approach provides a more realistic
perspective on the costs of FC bus deployment across the entire fleet.
Until the availability of FC buses is equal to diesel buses, TCO in this study will be lower
than conventional TCO. Conventional TCO does not take into account replacements and
therefore assumes a lower distance travelled. Hence, per kilometre costs of the FC buses without
replacement are higher. With replacement buses, TCO in this study assume a higher annual
distance travelled. Accordingly, TCO in this study is lower than conventional TCO since the fixed
costs depreciate over a higher number of kilometres travelled by FC and diesel buses.
Conventional TCO and TCO in this study will be equal when the availability of FC buses is the
same as that of diesel buses (see sections below for availability assumptions).
The assumptions guiding the cost projections for FC buses were agreed on
jointly
All cost projections were provided for FC buses that perform according to the following
characteristics: minimum range of 250 km, maximum speed 80 km/h, acceleration time to 30
7
INTERNAL DOCUMENT – NOT FOR DISSEMINATION
TCO figures have been calculated taking into consideration most important components of buses and infrastructure costs
Maintenance costs
Labourcosts
Financing costs
Bus depreciation
Financing costs
Infrastructure depreciation
Maintenance costs
Infrastructure costs
Fuel costs
Bus costs
Total Costs
Principles and methodology
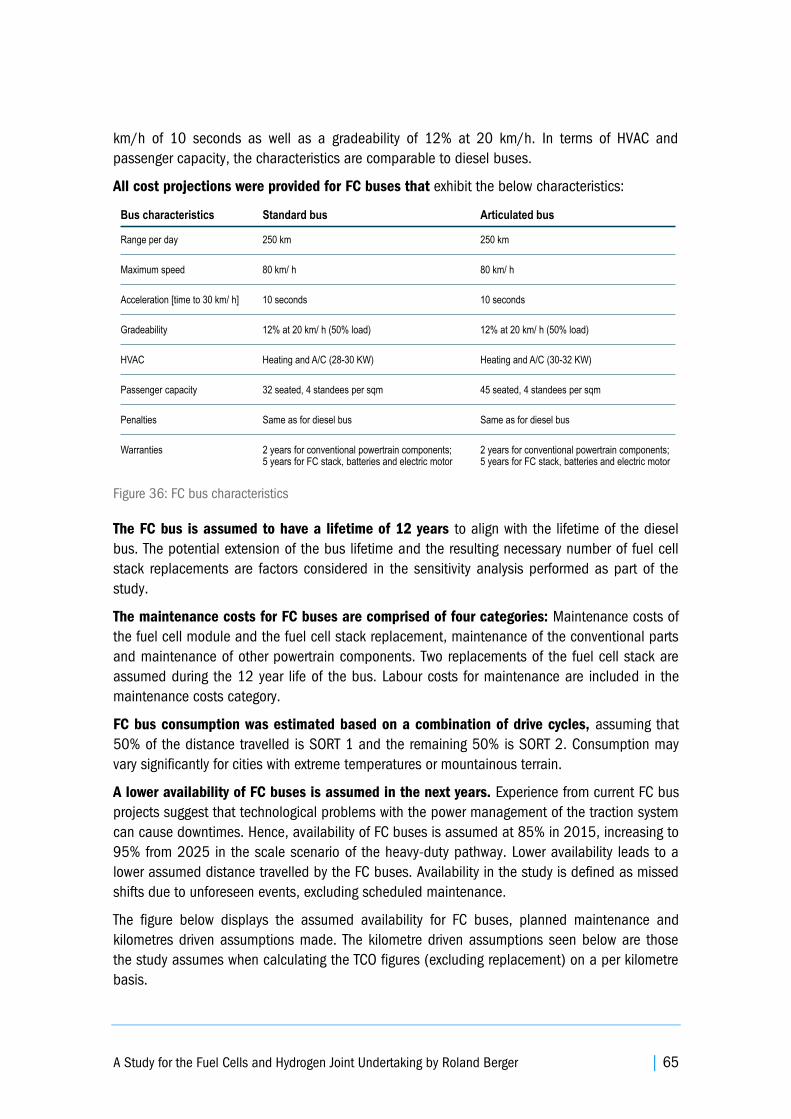
A Study for the Fuel Cells and Hydrogen Joint Undertaking by Roland Berger | 65
km/h of 10 seconds as well as a gradeability of 12% at 20 km/h. In terms of HVAC and
passenger capacity, the characteristics are comparable to diesel buses.
All cost projections were provided for FC buses that exhibit the below characteristics:
Figure 36: FC bus characteristics
The FC bus is assumed to have a lifetime of 12 years to align with the lifetime of the diesel
bus. The potential extension of the bus lifetime and the resulting necessary number of fuel cell
stack replacements are factors considered in the sensitivity analysis performed as part of the
study.
The maintenance costs for FC buses are comprised of four categories: Maintenance costs of
the fuel cell module and the fuel cell stack replacement, maintenance of the conventional parts
and maintenance of other powertrain components. Two replacements of the fuel cell stack are
assumed during the 12 year life of the bus. Labour costs for maintenance are included in the
maintenance costs category.
FC bus consumption was estimated based on a combination of drive cycles, assuming that
50% of the distance travelled is SORT 1 and the remaining 50% is SORT 2. Consumption may
vary significantly for cities with extreme temperatures or mountainous terrain.
A lower availability of FC buses is assumed in the next years. Experience from current FC bus
projects suggest that technological problems with the power management of the traction system
can cause downtimes. Hence, availability of FC buses is assumed at 85% in 2015, increasing to
95% from 2025 in the scale scenario of the heavy-duty pathway. Lower availability leads to a
lower assumed distance travelled by the FC buses. Availability in the study is defined as missed
shifts due to unforeseen events, excluding scheduled maintenance.
The figure below displays the assumed availability for FC buses, planned maintenance and
kilometres driven assumptions made. The kilometre driven assumptions seen below are those
the study assumes when calculating the TCO figures (excluding replacement) on a per kilometre
basis.
Articulated busStandard bus
250 km 250 kmRange per day
80 km/ h 80 km/ hMaximum speed
10 seconds 10 secondsAcceleration [time to 30 km/ h]
Heating and A/C (28-30 KW) Heating and A/C (30-32 KW)HVAC
Bus characteristics
12% at 20 km/ h (50% load) 12% at 20 km/ h (50% load)Gradeability
32 seated, 4 standees per sqm 45 seated, 4 standees per sqmPassenger capacity
Same as for diesel bus Same as for diesel busPenalties
Warranties 2 years for conventional powertrain components; 5 years for FC stack, batteries and electric motor
2 years for conventional powertrain components; 5 years for FC stack, batteries and electric motor
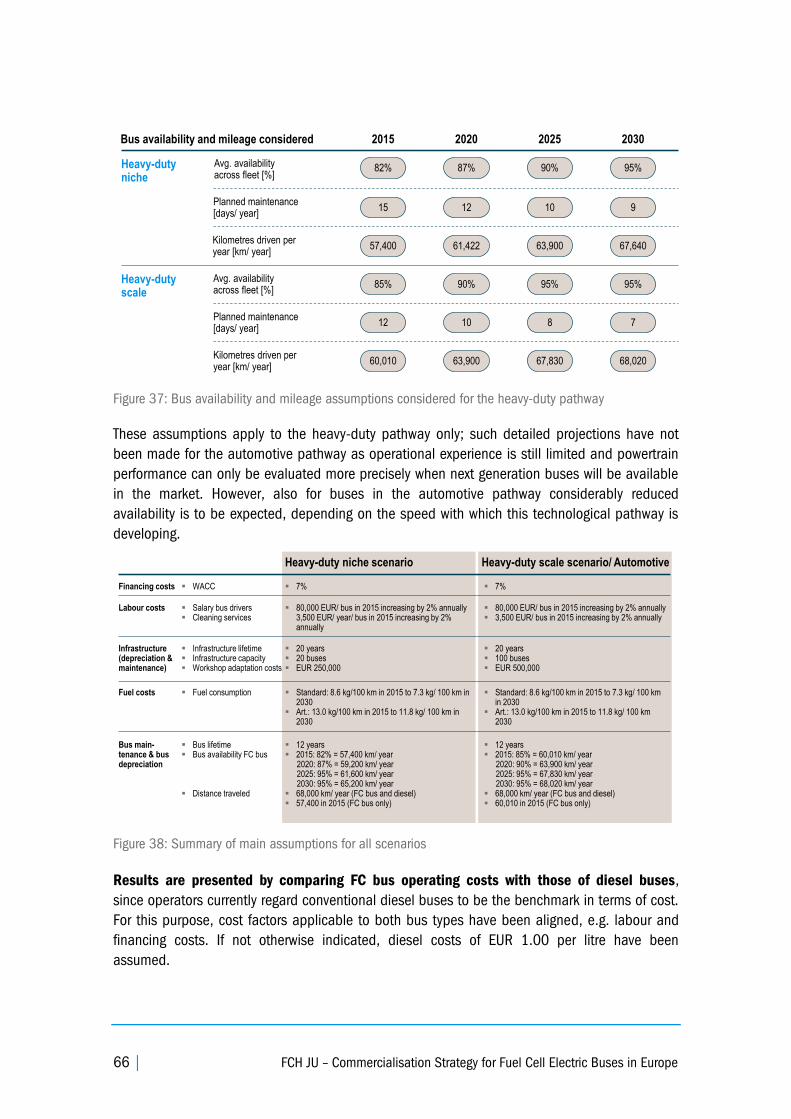
66 | FCH JU – Commercialisation Strategy for Fuel Cell Electric Buses in Europe
Figure 37: Bus availability and mileage assumptions considered for the heavy-duty pathway
These assumptions apply to the heavy-duty pathway only; such detailed projections have not
been made for the automotive pathway as operational experience is still limited and powertrain
performance can only be evaluated more precisely when next generation buses will be available
in the market. However, also for buses in the automotive pathway considerably reduced
availability is to be expected, depending on the speed with which this technological pathway is
developing.
Figure 38: Summary of main assumptions for all scenarios
Results are presented by comparing FC bus operating costs with those of diesel buses,
since operators currently regard conventional diesel buses to be the benchmark in terms of cost.
For this purpose, cost factors applicable to both bus types have been aligned, e.g. labour and
financing costs. If not otherwise indicated, diesel costs of EUR 1.00 per litre have been
assumed.
Heavy-duty niche
Heavy-duty scale
Avg. availability across fleet [%]
Planned maintenance [days/ year]
Planned maintenance [days/ year]
Avg. availability across fleet [%]
Kilometres driven per year [km/ year]
2015
82%
15
12
85%
57,400
60,010
2020
87%
12
10
90%
61,422
63,900
2025
90%
10
8
95%
63,900
67,830
2030
95%
9
7
95%
67,640
68,020Kilometres driven per year [km/ year]
Bus availability and mileage considered
Heavy-duty scale scenario/ Automotive
80,000 EUR/ bus in 2015 increasing by 2% annually 3,500 EUR/ bus in 2015 increasing by 2% annually
7%
Heavy-duty niche scenario
20 years 100 buses EUR 500,000
Infrastructure (depreciation & maintenance)
20 years 20 buses EUR 250,000
Infrastructure lifetime Infrastructure capacity Workshop adaptation costs
Labour costs 80,000 EUR/ bus in 2015 increasing by 2% annually 3,500 EUR/ year/ bus in 2015 increasing by 2% annually
Salary bus drivers Cleaning services
Financing costs 7% WACC
Standard: 8.6 kg/100 km in 2015 to 7.3 kg/ 100 km in 2030
Art.: 13.0 kg/100 km in 2015 to 11.8 kg/ 100 km 2030
Fuel costs Standard: 8.6 kg/100 km in 2015 to 7.3 kg/ 100 km in 2030
Art.: 13.0 kg/100 km in 2015 to 11.8 kg/ 100 km in 2030
Fuel consumption
12 years 2015: 85% = 60,010 km/ year
2020: 90% = 63,900 km/ year2025: 95% = 67,830 km/ year2030: 95% = 68,020 km/ year
68,000 km/ year (FC bus and diesel) 60,010 in 2015 (FC bus only)
Bus main-tenance & bus depreciation
12 years 2015: 82% = 57,400 km/ year
2020: 87% = 59,200 km/ year2025: 95% = 61,600 km/ year2030: 95% = 65,200 km/ year
68,000 km/ year (FC bus and diesel) 57,400 in 2015 (FC bus only)
Bus lifetime Bus availability FC bus
Distance traveled
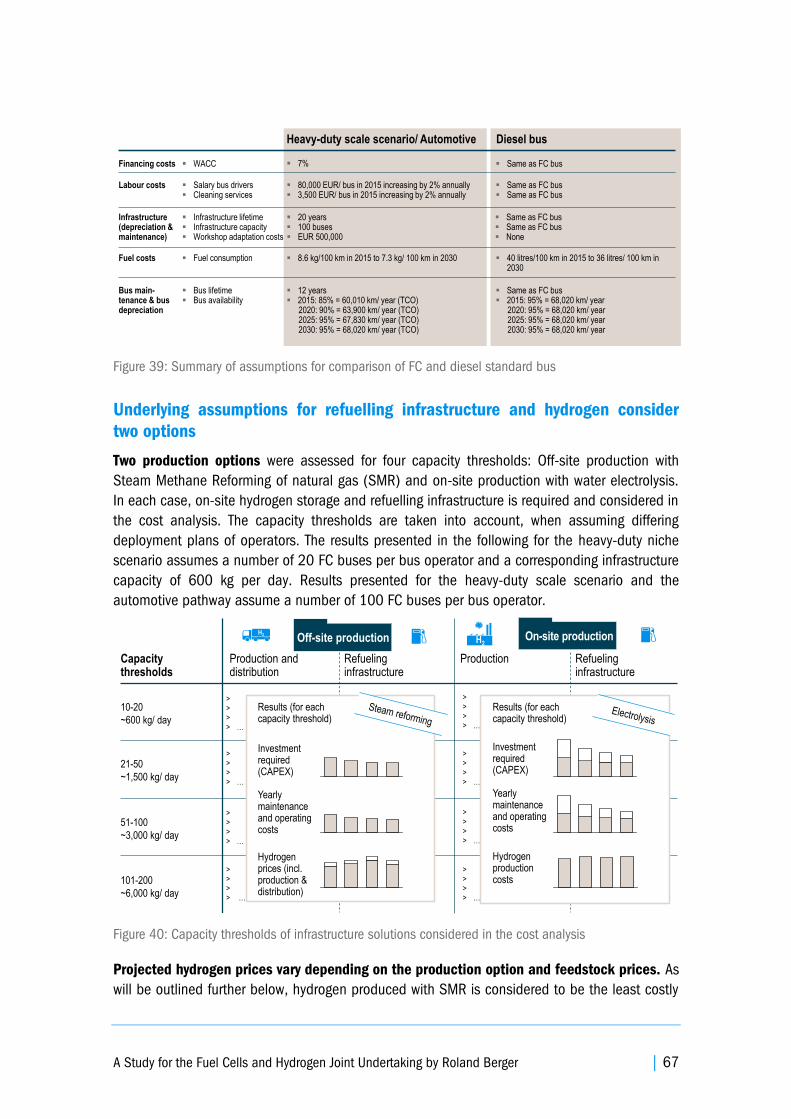
A Study for the Fuel Cells and Hydrogen Joint Undertaking by Roland Berger | 67
Figure 39: Summary of assumptions for comparison of FC and diesel standard bus
Underlying assumptions for refuelling infrastructure and hydrogen consider
two options
Two production options were assessed for four capacity thresholds: Off-site production with
Steam Methane Reforming of natural gas (SMR) and on-site production with water electrolysis.
In each case, on-site hydrogen storage and refuelling infrastructure is required and considered in
the cost analysis. The capacity thresholds are taken into account, when assuming differing
deployment plans of operators. The results presented in the following for the heavy-duty niche
scenario assumes a number of 20 FC buses per bus operator and a corresponding infrastructure
capacity of 600 kg per day. Results presented for the heavy-duty scale scenario and the
automotive pathway assume a number of 100 FC buses per bus operator.
Figure 40: Capacity thresholds of infrastructure solutions considered in the cost analysis
Projected hydrogen prices vary depending on the production option and feedstock prices. As
will be outlined further below, hydrogen produced with SMR is considered to be the least costly
Diesel busHeavy-duty scale scenario/ Automotive
20 years 100 buses EUR 500,000
80,000 EUR/ bus in 2015 increasing by 2% annually 3,500 EUR/ bus in 2015 increasing by 2% annually
8.6 kg/100 km in 2015 to 7.3 kg/ 100 km in 2030
Same as FC bus Same as FC bus None
Infrastructure lifetime Infrastructure capacity Workshop adaptation costs
Same as FC bus Same as FC bus
Salary bus drivers Cleaning services
Same as FC bus WACC
40 litres/100 km in 2015 to 36 litres/ 100 km in 2030
Fuel consumption
12 years 2015: 85% = 60,010 km/ year (TCO)
2020: 90% = 63,900 km/ year (TCO)2025: 95% = 67,830 km/ year (TCO)2030: 95% = 68,020 km/ year (TCO)
Bus main-tenance & bus depreciation
Same as FC bus 2015: 95% = 68,020 km/ year
2020: 95% = 68,020 km/ year2025: 95% = 68,020 km/ year2030: 95% = 68,020 km/ year
Bus lifetime Bus availability
Financing costs
Labour costs
7%
Infrastructure (depreciation & maintenance)
Fuel costs
Production anddistribution
Refueling infrastructure
Off-site productionH2
Results (for each capacity threshold)
Investment required (CAPEX)
Yearly maintenance and operating costs
Hydrogen prices (incl. production & distribution)
10-20
~600 kg/ day
21-50
~1,500 kg/ day
51-100
~3,000 kg/ day
101-200
~6,000 kg/ day
On-site production
>>>> …
Capacity thresholds
>>>> …
>>>> …
Production Refueling infrastructure
H2
>>>> …
>>>> …
Results (for each capacity threshold)
Investment required (CAPEX)
Yearly maintenance and operating costs
Hydrogen production costs
>>>> …
>>>> …
>>>> …
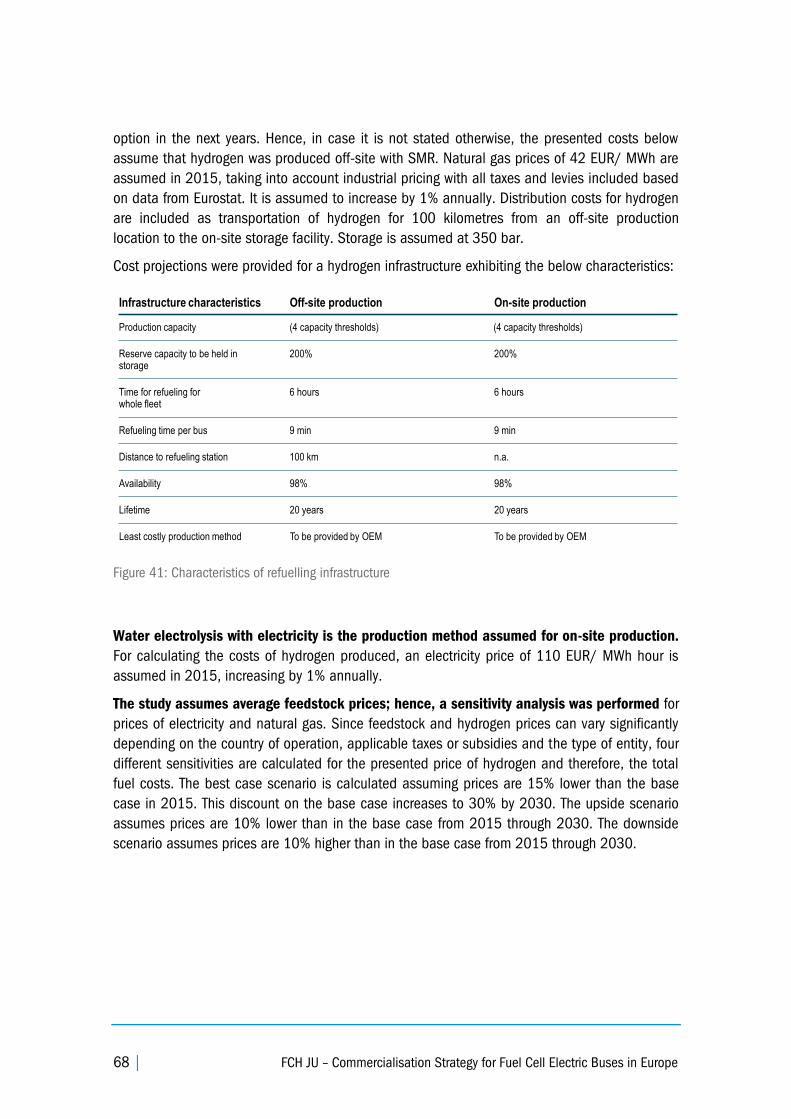
68 | FCH JU – Commercialisation Strategy for Fuel Cell Electric Buses in Europe
option in the next years. Hence, in case it is not stated otherwise, the presented costs below
assume that hydrogen was produced off-site with SMR. Natural gas prices of 42 EUR/ MWh are
assumed in 2015, taking into account industrial pricing with all taxes and levies included based
on data from Eurostat. It is assumed to increase by 1% annually. Distribution costs for hydrogen
are included as transportation of hydrogen for 100 kilometres from an off-site production
location to the on-site storage facility. Storage is assumed at 350 bar.
Cost projections were provided for a hydrogen infrastructure exhibiting the below characteristics:
Figure 41: Characteristics of refuelling infrastructure
Water electrolysis with electricity is the production method assumed for on-site production.
For calculating the costs of hydrogen produced, an electricity price of 110 EUR/ MWh hour is
assumed in 2015, increasing by 1% annually.
The study assumes average feedstock prices; hence, a sensitivity analysis was performed for
prices of electricity and natural gas. Since feedstock and hydrogen prices can vary significantly
depending on the country of operation, applicable taxes or subsidies and the type of entity, four
different sensitivities are calculated for the presented price of hydrogen and therefore, the total
fuel costs. The best case scenario is calculated assuming prices are 15% lower than the base
case in 2015. This discount on the base case increases to 30% by 2030. The upside scenario
assumes prices are 10% lower than in the base case from 2015 through 2030. The downside
scenario assumes prices are 10% higher than in the base case from 2015 through 2030.
31
INTERNAL DOCUMENT – NOT FOR DISSEMINATION
Both on-site and off-site production options were considered for cost analysis – Standard infrastructure characteristics have been agreed
Infrastructure characteristics On-site production
Reserve capacity to be held in storage
200%200%
Time for refueling for whole fleet
6 hours6 hours
Distance to refueling station n.a.100 km
Off-site production
Refueling time per bus 9 min9 min
Availability 98%98%
Lifetime 20 years20 years
Least costly production method To be provided by OEMTo be provided by OEM
Source: Roland Berger
Results infrastructure and hydrogen
Production capacity (4 capacity thresholds) (4 capacity thresholds)
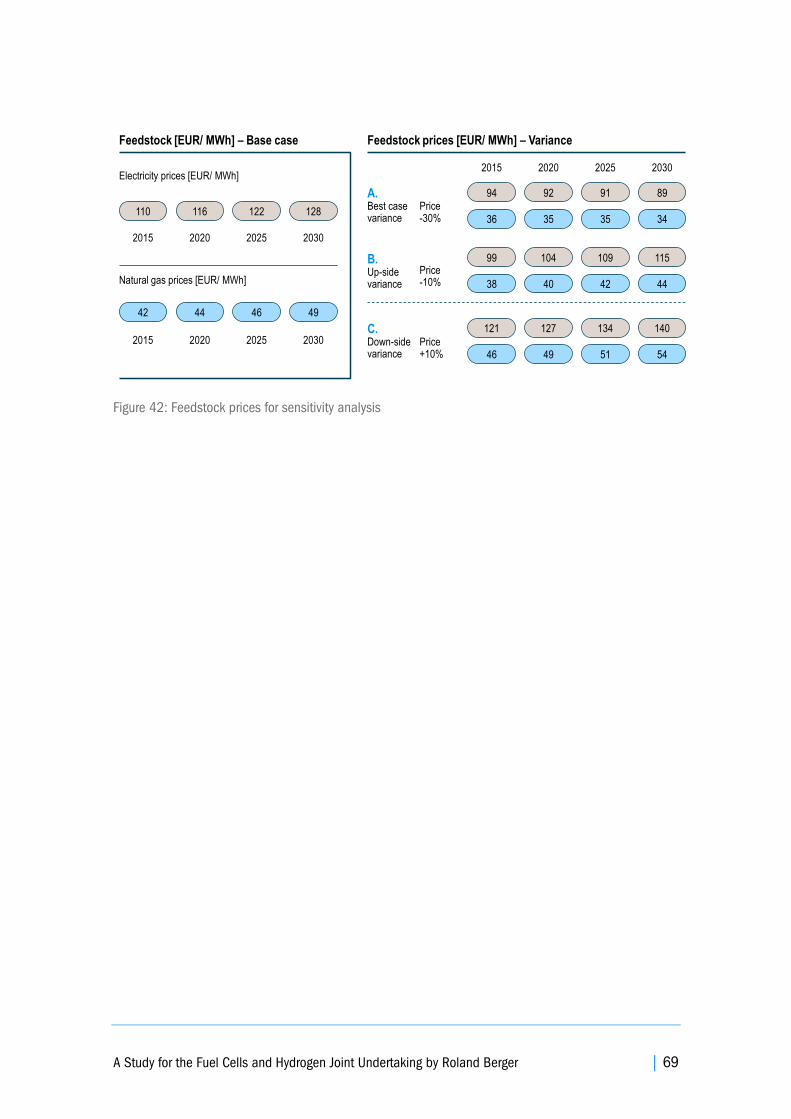
A Study for the Fuel Cells and Hydrogen Joint Undertaking by Roland Berger | 69
Figure 42: Feedstock prices for sensitivity analysis
32
INTERNAL DOCUMENT – NOT FOR DISSEMINATION
To accommodate potential different evolutions of feedstock prices, we computed 3 sensitivity variances
Feedstock prices [EUR/ MWh] – VarianceFeedstock [EUR/ MWh] – Base case
Electricity prices [EUR/ MWh]
110 116 122 128
Natural gas prices [EUR/ MWh]
42 44 46 49
2015 2020 2025 2030
2015 2020 2025 2030
94 92 91 89
36 35 35 34
99 104 109 115
38 40 42 44
121 127 134 140
2015 2020 2025 2030
46 49 51 54
Price-10%
Price+10%
Price-30%
A.Best case variance
C.Down-side variance
B.Up-side variance
Sensitivities analysis TCO – Feedstock
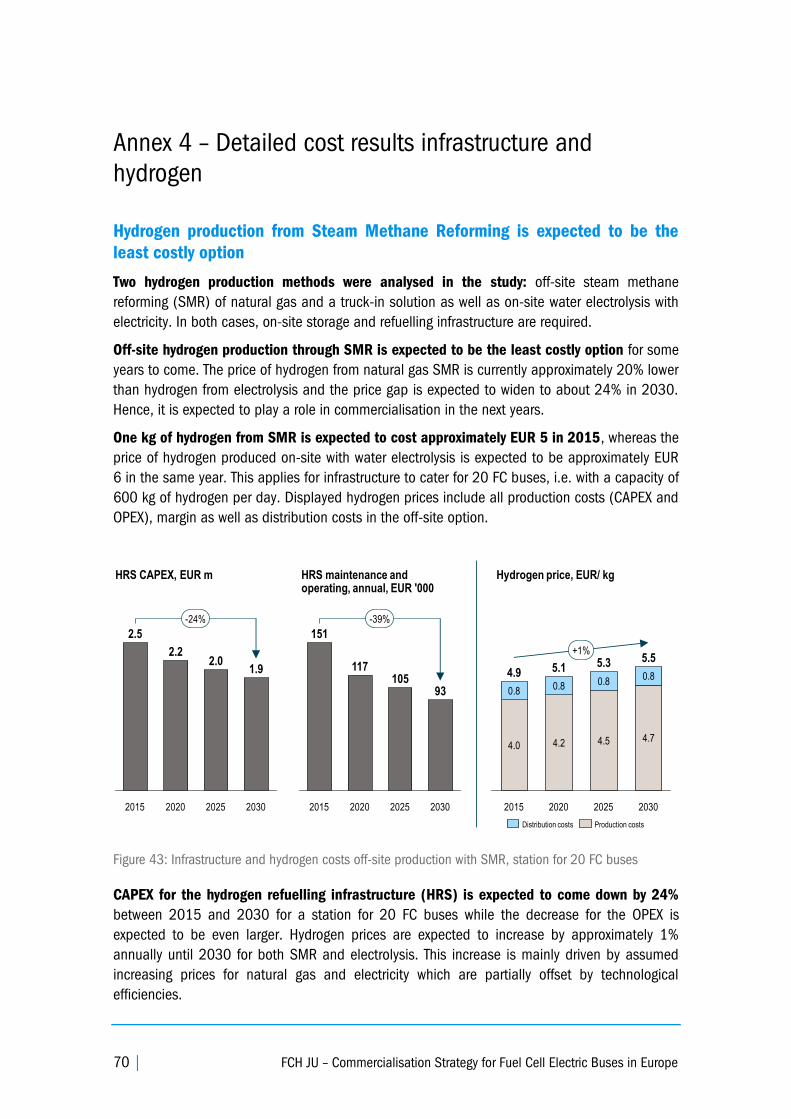
70 | FCH JU – Commercialisation Strategy for Fuel Cell Electric Buses in Europe
Annex 4 – Detailed cost results infrastructure and
hydrogen
Hydrogen production from Steam Methane Reforming is expected to be the
least costly option
Two hydrogen production methods were analysed in the study: off-site steam methane
reforming (SMR) of natural gas and a truck-in solution as well as on-site water electrolysis with
electricity. In both cases, on-site storage and refuelling infrastructure are required.
Off-site hydrogen production through SMR is expected to be the least costly option for some
years to come. The price of hydrogen from natural gas SMR is currently approximately 20% lower
than hydrogen from electrolysis and the price gap is expected to widen to about 24% in 2030.
Hence, it is expected to play a role in commercialisation in the next years.
One kg of hydrogen from SMR is expected to cost approximately EUR 5 in 2015, whereas the
price of hydrogen produced on-site with water electrolysis is expected to be approximately EUR
6 in the same year. This applies for infrastructure to cater for 20 FC buses, i.e. with a capacity of
600 kg of hydrogen per day. Displayed hydrogen prices include all production costs (CAPEX and
OPEX), margin as well as distribution costs in the off-site option.
Figure 43: Infrastructure and hydrogen costs off-site production with SMR, station for 20 FC buses
CAPEX for the hydrogen refuelling infrastructure (HRS) is expected to come down by 24%
between 2015 and 2030 for a station for 20 FC buses while the decrease for the OPEX is
expected to be even larger. Hydrogen prices are expected to increase by approximately 1%
annually until 2030 for both SMR and electrolysis. This increase is mainly driven by assumed
increasing prices for natural gas and electricity which are partially offset by technological
efficiencies.
70
INTERNAL DOCUMENT – NOT FOR DISSEMINATION
CAPEX for HRS expected to decrease by 24% until 2030 to ~EUR 2 m with hydrogen prices starting at EUR 4.9 in 2015 for off-site production
Off-site steam reforming and truck-in – Niche production scenario
-24%
2030
1.9
2025
2.0
2020
2.2
2015
2.5
HRS CAPEX, EUR m
-39%
2030
93
2025
105
2020
117
2015
151
HRS maintenance and operating, annual, EUR '000
Hydrogen price, EUR/ kg
+1%
2030
5.5
4.7
0.8
2025
5.3
4.5
0.8
2020
5.1
4.2
0.8
2015
4.9
4.0
0.8
Source: Coalition Members, Roland Berger
Results infrastructure and hydrogen
Distribution costs Production costs
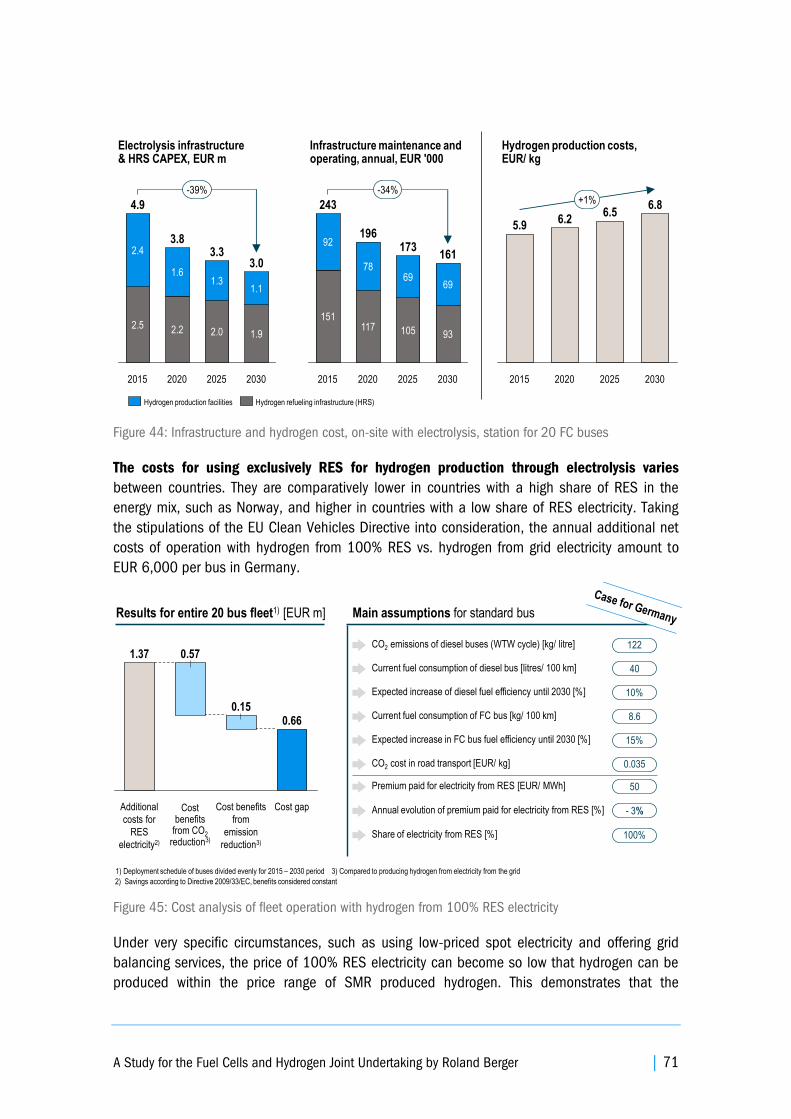
A Study for the Fuel Cells and Hydrogen Joint Undertaking by Roland Berger | 71
Figure 44: Infrastructure and hydrogen cost, on-site with electrolysis, station for 20 FC buses
The costs for using exclusively RES for hydrogen production through electrolysis varies
between countries. They are comparatively lower in countries with a high share of RES in the
energy mix, such as Norway, and higher in countries with a low share of RES electricity. Taking
the stipulations of the EU Clean Vehicles Directive into consideration, the annual additional net
costs of operation with hydrogen from 100% RES vs. hydrogen from grid electricity amount to
EUR 6,000 per bus in Germany.
Figure 45: Cost analysis of fleet operation with hydrogen from 100% RES electricity
Under very specific circumstances, such as using low-priced spot electricity and offering grid
balancing services, the price of 100% RES electricity can become so low that hydrogen can be
produced within the price range of SMR produced hydrogen. This demonstrates that the
72
INTERNAL DOCUMENT – NOT FOR DISSEMINATION
CAPEX for electrolysis production facilities expected to decrease significantly until 2030 with hydrogen costs starting from 5.9 EUR/ kg
On-site electrolysis – Niche production scenario
-39%
2030
3.0
1.9
1.1
2025
3.3
2.0
1.3
2020
3.8
2.2
1.6
2015
4.9
2.5
2.4
Electrolysis infrastructure & HRS CAPEX, EUR m
-34%
2030
161
93
69
2025
173
105
69
2020
196
117
78
2015
243
151
92
Infrastructure maintenance and operating, annual, EUR '000
Hydrogen production costs, EUR/ kg
+1%
2030
6.8
2025
6.5
2020
6.2
2015
5.9
Results infrastructure and hydrogen
Hydrogen refueling infrastructure (HRS)Hydrogen production facilities
5
INTERNAL DOCUMENT – NOT FOR DISSEMINATION
We estimate annual additional costs of ~ EUR 6,000 per FC bus for H2 from 100% RES in comparison to H2 from grid electricity
Main assumptions for standard bus
CO2 emissions of diesel buses (WTW cycle) [kg/ litre] 122
Current fuel consumption of diesel bus [litres/ 100 km] 40
Expected increase of diesel fuel efficiency until 2030 [%] 10%
CO2 cost in road transport [EUR/ kg] 0.035
Current fuel consumption of FC bus [kg/ 100 km] 8.6
Expected increase in FC bus fuel efficiency until 2030 [%] 15%
Annual evolution of premium paid for electricity from RES [%] - 3%
Premium paid for electricity from RES [EUR/ MWh] 50
Share of electricity from RES [%] 100%
Cost gap
0.66
Cost benefits
from
emission
reduction3)
0.15
0.57
Additional
costs for
RES
electricity2)
1.37
Results for entire 20 bus fleet1) [EUR m]
1) Deployment schedule of buses divided evenly for 2015 – 2030 period
2) Savings according to Directive 2009/33/EC, benefits considered constant
Cost benefits
from CO2
reduction3)
Environmental analysis
3) Compared to producing hydrogen from electricity from the grid
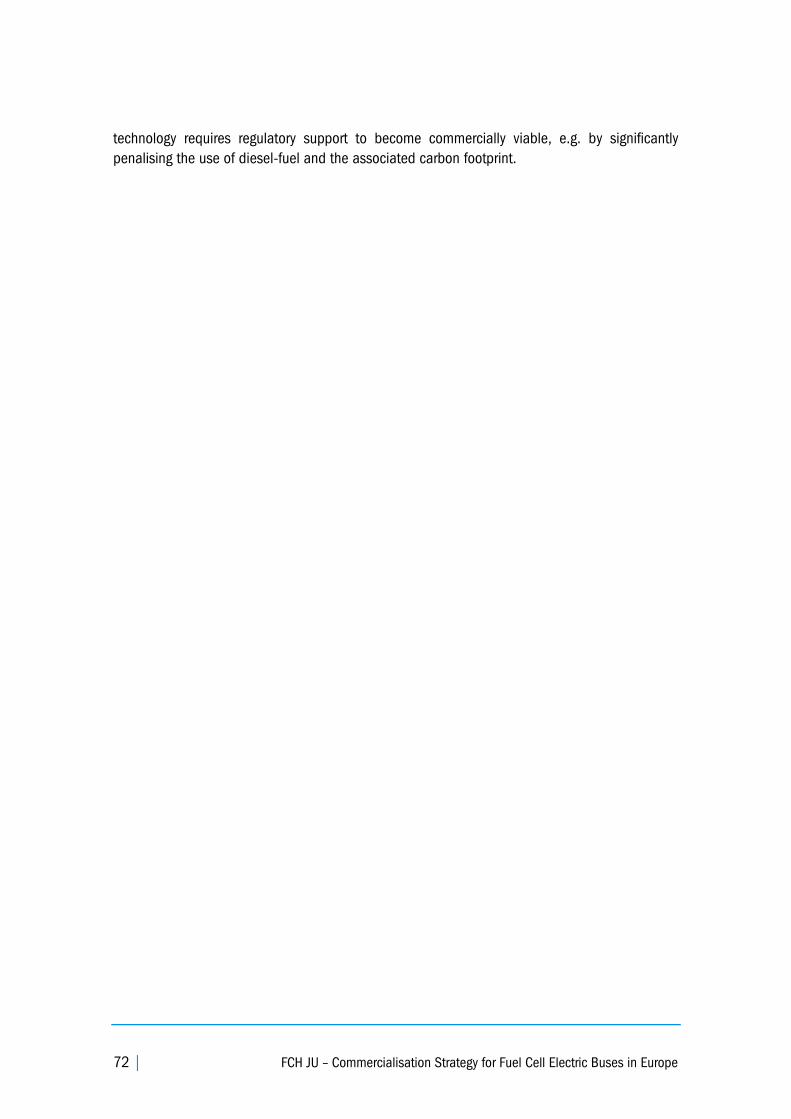
72 | FCH JU – Commercialisation Strategy for Fuel Cell Electric Buses in Europe
technology requires regulatory support to become commercially viable, e.g. by significantly
penalising the use of diesel-fuel and the associated carbon footprint.
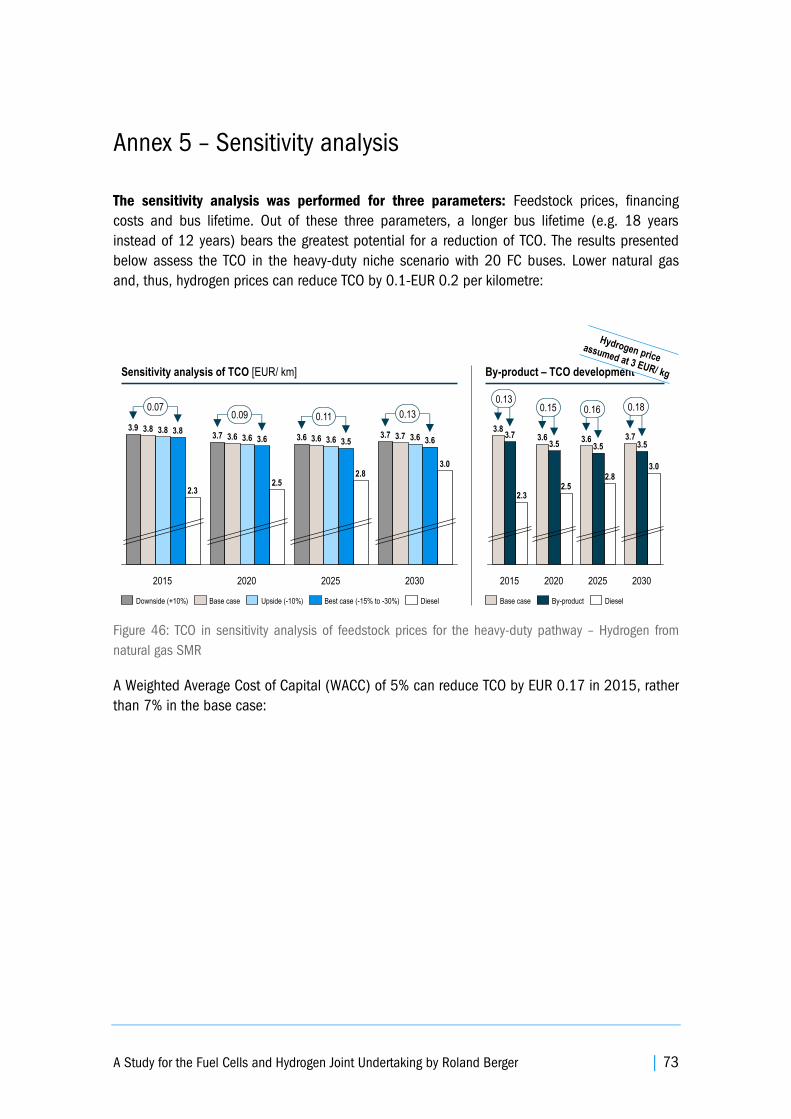
A Study for the Fuel Cells and Hydrogen Joint Undertaking by Roland Berger | 73
Annex 5 – Sensitivity analysis
The sensitivity analysis was performed for three parameters: Feedstock prices, financing
costs and bus lifetime. Out of these three parameters, a longer bus lifetime (e.g. 18 years
instead of 12 years) bears the greatest potential for a reduction of TCO. The results presented
below assess the TCO in the heavy-duty niche scenario with 20 FC buses. Lower natural gas
and, thus, hydrogen prices can reduce TCO by 0.1-EUR 0.2 per kilometre:
Figure 46: TCO in sensitivity analysis of feedstock prices for the heavy-duty pathway – Hydrogen from
natural gas SMR
A Weighted Average Cost of Capital (WACC) of 5% can reduce TCO by EUR 0.17 in 2015, rather
than 7% in the base case:
By-product – TCO developmentSensitivity analysis of TCO [EUR/ km]
0.130.110.090.07
2030
3.0
3.63.63.7
2025
3.7
2.8
3.53.63.63.6
2020
2.5
3.63.63.63.7
2015
2.3
3.83.83.83.9
DieselBest case (-15% to -30%)Upside (-10%)Base caseDownside (+10%)
0.180.160.150.13
2030
3.0
3.6
2015
2.3
3.73.8
2025
2.8
3.5 3.53.6
2020
2.5
3.53.7
DieselBy-productBase case
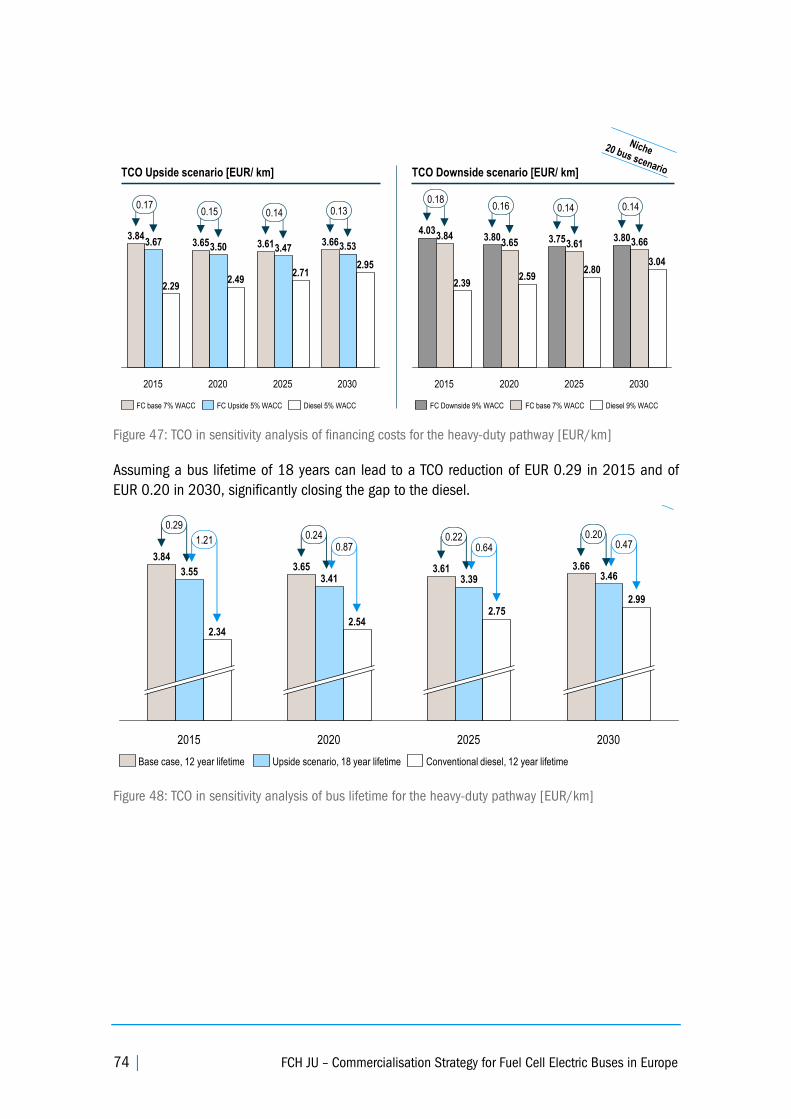
74 | FCH JU – Commercialisation Strategy for Fuel Cell Electric Buses in Europe
Figure 47: TCO in sensitivity analysis of financing costs for the heavy-duty pathway [EUR/km]
Assuming a bus lifetime of 18 years can lead to a TCO reduction of EUR 0.29 in 2015 and of
EUR 0.20 in 2030, significantly closing the gap to the diesel.
Figure 48: TCO in sensitivity analysis of bus lifetime for the heavy-duty pathway [EUR/km]
0.15
3.613.47
0.130.14
2020
3.66
2015
3.84
2.49
3.50
0.17
3.65
2030
2.952.71
2025
2.29
3.67 3.53
FC base 7% WACC Diesel 5% WACCFC Upside 5% WACC
3.04
2030
0.180.14
2015
0.140.16
3.663.803.613.75
2020
2.39
3.844.03
3.803.65
2025
2.802.59
Diesel 9% WACCFC base 7% WACCFC Downside 9% WACC
TCO Upside scenario [EUR/ km] TCO Downside scenario [EUR/ km]
80
INTERNAL DOCUMENT – NOT FOR DISSEMINATION
0.470.640.871.21
0.200.220.24
2030
2.99
3.463.66
3.41
2.54
2020
3.613.39
0.29
2.75
2025
3.84
3.55
2.34
2015
3.65
Assuming a bus lifetime of 18 years can lead to a TSC reduction of ~ 5% in 2030, significantly closing the gap to the diesel TSC
Upside scenario, 18 year lifetimeBase case, 12 year lifetime Conventional diesel, 12 year lifetime
TSC development [EUR/ km]
Sensitivities analysis TSC – Bus lifetime