Embed Size (px)
Citation preview

Fuel Economy for the ASEAN Establishing Baselines for Fuel Economy of
Light Duty Passenger Vehicles in the
Philippines
September 2015
©2015 Clean Air Asia. All rights reserved.
Clean Air Asia Center, 2015. “Establishing Baselines for Fuel Economy of Light Duty Passenger Vehicles in the Philippines”. Pasig
City, Philippines.
This publication may be reproduced in whole or in part in any form for educational or non-profit purposes without special
permission from the copyright holder, provided acknowledgment of the source is made. The Clean Air Asia Center would
appreciate receiving a copy of any publication that uses this Clean Air Asia Center publication as a source. No use of this
publication may be made for resale or for any other commercial purpose whatsoever, without prior permission in writing from
the Clean Air Asia Center.
Disclaimer
The views expressed in this publication are those of Clean Air Asia staff, consultants and management, and do not necessarily
reflect the views of the Board of Trustees of the Clean Air Asia Center. The Clean Air Asia Center does not guarantee the accuracy
of the data included in this publication and does not accept responsibility for consequence of their use.
Acknowledgements
This report is made possible by the United Nations Environment Programme, the Global Fuel Economy Initiative and FIA
Foundation. Clean Air Asia acknowledges the partners in the regional work on harmonizing fuel economy policy in the ASEAN
through the Partnership for Clean Fuels and Vehicles. Clean Air Asia would also like to acknowledge the support given by the
Department of Energy in the Philippines for leading the discussions on fuel economy policy in the country during the many
stakeholder meetings.
Cover photo by carguide.ph
Contact
Clean Air Asia Center
Unit 3505 Robinsons Equitable Tower
ADB Avenue, Pasig City, 1605 Philippines
Tel +632 6311042
Fax +63 2 6311390
Clean Air Asia China Office
901A, Reignwood Building, No.8
YongAnDongLi, Jianguomenwai
Avenue
Beijing 100022 China
Tel/Fax: +86 10 8528 8381
Clean Air Asia India Office
1st Floor, Building No.4
Thyagraj Nagar Market
Lodhi Colony, 110003, India
Tel +91 11 60120260
Fax +91 11 43850032
Country Networks in China,
India, Indonesia, Nepal,
Pakistan, Philippines, Sri
Lanka, Vietnam
About Clean Air Asia
www.cleanairasia.org
Clean Air Initiative for Asian Cities (Clean Air Asia) promotes better air quality and livable cities by translating knowledge to
policies and actions that reduce air pollution and greenhouse emissions from transport, energy, and other sectors.
Clean Air Asia was established as the leading air quality management network for Asia by the Asian Development Bank,
World Bank and USAID in 2001, and operates since 2007 as an independent non-profit organization. Clean Air Asia has
offices in Manila, Beijing and Delhi, networks in eight Asian countries (China, India, Indonesia, Nepal, Pakistan, Philippines,
Sri Lanka, and Vietnam) and is a UN recognized partnership of almost 250 organizations in Asia and worldwide.
Clean Air Asia uses knowledge and partnerships to enable Asia’s 1,000+ cities and national governments understand the
problems and identify effective policies and measures. Our four programs are: Air Quality and Climate Change, Low
Emissions Urban Development, Clean Fuels and Vehicles, and Green Freight and Logistics.
The biennial Better Air Quality (BAQ) conference is the flagship event of Clean Air Asia bringing experts, policy and decision
makers together to network, learn and share experiences on air quality management. Past BAQs have proven to influence
policies, initiate new projects and establish partnerships.

EXECUTIVE SUMMARY
Fuel dependency is a global threat to sustainability as fuel reserves are limited, and increasing fuel use
exacerbates the levels of greenhouse gases that hasten the effects of climate change. For these reasons,
the Global Fuel Economy Initiative (GFEI) was established to initiate the discussion of developing policies
that promote energy efficiency and fuel economy. GFEI has determined a global target of 50%
improvement in fuel economy from a 2005 baseline by 2050 (50 by 50). As of 2014, GFEI reports that it is
still far from meeting its target.
GFEI has worked with various countries from Africa, Asia and Latin America, and works closely with Clean
Air Asia to promote fuel economy discussions in the Asian region. One of the roles of Clean Air Asia is to
ensure that actions and interventions are adopted by governments in Asia to mitigate the contribution of
the transport sector to fuel consumption. Clean Air Asia, through the support of the United Nations
Environment Programme (UNEP), has worked with governments of the Association of Southeast Asian
Nations (ASEAN) member countries in driving discussions towards developing fuel economy policies and
standards at both national and sub-regional level. Through GFEI and UNEP support, Clean Air Asia has
embarked on multiple discussions to elevate fuel economy as a policy agenda in the ASEAN sub-region by
engaging key stakeholders, leading the discussions and providing technical assistance for establishing
scientifically sound policy measures.
In the Philippines, Clean Air Asia was officially designated as the Secretariat for the Technical Working
Group for Fuel Economy that has had ongoing discussions since early 2012. The Department of Energy
hosted the policy dialogues that involved other government agencies such as the Department of Transport
and Communications and the Department of Trade and Industry, with due participation from various
stakeholders from the energy and vehicle manufacturing sectors. These stakeholders are expected to play
important roles in the development and implementation of fuel economy policies and measures in the
Philippines. Six meetings have been held since inception, the last of which was held in October 2013,
where it was decided that there has to be an established baseline estimate for fuel economy in order to
have basis for the policy dialogues within the Technical Working Group for Fuel Economy.
Scope and Objectives
Following the directive from the Technical Working Group, Clean Air Asia initiated the technical work for
establishing the baseline fuel economy for the Philippines. This report aimed to establish the baseline fuel
economy of new light duty vehicles (LDVs) that entered the Philippine market in 2013. Light duty vehicles
for this purpose are defined as all passenger cars and light commercial vehicles (LCVs), classified as M1
and N1 according to Philippine vehicle classification by the Land Transportation Office (LTO), and not more
than 3.5 tons in gross vehicle weight (GVW). The general objective for this study is to estimate the fuel
economy and compare the performance of various vehicle segments with respect to baseline. By arriving
at scientifically sound baselines, the researchers hope to provide the basis for policy discussions in the
future.

Establishing Baselines for Fuel Economy of Light Duty Passenger Vehicles in the Philippines – Final Report
September 2015
2
Methodology
The methodology for baseline estimation adopts the prescribed estimator by the GFEI toolkit, using the
harmonic mean fuel economy of the fleet of interest interpreted as the average fuel economy of
registered vehicles at base year. Registration data was acquired from Segment Y, and a total of 731 LDV
models were included in the estimation, consisting of 620 of passenger cars 111 LCVs. Data included
vehicle models with information on GVW, engine displacement, gearing, and transmission, following the
minimum data requirement of the GFEI methodology. Fuel economy is reported in liters of gasoline
equivalent per 100 km (Lge/100 km) instead of liters per 100 km (L/100 km) for comparability. For the LDV
fuel economy estimation, registration data was acquired from Segment Y.
Conclusion
Based on available data, the harmonic mean fuel economy of newly registered LDVs in the Philippines in
the year 2013 is 7.8 Lge/100 km. Passenger cars perform better than baseline at 7.3 Lge/100 km while
LCVs perform worse than baseline at 9.9 Lge/100 km. Diesel vehicles have a fuel economy above baseline
at 10.3 Lge/100 km, while gasoline and hybrid vehicles have 6.3 and 4.5 Lge/100 km respectively. It is
inferred that the demand for sedans, LCVs and multi-purpose vehicles (MPVs) shaped the fuel economy
of the newly registered passenger cars in 2013, with the larger and less efficient vehicles driving the
estimate up. Similarly, vans and pick-ups had the most shares of registrations and also influenced the fuel
economy of LCVs.
This study does not determine which vehicles are better or worse. Rather, it provides an estimate of the
baseline of the fuel economy as per available data, and then compares the fuel economy of the various
segments with respect to the baseline. The results are only indicative of the real situation, and it is
recommended to conduct controlled experiments to arrive at confirmative results.
Establishing Baselines for Fuel Economy of Light Duty Passenger Vehicles in the Philippines – Final Report
September 2015
3
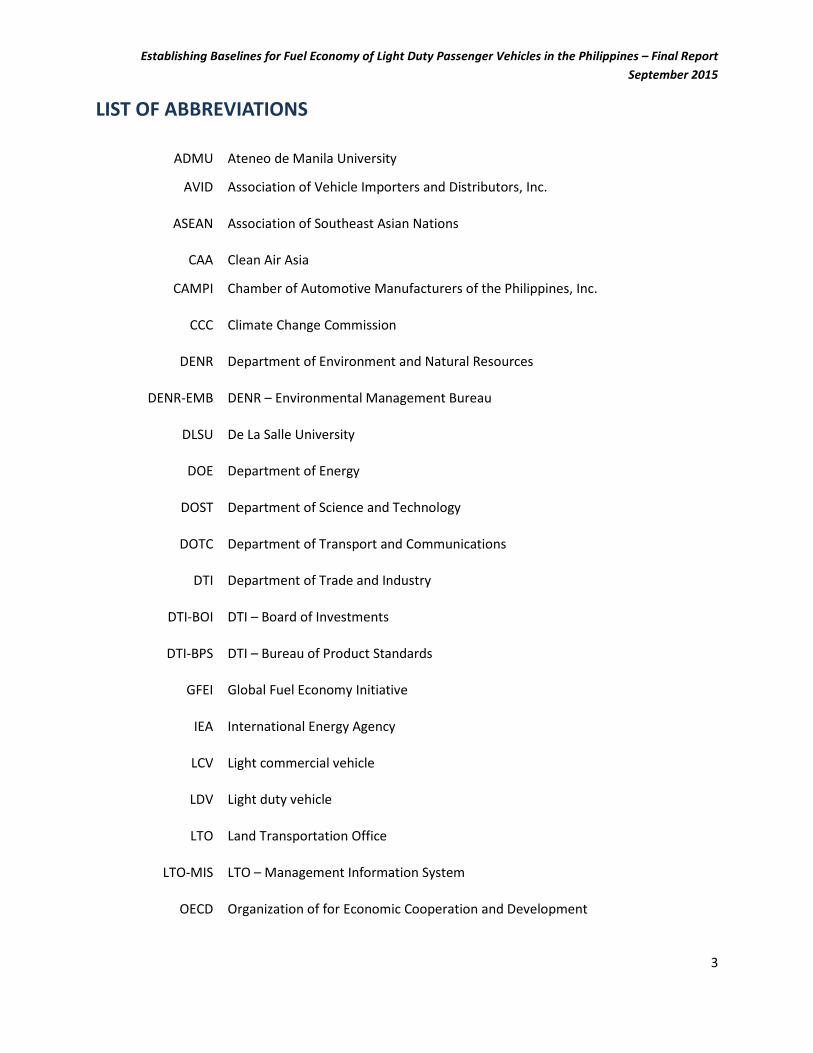
LIST OF ABBREVIATIONS
ADMU
AVID
Ateneo de Manila University
Association of Vehicle Importers and Distributors, Inc.
ASEAN Association of Southeast Asian Nations
CAA
CAMPI
Clean Air Asia
Chamber of Automotive Manufacturers of the Philippines, Inc.
CCC Climate Change Commission
DENR Department of Environment and Natural Resources
DENR-EMB DENR – Environmental Management Bureau
DLSU De La Salle University
DOE Department of Energy
DOST Department of Science and Technology
DOTC Department of Transport and Communications
DTI Department of Trade and Industry
DTI-BOI DTI – Board of Investments
DTI-BPS DTI – Bureau of Product Standards
GFEI Global Fuel Economy Initiative
IEA International Energy Agency
LCV Light commercial vehicle
LDV Light duty vehicle
LTO Land Transportation Office
LTO-MIS LTO – Management Information System
OECD Organization of for Economic Cooperation and Development

Establishing Baselines for Fuel Economy of Light Duty Passenger Vehicles in the Philippines – Final Report
September 2015
4
TC44 Technical Committee 44
UNEP United Nations Environment Programme
UPD University of the Philippines – Diliman Campus
US EPA United States Environmental Protection Agency

Establishing Baselines for Fuel Economy of Light Duty Passenger Vehicles in the Philippines – Final Report
September 2015
5
CONTENTS
EXECUTIVE SUMMARY .................................................................................................................................. 1
Scope and Objectives ................................................................................................................................ 1
Methodology ............................................................................................................................................. 2
Conclusion ................................................................................................................................................. 2
LIST OF ABBREVIATIONS ............................................................................................................................... 3
I. Introduction .......................................................................................................................................... 8
II. Developing the National Fuel Economy Policies and Measures ........................................................... 9
III. Fuel Economy Policy in the Philippine Context ............................................................................... 10
IV. Scope and Objectives of Baseline Setting ....................................................................................... 11
V. Methodology ....................................................................................................................................... 11
GFEI Methodology .................................................................................................................................. 11
Data Challenges and Limitations ............................................................................................................. 12
Data Profile ............................................................................................................................................. 13
Fuel Economy Estimation and Interpretation ......................................................................................... 15
Data Uncertainty ..................................................................................................................................... 16
Comparing with Official Statistics ........................................................................................................... 17
Analytic Methods .................................................................................................................................... 18
VI. Results and Analysis ........................................................................................................................ 19
Summary Statistics for LDVs in the Data ................................................................................................. 19
Fleet-wide Fuel Economy Estimates ....................................................................................................... 29
Fuel Economy and Vehicle Weight ......................................................................................................... 30
Fuel Economy and Engine Displacement ................................................................................................ 32
Fuel Economy and Segments .................................................................................................................. 34
V. Summary and Conclusion ................................................................................................................... 35

Establishing Baselines for Fuel Economy of Light Duty Passenger Vehicles in the Philippines – Final Report
September 2015
6
VI. Recommendations .......................................................................................................................... 36
Annex 1: Field Definitions for Segment Y Data ........................................................................................... 37
Annex 2: Segment Y Vehicle Segment Definitions ...................................................................................... 38
Annex 3: LTO Classification of Motor Vehicles ........................................................................................... 39
Works Cited ................................................................................................................................................. 40
LIST OF FIGURES
Figure 1 - Energy demand per sector in the Philippines from 1990 to 2010 ................................................ 8
Figure 2 – Data distribution of passenger car models by fuel type ............................................................ 14
Figure 3 - Number of models by production year ...................................................................................... 15
Figure 4 - Total number of registrations from 2010 to 2013 ...................................................................... 17
Figure 5 - Comparison of GVW averages of LDV models, overall, passenger cars and light commercial
vehicles........................................................................................................................................................ 20
Figure 6 - Histogram of GVW for newly registered LDV models in 2013 ................................................... 21
Figure 7 - Average GVW per body type of LDV models .............................................................................. 21
Figure 8 - Histogram of engine displacement across LDV models .............................................................. 23
Figure 9 - Average engine displacement per body type of LDV models ..................................................... 23
Figure 10 - Distribution of newly registered LDVs in 2013 ......................................................................... 24
Figure 11 - Distribution of new registrations per vehicle type by weight class .......................................... 25
Figure 12 – Shares of newly registered LDVs per fuel type ....................................................................... 25
Figure 13 - Cumulative percentage of newly registered passenger cars by body type ............................. 26
Figure 14 - Cumulative percentage of newly registered LCVs by body type .............................................. 27
Figure 15 - Percent of new registrations by number of gears of LDVs ....................................................... 28
Figure 16 - Share of new registrations per transmission type .................................................................... 28
Figure 17 - Fuel economy of passenger cars by weight class per body type .............................................. 30
Figure 18 - Fuel economy of LCVs per body type by weight class ............................................................. 31
Figure 19 – Scatter diagram of fuel economy and GVW among vehicle models with respect to baseline
for LDVs ...................................................................................................................................................... 32
Figure 20 - Fuel economy by engine displacement category of LDVs ........................................................ 33
Figure 21 - Scatter plot of fuel economy by engine displacement of LDV body types .............................. 33
Figure 22 - Fuel economy by body type of newly registered LDVs ............................................................ 34
Figure 23 - Fuel economy by gearing type .................................................................................................. 35
Figure 24 - Fuel economy by transmission type ......................................................................................... 35

Establishing Baselines for Fuel Economy of Light Duty Passenger Vehicles in the Philippines – Final Report
September 2015
7
LIST OF TABLES
Table 1 - GFEI Global Targets for Fuel Economy ........................................................................................... 9
Table 2 - Fields included in the Segment Y data ......................................................................................... 13
Table 3 - Data counts for models of newly registered vehicles in 2013 data ............................................. 14
Table 4 - Number of LDV models per weight class based from LTO definitions ......................................... 15
Table 5 - Number of New Registrations of LDVs as per LTO classification, 2013 ....................................... 17
Table 6 - Regional comparison of new LDV registrations in 2013 .............................................................. 18
Table 7 - Summary Statistics for GVW of passenger cars ........................................................................... 20
Table 8 - Summary Statistics for GVW of light commercial vehicles .......................................................... 20
Table 9 - Summary statistics for engine displacement of LDVs .................................................................. 22
Table 10 - Summary of engine displacement per weight class ................................................................... 22
Table 11 - Correlation Matrix for fuel economy, GVW and engine displacement ..................................... 29
Table 12 - Final estimates on fuel economy for newly registered LDVs in the Philippines during 2013 .... 29
Table 13 - Comparison of the harmonic mean with the trimmed mean and the median fuel economy
estimates ..................................................................................................................................................... 30
Establishing Baselines for Fuel Economy of Light Duty Passenger Vehicles in the Philippines – Final Report
September 2015
8
I. Introduction
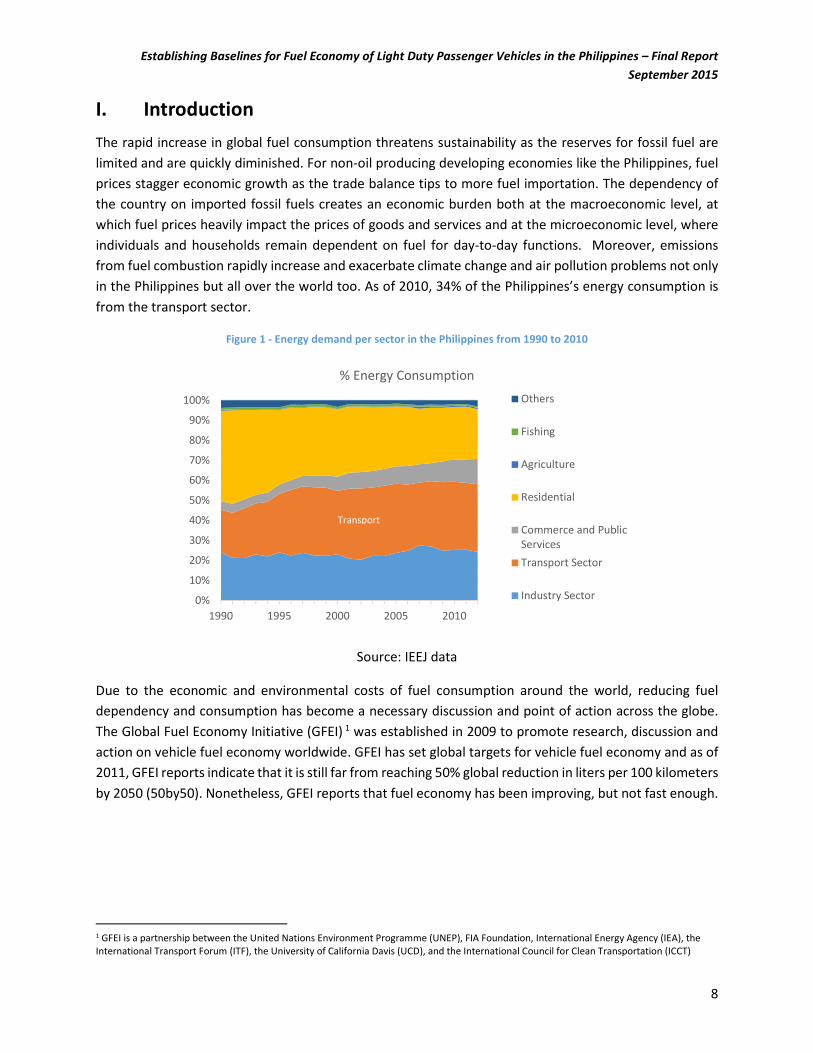
The rapid increase in global fuel consumption threatens sustainability as the reserves for fossil fuel are
limited and are quickly diminished. For non-oil producing developing economies like the Philippines, fuel
prices stagger economic growth as the trade balance tips to more fuel importation. The dependency of
the country on imported fossil fuels creates an economic burden both at the macroeconomic level, at
which fuel prices heavily impact the prices of goods and services and at the microeconomic level, where
individuals and households remain dependent on fuel for day-to-day functions. Moreover, emissions
from fuel combustion rapidly increase and exacerbate climate change and air pollution problems not only
in the Philippines but all over the world too. As of 2010, 34% of the Philippines’s energy consumption is
from the transport sector.
Figure 1 - Energy demand per sector in the Philippines from 1990 to 2010
Source: IEEJ data
Due to the economic and environmental costs of fuel consumption around the world, reducing fuel
dependency and consumption has become a necessary discussion and point of action across the globe.
The Global Fuel Economy Initiative (GFEI) 1 was established in 2009 to promote research, discussion and
action on vehicle fuel economy worldwide. GFEI has set global targets for vehicle fuel economy and as of
2011, GFEI reports indicate that it is still far from reaching 50% global reduction in liters per 100 kilometers
by 2050 (50by50). Nonetheless, GFEI reports that fuel economy has been improving, but not fast enough.
1 GFEI is a partnership between the United Nations Environment Programme (UNEP), FIA Foundation, International Energy Agency (IEA), the
International Transport Forum (ITF), the University of California Davis (UCD), and the International Council for Clean Transportation (ICCT)
0%
10%
20%
30%
40%
50%
60%
70%
80%
90%
100%
1990 1995 2000 2005 2010
% Energy Consumption
Others
Fishing
Agriculture
Residential
Commerce and Public
Services
Transport Sector
Industry Sector
Transport

Establishing Baselines for Fuel Economy of Light Duty Passenger Vehicles in the Philippines – Final Report
September 2015
9
Table 1 - GFEI Global Targets for Fuel Economy
Fuel economy refers to fuel used relative to distance travelled (Fulton, 2014). The terms fuel economy,
fuel efficiency, and fuel intensity are all interchangeable terms. Fuel economy is measured depending on
which country is speaking, and what objectives are involved in terms of policy. For example, fuel economy
is measured in liters per 100 km (l/100km) in Europe, kilometers per liter (km/L) in Japan, and miles per
gallon (mpg) in the United States. Simply put, fuel economy is the rate of energy use.
This study aims to establish a baseline fuel economy estimate for new light-duty vehicles (LDV) that
entered the Philippine fleet in the year 2013.2 The research hopes to facilitate policy discussions by
providing a scientifically-sound assessment of the fuel economy of new light-duty vehicles that enter the
fleet.
II. Developing the National Fuel Economy Policies and Measures
Clean Air Asia (CAA) facilitated discussions on fuel economy policy development for the ASEAN member
countries since 2012 as the strategic partner of GFEI for Asia. The discussions on fuel economy policy for
the Philippines have been ongoing since 2012, with support from UNEP and GFEI. CAA functioned as the
secretariat to a series of stakeholder meetings where representatives from transport and fuel sector were
invited, including various government agencies mandated to deal with transport and fuel efficiency
policies. Some international representatives from other governments and organizations were asked to
share their experiences with fuel economy policies, such as Thailand and India.
A total of six workshop meetings were organized between 2012 and 2013. The first meeting was held in
Malacañang Palace in January 2012 and was attended by representatives from the Department of
Transport and Communications (DOTC), Department of Environment and Natural Resources –
Environmental Management Bureau (DENR-EMB), Department of Energy (DOE), Department of Trade and
Industry (DTI), Department of Science and Technology (DOST), Climate Change Commission (CCC) and the
Senate. The private sector was represented by people from both the fuel retail and car retail industries.
Also present were academic representatives from De La Salle University (DLSU), University of the
Philippines – Diliman (UPD) and Ateneo de Manila University (ADMU). It was in this meeting that GFEI
2 This study excludes two and three-wheelers.

Establishing Baselines for Fuel Economy of Light Duty Passenger Vehicles in the Philippines – Final Report
September 2015
10
together with CAA introduced the efforts being done on fuel economy policy at a global scale. In this
meeting, it was decided that the DOE in coordination with DTI-BPS shall serve as the issuing body of the
fuel economy standards.
A second meeting took place in 3 February 2012, hosted by the DOE. In this meeting, the DOE presented
the proposed National Energy Efficiency and Conservation Bill (NEEC) and invited comments from the
meeting participants. The draft bill is still being finalized in 2014.
Three more meetings occurred in 2012. During this time, CAA and UNEP invited foreign experts to share
their experiences with developing fuel economy standards for their countries. An institutional framework
has also been proposed before the participants, and discussions on institutionalization of fuel economy
have long been underway.
The last meeting was held in October 2013 where the members of the committee decided to establish a
Technical Working Group (TWG) on Fuel Economy which was to be led by Technical Committee 44 (TC44)
of the Bureau of Product Standards in DTI. In this meeting, the participants decided that there is a need
for data to establish fuel economy baselines that are science-based to support the development of the
standards.
To help move the policy development forward, CAA initiated the technical work required to establish the
baseline fuel economy estimation of newly registered passenger vehicles. This study aims to establish the
baseline fuel economy of new LDVs in the Philippines during 2013 using available vehicle registration data.
The baselines shall be used to support policy discussions for the development of fuel economy standards
in the Philippines. The study results was initially presented to TWG representatives from government
(Department of Energy) and private sector (Chamber of Automotive Manufacturers of the Philippines, Inc.
or CAMPI). CAA will aim to resume the stakeholder discussions involving the rest of the TWG members as
next step but largely depending on the policy direction of the Government of the Philippines.
III. Fuel Economy Policy in the Philippine Context
The Philippines has no fuel economy standards in place but there are policies that specifically target fuel
economy improvement in general. The Department of Energy (DOE) has established a roadmap towards
promoting energy conservation in various sectors. Two of the programs that indicate specific energy
efficiency targets are the Philippine Energy Plan and the National Energy Efficiency and Conservation
Program, and both programs include targets for the transport sector summarized below.
Philippine Energy Plan 2012-2030
The Philippine Energy Plan 2012-2030 governs the policies to be implemented that are in line with its
thrust of ensuring energy security in the country. The PEP specifies plans and programs for the power
generation sector, rural electrification, indigenous energy development, renewable energy, downstream
oil industry, downstream natural gas, alternative fuels, and energy efficiency and conservation. The
relevant targets and plans for transport include:

Establishing Baselines for Fuel Economy of Light Duty Passenger Vehicles in the Philippines – Final Report
September 2015
11
1. 10% energy savings on total annual energy demand of all economic sectors, including transport;
2. 30% of all public utility vehicles running on alternative fuels nationwide by 2030;
3. Natural gas as a major alternative fuel for public transport;
4. CNG refilling stations in Metro Manila and LNG Hub Terminals in Quezon; and
5. Promotion of fuel discounts and direct subsidies to public utility jeepneys and tricycle drivers.
National Energy Efficiency and Conservation Program
Alongside the implementation of the PEP is the National Energy Efficiency and Conservation Program
(NEECP) which aims to promote efficient utilization of all forms of energy. The goal of this program is to
achieve an average annual energy savings of 23 million barrels of fuel-oil-equivalent (MMBFOE) and 5.086
gigagram CO2 equivalent (GgCO2e) emissions avoidance for the period 2005 to 2014 (or a total of 229
MMBFOE for the entire period). This also translates to an avoidance of 50.9 million tons of CO2 emissions
for the same period.
IV. Scope and Objectives of Baseline Setting
The following are the objectives of the baseline setting on fuel economy:
1. To estimate from available data the baseline performance of fuel economy of the fleet of new
light duty vehicles in the Philippines;
2. To compare the fuel economy of various vehicle segments with the baseline; and
3. To facilitate the development of fuel economy policies in the Philippines.
This study utilizes 2013 data on newly registered LDVs in the Philippines, which include passenger cars
and light commercial vehicles (LCV) up to 3500 kg (3.5 tons) excluding two and three-wheelers. 2013 data
was selected to arrive at the most up-to-date baseline estimate that closely characterizes the target
vehicle segment currently in the market of the country.
V. Methodology
GFEI Methodology
This study uses the GFEI methodology as the basis for data collection and estimation. The GFEI uses
2005 as the baseline year, and recommends collection of 2008 data and every 2 years thereafter. The
methodology requires a minimum set of data as follows:
• Vehicle make and model, and if possible “configuration” (this typically is labeled by the
manufacturer using a sub-model number or other designation; it can indicate transmission type,
trim level, optional accessories, etc.)
• Model production year
• Year of first registration, if different from model year
• Fuel type

Establishing Baselines for Fuel Economy of Light Duty Passenger Vehicles in the Philippines – Final Report
September 2015
12
• Engine size
• Domestically produced or imported
• New or second hand import
• Rated Fuel Economy per model and test cycle basis. This can be done either by getting data from
country of origin or manufacturer (see Resources section below for links), or by testing of a
select sample of vehicles.
• Number of sales by model
In summary, the baseline-setting exercise includes the following steps:
1. Establish the baseline year (e.g. the GFEI uses 2005)
2. Establish the data points you will need to collect in order to calculate a robust baseline
3. Find and evaluate available new LDV vehicle registration data sources and their quality
4. Calculate your baseline year average fuel economy and other characteristics for newly
registered vehicles; and
5. Repeat the same exercise using uniform methodology at regular intervals.
The GFEI prescribes the harmonic mean fuel economy as the fleet-wide estimator to characterize the fuel
economy of new vehicles that enter the market at base year. The equation is shown in the section on Fuel
Economy Estimation and Interpretation. This methodology has been adopted by other countries such as
Kenya, South Africa, Indonesia, and Chile. For the Philippines, the researchers selected 2013 as the base
year to utilize the most updated and complete data that reflects the current vehicle technology.
For more information on the GFEI methodology, visit www.unep.org/transport/gfei/autotool.
Data Challenges and Limitations
Publicly available data on vehicle sales or registration segmented over specific attributes is very sparse in
the Philippines. The Land Transportation Office (LTO) is the national government agency responsible for
vehicle registration and its Management Information System (MIS) department compiles vehicle
registrations across the region and subsequently publishes the aggregated counts of all registrations
annually. However, the published data contains total vehicle registrations segmented only by fuel type,
vehicle type, new and renewals, and type of ownership, as well as information on unit value. In addition,
the LTO classifies vehicle fuel type into diesel and gasoline only, and it is unclear how vehicles running on
alternative fuel, i.e. electric and hybrid vehicles are classified. In general, the LTO does not report other
details of the registration it deems confidential, and further disaggregation of the data is not available.
Moreover, digital copies of the officially published data are not accessible and difficult to acquire.
Available LTO data cannot supplement the data needs of the fuel estimation method adopted from GFEI,
thus the need to look for data from other sources.
The research team also requested data directly from the car manufacturers and dealers particularly from
the Chamber of Automotive Manufacturers of the Philippines, Inc. (CAMPI) and the Association of Vehicle
Importers and Distributors, Inc. (AVID). Disaggregated sales data based on the requirements of the GFEI
methodology were requested from car manufacturing companies and associations to ensure that the

Establishing Baselines for Fuel Economy of Light Duty Passenger Vehicles in the Philippines – Final Report
September 2015
13
process is consultative. However, requesting for the data from the private sector proved to be a challenge,
and with limited time and resources, other options had to be considered.
As a last resort, Segment Y data was acquired for use in the baseline setting activity. Segment Y
Automotive Intelligence Pvt. Ltd. is a Dutch owned and managed company based in India that focuses on
automotive markets in Asia (Segment Y, 2015) and quality vehicle data is among its many research
products. The limitation of Segment Y data is that it is very difficult to validate. Also, the presence of a
“grey market” (unregistered vehicles) creates uncertainty when generalizing the data fuel economy with
that of the whole Philippine fleet. Another limitation is that the vehicle classification used by Segment Y
does not compare with the official statistics. It is also important to note that the fuel economy values used
in the estimation process refer to the rated (tested) fuel economy (fuel economy based on prescribed
international testing standards and procedures) and may not necessarily reflect the on-the-ground fuel
economy of the specific registered vehicle.3 Segment Y provides urban, extra urban and combined rated
fuel economy, and the baseline estimation utilizes the combined fuel economy of the included models.
Despite this, Segment Y is internationally renowned for its vehicle data and research products, and for the
Philippine data, Segment Y claims confidence in knowing of the uncertainties involved with the data they
provide.
Data Profile
The data from Segment Y contained new vehicles registered for a combination of vehicle models and
versions per vehicle type. The attributes requested from Segment Y are the minimum set of information
recommended by GFEI for fuel economy baseline setting. Segment Y acquires information directly from
vehicle manufacturing companies and in the Philippines and car manufacturing associations such as the
CAMPI and AVID, as well as independently conducted market studies.
Each row corresponds to a specific model and version of the model. Segment Y data contains the fields
shown in Table 2 - Fields included in the Segment Y data, and the definitions of these fields are provided in
Annex 1: Field Definitions for Segment Y Data. A total of 731 vehicle models were included in the data,
620 of which were passenger cars and 111 are LCVs (
Table 3).
Table 2 - Fields included in the Segment Y data
Serial No. Body style
Data type Transmission type
Country Gears
Vehicle type Number of Cylinders
Segment-global Engine Displacement (cc)
Data source Fuel type
Production year Urban
Make Extra Urban
Model Combined
Version Norm
3 This approach follows the guidance of the GFEI methodology.

Establishing Baselines for Fuel Economy of Light Duty Passenger Vehicles in the Philippines – Final Report
September 2015
14
Model code Gross Vehicle Weight (GVW)
Table 3 - Data counts for models of newly registered vehicles in 2013 data
Vehicle Type No. of Models in
Raw Data Percent
passenger cars 620 85%
light commercial vehicles 111 15%
TOTAL 731 100%
Source: Segment Y 2013
Out of the 620 passenger car models, the Mitsubishi i is an electric vehicle with no tested fuel economy
and is removed from the dataset of interest. Thus, 619 passenger car models are included alongside the
111 LCV models for baseline analysis. The distribution by fuel type of passenger car and LCV models is
shown in Figure 2.
Figure 2 – Data distribution of passenger car models by fuel type
The mix of models is highly varied based on production year. Most of the passenger car models have
production years 2010 onwards, but there are quite numerous models produced before 2010 even as far
back as 2002 which would have been 11 years old in 2013. Newly registered LCV models reach as far back
as 2000, which would have been 13 years old in 2013.
The number of models per production year is plotted in Figure 3.
22%
76%
1%76%
24%
0% 20% 40% 60% 80% 100%
passenger cars
light commercial vehicles
diesel hybrid petrol
(111 models)
(619 models)

Establishing Baselines for Fuel Economy of Light Duty Passenger Vehicles in the Philippines – Final Report
September 2015
15
Figure 3 - Number of models by production year
To be comparable with LTO definitions, vehicle gross vehicle weight (GVW) was categorized using LTO-
MIS guidelines under a new variable named “Weight Class”. As seen in Table 4 most models in the data are
medium-weight vehicles.
Table 4 - Number of LDV models per weight class based from LTO definitions
LTO Definition No. of PC models No. of LCV models
Light up to 1600 kilograms 126 9
Medium 1601-2300 kilograms 339 16
Heavy more than 2300 kilograms 154 86
TOTAL 619 111
Fuel Economy Estimation and Interpretation
The baseline estimation utilizes the prescribed methodology by the UNEP using a harmonic mean of fuel
economy as shown in the following formula:
3
19 19
3421
6
132
42
177
135
31
4 112
1 4 411 15 19
32
8
0
20
40
60
80
100
120
140
160
180
200
2000 2001 2002 2004 2005 2006 2007 2008 2009 2010 2011 2012 2013 2014
No
. of
mo
del
s
Production Year
passenger cars light commercial vehicles

Establishing Baselines for Fuel Economy of Light Duty Passenger Vehicles in the Philippines – Final Report
September 2015
16
The harmonic mean controls for the high variability in tested fuel economy between each model and
vehicle weight class. Generally, the harmonic mean is preferred for estimating rates, i.e. fuel economy,
for a certain population. For the Segment Y data, the sales variable is replaced by number of new
registrations which represents the population of new vehicles that enter the Philippine market in 2013.
This allows for policy basis for fuel economy standards of new vehicles.
Segment Y reports fuel economy in liters per 100 kilometers (L/100 km). In order to make the values
comparable across the fleet (and across fuels), the fuel economy of each observation was converted to
liters gasoline equivalent per 100 kilometers (Lge/100 km). 4
The harmonic mean fuel economy in this methodology is interpreted as the average liters of fuel
(converted to Lge) that would be consumed per distance traveled by the vehicles registered at base year.
The higher the value, the less efficient the vehicle and vice versa.
The limitation of this method of estimation is that it utilizes the fuel economy rated from the country of
manufacture as opposed to locally tested fuel economy. This means that the figures may not reflect
localized conditions particularly local drive cycles and ambient conditions. There is no facility that
conducts laboratory testing in the Philippines and according to IEA the difference between rated and real-
world fuel economy can reach up to 10%.
Data Uncertainty
Since Segment Y data acquires what car manufacturers and dealers can and would provide, it is uncertain
whether the models are exhaustive of every model in the market at base year. Despite this concern,
Segment Y is certain that none in the private sector would underreport, and that most of the uncertainty
would come from vehicles from grey imports.
LTO data was acquired for supporting analysis and comparison with the available Segment Y data. LTO is
the authority on vehicle registration in the Philippines, and the agency compiles annual registration
counts. The challenge with comparing LTO data with Segment Y data lie in understanding the vehicle
classification. The LTO does not use the same segment definitions as Segment Y, as can be seen between
Annex 2: and
4 Assumptions are based on conversion factors by the Massachusetts Institute of Technology (MIT)

Establishing Baselines for Fuel Economy of Light Duty Passenger Vehicles in the Philippines – Final Report
September 2015
17
Annex 3: LTO Classification of Motor Vehicles.
Comparing with Official Statistics
Figure 4Error! Reference source not found. shows LTO registration counts from 2010 to 2013, which are
official statistics culled from the LTO compilation. Cars, SUVs and UVs are counted as LDVs based from
LTO classification, and details of this classification are shown in Annex 3. As seen from the data, the
number of new registrations of LDV grew by 18% between 2010 and 2013 or an average of 4.5% per
year. New registrations in 2013 account for about 8% of the total, or 234,000 newly registered LDVs.
Figure 4 - Total number of registrations from 2010 to 2013
Of the 234 thousand newly registered vehicles, 49% are classified as utility vehicles (UV). It is apparent
from this data that there is a gap between LTO and Segment Y at 234 thousand and 160 thousand new
registrations respectively. Segment Y data includes 77,279 cars (hatchback, sedan, coupe, etc.), 47,722
SUVs, and the remainder amounts to 81,482 (light trucks and vans, MPVs, pickups, etc.). The reason is
that the UVs according to LTO classification include bigger vehicles larger than 3.5 tons (Segment Y’s cutoff
for passenger cars). These include transport jeepneys, remanufactured jeepneys, etc. The remainder of
the gap with official data comes from the “grey importers” which are not included in Segment Y data.
Table 5 - Number of New Registrations of LDVs as per LTO classification, 2013
Vehicle Type Number of New Registrations Percent
Cars 73,651 31%
SUV 46,535 20%
UV 113,872 49%
TOTAL 234,058 100%
198 197 217 234
2,568 2,660 2,714 2,775
2,766 2,858 2,931 3,009
-
500
1,000
1,500
2,000
2,500
3,000
3,500
2010 2011 2012 2013
Nu
mb
er o
f V
ehic
les
(Th
ou
san
ds)
YEAR
New Renewal Total Registrations
Establishing Baselines for Fuel Economy of Light Duty Passenger Vehicles in the Philippines – Final Report
September 2015
18
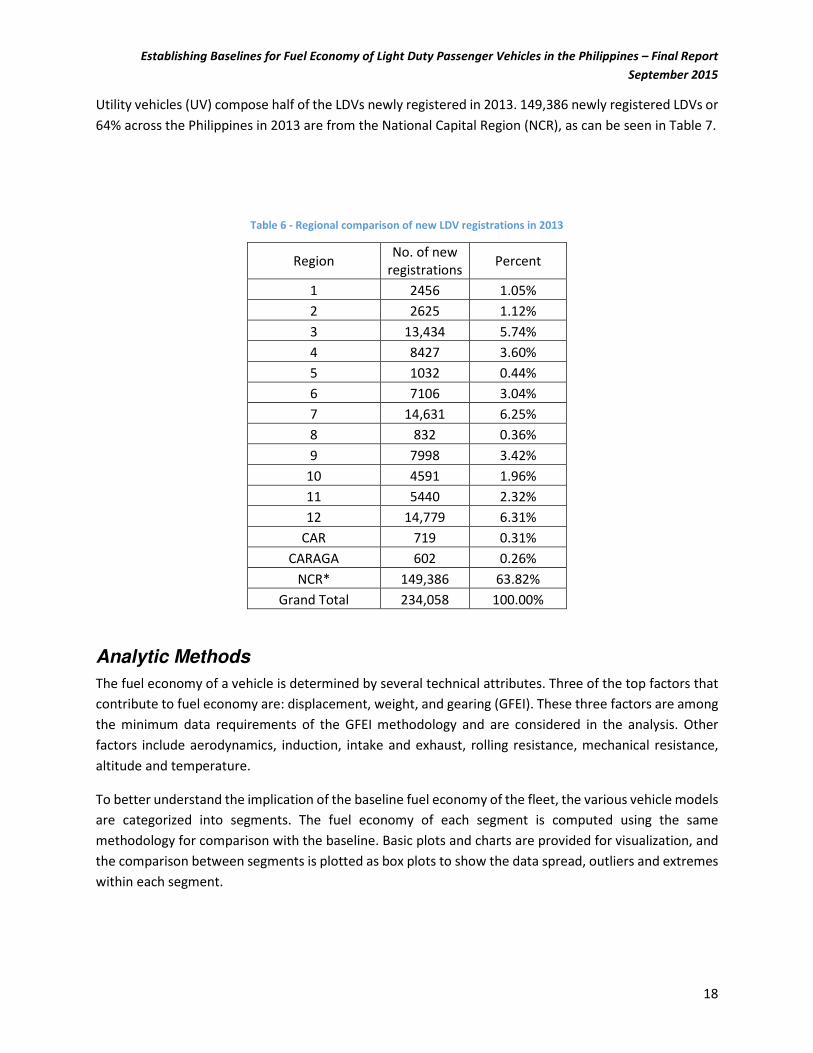
Utility vehicles (UV) compose half of the LDVs newly registered in 2013. 149,386 newly registered LDVs or
64% across the Philippines in 2013 are from the National Capital Region (NCR), as can be seen in Table 7.
Table 6 - Regional comparison of new LDV registrations in 2013
Region No. of new
registrations Percent
1 2456 1.05%
2 2625 1.12%
3 13,434 5.74%
4 8427 3.60%
5 1032 0.44%
6 7106 3.04%
7 14,631 6.25%
8 832 0.36%
9 7998 3.42%
10 4591 1.96%
11 5440 2.32%
12 14,779 6.31%
CAR 719 0.31%
CARAGA 602 0.26%
NCR* 149,386 63.82%
Grand Total 234,058 100.00%
Analytic Methods
The fuel economy of a vehicle is determined by several technical attributes. Three of the top factors that
contribute to fuel economy are: displacement, weight, and gearing (GFEI). These three factors are among
the minimum data requirements of the GFEI methodology and are considered in the analysis. Other
factors include aerodynamics, induction, intake and exhaust, rolling resistance, mechanical resistance,
altitude and temperature.
To better understand the implication of the baseline fuel economy of the fleet, the various vehicle models
are categorized into segments. The fuel economy of each segment is computed using the same
methodology for comparison with the baseline. Basic plots and charts are provided for visualization, and
the comparison between segments is plotted as box plots to show the data spread, outliers and extremes
within each segment.

Establishing Baselines for Fuel Economy of Light Duty Passenger Vehicles in the Philippines – Final Report
September 2015
19
The baseline analysis is purely comparative in nature, and no causal relationship can be established with
the data at hand. All the results are only indicative of any relationship, and further investigation with
proper data is recommended.
VI. Results and Analysis
Summary Statistics for LDVs in the Data
This section presents the descriptive summary statistics of passenger cars and LCVs. The minimum,
maximum and average values are shown alongside measures of variation to characterize the models
included in the data.
Gross Vehicle Weight (GVW)
Weight is one of the factors that determine how hard the engine should work to provide power to the
vehicle. The average weight for all LDV model in the data is 2104 kg. Passenger cars average at 2028
kilograms across all newly registered models in 2013, while LCVs are heavier on average at 2526 kilograms.
Figure 5 provides a visual comparison of GVW across all LDVs and of passenger cars and LCV. Summary
statistics are provided in Figure 5 - Comparison of GVW averages of LDV models, overall, passenger cars and light
commercial vehicles
Table 7 and
Table 8 with LTO weight classes as segmenting variable. A histogram of the GVW is shown in Figure 6 and
it shows that vehicle weights of the newly registered passenger cars lean towards the light to medium
spectrum.
2104.1
2526.2
2028.5
0.0
500.0
1000.0
1500.0
2000.0
2500.0
3000.0
LDV light commercial vehicles passenger cars
GV
W (
kg)

Establishing Baselines for Fuel Economy of Light Duty Passenger Vehicles in the Philippines – Final Report
September 2015
20
Figure 5 - Comparison of GVW averages of LDV models, overall, passenger cars and light commercial vehicles
Table 7 - Summary Statistics for GVW of passenger cars
Weight Class No. of models Low GVW
(kg)
High GVW
(kg)
Average GVW
(kg) Std. Dev Coefficient of variation
Light 126 1150 1600 1446.9 116.7 8%
Medium 339 1608 2300 1956.9 205.1 10%
Heavy 154 2305 3502 2661.9 269.0 10%
Passenger cars 619 2028.5 464.1 23%
Table 8 - Summary Statistics for GVW of light commercial vehicles
Weight Class No. of
models
Low
GVW
(kg)
High
GVW
(kg)
Average
GVW
(kg)
Std.
Dev
Coefficient of
variation
Light 9 1400 1600 1440 70 5%
Medium 16 1615 2150 1816.9 153.4 8%
Heavy 86 2370 3200 2771.8 193.4 7%
Light commercial
vehicles
111 2526.2 499.3 20%
2104.1
2526.2
2028.5
0.0
500.0
1000.0
1500.0
2000.0
2500.0
3000.0
LDV light commercial vehicles passenger cars
GV
W (
kg)

Establishing Baselines for Fuel Economy of Light Duty Passenger Vehicles in the Philippines – Final Report
September 2015
21
Figure 6 - Histogram of GVW for newly registered LDV models in 2013
Figure 7 is a chart of the average GVW of each body type of LDVs. Among passenger cars, SUVs and
MPVs weigh above average GVW, while sedans weigh below average GVW. For LCVs, vans are the
heaviest and the mini trucks are the lightest. Overall LDVs, vans have the highest average GVW while
hatchbacks have the lowest average GVW.
Figure 7 - Average GVW per body type of LDV models
0
10
20
30
40
50
60
70
1150
1248
1346
1444
1542
1640
1738
1836
1934
2032
2130
2228
2326
2424
2522
2620
2718
2816
2914
3012
3110
3208
3306
3404
Mor
e
Fre
qu
ency
GVW (kg)
0.0
500.0
1000.0
1500.0
2000.0
2500.0
3000.0
va
n
SU
V
MP
V
cab
rio
let
(4 s
ea
ts)
est
ate
cou
pé
sed
an
roa
dst
er
(2 s
ea
ts)
ha
tch
ba
ck
va
n
va
n-b
ase
d t
ruck
pic
k-u
p d
ou
ble
ca
b
tru
ck c
ha
ssis
pic
k-u
p c
ha
ssis
pic
k-u
p s
ing
le c
ab
pa
ne
l v
an
min
i v
an
min
i tru
ck
passenger cars light commercial vehicles
GV
W (
kg
)

Establishing Baselines for Fuel Economy of Light Duty Passenger Vehicles in the Philippines – Final Report
September 2015
22
Engine Displacement
Engine displacement is the volume swept by all the pistons inside the cylinders of a reciprocating engine
in a single movement from top dead center (TDC) to bottom dead center (BDC). Holding all other things
constant, larger engines tend to make more horsepower because they can naturally move more air per
revolution, requiring more fuel to generate such power. The unit for engine displacement is cubic
centimeters (cc), and is an indicator of the engine’s size and power based on the volume of its cylinders.
The average engine displacement of the models is 2395 cc. For comparability, engine displacement of
each model was categorized according to the study by IEA and GFEI. Table 9 provides summary statistics
for engine displacement and it shows that there is low variation within each category. Table 10 provides
the engine displacement averages based on weight class, showing high variation in engine displacement
of each class.
Table 9 - Summary statistics for engine displacement of LDVs
Engine Displacement Category No. of
models Min CC Max CC Average CC Std Dev
Coefficient
of
variation
Less than 800 4 796 796 796.0 0.0 0%
800-1200 35 812 1199 1063.5 121.1 11%
1200-1600 204 1206 1598 1470.0 120.1 8%
1600-2000 132 1685 1999 1946.1 88.3 5%
2000-2400 49 2143 2400 2269.3 92.5 4%
2400-2800 119 2402 2793 2549.1 111.1 4%
2800-3200 73 2902 3200 2999.8 62.6 2%
Greater than 3200 114 3342 6749 4485.0 1027.3 23%
Table 10 - Summary of engine displacement per weight class
Weight Class No. of
Models Min CC Max CC Average CC Std Dev
Coefficient
of
Variation
Light 135 796 1997 1321.9 217.4 16%
Medium 355 999 6424 2293.23 1022.4 45%
Heavy 240 1809 6749 3122.7 1052.9 34%
Supporting analysis is shown in Figure 8 and Figure 9. The histogram shows how widely spread the engine
displacement is across the models. Closer examination of the engine displacement of each model shows
that the coupé has the highest spread of engine CC compared to the other body types, and on average
have larger engine displacement. In contrast, hatchbacks have smaller spread and lower engine
displacement on average. Figure 9 shows the average engine displacement per body type, where the

Establishing Baselines for Fuel Economy of Light Duty Passenger Vehicles in the Philippines – Final Report
September 2015
23
coupe has the highest engine displacement among passenger cars and LDVs while the mini-vans have the
lowest engine displacement among LDVs.
Figure 8 - Histogram of engine displacement across LDV models
Figure 9 - Average engine displacement per body type of LDV models
Segments
New registrations represent the vehicles that enter the market. A vehicle’s demand is based on certain
specifications that meet the needs of the buyer, creating different market segments. The baseline can be
0
20
40
60
80
100
120
140
796.
0
1044
.0
1292
.1
1540
.1
1788
.2
2036
.2
2284
.3
2532
.3
2780
.3
3028
.4
3276
.4
3524
.5
3772
.5
4020
.5
4268
.6
4516
.6
4764
.7
5012
.7
5260
.8
5508
.8
5756
.8
6004
.9
6252
.9
6501
.0
Mor
e
Fre
qu
ency
Engine displacement (cc)
0.0
500.0
1000.0
1500.0
2000.0
2500.0
3000.0
3500.0
4000.0
cou
pé
roa
dst
er
(2 s
ea
ts)
va
n
SU
V
cab
rio
let
(4 s
ea
ts)
sed
an
est
ate
MP
V
ha
tch
ba
ck
pic
k-u
p d
ou
ble
ca
b
tru
ck c
ha
ssis
pic
k-u
p s
ing
le c
ab
va
n
va
n-b
ase
d t
ruck
pic
k-u
p c
ha
ssis
pa
ne
l v
an
min
i tr
uck
min
i va
n
passenger cars light commercial vehicles
En
gin
e d
isp
lace
me
nt
(cc)

Establishing Baselines for Fuel Economy of Light Duty Passenger Vehicles in the Philippines – Final Report
September 2015
24
understood better by looking at the distribution of registrations and the fuel economy of the various
segments. The segments are identified as follows:
• Weight class
• Fuel type
• Body type
• Gearing
• Transmission type
Figure 10 shows the distribution of newly registered LDVs in 2013, where 78% of registrations were
passenger cars. Further disaggregation is shown in Figure 11, where the share of registrations per weight
class is shown for each LDV type. The chart shows that Light to Medium-sized vehicles dominated the
passenger car market in while Heavy-sized vehicles led the LCV market in 2013.
Figure 10 - Distribution of newly registered LDVs in 2013
78%
22%
passenger cars
light commercialvehicles
No. of new registrations = 206,387

Establishing Baselines for Fuel Economy of Light Duty Passenger Vehicles in the Philippines – Final Report
September 2015
25
Figure 11 - Distribution of new registrations per vehicle type by weight class
Figure 12 presents the share of new registrations per fuel type, and it shows that there is a nearly equal
share of diesel and gasoline vehicles. There were a small number of hybrid vehicles running on regular
unleaded gasoline that were in the registration data. The fuel type is one of the determinants of emissions
and would be useful for converting L/100 km to Lge/100km and gCO2/km.
Figure 12 – Shares of newly registered LDVs per fuel type
Since passenger cars and LCVs have different markets and functions, the market segments of the two
types of LDV are presented in cumulative charts below. For passenger cars, sedans, SUVs and MPVs had
the most number of new passenger car registrations in 2013 which when combined composes about 84%
1%
35%
4%
42%
95%
23%
0% 20% 40% 60% 80% 100%
light commercial vehicles
passenger cars
Light Medium Heavy
(160,711 registrations)
(45,676 registrations)
50.29%49.66%
0.05%
diesel
petrol
hybrid
No. of new registrations = 206,387

Establishing Baselines for Fuel Economy of Light Duty Passenger Vehicles in the Philippines – Final Report
September 2015
26
of the newly registered passenger cars as can be seen in Figure 13. For LCVs, the pick-up double truck and
the van had the largest combined share of registrations at 84% as seen in Figure 14.
The figures indicate that majority of passenger cars that entered the Philippine market in 2013 favors the
type of vehicles generally preferred by families and the working class. Sedans are generally cheap small
cars made easily accessible through car loans and low tax rates. This is in line with the analysis conducted
by IEA and GFEI (OECD/IEA, 2011) in which they indicated that developing countries favor small to mid-
sized cars as the car for all-around car use. The dominance of these car types directly impact the fleet-
wide fuel economy.
On the other hand, it is difficult to deduce the reason for the dominance of pick-ups and vans among
newly registered LCVs. There is no information on the function where the specific models are utilized, and
for better understanding of the freight baselines, it is recommended to further study how these vehicles
are typically used.
In the succeeding sections, the fuel economy estimates of each market segment would allow a realization
of the performance and implications on fuel consumption of passenger cars sold in the country.
Figure 13 - Cumulative percentage of newly registered passenger cars by body type
32.32%
62.01%
84.09%
0%
10%
20%
30%
40%
50%
60%
70%
80%
90%
100%
0
10,000
20,000
30,000
40,000
50,000
60,000
sedan SUV MPV hatchback coupé van estate roadster(2 seats)
cabriolet(4 seats)
Percen
t of p
asseng
er carsNo
. of
new
reg
istr
atio
ns
Body type
No. of new registrations Cumulative %
Total newly registered passenger cars = 160,712

Establishing Baselines for Fuel Economy of Light Duty Passenger Vehicles in the Philippines – Final Report
September 2015
27
Figure 14 - Cumulative percentage of newly registered LCVs by body type
Aside from weight and engine displacement, the distribution of registered vehicles based on gearing and
transmission type also provides further insights to market preference. Gearing is the base feature that
determines how the vehicle is maneuvered on the road. In terms of fuel economy, the basic system that
converts engine revolutions into rolling tires is transmission, and the number of gears determines how
efficient the engine provides more speed to the vehicle when driving. Figure 15 and Figure 16 show the
shares of registration by gear and transmission type. Figure 15 indicates that most LDVs newly registered
in 2013 are 5-speed cars, while Figure 16 indicates that there is more or less an equal share of manual and
automatic transmission car among new registrations.
44%
84%
0%
20%
40%
60%
80%
100%
0
5000
10000
15000
20000
25000
Percen
t of L
CV
sN
o. o
f n
ew r
egis
trat
ion
s
No. of registrations Cumulative Percent
No. of newly registered LCV = 45,676

Establishing Baselines for Fuel Economy of Light Duty Passenger Vehicles in the Philippines – Final Report
September 2015
28
Figure 15 - Percent of new registrations by number of gears of LDVs
Figure 16 - Share of new registrations per transmission type
Correlation Analysis
There is evidence of correlation between the tested fuel economy, engine displacement and the gross
vehicle weight (GVW) of models in the data. This can be seen in the correlation matrix provided in Table
11. The tested fuel economy seems to be highly correlated with engine displacement, and moderately
correlated with gross vehicle weight when looking across the models in the data. Engine displacement
and gross vehicle weight are also moderately correlated.
30%
51%
14%
0%
0%0%
5%
4 speed
5 speed
6 speed
7 speed
8 speed
9 speed
CVT
0%
49%
5%
2%
44%
automated manual
automatic
CVT
dual clutch
manual

Establishing Baselines for Fuel Economy of Light Duty Passenger Vehicles in the Philippines – Final Report
September 2015
29
Table 11 - Correlation Matrix for fuel economy, GVW and engine displacement
Combined Fuel Economy Gross Vehicle Weight Engine Displacement
Combined Fuel Economy 1 0.62 0.80
Gross Vehicle Weight (GVW) 0.62 1 0.68
Engine Displacement 0.80 0.68 1
Fleet-wide Fuel Economy Estimates
Using the harmonic mean over number of registrations, the fleet-wide fuel economy estimates for each
vehicle type were computed as seen in Table 12 below. The computations are based on the combined
tested fuel economy of each vehicle model (weighted average of urban and extra-urban fuel economy).
Based from the new registrations of Segment Y data, LDVs have an average fuel economy of 7.8 Lge/100
km. A disaggregation by fuel type for each vehicle type is also provided.
Table 12 - Final estimates on fuel economy for newly registered LDVs in the Philippines during 2013
Vehicle Type Highest FE
(Lge/100 km)
Lowest FE
(Lge/100 km)
Harmonic Mean FE
(Lge/100 km)
Light duty vehicles 7.8
Diesel 10.3
Gasoline 6.3
Others 4.5
Passenger cars 2.5 16.8 7.3
Diesel 4.7 13.4 9.9
Gasoline 3.8 16.8 6.2
Others 2.5 8 4.5
Light commercial vehicles 5.9 13.9 9.9
Diesel 6.7 13.9 11.2
Gasoline 5.9 12.5 9.4
Others none none None
To see the performance of the harmonic mean as an estimate, the arithmetic mean5 and the 5%, 10% and
20% trimmed means6 are provided in Table 13. Note that the additional estimates are based on the tested
fuel economy of the models in the data. The table shows that the harmonic mean fuel economy is lower
than the other estimates, implying that models with higher registrations must have low (better) Lge/100
km. Since the harmonic mean is based on registrations, the implication is that majority of new passenger
car models registered in 2013 tended to be more efficient than average, thus pulling the fleet-wide
harmonic mean down. In contrast, the harmonic mean fuel economy for LCVs seems to indicate low
efficiency of new registrations.
5 The arithmetic mean is the basic average (sum of observations over number of observations). 6 The M% trimmed mean is computed by removing M% of the sorted data points (array) from the top-most and bottom-most
values. It is a means of checking for the robustness of estimates in the presence of extreme values and outliers.

Establishing Baselines for Fuel Economy of Light Duty Passenger Vehicles in the Philippines – Final Report
September 2015
30
Table 13 - Comparison of the harmonic mean with the trimmed mean and the median fuel economy estimates
Vehicle Type Harmonic Mean FE
(Lge/100 km)
Median FE
(Lge/100 km)
Arithmetic Mean FE (Lge/100
km)
5% Trimmed Mean FE (Lge/100
km)
10% Trimmed Mean FE (Lge/100
km)
20% Trimmed Mean FE (Lge/100
km)
passenger cars 7.3 7.6 8.0 7.9 7.8 7.8
light commercial vehicles 9.9 10 9.2 9.2 9.2 9.3
Fuel Economy and Vehicle Weight
The fuel economy for each body type was estimated by weight class based from the LTO-MIS guidelines.
Separate baseline comparison for LCVs and passenger cars are provided. Figure 17 shows a baseline
comparison for the passenger cars by weight class. It can be seen from the chart that almost all the light-
weight body types fall below average Lge/100 km, or in general are more efficient than baseline. Light and
medium sedan models on average perform better than the baseline at 6.2 and 6.6 Lge/100 km
respectively. Similar to sedans, low and medium hatchbacks seem to perform better than most of the
other body types.
Figure 17 - Fuel economy of passenger cars by weight class per body type
A similar chart was constructed for LCVs as Figure 18. It is apparent from the chart that the heavy body
types fall above baseline for LCVs (9.9 Lge/100 km). The number of registrations was dominated by heavy
pick-ups and vans, thus pulling the harmonic mean up for LCVs. Only the mini-truck, mini vans and panel
7.8
5.1
7.8
10.5
8.2
4.7
5.9
8.5
7.8
9.2
10.1
6.8
8.0
6.26.6
8.5
7.27.6
10.4
12.2
0
5000
10000
15000
20000
25000
30000
35000
40000
0
2
4
6
8
10
12
14
Med
ium
Ligh
t
Med
ium
Hea
vy
Med
ium
Ligh
t
Med
ium
Hea
vy
Ligh
t
Med
ium
Hea
vy
Ligh
t
Med
ium
Ligh
t
Med
ium
Hea
vy
Ligh
t
Med
ium
Hea
vy
Hea
vy
cabriolet coupé estate hatchback MPV roadster sedan SUV van
No
. of reg
istration
sL
ge/
100
km
Average FE Overall FE No. of registrations

Establishing Baselines for Fuel Economy of Light Duty Passenger Vehicles in the Philippines – Final Report
September 2015
31
vans fall below the average Lge/100 km – these body types are more efficient than both LCV baseline and
the overall LDV baseline of 7.8 Lge/100 km.
Figure 18 - Fuel economy of LCVs per body type by weight class
Figure 19 is a scatter plot to show where the fuel economy of each model lies with respect to the baseline
estimate. Segmentation by weight class is provided for visual comparison. It can be seen that although
half of the LDV models have indicated fuel economy above the baseline of 7.8 Lge/100 km, only 44% of
the new registrations perform better than baseline. It seems that based on the data, vehicles with higher
GVW have higher Lge/100 km. This can be seen from the LCV models above the baseline. The highest
(least efficient) rated fuel economy among the models is 16.8 Lge/100 km and the lowest (most efficient)
is at 2.5 Lge/100 km.
6.06.6
7.9
6.16.5 6.5
11.0 11.1 11.1 11.0
13.0
11.2 11.5
0.0
5000.0
10000.0
15000.0
20000.0
25000.0
0.0
2.0
4.0
6.0
8.0
10.0
12.0
14.0
Light Medium Heavy Light Medium Medium Heavy Medium Heavy Heavy Heavy Heavy Heavy
mini truck mini van panelvan
pick-upchassis
pick-up doublecab
pick-upsinglecab
truckchassis
van van-basedtruck
No
. of n
ew reg
istration
sL
ge/
100
km
Segment FE LCV Baseline No. of registrations

Establishing Baselines for Fuel Economy of Light Duty Passenger Vehicles in the Philippines – Final Report
September 2015
32
Figure 19 – Scatter diagram of fuel economy and GVW among vehicle models with respect to baseline for LDVs
Fuel Economy and Engine Displacement
Figure 20 is a chart of the fuel economy estimates per engine displacement segmented according to the
GFEI methodology. The plot shows a clear relationship between fuel economy and engine displacement,
although further investigation must be done to establish this relationship. Nonetheless, based from data,
vehicles with higher engine displacement have higher Lge/100 km, meaning higher displacement results
in less-efficient vehicles. Vehicles with engine displacement above 1600 cc represented in the data have
Lge/100 km above the baseline.
A scatter plot similar to Figure 19 is provided (Figure 21) with lines marking the delineation between each
engine displacement category. The individual observations show that for passenger cars, models with
body type as coupes and SUVs are the body types with above average Lge/100 km, indicating less
efficiency compared to baseline. Similarly, vans and pick-ups lie above baseline, although these body types
have mid-range engine displacement but as shown in the previous scatter diagram, these body types have
heavier GVW.
0.0
2.0
4.0
6.0
8.0
10.0
12.0
14.0
16.0
18.0
0 500 1,000 1,500 2,000 2,500 3,000 3,500 4,000
Lg
e/10
0 km
GVW
SUV
MPV
estate
roadster (2 seats)
cabriolet (4 seats)
coupé
hatchback
sedan
mini van
pick-up
van
truck
mini truck
LIGHT MEDIUM HEAVY
BASELINE FUEL ECONOMY = 7.8 Lge/100 km
361 models (50%)
89,840 registrations (44%)
369 models (50%)
116,546 registrations (44%)

Establishing Baselines for Fuel Economy of Light Duty Passenger Vehicles in the Philippines – Final Report
September 2015
33
Figure 20 - Fuel economy by engine displacement category of LDVs
Figure 21 - Scatter plot of fuel economy by engine displacement of LDV body types
4.4 4.6
6.37.3
9.810.7 10.7 10.4
0.0
2.0
4.0
6.0
8.0
10.0
12.0
Less
than
800
800-
1200
1200
-160
0
1600
-200
0
2000
-240
0
2400
-280
0
2800
-320
0
Gre
ater
than
320
0
Lg
e/10
0 km
Engine displacement (cc)
Segment FE Baseline
0.0
2.0
4.0
6.0
8.0
10.0
12.0
14.0
16.0
18.0
0 400
800
1,200
1,600
2,000
2,400
2,800
3,200
3,600
4,000
4,400
4,800
5,200
5,600
6,000
6,400
6,800
7,200
Lg
e/10
0 km
Engine displacement (cc)
SUV
MPV
estate
roadster (2 seats)
cabriolet (4 seats)
coupé
sedan
hatchback
mini van
pick-up
van
truck
mini truck
BASELINE FUEL ECONOMY = 7.8 Lge/100 km

Establishing Baselines for Fuel Economy of Light Duty Passenger Vehicles in the Philippines – Final Report
September 2015
34
Fuel Economy and Segments
a. Fuel Economy by Body Type
Figure 22 - Fuel economy by body type of newly registered LDVs
Figure 22 shows a comparison of harmonic mean fuel economy for each body type. The dark blue bars
are the LCVs and the light blue bars are the passenger cars. It can be seen from this chart that the large
body types have fuel economy above the baseline, meaning these body types are less efficient. The
hatchback has the most efficiency across all body types, while the truck chassis have the least. As shown
in earlier sections, the truck chassis has one of the heaviest vehicle bodies and one of the highest engine
displacement.
b. Fuel Economy and Gearing
Figure 23 and Figure 24 provide additional insights into the rated fuel economy of vehicle segments by
gearing and transmission. It can be seen that when compared to baseline, the registered vehicles with
Continuously Variable Transmission (CVT) technology on average is the most fuel efficient compared to
baseline, and the others are close to baseline. CVT, also known as single-speed transmission, gearless
transmission, one-speed automatic and variable pulley transmission, is a transmission technology that can
change seamlessly through an infinite number of effective gear ratios to find the perfect combination for
speed, fuel efficiency, or both (Haj-Assaad, 2012). This result does not immediately imply that CVT is better
than the other transmission types, although further investigation is recommended.
5.0
6.3 6.5 6.5 6.5
7.5 7.8 7.9 8.2
9.29.5
11.0 11.0 11.1 11.2 11.5
13.0
0.0
2.0
4.0
6.0
8.0
10.0
12.0
14.0
Lg
e/10
0 km
Segment FE Baseline

Establishing Baselines for Fuel Economy of Light Duty Passenger Vehicles in the Philippines – Final Report
September 2015
35
Figure 23 - Fuel economy by gearing type
Figure 24 - Fuel economy by transmission type
V. Summary and Conclusion Based on the available data, the harmonic mean fuel economy of newly registered LDVs in the Philippines
during 2013 is 7.8 Lge/100 km. Passenger cars perform better than baseline at 7.3 Lge/100 km while LCVs
perform worse than baseline at 9.9 Lge/100 km.
It can be inferred that sedans and SUVs determined the fleet-wide fuel economy of passenger cars newly
registered in 2013. Light sedans in particular are in-demand vehicles in the Philippines due to their
relatively cheap costs, easy access to bank support and market availability. Sedans are about 32% of new
registrations and were the bulk of the market at that year. Sedans perform below the baseline at 6.3
9.4 9.7
7.97.2
6.77.6
5.1
0
20000
40000
60000
80000
100000
120000
140000
0.0
2.0
4.0
6.0
8.0
10.0
12.0
4 speed 5 speed 6 speed 7 speed 8 speed 9 speed CVT
No
. of reg
istration
s
Lg
e/10
0 km
Gear
Segment FE Baseline No. of registrations
10.1
8.7
5.2
6.6
4.8
0
20000
40000
60000
80000
100000
120000
0.0
2.0
4.0
6.0
8.0
10.0
12.0
manual automatic CVT dual clutch automated
manual
No
. of re
gistra
tion
sLg
e/1
00
km
Transmission Type

Establishing Baselines for Fuel Economy of Light Duty Passenger Vehicles in the Philippines – Final Report
September 2015
36
Lge/100 km, and seem to be the most fuel efficient passenger cars. The compact size of the sedan makes
it easy to maneuver especially in crammed streets of the Philippines’ urban areas.
On the other hand, SUVs showed to be less efficient than the baseline. The average fuel economy of SUVs
in 2013 was 9.5 Lge/100 km. This is probably because this body type is heavier, larger and has larger
engine displacement, although as emphasized, the relationship is merely indicative and further studies
must be conducted. SUVs weigh from 1420 to 3502 kg and have a displacement ranging from 1328 to
5663 cc. However, SUVs have more rider capacity than sedans, making them ideal for family driving.
Among LCVs, the market was dominated by vans and pick-ups, and there is a lack of information on what
these vehicles were used to understand the demand. It is possible that these vehicles were either adopted
for public utility or as freight. The LCVs in the data are heavy vehicles with high engine displacement that
indicate inefficiency.
The market preference determines how fuel efficient the fleet is. The private sector plays the role of
making energy efficient technology available in the market and the government must ensure that this is
met through policy intervention. The fuel economy baseline in this study could serve as a start.
This study does not determine which vehicles are better or not. Rather, it provides estimate of the baseline
of the fuel economy based from available data, then compares the fuel economy of the various segments
with respect to the data. It also provides a lead on which vehicles may be improved or further tested
based on its utilization on the ground.
VI. Recommendations The baseline serves is just a characterization of the fleet. The results of this study can be used to continue
the stakeholder discussions on vehicle fuel economy in the Philippines, especially among the government
and private sector representatives of the TWG. It can also be used to support other policy instruments
under discussion such as the Philippine Energy Efficiency Roadmap (and action plan), draft Senate bill on
National Energy Efficiency and Conservation, and initial discussions to develop a policy for mandatory fuel
economy labeling.
The constraints to vehicle data needs to be addressed. The study team employed multiple approaches to
acquire data since this is not readily available from government agencies. A deeper involvement and
engagement of the private sector to provide data sets (standardized based on the GFEI methodology) is
ideal to verify and improve the baseline estimates, as well as to monitor future vehicle growth.
We further recommend for the government to continuously gather annual vehicle registration data to
determine the trend of fuel economy across the fleet over the years and to expand the baseline-setting
study to include other vehicle types such as Heavy-Duty Vehicles (HDVs) and motorcycles. This will aid
government min setting the fuel economy targets for a range of vehicle segments in the long term so that
is consistent with the trajectory of vehicle growth that can easily be supported by the private sector and
accepted by the public. Fuel economy policies (and the GFEI targets) can only be achieved in the
Philippines if there is a clear understanding between policy makers and the automotive industry especially
with regards timeline of implementation.

Establishing Baselines for Fuel Economy of Light Duty Passenger Vehicles in the Philippines – Final Report
September 2015
37
Annex 1: Field Definitions for Segment Y Data
Field Definition
Serial No. Identification from Segment Y
Data type
Country The country where the data was acquired
Vehicle type The vehicle classification of the model
Segment-global The market segment
Data source The data provider
Production year Year when model is available in the market
Make The vehicle’s brand or creator
Model The specific name of the vehicle model
Version The specific version of the vehicle model
Model code Specific model code
Body style The base style of the vehicle model based from global classifications
Transmission type The power transmission technology of the vehicle
Gears The gearing technology of the vehicle
Number of Cylinders The number of cylinders in the engine
Engine Displacement (cc) The volume within the cylinders of the engine of the vehicle
Fuel type The required fuel of the vehicle (diesel, petrol, hybrid, electric)
Urban (L/100 km) Fuel economy of the vehicle when driving in urban areas
Extra Urban (L/100 km)
Fuel economy of the vehicle when driving in extra urban areas (Highways,
etc.)
Combined (L/100 km)
The weighted average fuel economy based on the urban and extra urban
fuel economy
Norm The country whose manufacturing specifications were followed
Gross Vehicle Weight (GVW) The rated maximum vehicle weight of the model

Establishing Baselines for Fuel Economy of Light Duty Passenger Vehicles in the Philippines – Final Report
September 2015
38
Annex 2: Segment Y Vehicle Segment Definitions
Passenger Cars
Segment Description
mini small cars below 3.8m, engines 0.8-1.2 litre, includes slightly larger, cheaper Chinese origin cars
small sedans and hatchbacks, engines between 1.2 and 1.6, length around 3.8-4.2m
lower medium
sedans and hatchbacks, engines generally between 1.5 and 2.0 litres, length around 4.4m
medium sedans and hatchbacks, engines generally between 1.8 and 2.4 litres, length around 4.6m
upper medium mostly sedans, engines around 2 litre, premium brands
large mostly sedans, length 4.7m+, engines 2 litres and above
luxury mostly sedans, length 5.0m+, engines 3 litres and above
small MPV small MPVs, 5-7 seaters, 1.2-1.5 litre engines
medium MPV MPVs with 5-8 seats, engines 1.8 to 2.5, includes Asian MPVs like Innova
large MPV MPV with 7 seats or more, engines 2 litre and above
small SUV SUV body, length below 4.2m, engines up to 1.6 litres
monocoque SUV monocoque MPVs, engines around 2.0-2.5 litre, seating usually just 5
medium SUV mostly ladder chassis SUVs, engines 2.0-3.5 litre, length 4.6m+
premium SUV large or expensive SUVs, engine usually 3.0 litre+
entry sports small coupe's, cabrio's, engine up to 2 litres, non-premium brands
sports coupe's, cabrio's, engine above 2 litres, includes non-premium brands
exotic sports coupe's, cabrio's, engine above 3 litres, premium brands
Light Commercial Vehicles
Segment Description
mini van small vans derived from Japanese K-car class, engines up to 1.3 litre
mini truck small trucks derived from Japanese K-car class, engines up to 1.3 litre
pick-up pick-up body with single or double cab, engine 2-3 litre
van panel van, engine above 1.6 litre
truck cab-over-wheel body, separate load area
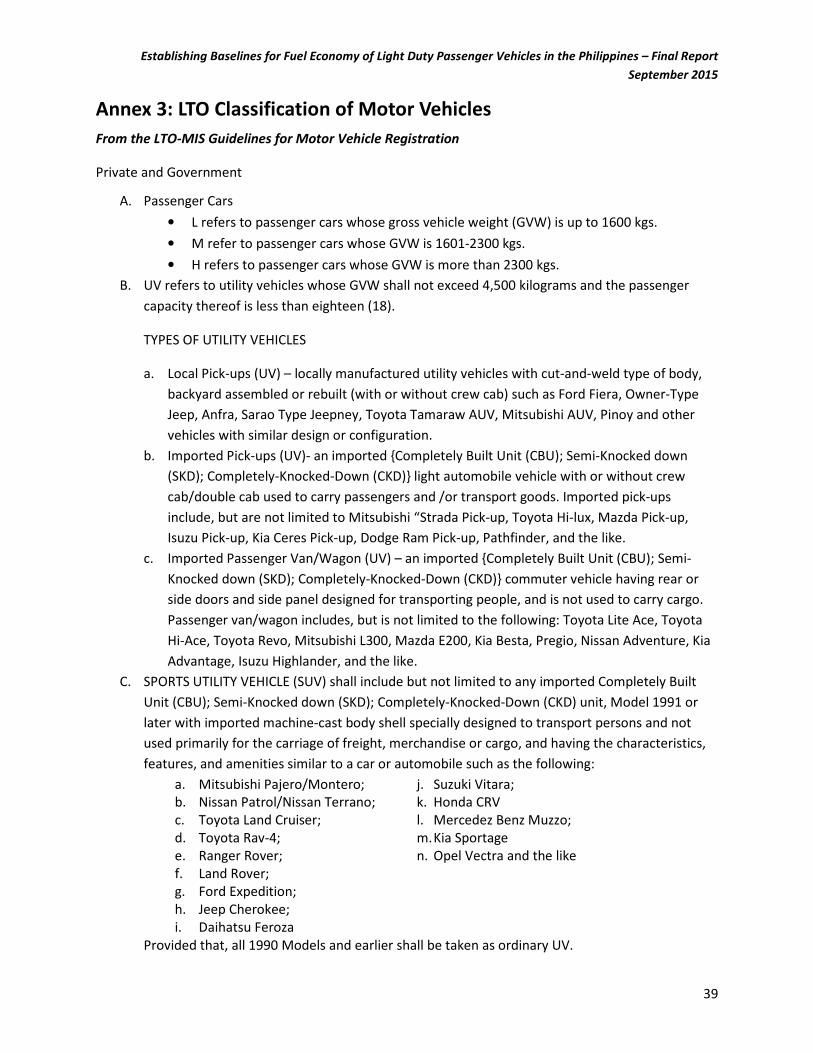
Establishing Baselines for Fuel Economy of Light Duty Passenger Vehicles in the Philippines – Final Report
September 2015
39
Annex 3: LTO Classification of Motor Vehicles
From the LTO-MIS Guidelines for Motor Vehicle Registration
Private and Government
A. Passenger Cars
• L refers to passenger cars whose gross vehicle weight (GVW) is up to 1600 kgs.
• M refer to passenger cars whose GVW is 1601-2300 kgs.
• H refers to passenger cars whose GVW is more than 2300 kgs.
B. UV refers to utility vehicles whose GVW shall not exceed 4,500 kilograms and the passenger
capacity thereof is less than eighteen (18).
TYPES OF UTILITY VEHICLES
a. Local Pick-ups (UV) – locally manufactured utility vehicles with cut-and-weld type of body,
backyard assembled or rebuilt (with or without crew cab) such as Ford Fiera, Owner-Type
Jeep, Anfra, Sarao Type Jeepney, Toyota Tamaraw AUV, Mitsubishi AUV, Pinoy and other
vehicles with similar design or configuration.
b. Imported Pick-ups (UV)- an imported {Completely Built Unit (CBU); Semi-Knocked down
(SKD); Completely-Knocked-Down (CKD)} light automobile vehicle with or without crew
cab/double cab used to carry passengers and /or transport goods. Imported pick-ups
include, but are not limited to Mitsubishi “Strada Pick-up, Toyota Hi-lux, Mazda Pick-up,
Isuzu Pick-up, Kia Ceres Pick-up, Dodge Ram Pick-up, Pathfinder, and the like.
c. Imported Passenger Van/Wagon (UV) – an imported {Completely Built Unit (CBU); Semi-
Knocked down (SKD); Completely-Knocked-Down (CKD)} commuter vehicle having rear or
side doors and side panel designed for transporting people, and is not used to carry cargo.
Passenger van/wagon includes, but is not limited to the following: Toyota Lite Ace, Toyota
Hi-Ace, Toyota Revo, Mitsubishi L300, Mazda E200, Kia Besta, Pregio, Nissan Adventure, Kia
Advantage, Isuzu Highlander, and the like.
C. SPORTS UTILITY VEHICLE (SUV) shall include but not limited to any imported Completely Built
Unit (CBU); Semi-Knocked down (SKD); Completely-Knocked-Down (CKD) unit, Model 1991 or
later with imported machine-cast body shell specially designed to transport persons and not
used primarily for the carriage of freight, merchandise or cargo, and having the characteristics,
features, and amenities similar to a car or automobile such as the following:
a. Mitsubishi Pajero/Montero;
b. Nissan Patrol/Nissan Terrano;
c. Toyota Land Cruiser;
d. Toyota Rav-4;
e. Ranger Rover;
f. Land Rover;
g. Ford Expedition;
h. Jeep Cherokee;
i. Daihatsu Feroza
j. Suzuki Vitara;
k. Honda CRV
l. Mercedez Benz Muzzo;
m. Kia Sportage
n. Opel Vectra and the like
Provided that, all 1990 Models and earlier shall be taken as ordinary UV.
Establishing Baselines for Fuel Economy of Light Duty Passenger Vehicles in the Philippines – Final Report
September 2015
40
Works Cited
Fulton, L. (2014). Fuel Economy State of the World 2014: The World is Shifting into Gear on Fuel
Economy. Sri Lanka: BAQ 2014.
GFEI. (n.d.). GFEI Toolkit. Retrieved December 2014, from Global Fuel Economy Initiative:
http://www.unep.org/transport/gfei/autotool/nextsteps/developing_a_baseline.asp
Haj-Assaad, S. (2012, May 30). Should you buy a car with CVT Transmission? Retrieved January 27, 2015,
from AutoGuide: http://www.autoguide.com/auto-news/2012/05/should-you-buy-a-car-with-a-
cvt-transmission.html
OECD/IEA. (2011). International comparison of light-duty vehicle fuel economy and related
characteristics. Paris: International Energy Agency Head of Publications Service.
Segment Y. (2015). About Us. Retrieved January 28, 2015, from Segment Y Automotive Intelligence:
http://www.segmenty.com/aboutus.html#