Embed Size (px)
Citation preview
Fuel Economy, VMT, and Transport Policy
They All Matter to Restraining GHG Emissions
Lee Schipper, Ph.D.Visiting Scholar, UC Berkeley Transportation
Center
Alex Farrell 1962-2008
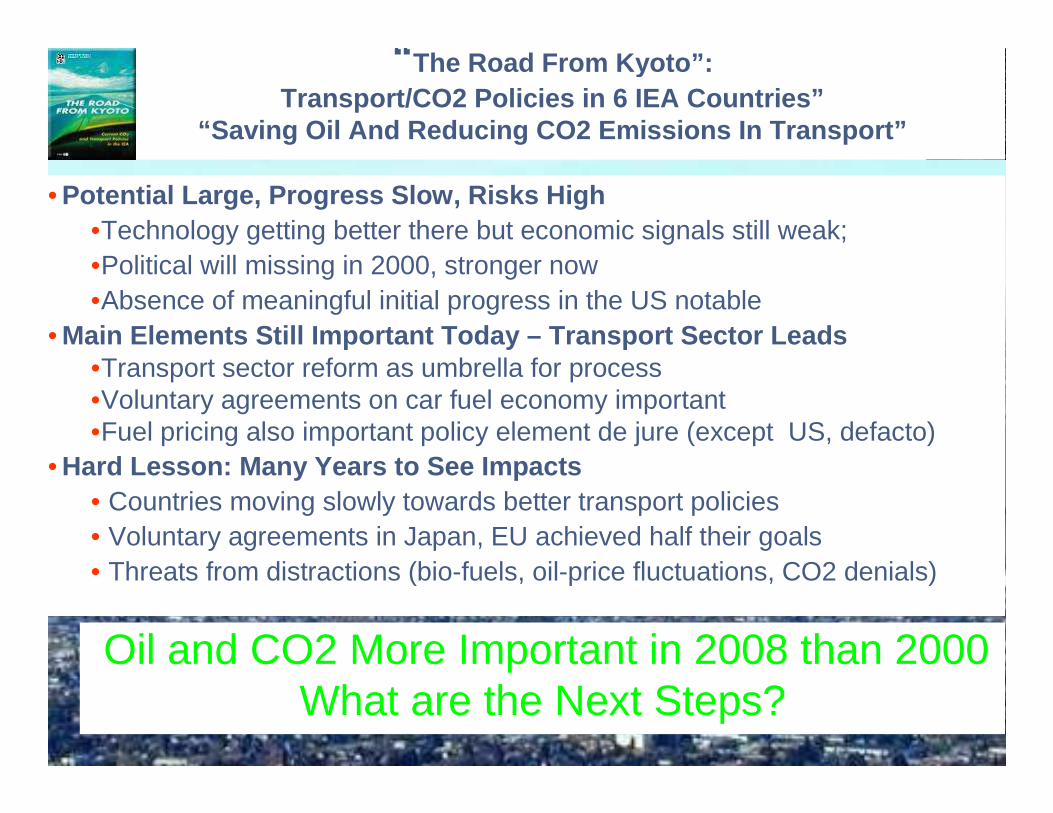
“ The Road From Kyoto ” : Transport/CO2 Policies in 6 IEA Countries”
“Saving Oil And Reducing CO2 Emissions In Transport ”
• Potential Large, Progress Slow, Risks High•Technology getting better there but economic signals still weak;•Political will missing in 2000, stronger now•Absence of meaningful initial progress in the US notable
• Main Elements Still Important Today – Transport Sect or Leads•Transport sector reform as umbrella for process•Voluntary agreements on car fuel economy important•Fuel pricing also important policy element de jure (except US, defacto)
• Hard Lesson: Many Years to See Impacts• Countries moving slowly towards better transport policies• Voluntary agreements in Japan, EU achieved half their goals• Threats from distractions (bio-fuels, oil-price fluctuations, CO2 denials)
Oil and CO2 More Important in 2008 than 2000 What are the Next Steps?
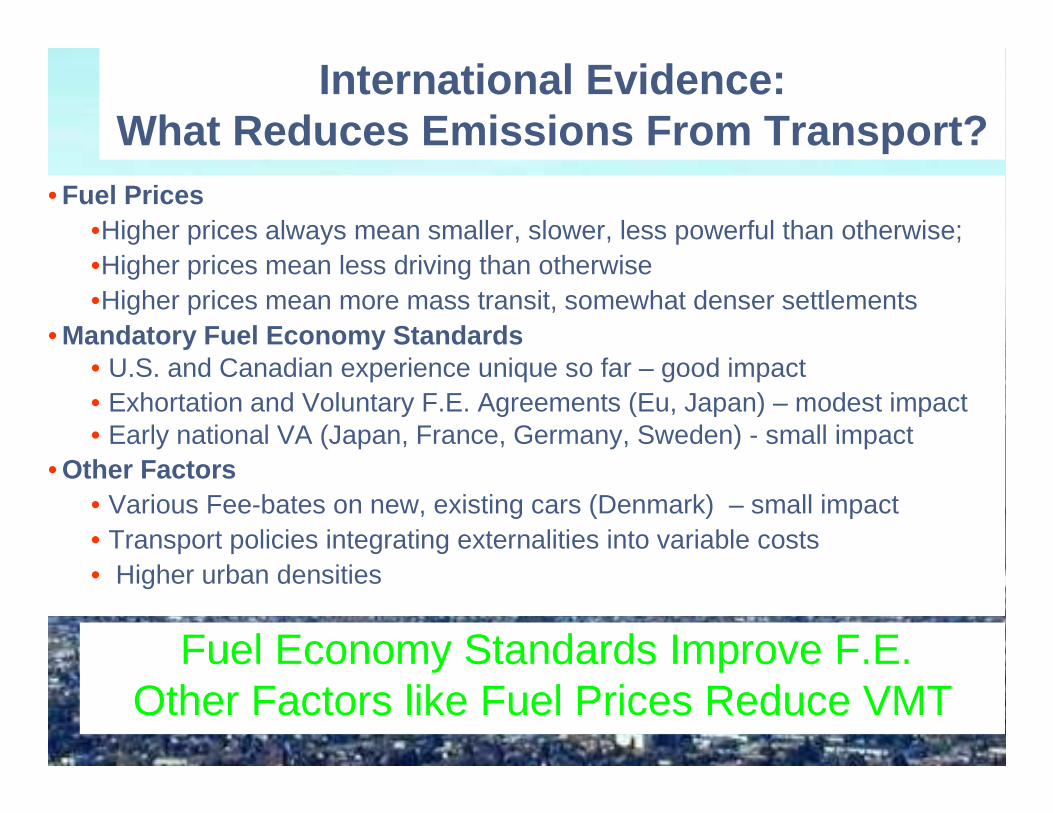
International Evidence:What Reduces Emissions From Transport?
• Fuel Prices•Higher prices always mean smaller, slower, less powerful than otherwise; •Higher prices mean less driving than otherwise•Higher prices mean more mass transit, somewhat denser settlements
• Mandatory Fuel Economy Standards• U.S. and Canadian experience unique so far – good impact• Exhortation and Voluntary F.E. Agreements (Eu, Japan) – modest impact • Early national VA (Japan, France, Germany, Sweden) - small impact
• Other Factors • Various Fee-bates on new, existing cars (Denmark) – small impact• Transport policies integrating externalities into variable costs• Higher urban densities
Fuel Economy Standards Improve F.E.Other Factors like Fuel Prices Reduce VMT
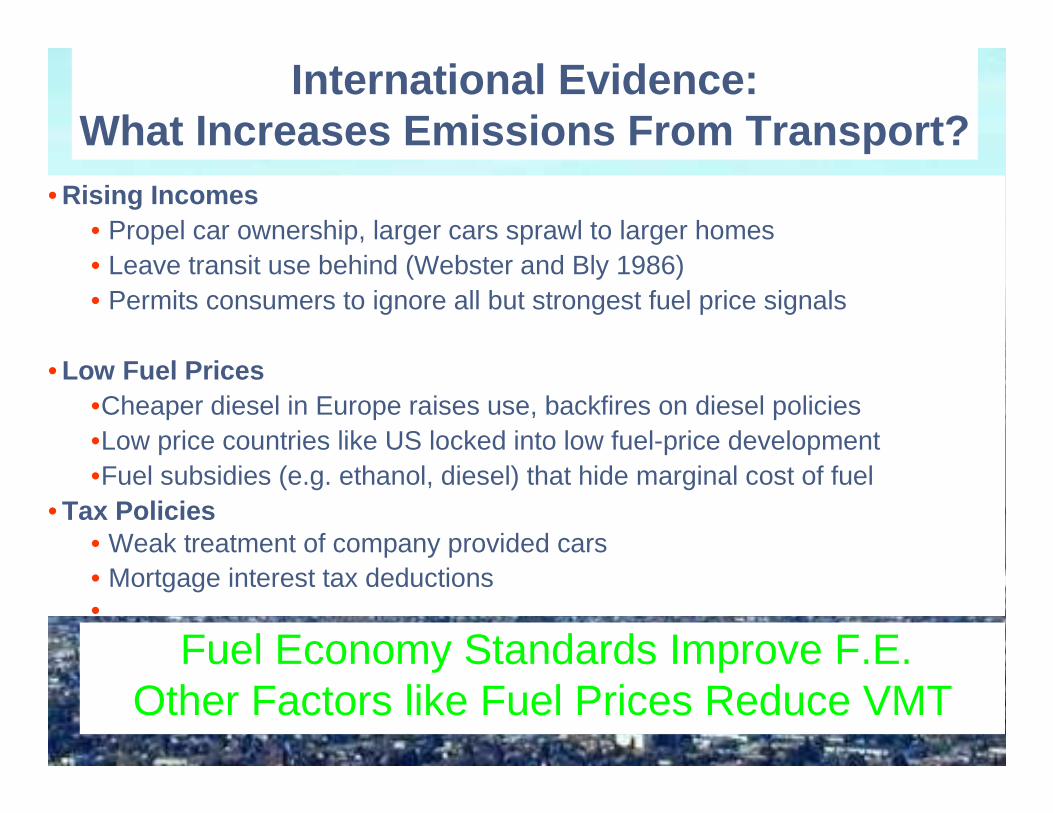
International Evidence:What Increases Emissions From Transport?
• Rising Incomes• Propel car ownership, larger cars sprawl to larger homes• Leave transit use behind (Webster and Bly 1986)• Permits consumers to ignore all but strongest fuel price signals
• Low Fuel Prices•Cheaper diesel in Europe raises use, backfires on diesel policies •Low price countries like US locked into low fuel-price development•Fuel subsidies (e.g. ethanol, diesel) that hide marginal cost of fuel
• Tax Policies• Weak treatment of company provided cars• Mortgage interest tax deductions •
Fuel Economy Standards Improve F.E.Other Factors like Fuel Prices Reduce VMT
0
2
4
6
8
10
12
14
16
18
20
1970 1975 1980 1985 1990 1995 2000 2005
L/10
0 km
, on
road
, gas
olin
e eq
.
0
50
100
150
200
250
300
350
400
450
CO
2 E
mis
sion
s, g
m/k
m
US Cars and Houseld light trucks/SUV Japan incl mini cars
France All Germany
w. Germany Italy
UK Spain
5.
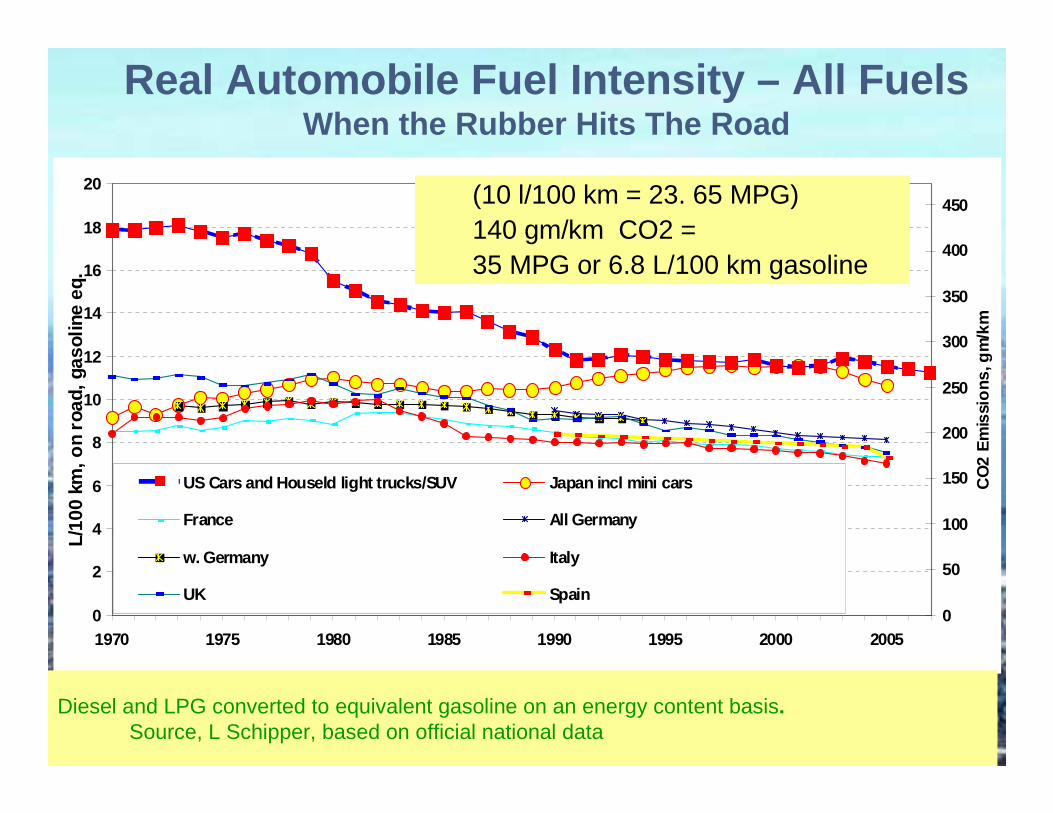
Real Automobile Fuel Intensity – All FuelsWhen the Rubber Hits The Road
Diesel and LPG converted to equivalent gasoline on an energy content basis.Source, L Schipper, based on official national data
(10 l/100 km = 23. 65 MPG)140 gm/km CO2 =35 MPG or 6.8 L/100 km gasoline
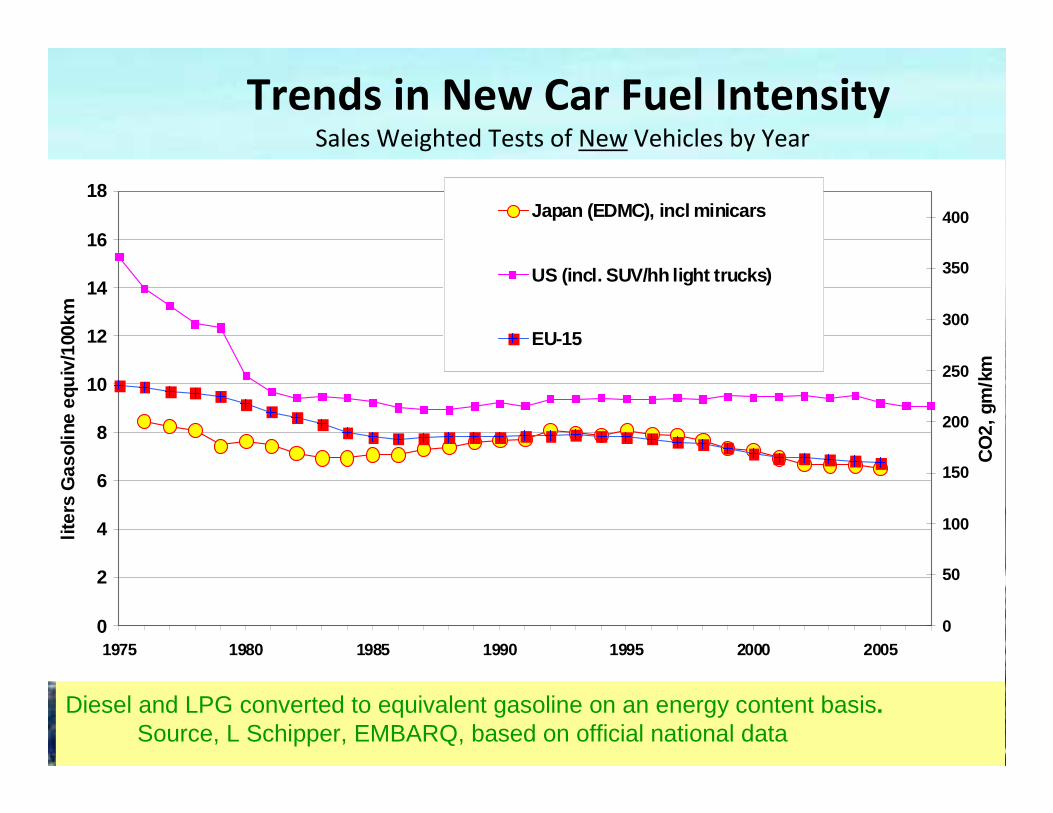
Trends in New Car Fuel Intensity Sales Weighted Tests of New Vehicles by Year
Diesel and LPG converted to equivalent gasoline on an energy content basis.Source, L Schipper, EMBARQ, based on official national data
0
2
4
6
8
10
12
14
16
18
1975 1980 1985 1990 1995 2000 2005
liter
s G
asol
ine
equi
v/10
0km
0
50
100
150
200
250
300
350
400
CO
2, g
m/k
m
Japan (EDMC), incl minicars
US (incl. SUV/hh light trucks)
EU-15
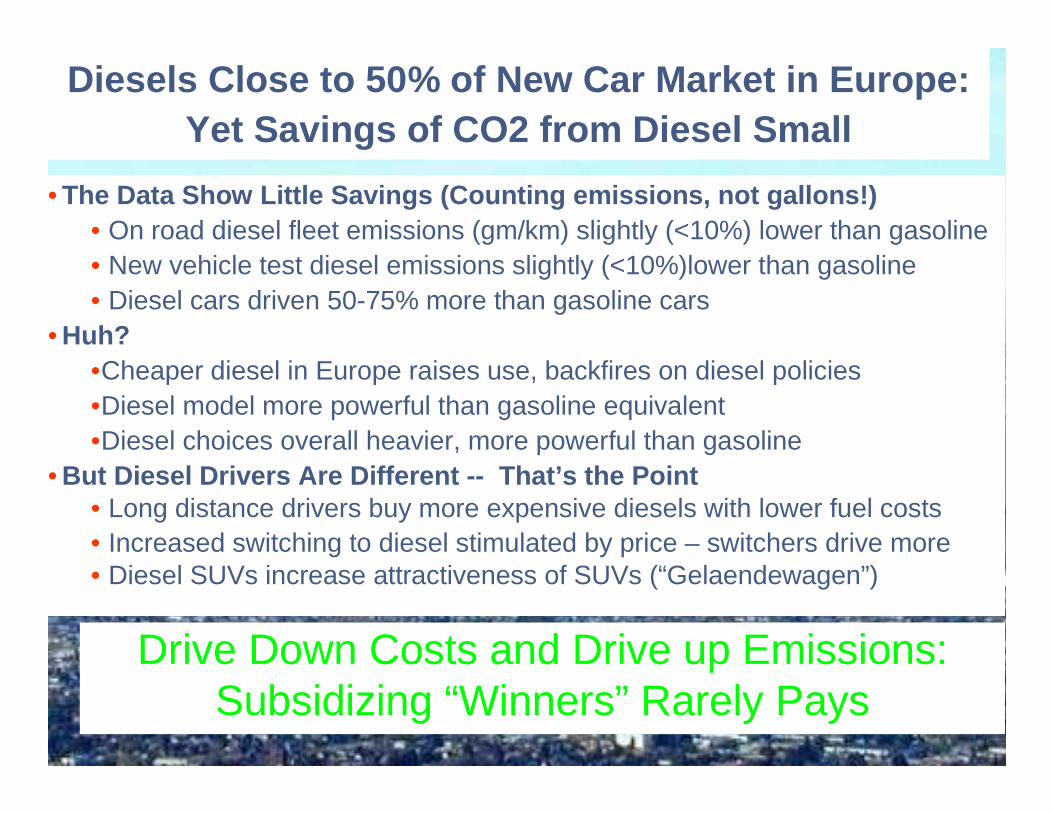
Diesels Close to 50% of New Car Market in Europe:Yet Savings of CO2 from Diesel Small
• The Data Show Little Savings (Counting emissions, n ot gallons!)• On road diesel fleet emissions (gm/km) slightly (<10%) lower than gasoline• New vehicle test diesel emissions slightly (<10%)lower than gasoline• Diesel cars driven 50-75% more than gasoline cars
• Huh?•Cheaper diesel in Europe raises use, backfires on diesel policies •Diesel model more powerful than gasoline equivalent•Diesel choices overall heavier, more powerful than gasoline
• But Diesel Drivers Are Different -- That’s the Point• Long distance drivers buy more expensive diesels with lower fuel costs• Increased switching to diesel stimulated by price – switchers drive more • Diesel SUVs increase attractiveness of SUVs (“Gelaendewagen”)
Drive Down Costs and Drive up Emissions:Subsidizing “Winners” Rarely Pays
8
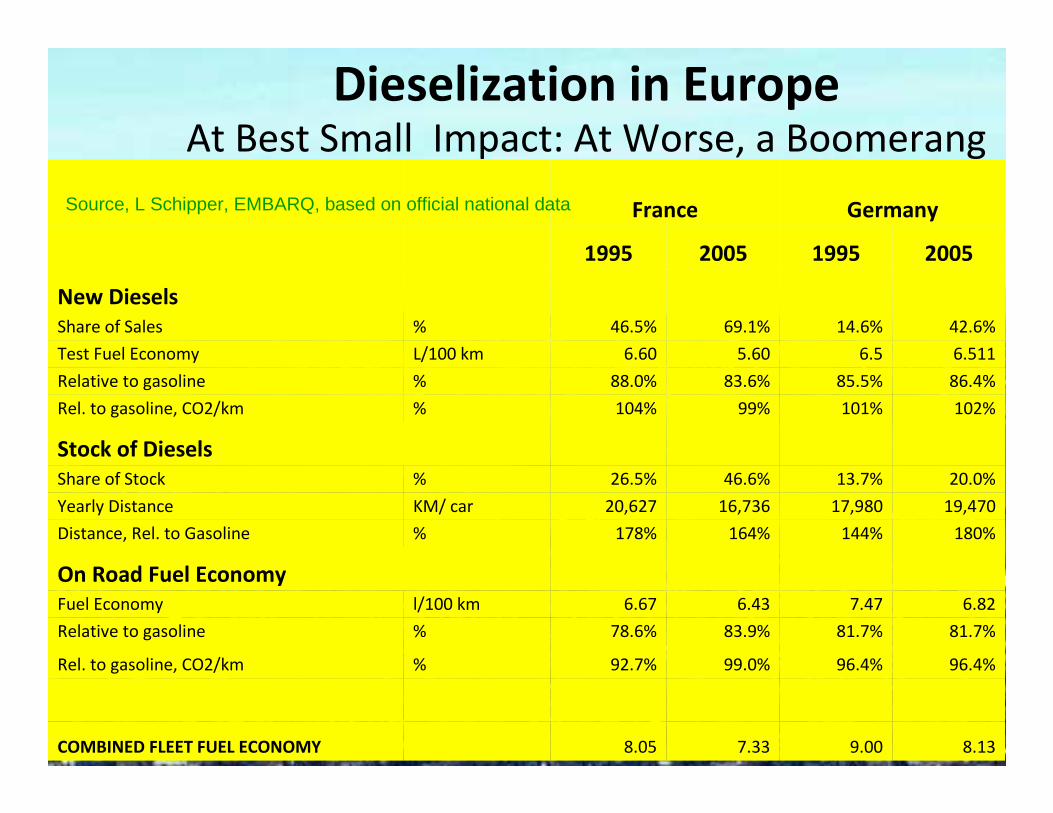
Dieselization in EuropeAt Best Small Impact: At Worse, a Boomerang
France Germany
1995 2005 1995 2005
New Diesels
Share of Sales % 46.5% 69.1% 14.6% 42.6%
Test Fuel Economy L/100 km 6.60 5.60 6.5 6.511
Relative to gasoline % 88.0% 83.6% 85.5% 86.4%
Rel. to gasoline, CO2/km % 104% 99% 101% 102%
Stock of Diesels
Share of Stock % 26.5% 46.6% 13.7% 20.0%
Yearly Distance KM/ car 20,627 16,736 17,980 19,470
Distance, Rel. to Gasoline % 178% 164% 144% 180%
On Road Fuel Economy
Fuel Economy l/100 km 6.67 6.43 7.47 6.82
Relative to gasoline % 78.6% 83.9% 81.7% 81.7%
Rel. to gasoline, CO2/km % 92.7% 99.0% 96.4% 96.4%
COMBINED FLEET FUEL ECONOMY 8.05 7.33 9.00 8.13
Source, L Schipper, EMBARQ, based on official national data

International Evidence:Power and Weight, and Fuel Economy
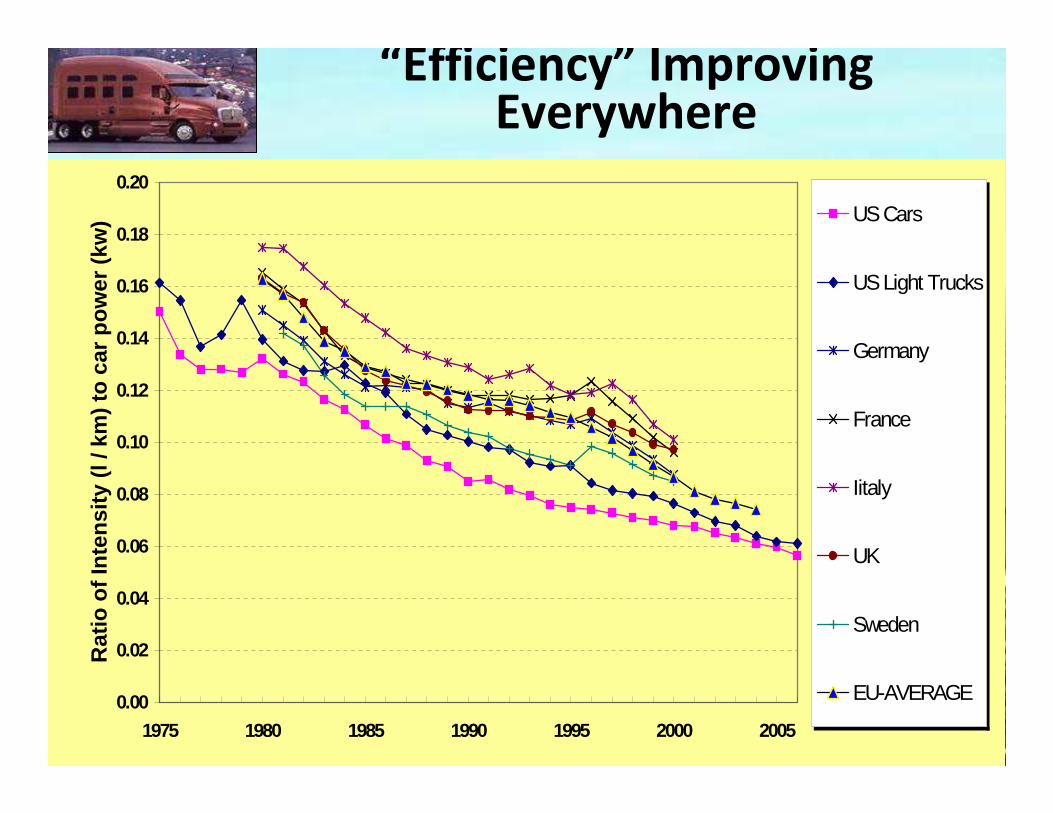
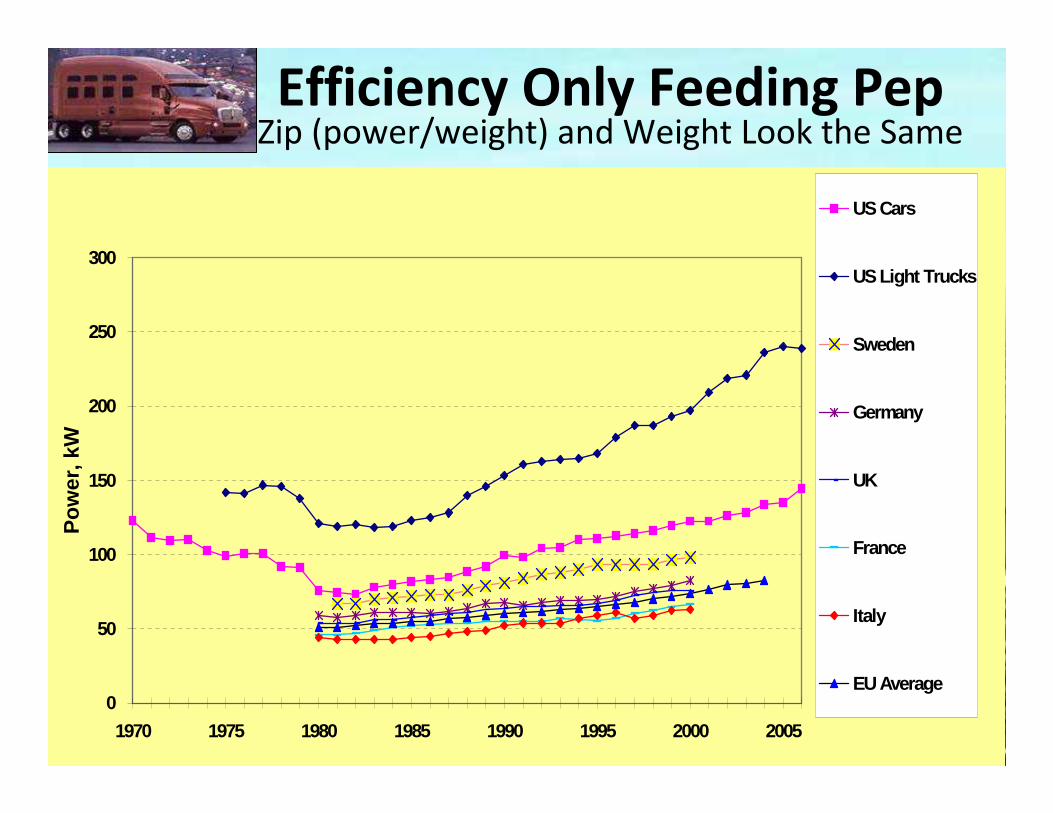
• Power and Weight Rising Everywhere, BUT• In US rise offset all technological improvements in “efficiency”• In Japan “Top Runners”, Mini-cars meant new car fuel economy improved from 1998
• In EU, technology improved faster than power or weight, FE improved• Cross Sectional Differences
•Power, weight, engines, etc account for most of US/EU-J differences in FE•Small impact of efficiency technologies (Fulton, IEA 2000)•High fuel prices, weight or engine size taxes keep Europe, Japan “small”
• The Future – What California Could Do• Taxation of fuel, fuel economy (fee-bates) will limit size of engines• Parking, crowding also favoring smaller cars in EU, J– US?• Speed limits, enforcement, speed governors would also slow rise in power
The Real Rebound Effect – When TechnologyGave More Macho at Constant Fuel Economy, rather than More
Fuel Economy at Constant Macho
10
“Efficiency” Improving Everywhere
0.00
0.02
0.04
0.06
0.08
0.10
0.12
0.14
0.16
0.18
0.20
1975 1980 1985 1990 1995 2000 2005
Rat
io o
f Int
ensi
ty (
l / k
m)
to c
ar p
ower
(kw
)
US Cars
US Light Trucks
Germany
France
Iitaly
UK
Sweden
EU-AVERAGE
11
Efficiency Only Feeding PepZip (power/weight) and Weight Look the Same
0
50
100
150
200
250
300
1970 1975 1980 1985 1990 1995 2000 2005
Pow
er, k
W
US Cars
US Light Trucks
Sweden
Germany
UK
France
Italy
EU Average
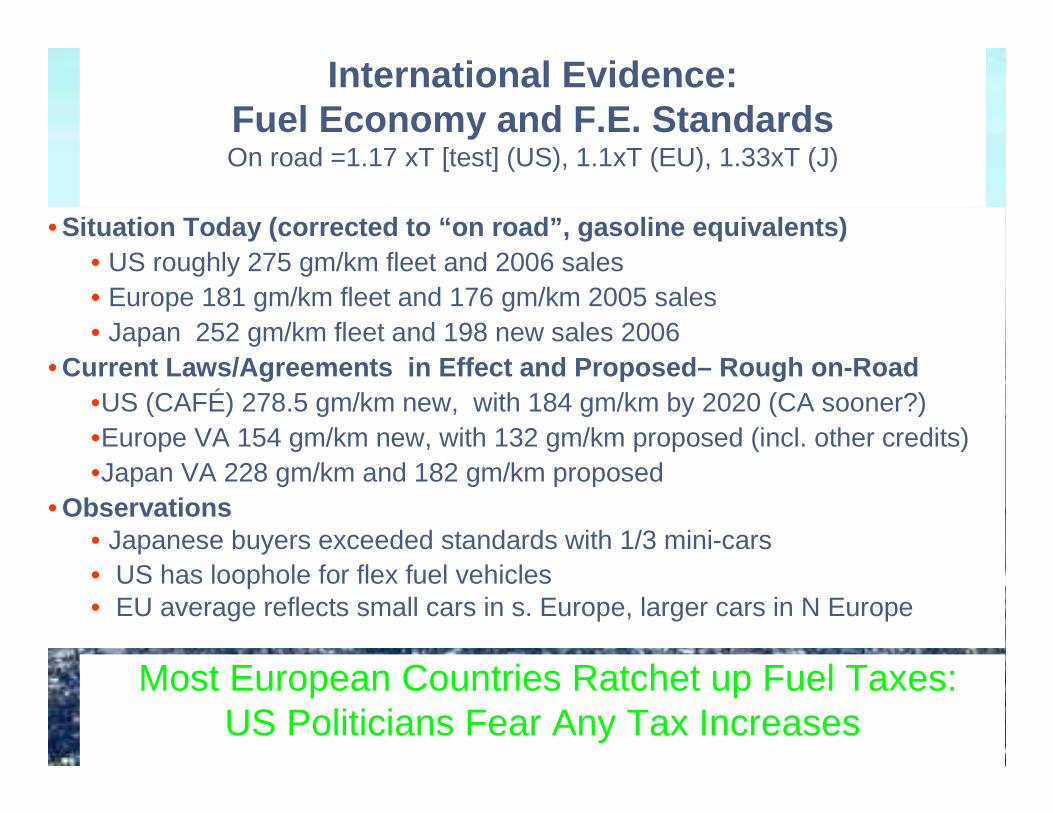
International Evidence:Fuel Economy and F.E. StandardsOn road =1.17 xT [test] (US), 1.1xT (EU), 1.33xT (J)
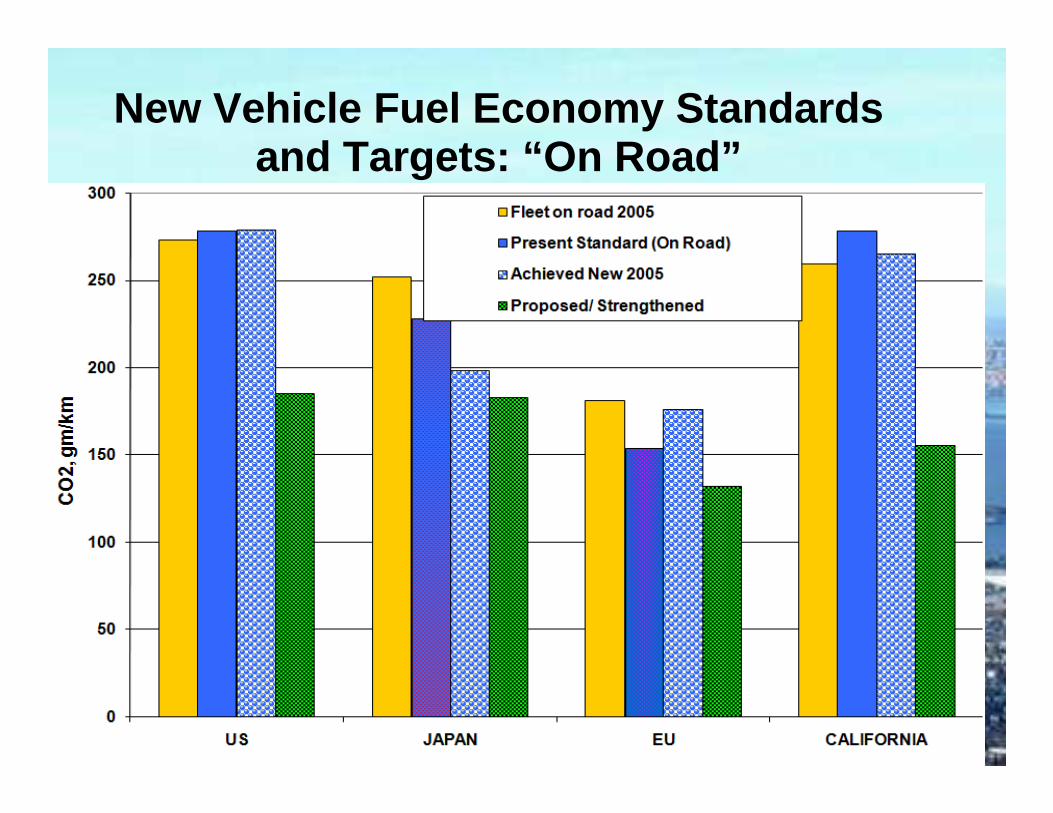
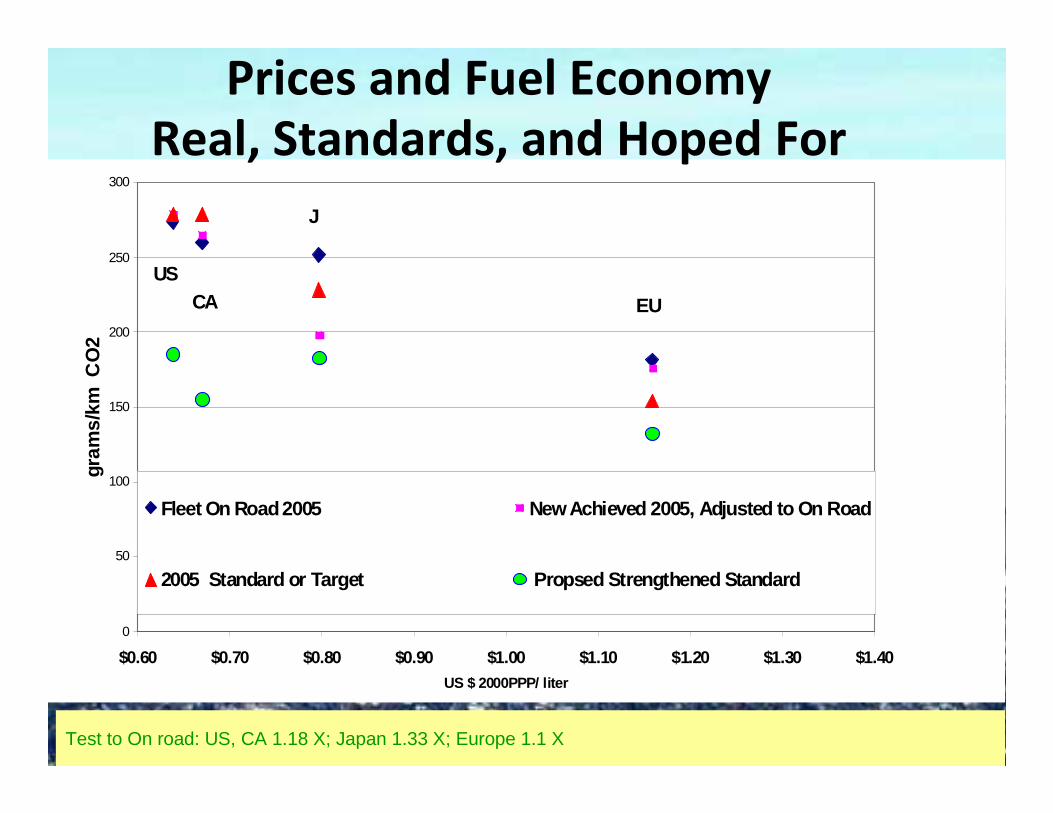
• Situation Today (corrected to “on road”, gasoline e quivalents)• US roughly 275 gm/km fleet and 2006 sales• Europe 181 gm/km fleet and 176 gm/km 2005 sales• Japan 252 gm/km fleet and 198 new sales 2006
• Current Laws/Agreements in Effect and Proposed– Rou gh on-Road•US (CAFÉ) 278.5 gm/km new, with 184 gm/km by 2020 (CA sooner?)•Europe VA 154 gm/km new, with 132 gm/km proposed (incl. other credits)•Japan VA 228 gm/km and 182 gm/km proposed
• Observations• Japanese buyers exceeded standards with 1/3 mini-cars• US has loophole for flex fuel vehicles• EU average reflects small cars in s. Europe, larger cars in N Europe
Most European Countries Ratchet up Fuel Taxes:US Politicians Fear Any Tax Increases
13
New Vehicle Fuel Economy Standards and Targets: “On Road”
Source, L Schipper, EMBARQ, based on official national data
0
50
100
150
200
250
300
$0.60 $0.70 $0.80 $0.90 $1.00 $1.10 $1.20 $1.30 $1.40US $ 2000PPP/ liter
gram
s/km
CO
2
Fleet On Road 2005 New Achieved 2005, Adjusted to On Road
2005 Standard or Target Propsed Strengthened Standard
USCA
J
EU
14
Prices and Fuel Economy
Real, Standards, and Hoped For
Test to On road: US, CA 1.18 X; Japan 1.33 X; Europe 1.1 X
15
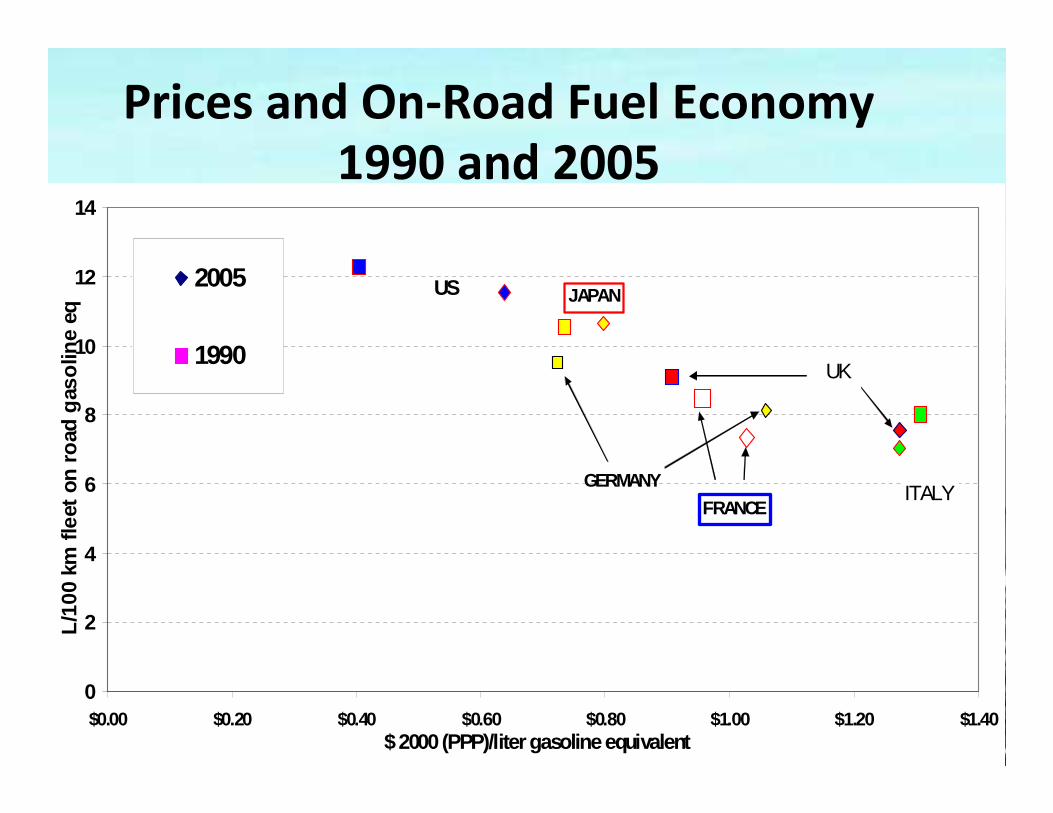
Prices and On-Road Fuel Economy
1990 and 2005Source, L Schipper, EMBARQ, based on official national data
0
2
4
6
8
10
12
14
$0.00 $0.20 $0.40 $0.60 $0.80 $1.00 $1.20 $1.40$ 2000 (PPP)/liter gasoline equivalent
L/10
0 km
flee
t on
road
gas
olin
e eq
2005
1990
US
ITALY
JAPAN
UK
GERMANY
FRANCE
16
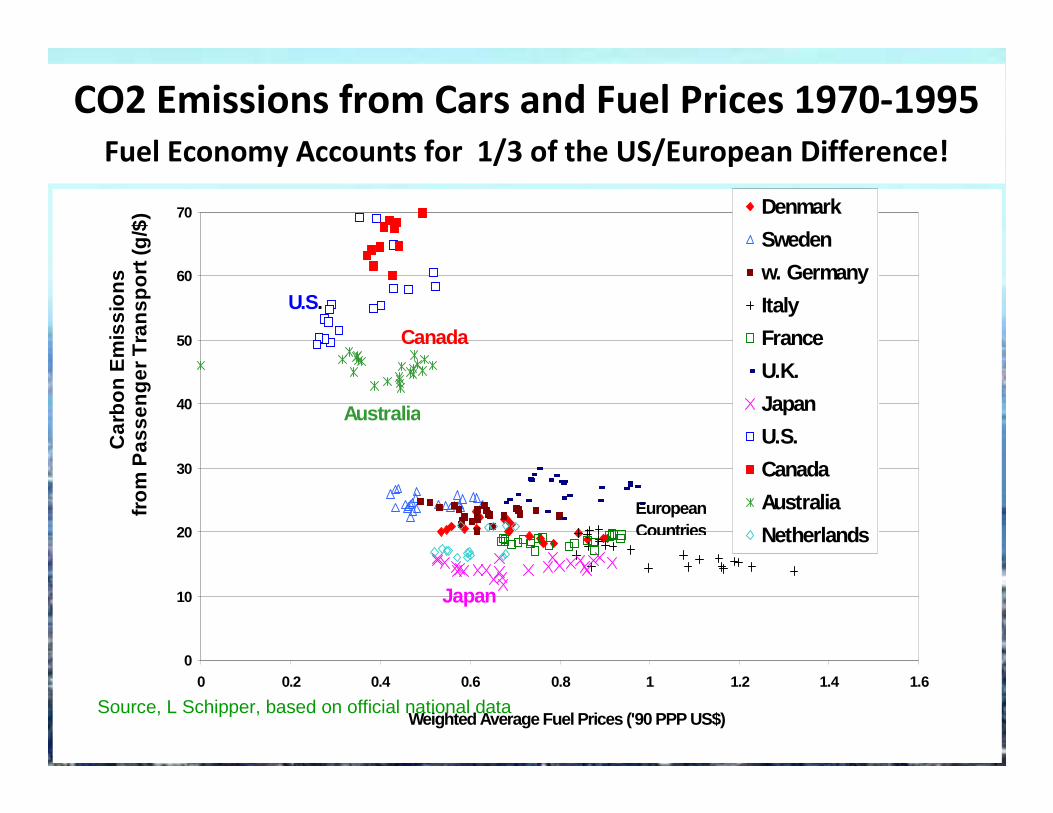
CO2 Emissions from Cars and Fuel Prices 1970-1995
Fuel Economy Accounts for 1/3 of the US/European Difference!
0
10
20
30
40
50
60
70
0 0.2 0.4 0.6 0.8 1 1.2 1.4 1.6
Weighted Average Fuel Prices ('90 PPP US$)
Car
bon
Em
issi
ons
from
Pas
seng
er T
rans
port
(g/$
)
Denmark
Sweden
w. Germany
Italy
France
U.K.
Japan
U.S.
Canada
Australia
NetherlandsEuropean Countries
Australia
U.S.
Canada
Japan
Source, L Schipper, based on official national data
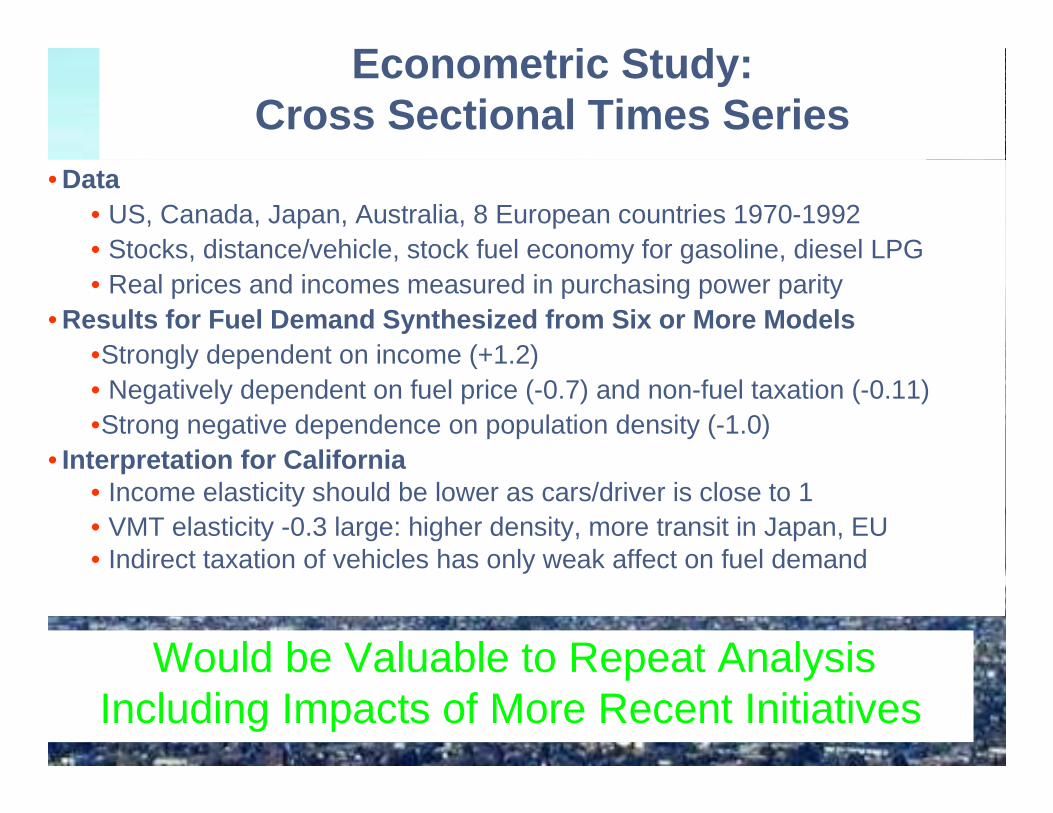
Econometric Study:Cross Sectional Times Series
• Data• US, Canada, Japan, Australia, 8 European countries 1970-1992• Stocks, distance/vehicle, stock fuel economy for gasoline, diesel LPG• Real prices and incomes measured in purchasing power parity
• Results for Fuel Demand Synthesized from Six or Mor e Models •Strongly dependent on income (+1.2) • Negatively dependent on fuel price (-0.7) and non-fuel taxation (-0.11)•Strong negative dependence on population density (-1.0)
• Interpretation for California• Income elasticity should be lower as cars/driver is close to 1• VMT elasticity -0.3 large: higher density, more transit in Japan, EU• Indirect taxation of vehicles has only weak affect on fuel demand
Would be Valuable to Repeat Analysis Including Impacts of More Recent Initiatives
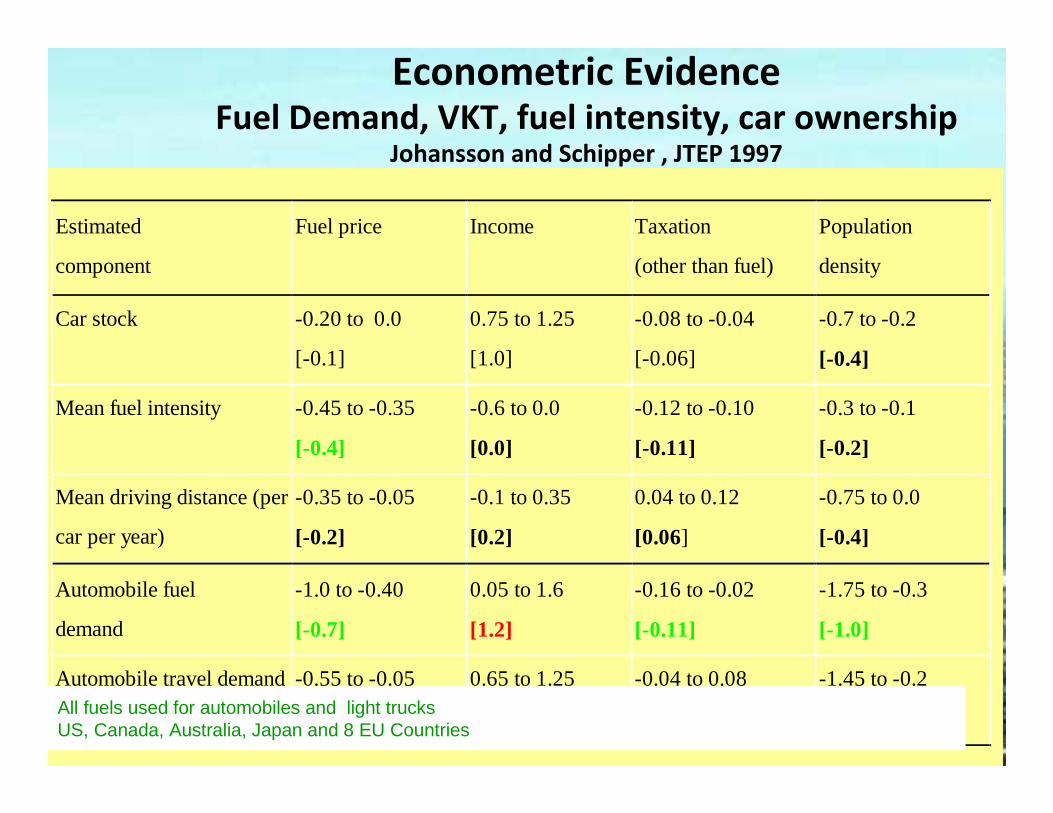
Estimated
component
Fuel price
Income
Taxation
(other than fuel)
Population
density Car stock
-0.20 to 0.0
[-0.1]
0.75 to 1.25
[1.0]
-0.08 to -0.04
[-0.06]
-0.7 to -0.2
[-0.4] Mean fuel intensity
-0.45 to -0.35
[-0.4]
-0.6 to 0.0
[0.0]
-0.12 to -0.10
[-0.11]
-0.3 to -0.1
[-0.2] Mean driving distance (per
car per year)
-0.35 to -0.05
[-0.2]
-0.1 to 0.35
[0.2]
0.04 to 0.12
[0.06]
-0.75 to 0.0
[-0.4] Automobile fuel
demand
-1.0 to -0.40
[-0.7]
0.05 to 1.6
[1.2]
-0.16 to -0.02
[-0.11]
-1.75 to -0.3
[-1.0] Automobile travel demand
-0.55 to -0.05
[-0.3]
0.65 to 1.25
[1.2]
-0.04 to 0.08
[0.0]
-1.45 to -0.2
[-0.8]
18
Econometric EvidenceFuel Demand, VKT, fuel intensity, car ownership
Johansson and Schipper , JTEP 1997
All fuels used for automobiles and light trucksUS, Canada, Australia, Japan and 8 EU Countries
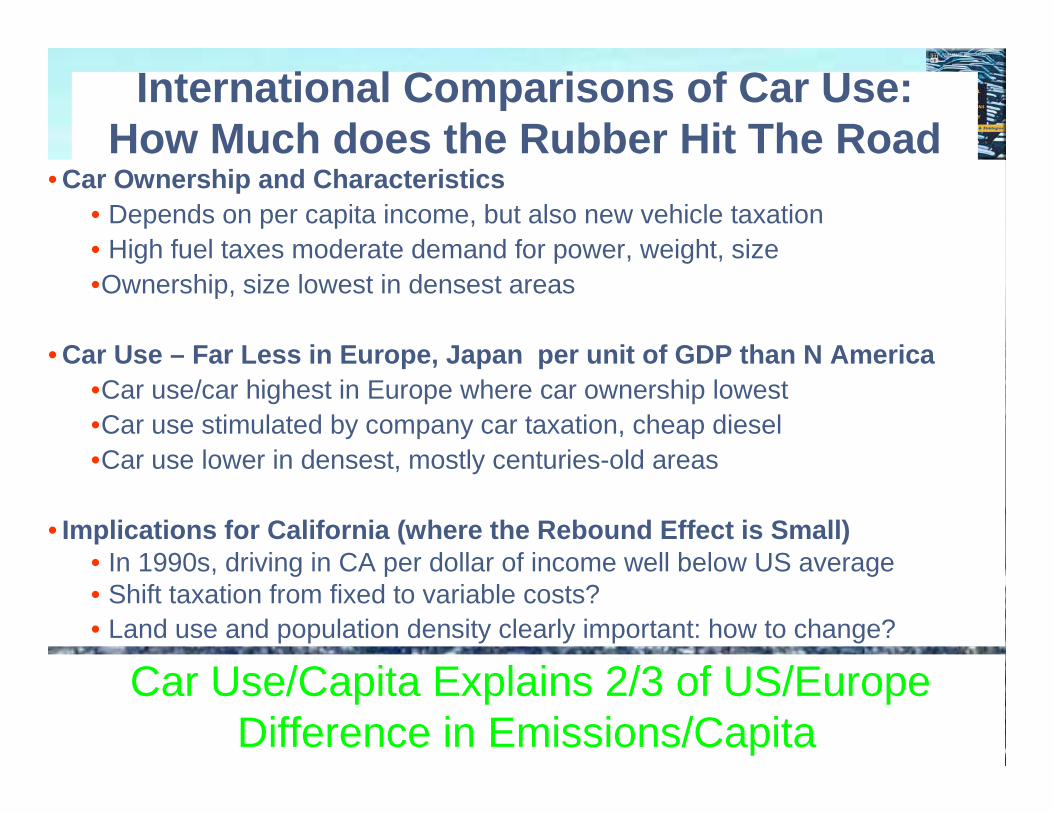
International Comparisons of Car Use:How Much does the Rubber Hit The Road
• Car Ownership and Characteristics• Depends on per capita income, but also new vehicle taxation• High fuel taxes moderate demand for power, weight, size •Ownership, size lowest in densest areas
• Car Use – Far Less in Europe, Japan per unit of GDP than N America•Car use/car highest in Europe where car ownership lowest •Car use stimulated by company car taxation, cheap diesel•Car use lower in densest, mostly centuries-old areas
• Implications for California (where the Rebound Effe ct is Small)• In 1990s, driving in CA per dollar of income well below US average • Shift taxation from fixed to variable costs?• Land use and population density clearly important: how to change?
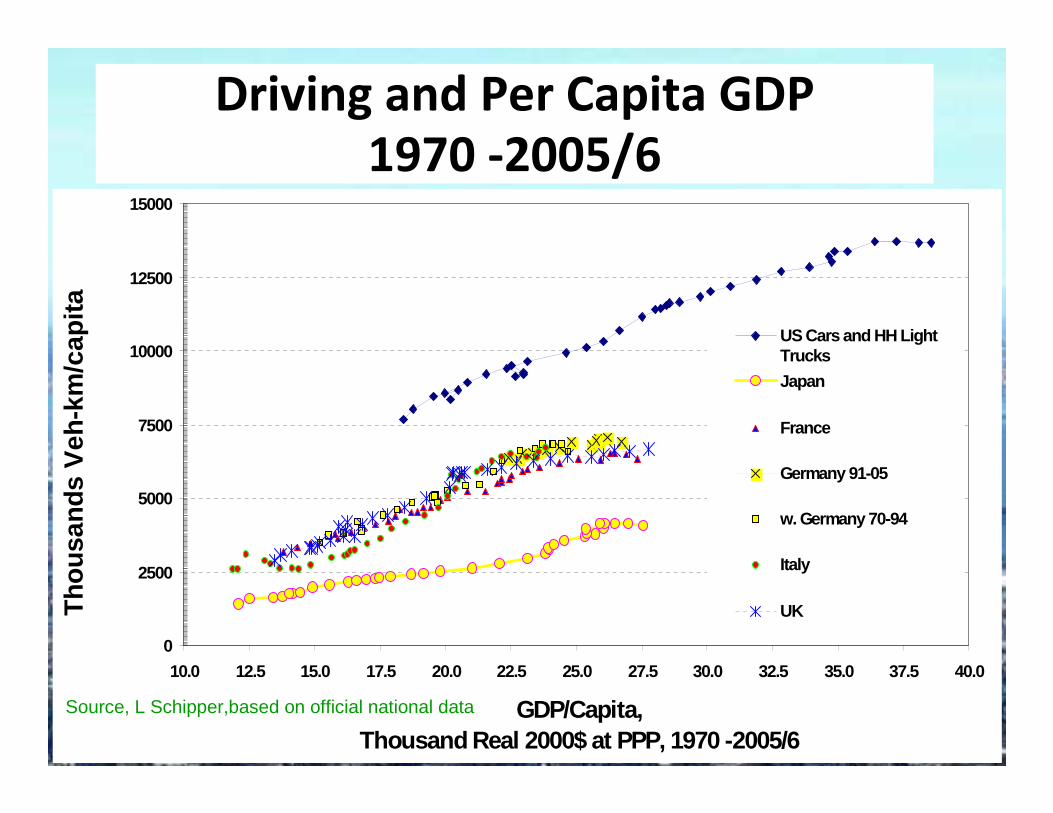
Car Use/Capita Explains 2/3 of US/Europe Difference in Emissions/Capita
20
Driving and Per Capita GDP
1970 -2005/6
0
2500
5000
7500
10000
12500
15000
10.0 12.5 15.0 17.5 20.0 22.5 25.0 27.5 30.0 32.5 35.0 37.5 40.0
GDP/Capita, Thousand Real 2000$ at PPP, 1970 -2005/6
Tho
usan
ds V
eh-k
m/c
apita US Cars and HH Light
Trucks
Japan
France
Germany 91-05
w. Germany 70-94
Italy
UK
Source, L Schipper,based on official national data
21
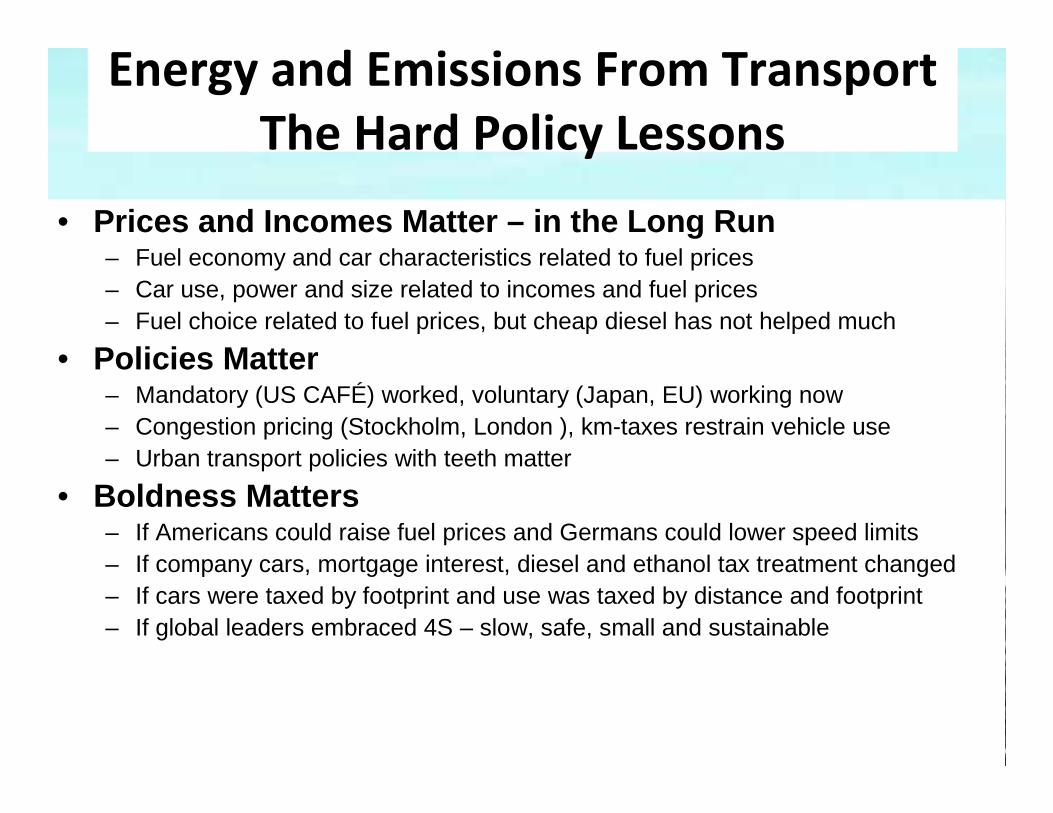
• Prices and Incomes Matter – in the Long Run– Fuel economy and car characteristics related to fuel prices– Car use, power and size related to incomes and fuel prices – Fuel choice related to fuel prices, but cheap diesel has not helped much
• Policies Matter– Mandatory (US CAFÉ) worked, voluntary (Japan, EU) working now– Congestion pricing (Stockholm, London ), km-taxes restrain vehicle use– Urban transport policies with teeth matter
• Boldness Matters– If Americans could raise fuel prices and Germans could lower speed limits– If company cars, mortgage interest, diesel and ethanol tax treatment changed– If cars were taxed by footprint and use was taxed by distance and footprint– If global leaders embraced 4S – slow, safe, small and sustainable
Energy and Emissions From Transport
The Hard Policy Lessons
22
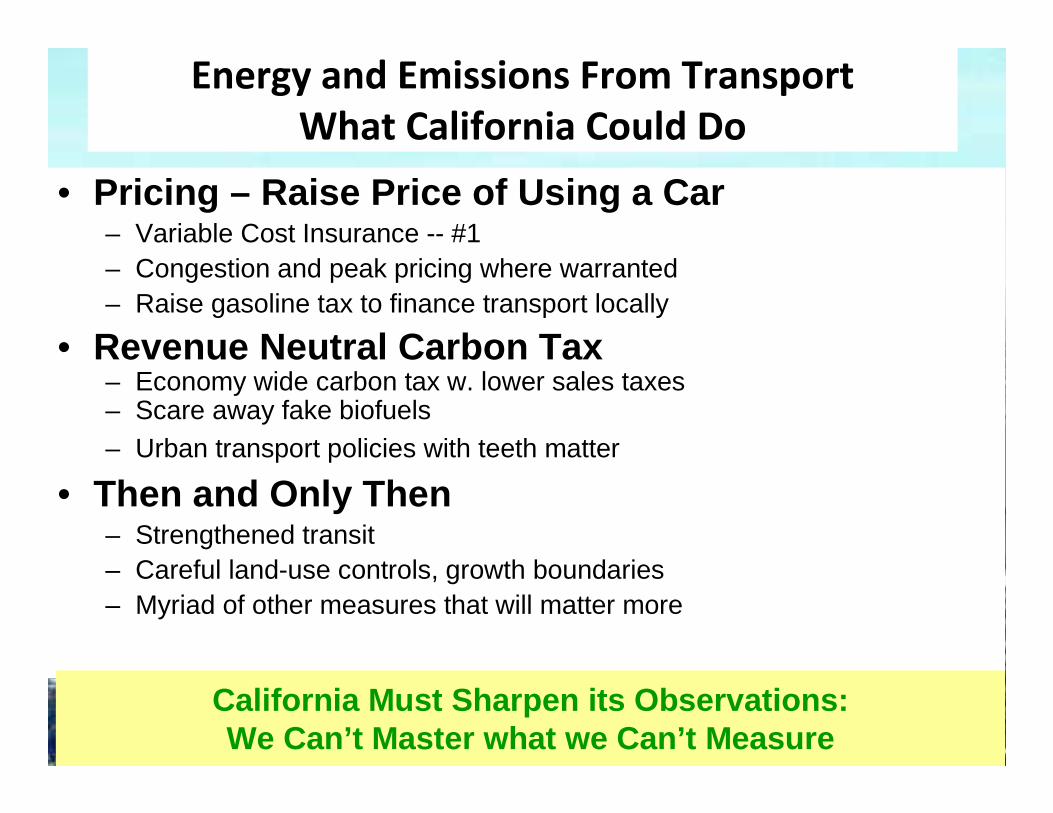
• Pricing – Raise Price of Using a Car– Variable Cost Insurance -- #1 – Congestion and peak pricing where warranted – Raise gasoline tax to finance transport locally
• Revenue Neutral Carbon Tax– Economy wide carbon tax w. lower sales taxes– Scare away fake biofuels– Urban transport policies with teeth matter
• Then and Only Then– Strengthened transit – Careful land-use controls, growth boundaries– Myriad of other measures that will matter more
Energy and Emissions From Transport
What California Could Do
California Must Sharpen its Observations:We Can’t Master what we Can’t Measure
23
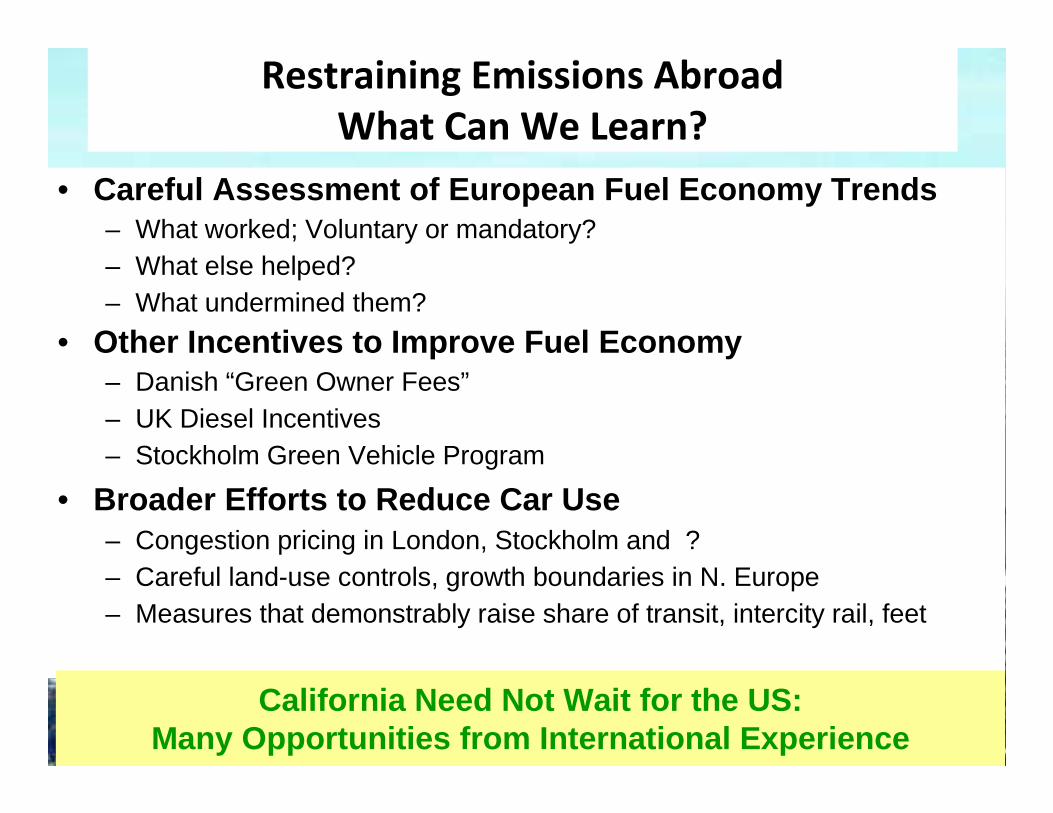
• Careful Assessment of European Fuel Economy Trends– What worked; Voluntary or mandatory? – What else helped? – What undermined them?
• Other Incentives to Improve Fuel Economy– Danish “Green Owner Fees”– UK Diesel Incentives– Stockholm Green Vehicle Program
• Broader Efforts to Reduce Car Use– Congestion pricing in London, Stockholm and ? – Careful land-use controls, growth boundaries in N. Europe– Measures that demonstrably raise share of transit, intercity rail, feet
Restraining Emissions Abroad
What Can We Learn?
California Need Not Wait for the US:Many Opportunities from International Experience