Embed Size (px)
Citation preview
C O R P O R A T I O N
Report
Fuel Reduction for the Mobility Air ForcesExecutive Summary
Christopher A. Mouton, James D. Powers, Daniel M. Romano, Christopher Guo, Sean Bednarz, Caolionn O’Connell
Limited Print and Electronic Distribution Rights
This document and trademark(s) contained herein are protected by law. This representation of RAND intellectual property is provided for noncommercial use only. Unauthorized posting of this publication online is prohibited. Permission is given to duplicate this document for personal use only, as long as it is unaltered and complete. Permission is required from RAND to reproduce, or reuse in another form, any of its research documents for commercial use. For information on reprint and linking permissions, please visit www.rand.org/pubs/permissions.html.
The RAND Corporation is a research organization that develops solutions to public policy challenges to help make communities throughout the world safer and more secure, healthier and more prosperous. RAND is nonprofit, nonpartisan, and committed to the public interest.
RAND’s publications do not necessarily reflect the opinions of its research clients and sponsors.
Support RANDMake a tax-deductible charitable contribution at
www.rand.org/giving/contribute
www.rand.org
Library of Congress Cataloging-in-Publication Data is available for this publication.
ISBN: 978-0-8330-8766-9
For more information on this publication, visit www.rand.org/t/RR757z1
Published by the RAND Corporation, Santa Monica, Calif.
© Copyright 2015 RAND Corporation
R® is a registered trademark.
iii
Preface
The Department of Defense (DoD) is the largest U.S. government user of energy, typically accounting for about 80 percent of the total government energy consumption. Aviation fuel accounts for about half of DoD’s total energy use. Given significant fuel price increases, the Air Force seeks the greatest possible fuel efficiency.
To help it achieve fuel efficiency, the Air Force has implemented several energy-efficiency and conservation measures and is considering additional initiatives to reduce fuel consumption. These measures include technology improvements (aerodynamics, aircraft weight, propulsion, etc.) and fleet, flight, and ground operations optimization.
This summary report provides a detailed analysis of the fuel and cost-savings potential of fuel efficiency initiatives being considered by Air Mobility Command (AMC), the biggest consumer of aviation fuel in DoD. Readers interested in further detail should refer to the main report:
Christopher A. Mouton, James D. Powers, Daniel M. Romano, Christopher Guo, Sean Bednarz, and Caolionn O’Connell, Fuel Reduction for the Mobility Air Forces, Santa Monica, Calif.: RAND Corporation, RR-757-AF, 2015.
The research summarized here was commissioned by the AMC Director of Operations and conducted within the Resource Management Program of RAND Project AIR FORCE as part of a project entitled “Reducing Mobility Air Forces (MAF) Energy Costs: Best Practices in Aviation Operations and Training.” It should be of interest to mobility air operations planners and those concerned with energy use within DoD.
RAND Project AIR FORCE
RAND Project AIR FORCE (PAF), a division of the RAND Corporation, is the U.S. Air Force’s federally funded research and development center for studies and analyses. PAF provides the Air Force with independent analyses of policy alternatives affecting the development, employment, combat readiness, and support of current and future air, space, and cyber forces. Research is conducted in four programs: Force Modernization and Employment; Manpower, Personnel, and Training; Resource Management; and Strategy and Doctrine. The research reported here was prepared under contract FA7014-06-C-0001.
Additional information about PAF is available on our website: http://www.rand.org/paf/

v
Contents
Preface ............................................................................................................................................ iii Figures and Tables ........................................................................................................................ vii Acknowledgments .......................................................................................................................... ix Abbreviations ................................................................................................................................. xi 1. Introduction and Background ..................................................................................................... 1 2. Fuel Reduction Options .............................................................................................................. 3 3. Cost-Effective Options That Can Be Reasonably Implemented ................................................. 7
Engine-Out Taxiing .................................................................................................................................. 7 Optimum Flight Level and Speed ............................................................................................................. 8 Basic Weight Reduction ......................................................................................................................... 10 APU Use Reduction ................................................................................................................................ 11 Load Balancing Improvement ................................................................................................................ 12 Microvanes ............................................................................................................................................. 14
4. Conclusions and Recommendations ......................................................................................... 17
Actions to Implement Now ..................................................................................................................... 18 Options for Further Analysis .................................................................................................................. 19
References ..................................................................................................................................... 21

vii
Figures and Tables
Figures
Figure 2.1. Cost-Effectiveness of Fuel Reduction Options ............................................................ 5 Figure 3.1. Fuel Consumption at Different Flight Level and Speed Combinations ....................... 9
Tables Table 3.1. Cost Savings from Engine-Out Taxiing ......................................................................... 8 Table 3.2. Cost Savings from Optimum Flight Level and Speed ................................................. 10 Table 3.3. Cost Savings from Basic Weight Reduction ................................................................ 11 Table 3.4. Cost Savings from APU Usage Reduction .................................................................. 12 Table 3.5. Fuel Savings from Improved Center of Gravity (CG) Location .................................. 14 Table 3.6. Cost Savings from Load-Balancing Improvement ...................................................... 14 Table 3.7. Cost Savings of Microvanes for the C-130 .................................................................. 16 Table 4.1. Cost-Effectiveness of Fuel Reduction Options ............................................................ 17


ix
Acknowledgments
We are grateful for the support we received from Air Mobility Command. We particularly appreciate the support and feedback we received from the project sponsors, Brig Gen Scott Goodwin and Maj Gen Scott Hanson.1 The Fuel Efficiency Office, led by Col Bobby Fowler and Col Keith Boone, was invaluable to our effort. Col Michael Horsey, Maj Darren Loftin, and Maj Daniel Ortwerth continually provided us with the contacts and data we needed for our work. Their enthusiasm for the topic was very much appreciated.
We received a great deal of support from personnel throughout AMC. Maj Mark Blumke, AMC/A4, greatly improved our understanding of maintenance operations. In addition, TSgt Joseph A. Schmeisser assisted us with data collection. AMC’s Air Refueling Liaison Office was instrumental in providing data with regards to improving tanker operations. In particular, we are thankful for the support from Mr. Jeffrey Sheppard and Mr. William Ganz. Mr. David Merrill, AMC/A9, provided excellent feedback on our work, which allowed us to sharpen our analysis.
We appreciate the assistance of several industry experts who gave us important insights into commercial aviation best practices. Tom Kane, Ronald Lane, Richard Rolland, and John Dietrich at Atlas provided performance data and explained how they perform detailed flight optimizations. We are grateful for the time they took to expand our understanding of how flight operations can be optimized to minimize fuel use. Art Parra at Federal Express provided insight on the challenges of maintaining and enforcing fuel management procedures. James Barry, William Leber, and Chris Maccarone at PASSUR Aerospace provided details on how information systems, integration of real-time data, and better situational awareness can translate into fuel savings. Tom Randall and Rick Darby at Delta Airlines helped us better understand airline operations and data collection. Quentin Peterson, Michael Swick, Willie Swearengen, Kyle Smith, and C. J. Hybart at Lockheed Martin provided us with a great deal of data on technological modifications to current AMC aircraft. Bill Carolan, Melvin Rice, Mark Stevens, John Dorris, and John Skorupa at Boeing offered perspective on energy efficiency improvements to current aircraft as well as a vision of future technologies.
We are also thankful for the assistance of our RAND colleagues: Michael Kennedy provided expertise and advice throughout the analysis and David Orletsky provided his expert judgment on a wide variety of topics, which helped us shape our research direction. We also appreciate the help of Jerry Sollinger and Karin Suede in the preparation of this document.
We sincerely appreciate the insightful suggestions and observations made by the reviewers of this document, Thomas Light and Tasos Nikoleris.
1 All ranks and offices are current as of the time of this research.


xi
Abbreviations
AGE aerospace ground equipment AMC Air Mobility Command APU auxiliary power unit DoD Department of Defense FEO Fuel Efficiency Office FY fiscal year MAF Mobility Air Forces MDS mission design series MG millions of gallons


1
1. Introduction and Background
The Department of Defense (DoD) is the largest U.S. government user of energy, typically accounting for about 80 percent of all government energy consumption. DoD has reduced its fuel use in recent years, including a 4 percent reduction in use of petroleum from fiscal year (FY) 2005 to FY 2011.2 However, the cost saving associated with reduced consumption was offset by sharp increases in the price of fuel.
Aviation fuel accounts for about half of DoD’s total energy use. Much of this is for the Mobility Air Forces (MAF), which consumes about 60 percent of the Air Force’s aviation fuel.3 To identify and implement fuel reduction initiatives, the Air Mobility Command (AMC) chartered its Fuel Efficiency Office (FEO) in 2008. The Air Force also launched an initiative that reduced its fuel consumption by 12 percent from 2006 to 2013, exceeding a 10 percent reduction goal it had set for 2015.4 Although this goal has been met, it is still prudent for the Air Force to pursue cost-effective options to further reduce fuel use.
To reduce MAF energy costs further, the AMC Director of Operations asked RAND Project AIR FORCE to quantify the fuel savings potential of options for the AMC enterprise. This summary report provides this analysis. Readers interested in further detail are strongly encouraged to consult the main report, which documents the full analysis.5
The literature on fuel use in the aviation industry is extensive, but most of it does not calculate fuel savings from an enterprise perspective. For example, there is significant literature on drag reduction of winglets; however, most of this focuses on cruise flight and does not account for fuel burned on the ground or during takeoff and landing. Furthermore, the literature often focuses on commercial rather than military operations. We therefore sought to apply existing research across the AMC enterprise to compare a range of fuel reduction options on an equal basis.
Our specific objectives were to provide the Air Force approaches to: • characterize the cost-effectiveness of fuel-reduction options • prioritize among cost-effective fuel reduction initiatives
2 Moshe Schwartz, Katherine Blakeley, and Ronald O’Rourke, “Department of Defense Energy Initiatives: Background and Issues for Congress,” Washington, D.C.: Congressional Research Service, December 10, 2012. 3 Scott T. Sturkol, “Energy Awareness: AMC Fuel Efficiency Office Shows How ‘Efficiency Promotes Effectiveness,’” Air Mobility Command Public Affairs, January 4, 2011. 4 Jared Serbu, “Air Force Meets Fuel Efficiency Goal Several Years Early,” FederalNewsRadio.com, March 22, 2013; and Matthew Bates (Tech. Sgt.), “Every Drop Counts,” Travis Air Force Base, Calif.: Defense Media Activity, November 1, 2013. 5 Christopher A. Mouton, James D. Powers, Daniel M. Romano, Christopher Guo, Sean Bednarz, and Caolionn O’Connell, Fuel Reduction for the Mobility Air Forces, Santa Monica, Calif.: RAND Corporation, Calif., RR-757-AF, 2015.

2
• better estimate the fuel efficiency of the fleet. We demonstrated this framework by comparing a wide array of fuel reduction options in a
consistent way that is relevant to AMC. In doing so, we adjusted our analyses appropriately to account for the differences between military and commercial aviation. With this approach, we were able to compare fuel efficiency options by their relative cost-effectiveness as well as by other effects of their implementation. Our analyses were based on a number of assumptions, including
• MAF flying hours will reflect those programmed in the President’s Budget for FY 2014, including those for training, as an estimation for all future flying.
• Baseline fuel costs $3.73 per gallon, the FY 2013 Defense Logistics Agency standard fuel price, which historically has varied from $2.31 to $3.95 in FY 2012 dollars.6
• A real discount rate of 1.1 percent is used, which is current as of August 2013 but also the lowest value recorded.7
We developed a series of highly adaptable flight models to assess options, using flight-
performance data and allowing aircraft weight, range, climb performance, and ground-fuel usage to vary. Our results focus on annualized costs and savings in terms of both dollars and fuel. We also account for planned aircraft retirement and replacements, using estimates from recent RAND work for the airlift fleet.8 Given the breadth of our analysis, we do not consider all sortie-specific details, nor do we analyze how individual sortie deviations could further increase or decrease fuel burn. For example, we do not analyze details affecting specific sorties, such as situations where descending, rather than ascending, as the aircraft burns fuel is preferred as a result of the winds and temperatures along that specific route at a specific time. We further assume that the fuel required for each sortie is properly calculated; however, this does require investment in information systems.
6 Although, the Energy Information Administration expects a rise in real jet fuel prices of 0.7 percent per year through 2040. See Energy Information Administration, Annual Energy Outlook 2014, Appendix A – Table 3, undated; and Defense Logistics Agency, “DLA Standard Energy Prices,” 2013. 7 Office of Management and Budget, Guidelines and Discounted Rates for Benefit-Cost Analyses of Federal Programs, OMB Circular No. A-94 Appendix C, “Table of Past Years Discount Rates,” Washington, D.C., revised December 2012. 8 Mouton et al., 2015.
3
2. Fuel Reduction Options
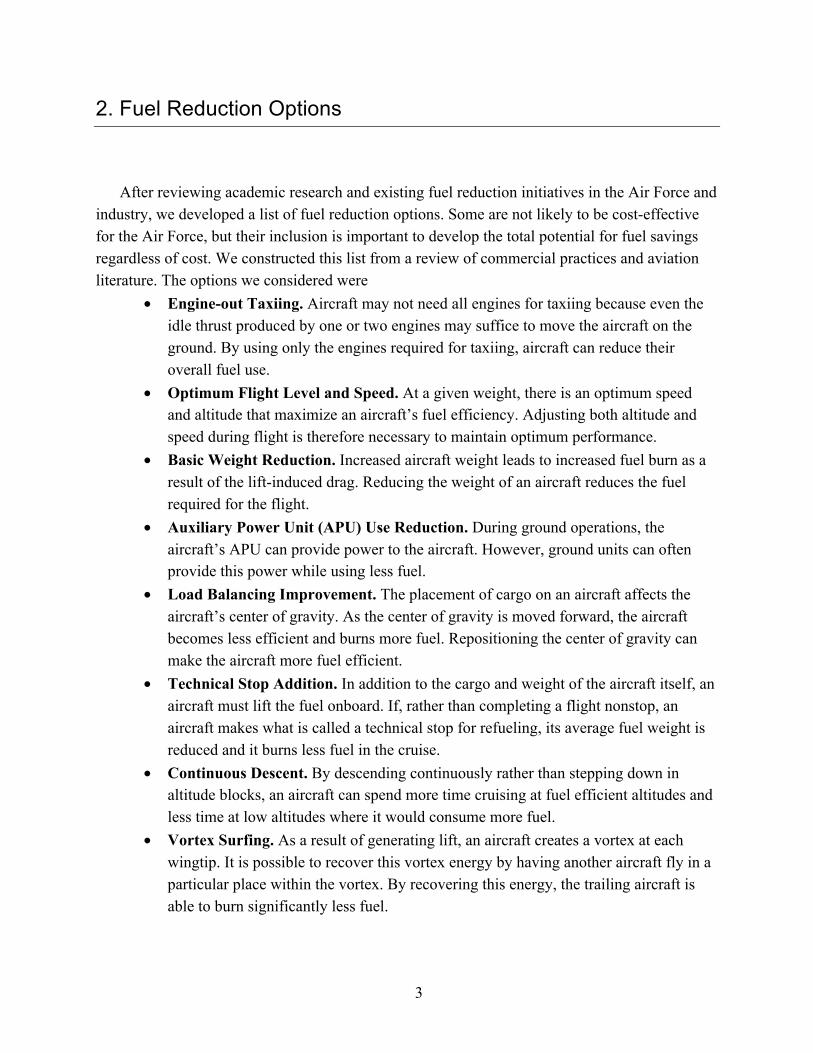
After reviewing academic research and existing fuel reduction initiatives in the Air Force and industry, we developed a list of fuel reduction options. Some are not likely to be cost-effective for the Air Force, but their inclusion is important to develop the total potential for fuel savings regardless of cost. We constructed this list from a review of commercial practices and aviation literature. The options we considered were
• Engine-out Taxiing. Aircraft may not need all engines for taxiing because even the idle thrust produced by one or two engines may suffice to move the aircraft on the ground. By using only the engines required for taxiing, aircraft can reduce their overall fuel use.
• Optimum Flight Level and Speed. At a given weight, there is an optimum speed and altitude that maximize an aircraft’s fuel efficiency. Adjusting both altitude and speed during flight is therefore necessary to maintain optimum performance.
• Basic Weight Reduction. Increased aircraft weight leads to increased fuel burn as a result of the lift-induced drag. Reducing the weight of an aircraft reduces the fuel required for the flight.
• Auxiliary Power Unit (APU) Use Reduction. During ground operations, the aircraft’s APU can provide power to the aircraft. However, ground units can often provide this power while using less fuel.
• Load Balancing Improvement. The placement of cargo on an aircraft affects the aircraft’s center of gravity. As the center of gravity is moved forward, the aircraft becomes less efficient and burns more fuel. Repositioning the center of gravity can make the aircraft more fuel efficient.
• Technical Stop Addition. In addition to the cargo and weight of the aircraft itself, an aircraft must lift the fuel onboard. If, rather than completing a flight nonstop, an aircraft makes what is called a technical stop for refueling, its average fuel weight is reduced and it burns less fuel in the cruise.
• Continuous Descent. By descending continuously rather than stepping down in altitude blocks, an aircraft can spend more time cruising at fuel efficient altitudes and less time at low altitudes where it would consume more fuel.
• Vortex Surfing. As a result of generating lift, an aircraft creates a vortex at each wingtip. It is possible to recover this vortex energy by having another aircraft fly in a particular place within the vortex. By recovering this energy, the trailing aircraft is able to burn significantly less fuel.
4
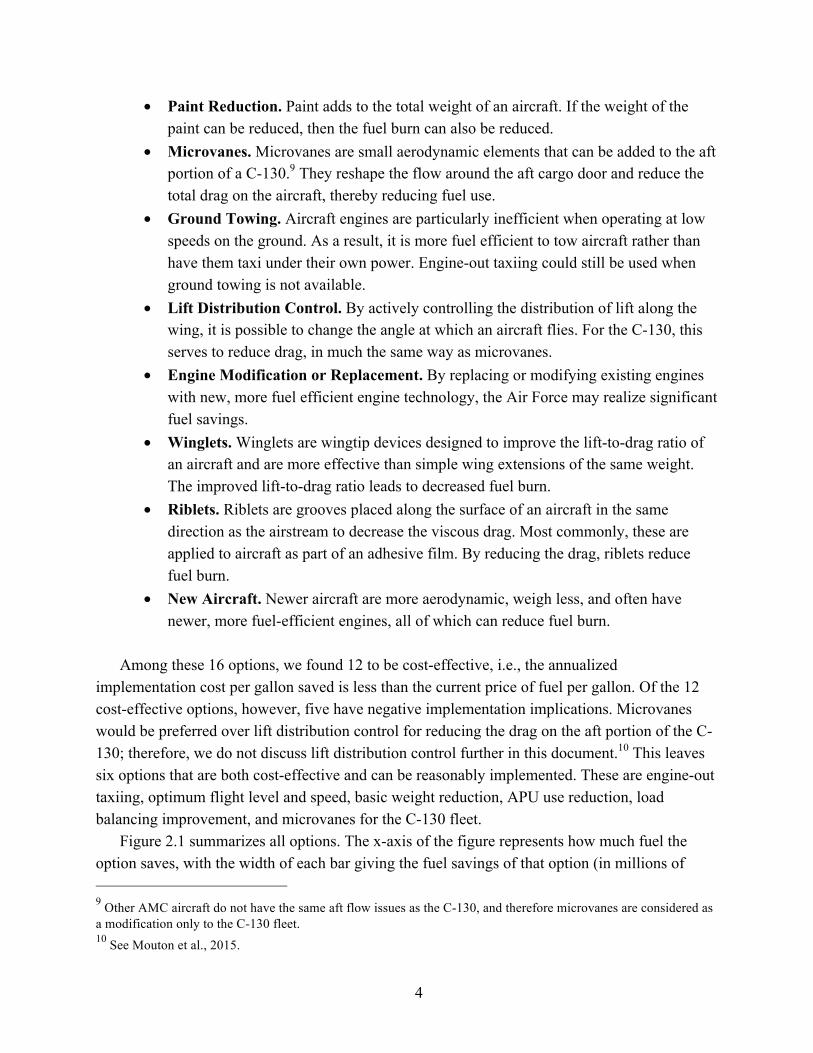
• Paint Reduction. Paint adds to the total weight of an aircraft. If the weight of the paint can be reduced, then the fuel burn can also be reduced.
• Microvanes. Microvanes are small aerodynamic elements that can be added to the aft portion of a C-130.9 They reshape the flow around the aft cargo door and reduce the total drag on the aircraft, thereby reducing fuel use.
• Ground Towing. Aircraft engines are particularly inefficient when operating at low speeds on the ground. As a result, it is more fuel efficient to tow aircraft rather than have them taxi under their own power. Engine-out taxiing could still be used when ground towing is not available.
• Lift Distribution Control. By actively controlling the distribution of lift along the wing, it is possible to change the angle at which an aircraft flies. For the C-130, this serves to reduce drag, in much the same way as microvanes.
• Engine Modification or Replacement. By replacing or modifying existing engines with new, more fuel efficient engine technology, the Air Force may realize significant fuel savings.
• Winglets. Winglets are wingtip devices designed to improve the lift-to-drag ratio of an aircraft and are more effective than simple wing extensions of the same weight. The improved lift-to-drag ratio leads to decreased fuel burn.
• Riblets. Riblets are grooves placed along the surface of an aircraft in the same direction as the airstream to decrease the viscous drag. Most commonly, these are applied to aircraft as part of an adhesive film. By reducing the drag, riblets reduce fuel burn.
• New Aircraft. Newer aircraft are more aerodynamic, weigh less, and often have newer, more fuel-efficient engines, all of which can reduce fuel burn.
Among these 16 options, we found 12 to be cost-effective, i.e., the annualized
implementation cost per gallon saved is less than the current price of fuel per gallon. Of the 12 cost-effective options, however, five have negative implementation implications. Microvanes would be preferred over lift distribution control for reducing the drag on the aft portion of the C-130; therefore, we do not discuss lift distribution control further in this document.10 This leaves six options that are both cost-effective and can be reasonably implemented. These are engine-out taxiing, optimum flight level and speed, basic weight reduction, APU use reduction, load balancing improvement, and microvanes for the C-130 fleet.
Figure 2.1 summarizes all options. The x-axis of the figure represents how much fuel the option saves, with the width of each bar giving the fuel savings of that option (in millions of 9 Other AMC aircraft do not have the same aft flow issues as the C-130, and therefore microvanes are considered as a modification only to the C-130 fleet. 10 See Mouton et al., 2015.

5
Figure 2.1. Cost-Effectiveness of Fuel Reduction Options
gallons [MG] of cumulative annualized fuel savings). The y-axis is the cost to implement the savings option, with the height of each option representing the cost per gallon of fuel saved for implementing each option. For example, ground towing of C-17 aircraft would save 13.9 MG annually and cost $2.18 for each gallon of fuel saved, well below the assumed cost of $3.73 per gallon, making it a cost-efficient option.
Of all the fuel reduction options, those that are cost-effective—below the dashed line—represent annual savings of about 50 MG, or 5 percent of projected MAF annual fuel use.11 The options that are not cost-effective represent a much bigger potential for fuel reduction, about 135 MG per year. Although there are many possibilities for fuel reduction, this illustrates that only a portion of the possible saving opportunities are cost-effective. Further, of the options that are cost-effective, nearly half of them have negative implementation impacts (orange shading). In fact, the cost-effective options that have neutral or positive implementation impacts represent only 16 MG of fuel, or 1.6 percent of projected MAF fuel use. This 16 MG of fuel savings is achievable while maintaining the programmed flight hours. Reducing flight hours, for example, by replacing flight hours with simulator training or more effectively programming the flight hours, would, of course, yield additional savings.
11 Note that this number is slightly lower than that shown in the figure because some options, such as lift distribution control and microvanes, or engine-out taxiing and ground towing, would not be done concurrently.

6
Figure 2.1 shows that these options generally fall in four broad categories. First, a small set of options are both cost-effective and have neutral implementation impacts (tan shading). Second, a set of options are cost-effective but have negative implementation impacts (orange shading and below the $3.73 per gallon dashed line). Third, a set of options are not cost-effective and also have negative implementation impacts (orange shading and above the $3.73 per gallon dashed line). Fourth, a set of options are extremely not cost-effective yet have positive implementation impacts (dark green shading).
We next review further details of the six options that are both cost-effective and have neutral implementation impacts (excluding, for reasons noted above, lift distribution control). We then conclude with a discussion of the implications of other options and recommendations for the Air Force in both the short and long term.

7
3. Cost-Effective Options That Can Be Reasonably Implemented
If implementing an approach costs more than the savings gained from fuel reductions, then it does not make sense to implement such an option in the absence of other benefits. Below, we examine in more detail the cost-effective options for fuel savings that may also be reasonably implemented. These are ordered by greatest to least net savings.
Engine-Out Taxiing
When surface conditions and aircraft weight are favorable, aircraft crew can delay starting all engines and taxi with fewer than all engines to conserve fuel. Commercial carriers regularly use one engine when taxiing.12 JetBlue reports using single-engine taxiing on 62 percent of its A320 flights.13
MAF aircraft operations procedures direct delayed-engine start, but only the C-17 procedure suggests engine-out taxiing.14 Our observations and conversations with pilots show that MAF crews already use engine-out taxiing to some extent, but not universally.
We assumed that only 50 percent of MAF sorties could utilize engine-out taxiing. Engine-out taxiing is not always possible because of aircraft weight, runway conditions, or airport restrictions. Our estimate is less than the 62 percent that JetBlue is able to achieve with its A320 fleet, partially to account for the fact that some level of engine-out taxiing is already done in the MAF fleet. We also assumed that aircraft taxiing is, on average, about 15 minutes to and 15 minutes from the end of the runway and is done with two engines. Finally, we assumed that ground-operations fuel consumption in pounds per minute was approximately 30 percent of cruise fuel consumption midpoint weight, approximating our experience operating a Boeing 747-400F simulator, although more complex estimations for taxi fuel flow exist.15
12 American Airlines Newsroom, “Fuel Smart,” online, undated; and Delta Airlines, “Environmental Fact Sheet,” online, updated January 2010. 13 Jet Blue, 2012 Responsibility Report, online, undated. 14 Secretary of the Air Force, Air Force Instruction (AFI) 11-2KC-135, C/KC-135 Operations Procedures, Vol. 3, §14.4.2.5, September 18, 2008b, certified current October 15, 2010; Secretary of the Air Force, Air Force Instruction (AFI) 11-2C-130J, C-130J Operations Procedures Vol. 3, §14.5.14, December 8, 2009; Secretary of the Air Force, Air Force Instruction (AFI) 11-2KC-10, KC-10 Operations Procedures, Vol. 3, §14.2.3, August 30, 2011a; Secretary of the Air Force, Air Force Instruction (AFI) 11-2C-17, C-17 Operations Procedures, Vol. 3, §6.25.1, November 16, 2011b; Secretary of the Air Force, Air Force Instruction (AFI) 11-2C-5, C-5 Operations Procedures, Vol. 3, §14.2.3, February 24, 2012a; and Secretary of the Air Force, Air Force Instruction (AFI) 11-2C-130, C-130 Operations Procedures, Vol. 3, §14.2.5, April 23, 2012b. 15 T. Nikoleris, G. Gupta, and M. Kistler, “Detailed Estimation of Fuel Consumption and Emissions during Aircraft Taxi Operations at Dallas/Fort Worth International Airport,” Part D: Transport and Environment Journal, Vol. 16, No. 4, June 2011, pp. 302–308.

8
Altogether, as Table 3.1 shows, this option could save 8.1 MG of fuel, or $30.3 million at the current price of $3.73 per gallon. Most of these savings would come from the C-17 fleet as a result of its high number of sorties. Taxiing on fewer engines may require longer launch times to start all engines and allow adequate engine warm-up at the end of runway. Crew launch procedures and order of checklist items may also need to be revised to accommodate this procedure. Yet this option places only a limited burden on maintenance or crew operations and is done extensively for commercial flights. Incorporating engine-out taxiing into standard operating procedures can help institutionalize it and save millions of gallons of fuel annually.
Table 3.1. Cost Savings from Engine-Out Taxiing
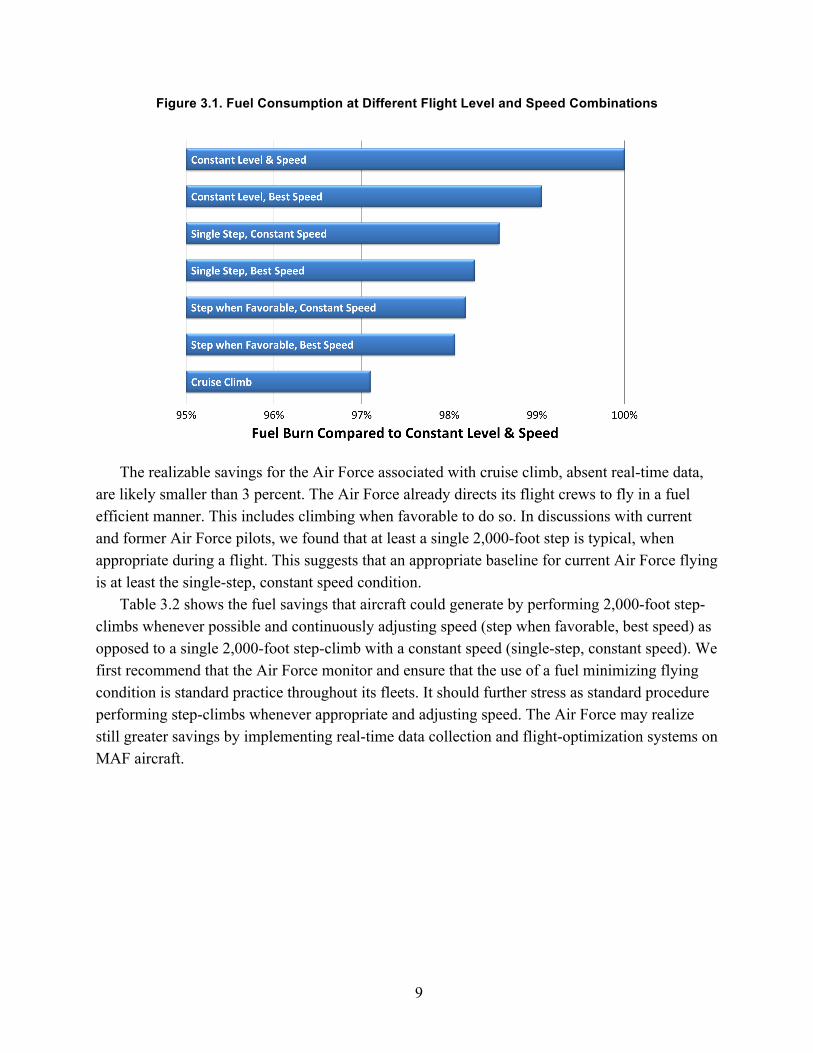
Optimum Flight Level and Speed We modeled seven approaches to choosing flight level and speed to examine how fuel burn
varies across these for MAF missions. Figure 3.1 outlines these and the savings each could achieve relative to constant level and speed, the worst case for fuel efficiency we analyzed. The savings between the best- and worst-case scenarios is nearly 3 percent, which can represent significant overall savings.
In ideal weather conditions and absent air traffic constraints, an aircraft achieves its most fuel efficient flying by doing a cruise climb, continuously increasing its altitude throughout flight so that fuel efficiency is optimized at all times. However, cruise climb is generally not available to aircraft, because air traffic control agencies typically restrict flight levels to discrete intervals 2,000 to 4,000 feet apart.16 These periodic step-climbs result in long cruises at constant altitude, during which aircraft can reduce fuel use by continuously adjusting speed (slowing down, generally) to achieve the best specific range for that altitude and instantaneous aircraft weight.
16 Elizabeth L. Ray, Air Traffic Organization, “Air Traffic Control,” FAA Order JO7110.65U, Washington, D.C.: Federal Aviation Administration, December 16, 2011.
Neutral Additional Impacts
Annualized Fuel Savings (MG / Percent)
Annualized Engine-‐Out Taxi Cost ($FY13M)
Annualized Fuel Savings ($FY13M)
C-‐130 1.4 (1.6%) Minimal 5.4
C-‐17 4.3 (0.9%) Minimal 16.2
C-‐5 0.7 (0.7%) Minimal 2.5
KC-‐135 1.3 (0.7%) Minimal 4.8
KC-‐10 0.4 (0.4%) Minimal 1.5
Total 8.1 (0.8%) Minimal 30.3
9
Figure 3.1. Fuel Consumption at Different Flight Level and Speed Combinations
The realizable savings for the Air Force associated with cruise climb, absent real-time data, are likely smaller than 3 percent. The Air Force already directs its flight crews to fly in a fuel efficient manner. This includes climbing when favorable to do so. In discussions with current and former Air Force pilots, we found that at least a single 2,000-foot step is typical, when appropriate during a flight. This suggests that an appropriate baseline for current Air Force flying is at least the single-step, constant speed condition.
Table 3.2 shows the fuel savings that aircraft could generate by performing 2,000-foot step-climbs whenever possible and continuously adjusting speed (step when favorable, best speed) as opposed to a single 2,000-foot step-climb with a constant speed (single-step, constant speed). We first recommend that the Air Force monitor and ensure that the use of a fuel minimizing flying condition is standard practice throughout its fleets. It should further stress as standard procedure performing step-climbs whenever appropriate and adjusting speed. The Air Force may realize still greater savings by implementing real-time data collection and flight-optimization systems on MAF aircraft.

10
Table 3.2. Cost Savings from Optimum Flight Level and Speed
Basic Weight Reduction The empty weight of an aircraft consists of the weight of its airframe, engines, propellers,
rotors, and fixed equipment.17 The basic weight of an aircraft is its empty weight plus unusable fuel, oil, oxygen, survival kits, and other equipment not consumed during flight.18 As with any aircraft weight reduction, reducing aircraft basic weight will increase fuel efficiency.
Commercial airlines are continuously looking for ways to reduce aircraft weight. Lufthansa, for example, recently stripped an Airbus A340 of nearly four metric tons of items.19 The Air Force has also sought to reduce aircraft weight, including, for example, by introducing electronic flight bags to reduce the amount of paper carried.20 The Air Force has also sought to palletize certain aircraft equipment not needed for local sorties, loading the pallets only for sorties departing home station.
To develop a reasonable weight-reduction objective for the MAF fleet, we compared the basic weight of individual aircraft as reported on Form B—Aircraft Weight Record the mission-design series (MDS) average.21 We found that the deviation from average weight was roughly constant across all MDS, at about 1,250 pounds per aircraft, rather than proportional to the average basic weight for each MDS. If the Air Force were to reduce the basic weight of all aircraft heavier than the MDS average to the average weight for their MDS, it would produce a net fuel savings roughly equivalent to reducing the weight of all aircraft by 655 pounds.
Table 3.3 shows the savings resulting from this weight reduction. Altogether, the MAF would save 1.7 MG of fuel annually, which corresponds to an annualized savings of $6.2 17 Code of Federal Regulations, Title 14—Aeronautics and Space, Section 119.3 Definitions, January 1, 2003. 18 Secretary of the Air Force, “Basic Technical Order for USAF Aircraft: Weight and Balance,” T.O. 1-1B-50, Tinker AFB, Okla.: 557 ACSS/GFEAC, April 1, 2008a. 19 Graham Warwick, “How Many Bin Bags to Empty an A340?” Aviation Week, blog post, March 20, 2013. 20 Amy McCullough, “Energy Effectiveness,” Air Force Magazine, January 19, 2011; and Matthew Stibbe, “U.S. Air Force Will Save $50M with iPad Electronic Flight Bags,” Forbes, May 30, 2013. 21 Secretary of the Air Force, 2008a.
Neutral Additional Impacts
Annualized Fuel Savings (MG / Percent)
Annualized Cost ($FY13M)
Annualized Fuel Savings ($FY13M)
C-‐130 0.5 (0.5%) Minimal 1.8
C-‐17 2.4 (0.5%) Minimal 8.9
C-‐5 0.6 (0.7%) Minimal 2.4
KC-‐135 N/A N/A N/A
KC-‐10 N/A N/A N/A
Total 3.5 (0.4%) Minimal 13.1
11
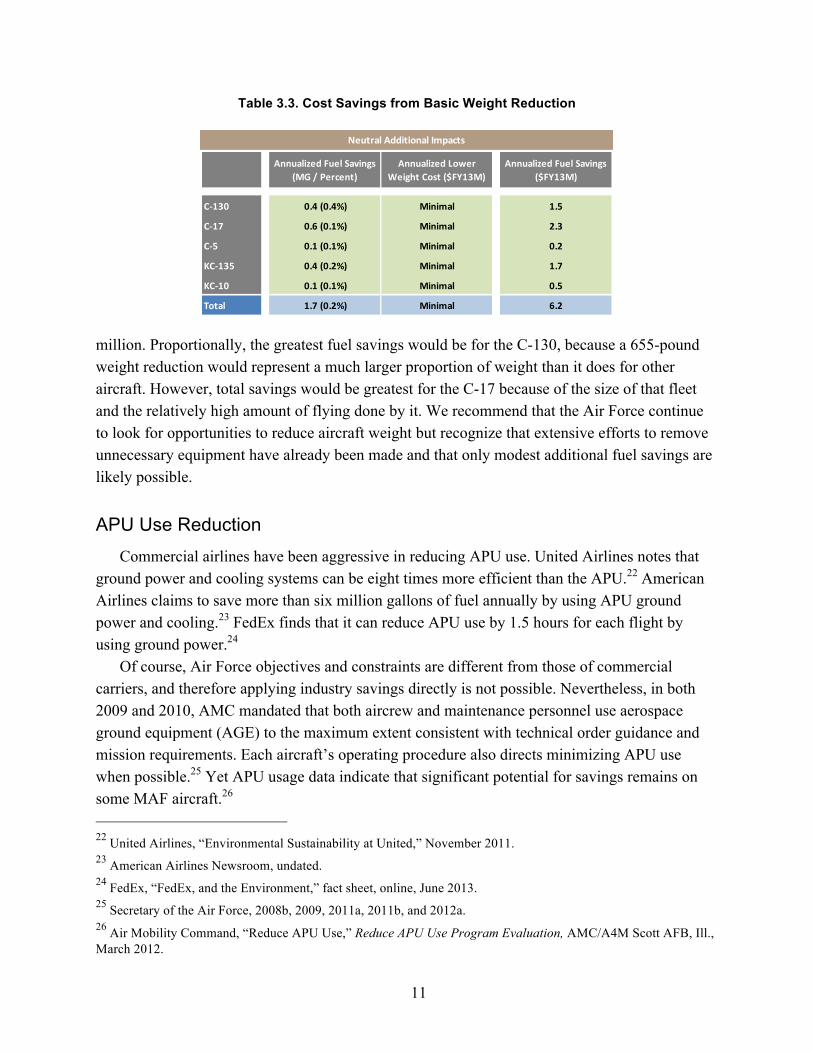
Table 3.3. Cost Savings from Basic Weight Reduction
million. Proportionally, the greatest fuel savings would be for the C-130, because a 655-pound weight reduction would represent a much larger proportion of weight than it does for other aircraft. However, total savings would be greatest for the C-17 because of the size of that fleet and the relatively high amount of flying done by it. We recommend that the Air Force continue to look for opportunities to reduce aircraft weight but recognize that extensive efforts to remove unnecessary equipment have already been made and that only modest additional fuel savings are likely possible.
APU Use Reduction Commercial airlines have been aggressive in reducing APU use. United Airlines notes that
ground power and cooling systems can be eight times more efficient than the APU.22 American Airlines claims to save more than six million gallons of fuel annually by using APU ground power and cooling.23 FedEx finds that it can reduce APU use by 1.5 hours for each flight by using ground power.24
Of course, Air Force objectives and constraints are different from those of commercial carriers, and therefore applying industry savings directly is not possible. Nevertheless, in both 2009 and 2010, AMC mandated that both aircrew and maintenance personnel use aerospace ground equipment (AGE) to the maximum extent consistent with technical order guidance and mission requirements. Each aircraft’s operating procedure also directs minimizing APU use when possible.25 Yet APU usage data indicate that significant potential for savings remains on some MAF aircraft.26 22 United Airlines, “Environmental Sustainability at United,” November 2011. 23 American Airlines Newsroom, undated. 24 FedEx, “FedEx, and the Environment,” fact sheet, online, June 2013. 25 Secretary of the Air Force, 2008b, 2009, 2011a, 2011b, and 2012a. 26 Air Mobility Command, “Reduce APU Use,” Reduce APU Use Program Evaluation, AMC/A4M Scott AFB, Ill., March 2012.
Neutral Additional Impacts
Annualized Fuel Savings (MG / Percent)
Annualized Lower Weight Cost ($FY13M)
Annualized Fuel Savings ($FY13M)
C-‐130 0.4 (0.4%) Minimal 1.5
C-‐17 0.6 (0.1%) Minimal 2.3
C-‐5 0.1 (0.1%) Minimal 0.2
KC-‐135 0.4 (0.2%) Minimal 1.7
KC-‐10 0.1 (0.1%) Minimal 0.5
Total 1.7 (0.2%) Minimal 6.2

12
To calculate potential savings from using AGE for APU, we assumed that a ground power unit and either an air conditioning unit or heater unit were required in lieu of an APU, even though both may not always be required. For the C-5, which has two APUs, we assumed that the aircraft would require two power units and two air conditioning units.
To estimate the potential for reducing APU use, we first corrected for temperature effects. APU use increases in unusually hot or cold weather. We also identified the major operating location that, for each MDS, had the lowest APU use; these became our target levels of usage to estimate potential savings. We found that reducing APU at all airfields to the target levels could save the Air Force more than 1 MG of fuel per year. As Table 3.4 shows, this equates to $4.7 million of fuel cost savings at the assumed price of $3.73 per gallon, with most savings coming from the C-17 fleet because of its high sortie rates. These savings are purely fuel savings and do not include secondary effects, such as an increase in maintenance cost for ground equipment or a decrease in maintenance costs for APUs.
From our discussion with operators, we conclude there may be sufficient AGE units available to meet any additional demand; therefore, an investment in additional units may not be required to realize these savings. As AGE use increases, there might be a commensurate increase in demand for maintenance manpower to ensure that ground units are readily available to aircraft, which the Air Force should explore further. To realize these savings, the Air Force would need to embed maximal use of AGE into training and integrate it into standard flightline procedures.
Table 3.4. Cost Savings from APU Usage Reduction
Load Balancing Improvement The center of gravity of an aircraft during flight can shift by moving fuel forward or aft.27
Movement of the center of gravity within the allowable range can increase or decrease specific
27 Airbus, “Getting to Grips with Fuel Economy,” Flight Operations Support & Line Assistance, Airbus Customer Services, No. 3, July 2004.
Neutral Additional Impacts
Annualized Fuel Savings (MG / Percent)
Annualized Reduced APU Use Cost ($FY13M)
Annualized Fuel Savings ($FY13M)
C-‐130 N/A N/A N/A
C-‐17 1.1 (0.2%) Minimal 4.0
C-‐5 0.1 (0.2%) Minimal 0.5
KC-‐135 N/A N/A N/A
KC-‐10 0.0 (0.0%) Minimal 0.2
Total 1.3 (0.1%) Minimal 4.7

13
range by about 2 percent.28 This is because as the center of gravity is moved forward, an aircraft needs more trim—downward force on its horizontal tail—to maintain level flight..29 It is also possible to move the center of gravity by shifting loads within the cargo compartment. The Air Force has sought ways to improve the center of gravity location, including by automation of load plans.30
To estimate the extent of possible center-of-gravity improvements and resulting fuel savings, we derived a detailed estimate for the C-17 and applied these results to other aircraft. Fuel tracker data maintained by the AMC FEO include center-of-gravity location. We analyzed these data to determine what percentage of sorties had a significant payload and a center-of-gravity forward of the nominal location. For these sorties, we calculated the average center-of-gravity location. We then calculated the improved specific range assuming that all these sorties had instead been flown with a nominal center of gravity. The center of gravity has no effect on fuel burned during ground operations. We estimated the improvement in specific range to be about 0.3 percent for every 1 percent change in mean aerodynamic chord, i.e., the distance between the leading and trailing edges of the wing.
We analyzed one year of data and found that 35 percent of C-17 sorties had a load of at least 5,000 pounds, that is, with substantial loads whose balancing might be improved. Of these sorties, 74 percent had a center of gravity 1.32 percent forward of the nominal location. This corresponds to an average improvement of specific range of just over 0.1 percent. Using calculations on the improvement achievable for the C-17, we applied similar factors to other MAF aircraft, as shown in Table 3.5. The same improvement in specific range results in a different fuel reduction for the different MDS across the entire spectrum of flight profiles. For example, the C-130 has the lowest percentage fuel reduction because of its relatively short sortie distances, meaning that ground operations and climb contribute to a greater proportion of the sortie fuel burn.
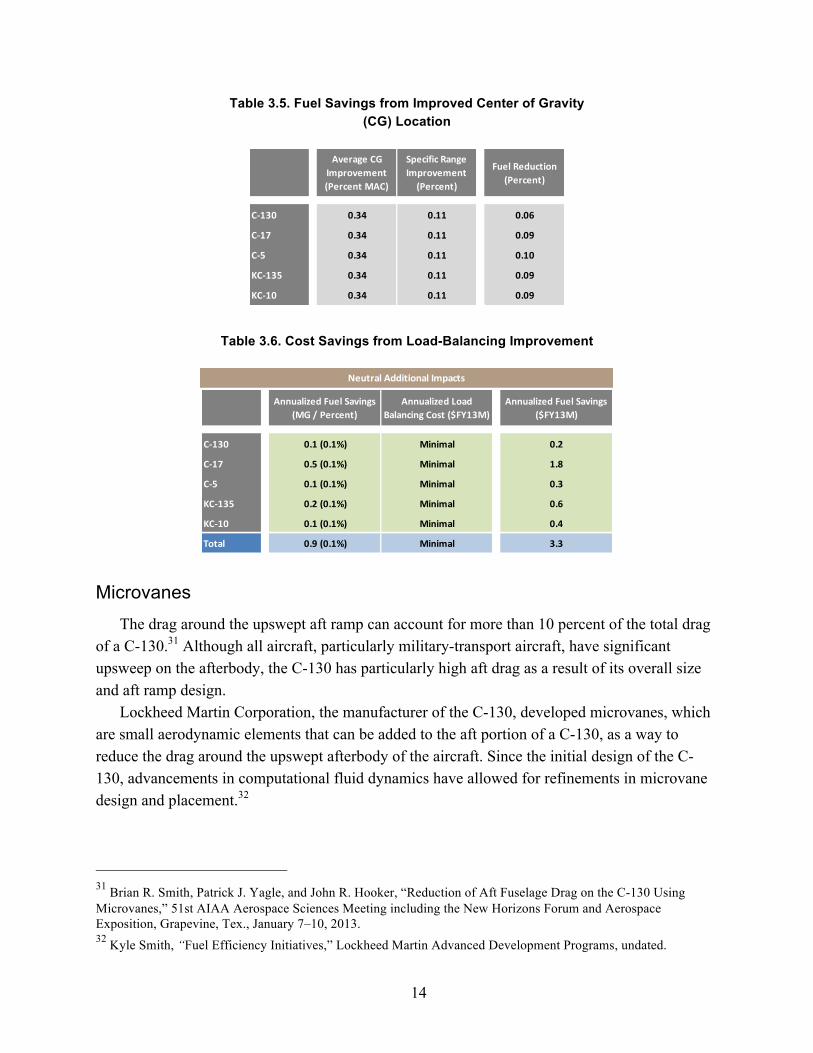
Given that average center-of-gravity locations are not far from the nominal location and that 65 percent of sorties fly near empty, the potential fuel savings from improving the center of gravity is less than 1 MG per year, as shown in Table 3.6. Furthermore, some of these savings may not be realized because of loading limitations, intermediate stops, and cargo uncertainty. Nevertheless, we recommend that the Air Force continue to improve center-of-gravity location through better data and use of load-balancing software.
28 Airbus, 2004; and Military Airlift Command, Navigation and Performance Division of Aircrew Standardization, “Birds Fly Free, MAC Doesn’t,” Scott Air Force Base, Ill., February 10, 1976. 29 The downward force on the horizontal tail counteracts the lift of the wing; thereby requiring the wing to produce more lift which in turns generates additional lift-induced drag. See Military Airlift Command, 1976. 30 Harold Smoot, “AWBS: Automated Weight & Balance System,” Lockheed Martin Corporation, undated
14
Table 3.5. Fuel Savings from Improved Center of Gravity (CG) Location
Table 3.6. Cost Savings from Load-Balancing Improvement
Microvanes The drag around the upswept aft ramp can account for more than 10 percent of the total drag
of a C-130.31 Although all aircraft, particularly military-transport aircraft, have significant upsweep on the afterbody, the C-130 has particularly high aft drag as a result of its overall size and aft ramp design.
Lockheed Martin Corporation, the manufacturer of the C-130, developed microvanes, which are small aerodynamic elements that can be added to the aft portion of a C-130, as a way to reduce the drag around the upswept afterbody of the aircraft. Since the initial design of the C-130, advancements in computational fluid dynamics have allowed for refinements in microvane design and placement.32
31 Brian R. Smith, Patrick J. Yagle, and John R. Hooker, “Reduction of Aft Fuselage Drag on the C-130 Using Microvanes,” 51st AIAA Aerospace Sciences Meeting including the New Horizons Forum and Aerospace Exposition, Grapevine, Tex., January 7–10, 2013. 32 Kyle Smith, “Fuel Efficiency Initiatives,” Lockheed Martin Advanced Development Programs, undated.
Average CG Improvement (Percent MAC)
Specific Range Improvement (Percent)
Fuel Reduction (Percent)
C-‐130 0.34 0.11 0.06
C-‐17 0.34 0.11 0.09
C-‐5 0.34 0.11 0.10
KC-‐135 0.34 0.11 0.09
KC-‐10 0.34 0.11 0.09
Neutral Additional Impacts
Annualized Fuel Savings (MG / Percent)
Annualized Load Balancing Cost ($FY13M)
Annualized Fuel Savings ($FY13M)
C-‐130 0.1 (0.1%) Minimal 0.2
C-‐17 0.5 (0.1%) Minimal 1.8
C-‐5 0.1 (0.1%) Minimal 0.3
KC-‐135 0.2 (0.1%) Minimal 0.6
KC-‐10 0.1 (0.1%) Minimal 0.4
Total 0.9 (0.1%) Minimal 3.3

15
Separately, Vortex Control Technologies has developed finlets, which are much larger than microvanes, for the C-130, which also reduce drag on the aft position of the aircraft.33 Only four to six finlets would be required per side, in comparison to 18 microvanes.34
Flight test results from August 2011 suggest that microvanes can reduce fuel consumption by 2 to 3 percent, whereas finlets reduce fuel use by 7 percent.35 Yet computational fluid dynamic results on finlets show a drag reduction similar to the drag reduction of microvanes.36 Previous work by Lockheed Martin indicates that large strakes, such as finlets, although offering additional drag reduction, are likely to interfere with airdrop operations.37
For this analysis, we assume the average of the C-130 microvane flight test results, which gives a total fuel reduction of 2.5 percent. We estimated the cost for microvanes to be $250,000 per aircraft but, given the uncertainty about this cost, we performed a sensitivity analysis to derive the maximum cost at which microvanes would be cost-effective.
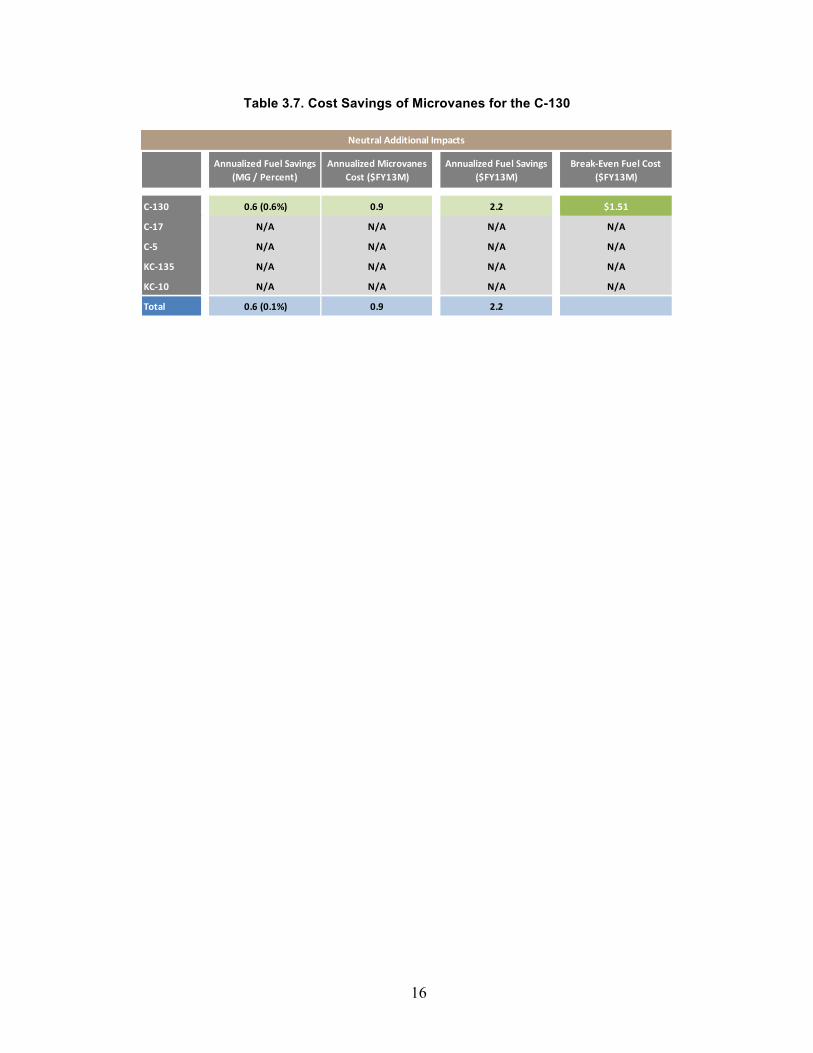
We find that a 2.5 percent decrease in fuel usage for the C-130 fleet yields a modest annualized savings of about 600,000 gallons of fuel, which corresponds to $2.2 million in annualized fuel savings, as Table 3.7 shows. This accounts for the retirement of the C-130 fleet, meaning that the fuel savings from microvanes will not be realized indefinitely. At $250,000 per aircraft, the total cost to retrofit the C-130 fleet would be slightly more than $80 million. Using the real discount rate of 1.1 percent, this yields an annualized cost of about $873,000, significantly less than the $2.2 million in annualized fuel savings. In fact, microvanes would be cost-effective at today’s fuel price as long as the cost to retrofit the entire fleet was less than $198 million or $618,000 per aircraft. Judging by the finlet list price, this seems very likely.
We therefore recommend that the Air Force plan to install microvanes, or finlets, if the total cost per aircraft is less than $618,000. Before installation, however, the Air Force should also verify no degradation to mission performance or aircraft maintainability.
33 Vortex Control Technologies, “Finlets Technology—Applicable Aircraft: C130 /L100 Hercules,” 2012a. 34 Consulting Aviation Services, “VC Finlet: Reduces Drag on Upward Swept Fuselage Aircraft,” 2009; Erdem Ayan, Hakan Telli, and Assistant Professor Dr Y. Volkan Pehlivanoglu, Computational Investigation of C-130 Afterbody Drag Reduction by Finlets, Istanbul, Turkey: Aeronautics and Space Technologies Institute, Turkish Air Force Academy, undated; and Smith, undated. 35 Graham Warwick, “Lockheed Developing Winglets For C-130, C-5,” Aerospace Daily & Defense Report, October 6, 2011, p. 3; and Vortex Control Technologies, “2013 Program Price List,” 2012b. 36 Ayan, Telli, and Pehlivanoglu, undated. 37 Jeff Rhodes, “Tweak My Ride,” Code One, March 7, 2012.
16
Table 3.7. Cost Savings of Microvanes for the C-130
Neutral Additional Impacts
Annualized Fuel Savings (MG / Percent)
Annualized Microvanes Cost ($FY13M)
Annualized Fuel Savings ($FY13M)
Break-‐Even Fuel Cost ($FY13M)
C-‐130 0.6 (0.6%) 0.9 2.2 $1.51
C-‐17 N/A N/A N/A N/A
C-‐5 N/A N/A N/A N/A
KC-‐135 N/A N/A N/A N/A
KC-‐10 N/A N/A N/A N/A
Total 0.6 (0.1%) 0.9 2.2

17
4. Conclusions and Recommendations
Table 4.1 summarizes the options we considered in our full analysis by their implementation impacts and by their cost-effectiveness. Font size for each option indicates the relative amount of possible fuel savings.
The top-left cell represents the best options, those that have positive implementation impacts and are cost-effective. Only one option, lift-distribution control, falls in that cell, but it represents a very small savings potential, and, as noted above and discussed in the main report, would not be implemented in addition to microvanes, which offers better value.
The lack of additional options in the top-left corner is not unexpected, because options that would appear there have most likely already been implemented. We see that most of the cost-effective options have neutral or negative implementation impacts. In fact, the cost-effective option with the greatest savings, ground towing, has negative implementation impacts.
Table 4.1. Cost-Effectiveness of Fuel Reduction Options
Cost-‐Effective(<$3/gal)
Marginally Cost-‐Effective($3/gal -‐ $5/gal)
Not Cost-‐Effective(>$5/gal)
Positive Implementation
ImpactsLift Distribution Control
Engine Modification
Engine Replacement
New Aircraft
Neutral Implementation
Impacts
APU Use Reduction
Basic Weight Reduction
Engine-‐Out TaxiingLoad Balancing Improvement
Microvanes
Optimum Level & Speed
RibletsWinglets
Negative Implementation
Impacts
Continuous Descents
Ground TowingPaint Reduction
Technical Stop AdditionVortex Surfing
18
The table also shows that no options are marginally cost-effective, that is, costing $3 to $5 per gallon to implement (middle column). We also see that there are no options in the bottom right corner, as such options could be excluded from the analysis a priori.
We do see that some options, such as new aircraft, offer large aggregate savings and neutral or positive implementation impacts but are not as cost-effective as a fuel savings program. There may be valid reasons to pursue such strategies, but fuel savings alone would not justify such pursuit.
More broadly, we conclude the Air Force has already taken many of the steps it can to achieve fuel savings. Future initiatives for fuel savings may have more marginal results or require addressing implementation impacts or high costs. With this in mind, we offer two sets of recommendations below. The first are those that the Air Force can take now to reduce fuel use still further, and the second is options it should explore that have the potential to reduce future fuel use.
Actions to Implement Now Actions the Air Force should take now, based on the cost-effective and reasonably
implemented alternatives we discussed, include the following. Implement Engine-Out Taxiing. Incorporating engine-out taxiing into standard operating
procedures can help institutionalize the practice and save millions of gallons of fuel annually. Engine-out taxiing places only a limited burden on operations and is done extensively in the commercial sector. Current Air Force procedures allow for the practice of delayed-engine start when conditions permit but do not direct it.
Fly at Optimum Level and Speed. Ensuring that crews perform step-climbs when appropriate and adjust their speed based on their weight and altitude can save significant fuel. We understand that performing at least one step-climb when appropriate is currently standard for Air Force crews, but this should be verified. In addition, aircraft should fly the optimum speed for the given flight conditions. Incorporating real-time weather data, such as wind and temperature, can further increase fuel savings.
Continue to Reduce the Basic Weight of Aircraft. Removing unnecessary equipment and maintaining the lowest empty weight possible can lead to modest fuel savings. The Air Force has already made significant efforts to reduce aircraft weight, efforts it should continue and reinforce.
Reduce APU Use. Using ground equipment instead of an aircraft’s APU can save more than 1 MG of fuel annually. Some bases currently use the APU significantly less than others. AMC should also continue to monitor and record APU use and increase the auditing of these data to identify and resolve problems early.
Ensure That Loads Are Properly Balanced. By ensuring that loads are properly balanced, the Air Force could reduce fuel use by almost 1 MG annually. The Air Force is currently

19
improving load balancing procedures. It should reinforce these and standardize practices across the fleet.
Install Microvanes on the C-130 Fleet. Installing microvanes (or finlets) on the C-130 fleet could save more than 0.5 MG of fuel annually. Testing is ongoing and indications are that these can be installed easily and safely and will not degrade mission performance.
Options for Further Analysis Additional options warrant further analysis and may yield future benefits. We note them
here; the main report contains additional details. Expand the Use of Continuous-Descent Approaches. The Air Force should examine which
of its aircraft can execute continuous-descent approaches and the modifications that would be required to employ this technique. It should also see if such approaches are executed when possible and if they can be expanded at military airfields. Continuous-descent approaches could save the Air Force more than 11 MG of fuel annually.
Continue Testing and Feasibility Studies of Vortex Surfing. The Air Force has been testing vortex surfing with C-17s and the results are promising. This testing should continue with detailed analysis on its implementation for the MAF fleet. The Air Force should further analyze such issues as aircraft fatigue and ride quality. Use of vortex surfing by the C-17 fleet alone could save 4 MG of fuel annually.
Conduct a Feasibility Study of Ground Towing. Although ground towing has clear negative implementation impacts, such as possible congestion at the end of the runway, these may be offset by the potential to save more than 20 MG of fuel annually. Implementing ground towing at military airfields with little traffic and long taxi times may provide an excellent opportunity to test the concept. In addition, industry is developing alternatives that allow aircraft to taxi themselves without using their engines; the Air Force should monitor these developments.
Altogether, by implementing those actions we recommend now, the Air Force could begin to save 16 MG of fuel annually, 1.6 percent of MAF fuel consumption, in a cost-effective manner. By exploring the future actions we recommend, including continuous descent, vortex surfing, and ground towing, the Air Force could potentially increase these annual fuel savings by an additional 38 MG.

21
References
Airbus, “Getting to Grips with Fuel Economy,” Flight Operations Support & Line Assistance, Airbus Customer Services, No. 3, July 2004.
Air Mobility Command, “Reduce APU Use,” Reduce APU Use Program Evaluation, AMC/A4M Scott AFB, Ill., March 2012.
American Airlines Newsroom, “Fuel Smart,” online, undated. As of February 25, 2014: http://hub.aa.com/en/nr/media-kit/operations/fuelsmart
Ayan, Erdem, Hakan Telli, and Assistant Professor Dr Y. Volkan Pehlivanoglu, Computational Investigation of C-130 Afterbody Drag Reduction by Finlets, Istanbul, Turkey: Aeronautics and Space Technologies Institute, Turkish Air Force Academy, undated.
Bates, Matthew (Tech. Sgt.), “Every Drop Counts,” Travis Air Force Base, Calif.: Defense Media Activity, November 1, 2013. As of February 24, 2014: http://www.amc.af.mil/news/story.asp?id=123369200
Bednarz, Sean G., Anthony D. Rosello, Shane Tierney, David Cox, Steven C. Isley, Michael Kennedy, Chuck Stelzner and Fred Timson, Modernizing the Mobility Air Force for Tomorrow's Air Traffic Management System, Santa Monica, Calif.: RAND Corporation, MG-1194-AF, 2012. As of February 24, 2014: http://www.rand.org/pubs/monographs/MG1194.html
Code of Federal Regulations, Title 14—Aeronautics and Space, Section 119.3 Definitions, January 1, 2003.
Consulting Aviation Services, “VC Finlet: Reduces Drag on Upward Swept Fuselage Aircraft,” 2009. As of February 26, 2014: http://www.casinc.us/innovations.php#Finlet
Defense Logistics Agency, “DLA Standard Energy Prices,” 2013. As of February 24, 2014: http://www.energy.dla.mil/DLA_finance_energy/Pages/dlafp03.aspx
Delta Airlines, “Environmental Fact Sheet,” online, updated January 2010. As of February 24, 2014: http://news.delta.com/index.php?s=18&item=83
Energy Information Administration, Annual Energy Outlook 2014, Appendix A – Table 3, undated. As of September 3, 2014: http://www.eia.gov/forecasts/aeo/er/pdf/tbla3.pdf

22
FedEx, “FedEx, and the Environment,” fact sheet, online, June 2013. As of September 5, 2014: http://www.fedex.com/sc/about/sustainability/environment.html
Jet Blue, 2012 Responsibility Report, online, undated. As of February 24, 2014: http://www.jetblue.com/green/
McCullough, Amy, “Energy Effectiveness,” Air Force Magazine, January 19, 2011. As of February 24, 2014: http://www.airforcemag.com/Features/airpower/Pages/box011911energy.aspx
Mouton, Christopher A., Powers, James D., Romano, Daniel M., Guo, Christopher, Bednarz, Sean, O’Connell, Caolionn, Fuel Reduction for the Mobility Air Forces, Santa Monica, Calif.: RAND Corporation, RR-757-AF, 2015. As of February 2015: http://www.rand.org/pubs/research_reports/RR757.html
Mouton, Christopher A., David T. Orletsky, Michael Kennedy and Fred Timson, Reducing Long-Term Costs While Preserving a Robust Strategic Airlift Fleet: Options for the Current Fleet and Next-Generation Aircraft, Santa Monica, Calif.: RAND Corporation, MG-1238-AF, 2013. As of February 24, 2014: http://www.rand.org/pubs/monographs/MG1238.html
Military Airlift Command, Navigation and Performance Division of Aircrew Standardization, “Birds Fly Free, MAC Doesn’t,” Scott Air Force Base, Ill., February 10, 1976.
Nikoleris, T., G. Gupta, and M. Kistler, “Detailed Estimation of Fuel Consumption and Emissions During Aircraft Taxi Operations at Dallas/Fort Worth International Airport,” Part D: Transport and Environment Journal, Vol. 16, No. 4, June 2011, pp. 302–308.
Office of Management and Budget, Guidelines and Discounted Rates for Benefit-Cost Analyses of Federal Programs, OMB Circular No. A-94 Appendix C, Table of Past Years Discount Rates, revised December 2012. As of February 24, 2014: http://www.whitehouse.gov/omb/circulars_a094/a94_appx-c
Ray, Elizabeth L., Air Traffic Organization, “Air Traffic Control,” FAA Order JO7110.65U, Washington, D.C.: Federal Aviation Administration, December 16, 2011.
Rhodes, Jeff, “Tweak My Ride,” Code One, March 7, 2012. As of February 26, 2014: http://www.codeonemagazine.com/article.html?item_id=91
Schwartz, Moshe, Katherine Blakeley, and Ronald O’Rourke, “Department of Defense Energy Initiatives: Background and Issues for Congress,” Washington, D.C.: Congressional Research Service, December 10, 2012.
Secretary of the Air Force, “Basic Technical Order for USAF Aircraft: Weight and Balance,” T.O. 1-1B-50, Tinker AFB, Okla.: 557 ACSS/GFEAC, April 1, 2008a.

23
———, Air Force Instruction (AFI) 11-2KC-135, C/KC-135 Operations Procedures, Vol. 3, §14.4.2.5, September 18, 2008b, certified current October 15, 2010.
———, Air Force Instruction (AFI) 11-2C-130J, C-130J Operations Procedures Vol. 3, §14.5.14, December 8, 2009.
———, Air Force Instruction (AFI) 11-2KC-10, KC-10 Operations Procedures, Vol. 3, §14.2.3, August 30, 2011a.
———, Air Force Instruction (AFI) 11-2C-17, C-17 Operations Procedures, Vol. 3, §6.25.1, November 16, 2011b.
———, Air Force Instruction (AFI) 11-2C-5, C-5 Operations Procedures, Vol. 3, §14.2.3, February 24, 2012a.
———, Air Force Instruction (AFI) 11-2C-130, C-130 Operations Procedures, Vol. 3, §14.2.5, April 23, 2012b.
Serbu, Jared, “Air Force Meets Fuel Efficiency Goal Several Years Early,” FederalNewsRadio.com, March 22, 2013. As of February 24, 2014: http://www.federalnewsradio.com/395/3259612/Air-Force-meets-fuel-efficiency-goal-several-years-early
Smith, Brian R., Patrick J. Yagle, and John R. Hooker, “Reduction of Aft Fuselage Drag on the C-130 Using Microvanes,” 51st AIAA Aerospace Sciences Meeting including the New Horizons Forum and Aerospace Exposition, Grapevine, Tex., January 7–10, 2013. As of February 26, 2014: http://arc.aiaa.org/doi/abs/10.2514/6.2013-105
Smith, Kyle, “Fuel Efficiency Initiatives,” Lockheed Martin Advanced Development Programs, undated. As of August 30, 2013: http://www.lockheedmartin.com/content/dam/lockheed/data/aero/documents/global-sustainment/product-support/2012HOC-Presentations/Wednesday/Wed%201600%20Fuel%20Efficiency%20Initiatives-Kyle%20Smith.pdf
Smoot, Harold, “AWBS: Automated Weight & Balance System,” Lockheed Martin Corporation, undated.
Stibbe, Matthew, “U.S. Air Force Will Save $50M with iPad Electronic Flight Bags,” Forbes, May 30, 2013. As of February 25, 2014: http://www.forbes.com/sites/matthewstibbe/2013/05/30/u-s-air-force-will-save-50m-with-ipad-electronic-flight-bags/
Sturkol, Scott T., “Energy Awareness: AMC Fuel Efficiency Office Shows How ‘Efficiency Promotes Effectiveness,’” Air Mobility Command Public Affairs, January 4, 2011. As of

24
February 24, 2014: http://www.af.mil/DesktopModules/ArticleCS/Print.aspx?PortalId=1&ModuleId= 850&Article=114505
United Airlines, “Environmental Sustainability at United,” November 2011. As of February 25, 2014: https://www.united.com/web/format/pdf/globalcitizenship/22161_eco-skies_Overview_v4.pdf
Vortex Control Technologies, “Finlets Technology—Applicable Aircraft: C130 /L100 Hercules,” 2012a. As of February 26, 2014: http://www.vortexct.com/products/finlets/aircraft/c130l-100-hercules/
———, “2013 Program Price List,” 2012b. As of February 26, 2014: http://www.vortexct.com/products/finlets/aircraft/c130l-100-hercules/
Warwick, Graham, “Lockheed Developing Winglets for C-130, C-5,” Aerospace Daily & Defense Report, October 6, 2011, p. 3.
———, “How Many Bin Bags to Empty an A340?” Aviation Week, blog post, March 20, 2013. As of February 24, 2014: http://www.aviationweek.com/Blogs.aspx?plckPostId=Blog:7a78f54e-b3dd-4fa6-ae6e-dff2ffd7bdbbPost:596045d7-2aef-4b10-b9b5-bd78c93b351f

www.rand.org
RR-757/1-AF9 7 8 0 8 3 3 0 8 7 6 6 9
ISBN-13 978-0-8330-8766-9ISBN-10 0-8330-8766-5
51650
$16.50
PROJECT AIR FORCE