Embed Size (px)
Citation preview

2003 gtz OE [email protected]
THE SUB-SAHARAN AFRICA TRANSPORT POLICY PROGRAM (SSATP)
ANNUAL STAKEHOLDER’S MEETING 2003
FUEL Taxation-for Road and State financing –
-andVEHICLE TAXATION
- for urban roads and schools -
in AFRICAN Countries
KIGALI, RWANDA, MAY 25TH– 30TH 2003
Gerhard P. [email protected]
www.InternationalFuelPrices.com

22003 gtz OE [email protected]
Why fuel taxes are so important?
• Detailed studies reveal that an average of
10 US cent per liter Gasoline and Dieselare necessary to finance themaintenance of the road networkunder normal circumstances.
• Even the Rural Roadscan be financed
by 2 to 3 US centsper litre fuel (mostly administeredwithin a Road Fund with 20% to 30 % of the total expenditures).

32003 gtz OE [email protected]
3. International Fuel Prices3.1 Fuel Prices in Africa
as of 10 December 2002
Algeria22 (10) Libya
10 (8)
Tunisia29 (19)
Egypt19* (8)
Morocco87 (55)
Mauritania63 (39) Mali
69 (55) Chad79 (77) Sudan
30* (24)
Ethiopia52* (32)
Kenya70 (56)
Uganda83 (80)
CongoDem. Rep.
70 (69)Tanzania
67 (61)
Zimbabwe5 (5)
Madagascar108 (65)
South Africa43 (40)
Botswana41 (38)
Namibia45 (43)
Angola19* (13)
Mozambique46 (43)
Malawi66* (62)
Congo Rep.69 (48)
Cameroon68* (57)
Nigeria20 (19)
Burkina Faso83 (62)
Sengal75 (53)
Guinea66* (56)
SierraLeone51* (50)
Gabon69 (53)
CentralAfrican Rep.
100 (87)
Djibouti98 (54)
Eritrea36* (25)
Rwanda84* (84)
Coted‘Ivoire85 (60)
Ghana28 (23)
Zambia72 (60)
Note:
1. Figures indicate price at petrol station incl. VAT forsuper gasoline (diesel in brackets) in US Cents per litre. At the time of survey the world market price forcrude oil was 26 US $ / barrel „Brent“.
Swaziland1
47* (44)
Lesotho1
50* (47)
Somalia35* (29)
Niger77 (55)
“Normal Sales Price (excluding fuel taxation)”Value Added Tax of 10 – 20 % for the Normal Sales PriceRefinery and distribution costs; Industry and dealer marginsCrude oil price (26 US$ / 159 litre)
32 (30 – 35)
3 – 611 – 13
16
Super GasolineUS Cents per litre
31 (29 – 34)=3 – 6+
10 – 12+16
DieselUS Cents per litre
2. Cross check on cost recovery of fuel prices:
Super Gasoline Pricein US Cents per litre
South Africa43 / (40) Diesel Price
in US Cents per litre
Reading Sample:
Fuel** neither subsidizednor specially taxed
Fuel** taxation for road and transport financing
Fuel** pricessubsidized
** Generalised as average between gasoline and diesel
* Normal grade gasoline, as super gasoline is notcommonly available in the country
1 Figures are of Dec 2000
Gambia46* (40) Togo
56 (46) Benin54 (41)
Burundi58* (54)
[Source: Metschies, gtz survey Dec. 2002]

42003 gtz OE [email protected]
3. International Fuel Prices3.1.1 Comparison of Fuel Prices in Africa
as of 10 December 2002
Diesel[US Cents per Litre]
Super Gasoline[US Cents per Litre]
10 Libya5 Zi babwe
19* Angola19* Egypt, Arab Rep.20* Nigeria22 Algeria
28 GhanaTunisia
35 Somalia30* Sudan
36* Eritrea
43 South Africa41 Botswana
46 Mozambique45 Namibia
46* Gambia, The51* Sierra Leone52* Ethiopia54 Benin56 Togo58* Burundi
63 Mauritania66* Malawi66* Guinea67 Tanzania68* Cameroon69 Mali69 Gabon69 Congo, Rep.70 Congo, Dem. Rep.70 Kenya72 Zambia
75 Senegal77 Niger79 Chad
83 Uganda83 Burkina Faso84* Rwanda85 Cote d'Ivoire87 Morocco
98* Djibouti100 C.A.R.
108 Madag.
Libya 8Zimbabwe 5
Angola 1Egypt, A ab Rep. 8
Nigeria 19lgeria 10
Ghana 23Tunisia 19
Sudan 24Somalia 2
Eritrea 25Botswana 38
South Africa 40
Mozambique 43Gambia, The 40
Sierra Leone 50Ethiopia 32
Benin 41Togo 46
Burundi 54Mauritania 39
Malawi 62Guinea 56
Tanzania 61Cameroon 57
Mali 55Gabon 53
Congo, Rep. 48Congo, Dem.R. 69
Kenya 56Zambia 60
Senegal 53Niger 55
Chad 79Uganda 70
Burkina Faso 62Rwanda 84
Cote d'Ivoire 60Morocco 55
Djibouti 54C.A.R. 87
Madagascar 65
Namibia 43
90 80 70 60 50 40 30 20 10 0 10 20 30 40 50 60 70 80 90 100 110
Red base lines:
Crude OilSpot Price
„Brent“(26 US$ per
barrel = 16 US Cents
per Liter)
Green base lines:
Normal Sales Price(excluding Fuel Taxation)
(31-32 US Cents per Liter)
* Normal grade gasoline, as super gasoline is not commonly available in the country
r
A
9
29
3
m
Note: The “Red Base Line” represents the world market price for crude oil (North Sea Brent) at Rotterdam port on 10th December 2002. This price is by chance roughly the average crude oil price during the year 2002.The “Green Base Line” represents the hypothetical sales price of the refined and distributed MINERAL FUEL, if it would be sold as a normal commercial good e.g. MINERAL WATER. Therefore the green line marks the border between fuel subsidy & taxation. In the case of self-producing oil-countries this green line is supposed to be valid as well: Assuming that the oil production could have been sold abroad, fuel prices are subsidised at the expense of the country’s energy sector.
[Source: Metschies, gtz survey Dec. 2002]

52003 gtz OE [email protected]
3. International Fuel Prices3.1.3 Detailed Time Series of Fuel Prices in Africa
1991 – 2002 (from Eritrea to Ghana)
Diesel[US Cents per Litre]
Super Gasoline[US Cents per Litre]
Eritrea
Ethiopia
Gabon
Gambia, The
Ghana
[Sources: GTZ Fuel Price Surveys, 1991, 1993, 1995, 1998, 2000, 2002
Note: The graphs above show actual prices paid
The “Red Base Line” represents the world market price for crude oil (North Sea Brent) at Rotterdam port at time of survey.
The “Green Base Line” represents the hypothetical “Normal Sales Price” of the refined and distributed MINERAL FUEL, if it would be sold as a normal commercial good e.g. MINERAL WATER. Therefore the green line marks the border between fuelsubsidy and fuel taxation. In the case of self-producing oil-countries this green line is supposed to be valid as well: Assumingthat the oil production could have been sold abroad, fuel prices are subsidised at the expense of the country’s energy sector.
29 19 23 33 25
020406080
100120140
1991 1993 1995 1998 2000 2002
50 40 3756
36
020406080
100120140
1991 1993 1995 1998 2000 2002
14 19 24 25 27 32
020406080
100120140
1991 1993 1995 1998 2000 2002
8370
39 3753
020406080
100120140
1991 1993 1995 1998 2000 2002
118 116
63 5369
020406080
100120140
1991 1993 1995 1998 2000 2002
27 26 32 36 46 52
020406080
100120140
1991 1993 1995 1998 2000 2002
52 4863
47 40
020406080
100120140
1991 1993 1995 1998 2000 2002
73 6783
6446
020406080
100120140
1991 1993 1995 1998 2000 2002
43 4533 30 19 23
020406080
100120140
1991 1993 1995 1998 2000 2002
53 5338 32
20 28
020406080
100120140
1991 1993 1995 1998 2000 2002

62003 gtz OE [email protected]
3. International Fuel Prices3.5.2 Super Gasoline Prices in 165 Countries
as of 10 December 2002
20 40 60 80 10032 120 140
Switzerland 89
Senegal 75
Congo, Dem. Rep. 70Lithuania 69
Cameroon 68*Tanzania 67Malawi 66*Guinea 66*
Lebanon 65Costa Rica 64
Mexico 62
Estonia 58Burundi 58*
New Zealand 55Brazil 55
Benin 54Papua New Guinea 53
Sierra Leone 51*Canada 51
Belarus 50
Uruguay 46*
Botswana 41Trinidad and Tobago 40
Tajikistan 36Lao PDR 36
Russian Federation 35
Vietnam 34*
Saudi Arabia 24
China 42
Germany 103
Ireland 90
Albania 80*Greece 78
Slovenia 76
Slovak Republic 74Macao, China 73
Latvia 70
Congo, Rep. 69
Honduras 63
Cape Verde 59
Togo 56Paraguay 56
Haiti 54
Jordan 52Ethiopia 52*
Dominican Republic 49Ukraine 47
Gambia, The 46*Namibia 45
Colombia 44*
Uzbekistan 38
Malaysia 35
Oman 31Sudan 30*
Argentina 30Tunisia 29
Indonesia 27
Yemen, Rep. 21*Nigeria 20*
66* Nepal68 Bulgaria
69 Bolivia69 Gabon
69 Mali70 Kenya
72 Zambia74 Bosnia and Herzegovina
74 Serbia & Montenegro76 Luxembourg
France 105Sweden 106
Denmark 109Finland 112
Iceland 116 118 United Kingdom123 NorwayGuatemala 123
Hong Kong, China 147
77 Niger79 Chad
81 Czech Republic83 Cyprus83 Spain
84 Austria85 Cote d'Ivoire
85 Singapore87 Morocco89 Liechtenstein
90 Cuba90 Israel
91 Japan97 Portugal
99 West Bank and Gaza
112 Netherlands109* Korea, South
108 Madagascar105 Italy
104 Belgium102 Turkey
Djibouti 98*Hungary 94
Sao Tomé and Principe 90
Egypt, Arab Rep. 19* 19* AngolaLibya 10 7 Iran, Islamic Rep. 5 Zimbabwe5* Venezuela, RB2 Turkmenistan2 Iraq
Burkina Faso 83Poland 83
Uganda 83Rwanda 84*
Macedonia 85Malta 87Croatia 89
Ecuador 130
Central African Republic 100
66 India66 Barbados
64 Romania63 Mauritania
63 Cambodia61 Taiwan
58 Nicaragua58 Chile58* Bhutan
56 Suriname56 Antigua and Barbuda
55 Korea, North54 Sri Lanka
54 Grenada53 Syrian Arab Republic
52 Pakistan52 Jamaica52 Bangladesh
51 Panama50 Lesotho
50 Australia48 Georgia
47 Swaziland46 Mozambique46 El Salvador
45 Moldova43 South Africa
42 Armenia40 United States
39 Kyrgyz Republic38 Mongolia
36 Thailand36* Myanmar36* Eritrea
35 Philippines35 Kazakhstan
34 Afghanistan31 Guyana
30 Brunei29 United Arab Emirates
28 Ghana27 Bahrain
22 Algeria21 Peru
20 Kuwait
Azerbaijan 37
Category IGasoline prices below„Normal Sales Price(excluding Fuel Tax)“
Category IIGasoline prices below
or at US level
Category IIIGasoline prices between
US level andminimum EU level
Category IVGasoline prices at
EU and Japan level
[Average Consumer Prices at Highway Pump in US Cents per Liter for SUPER GASOLINE]160
[Source: Metschies, gtz survey Dec. 2002]
Note: The “Red Base Line” represents the world market price for crude oil (North Sea Brent) at Rotterdam port on 10th December 2002. This price is by chance roughly the average crude oil price during the year 2002.The “Green Base Line” represents the hypothetical sales price of the refined and distributed MINERAL FUEL, if it would be sold as a normal commercial good e.g. MINERAL WATER. Therefore the green line marks the border between fuel subsidy & taxation. In the case of self-producing oil-countries this green line is supposed to be valid as well: Assuming that the oil production could have been sold abroad, fuel prices are subsidised at the expense of the country’s energy sector.
* Normal grade gasoline, as super gasoline is not commonly available in the country
Red base line:
Crude OilSpot Price
„Brent“(26 US$ per
barrel = 16 US Cents
per Litre)
Green base line:
Normal Sales Price(excluding
Fuel Taxation)
(32 US Cents per Litre)
72003 gtz OE [email protected]
International Fuel PricesDiesel Prices in 165 Countriesas of 10 December 2002
[Average Consumer Prices at Highway Pump in US Cents per litre for DIESEL]20 40 60 80 100
Category IDiesel prices below„Normal Sales Price(excluding Fuel Tax)“
Category IIDiesel prices
belowor at US level
Category IIIDiesel prices between
US level andminimum EU level
Category IVDiesel prices at
EU and Japan level
80 France
71 Czech Republic
54 Burundi53 Nicaragua53 Gabon
51 Albania
44 Jamaica
43 Canada
39 Chile
38 Bhutan37 China
36 Belarus
29 Armenia
27 Guyana
25 Eritrea24 Sudan
18 Brunei18 Syria
29 Kazakhstan
33 New Zealand
34 Ukraine
39 United States
43 Namibia
46 Togo47 Mexico
55 Niger
59 Lithuania60 Zambia
48 Congo, Rep.
45 Cuba
32 Thailand
30 Lao PDR
52 W.Bank & Gaza
26 Oman25 Lebanon
10 Yemen14 Peru
16 Azerbaijan
20 Uruguay23 Ghana
31 Brazil
41 India41 Georgia
41 Suriname
44 Costa Rica
57 Romania56 Kenya56 Estonia
55 Mali
71 Sao Tomé & Princ.
19 Indonesia19 Nigeria
27 Vietnam
31 Sri Lanka
34 Papua New Guinea
38 Singapore
40 South Africa
62 Burkina Faso
27 Afghanistan
10 Saudi ArabiaAngola 13Argentina 15
Jordan 17Kuwait 18Bahrain 19
Malaysia 19Tunisia 19
Trinidad and Tobago 21Colombia 24Tajikistan 24
Kyrgyz Republic 25Russian Federation 25
Uzbekistan 26Dominican Republic 27
Philippines 27Myanmar 28
Bangladesh 29Haiti 30
U.A. Emirates 30Moldova 31
Ethiopia 32El Salvador 33
Nepal 34Paraguay 34
Pakistan 35Panama 36Mongolia 37Botswana 38
Cape Verde 39Mauritania 39
Gambia, The 40Benin 41
Grenada 41Korea, North 41
Bolivia 42Mozambique 43
Cambodia 44Cyprus 44
Swaziland 44Honduras 46
Lesotho 47Australia 48
Macao, China 50Taiwan 50
80 Belgium
Norway 118
70 Slovak Republic68 Poland
67 Slovenia66 Japan
65 Luxembourg63 Macedonia
62 Israel
1 Iraq1 Turkmenistan 2 Iran, Islamic Rep.5 Venezuela, RB 5 Zimbabwe8 EgyptLibya 8 10 Algeria
73 Austria74 Croatia
77 Hong Kong, ChinaFinland 80Ireland 80Germany 82
Hungary 85Central African Rep. 87
Guatemala 92
Turkey 78Chad 77
Bosnia and Herzeg. 74Spain 72
Portugal 71Uganda 70
Congo, Dem. Rep. 69Greece 68
Serbia & Montenegro 66Madagascar 65
Latvia 65Malawi 62Iceland 62
Tanzania 61Cote d'Ivoire 60
United Kingdom 12094 DenmarkSweden 96
Switzerland 93 93 Liechtenstein90 Ecuador
86 Italy84 Rwanda
81 Netherlands
Bulgaria 59Cameroon 57
Guinea 56Antigua & Barbuda 56
Morocco 55Djibouti 54
Senegal 53Malta 53
Barbados 53Korea, South 51
50 Sierra Leone
310 16
[Source: Metschies, gtz survey Dec. 2002]
Red base line:
Crude OilSpot Price
„Brent“(26 US$ per
barrel = 16 US Cents
per Litre)
Green base line:
Normal Sales Price(excluding
Fuel Taxation)
(31 US Cents per Litre)
Note: The “Red Base Line” represents the world market price for crude oil (North Sea Brent) at Rotterdam port on 10th December 2002. This price is by chance roughly the average crude oil price during the year 2002.The “Green Base Line” represents the hypothetical sales price of the refined and distributed MINERAL FUEL, if it would be sold as a normal commercial good e.g. MINERAL WATER. Therefore the green line marks the border between fuel subsidy & taxation. In the case of self-producing oil-countries this green line is supposed to be valid as well: Assuming that the oil production could have been sold abroad, fuel prices are subsidised at the expense of the country’s energy sector.

82003 gtz OE [email protected]
4. Fuel Taxation and State Financing
Different Fuel Policy of Oil EXPORTERS –NORWAY and TURKMENISTAN
118 US cents
123 UScents324 000 sq km
4.8 millionNorway
1 US cent2 US cents
488 000 sq km
4.5 millionTurkmeni-stan
Diesel priceGazolineprice
Surface area
inhabitants
Fuel Policy of Oil Importers –CUBA and ZIMBABWE
With the breakdown of the central command economy in Eastern Europe and the dissolution of the Council for Mutual Economic Assistance COMECON4 in June 1991 all countries – including member states as Cuba, Mongolia and Vietnam had to follow the principles of the market economy based on world market prices and on convertible currencies. This holds true specifically for the oil sector.
The Cuban solution is to transfer the new conditions from the government to the consumer, i.e. to ask the cuban individual consumer to pay his petrol in foreign currency (US $) at all filling stations in the country (gazoline for 90 US cents and diesel 45 cents). This is a viable solution, similar to the practice in many developing countries to pay all flight tickets even locally in US $. Thus the procurement of foreign currency (from what sources whatsoever) remains the task of the consumer.
The other solution is that of Zimbabwe. At the exchange rate of the parallel market, which indicates the real situation in the long run everywhere,
petrol sells in Zimbabwe at 5 US cents only per litre.The import of fuel was calculated at the tremendously overvalued local currency exchange rate and the consumer is benefiting the purchase of petrol at the “artificially” low prices: The incentive to smuggle it to neighbouring Zambia (with a litre price of 72 cents) is evident and the break-down of the system only a question of time.

92003 gtz OE [email protected]
4. Fuel Taxation and State Financing
4.3.1 Fuel Contribution to Total Tax Revenuesin 110 Countries
[Calculated Transport Fuel Taxation as % of Total Tax Revenues*]
Note: Current fuel taxation revenues have been calculated with a fuel consumption of 10 liter/100km for a passenger car and 25 liter/100km for a commercial vehicle. The average annual travel distance of passenger cars has been estimated at 10.000 km per year, if exact data are not available. The average annual travel distance for commercial vehicles has been estimated at 25.000 km per year (average of pick-up, truck and public service vehicles). Fuel taxation per litre has been estimated at sales price of 10th Dec. 2002 minus „Normal Sales Price (excluding fuel taxation)“. See calculations on the following pages.
Venezuela
-10% 0% 10% 20% 30% 40%
Iran, Zimbabwe Indonesia, Egypt, Bahrain Peru, Azerbaijan Argentina Tunisia, Ghana, Algeria Malaysia, OmanRussian Federation, United Arab EmiratesPhilippines, Vietnam, Tajikistan, Uruguay, Trinidad & Tobago, Bhutan
Colombia, Syria, Kazakhstan, Jordan, Kyrgyz RepublicThailand, Dominican Rep., Paraguay, Jamaica, Macao
United States, Brazil, Ethiopia, Singapore, Botswana, LuxembourgChina, Pakistan, Canada, Austria, Papua New Guinea, New Zealand, Namibia
Australia, Israel, LesothoS. Africa, Chile, Belgium, Belarus, El Salvador, Ireland, Panama, Swaziland
Sri Lanka, Netherlands, Sweden, Switzerland, GuineaIndia, France, Italy, Denmark, Norway, Slovenia, Iceland
Costa RicaMexico, Germany, Bolivia
Japan, Kenya, Cameroon, Finland, LebanonUnited Kingdom, Nicaragua, Moldova, Congo Republic
Ukraine, Spain, Senegal, Sierra Leone, Croatia, CyprusMorocco, Greece, Czech Republic, Slovak Republic
South Korea, ZambiaPortugal
Uganda Lithuania, Rwanda
Turkey, Georgia, Latvia, Burkina Faso
Ecuador, AlbaniaMadagascar
Guatemala Bulgaria
- 2 % -1 %
0 %1 %2 %3 %4 %5 %6 %7 %8 %9 %
10 %11 %12 %13 %14 %18 %19 %20 %21 % 22 % 24 % 31 % 33 % 34 % 36 %
- 8 %- 7 %
- 6 %- 5 %
- 4 %- 3 %
Poland, Romania, Cote d‘Ivoire, Hungary, Estonia
Reading Samples:
Indonesisa spends 6 % of its tax revenuesfor subsidising Fuel
Bulgaria receives 36 % of its tax revenues from fuel taxation
* Most recently available consolidated central government tax revenues from the International Monetary Fund are used. Currencies have been converted using the average exchange rate of the concerned fiscal year
[Sources: Verkehrstaschenbuch Aral 2002/2003, World Road Statistics IRF 2002, IMF Government Finance Statistics Yearbook 2002, Consultants Calculations]

102003 gtz OE [email protected]
4. Fuel Taxation and State Financing
4.3.2 Africa’s Fuel Taxation Revenues + Impact of a Fuel Price Increase of 10 US Cents/litre
Existing Fuel Subsidies represents 14% of all Tax Revenues*
EgyptMinus 6% (+3%)(subsidised)
Impact of a potential Tax Increaseof 10 US Cents/Litre represents 4 % of all Tax Rev.*
Reading Sample:
TunisiaMinus 3%(subsidised)
(+4%)
EgyptMinus 6%(subsidised)(+3%)
Morocco14% (+4%)
Ethiopia3% (+3%)
Kenya11% (+4%)
Uganda21% (+5%)
ZimbabweMinus 7%(subsidised)
(+3%)
Madagascar33% (+6%)
South Africa6% (+6%)
Botswana3% (+4%)
Namibia4% (+3%)
Lesotho5% (+3%)
Swaziland6% (+5%)
Zambia19% (+5%)
SierraLeone
13% (+7%)Cameroon11% (+4%)
Congo Rep.12% (+4%)
Coted‘Ivoire
18% (+4%)
Senegal13% (+4%)
Guinea7% (+2%)
Burkina Faso24% (+6%)
GhanaMinus 3%Subsidised(+4%)
Rwanda22% (+4%)
3 - 4 % potentialIncrease of Tax Revenues**1 – 2 % potential Increase of Tax Revenues**
5 % and more potentialIncrease of Tax Revenues**
** if fuel taxation will be raisedby 10 US cents per litre
AlgeriaMinus 3%(subsidised)
(+2%)
Note: Current and potential fuel taxation revenueshave been calculated with a fuelconsumption of 10 liter/100km for a passenger car and 25 liter/100km for a commercial vehicle. The average annualtravel distance of passenger cars has beenestimated at 10.000 km per year, if exactdata was not available. The average annualtravel distance for commercial vehicles has been estimated at 25.000 km per year. Detailed calculation data can be found in theAnnex.
* Most recently available consolidated central government tax revenues from the International Monetary Fund are used. Currencies have been converted using the average exchange rate of the concerned fiscal year (see Annex).
[Source: Verkehrstaschenbuch Aral 2002/2003, World Road Statistics IRF 2002, IMF Government Finance Statistics Yearbook 2002, World Bank World Economic Indicators 2003]

112003 gtz OE [email protected]
5. Loss of Fuel Revenues
Nigeria
BurkinaFaso
Coted‘Ivoire Togo
Ghana
Missing Fuel Harmonisation in GHANA –
In the late 1970s in GHANA fuel prices were 3-4 times as high as in neighboring French-speaking CFA countries. After Ghana’s economic break down of 1984 this ratio improved. But Ghana’s new situation as of 1991 run into difficulties as shown in the following table:
Gasoline Price
Diesel Price
GazolinePrice
Diesel Price
20021991
28235343Ghana
836210384Burkina Faso
8560124115Cote d’Ivoire
56468166Togo
US Cents per LitreCountry
1 Details can be found in the previous 2nd edition of Fuel Prices and VehicleTaxation, page 59
122003 gtz OE [email protected]
5. Loss of Fuel Revenues
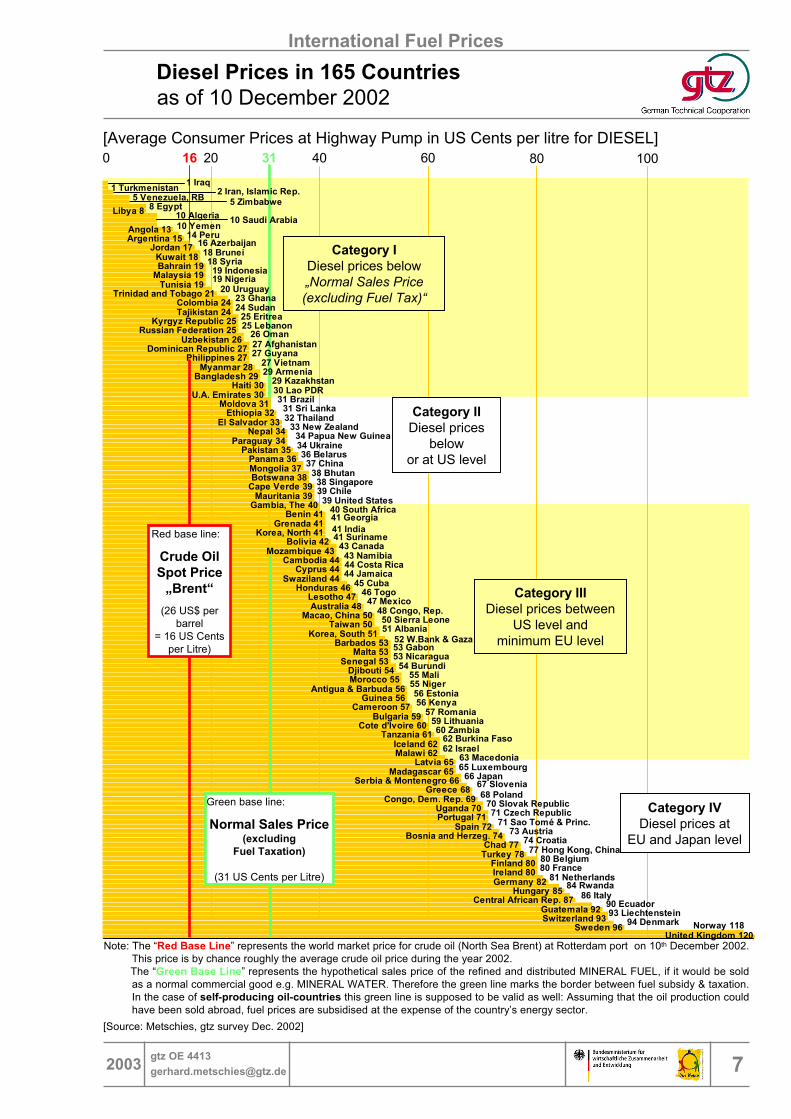
The most urgent cases for harmonisation and fuel price adjustments
1. NIGERIAs illicit fuel export affects direct neighbours as Cameroon, Niger, Benin and also its indirect neighbors as Central African Republic, Chad, Burkina Faso, Mali and Togo. Official fuel prices in all these countries are 3 - 4 times as high as in Nigeria. Although and because fuel prices are rising in Nigeria, an international harmonization should be reached before the Finance Ministry may profit from it as well.
2. ANGOLA – after the end of civil war –
experiences increased fuel smuggling into the neighbouring countries of Congo-Brazza, Congo-Kinshasa, Zambia and Namibia, where fuel prices on average are 4 times higher than in Angola. An increase of fuel prices in Angola would help also to balance the budget and lower the inflation.
3. GHANA – a long-standing tradition has to be given up, as low fuel prices destabilize all the neighbors budgets
In these cases all regional economies cooperation (as intended by ECOWAS, UDEAC, SADEC etc.) is stalled as long as the overdue harmonization of the fuel prices is not in place.

132003 gtz OE [email protected]
6. Social Sustainability of Fuel Price Policies6.3 Diesel Prices in Egg Equivalents
as of 10th Dec 2002
7,1 Korea, South
6,2 Brazil
4 Colombia3,8 Cuba
3,7 Mongolia
2,4 Indonesia
2 Ghana
0,3 Iran
1,2 Argentina
3,2 Uzbekistan
1,3 Brunei
2,1 Trinidad and Tobago
2,8 Panama3 Afghanistan
4,4 Cambodia
4,6 Philippines4,7 Mexico
3 Tajikistan
2,7 Malaysia
3,5 Gabon
1,7 Yemen, Rep.1,6 Myanmar
1,9 Nigeria
2,2 United Arab Emirates
4,6 Congo, Dem. Rep.4,5 Dominican Republic
4,4 Vietnam
4,1 Kazakhstan
6,4 Tunisia
1 Angola
1,5 Kuwait
4,8 Mozambique
0,2 Turkmenistan0,4 Venezuela
Libya 11,2 Saudi Arabia
Egypt 1,5Zimbabwe 1,5
Algeria 1,7Jordan 1,9
Azerbaijan 2Sudan 2Oman 2,2
Peru 2,3United States 2,4
Lebanon 2,8South Africa 2,9
Mauritania 3Australia 3,2
Congo, Rep. 3,2
6,8 Paraguay
Hong Kong 12,8
5,9 Chad5,8 Central African Rep.
5,5 Morocco5,4 Cote d'Ivoire5,2 Sri Lanka
5 Sierra Leone4,9 Costa Rica
6,5 Madagascar6,6 Honduras6,8 Malawi
Pakistan 7Somalia 7,1
Zambia 7,5Tanzania 7,6
Thailand 8Bolivia 8,4
Nepal 6,8Netherlands 6,7
West Bank and Gaza 6,5Ethiopia 6,5
Guinea 6,2Lao PDR 5,9Georgia 5,8
Greece 5,6Cyprus 5,5
Namibia 5,3Kenya 5,1
Russian Federation 5Bangladesh 4,9Cameroon 4,8
Togo 4,6
Uganda 13,9
10,4 IndiaHungary 10,6
Germany 9,18,9 Czech Republic
8,2 Ecuador7,7 Burundi
7,6 Rwanda7,5 China
Mali 4,6Senegal 4,5Belarus 4,5Japan 4,4
Armenia 4,2Burkina Faso 4,1
Chile 3,9Niger 3,7
Gambia, The 3,7Eritrea 3,5
3,2 Benin
0 1 2 3 4 5 6 7 8 9 10 11 12 13 14
[Number of Normal Eggs, equivalent to 1 litre Diesel]
Note: The „normal egg“ is calculated as the average of small and big hen eggs.No special-priced eco eggs are considered.
Reading Sample:
In GHANA 1 litre of diesel costs as
much as 2.0 hen eggs;
in GERMANY / Europe as 9.1 eggs and
in INDIA it costs as much as 10.4 eggs
[Source: Metschies, gtz survey Dec. 2002]

142003 gtz OE [email protected]
7. State Expenditures for Transport Sector out of Fuel Taxation
Financing the National Roads nearly exclusively out of Fuel Taxes
USA Federal Highway Trust Fund (HTF) (Receipts (billion of US $) during 34 years: 1960 – 1994,
incl. Interstate Highway System starting 1983)
(from: FHWA, “Our National Highways”, Washington 1998)
Most receipts from the Federal taxation of motor fuel, along with a number of other Highway-related taxes, are deposited in the Federal Highway Trust Fund. The Trust Fund is made up of two accounts – highway and mass transit – and is dedicated for the funding of Federal surface transportation programs. In this way, taxes on highway users are used to fund highway facilities. The Trust Fund has provided a stable funding source for highway programs since it was established in 1956.
1960 1965 1970 1975 1980 19840
5
10
15
20
Bill
ions
of U
S D
olla
rs
$18,106 Total Receipts
1,4382Interest Income 100.0 16,668 Total Tax Receipts 2.0 327 Tires 3.7 618 Heavy Vehicle Use 8.4 1,405 Trucks and Trailers (20.1) (3,349) Diesel and Other (5.1) (851) Gasohol (60.7) (10,117) Gasoline 85.9 $14,3171Motor Fuel
Percent of Total
Receipts ($1,000,000)
Source
1: Includes transfers of $2.008.000.000 to the Mass Transit Account.2: Includes $683,617,190 credited to the Mass Transit Account.

152003 gtz OE [email protected]
2. ANNUAL VEHICLE TAXATIONThe annual vehicle taxation is the second main source for
revenues from the transport sector.It may be collected monthly or annually. Often it is collected as a property tax rising
in line with the value of the car, or with the cubic centimeters of the engine or thehorsepower of the vehicle. Here a distinction between passenger cars, which use
the road SPACE mostly in towns and the heavy vehicles causing DAMAGE by destrowing the the main road network should be made.2.1 Annual Taxation for
heavy vehicles
• Annual Vehicle tax on HEAVY TRUCKS (using the maximum axle load of 10 tons) should be levied according to the damagethey cause to the road increasing by the4th power of the axle load. (Acc. to AASHOO Road Test)
• Therefore a 36 ton truck -trailer may becharged 20 times as much than a 10 ton truck and not only 3 or 4 times as it ismostly the case.
• Up to now nearly no African countryrealised this fact – with the exeption of Tunesia which is charging 12 times as much for heavy trucks compared with light trucks.
• This restructuring of heavy vehicletaxation according to “the user- pays- the-damage –principle“ is overdue in all theAfrican countries.

162003 gtz OE [email protected]
DRAFT of 1st April 2003
2.1 Truck Taxation in Africa
Taxes on Trucks in US $ per YearHeavy Trucks (32 tons or more Gross Vehicle Weight) Annual Taxes in US$
Medium Trucks (about 18 tons Gross Vehicle Weight) Annual Taxes in US$
Light Trucks (about 8 tons Gross Vehicle Weight) Annual Taxes in US$
Morocco 979 / 497 / 279
ReadingSample
Algeria100 / - / -
Tunisia600 / 360 / 52Morocco
979 / 497 / 279
Chad151 / 117 / 67
Kenya339 / 276 / 161
Uganda58 / 40 / 30
CongoDem. Rep.
767 / 689 / 633
Zambia- / - / 34
South Africa- / 131 / 65
Mozambique93 / 93 / 15
Ghana48 / 12 / 7
Gambia130 / 94 / 52
Togo0 / 0 / 0
Burkina Faso0 / 0 / 0
Madagascar414 / 197 / 70
Cote d‘Ivoire356 / 345 / 337
Ethiopia298 / 298 / 119
Tanzania0 / 0 / 0
Burundi- / 140 / 62
Rwanda939 / 593 / 241
200 – 700 US $Annual tax for heavy trucks
More than 700 US $Annual tax for heavy trucks
Less than 200 US $Annual tax for heavy trucks
Mali208 / 151 / 105
Cameroon336 / 194 / 156
Nigeria21 / 13 / 6
Malawi757 / 426 / 189
Benin210 / 210 / 57
Note:
Heavy Truck: 4 axles or more, mostly 400 HP
or 12000 ccm (40 liter per 100 km)
Medium Truck: 3 axles, 240 HP
or 6400 ccm (25 liter per 100 km)
Light Truck: 2 axles, 140 HP
or 4200 ccm (16 liter per 100 km)
[Source: Metschies, gtz survey Dec. 2002]

172003 gtz OE [email protected]
2.2 Annual Vehicle Taxation on passenger cars
• As most of the passenger cars are used in thecities anyway, taxation of passenger cars - basedon the road user principle - may pay for the spacethe use on urban roads.
• But nowadays - as the GTZ study on passencartaxation revealed – the car taxation in African countries is very low.In some countries like Gahnaor Tanzania and Ethiopia it is nearly zero, while in Tunesia only 120 US $ per year (10 $ per month) are levied.
• The car taxation in Africa (compared with 140 US $ p.a. in Greese, Italy and Turkey) is often less than10 to 30 % of that required – in comparison also with the price of the vehicle..
• Here also detailed studies are recommended, on order to find a stable source of finance for theurban roads in Africa.

182003 gtz OE [email protected]
DRAFT of 1st April 2003
Passenger Car Taxation in Africa
Taxation of Small Passenger Car in US$ p.a.
Algeria50
Tunisia120*
Egypt15
Morocco72
Niger31 Chad
51
Kenya31
Uganda20
CongoDem. Rep.
185
South Africa14
Mozambique26*
Sengal43
Rwanda40
Ghana2
Zambia30
50 – 200 US $Annual tax for small car
More than 200 US $Annual tax for small car
Less than 50 US $Annual tax for small car
Coted‘Ivoire
55*
Ethiopia0
Tanzania0
Mali52
Nigeria3
Cameroon23
Malawi33
Gambia18 Burundi
7
* Annual tax is reduced for older cars
[Source: Metschies, gtz survey Dec. 2002]

192003 gtz OE [email protected]
Annual Taxation for Passenger CarsBased on a comparative study by DEXIA on urban revenues in former Eastern
Block countries, a GTZ-study on urban road financing in a Central AsianRepublic showed, that the maintenance of Urban Roads can indeed be
financed by an annual vehicle tax, if it is earmarked for the urban roads. Moreover it may be possible to finance other social obligations of the cities as
elementary schools by the same tax also.
• If annual taxes on passenger cars at a sustainable level of6 to 16 $ per car per month or 75 – 200 US $ per year, are paid in urban areas,
• 50 % could be used for maintaining urban roads and
• 50% for the local urban elementary schoolsector
• Thus financing and building urban roadsand schools at the same time out of thisstable source of funds - as the vehicletaxation - may be the best way to help thepoor.
Thank you for listening.