Embed Size (px)
Citation preview

Fugro investor presentation
May 2018
www.fugro.com2
Cautionary statement
This presentation may contain forward-looking statements. Forward-looking statements are statements that are not historical facts, including (but not limited to) statements expressing or implying Fugro’sbeliefs, expectations, intentions, forecasts, estimates or predictions (and the assumptions underlying them). Forward-looking statements necessarily involve risks and uncertainties. The actual future results and situations may therefore differ materially from those expressed or implied in any forward-looking statements. Such differences may be caused by various factors including, but not limited to, developments in the oil and gas industry and related markets, currency risks and unexpected operational setbacks. Any forward-looking statements are based on information currently available to Fugro’smanagement. Fugro assumes no obligation to make a public announcement in each case where there are changes in information related to, or if there are otherwise changes or developments in respect of, the forward-looking statements in this presentation.
Investor presentation May 2018

www.fugro.com3
1. Company overview and strategy
2. Markets summary
3. Project examples
4. FY 2017 results
5. Outlook
Contents
Investor presentation May 2018

www.fugro.com4
Company overview and strategy
Investor presentation May 2018

www.fugro.com5
Fugro company overview
The world’s leading, independent provider of geo-intelligence and asset integrity solutions: Fugro acquires and analyses data on topography and the subsurface, soil composition, meteorological & environmental conditions, and provides related advice
With its services, Fugro supports the safe, efficient and sustainable development & operation of buildings, industrial facilities & infrastructure and the exploration & development of natural resources
Fugro works offshore and onshore, with around 10,000 people in 65 countries
Investor presentation May 2018
AcquisitionSpecialist data acquisition technology and services to investigate the Earth and assets
AnalyticsData management, processing, analysis, interpretation, visualisation and data hosting
AdviceCustomised consulting covering wide spectrum of geo-engineering and asset integrity
Revenue by market segment Business model

www.fugro.com6
Global trends drive demand for Fugro services
Over the coming decades, population growth, urbanisation and climate change will increase demand for energy, water, natural resources, buildings and infrastructure.Our purpose is to provide geo-intelligence and asset integrity solutions to contribute to meeting this demand and to create a safe and liveable world.
Investor presentation May 2018

www.fugro.com7
Essential data for sustainable construction and operation
Geo- and asset integrity data are essential for sustainable development and management of large constructions, infrastructure and natural resources. Fugro is one of the world’s largest inspection & consulting engineering companies collecting site information and providing advice to support building and infrastructure development.
Investor presentation May 2018

From conceptionto decommissioningOur clients needs smart, practical information.
Every step of the way, we provide them with geo-intelligence, to help ensure their assets a lifetime of excellent service.
Relevant, reliable, insightful information

www.fugro.com9
Marine and Land divisions organised in uniform business lines…
Since launch of Building on Strength strategy, Fugro has been transformed from a group of locally managed operating companies into an integrated organisation
Fugro now managed through 2 main divisions, Marine and Land, both offering integrated services to clients from uniform site characterisation and asset integrity business lines
Site characterisationDetermine ground andenvironmental conditionsof project sites
Asset integrityDetermine conditions of
existing constructionsand infrastructure
Operate & ManageBuildPlan & Design Decom-mission
Investor presentation May 2018

www.fugro.com10 Investor presentation May 2018
Client centric organisation
Has strengthened Fugro’s ability to effectively provide integrated, standardised solutions across the globe
Cost efficient organisation
Allows Fugro to capture further synergies by having all marine assets under central management structure; other assets regionally or globally pooled
Shared service centres in operation in largest hubs in USA, EU, Middle East, Asia and Australia
50 additional legal entities closed in 2017
Rationalisation of legal entity structure and implementation of shared service centres largely finalised in 2018
… resulting in more client centric and efficient organisation

www.fugro.com11
Organisational structure as of 2017
Innovation & Technology
Fugro NV
MarineLand Geoscience
5 regions
Site Characterisation
AssetIntegrity
Shared service centers for HR, finance, QHSSE, IT, legal
Seabed Geosolutions5 regions
Site Characterisation
AssetIntegrity
Investor presentation May 2018

www.fugro.com12
Clear market leadership in several market segments
Capability to deliver complete suite of services from data acquisition, analysis (processing, interpretation, visualisation and hosting) through to advice
Independent position, which assures clients of impartial data and advice
Vast expertise and experience of staff Local presence throughout the world, with 178
offices located in 59 countries Technology leadership through continuous
investment in R&D and innovation Capability to take on large integrated projects
and multi-year framework contracts Consistently delivering quality services safely,
meeting standards, on time and meeting or exceeding requirements
Multi-market exposure, creating resilience against market volatility
Market leading positions
Investor presentation May 2018

to offer unified support for large scale projects
Global network of offices andfacilities
10,000 employees169 offices16 R&D centres65 countries5 regions
Global network
Investor presentation May 2018

www.fugro.com14
68143 159 108
100
318 373 369 360
20101757
1172855
0
500
1000
1500
2000
2500
3000
FY14 FY15 FY16 FY17
6 4
36 9 7
712 16
21
24
78 7466
57
0%
10%
20%
30%
40%
50%
60%
70%
80%
90%
100%
FY14 FY15 FY16 FY17
Increasing importance of non-oil and gas markets
+ 9%
- 25%
Revenue - % of total Revenue – EUR (x million)
* until 2017, renewables included in power, and nautical in building & infrastructure
oil & gas building & infra renewables * power nautical * mining other
Y-o-Ycurrency
comparablerevenue
growth
Investor presentation May 2018

www.fugro.com15
Fugro’s activities across life cycle of offshore oil and gas field
Decom-missioning
Exploration & appraisal
Development planning
Field development
Production & maintenance
Inspection, repair and maintenance services
Drill support
Ocean bottom seismicsurveys
Geophysical survey
Construction support
Monitoring and forecasting
Geoconsulting
Geotechnical investigation
Ocean bottomseismic surveys
Final investment decision
Positioning
Drill support
Construction support
Investor presentation May 2018

www.fugro.com16
Fugro’ s activities across life cycle of offshore wind farm
Decom-missioningSite appraisal Design &
contracting Construction Operation & maintenance
Inspection, repair and maintenance services
Geophysical survey
Monitoring and forecasting
Geoconsulting
Geotechnical investigation
Final investment decision
Positioning
Construction support
Construction support
Investor presentation May 2018

www.fugro.com17
Fugro’s activities across life cycle of building and infrastructure project
Testing and monitoring
Asset integrity services
Geoconsulting
Construction support
Investor presentation May 2018
Decom-missioningSite appraisal Design &
contracting Construction Operation & maintenance
Final investment decision
Drilling servicesCone penetration testingGeophysical surveys
www.fugro.com18
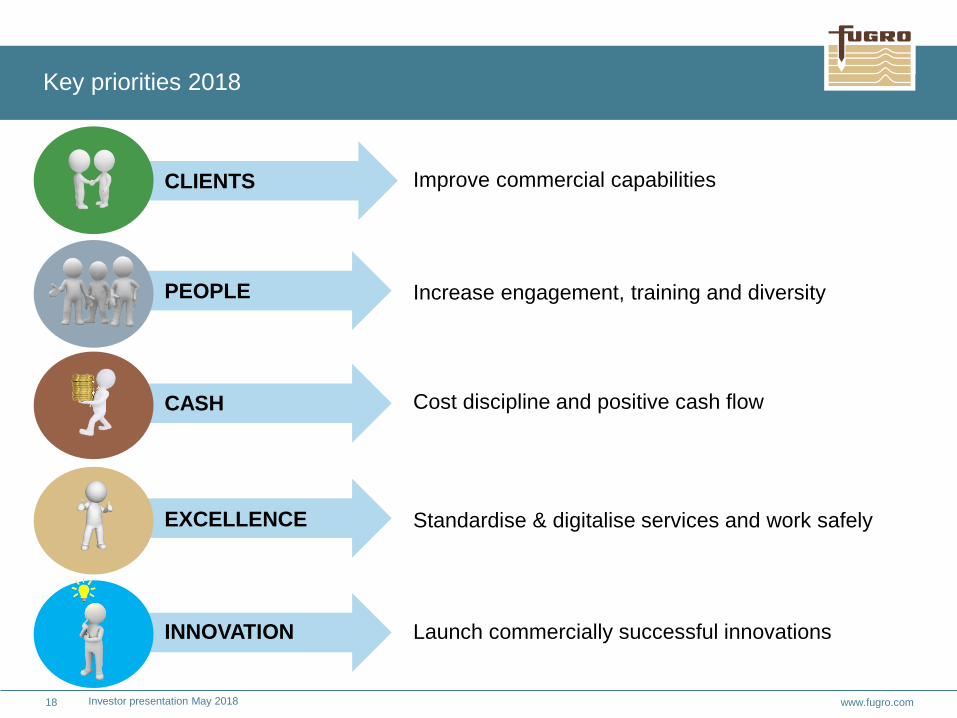
Improve commercial capabilities
Standardise & digitalise services and work safely
Launch commercially successful innovations
Increase engagement, training and diversity
Cost discipline and positive cash flow
CLIENTS
CASH
PEOPLE
EXCELLENCE
INNOVATION
Key priorities 2018
Investor presentation May 2018

We areFugroMarketsSummary

www.fugro.com20
+10% +1%
Key market developments 2018
World economy growth continues
Gradual but volatile increase in oil price expected
Offshore oilfield services market stabilising
Building & infrastructure investments growing
Offshore wind capital expenditure growing
Global growth Brent oil price
+15%
Offshore OFSexpenditure
Offshore wind capital expenditure
Metals & minerals price index
Buildings & Infrastructure expenditure
+4% -3%
+7%
Market forecast annual growth 2018
Investor presentation May 2018

www.fugro.com21
Global demand for energy growing
World economy continues to grow, impacting world energy demand
Demand for all energy sources expected to grow, except coal
Additional investments needed to meet energy demand growth
Source: IEA – World Energy Outlook 2017, 14 November 2017; IEA – World Energy Investment 2017, June 2017
2.3 3.0 3.7 3.8 3.8
3.74.0
4.1 4.3 4.52.1
2.42.7
2.9 3.2
0.7
0.7
0.70.7 0.8
1.3
1.4
1.61.9
2.2
10.0
11.5
12.913.6
14.3
0
20
40
60
80
100
0
3
6
9
12
15
2000 2005 2010 2015 2020e
GD
P: U
SD tr
illion
s
Ener
gy d
eman
d: th
ousa
nds
Mto
e
World energy demand and GDP
Coal OilGas NuclearRenewables World GDP output (RHS)
Investor presentation May 2018

www.fugro.com22
Offshore oil and gas competitive with shale
Large volumes of US shale oil available around US$ 55 / barrel
Shale is important factor for oil demand/supply balance as production can be developed in short time frame
Non-shale offers many lower cost opportunities but with higher upfront cost and longer lead times
Many oil companies continue to develop offshore opportunities
Source: Goldman Sachs – Top Projects 2017, 25 May 2017 Brent oil price as per 19 February 2018
Investor presentation May 2018
Cumulative peak oil production with range of breakeven for new developments

www.fugro.com23
317348 366
306244 218 206
0
100
200
300
400
500
600
2012 2013 2014 2015 2016 2017e 2018f
USD
billi
ons
Offshore OFS expenditures
Exploration Development Production Decommissioning
Onshore oilfield services growing, offshore stabilising
Onshore OFS expenditure growth driven by shale
Offshore OFS expenditure stabilising in 2018
Increase in sanctioned offshore FIDs in 2017 and 2018, expected to result in OFS growth from 2019 onwards
Source: Rystad Energy – UCube / DCube analysis, 19 February 2018
540577 598
452
351395 422
0
100
200
300
400
500
600
2012 2013 2014 2015 2016 2017e 2018f
USD
billi
ons
Onshore OFS expenditures
Conventional Shale Oil sands
18 306523 15
4370
68
40
115
176
0
50
100
150
200
2016 2017 2018e
USD
billi
ons
Sanctioned offshore FID capex
Subsea tie back Fixed Floater
Investor presentation May 2018

www.fugro.com24
1.7 1.8 1.8 1.8 1.9 2.0 2.1
2.7 2.7 2.7 2.3 2.3 2.4 2.6
3.23.6 3.9
3.8 3.94.1
4.4
0.60.7
0.70.7 0.7
0.70.7
8.48.9
9.38.8 8.9
9.410.1
0
2
4
6
8
10
12
2012 2013 2014 2015 2016 2017e 2018f
USD
trilli
ons
Buildings & Infrastructure construction expenditure by region
Americas Europe & Caspian Africa Asia-Pacific Middle East & India
Growth building & Infrastructure market
Source: Construction IC / Infrastructure IC – Custom data report, 15 February 2018
Investor presentation May 2018

www.fugro.com25
443573
159437
575375
592391
572 664
114
140
166
538
517
398
455
502417
527 575
299
608
1113
892990
852
11121195
0
200
400
600
800
1000
1200
2012 2013 2014 2015 2016 2017 2018 2019 2020 2021
Annual offshore wind turbine foundations entering construction
Europe North America Asia
Growth in offshore wind farms
Main markets for offshore wind are North-West Europe and China, and are expected to grow
Fugro involved in first North American, Taiwanese and Indian offshore wind farms
Offshore wind farms getting larger in terms of generation capacity, turbines increasing in size
Source: 4C Offshore – Project Opportunity Pipeline, 2 February 2018
5 5 4 4 7 8 9 10 11 13
2
24
5 66
78
5 6 5 6
1014 15
1619
22
0
2
4
6
8
10
0
5
10
15
20
25
2012 2013 2014 2015 2016 2017 2018 2019 2020 2021
GW
EUR
billi
ons
Annual offshore wind capital expenditure vs. annual capacity entering construction
Europe North America Asia Capacity (Annual)
Investor presentation May 2018

www.fugro.com26
Increasing investment in power plants and infrastructure
Global power demand is growing strongly, resulting in increasing power plant and infrastructure investments
Nuclear dominates power generation projects pipeline
Growing investments in electricity networks, driven by need to integrate new renewables-based generation, improve system reliability and replace ageing assets
0
200
400
600
800
1000
1200
USD
billi
ons
Power generation projects pipeline up to 2025
154 151 162 147 143 153 159
101 112 114 110 106 112 121
311 348 365 360 396458
52397
98 103 103 106114
122677 726 764 738 768
856945
0
200
400
600
800
1000
2012 2013 2014 2015 2016 2017e 2018f
Electricity and power plants expenditure
Americas Europe & Caspian Africa Asia-Pacific Middle East & India
Source: Construction IC / Infrastructure IC – Custom data report, 15 February 2018
Investor presentation May 2018

Project examples

www.fugro.com28
Real time5,000 sensors
GeoRiskPortal so far been used in 70+ projects world wide
Safe realisation and operation of tunnel in urban area
Rotterdamsebaan tunnel, the Hague
Monitoring of buildings and surface during construction
One of the largest monitoring systems ever developed in the Netherlands
GeoRiskPortal® presents results inreal-time to client and contractors
Broad use of Fugro’s capabilities: acquisition, analytics and advice
Client benefits
During construction: real time assessment of risks, more rapid decision making
During operation: reduces maintenance costs, extends life time, detects failure risks
Investor presentation May 2018

www.fugro.com29
Optimisation of foundation design for one of world’s tallest buildings
OptimisationAnticipated height: 928 metres
36,300 tons: world record for deepfoundation testing load, applied on a single barrette
Dubai Creek Tower
Fugro performed one of the most comprehensive geotechnical site investigations ever in the region
Additional load testing of proposed foundations
Client benefits
During design & construction: optimised foundation design, reduced construction costs and risks
During operation: monitor behaviour of foundations through fibre optic sensing
Investor presentation May 2018

www.fugro.com30
3D solution for precise and safe installation of offshore wind farm
Efficient & Accurate
Successful installation of 344 piles on 86 locations
Using approximately 50 sensorson installation frame
Beatrice wind farm
Fugro supported installation by acquiring data with real time analysis in specialised decision support survey system
Allowing the client to install the piles precisely and efficiently, and to support smooth installation of the jackets
Client benefits
Cost and risk reduction of pile and jacket installation
Enhanced safety by remote monitoring of installation
Investor presentation May 2018

FY 2017 results

www.fugro.com32
FY 2017 results in line with expectations
Strong progress strategic agenda:
activities regrouped into Marine and Land division, with uniform business lines more client centric and efficient organisation divestment non-core marine construction and installation business growing in other markets
Measures to reduce costs and improve performance on track and mostly implemented
Oil and gas market stabilising after challenging 2017; growth in other markets
Results expected to improve in 2018
Key take-aways
Investor presentation May 2018

www.fugro.com33
Financial highlights FY 2017
FY 2017 resultsContinued revenue decline
Negative cash flow after investments
Q-o-Q backlog growth
Low single digit EBIT loss
EBIT margin (before exceptional items)
2017
-2.1%
2016
0.5%
1.9 x2.2 x
12-month backlog
2017
- 51
2016excl. proceedsasset disposals
75
1,776 1,497
Revenue growth corrected for currency effect; 2017 backlog corrected for currency effect and for portfolio changes related to marine construction and installation activities
2017
1,497
2016
1,776
Dec. 2016 Dec. 2017
1,170
Sept. 2017
867 928
*
-13.2%*-7.3% *
+9.1% *
Investor presentation May 2018

www.fugro.com34
Another difficult year due to double digit decline in offshore oil and gas
Investor presentation May 2018
Revenue (currency comparable) Declines of 11.3% in Marine, 3.0% in Land and 55.7% in Seabed GeosolutionsEBIT (margin) excluding exceptional items Low utilisation APAC, price pressure and incidental operational issues in Marine division Improved profitability in Land division Low activity level Seabed GeosolutionsCapital employed Reduced due to lower working capital, capex below D&A, impaired deferred tax assets and exchange rate differencesCash flow Cash generated from operating activities insufficient to support 2017 investment level
* Currency comparable * * NOPAT last 12 months (applying domestic weighted average tax rate); capital employed average of last three reporting periods
excl. proceedsasset disposals
Revenue EBIT (margin)excluding exceptional items
Capital employed ROCE **excluding exceptional items
Cash flow
1,184
2016
1,341
2017 2017
- 3.3%
2016
- 0.7%
1,497
2016
1,776
2017 2017
- 2.1%
2016
0.5%
2016
- 51
2017
75 X EUR million
- 32
9
- 13.2%*

www.fugro.com35
EBIT decline in Marine and Geoscience divisions, Land improved
Investor presentation May 2018
excl. exceptional itemsX EUR million
9
- 31
Geoscience
- 32
2017Land
15
Marine
- 25
2016
One
-off
oper
atio
nal
bene
fit 2
016
- 11
- 20
One
-off
oper
atio
nal
bene
fit 2
017
6
9

www.fugro.com36
Strong cost reductions, yet insufficient to offset revenue decline
Investor presentation May 2018
excl. exceptional itemsX EUR million
- 32
9
38
Depreciation + amorisation
EBITFY 2017
FX
2
Other income and expenses
45
Personnel expenses
50
Third party costs
59
Revenue
- 235EBIT
FY 2016

www.fugro.com37 Investor presentation May 2018
Finalisation active involvement in marine construction & installation business
cable laying and trenching business divested
early termination of long-term charters of the 2 remaining construction and installation vessels
Significant improvement in charter terms 2 IRM vessels
Retirement of 2 old vessels in Q4
Headcount reduction in 2017 by 486 employees to 10,044 at year-end
Measures to reduce costs mostly implemented
EUR 20 million of financial benefit realised in H2 2017, EUR 40 – 50 million will contribute to 2018 EBITDA improvement
www.fugro.com38
Additional measures to restore profitability mostly implemented
Investor presentation May 2018
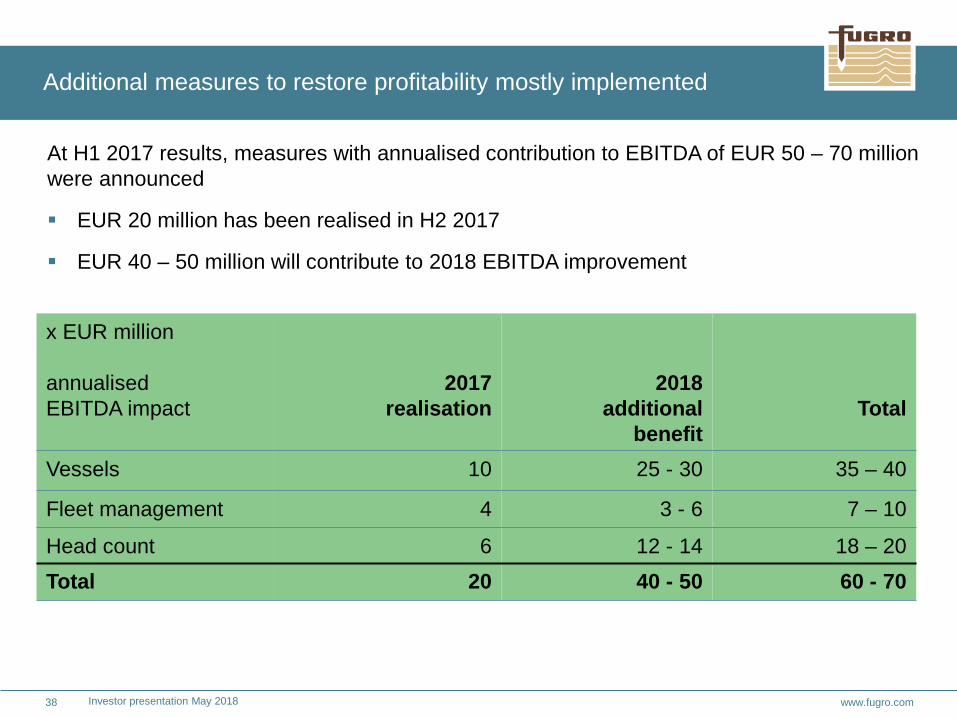
x EUR million
annualisedEBITDA impact
2017 realisation
2018 additional
benefitTotal
Vessels 10 25 - 30 35 – 40
Fleet management 4 3 - 6 7 – 10
Head count 6 12 - 14 18 – 20Total 20 40 - 50 60 - 70
At H1 2017 results, measures with annualised contribution to EBITDA of EUR 50 – 70 million were announced
EUR 20 million has been realised in H2 2017
EUR 40 – 50 million will contribute to 2018 EBITDA improvement
www.fugro.com39
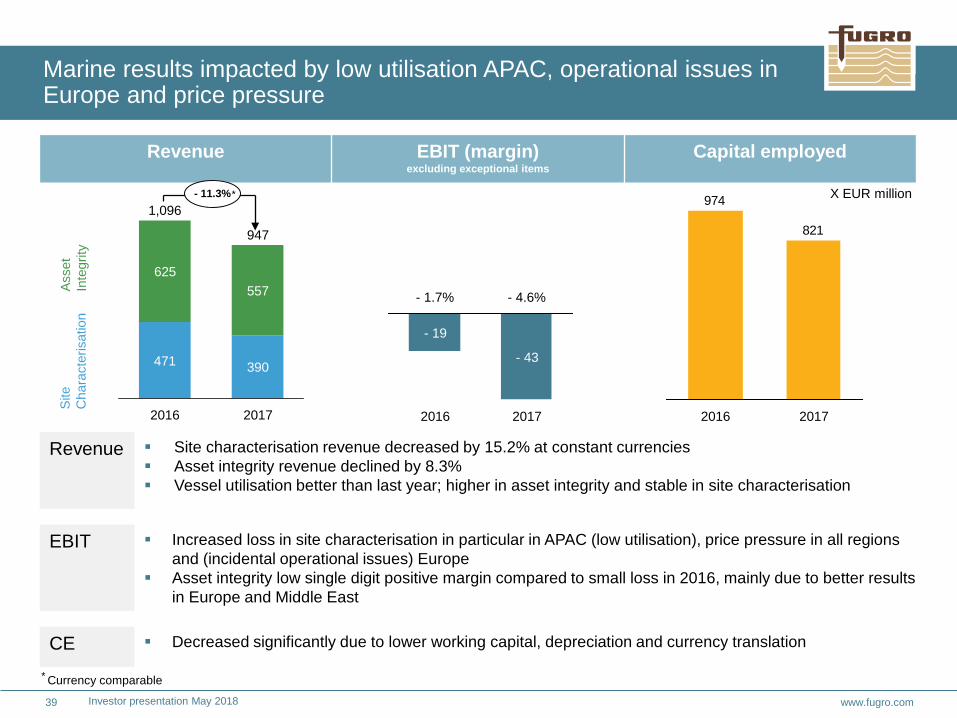
Marine results impacted by low utilisation APAC, operational issues in Europe and price pressure
Investor presentation May 2018
625557
390
2017
471
947
2016
1,096
- 19
2017
- 43
2016
821
974
20172016
- 1.7% - 4.6%
Revenue Site characterisation revenue decreased by 15.2% at constant currencies Asset integrity revenue declined by 8.3% Vessel utilisation better than last year; higher in asset integrity and stable in site characterisation
EBIT Increased loss in site characterisation in particular in APAC (low utilisation), price pressure in all regionsand (incidental operational issues) Europe
Asset integrity low single digit positive margin compared to small loss in 2016, mainly due to better results in Europe and Middle East
CE Decreased significantly due to lower working capital, depreciation and currency translation
Asse
t In
tegr
itySi
te
Cha
ract
eris
atio
n
Revenue EBIT (margin)excluding exceptional items
Capital employed
X EUR million - 11.3%*
* Currency comparable

www.fugro.com40
Improved profitability of Land division driven by growth in building & infrastructure and power
Investor presentation May 2018
7
15
2017
6
2016
219231
20172016
1.3%
4.5%
Revenue Strong decline oil and gas related revenue largely offset by growth other markets Site characterisation flat at constant currencies; higher revenue in Europe, Middle East and APAC offset
by finalisation large LNG projects in USA Asset integrity decreased by 12.5% as a consequence of reduced oil and gas infrastructure activity
EBIT Improvement reflects improved profitability in Middle East, Europe and APAC; reduced losses in Africa; and positive one-off operational effect of EUR 6.1 million
Site characterisation mid single digit EBIT margin, slightly better than prior year; asset integrity improved from high single digit loss to breakeven
CE Slight decrease due to improvement working capital
122 105
371385
2017
476
2016
507
One-off operationaleffect
*
* Currency comparable
Asse
t In
tegr
itySi
te
Cha
ract
eris
atio
n
Revenue EBIT (margin)excluding exceptional items
Capital employed
X EUR million - 3.0%*

www.fugro.com41
Seabed results impacted by low utilisation, despite good project performance
Investor presentation May 2018
173
74
740
1730
2017
-13.8%
1
2016
12.0%
11
4136
136
136
0
2017
145
9
2016
Revenue Seabed: Low utilisation, with only two crews active during 1HY and idleness from June to November
EBIT Seabed: despite exceptionally low utilisation, loss contained by robust operational project performance and further cost reductions
Seabed: Last years’ EBIT included positive one-off operational benefit of EUR 11.3 million, related to conversion of vessel charter into lease and purchase agreement
CE Seabed: higher working capital due to the later start of Lula project Other: includes EUR 22.5 million for indirect interests in Australian exploration projects, partly offset by
other provisions and payables* Currency comparable* * Indirect interests (via Finder Exploration) in Australian exploration projects
Seabed
Other * *
2016 2017
One-off operationaleffect
136
6
-11
*
Revenue EBIT (margin)excluding exceptional items
Capital employed
X EUR million - 55.7%*
www.fugro.com42
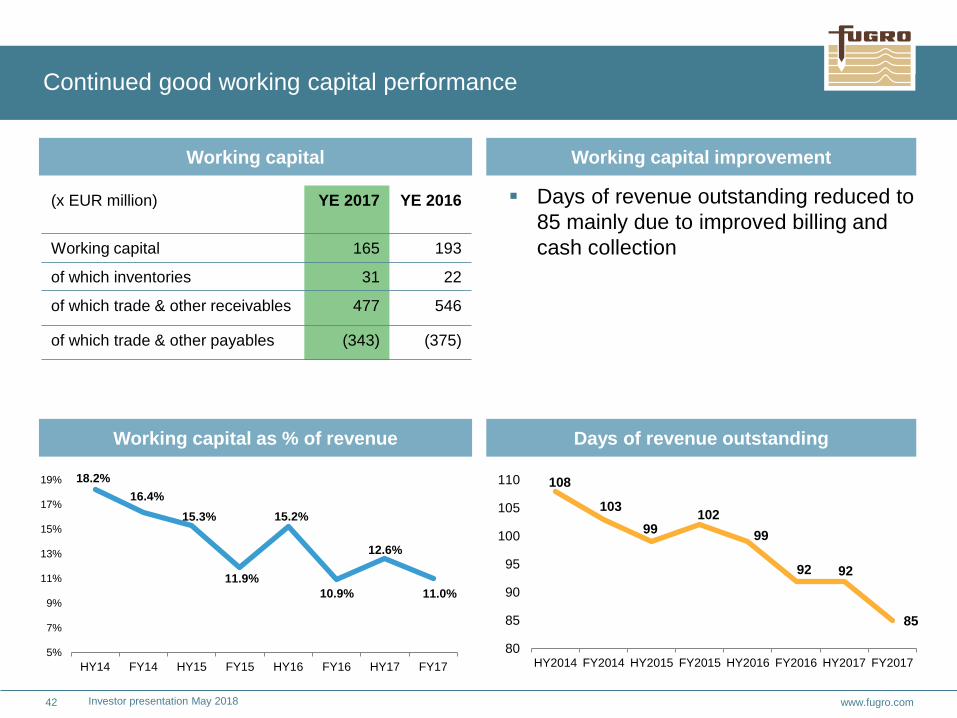
Continued good working capital performance
Investor presentation May 2018
18.2%16.4%
15.3%
11.9%
15.2%
10.9%
12.6%
11.0%
5%
7%
9%
11%
13%
15%
17%
19%
HY14 FY14 HY15 FY15 HY16 FY16 HY17 FY17
(x EUR million) YE 2017 YE 2016
Working capital 165 193
of which inventories 31 22
of which trade & other receivables 477 546
of which trade & other payables (343) (375)
Days of revenue outstanding reduced to 85 mainly due to improved billing and cash collection
Working capital improvement
Working capital as % of revenue Days of revenue outstanding
108
10399
10299
92 92
85
80
85
90
95
100
105
110
HY2014 FY2014 HY2015 FY2015 HY2016 FY2016 HY2017 FY2017
Working capital

www.fugro.com43
Well within covenants and good liquidity
Investor presentation May 2018
100
00
190
387
00
202320222021202020192018 2024
*
430427434351
467535734801
187
467
4q173Q17
267
2Q17
277
4Q16
198
2Q164Q152Q154Q14
Net debt (X EUR million)
Debt maturity per December 2017 (X millions, euro equivalents)
Net debtNet debt for covenant purposes*
* Will be lower than EUR 290 million when bond will be (partly) converted into equity
4Q16
2.4
3Q16
2.6
2Q16
2.5
4Q17
2.2
1Q16
2.8
4Q15
3.1
3Q15
2.9
2Q15
2.8
1Q15
3.1
4Q14
2.9
3Q17
1.9
2Q17
2.3
1Q17
2.3
1.6
3Q15
2.0
2Q15
2.0
1Q15
2.2
1Q17
1.3
4Q16
1.1
3Q16
1.8
2Q16
1.8
1Q16
1.7
4Q15 4Q17
1.9
3Q17
2.9
2Q17
2.2
4Q14
2.2
Net debt/EBITDA
Fixed charge cover
revolving credit facility
subordinated convertible
bond 2016
subordinated convertible
bond 2017
* Difference between net debt and net debt for covenant purposesrelates to debt component of convertible bonds
*≥ 1.8 covenant
≤ 3.0 covenant

Q1 2018 trading update & outlook

www.fugro.com45
First year-on-year revenue and backlog growth since 12 quarters
Offshore oil and gas market stabilising
Non-oil and gas markets, mostly building & infrastructure and offshore wind, continue to develop positively
Margin improvement still limited due to oversupply and consumption of down cycle backlog
Continued focus on price improvement, cost control and positive cash flow generation
Results 2018 expected to improve compared to 2017
Financial highlights Q1 2018
Investor presentation May 2018

www.fugro.com46
Backlog: first year-on-year increase after 12 quarters of decline
959 917 795 797 727 676 647 720 655 606 508 545
418 382334 371 368 335 343 357 341 299 280 274
588
272
213208233
1.05256
4Q16
1,17093
3Q16
1,05565
2Q16
1,06554
1Q16
1,17681
4Q15
1,323155
971
1,342
2Q15
1,507
1Q15
1,610
66 104
3Q17
867
2Q17
79
1Q17
964
1Q184Q17
109928
3Q15* Corrected for currency effect (of around – 9% year-on-year) and for portfolio changes related to divestment of marine construction & installation activities in 2017Marine Land Geoscience
7.7%*6.1%*
12 month backlog Comparable growth*
(x EUR million) 1Q17 4Q17 1Q18 Y-on-Y Q-on-Q
Site characterisation Marine 240 212 247 12.5% 18.5%
Asset integrity Marine 415 333 341 6.5% 4.4%
Marine 655 545 588 8.9% 9.9%
Site characterisation Land 270 203 204 (16.7%) 2.2%
Asset integrity Land 71 71 68 4.7% (0.9%)
Land 341 274 272 (12.2%) 1.4%
Geoscience (Seabed) 56 109 104 116.7% (0.9%)
Total 1,052 928 964 7.7% 6.1%
Investor presentation May 2018

www.fugro.com47
Outlook 2018
General market developments
stabilising oil and gas environment
continued growth in building & infrastructure and renewables markets
Fugro outlook 2018
revenue growth
improved EBIT margin
positive cash flow from operating activities after investments
capex of around EUR 80 million
Investor presentation May 2018

Questions?CONTACT CATRIEN VAN BUTTINGHA, DIRECTOR IR: [email protected]