Embed Size (px)
Citation preview

FUGRO TECHNICAL SERVICES LIMITED
Fugro Development Centre, Tel : +852 2450 8233 5 Lok Yi Street, Tai Lam, Fax : +852 2450 6138 Tuen Mun, N.T., E-mail : [email protected] Hong Kong. Website : www.fugro.com
The copyright of this document is owned by Fugro Technical Services Limited. It may not be reproduced except with prior written approval from the Company.
A Fugro Group Company
Page 1 of 19
Proposal of Scale down for the Water Quality Monitoring Stations during High Spots Removal at Sub-zone Z2B1, Z2B2 and Z2C1
Client : China International Water & Electric Corporation Project: Providing Sufficient Water Depth for Kwai Tsing
Container Basin and its Approach Channel – CV/2013/04
Report No.: 0394/13/ED/0370G
Project Proponent: Civil Engineering & Development Department 101 Princess Margaret Road, Homantin, Kowloon, Hong Kong.
Prepared by: Wingo So Reviewed by: Cyrus Lai
Certified by: Colin Yung
Environmental Team Leader for Fugro Technical Services Limited

FUGRO TECHNICAL SERVICES LIMITED
Fugro Development Centre, Tel : +852 2450 8233 5 Lok Yi Street, Tai Lam, Fax : +852 2450 6138 Tuen Mun, N.T., E-mail : [email protected] Hong Kong. Website : www.fugro.com
The copyright of this document is owned by Fugro Technical Services Limited. It may not be reproduced except with prior written approval from the Company.
A Fugro Group Company
Page 0 of 19
TABLE OF CONTENTS
1. INTRODUCTION 1
2. PURPOSE OF THIS PROPOSAL 1
3. METHODOLOGY OF REVIEW 2
4. RESULTS OF ANALYSIS 5
5. PROPOSED WATER QUALITY MONITORING PROGRAMME 8
6. OTHERS EM&A REQUIREMENT 10
7. THE EM&A PROGRAMME AFTER COMPLETION OF HIGH SPOTS DREDGING
AT Z2B1, Z2B2 AND Z2C1 10
FIGURES
Figure 1 Predicted High Spots Location and Expected Volume Figure 2 Locations of Water Quality Monitoring Stations
ANNEX Annex A Statistical Analysis of Reviewed Impact Monitoring Stations

FUGRO TECHNICAL SERVICES LIMITED
Fugro Development Centre, Tel : +852 2450 8233 5 Lok Yi Street, Tai Lam, Fax : +852 2450 6138 Tuen Mun, N.T., E-mail : [email protected] Hong Kong. Website : www.fugro.com
Page 1
The copyright of this document is owned by Fugro Technical Services Limited. It may not be reproduced except with prior written approval from the Company.
A Fugro Group Company
Page 1 of 19
1. INTRODUCTION
1.1 In order to provide sufficient depth of container basin and approach channel to Kwai Tsing Container Terminal (KTCT) for the safe navigation of Ultra Large Container Ships (ULCS), Environmental Permit (EP) No. EP-426/2011/A, was approved to commission the dredging works of approximately 4.0 million cubic metres of sediment from the seabed of Kwai Tsing Container Basin, as well as portions of Northern Fairway and Western Fairway (hereafter referred to as the “Project”). The project proponent was the Civil Engineering & Development Department, HKSAR (CEDD). China International Water & Electric Corporation Limited (CIWE) was appointed as the main Contractor for the aforesaid dredging works under CEDD Contract No. CV/2013/04 (hereafter referred to as the “Contract”)
1.2 The dredging works was commenced on 23 April 2014. All dredging works under this Contract of the construction phase, included removal of hard materials in sub-zones Z2B1, Z2B2, Z2C1, Z2A1, Z2A2, Z2A3 and Z4A and the dredging works in Hotspot area and its buffer area in sub-zones Z2B1 and Z2B2 was substantially completed on 21 November 2017. The environmental monitoring and audit (EM&A) works of this Project was carried out in accordance with the EM&A Manual requirements in the Environmental Permit (EP) No. EP-426/2011/A, EM&A Manual (AEIAR-156/2010) and EM&A TIN (EPD Letter Ref: (34) in Ax(1) to EP2/N3/C/57Pt.7)). A final EM&A report was prepared in December 2017 and the EM&A programme for the Construction Phase was substantially completed in December 2017.
1.3 However, according to the Contractor, a hydrographic survey was conducted by the Marine Department during late 2017 and early 2018. The survey result showed that approximately 5200 m3 (in-situ volume) of high spots was discovered at Z2B1, Z2B2 and Z2C1. There may also be some other high spots discovered in “Portion B” (i.e. sub-zones Z5A, Z5B, Z5C, Z6A, Z6B, Z6C, Z6D, Z7 and Z8 stated in the EP-426/2011/A), which the location area and the volumes are still under review. Due to the aforementioned defect, CEDD appointed CIWE to resume the dredging programme for this Contract. This proposal covers construction phase dredging works for high spots removal in Portion A only.
2. PURPOSE OF THIS PROPOSAL
2.1 According to the Contractor, the scale of the upcoming dredging works of high spots at Z2B1, Z2B2 and Z2C1 will be approximately 5200 m3 (in-situ volume) in total, which is far below than the dredging scale which was mentioned in the EP, in which daily maximum dredging rate is 400 m3/ day, 950 m3/ day and 850 m3/ day at Z2B1, Z2B2 and Z2C1 respectively in dry season and 800 m3/ day, 1450 m3/ day and 1550 m3/ day respectively in wet season. In addition, based on the survey conducted in the approved EIA report and the previous survey done by the Contractor, the profile of sediment will be expected to be consisted of hard material, i.e. hard alluvium and rock, as such the formation rate of the sediment plume will be expected lower than the EIA prediction.
2.2 In accordance with Section 2.1.4 of the EM&A Manual, ET Leader shall propose updated monitoring locations and seek approval from the IEC and EPD in any case that the status and locations of water sensitive receivers and the marine activities may change. Based on the above reasons, Fugro Technical Services Limited (FTS) is appointed to propose a further reduction of some of the water quality monitoring stations after

FUGRO TECHNICAL SERVICES LIMITED
Fugro Development Centre, Tel : +852 2450 8233 5 Lok Yi Street, Tai Lam, Fax : +852 2450 6138 Tuen Mun, N.T., E-mail : [email protected] Hong Kong. Website : www.fugro.com
Page 2
The copyright of this document is owned by Fugro Technical Services Limited. It may not be reproduced except with prior written approval from the Company.
A Fugro Group Company
Page 2 of 19
resuming the marine construction works at Z2B1, Z2B2 and Z2C1 for this Contract. The predicted high spots locations and its expected volume are given in Figure 1.
2.3 This proposal will cover the prediction of water quality impact after resuming the marine construction works at Z2B1, Z2B2 and Z2C1 for this Contract, the proposed water quality monitoring programme, includes the changes of water monitoring stations and the rationales for the changes.
3. METHODOLOGY OF REVIEW
3.1 As aforementioned dredging works of high spots are only carried out at Subzones at Z2B1, Z2B2 and Z2C1. Sensitive receivers with farther distance from Z2B1, Z2B2 and Z2C1 would be expected to have less Project impact. With such assumption, the impact on SR2 and SR3 will be reviewed in this proposal. Though SR5 (Ma Wan, Fish Culture Zone) is the farthest existing sensitive receiver from Z2B1, Z2B2 and Z2C1, it will not be covered in this review study. The detailed information of the reviewed impact monitoring stations is summarized in Table 3.1. The locations of the reviewed impact monitoring stations are shown in Figure 2.
Table 3.1 Locations of Reviewed Impact Monitoring Stations
Water Monitoring Station Easting Northing
SR2 Casam, Gazetted Beach 825723.225 825334.784
SR3 Approach, Gazetted Beach 826960.152 825260.726
3.2 The review of this proposal is based on comparison of the past data in routine impact water quality monitoring which dredging works were involved at Z2B1, Z2B2 and Z2C1 (including the monitoring data of dredging works in Hotspot area and its buffer area, i.e. Sub-zones Z2B1 and Z2B2 stated in the EP-426/2011/A) (hereinafter referred to as “Data with Dredging”) with those data that no dredging works were carried out at any zones under the Project (hereinafter referred to as “Data with No Dredging”). Dates of monitoring data used for analysis are shown in Table 3.2. Data including dissolved oxygen (surface & middle) (DO (S&M)), dissolved oxygen (bottom) (DO (B)), turbidity, total suspended solids (SS), ammoniacal nitrogen (NH3-N) (In-situ) and (Lab), unionized ammonia (UIA) (In-situ) and (Lab) in SR2 and SR3 were compared separately in two seasons: dry season and wet season. Table 3.2 Period of Monitoring Data Used for Analysis
Mode of Monitoring
Data
Impact Station
for Analysis
Parameter for Analysis Season^ Dates of Data Used for Analysis
No. of Date of
Data
#With
Dredging SR2 & SR3
DO (S&M), DO (B),
Turbidity, SS, NH3-N (In-
situ), NH3-N (Lab), UIA
(In-situ), UIA (Lab)
Dry
2015: 21 Nov, 24 Dec 2016: 9 Jan 2017: 25 Feb, 4 Nov, 21 Nov
6

FUGRO TECHNICAL SERVICES LIMITED
Fugro Development Centre, Tel : +852 2450 8233 5 Lok Yi Street, Tai Lam, Fax : +852 2450 6138 Tuen Mun, N.T., E-mail : [email protected] Hong Kong. Website : www.fugro.com
Page 3
The copyright of this document is owned by Fugro Technical Services Limited. It may not be reproduced except with prior written approval from the Company.
A Fugro Group Company
Page 3 of 19
Mode of Monitoring
Data
Impact Station
for Analysis
Parameter for Analysis Season^ Dates of Data Used for Analysis
No. of Date of
Data
Wet
2015: 2 Jun, 3 Sep, 12 Sep, 26 Sep, 6 Oct 2016: 16 Apr, 4 Jun, 18 Jun, 2 Jul, 9 Jul, 12 Jul 2017: 20 Apr, 29 Apr, 6 May, 11 May, 25 May, 15 Jun, 17 Jun, 29 Jun, 1 Jul, 11 Jul, 18 Jul, 20 Jul, 1 Aug, 3 Aug, 10 Aug, 7 Sep, 21 Sep, 23 Sep, 28 Sep, 12 Oct, 19 Oct, 21 Oct, 26 Oct, 28 Oct, 31 Oct
36
With No Dredging
SR2 & SR3
DO (S&M), DO (B),
Turbidity, SS, NH3-N (In-
situ), NH3-N (Lab), UIA
(In-situ), UIA (Lab)
Dry
2015: 26 Dec, 29 Dec, 31 Dec 2016: 12 Jan, 14 Jan, 26 Mar, 29 Mar, 24 Dec, 27 Dec, 31 Dec 2017: 3 Jan, 7 Jan, 10 Jan, 14 Jan, 17 Jan, 19 Jan, 21 Jan, 23 Jan, 25 Jan, 27 Jan, 31 Jan, 2 Feb, 4 Feb, 7 Feb, 9 Feb, 11 Feb, 14 Feb, 16 Feb, 18 Feb, 21 Feb, 23 Feb, 28 Feb, 2 Mar, 4 Mar, 7 Mar, 9 Mar, 11 Mar, 14 Mar, 16 Mar, 18 Mar, 21 Mar, 23 Mar, 25 Mar, 28 Mar, 30 Mar, 2 Nov, 7 Nov, 9 Nov, 11 Nov, 14 Nov, 16 Nov, 18 Nov
52
Wet
2015: 4 Jun, 11 Jun, 14 Jul, 16 Jul, 18 Jul, 25 Jul, 1 Sep 2016: 2 Apr, 14 Apr, 3 May, 7 May, 2 Jun, 14 Jul, 16 Jul, 19 Jul, 21 Jul, 23 Jul, 26 Jul, 28 Jul, 30 Jul, 4 Aug, 6 Aug, 9 Aug, 11 Aug, 13 Aug, 16 Aug, 20 Aug 2017: 1 Apr, 4 Apr, 6 Apr, 8 Apr, 11 Apr, 13 Apr, 18 Apr, 22 Apr, 25 Apr, 27 Apr, 2 May, 4 May, 9 May, 13 May, 16 May, 18 May, 20 May, 23 May, 27 May, 30 May, 1 Jun, 3 Jun, 6 Jun, 8 Jun, 10 Jun, 20 Jun, 22 Jun, 24 Jun, 27 Jun, 4 Jul, 6 Jul, 8 Jul, 15 Jul, 18 Jul, 20 Jul, 22 Jul, 25 Jul, 27 Jul, 29 Jul, 5 Aug, 15 Aug, 17 Aug, 19 Aug, 22 Aug, 24 Aug, 26 Aug, 29 Aug, 31 Aug, 2 Sep, 5 Sep, 9 Sep, 12 Sep, 14 Sep, 16 Sep, 19 Sep, 30 Sep, 3 Oct, 5 Oct, 7 Oct, 14 Oct, 17 Oct, 24 Oct,
89
Remark: # Data with dredging refer to monitoring data which dredging works were involved at Z2B1, Z2B2 and Z2C1;
^ In accordance with the definition in EP-426/2011/A, Wet Seasons refer to April to October, Dry Seasons refer to November to March.
3.3 The average value of DO (S&M) and DO (B), turbidity, SS, NH3-N (In-situ) and (Lab),
UIA (In-situ) and (Lab) are compared. To assess the impact of dredging involved at Z2B1, Z2B2 and Z2C1, average value of “Data with Dredging” which greater than (or smaller than for DO) those “Data with No Dredging”, are further analysed by using Statistical Software “Pro UCL” (Version 4.0). Goodness-of-fit Test is used to test the

FUGRO TECHNICAL SERVICES LIMITED
Fugro Development Centre, Tel : +852 2450 8233 5 Lok Yi Street, Tai Lam, Fax : +852 2450 6138 Tuen Mun, N.T., E-mail : [email protected] Hong Kong. Website : www.fugro.com
Page 4
The copyright of this document is owned by Fugro Technical Services Limited. It may not be reproduced except with prior written approval from the Company.
A Fugro Group Company
Page 4 of 19
normality of the dataset. T-test or Wilcoxon-Mann-Whitney (WMW) Test is used to compare whether there is a significant difference between the “Data with Dredging” and “Data with No Dredging”. Details of statistical analysis setting are shown in Table 3.3 below: Table 3.3 Details of Statistical Analysis
Analysis Test Methods
Goodness-of-fit Test T-test (for dataset fits normal distribution)
Wilcoxon-Mann-Whitney (WMW) Test (for dataset does not fit normal distribution)
Shapiro Wilk Test (for sample size ≤ 50)
Lilliefors Test (for sample size > 50)
Test purpose
To test whether the dataset fits a normal distribution and to determine whether T-test (parametric) or Wilcoxon-Mann-Whitney Test (non-parametric) is used
To test whether the dataset fits a normal distribution and to determine whether T-test (parametric) or Wilcoxon-Mann-Whitney Test (non-parametric) is used
To compare whether there is a significant difference between the “Data with Dredging” and “Data with No Dredging”
To compare whether there is a significant difference between the “Data with Dredging” and “Data with No Dredging”
Variables For parameters with sample size ≤ 50
For parameters with sample size > 50
For parameters that fit normal distribution
For parameters that do not fit normal distribution
Cases Data with Dredging & Data with No Dredging
Data with Dredging & Data with No Dredging
Data with Dredging vs Data with No Dredging
Data with Dredging vs Data with No Dredging
Confidence coefficient
95% 95% 95% 95%
Null hypothesis (H0)
Data are not normally distributed
Data are normally distributed
Mean/Median of “Data with Dredging” less than or equal to Mean/Median of “Data with No Dredging”
Mean/Median of “Data with Dredging” less than or equal to Mean/Median of “Data with No Dredging”
Output results
Shapiro Wilk Test Statistic
Lilliefors Test Statistic P-Value P-Value
Conclusion Reject H0: - If Shapiro Wilk Test Statistic > Shapiro Wilk Critical Value (i.e. Dataset fits normal distribution if H0 is rejected)
Reject H0: - If Lilliefors Test Statistic > Lilliefors Critical Value (i.e. Dataset fits normal distribution if H0 is not rejected)
Reject H0: - If P-Value < 0.05 (i.e. Impact is significant if H0 is rejected)
Reject H0: - If P-Value < 0.05 (i.e. Impact is significant if H0 is rejected)

FUGRO TECHNICAL SERVICES LIMITED
Fugro Development Centre, Tel : +852 2450 8233 5 Lok Yi Street, Tai Lam, Fax : +852 2450 6138 Tuen Mun, N.T., E-mail : [email protected] Hong Kong. Website : www.fugro.com
Page 5
The copyright of this document is owned by Fugro Technical Services Limited. It may not be reproduced except with prior written approval from the Company.
A Fugro Group Company
Page 5 of 19
4. RESULTS OF ANALYSIS
4.1 Results of comparison of the historical data in routine impact water quality monitoring which dredging works were involved at Z2B1, Z2B2 and Z2C1 with those data that no dredging works carried out are summarized in Table 4.1 to Table 4.10. Detailed results of statistical analysis are presented in Annex A.
Table 4.1 Data Comparison between Dredging and No Dredging (DO (S&M))
Monitoring Station
Tide Mode
Average DO (S&M) mg/L
Dry Season Wet Season
No Dredging
Work
#With
Dredging Works
*Impact significant
(p<0.05)
No Dredging
Work
#With
Dredging Works
*Impact significant
(p<0.05)
SR2
Mid-Flood 6.95 6.71 No 6.00 5.83 No
Mid-Ebb 6.97 6.69 No 5.98 5.79 No
SR3
Mid-Flood 6.89 6.64 No 6.05 5.86 No
Mid-Ebb 6.90 6.57 No 5.99 5.80 No
Remark: # Data with dredging refer to monitoring data which dredging works were involved at Z2B1, Z2B2 and Z2C1;
*Statistical analysis was only conducted for average value of data with dredging is smaller than those data with no dredging. “No” significant impact refers to p>0.05 from the statistical analysis results.
Table 4.2 Data Comparison between Dredging and No Dredging (DO (B))
Monitoring Station
Tide Mode
Average DO (B) mg/L
Dry Season Wet Season
No Dredging
Work
#With
Dredging Works
*Impact significant
(p<0.05)
No Dredging
Work
#With
Dredging Works
*Impact significant
(p<0.05)
SR2
Mid-Flood 6.86 6.55 No 5.71 5.55 No
Mid-Ebb 6.88 6.54 No 5.69 5.51 No
SR3
Mid-Flood 6.83 6.47 No 5.71 5.57 No
Mid-Ebb 6.81 6.44 No 5.69 5.55 No
Remark: # Data with dredging refer to monitoring data which dredging works were involved at Z2B1, Z2B2 and Z2C1;
*Statistical analysis was only conducted for average value of data with dredging is smaller than those data with no dredging. “No” significant impact refers to p>0.05 from the statistical analysis results.

FUGRO TECHNICAL SERVICES LIMITED
Fugro Development Centre, Tel : +852 2450 8233 5 Lok Yi Street, Tai Lam, Fax : +852 2450 6138 Tuen Mun, N.T., E-mail : [email protected] Hong Kong. Website : www.fugro.com
Page 6
The copyright of this document is owned by Fugro Technical Services Limited. It may not be reproduced except with prior written approval from the Company.
A Fugro Group Company
Page 6 of 19
Table 4.3 Data Comparison between Dredging and No Dredging (Turbidity)
Monitoring Station
Tide Mode
Average Turbidity NTU
Dry Season Wet Season
No Dredging
Work
#With
Dredging Works
*Impact significant
(p<0.05)
No Dredging
Work
#With
Dredging Works
*Impact significant
(p<0.05)
SR2
Mid-Flood 1.9 2.8 No 2.4 3.0 No
Mid-Ebb 1.8 3.0 No 2.3 2.9 No
SR3
Mid-Flood 2.1 3.0 No 2.5 3.0 No
Mid-Ebb 2.0 3.0 No 2.4 2.9 No
Remark: # Data with dredging refer to monitoring data which dredging works were involved at Z2B1, Z2B2 and Z2C1;
*Statistical analysis was only conducted for average value of data with dredging is greater than those data with no dredging. “No” significant impact refers to p>0.05 from the statistical analysis results.
Table 4.4 Data Comparison between Dredging and No Dredging (SS)
Monitoring Station
Tide Mode
Average SS mg/L
Dry Season Wet Season
No Dredging
Work
#With
Dredging Works
*Impact significant
(p<0.05)
No Dredging
Work
#With
Dredging Works
*Impact significant
(p<0.05)
SR2
Mid-Flood 5.4 5.0 NA 4.5 4.6 No
Mid-Ebb 5.4 5.6 No 4.6 4.3 NA
SR3
Mid-Flood 6.3 5.3 NA 4.6 5.1 No
Mid-Ebb 6.1 6.5 No 4.6 5.0 No
Remark: # Data with dredging refer to monitoring data which dredging works were involved at Z2B1, Z2B2 and Z2C1;
* Statistical analysis was only conducted for average value of data with dredging is greater than those data with no dredging. “NA” refers to Not Applicable, meaning the average value of data with dredging is smaller or equal to those data with no dredging. “No” significant impact refers to p>0.05 from the statistical analysis results. Table 4.5 Data Comparison between Dredging and No Dredging (NH3-N (In-situ))
Monitoring Station
Tide Mode
Average NH3-N (In-situ) mg/L
Dry Season Wet Season
No Dredging
Work
#With
Dredging Works
*Impact significant
(p<0.05)
No Dredging
Work
#With
Dredging Works
*Impact significant
(p<0.05)
SR2
Mid-Flood 0.13 0.09 NA 0.08 0.07 NA
Mid-Ebb 0.13 0.09 NA 0.08 0.06 NA
SR3
Mid-Flood 0.14 0.09 NA 0.09 0.07 NA
Mid-Ebb 0.14 0.11 NA 0.09 0.08 NA
Remark: # Data with dredging refer to monitoring data which dredging works were involved at Z2B1, Z2B2 and Z2C1;
* Statistical analysis was only conducted for average value of data with dredging is greater than those data with no dredging. NA” refers to Not Applicable, meaning the average value of data with dredging is smaller or equal to those data with no dredging.

FUGRO TECHNICAL SERVICES LIMITED
Fugro Development Centre, Tel : +852 2450 8233 5 Lok Yi Street, Tai Lam, Fax : +852 2450 6138 Tuen Mun, N.T., E-mail : [email protected] Hong Kong. Website : www.fugro.com
Page 7
The copyright of this document is owned by Fugro Technical Services Limited. It may not be reproduced except with prior written approval from the Company.
A Fugro Group Company
Page 7 of 19
Table 4.6 Data Comparison between Dredging and No Dredging (NH3-N (Lab))
Monitoring Station
Tide Mode
Average NH3-N (Lab) mg/L
Dry Season Wet Season
No Dredging
Work
#With
Dredging Works
*Impact significant
(p<0.05)
No Dredging
Work
#With
Dredging Works
*Impact significant
(p<0.05)
SR2
Mid-Flood 0.13 0.09 NA 0.08 0.06 NA
Mid-Ebb 0.13 0.09 NA 0.08 0.06 NA
SR3
Mid-Flood 0.14 0.10 NA 0.08 0.07 NA
Mid-Ebb 0.14 0.11 NA 0.08 0.08 NA
Remark: # Data with dredging refer to monitoring data which dredging works were involved at Z2B1, Z2B2 and Z2C1;
* Statistical analysis was only conducted for average value of data with dredging is greater than those data with no dredging. NA” refers to Not Applicable, meaning the average value of data with dredging is smaller or equal to those data with no dredging. Table 4.7 Data Comparison between Dredging and No Dredging (UIA (In-situ))
Monitoring Station
Tide Mode
Average UIA (In-situ) mg/L
Dry Season Wet Season
No Dredging
Work
#With
Dredging Works
*Impact significant
(p<0.05)
No Dredging
Work
#With
Dredging Works
*Impact significant
(p<0.05)
SR2
Mid-Flood 0.006 0.004 NA 0.003 0.003 NA
Mid-Ebb 0.006 0.003 NA 0.004 0.003 NA
SR3
Mid-Flood 0.006 0.004 NA 0.004 0.003 NA
Mid-Ebb 0.006 0.004 NA 0.004 0.003 NA
Remark: # Data with dredging refer to monitoring data which dredging works were involved at Z2B1, Z2B2 and Z2C1;
* Statistical analysis was only conducted for average value of data with dredging is greater than those data with no dredging. NA” refers to Not Applicable, meaning the average value of data with dredging is smaller or equal to those data with no dredging.
Table 4.8 Data Comparison between Dredging and No Dredging (UIA (Lab))
Monitoring Station
Tide Mode
Average UIA (Lab) mg/L
Dry Season Wet Season
No Dredging
Work
#With
Dredging Works
*Impact significant
(p<0.05)
No Dredging
Work
#With
Dredging Works
*Impact significant
(p<0.05)
SR2
Mid-Flood 0.006 0.003 NA 0.003 0.002 NA
Mid-Ebb 0.006 0.004 NA 0.003 0.002 NA
SR3
Mid-Flood 0.006 0.004 NA 0.004 0.002 NA
Mid-Ebb 0.006 0.004 NA 0.004 0.003 NA
Remark: # Data with dredging refer to monitoring data which dredging works were involved at Z2B1, Z2B2 and Z2C1;
* Statistical analysis was only conducted for average value of data with dredging is greater than those data with no dredging. NA” refers to Not Applicable, meaning the average value of data with dredging is smaller or equal to those data with no dredging.
4.2 Base on the results of data comparison, no deterioration of NH3-N (in-situ) and (Lab), UIA (in-situ) and (Lab) were found at SR2 and SR3 due to the dredging works involved at Z2B1, Z2B2 and Z2C1.
4.3 Results of data comparison shown that during dredging works were involved at Z2B1, Z2B2 and Z2C1, DO (S&M) and DO (B) were slightly smaller at SR2 and SR3; while turbidity at SR2 and SR3 and some of the SS at SR2 and SR3 were slightly higher, than those with no dredging works were carried out. However, base on the statistical analysis

FUGRO TECHNICAL SERVICES LIMITED
Fugro Development Centre, Tel : +852 2450 8233 5 Lok Yi Street, Tai Lam, Fax : +852 2450 6138 Tuen Mun, N.T., E-mail : [email protected] Hong Kong. Website : www.fugro.com
Page 8
The copyright of this document is owned by Fugro Technical Services Limited. It may not be reproduced except with prior written approval from the Company.
A Fugro Group Company
Page 8 of 19
of SR2 and SR3, no significant impact (i.e. p>0.05) was shown due to the dredging works involved at Z2B1, Z2B2 and Z2C1.
4.4 Based on the analysis of the results, it is concluded that no project impact was found in SR2 and SR3 during dredging at Z2B1, Z2B2 and Z2C1 (including the dredging works in Hotspot area and its buffer area, i.e. Sub-zones Z2B1 and Z2B2 stated in the EP-426/2011/A). Therefore, SR2 and SR3 are proposed to be removed during dredging works for high spots removal at Z2B1, Z2B2 and Z2C1 only.
5. PROPOSED WATER QUALITY MONITORING PROGRAMME
5.1 The proposed remaining water quality monitoring stations for routine water monitoring and 24-hours water quality monitoring are presented in Table 5.1 and Table 5.2. The locations of the remaining water quality monitoring stations are illustrated Figure 2. Table 5.1 Proposed Water Quality Monitoring Stations for Routine Water Quality Monitoring
Water Monitoring Station Easting Northing
SR4 Tsuen Wan, WSD Flushing Water Intake 829270.482 825382.994
SR5 Ma Wan, Fish Culture Zone 823758.839 823575.934
SR12 Tsing Yi, WSD Flushing Water Intake 829599.152 823262.269
SR13 EMSD Cooling Water Intake for Kwai Chung Hospital 831397.450 822002.433
G2 Gradient Station 825979.792 824683.158
C1A Control Station 820626.195 822834.323
C2A Control Station 830423.070 819431.722
Table 5.2 Proposed Water Quality Monitoring Stations for 24-hours Water Quality Monitoring
Water Monitoring Station Easting Northing
SR4 Tsuen Wan, WSD Flushing Water Intake 829270.482 825382.994
SR5 Ma Wan, Fish Culture Zone 823758.839 823575.934
SR12 Tsing Yi, WSD Flushing Water Intake 829599.152 823262.269
SR13 EMSD Cooling Water Intake for Kwai Chung Hospital
831397.450 822002.433
5.2 The monitoring parameters and frequency for both in-situ measurement and laboratory
analysis for the remaining monitoring stations will be kept as the same as the previous programme. The monitoring parameters and frequency for both in-situ measurement and laboratory analysis for the remaining monitoring stations are summarized in Table 5.3. Parameters for each remaining monitoring station are specified in Table 5.4.

FUGRO TECHNICAL SERVICES LIMITED
Fugro Development Centre, Tel : +852 2450 8233 5 Lok Yi Street, Tai Lam, Fax : +852 2450 6138 Tuen Mun, N.T., E-mail : [email protected] Hong Kong. Website : www.fugro.com
Page 9
The copyright of this document is owned by Fugro Technical Services Limited. It may not be reproduced except with prior written approval from the Company.
A Fugro Group Company
Page 9 of 19
Table 5.3 Monitoring Parameters and Frequency
Parameters Monitoring Frequency
In-situ Measurement Turbidity (in NTU), pH, Dissolved Oxygen (in mg/L and %), Temperature (in °C), Salinity (in ppt),
1Ammonia-N (in mg/L-N and
UIA); 2TIN: Ammonia-N (in mg/L), Nitrite (in mg/L), Nitrate (in mg/L)
Laboratory Analysis 1Ammonia-N (in mg/L-N and UIA), Suspended Solids (SS),
2BOD5,
2E.coli,
2Synthetic Detergent;
2TIN: Ammonia-N (in mg/L), Nitrite (in mg/L), Nitrate (in mg/L)
3 days per week, at mid-flood and mid-ebb tides (except detergent which shall be taken one day per month, at mid-flood and mid-ebb) 36 hours interval was allowed between subsequent sets of measurement.
Notes: 1. Ammonia measurements and samples were taken at SR4, SR12, C1A and C2A only;
UIA: In-situ unionized ammonia was calculated from in-situ measurement of NH3-N, temperature, pH and salinity; Laboratory determined unionized ammonia was calculated from analysed NH3-N from water samples and in-situ measurement of temperature, pH and salinity;
2. Total Inorganic Nitrogen (TIN) measurements and samples were taken at SR5, G2, C1A, C2A only; and 3. BOD5, E.coli and Synthetic Detergent samples were taken at SR4, SR12, C1A, C2A only.
Table 5.4 Water Quality Monitoring Parameters
ID
In-situ Measurement Laboratory Analysis
pH
Tem
pera
ture
Sa
lin
ity
Tu
rbid
ity
Dis
so
lve
d O
xy
ge
n /
Dis
so
lved
Ox
yg
en
%
NH
3-N
/ U
IA
TIN
(N
H3-N
, N
O2 &
NO
3)
Su
sp
en
de
d S
oli
ds
BO
D5
E.
co
li
NH
3-N
/ U
IA
Sy
nth
eti
c D
ete
rge
nt
TIN
(N
H3-N
, N
O2 &
NO
3)
SR4 O O O O O O O O O O O
SR5 O O O O O O O O
SR12 O O O O O O O O O O O
SR13 O O O O O O
G2 O O O O O O O O
C1A O O O O O O O O O O O O O
C2A O O O O O O O O O O O O O
Notes: 1. UIA: In-situ unionized ammonia was calculated from in-situ measurement of NH3-N, temperature,
pH and salinity; laboratory determined unionized ammonia was calculated from analysed NH3-N from water samples taken and in-situ measurement of temperature, pH and salinity.

FUGRO TECHNICAL SERVICES LIMITED
Fugro Development Centre, Tel : +852 2450 8233 5 Lok Yi Street, Tai Lam, Fax : +852 2450 6138 Tuen Mun, N.T., E-mail : [email protected] Hong Kong. Website : www.fugro.com
Page 10
The copyright of this document is owned by Fugro Technical Services Limited. It may not be reproduced except with prior written approval from the Company.
A Fugro Group Company
Page 10 of 19
5.3 24-hours water quality monitoring at SR4 (Tsuen Wan, WSD Flushing Water Intake),
SR5 (Ma Wan, Fish Culture Zone), SR12 (Tsing Yi WSD Flushing Water Intake) and SR13 (EMSD Cooling Water Intake for Kwai Chung Hospital) will be kept as the same as the previous programme, in which dissolved oxygen, temperature and turbidity data are taken at 5 minutes interval, while ammonia data are analyzed at every 20 minutes.
6. OTHERS EM&A REQUIREMENT
6.1 Others EM&A requirement included environmental site inspection and audit, event and plan, and all necessary mitigation measures as specified in the EP and EM&A Manual should also be implemented during upcoming construction works.
7. THE EM&A PROGRAMME AFTER COMPLETION OF HIGH SPOTS DREDGING AT Z2B1, Z2B2 AND Z2C1
7.1 As mentioned in Section 1.3 of this proposal, there may also be some other high spots discovered in “Portion B” (i.e. sub-zones Z5A, Z5B, Z5C, Z6A, Z6B, Z6C, Z6D, Z7 and Z8 stated in the EP-426/2011/A). Since they are not covered in the previous proposal, further review shall be required if high spots dredging is needed for those area, otherwise the full set of water quality monitoring shall be adopted as stipulated in the Section 2.1.6 and Section 2.1.10 of the EM&A manual except for SR1 which had been verified on site that the flushing water intake point did not exist as referred to the previous proposal.
7.2 The post-construction monitoring has to be re-conducted in accordance with Section 2.1.7 of the EM&A manual after all the works of this Contract are certified to be completed.

FUGRO TECHNICAL SERVICES LIMITED
Fugro Development Centre, Tel : +852 2450 8233 5 Lok Yi Street, Tai Lam, Fax : +852 2450 6138 Tuen Mun, N.T., E-mail : [email protected] Hong Kong. Website : www.fugro.com
The copyright of this document is owned by Fugro Technical Services Limited. It may not be reproduced except with prior written approval from the Company.
A Fugro Group Company
Page 11 of 19
Figure 1
Predicted High Spots Location and Expected Volume


FUGRO TECHNICAL SERVICES LIMITED
Fugro Development Centre, Tel : +852 2450 8233 5 Lok Yi Street, Tai Lam, Fax : +852 2450 6138 Tuen Mun, N.T., E-mail : [email protected] Hong Kong. Website : www.fugro.com
The copyright of this document is owned by Fugro Technical Services Limited. It may not be reproduced except with prior written approval from the Company.
A Fugro Group Company
Page 12 of 19
Figure 2
Locations of Water Quality Monitoring Stations

PROPOSED REMOVED MONITORINGSTATION
Figure 2 - Location of Water Quality Monitoring Stations
REMAINING GRADIENT STATION

FUGRO TECHNICAL SERVICES LIMITED
Fugro Development Centre, Tel : +852 2450 8233 5 Lok Yi Street, Tai Lam, Fax : +852 2450 6138 Tuen Mun, N.T., E-mail : [email protected] Hong Kong. Website : www.fugro.com
The copyright of this document is owned by Fugro Technical Services Limited. It may not be reproduced except with prior written approval from the Company.
A Fugro Group Company
Page 13 of 19
Annex A
Statistical Analysis of Reviewed Impact Monitoring Stations

FUGRO TECHNICAL SERVICES LIMITED
Fugro Development Centre, Tel : +852 2450 8233 5 Lok Yi Street, Tai Lam, Fax : +852 2450 6138 Tuen Mun, N.T., E-mail : [email protected] Hong Kong. Website : www.fugro.com
The copyright of this document is owned by Fugro Technical Services Limited. It may not be reproduced except with prior written approval from the Company.
A Fugro Group Company
Page 14 of 19
Dissolved Oxygen (Surface & Middle)

SR2 - Dry Season DO (S and M) at Mid-Flood (mg/L)
Date DO(S&M) mg/L Date DO(S&M) mg/L Date DO(S&M) mg/L
26-Dec-2015 7.04 11-Nov-2017 6.33 21-Nov-2015 6.22
29-Dec-2015 7.01 14-Nov-2017 6.12 24-Dec-2015 6.85
31-Dec-2015 7.10 16-Nov-2017 6.02 9-Jan-2016 7.33
12-Jan-2016 7.37 18-Nov-2017 6.02 25-Feb-2017 7.55
14-Jan-2016 7.93 4-Nov-2017 6.08
26-Mar-2016 7.39 21-Nov-2017 6.24
29-Mar-2016 7.51
24-Dec-2016 7.42
27-Dec-2016 7.17
31-Dec-2016 7.51
3-Jan-2017 7.76
7-Jan-2017 7.33
10-Jan-2017 7.34
14-Jan-2017 6.14
17-Jan-2017 6.69
19-Jan-2017 6.65
21-Jan-2017 6.33
23-Jan-2017 6.71
25-Jan-2017 6.55
27-Jan-2017 6.51
31-Jan-2017 6.75
2-Feb-2017 6.80
4-Feb-2017 6.71
7-Feb-2017 7.02
9-Feb-2017 7.09
11-Feb-2017 7.42
14-Feb-2017 7.30
16-Feb-2017 7.33
18-Feb-2017 7.40
21-Feb-2017 7.45
23-Feb-2017 7.58
28-Feb-2017 7.49
2-Mar-2017 7.71
4-Mar-2017 7.37
7-Mar-2017 7.00
9-Mar-2017 7.36
11-Mar-2017 6.93
14-Mar-2017 6.87
16-Mar-2017 6.89
18-Mar-2017 6.94
21-Mar-2017 7.07
23-Mar-2017 6.72
25-Mar-2017 6.83
28-Mar-2017 6.91
30-Mar-2017 6.58
2-Nov-2017 6.17
7-Nov-2017 5.96
9-Nov-2017 6.00
No Dredging Work With Dredging Works

SR2 - Dry Season DO (S and M) at Mid-Flood (mg/L)
No Dredging Work With Dredging Works
Raw Statistics Raw Statistics
Number of Valid Observations 52 Number of Valid Observations 6
Number of Distinct Observations 48 Number of Distinct Observations 6
Minimum 5.96 Minimum 6.08
Maximum 7.925 Maximum 7.553
Mean of Raw Data 6.951 Mean of Raw Data 6.71
Standard Deviation of Raw Data 0.506 Standard Deviation of Raw Data 0.628
Kstar 177.7 Kstar 69.66
Mean of Log Transformed Data 1.936 Mean of Log Transformed Data 1.9
Standard Deviation of Log Transformed Data 0.074 Standard Deviation of Log Transformed Data 0.0926
Normal Distribution Test Results Normal Distribution Test Results
Correlation Coefficient R 0.983 Correlation Coefficient R 0.947
Approximate Shapiro Wilk Test Statistic 0.95 Shapiro Wilk Test Statistic 0.872
Approximate Shapiro Wilk P Value 4.90E-02 Shapiro Wilk Critical (0.95) Value 0.788
Lilliefors Test Statistic 0.12 Approximate Shapiro Wilk P Value N/A
Lilliefors Critical (0.95) Value 0.123 Lilliefors Test Statistic 0.276
Lilliefors Critical (0.95) Value 0.362
Data appear Normal at (0.05) Significance Level Data appear Normal at (0.05) Significance Level
t-Test Site vs Background Comparison for Full Data Sets without NDs
User Selected Options
Full Precision OFF
Confidence Coefficient 95%
Substantial Difference 0%
Selected Null Hypothesis Site or AOC Mean/Median Less Than or Equal to Background Mean/Median (Form 1)
Alternative Hypothesis Site or AOC Mean/Median Greater Than Background Mean/Median
Area of Concern Data: With Dredging Works
Background Data: No Dredging Work
Raw Statistics
Site Background
Number of Valid Observations 6 52
Number of Distinct Observations 6 48
Minimum 6.08 5.96
Maximum 7.553 7.925
Mean 6.71 6.951
Median 6.543 7.004
SD 0.628 0.506
SE of Mean 0.256 0.0701
Site vs Background Two-Sample t-Test
H0: Mu of Site - Mu of Background <= 0
t-Test Critical
Method DF Value t (0.050) P-Value
Pooled (Equal Variance) 56 -1.079 1.673 0.857
Satterthwaite (Unequal Variance) 5.8 -0.906 1.943 0.8
Pooled SD 0.518
Conclusion with Alpha = 0.050
* Student t (Pooled) Test: Do Not Reject H0, Conclude Site <= Background
* Satterthwaite Test: Do Not Reject H0, Conclude Site <= Background
ProUCL Version 4.0 (Version 4.00.04)

SR2 - Wet Season DO (S and M) at Mid-Flood (mg/L)
Date DO(S&M) mg/L Date DO(S&M) mg/L Date DO(S&M) mg/L
4-Jun-2015 4.85 3-Jun-2017 6.41 2-Jun-2015 6.63
11-Jun-2015 5.83 6-Jun-2017 7.67 3-Sep-2015 4.84
14-Jul-2015 5.91 8-Jun-2017 7.75 12-Sep-2015 6.74
16-Jul-2015 5.48 10-Jun-2017 6.58 26-Sep-2015 6.45
18-Jul-2015 4.70 20-Jun-2017 5.79 6-Oct-2015 6.12
25-Jul-2015 5.87 22-Jun-2017 5.55 16-Apr-2016 6.84
1-Sep-2015 4.70 24-Jun-2017 5.37 4-Jun-2016 7.25
2-Apr-2016 9.88 27-Jun-2017 5.41 18-Jun-2016 6.03
14-Apr-2016 6.98 4-Jul-2017 6.28 2-Jul-2016 7.14
3-May-2016 7.45 6-Jul-2017 6.78 9-Jul-2016 4.79
7-May-2016 6.24 8-Jul-2017 6.48 12-Jul-2016 4.37
2-Jun-2016 7.75 15-Jul-2017 6.18 20-Apr-2017 7.31
14-Jul-2016 5.05 18-Jul-2017 6.17 29-Apr-2017 5.91
16-Jul-2016 5.93 20-Jul-2017 6.43 6-May-2017 6.09
19-Jul-2016 7.92 22-Jul-2017 6.28 11-May-2017 5.84
21-Jul-2016 5.36 25-Jul-2017 6.47 25-May-2017 5.72
23-Jul-2016 4.15 27-Jul-2017 4.72 15-Jun-2017 5.12
26-Jul-2016 4.99 29-Jul-2017 4.41 17-Jun-2017 4.92
28-Jul-2016 7.36 5-Aug-2017 4.93 29-Jun-2017 5.38
30-Jul-2016 8.94 15-Aug-2017 5.30 1-Jul-2017 5.68
4-Aug-2016 4.27 17-Aug-2017 6.89 11-Jul-2017 5.34
6-Aug-2016 4.30 19-Aug-2017 6.90 18-Jul-2017 6.17
9-Aug-2016 5.25 22-Aug-2017 5.49 20-Jul-2017 6.43
11-Aug-2016 4.69 24-Aug-2017 6.90 1-Aug-2017 5.39
13-Aug-2016 5.34 26-Aug-2017 4.98 3-Aug-2017 5.50
16-Aug-2016 5.57 29-Aug-2017 5.90 10-Aug-2017 4.73
20-Aug-2016 4.69 31-Aug-2017 6.53 7-Sep-2017 4.93
1-Apr-2017 7.06 2-Sep-2017 7.14 21-Sep-2017 4.86
4-Apr-2017 6.87 5-Sep-2017 5.65 23-Sep-2017 6.91
6-Apr-2017 7.88 9-Sep-2017 4.91 28-Sep-2017 5.82
8-Apr-2017 6.84 12-Sep-2017 4.70 12-Oct-2017 5.84
11-Apr-2017 6.66 14-Sep-2017 5.31 19-Oct-2017 5.56
13-Apr-2017 6.49 16-Sep-2017 5.88 21-Oct-2017 5.49
18-Apr-2017 7.09 19-Sep-2017 5.73 26-Oct-2017 5.84
22-Apr-2017 6.77 30-Sep-2017 6.00 28-Oct-2017 5.84
25-Apr-2017 5.81 3-Oct-2017 6.27 31-Oct-2017 5.96
27-Apr-2017 5.60 5-Oct-2017 4.84
2-May-2017 6.02 7-Oct-2017 5.15
4-May-2017 5.71 14-Oct-2017 5.70
9-May-2017 6.49 17-Oct-2017 5.87
13-May-2017 6.49 24-Oct-2017 5.54
16-May-2017 5.69
18-May-2017 6.20
20-May-2017 5.96
23-May-2017 5.39
27-May-2017 5.42
30-May-2017 5.35
1-Jun-2017 6.03
No Dredging Work With Dredging Works

SR2 - Wet Season DO (S and M) at Mid-Flood (mg/L)
No Dredging Work With Dredging Works
Raw Statistics Raw Statistics
Number of Valid Observations 89 Number of Valid Observations 36
Number of Distinct Observations 87 Number of Distinct Observations 34
Minimum 4.15 Minimum 4.365
Maximum 9.88 Maximum 7.305
Mean of Raw Data 6.004 Mean of Raw Data 5.825
Standard Deviation of Raw Data 1.029 Standard Deviation of Raw Data 0.758
Kstar 35.03 Kstar 55.77
Mean of Log Transformed Data 1.779 Mean of Log Transformed Data 1.754
Standard Deviation of Log Transformed Data 0.166 Standard Deviation of Log Transformed Data 0.13
Normal Distribution Test Results Normal Distribution Test Results
Correlation Coefficient R 0.978 Correlation Coefficient R 0.99
Approximate Shapiro Wilk Test Statistic 0.958 Shapiro Wilk Test Statistic 0.968
Approximate Shapiro Wilk P Value 2.46E-02 Shapiro Wilk Critical (0.95) Value 0.935
Lilliefors Test Statistic 0.0741 Approximate Shapiro Wilk P Value 4.64E-01
Lilliefors Critical (0.95) Value 0.0939 Lilliefors Test Statistic 0.0758
Lilliefors Critical (0.95) Value 0.148
Data appear Normal at (0.05) Significance Level Data appear Normal at (0.05) Significance Level
t-Test Site vs Background Comparison for Full Data Sets without NDs
User Selected Options
Full Precision OFF
Confidence Coefficient 95%
Substantial Difference 0%
Selected Null Hypothesis Site or AOC Mean/Median Less Than or Equal to Background Mean/Median (Form 1)
Alternative Hypothesis Site or AOC Mean/Median Greater Than Background Mean/Median
Area of Concern Data: With Dredging Works
Background Data: No Dredging Work
Raw Statistics
Site Background
Number of Valid Observations 36 89
Number of Distinct Observations 34 87
Minimum 4.365 4.15
Maximum 7.305 9.88
Mean 5.825 6.004
Median 5.835 5.88
SD 0.758 1.029
SE of Mean 0.126 0.109
Site vs Background Two-Sample t-Test
H0: Mu of Site - Mu of Background <= 0
t-Test Critical
Method DF Value t (0.050) P-Value
Pooled (Equal Variance) 123 -0.942 1.657 0.826
Satterthwaite (Unequal Variance) 87.4 -1.071 1.663 0.856
Pooled SD 0.960
Conclusion with Alpha = 0.050
* Student t (Pooled) Test: Do Not Reject H0, Conclude Site <= Background
* Satterthwaite Test: Do Not Reject H0, Conclude Site <= Background
ProUCL Version 4.0 (Version 4.00.04)

SR2 - Dry Season DO (S and M) at Mid-Ebb (mg/L)
Date DO(S&M) mg/L Date DO(S&M) mg/L Date DO(S&M) mg/L
26-Dec-2015 6.98 11-Nov-2017 6.33 21-Nov-2015 6.17
29-Dec-2015 7.04 14-Nov-2017 6.05 24-Dec-2015 6.68
31-Dec-2015 6.96 16-Nov-2017 6.05 9-Jan-2016 7.39
12-Jan-2016 7.61 18-Nov-2017 5.90 25-Feb-2017 7.53
14-Jan-2016 7.89 4-Nov-2017 6.15
26-Mar-2016 7.10 21-Nov-2017 6.20
29-Mar-2016 7.66
24-Dec-2016 7.41
27-Dec-2016 7.11
31-Dec-2016 7.56
3-Jan-2017 7.69
7-Jan-2017 7.35
10-Jan-2017 7.37
14-Jan-2017 6.24
17-Jan-2017 6.79
19-Jan-2017 6.57
21-Jan-2017 6.63
23-Jan-2017 6.72
25-Jan-2017 6.74
27-Jan-2017 6.83
31-Jan-2017 6.76
2-Feb-2017 6.79
4-Feb-2017 6.80
7-Feb-2017 6.90
9-Feb-2017 7.08
11-Feb-2017 7.26
14-Feb-2017 7.28
16-Feb-2017 7.33
18-Feb-2017 7.41
21-Feb-2017 7.46
23-Feb-2017 7.59
28-Feb-2017 7.40
2-Mar-2017 7.69
4-Mar-2017 7.38
7-Mar-2017 6.72
9-Mar-2017 7.54
11-Mar-2017 6.94
14-Mar-2017 6.83
16-Mar-2017 6.89
18-Mar-2017 6.91
21-Mar-2017 7.94
23-Mar-2017 6.50
25-Mar-2017 6.86
28-Mar-2017 6.91
30-Mar-2017 6.64
2-Nov-2017 6.19
7-Nov-2017 5.98
9-Nov-2017 6.01
No Dredging Work With Dredging Works

SR2 - Dry Season DO (S and M) at Mid-Ebb (mg/L)
No Dredging Work With Dredging Works
Raw Statistics Raw Statistics
Number of Valid Observations 52 Number of Valid Observations 6
Number of Distinct Observations 50 Number of Distinct Observations 6
Minimum 5.903 Minimum 6.145
Maximum 7.935 Maximum 7.533
Mean of Raw Data 6.971 Mean of Raw Data 6.685
Standard Deviation of Raw Data 0.518 Standard Deviation of Raw Data 0.634
Kstar 170.7 Kstar 68.32
Mean of Log Transformed Data 1.939 Mean of Log Transformed Data 1.896
Standard Deviation of Log Transformed Data 0.0755 Standard Deviation of Log Transformed Data 0.0933
Normal Distribution Test Results Normal Distribution Test Results
Correlation Coefficient R 0.987 Correlation Coefficient R 0.916
Approximate Shapiro Wilk Test Statistic 0.958 Shapiro Wilk Test Statistic 0.81
Approximate Shapiro Wilk P Value 1.13E-01 Shapiro Wilk Critical (0.95) Value 0.788
Lilliefors Test Statistic 0.0836 Approximate Shapiro Wilk P Value N/A
Lilliefors Critical (0.95) Value 0.123 Lilliefors Test Statistic 0.28
Lilliefors Critical (0.95) Value 0.362
Data appear Normal at (0.05) Significance Level Data appear Normal at (0.05) Significance Level
t-Test Site vs Background Comparison for Full Data Sets without NDs
User Selected Options
Full Precision OFF
Confidence Coefficient 95%
Substantial Difference 0%
Selected Null Hypothesis Site or AOC Mean/Median Less Than or Equal to Background Mean/Median (Form 1)
Alternative Hypothesis Site or AOC Mean/Median Greater Than Background Mean/Median
Area of Concern Data: With Dredging Works
Background Data: No Dredging Work
Raw Statistics
Site Background
Number of Valid Observations 6 52
Number of Distinct Observations 6 50
Minimum 6.145 5.903
Maximum 7.533 7.935
Mean 6.685 6.971
Median 6.435 6.921
SD 0.634 0.518
SE of Mean 0.259 0.0718
Site vs Background Two-Sample t-Test
H0: Mu of Site - Mu of Background <= 0
t-Test Critical
Method DF Value t (0.050) P-Value
Pooled (Equal Variance) 56 -1.253 1.673 0.892
Satterthwaite (Unequal Variance) 5.8 -1.064 1.943 0.835
Pooled SD 0.529
Conclusion with Alpha = 0.050
* Student t (Pooled) Test: Do Not Reject H0, Conclude Site <= Background
* Satterthwaite Test: Do Not Reject H0, Conclude Site <= Background
ProUCL Version 4.0 (Version 4.00.04)

SR2 - Wet Season DO (S and M) at Mid-Ebb (mg/L)
Date DO(S&M) mg/L Date DO(S&M) mg/L Date DO(S&M) mg/L
4-Jun-2015 4.70 3-Jun-2017 6.49 2-Jun-2015 6.65
11-Jun-2015 5.04 6-Jun-2017 7.47 3-Sep-2015 5.11
14-Jul-2015 5.92 8-Jun-2017 6.44 12-Sep-2015 6.57
16-Jul-2015 5.37 10-Jun-2017 7.69 26-Sep-2015 6.39
18-Jul-2015 4.90 20-Jun-2017 5.87 6-Oct-2015 6.19
25-Jul-2015 5.77 22-Jun-2017 5.49 16-Apr-2016 6.77
1-Sep-2015 4.70 24-Jun-2017 5.34 4-Jun-2016 7.42
2-Apr-2016 10.38 27-Jun-2017 5.43 18-Jun-2016 6.03
14-Apr-2016 6.73 4-Jul-2017 6.28 2-Jul-2016 6.34
3-May-2016 7.31 6-Jul-2017 6.06 9-Jul-2016 4.51
7-May-2016 6.28 8-Jul-2017 6.49 12-Jul-2016 4.37
2-Jun-2016 7.27 15-Jul-2017 6.18 20-Apr-2017 7.29
14-Jul-2016 5.17 18-Jul-2017 6.25 29-Apr-2017 5.91
16-Jul-2016 5.93 20-Jul-2017 6.49 6-May-2017 5.97
19-Jul-2016 7.55 22-Jul-2017 6.19 11-May-2017 5.80
21-Jul-2016 5.36 25-Jul-2017 6.34 25-May-2017 5.72
23-Jul-2016 5.41 27-Jul-2017 4.69 15-Jun-2017 5.02
26-Jul-2016 6.66 29-Jul-2017 4.18 17-Jun-2017 4.89
28-Jul-2016 6.64 5-Aug-2017 5.02 29-Jun-2017 5.14
30-Jul-2016 7.77 15-Aug-2017 4.86 1-Jul-2017 5.81
4-Aug-2016 4.56 17-Aug-2017 6.91 11-Jul-2017 5.29
6-Aug-2016 4.44 19-Aug-2017 6.88 18-Jul-2017 6.25
9-Aug-2016 4.70 22-Aug-2017 5.62 20-Jul-2017 6.49
11-Aug-2016 4.68 24-Aug-2017 6.90 1-Aug-2017 5.43
13-Aug-2016 5.32 26-Aug-2017 5.11 3-Aug-2017 5.63
16-Aug-2016 5.55 29-Aug-2017 5.86 10-Aug-2017 4.72
20-Aug-2016 4.71 31-Aug-2017 6.01 7-Sep-2017 4.82
1-Apr-2017 7.10 2-Sep-2017 6.98 21-Sep-2017 4.84
4-Apr-2017 6.94 5-Sep-2017 5.64 23-Sep-2017 6.89
6-Apr-2017 7.89 9-Sep-2017 4.82 28-Sep-2017 5.70
8-Apr-2017 6.89 12-Sep-2017 4.71 12-Oct-2017 5.77
11-Apr-2017 7.31 14-Sep-2017 5.37 19-Oct-2017 5.56
13-Apr-2017 6.51 16-Sep-2017 5.90 21-Oct-2017 5.52
18-Apr-2017 7.10 19-Sep-2017 5.77 26-Oct-2017 5.87
22-Apr-2017 6.80 30-Sep-2017 6.08 28-Oct-2017 5.92
25-Apr-2017 5.86 3-Oct-2017 6.24 31-Oct-2017 5.95
27-Apr-2017 5.59 5-Oct-2017 4.81
2-May-2017 6.16 7-Oct-2017 4.84
4-May-2017 5.72 14-Oct-2017 5.69
9-May-2017 6.50 17-Oct-2017 5.79
13-May-2017 6.99 24-Oct-2017 5.55
16-May-2017 5.27
18-May-2017 6.16
20-May-2017 6.37
23-May-2017 5.39
27-May-2017 5.44
30-May-2017 5.27
1-Jun-2017 5.92
No Dredging Work With Dredging Works

SR2 - Wet Season DO (S and M) at Mid-Ebb (mg/L)
No Dredging Work With Dredging Works
Raw Statistics Raw Statistics
Number of Valid Observations 89 Number of Valid Observations 36
Number of Distinct Observations 88 Number of Distinct Observations 36
Minimum 4.175 Minimum 4.365
Maximum 10.38 Maximum 7.415
Mean of Raw Data 5.984 Mean of Raw Data 5.792
Standard Deviation of Raw Data 0.992 Standard Deviation of Raw Data 0.749
Kstar 37.75 Kstar 56.07
Mean of Log Transformed Data 1.776 Mean of Log Transformed Data 1.748
Standard Deviation of Log Transformed Data 0.16 Standard Deviation of Log Transformed Data 0.13
Normal Distribution Test Results Normal Distribution Test Results
Correlation Coefficient R 0.968 Correlation Coefficient R 0.995
Approximate Shapiro Wilk Test Statistic 0.95 Shapiro Wilk Test Statistic 0.981
Approximate Shapiro Wilk P Value 5.21E-03 Shapiro Wilk Critical (0.95) Value 0.935
Lilliefors Test Statistic 0.0629 Approximate Shapiro Wilk P Value 8.25E-01
Lilliefors Critical (0.95) Value 0.0939 Lilliefors Test Statistic 0.0725
Lilliefors Critical (0.95) Value 0.148
Data appear Normal at (0.05) Significance Level Data appear Normal at (0.05) Significance Level
t-Test Site vs Background Comparison for Full Data Sets without NDs
User Selected Options
Full Precision OFF
Confidence Coefficient 95%
Substantial Difference 0%
Selected Null Hypothesis Site or AOC Mean/Median Less Than or Equal to Background Mean/Median (Form 1)
Alternative Hypothesis Site or AOC Mean/Median Greater Than Background Mean/Median
Area of Concern Data: With Dredging Works
Background Data: No Dredging Work
Raw Statistics
Site Background
Number of Valid Observations 36 89
Number of Distinct Observations 36 88
Minimum 4.365 4.175
Maximum 7.415 10.38
Mean 5.792 5.984
Median 5.8 5.9
SD 0.749 0.992
SE of Mean 0.125 0.105
Site vs Background Two-Sample t-Test
H0: Mu of Site - Mu of Background <= 0
t-Test Critical
Method DF Value t (0.050) P-Value
Pooled (Equal Variance) 123 -1.046 1.657 0.851
Satterthwaite (Unequal Variance) 85.3 -1.177 1.663 0.879
Pooled SD 0.929
Conclusion with Alpha = 0.050
* Student t (Pooled) Test: Do Not Reject H0, Conclude Site <= Background
* Satterthwaite Test: Do Not Reject H0, Conclude Site <= Background
ProUCL Version 4.0 (Version 4.00.04)

SR3 - Dry Season DO (S and M) at Mid-Flood (mg/L)
Date DO(S&M) mg/L Date DO(S&M) mg/L Date DO(S&M) mg/L
26-Dec-2015 6.94 11-Nov-2017 6.39 21-Nov-2015 6.36
29-Dec-2015 6.87 14-Nov-2017 6.05 24-Dec-2015 6.86
31-Dec-2015 6.81 16-Nov-2017 5.98 9-Jan-2016 7.16
12-Jan-2016 7.40 18-Nov-2017 6.27 25-Feb-2017 7.25
14-Jan-2016 7.65 4-Nov-2017 6.03
26-Mar-2016 7.45 21-Nov-2017 6.17
29-Mar-2016 7.52
24-Dec-2016 7.26
27-Dec-2016 7.14
31-Dec-2016 7.45
3-Jan-2017 7.88
7-Jan-2017 7.36
10-Jan-2017 7.48
14-Jan-2017 6.04
17-Jan-2017 6.64
19-Jan-2017 6.38
21-Jan-2017 6.11
23-Jan-2017 6.25
25-Jan-2017 6.80
27-Jan-2017 6.63
31-Jan-2017 6.63
2-Feb-2017 6.71
4-Feb-2017 6.75
7-Feb-2017 6.91
9-Feb-2017 6.82
11-Feb-2017 7.31
14-Feb-2017 7.19
16-Feb-2017 7.20
18-Feb-2017 7.30
21-Feb-2017 7.28
23-Feb-2017 7.64
28-Feb-2017 7.53
2-Mar-2017 7.48
4-Mar-2017 7.28
7-Mar-2017 7.02
9-Mar-2017 7.14
11-Mar-2017 6.76
14-Mar-2017 6.85
16-Mar-2017 6.76
18-Mar-2017 6.88
21-Mar-2017 7.12
23-Mar-2017 6.72
25-Mar-2017 6.97
28-Mar-2017 6.83
30-Mar-2017 6.79
2-Nov-2017 6.18
7-Nov-2017 5.80
9-Nov-2017 5.90
No Dredging Work With Dredging Works

SR3 - Dry Season DO (S and M) at Mid-Flood (mg/L)
No Dredging Work With Dredging Works
Raw Statistics Raw Statistics
Number of Valid Observations 52 Number of Valid Observations 6
Number of Distinct Observations 51 Number of Distinct Observations 6
Minimum 5.795 Minimum 6.025
Maximum 7.875 Maximum 7.255
Mean of Raw Data 6.893 Mean of Raw Data 6.636
Standard Deviation of Raw Data 0.507 Standard Deviation of Raw Data 0.525
Kstar 173.7 Kstar 96.09
Mean of Log Transformed Data 1.928 Mean of Log Transformed Data 1.89
Standard Deviation of Log Transformed Data 0.0749 Standard Deviation of Log Transformed Data 0.0791
Normal Distribution Test Results Normal Distribution Test Results
Correlation Coefficient R 0.986 Correlation Coefficient R 0.963
Approximate Shapiro Wilk Test Statistic 0.959 Shapiro Wilk Test Statistic 0.9
Approximate Shapiro Wilk P Value 1.32E-01 Shapiro Wilk Critical (0.95) Value 0.788
Lilliefors Test Statistic 0.089 Approximate Shapiro Wilk P Value N/A
Lilliefors Critical (0.95) Value 0.123 Lilliefors Test Statistic 0.204
Lilliefors Critical (0.95) Value 0.362
Data appear Normal at (0.05) Significance Level Data appear Normal at (0.05) Significance Level
t-Test Site vs Background Comparison for Full Data Sets without NDs
User Selected Options
Full Precision OFF
Confidence Coefficient 95%
Substantial Difference 0%
Selected Null Hypothesis Site or AOC Mean/Median Less Than or Equal to Background Mean/Median (Form 1)
Alternative Hypothesis Site or AOC Mean/Median Greater Than Background Mean/Median
Area of Concern Data: With Dredging Works
Background Data: No Dredging Work
Raw Statistics
Site Background
Number of Valid Observations 6 52
Number of Distinct Observations 6 51
Minimum 6.025 5.795
Maximum 7.255 7.875
Mean 6.636 6.893
Median 6.608 6.875
SD 0.525 0.507
SE of Mean 0.214 0.0703
Site vs Background Two-Sample t-Test
H0: Mu of Site - Mu of Background <= 0
t-Test Critical
Method DF Value t (0.050) P-Value
Pooled (Equal Variance) 56 -1.171 1.673 0.877
Satterthwaite (Unequal Variance) 6.1 -1.139 1.943 0.851
Pooled SD 0.509
Conclusion with Alpha = 0.050
* Student t (Pooled) Test: Do Not Reject H0, Conclude Site <= Background
* Satterthwaite Test: Do Not Reject H0, Conclude Site <= Background
ProUCL Version 4.0 (Version 4.00.04)
SR3 - Wet Season DO (S and M) at Mid-Flood (mg/L)
Date DO(S&M) mg/L Date DO(S&M) mg/L Date DO(S&M) mg/L
4-Jun-2015 4.97 3-Jun-2017 6.41 2-Jun-2015 6.63
11-Jun-2015 5.93 6-Jun-2017 7.56 3-Sep-2015 4.82
14-Jul-2015 8.47 8-Jun-2017 7.66 12-Sep-2015 6.66
16-Jul-2015 5.41 10-Jun-2017 6.76 26-Sep-2015 6.45
18-Jul-2015 5.01 20-Jun-2017 5.76 6-Oct-2015 6.28
25-Jul-2015 6.02 22-Jun-2017 6.17 16-Apr-2016 6.89
1-Sep-2015 4.70 24-Jun-2017 5.42 4-Jun-2016 7.13
2-Apr-2016 9.60 27-Jun-2017 5.76 18-Jun-2016 5.87
14-Apr-2016 6.77 4-Jul-2017 6.07 2-Jul-2016 6.00
3-May-2016 7.26 6-Jul-2017 5.85 9-Jul-2016 5.07
7-May-2016 6.28 8-Jul-2017 5.94 12-Jul-2016 4.83
2-Jun-2016 7.76 15-Jul-2017 6.72 20-Apr-2017 7.82
14-Jul-2016 5.04 18-Jul-2017 5.96 29-Apr-2017 5.87
16-Jul-2016 6.41 20-Jul-2017 6.50 6-May-2017 5.98
19-Jul-2016 7.52 22-Jul-2017 6.76 11-May-2017 5.84
21-Jul-2016 5.07 25-Jul-2017 6.44 25-May-2017 5.79
23-Jul-2016 4.83 27-Jul-2017 4.69 15-Jun-2017 5.30
26-Jul-2016 5.34 29-Jul-2017 4.42 17-Jun-2017 5.24
28-Jul-2016 7.28 5-Aug-2017 4.78 29-Jun-2017 5.55
30-Jul-2016 8.69 15-Aug-2017 5.61 1-Jul-2017 6.35
4-Aug-2016 4.46 17-Aug-2017 6.81 11-Jul-2017 5.83
6-Aug-2016 4.57 19-Aug-2017 7.12 18-Jul-2017 5.96
9-Aug-2016 5.34 22-Aug-2017 5.67 20-Jul-2017 6.50
11-Aug-2016 4.73 24-Aug-2017 6.82 1-Aug-2017 5.62
13-Aug-2016 5.45 26-Aug-2017 5.06 3-Aug-2017 5.77
16-Aug-2016 5.43 29-Aug-2017 5.70 10-Aug-2017 4.68
20-Aug-2016 4.69 31-Aug-2017 5.92 7-Sep-2017 5.02
1-Apr-2017 7.13 2-Sep-2017 6.66 21-Sep-2017 4.86
4-Apr-2017 6.79 5-Sep-2017 5.67 23-Sep-2017 6.82
6-Apr-2017 7.93 9-Sep-2017 5.02 28-Sep-2017 5.76
8-Apr-2017 6.88 12-Sep-2017 4.80 12-Oct-2017 5.66
11-Apr-2017 7.08 14-Sep-2017 5.33 19-Oct-2017 5.54
13-Apr-2017 6.39 16-Sep-2017 5.63 21-Oct-2017 5.37
18-Apr-2017 7.17 19-Sep-2017 5.91 26-Oct-2017 5.54
22-Apr-2017 6.97 30-Sep-2017 5.93 28-Oct-2017 5.90
25-Apr-2017 5.78 3-Oct-2017 6.21 31-Oct-2017 5.82
27-Apr-2017 5.78 5-Oct-2017 5.06
2-May-2017 6.27 7-Oct-2017 5.04
4-May-2017 5.28 14-Oct-2017 5.67
9-May-2017 6.59 17-Oct-2017 5.75
13-May-2017 6.02 24-Oct-2017 5.49
16-May-2017 5.72
18-May-2017 6.26
20-May-2017 5.72
23-May-2017 6.07
27-May-2017 5.59
30-May-2017 5.36
1-Jun-2017 6.23
No Dredging Work With Dredging Works

SR3 - Wet Season DO (S and M) at Mid-Flood (mg/L)
No Dredging Work With Dredging Works
Raw Statistics Raw Statistics
Number of Valid Observations 89 Number of Valid Observations 36
Number of Distinct Observations 88 Number of Distinct Observations 36
Minimum 4.42 Minimum 4.68
Maximum 9.595 Maximum 7.82
Mean of Raw Data 6.049 Mean of Raw Data 5.86
Standard Deviation of Raw Data 0.996 Standard Deviation of Raw Data 0.7
Kstar 38.12 Kstar 67.8
Mean of Log Transformed Data 1.787 Mean of Log Transformed Data 1.761
Standard Deviation of Log Transformed Data 0.159 Standard Deviation of Log Transformed Data 0.118
Normal Distribution Test Results Normal Distribution Test Results
Correlation Coefficient R 0.977 Correlation Coefficient R 0.982
Approximate Shapiro Wilk Test Statistic 0.951 Shapiro Wilk Test Statistic 0.964
Approximate Shapiro Wilk P Value 6.71E-03 Shapiro Wilk Critical (0.95) Value 0.935
Lilliefors Test Statistic 0.0883 Approximate Shapiro Wilk P Value 3.55E-01
Lilliefors Critical (0.95) Value 0.0939 Lilliefors Test Statistic 0.143
Lilliefors Critical (0.95) Value 0.148
Data appear Normal at (0.05) Significance Level Data appear Normal at (0.05) Significance Level
t-Test Site vs Background Comparison for Full Data Sets without NDs
User Selected Options
Full Precision OFF
Confidence Coefficient 95%
Substantial Difference 0%
Selected Null Hypothesis Site or AOC Mean/Median Less Than or Equal to Background Mean/Median (Form 1)
Alternative Hypothesis Site or AOC Mean/Median Greater Than Background Mean/Median
Area of Concern Data: With Dredging Works
Background Data: No Dredging Work
Raw Statistics
Site Background
Number of Valid Observations 36 89
Number of Distinct Observations 36 88
Minimum 4.68 4.42
Maximum 7.82 9.595
Mean 5.86 6.049
Median 5.823 5.915
SD 0.7 0.996
SE of Mean 0.117 0.106
Site vs Background Two-Sample t-Test
H0: Mu of Site - Mu of Background <= 0
t-Test Critical
Method DF Value t (0.050) P-Value
Pooled (Equal Variance) 123 -1.039 1.657 0.85
Satterthwaite (Unequal Variance) 91.4 -1.202 1.662 0.884
Pooled SD 0.921
Conclusion with Alpha = 0.050
* Student t (Pooled) Test: Do Not Reject H0, Conclude Site <= Background
* Satterthwaite Test: Do Not Reject H0, Conclude Site <= Background
ProUCL Version 4.0 (Version 4.00.04)

SR3 - Dry Season DO (S and M) at Mid-Ebb (mg/L)
Date DO(S&M) mg/L Date DO(S&M) mg/L Date DO(S&M) mg/L
26-Dec-2015 7.00 11-Nov-2017 6.40 21-Nov-2015 6.06
29-Dec-2015 7.01 14-Nov-2017 6.16 24-Dec-2015 6.87
31-Dec-2015 6.71 16-Nov-2017 6.01 9-Jan-2016 7.36
12-Jan-2016 7.35 18-Nov-2017 6.08 25-Feb-2017 7.26
14-Jan-2016 8.03 4-Nov-2017 6.08
26-Mar-2016 7.38 21-Nov-2017 5.81
29-Mar-2016 7.72
24-Dec-2016 7.28
27-Dec-2016 7.08
31-Dec-2016 7.51
3-Jan-2017 7.84
7-Jan-2017 7.38
10-Jan-2017 7.33
14-Jan-2017 6.30
17-Jan-2017 6.81
19-Jan-2017 6.37
21-Jan-2017 6.25
23-Jan-2017 6.23
25-Jan-2017 6.48
27-Jan-2017 6.60
31-Jan-2017 6.44
2-Feb-2017 6.47
4-Feb-2017 6.67
7-Feb-2017 6.89
9-Feb-2017 6.79
11-Feb-2017 7.37
14-Feb-2017 7.11
16-Feb-2017 7.20
18-Feb-2017 7.30
21-Feb-2017 7.29
23-Feb-2017 7.67
28-Feb-2017 7.68
2-Mar-2017 7.52
4-Mar-2017 7.27
7-Mar-2017 6.71
9-Mar-2017 7.17
11-Mar-2017 6.75
14-Mar-2017 7.03
16-Mar-2017 6.87
18-Mar-2017 6.86
21-Mar-2017 7.02
23-Mar-2017 6.71
25-Mar-2017 6.95
28-Mar-2017 6.95
30-Mar-2017 6.78
2-Nov-2017 6.23
7-Nov-2017 5.80
9-Nov-2017 5.91
No Dredging Work With Dredging Works

SR3 - Dry Season DO (S and M) at Mid-Ebb (mg/L)
No Dredging Work With Dredging Works
Raw Statistics Raw Statistics
Number of Valid Observations 52 Number of Valid Observations 6
Number of Distinct Observations 50 Number of Distinct Observations 6
Minimum 5.795 Minimum 5.805
Maximum 8.025 Maximum 7.36
Mean of Raw Data 6.896 Mean of Raw Data 6.57
Standard Deviation of Raw Data 0.525 Standard Deviation of Raw Data 0.674
Kstar 164.4 Kstar 57.18
Mean of Log Transformed Data 1.928 Mean of Log Transformed Data 1.878
Standard Deviation of Log Transformed Data 0.0767 Standard Deviation of Log Transformed Data 0.103
Normal Distribution Test Results Normal Distribution Test Results
Correlation Coefficient R 0.996 Correlation Coefficient R 0.947
Approximate Shapiro Wilk Test Statistic 0.98 Shapiro Wilk Test Statistic 0.869
Approximate Shapiro Wilk P Value 7.27E-01 Shapiro Wilk Critical (0.95) Value 0.788
Lilliefors Test Statistic 0.0698 Approximate Shapiro Wilk P Value N/A
Lilliefors Critical (0.95) Value 0.123 Lilliefors Test Statistic 0.266
Lilliefors Critical (0.95) Value 0.362
Data appear Normal at (0.05) Significance Level Data appear Normal at (0.05) Significance Level
t-Test Site vs Background Comparison for Full Data Sets without NDs
User Selected Options
Full Precision OFF
Confidence Coefficient 95%
Substantial Difference 0%
Selected Null Hypothesis Site or AOC Mean/Median Less Than or Equal to Background Mean/Median (Form 1)
Alternative Hypothesis Site or AOC Mean/Median Greater Than Background Mean/Median
Area of Concern Data: With Dredging Works
Background Data: No Dredging Work
Raw Statistics
Site Background
Number of Valid Observations 6 52
Number of Distinct Observations 6 50
Minimum 5.805 5.795
Maximum 7.36 8.025
Mean 6.57 6.896
Median 6.473 6.915
SD 0.674 0.525
SE of Mean 0.275 0.0727
Site vs Background Two-Sample t-Test
H0: Mu of Site - Mu of Background <= 0
t-Test Critical
Method DF Value t (0.050) P-Value
Pooled (Equal Variance) 56 -1.399 1.673 0.916
Satterthwaite (Unequal Variance) 5.7 -1.143 1.943 0.851
Pooled SD 0.540
Conclusion with Alpha = 0.050
* Student t (Pooled) Test: Do Not Reject H0, Conclude Site <= Background
* Satterthwaite Test: Do Not Reject H0, Conclude Site <= Background
ProUCL Version 4.0 (Version 4.00.04)

SR3 - Wet Season DO (S and M) at Mid-Ebb (mg/L)
Date DO(S&M) mg/L Date DO(S&M) mg/L Date DO(S&M) mg/L
4-Jun-2015 5.12 3-Jun-2017 6.46 2-Jun-2015 6.39
11-Jun-2015 5.93 6-Jun-2017 7.37 3-Sep-2015 4.76
14-Jul-2015 5.91 8-Jun-2017 7.65 12-Sep-2015 6.55
16-Jul-2015 5.48 10-Jun-2017 7.64 26-Sep-2015 6.34
18-Jul-2015 4.72 20-Jun-2017 5.67 6-Oct-2015 6.26
25-Jul-2015 6.08 22-Jun-2017 5.62 16-Apr-2016 6.75
1-Sep-2015 4.69 24-Jun-2017 5.42 4-Jun-2016 7.55
2-Apr-2016 9.80 27-Jun-2017 5.44 18-Jun-2016 5.88
14-Apr-2016 6.79 4-Jul-2017 6.01 2-Jul-2016 5.92
3-May-2016 6.84 6-Jul-2017 6.03 9-Jul-2016 5.05
7-May-2016 6.28 8-Jul-2017 5.86 12-Jul-2016 4.62
2-Jun-2016 6.90 15-Jul-2017 6.73 20-Apr-2017 7.81
14-Jul-2016 4.93 18-Jul-2017 6.29 29-Apr-2017 5.83
16-Jul-2016 6.41 20-Jul-2017 6.06 6-May-2017 5.94
19-Jul-2016 7.59 22-Jul-2017 6.90 11-May-2017 5.80
21-Jul-2016 5.43 25-Jul-2017 6.39 25-May-2017 5.75
23-Jul-2016 5.44 27-Jul-2017 4.72 15-Jun-2017 4.69
26-Jul-2016 5.64 29-Jul-2017 4.26 17-Jun-2017 4.78
28-Jul-2016 6.66 5-Aug-2017 4.83 29-Jun-2017 5.24
30-Jul-2016 7.63 15-Aug-2017 5.57 1-Jul-2017 6.33
4-Aug-2016 4.73 17-Aug-2017 6.82 11-Jul-2017 5.53
6-Aug-2016 4.06 19-Aug-2017 7.31 18-Jul-2017 6.29
9-Aug-2016 5.11 22-Aug-2017 5.80 20-Jul-2017 6.06
11-Aug-2016 4.82 24-Aug-2017 6.82 1-Aug-2017 5.32
13-Aug-2016 5.25 26-Aug-2017 5.20 3-Aug-2017 5.86
16-Aug-2016 5.21 29-Aug-2017 5.50 10-Aug-2017 4.69
20-Aug-2016 4.70 31-Aug-2017 5.93 7-Sep-2017 4.89
1-Apr-2017 7.02 2-Sep-2017 6.69 21-Sep-2017 4.81
4-Apr-2017 6.98 5-Sep-2017 5.66 23-Sep-2017 6.81
6-Apr-2017 7.98 9-Sep-2017 4.93 28-Sep-2017 5.74
8-Apr-2017 6.90 12-Sep-2017 4.70 12-Oct-2017 5.74
11-Apr-2017 7.10 14-Sep-2017 5.37 19-Oct-2017 5.61
13-Apr-2017 6.41 16-Sep-2017 5.60 21-Oct-2017 5.37
18-Apr-2017 7.13 19-Sep-2017 5.60 26-Oct-2017 5.54
22-Apr-2017 6.98 30-Sep-2017 5.95 28-Oct-2017 6.00
25-Apr-2017 5.87 3-Oct-2017 6.22 31-Oct-2017 6.15
27-Apr-2017 5.76 5-Oct-2017 4.74
2-May-2017 6.24 7-Oct-2017 5.00
4-May-2017 5.87 14-Oct-2017 5.66
9-May-2017 6.37 17-Oct-2017 5.75
13-May-2017 6.99 24-Oct-2017 5.48
16-May-2017 5.52
18-May-2017 6.17
20-May-2017 5.84
23-May-2017 5.53
27-May-2017 5.50
30-May-2017 5.44
1-Jun-2017 6.20
No Dredging Work With Dredging Works
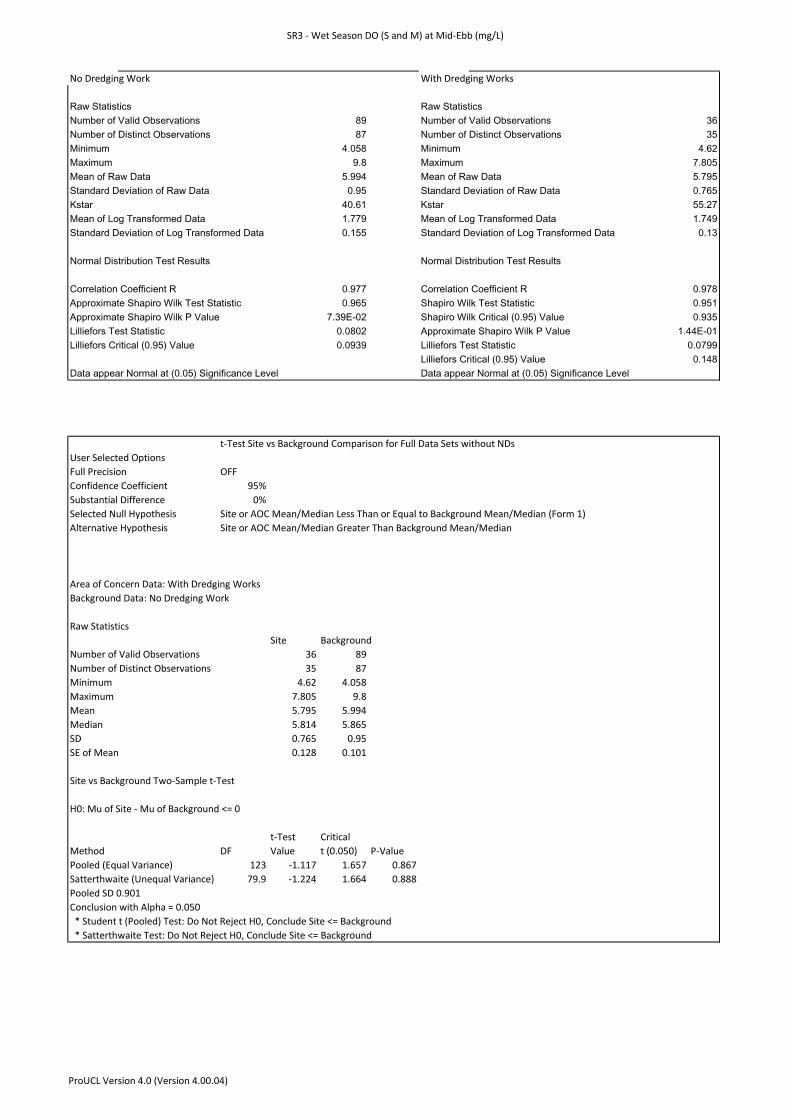
SR3 - Wet Season DO (S and M) at Mid-Ebb (mg/L)
No Dredging Work With Dredging Works
Raw Statistics Raw Statistics
Number of Valid Observations 89 Number of Valid Observations 36
Number of Distinct Observations 87 Number of Distinct Observations 35
Minimum 4.058 Minimum 4.62
Maximum 9.8 Maximum 7.805
Mean of Raw Data 5.994 Mean of Raw Data 5.795
Standard Deviation of Raw Data 0.95 Standard Deviation of Raw Data 0.765
Kstar 40.61 Kstar 55.27
Mean of Log Transformed Data 1.779 Mean of Log Transformed Data 1.749
Standard Deviation of Log Transformed Data 0.155 Standard Deviation of Log Transformed Data 0.13
Normal Distribution Test Results Normal Distribution Test Results
Correlation Coefficient R 0.977 Correlation Coefficient R 0.978
Approximate Shapiro Wilk Test Statistic 0.965 Shapiro Wilk Test Statistic 0.951
Approximate Shapiro Wilk P Value 7.39E-02 Shapiro Wilk Critical (0.95) Value 0.935
Lilliefors Test Statistic 0.0802 Approximate Shapiro Wilk P Value 1.44E-01
Lilliefors Critical (0.95) Value 0.0939 Lilliefors Test Statistic 0.0799
Lilliefors Critical (0.95) Value 0.148
Data appear Normal at (0.05) Significance Level Data appear Normal at (0.05) Significance Level
t-Test Site vs Background Comparison for Full Data Sets without NDs
User Selected Options
Full Precision OFF
Confidence Coefficient 95%
Substantial Difference 0%
Selected Null Hypothesis Site or AOC Mean/Median Less Than or Equal to Background Mean/Median (Form 1)
Alternative Hypothesis Site or AOC Mean/Median Greater Than Background Mean/Median
Area of Concern Data: With Dredging Works
Background Data: No Dredging Work
Raw Statistics
Site Background
Number of Valid Observations 36 89
Number of Distinct Observations 35 87
Minimum 4.62 4.058
Maximum 7.805 9.8
Mean 5.795 5.994
Median 5.814 5.865
SD 0.765 0.95
SE of Mean 0.128 0.101
Site vs Background Two-Sample t-Test
H0: Mu of Site - Mu of Background <= 0
t-Test Critical
Method DF Value t (0.050) P-Value
Pooled (Equal Variance) 123 -1.117 1.657 0.867
Satterthwaite (Unequal Variance) 79.9 -1.224 1.664 0.888
Pooled SD 0.901
Conclusion with Alpha = 0.050
* Student t (Pooled) Test: Do Not Reject H0, Conclude Site <= Background
* Satterthwaite Test: Do Not Reject H0, Conclude Site <= Background
ProUCL Version 4.0 (Version 4.00.04)
FUGRO TECHNICAL SERVICES LIMITED
Fugro Development Centre, Tel : +852 2450 8233 5 Lok Yi Street, Tai Lam, Fax : +852 2450 6138 Tuen Mun, N.T., E-mail : [email protected] Hong Kong. Website : www.fugro.com
The copyright of this document is owned by Fugro Technical Services Limited. It may not be reproduced except with prior written approval from the Company.
A Fugro Group Company
Page 15 of 19
Dissolved Oxygen (Bottom)

SR2 - Dry Season DO (B) at Mid-Flood (mg/L)
Date DO(B) mg/L Date DO(B) mg/L Date DO(B) mg/L
26-Dec-2015 6.73 11-Nov-2017 6.32 21-Nov-2015 5.86
29-Dec-2015 6.80 14-Nov-2017 6.02 24-Dec-2015 6.61
31-Dec-2015 6.95 16-Nov-2017 5.98 9-Jan-2016 7.19
12-Jan-2016 7.30 18-Nov-2017 5.53 25-Feb-2017 7.45
14-Jan-2016 7.74 4-Nov-2017 6.08
26-Mar-2016 6.99 21-Nov-2017 6.13
29-Mar-2016 7.31
24-Dec-2016 7.40
27-Dec-2016 7.15
31-Dec-2016 7.41
3-Jan-2017 7.72
7-Jan-2017 7.35
10-Jan-2017 7.36
14-Jan-2017 6.13
17-Jan-2017 6.76
19-Jan-2017 6.57
21-Jan-2017 6.30
23-Jan-2017 6.55
25-Jan-2017 6.54
27-Jan-2017 6.31
31-Jan-2017 6.63
2-Feb-2017 6.58
4-Feb-2017 6.69
7-Feb-2017 6.80
9-Feb-2017 6.86
11-Feb-2017 7.14
14-Feb-2017 7.21
16-Feb-2017 7.28
18-Feb-2017 7.29
21-Feb-2017 7.46
23-Feb-2017 7.51
28-Feb-2017 7.37
2-Mar-2017 7.71
4-Mar-2017 7.36
7-Mar-2017 6.93
9-Mar-2017 7.45
11-Mar-2017 6.87
14-Mar-2017 6.81
16-Mar-2017 6.81
18-Mar-2017 6.86
21-Mar-2017 6.93
23-Mar-2017 6.75
25-Mar-2017 6.83
28-Mar-2017 6.79
30-Mar-2017 6.65
2-Nov-2017 6.14
7-Nov-2017 5.97
9-Nov-2017 5.99
No Dredging Work With Dredging Works

SR2 - Dry Season DO (B) at Mid-Flood (mg/L)
No Dredging Work With Dredging Works
Raw Statistics Raw Statistics
Number of Valid Observations 52 Number of Valid Observations 6
Number of Distinct Observations 52 Number of Distinct Observations 6
Minimum 5.53 Minimum 5.86
Maximum 7.735 Maximum 7.45
Mean of Raw Data 6.861 Mean of Raw Data 6.553
Standard Deviation of Raw Data 0.512 Standard Deviation of Raw Data 0.648
Kstar 168.3 Kstar 62.54
Mean of Log Transformed Data 1.923 Mean of Log Transformed Data 1.876
Standard Deviation of Log Transformed Data 0.0762 Standard Deviation of Log Transformed Data 0.0977
Normal Distribution Test Results Normal Distribution Test Results
Correlation Coefficient R 0.985 Correlation Coefficient R 0.96
Approximate Shapiro Wilk Test Statistic 0.96 Shapiro Wilk Test Statistic 0.902
Approximate Shapiro Wilk P Value 1.47E-01 Shapiro Wilk Critical (0.95) Value 0.788
Lilliefors Test Statistic 0.0984 Approximate Shapiro Wilk P Value N/A
Lilliefors Critical (0.95) Value 0.123 Lilliefors Test Statistic 0.245
Lilliefors Critical (0.95) Value 0.362
Data appear Normal at (0.05) Significance Level Data appear Normal at (0.05) Significance Level
t-Test Site vs Background Comparison for Full Data Sets without NDs
User Selected Options
Full Precision OFF
Confidence Coefficient 95%
Substantial Difference 0%
Selected Null Hypothesis Site or AOC Mean/Median Less Than or Equal to Background Mean/Median (Form 1)
Alternative Hypothesis Site or AOC Mean/Median Greater Than Background Mean/Median
Area of Concern Data: With Dredging Works
Background Data: No Dredging Work
Raw Statistics
Site Background
Number of Valid Observations 6 52
Number of Distinct Observations 6 52
Minimum 5.86 5.53
Maximum 7.45 7.735
Mean 6.553 6.861
Median 6.368 6.84
SD 0.648 0.512
SE of Mean 0.265 0.071
Site vs Background Two-Sample t-Test
H0: Mu of Site - Mu of Background <= 0
t-Test Critical
Method DF Value t (0.050) P-Value
Pooled (Equal Variance) 56 -1.362 1.673 0.911
Satterthwaite (Unequal Variance) 5.7 -1.126 1.943 0.847
Pooled SD 0.525
Conclusion with Alpha = 0.050
* Student t (Pooled) Test: Do Not Reject H0, Conclude Site <= Background
* Satterthwaite Test: Do Not Reject H0, Conclude Site <= Background
ProUCL Version 4.0 (Version 4.00.04)

SR2 - Wet Season DO (B) at Mid-Flood (mg/L)
Date DO(B) mg/L Date DO(B) mg/L Date DO(B) mg/L
4-Jun-2015 4.16 3-Jun-2017 6.32 2-Jun-2015 6.36
11-Jun-2015 5.58 6-Jun-2017 7.89 3-Sep-2015 4.21
14-Jul-2015 5.80 8-Jun-2017 7.83 12-Sep-2015 6.68
16-Jul-2015 5.14 10-Jun-2017 6.52 26-Sep-2015 6.39
18-Jul-2015 4.16 20-Jun-2017 5.63 6-Oct-2015 5.77
25-Jul-2015 5.48 22-Jun-2017 5.51 16-Apr-2016 6.72
1-Sep-2015 4.21 24-Jun-2017 5.20 4-Jun-2016 7.24
2-Apr-2016 8.64 27-Jun-2017 5.09 18-Jun-2016 5.90
14-Apr-2016 6.79 4-Jul-2017 6.24 2-Jul-2016 7.07
3-May-2016 7.45 6-Jul-2017 5.00 9-Jul-2016 4.32
7-May-2016 6.25 8-Jul-2017 6.69 12-Jul-2016 3.53
2-Jun-2016 7.60 15-Jul-2017 6.20 20-Apr-2017 6.94
14-Jul-2016 4.16 18-Jul-2017 6.34 29-Apr-2017 5.76
16-Jul-2016 5.89 20-Jul-2017 6.25 6-May-2017 5.91
19-Jul-2016 7.71 22-Jul-2017 6.20 11-May-2017 5.60
21-Jul-2016 3.96 25-Jul-2017 6.31 25-May-2017 5.65
23-Jul-2016 3.60 27-Jul-2017 4.15 15-Jun-2017 4.28
26-Jul-2016 3.54 29-Jul-2017 3.73 17-Jun-2017 4.74
28-Jul-2016 6.80 5-Aug-2017 4.43 29-Jun-2017 5.07
30-Jul-2016 8.10 15-Aug-2017 4.20 1-Jul-2017 4.66
4-Aug-2016 4.19 17-Aug-2017 6.96 11-Jul-2017 5.22
6-Aug-2016 3.96 19-Aug-2017 6.68 18-Jul-2017 6.34
9-Aug-2016 4.27 22-Aug-2017 5.25 20-Jul-2017 6.25
11-Aug-2016 4.18 24-Aug-2017 6.64 1-Aug-2017 5.22
13-Aug-2016 4.19 26-Aug-2017 4.51 3-Aug-2017 4.78
16-Aug-2016 5.49 29-Aug-2017 5.28 10-Aug-2017 4.16
20-Aug-2016 4.34 31-Aug-2017 5.55 7-Sep-2017 4.73
1-Apr-2017 7.10 2-Sep-2017 7.29 21-Sep-2017 4.74
4-Apr-2017 6.81 5-Sep-2017 5.59 23-Sep-2017 6.66
6-Apr-2017 7.82 9-Sep-2017 4.59 28-Sep-2017 5.11
8-Apr-2017 6.90 12-Sep-2017 4.28 12-Oct-2017 5.32
11-Apr-2017 6.59 14-Sep-2017 5.05 19-Oct-2017 5.55
13-Apr-2017 6.44 16-Sep-2017 5.89 21-Oct-2017 5.61
18-Apr-2017 7.02 19-Sep-2017 5.32 26-Oct-2017 5.69
22-Apr-2017 6.76 30-Sep-2017 5.71 28-Oct-2017 5.71
25-Apr-2017 5.65 3-Oct-2017 6.25 31-Oct-2017 5.98
27-Apr-2017 5.44 5-Oct-2017 4.56
2-May-2017 5.77 7-Oct-2017 4.97
4-May-2017 5.69 14-Oct-2017 5.66
9-May-2017 6.44 17-Oct-2017 5.82
13-May-2017 6.70 24-Oct-2017 5.51
16-May-2017 5.29
18-May-2017 6.38
20-May-2017 5.80
23-May-2017 5.35
27-May-2017 5.34
30-May-2017 5.05
1-Jun-2017 5.68
No Dredging Work With Dredging Works

SR2 - Wet Season DO (B) at Mid-Flood (mg/L)
No Dredging Work With Dredging Works
Raw Statistics Raw Statistics
Number of Valid Observations 89 Number of Valid Observations 36
Number of Distinct Observations 83 Number of Distinct Observations 35
Minimum 3.54 Minimum 3.53
Maximum 8.64 Maximum 7.24
Mean of Raw Data 5.714 Mean of Raw Data 5.55
Standard Deviation of Raw Data 1.159 Standard Deviation of Raw Data 0.911
Kstar 23.32 Kstar 33.62
Mean of Log Transformed Data 1.722 Mean of Log Transformed Data 1.7
Standard Deviation of Log Transformed Data 0.207 Standard Deviation of Log Transformed Data 0.17
Normal Distribution Test Results Normal Distribution Test Results
Correlation Coefficient R 0.991 Correlation Coefficient R 0.994
Approximate Shapiro Wilk Test Statistic 0.966 Shapiro Wilk Test Statistic 0.978
Approximate Shapiro Wilk P Value 9.24E-02 Shapiro Wilk Critical (0.95) Value 0.935
Lilliefors Test Statistic 0.0739 Approximate Shapiro Wilk P Value 7.61E-01
Lilliefors Critical (0.95) Value 0.0939 Lilliefors Test Statistic 0.0835
Lilliefors Critical (0.95) Value 0.148
Data appear Normal at (0.05) Significance Level Data appear Normal at (0.05) Significance Level
t-Test Site vs Background Comparison for Full Data Sets without NDs
User Selected Options
Full Precision OFF
Confidence Coefficient 95%
Substantial Difference 0%
Selected Null Hypothesis Site or AOC Mean/Median Less Than or Equal to Background Mean/Median (Form 1)
Alternative Hypothesis Site or AOC Mean/Median Greater Than Background Mean/Median
Area of Concern Data: With Dredging Works
Background Data: No Dredging Work
Raw Statistics
Site Background
Number of Valid Observations 36 89
Number of Distinct Observations 35 83
Minimum 3.53 3.54
Maximum 7.24 8.64
Mean 5.55 5.714
Median 5.629 5.655
SD 0.911 1.159
SE of Mean 0.152 0.123
Site vs Background Two-Sample t-Test
H0: Mu of Site - Mu of Background <= 0
t-Test Critical
Method DF Value t (0.050) P-Value
Pooled (Equal Variance) 123 -0.759 1.657 0.775
Satterthwaite (Unequal Variance) 81.9 -0.84 1.664 0.798
Pooled SD 1.094
Conclusion with Alpha = 0.050
* Student t (Pooled) Test: Do Not Reject H0, Conclude Site <= Background
* Satterthwaite Test: Do Not Reject H0, Conclude Site <= Background
ProUCL Version 4.0 (Version 4.00.04)

SR2 - Dry Season DO (B) at Mid-Ebb (mg/L)
Date DO(B) mg/L Date DO(B) mg/L Date DO(B) mg/L
26-Dec-2015 6.69 11-Nov-2017 6.32 21-Nov-2015 6.02
29-Dec-2015 6.90 14-Nov-2017 6.00 24-Dec-2015 6.34
31-Dec-2015 6.80 16-Nov-2017 5.94 9-Jan-2016 7.23
12-Jan-2016 7.52 18-Nov-2017 5.47 25-Feb-2017 7.46
14-Jan-2016 7.77 4-Nov-2017 6.08
26-Mar-2016 7.21 21-Nov-2017 6.10
29-Mar-2016 7.39
24-Dec-2016 7.44
27-Dec-2016 7.08
31-Dec-2016 7.46
3-Jan-2017 7.67
7-Jan-2017 7.36
10-Jan-2017 7.35
14-Jan-2017 6.23
17-Jan-2017 6.66
19-Jan-2017 6.43
21-Jan-2017 6.50
23-Jan-2017 6.60
25-Jan-2017 6.58
27-Jan-2017 6.78
31-Jan-2017 6.60
2-Feb-2017 6.60
4-Feb-2017 6.73
7-Feb-2017 6.74
9-Feb-2017 6.86
11-Feb-2017 7.16
14-Feb-2017 7.20
16-Feb-2017 7.27
18-Feb-2017 7.29
21-Feb-2017 7.42
23-Feb-2017 7.50
28-Feb-2017 7.35
2-Mar-2017 7.73
4-Mar-2017 7.46
7-Mar-2017 6.76
9-Mar-2017 7.70
11-Mar-2017 6.89
14-Mar-2017 6.79
16-Mar-2017 6.83
18-Mar-2017 6.86
21-Mar-2017 6.92
23-Mar-2017 6.74
25-Mar-2017 6.85
28-Mar-2017 6.78
30-Mar-2017 6.72
2-Nov-2017 6.14
7-Nov-2017 5.98
9-Nov-2017 5.99
No Dredging Work With Dredging Works

SR2 - Dry Season DO (B) at Mid-Ebb (mg/L)
No Dredging Work With Dredging Works
Raw Statistics Raw Statistics
Number of Valid Observations 52 Number of Valid Observations 6
Number of Distinct Observations 48 Number of Distinct Observations 6
Minimum 5.465 Minimum 6.02
Maximum 7.765 Maximum 7.455
Mean of Raw Data 6.882 Mean of Raw Data 6.537
Standard Deviation of Raw Data 0.522 Standard Deviation of Raw Data 0.638
Kstar 162.5 Kstar 65.41
Mean of Log Transformed Data 1.926 Mean of Log Transformed Data 1.874
Standard Deviation of Log Transformed Data 0.0775 Standard Deviation of Log Transformed Data 0.0951
Normal Distribution Test Results Normal Distribution Test Results
Correlation Coefficient R 0.984 Correlation Coefficient R 0.9
Approximate Shapiro Wilk Test Statistic 0.96 Shapiro Wilk Test Statistic 0.789
Approximate Shapiro Wilk P Value 1.37E-01 Shapiro Wilk Critical (0.95) Value 0.788
Lilliefors Test Statistic 0.089 Approximate Shapiro Wilk P Value N/A
Lilliefors Critical (0.95) Value 0.123 Lilliefors Test Statistic 0.288
Lilliefors Critical (0.95) Value 0.362
Data appear Normal at (0.05) Significance Level Data appear Normal at (0.05) Significance Level
t-Test Site vs Background Comparison for Full Data Sets without NDs
User Selected Options
Full Precision OFF
Confidence Coefficient 95%
Substantial Difference 0%
Selected Null Hypothesis Site or AOC Mean/Median Less Than or Equal to Background Mean/Median (Form 1)
Alternative Hypothesis Site or AOC Mean/Median Greater Than Background Mean/Median
Area of Concern Data: With Dredging Works
Background Data: No Dredging Work
Raw Statistics
Site Background
Number of Valid Observations 6 52
Number of Distinct Observations 6 48
Minimum 6.02 5.465
Maximum 7.455 7.765
Mean 6.537 6.882
Median 6.218 6.835
SD 0.638 0.522
SE of Mean 0.26 0.0724
Site vs Background Two-Sample t-Test
H0: Mu of Site - Mu of Background <= 0
t-Test Critical
Method DF Value t (0.050) P-Value
Pooled (Equal Variance) 56 -1.503 1.673 0.931
Satterthwaite (Unequal Variance) 5.8 -1.279 1.943 0.875
Pooled SD 0.534
Conclusion with Alpha = 0.050
* Student t (Pooled) Test: Do Not Reject H0, Conclude Site <= Background
* Satterthwaite Test: Do Not Reject H0, Conclude Site <= Background
ProUCL Version 4.0 (Version 4.00.04)

SR2 - Wet Season DO (B) at Mid-Ebb (mg/L)
Date DO(B) mg/L Date DO(B) mg/L Date DO(B) mg/L
4-Jun-2015 4.17 3-Jun-2017 6.39 2-Jun-2015 6.41
11-Jun-2015 4.75 6-Jun-2017 7.62 3-Sep-2015 4.17
14-Jul-2015 5.83 8-Jun-2017 7.89 12-Sep-2015 6.49
16-Jul-2015 5.20 10-Jun-2017 7.60 26-Sep-2015 6.37
18-Jul-2015 4.24 20-Jun-2017 5.64 6-Oct-2015 5.98
25-Jul-2015 5.03 22-Jun-2017 5.34 16-Apr-2016 6.75
1-Sep-2015 4.23 24-Jun-2017 5.19 4-Jun-2016 7.32
2-Apr-2016 8.51 27-Jun-2017 5.12 18-Jun-2016 5.81
14-Apr-2016 6.77 4-Jul-2017 6.25 2-Jul-2016 6.14
3-May-2016 6.90 6-Jul-2017 5.20 9-Jul-2016 3.76
7-May-2016 6.18 8-Jul-2017 6.72 12-Jul-2016 3.77
2-Jun-2016 7.02 15-Jul-2017 6.16 20-Apr-2017 6.95
14-Jul-2016 4.60 18-Jul-2017 6.26 29-Apr-2017 5.78
16-Jul-2016 5.85 20-Jul-2017 6.32 6-May-2017 5.72
19-Jul-2016 7.12 22-Jul-2017 6.04 11-May-2017 5.58
21-Jul-2016 3.95 25-Jul-2017 6.26 25-May-2017 5.66
23-Jul-2016 3.60 27-Jul-2017 4.17 15-Jun-2017 4.29
26-Jul-2016 3.79 29-Jul-2017 3.71 17-Jun-2017 4.20
28-Jul-2016 6.12 5-Aug-2017 4.39 29-Jun-2017 4.95
30-Jul-2016 7.73 15-Aug-2017 4.15 1-Jul-2017 4.64
4-Aug-2016 4.36 17-Aug-2017 6.66 11-Jul-2017 5.22
6-Aug-2016 3.95 19-Aug-2017 6.65 18-Jul-2017 6.26
9-Aug-2016 4.40 22-Aug-2017 5.17 20-Jul-2017 6.32
11-Aug-2016 4.16 24-Aug-2017 6.65 1-Aug-2017 5.22
13-Aug-2016 4.15 26-Aug-2017 4.81 3-Aug-2017 4.95
16-Aug-2016 5.30 29-Aug-2017 5.35 10-Aug-2017 4.15
20-Aug-2016 4.37 31-Aug-2017 5.95 7-Sep-2017 4.72
1-Apr-2017 7.07 2-Sep-2017 6.81 21-Sep-2017 4.77
4-Apr-2017 6.81 5-Sep-2017 5.60 23-Sep-2017 6.65
6-Apr-2017 7.84 9-Sep-2017 4.42 28-Sep-2017 5.26
8-Apr-2017 6.85 12-Sep-2017 4.22 12-Oct-2017 5.32
11-Apr-2017 7.20 14-Sep-2017 5.18 19-Oct-2017 5.55
13-Apr-2017 6.60 16-Sep-2017 5.84 21-Oct-2017 5.60
18-Apr-2017 7.01 19-Sep-2017 5.71 26-Oct-2017 5.66
22-Apr-2017 6.77 30-Sep-2017 5.74 28-Oct-2017 5.88
25-Apr-2017 5.68 3-Oct-2017 6.25 31-Oct-2017 5.99
27-Apr-2017 5.43 5-Oct-2017 4.57
2-May-2017 5.92 7-Oct-2017 4.54
4-May-2017 5.69 14-Oct-2017 5.60
9-May-2017 6.45 17-Oct-2017 5.78
13-May-2017 6.89 24-Oct-2017 5.51
16-May-2017 5.20
18-May-2017 5.90
20-May-2017 6.20
23-May-2017 5.35
27-May-2017 5.36
30-May-2017 5.20
1-Jun-2017 5.74
No Dredging Work With Dredging Works

SR2 - Wet Season DO (B) at Mid-Ebb (mg/L)
No Dredging Work With Dredging Works
Raw Statistics Raw Statistics
Number of Valid Observations 89 Number of Valid Observations 36
Number of Distinct Observations 79 Number of Distinct Observations 33
Minimum 3.6 Minimum 3.76
Maximum 8.51 Maximum 7.32
Mean of Raw Data 5.693 Mean of Raw Data 5.505
Standard Deviation of Raw Data 1.117 Standard Deviation of Raw Data 0.909
Kstar 24.87 Kstar 32.95
Mean of Log Transformed Data 1.72 Mean of Log Transformed Data 1.692
Standard Deviation of Log Transformed Data 0.201 Standard Deviation of Log Transformed Data 0.172
Normal Distribution Test Results Normal Distribution Test Results
Correlation Coefficient R 0.992 Correlation Coefficient R 0.992
Approximate Shapiro Wilk Test Statistic 0.967 Shapiro Wilk Test Statistic 0.972
Approximate Shapiro Wilk P Value 1.14E-01 Shapiro Wilk Critical (0.95) Value 0.935
Lilliefors Test Statistic 0.076 Approximate Shapiro Wilk P Value 5.81E-01
Lilliefors Critical (0.95) Value 0.0939 Lilliefors Test Statistic 0.101
Lilliefors Critical (0.95) Value 0.148
Data appear Normal at (0.05) Significance Level Data appear Normal at (0.05) Significance Level
t-Test Site vs Background Comparison for Full Data Sets without NDs
User Selected Options
Full Precision OFF
Confidence Coefficient 95%
Substantial Difference 0%
Selected Null Hypothesis Site or AOC Mean/Median Less Than or Equal to Background Mean/Median (Form 1)
Alternative Hypothesis Site or AOC Mean/Median Greater Than Background Mean/Median
Area of Concern Data: With Dredging Works
Background Data: No Dredging Work
Raw Statistics
Site Background
Number of Valid Observations 36 89
Number of Distinct Observations 33 79
Minimum 3.76 3.6
Maximum 7.32 8.51
Mean 5.505 5.693
Median 5.625 5.71
SD 0.909 1.117
SE of Mean 0.151 0.118
Site vs Background Two-Sample t-Test
H0: Mu of Site - Mu of Background <= 0
t-Test Critical
Method DF Value t (0.050) P-Value
Pooled (Equal Variance) 123 -0.897 1.657 0.814
Satterthwaite (Unequal Variance) 79.1 -0.978 1.664 0.834
Pooled SD 1.062
Conclusion with Alpha = 0.050
* Student t (Pooled) Test: Do Not Reject H0, Conclude Site <= Background
* Satterthwaite Test: Do Not Reject H0, Conclude Site <= Background
ProUCL Version 4.0 (Version 4.00.04)

SR3 - Dry Season DO (B) at Mid-Flood (mg/L)
Date DO(B) mg/L Date DO(B) mg/L Date DO(B) mg/L
26-Dec-2015 6.62 11-Nov-2017 6.37 21-Nov-2015 6.04
29-Dec-2015 6.79 14-Nov-2017 6.05 24-Dec-2015 6.48
31-Dec-2015 6.77 16-Nov-2017 5.96 9-Jan-2016 7.05
12-Jan-2016 7.24 18-Nov-2017 6.04 25-Feb-2017 7.13
14-Jan-2016 7.62 4-Nov-2017 6.07
26-Mar-2016 7.03 21-Nov-2017 6.04
29-Mar-2016 7.31
24-Dec-2016 7.28
27-Dec-2016 7.10
31-Dec-2016 7.36
3-Jan-2017 7.80
7-Jan-2017 7.38
10-Jan-2017 7.46
14-Jan-2017 6.92
17-Jan-2017 6.70
19-Jan-2017 6.32
21-Jan-2017 6.13
23-Jan-2017 6.16
25-Jan-2017 6.69
27-Jan-2017 6.52
31-Jan-2017 6.52
2-Feb-2017 6.55
4-Feb-2017 6.67
7-Feb-2017 6.75
9-Feb-2017 6.68
11-Feb-2017 7.05
14-Feb-2017 7.10
16-Feb-2017 7.11
18-Feb-2017 7.17
21-Feb-2017 7.24
23-Feb-2017 7.64
28-Feb-2017 7.37
2-Mar-2017 7.43
4-Mar-2017 7.24
7-Mar-2017 6.93
9-Mar-2017 7.23
11-Mar-2017 6.67
14-Mar-2017 6.73
16-Mar-2017 6.76
18-Mar-2017 6.82
21-Mar-2017 7.04
23-Mar-2017 6.67
25-Mar-2017 6.91
28-Mar-2017 6.76
30-Mar-2017 6.83
2-Nov-2017 6.14
7-Nov-2017 5.80
9-Nov-2017 5.82
No Dredging Work With Dredging Works

SR3 - Dry Season DO (B) at Mid-Flood (mg/L)
No Dredging Work With Dredging Works
Raw Statistics Raw Statistics
Number of Valid Observations 52 Number of Valid Observations 6
Number of Distinct Observations 48 Number of Distinct Observations 5
Minimum 5.795 Minimum 6.04
Maximum 7.8 Maximum 7.125
Mean of Raw Data 6.83 Mean of Raw Data 6.468
Standard Deviation of Raw Data 0.483 Standard Deviation of Raw Data 0.509
Kstar 188.4 Kstar 98.79
Mean of Log Transformed Data 1.919 Mean of Log Transformed Data 1.864
Standard Deviation of Log Transformed Data 0.0718 Standard Deviation of Log Transformed Data 0.0777
Normal Distribution Test Results Normal Distribution Test Results
Correlation Coefficient R 0.99 Correlation Coefficient R 0.911
Approximate Shapiro Wilk Test Statistic 0.967 Shapiro Wilk Test Statistic 0.799
Approximate Shapiro Wilk P Value 2.69E-01 Shapiro Wilk Critical (0.95) Value 0.788
Lilliefors Test Statistic 0.101 Approximate Shapiro Wilk P Value N/A
Lilliefors Critical (0.95) Value 0.123 Lilliefors Test Statistic 0.283
Lilliefors Critical (0.95) Value 0.362
Data appear Normal at (0.05) Significance Level Data appear Normal at (0.05) Significance Level
t-Test Site vs Background Comparison for Full Data Sets without NDs
User Selected Options
Full Precision OFF
Confidence Coefficient 95%
Substantial Difference 0%
Selected Null Hypothesis Site or AOC Mean/Median Less Than or Equal to Background Mean/Median (Form 1)
Alternative Hypothesis Site or AOC Mean/Median Greater Than Background Mean/Median
Area of Concern Data: With Dredging Works
Background Data: No Dredging Work
Raw Statistics
Site Background
Number of Valid Observations 6 52
Number of Distinct Observations 5 48
Minimum 6.04 5.795
Maximum 7.125 7.8
Mean 6.468 6.83
Median 6.275 6.803
SD 0.509 0.483
SE of Mean 0.208 0.067
Site vs Background Two-Sample t-Test
H0: Mu of Site - Mu of Background <= 0
t-Test Critical
Method DF Value t (0.050) P-Value
Pooled (Equal Variance) 56 -1.729 1.673 0.955
Satterthwaite (Unequal Variance) 6.1 -1.658 1.943 0.926
Pooled SD 0.485
Conclusion with Alpha = 0.050
* Student t (Pooled) Test: Do Not Reject H0, Conclude Site <= Background
* Satterthwaite Test: Do Not Reject H0, Conclude Site <= Background
ProUCL Version 4.0 (Version 4.00.04)

SR3 - Wet Season DO (B) at Mid-Flood (mg/L)
Date DO(B) mg/L Date DO(B) mg/L Date DO(B) mg/L
4-Jun-2015 4.15 3-Jun-2017 6.36 2-Jun-2015 6.59
11-Jun-2015 5.70 6-Jun-2017 7.33 3-Sep-2015 4.53
14-Jul-2015 5.85 8-Jun-2017 7.60 12-Sep-2015 6.64
16-Jul-2015 5.18 10-Jun-2017 6.04 26-Sep-2015 6.41
18-Jul-2015 4.18 20-Jun-2017 5.58 6-Oct-2015 6.07
25-Jul-2015 5.07 22-Jun-2017 6.05 16-Apr-2016 6.77
1-Sep-2015 4.34 24-Jun-2017 5.34 4-Jun-2016 7.02
2-Apr-2016 8.36 27-Jun-2017 5.15 18-Jun-2016 5.62
14-Apr-2016 6.61 4-Jul-2017 6.00 2-Jul-2016 6.47
3-May-2016 7.21 6-Jul-2017 5.62 9-Jul-2016 4.15
7-May-2016 6.15 8-Jul-2017 5.73 12-Jul-2016 3.26
2-Jun-2016 7.61 15-Jul-2017 6.72 20-Apr-2017 7.55
14-Jul-2016 4.12 18-Jul-2017 5.75 29-Apr-2017 5.77
16-Jul-2016 6.08 20-Jul-2017 6.35 6-May-2017 5.78
19-Jul-2016 7.21 22-Jul-2017 6.22 11-May-2017 5.60
21-Jul-2016 3.67 25-Jul-2017 6.19 25-May-2017 5.71
23-Jul-2016 3.69 27-Jul-2017 4.18 15-Jun-2017 4.61
26-Jul-2016 4.45 29-Jul-2017 4.03 17-Jun-2017 4.74
28-Jul-2016 6.59 5-Aug-2017 4.23 29-Jun-2017 4.88
30-Jul-2016 8.11 15-Aug-2017 4.82 1-Jul-2017 5.86
4-Aug-2016 4.16 17-Aug-2017 6.82 11-Jul-2017 4.62
6-Aug-2016 4.03 19-Aug-2017 6.81 18-Jul-2017 5.75
9-Aug-2016 4.57 22-Aug-2017 5.17 20-Jul-2017 6.35
11-Aug-2016 4.21 24-Aug-2017 6.71 1-Aug-2017 5.51
13-Aug-2016 4.30 26-Aug-2017 4.52 3-Aug-2017 4.92
16-Aug-2016 5.35 29-Aug-2017 5.31 10-Aug-2017 4.27
20-Aug-2016 4.32 31-Aug-2017 5.52 7-Sep-2017 4.63
1-Apr-2017 7.16 2-Sep-2017 6.50 21-Sep-2017 4.60
4-Apr-2017 6.73 5-Sep-2017 5.53 23-Sep-2017 6.72
6-Apr-2017 7.91 9-Sep-2017 4.83 28-Sep-2017 5.64
8-Apr-2017 6.82 12-Sep-2017 4.31 12-Oct-2017 5.52
11-Apr-2017 6.99 14-Sep-2017 5.27 19-Oct-2017 5.50
13-Apr-2017 6.39 16-Sep-2017 5.62 21-Oct-2017 5.42
18-Apr-2017 7.14 19-Sep-2017 5.43 26-Oct-2017 5.45
22-Apr-2017 6.97 30-Sep-2017 5.14 28-Oct-2017 5.80
25-Apr-2017 5.67 3-Oct-2017 6.13 31-Oct-2017 5.85
27-Apr-2017 5.30 5-Oct-2017 4.54
2-May-2017 5.87 7-Oct-2017 4.90
4-May-2017 5.33 14-Oct-2017 5.63
9-May-2017 6.57 17-Oct-2017 5.75
13-May-2017 6.77 24-Oct-2017 5.46
16-May-2017 5.46
18-May-2017 6.36
20-May-2017 5.74
23-May-2017 5.95
27-May-2017 5.25
30-May-2017 5.33
1-Jun-2017 6.17
No Dredging Work With Dredging Works

SR3 - Wet Season DO (B) at Mid-Flood (mg/L)
No Dredging Work With Dredging Works
Raw Statistics Raw Statistics
Number of Valid Observations 89 Number of Valid Observations 36
Number of Distinct Observations 84 Number of Distinct Observations 36
Minimum 3.67 Minimum 3.26
Maximum 8.36 Maximum 7.55
Mean of Raw Data 5.71 Mean of Raw Data 5.569
Standard Deviation of Raw Data 1.081 Standard Deviation of Raw Data 0.912
Kstar 26.85 Kstar 33.19
Mean of Log Transformed Data 1.724 Mean of Log Transformed Data 1.703
Standard Deviation of Log Transformed Data 0.193 Standard Deviation of Log Transformed Data 0.172
Normal Distribution Test Results Normal Distribution Test Results
Correlation Coefficient R 0.993 Correlation Coefficient R 0.988
Approximate Shapiro Wilk Test Statistic 0.968 Shapiro Wilk Test Statistic 0.979
Approximate Shapiro Wilk P Value 1.24E-01 Shapiro Wilk Critical (0.95) Value 0.935
Lilliefors Test Statistic 0.0677 Approximate Shapiro Wilk P Value 7.76E-01
Lilliefors Critical (0.95) Value 0.0939 Lilliefors Test Statistic 0.127
Lilliefors Critical (0.95) Value 0.148
Data appear Normal at (0.05) Significance Level Data appear Normal at (0.05) Significance Level
t-Test Site vs Background Comparison for Full Data Sets without NDs
User Selected Options
Full Precision OFF
Confidence Coefficient 95%
Substantial Difference 0%
Selected Null Hypothesis Site or AOC Mean/Median Less Than or Equal to Background Mean/Median (Form 1)
Alternative Hypothesis Site or AOC Mean/Median Greater Than Background Mean/Median
Area of Concern Data: With Dredging Works
Background Data: No Dredging Work
Raw Statistics
Site Background
Number of Valid Observations 36 89
Number of Distinct Observations 36 84
Minimum 3.26 3.67
Maximum 7.55 8.36
Mean 5.569 5.71
Median 5.628 5.67
SD 0.912 1.081
SE of Mean 0.152 0.115
Site vs Background Two-Sample t-Test
H0: Mu of Site - Mu of Background <= 0
t-Test Critical
Method DF Value t (0.050) P-Value
Pooled (Equal Variance) 123 -0.687 1.657 0.753
Satterthwaite (Unequal Variance) 76.2 -0.738 1.665 0.769
Pooled SD 1.035
Conclusion with Alpha = 0.050
* Student t (Pooled) Test: Do Not Reject H0, Conclude Site <= Background
* Satterthwaite Test: Do Not Reject H0, Conclude Site <= Background
ProUCL Version 4.0 (Version 4.00.04)

SR3 - Dry Season DO (B) at Mid-Ebb (mg/L)
Date DO(B) mg/L Date DO(B) mg/L Date DO(B) mg/L
26-Dec-2015 6.59 11-Nov-2017 6.39 21-Nov-2015 5.99
29-Dec-2015 6.89 14-Nov-2017 6.07 24-Dec-2015 6.55
31-Dec-2015 6.49 16-Nov-2017 5.97 9-Jan-2016 7.15
12-Jan-2016 7.35 18-Nov-2017 5.59 25-Feb-2017 7.12
14-Jan-2016 7.86 4-Nov-2017 6.08
26-Mar-2016 7.70 21-Nov-2017 5.76
29-Mar-2016 7.44
24-Dec-2016 7.27
27-Dec-2016 7.01
31-Dec-2016 7.37
3-Jan-2017 7.78
7-Jan-2017 7.35
10-Jan-2017 7.34
14-Jan-2017 6.11
17-Jan-2017 6.51
19-Jan-2017 6.23
21-Jan-2017 6.22
23-Jan-2017 6.29
25-Jan-2017 6.39
27-Jan-2017 6.69
31-Jan-2017 6.52
2-Feb-2017 6.25
4-Feb-2017 6.72
7-Feb-2017 6.66
9-Feb-2017 6.62
11-Feb-2017 7.06
14-Feb-2017 7.11
16-Feb-2017 7.12
18-Feb-2017 7.13
21-Feb-2017 7.26
23-Feb-2017 7.64
28-Feb-2017 7.46
2-Mar-2017 7.48
4-Mar-2017 7.24
7-Mar-2017 6.67
9-Mar-2017 7.24
11-Mar-2017 6.69
14-Mar-2017 6.91
16-Mar-2017 6.85
18-Mar-2017 6.83
21-Mar-2017 6.85
23-Mar-2017 6.58
25-Mar-2017 6.87
28-Mar-2017 6.87
30-Mar-2017 6.81
2-Nov-2017 6.25
7-Nov-2017 5.81
9-Nov-2017 5.81
No Dredging Work With Dredging Works

SR3 - Dry Season DO (B) at Mid-Ebb (mg/L)
No Dredging Work With Dredging Works
Raw Statistics Raw Statistics
Number of Valid Observations 52 Number of Valid Observations 6
Number of Distinct Observations 49 Number of Distinct Observations 6
Minimum 5.585 Minimum 5.755
Maximum 7.855 Maximum 7.15
Mean of Raw Data 6.809 Mean of Raw Data 6.441
Standard Deviation of Raw Data 0.54 Standard Deviation of Raw Data 0.597
Kstar 150.9 Kstar 70.63
Mean of Log Transformed Data 1.915 Mean of Log Transformed Data 1.859
Standard Deviation of Log Transformed Data 0.0802 Standard Deviation of Log Transformed Data 0.0921
Normal Distribution Test Results Normal Distribution Test Results
Correlation Coefficient R 0.996 Correlation Coefficient R 0.955
Approximate Shapiro Wilk Test Statistic 0.979 Shapiro Wilk Test Statistic 0.885
Approximate Shapiro Wilk P Value 6.67E-01 Shapiro Wilk Critical (0.95) Value 0.788
Lilliefors Test Statistic 0.0734 Approximate Shapiro Wilk P Value N/A
Lilliefors Critical (0.95) Value 0.123 Lilliefors Test Statistic 0.227
Lilliefors Critical (0.95) Value 0.362
Data appear Normal at (0.05) Significance Level Data appear Normal at (0.05) Significance Level
t-Test Site vs Background Comparison for Full Data Sets without NDs
User Selected Options
Full Precision OFF
Confidence Coefficient 95%
Substantial Difference 0%
Selected Null Hypothesis Site or AOC Mean/Median Less Than or Equal to Background Mean/Median (Form 1)
Alternative Hypothesis Site or AOC Mean/Median Greater Than Background Mean/Median
Area of Concern Data: With Dredging Works
Background Data: No Dredging Work
Raw Statistics
Site Background
Number of Valid Observations 6 52
Number of Distinct Observations 6 49
Minimum 5.755 5.585
Maximum 7.15 7.855
Mean 6.441 6.809
Median 6.315 6.835
SD 0.597 0.54
SE of Mean 0.244 0.0748
Site vs Background Two-Sample t-Test
H0: Mu of Site - Mu of Background <= 0
t-Test Critical
Method DF Value t (0.050) P-Value
Pooled (Equal Variance) 56 -1.568 1.673 0.939
Satterthwaite (Unequal Variance) 6 -1.446 1.943 0.901
Pooled SD 0.545
Conclusion with Alpha = 0.050
* Student t (Pooled) Test: Do Not Reject H0, Conclude Site <= Background
* Satterthwaite Test: Do Not Reject H0, Conclude Site <= Background
ProUCL Version 4.0 (Version 4.00.04)

SR3 - Wet Season DO (B) at Mid-Ebb (mg/L)
Date DO(B) mg/L Date DO(B) mg/L Date DO(B) mg/L
4-Jun-2015 4.28 3-Jun-2017 6.37 2-Jun-2015 6.34
11-Jun-2015 5.12 6-Jun-2017 7.29 3-Sep-2015 4.52
14-Jul-2015 5.81 8-Jun-2017 7.61 12-Sep-2015 6.45
16-Jul-2015 5.23 10-Jun-2017 7.60 26-Sep-2015 6.30
18-Jul-2015 4.19 20-Jun-2017 5.49 6-Oct-2015 6.15
25-Jul-2015 5.55 22-Jun-2017 5.43 16-Apr-2016 6.60
1-Sep-2015 4.31 24-Jun-2017 5.35 4-Jun-2016 7.07
2-Apr-2016 8.57 27-Jun-2017 5.41 18-Jun-2016 5.65
14-Apr-2016 6.74 4-Jul-2017 5.97 2-Jul-2016 5.68
3-May-2016 6.69 6-Jul-2017 5.85 9-Jul-2016 4.35
7-May-2016 6.17 8-Jul-2017 5.69 12-Jul-2016 3.56
2-Jun-2016 6.73 15-Jul-2017 6.73 20-Apr-2017 7.56
14-Jul-2016 4.35 18-Jul-2017 6.15 29-Apr-2017 5.74
16-Jul-2016 6.10 20-Jul-2017 6.08 6-May-2017 5.81
19-Jul-2016 7.32 22-Jul-2017 6.65 11-May-2017 5.58
21-Jul-2016 4.01 25-Jul-2017 6.27 25-May-2017 5.64
23-Jul-2016 3.79 27-Jul-2017 4.15 15-Jun-2017 4.13
26-Jul-2016 4.14 29-Jul-2017 3.95 17-Jun-2017 4.19
28-Jul-2016 6.00 5-Aug-2017 4.19 29-Jun-2017 4.83
30-Jul-2016 7.05 15-Aug-2017 4.36 1-Jul-2017 5.99
4-Aug-2016 4.48 17-Aug-2017 6.72 11-Jul-2017 4.78
6-Aug-2016 3.90 19-Aug-2017 7.17 18-Jul-2017 6.15
9-Aug-2016 4.33 22-Aug-2017 5.13 20-Jul-2017 6.08
11-Aug-2016 4.32 24-Aug-2017 6.69 1-Aug-2017 5.30
13-Aug-2016 4.45 26-Aug-2017 4.90 3-Aug-2017 5.51
16-Aug-2016 4.97 29-Aug-2017 5.30 10-Aug-2017 4.28
20-Aug-2016 4.44 31-Aug-2017 5.56 7-Sep-2017 4.63
1-Apr-2017 6.91 2-Sep-2017 6.56 21-Sep-2017 4.58
4-Apr-2017 6.88 5-Sep-2017 5.56 23-Sep-2017 6.69
6-Apr-2017 7.96 9-Sep-2017 4.82 28-Sep-2017 5.68
8-Apr-2017 6.83 12-Sep-2017 4.25 12-Oct-2017 5.35
11-Apr-2017 6.97 14-Sep-2017 5.28 19-Oct-2017 5.58
13-Apr-2017 6.44 16-Sep-2017 5.68 21-Oct-2017 5.42
18-Apr-2017 7.14 19-Sep-2017 5.58 26-Oct-2017 5.45
22-Apr-2017 7.03 30-Sep-2017 4.67 28-Oct-2017 5.92
25-Apr-2017 5.68 3-Oct-2017 6.14 31-Oct-2017 6.16
27-Apr-2017 5.49 5-Oct-2017 4.45
2-May-2017 5.78 7-Oct-2017 4.82
4-May-2017 5.90 14-Oct-2017 5.63
9-May-2017 6.14 17-Oct-2017 5.72
13-May-2017 6.88 24-Oct-2017 5.48
16-May-2017 5.03
18-May-2017 5.82
20-May-2017 5.77
23-May-2017 5.41
27-May-2017 5.32
30-May-2017 5.40
1-Jun-2017 5.87
No Dredging Work With Dredging Works

SR3 - Wet Season DO (B) at Mid-Ebb (mg/L)
No Dredging Work With Dredging Works
Raw Statistics Raw Statistics
Number of Valid Observations 89 Number of Valid Observations 36
Number of Distinct Observations 83 Number of Distinct Observations 34
Minimum 3.79 Minimum 3.56
Maximum 8.57 Maximum 7.56
Mean of Raw Data 5.687 Mean of Raw Data 5.545
Standard Deviation of Raw Data 1.063 Standard Deviation of Raw Data 0.888
Kstar 27.71 Kstar 35.14
Mean of Log Transformed Data 1.721 Mean of Log Transformed Data 1.7
Standard Deviation of Log Transformed Data 0.19 Standard Deviation of Log Transformed Data 0.167
Normal Distribution Test Results Normal Distribution Test Results
Correlation Coefficient R 0.99 Correlation Coefficient R 0.989
Approximate Shapiro Wilk Test Statistic 0.965 Shapiro Wilk Test Statistic 0.978
Approximate Shapiro Wilk P Value 7.83E-02 Shapiro Wilk Critical (0.95) Value 0.935
Lilliefors Test Statistic 0.0855 Approximate Shapiro Wilk P Value 7.64E-01
Lilliefors Critical (0.95) Value 0.0939 Lilliefors Test Statistic 0.114
Lilliefors Critical (0.95) Value 0.148
Data appear Normal at (0.05) Significance Level Data appear Normal at (0.05) Significance Level
t-Test Site vs Background Comparison for Full Data Sets without NDs
User Selected Options
Full Precision OFF
Confidence Coefficient 95%
Substantial Difference 0%
Selected Null Hypothesis Site or AOC Mean/Median Less Than or Equal to Background Mean/Median (Form 1)
Alternative Hypothesis Site or AOC Mean/Median Greater Than Background Mean/Median
Area of Concern Data: With Dredging Works
Background Data: No Dredging Work
Raw Statistics
Site Background
Number of Valid Observations 36 89
Number of Distinct Observations 34 83
Minimum 3.56 3.79
Maximum 7.56 8.57
Mean 5.545 5.687
Median 5.643 5.675
SD 0.888 1.063
SE of Mean 0.148 0.113
Site vs Background Two-Sample t-Test
H0: Mu of Site - Mu of Background <= 0
t-Test Critical
Method DF Value t (0.050) P-Value
Pooled (Equal Variance) 123 -0.71 1.657 0.761
Satterthwaite (Unequal Variance) 77.1 -0.767 1.665 0.777
Pooled SD 1.016
Conclusion with Alpha = 0.050
* Student t (Pooled) Test: Do Not Reject H0, Conclude Site <= Background
* Satterthwaite Test: Do Not Reject H0, Conclude Site <= Background
ProUCL Version 4.0 (Version 4.00.04)

FUGRO TECHNICAL SERVICES LIMITED
Fugro Development Centre, Tel : +852 2450 8233 5 Lok Yi Street, Tai Lam, Fax : +852 2450 6138 Tuen Mun, N.T., E-mail : [email protected] Hong Kong. Website : www.fugro.com
The copyright of this document is owned by Fugro Technical Services Limited. It may not be reproduced except with prior written approval from the Company.
A Fugro Group Company
Page 16 of 19
Turbidity

SR2 - Dry Season Turbidity at Mid-Flood (NTU)
Date Turbidity NTU Date Turbidity NTU Date Turbidity NTU
26-Dec-2015 2.9 11-Nov-2017 3.4 21-Nov-2015 1.6
29-Dec-2015 2.7 14-Nov-2017 6.1 24-Dec-2015 2.3
31-Dec-2015 1.7 16-Nov-2017 4.6 9-Jan-2016 0.5
12-Jan-2016 0.7 18-Nov-2017 3.8 25-Feb-2017 2.1
14-Jan-2016 0.5 4-Nov-2017 5.4
26-Mar-2016 2.0 21-Nov-2017 4.7
29-Mar-2016 1.5
24-Dec-2016 0.8
27-Dec-2016 1.6
31-Dec-2016 2.0
3-Jan-2017 2.2
7-Jan-2017 1.7
10-Jan-2017 1.7
14-Jan-2017 4.1
17-Jan-2017 3.0
19-Jan-2017 1.4
21-Jan-2017 1.0
23-Jan-2017 1.3
25-Jan-2017 1.8
27-Jan-2017 3.1
31-Jan-2017 3.1
2-Feb-2017 3.3
4-Feb-2017 2.0
7-Feb-2017 1.6
9-Feb-2017 2.4
11-Feb-2017 3.1
14-Feb-2017 2.4
16-Feb-2017 1.2
18-Feb-2017 0.7
21-Feb-2017 0.9
23-Feb-2017 0.7
28-Feb-2017 0.3
2-Mar-2017 1.9
4-Mar-2017 0.8
7-Mar-2017 0.8
9-Mar-2017 1.0
11-Mar-2017 0.3
14-Mar-2017 0.7
16-Mar-2017 0.4
18-Mar-2017 1.1
21-Mar-2017 0.7
23-Mar-2017 0.1
25-Mar-2017 0.3
28-Mar-2017 1.3
30-Mar-2017 0.5
2-Nov-2017 5.3
7-Nov-2017 2.0
9-Nov-2017 2.1
No Dredging Work With Dredging Works

SR2 - Dry Season Turbidity at Mid-Flood (NTU)
No Dredging Work With Dredging Works
Raw Statistics Raw Statistics
Number of Valid Observations 52 Number of Valid Observations 6
Number of Distinct Observations 51 Number of Distinct Observations 6
Minimum 0.1 Minimum 0.467
Maximum 6.117 Maximum 5.433
Mean of Raw Data 1.854 Mean of Raw Data 2.767
Standard Deviation of Raw Data 1.328 Standard Deviation of Raw Data 1.902
Kstar 1.788 Kstar 1.136
Mean of Log Transformed Data 0.329 Mean of Log Transformed Data 0.754
Standard Deviation of Log Transformed Data 0.843 Standard Deviation of Log Transformed Data 0.882
Normal Distribution Test Results Normal Distribution Test Results
Correlation Coefficient R 0.954 Correlation Coefficient R 0.964
Approximate Shapiro Wilk Test Statistic 0.907 Shapiro Wilk Test Statistic 0.921
Approximate Shapiro Wilk P Value 4.26E-04 Shapiro Wilk Critical (0.95) Value 0.788
Lilliefors Test Statistic 0.119 Approximate Shapiro Wilk P Value N/A
Lilliefors Critical (0.95) Value 0.123 Lilliefors Test Statistic 0.257
Lilliefors Critical (0.95) Value 0.362
Data appear Normal at (0.05) Significance Level Data appear Normal at (0.05) Significance Level
t-Test Site vs Background Comparison for Full Data Sets without NDs
User Selected Options
Full Precision OFF
Confidence Coefficient 95%
Substantial Difference 0%
Selected Null Hypothesis Site or AOC Mean/Median Less Than or Equal to Background Mean/Median (Form 1)
Alternative Hypothesis Site or AOC Mean/Median Greater Than Background Mean/Median
Area of Concern Data: With Dredging Works
Background Data: No Dredging Work
Raw Statistics
Site Background
Number of Valid Observations 6 52
Number of Distinct Observations 6 51
Minimum 0.467 0.1
Maximum 5.433 6.117
Mean 2.767 1.854
Median 2.208 1.633
SD 1.902 1.328
SE of Mean 0.777 0.184
Site vs Background Two-Sample t-Test
H0: Mu of Site - Mu of Background <= 0
t-Test Critical
Method DF Value t (0.050) P-Value
Pooled (Equal Variance) 56 1.524 1.673 0.067
Satterthwaite (Unequal Variance) 5.6 1.143 1.943 0.15
Pooled SD 1.389
Conclusion with Alpha = 0.050
* Student t (Pooled) Test: Do Not Reject H0, Conclude Site <= Background
* Satterthwaite Test: Do Not Reject H0, Conclude Site <= Background
ProUCL Version 4.0 (Version 4.00.04)

SR2 - Wet Season Turbidity at Mid-Flood (NTU)
Date Turbidity NTU Date Turbidity NTU Date Turbidity NTU
4-Jun-2015 2.4 3-Jun-2017 0.4 2-Jun-2015 3.9
11-Jun-2015 0.4 6-Jun-2017 1.6 3-Sep-2015 2.0
14-Jul-2015 2.7 8-Jun-2017 1.5 12-Sep-2015 4.6
16-Jul-2015 4.6 10-Jun-2017 0.8 26-Sep-2015 4.2
18-Jul-2015 3.0 20-Jun-2017 1.7 6-Oct-2015 2.4
25-Jul-2015 2.3 22-Jun-2017 1.3 16-Apr-2016 0.6
1-Sep-2015 5.1 24-Jun-2017 1.1 4-Jun-2016 0.8
2-Apr-2016 1.0 27-Jun-2017 1.4 18-Jun-2016 1.7
14-Apr-2016 0.9 4-Jul-2017 0.5 2-Jul-2016 0.5
3-May-2016 1.3 6-Jul-2017 0.6 9-Jul-2016 2.4
7-May-2016 4.5 8-Jul-2017 1.3 12-Jul-2016 1.0
2-Jun-2016 0.4 15-Jul-2017 1.6 20-Apr-2017 0.8
14-Jul-2016 0.7 18-Jul-2017 1.1 29-Apr-2017 2.8
16-Jul-2016 3.3 20-Jul-2017 1.0 6-May-2017 1.5
19-Jul-2016 3.2 22-Jul-2017 2.2 11-May-2017 1.4
21-Jul-2016 1.5 25-Jul-2017 1.3 25-May-2017 2.8
23-Jul-2016 0.8 27-Jul-2017 3.4 15-Jun-2017 2.3
26-Jul-2016 1.3 29-Jul-2017 3.1 17-Jun-2017 0.8
28-Jul-2016 1.0 5-Aug-2017 1.2 29-Jun-2017 1.2
30-Jul-2016 4.0 15-Aug-2017 1.5 1-Jul-2017 2.0
4-Aug-2016 3.5 17-Aug-2017 0.7 11-Jul-2017 1.0
6-Aug-2016 1.2 19-Aug-2017 1.1 18-Jul-2017 1.1
9-Aug-2016 1.4 22-Aug-2017 1.8 20-Jul-2017 1.0
11-Aug-2016 1.9 24-Aug-2017 0.7 1-Aug-2017 1.5
13-Aug-2016 0.9 26-Aug-2017 1.3 3-Aug-2017 2.1
16-Aug-2016 2.8 29-Aug-2017 10.1 10-Aug-2017 0.4
20-Aug-2016 1.4 31-Aug-2017 1.6 7-Sep-2017 9.0
1-Apr-2017 0.8 2-Sep-2017 8.5 21-Sep-2017 10.3
4-Apr-2017 0.6 5-Sep-2017 12.4 23-Sep-2017 0.7
6-Apr-2017 0.4 9-Sep-2017 9.9 28-Sep-2017 9.7
8-Apr-2017 1.0 12-Sep-2017 5.9 12-Oct-2017 9.0
11-Apr-2017 1.2 14-Sep-2017 7.3 19-Oct-2017 10.5
13-Apr-2017 1.7 16-Sep-2017 1.8 21-Oct-2017 4.0
18-Apr-2017 1.2 19-Sep-2017 10.2 26-Oct-2017 1.9
22-Apr-2017 0.9 30-Sep-2017 8.5 28-Oct-2017 2.5
25-Apr-2017 4.6 3-Oct-2017 1.2 31-Oct-2017 2.0
27-Apr-2017 3.9 5-Oct-2017 1.4
2-May-2017 2.4 7-Oct-2017 4.1
4-May-2017 2.5 14-Oct-2017 7.0
9-May-2017 1.6 17-Oct-2017 1.3
13-May-2017 2.6 24-Oct-2017 2.0
16-May-2017 0.4
18-May-2017 0.5
20-May-2017 0.5
23-May-2017 0.7
27-May-2017 0.8
30-May-2017 0.6
1-Jun-2017 1.2
No Dredging Work With Dredging Works

SR2 - Wet Season Turbidity at Mid-Flood (NTU)
No Dredging Work With Dredging Works
Raw Statistics Raw Statistics
Number of Valid Observations 89 Number of Valid Observations 36
Number of Distinct Observations 81 Number of Distinct Observations 34
Minimum 0.367 Minimum 0.433
Maximum 12.43 Maximum 10.48
Mean of Raw Data 2.409 Mean of Raw Data 2.96
Standard Deviation of Raw Data 2.508 Standard Deviation of Raw Data 2.959
Kstar 1.4 Kstar 1.312
Mean of Log Transformed Data 0.494 Mean of Log Transformed Data 0.691
Standard Deviation of Log Transformed Data 0.846 Standard Deviation of Log Transformed Data 0.88
Normal Distribution Test Results Normal Distribution Test Results
Correlation Coefficient R 0.843 Correlation Coefficient R 0.856
Approximate Shapiro Wilk Test Statistic 0.713 Shapiro Wilk Test Statistic 0.724
Approximate Shapiro Wilk P Value 0.00E+00 Shapiro Wilk Critical (0.95) Value 0.935
Lilliefors Test Statistic 0.234 Approximate Shapiro Wilk P Value 4.19E-08
Lilliefors Critical (0.95) Value 0.0939 Lilliefors Test Statistic 0.267
Lilliefors Critical (0.95) Value 0.148
Data not Normal at (0.05) Significance Level Data not Normal at (0.05) Significance Level
Wilcoxon-Mann-Whitney Site vs Background Comparison Test for Full Data Sets without NDs
User Selected Options
Full Precision OFF
Confidence Coefficient 95%
Substantial Difference 0%
Selected Null Hypothesis Site or AOC Mean/Median Less Than or Equal to Background Mean/Median (Form 1)
Alternative Hypothesis Site or AOC Mean/Median Greater Than Background Mean/Median
Area of Concern Data: With Dredging Works
Background Data: No Dredging Work
Raw Statistics
Site Background
Number of Valid Observations 36 89
Number of Distinct Observations 34 81
Minimum 0.433 0.367
Maximum 10.48 12.43
Mean 2.96 2.409
Median 1.994 1.433
SD 2.959 2.508
SE of Mean 0.493 0.266
Wilcoxon-Mann-Whitney (WMW) Test
H0: Mean/Median of Site or AOC <= Mean/Median of Background
Site Rank Sum W-Stat 2486
WMW Test U-Stat 1.183
WMW Critical Value (0.050) 1.645
P-Value 0.118
Conclusion with Alpha = 0.05
Do Not Reject H0, Conclude Site <= Background
P-Value >= alpha (0.05)
ProUCL Version 4.0 (Version 4.00.04)

SR2 - Dry Season Turbidity at Mid-Ebb (NTU)
Date Turbidity NTU Date Turbidity NTU Date Turbidity NTU
26-Dec-2015 3.6 11-Nov-2017 3.4 21-Nov-2015 2.2
29-Dec-2015 1.3 14-Nov-2017 5.7 24-Dec-2015 2.1
31-Dec-2015 1.2 16-Nov-2017 4.5 9-Jan-2016 0.2
12-Jan-2016 0.3 18-Nov-2017 5.1 25-Feb-2017 2.1
14-Jan-2016 0.3 4-Nov-2017 6.6
26-Mar-2016 2.1 21-Nov-2017 5.1
29-Mar-2016 1.3
24-Dec-2016 0.8
27-Dec-2016 1.9
31-Dec-2016 2.3
3-Jan-2017 2.5
7-Jan-2017 1.8
10-Jan-2017 1.6
14-Jan-2017 3.0
17-Jan-2017 2.6
19-Jan-2017 1.9
21-Jan-2017 1.0
23-Jan-2017 1.4
25-Jan-2017 1.4
27-Jan-2017 2.0
31-Jan-2017 3.2
2-Feb-2017 3.3
4-Feb-2017 1.8
7-Feb-2017 1.4
9-Feb-2017 2.3
11-Feb-2017 2.6
14-Feb-2017 2.4
16-Feb-2017 1.2
18-Feb-2017 0.7
21-Feb-2017 0.6
23-Feb-2017 0.7
28-Feb-2017 0.4
2-Mar-2017 2.0
4-Mar-2017 0.9
7-Mar-2017 0.9
9-Mar-2017 0.9
11-Mar-2017 0.4
14-Mar-2017 0.8
16-Mar-2017 0.5
18-Mar-2017 0.6
21-Mar-2017 0.9
23-Mar-2017 0.3
25-Mar-2017 0.5
28-Mar-2017 1.4
30-Mar-2017 0.6
2-Nov-2017 5.8
7-Nov-2017 2.0
9-Nov-2017 2.1
No Dredging Work With Dredging Works

SR2 - Dry Season Turbidity at Mid-Ebb (NTU)
No Dredging Work With Dredging Works
Raw Statistics Raw Statistics
Number of Valid Observations 52 Number of Valid Observations 6
Number of Distinct Observations 49 Number of Distinct Observations 6
Minimum 0.267 Minimum 0.233
Maximum 5.8 Maximum 6.567
Mean of Raw Data 1.81 Mean of Raw Data 3.044
Standard Deviation of Raw Data 1.347 Standard Deviation of Raw Data 2.324
Kstar 1.873 Kstar 0.818
Mean of Log Transformed Data 0.319 Mean of Log Transformed Data 0.719
Standard Deviation of Log Transformed Data 0.779 Standard Deviation of Log Transformed Data 1.176
Normal Distribution Test Results Normal Distribution Test Results
Correlation Coefficient R 0.936 Correlation Coefficient R 0.947
Approximate Shapiro Wilk Test Statistic 0.867 Shapiro Wilk Test Statistic 0.9
Approximate Shapiro Wilk P Value 4.46E-06 Shapiro Wilk Critical (0.95) Value 0.788
Lilliefors Test Statistic 0.129 Approximate Shapiro Wilk P Value N/A
Lilliefors Critical (0.95) Value 0.123 Lilliefors Test Statistic 0.309
Lilliefors Critical (0.95) Value 0.362
Data not Normal at (0.05) Significance Level Data appear Normal at (0.05) Significance Level
Wilcoxon-Mann-Whitney Site vs Background Comparison Test for Full Data Sets without NDs
User Selected Options
Full Precision OFF
Confidence Coefficient 95%
Substantial Difference 0%
Selected Null Hypothesis Site or AOC Mean/Median Less Than or Equal to Background Mean/Median (Form 1)
Alternative Hypothesis Site or AOC Mean/Median Greater Than Background Mean/Median
Area of Concern Data: With Dredging Works
Background Data: No Dredging Work
Raw Statistics
Site Background
Number of Valid Observations 6 52
Number of Distinct Observations 6 49
Minimum 0.233 0.267
Maximum 6.567 5.8
Mean 3.044 1.81
Median 2.167 1.417
SD 2.324 1.347
SE of Mean 0.949 0.187
Wilcoxon-Mann-Whitney (WMW) Test
H0: Mean/Median of Site or AOC <= Mean/Median of Background
Site Rank Sum W-Stat 231
WMW Test U-Stat 1.366
WMW Critical Value (0.050) 1.645
P-Value 0.086
Conclusion with Alpha = 0.05
Do Not Reject H0, Conclude Site <= Background
P-Value >= alpha (0.05)
ProUCL Version 4.0 (Version 4.00.04)

SR2 - Wet Season Turbidity at Mid-Ebb (NTU)
Date Turbidity NTU Date Turbidity NTU Date Turbidity NTU
4-Jun-2015 0.9 3-Jun-2017 0.4 2-Jun-2015 4.1
11-Jun-2015 0.8 6-Jun-2017 1.4 3-Sep-2015 1.1
14-Jul-2015 3.6 8-Jun-2017 1.6 12-Sep-2015 4.6
16-Jul-2015 3.6 10-Jun-2017 0.3 26-Sep-2015 3.7
18-Jul-2015 2.3 20-Jun-2017 1.4 6-Oct-2015 2.8
25-Jul-2015 2.9 22-Jun-2017 1.3 16-Apr-2016 0.7
1-Sep-2015 4.2 24-Jun-2017 1.0 4-Jun-2016 1.0
2-Apr-2016 0.6 27-Jun-2017 1.2 18-Jun-2016 2.3
14-Apr-2016 0.9 4-Jul-2017 0.5 2-Jul-2016 0.7
3-May-2016 0.9 6-Jul-2017 0.7 9-Jul-2016 2.4
7-May-2016 5.5 8-Jul-2017 1.4 12-Jul-2016 0.6
2-Jun-2016 0.2 15-Jul-2017 1.6 20-Apr-2017 0.7
14-Jul-2016 0.8 18-Jul-2017 2.1 29-Apr-2017 2.9
16-Jul-2016 4.0 20-Jul-2017 0.9 6-May-2017 1.3
19-Jul-2016 3.4 22-Jul-2017 2.0 11-May-2017 1.5
21-Jul-2016 1.4 25-Jul-2017 0.9 25-May-2017 2.8
23-Jul-2016 0.3 27-Jul-2017 3.7 15-Jun-2017 2.4
26-Jul-2016 0.8 29-Jul-2017 2.6 17-Jun-2017 0.5
28-Jul-2016 1.6 5-Aug-2017 1.3 29-Jun-2017 1.3
30-Jul-2016 1.7 15-Aug-2017 1.4 1-Jul-2017 2.0
4-Aug-2016 5.3 17-Aug-2017 0.7 11-Jul-2017 0.9
6-Aug-2016 0.8 19-Aug-2017 1.0 18-Jul-2017 2.1
9-Aug-2016 1.6 22-Aug-2017 1.8 20-Jul-2017 0.9
11-Aug-2016 2.9 24-Aug-2017 0.7 1-Aug-2017 1.3
13-Aug-2016 0.4 26-Aug-2017 1.6 3-Aug-2017 2.1
16-Aug-2016 2.3 29-Aug-2017 10.2 10-Aug-2017 0.4
20-Aug-2016 1.5 31-Aug-2017 1.3 7-Sep-2017 9.3
1-Apr-2017 0.7 2-Sep-2017 8.2 21-Sep-2017 10.2
4-Apr-2017 0.9 5-Sep-2017 12.3 23-Sep-2017 0.7
6-Apr-2017 0.3 9-Sep-2017 10.4 28-Sep-2017 9.2
8-Apr-2017 0.8 12-Sep-2017 5.9 12-Oct-2017 9.1
11-Apr-2017 0.8 14-Sep-2017 7.3 19-Oct-2017 10.4
13-Apr-2017 2.1 16-Sep-2017 1.8 21-Oct-2017 4.0
18-Apr-2017 1.4 19-Sep-2017 10.1 26-Oct-2017 1.9
22-Apr-2017 1.2 30-Sep-2017 8.4 28-Oct-2017 2.0
25-Apr-2017 4.5 3-Oct-2017 1.2 31-Oct-2017 2.0
27-Apr-2017 3.7 5-Oct-2017 0.7
2-May-2017 1.8 7-Oct-2017 4.3
4-May-2017 1.1 14-Oct-2017 7.1
9-May-2017 1.8 17-Oct-2017 0.9
13-May-2017 1.4 24-Oct-2017 2.0
16-May-2017 0.7
18-May-2017 0.5
20-May-2017 0.8
23-May-2017 0.7
27-May-2017 0.9
30-May-2017 1.5
1-Jun-2017 1.2
No Dredging Work With Dredging Works

SR2 - Wet Season Turbidity at Mid-Ebb (NTU)
No Dredging Work With Dredging Works
Raw Statistics Raw Statistics
Number of Valid Observations 89 Number of Valid Observations 36
Number of Distinct Observations 77 Number of Distinct Observations 35
Minimum 0.2 Minimum 0.417
Maximum 12.28 Maximum 10.37
Mean of Raw Data 2.347 Mean of Raw Data 2.939
Standard Deviation of Raw Data 2.543 Standard Deviation of Raw Data 2.926
Kstar 1.292 Kstar 1.297
Mean of Log Transformed Data 0.432 Mean of Log Transformed Data 0.678
Standard Deviation of Log Transformed Data 0.89 Standard Deviation of Log Transformed Data 0.891
Normal Distribution Test Results Normal Distribution Test Results
Correlation Coefficient R 0.839 Correlation Coefficient R 0.859
Approximate Shapiro Wilk Test Statistic 0.706 Shapiro Wilk Test Statistic 0.73
Approximate Shapiro Wilk P Value 0.00E+00 Shapiro Wilk Critical (0.95) Value 0.935
Lilliefors Test Statistic 0.263 Approximate Shapiro Wilk P Value 5.69E-08
Lilliefors Critical (0.95) Value 0.0939 Lilliefors Test Statistic 0.258
Lilliefors Critical (0.95) Value 0.148
Data not Normal at (0.05) Significance Level Data not Normal at (0.05) Significance Level
Wilcoxon-Mann-Whitney Site vs Background Comparison Test for Full Data Sets without NDs
User Selected Options
Full Precision OFF
Confidence Coefficient 95%
Substantial Difference 0%
Selected Null Hypothesis Site or AOC Mean/Median Less Than or Equal to Background Mean/Median (Form 1)
Alternative Hypothesis Site or AOC Mean/Median Greater Than Background Mean/Median
Area of Concern Data: With Dredging Works
Background Data: No Dredging Work
Raw Statistics
Site Background
Number of Valid Observations 36 89
Number of Distinct Observations 35 77
Minimum 0.417 0.2
Maximum 10.37 12.28
Mean 2.939 2.347
Median 2.041 1.417
SD 2.926 2.543
SE of Mean 0.488 0.27
Wilcoxon-Mann-Whitney (WMW) Test
H0: Mean/Median of Site or AOC <= Mean/Median of Background
Site Rank Sum W-Stat 2531
WMW Test U-Stat 1.431
WMW Critical Value (0.050) 1.645
P-Value 0.0762
Conclusion with Alpha = 0.05
Do Not Reject H0, Conclude Site <= Background
P-Value >= alpha (0.05)
ProUCL Version 4.0 (Version 4.00.04)

SR3 - Dry Season Turbidity at Mid-Flood (NTU)
Date Turbidity NTU Date Turbidity NTU Date Turbidity NTU
26-Dec-2015 3.2 11-Nov-2017 3.8 21-Nov-2015 1.6
29-Dec-2015 2.2 14-Nov-2017 5.3 24-Dec-2015 2.2
31-Dec-2015 1.6 16-Nov-2017 4.7 9-Jan-2016 0.4
12-Jan-2016 0.5 18-Nov-2017 2.8 25-Feb-2017 2.9
14-Jan-2016 0.5 4-Nov-2017 4.5
26-Mar-2016 2.8 21-Nov-2017 6.2
29-Mar-2016 1.1
24-Dec-2016 1.1
27-Dec-2016 1.4
31-Dec-2016 1.4
3-Jan-2017 2.6
7-Jan-2017 1.7
10-Jan-2017 1.2
14-Jan-2017 3.4
17-Jan-2017 2.0
19-Jan-2017 1.8
21-Jan-2017 1.3
23-Jan-2017 1.8
25-Jan-2017 1.8
27-Jan-2017 3.2
31-Jan-2017 3.3
2-Feb-2017 3.7
4-Feb-2017 2.7
7-Feb-2017 2.2
9-Feb-2017 3.4
11-Feb-2017 5.2
14-Feb-2017 4.0
16-Feb-2017 1.9
18-Feb-2017 1.1
21-Feb-2017 0.7
23-Feb-2017 0.5
28-Feb-2017 2.9
2-Mar-2017 2.2
4-Mar-2017 0.9
7-Mar-2017 0.8
9-Mar-2017 0.8
11-Mar-2017 0.9
14-Mar-2017 1.6
16-Mar-2017 1.7
18-Mar-2017 0.3
21-Mar-2017 1.2
23-Mar-2017 0.3
25-Mar-2017 1.0
28-Mar-2017 2.1
30-Mar-2017 0.6
2-Nov-2017 6.6
7-Nov-2017 1.8
9-Nov-2017 1.7
No Dredging Work With Dredging Works

SR3 - Dry Season Turbidity at Mid-Flood (NTU)
No Dredging Work With Dredging Works
Raw Statistics Raw Statistics
Number of Valid Observations 52 Number of Valid Observations 6
Number of Distinct Observations 49 Number of Distinct Observations 6
Minimum 0.317 Minimum 0.4
Maximum 6.583 Maximum 6.183
Mean of Raw Data 2.098 Mean of Raw Data 2.972
Standard Deviation of Raw Data 1.386 Standard Deviation of Raw Data 2.081
Kstar 2.261 Kstar 1.03
Mean of Log Transformed Data 0.517 Mean of Log Transformed Data 0.793
Standard Deviation of Log Transformed Data 0.71 Standard Deviation of Log Transformed Data 0.965
Normal Distribution Test Results Normal Distribution Test Results
Correlation Coefficient R 0.954 Correlation Coefficient R 0.986
Approximate Shapiro Wilk Test Statistic 0.907 Shapiro Wilk Test Statistic 0.971
Approximate Shapiro Wilk P Value 3.91E-04 Shapiro Wilk Critical (0.95) Value 0.788
Lilliefors Test Statistic 0.144 Approximate Shapiro Wilk P Value N/A
Lilliefors Critical (0.95) Value 0.123 Lilliefors Test Statistic 0.177
Lilliefors Critical (0.95) Value 0.362
Data not Normal at (0.05) Significance Level Data appear Normal at (0.05) Significance Level
Wilcoxon-Mann-Whitney Site vs Background Comparison Test for Full Data Sets without NDs
User Selected Options
Full Precision OFF
Confidence Coefficient 95%
Substantial Difference 0%
Selected Null Hypothesis Site or AOC Mean/Median Less Than or Equal to Background Mean/Median (Form 1)
Alternative Hypothesis Site or AOC Mean/Median Greater Than Background Mean/Median
Area of Concern Data: With Dredging Works
Background Data: No Dredging Work
Raw Statistics
Site Background
Number of Valid Observations 6 52
Number of Distinct Observations 6 49
Minimum 0.4 0.317
Maximum 6.183 6.583
Mean 2.972 2.098
Median 2.558 1.767
SD 2.081 1.386
SE of Mean 0.85 0.192
Wilcoxon-Mann-Whitney (WMW) Test
H0: Mean/Median of Site or AOC <= Mean/Median of Background
Site Rank Sum W-Stat 218
WMW Test U-Stat 1.034
WMW Critical Value (0.050) 1.645
P-Value 0.151
Conclusion with Alpha = 0.05
Do Not Reject H0, Conclude Site <= Background
P-Value >= alpha (0.05)
ProUCL Version 4.0 (Version 4.00.04)

SR3 - Wet Season Turbidity at Mid-Flood (NTU)
Date Turbidity NTU Date Turbidity NTU Date Turbidity NTU
4-Jun-2015 2.0 3-Jun-2017 0.3 2-Jun-2015 3.3
11-Jun-2015 0.1 6-Jun-2017 1.4 3-Sep-2015 1.5
14-Jul-2015 2.2 8-Jun-2017 1.5 12-Sep-2015 3.4
16-Jul-2015 3.2 10-Jun-2017 0.6 26-Sep-2015 3.2
18-Jul-2015 3.8 20-Jun-2017 1.7 6-Oct-2015 3.6
25-Jul-2015 3.4 22-Jun-2017 2.0 16-Apr-2016 2.6
1-Sep-2015 2.0 24-Jun-2017 1.6 4-Jun-2016 1.3
2-Apr-2016 1.0 27-Jun-2017 3.8 18-Jun-2016 2.3
14-Apr-2016 2.4 4-Jul-2017 0.6 2-Jul-2016 1.2
3-May-2016 2.4 6-Jul-2017 1.5 9-Jul-2016 2.0
7-May-2016 4.9 8-Jul-2017 1.8 12-Jul-2016 1.3
2-Jun-2016 0.5 15-Jul-2017 1.5 20-Apr-2017 1.1
14-Jul-2016 0.7 18-Jul-2017 0.3 29-Apr-2017 2.6
16-Jul-2016 2.4 20-Jul-2017 0.6 6-May-2017 1.2
19-Jul-2016 3.5 22-Jul-2017 1.1 11-May-2017 1.4
21-Jul-2016 2.0 25-Jul-2017 1.2 25-May-2017 2.6
23-Jul-2016 1.3 27-Jul-2017 3.3 15-Jun-2017 1.9
26-Jul-2016 1.0 29-Jul-2017 3.0 17-Jun-2017 0.7
28-Jul-2016 2.0 5-Aug-2017 1.4 29-Jun-2017 2.0
30-Jul-2016 3.9 15-Aug-2017 2.0 1-Jul-2017 0.7
4-Aug-2016 1.9 17-Aug-2017 1.2 11-Jul-2017 0.6
6-Aug-2016 1.3 19-Aug-2017 3.0 18-Jul-2017 0.3
9-Aug-2016 1.9 22-Aug-2017 2.5 20-Jul-2017 0.6
11-Aug-2016 3.5 24-Aug-2017 1.4 1-Aug-2017 1.6
13-Aug-2016 0.7 26-Aug-2017 1.7 3-Aug-2017 2.1
16-Aug-2016 3.3 29-Aug-2017 10.6 10-Aug-2017 1.6
20-Aug-2016 1.1 31-Aug-2017 1.3 7-Sep-2017 10.1
1-Apr-2017 1.4 2-Sep-2017 9.3 21-Sep-2017 12.4
4-Apr-2017 0.6 5-Sep-2017 11.9 23-Sep-2017 1.4
6-Apr-2017 0.5 9-Sep-2017 9.0 28-Sep-2017 8.0
8-Apr-2017 0.6 12-Sep-2017 9.4 12-Oct-2017 8.6
11-Apr-2017 0.7 14-Sep-2017 7.9 19-Oct-2017 8.5
13-Apr-2017 2.1 16-Sep-2017 2.6 21-Oct-2017 4.7
18-Apr-2017 1.7 19-Sep-2017 7.9 26-Oct-2017 2.0
22-Apr-2017 1.9 30-Sep-2017 8.1 28-Oct-2017 2.1
25-Apr-2017 4.4 3-Oct-2017 1.6 31-Oct-2017 2.2
27-Apr-2017 3.1 5-Oct-2017 0.8
2-May-2017 1.9 7-Oct-2017 3.7
4-May-2017 0.5 14-Oct-2017 6.5
9-May-2017 1.4 17-Oct-2017 1.2
13-May-2017 0.9 24-Oct-2017 2.3
16-May-2017 0.2
18-May-2017 0.8
20-May-2017 0.5
23-May-2017 0.5
27-May-2017 0.8
30-May-2017 1.7
1-Jun-2017 0.8
No Dredging Work With Dredging Works

SR3 - Wet Season Turbidity at Mid-Flood (NTU)
No Dredging Work With Dredging Works
Raw Statistics Raw Statistics
Number of Valid Observations 89 Number of Valid Observations 36
Number of Distinct Observations 73 Number of Distinct Observations 34
Minimum 0.133 Minimum 0.3
Maximum 11.85 Maximum 12.42
Mean of Raw Data 2.472 Mean of Raw Data 2.96
Standard Deviation of Raw Data 2.467 Standard Deviation of Raw Data 2.892
Kstar 1.372 Kstar 1.448
Mean of Log Transformed Data 0.511 Mean of Log Transformed Data 0.732
Standard Deviation of Log Transformed Data 0.905 Standard Deviation of Log Transformed Data 0.835
Normal Distribution Test Results Normal Distribution Test Results
Correlation Coefficient R 0.858 Correlation Coefficient R 0.849
Approximate Shapiro Wilk Test Statistic 0.737 Shapiro Wilk Test Statistic 0.726
Approximate Shapiro Wilk P Value 0.00E+00 Shapiro Wilk Critical (0.95) Value 0.935
Lilliefors Test Statistic 0.223 Approximate Shapiro Wilk P Value 4.63E-08
Lilliefors Critical (0.95) Value 0.0939 Lilliefors Test Statistic 0.267
Lilliefors Critical (0.95) Value 0.148
Data not Normal at (0.05) Significance Level Data not Normal at (0.05) Significance Level
Wilcoxon-Mann-Whitney Site vs Background Comparison Test for Full Data Sets without NDs
User Selected Options
Full Precision OFF
Confidence Coefficient 95%
Substantial Difference 0%
Selected Null Hypothesis Site or AOC Mean/Median Less Than or Equal to Background Mean/Median (Form 1)
Alternative Hypothesis Site or AOC Mean/Median Greater Than Background Mean/Median
Area of Concern Data: With Dredging Works
Background Data: No Dredging Work
Raw Statistics
Site Background
Number of Valid Observations 36 89
Number of Distinct Observations 34 73
Minimum 0.3 0.133
Maximum 12.42 11.85
Mean 2.96 2.472
Median 1.975 1.7
SD 2.892 2.467
SE of Mean 0.482 0.262
Wilcoxon-Mann-Whitney (WMW) Test
H0: Mean/Median of Site or AOC <= Mean/Median of Background
Site Rank Sum W-Stat 2481
WMW Test U-Stat 1.156
WMW Critical Value (0.050) 1.645
P-Value 0.124
Conclusion with Alpha = 0.05
Do Not Reject H0, Conclude Site <= Background
P-Value >= alpha (0.05)
ProUCL Version 4.0 (Version 4.00.04)

SR3 - Dry Season Turbidity at Mid-Ebb (NTU)
Date Turbidity NTU Date Turbidity NTU Date Turbidity NTU
26-Dec-2015 4.1 11-Nov-2017 3.8 21-Nov-2015 1.4
29-Dec-2015 2.0 14-Nov-2017 5.2 24-Dec-2015 2.1
31-Dec-2015 1.6 16-Nov-2017 4.7 9-Jan-2016 0.9
12-Jan-2016 0.6 18-Nov-2017 4.4 25-Feb-2017 2.6
14-Jan-2016 0.5 4-Nov-2017 5.3
26-Mar-2016 2.3 21-Nov-2017 5.7
29-Mar-2016 0.9
24-Dec-2016 1.1
27-Dec-2016 2.4
31-Dec-2016 2.4
3-Jan-2017 2.5
7-Jan-2017 1.7
10-Jan-2017 1.8
14-Jan-2017 2.4
17-Jan-2017 3.0
19-Jan-2017 3.2
21-Jan-2017 1.6
23-Jan-2017 1.7
25-Jan-2017 1.9
27-Jan-2017 2.2
31-Jan-2017 3.4
2-Feb-2017 4.5
4-Feb-2017 3.0
7-Feb-2017 1.7
9-Feb-2017 3.4
11-Feb-2017 5.0
14-Feb-2017 2.9
16-Feb-2017 2.0
18-Feb-2017 1.0
21-Feb-2017 0.8
23-Feb-2017 0.5
28-Feb-2017 1.0
2-Mar-2017 2.5
4-Mar-2017 0.9
7-Mar-2017 1.0
9-Mar-2017 0.7
11-Mar-2017 1.0
14-Mar-2017 0.3
16-Mar-2017 0.5
18-Mar-2017 0.4
21-Mar-2017 0.8
23-Mar-2017 0.2
25-Mar-2017 0.9
28-Mar-2017 0.6
30-Mar-2017 0.8
2-Nov-2017 2.4
7-Nov-2017 2.1
9-Nov-2017 2.2
No Dredging Work With Dredging Works

SR3 - Dry Season Turbidity at Mid-Ebb (NTU)
No Dredging Work With Dredging Works
Raw Statistics Raw Statistics
Number of Valid Observations 52 Number of Valid Observations 6
Number of Distinct Observations 50 Number of Distinct Observations 6
Minimum 0.233 Minimum 0.933
Maximum 5.15 Maximum 5.667
Mean of Raw Data 2.003 Mean of Raw Data 2.986
Standard Deviation of Raw Data 1.329 Standard Deviation of Raw Data 2.002
Kstar 1.983 Kstar 1.416
Mean of Log Transformed Data 0.437 Mean of Log Transformed Data 0.89
Standard Deviation of Log Transformed Data 0.783 Standard Deviation of Log Transformed Data 0.716
Normal Distribution Test Results Normal Distribution Test Results
Correlation Coefficient R 0.966 Correlation Coefficient R 0.944
Approximate Shapiro Wilk Test Statistic 0.915 Shapiro Wilk Test Statistic 0.868
Approximate Shapiro Wilk P Value 9.90E-04 Shapiro Wilk Critical (0.95) Value 0.788
Lilliefors Test Statistic 0.144 Approximate Shapiro Wilk P Value N/A
Lilliefors Critical (0.95) Value 0.123 Lilliefors Test Statistic 0.243
Lilliefors Critical (0.95) Value 0.362
Data not Normal at (0.05) Significance Level Data appear Normal at (0.05) Significance Level
Wilcoxon-Mann-Whitney Site vs Background Comparison Test for Full Data Sets without NDs
User Selected Options
Full Precision OFF
Confidence Coefficient 95%
Substantial Difference 0%
Selected Null Hypothesis Site or AOC Mean/Median Less Than or Equal to Background Mean/Median (Form 1)
Alternative Hypothesis Site or AOC Mean/Median Greater Than Background Mean/Median
Area of Concern Data: With Dredging Works
Background Data: No Dredging Work
Raw Statistics
Site Background
Number of Valid Observations 6 52
Number of Distinct Observations 6 50
Minimum 0.933 0.233
Maximum 5.667 5.15
Mean 2.986 2.003
Median 2.333 1.817
SD 2.002 1.329
SE of Mean 0.817 0.184
Wilcoxon-Mann-Whitney (WMW) Test
H0: Mean/Median of Site or AOC <= Mean/Median of Background
Site Rank Sum W-Stat 226.5
WMW Test U-Stat 1.251
WMW Critical Value (0.050) 1.645
P-Value 0.105
Conclusion with Alpha = 0.05
Do Not Reject H0, Conclude Site <= Background
P-Value >= alpha (0.05)
ProUCL Version 4.0 (Version 4.00.04)

SR3 - Wet Season Turbidity at Mid-Ebb (NTU)
Date Turbidity NTU Date Turbidity NTU Date Turbidity NTU
4-Jun-2015 1.2 3-Jun-2017 0.2 2-Jun-2015 3.1
11-Jun-2015 0.7 6-Jun-2017 1.6 3-Sep-2015 1.5
14-Jul-2015 2.4 8-Jun-2017 1.6 12-Sep-2015 2.9
16-Jul-2015 4.0 10-Jun-2017 0.5 26-Sep-2015 5.2
18-Jul-2015 2.9 20-Jun-2017 2.1 6-Oct-2015 1.8
25-Jul-2015 2.8 22-Jun-2017 1.7 16-Apr-2016 0.6
1-Sep-2015 7.1 24-Jun-2017 1.5 4-Jun-2016 0.8
2-Apr-2016 0.8 27-Jun-2017 1.2 18-Jun-2016 2.8
14-Apr-2016 1.8 4-Jul-2017 0.5 2-Jul-2016 0.5
3-May-2016 1.0 6-Jul-2017 1.4 9-Jul-2016 1.8
7-May-2016 5.6 8-Jul-2017 1.6 12-Jul-2016 1.1
2-Jun-2016 0.2 15-Jul-2017 1.6 20-Apr-2017 1.1
14-Jul-2016 0.5 18-Jul-2017 0.2 29-Apr-2017 2.6
16-Jul-2016 3.4 20-Jul-2017 0.9 6-May-2017 1.0
19-Jul-2016 2.7 22-Jul-2017 1.2 11-May-2017 1.5
21-Jul-2016 1.0 25-Jul-2017 0.7 25-May-2017 2.2
23-Jul-2016 1.4 27-Jul-2017 3.5 15-Jun-2017 2.8
26-Jul-2016 1.3 29-Jul-2017 3.8 17-Jun-2017 0.9
28-Jul-2016 0.8 5-Aug-2017 1.5 29-Jun-2017 2.2
30-Jul-2016 1.7 15-Aug-2017 1.6 1-Jul-2017 0.8
4-Aug-2016 5.0 17-Aug-2017 1.4 11-Jul-2017 0.7
6-Aug-2016 1.0 19-Aug-2017 1.9 18-Jul-2017 0.2
9-Aug-2016 1.4 22-Aug-2017 2.6 20-Jul-2017 0.9
11-Aug-2016 1.7 24-Aug-2017 1.2 1-Aug-2017 1.3
13-Aug-2016 0.4 26-Aug-2017 2.0 3-Aug-2017 1.2
16-Aug-2016 1.2 29-Aug-2017 10.6 10-Aug-2017 0.7
20-Aug-2016 2.1 31-Aug-2017 1.6 7-Sep-2017 10.6
1-Apr-2017 1.0 2-Sep-2017 9.1 21-Sep-2017 12.7
4-Apr-2017 0.7 5-Sep-2017 11.8 23-Sep-2017 1.2
6-Apr-2017 0.4 9-Sep-2017 9.3 28-Sep-2017 6.4
8-Apr-2017 0.5 12-Sep-2017 9.0 12-Oct-2017 8.3
11-Apr-2017 0.6 14-Sep-2017 7.9 19-Oct-2017 13.8
13-Apr-2017 1.6 16-Sep-2017 2.5 21-Oct-2017 4.8
18-Apr-2017 1.5 19-Sep-2017 10.5 26-Oct-2017 2.0
22-Apr-2017 1.4 30-Sep-2017 6.2 28-Oct-2017 1.5
25-Apr-2017 4.3 3-Oct-2017 1.4 31-Oct-2017 1.5
27-Apr-2017 3.3 5-Oct-2017 1.0
2-May-2017 2.2 7-Oct-2017 3.5
4-May-2017 0.4 14-Oct-2017 6.9
9-May-2017 1.4 17-Oct-2017 1.5
13-May-2017 0.7 24-Oct-2017 2.0
16-May-2017 1.6
18-May-2017 0.6
20-May-2017 0.4
23-May-2017 0.2
27-May-2017 0.5
30-May-2017 2.0
1-Jun-2017 1.2
No Dredging Work With Dredging Works

SR3 - Wet Season Turbidity at Mid-Ebb (NTU)
No Dredging Work With Dredging Works
Raw Statistics Raw Statistics
Number of Valid Observations 89 Number of Valid Observations 36
Number of Distinct Observations 73 Number of Distinct Observations 35
Minimum 0.2 Minimum 0.2
Maximum 11.75 Maximum 13.77
Mean of Raw Data 2.413 Mean of Raw Data 2.916
Standard Deviation of Raw Data 2.587 Standard Deviation of Raw Data 3.38
Kstar 1.245 Kstar 1.117
Mean of Log Transformed Data 0.442 Mean of Log Transformed Data 0.598
Standard Deviation of Log Transformed Data 0.939 Standard Deviation of Log Transformed Data 0.951
Normal Distribution Test Results Normal Distribution Test Results
Correlation Coefficient R 0.845 Correlation Coefficient R 0.826
Approximate Shapiro Wilk Test Statistic 0.711 Shapiro Wilk Test Statistic 0.686
Approximate Shapiro Wilk P Value 0.00E+00 Shapiro Wilk Critical (0.95) Value 0.935
Lilliefors Test Statistic 0.257 Approximate Shapiro Wilk P Value 5.37E-09
Lilliefors Critical (0.95) Value 0.0939 Lilliefors Test Statistic 0.28
Lilliefors Critical (0.95) Value 0.148
Data not Normal at (0.05) Significance Level Data not Normal at (0.05) Significance Level
Wilcoxon-Mann-Whitney Site vs Background Comparison Test for Full Data Sets without NDs
User Selected Options
Full Precision OFF
Confidence Coefficient 95%
Substantial Difference 0%
Selected Null Hypothesis Site or AOC Mean/Median Less Than or Equal to Background Mean/Median (Form 1)
Alternative Hypothesis Site or AOC Mean/Median Greater Than Background Mean/Median
Area of Concern Data: With Dredging Works
Background Data: No Dredging Work
Raw Statistics
Site Background
Number of Valid Observations 36 89
Number of Distinct Observations 35 73
Minimum 0.2 0.2
Maximum 13.77 11.75
Mean 2.916 2.413
Median 1.538 1.517
SD 3.38 2.587
SE of Mean 0.563 0.274
Wilcoxon-Mann-Whitney (WMW) Test
H0: Mean/Median of Site or AOC <= Mean/Median of Background
Site Rank Sum W-Stat 2377
WMW Test U-Stat 0.592
WMW Critical Value (0.050) 1.645
P-Value 0.277
Conclusion with Alpha = 0.05
Do Not Reject H0, Conclude Site <= Background
P-Value >= alpha (0.05)
ProUCL Version 4.0 (Version 4.00.04)

FUGRO TECHNICAL SERVICES LIMITED
Fugro Development Centre, Tel : +852 2450 8233 5 Lok Yi Street, Tai Lam, Fax : +852 2450 6138 Tuen Mun, N.T., E-mail : [email protected] Hong Kong. Website : www.fugro.com
The copyright of this document is owned by Fugro Technical Services Limited. It may not be reproduced except with prior written approval from the Company.
A Fugro Group Company
Page 17 of 19
Total Suspended Solids

SR2 - Wet Season SS at Mid-Flood (mg/L)
Date SS mg/L Date SS mg/L Date SS mg/L
4-Jun-2015 1.8 3-Jun-2017 2.3 2-Jun-2015 5.3
11-Jun-2015 2.7 6-Jun-2017 2.2 3-Sep-2015 6.8
14-Jul-2015 2.7 8-Jun-2017 3.2 12-Sep-2015 9.0
16-Jul-2015 5.2 10-Jun-2017 4.8 26-Sep-2015 9.7
18-Jul-2015 3.8 20-Jun-2017 3.5 6-Oct-2015 3.5
25-Jul-2015 1.7 22-Jun-2017 2.7 16-Apr-2016 1.2
1-Sep-2015 5.2 24-Jun-2017 5.3 4-Jun-2016 4.0
2-Apr-2016 5.7 27-Jun-2017 6.3 18-Jun-2016 2.7
14-Apr-2016 3.3 4-Jul-2017 3.7 2-Jul-2016 3.7
3-May-2016 3.8 6-Jul-2017 2.8 9-Jul-2016 2.0
7-May-2016 9.0 8-Jul-2017 4.5 12-Jul-2016 5.0
2-Jun-2016 3.0 15-Jul-2017 3.3 20-Apr-2017 2.2
14-Jul-2016 3.0 18-Jul-2017 2.8 29-Apr-2017 7.0
16-Jul-2016 3.5 20-Jul-2017 4.8 6-May-2017 4.7
19-Jul-2016 5.7 22-Jul-2017 2.2 11-May-2017 3.0
21-Jul-2016 5.5 25-Jul-2017 3.3 25-May-2017 1.0
23-Jul-2016 5.7 27-Jul-2017 6.3 15-Jun-2017 2.0
26-Jul-2016 6.3 29-Jul-2017 4.5 17-Jun-2017 1.7
28-Jul-2016 3.5 5-Aug-2017 4.5 29-Jun-2017 6.8
30-Jul-2016 6.0 15-Aug-2017 4.3 1-Jul-2017 3.3
4-Aug-2016 1.5 17-Aug-2017 2.2 11-Jul-2017 4.3
6-Aug-2016 5.8 19-Aug-2017 6.2 18-Jul-2017 2.8
9-Aug-2016 2.8 22-Aug-2017 6.8 20-Jul-2017 4.8
11-Aug-2016 2.7 24-Aug-2017 9.2 1-Aug-2017 5.2
13-Aug-2016 2.5 26-Aug-2017 5.0 3-Aug-2017 3.0
16-Aug-2016 5.2 29-Aug-2017 5.8 10-Aug-2017 3.8
20-Aug-2016 2.0 31-Aug-2017 1.7 7-Sep-2017 5.3
1-Apr-2017 3.8 2-Sep-2017 3.3 21-Sep-2017 6.0
4-Apr-2017 6.8 5-Sep-2017 7.7 23-Sep-2017 3.8
6-Apr-2017 4.2 9-Sep-2017 6.7 28-Sep-2017 5.8
8-Apr-2017 5.8 12-Sep-2017 4.7 12-Oct-2017 4.5
11-Apr-2017 2.3 14-Sep-2017 1.3 19-Oct-2017 9.8
13-Apr-2017 5.3 16-Sep-2017 4.2 21-Oct-2017 7.7
18-Apr-2017 5.2 19-Sep-2017 8.8 26-Oct-2017 3.5
22-Apr-2017 3.7 30-Sep-2017 4.8 28-Oct-2017 5.3
25-Apr-2017 10.3 3-Oct-2017 4.5 31-Oct-2017 3.5
27-Apr-2017 10.3 5-Oct-2017 5.8
2-May-2017 2.8 7-Oct-2017 6.5
4-May-2017 2.2 14-Oct-2017 8.3
9-May-2017 3.7 17-Oct-2017 10.3
13-May-2017 5.5 24-Oct-2017 9.2
16-May-2017 1.2
18-May-2017 6.3
20-May-2017 3.2
23-May-2017 3.3
27-May-2017 1.0
30-May-2017 2.0
1-Jun-2017 3.0
No Dredging Work With Dredging Works

SR2 - Wet Season SS at Mid-Flood (mg/L)
No Dredging Work With Dredging Works
Raw Statistics Raw Statistics
Number of Valid Observations 89 Number of Valid Observations 36
Number of Distinct Observations 41 Number of Distinct Observations 28
Minimum 1 Minimum 1
Maximum 10.33 Maximum 9.833
Mean of Raw Data 4.517 Mean of Raw Data 4.551
Standard Deviation of Raw Data 2.2 Standard Deviation of Raw Data 2.24
Kstar 4.122 Kstar 3.691
Mean of Log Transformed Data 1.386 Mean of Log Transformed Data 1.385
Standard Deviation of Log Transformed Data 0.513 Standard Deviation of Log Transformed Data 0.545
Normal Distribution Test Results Normal Distribution Test Results
Correlation Coefficient R 0.972 Correlation Coefficient R 0.978
Approximate Shapiro Wilk Test Statistic 0.928 Shapiro Wilk Test Statistic 0.947
Approximate Shapiro Wilk P Value 5.30E-05 Shapiro Wilk Critical (0.95) Value 0.935
Lilliefors Test Statistic 0.105 Approximate Shapiro Wilk P Value 1.09E-01
Lilliefors Critical (0.95) Value 0.0939 Lilliefors Test Statistic 0.113
Lilliefors Critical (0.95) Value 0.148
Data not Normal at (0.05) Significance Level Data appear Normal at (0.05) Significance Level
Wilcoxon-Mann-Whitney Site vs Background Comparison Test for Full Data Sets without NDs
User Selected Options
Full Precision OFF
Confidence Coefficient 95%
Substantial Difference 0%
Selected Null Hypothesis Site or AOC Mean/Median Less Than or Equal to Background Mean/Median (Form 1)
Alternative Hypothesis Site or AOC Mean/Median Greater Than Background Mean/Median
Area of Concern Data: With Dredging Works
Background Data: No Dredging Work
Raw Statistics
Site Background
Number of Valid Observations 36 89
Number of Distinct Observations 28 41
Minimum 1 1
Maximum 9.833 10.33
Mean 4.551 4.517
Median 4.167 4.167
SD 2.24 2.2
SE of Mean 0.373 0.233
Wilcoxon-Mann-Whitney (WMW) Test
H0: Mean/Median of Site or AOC <= Mean/Median of Background
Site Rank Sum W-Stat 2294
WMW Test U-Stat 0.139
WMW Critical Value (0.050) 1.645
P-Value 0.445
Conclusion with Alpha = 0.05
Do Not Reject H0, Conclude Site <= Background
P-Value >= alpha (0.05)
ProUCL Version 4.0 (Version 4.00.04)

SR2 - Dry Season SS at Mid-Ebb (mg/L)
Date SS mg/L Date SS mg/L Date SS mg/L
26-Dec-2015 3.5 11-Nov-2017 9.2 21-Nov-2015 5.5
29-Dec-2015 5.5 14-Nov-2017 8.0 24-Dec-2015 5.0
31-Dec-2015 6.2 16-Nov-2017 10.2 9-Jan-2016 1.8
12-Jan-2016 5.3 18-Nov-2017 5.3 25-Feb-2017 6.5
14-Jan-2016 3.3 4-Nov-2017 8.7
26-Mar-2016 3.7 21-Nov-2017 6.2
29-Mar-2016 3.2
24-Dec-2016 3.7
27-Dec-2016 4.5
31-Dec-2016 6.7
3-Jan-2017 10.3
7-Jan-2017 7.7
10-Jan-2017 5.2
14-Jan-2017 4.7
17-Jan-2017 6.8
19-Jan-2017 6.3
21-Jan-2017 5.0
23-Jan-2017 5.3
25-Jan-2017 6.7
27-Jan-2017 6.0
31-Jan-2017 9.2
2-Feb-2017 4.5
4-Feb-2017 4.3
7-Feb-2017 6.2
9-Feb-2017 7.3
11-Feb-2017 3.5
14-Feb-2017 7.5
16-Feb-2017 5.0
18-Feb-2017 1.2
21-Feb-2017 1.7
23-Feb-2017 2.2
28-Feb-2017 3.2
2-Mar-2017 4.2
4-Mar-2017 3.2
7-Mar-2017 6.8
9-Mar-2017 3.3
11-Mar-2017 3.7
14-Mar-2017 6.3
16-Mar-2017 3.7
18-Mar-2017 4.8
21-Mar-2017 2.2
23-Mar-2017 3.0
25-Mar-2017 6.3
28-Mar-2017 5.0
30-Mar-2017 8.3
2-Nov-2017 4.0
7-Nov-2017 11.0
9-Nov-2017 8.5
No Dredging Work With Dredging Works

SR2 - Dry Season SS at Mid-Ebb (mg/L)
No Dredging Work With Dredging Works
Raw Statistics Raw Statistics
Number of Valid Observations 52 Number of Valid Observations 6
Number of Distinct Observations 33 Number of Distinct Observations 6
Minimum 1.167 Minimum 1.833
Maximum 11 Maximum 8.667
Mean of Raw Data 5.426 Mean of Raw Data 5.611
Standard Deviation of Raw Data 2.281 Standard Deviation of Raw Data 2.24
Kstar 5.072 Kstar 2.788
Mean of Log Transformed Data 1.595 Mean of Log Transformed Data 1.628
Standard Deviation of Log Transformed Data 0.465 Standard Deviation of Log Transformed Data 0.535
Normal Distribution Test Results Normal Distribution Test Results
Correlation Coefficient R 0.987 Correlation Coefficient R 0.961
Approximate Shapiro Wilk Test Statistic 0.963 Shapiro Wilk Test Statistic 0.947
Approximate Shapiro Wilk P Value 2.01E-01 Shapiro Wilk Critical (0.95) Value 0.788
Lilliefors Test Statistic 0.0932 Approximate Shapiro Wilk P Value N/A
Lilliefors Critical (0.95) Value 0.123 Lilliefors Test Statistic 0.226
Lilliefors Critical (0.95) Value 0.362
Data appear Normal at (0.05) Significance Level Data appear Normal at (0.05) Significance Level
t-Test Site vs Background Comparison for Full Data Sets without NDs
User Selected Options
Full Precision OFF
Confidence Coefficient 95%
Substantial Difference 0%
Selected Null Hypothesis Site or AOC Mean/Median Less Than or Equal to Background Mean/Median (Form 1)
Alternative Hypothesis Site or AOC Mean/Median Greater Than Background Mean/Median
Area of Concern Data: With Dredging Works
Background Data: No Dredging Work
Raw Statistics
Site Background
Number of Valid Observations 6 52
Number of Distinct Observations 6 33
Minimum 1.833 1.167
Maximum 8.667 11
Mean 5.611 5.426
Median 5.833 5.083
SD 2.24 2.281
SE of Mean 0.915 0.316
Site vs Background Two-Sample t-Test
H0: Mu of Site - Mu of Background <= 0
t-Test Critical
Method DF Value t (0.050) P-Value
Pooled (Equal Variance) 56 0.188 1.673 0.426
Satterthwaite (Unequal Variance) 6.3 0.191 1.943 0.427
Pooled SD 2.278
Conclusion with Alpha = 0.050
* Student t (Pooled) Test: Do Not Reject H0, Conclude Site <= Background
* Satterthwaite Test: Do Not Reject H0, Conclude Site <= Background
ProUCL Version 4.0 (Version 4.00.04)

SR3 - Wet Season SS at Mid-Flood (mg/L)
Date SS mg/L Date SS mg/L Date SS mg/L
4-Jun-2015 1.3 3-Jun-2017 3.5 2-Jun-2015 4.0
11-Jun-2015 2.3 6-Jun-2017 3.2 3-Sep-2015 5.0
14-Jul-2015 3.3 8-Jun-2017 3.0 12-Sep-2015 7.5
16-Jul-2015 4.3 10-Jun-2017 6.2 26-Sep-2015 6.5
18-Jul-2015 3.7 20-Jun-2017 3.2 6-Oct-2015 5.5
25-Jul-2015 2.0 22-Jun-2017 2.8 16-Apr-2016 1.5
1-Sep-2015 4.5 24-Jun-2017 7.2 4-Jun-2016 4.7
2-Apr-2016 4.7 27-Jun-2017 6.5 18-Jun-2016 3.0
14-Apr-2016 3.7 4-Jul-2017 3.0 2-Jul-2016 4.2
3-May-2016 3.8 6-Jul-2017 3.7 9-Jul-2016 2.5
7-May-2016 12.3 8-Jul-2017 4.8 12-Jul-2016 3.3
2-Jun-2016 3.8 15-Jul-2017 3.2 20-Apr-2017 2.0
14-Jul-2016 2.3 18-Jul-2017 3.0 29-Apr-2017 7.2
16-Jul-2016 3.7 20-Jul-2017 8.8 6-May-2017 4.8
19-Jul-2016 6.0 22-Jul-2017 3.3 11-May-2017 3.0
21-Jul-2016 7.7 25-Jul-2017 3.8 25-May-2017 1.3
23-Jul-2016 4.2 27-Jul-2017 5.0 15-Jun-2017 3.0
26-Jul-2016 6.2 29-Jul-2017 4.3 17-Jun-2017 2.3
28-Jul-2016 4.5 5-Aug-2017 4.3 29-Jun-2017 8.8
30-Jul-2016 6.7 15-Aug-2017 4.8 1-Jul-2017 3.2
4-Aug-2016 1.5 17-Aug-2017 3.0 11-Jul-2017 3.7
6-Aug-2016 5.0 19-Aug-2017 4.3 18-Jul-2017 3.0
9-Aug-2016 3.5 22-Aug-2017 7.5 20-Jul-2017 8.8
11-Aug-2016 2.2 24-Aug-2017 10.3 1-Aug-2017 7.0
13-Aug-2016 2.0 26-Aug-2017 6.0 3-Aug-2017 4.3
16-Aug-2016 5.5 29-Aug-2017 6.8 10-Aug-2017 3.7
20-Aug-2016 2.5 31-Aug-2017 2.8 7-Sep-2017 16.3
1-Apr-2017 6.2 2-Sep-2017 4.7 21-Sep-2017 8.5
4-Apr-2017 9.0 5-Sep-2017 8.7 23-Sep-2017 4.2
6-Apr-2017 3.8 9-Sep-2017 3.7 28-Sep-2017 3.5
8-Apr-2017 4.8 12-Sep-2017 1.5 12-Oct-2017 5.5
11-Apr-2017 1.5 14-Sep-2017 1.3 19-Oct-2017 7.7
13-Apr-2017 5.3 16-Sep-2017 4.5 21-Oct-2017 9.3
18-Apr-2017 4.5 19-Sep-2017 6.8 26-Oct-2017 5.0
22-Apr-2017 4.0 30-Sep-2017 3.2 28-Oct-2017 4.5
25-Apr-2017 7.8 3-Oct-2017 7.3 31-Oct-2017 5.0
27-Apr-2017 6.2 5-Oct-2017 4.8
2-May-2017 4.3 7-Oct-2017 6.8
4-May-2017 2.8 14-Oct-2017 7.0
9-May-2017 4.5 17-Oct-2017 12.7
13-May-2017 5.0 24-Oct-2017 7.3
16-May-2017 1.3
18-May-2017 3.3
20-May-2017 4.8
23-May-2017 3.0
27-May-2017 1.7
30-May-2017 2.8
1-Jun-2017 2.8
No Dredging Work With Dredging Works

SR3 - Wet Season SS at Mid-Flood (mg/L)
No Dredging Work With Dredging Works
Raw Statistics Raw Statistics
Number of Valid Observations 89 Number of Valid Observations 36
Number of Distinct Observations 40 Number of Distinct Observations 27
Minimum 1.333 Minimum 1.333
Maximum 12.67 Maximum 16.33
Mean of Raw Data 4.625 Mean of Raw Data 5.093
Standard Deviation of Raw Data 2.288 Standard Deviation of Raw Data 2.891
Kstar 4.26 Kstar 3.517
Mean of Log Transformed Data 1.414 Mean of Log Transformed Data 1.491
Standard Deviation of Log Transformed Data 0.499 Standard Deviation of Log Transformed Data 0.531
Normal Distribution Test Results Normal Distribution Test Results
Correlation Coefficient R 0.958 Correlation Coefficient R 0.918
Approximate Shapiro Wilk Test Statistic 0.913 Shapiro Wilk Test Statistic 0.86
Approximate Shapiro Wilk P Value 1.75E-06 Shapiro Wilk Critical (0.95) Value 0.935
Lilliefors Test Statistic 0.143 Approximate Shapiro Wilk P Value 1.91E-04
Lilliefors Critical (0.95) Value 0.0939 Lilliefors Test Statistic 0.179
Lilliefors Critical (0.95) Value 0.148
Data not Normal at (0.05) Significance Level Data not Normal at (0.05) Significance Level
Wilcoxon-Mann-Whitney Site vs Background Comparison Test for Full Data Sets without NDs
User Selected Options
Full Precision OFF
Confidence Coefficient 95%
Substantial Difference 0%
Selected Null Hypothesis Site or AOC Mean/Median Less Than or Equal to Background Mean/Median (Form 1)
Alternative Hypothesis Site or AOC Mean/Median Greater Than Background Mean/Median
Area of Concern Data: With Dredging Works
Background Data: No Dredging Work
Raw Statistics
Site Background
Number of Valid Observations 36 89
Number of Distinct Observations 27 40
Minimum 1.333 1.333
Maximum 16.33 12.67
Mean 5.093 4.625
Median 4.417 4.333
SD 2.891 2.288
SE of Mean 0.482 0.243
Wilcoxon-Mann-Whitney (WMW) Test
H0: Mean/Median of Site or AOC <= Mean/Median of Background
Site Rank Sum W-Stat 2401
WMW Test U-Stat 0.722
WMW Critical Value (0.050) 1.645
P-Value 0.235
Conclusion with Alpha = 0.05
Do Not Reject H0, Conclude Site <= Background
P-Value >= alpha (0.05)
ProUCL Version 4.0 (Version 4.00.04)

SR3 - Dry Season SS at Mid-Ebb (mg/L)
Date SS mg/L Date SS mg/L Date SS mg/L
26-Dec-2015 4.8 11-Nov-2017 6.2 21-Nov-2015 3.6
29-Dec-2015 3.5 14-Nov-2017 7.7 24-Dec-2015 6.2
31-Dec-2015 7.8 16-Nov-2017 8.3 9-Jan-2016 2.2
12-Jan-2016 3.8 18-Nov-2017 7.7 25-Feb-2017 10.5
14-Jan-2016 3.7 4-Nov-2017 9.5
26-Mar-2016 3.5 21-Nov-2017 7.2
29-Mar-2016 2.2
24-Dec-2016 4.8
27-Dec-2016 5.5
31-Dec-2016 7.3
3-Jan-2017 9.0
7-Jan-2017 5.3
10-Jan-2017 7.0
14-Jan-2017 7.8
17-Jan-2017 10.2
19-Jan-2017 8.5
21-Jan-2017 4.2
23-Jan-2017 7.5
25-Jan-2017 7.8
27-Jan-2017 6.0
31-Jan-2017 11.3
2-Feb-2017 6.5
4-Feb-2017 6.2
7-Feb-2017 6.3
9-Feb-2017 10.0
11-Feb-2017 6.8
14-Feb-2017 8.5
16-Feb-2017 5.2
18-Feb-2017 1.2
21-Feb-2017 3.3
23-Feb-2017 5.0
28-Feb-2017 2.8
2-Mar-2017 7.0
4-Mar-2017 5.5
7-Mar-2017 8.7
9-Mar-2017 4.2
11-Mar-2017 4.8
14-Mar-2017 7.2
16-Mar-2017 5.5
18-Mar-2017 4.7
21-Mar-2017 1.7
23-Mar-2017 2.7
25-Mar-2017 6.0
28-Mar-2017 4.3
30-Mar-2017 4.5
2-Nov-2017 4.2
7-Nov-2017 11.3
9-Nov-2017 11.3
No Dredging Work With Dredging Works

SR3 - Dry Season SS at Mid-Ebb (mg/L)
No Dredging Work With Dredging Works
Raw Statistics Raw Statistics
Number of Valid Observations 52 Number of Valid Observations 6
Number of Distinct Observations 36 Number of Distinct Observations 6
Minimum 1.167 Minimum 2.167
Maximum 11.33 Maximum 10.5
Mean of Raw Data 6.093 Mean of Raw Data 6.517
Standard Deviation of Raw Data 2.458 Standard Deviation of Raw Data 3.248
Kstar 5.106 Kstar 2.064
Mean of Log Transformed Data 1.712 Mean of Log Transformed Data 1.741
Standard Deviation of Log Transformed Data 0.473 Standard Deviation of Log Transformed Data 0.607
Normal Distribution Test Results Normal Distribution Test Results
Correlation Coefficient R 0.993 Correlation Coefficient R 0.987
Approximate Shapiro Wilk Test Statistic 0.972 Shapiro Wilk Test Statistic 0.956
Approximate Shapiro Wilk P Value 4.24E-01 Shapiro Wilk Critical (0.95) Value 0.788
Lilliefors Test Statistic 0.0761 Approximate Shapiro Wilk P Value N/A
Lilliefors Critical (0.95) Value 0.123 Lilliefors Test Statistic 0.154
Lilliefors Critical (0.95) Value 0.362
Data appear Normal at (0.05) Significance Level Data appear Normal at (0.05) Significance Level
t-Test Site vs Background Comparison for Full Data Sets without NDs
User Selected Options
Full Precision OFF
Confidence Coefficient 95%
Substantial Difference 0%
Selected Null Hypothesis Site or AOC Mean/Median Less Than or Equal to Background Mean/Median (Form 1)
Alternative Hypothesis Site or AOC Mean/Median Greater Than Background Mean/Median
Area of Concern Data: With Dredging Works
Background Data: No Dredging Work
Raw Statistics
Site Background
Number of Valid Observations 6 52
Number of Distinct Observations 6 36
Minimum 2.167 1.167
Maximum 10.5 11.33
Mean 6.517 6.093
Median 6.667 6
SD 3.248 2.458
SE of Mean 1.326 0.341
Site vs Background Two-Sample t-Test
H0: Mu of Site - Mu of Background <= 0
t-Test Critical
Method DF Value t (0.050) P-Value
Pooled (Equal Variance) 56 0.387 1.673 0.35
Satterthwaite (Unequal Variance) 5.7 0.31 1.943 0.384
Pooled SD 2.538
Conclusion with Alpha = 0.050
* Student t (Pooled) Test: Do Not Reject H0, Conclude Site <= Background
* Satterthwaite Test: Do Not Reject H0, Conclude Site <= Background
ProUCL Version 4.0 (Version 4.00.04)

SR3 - Wet Season SS at Mid-Ebb (mg/L)
Date SS mg/L Date SS mg/L Date SS mg/L
4-Jun-2015 1.7 3-Jun-2017 3.3 2-Jun-2015 5.3
11-Jun-2015 1.2 6-Jun-2017 2.8 3-Sep-2015 5.3
14-Jul-2015 3.5 8-Jun-2017 2.8 12-Sep-2015 6.8
16-Jul-2015 3.5 10-Jun-2017 5.8 26-Sep-2015 7.2
18-Jul-2015 5.2 20-Jun-2017 2.8 6-Oct-2015 5.7
25-Jul-2015 2.2 22-Jun-2017 3.7 16-Apr-2016 1.2
1-Sep-2015 6.7 24-Jun-2017 3.3 4-Jun-2016 7.8
2-Apr-2016 4.0 27-Jun-2017 6.0 18-Jun-2016 3.5
14-Apr-2016 7.5 4-Jul-2017 3.8 2-Jul-2016 3.8
3-May-2016 5.5 6-Jul-2017 2.5 9-Jul-2016 2.0
7-May-2016 9.5 8-Jul-2017 3.3 12-Jul-2016 5.3
2-Jun-2016 2.8 15-Jul-2017 3.3 20-Apr-2017 3.3
14-Jul-2016 3.5 18-Jul-2017 1.0 29-Apr-2017 8.0
16-Jul-2016 3.3 20-Jul-2017 4.5 6-May-2017 3.7
19-Jul-2016 6.7 22-Jul-2017 3.3 11-May-2017 2.7
21-Jul-2016 6.0 25-Jul-2017 4.5 25-May-2017 3.7
23-Jul-2016 5.7 27-Jul-2017 6.7 15-Jun-2017 3.2
26-Jul-2016 8.8 29-Jul-2017 3.5 17-Jun-2017 2.8
28-Jul-2016 3.5 5-Aug-2017 3.8 29-Jun-2017 2.7
30-Jul-2016 4.8 15-Aug-2017 5.2 1-Jul-2017 2.3
4-Aug-2016 2.2 17-Aug-2017 1.3 11-Jul-2017 4.2
6-Aug-2016 4.2 19-Aug-2017 3.5 18-Jul-2017 1.0
9-Aug-2016 2.8 22-Aug-2017 4.8 20-Jul-2017 4.5
11-Aug-2016 2.7 24-Aug-2017 5.7 1-Aug-2017 4.7
13-Aug-2016 2.2 26-Aug-2017 5.8 3-Aug-2017 5.3
16-Aug-2016 4.7 29-Aug-2017 5.2 10-Aug-2017 4.3
20-Aug-2016 2.0 31-Aug-2017 4.0 7-Sep-2017 5.2
1-Apr-2017 6.3 2-Sep-2017 2.7 21-Sep-2017 5.7
4-Apr-2017 3.8 5-Sep-2017 8.7 23-Sep-2017 4.3
6-Apr-2017 5.8 9-Sep-2017 8.3 28-Sep-2017 4.3
8-Apr-2017 3.7 12-Sep-2017 3.3 12-Oct-2017 6.3
11-Apr-2017 3.2 14-Sep-2017 1.7 19-Oct-2017 17.0
13-Apr-2017 5.0 16-Sep-2017 6.3 21-Oct-2017 8.8
18-Apr-2017 5.5 19-Sep-2017 7.0 26-Oct-2017 4.7
22-Apr-2017 4.5 30-Sep-2017 3.8 28-Oct-2017 7.0
25-Apr-2017 14.3 3-Oct-2017 6.2 31-Oct-2017 6.0
27-Apr-2017 6.0 5-Oct-2017 6.3
2-May-2017 5.7 7-Oct-2017 9.5
4-May-2017 2.3 14-Oct-2017 8.7
9-May-2017 5.2 17-Oct-2017 13.8
13-May-2017 6.3 24-Oct-2017 8.0
16-May-2017 1.0
18-May-2017 4.8
20-May-2017 2.2
23-May-2017 4.3
27-May-2017 1.5
30-May-2017 1.0
1-Jun-2017 2.8
No Dredging Work With Dredging Works

SR3 - Wet Season SS at Mid-Ebb (mg/L)
No Dredging Work With Dredging Works
Raw Statistics Raw Statistics
Number of Valid Observations 89 Number of Valid Observations 36
Number of Distinct Observations 40 Number of Distinct Observations 27
Minimum 1 Minimum 1
Maximum 14.33 Maximum 17
Mean of Raw Data 4.633 Mean of Raw Data 4.991
Standard Deviation of Raw Data 2.484 Standard Deviation of Raw Data 2.778
Kstar 3.598 Kstar 3.615
Mean of Log Transformed Data 1.393 Mean of Log Transformed Data 1.475
Standard Deviation of Log Transformed Data 0.553 Standard Deviation of Log Transformed Data 0.54
Normal Distribution Test Results Normal Distribution Test Results
Correlation Coefficient R 0.95 Correlation Coefficient R 0.894
Approximate Shapiro Wilk Test Statistic 0.904 Shapiro Wilk Test Statistic 0.828
Approximate Shapiro Wilk P Value 2.23E-07 Shapiro Wilk Critical (0.95) Value 0.935
Lilliefors Test Statistic 0.109 Approximate Shapiro Wilk P Value 2.11E-05
Lilliefors Critical (0.95) Value 0.0939 Lilliefors Test Statistic 0.154
Lilliefors Critical (0.95) Value 0.148
Data not Normal at (0.05) Significance Level Data not Normal at (0.05) Significance Level
Wilcoxon-Mann-Whitney Site vs Background Comparison Test for Full Data Sets without NDs
User Selected Options
Full Precision OFF
Confidence Coefficient 95%
Substantial Difference 0%
Selected Null Hypothesis Site or AOC Mean/Median Less Than or Equal to Background Mean/Median (Form 1)
Alternative Hypothesis Site or AOC Mean/Median Greater Than Background Mean/Median
Area of Concern Data: With Dredging Works
Background Data: No Dredging Work
Raw Statistics
Site Background
Number of Valid Observations 36 89
Number of Distinct Observations 27 40
Minimum 1 1
Maximum 17 14.33
Mean 4.991 4.633
Median 4.583 4
SD 2.778 2.484
SE of Mean 0.463 0.263
Wilcoxon-Mann-Whitney (WMW) Test
H0: Mean/Median of Site or AOC <= Mean/Median of Background
Site Rank Sum W-Stat 2411
WMW Test U-Stat 0.774
WMW Critical Value (0.050) 1.645
P-Value 0.219
Conclusion with Alpha = 0.05
Do Not Reject H0, Conclude Site <= Background
P-Value >= alpha (0.05)
ProUCL Version 4.0 (Version 4.00.04)