Embed Size (px)
Citation preview
Fukushima Incident
Preliminary Analysis, Consequencesand
Safety Status of Indian NPPsPart-1
Dr. S.K.Jain
Chairman & Managing Director NPCIL & BHAVINI
Contents
• Introduction • Overview of the Incident• Sequence of Events & Present Scenario• Preliminary Analysis• Safety Status of Indian NPPs• Actions taken by Indian & International
agencies• Radiation & Emergency Preparedness
aspects
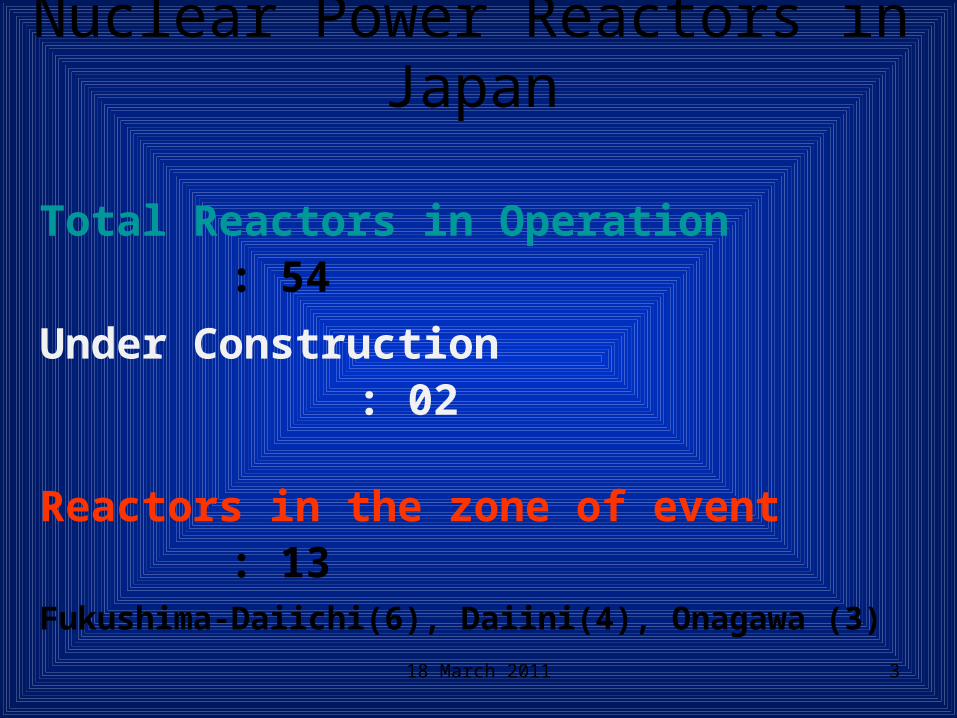
Nuclear Power Reactors in Japan
Total Reactors in Operation : 54
Under Construction : 02
Reactors in the zone of event : 13Fukushima-Daiichi(6), Daiini(4), Onagawa (3)
318 March 2011
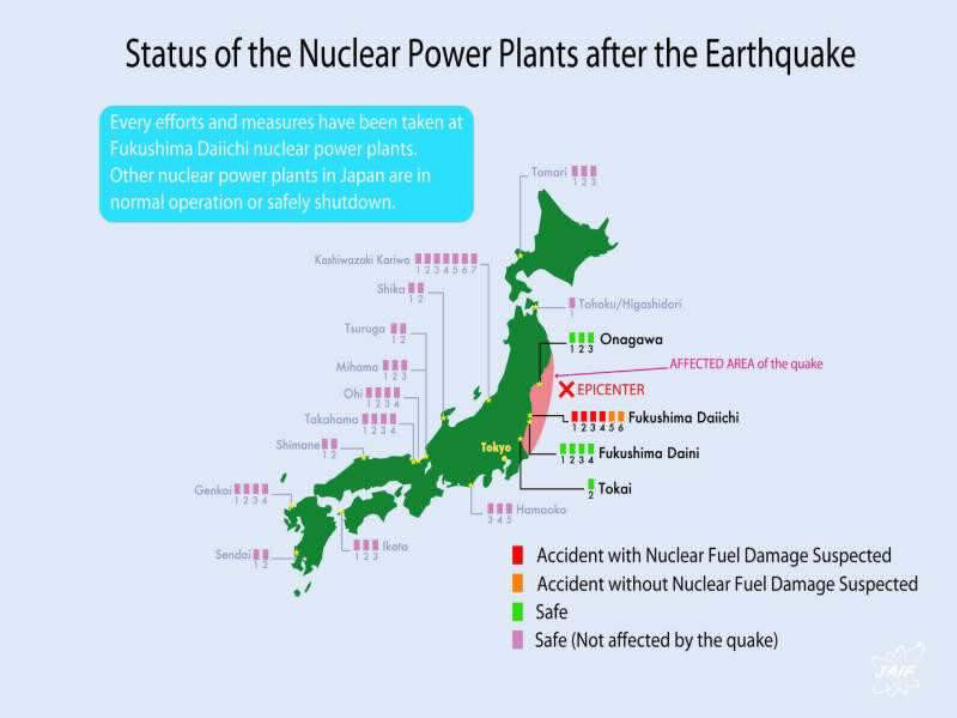
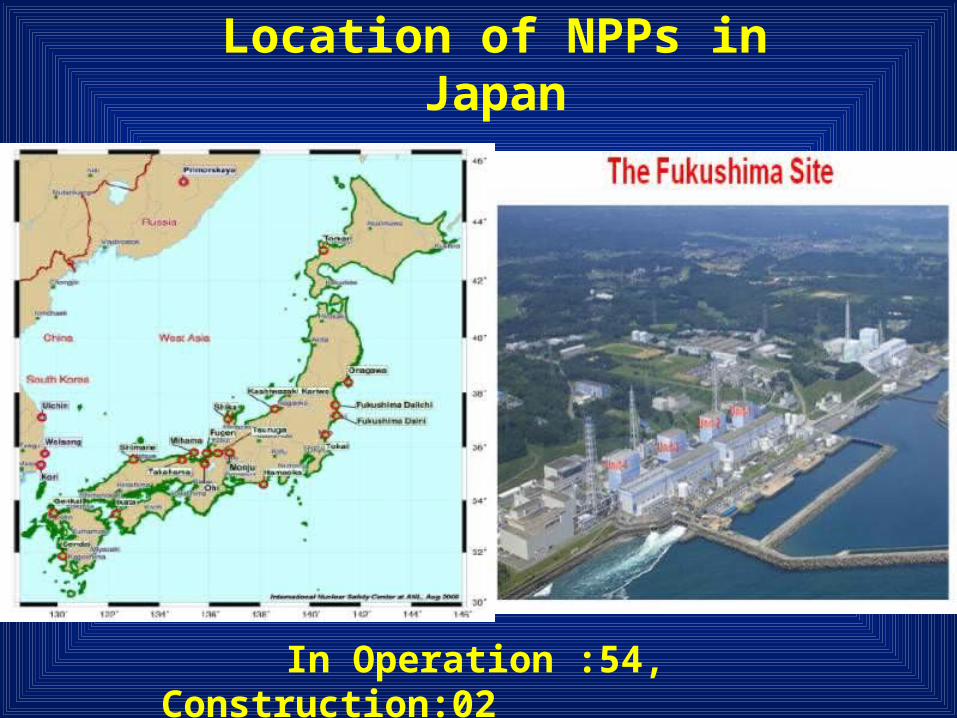
Location of NPPs in Japan
In Operation :54, Construction:02
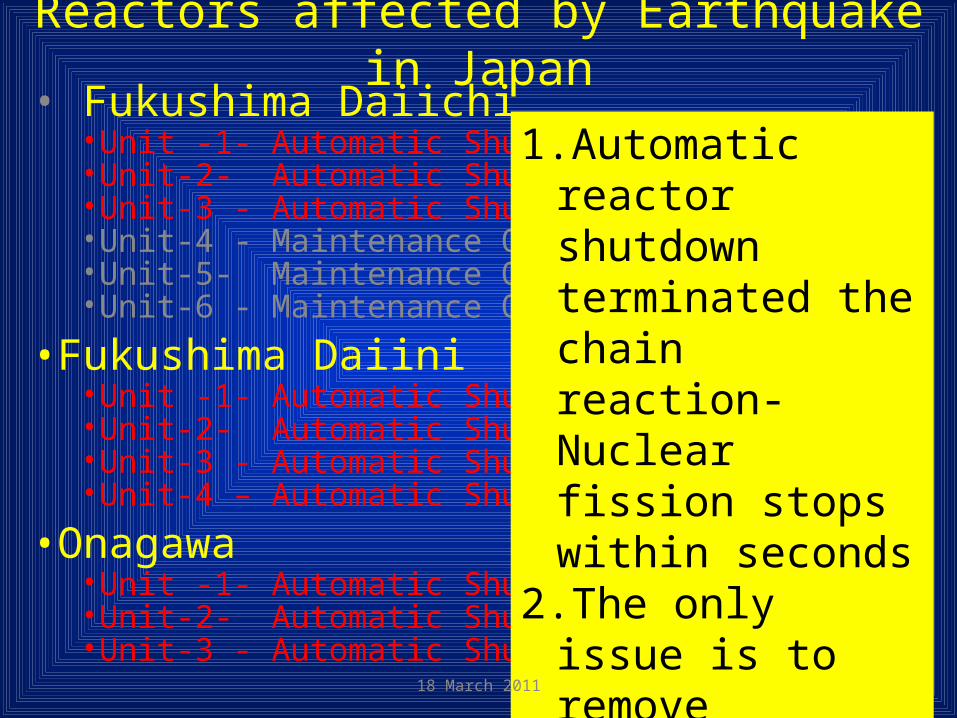
Reactors affected by Earthquake in Japan• Fukushima Daiichi
•Unit -1- Automatic Shutdown •Unit-2- Automatic Shutdown •Unit-3 - Automatic Shutdown •Unit-4 - Maintenance Outage•Unit-5- Maintenance Outage•Unit-6 - Maintenance Outage
•Fukushima Daiini•Unit -1- Automatic Shutdown•Unit-2- Automatic Shutdown •Unit-3 - Automatic Shutdown•Unit-4 – Automatic Shutdown
•Onagawa•Unit -1- Automatic Shutdown•Unit-2- Automatic Shutdown •Unit-3 - Automatic Shutdown
6
1.Automatic reactor shutdown terminated the chain reaction-Nuclear fission stops within seconds
2.The only issue is to remove radioactive decay heat from fuel
18 March 2011
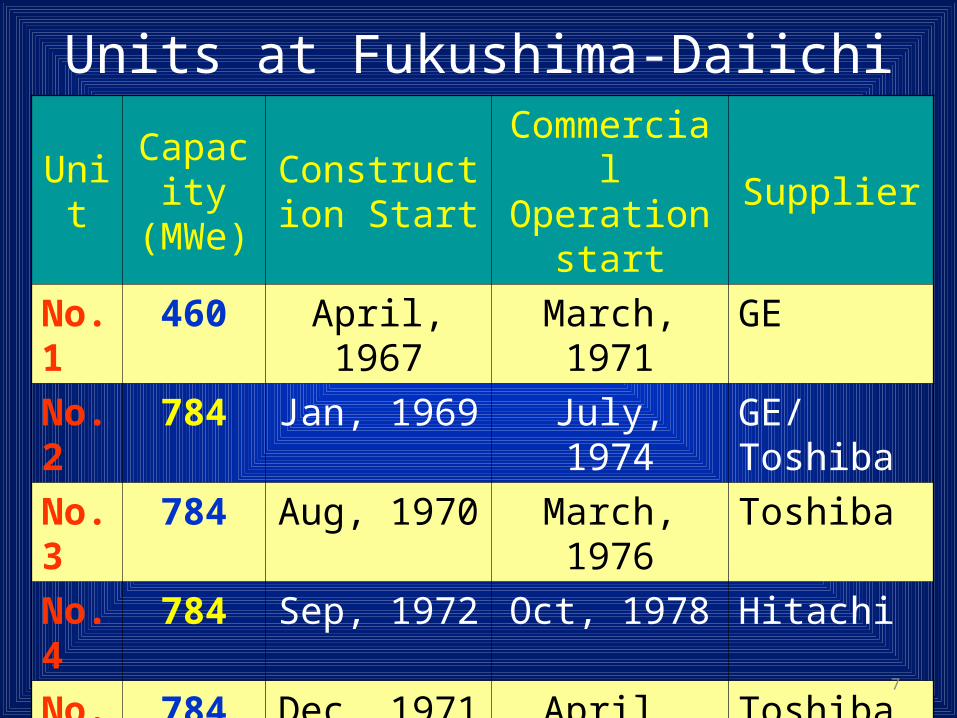
Units at Fukushima-Daiichi
Unit Capacity (MWe)
Construction Start
Commercial Operation start Supplier
No.1 460 April, 1967 March, 1971 GE
No.2 784 Jan, 1969 July, 1974 GE/Toshiba
No.3 784 Aug, 1970 March, 1976 Toshiba
No.4 784 Sep, 1972 Oct, 1978 Hitachi
No.5 784 Dec, 1971 April, 1978 Toshiba
No.6 1100 May, 1973 Oct, 1979 GE/Toshiba
Total Power : 4696 MWe7
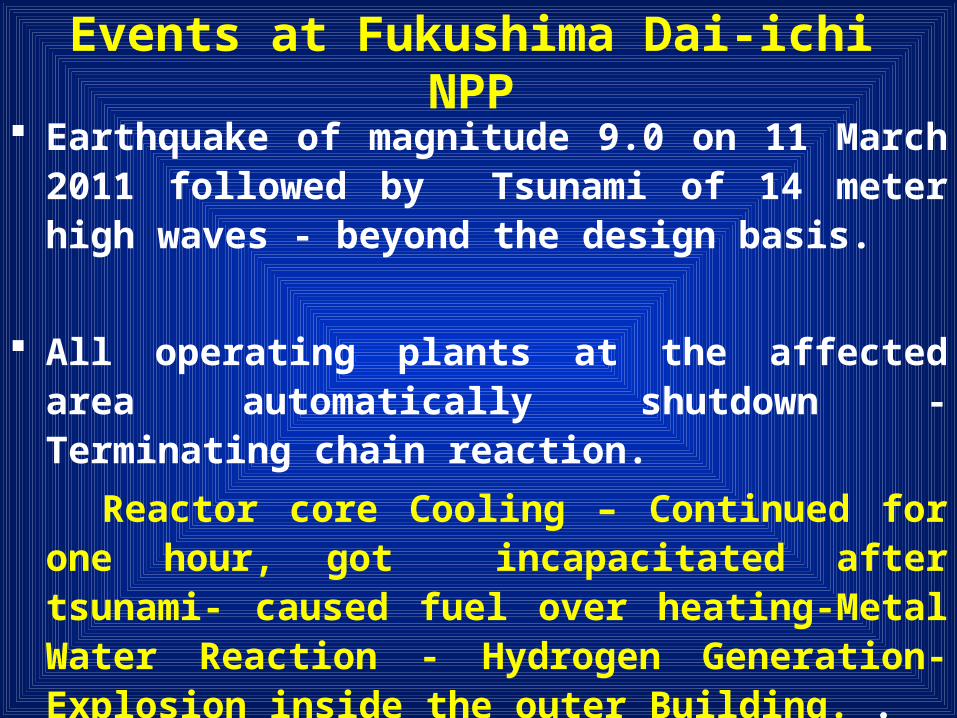
Events at Fukushima Dai-ichi NPP Earthquake of magnitude 9.0 on 11 March 2011
followed by Tsunami of 14 meter high waves - beyond the design basis.
All operating plants at the affected area automatically shutdown - Terminating chain reaction.
Reactor core Cooling – Continued for one hour, got incapacitated after tsunami- caused fuel over heating-Metal Water Reaction - Hydrogen Generation- Explosion inside the outer Building. .
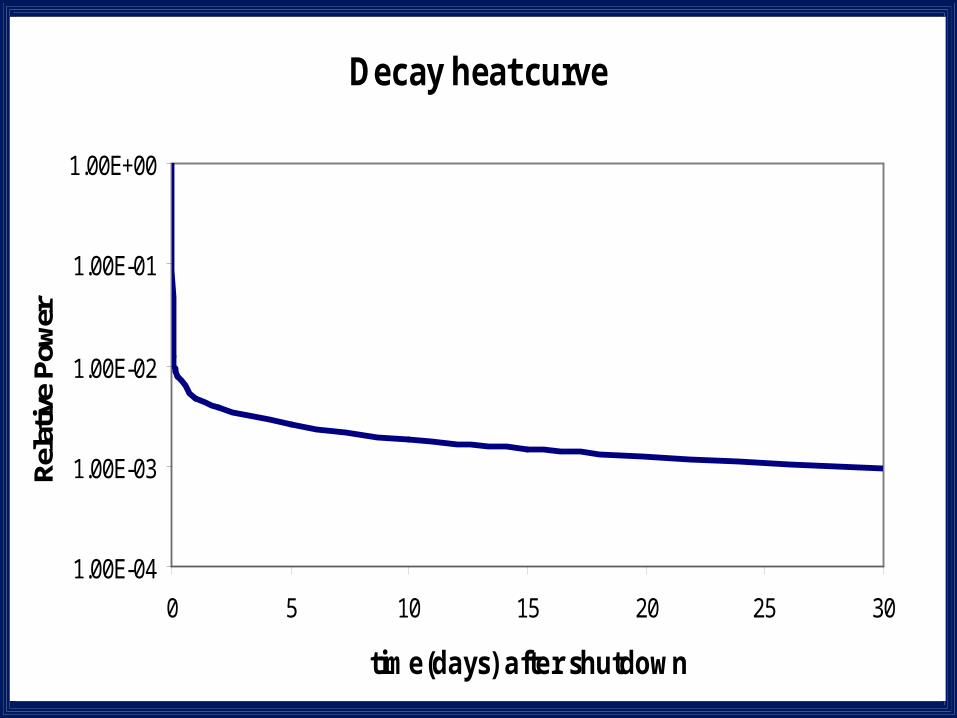
Decay heat curve
1.00E-04
1.00E-03
1.00E-02
1.00E-01
1.00E+00
0 5 10 15 20 25 30
time(days) after shutdown
Rela
tive
Pow
er

Incident Overview
IAEA
•
Information sources
NISA, Japan
JAIF
12
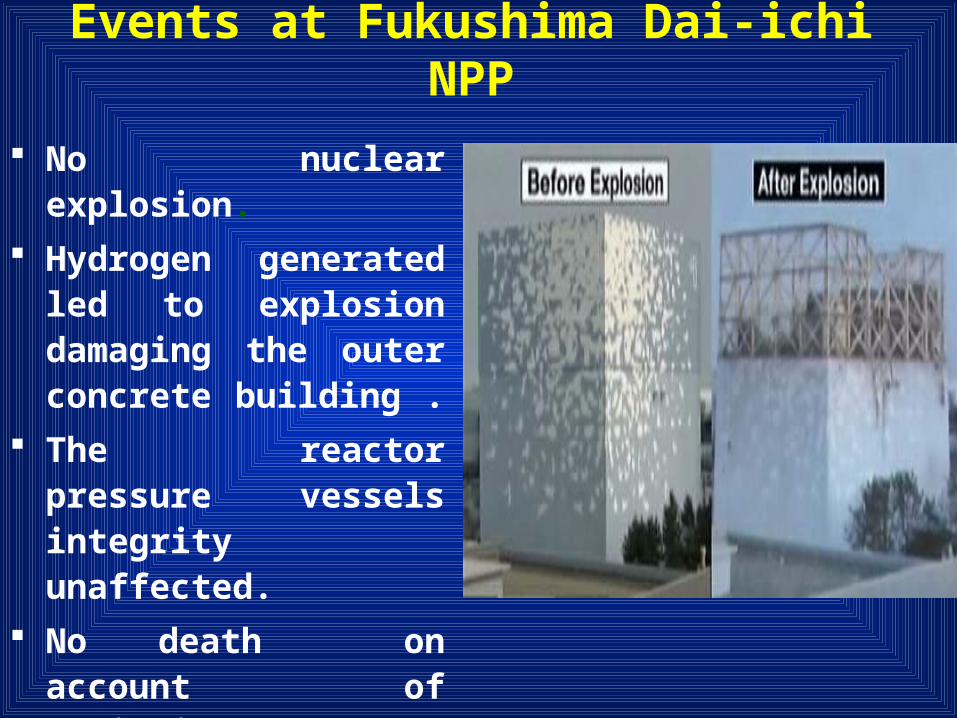
Events at Fukushima Dai-ichi NPP
No nuclear explosion.
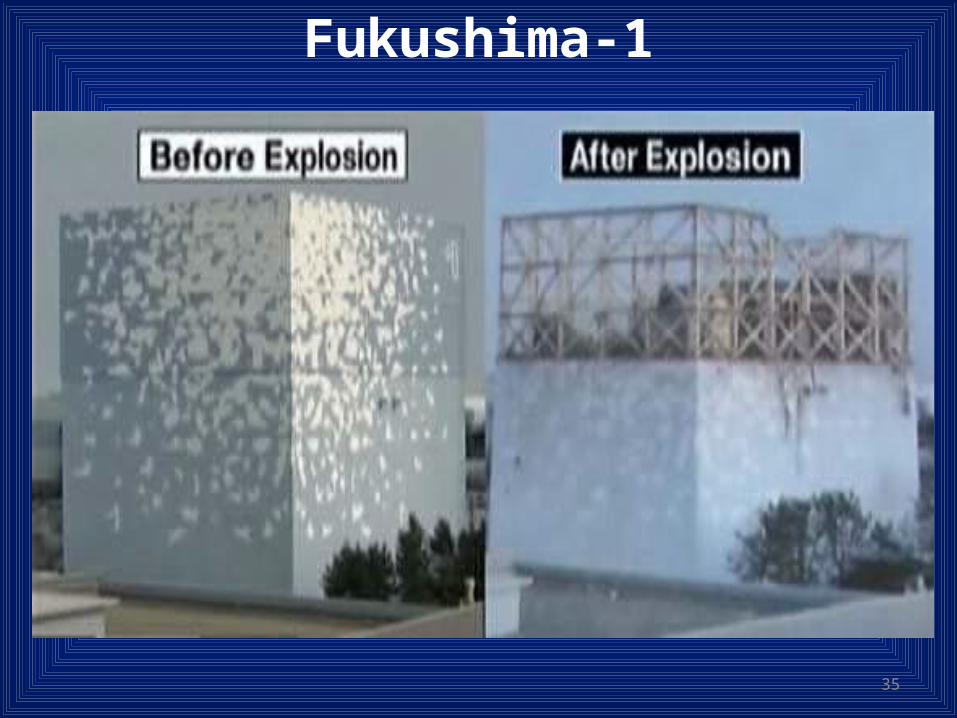
Hydrogen generated led to explosion damaging the outer concrete building .
The reactor pressure vessels integrity unaffected.
No death on account of radiation exposure.
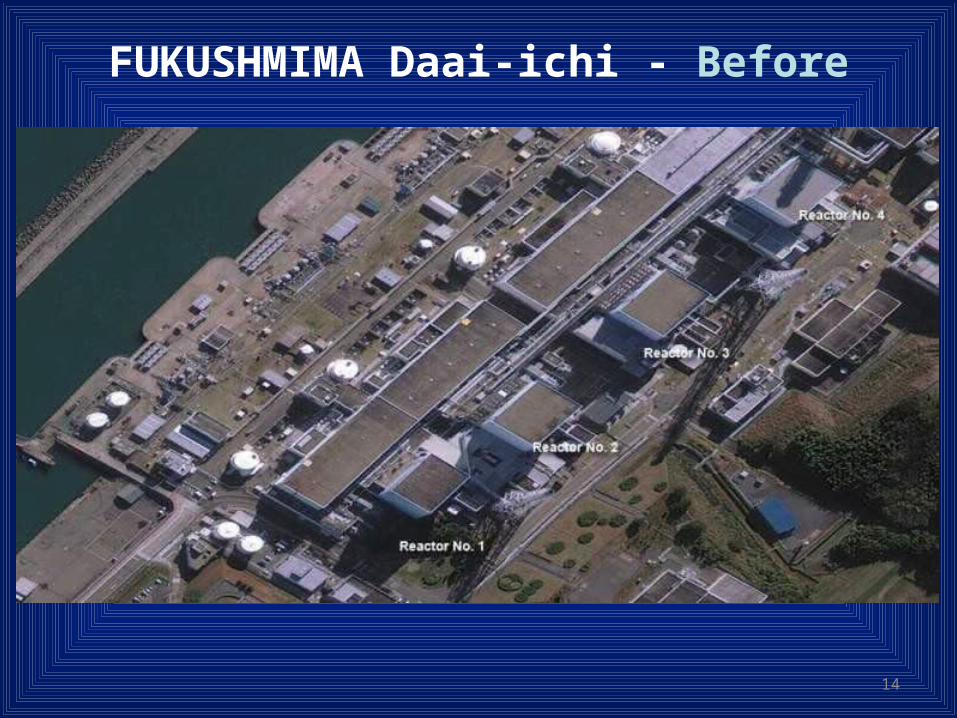
FUKUSHMIMA Daai-ichi - Before
14
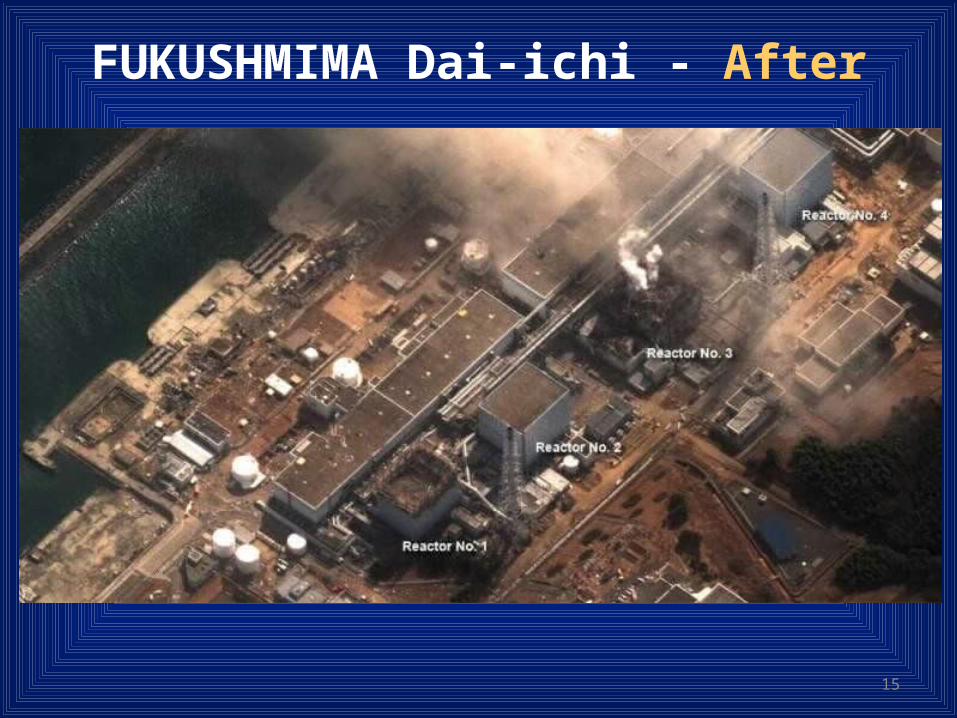
FUKUSHMIMA Dai-ichi - After
15

Possible scenario of
progression of events
16
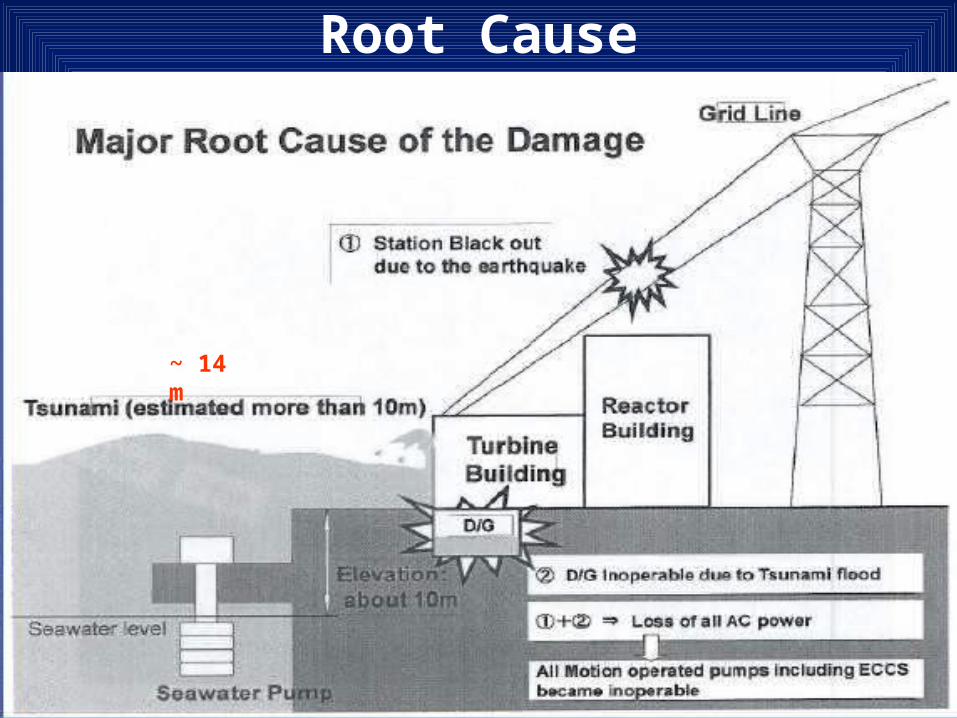
Root Cause
~ 14 m
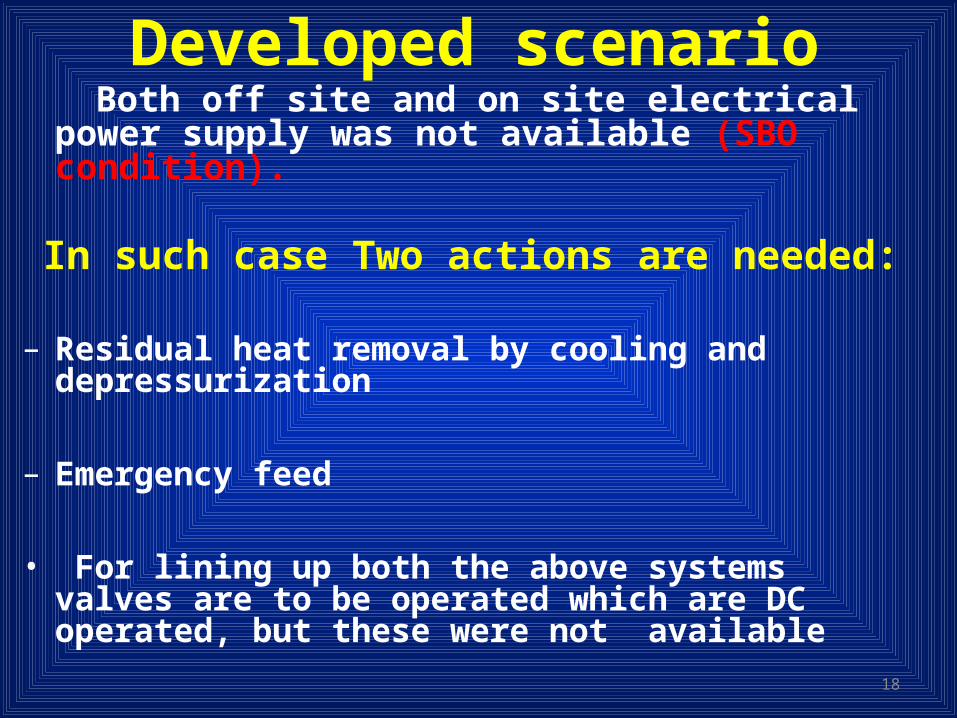
Developed scenario Both off site and on site electrical power
supply was not available (SBO condition).
In such case Two actions are needed:
– Residual heat removal by cooling and depressurization
– Emergency feed
• For lining up both the above systems valves are to be operated which are DC operated, but these were not available
18
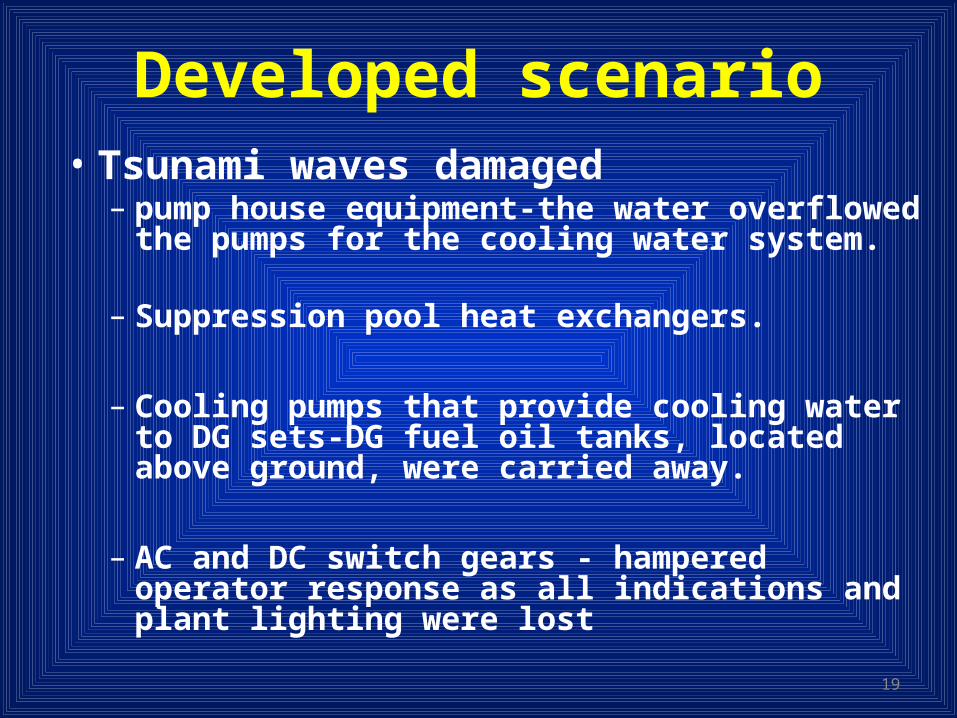
Developed scenario• Tsunami waves damaged
– pump house equipment-the water overflowed the pumps for the cooling water system.
– Suppression pool heat exchangers.
– Cooling pumps that provide cooling water to DG sets-DG fuel oil tanks, located above ground, were carried away.
– AC and DC switch gears - hampered operator response as all indications and plant lighting were lost
19
20
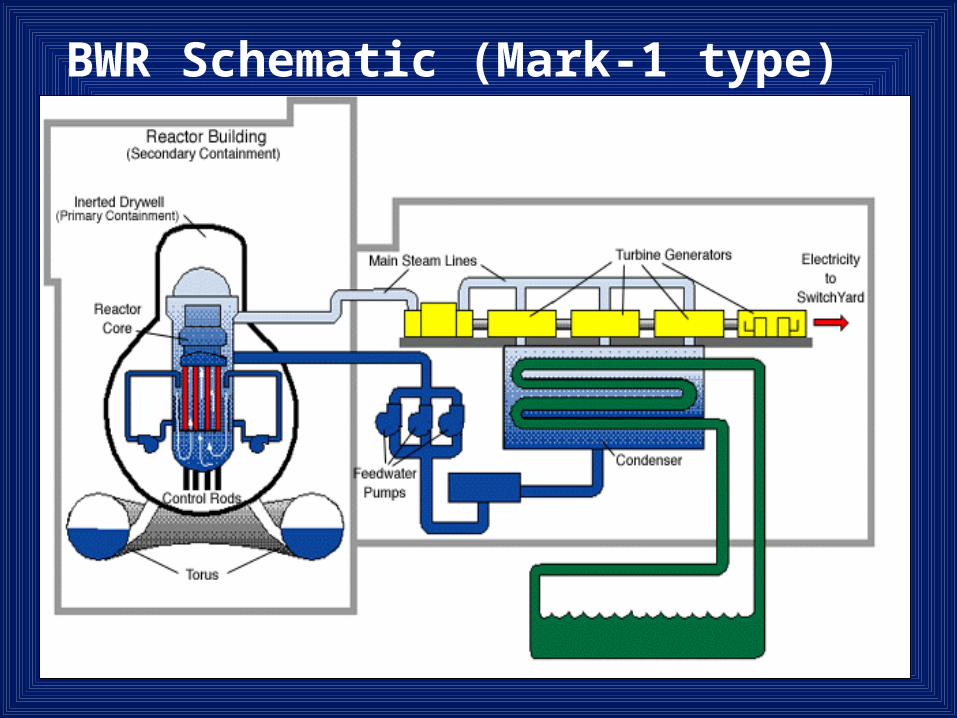
BWR Schematic (Mark-1 type)
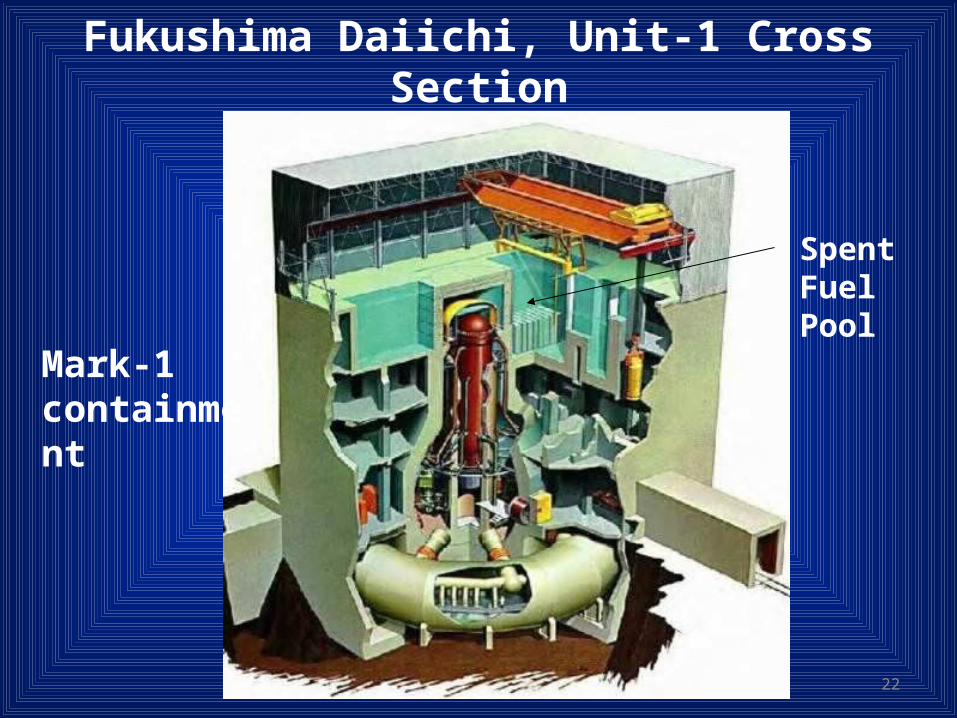
Fukushima Daiichi, Unit-1 Cross Section
Mark-1 containment
22
Spent Fuel Pool
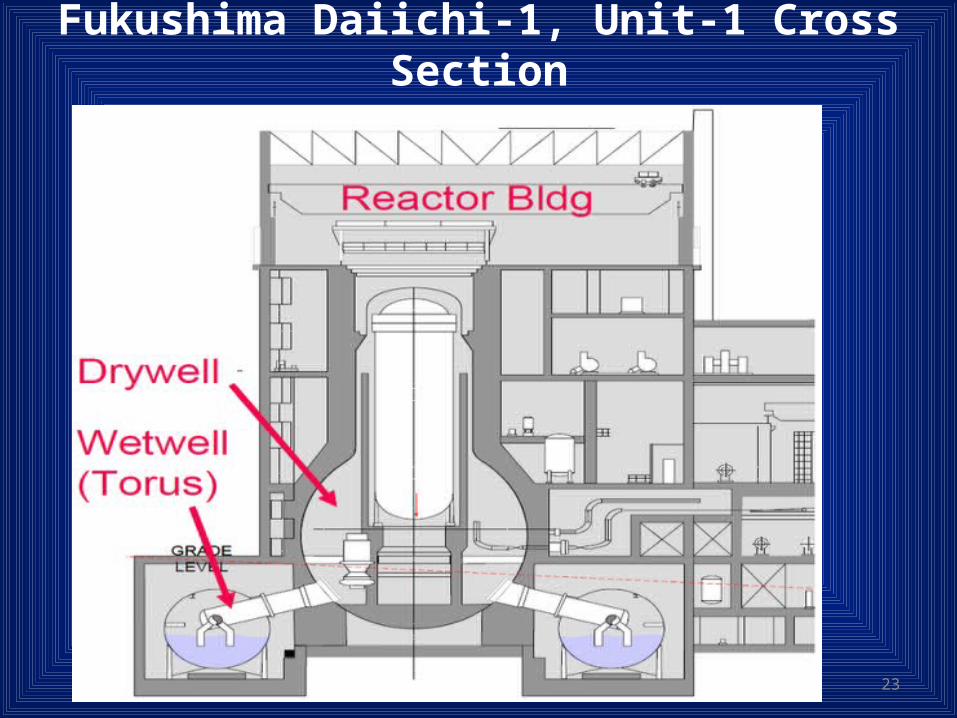
Fukushima Daiichi-1, Unit-1 Cross Section
23
Developed scenario
• The insufficient cooling pressure inside RPV increases and relieves it to the suppression pool through auto blow down system through instrumented relief valves/ mechanical RVs.
• This steam gets quenched in the suppression pool partly (as per efficiency) and remaining steam and non condensable comes to drywell, the primary containment and results in pressure rise of drywell also.
24
Developed scenario• Suppression pool recirculation pumps which are part of emergency cooling were not available so heat removal efficiency comes down and suppression pool temp increases, which further raises containment pressure.
• The pressure inside the reactor containment was allowed to increase as high as twice the design pressure in order to control the release the radioactivity.
25
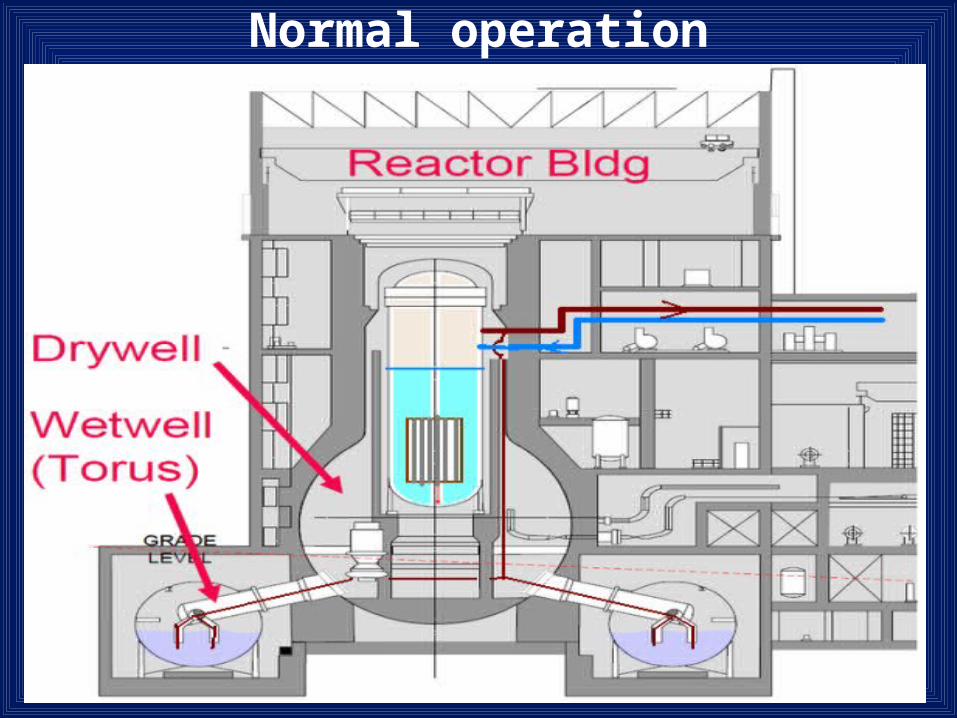
Normal operation
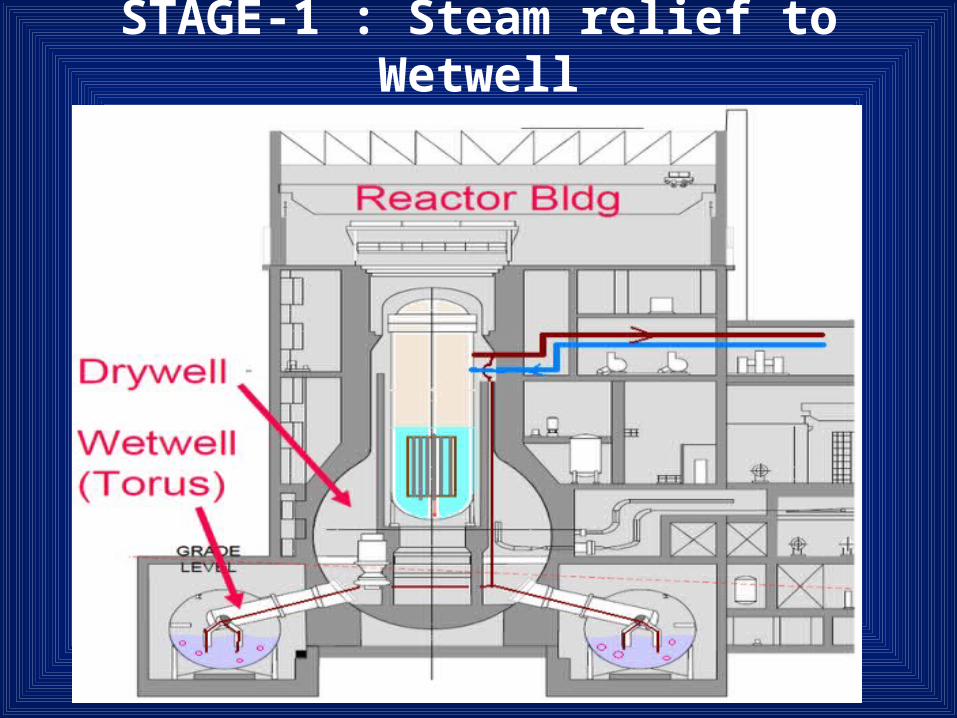
STAGE-1 : Steam relief to Wetwell
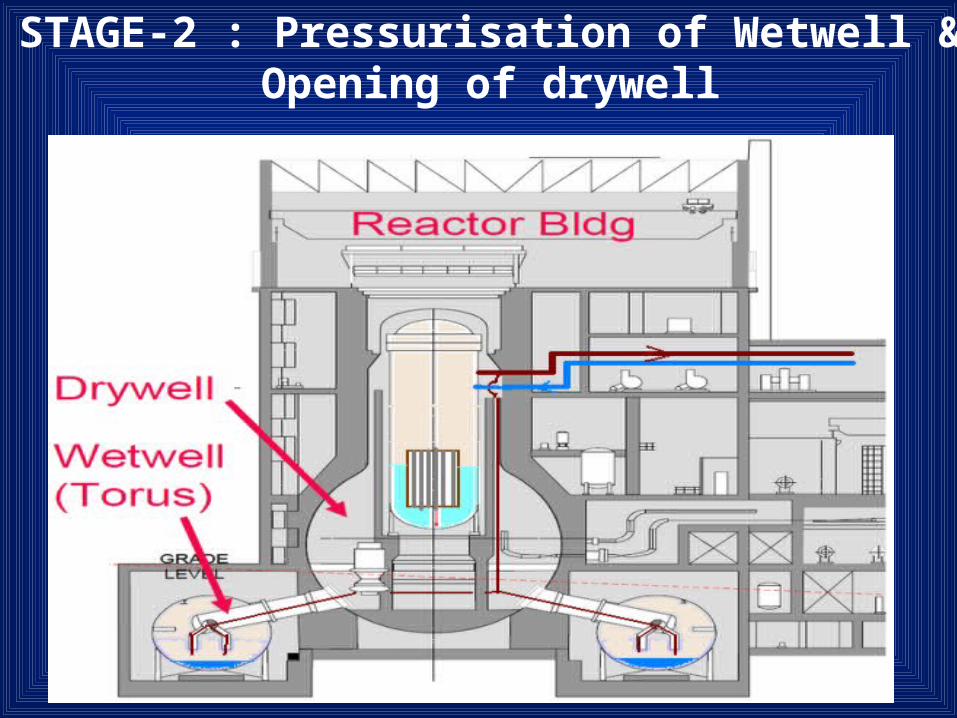
STAGE-2 : Pressurisation of Wetwell & Opening of drywell
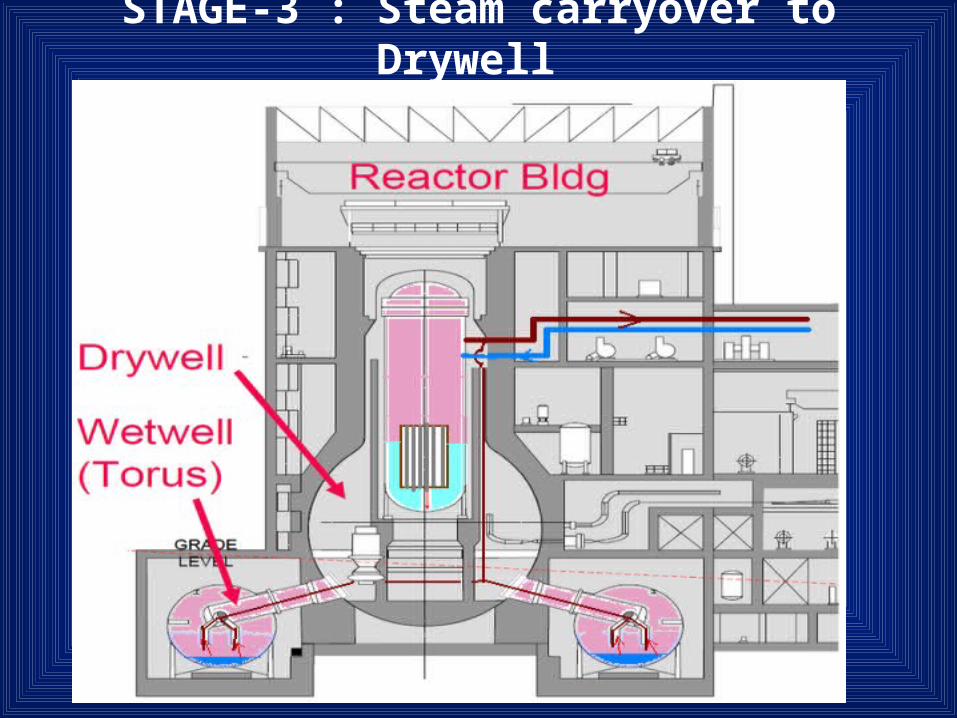
STAGE-3 : Steam carryover to Drywell
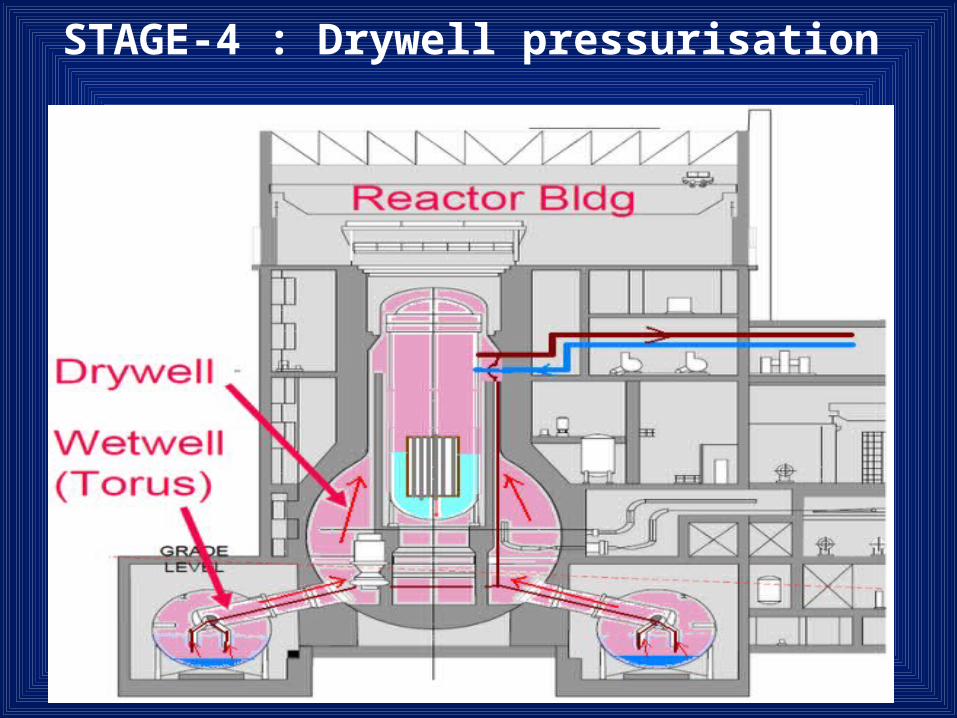
STAGE-4 : Drywell pressurisation
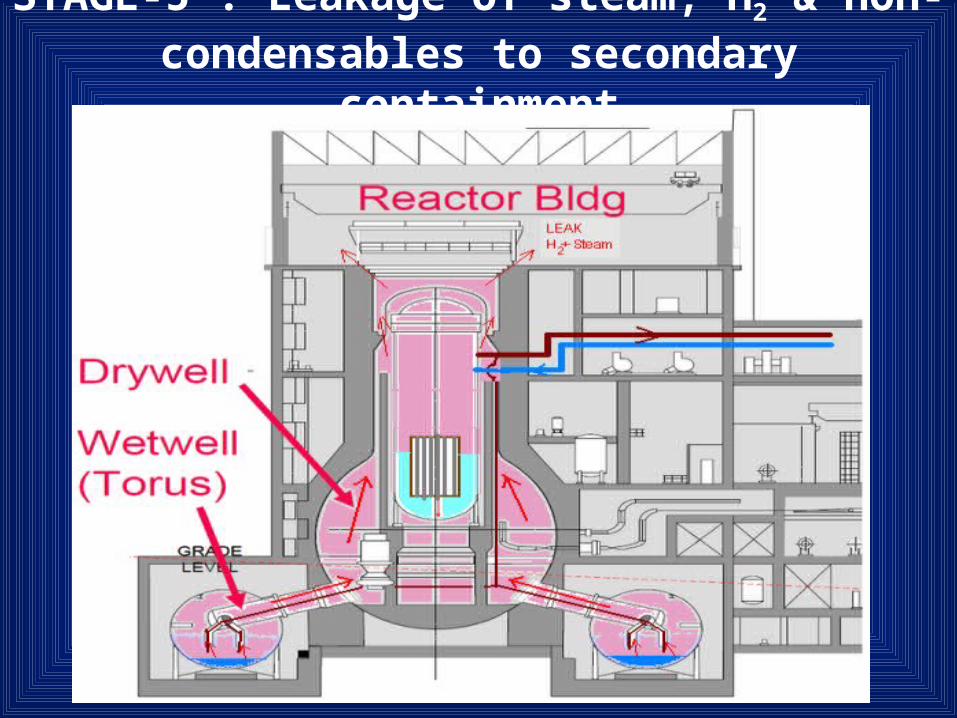
STAGE-5 : Leakage of steam, H2 & non-condensables to secondary containment
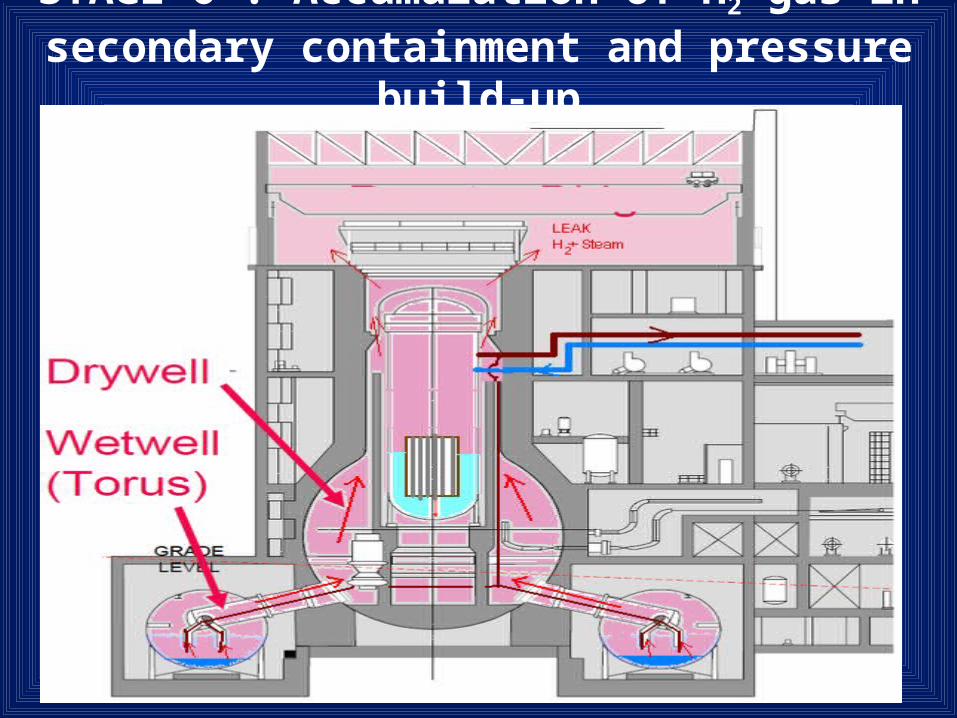
STAGE-6 : Accumulation of H2 gas in secondary containment and pressure build-up
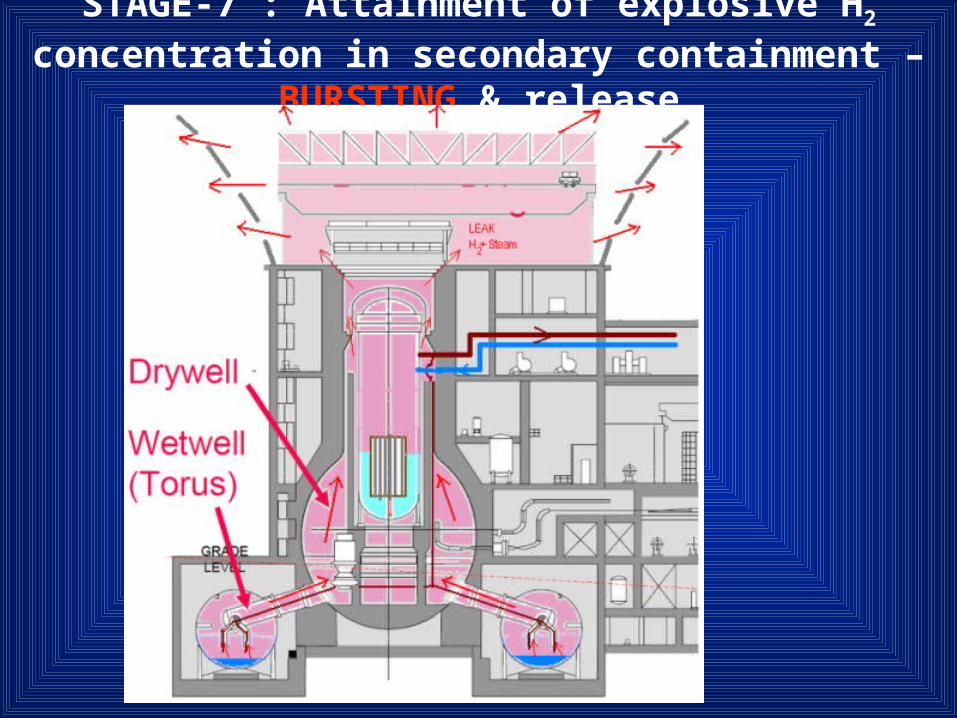
STAGE-7 : Attainment of explosive H2 concentration in secondary containment – BURSTING & release
(Units 1&3)
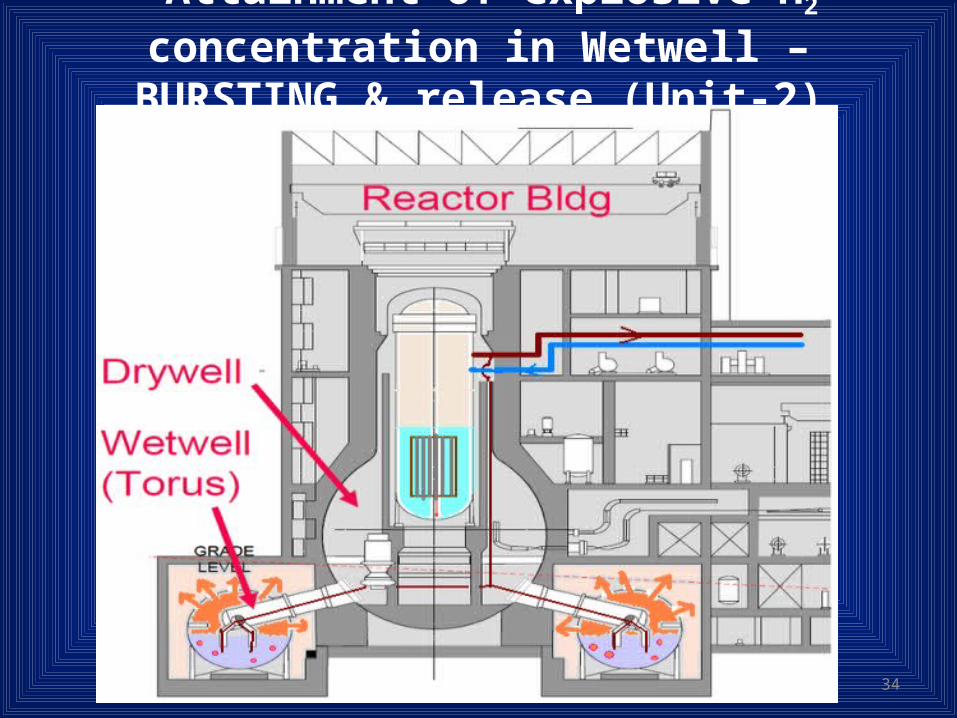
Attainment of explosive H2 concentration in Wetwell – BURSTING & release (Unit-2)
34
Fukushima-1
35
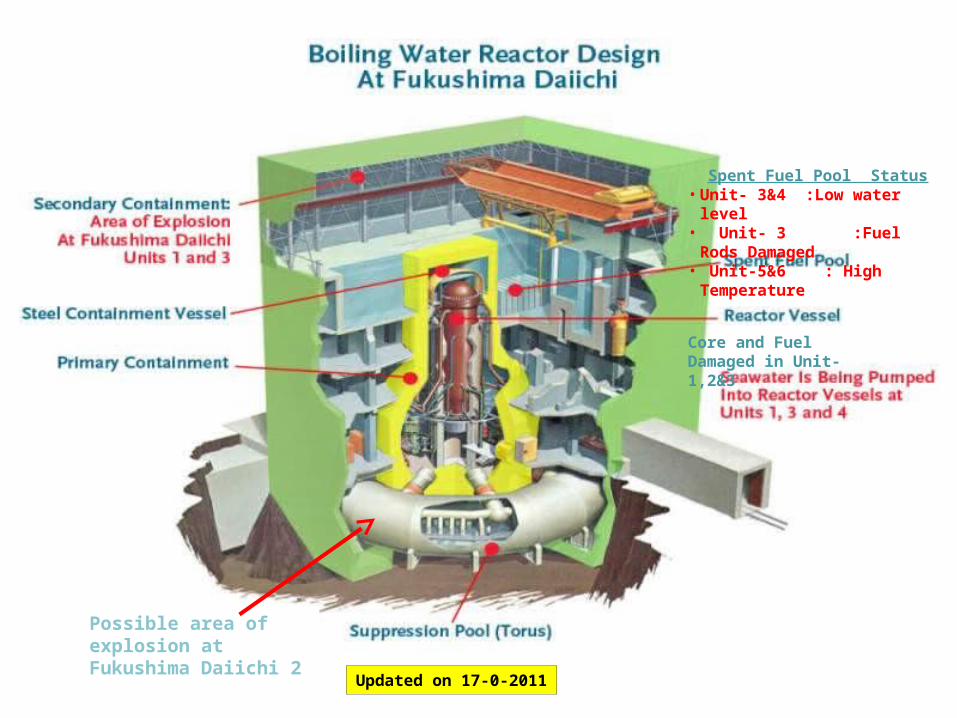
Possible area of explosion at Fukushima Daiichi 2
Spent Fuel Pool Status• Unit- 3&4 :Low water level • Unit- 3 :Fuel Rods
Damaged• Unit-5&6 : High Temperature
Core and Fuel Damaged in Unit- 1,2&3
Updated on 17-0-2011

Preliminary Analysis Source :IAEA
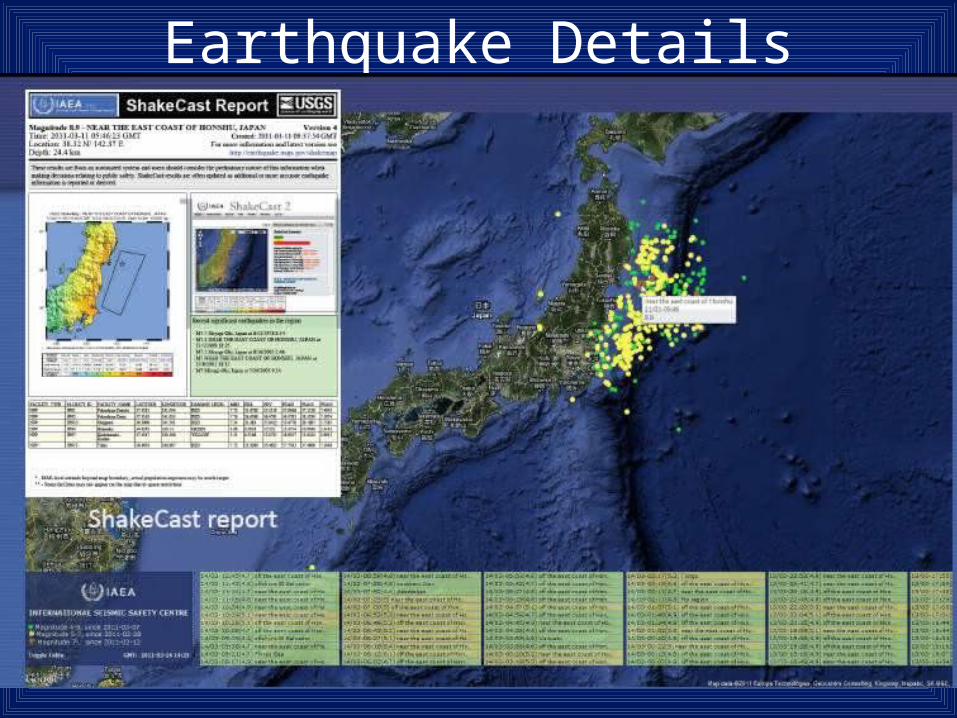
Earthquake Details
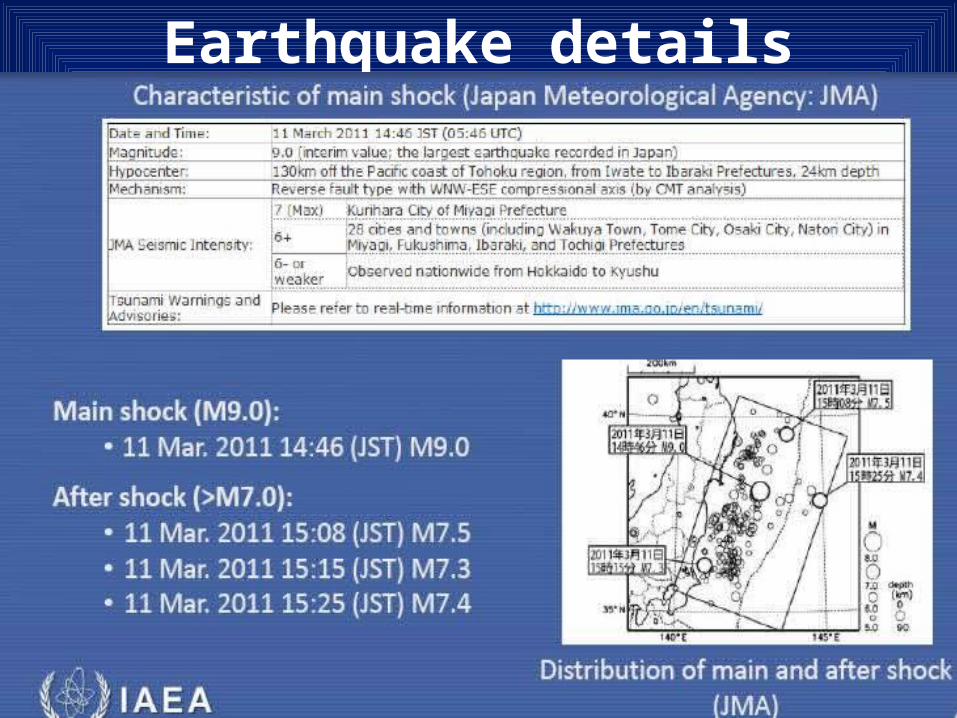
Earthquake details
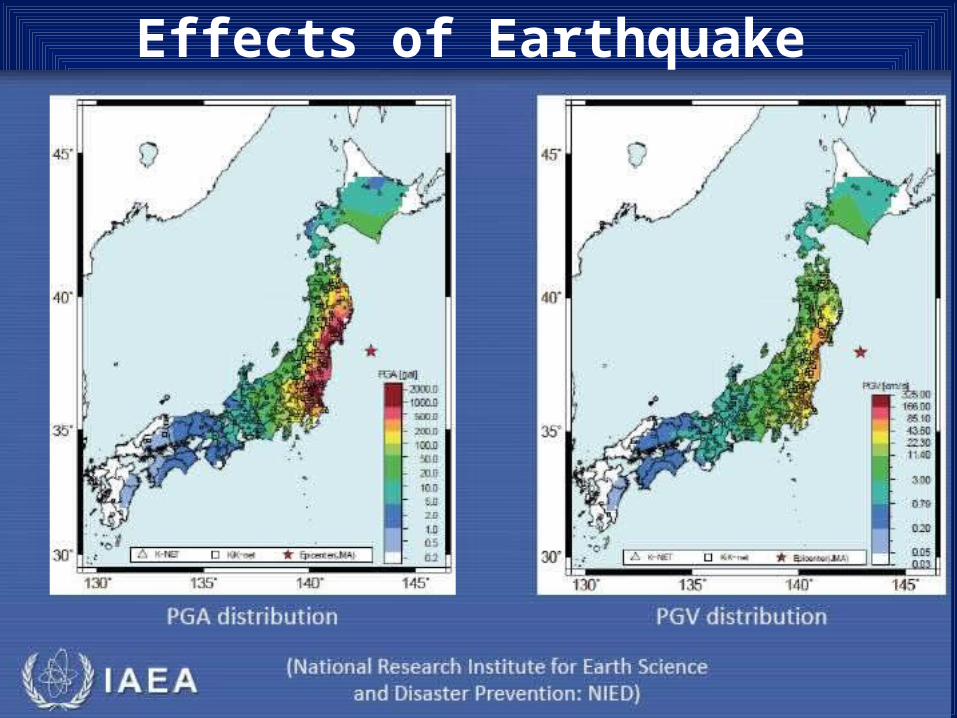
Effects of Earthquake
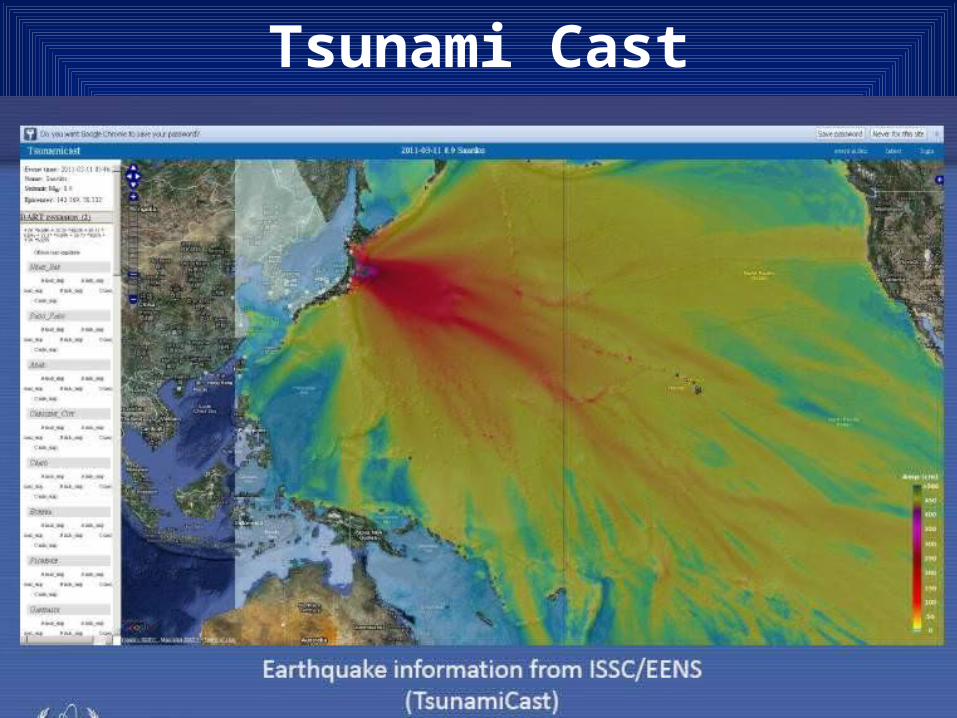
Tsunami Cast
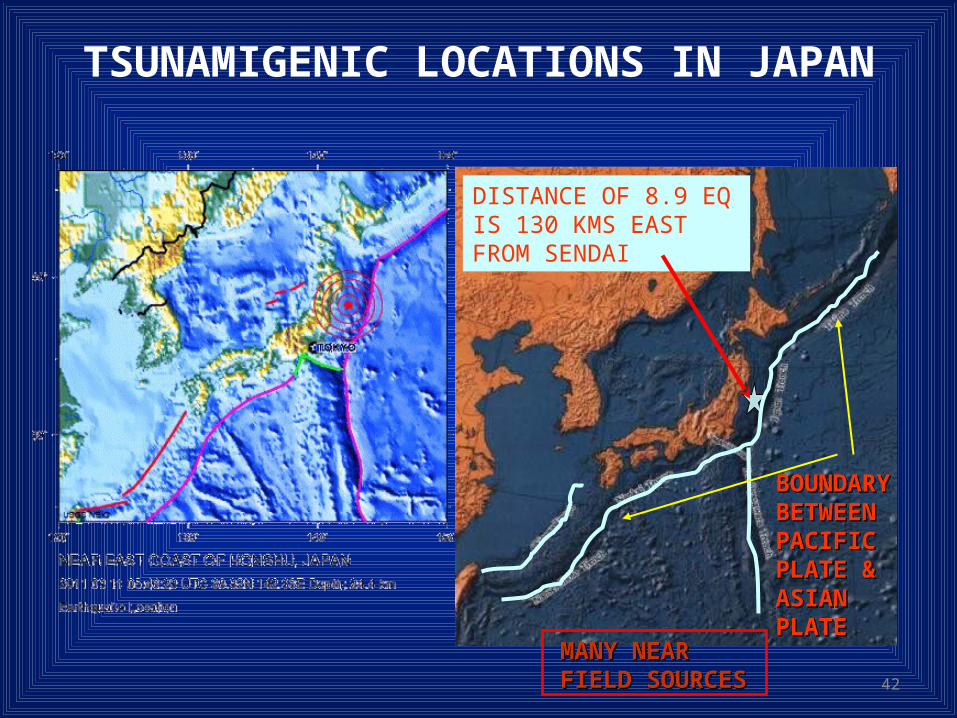
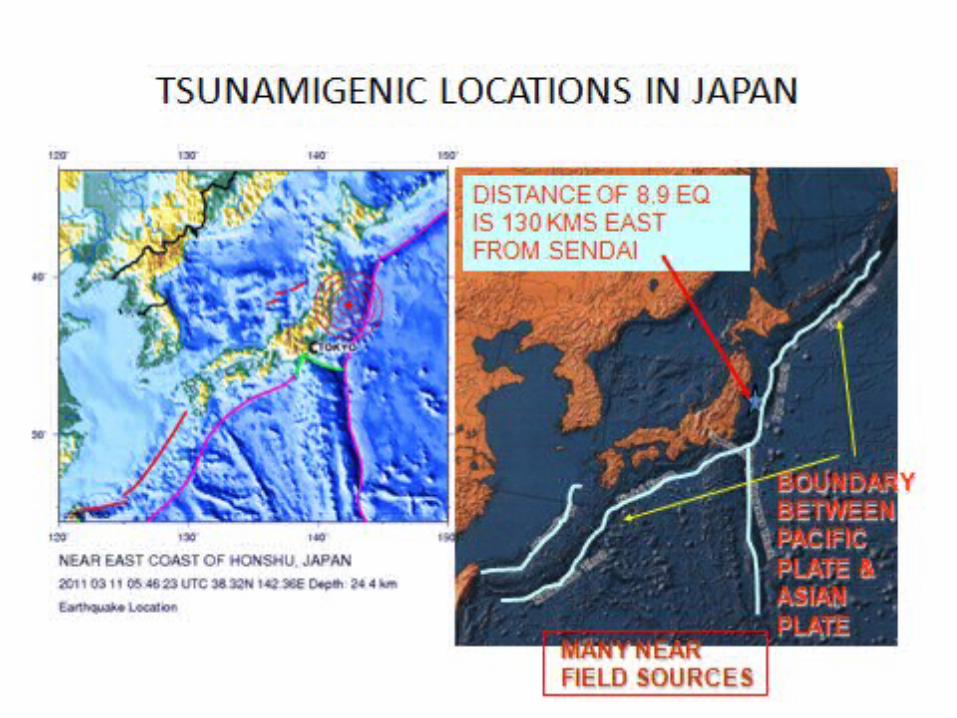
TSUNAMIGENIC LOCATIONS IN JAPAN
BOUNDARY BOUNDARY BETWEEN BETWEEN PACIFIC PACIFIC PLATE & PLATE & ASIAN ASIAN PLATEPLATE
DISTANCE OF 8.9 EQ IS 130 KMS EAST FROM SENDAI
MANY NEAR MANY NEAR FIELD SOURCESFIELD SOURCES 42
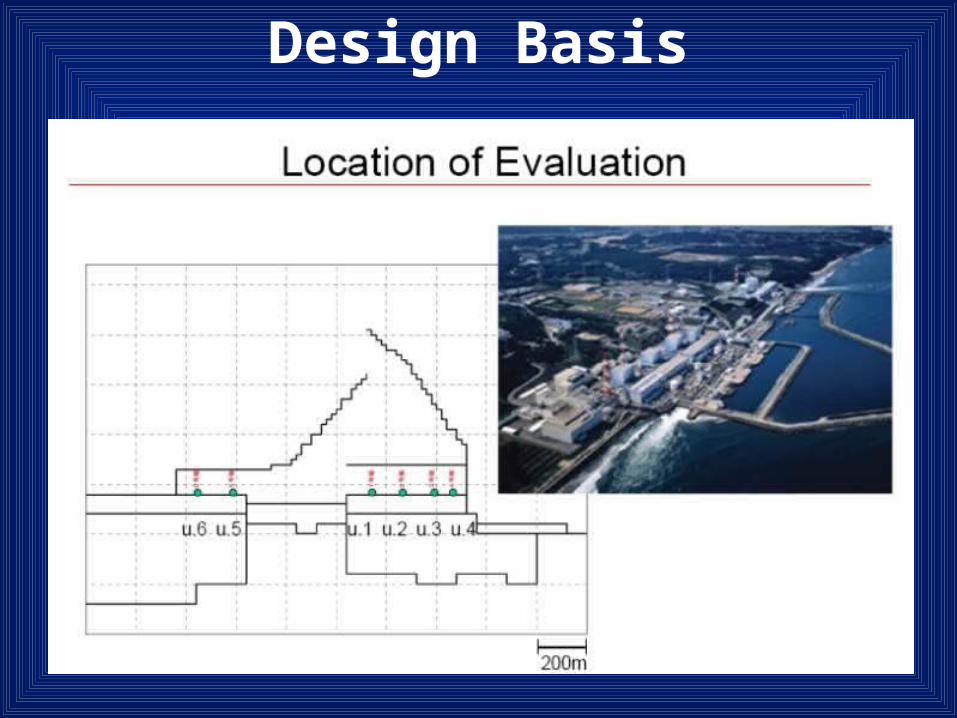
Design Basis
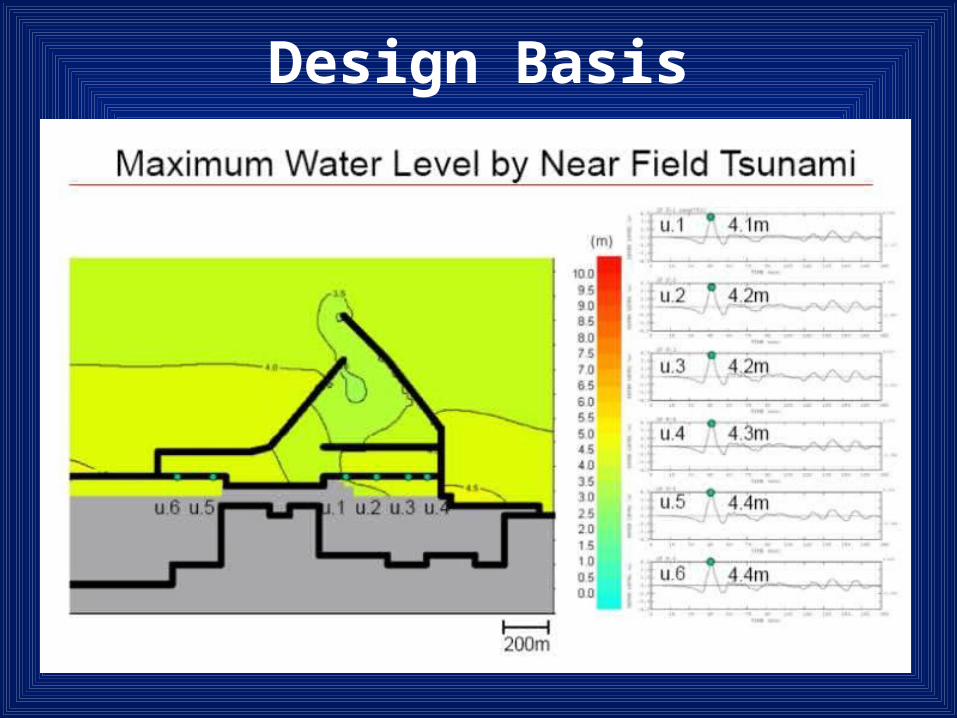
Design Basis
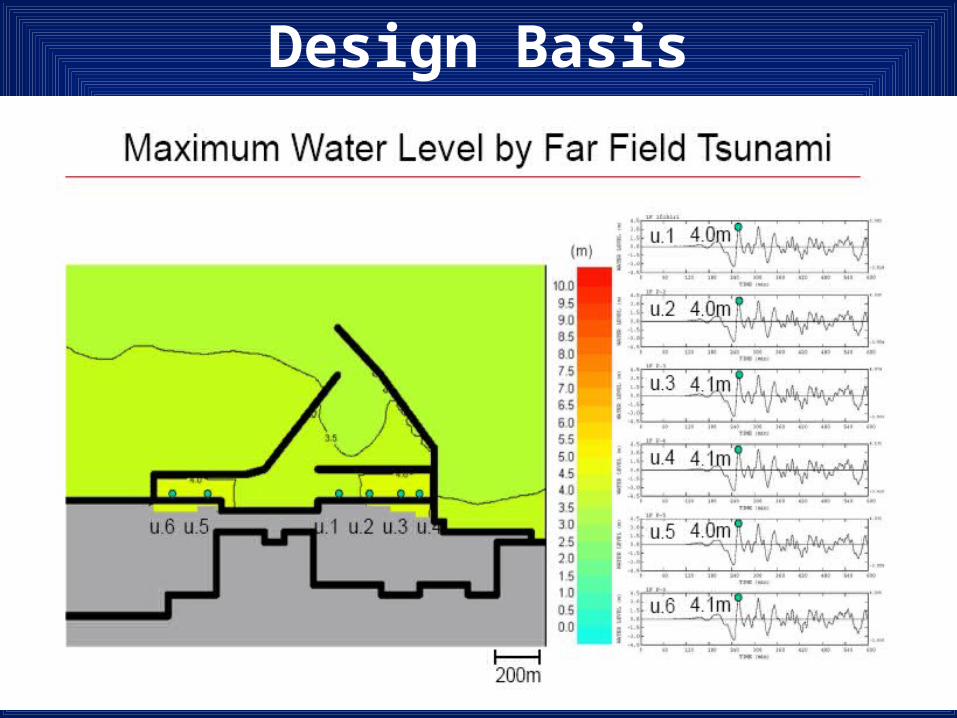
Design Basis
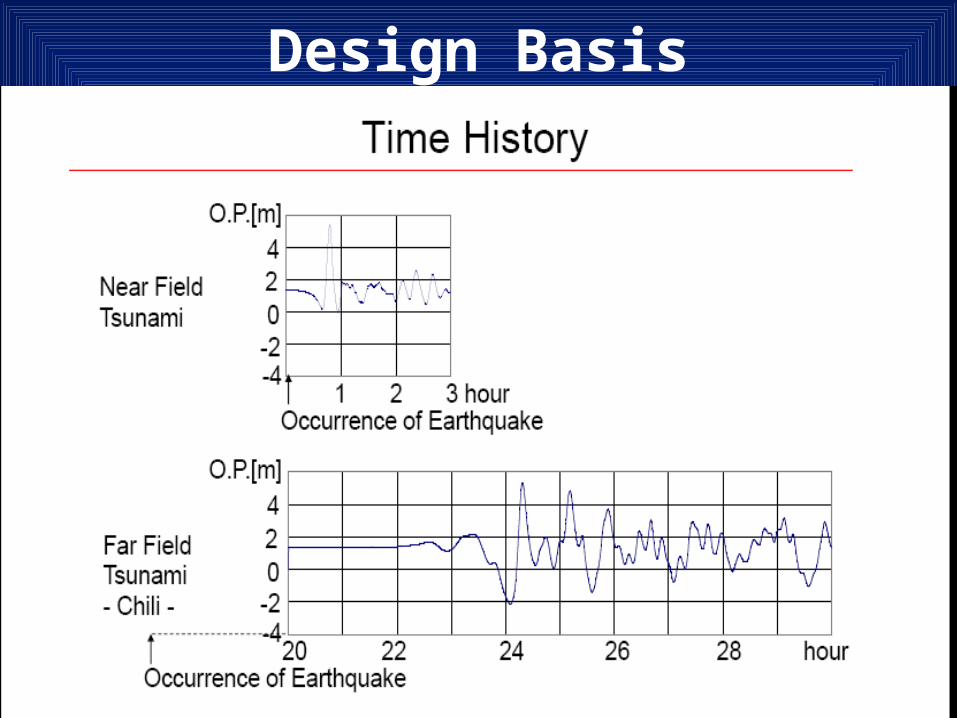
Design Basis
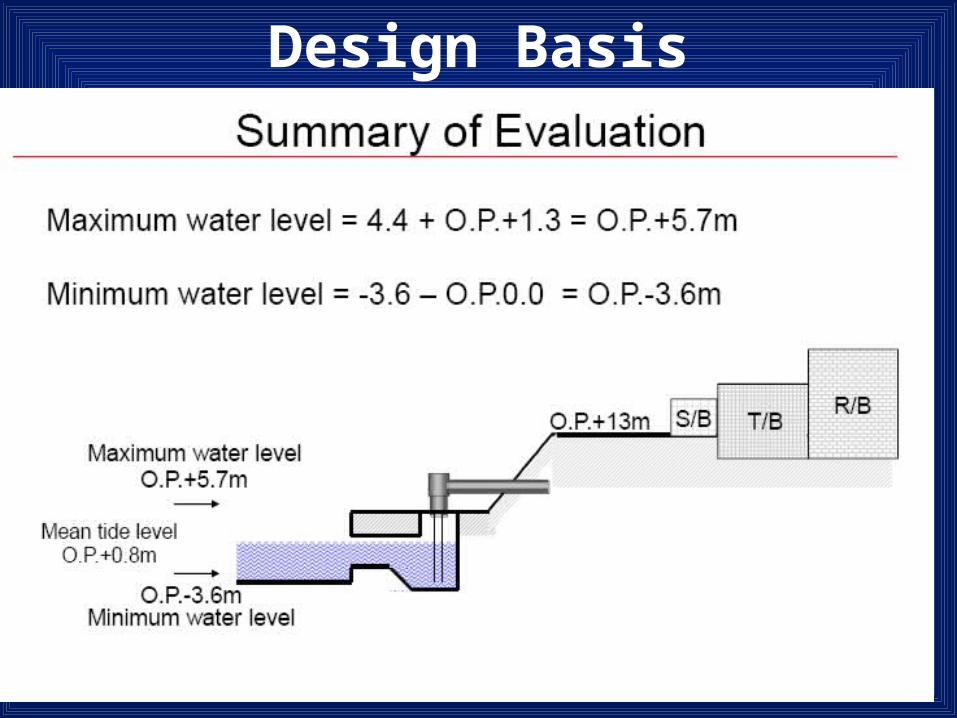
Design Basis