Embed Size (px)
Citation preview
ClickHere
for
FullArticle
NUMERICAL SIMULATION OF MAGMATICHYDROTHERMAL SYSTEMS
S. E. Ingebritsen,1 S. Geiger,2 S. Hurwitz,1 and T. Driesner3
Received 16 March 2009; revised 7 July 2009; accepted 8 September 2009; published 19 March 2010.
[1] The dynamic behavior of magmatic hydrothermal sys-tems entails coupled and nonlinear multiphase flow, heatand solute transport, and deformation in highly heteroge-neous media. Thus, quantitative analysis of these systemsdepends mainly on numerical solution of coupled partial dif-ferential equations and complementary equations of state(EOS). The past 2 decades have seen steady growth of com-putational power and the development of numerical modelsthat have eliminated or minimized the need for various sim-plifying assumptions. Considerable heuristic insight hasbeen gained from process‐oriented numerical modeling.Recent modeling efforts employing relatively complete
EOS and accurate transport calculations have revealeddynamic behavior that was damped by linearized, less accu-rate models, including fluid property control of hydrother-mal plume temperatures and three‐dimensional geometries.Other recent modeling results have further elucidated thecontrolling role of permeability structure and revealed thepotential for significant hydrothermally driven deformation.Key areas for future research include incorporation ofaccurate EOS for the complete H2O‐NaCl‐CO2 system,more realistic treatment of material heterogeneity in spaceand time, realistic description of large‐scale relative perme-ability behavior, and intercode benchmarking comparisons.
Citation: Ingebritsen, S. E., S. Geiger, S. Hurwitz, and T. Driesner (2010), Numerical simulation of magmatic hydrothermalsystems, Rev. Geophys., 48, RG1002, doi:10.1029/2009RG000287.
1. PURPOSE AND SCOPE
[2] This review emphasizes the application of numericalmodeling to understand and quantify processes in magmatichydrothermal systems. We assess the state of knowledgeand describe advances that have emerged in the 2 decadessince a similar review by Lowell [1991]. Though our ability torigorously describe key hydrothermal processes is still im-perfect, there have been substantial advances since Lowell’s[1991] review. These advances owe mainly to the steadygrowth of computational power and the concomitant devel-opment of numerical models that have gradually minimizedvarious simplifying assumptions. They include incorporationof more accurate equations of state (EOS) for the fluid sys-tem, an increased ability to represent geometric complexityand heterogeneity, and faster and more accurate computa-tional schemes. These advances have revealed dynamicbehaviors that were entirely obscured in previous genera-tions of models.
[3] For purposes of this paper we define “magmatichydrothermal systems” as aqueous fluid systems that areinfluenced by magma bodies in the upper crust. We par-ticularly emphasize multiphase, multicomponent phenome-na, which can have both quantitative and qualitative effectson the behavior of hydrothermal systems [Lu and Kieffer,2009]. Multiphase (liquid‐vapor) hydrothermal phenomenaof interest include phase separation at scales ranging fromcentimeters to kilometers, with concomitant geochemicaleffects; novel modes of heat transport such as boiling plumesand countercurrent liquid‐vapor flow (“heat pipes”) [Haybaand Ingebritsen, 1997]; profound retardation of pressuretransmission [Grant and Sorey, 1979]; and boiling‐relatedmineralization.
2. IMPORTANCE OF MAGMATIC HYDROTHERMALSYSTEMS
[4] Magmatic hydrothermal systems have immense sci-entific and practical significance and have been the topic ofmany review papers [e.g., Lister, 1980; Norton, 1984;Elderfield and Schultz, 1996; Kelley et al., 2002; Germanand Von Damm, 2003; Pirajno and van Kranendonk,2005]. Nearly all of these reviews have focused on theiressential physical, chemical, and biological characteristics.We will review those characteristics very briefly here, but
1U.S. Geological Survey, Menlo Park, California, USA.2Institute of Petroleum Engineering, Heriot‐Watt University,
Edinburgh, UK.3Institute of Isotope Geochemistry and Mineral Resources, ETH
Zurich, Zurich, Switzerland.
Copyright 2010 by the American Geophysical Union. Reviews of Geophysics, 48, RG1002 / 20101 of 33
8755‐1209/10/2009RG000287 Paper number 2009RG000287RG1002
the remainder of this paper will focus specifically onquantitative analysis of magmatic hydrothermal systems andin particular the role of numerical modeling.[5] Magmatic hydrothermal systems occur both on the
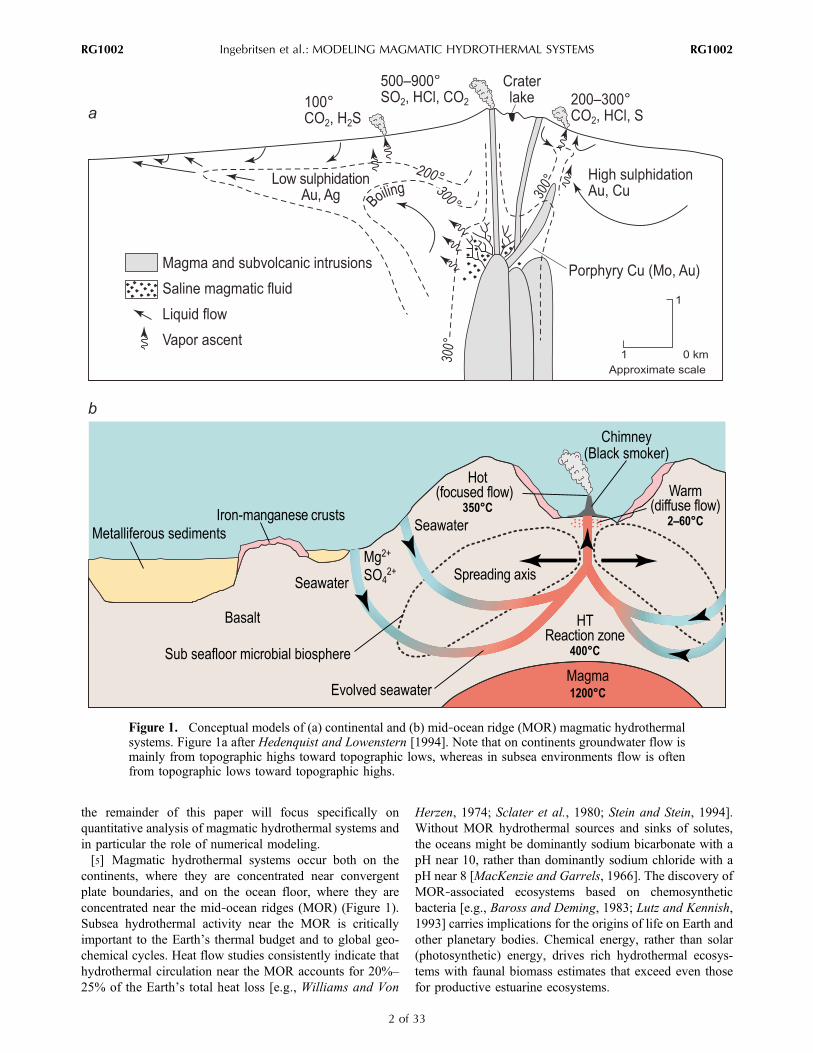
continents, where they are concentrated near convergentplate boundaries, and on the ocean floor, where they areconcentrated near the mid‐ocean ridges (MOR) (Figure 1).Subsea hydrothermal activity near the MOR is criticallyimportant to the Earth’s thermal budget and to global geo-chemical cycles. Heat flow studies consistently indicate thathydrothermal circulation near the MOR accounts for 20%–25% of the Earth’s total heat loss [e.g., Williams and Von
Herzen, 1974; Sclater et al., 1980; Stein and Stein, 1994].Without MOR hydrothermal sources and sinks of solutes,the oceans might be dominantly sodium bicarbonate with apH near 10, rather than dominantly sodium chloride with apH near 8 [MacKenzie and Garrels, 1966]. The discovery ofMOR‐associated ecosystems based on chemosyntheticbacteria [e.g., Baross and Deming, 1983; Lutz and Kennish,1993] carries implications for the origins of life on Earth andother planetary bodies. Chemical energy, rather than solar(photosynthetic) energy, drives rich hydrothermal ecosys-tems with faunal biomass estimates that exceed even thosefor productive estuarine ecosystems.
Figure 1. Conceptual models of (a) continental and (b) mid‐ocean ridge (MOR) magmatic hydrothermalsystems. Figure 1a after Hedenquist and Lowenstern [1994]. Note that on continents groundwater flow ismainly from topographic highs toward topographic lows, whereas in subsea environments flow is oftenfrom topographic lows toward topographic highs.
Ingebritsen et al.: MODELING MAGMATIC HYDROTHERMAL SYSTEMS RG1002RG1002
2 of 33
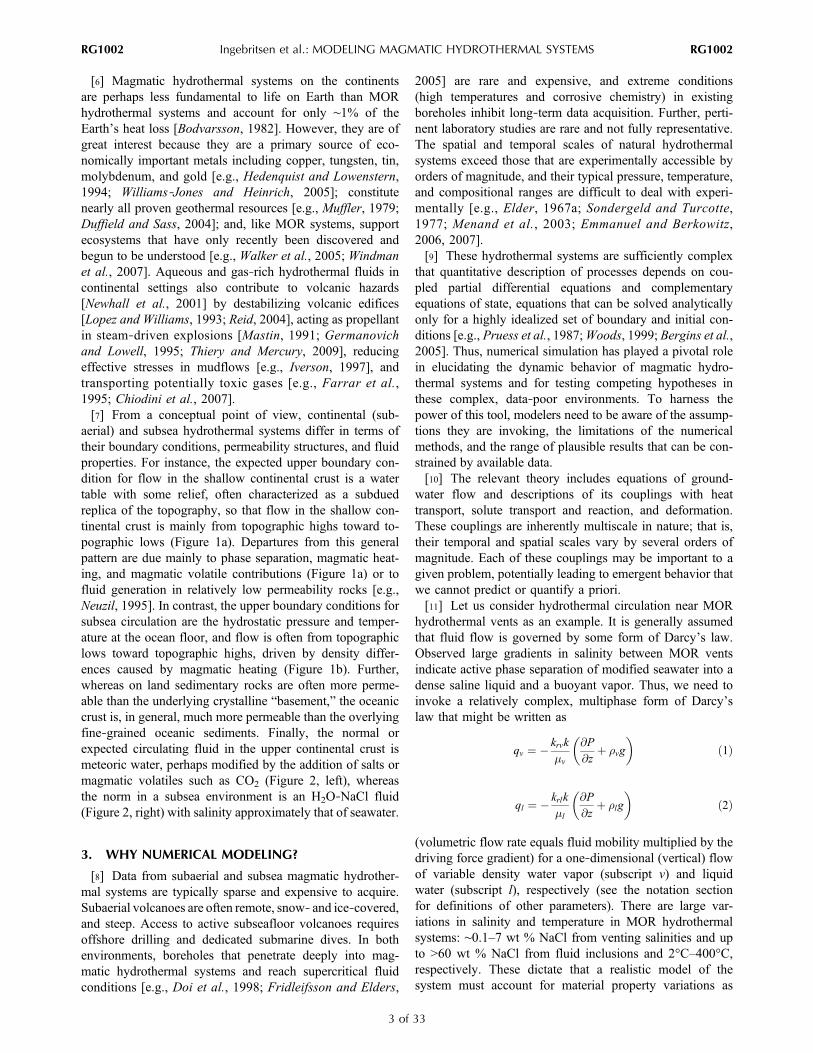
[6] Magmatic hydrothermal systems on the continentsare perhaps less fundamental to life on Earth than MORhydrothermal systems and account for only ∼1% of theEarth’s heat loss [Bodvarsson, 1982]. However, they are ofgreat interest because they are a primary source of eco-nomically important metals including copper, tungsten, tin,molybdenum, and gold [e.g., Hedenquist and Lowenstern,1994; Williams‐Jones and Heinrich, 2005]; constitutenearly all proven geothermal resources [e.g., Muffler, 1979;Duffield and Sass, 2004]; and, like MOR systems, supportecosystems that have only recently been discovered andbegun to be understood [e.g., Walker et al., 2005; Windmanet al., 2007]. Aqueous and gas‐rich hydrothermal fluids incontinental settings also contribute to volcanic hazards[Newhall et al., 2001] by destabilizing volcanic edifices[Lopez and Williams, 1993; Reid, 2004], acting as propellantin steam‐driven explosions [Mastin, 1991; Germanovichand Lowell, 1995; Thiery and Mercury, 2009], reducingeffective stresses in mudflows [e.g., Iverson, 1997], andtransporting potentially toxic gases [e.g., Farrar et al.,1995; Chiodini et al., 2007].[7] From a conceptual point of view, continental (sub-
aerial) and subsea hydrothermal systems differ in terms oftheir boundary conditions, permeability structures, and fluidproperties. For instance, the expected upper boundary con-dition for flow in the shallow continental crust is a watertable with some relief, often characterized as a subduedreplica of the topography, so that flow in the shallow con-tinental crust is mainly from topographic highs toward to-pographic lows (Figure 1a). Departures from this generalpattern are due mainly to phase separation, magmatic heat-ing, and magmatic volatile contributions (Figure 1a) or tofluid generation in relatively low permeability rocks [e.g.,Neuzil, 1995]. In contrast, the upper boundary conditions forsubsea circulation are the hydrostatic pressure and temper-ature at the ocean floor, and flow is often from topographiclows toward topographic highs, driven by density differ-ences caused by magmatic heating (Figure 1b). Further,whereas on land sedimentary rocks are often more perme-able than the underlying crystalline “basement,” the oceaniccrust is, in general, much more permeable than the overlyingfine‐grained oceanic sediments. Finally, the normal orexpected circulating fluid in the upper continental crust ismeteoric water, perhaps modified by the addition of salts ormagmatic volatiles such as CO2 (Figure 2, left), whereasthe norm in a subsea environment is an H2O‐NaCl fluid(Figure 2, right) with salinity approximately that of seawater.
3. WHY NUMERICAL MODELING?
[8] Data from subaerial and subsea magmatic hydrother-mal systems are typically sparse and expensive to acquire.Subaerial volcanoes are often remote, snow‐ and ice‐covered,and steep. Access to active subseafloor volcanoes requiresoffshore drilling and dedicated submarine dives. In bothenvironments, boreholes that penetrate deeply into mag-matic hydrothermal systems and reach supercritical fluidconditions [e.g., Doi et al., 1998; Fridleifsson and Elders,
2005] are rare and expensive, and extreme conditions(high temperatures and corrosive chemistry) in existingboreholes inhibit long‐term data acquisition. Further, perti-nent laboratory studies are rare and not fully representative.The spatial and temporal scales of natural hydrothermalsystems exceed those that are experimentally accessible byorders of magnitude, and their typical pressure, temperature,and compositional ranges are difficult to deal with experi-mentally [e.g., Elder, 1967a; Sondergeld and Turcotte,1977; Menand et al., 2003; Emmanuel and Berkowitz,2006, 2007].[9] These hydrothermal systems are sufficiently complex
that quantitative description of processes depends on cou-pled partial differential equations and complementaryequations of state, equations that can be solved analyticallyonly for a highly idealized set of boundary and initial con-ditions [e.g., Pruess et al., 1987;Woods, 1999; Bergins et al.,2005]. Thus, numerical simulation has played a pivotal rolein elucidating the dynamic behavior of magmatic hydro-thermal systems and for testing competing hypotheses inthese complex, data‐poor environments. To harness thepower of this tool, modelers need to be aware of the assump-tions they are invoking, the limitations of the numericalmethods, and the range of plausible results that can be con-strained by available data.[10] The relevant theory includes equations of ground-
water flow and descriptions of its couplings with heattransport, solute transport and reaction, and deformation.These couplings are inherently multiscale in nature; that is,their temporal and spatial scales vary by several orders ofmagnitude. Each of these couplings may be important to agiven problem, potentially leading to emergent behavior thatwe cannot predict or quantify a priori.[11] Let us consider hydrothermal circulation near MOR
hydrothermal vents as an example. It is generally assumedthat fluid flow is governed by some form of Darcy’s law.Observed large gradients in salinity between MOR ventsindicate active phase separation of modified seawater into adense saline liquid and a buoyant vapor. Thus, we need toinvoke a relatively complex, multiphase form of Darcy’slaw that might be written as
qv ¼ � krvk
�v
@P
@zþ �vg
� �ð1Þ
ql ¼ � krlk
�l
@P
@zþ �lg
� �ð2Þ
(volumetric flow rate equals fluid mobility multiplied by thedriving force gradient) for a one‐dimensional (vertical) flowof variable density water vapor (subscript v) and liquidwater (subscript l), respectively (see the notation sectionfor definitions of other parameters). There are large var-iations in salinity and temperature in MOR hydrothermalsystems: ∼0.1–7 wt % NaCl from venting salinities and upto >60 wt % NaCl from fluid inclusions and 2°C–400°C,respectively. These dictate that a realistic model of thesystem must account for material property variations as
Ingebritsen et al.: MODELING MAGMATIC HYDROTHERMAL SYSTEMS RG1002RG1002
3 of 33

functions of temperature, pressure, and composition andinclude heat transport, solute transport, and all phase rela-tions between liquid, vapor, and salt. Further, we mustanticipate that the flow systems are highly transient as theexceptionally high rates of heat discharge can only beexplained as the result of rapid crystallization and cooling oflarge volumes of magma [e.g., Lister, 1974, 1983]. Thisimplies that the intensity and spatial distribution of heatsources must vary with time. We would also expect thatprecipitation and dissolution of minerals cause continuousvariations in porosity and permeability because the extremevariations in fluid composition and temperature make for ahighly reactive chemical environment. As a result of these
transient phenomena, deformation enters the picture: aspermeability, flow rates, and temperatures wax and wane,rates of thermomechanical deformation are likely largeenough to substantially affect permeability [Germanovichand Lowell, 1992]. MOR systems are also tectonicallyactive, and faulting and fracturing will cause sudden chan-ges in permeability. Tectonic plate movement away from theMOR itself (yet another mode of deformation) advects bothfluid‐saturated rock and heat. Finally, there may be mutualfeedbacks between the fluid pressure and regional stressfields via fracture formation and/or reactivation.[12] Although we can recognize the probable importance
of each of these couplings we still do not know which
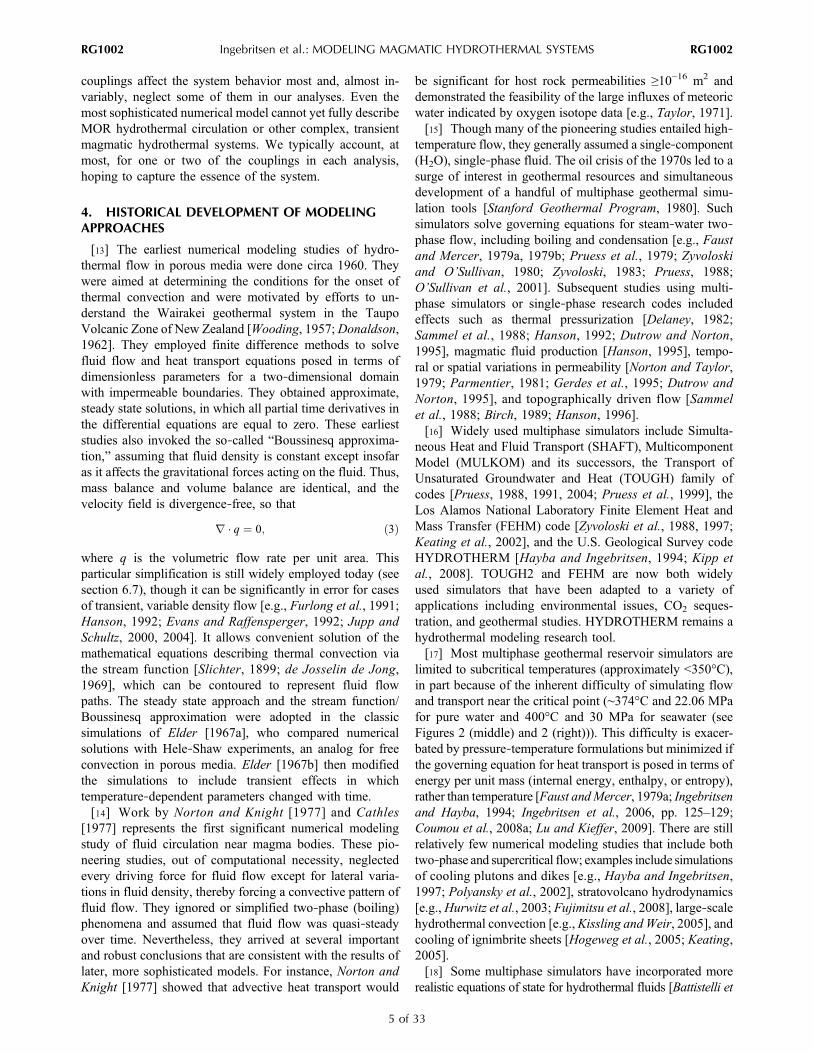
Figure 2. Phase diagrams for temperature‐pressure‐composition coordinates relevant to magmatichydrothermal systems, showing relations between (middle) the pure H2O system and the two mostimportant binary systems, (left) H2O‐CO2 and (right) H2O‐NaCl. The boiling curve of H2O (blue)ends in the H2O critical point (374°C, 220.6 bar) and separates liquid at high pressures from vaporat low pressures. At temperatures higher than the critical temperature, gradual transitions betweenliquid‐like and vapor‐like fluids occur as a response to changes in pressure. In the system H2O‐CO2
(Figure 2, left), there is a large volume (rather than a single boiling curve) occupied by the coexistenceregion of an aqueous, liquid‐like fluid with a carbonic fluid that may be vapor‐ or liquid‐like, dependingon pressure. This region closes toward higher temperatures, where only a single‐phase fluid exists. Inthe system H2O‐NaCl (Figure 2, right), however, the region of two‐phase liquid plus vapor coexistencebecomes larger with increasing temperature. Magmatic hydrothermal systems may also encounter thevapor plus halite and liquid plus halite two‐phase regions as well as the three‐phase assemblage liquidplus vapor plus halite and liquid‐ or vapor‐like single‐phase fluids. H2O diagram after Haar et al.[1984], H2O‐CO2 after Blencoe [2004], and H2O‐NaCl after Driesner and Heinrich [2007].
Ingebritsen et al.: MODELING MAGMATIC HYDROTHERMAL SYSTEMS RG1002RG1002
4 of 33
couplings affect the system behavior most and, almost in-variably, neglect some of them in our analyses. Even themost sophisticated numerical model cannot yet fully describeMOR hydrothermal circulation or other complex, transientmagmatic hydrothermal systems. We typically account, atmost, for one or two of the couplings in each analysis,hoping to capture the essence of the system.
4. HISTORICAL DEVELOPMENT OF MODELINGAPPROACHES
[13] The earliest numerical modeling studies of hydro-thermal flow in porous media were done circa 1960. Theywere aimed at determining the conditions for the onset ofthermal convection and were motivated by efforts to un-derstand the Wairakei geothermal system in the TaupoVolcanic Zone of New Zealand [Wooding, 1957;Donaldson,1962]. They employed finite difference methods to solvefluid flow and heat transport equations posed in terms ofdimensionless parameters for a two‐dimensional domainwith impermeable boundaries. They obtained approximate,steady state solutions, in which all partial time derivatives inthe differential equations are equal to zero. These earlieststudies also invoked the so‐called “Boussinesq approxima-tion,” assuming that fluid density is constant except insofaras it affects the gravitational forces acting on the fluid. Thus,mass balance and volume balance are identical, and thevelocity field is divergence‐free, so that
r � q ¼ 0; ð3Þ
where q is the volumetric flow rate per unit area. Thisparticular simplification is still widely employed today (seesection 6.7), though it can be significantly in error for casesof transient, variable density flow [e.g., Furlong et al., 1991;Hanson, 1992; Evans and Raffensperger, 1992; Jupp andSchultz, 2000, 2004]. It allows convenient solution of themathematical equations describing thermal convection viathe stream function [Slichter, 1899; de Josselin de Jong,1969], which can be contoured to represent fluid flowpaths. The steady state approach and the stream function/Boussinesq approximation were adopted in the classicsimulations of Elder [1967a], who compared numericalsolutions with Hele‐Shaw experiments, an analog for freeconvection in porous media. Elder [1967b] then modifiedthe simulations to include transient effects in whichtemperature‐dependent parameters changed with time.[14] Work by Norton and Knight [1977] and Cathles
[1977] represents the first significant numerical modelingstudy of fluid circulation near magma bodies. These pio-neering studies, out of computational necessity, neglectedevery driving force for fluid flow except for lateral varia-tions in fluid density, thereby forcing a convective pattern offluid flow. They ignored or simplified two‐phase (boiling)phenomena and assumed that fluid flow was quasi‐steadyover time. Nevertheless, they arrived at several importantand robust conclusions that are consistent with the results oflater, more sophisticated models. For instance, Norton andKnight [1977] showed that advective heat transport would
be significant for host rock permeabilities ≥10−16 m2 anddemonstrated the feasibility of the large influxes of meteoricwater indicated by oxygen isotope data [e.g., Taylor, 1971].[15] Though many of the pioneering studies entailed high‐
temperature flow, they generally assumed a single‐component(H2O), single‐phase fluid. The oil crisis of the 1970s led to asurge of interest in geothermal resources and simultaneousdevelopment of a handful of multiphase geothermal simu-lation tools [Stanford Geothermal Program, 1980]. Suchsimulators solve governing equations for steam‐water two‐phase flow, including boiling and condensation [e.g., Faustand Mercer, 1979a, 1979b; Pruess et al., 1979; Zyvoloskiand O’Sullivan, 1980; Zyvoloski, 1983; Pruess, 1988;O’Sullivan et al., 2001]. Subsequent studies using multi-phase simulators or single‐phase research codes includedeffects such as thermal pressurization [Delaney, 1982;Sammel et al., 1988; Hanson, 1992; Dutrow and Norton,1995], magmatic fluid production [Hanson, 1995], tempo-ral or spatial variations in permeability [Norton and Taylor,1979; Parmentier, 1981; Gerdes et al., 1995; Dutrow andNorton, 1995], and topographically driven flow [Sammelet al., 1988; Birch, 1989; Hanson, 1996].[16] Widely used multiphase simulators include Simulta-
neous Heat and Fluid Transport (SHAFT), MulticomponentModel (MULKOM) and its successors, the Transport ofUnsaturated Groundwater and Heat (TOUGH) family ofcodes [Pruess, 1988, 1991, 2004; Pruess et al., 1999], theLos Alamos National Laboratory Finite Element Heat andMass Transfer (FEHM) code [Zyvoloski et al., 1988, 1997;Keating et al., 2002], and the U.S. Geological Survey codeHYDROTHERM [Hayba and Ingebritsen, 1994; Kipp etal., 2008]. TOUGH2 and FEHM are now both widelyused simulators that have been adapted to a variety ofapplications including environmental issues, CO2 seques-tration, and geothermal studies. HYDROTHERM remains ahydrothermal modeling research tool.[17] Most multiphase geothermal reservoir simulators are
limited to subcritical temperatures (approximately <350°C),in part because of the inherent difficulty of simulating flowand transport near the critical point (∼374°C and 22.06 MPafor pure water and 400°C and 30 MPa for seawater (seeFigures 2 (middle) and 2 (right))). This difficulty is exacer-bated by pressure‐temperature formulations but minimized ifthe governing equation for heat transport is posed in terms ofenergy per unit mass (internal energy, enthalpy, or entropy),rather than temperature [Faust andMercer, 1979a; Ingebritsenand Hayba, 1994; Ingebritsen et al., 2006, pp. 125–129;Coumou et al., 2008a; Lu and Kieffer, 2009]. There are stillrelatively few numerical modeling studies that include bothtwo‐phase and supercritical flow; examples include simulationsof cooling plutons and dikes [e.g., Hayba and Ingebritsen,1997; Polyansky et al., 2002], stratovolcano hydrodynamics[e.g.,Hurwitz et al., 2003; Fujimitsu et al., 2008], large‐scalehydrothermal convection [e.g.,Kissling andWeir, 2005], andcooling of ignimbrite sheets [Hogeweg et al., 2005; Keating,2005].[18] Some multiphase simulators have incorporated more
realistic equations of state for hydrothermal fluids [Battistelli et
Ingebritsen et al.: MODELING MAGMATIC HYDROTHERMAL SYSTEMS RG1002RG1002
5 of 33

al., 1997; Kissling, 2005a, 2005b; Croucher and O’Sullivan,2008]. Two important new codes, Complex Systems Plat-form (CSMP++) and Fully Implicit Seafloor HydrothermalEvent Simulator (FISHES), have been developed specificallyto allow simulation of high‐temperature multiphase flow ofNaCl‐H2O fluids [Geiger et al., 2006a, 2006b; Matthäi etal., 2007; Coumou et al., 2009; Lewis and Lowell, 2009a,2009b]. Other recent developments include higher‐orderaccurate transport methods [Oldenburg and Pruess, 2000;Geiger et al., 2004, 2006a; Coumou et al., 2006; Croucherand O’Sullivan, 2008] and simulations of mineral precipi-tation and fluid‐rock interactions [Cline et al., 1992; Steefeland Lasaga, 1994; Fontaine et al., 2001; Xu and Pruess,2001; Xu et al., 2001; Giambalvo et al., 2002; Geiger etal., 2002; Xu et al., 2004a], coupling between hydrother-mal flow and mechanical deformation [Todesco et al., 2004;Hurwitz et al., 2007; Hutnak et al., 2009], and geometricallycomplex geological structures [Zyvoloski et al., 1997;Geiger et al., 2004, 2006a; Paluszny et al., 2007]. The rel-ative capabilities of selected multiphase simulators aresummarized in Table 1.
5. GOVERNING EQUATIONS
[19] There are many ways of formulating the basic gov-erning equations for the flow of multiphase, variable densityfluids and its coupling with heat transport, solute transport,and deformation. One useful set of equations for multiphase,single‐component fluid flow and heat transport is
@ � Sl�l þ Sv�vð Þ½ �@t
�r � �lkrlk
�lrP þ �lgrzð Þ
� �
�r � �vkrvk
�vrP þ �vgrzð Þ
� �� Rm ¼ 0
ð4Þ
(change in mass stored minus mass flux of liquid minusmass flux of vapor minus mass sources equals 0) for fluidflow and
@ � Sl�lhl þ Sv�vhvð Þ þ 1� �ð Þ�rhr½@t
�r � �lkrlkhl�l
rP þ �lgrzð Þ� �
�r � �vkrvkhv�v
rP þ �vgrzð Þ� �
�r � KmrT � Rh ¼ 0
ð5Þ
(change in heat stored minus heat advected by liquid minusheat advected by vapor minus heat conducted minus heatsources equals 0) for heat transport. In these equations thegradient operator r describes the gradient of a vector orscalar quantity in the x, y, and z directions; the R termsrepresent sources and sinks of fluid mass or heat; and thedependent variables for fluid flow and heat transport arepressure P and enthalpy h [Faust and Mercer, 1979a].Although the permeability k is a second‐rank tensor, nu-merical simulations often treat it as a scalar for practicalpurposes.[20] In equation (5), the specific enthalpies h (J kg−1) are
used rather than the total enthalpy H (J). In publications onheat transport in a geologic context, enthalpy is often erro-neously written as h = cT, whereas the correct relation isdh = cdT. However, the de facto implementation in (most)flow codes is the latter version; hence, the misrepresentationis not propagated into the simulation results. Though thepressure‐entropy pair has certain advantages in representingmulticomponent, multiphase H2O systems [Lu and Kieffer,2009], that approach has not yet been implemented in ahydrothermal simulator.[21] Equations (4) and (5) are coupled and nonlinear. They
are coupled by the appearance of both dependent variables(P and h) in the heat transport equation (equation (5)) and
TABLE 1. Relative Capabilities of Selected Multiphase Numerical Codes Commonly Applied in Simulations of Magmatic HydrothermalSystemsa
Name ReferenceTmax
(°C)Pmax
(MPa)NumericalMethod
ReactiveTransport Deformation CO2 NaCl
CSMP++ Matthäi et al. [2007] and Coumou [2008] 1000 500 FE‐FV XFEHM Zyvoloski et al. [1988, 1997],
Bower and Zyvoloski [1997],Dutrow et al. [2001], andKeating et al. [2002]
1500 FE X X X
FISHESb Lewis [2007] and Lewis and Lowell [2009a] 800 1000 FV XHYDROTHERM Hayba and Ingebritsen [1994] and
Kipp et al. [2008]1,00 1000 FD
NaCl‐TOUGH2 Kissling [2005b] 620 100 IFD XTOUGH2 Pruess [1991] and Pruess et al. [1999] 350 100 IFD X XTOUGH2‐BIOT Hurwitz et al. [2007] 350 100 IFD‐FE X XTOUGH‐FLAC Rutqvist et al. [2002] 350 100 IFD‐FE X XTOUGHREACT Xu et al. [2004b] 350 100 IFD X X
aNumerical methods are as follows: FD, finite difference; IFD, integrated finite difference; FE, finite element; FE‐FV, finite element–finite volume. Thecolumns labeled CO2 and NaCl indicate whether the equation of state formulations include those components. CSMP++, Complex Systems Platform;FEHM, Finite Element Heat and Mass Transfer; FISHES, Fully Implicit Seafloor Hydrothermal Event Simulator; TOUGH2, Transport of UnsaturatedGroundwater and Heat; TOUGH2‐BIOT, TOUGH With Poroelastic Deformation; TOUGH2‐FLAC, TOUGH With Fast Lagrangian Analysis ofContinua; TOUGHREACT, TOUGH With Reactions. Most of these codes have interactive websites: CSMP++, http://csmp.ese.imperial.ac.uk/wiki/Home; FEHM, http://fehm.lanl.gov/; HYDROTHERM, http://wwwbrr.cr.usgs.gov/projects/GW_Solute/hydrotherm/; TOUGH2, http://esd.lbl.gov/TOUGH2/. Crosses indicate the capability to model reactive transport, deformation, H2O‐CO2 fluids, or H2O‐NaCl fluids.
bSuccessor model to Georgia Tech Hydrothermal Model (GTHM) [Lowell and Xu, 2000; Bai et al., 2003].
Ingebritsen et al.: MODELING MAGMATIC HYDROTHERMAL SYSTEMS RG1002RG1002
6 of 33
are nonlinear because many of the coefficients (e.g., rv, rl,kr, mv, and ml) are functions of the dependent variables.[22] Formulations such as equations (4) and (5) were well
established at the time of Lowell’s [1991] review. Anongoing challenge is the effective coupling of such equationswith descriptions of multiphase, multicomponent solute trans-port and deformation.[23] A general equation for solute transport of a single
chemical component i in the vapor or liquid phase, denotedhere as phase j, can be written
@ ��jSjCi
� �@t
�r � �j�jCi
� ��r � Sj�jDrCi
� �� Ri ¼ 0 ð6Þ
(change in solute mass stored minus solute advected minussolute transport by dispersion and diffusion minus solutesources equals 0), where C is aqueous concentration; D ishydrodynamic dispersion (also a second‐order tensor); u isq/� (see equations (1)–(3)), the average pore velocity; andRi is a source (positive) or sink (negative) of the chemicalcomponent. Although such an equation is inadequate torepresent the complexity of reactive solute transport in amultiphase, multicomponent, variable density fluid system, itdoes indicate the fundamental coupling with equations (4)and (5) for fluid flow and heat transport through porosity �,density r, and the average pore velocity u (q/�).[24] Displacements (deformation) in porothermoelastic
media subjected to changes in fluid pressure and tempera-ture can be described by
Gr2uþ G
1� 2�r r � uð Þ ¼ �rP̂ þ G
2 1þ �ð Þ1� 2�
�TrT̂ ; ð7Þ
where the circumflex above P and T is used to indicate anincrease or decrease, rather than an absolute value; u is the
displacement vector; and G is the shear modulus. This is anequation of mechanical equilibrium written in terms ofdisplacements. Calculated pressure and temperature changescan be inserted into equation (7) to obtain the strain and thedisplacements experienced by the porous matrix. Typicaldisplacements in magmatic hydrothermal systems rangefrom mm yr−1 to m yr−1 (see section 8.2.7). Strain alsoaffects fluid pressure and permeability, and thus, to representporoelastic behavior, equation (7) must be coupled with agroundwater flow equation incorporating a volumetric strainterm (which equation (4) lacks). In this context, “coupling”means that the equations are linked by incorporating thesame strains and fluid pressures in their solutions. Problemsin porothermoelasticity require coupling with equationsof heat transport (such as equation (5)) as well. Unlikeequations (4)–(6), the terms in equation (7) do not readilylend themselves to concise, intuitive definition; we referinterested readers toNeuzil [2003],Wang [2004], or Ingebritsenet al. [2006, pp. 39–61] for full developments.
6. COMMON ASSUMPTIONS ANDSIMPLIFICATIONS
[25] In this section we review ten common assumptionsand simplifications inherent in numerical modeling of hydro-thermal systems via systems of equations such as (4)–(7).The first six of these assumptions are actually incorporatedinto equations (4)–(7), whereas the latter four are not.[26] Assumptions are a key source of uncertainty in nu-
merical model results and as such deserve careful exami-nation. Most nonmodelers are probably unaware of thesecommon assumptions, and they often go unmentioned, orare noted but not discussed, in modern modeling studies.
6.1. Representative Elementary Volume[27] Equations for flow (e.g., equation (4)), transport
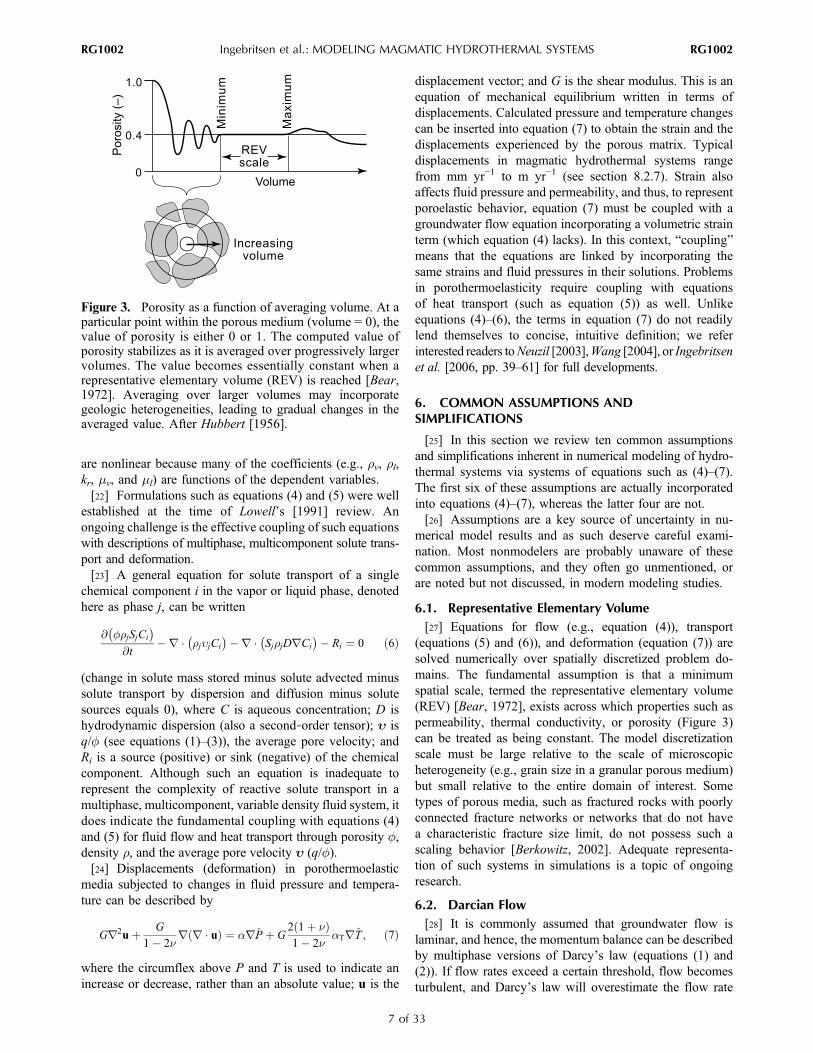
(equations (5) and (6)), and deformation (equation (7)) aresolved numerically over spatially discretized problem do-mains. The fundamental assumption is that a minimumspatial scale, termed the representative elementary volume(REV) [Bear, 1972], exists across which properties such aspermeability, thermal conductivity, or porosity (Figure 3)can be treated as being constant. The model discretizationscale must be large relative to the scale of microscopicheterogeneity (e.g., grain size in a granular porous medium)but small relative to the entire domain of interest. Sometypes of porous media, such as fractured rocks with poorlyconnected fracture networks or networks that do not havea characteristic fracture size limit, do not possess such ascaling behavior [Berkowitz, 2002]. Adequate representa-tion of such systems in simulations is a topic of ongoingresearch.
6.2. Darcian Flow[28] It is commonly assumed that groundwater flow is
laminar, and hence, the momentum balance can be describedby multiphase versions of Darcy’s law (equations (1) and(2)). If flow rates exceed a certain threshold, flow becomesturbulent, and Darcy’s law will overestimate the flow rate
Figure 3. Porosity as a function of averaging volume. At aparticular point within the porous medium (volume = 0), thevalue of porosity is either 0 or 1. The computed value ofporosity stabilizes as it is averaged over progressively largervolumes. The value becomes essentially constant when arepresentative elementary volume (REV) is reached [Bear,1972]. Averaging over larger volumes may incorporategeologic heterogeneities, leading to gradual changes in theaveraged value. After Hubbert [1956].
Ingebritsen et al.: MODELING MAGMATIC HYDROTHERMAL SYSTEMS RG1002RG1002
7 of 33
associated with a particular pressure gradient. The upperlimit for Darcy’s law is usually estimated on the basis of thedimensionless Reynolds number Re,
Re ¼ �qLð Þ=�; ð8Þ
where L is a characteristic length and r and m are fluiddensity and dynamic viscosity, assumed constant inequation (8). The Reynolds number was developed for pipeflow [e.g., Vennard and Street, 1975, pp. 299–306], where Lis the pipe diameter. Its application to flow in porous orfractured media is somewhat problematic, particularly in thecontext of variable density, multiphase systems. For single‐phase flow in granular porous media, L can be related tomedian grain size (e.g., d50) or sometimes to k1/2 [Ward,1964], and the transition from laminar to turbulent flowoccurs at Re ∼ 1–10 [Bear, 1979, pp. 65–66]. For fracturedmedia, L can be related to fracture aperture, and q inequation (8) can be replaced by u, the average linear velocity;under these assumptions the transition may occur at Re ∼1000 [Ingebritsen et al., 2006, p. 5]. Flow rates sufficient toviolate Darcy’s law are not common in the subsurface butcan occur in geyser conduits, near MOR vents, duringphreatic eruptions, and, more generally, in open and well‐connected fracture systems.
6.3. Local Thermal Equilibrium and ThermalDispersion[29] In hydrothermal modeling it is commonly assumed
that fluid and rock are in local thermal equilibrium and thatthe effects of thermal dispersion are negligible. That is, inequation (5) steam and liquid water are permitted to havedifferent specific enthalpies (hv and hl), but steam, liquid,and rock have the same temperature T at the REV scale(e.g., in the fourth term on the left‐hand side of equation(5)); further, there is no provision for thermal dispersionin equation (5), though solute dispersion is explicitly rep-resented in the solute transport equation (equation (6), thirdterm on left‐hand side). The assumptions of local thermalequilibrium and insignificant thermal dispersion are justifiedby the generally low rates of subsurface fluid flow and therelative efficiency of heat conduction in geologic media,which acts to homogenize the local temperature field. The“diffusive” transport of heat by conduction (the fourth termon the left‐hand side of equation (5)) is much more effectivethan solute diffusion (the third term on the left‐hand side ofequation (6)) [Bickle and McKenzie, 1987], rendering ther-mal dispersion relatively insignificant. However, the as-sumption of thermal equilibrium may not be appropriate atthe pore scale [Wu and Hwang, 1998] or in highly fracturedmedia, given sufficiently high, transient flow rates.
6.4. Thermal Conduction and Radiative Heat Transfer[30] Conduction of thermal energy is described by Fourier’s
law of heat conduction
qh ¼ �KmrT ; ð9Þ
where qh is a vector and Km is the thermal conductivity of themedium. The thermal conductivity of most common rocksdecreases nonlinearly with increasing temperature to at least250°C [Sass et al., 1992; Vosteen and Schellschmidt, 2003]. Aroom temperature conductivity of 2.4 W m−1 K−1 is predictedto decrease to 1.6 W m−1 K−1 at 500°C [Vosteen andSchellschmidt, 2003]. Above ∼600°C, radiative heat transferbecomes significant and can be approximated by a radiativethermal conductivity component which increases with in-creasing temperature [Clauser, 1988; Hofmeister et al., 2007].Both the temperature dependence of thermal conductivity andradiative heat transport are usually neglected in hydrothermalmodeling. Instead, a “medium” thermal conductivity (Km inequations (5) and (9)) is typically approximated by a singlebulk conductivity of fluid and rock [Bear, 1972, pp. 648–650]or by a porosity‐weighted (geometric mean) conductivity offluid and rock [Raffensperger, 1997]. Such approximationsmay be significant in a conduction‐dominated system and lessso where advection is dominant. Temperature‐dependentthermal conductivity is straightforward to implement in nu-merical solutions and is not computationally expensive in thecontext of modern computational resources.
6.5. Relative Permeabilities[31] The concept of relative permeability (kr in equations
(1), (2), (4), and (5)) is invoked in multiphase flow problemsto express the reduction in mobility of one fluid phase due tothe interfering presence of one or more other phases. Rela-tive permeability is treated as a scalar function of volumetricfluid saturation varying from 0 to 1 (Figure 4). The level ofpartial saturation below which a phase is disconnected andbecomes immobile is called residual saturation. To para-phrase Scheidegger [1974, pp. 249–250], relative perme-abilities are essentially “fudge factors” that allow Darcy’slaw to be applied to various empirical data on multiphaseflows.[32] Though relative permeability is an empirical con-
struct, very few laboratory data are available for water‐steam relative permeability curves [e.g., Horne et al., 2000].In porous rocks, steam‐water relative permeabilities, likethose for oil‐water or gas‐water flow, may be best describedby nonlinear Corey‐type relations [Piquemal, 1994]. How-ever, steam‐water functions for fracture‐dominated mediamay be linear; that is, kr ∼ S, where S is the volumetricsaturation of a particular phase, implying little phase inter-ference and that relative permeabilities sum to 1 [e.g.,Gilman and Kazemi, 1983; Wang and Horne, 2000]. Fur-ther, enthalpy data from well tests in geothermal reservoirssuggest Corey‐type relative permeabilities for liquid waterbut with little phase interference [Sorey et al., 1980], andsome authors [e.g., Cline et al., 1992] have introducedtemperature‐dependent relative permeability curves that re-flect the decrease in surface tension toward the critical pointof pure water. A possible physical explanation for less phaseinterference in steam‐water flow (relative to immisciblefluids) is that steam can flow through water‐filled pores bycondensing on one side and boiling off on the other [Verma,1990]. Regardless of the functional form of the relative
Ingebritsen et al.: MODELING MAGMATIC HYDROTHERMAL SYSTEMS RG1002RG1002
8 of 33
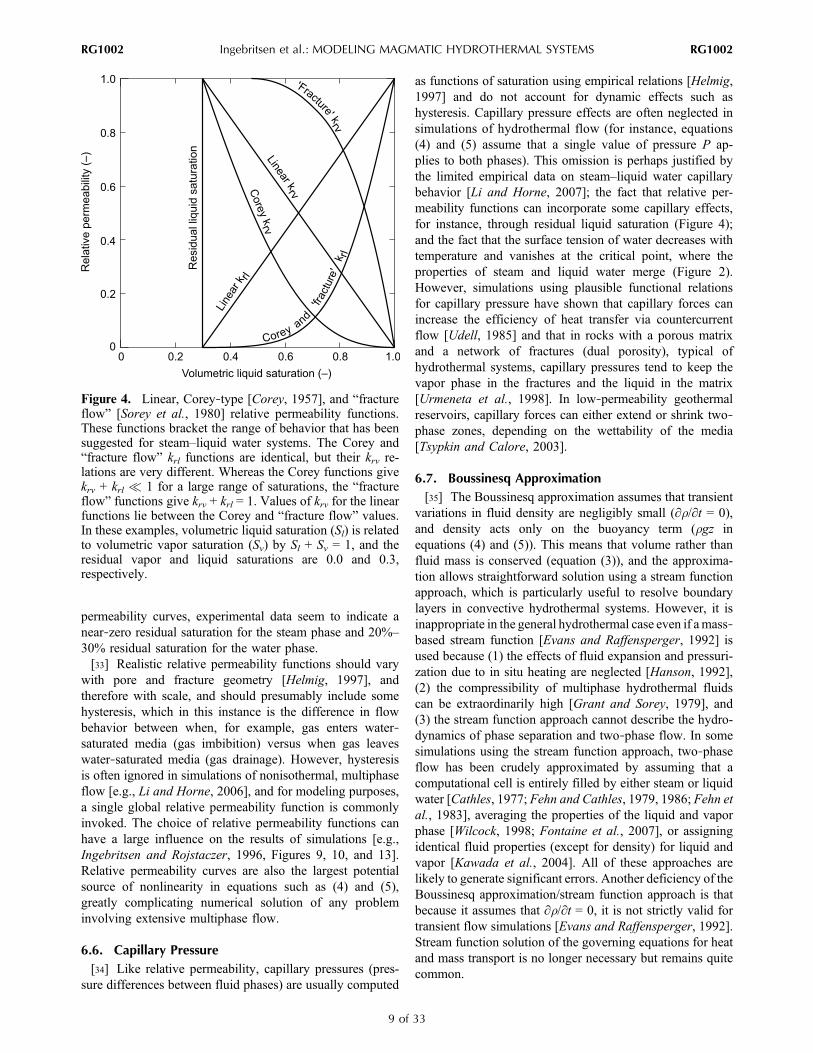
permeability curves, experimental data seem to indicate anear‐zero residual saturation for the steam phase and 20%–30% residual saturation for the water phase.[33] Realistic relative permeability functions should vary
with pore and fracture geometry [Helmig, 1997], andtherefore with scale, and should presumably include somehysteresis, which in this instance is the difference in flowbehavior between when, for example, gas enters water‐saturated media (gas imbibition) versus when gas leaveswater‐saturated media (gas drainage). However, hysteresisis often ignored in simulations of nonisothermal, multiphaseflow [e.g., Li and Horne, 2006], and for modeling purposes,a single global relative permeability function is commonlyinvoked. The choice of relative permeability functions canhave a large influence on the results of simulations [e.g.,Ingebritsen and Rojstaczer, 1996, Figures 9, 10, and 13].Relative permeability curves are also the largest potentialsource of nonlinearity in equations such as (4) and (5),greatly complicating numerical solution of any probleminvolving extensive multiphase flow.
6.6. Capillary Pressure[34] Like relative permeability, capillary pressures (pres-
sure differences between fluid phases) are usually computed
as functions of saturation using empirical relations [Helmig,1997] and do not account for dynamic effects such ashysteresis. Capillary pressure effects are often neglected insimulations of hydrothermal flow (for instance, equations(4) and (5) assume that a single value of pressure P ap-plies to both phases). This omission is perhaps justified bythe limited empirical data on steam–liquid water capillarybehavior [Li and Horne, 2007]; the fact that relative per-meability functions can incorporate some capillary effects,for instance, through residual liquid saturation (Figure 4);and the fact that the surface tension of water decreases withtemperature and vanishes at the critical point, where theproperties of steam and liquid water merge (Figure 2).However, simulations using plausible functional relationsfor capillary pressure have shown that capillary forces canincrease the efficiency of heat transfer via countercurrentflow [Udell, 1985] and that in rocks with a porous matrixand a network of fractures (dual porosity), typical ofhydrothermal systems, capillary pressures tend to keep thevapor phase in the fractures and the liquid in the matrix[Urmeneta et al., 1998]. In low‐permeability geothermalreservoirs, capillary forces can either extend or shrink two‐phase zones, depending on the wettability of the media[Tsypkin and Calore, 2003].
6.7. Boussinesq Approximation[35] The Boussinesq approximation assumes that transient
variations in fluid density are negligibly small (∂r/∂t = 0),and density acts only on the buoyancy term (rgz inequations (4) and (5)). This means that volume rather thanfluid mass is conserved (equation (3)), and the approxima-tion allows straightforward solution using a stream functionapproach, which is particularly useful to resolve boundarylayers in convective hydrothermal systems. However, it isinappropriate in the general hydrothermal case even if amass‐based stream function [Evans and Raffensperger, 1992] isused because (1) the effects of fluid expansion and pressuri-zation due to in situ heating are neglected [Hanson, 1992],(2) the compressibility of multiphase hydrothermal fluidscan be extraordinarily high [Grant and Sorey, 1979], and(3) the stream function approach cannot describe the hydro-dynamics of phase separation and two‐phase flow. In somesimulations using the stream function approach, two‐phaseflow has been crudely approximated by assuming that acomputational cell is entirely filled by either steam or liquidwater [Cathles, 1977; Fehn and Cathles, 1979, 1986; Fehn etal., 1983], averaging the properties of the liquid and vaporphase [Wilcock, 1998; Fontaine et al., 2007], or assigningidentical fluid properties (except for density) for liquid andvapor [Kawada et al., 2004]. All of these approaches arelikely to generate significant errors. Another deficiency of theBoussinesq approximation/stream function approach is thatbecause it assumes that ∂r/∂t = 0, it is not strictly valid fortransient flow simulations [Evans and Raffensperger, 1992].Stream function solution of the governing equations for heatand mass transport is no longer necessary but remains quitecommon.
Figure 4. Linear, Corey‐type [Corey, 1957], and “fractureflow” [Sorey et al., 1980] relative permeability functions.These functions bracket the range of behavior that has beensuggested for steam–liquid water systems. The Corey and“fracture flow” krl functions are identical, but their krv re-lations are very different. Whereas the Corey functions givekrv + krl � 1 for a large range of saturations, the “fractureflow” functions give krv + krl = 1. Values of krv for the linearfunctions lie between the Corey and “fracture flow” values.In these examples, volumetric liquid saturation (Sl) is relatedto volumetric vapor saturation (Sv) by Sl + Sv = 1, and theresidual vapor and liquid saturations are 0.0 and 0.3,respectively.
Ingebritsen et al.: MODELING MAGMATIC HYDROTHERMAL SYSTEMS RG1002RG1002
9 of 33
6.8. Fluid Composition[36] The presence of salts (primarily NaCl) and non-
condensible gas (primarily CO2) in continental and subma-rine hydrothermal systems affects fluid phase relations,densities, and miscibilities. These effects are usually notrepresented in high‐temperature, multiphase models. State‐of‐the‐art modeling studies have typically employed real-istic properties for pure water [e.g., Ingebritsen and Hayba,1994; Hayba and Ingebritsen, 1997; Jupp and Schultz,2000; Hurwitz et al., 2003; Coumou et al., 2006, 2008a,2008b]. Studies incorporating accurate representations ofthe binary H2O‐CO2 or H2O‐NaCl systems have only veryrecently become available [Todesco et al., 2004; Geiger etal., 2005; Driesner and Geiger, 2007; Coumou et al.,2009; Hutnak et al., 2009; Lewis and Lowell, 2009a,2009b]. These first binary system studies have shown thatthe extended pressure‐temperature range for phase separa-tion can have a large impact on system behavior. Yet eventhe binary system studies have not captured the full com-plexity of crustal fluids that are usually better representedin terms of three major components, H2O‐NaCl‐CO2.Equation‐of‐state formulations for the ternary [Bowers andHelgeson, 1983; Brown and Lamb, 1989; Duan et al.,1995; Anovitz et al., 2004; Duan and Li, 2008] cover onlylimited parts of the pressure‐temperature range encounteredin hydrothermal systems and have been shown to be oflimited accuracy in several regions of the phase diagram[e.g., Schmidt and Bodnar, 2000; Blencoe, 2004; Gottschalk,2007]. Therefore, some level of approximation remainsinevitable (see section 8.1.2). However, consideration ofsingle‐component end‐member systems may lead to con-clusions that exclude qualitatively and quantitatively impor-tant phenomena [Lu and Kieffer, 2009].
6.9. Nonreactive Fluid Flow[37] The dynamic reality of hydrothermal geochemistry is
not fully expressed by the solute transport equation pre-sented as equation (6), in which chemical reactions arerepresented only by the “R” term. Laboratory experiments[e.g., Seyfried, 1987; Bischoff and Rosenbauer, 1988, 1996;Bischoff et al., 1996; Foustoukos and Seyfried, 2007], ob-servations of spring and vent chemistry [e.g., Giggenbach,1984; Von Damm, 1990, 1995; Shinohara, 2008], andthermodynamic calculations [e.g., Symonds et al., 2001]show that circulating hydrothermal fluids are highly reactiveand that hydrothermal reactions have a strong feedback effecton the fluid flow field because they significantly alter bothrock and fluid properties. For instance, laboratory experi-ments indicate that fluid flow under a temperature gradientcan result in rapid mineral precipitation, decreasing perme-ability with time. During one experiment in which heatedwater was forced down a temperature gradient (300°C–92°C)through a cylindrical granite sample, the measured perme-ability dropped by a factor of ∼25 in just 2 weeks [Mooreet al., 1983]. However, many laboratory studies involvestrong chemical disequilibrium that may not be represen-tative of natural systems. Further, it is yet unclear as towhat degree the feedback between fluid pressure and rock
mechanics may counteract the chemical reaction effect onpermeability through creation of new fractures and/orreopening of existing fractures.[38] The interactions that lead to precipitation and dis-
solution of minerals are commonly referred to as “reactivetransport.” Because reactive transport simulations ofhydrothermal systems require a tremendous amount of com-putational power, they have been limited to one‐ or two‐dimensional domains with relatively simple geometries. Thelimited numerical simulations of reactive transport underhydrothermal conditions have mainly been carried out withTOUGH With Reactions (TOUGHREACT) [e.g., Xu andPruess, 2001; Xu et al., 2001; Dobson et al., 2004; Todakaet al., 2004], CSMP++ [Geiger et al., 2002], or specializedreactive transport codes [e.g., Steefel and Lasaga, 1994;Alt‐Epping and Smith, 2001].
6.10. Simplified Descriptions of Permeability[39] Intrinsic permeability (k in equations (1), (2), (4),
and (5)) is probably the most influential, least constrained,and most variable parameter influencing fluid flow inmagmatic hydrothermal systems. In the crystalline rockstypical of hydrothermal systems, fluid flow is focused infractures and thus may vary by orders of magnitude whenexamined at different length scales [Nehlig, 1994; Curewitzand Karson, 1997]. Fluid flow in fractured rocks is funda-mentally different from porous media flow and comprises amajor research area in hydrogeology [Berkowitz, 2002;Neuman, 2005]. For practical purposes, numerical simula-tions of hydrothermal flow generally assume that an REVexists over which fracture permeability can be described byan equivalent porous media approximation.[40] Although permeability varies by ∼17 orders of mag-
nitude in common geologic media, some systematic variationis suggested by various global and or crustal‐scale studies[e.g., Brace, 1980, 1984; Bjornsson and Bodvarsson, 1990;Fisher, 1998; Manning and Ingebritsen, 1999; Saar andManga, 2004; Talwani et al., 2007; Stober and Bucher,2007]. A global permeability‐depth relation based on geo-thermal and metamorphic data suggests that mean crustal‐scale permeability is approximated by
log k � �3:2 log z� 14; ð10Þ
where k is in m2 and z is in km [Manning and Ingebritsen,1999]. This relation suggests effectively constant perme-ability below 10–15 km, the approximate depth of the brittle‐ductile transition in tectonically active crust, and the absenceof a permeability discontinuity or barrier, implying that fluidsproduced by magmatism and metamorphism can be trans-mitted to the brittle crust and mix with meteoric fluids[Ingebritsen and Manning, 1999]. The brittle‐ductile transi-tion is probably much shallower than 10–15 km in the thin,hot crust associated with active magmatism.[41] Proposed permeability‐depth relations for the conti-
nental [Manning and Ingebritsen, 1999; Shmonov et al.,2003; Stober and Bucher, 2007] and oceanic [Fisher, 1998]crust assume permeability to be isotropic. In many geologic
Ingebritsen et al.: MODELING MAGMATIC HYDROTHERMAL SYSTEMS RG1002RG1002
10 of 33
environments there is, in fact, large permeability anisotropy,which is conventionally defined as the ratio between thehorizontal and vertical permeabilities but may also representstructural/tectonic features such as the axial rift/abyssal hilltopography of the MOR. The relatively few hydrothermalmodeling studies that have explored the effect of permeabilityanisotropy have found its effects to be significant [e.g.,Dutrow et al., 2001; Hurwitz et al., 2002, 2003; Saar andManga, 2004; Fisher et al., 2008].[42] Laboratory experiments involving hydrothermal flow
under pressure, temperature, and chemistry gradients incrystalline rocks result in order‐of‐magnitude permeabilitydecreases over daily to subannual time scales [e.g., Summerset al., 1978; Morrow et al., 1981, 2001; Moore et al., 1983,1994; Vaughan et al., 1986; Cox et al., 2001; Polak et al.,2003; Yasuhara et al., 2006]. Field observations of contin-uous, cyclic, and episodic hydrothermal flow transients atvarious time scales also suggest transient variations inpermeability [e.g., Baker et al., 1987, 1989; Titley, 1990;Hill et al., 1993; Urabe et al., 1995; Haymon, 1996; Fornariet al., 1998; Sohn et al., 1998; Gillis and Roberts, 1999;Johnson et al., 2000; Golden et al., 2003; Hurwitz andJohnston, 2003; Husen et al., 2004; Sohn, 2007]. Despitethese empirical observations, only a few modeling studieshave invoked temperature‐ [Hayba and Ingebritsen, 1997;Germanovich et al., 2000, 2001; Driesner and Geiger,2007], pressure‐ [Dutrow and Norton, 1995; Driesner andGeiger, 2007; Rojstaczer et al., 2008], or time‐dependentpermeability [e.g., Hurwitz et al., 2002] or the effects ofreactive transport on permeability [Dutrow et al., 2001]. Thewidespread occurrence of active, long‐lived (103–106 years)hydrothermal systems, despite the tendency for permeabilityto decrease with time, implies that other processes such ashydraulic fracturing and earthquakes regularly create newflow paths [e.g., Rojstaczer et al., 1995]. In fact, there havebeen suggestions that crustal‐scale permeability is a dynami-cally self‐adjusting or even emergent property [e.g.,Rojstaczeret al., 2008].
7. NUMERICAL METHODS
[43] The fundamental idea of any numerical method is torepresent the physical domain by a computational grid. Thisgrid consists of a number of discrete points located on theintersections of lines that are orthogonal to each other(“structured grid”) or in a nonorthogonal arrangement suchthat they optimize the representation of the geometricalfeatures within the domain (“unstructured grid”). Thenumber of grid points feasible or desirable in practical ap-plications depends greatly on the computational efficiencyof the numerical method, the complexity of the geologicalstructures present in the physical domain, the nonlinearity ofthe flow and transport processes, and the degree of precisionsought. At each grid point values of the parameters thatdescribe the physical domain, for example, the porosity andpermeability, are specified or calculated. The solution to thegoverning equations is then approximated numerically atthese points. For magmatic hydrothermal systems the sys-
tem of governing equations is coupled and highly nonlinear.Accurate, stable, and efficient solution of these equations isthe subject of ongoing research.[44] The first numerical methods used to simulate multi-
phase heat and mass transport were finite difference (FD)methods [Faust and Mercer, 1979a, 1979b]. They form thebasis for the U.S. Geological Survey code HYDROTHERM[Hayba and Ingebritsen, 1994; Kipp et al., 2008]. Pruess etal. [1979] used an integrated finite difference scheme (IFD)[Narasimhan and Witherspoon, 1976], formally equivalentto a finite volume (FV) method, that is the basis of thewidely used TOUGH code family [Pruess, 2004]. The FVmethod is also used in the research code FISHES [Lewis,2007; Lewis and Lowell, 2009a].[45] Both FD and IFD methods are very intuitive because
they approximate the spatial and temporal gradients of agiven property in equations such as equations (4) and (5) asthe difference in that property between two discrete points inx, y, and z directions or between two discrete points in time,respectively. The FD method is restricted to structured grids,which imposes restrictions in representing complex topog-raphy and stratigraphy or geological structures such asfaults. The IFD method can be used for unstructured gridsand hence provides more geometrical flexibility. However,it requires the interface between two grid points to be per-pendicular to the line connecting them. If this is not the case,the locations of temperature, pressure, and saturation frontswill exhibit strong grid orientation effects unless the spatialgradients are approximated in a more complex manner [e.g.,Aavatsmark, 2002; Lee et al., 2002].[46] To avoid numerical instabilities in situations where
advective transport dominates over diffusive transport, FDand IFD methods commonly use upstream weighting. Thatis, certain parameters (e.g., rv, rl, kr, mv, and ml), and thusthe flow between two grid points, are weighted toward thegrid point that lies in the upstream flow direction. Whereasupstream weighting stabilizes the numerical solution, it alsooverestimates diffusive flow between grid points. Thiscauses artificial smearing of steep concentration fronts, alsoknown as numerical dispersion. Numerical dispersion can bereduced by evaluating the flow between grid points at theinterface between the points, rather than the upstream node.Such so‐called “higher‐order” flux approximations predictthe locations of temperature, concentration, and saturationfronts more accurately [Oldenburg and Pruess, 2000;Geiger et al., 2006a].[47] The finite element (FE) method is a numerical method
that allows truly unstructured grids and hence providesmaximum geometric flexibility to represent complex geo-logical structures. It was adapted for simulation of multiphaseflow in magmatic hydrothermal systems by Zyvoloski [1983]and forms the basis of the Los Alamos National Laboratorycode FEHM [Zyvoloski et al., 1988, 1997; Keating et al.,2002]. Standard FE methods also suffer from numericalinstabilities if advection dominates over diffusion. Hence, theidea of upstream weighting was introduced here as well[Dalen, 1979]. However, upstream‐weighted FE methodsrequire special FE grids; otherwise, the upstream direction
Ingebritsen et al.: MODELING MAGMATIC HYDROTHERMAL SYSTEMS RG1002RG1002
11 of 33
cannot be identified uniquely, and nonphysical results canoccur [Forsyth, 1991].[48] More recently, a classical concept for modeling in-
compressible single‐ and two‐phase flow and transport inporous media [e.g., Baliga and Patankar, 1980; Durlofsky,1993] has been adapted to multiphase heat and masstransport simulations [Geiger et al., 2006a; Coumou, 2008].It combines the FE method to solve the diffusive parts ofheat and mass transport equations with a higher‐order FVmethod to solve the advective parts. This way, the numericalmethod that is best suited to solve a certain type of equation,FE for diffusion and FV for advection, can be used. At thesame time, maximum geometric flexibility is provided, evenfor very complex three‐dimensional structures such asfractured and faulted reservoirs [Paluszny et al., 2007]. Inthe combined FE‐FV approach, the mass balance equation(equation (4)) is reformulated as a pressure‐diffusion equa-tion. From its solution the velocity field can be computed,which is subsequently used in solution of the heat (equation(5)) and solute (equation (6)) transport equations [Geiger etal., 2006a; Coumou, 2008].[49] Regardless of the numerical method, the discretized
form of the heat and mass transport equations results in asystem of linear ordinary differential equations that can bewritten in matrix form as Ax = b. A is a sparse and diago-nally dominant matrix containing the discretization of thegoverning equation. A is of size n × n, where n is thenumber of unknowns. The vector x contains the solutionvariables (e.g., hf and/or P) at each grid point, and the vectorb contains the boundary and initial conditions. Both x and bare of length n. This implies that if there is only one solutionvariable, n is equal to the number of grid points. The systemAx = b must be solved at least once for each time step andhence hundreds to thousands of times during a typicalsimulation. There are several ways to solve Ax = b. Com-mon choices include (incomplete) decompositions of A intoa lower and upper matrix (so‐called LU and ILU methods),conjugate and biconjugate gradient (CG and BiCG) meth-ods, and generalized minimum residual (GMRES) methods.Often, several methods are combined to accelerate thesolution. For example, HYDROTHERMuses an ILUmethodto precondition a GMRES solver [Kipp et al., 2008], whereasTOUGH2 uses an ILU solver with BiCG/GMRES accelera-tion [Wu et al., 2002]. A problem with these methods is thatthe computing time for solvingAx = b increases by a factor of(n)1.5 to (n)3; that is, if the number of unknowns doubles, thecomputing time increases by a factor of ∼3–8. In practice, thisscaling behavior imposes restrictions on the number of un-knowns that can be solved for, thereby imposing limitationson how finely the grid can be resolved. However, a newgeneration of robust matrix solvers exists. They are based onalgebraic multigrid methods, and their computing time scaleslinearly with the number of unknowns [Stüben, 2001]. Such amatrix solver is currently used in the CSMP++ code, whichconsequently can deal with much larger numbers of un-knowns [Matthäi et al., 2007].[50] There are two fundamentally different ways that the
system Ax = b can be formulated, coupled and decoupled. In
a fully coupled approach, one solves simultaneously for allunknowns such as enthalpy Hf and pressure P (equations (4)and (5)). Hence, the system Ax = b contains the dis-cretizations and boundary conditions of two equations. Thenumber of unknowns (n) is now twice as large as thenumber of grid points. This approach can be expandedfurther to include concentration (equation (6)) or deforma-tion (equation (7)). Such coupled systems must be solvedusing a nonlinear iteration, which is commonly achieved bya Newton‐Raphson method. The advantage of fully coupledapproaches is that the resulting pressure, temperature, andsaturation fields are consistent and that relatively large timesteps can be used as long as the iterations converge. Fullycoupled approaches are most common to FD, IFD, and FEmethods. Decoupled approaches solve the system Ax = b foreach governing equation sequentially. This introduces anumerical error which is on the order of the time step: if thetime step is decreased by a factor of 2, the error decreases bythe same factor. While this error leads to pressure, temper-ature, and saturation fields that may not be entirely consis-tent, decoupled approaches are numerically more stablebecause they do not require iteration. In practice, this oftenallows use of finer grid meshes and higher‐order accuratetransport schemes, which resolve the flow and transportprocesses more accurately in heterogeneous media than fullycoupled approaches. Decoupled approaches are often usedin conjunction with combined FE‐FV methods.[51] Currently, no single code solves the fully coupled
equations for multiphase heat and mass transport anddeformation in porous media. Instead, these equations aresolved by coupling two different codes in sequence, onespecialized code for fluid flow and transport and anotherspecialized code for deformation [Rutqvist et al., 2002; Reid,2004; Hurwitz et al., 2007]. Great care must be exercisedbecause such “sequential coupling” can lead to nonphysicaloscillations in the numerical solution [Kim et al., 2009].
8. LESSONS LEARNED SINCE 1991
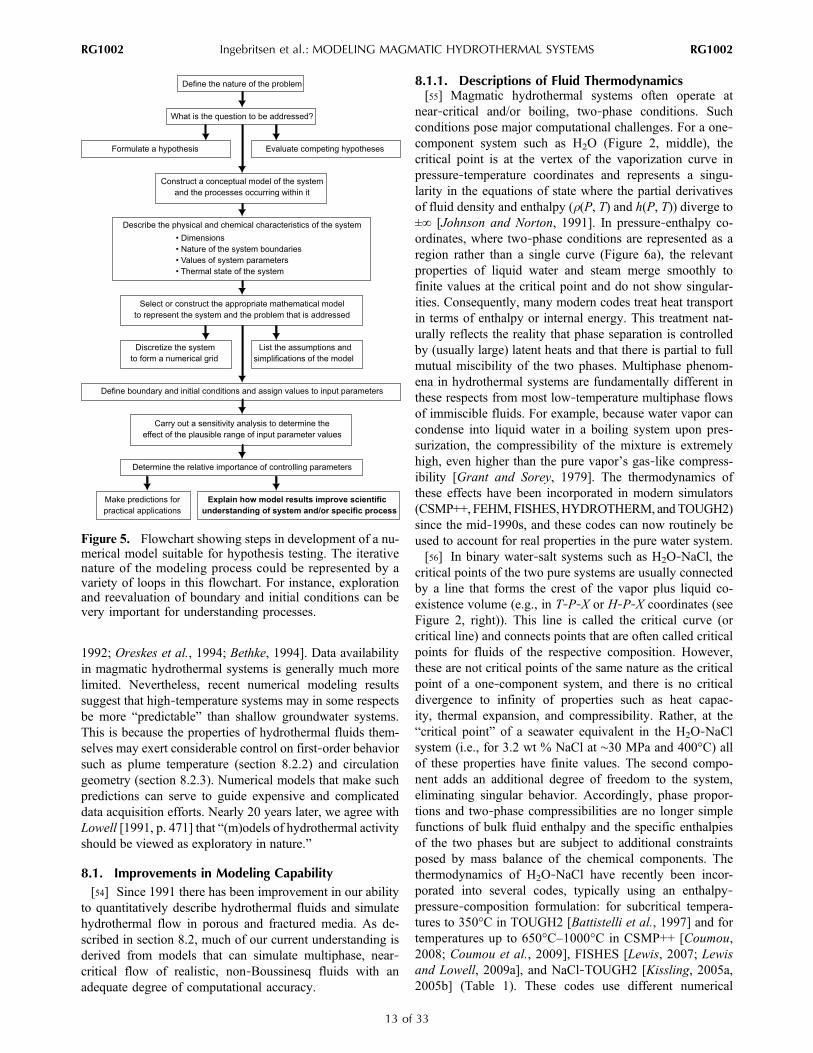
[52] We take Lowell’s [1991] review as the starting pointfor this part of our discussion. We divide this section intotwo parts, the first (section 8.1) emphasizing improvementsin modeling capability and the second (section 8.2) focusingon the resulting insights into the physics of magmatichydrothermal systems. Like Lowell [1991], we will em-phasize “process‐oriented” rather than site‐specific model-ing, though there are many recent, sophisticated modelingstudies of producing geothermal fields [O’Sullivan et al.,2001, 2009; Mannington et al., 2004; Kiryukhin andYampolsky, 2004; Kiryukhin et al., 2008]. Numerical sim-ulation is a powerful tool for testing competing hypothesesin data‐poor environments where data acquisition is a majorchallenge (Figure 5).[53] Parameter uncertainty and incomplete knowledge of
initial conditions generally precludes site‐specific, “predic-tive” forward modeling of subsurface hydrologic systems,even in shallow, low‐temperature groundwater systems withrelatively abundant data [e.g., Konikow and Bredehoeft,
Ingebritsen et al.: MODELING MAGMATIC HYDROTHERMAL SYSTEMS RG1002RG1002
12 of 33
1992; Oreskes et al., 1994; Bethke, 1994]. Data availabilityin magmatic hydrothermal systems is generally much morelimited. Nevertheless, recent numerical modeling resultssuggest that high‐temperature systems may in some respectsbe more “predictable” than shallow groundwater systems.This is because the properties of hydrothermal fluids them-selves may exert considerable control on first‐order behaviorsuch as plume temperature (section 8.2.2) and circulationgeometry (section 8.2.3). Numerical models that make suchpredictions can serve to guide expensive and complicateddata acquisition efforts. Nearly 20 years later, we agree withLowell [1991, p. 471] that “(m)odels of hydrothermal activityshould be viewed as exploratory in nature.”
8.1. Improvements in Modeling Capability[54] Since 1991 there has been improvement in our ability
to quantitatively describe hydrothermal fluids and simulatehydrothermal flow in porous and fractured media. As de-scribed in section 8.2, much of our current understanding isderived from models that can simulate multiphase, near‐critical flow of realistic, non‐Boussinesq fluids with anadequate degree of computational accuracy.
8.1.1. Descriptions of Fluid Thermodynamics[55] Magmatic hydrothermal systems often operate at
near‐critical and/or boiling, two‐phase conditions. Suchconditions pose major computational challenges. For a one‐component system such as H2O (Figure 2, middle), thecritical point is at the vertex of the vaporization curve inpressure‐temperature coordinates and represents a singu-larity in the equations of state where the partial derivativesof fluid density and enthalpy (r(P, T) and h(P, T)) diverge to±∞ [Johnson and Norton, 1991]. In pressure‐enthalpy co-ordinates, where two‐phase conditions are represented as aregion rather than a single curve (Figure 6a), the relevantproperties of liquid water and steam merge smoothly tofinite values at the critical point and do not show singular-ities. Consequently, many modern codes treat heat transportin terms of enthalpy or internal energy. This treatment nat-urally reflects the reality that phase separation is controlledby (usually large) latent heats and that there is partial to fullmutual miscibility of the two phases. Multiphase phenom-ena in hydrothermal systems are fundamentally different inthese respects from most low‐temperature multiphase flowsof immiscible fluids. For example, because water vapor cancondense into liquid water in a boiling system upon pres-surization, the compressibility of the mixture is extremelyhigh, even higher than the pure vapor’s gas‐like compress-ibility [Grant and Sorey, 1979]. The thermodynamics ofthese effects have been incorporated in modern simulators(CSMP++, FEHM,FISHES,HYDROTHERM, andTOUGH2)since the mid‐1990s, and these codes can now routinely beused to account for real properties in the pure water system.[56] In binary water‐salt systems such as H2O‐NaCl, the
critical points of the two pure systems are usually connectedby a line that forms the crest of the vapor plus liquid co-existence volume (e.g., in T‐P‐X or H‐P‐X coordinates (seeFigure 2, right)). This line is called the critical curve (orcritical line) and connects points that are often called criticalpoints for fluids of the respective composition. However,these are not critical points of the same nature as the criticalpoint of a one‐component system, and there is no criticaldivergence to infinity of properties such as heat capac-ity, thermal expansion, and compressibility. Rather, at the“critical point” of a seawater equivalent in the H2O‐NaClsystem (i.e., for 3.2 wt % NaCl at ∼30 MPa and 400°C) allof these properties have finite values. The second compo-nent adds an additional degree of freedom to the system,eliminating singular behavior. Accordingly, phase propor-tions and two‐phase compressibilities are no longer simplefunctions of bulk fluid enthalpy and the specific enthalpiesof the two phases but are subject to additional constraintsposed by mass balance of the chemical components. Thethermodynamics of H2O‐NaCl have recently been incor-porated into several codes, typically using an enthalpy‐pressure‐composition formulation: for subcritical tempera-tures to 350°C in TOUGH2 [Battistelli et al., 1997] and fortemperatures up to 650°C–1000°C in CSMP++ [Coumou,2008; Coumou et al., 2009], FISHES [Lewis, 2007; Lewisand Lowell, 2009a], and NaCl‐TOUGH2 [Kissling, 2005a,2005b] (Table 1). These codes use different numerical
Figure 5. Flowchart showing steps in development of a nu-merical model suitable for hypothesis testing. The iterativenature of the modeling process could be represented by avariety of loops in this flowchart. For instance, explorationand reevaluation of boundary and initial conditions can bevery important for understanding processes.
Ingebritsen et al.: MODELING MAGMATIC HYDROTHERMAL SYSTEMS RG1002RG1002
13 of 33

schemes and different equations of state: the EOS in CSMP++are from Driesner and Heinrich [2007] and Driesner [2007];those in FISHES are a synthesis of data and extrapolationsfrom Archer [1992], Anderko and Pitzer [1993], and Tangerand Pitzer [1989]; and those in NaCl‐TOUGH2 are fromPalliser and McKibbin [1998a, 1998b, 1998c]. Systematiccomparisons among these several codes have yet to be done.[57] The system H2O‐CO2 (Figure 2, left) is fundamen-
tally different from H2O‐NaCl in that the critical line for thissystem limits the two‐phase region to temperatures lowerthan the critical temperature of pure water, and only a sin-gle‐phase fluid exists at temperatures above those indicatedby the two‐fluid surface. Knowledge of the topology of thistwo‐phase region has recently been improved by high‐accuracy experimental studies, but available equations ofstate only approximate current understanding (see Blencoe[2004] for a summary). Complicated phase relations at lowtemperatures [Diamond, 2001] are not usually relevant tohydrothermal studies. Currently, only TOUGH2 and to somedegree the FEHM simulator have implemented hydrothermalH2O‐CO2 thermodynamics.8.1.2. Accurate Representation of Fluid Properties[58] Recent work has demonstrated that approximation of
the temperature‐pressure‐composition dependence of fluidproperties in equations (1), (2), (4), and (5) can actuallysuppress behavior that is revealed when fluid properties arerendered more accurately (see sections 8.2.2, 8.2.3, 8.2.6,and 8.2.7). An increasing number of high‐temperature (to>350°C) studies have employed realistic properties for purewater as a function of temperature (or enthalpy) and pressure[cf. Ingebritsen and Hayba, 1994; Hayba and Ingebritsen,
1997; Jupp and Schultz, 2000, 2004; Hurwitz et al., 2003;Coumou et al., 2006, 2008a, 2008b]. However, the presenceof salts (primarily NaCl) and noncondensible gas (primarilyCO2) adds composition as another factor that affects fluidphase relations, densities, enthalpies, and viscosities. Thebinary H2O‐NaCl system (Figure 2, right) is of particularinterest as a reasonable first‐order proxy for MOR fluids.Complete and accurate representations for this system re-cently became available for conditions to 1000°C, 500 MPa,and 0–1 XNaCl [Driesner and Heinrich, 2007; Driesner,2007] and have begun to be employed in numerical models[Geiger et al., 2005, 2006a; Coumou, 2008; Coumou et al.,2009]. Previous descriptions of the H2O‐NaCl system athigh temperature either contained errors in the thermody-namic formulation [Palliser and McKibbin, 1998a, 1998b,1998c] or were published only as preliminary studies.[59] In spite of these advances, some level of approxi-
mation of fluid properties remains ubiquitous in hydrother-mal modeling. For instance, in essentially all hydrothermalapplications, the composition dependence of viscosity in thebinary systems is represented by approximations. Further,the complexity of crustal fluids would be better representedin terms of the three major components (H2O‐NaCl‐CO2),but data and thermodynamic models for this ternary remainincomplete. To be useful in numerical modeling studies,equation‐of‐state descriptions must be accurate over anextended range of pressure, temperature, and composition;be coherent across potential discontinuities such as phaseboundaries; and be amenable to efficient numerical evalu-ation. Incorporation of H2O‐NaCl‐CO2 equations of state isnot yet feasible, and incorporation of other salts such as
Figure 6. (a) Pressure‐enthalpy diagram for pure water. The thick solid line represents the liquid (L) andvapor (V) branches of the boiling curve, joining at the critical point (CP). The area bounded by this curveis the coexistence region of a boiling liquid plus vapor mixture, within which phase proportions can bedetermined by the lever rule on a horizontal tie line. Arrows indicate adiabatic paths for a rising packageof water that is initially 350°C (black) or 250°C (gray) at 30 MPa. In the 350°C case, the boiling curve isencountered at ∼16.5 MPa, whereas in the 250°C case, boiling occurs at ∼4 MPa. (b) In a temperature‐depth context, this affords one explanation of why hydrothermal systems boil to various depths. Thedashed gray curve in Figure 6b represents the boiling point curve, that is, the increase in boiling temper-ature with depth (pressure). The initially 350°C fluid (black curve with arrow) boils at ∼2 km depth, andthe initially 250°C fluid (gray curve) boils at ∼0.4 km depth. The open circles in both Figures 6a and 6bindicate where the rising fluid intercepts the two‐phase region (boils). Because of the large heat of vapor-ization of water, expressed as the width of the two‐phase region in Figure 6a, rising hydrothermal plumesare unlikely to depart from the boiling point curve once they intercept it.
Ingebritsen et al.: MODELING MAGMATIC HYDROTHERMAL SYSTEMS RG1002RG1002
14 of 33
H2O‐KCl [Anderko and Pitzer, 1993] or H2O‐CaCl2 [Bischoffet al., 1996], which can shift phase boundaries and enhancethe reactivity of the fluid, is limited by the pressure‐temperature range of available experimental data.8.1.3. Role of Dimensionless Numbers[60] The Boussinesq approximation and the assumption
that fluid density, viscosity, and heat capacity vary linearlyas functions of temperature or composition allows definitionof a set of dimensionless parameters to characterize convec-tion (Table 2). These parameters are the Rayleigh number Ra,which describes the vigor of convection; the Nusselt numberNu, which describes the ratio of the total heat flux to the heatflux transported by conduction alone; the Lewis number Le,which describes the ratio between thermal and chemicaldiffusivity; the buoyancy ratio Rb, which is a ratio of fluiddensity contributions from salinity and temperature varia-tions; and the dimensionless porosity �*, which describes thedegree to which advective heat transport is retarded withrespect to advective solute transport [e.g., Nield and Bejan,1992].[61] For realistic fluids with strongly nonlinear fluid
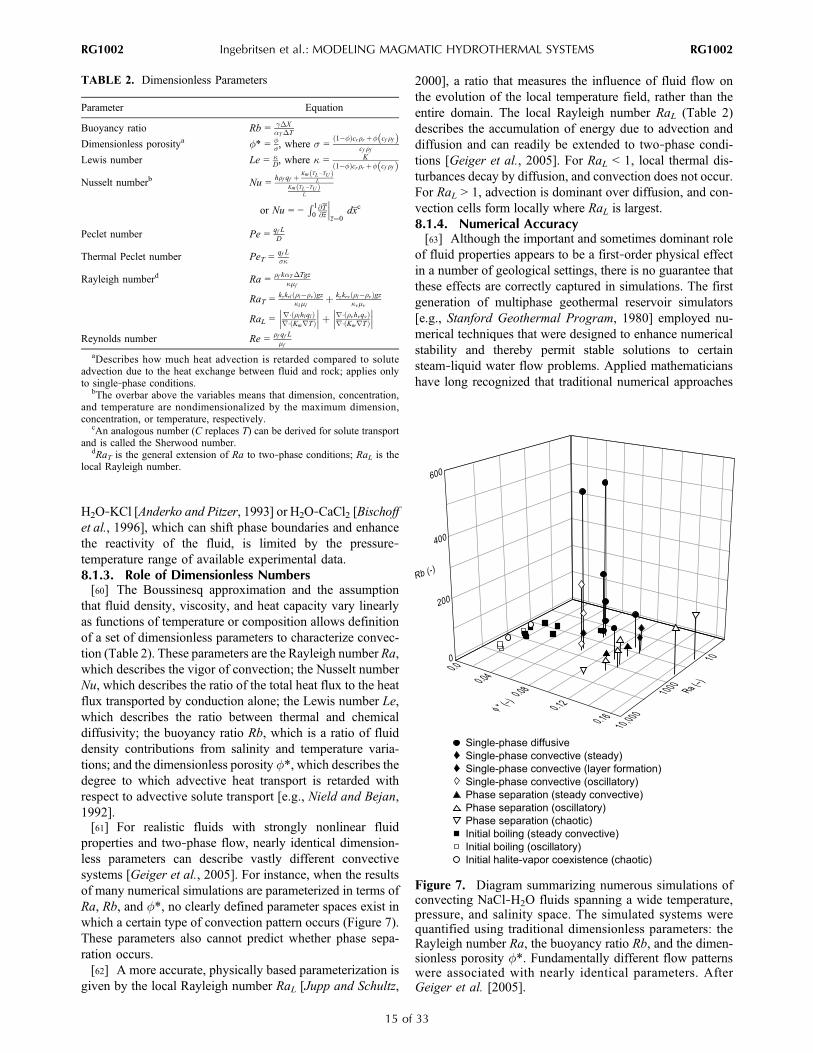
properties and two‐phase flow, nearly identical dimension-less parameters can describe vastly different convectivesystems [Geiger et al., 2005]. For instance, when the resultsof many numerical simulations are parameterized in terms ofRa, Rb, and �*, no clearly defined parameter spaces exist inwhich a certain type of convection pattern occurs (Figure 7).These parameters also cannot predict whether phase sepa-ration occurs.[62] A more accurate, physically based parameterization is
given by the local Rayleigh number RaL [Jupp and Schultz,
2000], a ratio that measures the influence of fluid flow onthe evolution of the local temperature field, rather than theentire domain. The local Rayleigh number RaL (Table 2)describes the accumulation of energy due to advection anddiffusion and can readily be extended to two‐phase condi-tions [Geiger et al., 2005]. For RaL < 1, local thermal dis-turbances decay by diffusion, and convection does not occur.For RaL > 1, advection is dominant over diffusion, and con-vection cells form locally where RaL is largest.8.1.4. Numerical Accuracy[63] Although the important and sometimes dominant role
of fluid properties appears to be a first‐order physical effectin a number of geological settings, there is no guarantee thatthese effects are correctly captured in simulations. The firstgeneration of multiphase geothermal reservoir simulators[e.g., Stanford Geothermal Program, 1980] employed nu-merical techniques that were designed to enhance numericalstability and thereby permit stable solutions to certainsteam‐liquid water flow problems. Applied mathematicianshave long recognized that traditional numerical approaches
TABLE 2. Dimensionless Parameters
Parameter Equation
Buoyancy ratio Rb = ��X�T�T
Dimensionless porositya �* = �, where s =
1��ð Þcr�r þ� cf �fð Þcf �f
Lewis number Le = D, where = K
1��ð Þcr�r þ� cf �fð ÞNusselt numberb Nu =
h�f qf þ Km TL�TUð ÞL
Km TL�TUð ÞL
or Nu = −R 10@T@z
���z¼0
dxc
Peclet number Pe = qf LD
Thermal Peclet number PeT = qf L
Rayleigh numberd Ra = �f k�T�Tgz�f
RaT = kzkrl �l��vð Þgzl�l
þ kzkrv �l��vð Þgzv�v
RaL = r� �l hlqlð Þr� KmrTð Þ��� ���þ r� �vhvqvð Þ
r� KmrTð Þ��� ���
Reynolds number Re = �f qf L�f
aDescribes how much heat advection is retarded compared to soluteadvection due to the heat exchange between fluid and rock; applies onlyto single‐phase conditions.
bThe overbar above the variables means that dimension, concentration,and temperature are nondimensionalized by the maximum dimension,concentration, or temperature, respectively.
cAn analogous number (C replaces T) can be derived for solute transportand is called the Sherwood number.
dRaT is the general extension of Ra to two‐phase conditions; RaL is thelocal Rayleigh number.
Figure 7. Diagram summarizing numerous simulations ofconvecting NaCl‐H2O fluids spanning a wide temperature,pressure, and salinity space. The simulated systems werequantified using traditional dimensionless parameters: theRayleigh number Ra, the buoyancy ratio Rb, and the dimen-sionless porosity �*. Fundamentally different flow patternswere associated with nearly identical parameters. AfterGeiger et al. [2005].
Ingebritsen et al.: MODELING MAGMATIC HYDROTHERMAL SYSTEMS RG1002RG1002
15 of 33
involving coarse spatial discretization and lower‐order nu-merical accuracy can artificially damp perturbations [e.g.,Harten, 1983; Sweby, 1984]. However, limited computa-tional resources have necessitated coarse discretization ofsimulated magmatic hydrothermal systems. Only recentlyhave more accurate high‐resolution discretization tech-niques been adopted [Oldenburg and Pruess, 2000; Geigeret al., 2006a] (see also section 7), and it has been shown thatthey can actually reveal hidden dynamic behavior that isphysically “real” (i.e., nonnumerical), such as hydrothermalplume splitting and fluctuations in vent temperature [Coumouet al., 2006].
8.2. Recent Insights Into the Physics of MagmaticHydrothermal Systems
8.2.1. Nature of the Magma Hydrothermal Interface[64] In some hydrothermal flow models, the lower
boundary is defined so as to approximately coincide withthe brittle‐ductile transition, which may be viewed as sep-arating ductile and hence very low permeability rocks (andnear‐lithostatic pressures) below the transition from brittle,higher‐permeability rocks (and near‐hydrostatic pressures)above the transition [Fournier, 1999]. The transition mayroughly coincide with a thin, heat‐conducting boundarylayer (sometimes referred to as “carapace”) that has longbeen inferred to exist between cooling magma (certainlyductile) and the overlying hydrothermal system [e.g., Lister,1974, 1983]. A relatively thin conductive boundary layerseems necessary to maintain the power output (∼100–1000 MW) typical of large magmatic hydrothermal systems[Schultz et al., 1992; Lowell and Germanovich, 1994]. Asthe magma in the underlying reservoir cools, the conductiveboundary layer will migrate downward, allowing progres-sively deeper penetration of hydrothermal fluids [Kelley andDelaney, 1987; Fournier, 1999]. The transition from brittleto ductile conditions is traditionally assumed to occur ina temperature range of 350°C–400°C [Fournier, 1999],which coincides with the maximum temperature of 405°Cmeasured in hydrothermal vents along the MOR [VonDamm et al., 2003] and with maximum temperatures mea-sured in deep geothermal wells worldwide [Fournier, 1991].However, experimental studies have shown that under re-alistic geological strain rates, the temperatures at whichdifferent rock types undergo transition from brittle to ductilerheology can range from 260°C for wet quartz to ∼700°C fordry orthopyroxene [Carter and Tsenn, 1987; Hirth et al.,1998; Simpson, 2001].[65] Recent high‐resolution, three‐dimensional numerical
simulations using temperature‐dependent permeability sug-gest that the brittle‐ductile transition temperature in mid‐ocean ridge settings is probably not lower than 650°C[Coumou, 2008]. These simulations assume that perme-ability is negligibly low at temperatures above the brittle‐ductile transition. If the brittle‐ductile transition is set attemperatures less than ∼650°C, the hydrothermal convectionsystem cannot effectively mine heat from the underlyingmagma. A broad hot zone develops at depth, and relativelylow‐temperature discharge (�400°C) occurs on and off
axis. A brittle‐ductile transition defined at 650°C–750°Cresults in simulated near‐axial discharge at ∼400°C in adomain with homogeneous and isotropic permeability.8.2.2. Maximum Hydrothermal Plume Temperaturesand “Superconvection”[66] There are a number of possible explanations for the
observation that maximum MOR fluid temperatures appearto be limited to ∼400°C, much less than the temperature ofbasaltic magma. Analytical solutions for conductive heattransport show that temperatures at the surface of a single,instantaneous intrusion will not exceed 0.5Tmax [e.g.,Lachenbruch et al., 1976], or ∼600°C in the case of basalt.Further, for typical hydrothermal pressures there is a max-imum in silica solubility at 350°C–400°C such that at highertemperatures fluid circulation may be inhibited by deposi-tion of silica [Fournier and Potter, 1982]. Finally, it hasbeen suggested that vent temperatures are linked to thetemperature of the brittle‐ductile transition (section 8.2.1).[67] Each of these explanations for MOR vent tempera-
tures seems plausible, but none of them are required. Si-mulations of free convection above an arbitrarily hot baseshow that the temperatures of upwelling plumes are effec-tively buffered by the properties of water itself. Pure waterwill tend to rise from an arbitrarily hot boundary layer attemperatures of 350°C–400°C (Figure 8), the temperaturerange associated with convection cells operating at maxi-mum energy transport [Jupp and Schultz, 2000]. This resulthas recently been supported by chemical geothermometry ofMOR fluids [Fontaine et al., 2009].[68] This self‐organizing effect is not evident in a
“Boussinesq” fluid, for which the upflow temperature scaleslinearly with the basal temperature (Figure 9). The pla-teauing of upflow temperature at ∼400°C for non‐Boussi-nesq water (see again Figure 9) can be understood in termsof a quantity termed “fluxibility” F [Jupp and Schultz,2000], which measures the ability of buoyancy‐driven wa-ter to transport heat:
F ¼ �0 � �ð Þ�h=�; ð11Þ
where r0 is the density of cold water. For pure water, thislocally defined quantity is weakly pressure‐dependent andshows clear peaks in ∂F/∂T at temperatures ranging from384°C at 25 MPa to 412°C at 35 MPa. These are thus thetemperatures at which pure water will tend to rise at a givenpressure. The fluxibility peaks shift to somewhat highertemperatures in a seawater system (Figure 10).[69] The fluxibility peaks at near‐critical temperatures are
related to an empirically observed phenomenon named“superconvection” [Dunn and Hardee, 1981]. Numericalexperiments involving a two‐dimensional vertical slab withfixed temperature top and bottom boundaries showed thatnear‐critical heat transfer enhancements result from dra-matic increases in the gradients in fluid enthalpy (hbot –htop, or Dh) and density (rmax – rmin, or Dr) across the slabthat occur as its temperature approaches the critical temper-ature [Ingebritsen and Hayba, 1994]. Maximum enhance-ments in simulated heat transfer rates for a rectangular
Ingebritsen et al.: MODELING MAGMATIC HYDROTHERMAL SYSTEMS RG1002RG1002
16 of 33

(10 m × 10 m) slab (Nu > 100) exceeded the maximumenhancement (Nu ∼ 80) observed by Dunn and Hardee[1981] in their much smaller experimental cylinder. How-ever, other simulations showed that subcritical two‐phaseprocesses (“heat pipes”) afford equally viable or superior heattransfer mechanisms. This result has been confirmed by morerecent simulations [Coumou et al., 2008a] and makes senseon an intuitive level becauseDH (in this case Hv–Hl, the heatof vaporization) and Dr (rmax – rmin) are both larger undertwo‐phase conditions than they can be at or above the criticalpoint itself.8.2.3. Self‐Organizing Geometries of ConvectionCells[70] Numerical simulations that incorporate more accurate
water properties and dense computational grids can also helpto explain the three‐dimensional geometry of MOR hydro-thermal circulation (Figure 11) [Coumou et al., 2008b]. Theconcept of fluxibility (equation (11)) can be extended to in-clude both upflow (subscript u) and downflow (subscript d)zones of a hydrothermal convection cell,
F ¼ �u hu � hdð Þ �d � �uð Þ�u 1þ "Bð Þ ; ð12Þ
where e represents the ratio Au/ku/Adkd; Au and Ad are thehorizontal cross‐sectional areas of the upflow and downflowzones, respectively; and B is the ratio of the fluid propertiesmdru/murd. This version of F expresses the ability of a multi-dimensional, single‐phase system to transport energy bybuoyancy‐driven convection. When evaluated, it indicatesthat in a uniform permeability medium, optimum energytransport occurs when convection cells self‐organize intopipelike upflow zones (∼380°C) that are surrounded by nar-row zones of focused, hot recharge (100°C–300°C). Thisimplies that recharge in MOR systems is much more focusedthan depicted in Figure 1b.
[71] Though the system depicted in Figure 11 has uniformintrinsic permeability k, the hydraulic conductivity
K ¼ k�f g
�fð13Þ
of both upflow and downflow zones is enhanced relative tosurrounding regions by the presence of hot fluids with lowerviscosity mf. Once established, this geometry seems to befairly robust. The hydraulic conductivity contrast caused bydifferences in fluid viscosity has the same stabilizing effectas a contrast in intrinsic permeability. The hot, areallyrestricted flow geometry dictated by water properties impliesshort fluid residence times. It has important implications forproposed MOR tracer tests and the formation of massivesulfide ore deposits [Coumou et al., 2008b, 2009].
Figure 8. Simulated temperature distribution in a subsea convection cell. The top boundary is main-tained at a pressure and temperature representing the seafloor and is permeable; a Gaussian (bell‐shaped)temperature profile is imposed along the bottom boundary, with a maximum temperature of 1200°C re-presenting magmatic temperatures. The lateral boundaries for the simulation are at distances of 1700 m,well beyond the range of these Figures. (a) Overall temperature structure of the convection cell, showingthe distinction between the basal boundary layer and the plume, and (b) close‐up view of the flow regimeand temperature structure inside the boundary layer, showing only the bottom 100 m of the simulationdomain. Vectors in Figure 8b indicate volumetric fluid flow rates per unit area. Adapted by permissionfrom Macmillan Publishers Ltd [Jupp and Schultz, 2000], copyright 2000.
Figure 9. Temperature of upwelling fluid in a porous con-vection cell as a function of temperature at the base of themodel domain, showing results for pure water at varioustop boundary pressures (solid lines) and a Boussinesq fluid(dashed line). After Jupp and Schultz [2004].
Ingebritsen et al.: MODELING MAGMATIC HYDROTHERMAL SYSTEMS RG1002RG1002
17 of 33
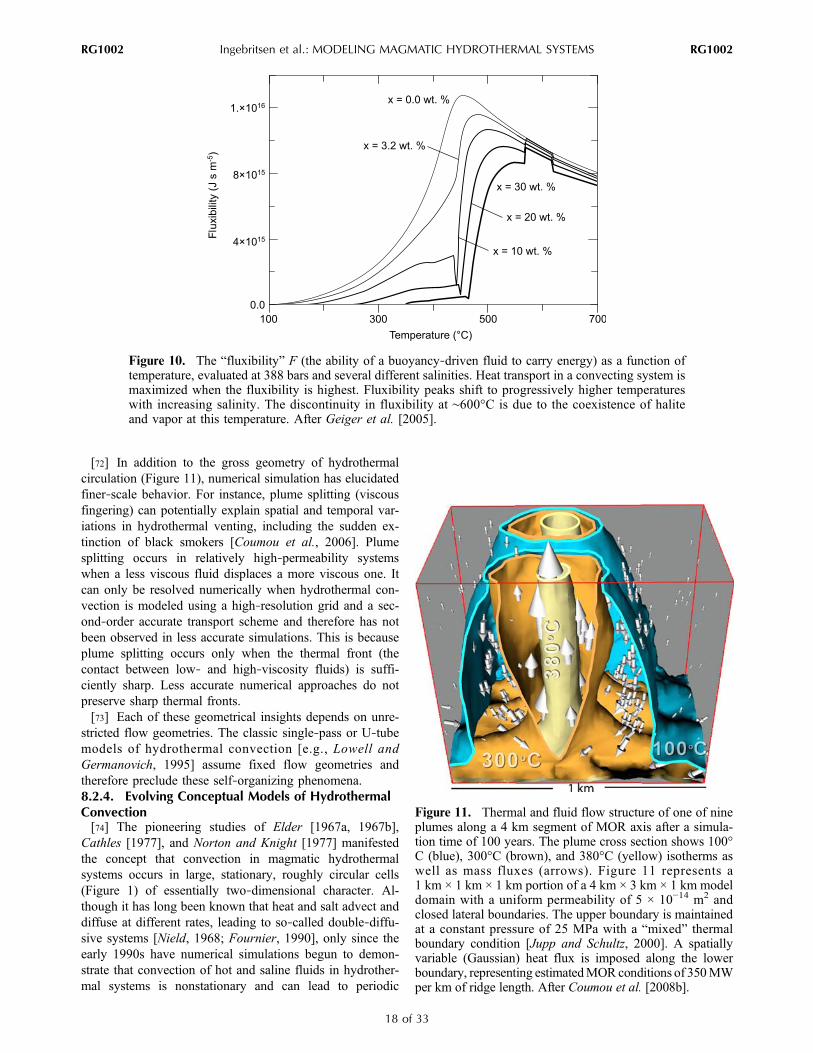
[72] In addition to the gross geometry of hydrothermalcirculation (Figure 11), numerical simulation has elucidatedfiner‐scale behavior. For instance, plume splitting (viscousfingering) can potentially explain spatial and temporal var-iations in hydrothermal venting, including the sudden ex-tinction of black smokers [Coumou et al., 2006]. Plumesplitting occurs in relatively high‐permeability systemswhen a less viscous fluid displaces a more viscous one. Itcan only be resolved numerically when hydrothermal con-vection is modeled using a high‐resolution grid and a sec-ond‐order accurate transport scheme and therefore has notbeen observed in less accurate simulations. This is becauseplume splitting occurs only when the thermal front (thecontact between low‐ and high‐viscosity fluids) is suffi-ciently sharp. Less accurate numerical approaches do notpreserve sharp thermal fronts.[73] Each of these geometrical insights depends on unre-
stricted flow geometries. The classic single‐pass or U‐tubemodels of hydrothermal convection [e.g., Lowell andGermanovich, 1995] assume fixed flow geometries andtherefore preclude these self‐organizing phenomena.8.2.4. Evolving Conceptual Models of HydrothermalConvection[74] The pioneering studies of Elder [1967a, 1967b],
Cathles [1977], and Norton and Knight [1977] manifestedthe concept that convection in magmatic hydrothermalsystems occurs in large, stationary, roughly circular cells(Figure 1) of essentially two‐dimensional character. Al-though it has long been known that heat and salt advect anddiffuse at different rates, leading to so‐called double‐diffu-sive systems [Nield, 1968; Fournier, 1990], only since theearly 1990s have numerical simulations begun to demon-strate that convection of hot and saline fluids in hydrother-mal systems is nonstationary and can lead to periodic
Figure 10. The “fluxibility” F (the ability of a buoyancy‐driven fluid to carry energy) as a function oftemperature, evaluated at 388 bars and several different salinities. Heat transport in a convecting system ismaximized when the fluxibility is highest. Fluxibility peaks shift to progressively higher temperatureswith increasing salinity. The discontinuity in fluxibility at ∼600°C is due to the coexistence of haliteand vapor at this temperature. After Geiger et al. [2005].
Figure 11. Thermal and fluid flow structure of one of nineplumes along a 4 km segment of MOR axis after a simula-tion time of 100 years. The plume cross section shows 100°C (blue), 300°C (brown), and 380°C (yellow) isotherms aswell as mass fluxes (arrows). Figure 11 represents a1 km × 1 km × 1 km portion of a 4 km × 3 km × 1 km modeldomain with a uniform permeability of 5 × 10⁻¹⁴ m2 andclosed lateral boundaries. The upper boundary is maintainedat a constant pressure of 25 MPa with a “mixed” thermalboundary condition [Jupp and Schultz, 2000]. A spatiallyvariable (Gaussian) heat flux is imposed along the lowerboundary, representing estimatedMOR conditions of 350MWper km of ridge length. After Coumou et al. [2008b].
Ingebritsen et al.: MODELING MAGMATIC HYDROTHERMAL SYSTEMS RG1002RG1002
18 of 33
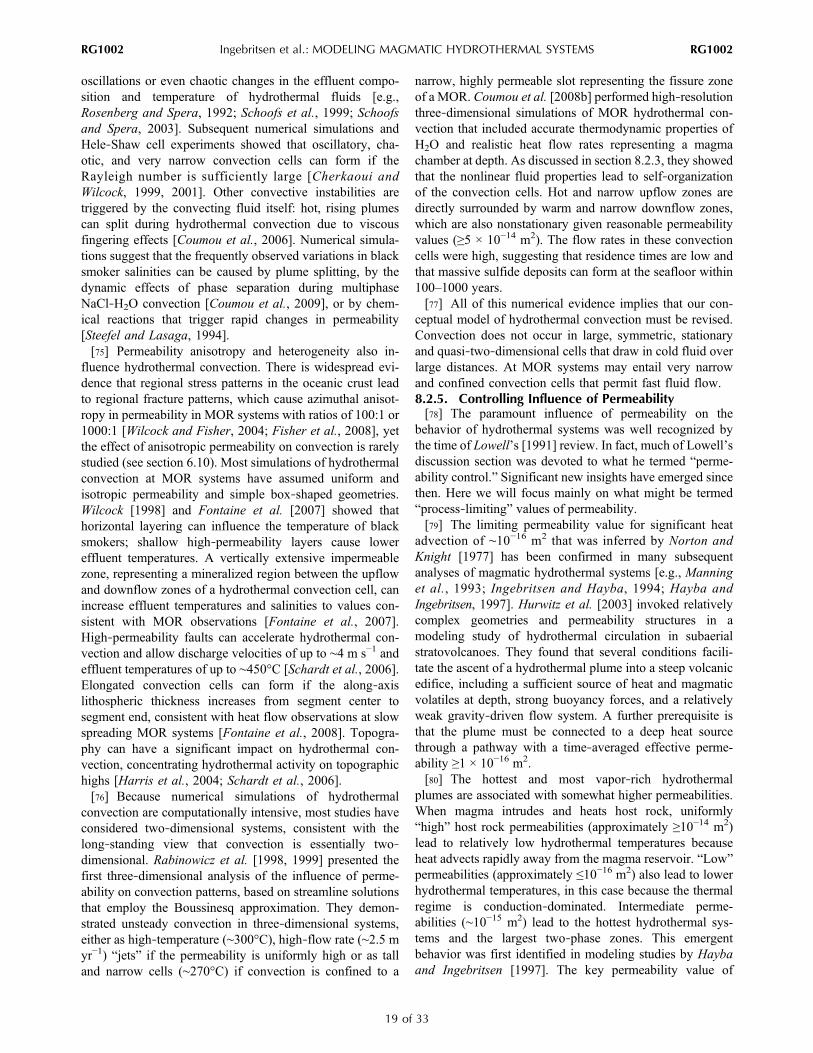
oscillations or even chaotic changes in the effluent compo-sition and temperature of hydrothermal fluids [e.g.,Rosenberg and Spera, 1992; Schoofs et al., 1999; Schoofsand Spera, 2003]. Subsequent numerical simulations andHele‐Shaw cell experiments showed that oscillatory, cha-otic, and very narrow convection cells can form if theRayleigh number is sufficiently large [Cherkaoui andWilcock, 1999, 2001]. Other convective instabilities aretriggered by the convecting fluid itself: hot, rising plumescan split during hydrothermal convection due to viscousfingering effects [Coumou et al., 2006]. Numerical simula-tions suggest that the frequently observed variations in blacksmoker salinities can be caused by plume splitting, by thedynamic effects of phase separation during multiphaseNaCl‐H2O convection [Coumou et al., 2009], or by chem-ical reactions that trigger rapid changes in permeability[Steefel and Lasaga, 1994].[75] Permeability anisotropy and heterogeneity also in-
fluence hydrothermal convection. There is widespread evi-dence that regional stress patterns in the oceanic crust leadto regional fracture patterns, which cause azimuthal anisot-ropy in permeability in MOR systems with ratios of 100:1 or1000:1 [Wilcock and Fisher, 2004; Fisher et al., 2008], yetthe effect of anisotropic permeability on convection is rarelystudied (see section 6.10). Most simulations of hydrothermalconvection at MOR systems have assumed uniform andisotropic permeability and simple box‐shaped geometries.Wilcock [1998] and Fontaine et al. [2007] showed thathorizontal layering can influence the temperature of blacksmokers; shallow high‐permeability layers cause lowereffluent temperatures. A vertically extensive impermeablezone, representing a mineralized region between the upflowand downflow zones of a hydrothermal convection cell, canincrease effluent temperatures and salinities to values con-sistent with MOR observations [Fontaine et al., 2007].High‐permeability faults can accelerate hydrothermal con-vection and allow discharge velocities of up to ∼4 m s−1 andeffluent temperatures of up to ∼450°C [Schardt et al., 2006].Elongated convection cells can form if the along‐axislithospheric thickness increases from segment center tosegment end, consistent with heat flow observations at slowspreading MOR systems [Fontaine et al., 2008]. Topogra-phy can have a significant impact on hydrothermal con-vection, concentrating hydrothermal activity on topographichighs [Harris et al., 2004; Schardt et al., 2006].[76] Because numerical simulations of hydrothermal
convection are computationally intensive, most studies haveconsidered two‐dimensional systems, consistent with thelong‐standing view that convection is essentially two‐dimensional. Rabinowicz et al. [1998, 1999] presented thefirst three‐dimensional analysis of the influence of perme-ability on convection patterns, based on streamline solutionsthat employ the Boussinesq approximation. They demon-strated unsteady convection in three‐dimensional systems,either as high‐temperature (∼300°C), high‐flow rate (∼2.5 myr−1) “jets” if the permeability is uniformly high or as talland narrow cells (∼270°C) if convection is confined to a
narrow, highly permeable slot representing the fissure zoneof a MOR. Coumou et al. [2008b] performed high‐resolutionthree‐dimensional simulations of MOR hydrothermal con-vection that included accurate thermodynamic properties ofH2O and realistic heat flow rates representing a magmachamber at depth. As discussed in section 8.2.3, they showedthat the nonlinear fluid properties lead to self‐organizationof the convection cells. Hot and narrow upflow zones aredirectly surrounded by warm and narrow downflow zones,which are also nonstationary given reasonable permeabilityvalues (≥5 × 10⁻¹⁴ m2). The flow rates in these convectioncells were high, suggesting that residence times are low andthat massive sulfide deposits can form at the seafloor within100–1000 years.[77] All of this numerical evidence implies that our con-
ceptual model of hydrothermal convection must be revised.Convection does not occur in large, symmetric, stationaryand quasi‐two‐dimensional cells that draw in cold fluid overlarge distances. At MOR systems may entail very narrowand confined convection cells that permit fast fluid flow.8.2.5. Controlling Influence of Permeability[78] The paramount influence of permeability on the
behavior of hydrothermal systems was well recognized bythe time of Lowell’s [1991] review. In fact, much of Lowell’sdiscussion section was devoted to what he termed “perme-ability control.” Significant new insights have emerged sincethen. Here we will focus mainly on what might be termed“process‐limiting” values of permeability.[79] The limiting permeability value for significant heat
advection of ∼10−16 m2 that was inferred by Norton andKnight [1977] has been confirmed in many subsequentanalyses of magmatic hydrothermal systems [e.g., Manninget al., 1993; Ingebritsen and Hayba, 1994; Hayba andIngebritsen, 1997]. Hurwitz et al. [2003] invoked relativelycomplex geometries and permeability structures in amodeling study of hydrothermal circulation in subaerialstratovolcanoes. They found that several conditions facili-tate the ascent of a hydrothermal plume into a steep volcanicedifice, including a sufficient source of heat and magmaticvolatiles at depth, strong buoyancy forces, and a relativelyweak gravity‐driven flow system. A further prerequisite isthat the plume must be connected to a deep heat sourcethrough a pathway with a time‐averaged effective perme-ability ≥1 × 10⁻¹⁶ m2.[80] The hottest and most vapor‐rich hydrothermal
plumes are associated with somewhat higher permeabilities.When magma intrudes and heats host rock, uniformly“high” host rock permeabilities (approximately ≥10−14 m2)lead to relatively low hydrothermal temperatures becauseheat advects rapidly away from the magma reservoir. “Low”permeabilities (approximately ≤10−16 m2) also lead to lowerhydrothermal temperatures, in this case because the thermalregime is conduction‐dominated. Intermediate perme-abilities (∼10−15 m2) lead to the hottest hydrothermal sys-tems and the largest two‐phase zones. This emergentbehavior was first identified in modeling studies by Haybaand Ingebritsen [1997]. The key permeability value of
Ingebritsen et al.: MODELING MAGMATIC HYDROTHERMAL SYSTEMS RG1002RG1002
19 of 33
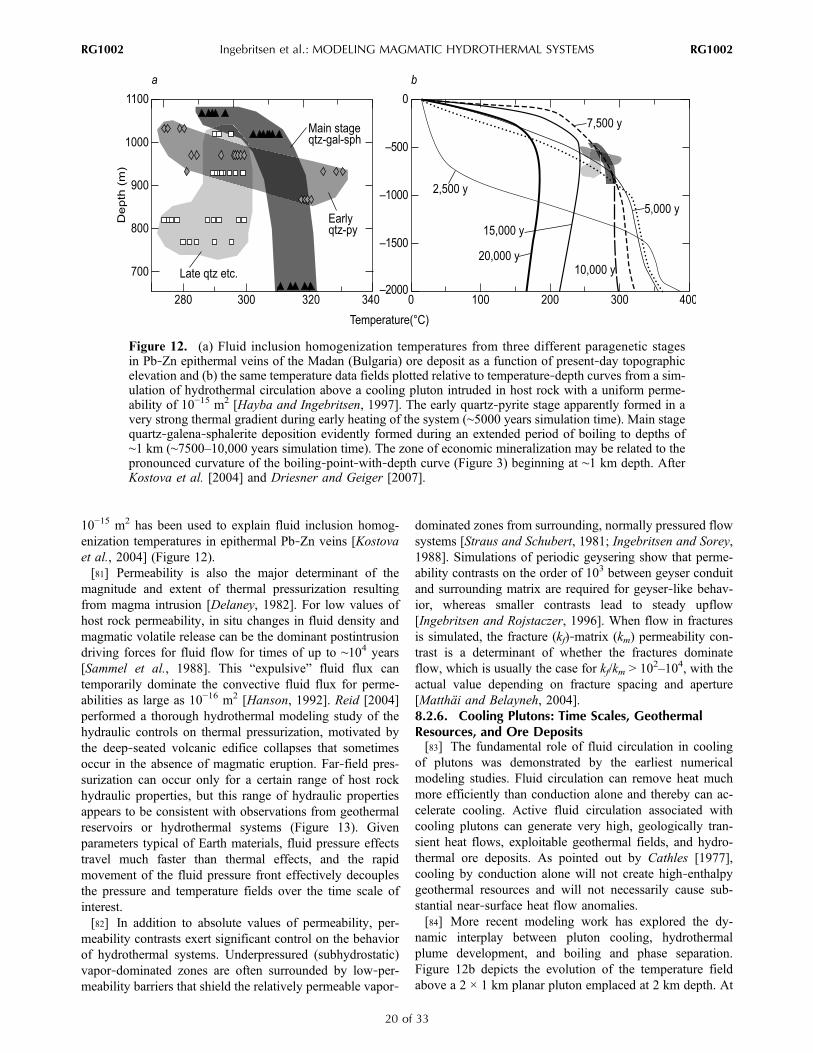
10−15 m2 has been used to explain fluid inclusion homog-enization temperatures in epithermal Pb‐Zn veins [Kostovaet al., 2004] (Figure 12).[81] Permeability is also the major determinant of the
magnitude and extent of thermal pressurization resultingfrom magma intrusion [Delaney, 1982]. For low values ofhost rock permeability, in situ changes in fluid density andmagmatic volatile release can be the dominant postintrusiondriving forces for fluid flow for times of up to ∼104 years[Sammel et al., 1988]. This “expulsive” fluid flux cantemporarily dominate the convective fluid flux for perme-abilities as large as 10−16 m2 [Hanson, 1992]. Reid [2004]performed a thorough hydrothermal modeling study of thehydraulic controls on thermal pressurization, motivated bythe deep‐seated volcanic edifice collapses that sometimesoccur in the absence of magmatic eruption. Far‐field pres-surization can occur only for a certain range of host rockhydraulic properties, but this range of hydraulic propertiesappears to be consistent with observations from geothermalreservoirs or hydrothermal systems (Figure 13). Givenparameters typical of Earth materials, fluid pressure effectstravel much faster than thermal effects, and the rapidmovement of the fluid pressure front effectively decouplesthe pressure and temperature fields over the time scale ofinterest.[82] In addition to absolute values of permeability, per-
meability contrasts exert significant control on the behaviorof hydrothermal systems. Underpressured (subhydrostatic)vapor‐dominated zones are often surrounded by low‐per-meability barriers that shield the relatively permeable vapor‐
dominated zones from surrounding, normally pressured flowsystems [Straus and Schubert, 1981; Ingebritsen and Sorey,1988]. Simulations of periodic geysering show that perme-ability contrasts on the order of 103 between geyser conduitand surrounding matrix are required for geyser‐like behav-ior, whereas smaller contrasts lead to steady upflow[Ingebritsen and Rojstaczer, 1996]. When flow in fracturesis simulated, the fracture (kf)‐matrix (km) permeability con-trast is a determinant of whether the fractures dominateflow, which is usually the case for kf/km > 102–104, with theactual value depending on fracture spacing and aperture[Matthäi and Belayneh, 2004].8.2.6. Cooling Plutons: Time Scales, GeothermalResources, and Ore Deposits[83] The fundamental role of fluid circulation in cooling
of plutons was demonstrated by the earliest numericalmodeling studies. Fluid circulation can remove heat muchmore efficiently than conduction alone and thereby can ac-celerate cooling. Active fluid circulation associated withcooling plutons can generate very high, geologically tran-sient heat flows, exploitable geothermal fields, and hydro-thermal ore deposits. As pointed out by Cathles [1977],cooling by conduction alone will not create high‐enthalpygeothermal resources and will not necessarily cause sub-stantial near‐surface heat flow anomalies.[84] More recent modeling work has explored the dy-
namic interplay between pluton cooling, hydrothermalplume development, and boiling and phase separation.Figure 12b depicts the evolution of the temperature fieldabove a 2 × 1 km planar pluton emplaced at 2 km depth. At
Figure 12. (a) Fluid inclusion homogenization temperatures from three different paragenetic stagesin Pb‐Zn epithermal veins of the Madan (Bulgaria) ore deposit as a function of present‐day topographicelevation and (b) the same temperature data fields plotted relative to temperature‐depth curves from a sim-ulation of hydrothermal circulation above a cooling pluton intruded in host rock with a uniform perme-ability of 10−15 m2 [Hayba and Ingebritsen, 1997]. The early quartz‐pyrite stage apparently formed in avery strong thermal gradient during early heating of the system (∼5000 years simulation time). Main stagequartz‐galena‐sphalerite deposition evidently formed during an extended period of boiling to depths of∼1 km (∼7500–10,000 years simulation time). The zone of economic mineralization may be related to thepronounced curvature of the boiling‐point‐with‐depth curve (Figure 3) beginning at ∼1 km depth. AfterKostova et al. [2004] and Driesner and Geiger [2007].
Ingebritsen et al.: MODELING MAGMATIC HYDROTHERMAL SYSTEMS RG1002RG1002
20 of 33
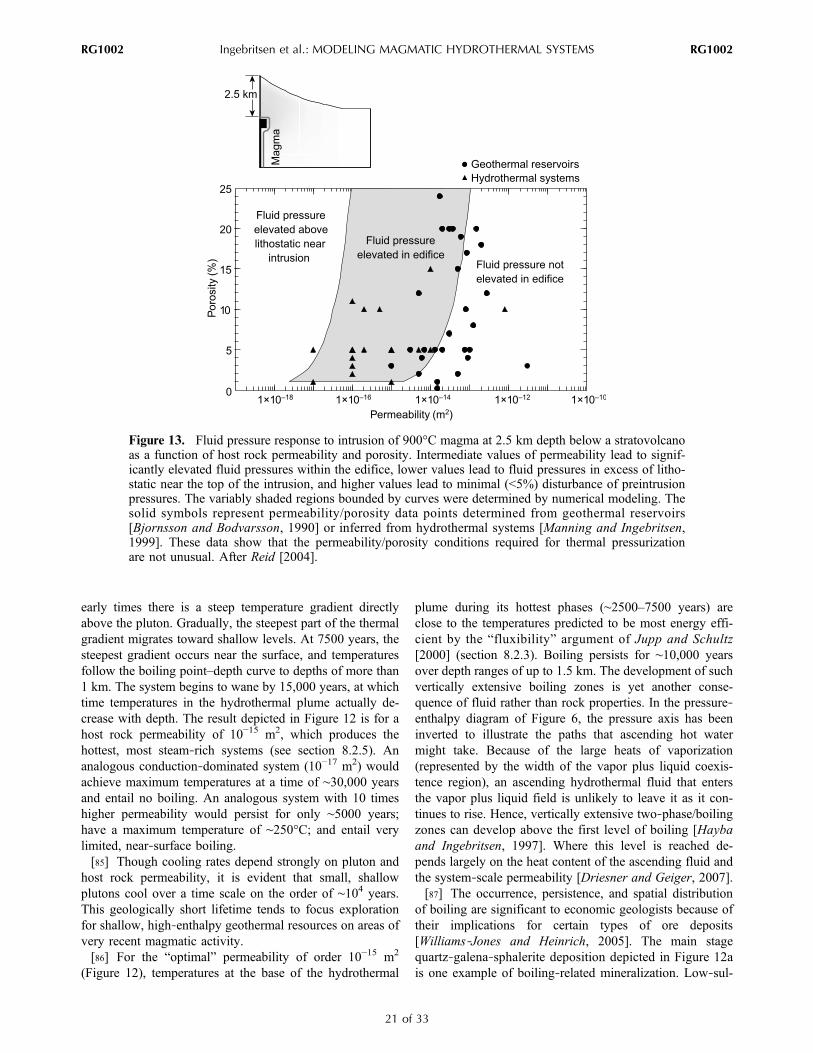
early times there is a steep temperature gradient directlyabove the pluton. Gradually, the steepest part of the thermalgradient migrates toward shallow levels. At 7500 years, thesteepest gradient occurs near the surface, and temperaturesfollow the boiling point–depth curve to depths of more than1 km. The system begins to wane by 15,000 years, at whichtime temperatures in the hydrothermal plume actually de-crease with depth. The result depicted in Figure 12 is for ahost rock permeability of 10−15 m2, which produces thehottest, most steam‐rich systems (see section 8.2.5). Ananalogous conduction‐dominated system (10−17 m2) wouldachieve maximum temperatures at a time of ∼30,000 yearsand entail no boiling. An analogous system with 10 timeshigher permeability would persist for only ∼5000 years;have a maximum temperature of ∼250°C; and entail verylimited, near‐surface boiling.[85] Though cooling rates depend strongly on pluton and
host rock permeability, it is evident that small, shallowplutons cool over a time scale on the order of ∼104 years.This geologically short lifetime tends to focus explorationfor shallow, high‐enthalpy geothermal resources on areas ofvery recent magmatic activity.[86] For the “optimal” permeability of order 10−15 m2
(Figure 12), temperatures at the base of the hydrothermal
plume during its hottest phases (∼2500–7500 years) areclose to the temperatures predicted to be most energy effi-cient by the “fluxibility” argument of Jupp and Schultz[2000] (section 8.2.3). Boiling persists for ∼10,000 yearsover depth ranges of up to 1.5 km. The development of suchvertically extensive boiling zones is yet another conse-quence of fluid rather than rock properties. In the pressure‐enthalpy diagram of Figure 6, the pressure axis has beeninverted to illustrate the paths that ascending hot watermight take. Because of the large heats of vaporization(represented by the width of the vapor plus liquid coexis-tence region), an ascending hydrothermal fluid that entersthe vapor plus liquid field is unlikely to leave it as it con-tinues to rise. Hence, vertically extensive two‐phase/boilingzones can develop above the first level of boiling [Haybaand Ingebritsen, 1997]. Where this level is reached de-pends largely on the heat content of the ascending fluid andthe system‐scale permeability [Driesner and Geiger, 2007].[87] The occurrence, persistence, and spatial distribution
of boiling are significant to economic geologists because oftheir implications for certain types of ore deposits[Williams‐Jones and Heinrich, 2005]. The main stagequartz‐galena‐sphalerite deposition depicted in Figure 12ais one example of boiling‐related mineralization. Low‐sul-
Figure 13. Fluid pressure response to intrusion of 900°C magma at 2.5 km depth below a stratovolcanoas a function of host rock permeability and porosity. Intermediate values of permeability lead to signif-icantly elevated fluid pressures within the edifice, lower values lead to fluid pressures in excess of litho-static near the top of the intrusion, and higher values lead to minimal (<5%) disturbance of preintrusionpressures. The variably shaded regions bounded by curves were determined by numerical modeling. Thesolid symbols represent permeability/porosity data points determined from geothermal reservoirs[Bjornsson and Bodvarsson, 1990] or inferred from hydrothermal systems [Manning and Ingebritsen,1999]. These data show that the permeability/porosity conditions required for thermal pressurizationare not unusual. After Reid [2004].
Ingebritsen et al.: MODELING MAGMATIC HYDROTHERMAL SYSTEMS RG1002RG1002
21 of 33

fidation epithermal gold is another example. In epithermalsystems, gold may be transported as bisulfide complexes inthe liquid phase and precipitate where the liquid starts toboil because the boiling partitions H2S into the vapor phaseand leads to decomplexation [e.g., Hedenquist and Henley,1985].8.2.7. Hydrothermally Driven Deformation[88] Numerical modeling studies of the coupling between
high‐temperature, multiphase fluid flow and deformationwere pioneered by Bonafede [1991] but are still in theirinfancy. The few modeling studies performed to date areintriguing because they suggest that the rates and patterns ofground surface deformation (GSD) measured in some largecalderas could be induced by poroelastic transients in thehydrothermal system [Todesco et al., 2004; Hurwitz et al.,2007; Hutnak et al., 2009; Todesco, 2009]. Traditionally,interpretations of GSD invoke volume change of a discretesource (often assumed to be a magma chamber) with a speci-fied geometry in a homogeneous, isotropic, and elastic [e.g.,Mogi, 1958;Fialko et al., 2001] or viscoelastic [Newman et al.,2001] half‐space. The calculated depth, shape, and volumechange of the source in these models are derived from inver-sion of the measured GSD. However, these traditional modelscannot readily explain episodes of subsidence or the spatialand temporal variability revealed bymodern geodetic methods[e.g., Dzurisin, 2007]. Todesco et al. [2004] simulated multi-phase, multicomponent (H2O‐CO2) fluid flow to explainrecent deformation in the Campi Flegrei (Italy) caldera.Hurwitz et al. [2007] simulated a single‐component (H2O)fluid to assess the range of conditions under which poro-elastically induced deformation might occur. Most recently,Hutnak et al. [2009] explored the effects of a multiphase
(liquid‐gas), multicomponent (H2O‐CO2) hydrothermal fluidand found that the addition of noncondensible gas enhanceddeformation relative to pure water systems (Figure 14). Suchstudies typically invoke a “one‐way” coupling between fluidflow and heat transport and poroelastic deformation. That is,the strains determined by equations analogous to equation (7)are not fed back into equations such as equations (4) and (5)so that the stress dependence of permeability and othermaterial properties is not considered.
9. SUGGESTIONS FOR FUTURE WORK
[89] In the past 2 decades, and particularly the past fewyears, significant advances have been made in developmentand application of numerical models to simulate magmahydrothermal systems. Faster computers, sophisticated soft-ware, and improved observational and experimental dataenable more rigorous modeling studies that can reduce manyof the assumptions discussed in this review. Continuedprogress will require the following.
9.1. Accurate Fluid Equation‐of‐State Formulations[90] In light of the immense influence of EOS descriptions
on system behavior (see sections 8.2.2–8.2.4), additionalwork is needed to develop and incorporate usable EOSformulations for multicomponent systems, particularly thecomplete H2O‐NaCl‐CO2 system. The availability of docu-mented, open source multiphase simulators (Table 1) haseliminated the need for ad hoc approximations of multiphasebehavior, and the use of best available EOS formulationsshould become standard in this era of widespread access toadequate computational resources.
Figure 14. Cross section of a simulated caldera at a time of 20,000 years for host rock permeabilityof 10−15 m2, showing contours of vapor saturation (%) resulting from basal injection of (a) single‐component fluid (21 kt/d H2O) and (b) multicomponent fluid (20 kt/d H2O and 1 kt/d CO2) at 350°C.Vertical deformation ranges up to ∼12 m at the center of the model (a radial distance of 0); note the breakin vertical scale at 0 m elevation. The multicomponent simulation has a much larger region of multiphaseflow. Vapor formation reduces relative permeability, impeding vertical aqueous fluid flow (F), increasingpressure gradients (P), and deflecting warm fluids radially outward. The magnitude of vertical deforma-tion and the radial extent of deformation are slightly larger in the multicomponent system (by 10% and15%, respectively). From Hutnak et al. [2009].
Ingebritsen et al.: MODELING MAGMATIC HYDROTHERMAL SYSTEMS RG1002RG1002
22 of 33
9.2. More Realistic Treatment of MaterialHeterogeneity in Space and Time[91] There is clear field and laboratory evidence for ex-
treme heterogeneity and dynamic variation in permeabilityin hydrothermal systems. Attempts to represent this vari-ability in numerical models are limited. More sophisticatedrepresentations of heterogeneity at the fault zone [Lopez andSmith, 1995] or system‐wide [Matthäi et al., 2004] scalesgenerally do not involve high‐temperature, multiphase,multicomponent flow. Attempts to represent dynamic var-iations in permeability in a hydrothermal context have beenad hoc rather than physically rigorous [e.g., Rojstaczer etal., 2008]. Realistic representations of heterogeneity couldalso benefit from the calculation of effective permeabilitiesand multiphase properties (e.g., relative permeabilities). So‐called “upscaling” is a standard procedure in reservoir en-gineering, helping to capture the essential heterogeneity of ageological model while reducing the number of grid pointsin the numerical model, ultimately reducing computing time[e.g., Christie, 2001].
9.3. Improved Description of Relative Permeabilityand Capillary Pressure Effects[92] We have noted that the choice of relative perme-
ability functions (section 6.5 and Figure 4) can have a largeinfluence on the results of numerical simulations, particu-larly if the simulations involve highly transient behavior[e.g., Ingebritsen and Rojstaczer, 1996]. The role of capil-lary pressure effects may be equally important but is gen-erally neglected (section 6.6). It requires a leap of faith toextrapolate relative permeability and capillary pressure re-lations determined from lab‐scale experiments to REV‐scalebehavior in numerical models. We suggest renewed effortsto estimate field‐scale relative permeability and capillarypressure behavior from observations in producing geother-mal fields [e.g., Sorey et al., 1980]. Such efforts shouldinclude mapping of subsurface fluid saturations in activehydrothermal systems using state‐of‐the‐art geophysicalimaging techniques [Finizola et al., 2006; Revil et al.,2008]. Pore network modeling techniques, which are rou-tinely used to obtain consistent relative permeability andcapillary pressure curves for oil‐gas‐water systems [e.g.,Blunt, 2001], could complement such studies. In addition topotentially elucidating magmatic hydrothermal phenomena,research in this area is highly pertinent to practical geo-thermal reservoir engineering issues.
9.4. Focus on “Process‐Based” SimulationsConditioned on Field Data[93] Laboratory experimentation relevant to hydrothermal
systems peaked in the 1980s and 1990s and has decreasedsubstantially in the past decade, as has deep drilling inmagmatic provinces. Given the current level of data avail-ability, “system‐based” numerical modeling studies arelikely to yield nonunique results and may be of limitedpredictive ability, with the important exception of focusedreservoir engineering applications constrained by boreholedata from producing geothermal fields. In the broader con-
text of magmatic hydrothermal systems, most system‐specific models will remain overparameterized (under-constrained). Research studies that attempt to characterizespecific systems should include sensitivity analyses in orderto explore the full range of conditions that can explain ob-served phenomena. Formal sensitivity analysis can helpidentify the appropriate degree of generality for system‐specific modeling and will typically reveal, for instance, thatonly one to two values of system permeability can belegitimately constrained [e.g., Deming, 1993]. More geo-metrically complex and heterogeneous models can be usefulfor heuristic purposes but are generally nonunique. Giventhe paucity of data from most individual systems, it can beuseful to aggregate data from several systems in order toexplore and constrain process behavior [e.g., Lewis andLowell, 2009b].
9.5. Continued Attention to Numerical Accuracy[94] Recent simulations with high‐resolution discretiza-
tion techniques [Oldenburg and Pruess, 2000; Geiger et al.,2006a] have revealed hidden dynamic behavior that is “real”(i.e., nonnumerical), such as hydrothermal plume splittingand fluctuations in vent temperature [Coumou et al., 2006].Fine spatial discretization and second‐order accurate trans-port descriptions seem indicated for problems involvinghighly transient and/or heterogeneous systems.
9.6. Continued Improvement of Solvers and Useof Parallel Processing Methods[95] Multiphase simulations with refined spatial dis-
cretization require substantial computational power, partic-ularly when phase changes are widespread and frequent orwhen reactive transport is considered. Simulations of evensimple geometries can still require days of computationaltime. Thus, methods to reduce run time are required. Par-allelization is attractive because fast, multiprocessor clustershave become more available. Such capability was recentlyadded to the TOUGH2 [Wu et al., 2002; Zhang et al., 2008]and CSMP++ codes [Coumou et al., 2008c; Geiger et al.,2009]. Additional significant gains can be realized by im-proving solver efficiency. Because the computing time ofalgebraic multigrid solvers scales linearly with the numberof unknowns [Stüben, 2001] and because the system Ax = bis computed hundreds to thousands of times during a typicalsimulations, these solvers are key to simulating multiphaseand multicomponent fluid flow in more complex two‐ andthree‐dimensional geologic structures. Another advantage ofalgebraic multigrid solvers is that they do not need any in-formation on the geometry of the domain, which is useful inlight of the structural complexity of magmatic hydrothermalsystems. Parallelization and algebraic multigrid approachescan be linked to make best use of both methods [Coumou etal., 2008c; Geiger et al., 2009].
9.7. Benchmarking and Intercode Comparisons[96] It is not possible to fully test multiphase, multicom-
ponent simulators against analytical solutions or empiricalresults. Analytical solutions are limited, and experimentaldata have to be developed for each specific application [e.g.,
Ingebritsen et al.: MODELING MAGMATIC HYDROTHERMAL SYSTEMS RG1002RG1002
23 of 33
Woods, 1999; Bergins et al., 2005; Benard et al., 2005].Thus, systematic intercomparison of independently devel-oped simulators can be an important way of building con-fidence in their performance. An ensemble of state‐of‐the‐artcodes should be exercised on a common problem set. Suchintercode comparison projects have been conducted in manyother subsurface modeling areas and have led to significantimprovements. Previous efforts include the U.S. Departmentof Energy–Stanford code comparison project [StanfordGeothermal Program, 1980], which exercised the first gen-eration of multiphase geothermal simulators; the HydrologicCode Intercomparison (HYDROCOIN) [Larsson, 1992],Development of Coupled Models and Their ValidationAgainst Experiments (DECOVALEX, http://www.decovalex.com), and Benchmark Tests and Guidance on CoupledProcesses for Performance Assessment of Nuclear WasteRepositories (BENCHPAR) [Stephansson and Min, 2004]projects, which focused on modeling coupled flow andtransport processes; and, most recently, comparisons of sub-surface CO2 storage simulators [Pruess et al., 2004;Ebigbo etal., 2007].
10. CONCLUDING STATEMENT
[97] We expect that numerical modeling exercises incoming years will continue to increase our conceptual un-derstanding of basic processes in magma hydrothermalsystems and, in turn, provide guidance for expensive ex-ploration efforts. Fundamental questions remain to be ad-dressed by the next generation of numerical models: Forinstance, how is 25% of the Earth’s heat crust transmittedfrom cooling magma to overlying hydrothermal systems atthe MOR? What is the expected near‐surface hydro-geochemical expression of magmatic unrest at severalkilometers depth? How does hydrothermal circulationtransport microbes, their food, and their respiration productswithin the subsurface biosphere? What is the nature of hy-drothermal circulation on extraterrestrial bodies such asMars? Credible efforts to attack such problems requirecontinued improvements in our ability to simulate coupledhydrothermal flow and deformation and reactive transport inmultiphase systems and, particularly in the case of extra-terrestrial systems, formal consideration of the third waterphase, ice.
NOTATION
c specific heat capacity (usually isobaric heatcapacity) (E M−1 T−1).
cb bulk compressibility (L t2 M−1).cs bulk compressibility of nonporous solids
(L t2 M−1).C aqueous concentration (M L−3).D hydrodynamic dispersion (L2 t−1).F fluxibility (M L−3 t−1).g gravitational acceleration (L t−2).G shear modulus, E/2(1 − n) (M L−1 t−2).h specific enthalpy (E M−1).H enthalpy (E).
k intrinsic permeability (L2).kr relative permeability (dimensionless).K hydraulic conductivity (L t−1).
Km medium thermal conductivity (E t−1 L−1 T−1).L characteristic length or distance (L).P pressure (M L−1 t−2).q volumetric flow rate per unit area (volume
flux, specific discharge, or Darcy velocity)(L t−1).
qh conductive heat flux per unit area (E L−2 t−1).R general source/sink term for mass (with
subscript m), heat (subscript h), or chemicalreactions.
S volumetric saturation (L3 L−3, dimensionless).t time (t).T temperature (T).u displacement vector (L).u average linear velocity (seepage velocity)
(L t−1).X mass fraction H2O, NaCl, or CO2 in an H2O‐
NaCl‐CO2 mixture (dimensionless).z elevation above a datum, vertical Cartesian
coordinate, or depth (L).a effective stress coefficient, 1 (cs/cb) (dimen-
sionless).aT porous medium linear thermal expansivity
(T−1).g chemical expansivity (dimensionless).� porosity (L3 L−3, dimensionless).m dynamic viscosity (M L−1 t−1).v Poisson’s ratio (dimensionless).r density (M L−3).
(̂ ) increase or decrease in a quantity.(_) a nondimensionalized quantity.
Subscripts
Unless otherwise locally redefined, subscriptshave the following meanings:
f fluid mixture in place (either a single phaseor a two‐phase mixture).
l liquid.m porous medium.r rock.v vapor (steam).0 an initial state.
[98] ACKNOWLEDGMENTS. We thank Barbara Dutrow,Hedeff Essaid, Andy Fisher, Mark Reid, Philipp Weis, an anony-mous reviewer, and Editor Michael Manga for their careful reviewsof earlier versions of this manuscript, which greatly improved thefinal product. S. Geiger thanks the Edinburgh Collaborative ofSubsurface Science and Engineering, a joint research institute ofthe Edinburgh Research Partnership in Engineering and Mathemat-ics, for financial support. This study was also partly supported bythe U. S. Geological Survey Volcano Hazards Program.[99] The Editor responsible for this paper was Michael Manga.
He thanks Barbara Dutrow, Andrew Fisher, and an additionalanonymous technical reviewer.
Ingebritsen et al.: MODELING MAGMATIC HYDROTHERMAL SYSTEMS RG1002RG1002
24 of 33
REFERENCES
Aavatsmark, I. I. (2002), An introduction to multipoint flux ap-proximations for quadrilateral grids, Computat. Geosci., 6,405–432, doi:10.1023/A:1021291114475.
Alt‐Epping, P., and L. Smith (2001), Computing geochemicalmass transfer and water/rock ratios in submarine hydrothermalsystems: Implications for estimating the vigour of convection,Geofluids, 1, 163–181, doi:10.1046/j.1468-8123.2001.00014.x.
Anderko, A., and K. S. Pitzer (1993), Phase equilibria and volu-metric properties of the systems KCl‐H2O and NaCl‐KCl‐H2Oabove 573 K: Equation of state representation, Geochim. Cosmo-chim. Acta, 57, 4885–4897.
Anovitz, L. M., T. C. Labotka, J. G. Blencoe, and J. Horita (2004),Experimental determination of the activity‐composition relationsand phase equilibria of H2O‐CO2‐NaCl fluids at 500°C, 500bars, Geochim. Cosmochim. Acta, 68, 3557–3567.
Archer, D. G. (1992), Thermodynamic properties of the NaCl +H2O system. II. Thermodynamic properties of NaCl (aq),NaCl.2H2O (cr), and phase equilibria, J. Phys. Chem. Ref. Data,21, 793–829.
Bai, W., W. Xu, and R. P. Lowell (2003), The dynamics of subma-rine geothermal heat pipes, Geophys. Res. Lett., 30(3), 1108,doi:10.1029/2002GL016176.
Baker, E. T., G. J. Massoth, and R. A. Feely (1987), Cataclysmichydrothermal venting on the Juan de Fuca Ridge, Nature, 329,149–151, doi:10.1038/329149a0.
Baker, E. T., J. W. Lavelle, R. A. Feely, G. J. Massoth, S. L.Walker,and J. E. Lupton (1989), Episodic venting of hydrothermal fluidsfrom the Juan de Fuca Ridge, J. Geophys. Res., 94(9), 9237–9250.
Baliga, B. R., and S. V. Patankar (1980), A new finite‐elementformulation for convection‐diffusion problems, Numer. HeatTransfer, 3, 393–409, doi:10.1080/01495728008961767.
Baross, J. A., and J. W. Deming (1983), Growth of ‘black smoker’bacteria at temperatures of at least 250°C, Nature, 303, 423–426,doi:10.1038/303423a0.
Battistelli, A., C. Calore, and K. Pruess (1997), The simulatorTOUGH2/EWASG for modeling geothermal reservoirs withbrines and non‐condensible gas, Geothermics, 26, 437–464,doi:10.1016/S0375-6505(97)00007-2.
Bear, J. (1972), Dynamics of Fluids in Porous Media, Elsevier,New York.
Bear, J. (1979), Hydraulics of Groundwater, McGraw‐Hill, NewYork.
Benard, J., R. Eymard, X. Nicolas, and C. Chavant (2005), Boilingin porous media: Model and simulations, Transp. Porous Media,60, 1–31, doi:10.1007/s11242-004-2594-9.
Bergins, C., S. Crone, and K. Strauss (2005), Multiphase flow inporous media with phase change. Part II: Analytical solutionsand experimental verification for constant pressure steam injec-tion, Transp. Porous Media, 60, 275–300, doi:10.1007/s11242-004-5740-5.
Berkowitz, B. (2002), Characterizing flow and transport in frac-tured geological media: A review, Adv. Water Resour., 25,861–884, doi:10.1016/S0309-1708(02)00042-8.
Bethke, C. M. (1994), The question of uniqueness in geochemicalmodeling, Geochim. Cosmochim. Acta, 56, 4315–4320.
Bickle, M. J., and D. McKenzie (1987), The transport of heat andmatter by fluids during metamorphism, Contrib. Mineral. Pet-rol., 95, 384–392, doi:10.1007/BF00371852.
Birch, M. U. (1989), Groundwater flow systems and thermalregimes near cooling igneous plutons: Influence of surfacetopography, M.S. thesis, Utah State Univ., Logan.
Bischoff, J. L., and R. J. Rosenbauer (1988), Liquid‐vapor rela-tions in the critical region of the system NaCl‐H2O from 380to 415°C: A refined determination of the critical point andtwo‐phase boundary of seawater, Geochim. Cosmochim. Acta,52(2), 2121–2126.
Bischoff, J. L., and R. J. Rosenbauer (1996), The alteration of rhy-olite in CO2 charged water at 200 and 350°C: The unreactivity ofCO2 at higher temperature, Geochim. Cosmochim. Acta, 60,3859–3867.
Bischoff, J. L., R. J. Rosenbauer, and R. O. Fournier (1996), Thegeneration of HCl in the system CaCl2‐H2O: Vapor‐liquid rela-tions from 380–500°C, Geochim. Cosmochim. Acta, 60, 7–16,doi:10.1016/0016-7037(95)00365-7.
Bjornsson, G., and G. Bodvarsson (1990), A survey of geothermalreservoir properties, Geothermics, 19, 17–27, doi:10.1016/0375-6505(90)90063-H.
Blencoe, J. G. (2004), The CO2‐H2O system, IV. Empirical, iso-thermal equations for representing vapor‐liquid equilibria at110–350°C, P < 150 MPa, Am. Mineral., 89, 1447–1455.
Blunt, M. J. (2001), Flow in porous media—Pore‐network modelsand multiphase flow, Curr. Opin. Colloid Interface Sci., 6, 197–207, doi:10.1016/S1359-0294(01)00084-X.
Bodvarsson, G. (1982), Terrestrial energy currents and transfer inIceland, in Continental and Oceanic Rifts, Geodyn. Ser., vol. 8,edited by G. Palmason, pp. 271–282, AGU, Washington, D. C.
Bonafede, M. (1991), Hot fluid migration: An efficient source ofground deformation: Application to the 1982–1985 crisis atCampi Flegrei‐Italy, J. Volcanol. Geotherm. Res., 48, 187–198,doi:10.1016/0377-0273(91)90042-X.
Bower, K. M., and G. Zyvoloski (1997), A numerical model forthermo‐hydro‐mechanical coupling in fractured rock, Int. J. RockMech. Min. Sci., 34, 1,201–1,211.
Bowers, T. S., and H. C. Helgeson (1983), Calculation of the ther-modynamic and geochemical consequences of nonideal mixingin the system H2O‐CO2‐NaCl on phase relations in geologicsystems: Equation of state for H2O‐CO2‐NaCl fluids at highpressures and temperatures, Geochim. Cosmochim. Acta, 47,1247–1275.
Brace, W. F. (1980), Permeability of crystalline and argillaceousrocks, Int. J. Mech. Min. Sci. Geomech. Abstr., 17, 241–251,doi:10.1016/0148-9062(80)90807-4.
Brace, W. F. (1984), Permeability of crystalline rocks: New in situmeasurements, J. Geophys. Res., 89, 4327–4330.
Brown, P. E., and W. M. Lamb (1989), P‐V‐T properties of fluidsin the system H2O + CO2 + NaCl: New graphical presentationsand implications for fluid inclusion studies,Geochim. Cosmochim.Acta, 53, 1209–1221.
Carter, N. L., and M. C. Tsenn (1987), Flow properties of conti-nental lithosphere, Tectonophysics, 136, 27–63, doi:10.1016/0040-1951(87)90333-7.
Cathles, L. M. (1977), An analysis of the cooling of intrusives byground‐water convection which includes boiling, Econ. Geol.,72, 804–826, doi:10.2113/gsecongeo.72.5.804.
Cherkaoui, A. S. M., and W. S. D. Wilcock (1999), Characteristicsof high Rayleigh number two‐dimensional convection in anopen‐top porous layer heated from below, J. Fluid Mech., 394,241–260, doi:10.1017/S0022112099005716.
Cherkaoui, A. S. M., and W. S. D. Wilcock (2001), Laboratorystudies of high Rayleigh number circulation in an open‐topHele‐Shaw cell: An analog to mid‐ocean ridge hydrothermal sys-tems, J. Geophys. Res., 106, 10,983–11,000, doi:10.1029/2000JB900470.
Chiodini, G., A. Baldini, F. Barberi, M. L. Carapezza, C. Cardellini,F. Frondini, D. Granieri, and M. Ranaldi (2007), Carbon dioxidedegassing at Latera caldera (Italy): Evidence of geothermal reser-voir and evaluation of its potential energy, J. Geophys. Res., 112,B12204, doi:10.1029/2006JB004896.
Christie, M. A. (2001), Flow in porous media—Scale up of multi-phase flow, Curr. Opin. Colloid Interface Sci., 6, 236–241,doi:10.1016/S1359-0294(01)00087-5.
Clauser, C. (1988), Opacity—The concept of radiative thermalconductivity, in Handbook of Terrestrial Heat‐Flow Density De-terminations, edited by R. Haenel, L. Rybach, and L. Stegena,pp. 143–165, Kluwer Acad., Dordrecht, Netherlands.
Ingebritsen et al.: MODELING MAGMATIC HYDROTHERMAL SYSTEMS RG1002RG1002
25 of 33

Cline, J. S., R. J. Bodnar, and J. D. Rimstidt (1992), Numericalsimulation of fluid flow and silica transport and deposition inboiling hydrothermal solutions: Application to epithermal golddeposits, J. Geophys. Res., 97, 9085–9103.
Corey, A. T. (1957), Measurement of water and air permeabilitiesin unsaturated soil, Soil Sci. Soc. Am. Proc., 21, 7–10.
Coumou, D. (2008), Numerical simulation of fluid flow in mid‐ocean ridge hydrothermal systems, Ph.D. thesis, ETH Zurich,Zurich, Switzerland.
Coumou, D., T. Driesner, S. Geiger, C. A. Heinrich, and S. Matthäi(2006), The dynamics of mid‐ocean ridge hydrothermal systems:Splitting plumes and fluctuating vent temperatures, Earth Planet.Sci. Lett., 245, 218–235, doi:10.1016/j.epsl.2006.02.044.
Coumou, D., T. Driesner, and C. A. Heinrich (2008a), Heat trans-port at boiling, near‐critical conditions, Geofluids, 8, 208–215,doi:10.1111/j.1468-8123.2008.00218.x.
Coumou, D., T. Driesner, and C. A. Heinrich (2008b), The struc-ture and dynamics of mid‐ocean ridge hydrothermal systems,Science, 321, 1825–1828.
Coumou, D., S. Matthäi, S. Geiger, and T. Driesner (2008c), Aparallel FE‐FV scheme to solve fluid flow in complex geologicmedia, Comput. Geosci., 34, 1697–1707.
Coumou, D., P. Weiss, T. Driesner, and C. A. Heinrich (2009),Phase separation, brine formation, and salinity variation at BlackSmoker hydrothermal systems, J. Geophys. Res., 114, B03212,doi:10.1029/2008JB005764.
Cox, S. F., M. A. Knackstedt, and J. Braun (2001), Principles ofstructural control on permeability and fluid flow in hydrothermalsystems, Rev. Econ. Geol., 14, 1–24.
Croucher, A. E., and M. J. O’Sullivan (2008), Application of thecomputer code TOUGH2 to the simulation of supercritical con-ditions in geothermal systems, Geothermics, 37, 622–634,doi:10.1016/j.geothermics.2008.03.005.
Curewitz, D., and J. A. Karson (1997), Structural settings of hydro-thermal outflow: Fracture permeability maintained by faultpropagation and interaction, J. Volcanol. Geotherm. Res., 79,149–168, doi:10.1016/S0377-0273(97)00027-9.
Dalen, V. (1979), Simplified finite‐element methods for reservoirflow problems, Soc. Pet. Eng. J., 19, 333–343, doi:10.2118/7196-PA.
de Josselin de Jong, G. (1969), Generating functions in the theoryof flow through porous media, in Flow Through Porous Media,edited by R. J. M. De Wiest, pp. 377–400, Academic, San Diego,Calif.
Delaney, P. T. (1982), Rapid intrusion of magma into hot rock:Groundwater flow due to pore pressure increases, J. Geophys.Res., 87, 7739–7756.
Deming, D. (1993), Regional permeability estimates from investi-gations of coupled heat and groundwater flow, North Slopeof Alaska, J. Geophys. Res., 98, 16,271–16,286, doi:10.1029/93JB01427.
Diamond, L. W. (2001), Review of the systematics of CO2‐H2Ofluid inclusions, Lithos, 55, 69–99, doi:10.1016/S0024-4937(00)00039-6.
Dobson, P. F., S. Salah, N. Spycher, and E. L. Sonnenthal (2004),Simulation of water‐rock interaction in the Yellowstone geother-mal system using TOUGHREACT, Geothermics, 33, 493–502,doi:10.1016/j.geothermics.2003.10.002.
Doi, N., O. Kato, K. Ikeuchi, R. Komatsu, S.‐I. Miyazaki, K. Akaku,and T. Uchida (1998), Genesis of the plutonic‐hydrothermal sys-tem around Quaternary granite in the Kakkonda geothermal sys-tem, Japan, Geothermics, 27, 663–690, doi:10.1016/S0375-6505(98)00039-X.
Donaldson, I. (1962), Temperature gradients in the upper layers ofthe Earth’s crust due to convective water flows, J. Geophys. Res.,67, 3449–3459.
Driesner, T. (2007), The system H2O‐NaCl. Part II: Correlationsfor molar volume, enthalpy, and isobaric heat capacity from 0 to
1000°C, 1 to 5000 bar, and 0 to 1 XNaCl, Geochim. Cosmochim.Acta, 71(4), 4902–4919.
Driesner, T., and S. Geiger (2007), Numerical simulation of multi-phase fluid flow in hydrothermal systems, in Fluid‐Fluid Interac-tions in the Earth’s Lithosphere, Rev. in Mineral. and Geochem.,vol. 65, edited by A. Liebscher and C. A. Heinrich, pp. 187–212,Mineral. Soc. of Am., Washington, D. C.
Driesner, T., and C. A. Heinrich (2007), The system H2O‐NaCl.Part I: Correlation formulae for phase relations in temperature‐pressure‐composition space from 0 to 1000°C, 0 to 5000 bar,and 0 to 1 XNaCl, Geochim. Cosmochim. Acta, 71(4), 4880–4901.
Duan, Z., and D. Li (2008), Coupled phase and aqueous speciesequilibrium of the H2O‐CO2‐NaCl‐CaCO3 system from 0 to250°C, 1 to 1000 bar with NaCl concentrations up to saturationof halite, Geochim. Cosmochim. Acta, 72, 5128–5145.
Duan, Z., N. Møller, and J. H. Weare (1995), Equation of statefor the NaCl‐H2O‐CO2 system: Prediction of phase equilibriaand volumetric properties, Geochim. Cosmochim. Acta, 59,2869–2882.
Duffield, W. A., and J. H. Sass (2004), Geothermal energy—Cleanpower from the Earth’s heat, U.S. Geol. Surv. Circ., 1249.
Dunn, J. C., and H. C. Hardee (1981), Superconvecting geothermalzones, J. Volcanol. Geotherm. Res., 11, 189–201, doi:10.1016/0377-0273(81)90022-6.
Durlofsky, L. J. (1993), A triangle based mixed finite element–finite volume technique for modeling two phase flow throughporous media, J. Comput. Phys., 105, 252–266, doi:10.1006/jcph.1993.1072.
Dutrow, B., and D. Norton (1995), Evolution of fluid pressureand fracture propagation during contact metamorphism,J. Metamorph. Geol., 13, 677–686, doi:10.1111/j.1525-1314.1995.tb00251.x.
Dutrow, B. L., B. J. Travis, C. W. Gable, and D. J. Henry (2001),Coupled heat and silica transport associated with dike intrusioninto sedimentary rock: Effects on isotherm location and perme-ability evolution, Geochim. Cosmochim. Acta, 65, 3749–3767.
Dzurisin, D. (2007), Volcano Deformation, Springer, London.Ebigbo, A., H. Class, and R. Helmig (2007), CO2 leakage throughan abandoned well: Problem oriented benchmarks, Comput.Geosci., 11, 103–115, doi:10.1007/s10596-006-9033-7.
Elder, J. W. (1967a), Steady free convection in a porous mediumheated from below, J. Fluid Mech., 27, 29–84, doi:10.1017/S0022112067000023.
Elder, J. W. (1967b), Transient convection in a porous medium,J. Fluid Mech., 27, 609–623, doi:10.1017/S0022112067000576.
Elderfield, H., and A. Schultz (1996), Mid‐ocean ridge hydrother-mal fluxes and the chemical composition of the ocean, Annu.Rev. Earth Planet. Sci., 24, 191–224, doi:10.1146/annurev.earth.24.1.191.
Emmanuel, S., and B. Berkowitz (2006), An experimentalanalogue for convection and phase separation in hydrothermalsystems, J. Geophys. Res. , 111 , B09103, doi:10.1029/2006JB004351.
Emmanuel, S., and B. Berkowitz (2007), Phase separation and con-vection in heterogeneous porous media: Implications for seafloorhydrothermal systems, J. Geophys. Res., 112, B05210,doi:10.1029/2006JB004804.
Evans, D. G., and J. P. Raffensperger (1992), On the stream func-tion for variable‐density groundwater flow, Water Resour. Res.,28(2), 141–142, 145.
Farrar, C. D., M. L. Sorey, W. C. Evans, J. F. Howle, B. D. Kerr,B. M. Kennedy, C.‐Y. King, and J. R. Southon (1995), Forest‐killing diffuse CO2 emission at Mammoth Mountain as a signof magmatic unrest, Nature, 376, 675–678, doi:10.1038/376675a0.
Faust, C. R., and J. W. Mercer (1979a), Geothermal reservoir sim-ulation: 1. Mathematical models for liquid‐ and vapor‐dominatedhydrothermal systems, Water Resour. Res. , 15 , 23–30,doi:10.1029/WR015i001p00023.
Ingebritsen et al.: MODELING MAGMATIC HYDROTHERMAL SYSTEMS RG1002RG1002
26 of 33
Faust, C. R., and J. W. Mercer (1979b), Geothermal reservoirsimulation: 2. Numerical solution techniques for liquid‐ andvapor‐dominated hydrothermal systems, Water Resour. Res.,15, 31–46, doi:10.1029/WR015i001p00031.
Fehn, U., and L. M. Cathles (1979), Hydrothermal convection atslow‐spreading mid‐ocean ridges, Tectonophysics, 55, 239–260, doi:10.1016/0040-1951(79)90343-3.
Fehn, U., and L. M. Cathles (1986), The influence of plate move-ment on the evolution of hydrothermal convection cells in theoceanic crust, Tectonophysics, 125, 289–312, doi:10.1016/0040-1951(86)90167-8.
Fehn, U., K. E. Green, R. P. Von Herzen, and L. M. Cathles(1983), Numerical models for the hydrothermal field at the Gala-pagos Spreading Center, J. Geophys. Res., 88, 1033–1048.
Fialko, Y., Y. Khazan, and M. Simons (2001), Deformation due toa pressurized horizontal circular crack in an elastic half‐space,with applications to volcano geodesy, Geophys. J. Int., 146,181–190, doi:10.1046/j.1365-246X.2001.00452.x.
Finizola, A., A. Revil, E. Rizzo, S. Piscitelli, T. Ricci, J. Morin, B.Angeletti, L. Mocochain, and F. Sortino (2006), Hydrogeologicalinsights at Stromboli volcano (Italy) from geoelectrical, temper-ature, and CO2 soil degassing investigations, Geophys. Res. Lett.,33, L17304, doi:10.1029/2006GL026842.
Fisher, A. T. (1998), Permeability within basaltic oceanic crust,Rev. Geophys., 36, 143–182, doi:10.1029/97RG02916.
Fisher, A. T., E. E. Davis, and K. Becker (2008), Borehole‐to‐borehole hydrologic response across 2.4 km in the upper oceaniccrust: Implications for crustal‐scale properties, J. Geophys. Res.,113, B07106, doi:10.1029/2007JB005447.
Fontaine, F. J., M. Rabinowicz, and J. Boulegue (2001), Perme-ability changes due to mineral diagenesis in fractured crust:Implications for hydrothermal circulation at mid‐ocean ridges,Earth Planet. Sci. Lett., 184, 407–425, doi:10.1016/S0012-821X(00)00332-0.
Fontaine, F. J., W. S. D. Wilcock, and D. A. Butterfield (2007),Physical controls on the salinity of mid‐ocean ridge hydrother-mal vents, Earth Planet. Sci. Lett., 257, 132–145, doi:10.1016/j.epsl.2007.02.027.
Fontaine, F. J., M. Cannat, and J. Escartin (2008), Hydrothermalcirculation at slow‐spreading mid‐ocean ridges: The role ofalong‐axis variations in axial lithospheric thickness, Geology,36, 759–762, doi:10.1130/G24885A.1.
Fontaine, F. J., W. S. D. Wilcock, D. E. Foustoukos, and D. A.Butterfield (2009), A Si‐Cl geothermobarometer for the reactionzone of high‐temperature, basaltic‐hosted mid‐ocean ridgehydrothermal systems, Geochem. Geophys. Geosyst., 10, Q05009,doi:10.1029/2009GC002407.
Fornari, D. J., T. Shank, K. L. Von Damm, T. K. P. Gregg,M. Lilley, G. Levai, A. Bray, R. M. Haymon, M. R. Perfit,and R. Lutz (1998), Time‐series temperature measurements athigh‐temperature hydrothermal vents, East Pacific Rise 9°49′–51°N: Evidence for monitoring a crustal cracking event, EarthPlanet. Sci. Lett., 160, 419–431, doi:10.1016/S0012-821X(98)00101-0.
Forsyth, P. A. (1991), A control volume finite element approach toNAPL groundwater contamination, SIAM J. Sci. Stat. Comput.,12, 1029–1057.
Fournier, R. O. (1990), Double‐diffusive convection in geothermalsystems: The Salton Sea, California, geothermal system as a like-ly candidate, Geothermics, 19, 481–496, doi:10.1016/0375-6505(90)90001-R.
Fournier, R. O. (1991), The transition from hydrostatic to greaterthan hydrostatic fluid pressure in presently active continental hy-drothermal systems in crystalline rock, Geophys. Res. Lett., 18,955–958, doi:10.1029/91GL00966.
Fournier, R. O. (1999), Hydrothermal processes related to move-ment of fluid from plastic into brittle rock in the magmatic‐epithermal environment, Econ. Geol., 94, 1193–1211.
Fournier, R. O., and R. W. Potter II (1982), An equation corre-lating the solubility of quartz in water from 25° to 900°C atpressures up to 10000 bars, Geochim. Cosmochim. Acta, 46,1969–1973, doi:10.1016/0016-7037(82)90135-1.
Foustoukos, D. I., and W. E. Seyfried Jr. (2007), Fluid phaseseparation processes in submarine hydrothermal systems, Rev.Mineral. Geochem., 65, 213–239, doi:10.2138/rmg.2007.65.7.
Fridleifsson, G. O., and W. A. Elders (2005), The IcelandicDeep Drilling Project: A search for deep unconventional geo-thermal resources, Geothermics, 34, 269–285, doi:10.1016/j.geothermics.2004.11.004.
Fujimitsu, Y., S. Ehara, R. Oki, and R. Kanou (2008), Numericalmodel of the hydrothermal system beneath Unzen volcano,Japan, J. Volcanol. Geotherm. Res., 175, 35–44, doi:10.1016/j.jvolgeores.2008.03.032.
Furlong, K. P., R. B. Hanson, and J. R. Bowers (1991), Modelingthermal regimes. in Contact Metamorphism, Rev. in Mineral.,vol. 26, edited by D. M. Kerrick, pp. 437–505, Mineral. Soc.of Am., Washington, D. C.
Geiger, S., R. Haggerty, J. H. Dilles, M. H. Reed, and S. K. Matthäi(2002), New insights from reactive transport modeling: The for-mation of the sericitic vein envelopes during early hydrothermalalteration at Butte, Montana, Geofluids, 2, 185–201, doi:10.1046/j.1468-8123.2002.00037.x.
Geiger, S., S. Roberts, S. K. Matthäi, C. Zoppou, and A. Burri(2004), Combining finite element and finite volume methodsfor efficient multiphase flow simulations in highly heterogeneousand structurally complex geologic media, Geofluids, 4, 284–299,doi:10.1111/j.1468-8123.2004.00093.x.
Geiger, S., T. Driesner, C. A. Heinrich, and S. K. Matthäi(2005), On the dynamics of NaCl‐H2O fluid convection in theEarth’s crust, J. Geophys. Res., 110, B07101, doi:10.1029/2004JB003362.
Geiger, S., T. Driesner, C. A. Heinrich, and S. K. Matthäi (2006a),Multiphase thermohaline convection in the Earth’s crust: I. Anew finite element‐finite volume solution technique combinedwith a new equation of state for NaCl‐H2O, Transp. PorousMedia, 63, 399–434, doi:10.1007/s11242-005-0108-z.
Geiger, S., T. Driesner, C. A. Heinrich, and S. K. Matthäi (2006b),Multiphase thermohaline convection in the Earth’s crust: II.Benchmarking and application of a finite element–finite volumesolution technique with a NaCl‐H2O equation of state, Transp.Porous Media, 63, 435–461, doi:10.1007/s11242-005-0109-y.
Geiger, S., Q. Huangfu, F. Reid, S. K. Matthäi, D. Coumou, M.Belayneh, C. Fricke, and K. Schmid (2009), Massively parallelsector scale discrete fracture and matrix simulations, SPE paper118924 presented at SPE Reservoir Simulation Symposium,Soc. of Pet. Eng., The Woodlands, Tex.
Gerdes, M. L., L. P. Baumgartner, and M. Person (1995), Stochas-tic permeability models of fluid flow during contact metamor-phism, Geology, 23, 945–948, doi:10.1130/0091-7613(1995)023<0945:SPMOFF>2.3.CO;2.
German, C. R., and K. L. Von Damm (2003), Hydrothermal pro-cesses, in , Treatise on Geochemistry, vol. 6, The Oceans andMarine Geochemistry, edited by H. Elderfield, pp. 181–222,Elsevier, Amsterdam.
Germanovich, L. N., and R. P. Lowell (1992), Percolation theory,thermoelasticity, and discrete hydrothermal venting in the Earth’scrust, Science, 255, 1564–1567.
Germanovich, L. N., and R. P. Lowell (1995), The mechanism ofphreatic eruptions, J. Geophys. Res., 100(B5), 8417–8434.
Germanovich, L. N., R. P. Lowell, and D. K. Astakhov (2000),Stress‐dependent permeability and the formation of seafloorevent plumes, J. Geophys. Res., 105(B4), 8341–8354.
Germanovich, L. N., R. P. Lowell, and D. K. Astakhov (2001),Temperature‐dependent permeability and bifurcations in hydro-thermal flow, J. Geophys. Res., 106, 473–495, doi:10.1029/2000JB900293.
Ingebritsen et al.: MODELING MAGMATIC HYDROTHERMAL SYSTEMS RG1002RG1002
27 of 33

Giambalvo, E. R., C. I. Steefel, A. T. Fisher, N. D. Rosenberg, andC. G. Wheat (2002), Effect of fluid‐sediment reaction on hydro-thermal fluxes of major elements, eastern flank of the Juan deFuca Ridge, Geochim. Cosmochim. Acta, 66, 1739–1757,doi:10.1016/S0016-7037(01)00878-X.
Giggenbach, W. F. (1984), Mass transfer in hydrothermal alter-ation systems—A conceptual approach, Geochim. Cosmochim.Acta, 48, 2693–2711.
Gillis, K. M., and M. D. Roberts (1999), Cracking at the magma‐hydrothermal transition: Evidence from the Troodos Ophiolite,Cyprus, Earth Planet. Sci. Lett., 169, 227–244, doi:10.1016/S0012-821X(99)00087-4.
Gilman, J. R., and H. Kazemi (1983), Improvements in simula-tion of naturally fractured reservoirs, SPEJ Soc. Pet. Eng. J.,24, 695–707.
Golden, C. E., S. C. Webb, and R. A. Sohn (2003), Hydrothermalmicroearthquake swarms beneath active vents at Middle Valley,northern Juan de Fuca Ridge, J. Geophys. Res., 108(B1), 2027,doi:10.1029/2001JB000226.
Gottschalk, M. (2007), Equations of state for complex fluids,in Fluid‐Fluid Interactions in the Earth’s Lithosphere, Rev. inMineral. and Geochem., vol. 65, edited by A. Liebscher andC. A.Heinrich, pp. 49–97,Mineral. Soc. of Am.,Washington, D. C.
Grant, M. A., and M. L. Sorey (1979), The compressibility andhydraulic diffusivity of a water‐steam flow, Water Resour.Res., 15, 684–686, doi:10.1029/WR015i003p00684.
Haar, L., J. S. Gallagher, and G. S. Kell (1984), NBS/NRC SteamTables Thermodynamic and Transport Properties and ComputerPrograms for Vapor and Liquid States of Water in SI Units,Hemisphere, New York.
Hanson, R. B. (1992), Effects of fluid production on fluid flowduring regional and contact metamorphism, J. Metamorph. Geol.,10, 87–97, doi:10.1111/j.1525-1314.1992.tb00073.x.
Hanson, R. B. (1995), The hydrodynamics of contact metamor-phism, Geol. Soc. Am. Bull., 107, 595–611, doi:10.1130/0016-7606(1995)107<0595:THOCM>2.3.CO;2.
Hanson, R. B. (1996), Hydrodynamics of magmatic and meteoricfluids in the vicinity of granitic intrusions, Trans. R. Soc. EdinburghEarth Sci., 87, 251–259.
Harris, R. N., A. T. Fisher, and D. S. Chapman (2004), Fluid flowthrough seamounts and implications for globalmass fluxes,Geology,32, 725–728, doi:10.1130/G20387.1.
Harten, A. (1983), High resolution schemes for hyperbolic conser-vation laws, J. Comput. Phys., 49, 357–393, doi:10.1016/0021-9991(83)90136-5.
Hayba, D. O., and S. E. Ingebritsen (1994), The computer modelHYDROTHERM, a three‐dimensional finite‐difference modelto simulate ground‐water flow and heat transport in the temper-ature range of 0 to 1, 200°C, U.S. Geol. Surv. Water Resour.Invest. Rep., 94‐4045.
Hayba, D. O., and S. E. Ingebritsen (1997), Multiphase ground-water flow near cooling plutons, J. Geophys. Res., 102,12,235–12,252, doi:10.1029/97JB00552.
Haymon, R. M. (1996), The response of ridge‐crest hydrothermalsystems to segmented, episodic magma supply, Geol. Soc. Spec.Publ., 118, 157–168.
Hedenquist, J. W., and R. W. Henley (1985), Hydrothermal erup-tions in the Waiotapu geothermal system, New Zealand: Theirorigin, associated breccias, and relation to precious metal miner-alization, Econ. Geol., 80(1), 640–641, 668.
Hedenquist, J. W., and J. L. Lowenstern (1994), The role ofmagmas in the formation of hydrothermal ore deposits, Nature,370, 519–527, doi:10.1038/370519a0.
Helmig, R. (1997), Multiphase Flow and Transport Processes inthe Subsurface: A Contribution to the Modeling of Hydro-systems, Springer, New York.
Hill, D. P., et al. (1993), Seismicity remotely triggered by themagnitude 7.3 Landers, California, earthquake, Science, 260,1617–1623.
Hirth, G. H., J. Escartin, and J. Lin (1998), The rheology of thelower oceanic crust: Implications for lithosphere deformation atmid‐ocean ridges, in Faulting and Magmatism at Mid‐OceanRidges, Geophys. Monogr. Ser., vol. 106, edited by W. R. Bucket al., pp. 291–303, AGU, Washington, D. C.
Hofmeister, A. M., M. Pertermann, and J. M. Branlund (2007),Thermal conductivity of the Earth, in , Treatise on Geophysics,vol. 2, edited by G. D. Price, pp. 543–578, Elsevier, Amsterdam.
Hogeweg, N., T. E. C. Keith, E. M. Colvard, and S. E. Ingebritsen(2005), Ongoing hydrothermal heat loss from the Valley of10000 Smokes, Alaska, J. Volcanol. Geotherm. Res., 143,279–291, doi:10.1016/j.jvolgeores.2004.12.003.
Horne, R. N., C. Satik, G. Mahiya, K. Li, W. Ambusso, R. Tovar,C. Wang, and H. Nassori (2000), Steam‐water relative perme-ability, paper presented at World Geothermal Congress 2000,Int. Geotherm. Assoc., Beppu, Japan, 28 May to 10 June.
Hubbert, M. K. (1956), Darcy’s law and the field equations of theflow of underground fluids, Trans. Am. Inst. Min. Metall. Pet.Eng., 207, 222–239.
Hurwitz, S., and M. J. S. Johnston (2003), Groundwater levelchanges in a deep well in response to a magma intrusion eventon Kilauea Volcano, Hawai’i, Geophys. Res. Lett., 30(22), 2173,doi:10.1029/2003GL018676.
Hurwitz, S., S. E. Ingebritsen, and M. L. Sorey (2002), Episodicthermal perturbations associated with groundwater flow: Anexample from Kilauea Volcano, Hawaii, J. Geophys. Res., 107(B11), 2297, doi:10.1029/2001JB001654.
Hurwitz, S., K. L. Kipp, S. E. Ingebritsen, and M. E. Reid (2003),Groundwater flow, heat transport, and water table position withinvolcanic edifices: Implications for volcanic processes in theCascade Range, J. Geophys. Res., 108(B12), 2557, doi:10.1029/2003JB002565.
Hurwitz, S., L. B. Christiansen, and P. A. Hsieh (2007), Hydro-thermal fluid flow and deformation in large calderas: Inferencesfrom numerical simulations, J. Geophys. Res., 112, B02206,doi:10.1029/2006JB004689.
Husen, S., R. Taylor, R. B. Smith, and H. Heasler (2004), Changesin geyser eruption behavior and remotely triggered seismicity inYellowstone National Park produced by the 2002 M 7.9 Denalifault earthquake, Alaska, Geology, 32, 537–540, doi:10.1130/G20381.1.
Hutnak, M., S. Hurwitz, S. E. Ingebritsen, and P. A. Hsieh (2009),Numerical models of caldera deformation: Effects of multiphaseand multicomponent hydrothermal fluid flow, J. Geophys. Res.,114, B04411, doi:10.1029/2008JB006151.
Ingebritsen, S. E., and D. O. Hayba (1994), Fluid flow and heattransport near the critical point of H2O, Geophys. Res. Lett.,21, 2199–2203.
Ingebritsen, S. E., and C. E. Manning (1999), Geological implica-tions of a permeability‐depth curve for the continental crust,Geology, 27, 1107–1110.
Ingebritsen, S. E., and S. A. Rojstaczer (1996), Geyser periodicityand the response of geysers to deformation, J. Geophys. Res.,101, 21,891–21,905, doi:10.1029/96JB02285.
Ingebritsen, S. E., and M. L. Sorey (1988), Vapor‐dominated zoneswithin hydrothermal systems: Evolution and natural state, J. Geo-phys. Res., 93, 13,635–13,655, doi:10.1029/JB093iB11p13635.
Ingebritsen, S. E., W. E. Sanford, and C. E. Neuzil (2006),Groundwater in Geologic Processes, 2nd ed., Cambridge Univ.Press, Cambridge, U. K.
Iverson, R. M. (1997), The physics of debris flows, Rev. Geophys.,35, 245–296, doi:10.1029/97RG00426.
Johnson, H. P., M. Hutnak, R. P. Dziak, C. G. Fox, I. Urcuyo, J. P.Cowen, J. Nabelek, and C. Fisher (2000), Earthquake‐inducedchanges in a hydrothermal system on the Juan de Fuca mid‐ocean ridge, Nature, 407, 174–177, doi:10.1038/35025040.
Johnson, J. W., and D. Norton (1991), Critical phenomena inhydrothermal systems: State, thermodynamic, electrostatic, and
Ingebritsen et al.: MODELING MAGMATIC HYDROTHERMAL SYSTEMS RG1002RG1002
28 of 33
transport properties of H2O in the critical region, Am. J. Sci., 291,541–648.
Jupp, T., and A. Schultz (2000), A thermodynamic explanation forblack smoker temperatures, Nature, 403, 880–883, doi:10.1038/35002552.
Jupp, T., and A. Schultz (2004), Physical balances in subseafloorhydrothermal convection cells, J. Geophys. Res., 109, B05101,doi:10.1029/2003JB002697.
Kawada, Y., S. Yoshida, and S. I. Watanabe (2004), Numericalsimulations of mid‐ocean ridge hydrothermal circulation includ-ing the phase separation of seawater, Earth Planets Space, 56,193–215.
Keating, G. N. (2005), The role of water in cooling ignimbrites,J. Volcanol. Geotherm. Res., 142, 145–171, doi:10.1016/j.jvolgeores.2004.10.019.
Keating, G. N., J. W. Geissman, and G. A. Zyvoloski (2002), Mul-tiphase modeling of contact metamorphic systems and applica-tion to transitional geomagnetic fields, Earth Planet. Sci. Lett.,198, 429–448, doi:10.1016/S0012-821X(02)00487-9.
Kelley, D. S., and J. R. Delaney (1987), Two‐phase separation andfracturing in mid‐ocean ridge gabbros at temperatures greaterthan 700°C, Earth Planet. Sci. Lett., 83, 53–66, doi:10.1016/0012-821X(87)90050-1.
Kelley, D. S., J. A. Baross, and J. R. Delaney (2002), Volcanoes,fluids, and life at mid‐ocean ridge spreading centers, Annu. Rev.Earth Planet. Sci., 30 , 385–491, doi:10.1146/annurev.earth.30.091201.141331.
Kim, J., H. A. Tchelepi, and R. Juanes (2009), Stability and accu-racy of sequential methods for coupled flow and geomechanics,SPE paper 1 19084 presented at SPE Reservoir Simulation Sym-posium, Soc. of Pet. Eng., The Woodlands, Tex.
Kipp, K. L., Jr., P. A. Hsieh, and S. R. Charlton (2008), Guideto the revised ground‐water flow and heat transport simulator:HYDROTHERM–Version 3, U.S. Geol. Surv. Tech. Methods,6–A25, U.S. Geol. Surv., Reston, Va.
Kiryukhin, A. V., and V. A. Yampolsky (2004), Modeling study ofthe Pauzhetsky geothermal field, Geothermics, 33, 421–442,doi:10.1016/j.geothermics.2003.09.010.
Kiryukhin, A. V., N. P. Asaulova, and S. Finsterle (2008), Inversemodeling and forecasting for the exploitation of the Pauzhetskygeothermal field, Kamchatka, Russia, Geothermics, 37, 540–562, doi:10.1016/j.geothermics.2008.04.003.
Kissling, W. M. (2005a), Transport of three‐phase hyper‐salinebrines in porous media: Examples, Transp. Porous Media, 60,141–157, doi:10.1007/s11242-004-4795-7.
Kissling, W. M. (2005b), Transport of three‐phase hyper‐salinebrines in porous media: Theory and code implementation, Transp.Porous Media, 61, 25–44, doi:10.1007/s11242-004-3306-1.
Kissling, W. M., and G. J. Weir (2005), The spatial distribution ofthe geothermal fields in the Taupo Volcanic Zone, New Zealand,J. Volcanol. Geotherm. Res., 145, 136–150, doi:10.1016/j.jvolgeores.2005.01.006.
Konikow, L. F., and J. D. Bredehoeft (1992), Ground‐watermodels cannot be validated, Adv. Water Resour., 15, 75–83,doi:10.1016/0309-1708(92)90033-X.
Kostova, B., T. Pettke, T. Driesner, P. Petrov, and C. A. Heinrich(2004), LA ICP‐MS study of fluid inclusions in quartz from theYuzhna Petrovitsa deposit, Madan ore field, Bulgaria, Schweiz.Mineral. Petrogr. Mitt., 84, 25–36.
Lachenbruch, A. H., J. H. Sass, R. J. Munroe, and T. H. Moses Jr.(1976), Geothermal setting and simple heat‐conduction modelsfor the Long Valley caldera, J. Geophys. Res., 81, 769–784,doi:10.1029/JB081i005p00769.
Larsson, A. (1992), The international projects INTRACOIN andHYDROCOIN and INTRAVAL, Adv. Water Resour., 15, 85–87, doi:10.1016/0309-1708(92)90034-Y.
Lee, S. H., P. Jenny, and H. A. Tchelepi (2002), A finite‐volumemethod with hexahedral mulitblock grids for modeling flow in
porous media, Comput. Geosci., 6, 353–379, doi:10.1023/A:1021287013566.
Lewis, K. C. (2007), Numerical modeling of two‐phase flow in thesodium chloride‐water system with applications to seafloor hy-drothermal systems, Ph.D. thesis, Ga. Inst. of Technol., Atlanta.
Lewis, K. C., and R. P. Lowell (2009a), Numerical modeling oftwo‐phase flow in the NaCl‐H2O system: Introduction of a nu-merical method and benchmarking, J. Geophys. Res., 114,B05202, doi:10.1029/2008JB006029.
Lewis, K. C., and R. P. Lowell (2009b), Numerical modeling oftwo‐phase flow in the NaCl‐H2O system: 2. Examples, J. Geophys.Res., 114, B08204, doi:10.1029/2008JB006030.
Li, K., and R. N. Horne (2006), Comparison of methods to calcu-late relative permeability from capillary pressure in consolidatedwater‐wet porous media, Water Resour. Res., 42, W06405,doi:10.1029/2005WR004482.
Li, K., and R. N. Horne (2007), Systematic study of steam‐watercapillary pressure, Geothermics, 36, 558–574, doi:10.1016/j.geothermics.2007.08.002.
Lister, C. R. B. (1974), On the penetration of water into hot rock,Geophys. J. R. Astron. Soc., 39, 465–509.
Lister, C. R. B. (1980), Heat flow and hydrothermal circulation,Annu. Rev. Earth Planet. Sci., 8, 95–117, doi:10.1146/annurev.ea.08.050180.000523.
Lister, C. R. B. (1983), The basic physics of water penetrationinto hot rock, in Hydrothermal Processes at Seafloor SpreadingCenters, edited by P. A. Rona et al., pp. 141–168, Plenum,New York.
Lopez, D. L., and L. Smith (1995), Fluid flow in fault zones: Influ-ence of hydraulic anisotropy and heterogeneity on the fluid flowand heat transfer regime, Water Resour. Res., 32, 3227–3235.
Lopez, D. L., and S. N. Williams (1993), Catastrophic volcaniccollapse: Relation to hydrothermal processes, Science, 260,1794–1796.
Lowell, R. P. (1991), Modeling continental and submarine hydro-thermal systems, Rev. Geophys., 29, 457–476, doi:10.1029/91RG01080.
Lowell, R. P., and L. N. Germanovich (1994), On the temporalevolution of high‐temperature hydrothermal systems at oceanridge crests, J. Geophys. Res., 99, 565–575, doi:10.1029/93JB02568.
Lowell, R. P., and L. N. Germanovich (1995), Hydrothermalprocesses at mid‐ocean ridges: Results from scale analysis andsingle‐pass models, in Mid‐Ocean Ridges: Hydrothermal Inter-action Between the Lithosphere and Oceans, Geophys. Monogr.Ser., vol. 148, edited by C. R. German, J. Lin, and L. M. Parson,pp. 219–244, AGU, Washington, D. C.
Lowell, R. P., and W. Xu (2000), Sub‐critical two‐phase seawaterconvection near a dike, Earth Planet. Sci. Lett., 174, 385–396,doi:10.1016/S0012-821X(99)00275-7.
Lu, X., and S. W. Kieffer (2009), Thermodynamics and masstransport in multicomponent, multiphase H2O systems of plane-tary interest, Annu. Rev. Earth Planet. Sci., 37, 449–477,doi:10.1146/annurev.earth.031208.100109.
Lutz, R. A., and M. J. Kennish (1993), Ecology of deep‐sea hydro-thermal vent communities: A review, Rev. Geophys., 31, 211–242, doi:10.1029/93RG01280.
MacKenzie, F. T., and R. M. Garrels (1966), Chemical mass bal-ance between rivers and oceans, Am. J. Sci., 264, 507–525.
Manning, C. E., and S. E. Ingebritsen (1999), Permeability of thecontinental crust: The implications of geothermal data and meta-morphic systems, Rev. Geophys., 37, 127–150, doi:10.1029/1998RG900002.
Manning, C. E., S. E. Ingebritsen, and D. K. Bird (1993), Missingmineral zones in contact metamorphosed basalts, Am. J. Sci.,293, 894–938.
Mannington, W., M. J. O’Sullivan, and D. Bullivant (2004),Computer modelling of the Wairakei‐Tauhara geothermal sys-
Ingebritsen et al.: MODELING MAGMATIC HYDROTHERMAL SYSTEMS RG1002RG1002
29 of 33

tem, New Zealand, Geothermics, 33, 401–419, doi:10.1016/j.geothermics.2003.09.009.
Mastin, L. G. (1991), The roles of magma and groundwater in thephreatic eruptions at InyoCraters, LongValley caldera, California,Bull. Volcanol., 53, 579–596, doi:10.1007/BF00493687.
Matthäi, S. K., and M. Belayneh (2004), Fluid flow partitioningbetween fractures and a permeable rock matrix, Geophys. Res.Lett., 31, L07602, doi:10.1029/2003GL019027.
Matthäi, S. K., C. A. Heinrich, and T. Driesner (2004), Is theMount Isa copper deposit the product of forced brine convectionin the footwall of a major reverse fault?, Geology, 32, 357–360,doi:10.1130/G20108.1.
Matthäi, S. K., et al. (2007), Numerical simulations of multiphasefluid flow in structurally complex reservoirs, in StructurallyComplex Reservoirs, edited by S. J. Jolley et al., Geol. Soc. Spec.Publ., 292, 405–429.
Menand, T., A. Raw, and A. W. Woods (2003), Thermal inertiaand reversing buoyancy in flow in porous media, Geophys.Res. Lett., 30(6), 1291, doi:10.1029/2002GL016294.
Mogi, K. (1958), Relations of the eruptions of various volcanoesand the deformation of ground surfaces around them, Bull.Earthquake Res. Inst. Univ. Tokyo, 36, 94–134.
Moore, D. E., C. A. Morrow, and J. D. Byerlee (1983), Chemicalreactions accompanying fluid flow through granite held in a tem-perature gradient, Geochim. Cosmochim. Acta, 47, 445–453,doi:10.1016/0016-7037(83)90267-3.
Moore, D. E., D. A. Lockner, and J. D. Byerlee (1994), Reductionof permeability in granite at elevated temperatures, Science, 265,1558–1561.
Morrow, C., D. Lockner, D. Moore, and J. Byerlee (1981), Perme-ability of granite in a temperature gradient, J. Geophys. Res., 86,3002–3008.
Morrow, C. A., D. E. Moore, and D. A. Lockner (2001), Perme-ability reduction in granite under hydrothermal conditions, J. Geo-phys. Res., 106, 30,551–30,560, doi:10.1029/2000JB000010.
Muffler, L. J. P. (Ed.) (1979), Assessment of geothermal resourcesof the United States–1978, U.S. Geol. Surv. Circ., 790.
Narasimhan, T. N., and P. A. Witherspoon (1976), An integratedfinite difference method for analyzing fluid flow in porous media,Water Resour. Res., 12, 57–65, doi:10.1029/WR012i001p00057.
Nehlig, P. (1994), Fracture and permeability analysis in magma‐hydrothermal transition zones in the Samail Ophiolite (Oman),J. Geophys. Res., 99, 589–601, doi:10.1029/93JB02569.
Neuman, S. P. (2005), Trends, prospects and challenges in quanti-fying flow and transport through fractured rocks, Hydrogeol. J.,13, 124–147, doi:10.1007/s10040-004-0397-2.
Neuzil, C. E. (1995), Abnormal pressures as hydrodynamic phe-nomena, Am. J. Sci., 295, 742–786.
Neuzil, C. E. (2003), Hydromechanical coupling in geologic pro-cesses, Hydrogeol. J., 11, 41–83.
Newhall, C. G., S. E. Albano, N. Matsumoto, and T. Sandoval(2001), Roles of groundwater in volcanic unrest, J. Geol. Soc.Philippines, 56, 69–84.
Newman, A. V., T. H. Dixon, G. I. Ofoegbu, and J. E. Dixon(2001), Geodetic and seismic constraints on recent activity atLong Valley Caldera, California: Evidence for viscoelastic rheol-ogy, J. Volcanol. Geotherm. Res., 105, 183–206, doi:10.1016/S0377-0273(00)00255-9.
Nield, D. A. (1968), Onset of thermohaline convection in a porousmedium, Water Resour. Res., 4, 553–560, doi:10.1029/WR004i003p00553.
Nield, D. A., and A. Bejan (1992), Convection in Porous Media,Springer, New York.
Norton, D. L. (1984), Theory of hydrothermal systems, Annu. Rev.Earth Planet. Sci., 12 , 155–178, doi:10.1146/annurev.ea.12.050184.001103.
Norton, D., and J. Knight (1977), Transport phenomena in hydro-thermal systems: Cooling plutons, Am. J. Sci., 277, 937–981.
Norton, D., and H. P. Taylor Jr. (1979), Quantitative simulation ofthe hydrothermal systems of crystallizing magmas on the basis oftransport theory and oxygen isotope data: An analysis of theSkaergaard intrusion, J. Petrol., 20, 421–486.
Oldenburg, C. M., and K. Pruess (2000), Simulation of propagat-ing fronts in geothermal reservoirs with the implicit Leonard totalvariation diminishing scheme, Geothermics , 29 , 1–25,doi:10.1016/S0375-6505(99)00048-6.
Oreskes, N., K. Shrader‐Frechette, and K. Belitz (1994), Verifica-tion and validation of numerical models in the Earth sciences,Science, 84, 85–92.
O’Sullivan, M. J., K. Pruess, and M. J. Lippmann (2001), Stateof the art of geothermal reservoir simulation, Geothermics, 30,395–429, doi:10.1016/S0375-6505(01)00005-0.
O’Sullivan, M. J., A. Yeh, and W. I. Mannington (2009), A historyof numerical modeling of the Wairekei geothermal field,Geothermics, 38, 155–168, doi:10.1016/j.geothermics.2008.12.001.
Palliser, C., and R. McKibbin (1998a), A model for deep geother-mal brines. I. T‐p‐X state‐space description, Transp. PorousMedia, 33, 65–80, doi:10.1023/A:1006537425101.
Palliser, C., and R. McKibbin (1998b), A model for deep geother-mal brines. II. Thermodynamic properties—Density, Transp.Porous Media, 33, 129–154, doi:10.1023/A:1006597626918.
Palliser, C., and R. McKibbin (1998c), A model for deep geo-thermal brines. III. Thermodynamic properties—Enthalpy andviscocity, Transp. Porous Media, 33, 155–171, doi:10.1023/A:1006549810989.
Paluszny, A., S. K. Matthäi, and M. Hohmeyer (2007), Hybridfinite element‐finite volume discretization of complex geologicstructures and a new simulation workflow demonstrated on frac-tured rocks, Geofluids, 7, 186–208, doi:10.1111/j.1468-8123.2007.00180.x.
Parmentier, E. M. (1981), Numerical experiments on 18O depletionin igneous intrusions cooling by groundwater convection,J. Geophys. Res., 86(7), 131–137, 144.
Piquemal, J. (1994), Saturated steam relative permeabilities of un-consolidated porous media, Transp. Porous Media, 17, 105–120,doi:10.1007/BF00624727.
Pirajno, F., and M. J. van Kranendonk (2005), Review of hydro-thermal processes and systems on Earth and implications forMartian analogues, Aust. J. Earth Sci. , 52 , 329–351,doi:10.1080/08120090500134571.
Polak, A., D. Elsworth, H. Yasuhara, A. S. Grader, and P. M. Halleck(2003), Permeability reduction of a natural fracture under net disso-lution by hydrothermal fluids, Geophys. Res. Lett., 30(20), 2020,doi:10.1029/2003GL017575.
Polyansky, O. P., V. V. Reverdatto, and V. G. Sverdlova (2002),Convection of two‐phase fluid in a layered porous medium drivenby the heat of magmatic dikes and sills,Geochem. Int., 40(suppl. 1),S69–S81.
Pruess, K. (1988), SHAFT, MULKOM, TOUGH: A set of numer-ical simulators for multiphase fluid and heat flow, Rep. LBL‐24430, Lawrence Berkeley Natl. Lab., Berkeley, Calif.
Pruess, K. (1991), TOUGH2—A general‐purpose numerical simu-lator for multiphase fluid and heat flow, Rep. LBL‐29400,Lawrence Berkeley Natl. Lab., Berkeley, Calif.
Pruess, K. (2004), The TOUGH codes—A family of simulationtools for multiphase flow and transport processes in permeablemedia, Vadose Zone J., 3, 738–746, doi:10.2113/3.3.738.
Pruess, K., C. Calore, R. Celati, and Y. S. Wu (1987), An analyt-ical solution for heat transfer at a boiling front moving through aporous medium, Int. J. Heat Mass Transfer, 30, 2595–2602,doi:10.1016/0017-9310(87)90140-2.
Pruess, K., J. M. Zerzan, R. C. Schoeder, and P. A. Witherspoon(1979), Description of the three‐dimensional two‐phase simula-tor SHAFT78 for use in geothermal reservoir studies, SPE paper7699 presented at Fifth Symposium on Reservoir Simulation,Soc. of Pet. Eng., Denver, Colo.
Ingebritsen et al.: MODELING MAGMATIC HYDROTHERMAL SYSTEMS RG1002RG1002
30 of 33
Pruess, K., C. Oldenburg, and G. Moridis (1999), TOUGH2 user’sguide, version 2.0, Rep. LBNL‐43134, Lawrence Berkeley Natl.Lab., Berkeley, Calif.
Pruess, K., J. Garcia, T. Kovscek, C. Oldenburg, C. I. Steefel, andT. F. Xu (2004), Code intercomparison builds confidence innumerical simulation models for geologic disposal of CO2, Energy,29, 1431–1444.
Rabinowicz, M., J. Boulegue, and P. Genthon (1998), Two‐and three‐dimensional modeling of hydrothermal convectionin the sedimented Middle Valley segment, Juan de Fuca Ridge,J. Geophys. Res., 103, 24,045–24,065, doi:10.1029/98JB01484.
Rabinowicz, M., J. C. Sempere, and P. Genthon (1999), Thermalconvection in a vertical permeable slot: Implications for hydro-thermal convection along mid‐ocean ridges, J. Geophys. Res.,104, 29,275–29,292, doi:10.1029/1999JB900259.
Raffensperger, J. P. (1997), Evidence and modeling of large‐scalegroundwater convection in Precambrian sedimentary basins, inBasin‐Wide Diagenetic Patterns: Integrated Petrologic, Geo-chemical, and Hydrologic Considerations, edited by I. P.Montañez, J. M. Gregg, and K. L. Helton, Spec. Publ. SEPMSoc. Sediment. Geol., 57, 15–26.
Reid, M. E. (2004), Massive collapse of volcano edifices triggeredby hydrothermal pressurization, Geology, 32, 373–376,doi:10.1130/G20300.1.
Revil, A., et al. (2008), Inner structure of La Fossa di Vulcano(Vulcano Island, southern Tyrrhenian Sea, Italy) revealed byhigh‐resolution electric resistivity tomography coupled withself‐potential, temperature, and CO2 diffuse degassing measure-ments, J. Geophys. Res., 113, B07207, doi:10.1029/2007JB005394.
Rojstaczer, S. A., S. Wolf, and R. Michel (1995), Permeability en-hancement in the shallow crust as a cause of earthquake‐inducedhydrological changes, Nature, 373, 237–239, doi:10.1038/373237a0.
Rojstaczer, S. A., S. E. Ingebritsen, and D. O. Hayba (2008), Perme-ability of continental crust influenced by internal and external forc-ing,Geofluids, 8, 128–139, doi:10.1111/j.1468-8123.2008.00211.x.
Rosenberg, N. D., and F. J. Spera (1992), Thermohaline convec-tion in a porous medium heated from below, Int. J. Heat MassTransfer, 35, 1261–1273.
Rutqvist, J., Y. S. Wu, C. F. Tsang, and G. Bodvarsson (2002), Amodeling approach for analysis of coupled multiphase fluid flow,heat transfer, and deformation in fractured porous rock, Int. J.Rock Mech. Min. Sci., 39, 429–442, doi:10.1016/S1365-1609(02)00022-9.
Saar, M. O., and M. Manga (2004), Depth dependence of perme-ability in the Oregon Cascades inferred from hydrogeologic,thermal, seismic, and magmatic modeling constraints, J. Geo-phys. Res., 109, B04204, doi:10.1029/2003JB002855.
Sammel, E. A., S. E. Ingebritsen, and R. H. Mariner (1988), Thehydrothermal system at Newberry volcano, Oregon, J. Geophys.Res., 93, 10,149–10,162, doi:10.1029/JB093iB09p10149.
Sass, J. H., A. H. Lachenbruch, T. H. Moses Jr., and P. Morgan(1992), Heat flow from a scientific research well at Cajon Pass,California, J. Geophys. Res., 97, 5017–5030.
Schardt, C., R. Large, and J. Yang (2006), Controls on heat flow,fluid migration, and massive sulphide formation of an off‐axishydrothermal system—The Lau basin perspective, Am. J. Sci.,306, 103–134, doi:10.2475/ajs.306.2.103.
Scheidegger, A. E. (1974), The Physics of Flow Through PorousMedia, 3rd ed., Univ. of Toronto Press, Toronto, Ont., Canada.
Schmidt, C., and R. J. Bodnar (2000), Synthetic fluid inclusions:XVI. PVTX properties in the system H2O‐NaCl‐CO2 at elevatedtemperatures, pressures and salinities, Geochim. Cosmochim.Acta, 64, 3853–3869.
Schoofs, S., and F. J. Spera (2003), Transition to chaos and flowdynamics of thermochemical porous medium convection,Transp . Porous Media , 50 , 179–195 , do i :10 .1023/A:1020699112998.
Schoofs, S., F. J. Spera, and U. Hansen (1999), Chaotic thermoha-line convection in low‐porosity hydrothermal systems, EarthPlanet. Sci. Lett., 174, 213–229, doi:10.1016/S0012-821X(99)00264-2.
Schultz, A., J. R. Delaney, and R. E. McDuff (1992), On the par-titioning of heat flux between diffuse and point source seafloorventing, J. Geophys. Res., 97, 12,299–12,314, doi:10.1029/92JB00889.
Sclater, J. G., C. Jaupart, and D. Galson (1980), The heatflow through oceanic and continental crust and the heat loss ofthe Earth, Rev. Geophys. , 18 , 269–311, doi:10.1029/RG018i001p00269.
Seyfried, W. E., Jr. (1987), Experimental and theoretical con-straints on hydrothermal alteration processes at mid‐oceanr idges, Annu. Rev. Earth Planet . Sci . , 15 , 317–335,doi:10.1146/annurev.ea.15.050187.001533.
Shinohara, H. (2008), Excess degassing from volcanoes and itsrole on eruptive and intrusive activity, Rev. Geophys., 46,RG4005, doi:10.1029/2007RG000244.
Shmonov, V. M., V. M. Viviovtova, A. V. Zharikov, and A. A.Grafchikov (2003), Fluid permeability of the continental crust:Estimation from experimental data, J. Geochem. Explor., 78-79,697–699.
Simpson, F. (2001), Fluid trapping at the brittle‐ductile transitionre‐examined, Geofluids, 1, 123–136, doi:10.1046/j.1468-8123.2001.00011.x.
Slichter, C. S. (1899), Theoretical investigations of motionsof groundwater flow, U.S. Geol. Surv. Annu. Rep., 19, part II,pp. 295–380, U.S. Geol. Surv., Reston, Va.
Sohn, R. A. (2007), Stochastic analysis of exit fluid temperaturerecords from the active TAG hydrothermal mound (Mid‐AtlanticRidge, 26°N): 1. Modes of variability and implications for sub-surface flow, J. Geophys. Res., 112, B07101, doi:10.1029/2006JB004435.
Sohn, R. A., D. J. Fornari, K. L. Von Damm, J. A. Hildebrand, andS. C. Webb (1998), Seismic and hydrothermal evidence for acracking event on the East Pacific rise crest at 9°50′ N, Nature,396, 159–161, doi:10.1038/24146.
Sondergeld, C. H., and D. L. Turcotte (1977), Experimental studyof two‐phase convection in porous medium with applications togeological problems, J. Geophys. Res., 82, 2045–2053.
Sorey, M. L., M. A. Grant, and E. Bradford (1980), Nonlinear ef-fects in two‐phase flow to wells in geothermal reservoirs, WaterResour. Res., 16, 767–777, doi:10.1029/WR016i004p00767.
Stanford Geothermal Program (1980), Proceedings of special panelon geothermal model intercomparison study at the 6th Workshopon Geothermal Reservoir Engineering, Stanford University,Stanford, California, December 17, 1980, Stanford Geotherm.Program Rep., SGP‐TR‐42, Stanford Univ., Stanford, Calif.
Steefel, C. I., and A. C. Lasaga (1994), A coupled model fortransport of multiple chemical species and kinetic precipitation/dissolution reactions with application to reactive flow in singlephase hydrothermal systems, Am. J. Sci., 294, 529–592.
Stein, C. A., and S. Stein (1994), Constraints on hydrothermal heatflux through the oceanic lithosphere from global heat flow,J. Geophys. Res., 99, 3081–3095.
Stephansson, O., and K.‐B. Min (2004), Thermo‐hydro‐mechanical(THM) coupled processes for performance and safety assessmentsof nuclear waste repository: Lessons learnt from EC BENCHPARproject, paper presented at Euradwaste ’04, Eur. Comm.,Luxembourg, 29–31 March. (Available at http://www.cordis.lu/fp6‐euratom/ev_euradwaste04_proceedings.htm)
Stober, I., and K. Bucher (2007), Hydraulic properties of the crys-talline basement, Hydrogeol. J., 15, 213–224, doi:10.1007/s10040-006-0094-4.
Straus, J. M., and G. Schubert (1981), One‐dimensional model ofvapor‐dominated geothermal systems, J. Geophys. Res., 86,9433–9438.
Ingebritsen et al.: MODELING MAGMATIC HYDROTHERMAL SYSTEMS RG1002RG1002
31 of 33
Stüben, K. (2001), A review of algebraic multigrid, J. Comput. Appl.Math., 128, 281–309, doi:10.1016/S0377-0427(00)00516-1.
Summers, R., K. Winkler, and J. Byerlee (1978), Permeabilitychanges during the flow of water through Westerly Granite attemperatures of 100°–400°C, J. Geophys. Res., 83, 339–344,doi:10.1029/JB083iB01p00339.
Sweby, P. K. (1984), High resolution schemes using flux limitersfor hyperbolic conservation laws, SIAM J. Numer. Anal., 21,995–1011.
Symonds, R. B., T. M. Gerlach, and M. H. Reed (2001), Magmaticgas scrubbing: Implications for volcano monitoring, J. Volcanol.Geotherm. Res., 108, 303–341, doi:10.1016/S0377-0273(00)00292-4.
Talwani, P., L. Chen, and K. Gahalaut (2007), Seismogenicpermeability, ks, J. Geophys. Res., 112, B07309, doi:10.1029/2006JB004665.
Tanger, J. C., IV, and K. S. Pitzer (1989), Thermodynamics ofNaCl‐H2O: A new equation of state for the near‐critical regionand comparisons with other equations for adjoining regions,Geochim. Cosmochim. Acta, 53, 973–987, doi:10.1016/0016-7037(89)90203-2.
Taylor, H. P., Jr. (1971), Oxygen isotope evidence for large‐scaleinteraction between meteoric groundwaters and Tertiary granodi-orite intrusions, Western Cascade Range, Oregon, J. Geophys.Res., 76(7), 7855–7874.
Thiery, R., and L. Mercury (2009), Explosive properties of waterin volcanic and hydrothermal systems, J. Geophys. Res., 114,B05205, doi:10.1029/2008JB005742.
Titley, S. R. (1990), Evolution and style of fracture permeability inintrusion‐centered hydrothermal systems, in The Role of Fluidsin Crustal Processes, edited by J. D. Bredehoeft and D. L.Norton, pp. 50–63, Natl. Acad., Washington, D. C.
Todaka, N., C. Akasaka, T. Xu, and K. Pruess (2004), Reactivegeothermal transport simulations to study the formation mecha-nism of an impermeable barrier between acidic and neutral fluidzones in the Onikobe Geothermal Field, Japan, J. Geophys. Res.,109, B05209, doi:10.1029/2003JB002792.
Todesco, M. (2009), Signals from the Campi Flegrei hydrothermalsystem: Role of a “magmatic” source of fluids, J. Geophys. Res.,114, B05201, doi:10.1029/2008JB006134.
Todesco, M., J. Rutqvist, G. Chiodini, K. Pruess, and C. M.Oldenburg (2004), Modeling of recent volcanic episodes atPhlegrean Fields (Italy), Geothermics, 33, 531–547, doi:10.1016/j.geothermics.2003.08.014.
Tsypkin, G. G., and C. Calore (2003), Role of capillary forces invapour extraction from low‐permeability, water‐saturated geo-thermal reservoirs, Geothermics, 32, 219–237, doi:10.1016/S0375-6505(03)00018-X.
Udell, K. S. (1985), Heat transfer in porous media: Consideringphase change and capillarity—The heat pipe effect, Int. J. HeatMass Transfer, 28, 485–495, doi:10.1016/0017-9310(85)90082-1.
Urabe, T., et al. (1995), The effect of magmatic activity on hydro-thermal venting along the superfast‐spreading East Pacific Rise,Science, 269, 1092–1095.
Urmeneta, N. A., S. Fitzgerald, and R. N. Horne (1998), The roleof capillary forces in the natural state of fractured geothermalreservoirs, in Proceedings of the 23rd Workshop on GeothermalReservoir Engineering, vol. 26, pp. 100–109, Stanford Univ.,Stanford, Calif.
Vaughan, P. J., D. E. Moore, C. A. Morrow, and J. D. Byerlee(1986), Role of cracks in progressive permeability reduction dur-ing flow of heated aqueous fluids through granite, J. Geophys.Res., 91, 7517–7530.
Vennard, J. K., and R. L. Street (1975), Elementary Fluid Mechanics,John Wiley, New York.
Verma, A. K. (1990), Effects of phase transformation on steam‐water relative permeabilities, Ph.D. thesis, Univ. of Calif., Berkeley.
Von Damm, K. L. (1990), Seafloor hydrothermal activity: Blacksmoker chemistry and chimneys, Annu. Rev. Earth Planet. Sci.,18, 173–204, doi:10.1146/annurev.ea.18.050190.001133.
Von Damm, K. L. (1995), Temporal and compositional diversity inseafloor hydrothermal fluids, Rev. Geophys., 33, 1297–1305.
Von Damm, K. L., M. D. Lilley, W. C. Shanks, M. Brockington,A. M. Bray, K. M. O’Grady, E. Olson, A. Graham, and G. Pros-kurowski (2003), Extraordinary phase separation and segregationin vent fluids from the southern East Pacific Rise, Earth Planet.Sci. Lett., 206, 365–378, doi:10.1016/S0012-821X(02)01081-6.
Vosteen, H.‐D., and R. Schellschmidt (2003), Influence oftemperature on thermal conductivity, thermal capacity and ther-mal diffusivity for different types of rock, Phys. Chem. Earth,28, 499–509.
Walker, J. J., J. R. Spear, and N. R. Pace (2005), Geobiology of amicrobial endolithic community in the Yellowstone geothermalenvironment, Nature, 434, 1011–1014.
Wang, C. T., and R. N. Horne (2000), Boiling flow in a horizontalfracture, Geothermics, 29, 759–772, doi:10.1016/S0375-6505(00)00029-8.
Wang, K. (2004), Applying fundamental principles and mathemat-ical models to understand processes and estimate parameters, inHydrogeology of the Oceanic Lithosphere, edited by E. E. Davisand H. Elderfield, pp. 376–413, Cambridge Univ. Press,Cambridge, U. K.
Ward, J. D. (1964), Turbulent flow in porous media, Proc. Am. Soc.Civ. Eng., 90, 1–12.
Wilcock, W. S. D. (1998), Cellular convection models of mid‐ocean ridge hydrothermal convection and the temperatures ofblack smoker fluids, J. Geophys. Res., 103, 2585–2596.
Wilcock, W. S. D., and A. T. Fisher (2004), Geophysical con-straints on the subseafloor environment near mid‐ocean ridges,in The Subsurface Biosphere at Mid‐Ocean Ridges, Geophys.Monogr. Ser., vol. 114, edited by W. S. D. Wilcock et al.,pp. 51–74, AGU, Washington, D. C.
Williams, D. L., and R. P. Von Herzen (1974), Heat loss from theEarth: New estimate, Geology, 2, 327–328, doi:10.1130/0091-7613(1974)2<327:HLFTEN>2.0.CO;2.
Williams‐Jones, A. E., and C. A. Heinrich (2005), Vapor transportof metals and the formation of magmatic hydrothermal oredeposits, Econ. Geol., 100, 1287–1312.
Windman, T., N. Zolotova, F. Schwandner, and E. L. Shock(2007), Formate as an energy source for microbial metabolismin chemosynthetic zones of hydrothermal ecosystems, Astrobiol-ogy, 7, 873–890, doi:10.1089/ast.2007.0127.
Wooding, R. A. (1957), Steady state free thermal convection ofliquid in a saturated permeable medium, J. Fluid Mech., 2,273–285, doi:10.1017/S0022112057000129.
Woods, A. W. (1999), Liquid and vapor flow in superheated rock,Annu. Rev. Fluid Mech., 31, 171–199, doi:10.1146/annurev.fluid.31.1.171.
Wu, C. C., and G. J. Hwang (1998), Flow and heat transfer char-acteristics inside packed and fluidized beds, J. Heat Transfer,120, 667–673, doi:10.1115/1.2824335.
Wu, Y.‐S., K. Zhang, C. Ding, K. Pruess, E. Elmroth, and G. S.Bodvarsson (2002), An efficient parallel‐computing method formodeling nonisothermal multiphase flow and multicomponenttransport in fractured porous media, Adv. Water Resour., 25,243–261, doi:10.1016/S0309-1708(02)00006-4.
Xu, T., and K. Pruess (2001), On fluid flow and mineral alterationin fractured caprock of magmatic hydrothermal systems, J. Geo-phys. Res., 106(B2), 2121–2138, doi:10.1029/2000JB900356.
Xu, T., E. Sonnenthal, N. Spycher, K. Pruess, G. Brimhall, and J.Apps (2001), Modeling multiphase non‐isothermal fluid flowand reactive geochemical transport in variably saturated fracturedrocks. 2. Applications to supergene copper enrichment andhydrothermal flows, Am. J. Sci., 301, 34–59, doi:10.2475/ajs.301.1.34.
Ingebritsen et al.: MODELING MAGMATIC HYDROTHERMAL SYSTEMS RG1002RG1002
32 of 33

Xu, T., Y. Ontoy, P. Molling, N. Spycher, M. Parini, and K. Pruess(2004a), Reactive transport modeling of injection well scalingand acidizing at Tiwi field, Philippines, Geothermics, 33, 477–491, doi:10.1016/j.geothermics.2003.09.012.
Xu, T., E. Sonnenthal, N. Spycher, and K. Pruess (2004b),TOUGHREACT user’s guide: A simulation program for non‐isothermal multiphase reactive geochemical transport in variablesaturated geologic media, Pap. LBNL‐55460, LawrenceBerkeley Natl. Lab., Berkeley, Calif.
Yasuhara, H., A. Polak, Y. Mitani, A. S. Grader, P. M. Halleck,and D. Elsworth (2006), Evolution of fracture permeabilitythrough fluid‐rock reaction under hydrothermal conditions,Earth Planet. Sci. Lett., 244, 186–200, doi:10.1016/j.epsl.2006.01.046.
Zhang, K., Y.‐S. Wu, and K. Pruess (2008), User’s guide forTOUGH2‐MP—A massively parallel version of the TOUGH2code, Lawrence Berkeley Natl. Lab., Berkeley, Calif. (Availableat http://www.tough2.com/index.html)
Zyvoloski, G. A. (1983), Finite element methods for geothermalreservoir simulation, Int. J. Numer. Anal. Methods Geomech.,7, 75–86, doi:10.1002/nag.1610070108.
Zyvoloski, G. A., and M. J. O’Sullivan (1980), Simulation of agas‐dominated, two‐phase geothermal reservoir, SPEJ Soc.Pet. Eng. J., 20, 52–58.
Zyvoloski, G. A., Z. V. Dash, and S. Kelkar (1988), FEHM: Finiteelement heat and mass transfer code, Rep. LA‐11224‐MS, LosAlamos, Natl. Lab., Los Alamos, N. M.
Zyvoloski, G. A., B. A. Robinson, Z. D. Dash, and L. L. Trease(1997), Summary of models and methods for the FEHMapplication—A finite‐element heat‐ and mass‐transfer code,Rep. LA‐13307‐MS, Los Alamos, Natl. Lab., Los Alamos, N. M.
T. Driesner, Institute of Isotope Geochemistry and MineralResources, ETH Zurich, NW F81.3, Clausiusstr. 25, CH‐8092 Zurich,Switzerland.S. Geiger, Institute of Petroleum Engineering, Heriot‐Watt University,
Edinburgh EH14 4AS, UK.S. Hurwitz and S. E. Ingebritsen, U.S. Geological Survey, 345
Middlefield Rd., Menlo Park, CA 94025, USA. ([email protected])
Ingebritsen et al.: MODELING MAGMATIC HYDROTHERMAL SYSTEMS RG1002RG1002
33 of 33


![Magmatic affinity of modern and ancient subalkaline ...espace.inrs.ca/1898/1/Ross-Bedard(magmatic-affinity)2009[1].pdf · determined from trace element discriminant diagrams ... Magmatic](https://img.pdfslide.net/doc/110x75/5b98e05509d3f219118ce71e/magmatic-affinity-of-modern-and-ancient-subalkaline-magmatic-affinity20091pdf.jpg)


![Indigenous Enhanced Mineralization Pyrene, Benzo[a]pyrene ...Indigenous soil microorganism mineralization experiments. All of the mineralization experiments were performed by using](https://img.pdfslide.net/doc/110x75/5e7c41b0b7c4ef64181e5e16/indigenous-enhanced-mineralization-pyrene-benzoapyrene-indigenous-soil-microorganism.jpg)