Embed Size (px)
Citation preview

Vol.:(0123456789)1 3
CEAS Aeronautical Journal (2021) 12:589–603 https://doi.org/10.1007/s13272-021-00522-w
ORIGINAL PAPER
Full configuration drag estimation of short‑to‑medium range fixed‑wing UAVs and its impact on initial sizing optimization
F. Götten1 · D. F. Finger1 · M. Havermann1 · C. Braun1 · M. Marino2 · C. Bil2
Received: 18 February 2021 / Revised: 21 April 2021 / Accepted: 3 June 2021 / Published online: 10 June 2021 © The Author(s) 2021
AbstractThe paper presents the derivation of a new equivalent skin friction coefficient for estimating the parasitic drag of short-to-medium range fixed-wing unmanned aircraft. The new coefficient is derived from an aerodynamic analysis of ten different unmanned aircraft used for surveillance, reconnaissance, and search and rescue missions. The aircraft is simulated using a validated unsteady Reynolds-averaged Navier Stokes approach. The UAV’s parasitic drag is significantly influenced by the presence of miscellaneous components like fixed landing gears or electro-optical sensor turrets. These components are respon-sible for almost half of an unmanned aircraft’s total parasitic drag. The new equivalent skin friction coefficient accounts for these effects and is significantly higher compared to other aircraft categories. It is used to initially size an unmanned aircraft for a typical reconnaissance mission. The improved parasitic drag estimation yields a much heavier unmanned aircraft when compared to the sizing results using available drag data of manned aircraft.
Keywords Parasitic drag · UAV · CFD · Aircraft sizing
AbbreviationsAoA Angle of attackAR Aspect ratioCD Drag coefficientCDmin Minimum drag coefficientCfeq Equivalent skin friction coefficientCL Lift coefficientEARSM Explicit algebraic Reynolds stressEO/IR Electro-optical infrared
ICE Internal combustion engineMTOM Maximum take-off massP/W Power-to-weight ratioRe Reynolds numberSIMPLE Semi Implicit Method for Pressure Linked
EquationsSMR Short-to-medium rangeSref Aircraft reference areaSST Shear stress transportSwet Aircraft wetted areaUAV Unmanned Aerial VehicleURANS Unsteady Reynolds Averaged Navier StokesW/S Wing loadingy+ Normalized wall distance
1 Introduction
Conceptual aircraft design is a multidisciplinary optimi-zation problem. The design routine is divided into several sub-models that are responsible for estimating the new aircraft’s properties, including weight, propulsion, cost, or aerodynamics. The accuracy of such underlying models is of critical importance as their outcomes drive the design to convergence. One of these critical models is responsi-ble for estimating the new aircraft’s parasitic drag. The
* F. Götten [email protected]
D. F. Finger [email protected]
M. Havermann [email protected]
C. Braun [email protected]
M. Marino [email protected]
C. Bil [email protected]
1 Department of Aerospace Engineering, FH Aachen University of Applied Sciences, Aachen, Germany
2 School of Engineering, RMIT University, Melbourne, Australia

590 F. Götten et al.
1 3
parasitic drag has a direct effect on flight performance prediction and propulsion system sizing.
A well-known approach is to use an equivalent skin friction method. In this method, the complete parasitic drag of an aircraft is based on an equivalent skin fric-tion coefficient and its multiplication with the wetted area of the airframe. The empirical skin friction coefficient depends on the aircraft category to account for their spe-cific aspects [1]. A careful literature review revealed that neither an equivalent skin friction factor nor wetted area correlations have yet been derived for short-to-medium range UAVs. These UAVs have take-off masses from 15 kg up to about 700 kg, and they are often used for recon-naissance, surveillance, and search and rescue missions. Both civil and military users employ such UAVs on long endurance missions from about 4–16 h [2, 3]. The rela-tive range of take-off masses is rather significant, which is a characteristic of this UAV class. There is no uniform classification for such UAVs, and multiple ones have been proposed in the past [2]. They are sometimes termed short-range (SR) to medium-range (MR) UAVs, but also referred to as “tactical UAVs” [4]. For reasons of simplicity, they are named SMR UAVs (short-to-medium range) in this publication.
These UAVs are larger than micro and small UAVs, where aerodynamic aspects are of minor importance, but they are also significantly smaller than Medium-Altitude or High-Altitude Long Endurance (MALE/HALE) UAVs, where manned aircraft drag estimations might be used [5]. In such SMR UAVs can be seen as the lightest UAV class for which aerodynamic aspects are critical, and their sizes and shapes dictate different aerodynamic behaviour compared to heavier aircraft. Prominent examples of this aircraft category are the Aeronautics Aerostar or the AAI Shadow 200. SMR UAVs employed for reconnaissance, surveillance, and search and rescue missions are often designed using the twin-tail boom configuration with a pusher propeller. In this configu-ration, the exhaust gases of the combustion engine do not interfere with the optical sensors.
The past development of SMR UAVs was very concerned with data-link capabilities, autopilot functionality, and safety aspects. Aerodynamic design was often subordinated, even though SMR UAVs are very sensitive to aerodynamic aspects, including parasitic drag [3]. Only very recently did research interest also extend to the aerodynamic design and optimization of SMR UAVs [6, 7].
Little information about the parasitic drag of SMR UAVs is currently available [8]. UAV designers nowadays rely on available data of other aircraft categories. As SMR UAVs feature particular configurational aspects like solid spring-type landing gears or EO/IR sensor turrets, their parasitic drag might not be comparable to these aircraft categories. As such, the drag and flight performance estimation of SMR
UAVs is subject to large uncertainties. This can have a sig-nificant effect on the outcomes of a design process.
This publication, therefore, presents new aerodynamic parasitic drag data of 10 representative UAVs. The data is generated using a validated Unsteady Reynolds-averaged Navier–Stokes (URANS) approach. The UAVs are chosen as representatives for a variety of configurations. The aerody-namic data is used to derive a novel equivalent skin friction coefficient that allows a full-configuration drag estimation of SMR UAVs. The new coefficient can be used in combination with geometrical data of an in-house database to directly estimate the drag of a new UAV.
In a parallel research effort, a tool for the initial sizing of general aviation aircraft has been developed [9]. It allows the sizing of conventional, fully-electric, and hybrid-electric aircraft. Recently, the tool has also been expanded to allow the sizing of SMR UAVs. The newly derived drag estimation technique for those aircraft is used in the aerodynamic model of this tool to increase its capabilities. The paper will further show the impact of the enhanced drag estimation accuracy based on the sizing results of an SMR UAV.
2 Methodology
2.1 Equivalent skin friction approach
The equivalent skin friction method models an aircraft’s par-asitic drag with a skin friction coefficient in analogy to a flat plate. This equivalent skin friction coefficient is multiplied with the aircraft’s total wetted area, which is assumed to be proportional to the total parasitic drag. The basic formula-tion of the method is given in Eq. (1).
The application of the method requires an equivalent skin friction coefficient and the ratio of the aircraft’s wet-ted area to reference (wing) area as inputs. Some wetted area estimates depending on the aircraft class are given in Raymer [1]. However, no data for UAVs is available.
The equivalent skin friction coefficient strongly depends on the aircraft category for two distinctive reasons: first, the size and flight speed of the aircraft category dictates its Reynolds number range. Larger aircraft at higher speeds operate at significantly larger Reynolds numbers than small, low-speed aircraft. Generally, an increase in Reynolds num-ber reduces the turbulent skin friction coefficient and, there-fore, also the equivalent skin friction coefficient.
Second, the equivalent skin friction coefficient has to rep-resent the complete parasitic drag of an aircraft. However, only a portion of the aircraft’s parasitic drag is friction drag
(1)CDmin = Cfeq ⋅Swet
Sref

591Full configuration drag estimation of short‑to‑medium range fixed‑wing UAVs and its impact…
1 3
and thus proportional to the wetted area. A large amount of aircraft parasitic drag can be pressure drag caused by flow separation or bluff body flow. Pressure drag is not pro-portional to the aircraft’s wetted area, and aircraft with sig-nificant parasitic pressure drag must have higher equivalent skin friction coefficients to account for this. The amount of parasitic pressure drag depends on the aerodynamic smooth-ness of the aircraft and, thereby, on the aircraft category.
An overview of equivalent skin friction coefficients for various aircraft categories is found in Ref. [1], and here shown in Table 1. It is important to note that these values are averaged for each aircraft category. The values for individual aircraft might also significantly scatter within a certain air-craft class, see Ref. [10]. This is caused by the individual aerodynamic behaviour of each aircraft. The level of scat-tering is generally accepted given that the method is only applied in very early aircraft design stages. Therefore, the application of average values is common. To date, no equiv-alent skin friction coefficient for SMR UAVs is available.
2.2 UAV geometry selection and modeling
The UAVs that were investigated in this study were chosen according to the findings of an extensive in-house database. It provides a range of statistical data that includes general dimensions, detailed shapes, and flight performance param-eters. Very little information on the detailed geometry of SMR UAVs is openly available as most manufacturers keep these a secret. Therefore, the information for the database was taken from high-quality images or three-view drawings. A central part of the database is the estimation of a UAV’s wetted area as a direct input into the equivalent skin friction drag estimation. The geometry is simplified and approxi-mated by shapes for which analytical equations are avail-able. Depending on the component, multiple geometrical representations are available, and the most realistic one can be chosen by the user. The geometrical breakdown of the UAVs is detailed. Taking the data acquisition accuracy into account, the overall accuracy for the total UAV wetted area is about 10–15%. This is considered adequate for the desired purpose. Further information on the database can be found in Ref. [11]
10 SMR UAVs included in the database were selected as being representative, and their geometry remodeled using NASA’s OpenVSP [12]. The CAD models of all UAVs were derived from drawings and images and do not pose exact CAD geometries from manufacturers. While being repre-sentative of the analyzed UAV class, one should not treat the presented data as original data of the real aircraft. It is, however, reasonable to assume that the models behave realistically in terms of their level of parasitic drag and the individual drag contribution of each aircraft component.
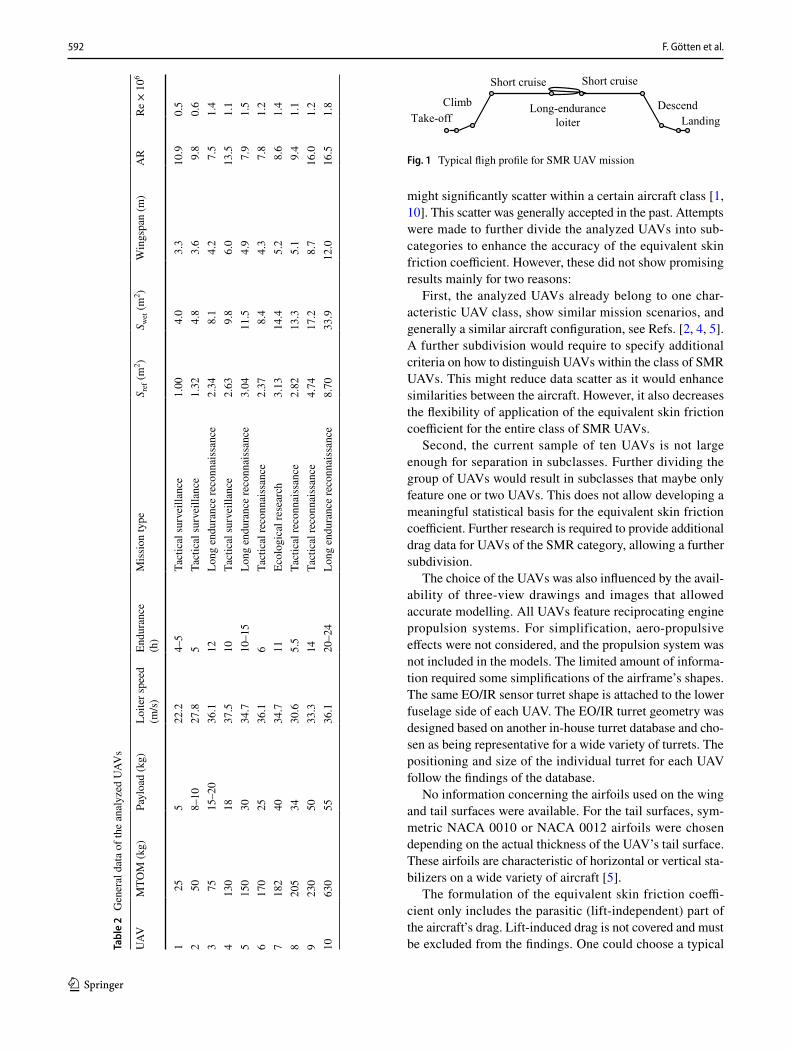
Table 2 gives an overview of the UAVs’ most important data. Take-off masses range from 25 kg up to 630 kg and therefore reflect the typical range of SMR UAVs. This range might seem rather large compared to take-off mass ranges of manned aircraft categories but is a characteristic of this class of UAVs [2]. Even though the UAVs show significant size differences, their geometry, mission scenarios, and use cases are quite similar. The UAVs mostly feature the twin tailboom configuration, a fixed tricycle landing gear, and an EO/IR sensor turret attached to their lower fuselage. Aspect ratios are moderate to large, and they are employed for surveillance, reconnaissance or research missions. Such scenarios follow a typical flight profile, which is highlighted in Fig. 1. The UAV takes off, climbs to a designated alti-tude, and cruises to its surveillance or reconnaissance area. There it loiters for an extensive amount of time, cruises back and lands again. Nominal flight altitudes are on the order of 500–1500 m, and loiter speeds optimized for long endur-ance [5].
The similar mission scenarios are also reflected in compa-rable payload fractions, which range from 0.14 to 0.25 for all but the heaviest UAV. This one has a payload fraction of only 0.087 but by far the longest endurance. In such, payload frac-tion is treated against fuel fraction. Wing aspect ratios are optimized for low speed loiter flight and range from 7.5 up to 16.5. Only the two heaviest UAVs with the longest endur-ances feature values above 16, while most of the smaller UAVs have aspect ratios between 7.5 and 10.
The endurance statements of the UAVs can vary consid-erably, and care has to be taken when interpreting the data. Manufacturers tend to lengthen their UAVs’ endurances for advertisement purposes and sometimes provide values that can only be reasonably achieved, reducing payload capabili-ties. All analyzed UAVs are shown in Fig. 2. This figure is not to scale and trimmed for visualization purposes. A scaled top-view of the UAVs is presented in Fig. 3. It is recog-nized that while the typical twin-tailboom configuration is dominant, the exact shapes of the UAVs differ, representing the design philosophies of the manufacturers. These shape differences are also expected to have an influence on the equivalent skin friction coefficient, given their effect on the aerodynamic smoothness of the UAVs. Previous research also highlighted that equivalent skin friction coefficients
Table 1 Equivalent skin friction coefficients for various aircraft
Aircraft type Cfeq Typical cruise wing-chord Re
Jet Bomber and Civil Transport 0.0026–0.0030 80,000,000Military Cargo 0.0035 80,000,000Jet Fighter 0.0035 30,000,000Light Aircraft–Single Engine Prop 0.0055 8,000,000Light Aircraft–Twin Engine Prop 0.0045 12,000,000
592 F. Götten et al.
1 3
might significantly scatter within a certain aircraft class [1, 10]. This scatter was generally accepted in the past. Attempts were made to further divide the analyzed UAVs into sub-categories to enhance the accuracy of the equivalent skin friction coefficient. However, these did not show promising results mainly for two reasons:
First, the analyzed UAVs already belong to one char-acteristic UAV class, show similar mission scenarios, and generally a similar aircraft configuration, see Refs. [2, 4, 5]. A further subdivision would require to specify additional criteria on how to distinguish UAVs within the class of SMR UAVs. This might reduce data scatter as it would enhance similarities between the aircraft. However, it also decreases the flexibility of application of the equivalent skin friction coefficient for the entire class of SMR UAVs.
Second, the current sample of ten UAVs is not large enough for separation in subclasses. Further dividing the group of UAVs would result in subclasses that maybe only feature one or two UAVs. This does not allow developing a meaningful statistical basis for the equivalent skin friction coefficient. Further research is required to provide additional drag data for UAVs of the SMR category, allowing a further subdivision.
The choice of the UAVs was also influenced by the avail-ability of three-view drawings and images that allowed accurate modelling. All UAVs feature reciprocating engine propulsion systems. For simplification, aero-propulsive effects were not considered, and the propulsion system was not included in the models. The limited amount of informa-tion required some simplifications of the airframe’s shapes. The same EO/IR sensor turret shape is attached to the lower fuselage side of each UAV. The EO/IR turret geometry was designed based on another in-house turret database and cho-sen as being representative for a wide variety of turrets. The positioning and size of the individual turret for each UAV follow the findings of the database.
No information concerning the airfoils used on the wing and tail surfaces were available. For the tail surfaces, sym-metric NACA 0010 or NACA 0012 airfoils were chosen depending on the actual thickness of the UAV’s tail surface. These airfoils are characteristic of horizontal or vertical sta-bilizers on a wide variety of aircraft [5].
The formulation of the equivalent skin friction coeffi-cient only includes the parasitic (lift-independent) part of the aircraft’s drag. Lift-induced drag is not covered and must be excluded from the findings. One could choose a typical Ta
ble
2 G
ener
al d
ata
of th
e an
alyz
ed U
AVs
UAV
MTO
M (k
g)Pa
yloa
d (k
g)Lo
iter s
peed
(m
/s)
Endu
ranc
e(h
)M
issi
on ty
peS r
ef (m
2 )S w
et (m
2 )W
ings
pan
(m)
AR
Re ×
106
125
522
.24–
5Ta
ctic
al su
rvei
llanc
e1.
004.
03.
310
.90.
52
508–
1027
.85
Tact
ical
surv
eilla
nce
1.32
4.8
3.6
9.8
0.6
375
15–2
036
.112
Long
end
uran
ce re
conn
aiss
ance
2.34
8.1
4.2
7.5
1.4
413
018
37.5
10Ta
ctic
al su
rvei
llanc
e2.
639.
86.
013
.51.
15
150
3034
.710
–15
Long
end
uran
ce re
conn
aiss
ance
3.04
11.5
4.9
7.9
1.5
617
025
36.1
6Ta
ctic
al re
conn
aiss
ance
2.37
8.4
4.3
7.8
1.2
718
240
34.7
11Ec
olog
ical
rese
arch
3.13
14.4
5.2
8.6
1.4
820
534
30.6
5.5
Tact
ical
reco
nnai
ssan
ce2.
8213
.35.
19.
41.
19
230
5033
.314
Tact
ical
reco
nnai
ssan
ce4.
7417
.28.
716
.01.
210
630
5536
.120
–24
Long
end
uran
ce re
conn
aiss
ance
8.70
33.9
12.0
16.5
1.8 Climb
Take-off
Short cruise
Long-enduranceloiter
Short cruise
DescendLanding
Fig. 1 Typical fligh profile for SMR UAV mission

593Full configuration drag estimation of short‑to‑medium range fixed‑wing UAVs and its impact…
1 3
cambered airfoil for the UAVs’ wings and trim the wing incidence angle to reach the desired lift coefficient. However, in this configuration, the influence of induced drag is sig-nificant. To adequately account for the lift-independent drag formulation, the wing’s induced drag must be subtracted from the wing’s parasitic pressure drag. This, however, is not
trivial using a volume resolving CFD method. Lift-induced drag is often calculated by wake surveys that are prone to numerical diffusion effects. Furthermore, a strict distinction between the vortices causing lift-induced drag of the wing and other flow protuberances in the far-field is not directly possible in case a full aircraft configuration is considered.
Fig. 2 Isometric views of the analyzed UAVs (not to scale)

594 F. Götten et al.
1 3
Further information is provided in Refs. [13, 14]. These fac-tors significantly reduce the accuracy of the wing-induced drag calculation and therefore enhance the inaccuracy of the wing’s parasitic pressure drag computation.
It was therefore decided to employ the symmetric NACA 0015 airfoil over the complete wingspan of each UAV. The symmetric airfoil, in combination with zero wing incidence, automatically enforces zero-lift conditions.
2.3 Numerical simulation approach
The analyses were performed using the computational fluid dynamics software StarCCM + v15.02. This finite volume solver is well-known in both industry and academia and has been validated for a variety of cases [15]. The Unsteady Reynolds-averaged Navier–Stokes (URANS) equations are solved with a SIMPLE (Semi Implicit Method for Pressure Linked Equations) algorithm assuming incompressibility due to the low Mach number regime (see Ref. [16]). Both the physical and numerical approach follows the guidelines presented in Ref. [17].
The numerical grid in the free volume was of an unstructured Cartesian type that allows the discretization of arbitrarily complex geometries. The near-wall flow was resolved with a dedicated prismatic boundary layer mesh. The numerical solution was second-order accurate in both space and time. It employed upwind schemes for discretizing convective fluxes, while diffusive ones were approximated
with central differences. Menter’s Shear Stress Transport (SST) model closed the RANS equations combined with a cubic non-linear constitutive option. This Explicit Alge-braic Reynold Stress Model (EARSM) enhances the predic-tion capabilities of anisotropy of turbulence [18, 19]. It is valuable for secondary flows caused by swirls or separation. The freestream turbulence intensity at the flow inlet was set to 0.5% in combination with a turbulent viscosity ratio of 5. Sustainment terms added to the transport equations of the turbulence model guaranteed that both turbulent kinetic energy and specific dissipation rate did not dissipate in the free flow [20].
All UAVs were analyzed at zero degrees angle of attack, assuming free atmospheric flight conditions. Therefore, a large flow domain was used that extended 30 times the maximum body length in flow direction and 15 times per-pendicular to the flow.
At the inlet boundary conditions, velocity, ambient pres-sure, and turbulence variables were fixed. The inlet veloc-ity corresponded to the given Reynolds number in Table 2, assuming mean sea level conditions. The pressure at the outlet boundary condition was set to the ambient reference pressure, while the velocity was extrapolated from the adja-cent cells in the domain. A cut through the 3D domain is shown in Fig. 4.
The UAV surfaces were discretized with quadratic cells following guidelines given in Ref. [17]. At least 80 cells were used in the chord-wise direction of the lifting surfaces
UAV 1 UAV 2 UAV 3 UAV 4 UAV 5
UAV 6 UAV 7 UAV 8 UAV 9 UAV 10
0 1 2 3 4 5 6 7 8 9 10 m
Fig. 3 Top-view of all analyzed UAVs; 1–10 from top left to bottom right (figure to scale)

595Full configuration drag estimation of short‑to‑medium range fixed‑wing UAVs and its impact…
1 3
with additional refinements at leading and trailing edges. The near-wall region was discretized with 30 prismatic cell layers, whereby the first cell height ensured having y+ values on the order of 0.5–0.8 for all cases. At least 10 cell lay-ers discretized the viscous sublayer. The transition between the boundary layer mesh and core mesh was smooth, with cell sizes being very similar. The surface mesh of UAV 9 is shown in Fig. 5, together with a close-up of the boundary layer and volume mesh.
The overall cell count of each simulation depends on the individual UAV and its complexity. It varies between 55 and 80 million hexahedral cells. Grid dependency studies were conducted for all UAV configurations ensuring grid-inde-pendent results for the total drag and the drag of individual components. Exemplary grid dependency studies of UAVs 1 and 10 showing total drag and turret drag are presented in Fig. 6.
The time step was approximated with typical Strouhal numbers of spheres and cylinders for comparable Reynolds numbers [21]. It was later adjusted by testing several time step reductions, whereby a value of 2.5 × 10⁻⁴ s was found to be optimal. After initial stabilization, the simulations were run for at least two more seconds (8000 time-steps). This corresponds to about 60–120 vortex oscillation periods of spheres or cylinders at comparable Reynolds numbers.
2.4 Validation
The simulation approach is validated by comparing it to a wind tunnel study of an 0.4-scale model of the AAI RQ-2 Pioneer UAV presented by Bray in Ref. [22]. The Pioneer UAV is a 205 kg surveillance and reconnaissance UAV employed by the United States and Israel. The model was tested in the Low-Speed Wind-Tunnel (LSWT) at Wichita State University. The tests were run at a chord-based Reyn-olds number of about 1.06 million, which corresponds to the full-scale free flight Reynolds number in 10,000 ft. The wing of the wind tunnel model has a NACA 4415 airfoil section and an incidence of two degrees. In such, minimum drag conditions are expected for positive lift. The model features a dummy payload consisting of a hemisphere attached to the lower fuselage. Further geometrical details of the model are presented in Ref. [22]. An angle of attack sweep from − 8° up to 14° was simulated with the above presented unsteady RANS approach. The results for both lift, drag, and moment coefficients are given in Figs. 7 and 8. Both lift, drag, and longitudinal moment match the wind tunnel data within 5% for moderate angles of attack. The simulation overpredicts the lift coefficient at higher angles of attack, which is typical for RANS-based approaches. However, stall conditions are achieved earlier than in the wind tunnel.
Velocity inlet
Pressure outlet
Fig. 4 Simulation domain on the symmetry plane (not to scale)
Fig. 5 Level of surface discretization and boundary layer mesh
0
20
40
60
80
100
120
140
0
100
200
300
400
500
600
700
0 20 40 60 80 100
CD
turre
t, dr
ag c
ount
s
CD
tota
l, dr
ag c
ount
s
No. of cells, Million
UAV 1 CD totalUAV 10 CD totalUAV 1 CD turretUAV 10 CD turret
UAV 1 CD totalUAV 10 CD totalUAV 1 CD turretUAV 10 CD turret
Fig. 6 Grid dependency study for UAVs 1 and 10

596 F. Götten et al.
1 3
The longitudinal moment matches the wind tunnel data for moderate angles of attack and starts deviating when approaching stall conditions. Drag is accurately simulated up to about 8 degrees angle of attack (CL = 1.0, deviations below 5%).
Higher lift conditions show an underestimation of drag along with an overprediction of lift. The validation high-lights that the chosen simulation approach is sufficiently accurate for the desired analysis cases.
3 Results
The following section describes the results of the numeri-cal analyses. A full aerodynamic investigation of the UAVs is beyond the scope of this publication. Therefore, only an overview of the pressure coefficient distribution on each of
the UAVs’ surfaces is given in Fig. 9. Further investigations focus on the parasitic drag of the UAVs.
Stagnation conditions are always found at the fuselage noses, while only a moderate level of flow acceleration is noted on the wing’s surfaces. This is due to the chosen sym-metric airfoil and zero degrees angle of attack. Significant flow acceleration and separation effects can be seen for both the landing gears and EO/IR turrets.
3.1 Parasitic drag analysis
The lift-independent pressure drag of the UAV’s wings is corrected for airfoil camber effects with the following approach: Airfoil drag generally consists of friction and pressure drag. Assuming fully attached flow, the pressure drag is referred to as boundary layer pressure drag. This drag is essentially due to the way the boundary layer changes the viscous pressure distribution of the airfoil compared to the inviscid case. Cambered and symmetric airfoils obviously have different inviscid pressure distributions. The presence of the boundary layer changes their pressure distributions, which yields larger boundary layer pressure drag for cam-bered airfoils due to their shape and the associated higher levels of flow acceleration [23]. This is valid for small and moderate angles of attack. It increases the total airfoil drag (often termed profile drag) of a cambered airfoil compared to a symmetric one.
The increased profile drag of cambered airfoils mani-fests itself in an increased lift-independent drag of a 3D wing compared to a wing with a symmetric airfoil. Based on wind-tunnel data from Ref. [24] and own data of the authors, a representative NACA 4415 airfoil used on sev-eral UAVs shows 1.08 times higher profile drag compared to a NACA 0015 airfoil assuming fully turbulent flow. The wing’s drag is, therefore, increased by this factor. The influ-ence on total drag, is generally small and does not exceed 3% of the total drag. For consistency, this correction is only applied for developing the equivalent skin friction coeffi-cient and not for the investigation of the drag break-down as derived from the CFD analyses. This is indicated for each of the following figures.
The parasitic drag break-down of all UAVs is shown in Fig. 10. normalized to the reference area of each individual UAV. Total drag varies between 302 and 618 drag counts. This significant margin is in part caused by the normaliza-tion with the UAV reference areas that vary considerably. For example, UAV 8 with the highest parasitic drag coeffi-cient is one of the larger UAVs studied here but has a refer-ence wing area that is comparable to the much smaller UAV 4. This increases the drag count for all components of UAV 8 compared to UAVs with larger reference areas.
Comparing the drag break-downs of the analyzed UAVs allows deriving initial characteristic drag aspects for the
-1.0
-0.5
0.0
0.5
1.0
1.5
2.0
-0.6-0.4-0.20.00.20.40.60.81.01.21.41.61.82.0
-10 0 10 20
CM
CL
AoA, deg
CL URANS - this studyCL wind-tunnel - BrayCM URANS - this studyCM wind-tunnel - Bray
CL URANSCL Wind-tunnel - BrayCM URANSCM Wind-tunnel - Bray
0
0
Fig. 7 Pioneer lift and moment with data from Ref. [22]
-0.4
-0.2
0.0
0.2
0.4
0.6
0.8
1.0
1.2
1.4
1.6
0.00 0.05 0.10 0.15 0.20
CL
CD
URANS
Wind-tunnel - Bray
Fig. 8 Pioneer drag polar with data from Ref. [22]

597Full configuration drag estimation of short‑to‑medium range fixed‑wing UAVs and its impact…
1 3
specific class of SMR UAVs. Wing, tail, fuselage, and tailboom only contribute between 40 and 64% of the total parasitic drag share, despite having about 90% of the entire airframe wetted area. Tailboom drag is rather small and does not exceed 3% of the total parasitic drag. The most impor-tant parts of the large airframe components are wing and fuselage. Tail drag is always below 10% of the total parasitic drag.
The drag of landing gears and EO/IR sensor turrets is very significant for all UAVs, while landing gear drag is higher than turret drag in most instances. Together, landing gear and EO/IR sensor turret are responsible for 36–60% of
the total parasitic drag of an SMR UAV. These components behave like bluff bodies and show high levels of flow sepa-ration causing significant pressure drag. Antenna drag does only play a minor role considering the airframe attachments and does never exceed 9% of the parasitic drag. The antennas of UAVs 8 and 9 show the highest drag share caused by large spherical and cylindrical shapes. However, these were rarely found for the UAVs analyzed in the in-house database, and most UAVs have smaller antennas, causing only minimal parasitic drag.
Research has shown that the parasitic drag break-down is usually specific for an individual aircraft category [25]. Even
Fig. 9 Isometric views of pressure coefficient on UAV surface (UAVs not to scale)

598 F. Götten et al.
1 3
though the exact drag break-down depends on the individual configuration, clear trends may be observed. The data of all analyzed UAVs were averaged and presents a typical SMR UAV-specific drag break-down, in Fig. 11. This is a common procedure in the statistical analysis of parasitic drag and was also performed for other aircraft categories [25]. An aver-aged parasitic drag break-down allows focusing on the most critical components that generally cause the highest parasitic drag. Such information is beneficial in early UAV design, as it enables the aerodynamicist to target the right parts for drag reduction measures.
The average SMR UAV wing contributes to 27% of the total parasitic drag, while the average fuselage shares about 17% of the total parasitic drag. Both landing gear and turret are responsible for 47% of an SMR UAV’s parasitic drag. On average, the turret of an SMR UAV causes more drag than its fuselage. The drag of antennas and tailbooms is comparably small, and all components together only contribute about 4–5% of the parasitic drag.
A majority (57–73%) of total SMR UAV drag is pres-sure drag mainly caused by the EO/IR sensor turret, land-ing gear, and fuselage. The comparably high-pressure drag shares of the fuselages are primarily driven by aft separa-tion and manifests themselves as base drag. The friction and pressure drag characteristics of full UAV configurations are, therefore, vastly different compared to larger manned aircraft categories. The parasitic drag of these types of aircraft is mainly friction drag with only a small portion of pressure drag [10]. The specific pressure drag characteristics of SMR UAVs will significantly affect their behaviour considering their equivalent skin friction coefficients.
The averaged SMR UAV-specific parasitic drag break-down is compared to a typical transport jet drag break-down in Fig. 11. The transport jet drag break down uses data from Ref. [25] showing the parasitic drag in cruise configuration
at Mach 0.8. The differences between UAV and transport aircraft are significant. Wing, tail and fuselage of a trans-port aircraft are responsible for about 83% of the parasitic drag, while these surfaces only contribute 53% to the typical UAV parasitic drag. Transport jets use retractable landing gears due to their focus on speed and range and are usually
0
100
200
300
400
500
600
700
1 2 3 4 5 6 7 8 9 10
CD
UAV
WingTailTailboomFuselage Landing gearEO/IR turretAntennas
x10-
4
Fig. 10 Parasitic drag break-down (NACA 0015 airfoil on wing)
Wing 27%
Tail 5%
Fuselage 17%
Tailbooms 2%
Landing gear 28%
Turret 19%
Antennas 2%SMR UAV average
Wing 36%
Tail 19%
Fuselage 28%
Nacelle 7%
Misc. 10%
Typical transport aircraft
Fig. 11 Averaged SMR UAV parasitic drag break-down (NACA 0015 airfoil on wing) and typical transport drag break-down, with data from Ref. [25]

599Full configuration drag estimation of short‑to‑medium range fixed‑wing UAVs and its impact…
1 3
not equipped with EO/IR sensor turrets. Both significantly reduces the parasitic drag and increases the influence of the large airframe surfaces.
The parasitic drag coefficients of all analyzed UAVs are shown in Table 3. They are normalized to the UAV’s refer-ence wing area. The equivalent skin friction coefficients of all UAVs are computed according to Eq. (1). The coefficients naturally scatter with the UAV configuration. The table both shows the data from the CFD analyses using a NACA 0015 airfoil on the UAVs’ wings and the correction for airfoil camber assuming a NACA 4415 airfoil. The correction for the cambered wing airfoil increases total drag by less than 3%, which directly increases the equivalent skin friction coefficients in the same manner. Such small influence is not relevant given the rather crude accuracy of the method for initial design. The data scatter (standard deviation of 0.00157) is on the expectable order of magnitude and also comparable to what is found for other aircraft categories, see Ref. [10].
The distribution of the UAV’s equivalent skin friction coefficients is additionally shown in the bar diagram plot of Fig. 12 in comparison to the values for two other aircraft categories given in Ref. [1]. The new SMR UAV equiva-lent skin friction coefficient is more than double as high compared to the light aircraft—single engine category and more than four times higher compared to the civil transport jet category. The high level of parasitic drag and the signifi-cant influence of miscellaneous components are the main reasons for the high equivalent skin friction coefficient of SMR UAVs.
3.2 Wetted area regressions
The equivalent skin friction coefficient drag estimation requires knowledge of the new aircraft’s wetted area.
Depending on the aircraft sizing algorithm and tool, the total wetted area might be calculated based on simple geometrical relationships that are available for the design. However, in case a total wetted area is not available in the design algo-rithm, several correlations for wetted areas of different air-craft categories are found in the literature (Refs. [1, 10]). However, no relationships for SMR UAVs are available. Therefore, a new correlation between total UAV wetted area and maximum take-off mass is developed using the in-house database. The data is shown in Fig. 13, together with the for-mulation of a simple power-law fit. The fit can describe the mean of the data; however, scatter is considerable. Whenever
Table 3 Equivalent skin friction coefficient of 10 SMR UAVs
UAV CDmin, NACA0015,drag counts
CDmin, corrected for NACA4415,drag counts
Cfeq NACA0015
Cfeqcorrected for NACA4415
1 516.4 528.2 0.0128 0.01312 360.7 370.1 0.0099 0.01023 302.2 310.4 0.0087 0.00894 432.3 441.4 0.0115 0.01185 470.9 506.1 0.0124 0.01336 407.0 416.2 0.0115 0.01187 428.4 436.5 0.0093 0.00958 617.6 626.1 0.0132 0.01339 373.7 383.0 0.0103 0.010510 343.3 352.2 0.0088 0.0090Average 425.2 437.0 0.1084 0.01115
0.000
0.002
0.004
0.006
0.008
0.010
0.012
0.014
0.016
1 2 3 4 5 6 7 8 9 10
Ctnelaviuqef
UAV
Light aircraft single engine - Raymer
Civil transport jet- Raymer
Average SMR UAV - this study
Fig. 12 Equivalent skin friction coefficient of 10 SMR UAVs (cor-rected for NACA 4415 airfoil on wings)
0
5
10
15
20
25
30
35
40
0 100 200 300 400 500 600 700
Sw
etm
²
MTOM, kg
Fig. 13 SMR UAV wetted area vs. MTOM, UAVs used in this study are marked in red

600 F. Götten et al.
1 3
more accurate estimations are available, it is highly desirable to use them.
3.3 UAV sizing process
To show the impact of the new drag estimation coefficient on the UAV design process, a case study is briefly presented in this section. The author’s in-house aircraft design tool [9, 26, 27] is updated with the newly derived equivalent skin friction coefficient for SMR UAVs. Then, the preliminary sizing of a typical SMR UAV is carried out. The results are compared to the results of a sizing that uses the skin friction coefficients for single-engine prop and for jet air-craft. This study will show how this single parameter will
influence the overall design of a UAV, thereby demonstrating its importance.
3.3.1 Aircraft and mission
A notional twin-boom reconnaissance SMR UAV is selected for the sizing study. The concept features a single pusher propeller and twin tail booms. A sketch of the notional aircraft is provided in Fig. 14. The UAV is designed for a typical long-endurance surveillance mission, which is shown in Fig. 15. Six hours of loiter at best endurance speed is required, as well as a quick 150 km dash at 65 m/s into- and out of the target area. A 15 kg payload of surveillance and communication equipment must be carried. Top-level requirements and a mission description are shown in Table 4.
3.3.2 Sizing approach
Because this paper focuses on the aerodynamic methods, the sizing approach is not presented in the full extend. The most important points are summarized in this section before the results, and the lessons learned from the results are dis-cussed in more detail in the following section.
The requirements of Sect. 3.3.1 are used to size the air-craft and perform the mass analysis. To assess the impact of the novel equivalent skin friction factor, the sizing process is performed three times. First, the authors’ novel skin fric-tion coefficient is used. The sizing is then repeated using Raymer’s skin friction coefficient for general aviation air-craft, and once more using the highly optimistic values rep-resentative of civil and military jet transports. The authors expect that using these different drag factors will decidedly change the sizing results.
The sizing process is supported by an optimization rou-tine. In particular, a global optimization scheme, the parti-cle swarm method, is employed to find an optimal design for the given set of TLARs and constraints. It is used to select the best possible combination of wing loading W/S,
Fig. 14 Notional SMR UAV concept
Fig. 15 Notional SMR UAV design mission
Table 4 Notional SMR UAV design parameters and mission
Parameter Value Parameter Value
Take-off Ground Roll (m) 250 SensorPayload (kg)
15
Rate of Climb at MSL (m/s) 3 Taxi and Take-off at MSLStall Speed (m/s) 30 Climb to Altitude 2000 mDash Speed (m/s) 65 Ingress to Target Area 150 kmLoiter Speed (m/s) 45 Loiter over Target Area for 6 hMax. Lift Coef.CL,max
1.30 Egress from Target Area 150 km
ServiceCeiling (m)
4600 Descend, Land, and Taxi at MSL
PropulsionSystem
4-Stroke ICE ICE best BSFC (g/kg/h) 315

601Full configuration drag estimation of short‑to‑medium range fixed‑wing UAVs and its impact…
1 3
power-to-weight ratio P/W, wing aspect ratio AR. These design variables have been shown to be appropriate for the initial design of subsonic aircraft [28]. The influence of W/S and AR on the induced drag of the aircraft is cap-tured, using methods from Ref. [1]. However, the zero-lift drag coefficient is calculated using different Cfeq and the aircraft’s wetted area.
A simplified illustration of the process is provided in Fig. 16. Analysis steps of the sizing process are indicated in blue boxes, while optimization steps are indicated in red boxes. Further information on the design process can be found in Ref. [29]
Minimum MTOM is selected as the optimization’s objective. The minimization of MTOM is usually the goal during aircraft design since it is widely acknowledged that “the lightest aircraft that does the job is considered the best” [W. H. Mason, “Modern Aircraft Design Tech-niques,” in Handbook of Transportation Engineering, McGraw-Hill, 2003, pp. 26.1–26.24]. Designers tradi-tionally use aircraft weight to predict cost, as cost scales almost linearly with aircraft weight.
Another suitable measure for assessing aircraft is their energy consumption. The required energy for the design mission is readily available, as it is determined by the mission analysis and then used to determine the aircraft’s energy mass fraction. This parameter will also be assessed in the result’s analysis.
3.3.3 Results of SMR UAV Sizing
The results of the sizing study are presented in Table 5. As expected, using an improper Cfeq will drastically impact the sizing and optimization results.
Using the author’s Cfeq value of 0.01084 (here directly taken from the analysis results using a NACA 0015 as the wing airfoil) resulted in a typical SMR UAV layout: a highly loaded, high AR wing is used to offset the high CDmin.
If designers were to assume typical Cfeq values for light aircraft, the result is driven away from such a typical geo-metric layout. The optimal AR, as well as the optimal W/S is reduced. Also, P/W is reduced, as a lot less aerodynamic drag needs to be overcome. The MTOM is estimated more than 20% too low, and the energy consumption is off by 61%.
Finally, using a Cfeq value of 0.0028, as is typical for jet transports, drives down AR, W/S, and P/W even further. The result has very little to do with the actual geometry found for SMR UAVs. For this design, MTOM is off by 25%, and energy consumption is 90% underestimated, compared to the result that uses the author’s Cfeq value.
These results show that by using an inappropriate Cfeq, very large errors are introduced in the design process. Such errors are very costly to correct in later design stages. If drag is underestimated for the first sizing computations, a redesign will have to follow once this issue is found. Using the authors’ novel Cfeq value will prevent additional design iterations.
A scaled illustration of the three different designs is provided in Fig. 17. This makes it easy to appreciate the differences in design that the optimization process selected. It becomes quite clear that selecting a proper drag model as early as possible in the design process is of utmost importance to avoid costly iterations at later stages of a program.
Fig. 16 Optimization process
Table 5 Sizing results—notional SMR UAV
Cfeq 0.011 0.0055 0.0028Parameter UAVs [authors] Light Aircraft Jets
CDmin 0.0470 0.0236 0.0106MTOM (kg) 311 256 248Energy (GJ) 1.74 1.08 0.92W/S (N/m2) 714 588 334P/W (W/kg) 110 78 62AR 15.0 9.7 6.5Error relative to UAV Cfeq of the authors MTOM (%) – 21.5 25.4 Energy (%) – 61.1 89.1

602 F. Götten et al.
1 3
4 Conclusion
The paper presents the derivation of a new equivalent skin friction coefficient for estimating the parasitic drag of SMR UAVs. Such UAVs are nowadays employed on surveillance, reconnaissance, and search and rescue missions. Their para-sitic drag is much larger compared to other aircraft catego-ries. It is significantly influenced by the presence of mis-cellaneous components like fixed landing gears and EO/IR sensor turrets. The new equivalent skin friction coefficient is more than double as high as common coefficients found for small single-engine aircraft. The coefficient might be employed with a new wetted area regression for SMR UAVs that allows determining the wetted area based on a UAVs maximum take-off mass.
The initial sizing of a novel SMR UAV is significantly affected by the parasitic drag estimation. Choosing an incor-rect friction coefficient will drive the design significantly away from an optimal layout. The new equivalent skin fric-tion coefficient significantly enhances drag estimation in early conceptual design stages.
Acknowledgements The authors like to express their gratitude to Sie-mens PLM Software for providing academic licenses of their software StarCCM+.
Funding Open Access funding enabled and organized by Projekt DEAL. Funding for this work was provided by the Department of Aero-space Engineering of FH Aachen University of Applied Sciences and the College of Science Engineering and Health of the Royal Melbourne Institute of Technology.
Open Access This article is licensed under a Creative Commons Attri-bution 4.0 International License, which permits use, sharing, adapta-tion, distribution and reproduction in any medium or format, as long as you give appropriate credit to the original author(s) and the source, provide a link to the Creative Commons licence, and indicate if changes were made. The images or other third party material in this article are included in the article’s Creative Commons licence, unless indicated otherwise in a credit line to the material. If material is not included in the article’s Creative Commons licence and your intended use is not permitted by statutory regulation or exceeds the permitted use, you will need to obtain permission directly from the copyright holder. To view a copy of this licence, visit http:// creat iveco mmons. org/ licen ses/ by/4. 0/.
References
1. Raymer, D.P.: Aircraft design. A conceptual approach, 6th edn. AIAA Education Series, Reston (2019) ISBN 978-1-62410-490-9
2. Valavanis, K.P., Vachtsevanos, G.J. (eds.): Handbook of unmanned aerial vehicles. Springer, Dordrecht (2015) ISBN 978-90-481-9706-4
3. Austin, R.: Unmanned aircraft systems. UAVS design, develop-ment and deployment, 2nd edn. Wiley, Chichester (2010) ISBN 978-0-470-05819-0
4. Sadraey, M.H.: Unmanned aircraft design. A review of fundamen-tals, Morgan & Claypool Publishers (2017) ISBN 9781681731681
5. Gundlach, J.: Designing unmanned aircraft systems: a comprehen-sive approach, 2nd edn. AIAA Education Series, Reston (2014) ISBN 978-1-62410-261-5
6. Panagiotou, P., Yakinthos, K.: Aerodynamic efficiency and perfor-mance enhancement of fixed-wing UAVs. Aerosp. Sci. Technol. (2019). https:// doi. org/ 10. 1016/j. ast. 2019. 105575
7. Panagiotou, P., Kaparos, P., Salpingidou, C., Yakinthos, K.: Aerodynamic design of a MALE UAV. Aerosp. Sci. Technol. 50, 127–138 (2016). https:// doi. org/ 10. 1016/j. ast. 2015. 12. 033
8. Götten, F., Havermann, M., Braun, C., Gómez, F., Bil, C.: On the applicability of empirical drag estimation methods for unmanned air vehicle design. In: 18th AIAA Aviation Technology Integration and Operations Conference. AIAA, Reston (2018) https:// doi. org/ 10. 2514/6. 2018- 3192.
9. Finger, D.F., Bil, C., Braun, C.: Initial sizing methodology for hybrid-electric general aviation aircraft. J. Aircr (2019). https:// doi. org/ 10. 2514/1. C0354 28
10. Roskam, J.: Airplane Design I-VIII. Roskam Aviation and Engi-neering Corporation, Ottawa (1987)
11. Götten, F., Finger, D.F., Braun, C., Havermann, M., Bil, C., Gómez, F.: Empirical correlations for geometry build-up of fixed wing unmanned air vehicles. In: The Proceedings of the 2018 Asia-Pacific International Symposium on Aerospace Technol-ogy (APISAT 2018), pp. 1365–1381. Springer, Singapore (2019) https:// doi. org/ 10. 1007/ 978- 981- 13- 3305-7_ 109
12. Gloudemans, J., Davis, P., Gelhausen, P.: A rapid geometry mod-eler for conceptual aircraft. In: 34th Aerospace Sciences Meet-ing and Exhibit. AIAA, Reston (1996) https:// doi. org/ 10. 2514/6. 1996- 52.
13. Marongiu, C., Tognaccini, R., Ueno, M.: Lift and lift-induced drag computation by lamb vector integration. AIAA J. 51(6), 1420–1430 (2013). https:// doi. org/ 10. 2514/1. J0521 04
14. Takahashi, T., Ou, C.-W.: When higher fidelity models degrade our understanding of induced drag—the tragedy of the trefftz plane integral. AIAA Scitech 2020 Forum (2020). https:// doi. org/ 10. 2514/6. 2020- 0276
15. CD-adapco, Validation of Star-CCM+ for External Aerodynamics in the Aerospace Industry https:// mdx2. plm. autom ation. sieme ns. com/ sites/ defau lt/ files/ Prese ntati on/ CD- adapco_ AeroV alida tion_ v7. pdf- aeros pace- indus try. Retrieved 22 Jan 2020
16. Hirsch, C.: Computational methods for inviscid and viscous flows. Wiley, Chichester (2002) ISBN 0471924520
17. Goetten, F., Finger, D.F., Marino, M., Cees, B., Havermann, M., Braun, C.: A review of guidelines and best practices for subsonic aerodynamic simulations using RANS CFD. In: APISAT 2019 Asia Pacific International Symposium on Aerospace Technology, pp. 227–245 (2019) ISBN 9781925627404
18. Hellsten, A.K.: New advanced k-w turbulence model for high-lift aerodynamics. AIAA J. 43(9), 1857–1869 (2005). https:// doi. org/ 10. 2514/1. 13754
19. Spalart, P.R.: Strategies for turbulence modeling and simulations. Int. J. Heat Fluid Flow 21(3), 252–263 (2000). https:// doi. org/ 10. 1016/ S0142- 727X(00) 00007-2
Fig. 17 Top-view of the three sizing results Cfeq = 0.011; 0.0055; 0.0028 from left to right
603Full configuration drag estimation of short‑to‑medium range fixed‑wing UAVs and its impact…
1 3
20. Spalart, P.R., Rumsey, C.L.: Effective inflow conditions for tur-bulence models in aerodynamic calculations. AIAA J. 45(10), 2544–2553 (2007). https:// doi. org/ 10. 2514/1. 29373
21. Lienhard, J.H.: Synopsis of lift, drag, and vortex frequency data for rigid circular cylinders. Bulletin 300 Washington State Uni-versity, Pullman (1966)
22. Bray, R.M.: A wind tunnel study of the Pioneer remotely piloted vehicle. Naval Postgraduate School, Monterey (1991) http:// hdl. handle. net/ 10945/ 43784. Retrieved 4 May 2020
23. Young, A.D.: Boundary Layers. AIAA Education Series, Wash-ington, DC (1989) ISBN 0930403576
24. Abbott, I.H., von Doenhoff, A.E. von, Stivers, L.S.: Summary of Airfoil Data. NACA TR-824 National Advisory Committee for Aeronautics, Langley Field (1945)
25. Jobe, C.E.: Prediction of Aerodynamic Drag. AFWAL-TM-84-203 U.S. Air Force, Dayton, Ohio (1984)
26. Finger, D.F., Götten, F., Braun, C., Bil, C.: Mass, primary energy, and cost. The impact of optimization objectives on the initial
sizing of hybrid-electric general aviation aircraft. CEAS Aeronaut. J. 18(2), 76 (2020). https:// doi. org/ 10. 1007/ s13272- 020- 00449-8
27. Finger, D.F., de Vries, R., Vos, R., Braun, C., Bil, C.: A Compari-son of Hybrid-Electric Aircraft Sizing Methods. AIAA Scitech 2020 Forum (2020)
28. Raymer, D.P.: Enhancing Aircraft Conceptual Design using Mul-tidisciplinary Optimization. PhD Thesis, Stockholm (2002) ISBN 91-7283-259-2
29. Finger, D.F.: Methodology for Multidisciplinary Aircraft Design under Consideration of Hybrid-Electric Propulsion Technology. PhD Thesis Royal Melbourne Institute of Technology, Melbourne (2020) https:// doi. org/ 10. 13140/ RG.2. 2. 31468. 59523
Publisher’s Note Springer Nature remains neutral with regard to jurisdictional claims in published maps and institutional affiliations.