Embed Size (px)
Citation preview

FULL-SCALE MSE TEST WALLS R.P. Stulgis GeoTesting Express, Inc., Boxborough, MA USA ABSTRACT
This paper describes research being performed under National Cooperative Highway Research Project (NCHRP) HR 24-22. The objective of the project is to develop selection guidelines, soil parameters, testing methods, and construction specifications that will allow the use of a wider range of reinforced fill materials within the reinforced zone of mechanically stabilized earth (MSE) walls. Phase I consisted of a literature search on the use and performance of different soil types for reinforced fill in MSE walls. State transportation agency and private industry responses to a “survey of the current practice” for MSE backfill were compiled. A full-scale field test is currently being conducted in Phase II to establish properties for “high fines” reinforced fill and associated design controls that give acceptable performance, and details are described. New guidelines for MSE backfill will be recommended, and will provide economic incentive to relax current MSE wall reinforced fill specifications. FULL-SCALE FIELD TEST
The results of the Phase I literature search and survey indicate that MSE walls on transportation projects are generally conservatively designed, with “low fines” reinforced soils. Private MSE walls are less conservatively designed, and use a variety of reinforced soils (NCMA allows for 35% < 0.075mm). It is also clear from the literature that reinforced soil consisting of fine-grained soils (either “high” fines or “high” plasticity) and pore pressure resulting from lack of drainage in the reinforced zone were the principle reasons for serviceability problems (excessive deformation) or failure (collapse).
However, on further review, it appears that a higher quantity of fines could be safely allowed in the reinforced fill, provided the properties of the materials are well defined and controls are established to address the design issues. The potential savings from replacing AASHTO reinforced fill materials with marginal reinforced fill materials could be in the range of 20 to 30% of current MSE wall costs.
A full-scale field test is currently being conducted, in order to establish properties for “high fines” reinforced soils and associated design controls that give acceptable MSE wall performance. The field test includes provisions to demonstrate the role of pore water pressure in the reinforced fill and the importance of including a positive drainage system to obtaining good wall performance. Based on the survey of the literature, to date, full-scale test or experimental MSE walls have not rigorously evaluated this important aspect.
The field test consists of four sections: One section with an A-1-a reinforced fill to
provide a baseline of performance for current AASHTO standards. A second section with an A-2-4 reinforced fill to demonstrate that non-plastic, silty sand materials with up to 35% fines (of
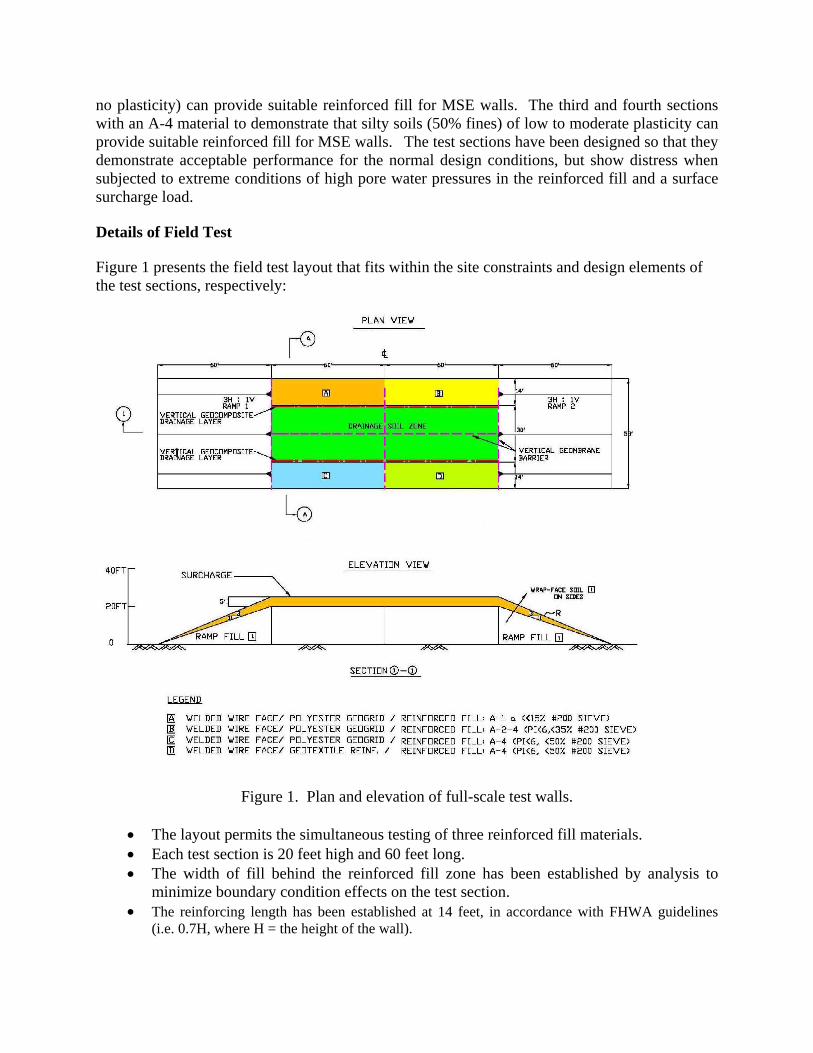
no plasticity) can provide suitable reinforced fill for MSE walls. The third and fourth sections with an A-4 material to demonstrate that silty soils (50% fines) of low to moderate plasticity can provide suitable reinforced fill for MSE walls. The test sections have been designed so that they demonstrate acceptable performance for the normal design conditions, but show distress when subjected to extreme conditions of high pore water pressures in the reinforced fill and a surface surcharge load. Details of Field Test Figure 1 presents the field test layout that fits within the site constraints and design elements of the test sections, respectively:
Figure 1. Plan and elevation of full-scale test walls.
• The layout permits the simultaneous testing of three reinforced fill materials. • Each test section is 20 feet high and 60 feet long. • The width of fill behind the reinforced fill zone has been established by analysis to
minimize boundary condition effects on the test section. • The reinforcing length has been established at 14 feet, in accordance with FHWA guidelines
(i.e. 0.7H, where H = the height of the wall).

• Test Section A employs an A-1-a reinforced fill, to provide a baseline of performance for current AASHTO standards. Polyester geogrid was used for the reinforcement.
• Test Section B employs an A-2-4 reinforced fill, to demonstrate that non-plastic to slightly plastic, silty sand materials with up to 35% fines (PI < 6) can provide suitable reinforced fill for MSE walls. Polyester geogrid was used for the reinforcement.
• Test Section C includes an A-4 material, to evaluate silty soils (50% fines) of low plasticity (PI < 6) and their behavior as reinforced fill for MSE walls. Polyester geogrid was used for the reinforcement.
• Test Section D employs the same A-4 material as Test Section C, but geotextile reinforcement was used in lieu of polyester geogrid.
• The reinforcement spacing was established at 18 inches. • The test sections have been hydraulically separated from each other. A vertical PVC
geomembrane was installed at the back of and along the sides of each test section. In addition, a PVC geomembrane was installed beneath the footprint of the test sections. The vertical PVC geomembrane was field welded to the base geomembrane.
• The fill material behind the reinforced fill zone consists of a sand with a permeability greater than 10-3 cm/sec.
• Welded wire was used for the wall face system. A geotextile wrap is provided at the face to retain the reinforced fill
Groundwater/Rainfall Simulation and Monitoring Porewater Pressure Effects An essential component of an MSE retaining wall that uses reinforced fill with “high fines” soil is aggressive drainage, to prevent the buildup of pore water pressure in the reinforced zone. This pore pressure produces an additional outward force that the wall must resist, and it reduces the strength of the soil that holds the wall in place. Review of case studies from Phase I indicated that pore water pressures behind the reinforced soil zone invariably played a major role for the serviceability problems, and, in some cases, complete collapse of walls with unacceptable behavior.
Therefore, the field test includes provisions to demonstrate the role of pore water pressure in the reinforced fill, and the importance of including a positive drainage system to obtaining good wall performance. Figure 2 shows how this will be accomplished. A geocomposite drainage material has been placed at the back of the reinforcement in each test section. It was wrapped around a slotted drain pipe at the bottom of the reinforced fill that will remove water from the drain.
To simulate groundwater, water will be pumped to a feed line at the top of the test
sections. A system of valves will control the introduction of water from the feed line into the individual drainage soil zones of each test section via slotted, vertical fill pipes. This will initiate horizontal flow towards the wall and into the geocomposite drain for the wall. By controlling the head in the drainage soil (with the drain pipe open), the effect of rising groundwater level on the performance of the wall can be simulated. We would expect little if any effect on the test sections, as long as the geocomposite drains function as designed.

Figure 2. Typical test wall cross-section.
This phase of the test is intended to demonstrate that various reinforced fill materials will provide suitable performance, even in areas with high groundwater conditions, as long as they are properly drained.
By closing a valve on the drain pipe and spraying water on top of the reinforced fill, the effects of poor drainage and heavy rainfall on the performance of MSE walls with various reinforced fills can be simulated. The pore pressure in the reinforced fill can be increased until the wall experiences noticeable distress. This phase will provide valuable information to evaluate the ability of the numerical models to consider the effects of pore pressure.
Finally, the test areas can be drained, a surcharge added and the test sequence repeated to measure the effects of groundwater and rainfall. The walls have been designed so that they should experience considerable distress when subjected to a surcharge and high pore pressures. This allows a factor of safety of essentially 1 to be produced, so that the ability of the numerical models can be checked to predict factor of safety at the only place it can be measured, i.e. at a value of 1.0 (also called incipient failure).
Figure 3 illustrates the proposed test sequence, and consists of the following steps:

Figure 3. Test sequence.
• Construct the MSE walls to 20 ft height with a geocomposite drain located at the back of the reinforcing elements (Spring/Summer 2005).
• Monitor the walls through the winter season with soil at its natural (aka, low) in-situ moisture content, to measure effects of freeze-thaw on wall performance and reinforcing elements.
• In Spring 2006, raise water level in fill behind the walls to within 1 ft of ground surface with the geocomposite drain open and functioning. This demonstrates that the design will work for high groundwater conditions, if proper drainage is in place and working.
• Close off the geocomposite drain and let pore pressure rise in the reinforced fill until some distress is observed in the walls or reinforcing elements.
• Drain reinforced fill and monitor response of walls under capillary heads. • Monitor the walls through the winter season (2006/2007) with soil at a high in-situ
moisture content. • Add surcharge. • In Spring 2007, raise water level in fill behind the walls to within 1 ft of ground surface
with the geocomposite drain open and functioning. The Walls have been designed to support a 5 ft surcharge under this groundwater condition without unacceptable distress.
• Close off the geocomposite drain and let pore pressure rise in reinforced fill until failure of walls occurs. This will provide an important calibration of the ability of the numerical models to predict factor of safety for the only condition where we know the factor of safety, i.e. a value of 1.0.

Instrumentation Plan Table I summarizes the questions or concerns that have been addressed in the full-scale field test. For each question, the technical reasoning for the validity of the question and a proposed monitoring solution as part of the full-scale field test are described.
Table I - Instrumentation Program – Full-Scale Field Test
Technical Question Discussion Monitoring Approach What is the distribution of pore pressures in the reinforced fill mass?
Excess pore pressures can produce an additional outward force that the wall must resist Water also reduces the strength of the reinforced fill that holds the wall in place.
Install multiple piezometers (e.g. vibrating wire) at selected positions throughout the reinforced fill to evaluate seepage pressures. Monitor sensors often, using automated system to capture short-term and long-term changes/trends.
What loads are being carried by the reinforcing elements, and where is the location of the failure surface?
Measuring the loads in the reinforcement will help in the assessment of the numerical models used during design, and to predict and develop the means to induce wall failure. It is important to measure loads locally and over larger reinforcement elements. Local loads may give misleading results, due to imperfections in reinforcing material or hard/soft spots in the reinforced fill. Measuring average loads over longer elements will miss peak strains along failure surfaces.
Since load cannot be easily measured in the reinforcement elements, strains are measured and equivalent loads calculated based on the reinforcement material’s physical properties. Use strain gages to measure localized strain on the reinforcing material. Use horizontal rod extensometers to measure strain over a larger gage distance. These two independent measurements of strain provide cross-checks of the measurements and redundancy in the strain measuring system. Monitor sensors often, using automated logging system to capture short-term and long-term changes/trends.
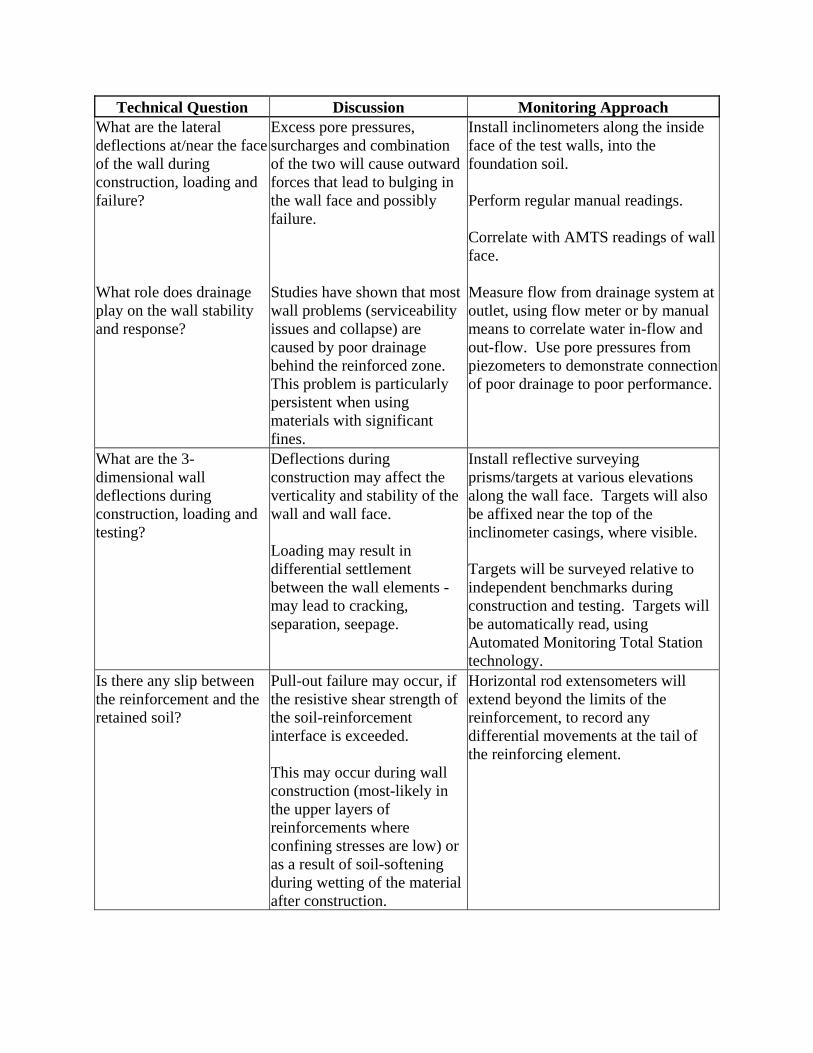
Technical Question Discussion Monitoring Approach What are the lateral deflections at/near the face of the wall during construction, loading and failure? What role does drainage play on the wall stability and response?
Excess pore pressures, surcharges and combination of the two will cause outward forces that lead to bulging in the wall face and possibly failure. Studies have shown that most wall problems (serviceability issues and collapse) are caused by poor drainage behind the reinforced zone. This problem is particularly persistent when using materials with significant fines.
Install inclinometers along the inside face of the test walls, into the foundation soil. Perform regular manual readings. Correlate with AMTS readings of wall face. Measure flow from drainage system at outlet, using flow meter or by manual means to correlate water in-flow and out-flow. Use pore pressures from piezometers to demonstrate connection of poor drainage to poor performance.
What are the 3-dimensional wall deflections during construction, loading and testing?
Deflections during construction may affect the verticality and stability of the wall and wall face. Loading may result in differential settlement between the wall elements - may lead to cracking, separation, seepage.
Install reflective surveying prisms/targets at various elevations along the wall face. Targets will also be affixed near the top of the inclinometer casings, where visible. Targets will be surveyed relative to independent benchmarks during construction and testing. Targets will be automatically read, using Automated Monitoring Total Station technology.
Is there any slip between the reinforcement and the retained soil?
Pull-out failure may occur, if the resistive shear strength of the soil-reinforcement interface is exceeded. This may occur during wall construction (most-likely in the upper layers of reinforcements where confining stresses are low) or as a result of soil-softening during wetting of the material after construction.
Horizontal rod extensometers will extend beyond the limits of the reinforcement, to record any differential movements at the tail of the reinforcing element.
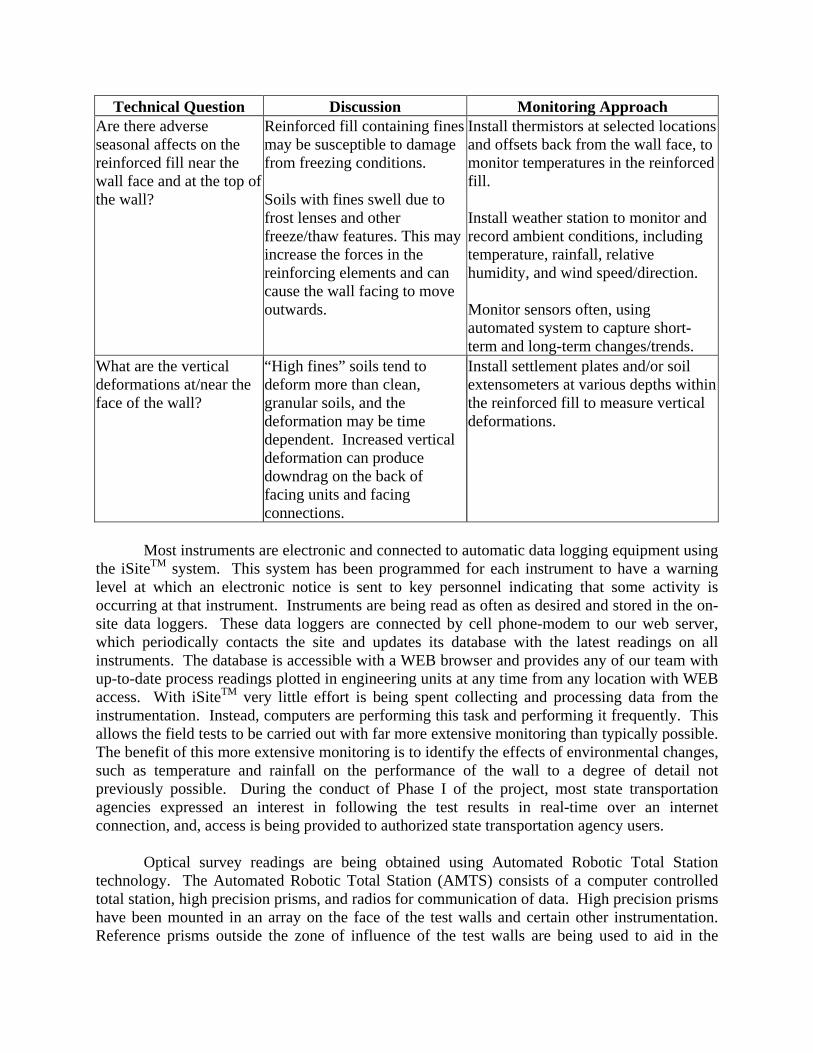
Technical Question Discussion Monitoring Approach Are there adverse seasonal affects on the reinforced fill near the wall face and at the top of the wall?
Reinforced fill containing finesmay be susceptible to damage from freezing conditions. Soils with fines swell due to frost lenses and other freeze/thaw features. This may increase the forces in the reinforcing elements and can cause the wall facing to move outwards.
Install thermistors at selected locations and offsets back from the wall face, to monitor temperatures in the reinforced fill. Install weather station to monitor and record ambient conditions, including temperature, rainfall, relative humidity, and wind speed/direction. Monitor sensors often, using automated system to capture short-term and long-term changes/trends.
What are the vertical deformations at/near the face of the wall?
“High fines” soils tend to deform more than clean, granular soils, and the deformation may be time dependent. Increased vertical deformation can produce downdrag on the back of facing units and facing connections.
Install settlement plates and/or soil extensometers at various depths within the reinforced fill to measure vertical deformations.
Most instruments are electronic and connected to automatic data logging equipment using
the iSiteTM system. This system has been programmed for each instrument to have a warning level at which an electronic notice is sent to key personnel indicating that some activity is occurring at that instrument. Instruments are being read as often as desired and stored in the on-site data loggers. These data loggers are connected by cell phone-modem to our web server, which periodically contacts the site and updates its database with the latest readings on all instruments. The database is accessible with a WEB browser and provides any of our team with up-to-date process readings plotted in engineering units at any time from any location with WEB access. With iSiteTM very little effort is being spent collecting and processing data from the instrumentation. Instead, computers are performing this task and performing it frequently. This allows the field tests to be carried out with far more extensive monitoring than typically possible. The benefit of this more extensive monitoring is to identify the effects of environmental changes, such as temperature and rainfall on the performance of the wall to a degree of detail not previously possible. During the conduct of Phase I of the project, most state transportation agencies expressed an interest in following the test results in real-time over an internet connection, and, access is being provided to authorized state transportation agency users.
Optical survey readings are being obtained using Automated Robotic Total Station technology. The Automated Robotic Total Station (AMTS) consists of a computer controlled total station, high precision prisms, and radios for communication of data. High precision prisms have been mounted in an array on the face of the test walls and certain other instrumentation. Reference prisms outside the zone of influence of the test walls are being used to aid in the

reduction of data. Once all of the equipment was mounted in a fixed, protected position, the total station was “trained” to survey the array of prisms. The system is capable of surveying about 100 prisms in one hour. Once the AMTS system has finished performing a survey, the data is transferred via radio to the project database powered by iSiteCentral, where it is automatically reduced and presented in real time. Again, authorized users will be able to access the survey data in real time through the Internet from any location with web access. CONSTRUCTION OF FULL-SCALE TEST WALLS Construction of the full-scale test walls began in summer 2005 and was completed in September 2005. Figures 4 through 15 depict pertinent aspects of the full-scale test wall construction, and are included at the end of the paper. REAL-TIME INSTRUMENTATION MONITORING As previously indicated, most instrumentation is being monitored on a real-time basis via automated data loggers transmitting instrumentation readings via cell phone modem to our web server. The automatically, continuously updated instrumentation database on the server is accessible via a web browser to our team and authorized users. By way of example, Figure 16 presents a “sample screen capture” from real-time processed strain gage data for Test Section A, for a one-week period in October 2005.

Figure 4. Full-scale field test NCHRP Project 24-22. Site preparation.

Figure 5. Full-scale field test NCHRP Project 24-22. Placing base PVC GM and seaming vertical GM.

Figure 6. Full-scale field test NCHRP Project 24-22. Internal drainage.
Inclinometer Casing
Welded WireFace Form
Inclinometer Casing
Welded WireFace Form
Drainage composite

Figure 7. Full-scale field test NCHRP Project 24-22. Placing/compacting reinforced fill.
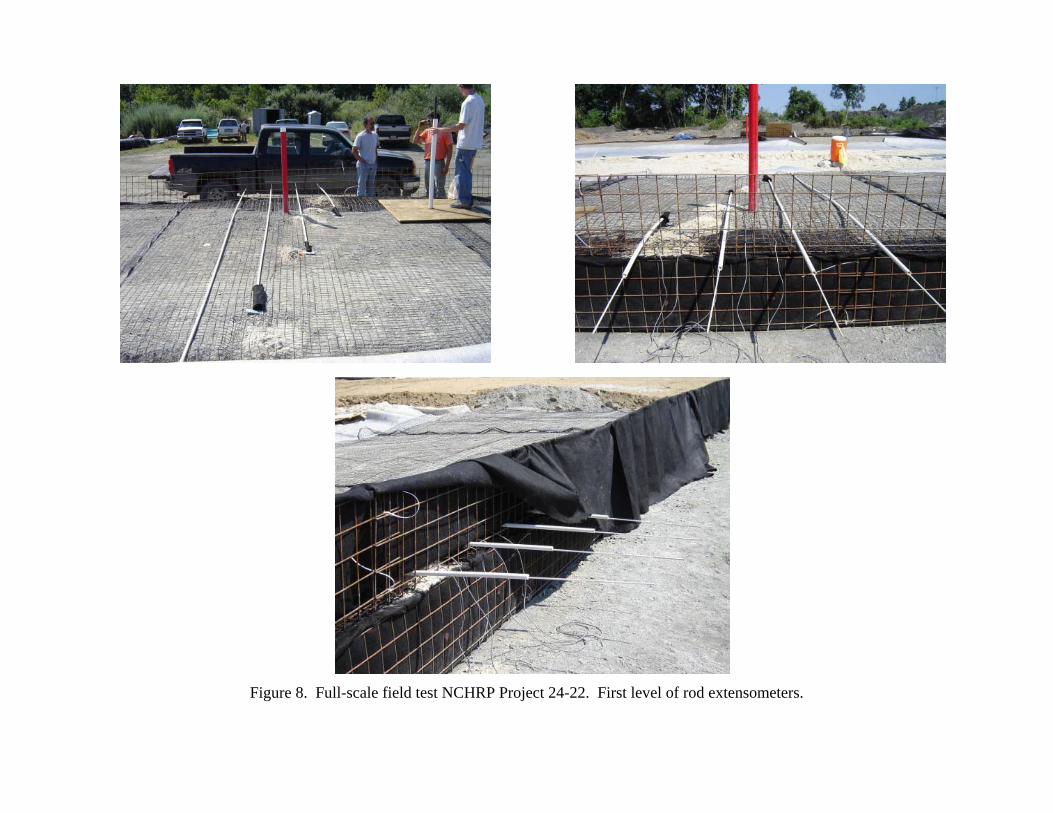
Figure 8. Full-scale field test NCHRP Project 24-22. First level of rod extensometers.

Figure 9. Full-scale field test NCHRP Project 24-22. First level of strain gages.
Polyester Geogrid(Section C)
Non-woven GT(Section D)

Figure 10. Full-scale field test NCHRP Project 24-22. Seaming PVC GM.
Section D
Drainage Fill
Drainage Composite
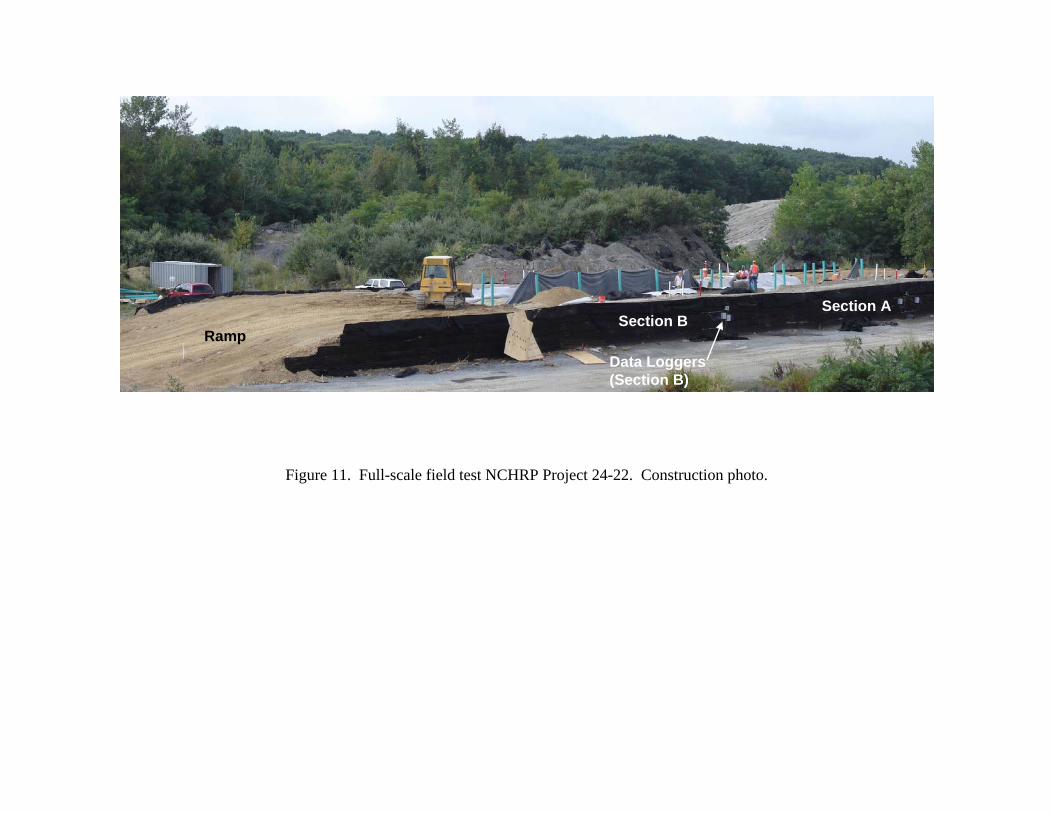
RampData Loggers(Section B)
Section BSection A
Figure 11. Full-scale field test NCHRP Project 24-22. Construction photo.

Permeability:k at 20o C = 6.1 x 10⁻⁵ cm/sec
ASTM D 5084
Multi-pointExtensometers
Strain Gages
Inclinometer
NW GT Reinforcement
Welded Wire face Form
SettlementPlatform
Figure 12. Full-scale field test NCHRP Project 24-22. Full-scale field test (Sect. D).
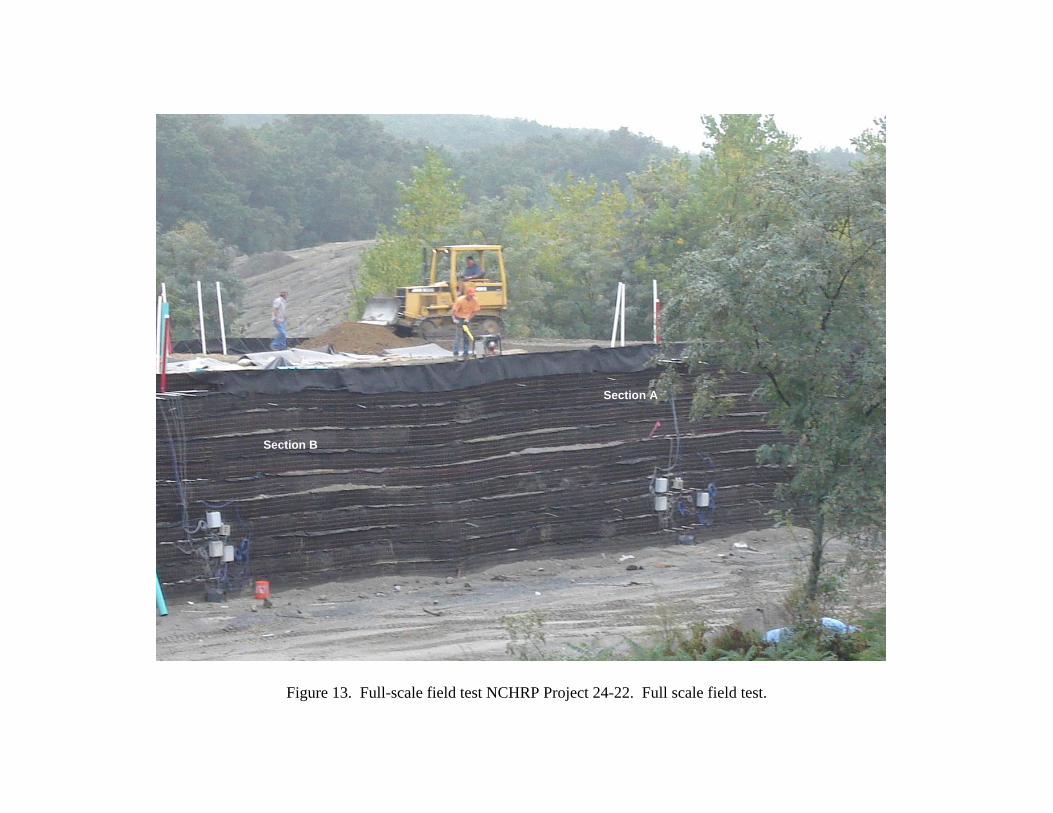
Figure 13. Full-scale field test NCHRP Project 24-22. Full scale field test.
Section A
Section B

Figure 14. Full-scale field test NCHRP Project 24-22. Instrumentation cluster.
Completed Test Wall – Section A

Figure 15. Full-scale field test NCHRP Project 24-22. Completed walls.
Section ASection B

Figure 16 - Sample of Real-Time Web-Based Monitoring Strain Gages Test Section A.
![GABION WALLS DESIGNgabions.net/downloads/Documents/MGS_Design_Guide.pdf · Mechanically Stabilized Earth (MSE) Gabion Wall [Reinforced Soil Wall] GABION WALLS DESIGN Gabion Gravity](https://img.pdfslide.net/doc/110x75/5a79b6847f8b9a9e0c8c102b/gabion-walls-stabilized-earth-mse-gabion-wall-reinforced-soil-wall-gabion-walls.jpg)


![MSE Walls Design for Internal & External Stability [Recovered]](https://img.pdfslide.net/doc/110x75/544ef4feb1af9f1f638b54e6/mse-walls-design-for-internal-external-stability-recovered.jpg)