Embed Size (px)
Citation preview

This content has been downloaded from IOPscience. Please scroll down to see the full text.
Download details:
IP Address: 131.111.5.146
This content was downloaded on 19/11/2016 at 19:19
Please note that terms and conditions apply.
You may also be interested in:
Deformation monitoring of long GFRP bar soil nails using distributed optical fiber sensing
technology
Cheng-Yu Hong, Jian-Hua Yin and Yi-Fan Zhang
Long-range BOTDA Sensor over 50-km Distance Employing Pre-pumped Simplex Coding
Qiao Sun, Xiaobo Tu, Shilin Sun et al.
Study of Raman amplification in DPP-BOTDA sensing employing Simplex coding for sub-meter scale
spatial resolution over long fiber distances
Mohammad Taki, Marcelo A Soto, Gabriele Bolognini et al.
Long-range distributed temperature and strain optical fibre sensor
Mohamed N Alahbabi, Yuh Tat Cho and Trevor P Newson
Long term structural health monitoring by Brillouin fibre-optic sensing: a real case
Aldo Minardo, Gianluca Persichetti, Genni Testa et al.
Long-range Brillouin optical time-domain analysis sensor employing pulse coding techniques
Marcelo A Soto, Gabriele Bolognini, Fabrizio Di Pasquale et al.
Full scale strain monitoring of a suspension bridge using high performance distributed fiber
optic sensors
View the table of contents for this issue, or go to the journal homepage for more
2016 Meas. Sci. Technol. 27 124017
(http://iopscience.iop.org/0957-0233/27/12/124017)
Home Search Collections Journals About Contact us My IOPscience
1 © 2016 IOP Publishing Ltd Printed in the UK
Jinlong Xu1,2, Yongkang Dong3, Zhaohui Zhang1,2, Shunlong Li4, Shaoyang He4 and Hui Li1,2
1 Key Lab of Intelligent Disaster Prevention for Civil Infrastructure, The Ministry of Industrial and Information Technology, People’s Republic of China2 School of Civil Engineering, Harbin Institute of Technology, Harbin 150090, People’s Republic of China3 National Key Lab of Science and Technology on Tunable Laser, Harbin Institute of Technology, Harbin 150001, People’s Republic of China4 School of Transportation Science and Engineering, Harbin Institute of Technology, Harbin 150090, People’s Republic of China
E-mail: [email protected]
Received 8 June 2016, revised 5 October 2016Accepted for publication 7 October 2016Published 14 November 2016
AbstractThis paper investigated field monitoring of a 1108 m suspension bridge during an assessment load test, using integrated distributed fibre-optic sensors (DFOSs). In addition to the conventional Brillouin time domain analysis system, a high spatial resolution Brillouin system using the differential pulse-width pair (DPP) technique was adopted. Temperature compensation was achieved using a Raman distributed temperature sensing system. This is the first full scale field application of DFOSs using the Brillouin time domain analysis technique in a thousand-meter-scale suspension bridge. Measured strain distributions along the whole length of the bridge were presented. The interaction between the main cables and the steel-box-girder was highlighted. The Brillouin fibre-optic monitoring systems exhibited great facility for the purposes of long distance distributed strain monitoring, with up to 0.05 m spatial resolution, and 0.01 m/point sampling interval. The performance of the Brillouin system using DPP technique was discussed. The measured data was also employed for assessing bridge design and for the assessment of structural condition. The results show that the symmetrical design assumptions were consistent with the actual bridge, and that the strain values along the whole bridge were within the safety range. This trial field study serves as an example, demonstrating the feasibility of highly dense strain and temperature measurement for large scale civil infrastructures using integrated DFOSs.
Keywords: distributed fiber optic sensors, structural heath monitoring, suspension bridges, load tests
(Some figures may appear in colour only in the online journal)
1. Introduction
Suspension bridges serve as key nodes for modern traffic sys-tems, and also tend to be the most expensive type of bridge to build. Over an intended service life of around 100 years,
a suspension bridge may face multiple safety risks, such as wind introduced vibration, vehicle introduced fatigue, mat-erial degradation, and natural hazards. Thus, structural health monitoring (SHM) systems are essential in order to monitor structural behaviors, check structural safety conditions, and
Measurement Science and Technology
Full scale strain monitoring of a suspension bridge using high performance distributed fiber optic sensors
J Xu et al
Printed in the UK
124017
MSTCEP
© 2016 IOP Publishing Ltd
27
Meas. Sci. Technol.
MST
0957-0233
10.1088/0957-0233/27/12/124017
Paper
12
Measurement Science and Technology
IOP
2016
0957-0233/16/124017+10$33.00
doi:10.1088/0957-0233/27/12/124017Meas. Sci. Technol. 27 (2016) 124017 (10pp)
J Xu et al
2
assess fitness for purpose of suspension bridges in continuous service [1]. Several examples of SHM systems for suspen-sion bridges with a main span comparable to that examined in this paper, such as the New Carquinez Bridge, and the Tsing Ma Bridge [2–4] have been reported. There is a great deal of literature dealing with various aspects of SHM for suspen-sion bridges [5–8]. Sensing information—e.g. strain, temper-ature, and acceleration—obtained by SHM systems plays a key role in structural monitoring studies. However, most sensing technologies can only measure discrete information at limited locations. It is highly preferable to obtain distrib-uted sensing information, especially for large-scale infra-structures. However, this is a challenging task, owing to the huge geometric size and harsh working environment of these structures. It is impractical to obtain distributed sensing infor-mation simply by increasing the number of sensors, because the cost is prohibitive.
Distributed fiber-optic sensors (DFOSs) possess the dis-tinct advantage of distributed sensing ability over extremely long distances. They can give insight into both local and global structural behaviours, strain and temperature dis-tribution, employing low cost optical fibre as a sensor: this effectively decreases the gap between lab research and field application [9–13]. With the maturity of commercial DFOS demodulation devices, various DFOSs have been successfully applied in several bridge monitoring cases. Matta et al [14] employed a Brillouin time domain reflectometry (BOTDR) system to measure the strain distributions of a steel contin-uous girder bridge during a load test. Minardo et al employed a Brillouin time domain analysis (BOTDA) system to perform a long-term (1 year) strain measurement on a concrete arch bridge, and strain distribution measurement on a newly-built concrete road-bridge, respectively, during a load test [15, 16]. Regier and Hoult reported an interesting study into the use of a Rayleigh backscatter system with high spatial resolution and accuracy to measure strain distributions on a simply sup-ported concrete bridge during a load test [17]. The various DFOSs interrogating technologies have particular advantages and disadvantages [13]. BOTDR employs a spontaneous Brillouin scattering technique, which leads to a lower meas-urement accuracy and sensing distance than BOTDA because of the lower signal-noise ratio (SNR). Spatial resolution is also limited to 1 m. However, BOTDR requires access to the sensing fiber only at one end, which makes fiber installation more convenient, and enables continuous measurements when the sensing fiber is damaged at certain location. The Rayleigh backscatter system has much higher spatial resolution (up to 1 mm) and accuracy (up to µε±1 ), but the sensing distance is limited (less than 70 m) which makes it less suitable for long-distance monitoring. BOTDA employs a stimulated Brillouin scattering technique, where system performances are comprehensively better than BOTDR owing to a higher SNR. With the development of high performance BOTDA techniques, BOTDA shows further increases in performance, making it potentially the ideal option for large-scale bridge monitoring. The sensing length, spatial resolution and acc-uracy of the BOTDA system will be discussed later in this paper. Until now, the field applications of bridge monitoring
using BOTDA have been limited to short span bridges, such as simple supported bridges, and continuous beam bridges. This paper presents the first full-scale field monitoring of a 1108 m suspension bridge using BOTDA. The bridge has been in use for 15 years, and underwent a condition assessment load test. To capture strain distribution data along the full length of bridge, both a conventional BOTDA, and a high performance BOTDA system using differential pulse-width pair (DPP) technique, were adopted. A Raman distributed temperature sensing system was used to measure the temperature distribu-tion and to provide temperature compensation for the strain measurement. The main research objectives were: to present full-scale strain distributions for the suspension bridge under a load test, and to evaluate the performance of integrated DFOSs system in field monitoring for large-scale infrastruc-tures. Firstly, this paper will give a background introduction to the principles of BOTDA, DPP-BOTDA and the Raman temper ature system. Then load test and instrumentation setup will be examined. Finally, the measured results will be dis-cussed and the main conclusions will be drawn.
2. Principles of BOTDA, DPP-BOTDA and Raman system
The backscattered light of lasers in optical fibre contains three components: i.e. Rayleigh, Brillouin and Raman, as shown in figure 1. Each of these three components may be interrogated for distributed strain or temperature sensing with the corre-sponding mechanisms.
The classical scheme of BOTDA employs a stimulated Brillouin scattering (SBS) technique [18]. As shown in figure 2(a), two counter-propagating laser beams, i.e. a pump pulse (with pulse width τ) and a continuous wave (CW) probe wave, with a certain frequency difference near the Brillouin frequency shift, are injected from both ends of the sensing fiber. The local acoustic wave can be excited by the coupling of the two laser beams, which results in an energy transfer from the pump pulse to the CW probe wave. The relation-ship between the Brillouin gain of the CW, and the frequency difference of the two laser beams, is defined as the Brillouin gain spectrum (BGS), and the central frequency of the BGS is defined as the Brillouin frequency shift νB, which can be expressed as equation (1) [19]
/ν λ= nV2B a (1)
Figure 1. The backscattered components of light in optical fiber.
Meas. Sci. Technol. 27 (2016) 124017

J Xu et al
3
where n is the refractive index of the sensing fiber, Va is the velocity of the acoustic wave, λ is the vacuum wavelength of the pump light, and νB is linearly affected by temperature and strain variation as follows:
( )ν ν ε= + + −C C t tB B s t r0 (2)
where νB is the measured Brillouin frequency shift, νB0 is the initial Brillouin frequency shift in the strain free state at the reference temperature tr, ε is the axial strain along the optical fiber, t is the fiber temperature, and Cs and Ct are the propor-tional constants of strain and temperature sensing, respec-tively. The sensing location can be calculated from the light speed in the sensing fiber and the propagating time between launching the pump pulse and detecting the Brillouin signal probe wave. So the distributed strain along the sensing fiber at any location z can be obtained by equation (3):
( ) ( ( ) ( ) ( ( ) ( )))/ε ν ν= − − −z z z C t z t z CB B t r s0 (3)
There are three parameters for evaluating the performance of a BOTDA system: accuracy, sensing distance, and spatial resolution. Spatial resolution ∆z is defined as the minimum measurable length of the BOTDA system, and is determined by the pump pulse width /( )τ∆ =z c n2 . However, there is a trade-off among these three parameters. The BOTDA system can employ a short width pump pulse to achieve higher spatial resolution, but the short pulse will decrease the signal-to-noise ratio (SNR) and the pulse energy, which leads to a decrease both in sensing accuracy and sensing distance. In 2008, Li et al [20] proposed a DPP technique for the BOTDA system. As shown in figure 2(b), the DPP-BOTDA system employs double pump pulses with different pulse-widths (τ1, τ2) and subtracts the corresponding Brillouin signals ( ( )τI0 1 , ( )τI0 2 ) to obtain the differential Brillouin signal ( ( )τ∆I0 ), which can then be used to construct the differential BGS. The strain sensing principles remain the same, but the spatial resolution is determined by the pulse width difference between τ1 and τ2
Figure 2. Principles of BOTDA and DPP-BOTDA sensing system. (a) BOTDA. (b) DPP-BOTDA.
Meas. Sci. Technol. 27 (2016) 124017

J Xu et al
4
by /( )τ∆ = ∆z c n2 , rather than the original pulse width. Thus, high spatial resolution may be achieved using double pulses with a small width difference, without an obvious decrease in sensing distance and accuracy. In 2011, Dong et al [21] performed a detailed study on the system optimization of DPP-BOTDA, achieving a 0.02 m spatial resolution with a 2 °C temperature accuracy over a 2 km length, thereby dem-onstrating DPP-BOTDA to be one of the best performance techniques in DFOSs.
The schematic of the DPP-BOTDA system adopted in this paper is shown in figure 3. A narrow linewidth 200 kHz fibre laser module, operating at ~1550 nm, is employed as the light source. A 3 dB coupler is used to split the output light into two parts, providing the pump and the probe waves, respectively. An electro-optic modulator (EOM1) with a high extinction ratio (ER > 40 dB) is used to generate the optical pulse, which is then amplified by an erbium-doped fibre amplifier before being launched into the sensing fibre. The microwave gener-ator module outputs microwave signals to modulate the light through EOM2, and the first-order lower sideband is chosen as the probe wave by a narrow bandwidth fibre Bragg grating. Two polarization controllers are used to ensure that the pump and probe waves are launched into the same principal axis of the sensing fibre. Therefore, a polarization-maintaining (PM) fibre is more suitable for this system. A detector, which can resolve the centimetre-order variation in strain or temperature, is used to detect the Brillouin signal. A pulse pair with a 0.5 ns pulse width difference is used, resulting in the high (0.05 m) spatial resolution of the DPP-BOTDA system. The strain measurement accuracy of the DPP-BOTDA system is µε±10 , and the maximum sensing distance is 5 km.
The Raman temperature system employs a spontaneous Raman scattering (SRS) technique, and an optical time domain reflectometry (OTDR) [22]. The injected laser pulse prop-agates along the sensing fibre and the backscattered Raman light at every fibre location z can then be detected. Raman scattering light consists of Stokes and anti-Stokes light. The ratio between the anti-Stokes intensity (Ias) and Stokes inten-sity (Is) at location z is defined as the Raman ratio and can be expressed as
( )( )
⎜ ⎟⎛⎝
⎞⎠ν
=∆I z
I z
K
K
h
kTexpas
s
as
s (4)
where Kas and Ks are constants representing the intensity losses at sensing position, h and k are Planck and Boltzmann constants, respectively, and ν∆ is the Raman frequency shift. Thus, the distribution of temperature T can be obtained by measuring the Raman ratio along the sensing fibre. The Raman system used in this paper has a spatial resolution of 1 m, a sensing length of 6 km, and a temperature sensing acc uracy of ±0.5 °C. It should be noted that Raman system is only sen-sitive to temperature change, so the strain influence can be eliminated, which is a valuable advantage in field monitoring.
3. Bridge load test
3.1. Bridge description
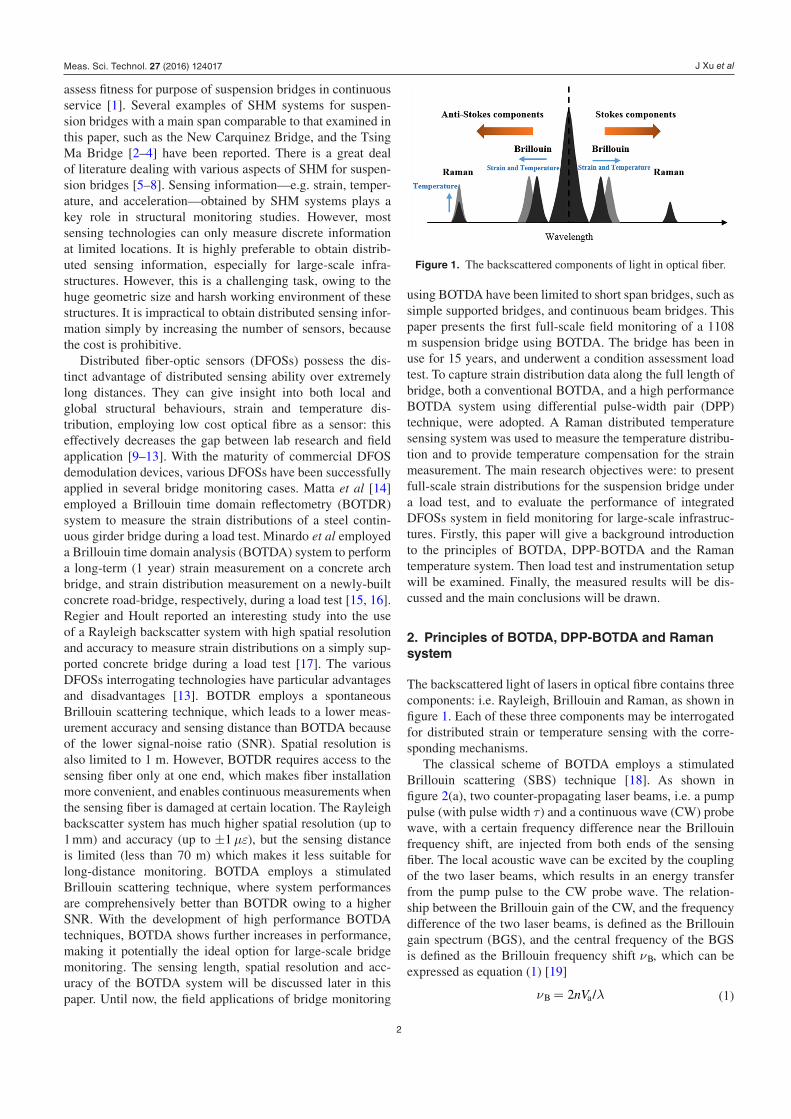
The Haicang Bridge is a highway suspension bridge with a total length of 1108 m, located in Xiamen, China, and linking Xiamen Island with the mainland. It is a three-span continuous full floating cable-suspension bridge with a steel box girder. The term ‘full floating’ means that there is no additional sup-port between the tower and the steel box girder. The geometry dimensions of the Haicang Bridge are shown in figure 4. The main span is 648 m, and the two side spans each measure 230 m. The concrete tower is 128 m in height, measured from the pier cap to the tower saddle. The two main cables, 34 m apart, are accommodated by four saddles located at the top of the tower legs of the main span, and the bridge deck is supported by a total of 164 suspender units. The steel box girder of the bridge is 36.6 m in width, and 3 m high, with diaphragms every 3 m along the longitudinal axis of the deck. Serving as the main connection between Xiamen Island and the mainland since its completion at the end of 1999, the traffic volume on the Haicang bridge is very high. After almost 15 years’ service, the bridge underwent its first diagnosis load test in November 2015, to check its structural condition preparatory to its next decade of service.
CiculatorEDFALaser
Module90%
PDDAQ Module
EOM
1
3
2EOM
AFG Module
10%
PC 2
PC 1
50%
Microwave Module
FBG
Isolator
Probe
Pump
PC 4
PC 3
Se
nsin
g Fi
ber
DC Module
10%
PC 2
CH 1
CH 2
Figure 3. Schematic of the DPP-BOTDA system. PD: photo-detector, PC: polarization controller, EOM: electro-optic modulator, EDFA: Erbium-doped fibre amplifier module, DAQ: data acquisition.
Meas. Sci. Technol. 27 (2016) 124017
J Xu et al
5
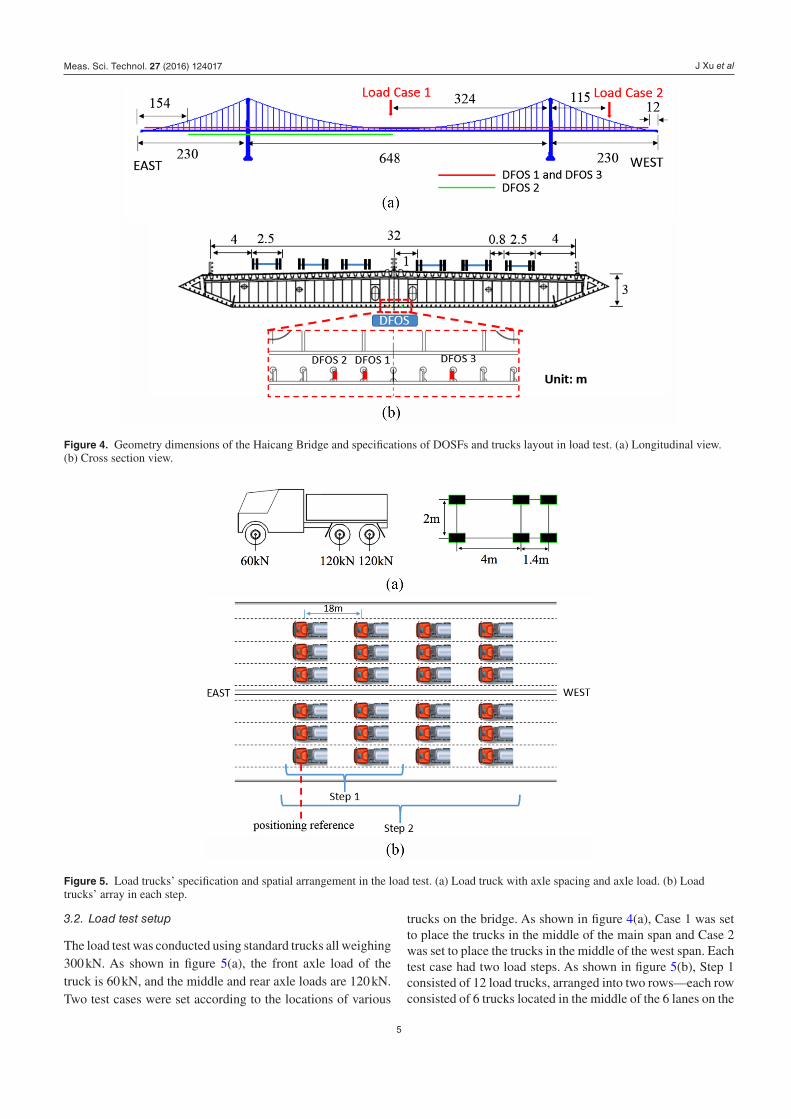
3.2. Load test setup
The load test was conducted using standard trucks all weighing 300 kN. As shown in figure 5(a), the front axle load of the truck is 60 kN, and the middle and rear axle loads are 120 kN. Two test cases were set according to the locations of various
trucks on the bridge. As shown in figure 4(a), Case 1 was set to place the trucks in the middle of the main span and Case 2 was set to place the trucks in the middle of the west span. Each test case had two load steps. As shown in figure 5(b), Step 1 consisted of 12 load trucks, arranged into two rows—each row consisted of 6 trucks located in the middle of the 6 lanes on the
Figure 4. Geometry dimensions of the Haicang Bridge and specifications of DOSFs and trucks layout in load test. (a) Longitudinal view. (b) Cross section view.
Figure 5. Load trucks’ specification and spatial arrangement in the load test. (a) Load truck with axle spacing and axle load. (b) Load trucks’ array in each step.
Meas. Sci. Technol. 27 (2016) 124017

J Xu et al
6
bridge deck. The front axle to front axle distance between the two rows was 18 m, and the total weight was 3600 kN. Step 2 consisted of 24 load trucks arranged in 4 rows. The distance between rows was the same as in Step 1. The trucks were driven from the west end to the planned location row by row to construct the load array. The longitudinal spatial location of the load trucks’ array was positioned by the front axle location of the first row (positioning reference). Then the load array halted for 30 min to allow DFOSs measurement, and moved to its next position row by row. The photo of load trucks on the bridge deck and load test specifications are shown in figure 6 and table 1.
3.3. Instrumentation setup
The optical fibre sensors were glued to the deck inside the steel-box-girder along the axis of symmetry to the longitu-dinal direction, passing through the gap between the dia-phragm and the deck. The specific spatial layout of the optical fibres is shown in figure 4. DFOS1 was a single mode optical fibre with total length of 3000 m, covering a 1084 m sensing distance, measured from 12 m in from the east end of the bridge to 12 m in from the west end of the bridge. Since the DFOS1 was integrated using the BOTDA technique, it has to be a closed loop, because BOTDA systems employ two counter-propagating laser beams injected from both end of the optical sensing fibre. For a monitoring distance of 1084 m, at least 2168 m sensing is required. The DFOS2 was a PM fibre with total length of 1000 m, which was installed to perform a high spatial resolution strain measurement covering a 400 m sensing distance, measuring from 154 m from the east end of the bridge, to the middle of the main span. The PM fibre decreases the polarization fading of the laser, and increases the SNR, resulting in a better signal for high spatial resolution measurement. After surface cleaning, DFOS1 and DFOS2 were glued to the deck using an epoxy (PERMA-CEMET
901) (figure 7(a)). Furthermore, a single mode temper-ature sensing fibre (DFOS3) was installed near DFOS1 and DFOS2. DFOS3 was in glue-free status, and covered the same sensing route as DFOS1. The integrated DFOSs monitoring system is shown in figure 7(b). A BOTDA system with 0.5 m spatial resolution was adopted to measure the DFOS1, a DPP-BOTDA system with 0.05 m high spatial resolution was adopted to measure the DFOS2, and a Raman distributed temperature sensing system with 1 m spatial resolution and ± °0.5 C accuracy was adopted to measure DFOS3. All three systems worked synchronously during the load test.
4. Results and discussions
4.1. Baseline reading and temperature compensation
The load test was conducted between 00:00 am and 06:00 am on the 8th of November 2015, during which period the bridge was closed to normal traffic. The initial strain distribution of DFOS1 with no vehicle load was measured as the baseline for subsequent strain measurements. As shown in figure 8, the ini-tial strain distribution of DFOS1 was highly non-uniform, with all positive strain, and the maximum strain value measured up to 1083 µε. This phenomenon was caused by residual tension occurring during the fibre installation. DFOS1 extended the full length of the bridge from the east to west. The frictional force between the fibre and deck reserved part of the tension force, leading to a positive strain, and also made the strain near the loose end lower than that in the middle. The baseline of DFOS1 was set as the ( )ν zB0 in equation (3), all subsequent strain measurements of DFOS1 during the load test were pre-idcated on this baseline, using equation (3). The same proce-dure was also applied to DFOS2. Temperature compensation is essential for Brillouin-based strain sensors, because they are sensitive to both strain and temperature. Relative temperature fluctuations between the moment of the strain baseline reading
Figure 6. Photo of load trucks on the bridge deck.
Table 1. Specifications of the load test.
Load Test Vehicle location Step Truck number Total load (kN)
Case 1 Middle of main span 324 m to West tower Step 1 12 3600Step 2 24 7200
Case 2 Middle of west span 115 m to West tower Step 1 12 3600Step 2 24 7200
Meas. Sci. Technol. 27 (2016) 124017

J Xu et al
7
and the subsequent measurement therefore need to be captured. The initial temperature distribution of the whole bridge was measured by DFOS3 using the Raman system at the start of the load test (00:00 am) and was set as the temperature baseline
( )t zr . The relative temperature fluctuations ( ) ( )−t z t zr during the load test (00:00 am–06:00 am) are shown in figure 9. As the load test was conducted in the early morning, the temperature of the bridge was higher than the air temperature in the outer environment. The steady heat exchange between the bridge and the air made the temperature along the bridge gradually decrease over the period from 00:00 am to 06:00 am. The average temperature fluctuations at 03:00 am and 06:00 am were −1.5 °C and −3 °C respectively. The temperature distri-bution was nonuniform, with a range of variability of ±1.5 °C in the measurement results. The claimed temperature sensing accuracy of the Raman system was ±0.5 °C. Figure 9 indicates that the error range of the Raman system increased in field test conditions. The average ( ) ( )−z t zt r was used as the temper-ature compensation in equation (3) to calculate the mechanical strain for DFOS1 and DFOS2.
4.2. Full scale strain distributions of the suspension bridge in the load test
The strain distributions along the full length of the Haicang Bridge measured by DFOS1 during the load test are shown in figure 10. In Case 1, the load trucks were placed at the centre
of the main span. As expected, the maximum positive strain was measured at the centre of the span, where the load trucks were placed. The maximum positive strain location was west shifted in Step 2 compared with Step 1, as Step 2 has 12 more load trucks placed on the west side of the array as compared with Step 1. The strain values decreased symmetrically from the middle to both sides and changed to negative around 1/3 span to the bridge tower. The measured results indicated an interaction between the main cables and the bridge deck in the load test. At mid-span, the main cables and the bridge deck were lower relative to their initial position due to the vehicle load, but towards the bridge tower they were higher relative to their initial position due to the interaction between the main cables and the deck, which resulted in a reduction in tension in the suspenders. The reduction in tension in the suspenders accompanied a negative bending moment in the deck near the bridge tower, as indicated by the negative strain measured by DFOS1. The moments in the deck were dependent on the relative stiffness of each component in the suspension bridge. Moreover, the load trucks not only influenced the strain distri-bution in the main span, but also introduced a negative strain distribution in both side spans. This caused the bridge deck in the side spans to be lifted by the main cables, resulting in negative bending moments in the side span deck. In Step1, the maximum positive and negative strain values of the main span were 120 µε and −99 µε respectively. The maximum nega-tive strain value of the side span was −90 µε. In Step 2, the
Figure 7. Photos of optical fibre sensors and monitoring system (a) Optical fibre sensors glued to the deck. (b) The integrated DFOS monitoring system.
0 200 400 600 800 1000 1084-200
0
200
400
600
800
1000
1200
Distance along the bridge (m)
Stra
in ( me)
Figure 8. The initial strain distribution of DFOS1 with no vehicle load.
0 200 400 600 800 1000 1084-5
0
5
Distance along the bridge (m)
Tem
pera
ture
(° C
)
03:00 am06:00 am
Figure 9. Distributed temperature fluctuations along the bridge measured by DFOS3 during load test.
Meas. Sci. Technol. 27 (2016) 124017

J Xu et al
8
maximum positive and negative strain values of the main span increased to 178 µε and −124 µε respectively. The maximum negative strain value of the side span increased to −120 µε.
In Case 2, the load trucks were moved to the middle of the west side span. The strain values increased from zero at the west end to the positive maximum at the load region, and then decreased to negative near the bridge tower, and gradually recovered to zero at the main span. The mechanism was sim-ilar to Case 1. In the west span, the main cables were lower, relative to their initial position at mid-span, but towards the bridge tower they were higher, relative to their initial position. The reduction in tension in the suspenders accompanied a neg-ative bending moment in the deck near the bridge tower. In the main span, the increased tension of the main cables lifted the bridge deck, causing negative bending near the bridge tower. The negative moments lead to a negative strain distribution on the bottom of steel-box-girder where DFOS1 was installed. The maximum positive strain values in Step 1 and Step 2 were 136 µε and 256 µε respectively. The maximum negative strain values at the bridge tower in Step 1 and Step 2 were −86 µε and −130 µε respectively. Moreover, the maximum positive strain location was west shifted in Step 2 compared with Step 1, as Step 2 had 12 more load trucks arranged to the west side of the load truck array as compared with Step1. Besides the increase in strain value, the load increase also expanded the influence distance in the main span. In Step 1, the maximum influence distance from the west end to the first non-zero strain point of the main span is 409 m. In Step 2, the influence distance increased to 456 m. The full-scale strain distributions
measured directly by DFOS1 show the actual strain responses of the Haicang Bridge during the load test, and give a clear insight into the interaction between the structural components of a suspension bridge.
4.3. Performance of the DPP-BOTDA system
The DPP-BOTDA system was adopted to measure the strain distributions of DFOS2. Higher spatial resolution gives a better insight into non-uniform strain distribution over a small distance, which is highly valuable for structural monitoring. Since DFOS2 was installed between 154 m to 554 m, mea-sured from the east end (refer to figure 4(a)), Case 2 had negligible influence in this area according to figure 10(b)—therefore only Case 1 was measured. The measurement results of DFOS2 and their comparison with DFOS1 are shown in figure 11. DFOS2 measured similar results to DFOS1, indi-cating that the strain distributions along the bridge were smooth, and lacking steep strain gradients. The reliability and accuracy of these distributed strain measurements is demon-strated by the similarity in measurements given by the two independent strain measurement systems. However, there was a difference between the BOTDA and DPP-BOTDA measure-ments around 525 m. The measurement results of DFOS2 were relatively smaller than DFOS1. This was caused by variation in the installation condition of the DPP-BOTDA around 525 m. At this point on the bridge there was a footway, constructed of steel plates, and used for bridge inspections. The fibre-optic sensor was able to pass through the gap underneath the steel
Figure 10. Strain distributions along the bridge measured by DFOS1 using BOTDA in load test. (a) Case 1. (b) Case 2.
Meas. Sci. Technol. 27 (2016) 124017

J Xu et al
9
plates, but could not be fully glued to the deck. Therefore, the measured strain was relatively smaller than the actual result. The noise level of the DPP-BOTDA system was higher than that of the conventional BOTDA system. The average mea-surement error of the conventional BOTDA system was about ±5 µε, but the average measurement error range of the DPP-BOTDA system was about ±12 µε. With the DPP-BOTDA system, an improvement in spatial resolution using differential techniques comes at the expense of a reduction of SNR, which results in a higher measurement error within the spatial reso-lution than occurs with a conventional BOTDA system [23]. Even though DFOS2 was a polarization maintaining fibre, which had a better SNR for Brillouin signal than the single mode fibre, the measurement error level of the DPP-BOTDA system was still higher than the conventional BOTDA system. However, ±12 µε falls within the acceptable range for long distance strain measurement, and can be decreased by average process. The comparison results exhibited the characteristics of the DPP-BOTDA system and its effectiveness for high per-formance strain monitoring in field application.
4.4. Design check and condition assessment
The Haicang Bridge was designed to be symmetrical in struc-ture, so the structural behaviors under symmetrical load tend to be symmetrical. According to the DFOS1 results, the full scale strain distributions along the bridge under Case 1 were fairly symmetrical, indicating that the symmetrical design assumption of the Haicang Bridge was applicable. Moreover,
the structural conditions of Haicang Bridge can be assessed by the strain distributions. The steel type of the Haicang Bridge is Q345_16Mn with an elastic limit strain of 1500–1700 µε. The maximum strain increase in the load test, excluding the dead load introduced strain, was less than 300 µε, which is within 20% of the elastic limit strain of the steel. The strain values along the whole bridge were within the safety range and there was no severe deterioration in Haicang Bridge. Moreover, SHM methods such as dense modal identification would also benefit from such distributed strain data, in order to detect very dense estimates of strain mode shapes, and extract poten-tially useful damage-sensitive features.
5. Conclusions
This trial field study provides a sample demonstration of the feasibility of highly dense strain and temperature measure-ment for large scale infrastructure, using integrated distributed fibre-optic sensing systems. A full scale field monitoring of a 1108 m suspension bridge using DFOSs was successfully con-ducted, the first field application of a Brillouin time domain analysis system in thousand-metre-scale suspension bridges. The measured strain distributions along the whole length of the bridge gave a clear insight into the actual structural behav-iors of a suspension bridge during a load test. The interaction between the main cables and the steel-box-girder was high-lighted. A negative bending moment around the bridge tower was observed in both Case 1 and Case 2. The trucks’ load in the middle of the main span not only affected the main span,
Figure 11. Comparison of the measured strain distributions along the bridg by DFOS1 using BOTDA and DFOS2 using DPP-BOTDA. (a) Case 1, Step 1. (b) Case 1, Step 2.
Meas. Sci. Technol. 27 (2016) 124017

J Xu et al
10
but also applied negative strain distribution in both side spans. The Brillouin system using the DPP technique was compared with a conventional Brillouin time domain analysis system, and was found to be effective for high spatial resolution and long distance strain measurement in field monitoring condi-tions. The reliability and availability of the distributed strain measurements can be verified by observing the similarity in the results of the double systems. The average measure-ment error of the Brillouin system using DPP technique was found to be ±12 µε, which is higher than ±5 µε of a con-ventional Brillouin time domain analysis system. The sym-metrical design assumption of the Haicang Bridge was found to be applicable. The measured strain increase along the whole bridge during the loading test was within 20% of the elastic limit of the steel, indicating that the structural condi-tion of Haicang Bridge was within the safety range. For future studies, various SHM methods on suspension bridges will undoubtedly benefit from the highly dense strain data in this paper.
Acknowledgment
Financial support from the National High Technology Research and Development Program of China 863 Program 2014AA110401, the Ministry of Science and Technology of China (Grant No: 2015DFG82080), the National Key Tech-nology R&D Program 2014BAG05B07, the National Key Scientific Instrument and Equipment Development Proj-ect 2013YQ040815, and the NSF of China 61575052 and 61308004 is greatly appreciated.
References
[1] Jinping Ou and Hui Li 2010 Structural health monitoring in mainland China: review and future trends Struct. Health Monit. 9 219–31
[2] Li S, Zhu S, Xu Y-L, Chen Z-W and Li H 2012 Long-term condition assessment of suspenders under traffic loads based on structural monitoring system: application to the Tsing Ma Bridge Struct. Control Health Monit. 19 82–101
[3] Chan T H T, Yu L, Tam H Y, Ni Y Q, Liu S Y, Chung W H and Cheng L K 2006 Fibre Bragg grating sensors for structural health monitoring of Tsing Ma bridge: background and experimental observation Eng. Struct. 28 648–59
[4] Kurata M, Kim J, Lynch J, van der Linden G, Sedarat H, Thometz E, Hipley P and Sheng L 2012 Internet-enabled wireless structural monitoring systems: development and permanent deployment at the new carquinez suspension bridge J. Struct. Eng. 139 1688–702
[5] Chen X, Matsumoto M and Kareem A 2000 Time domain flutter and buffeting response analysis of bridges J. Eng. Mech. 126 7–16
[6] Hong A, Ubertini F and Betti R 2010 Wind analysis of a suspension bridge: identification and finite-element model simulation J. Struct. Eng. 137 133–42
[7] Caracoglia L 2008 Influence of uncertainty in selected aerodynamic and structural parameters on the buffeting response of long-span bridges J. Wind Eng. Ind. Aerodyn. 96 327–44
[8] Sepe V, Caracoglia L and D’Asdia P 2000 Aeroelastic instability of long-span bridges: contributions to the analysis in frequency and time domains Wind Struct. 3 41–58
[9] Bolognini G, Soto M A and Di Pasquale F 2010 Simultaneous distributed strain and temperature sensing based on combined Raman–Brillouin scattering using Fabry–Perot lasers Meas. Sci. Technol. 21 94025
[10] Belal M, Cho Y T, Ibsen M and Newson T P 2010 A temperature-compensated high spatial resolution distributed strain sensor Meas. Sci. Technol. 21 15204
[11] Taki M, Soto M A, Bolognini G and Di Pasquale F 2013 Study of Raman amplification in DPP-BOTDA sensing employing simplex coding for sub-meter scale spatial resolution over long fibre distances Meas. Sci. Technol. 24 94018
[12] Leung C K Y, Wan K T, Inaudi D, Bao X, Habel W, Zhou Z, Ou J, Ghandehari M, Wu H C and Imai M 2015 Review: optical fibre sensors for civil engineering applications Mater. Struct. 48 871–906
[13] Bao X and Chen L 2011 Recent progress in Brillouin scattering based fibre sensors Sensors 11 4152–87
[14] Matta F, Bastianini F, Galati N, Casadei P and Nanni A 2008 Distributed strain measurement in steel bridge with fibre optic sensors: validation through diagnostic load test J. Perform. Constr. Facil. 22 264–73
[15] Minardo A, Persichetti G, Testa G, Zeni L and Bernini R 2012 Long term structural health monitoring by Brillouin fibre-optic sensing: a real case J. Geophys. Eng. 9 S64–9
[16] Minardo A, Bernini R, Amato L and Zeni L 2012 Bridge monitoring using Brillouin fibre-optic sensors IEEE Sens. J. 12 145–50
[17] Regier R and Hoult N A 2014 Distributed strain behavior of a reinforced concrete bridge: case study J. Bridge Eng. 19 5014007
[18] Horiguchi T and Tateda M 1989 Optical-fibre-attenuation investigation using stimulated Brillouin scattering between a pulse and a continuous wave Opt. Lett. 14 408
[19] Horiguchi T, Kurashima T and Tateda M 1989 Tensile strain dependence of Brillouin frequency shift in silica optical fibres IEEE Photonics Technol. Lett. 1 107–8
[20] Li W, Bao X, Li Y and Chen L 2008 Differential pulse-width pair BOTDA for high spatial resolution sensing Opt. Express 16 21616–25
[21] Dong Y, Bao X and Li W 2009 Differential Brillouin gain for improving the temperature accuracy and spatial resolution in a long-distance distributed fibre sensor Appl. Opt. 48 4297–301
[22] Bolognini G and Hartog A 2013 Raman-based fibre sensors: trends and applications Opt. Fibre Technol. 19 678–88
[23] Dong Y, Zhang H, Chen L and Bao X 2012 2 cm spatial-resolution and 2 km range Brillouin optical fibre sensor using a transient differential pulse pair Appl. Opt. 51 1229
Meas. Sci. Technol. 27 (2016) 124017


![6-plain strain compression...2. Large Scale True Triaxial Apparatus A large-scale true triaxial apparatus [3] was employed to conduct plane strain compression tests on gravel. The](https://img.pdfslide.net/doc/110x75/610862f054996469d42540ef/6-plain-strain-compression-2-large-scale-true-triaxial-apparatus-a-large-scale.jpg)