Embed Size (px)
Citation preview

Full Service Partnerships: California’s Investment to Support
Children and TransitionAge Youth with Serious Emotional Disturbance and
Adults and Older Adults with Severe Mental Illness
Draft Report – for Stakeholder Input
UCLA Center for Healthier Children, Youth and Families
The following report was funded by the Mental Health Services Oversight and Accountability Commission
July 25, 2012

Draft Report – for Stakeholder Input
Full Service Partnerships: California’s Investment to Support Children and Transition‐Age Youth with Serious Emotional Disturbance and Adults and Older Adults with Severe Mental Illness
Page i
Table of Contents
Executive Summary ............................................................................................................................ iii
I. Introduction .................................................................................................................................. 1 1. Presentations to Client & Family Groups/Organizations Representing Unserved/
Underserved Groups .............................................................................................................. 3 2. Key Stakeholder Interviews with Individuals Representing Client & Family Groups/
Organizations Representing Unserved/Underserved Groups ............................................... 4 3. Presentations to Associations/Service Provider Agencies ..................................................... 5 4. Interviews with Representatives from Associations/Service Provider Agencies ................... 5 5. Evaluation Advisory Group ..................................................................................................... 6 6. Interviews with Peer Advocates & Parent Partners ............................................................... 8 7. Involvement of Key Stakeholders: Summary ....................................................................... 12
a. Methodology ................................................................................................................................ 13 1. Program Costs ...................................................................................................................... 17 2. Age Groups ........................................................................................................................... 17 3. Housing ................................................................................................................................ 17 4. Outreach .............................................................................................................................. 19 5. Operational Definitions ........................................................................................................ 19 6. Cost Components ................................................................................................................. 20 7. Standardized Client Years .................................................................................................... 21
b. Per‐Person Annual Cost Average by Age Group .......................................................................... 25 c. Contextual Factors – Impact on Cost ........................................................................................... 28 d. Summary ...................................................................................................................................... 29
IV. Cost Offsets for Full Service Partnership Programs ....................................................................... 30 a. Methodology ................................................................................................................................ 30
1. New Enrollees ...................................................................................................................... 30 2. Annual per‐Client Offset Area Cost ...................................................................................... 31 3. Annualized per‐Client Offset Area Cost ............................................................................... 32
b. Acute Care Hospitalization (Physical Health) ............................................................................... 33 1. Statewide Acute (Physical Health) Inpatient Hospitalization Rate ...................................... 33 2. DCR Variables Analyzed at Baseline & Follow‐Up ................................................................ 34 3. Calculations – Acute Medical (Physical Health) Inpatient Hospitalization .......................... 34 4. Findings – Acute Medical (Physical Health) Inpatient Hospitalization ................................ 35
c. Inpatient Psychiatric Hospitalization ............................................................................................ 38 1. Statewide Acute (Physical Health) Inpatient Hospitalization Rate ...................................... 38 2. DCR Variables Analyzed at Baseline & Follow‐Up ................................................................ 39 3. Calculations – Inpatient Psychiatric Hospitalization ............................................................ 39 4. Findings – Inpatient Psychiatric Hospitalization ................................................................. 40
d. Skilled Nursing Facilities (Non‐Psychiatric) .................................................................................. 43

Draft Report – for Stakeholder Input
Full Service Partnerships: California’s Investment to Support Children and Transition‐Age Youth with Serious Emotional Disturbance and Adults and Older Adults with Severe Mental Illness
Page ii
1. Statewide Skilled Nursing Facility Rate (Non‐Psychiatric) ................................................... 43 2. DCR Variables Analyzed at Baseline & Follow‐Up ................................................................ 44 3. Calculations – Skilled Nursing Facility (Physical Health) ...................................................... 44 4. Findings – Skilled Nursing Facility (Physical Health) ............................................................ 45
e. Incarceration ................................................................................................................................ 48 1. Statewide Incarceration Rates ............................................................................................. 48 2. DCR Variables Analyzed at Baseline & Follow‐Up ................................................................ 50 3. Calculations – Incarceration ................................................................................................. 52 4. Findings – Incarceration ...................................................................................................... 52
f. Summary ...................................................................................................................................... 61 a. Process for Stakeholder Input ...................................................................................................... 69
1. Full Service Partnership Cost‐Offset Report ........................................................................ 69 2. County‐Specific FSP Costs & Cost‐Offset Tables .................................................................. 69
b. Subsequent Reports ..................................................................................................................... 70
Appendix A FSP Service Description ................................................................................................... 72 a. Full Service Partnership Services .................................................................................................. 74
1. Outreach & Engagement ...................................................................................................... 74 2. Recruitment – Priority to Unserved Populations ................................................................. 75 3. Assessment & Planning ........................................................................................................ 75 4. Required MHSA Practices ..................................................................................................... 78 5. MHSA Principles ................................................................................................................... 80 6. Outpatient Mental Health Services ...................................................................................... 81 7. Outpatient Mental Health Services ...................................................................................... 82 8. Peer Support Services .......................................................................................................... 83 9. Housing ................................................................................................................................ 85 10. FSP Team Composition ................................................................................................... 86 11. Co‐Occurring Disorders ................................................................................................... 86 12. FSP Services Summary .................................................................................................... 87
Appendix B Planned FSP Services by County ...................................................................................... 88
Appendix C Technical Appendix ....................................................................................................... 132
Appendix D County Participants ....................................................................................................... 143
Appendix E Revenue & Expenditure Reports .................................................................................... 146

Draft Report – for Stakeholder Input
Full Service Partnerships: California’s Investment to Support Children and Transition‐Age Youth with Serious Emotional Disturbance and Adults and Older Adults with Severe Mental Illness
Page iii
Executive Summary
Proposition 63 (2004) provides increased funding through the Mental Health Services Act (MHSA) to support mental health services and promote innovative services and best practices for individuals with mental illness and inadequate access to the traditional public mental health system. Prop 63 funds are distributed to county departments of mental health to implement MHSA components. The focus of this report is the Full Service Partnership (FSP), which is designed to serve Californians in all phases of life who experience the most severe mental health challenges because of illness or circumstance. This population has been historically underserved and has substantial opportunity for benefits from improved access and participation in quality mental health treatment and support. FSP programs are a large portion of the Community Services and Supports (CSS) funding allocation from MHSA. There is a requirement that most of the CSS budget be allocated to FSP, and that clients be served with “whatever it takes.” The remaining portions of CSS (can be up to 49 percent of county MHSA budgets) are used to cover gaps in systems of care related to needs for supportive services, such as transportation or vocational training (which are typically unfunded), crisis intervention and treatment.
The focus of this report is twofold, and critically important.
• First, this report identifies the average statewide annual and per‐day cost1 of providing FSP services to clients in California. The costs of FSP services are calculated in two categories: program services – which includes activities required under the Mental Health Services Act, as well as any evidence‐based models and/or practices offered – and housing costs.2 While FSP clients may be represented in marginal additional costs (e.g., outreach) there is not a feasible way of parsing these expenditures, and impacts on cost estimates would be minor.
• Second, this report identifies the cost savings3 that society realizes because these services have been provided. Of course, these savings are not the sole justification of expenditures; the prime purpose of the law is to improve services to citizens with mental illness most in need of assistance. However, it is a primary purpose of accountable and transparent public service to demonstrate the impacts of this needed and individually tailored service on public concerns. Therefore, this analysis summarizes the savings that are incurred in a limited number of public services for the recipients of FSP services. To state this differently, this analysis assesses the costs to society with respect to health services that are incurred by persons facing severe mental health challenges and public costs incurred because of criminal justice system involvement attributable to these challenges.
It is important to note that this is a conservative analysis. Costs that are not clearly attributable to FSP clients have not been included, and cost savings estimates have been indexed to conservative estimates of cost. As is widely recognized, estimating the costs of savings attributable to service is complex – from both a cost estimate and a
1 Although the technically accurate term is expenditure based on the data sources analyzed, this term is cumbersome, and not user‐friendly to the lay reader. Therefore, the term cost will be used in place of expenditure throughout this Executive Summary. 2 Housing is defined as housing support, operating support and housing placement. It does not include the Governor’s Housing Initiative. Housing support is the cost of housing subsidies for permanent, transitional and temporary housing; master leases; motel and other housing vouchers; rental security deposits; first‐ and last‐month rental payments; and other fiscal housing supports. The operating costs of providing housing supports to clients include building repair and maintenance, utilities, housing agency management fees, insurance, property taxes and assessments and credit reporting fees. Housing placement is assistance in securing housing, including supportive housing – permanent affordable housing with combined supports for independent living. 3 The terms cost savings and cost offsets are used interchangeably throughout the Executive Summary.

Draft Report – for Stakeholder Input
Full Service Partnerships: California’s Investment to Support Children and Transition‐Age Youth with Serious Emotional Disturbance and Adults and Older Adults with Severe Mental Illness
Page iv
savings estimate point of view. At each step in these estimation processes, we have consciously adopted a conservative approach.
In order to include a county in the FSP Cost and Cost Offset Report, we needed Full Service Partnership costs broken out by age group. The only way to reliably and accurately obtain this information was to ask the counties directly. A web survey was launched in order to collect FSP Costs by Age Group. The majority of counties responded – 37 (63.8%). 4 Their FSP Costs and Cost Offsets by Age Group are included in this draft report. The remaining counties have been given until August 3 to respond, and hopefully every county will be included the final report.
Cost of FSP Services FSP services are intensive to meet the needs of FSP‐targeted clients. This is driven primarily by the policy objective to meet the serious needs of the hardest‐to‐serve clients – those with severe mental illness. This policy objective includes both meeting the service and quality‐of‐life needs of FSP clients and the social outcomes and services needs of California. To assess this complex balance of service objectives, this study has assessed a broad range of costs to citizens of California that are a consequence of service delivery to mental health clients most in need.
Per the MHSA Community Services and Supports Three‐Year Program and Expenditure Plan requirements, “Each county must plan for each age group in their populations to be served.” (p. 13)5 Age groups are defined as follows:
• Children, Youth and Families (CYF): Birth to 18 years, and special‐education pupils from birth to age 21 (p. 21)
• Transition‐Age Youth (TAY): 16 to 25 years (p. 21)
• Adults: No specific age range is given
• Older Adults: 60 years and older (p. 21)
As previously noted, the majority of counties are included in this draft report (N = 37; 63.8%).6 The populations of counties (numbers of persons residing in the county, according to census data) represented in this report for Fiscal Year 2009‐10 (FY 09‐10) comprise the majority of the State of California (67.3%).7 The majority are also represented for Fiscal Year 2008‐09 (66.9%).
Although a majority of counties are included in the findings displayed in this Executive Summary, these findings should be considered preliminary because data are currently being collected from the remaining 20 counties.
More specifically,
4 Three counties and one municipality submitted their web survey too late for inclusion in this report draft, but will be analyzed in time for distribution for county review on 7/27, and for inclusion in the Final Report. The additional counties/municipality will bring the total number of participants to 41 (71%). Note that one county was in start‐up during the entire study period, and was therefore removed from the total N for purpose of calculation. Therefore, the N = 58 (rather than 59). The link to census data is: http://www.census.gov/popest/research/eval‐estimates/eval‐est2010.html 5 http://www.dmh.ca.gov/dmhdocs/docs/letters05/05‐05CSS.pdf Children and adolescents identified as seriously emotionally disturbed (SED) are eligible for FSPs if they meet the criteria set forth in Welfare and Institutions Code section 5600.3, subdivision (a). Adults and older adults identified to have a serious mental disorder are eligible for FSPs if they meet the criteria set forth in subdivision (b) of section 5600.3. http://www.leginfo.ca.gov/cgi‐bin/displaycode?section=wic&group=05001‐06000&file=5600‐5623.5 California’s Welfare and Institutions Code is posted in its entirety on the website cited above, absent page numbers. Click on the link and the section cited will appear on screen, verbatim, as quoted. 6 See footnote #4. 7 See Appendix D of the full Report for a list of county participants.

Draft Report – for Stakeholder Input
Full Service Partnerships: California’s Investment to Support Children and Transition‐Age Youth with Serious Emotional Disturbance and Adults and Older Adults with Severe Mental Illness
Page v
• Costs of service are program and housing costs for all clients in Fiscal Year 2008‐09 (FY 08‐09), and in FY 09‐10 as discussed above. Separate tables are provided for each fiscal year. Age groups are displayed on separate rows within each table.
• FSP participants represented in Tables 1 through 4 are people who received FSP services during the fiscal year (FY 08‐09 and/or FY 09‐10). 8 This includes FSP clients with:
o Start date in the fiscal year and end date in the fiscal year 9 o Start date before the fiscal year and end date in the fiscal year o Start date in the fiscal year and no end date (still enrolled) o Start date before the fiscal year and no end date (still enrolled)
The calculations shown in Tables 1 and 3 use annualized cost per FSP client year as a standard metric for service costs across counties. The calculation of annualized cost per FSP client involved the following steps:
• Identified all clients who were enrolled in FSP during the target fiscal year;
• Calculated the number of days that each was enrolled during the target fiscal year;
• Summed number of days enrolled across all enrollees;
• Divided by 365.
Table 1. Full Service Partnership Services: Per‐Person Annualized Cost per Client by Age Group (Fiscal Year 08‐09)
Number Served
Sum of Days
Number of Client Years
Annualized Cost per FSP Client
Daily Cost per FSP Client
FSP FY 08‐09 Total Costs
% of Total FSP Costs in FY 08‐09
CYF 3,695 917,465 2,513.6 $19,754.15 $54.12 $49,654,022.82 18.6%
TAY 3,082 829,784 2,273.4 $20,213.68 $55.38 $45,953,770.49 17.3%
Adults 7,414 1,913,845 5,243.4 $28,289.04 $77.50 $148,330,743.06 55.7%
Older Adults 1,112 300,503 823.3 $27,158.00 $74.41 $22,359,184.69 8.4%
Total 15,303 3,961,597 10,853.7 $24,535.20 $61.58 $266,297,721.06 100.0%
Table 2, below, shows overall Full Service Partnership Program costs by age group for FY 08‐09.
Table 2. Full Service Partnership Services: Percent of Core Cost Components Devoted to FSPs, by Age Group
(Fiscal Year 08‐09)
CYF TAY Adults Older Adults
Amount Percent Amount Percent Amount Percent Amount Percent
Housing $1,640,181.44 3.3% $3,236,489.17 7.0% $18,882,856.29 12.7% $2,190,973.10 10.0%
Program Services $48,013,841.38 96.7% $42,717,281.32 93.0% $129,447,886.77 87.3% $20,168,211.59 90.0%
Total $49,654,022.82 100.0% $45,953,770.49 100.0% $148,330,743.06 100.0% $22,359,184.69 100.0%
8 Calculation of FSP participants is complex and the methodology too detailed for inclusion in an Executive Summary. Please refer to Chapter III in the full Report for details. 9 We account for FSPs with multiple start and stop dates within the same fiscal year.

Draft Report – for Stakeholder Input
Full Service Partnerships: California’s Investment to Support Children and Transition‐Age Youth with Serious Emotional Disturbance and Adults and Older Adults with Severe Mental Illness
Page vi
Table 3. Full Service Partnership Services: Per‐Person Annualized Cost per Client by Age Group (Fiscal Year 09‐10)
Number Served
Sum of Days
Number of Client Years
Annualized Cost per FSP Client
Daily Cost per FSP Client
FSP FY 09‐10 Total Costs
% of Total FSP Costs in FY 09‐10
CYF 5,319 1,230,007 3,369.9 $17,837.80 $48.87 $60,111,608.41 17.5%
TAY 4,313 1,170,876 3,207.9 $16,229.03 $44.46 $52,061,115.33 15.1%
Adults 8,976 2,400,189 6,575.9 $31,345.83 $85.88 $206,127,054.54 60.0%
Older Adults 1,330 371,160 1,016.9 $24,952.82 $68.36 $25,374,517.21 7.4%
Total 19,938 5,172,232 14,170.6 $24,252.63 $61.54 $343,674,295.98 100.0%
Table 4, below, shows overall Full Service Partnership Program costs by age group for FY 09‐10.
Table 4. Full Service Partnership Services: Percent of Core Cost Components Devoted to FSPs, by Age Group
(Fiscal Year 09‐10)
CYF TAY Adults Older Adults
Amount Percent Amount Percent Amount Percent Amount Percent
Housing $945,854.49 1.6% $4,226,403.24 8.1% $17,649,111.39 8.6% $2,666,345.13 10.0%
Program Services $59,165,753.92 98.4% $47,834,712.09 91.9% $188,477,943.15 91.4% $22,708,172.58 90.0%
Total $60,111,608.41 100.0% $52,061,115.33 100.0% $206,127,054.54 100.0% $25,374,517.71 100.0%
The age breakouts reveal that FSP services for adults comprise the majority of expenditures in both fiscal years. Although this revelation is not earth‐shattering in and of itself, what is interesting is the comparison of the percentage of numbers served, sum of days and percent of total FSP costs among the age groups. The comparison is illustrated most clearly in the following bar charts:
Exhibit I. Age Breakout Cost Comparisons: Percentages (Fiscal Year 08‐09 – All FSPs receiving Service in FY 08‐09)
26.7%21.6%
45.0%
6.7%
23.8% 22.6%
46.4%
7.2%
17.5%15.1%
60.0%
7.4%
0.0%
10.0%
20.0%
30.0%
40.0%
50.0%
60.0%
70.0%
CYF TAY Adults Older Adults
% of # Served % of Sum of Days % of Total FSP Costs
Draft Report – for Stakeholder Input
Full Service Partnerships: California’s Investment to Support Children and Transition‐Age Youth with Serious Emotional Disturbance and Adults and Older Adults with Severe Mental Illness
Page vii
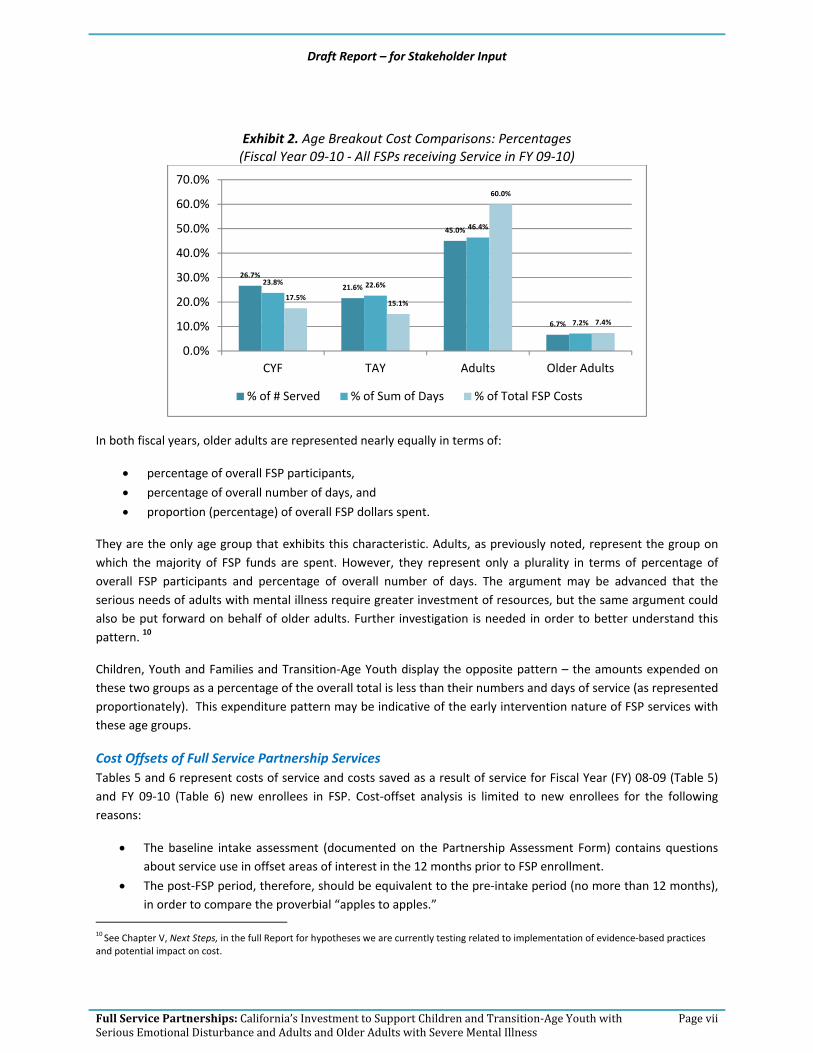
Exhibit 2. Age Breakout Cost Comparisons: Percentages (Fiscal Year 09‐10 ‐ All FSPs receiving Service in FY 09‐10)
In both fiscal years, older adults are represented nearly equally in terms of:
• percentage of overall FSP participants,
• percentage of overall number of days, and
• proportion (percentage) of overall FSP dollars spent.
They are the only age group that exhibits this characteristic. Adults, as previously noted, represent the group on which the majority of FSP funds are spent. However, they represent only a plurality in terms of percentage of overall FSP participants and percentage of overall number of days. The argument may be advanced that the serious needs of adults with mental illness require greater investment of resources, but the same argument could also be put forward on behalf of older adults. Further investigation is needed in order to better understand this pattern. 10
Children, Youth and Families and Transition‐Age Youth display the opposite pattern – the amounts expended on these two groups as a percentage of the overall total is less than their numbers and days of service (as represented proportionately). This expenditure pattern may be indicative of the early intervention nature of FSP services with these age groups.
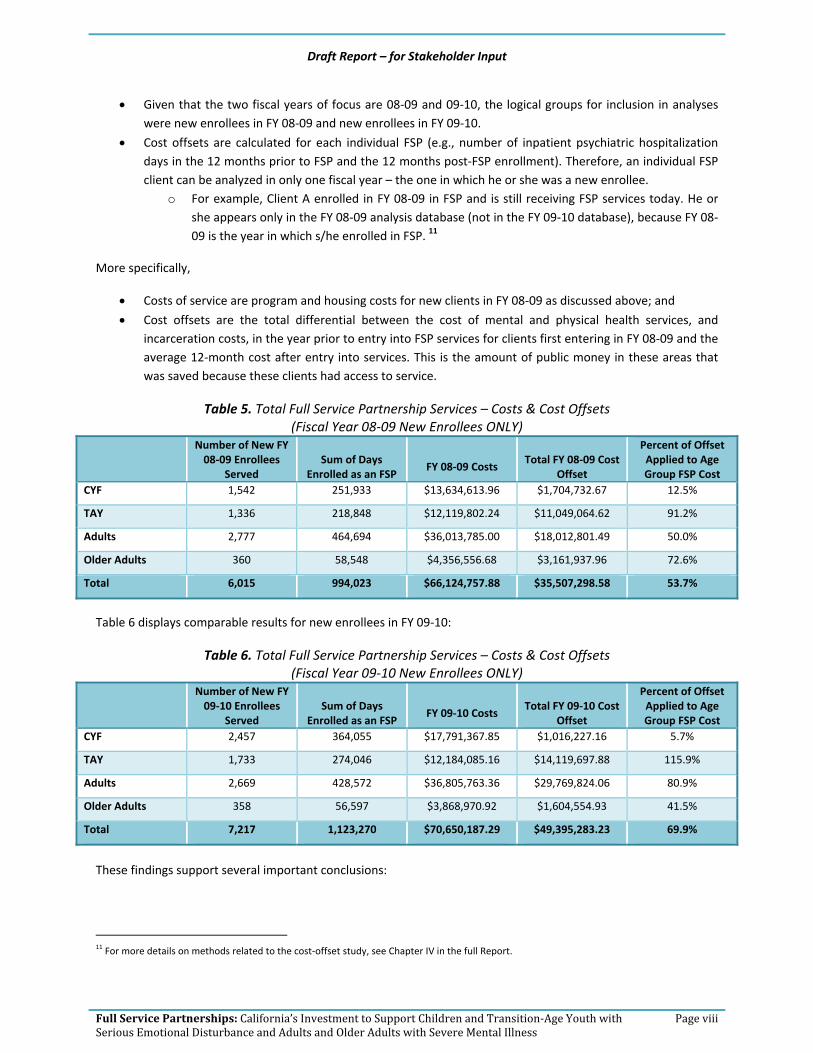
Cost Offsets of Full Service Partnership Services Tables 5 and 6 represent costs of service and costs saved as a result of service for Fiscal Year (FY) 08‐09 (Table 5) and FY 09‐10 (Table 6) new enrollees in FSP. Cost‐offset analysis is limited to new enrollees for the following reasons:
• The baseline intake assessment (documented on the Partnership Assessment Form) contains questions about service use in offset areas of interest in the 12 months prior to FSP enrollment.
• The post‐FSP period, therefore, should be equivalent to the pre‐intake period (no more than 12 months), in order to compare the proverbial “apples to apples.”
10 See Chapter V, Next Steps, in the full Report for hypotheses we are currently testing related to implementation of evidence‐based practices and potential impact on cost.
26.7%
21.6%
45.0%
6.7%
23.8% 22.6%
46.4%
7.2%
17.5%15.1%
60.0%
7.4%
0.0%
10.0%
20.0%
30.0%
40.0%
50.0%
60.0%
70.0%
CYF TAY Adults Older Adults
% of # Served % of Sum of Days % of Total FSP Costs
Draft Report – for Stakeholder Input
Full Service Partnerships: California’s Investment to Support Children and Transition‐Age Youth with Serious Emotional Disturbance and Adults and Older Adults with Severe Mental Illness
Page viii
• Given that the two fiscal years of focus are 08‐09 and 09‐10, the logical groups for inclusion in analyses were new enrollees in FY 08‐09 and new enrollees in FY 09‐10.
• Cost offsets are calculated for each individual FSP (e.g., number of inpatient psychiatric hospitalization days in the 12 months prior to FSP and the 12 months post‐FSP enrollment). Therefore, an individual FSP client can be analyzed in only one fiscal year – the one in which he or she was a new enrollee.
o For example, Client A enrolled in FY 08‐09 in FSP and is still receiving FSP services today. He or she appears only in the FY 08‐09 analysis database (not in the FY 09‐10 database), because FY 08‐09 is the year in which s/he enrolled in FSP. 11
More specifically,
• Costs of service are program and housing costs for new clients in FY 08‐09 as discussed above; and
• Cost offsets are the total differential between the cost of mental and physical health services, and incarceration costs, in the year prior to entry into FSP services for clients first entering in FY 08‐09 and the average 12‐month cost after entry into services. This is the amount of public money in these areas that was saved because these clients had access to service.
Table 5. Total Full Service Partnership Services – Costs & Cost Offsets (Fiscal Year 08‐09 New Enrollees ONLY)
Number of New FY 08‐09 Enrollees
Served Sum of Days
Enrolled as an FSP FY 08‐09 Costs
Total FY 08‐09 Cost Offset
Percent of Offset Applied to Age Group FSP Cost
CYF 1,542 251,933 $13,634,613.96 $1,704,732.67 12.5%
TAY 1,336 218,848 $12,119,802.24 $11,049,064.62 91.2%
Adults 2,777 464,694 $36,013,785.00 $18,012,801.49 50.0%
Older Adults 360 58,548 $4,356,556.68 $3,161,937.96 72.6%
Total 6,015 994,023 $66,124,757.88 $35,507,298.58 53.7%
Table 6 displays comparable results for new enrollees in FY 09‐10:
Table 6. Total Full Service Partnership Services – Costs & Cost Offsets (Fiscal Year 09‐10 New Enrollees ONLY)
Number of New FY 09‐10 Enrollees
Served Sum of Days
Enrolled as an FSP FY 09‐10 Costs
Total FY 09‐10 Cost Offset
Percent of Offset Applied to Age Group FSP Cost
CYF 2,457 364,055 $17,791,367.85 $1,016,227.16 5.7%
TAY 1,733 274,046 $12,184,085.16 $14,119,697.88 115.9%
Adults 2,669 428,572 $36,805,763.36 $29,769,824.06 80.9%
Older Adults 358 56,597 $3,868,970.92 $1,604,554.93 41.5%
Total 7,217 1,123,270 $70,650,187.29 $49,395,283.23 69.9%
These findings support several important conclusions:
11 For more details on methods related to the cost‐offset study, see Chapter IV in the full Report.
Draft Report – for Stakeholder Input
Full Service Partnerships: California’s Investment to Support Children and Transition‐Age Youth with Serious Emotional Disturbance and Adults and Older Adults with Severe Mental Illness
Page ix
• Even when assessing a restricted set of societal costs for these clients (e.g., mental and physical health, and incarceration) the cost savings to society are clear. These savings are greatest among the TAY age group, in which the measured costs are most salient. Costs for Youth are more clearly preventative and are not so clearly represented in the cost savings, cost components and time spans represented in this analysis. Similarly, cost savings for Older Adults may reflect increased cost protections (e.g., Medicare) in this age group.
• Cost savings over the two‐year period are consistent in relative magnitude across age groups. In particular, TAY consumers experienced the greatest cost‐related benefits of service. Transition‐Age Youth are at high risk for criminal justice and crisis management services, and FSP participation apparently has a significant impact on consequences for this age group.
• Cost offsets are dramatically lower for the CYF age group. This may reflect the more preventive orientation of services for children, which is not as clearly reflected in the short time line of the measured offsets. Effects of service are sensitive to life maturation, indicators of service success and the time horizon of measured effects. Given these parameters, the FSP program shows strong effects for those age groups for which age parameters and potential outcome parameters are most appropriate.
In summary, this analysis of cost offsets in larger social costs attributable to participation in the FSP program documents positive results. Results for the TAY and Adult age groups, where the great majority of clients reside, are particularly positive. This reflects the greater risk for hospitalization and incarceration that exists in these age groups. Overall, these results suggest a very positive treatment outcome, and return on investment, for FSP clients.
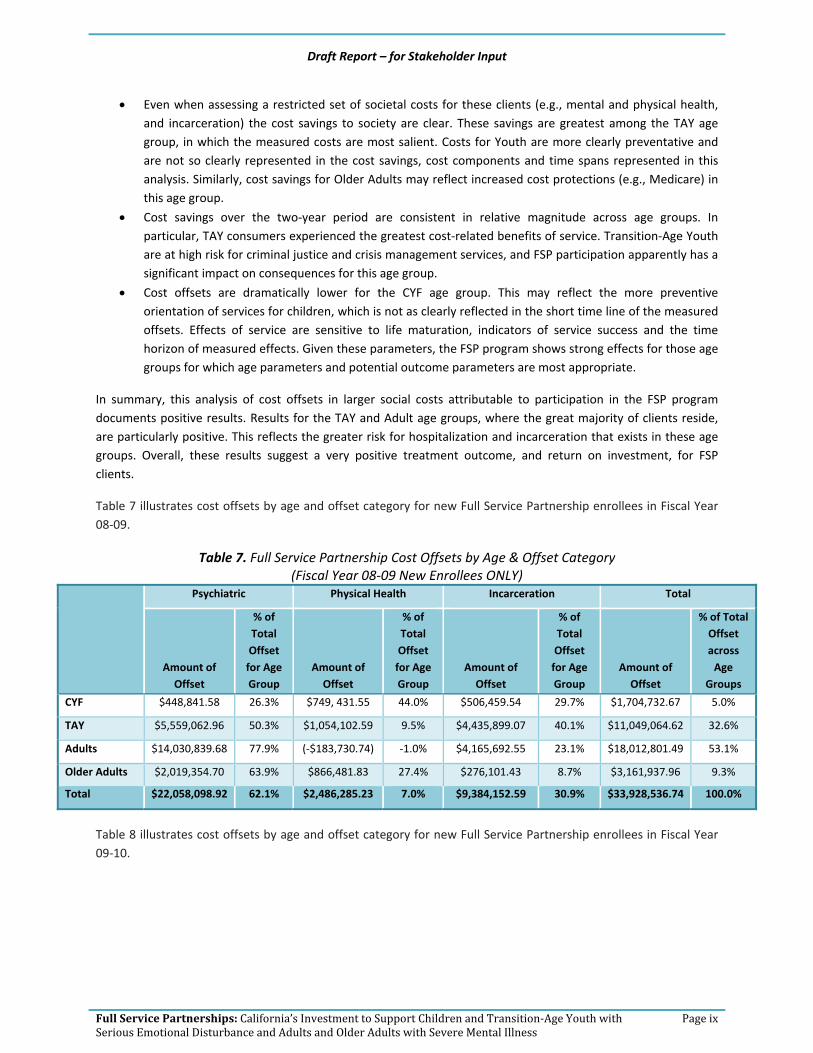
Table 7 illustrates cost offsets by age and offset category for new Full Service Partnership enrollees in Fiscal Year 08‐09.
Table 7. Full Service Partnership Cost Offsets by Age & Offset Category (Fiscal Year 08‐09 New Enrollees ONLY)
Psychiatric Physical Health Incarceration Total
Amount of Offset
% of Total Offset for Age Group
Amount of Offset
% of Total Offset for Age Group
Amount of Offset
% of Total Offset for Age Group
Amount of Offset
% of Total Offset across Age
Groups
CYF $448,841.58 26.3% $749, 431.55 44.0% $506,459.54 29.7% $1,704,732.67 5.0%
TAY $5,559,062.96 50.3% $1,054,102.59 9.5% $4,435,899.07 40.1% $11,049,064.62 32.6%
Adults $14,030,839.68 77.9% (‐$183,730.74) ‐1.0% $4,165,692.55 23.1% $18,012,801.49 53.1%
Older Adults $2,019,354.70 63.9% $866,481.83 27.4% $276,101.43 8.7% $3,161,937.96 9.3%
Total $22,058,098.92 62.1% $2,486,285.23 7.0% $9,384,152.59 30.9% $33,928,536.74 100.0%
Table 8 illustrates cost offsets by age and offset category for new Full Service Partnership enrollees in Fiscal Year 09‐10.

Draft Report – for Stakeholder Input
Full Service Partnerships: California’s Investment to Support Children and Transition‐Age Youth with Serious Emotional Disturbance and Adults and Older Adults with Severe Mental Illness
Page x
Table 8. Full Service Partnership Cost Offsets by Age & Offset Category (Fiscal Year 09‐10 New Enrollees ONLY)
Psychiatric Physical Health Incarceration Total
Amount of Offset
% of Total Offset for Age Group
Amount of Offset
% of Total Offset for Age Group
Amount of Offset
% of Total Offset for Age Group
Amount of Offset
% of Total Offset across Age
Groups
CYF $698,234.88 68.7% ‐($557, 027.28) ‐54.8% $875,019.56 86.1% $1,016,227.16 2.2%
TAY $5,476,779.84 38.8% $3,033,519.08 21.5% $5,609,398.96 39.7% $14,119,697.88 30.4%
Adults $20,009,702.44 67.2% $6,066,677.59) 20.2% $3,753,444.03 12.6% $29,769,824.06 64.0%
Older Adults $2,091,068.00 130.3% ‐($597,093.47 ‐37.2% $110,580.40 6.9% $1,604,554.93 3.4%
Total $28,275,785.16 57.2% $7,886,075.92 16.0% $10,348,442.95 26.8% $46,510,304.03 100.0%
Findings as displayed in Tables 7 and 8 support the following conclusions:
• For Adults and Older Adults, the greatest proportion of offsets each fiscal year is accounted for by inpatient psychiatric hospitalization.
• Physical health (inpatient hospitalization – acute and skilled nursing – non‐psychiatric) offsets more than doubled as a percentage of overall offsets – from seven percent in FY 08‐09 to 16 percent in FY 09‐10. This results from savings for Adults and TAY.
• Unlike FY 08‐09 results, in which a plurality of CYF showed the greatest proportion of offsets in this area, CYF do not show offsets in the area of physical health in FY 09‐10. Further exploration is needed to determine why there is a difference between the two fiscal years.
• Among Older Adults, over a quarter of offsets in FY 08‐09 were attributable to savings in physical health. No cost offsets, however, were observed for this group of Older Adults in FY 09‐10. Further exploration is needed to determine why there is a difference between the two fiscal years.
• Unlike FY 08‐09, in which nearly a third of CYF offsets were attributable to savings in number of days incarcerated, most of the savings in FY 09‐10 were in this area. Incarceration savings for TAY were nearly identical between the two fiscal years.
Percentage of overall offset represented by each age group (new enrollees only) is compared to their proportion in terms of overall numbers served, days of service, and costs (Exhibits 3 and 4).

Draft Report – for Stakeholder Input
Full Service Partnerships: California’s Investment to Support Children and Transition‐Age Youth with Serious Emotional Disturbance and Adults and Older Adults with Severe Mental Illness
Page xi
Exhibit 3. Full Service Partnership % of Costs & Cost Offsets by Age & Offset Category (Fiscal Year 08‐09 New Enrollees ONLY)
Exhibit 4. Full Service Partnership % of Costs & Cost Offsets by Age & Offset Category (Fiscal Year 09‐10 New Enrollees ONLY)
Findings as illustrated in Exhibits 3 and 4 support the following conclusions:
• As was the case in FY 08‐09, offsets for TAY in FY 09‐10 are in far greater proportion to their numbers, days of service and costs when compared with other age groups’ offsets.
• The proportion of offsets for Older Adults declines in FY 09‐10, whereas in FY 08‐09, the percentage of cost offsets was on par with their numbers, days of service and the percent expended.
25.6% 22.2%
46.2%
6.0%
25.3%22.0%
46.7%
5.9%
18.6%
17.3%
55.7%
8.4%5.0%
32.6%
53.1%
9.3%
0.0%
10.0%
20.0%
30.0%
40.0%
50.0%
60.0%
CYF TAY Adults Older Adults
% of # Served % of Sum of Days
% of Total FSP Costs % of Total FSP Cost Offsets
34.0%
24.0%
37.0%
5.0%
32.4%24.4%
38.2%
5.0%
17.5%
15.1%
60.0%
7.4%
2.2%
30.4%
64.0%
3.4%
0.0%
10.0%
20.0%
30.0%
40.0%
50.0%
60.0%
70.0%
CYF TAY Adults Older Adults
% of # Served % of Sum of Days
% of Total FSP Costs % of Total FSP Cost Offsets

Draft Report – for Stakeholder Input
Full Service Partnerships: California’s Investment to Support Children and Transition‐Age Youth with Serious Emotional Disturbance and Adults and Older Adults with Severe Mental Illness
Page xii
• As was exhibited in FY 08‐09, Adults in FY 09‐10 represent the age group on whom the greatest amount is spent, and as a proportion of overall offsets by age group, they also represent the greatest amount in terms of savings. In FY 09‐10, offsets for Adults exceeds cost of service for new enrollees.
• Savings for Children, Youth and Families as a whole represented only five percent in FY 08‐09 and less than three percent of cost offsets in FY 09‐10. However, this is in keeping with the focus on investing in the population to prevent later, more severe mental health problems.
Exhibits 5 through 8 illustrate the proportion of offset in each area for the age groups. The two fiscal years are combined in the pie charts. 12
Exhibit 5. Full Service Partnership % of Cost Offsets w/in CYF Age Group (FY 08‐09 & FY 09‐10 New Enrollees ONLY)
Exhibit 6. Full Service Partnership % of Cost Offsets w/in TAY Age Group (FY 08‐09 & FY 09‐10 New Enrollees ONLY)
12 As shown in Tables 7 and 8, some of the offset areas are in arrears (negative balance), and a pie chart cannot be created with a “negative slice.” However, a negative balance in any one offset area only appears in one fiscal year for any given age group. Thus, when the fiscal years are combined, a pie chart can be created.
Physical Health $1,147,076.46
42%
Incarceration$192,404.27
7%
Psychiatric$1,381,479.10
51%
Psychiatric$11,035,842.80
44%
Physical Health$4,087,621.67
16%
Incarceration$10,045,298.03
40%

Draft Report – for Stakeholder Input
Full Service Partnerships: California’s Investment to Support Children and Transition‐Age Youth with Serious Emotional Disturbance and Adults and Older Adults with Severe Mental Illness
Page xiii
Exhibit 7. Full Service Partnership % of Cost Offsets w/in Adult Age Group (FY 08‐09 & FY 09‐10 New Enrollees ONLY)
Exhibit 8. Full Service Partnership % of Cost Offsets w/in Older Adult Age Group (FY 08‐09 & FY 09‐10 New Enrollees ONLY)
The most consistent finding among the age groups is psychiatric offsets accounting for the majority of savings. Incarceration represents the next area of savings for TAY, Adults and Older Adults.
Stakeholder Feedback Process The Request for Proposal for the Expanded Statewide Evaluation of the Mental Health Services Act specifies: For Deliverable 1 – Full Service Partnerships, establish and maintain stakeholder engagement in the evaluation that is representative of a wide scope of expertise, including:
• A process for input from individuals living with mental illness, family members/personal caregivers and representatives of culturally diverse unserved and underserved groups of all ages, and
Psychiatric $34,040,542.12
71%
Physical Health$5,822,946.85
12%
Incarceration$7,919,136.58
17%
Psychiatric $4,110,422.70
86%
Physical Health $269,388.36
6%
Incarceration$386,681.83
8%

Draft Report – for Stakeholder Input
Full Service Partnerships: California’s Investment to Support Children and Transition‐Age Youth with Serious Emotional Disturbance and Adults and Older Adults with Severe Mental Illness
Page xiv
• A process for input from researchers, data analysts and programmers who are responsible for local data evaluation efforts.
Our stakeholder engagement process involved seven key strategies:
1. Presentations to client and family groups/organizations representing unserved/underserved groups 2. Key stakeholder interviews with individuals representing client/family groups and organizations
representing unserved/underserved groups 3. Presentations to associations/service provider organizations 4. Key stakeholder interviews with individuals representing associations/service provider organizations 5. Formation of an Evaluation Advisory Group 6. Key stakeholder interviews with peer advocates and parent partners 7. (ongoing) Product review/feedback: Stakeholder input will be sought for two key deliverables:
o This executive summary and the accompanying draft report o County‐specific tables depicting FSP costs and cost offsets13
This report14 will be released publicly at the Mental Health Services Oversight and Accountability Commission meeting on July 26, 2012. Stakeholders may submit comments in writing via e‐mail to:
[email protected] Feedback must be submitted no later than August 26, in order to allow EMT sufficient time for revision to the Final Report due September 30, 2012.
As noted previously, the majority of counties are included in this report (N = 37; 63.8%).15 The populations of counties (defined as persons residing in the county, documented through census data) represented in this report for Fiscal Year 09‐10 comprise the majority of the State of California (67.3%).16 The majority are also represented for Fiscal Year 08‐09 (66.9%).
County‐specific matrices that replicate the tables in this report will be distributed to participating counties on July 27, 2012. Counties have a 30‐day review and comment period. Feedback is due to EMT Associates no later than August 27, 2012. The deadline has been set in order to provide EMT with sufficient time to a) make necessary revisions and b) conduct cross‐county analyses for the Final Report, due September 30, 2012.17
However, an opportunity was provided to the remaining 20 counties/municipalities to complete the web survey, by July 13. The remaining counties have been given until August 3 to respond, and hopefully every county will be included the final report.
13 The data contained in the county‐specific tables form the basis for creation of the statewide data set, summarized and reported here. 14 Phase III. Deliverable 1.C. Initial written report that specifies the financial impact of outcomes achieved in comparison with expenditures for FSPs for each of the four age groups. 15 Three counties and one municipality submitted their web survey too late for inclusion in this report draft, but will be analyzed in time for distribution for county review on 7/27/12, and for inclusion in the Final Report. The additional counties/municipality will bring the total number of participants to 41 (71%). Note that one county was in start‐up during the entire study period, and was consequently removed from the total N for purpose of calculation. Therefore, the N = 58 (rather than 59). 16 See Appendix D in the full Report for a list of county participants. Population data were extracted by county and for the State, for 2008 (corresponding to FY 08‐09) and 2009 (corresponding to FY 09‐10), from census data: http://www.census.gov/popest/research/eval‐estimates/eval‐est2010.html 17 Phase III. Deliverable 1.B – Revised Deliverable 1.A. in response to stakeholder input, and Phase III. Deliverable 1.D. – Revised Deliverable 1C. in response to stakeholder input.

Draft Report – for Stakeholder Input
Full Service Partnerships: California’s Investment to Support Children and Transition‐Age Youth with Serious Emotional Disturbance and Adults and Older Adults with Severe Mental Illness
Page xv
Counties with complete web survey data will be analyzed and provided with a county‐specific matrix, following the procedures described in the paragraph above. Input from the counties through the web survey is essential in determining the breakout of Full Service Partnership expenditures by age group due to limitations in the Revenue and Expenditure Report data. In particular, the Revenue and Expenditure Reports18 were not designed with the requirement that expenditures be reported by age group:
• Children, Youth and Families
• Transition‐Age Youth
• Adults
• Older Adults
The report delivered to the MHSOAC on September 30, 2012, will be the Final Report. A compendium of feedback submitted and the disposition of each stakeholder’s comments will be contained in an appendix in the Final Report. The revision to this report will include the following additional offset areas:
• Long‐Term Care (number of days), 19 • Skilled Nursing (Psychiatric) (number of days), • Emergency Room Use (number of visits), and • Arrests (number of)
The Final Report will include FSP costs for additional counties. The exact, final number of participating counties therefore cannot be determined at this time. Absent FSP cost by age group data, cost offsets cannot be calculated. We are therefore working diligently with the California Mental Health Directors Association to encourage participation in the web survey by the remaining 20 counties, in order to reach a participation rate of 75 percent (N = 44). 20
In summary, the Final Report will incorporate data from additional counties21 in order to develop revised:
• Statewide and County Full Service Partnership Cost by Age Group o Children, Youth and Families o Transition‐Age Youth o Adults o Older Adults
• Statewide and County22 Full Service Partnership Cost Offsets by Age Group, in the following areas:
18 In addition, not all counties maintain consistent naming of programs between the Revenue and Expenditure Reports, Plans and Updates. Hence, although Plans require breakout budgets by age group, tracking the budgeted amounts to actual expenditures was not possible. See the Full Report for the methodology developed, in partnership with our Evaluation Advisory Group, in order to address this issue. 19 Institution for Mental Diseases facilities/Mental Health Rehabilitation Centers. Key Event Tracking data do not distinguish between the two. Therefore, an average between the IMD and MHRC rate for the facilities contracted by each county was used as the basis for calculating the cost applied to the number of days in long‐term care. 20 Participation in the web survey, at the time of this report writing, stands at 41. Only three (3) more counties are needed to reach our goal. 21 We cannot guarantee calculation of FSP cost by age group for any county that does not participate in the web survey, for the reasons outlined in the report Chapter III (limitations of the Revenue and Expenditure Report data, which prompted primary data collection from counties through a web survey in order to determine proportion of expenditures devoted to each age group). 22 Cost Offsets can be developed only for counties that submit data to the State Department of Mental Health’s Full Service Partnership (FSP) Data Collection and Reporting System (DCR). All of the variables used in the FSP Cost Offset analysis are contained in the DCR. EMT does not have access to non‐DCR data from counties.

Draft Report – for Stakeholder Input
Full Service Partnerships: California’s Investment to Support Children and Transition‐Age Youth with Serious Emotional Disturbance and Adults and Older Adults with Severe Mental Illness
Page xvi
Psychiatric o Inpatient Psychiatric Hospitalization (number of days) o Long‐Term Care (number of days) o Skilled Nursing (Psychiatric) (number of days)
Non‐Psychiatric o Skilled Nursing (Non‐Psychiatric) (number of days) o Acute Inpatient Hospitalization (number of days) o Emergency Room Use (number of times)23
Incarceration o Arrests (number of times) o Jail (number of days) o Prison (number of days) o Division of Juvenile Justice (number of days) o Juvenile Hall/Camp (number of days)
The Final Report will also include a detailed description of the services and activities planned under the Full Service Partnership program. Tables will be presented throughout the report to summarize the wealth of strategies and activities planned in each county, along with a statewide summary.
All counties were provided the opportunity to review the FSP Service Description developed and to submit documentary evidence for consideration (see the Full Report, Chapter II, for a discussion of methods). EMT is in the process of review and revision based on the number of documents submitted by counties. The Final Report will include:
• FSP Service Description results in report (descriptive narrative), and
• The use of FSP Service Description in analyses to determine impact of services on cost and offsets.
Finally, a number of ancillary topics bear consideration and will be addressed in the Final Report. These topics include:
• FSP costs by funding source, for FY 08‐09 and FY 09‐10,24
• Discussion of web survey results and lessons learned about FSP costs, and
• Review of start‐up costs.
23 The cost of an emergency room visit in each county is currently being calculated by OSHPD, and will be available in time for inclusion in the Final Report, due September 30, 2012. 24 It is not possible for counties to break out expenditures by funding source by age group.

Draft Report – for Stakeholder Input
Full Service Partnerships: California’s Investment to Support Children and Transition‐Age Youth with Serious Emotional Disturbance and Adults and Older Adults with Severe Mental Illness
Page 1
I. Introduction
Proposition 63 (2004) provides increased funding through the Mental Health Services Act (MHSA) to support mental health services and promote innovative services and best practices for individuals with mental illness and inadequate access to the traditional public mental health system. Prop 63 funds are distributed to county departments of mental health to implement MHSA components. The focus of this report is the Full Service Partnership (FSP), which is designed to serve Californians in all phases of life who experience the most severe mental health challenges because of illness or circumstance. This population has been historically underserved and has substantial opportunity for benefits from improved access and participation in quality mental health treatment and support. FSP programs are a large portion of the Community Services and Supports (CSS) funding allocation from MHSA. There is a requirement that most of the CSS budget be allocated to FSP, and that clients be served with “whatever it takes.” The remaining portions of CSS (can be up to 49 percent of county MHSA budgets) are used to cover gaps in systems of care related to needs for supportive services, such as transportation or vocational training (which are typically unfunded), crisis intervention and treatment. 25
The Statewide Evaluation UCLA’s Center for Healthier Children, Youth and Families and EMT Associates, Inc., have been contracted by the Mental Health Services Oversight and Accountability Commission to conduct a statewide evaluation of the Mental Health Services Act. This evaluation is designed to be consistent with the intent of the Act “to ensure that all funds are expended in the most cost effective manner and services are provided in accordance with recommended best practices subject to local and state oversight to ensure accountability to taxpayers and to the public.”
The UCLA/EMT Evaluation will produce deliverables in several priority areas. The purpose of this report is twofold, to specify the: 26
• Statewide and county‐specific per‐person annual cost 27 average for FSP Adults, Older Adults, Children and Transition‐Age Youth and 2) proportion of funding by revenue source. In plain language, the cost of providing FSP program services per person by age group, and
• Financial impact of outcomes achieved in comparison with expenditures for FSP clients for at least one of the four age groups. In the context of FSP impact, this report documents how FSP program costs are offset by savings28 in actual dollar amounts as a result of reductions in inpatient hospitalization days (psychiatric and physical health) and number of days incarcerated.
Report Overview This report, Full Service Partnerships: California’s Investment to Support Children and Transition‐Age Youth with Serious Emotional Disturbance and Adults and Older Adults with Severe Mental Illness, Draft – for Stakeholder Input, contains five (5) chapters. A brief synopsis of each chapter follows.
25 For a more detailed discussion about CSS component expenditures, see:
http://mhsoac.ca.gov/Announcements/docs/Evaluation_Deliverable1A_Brief1_CSS.pdf 26 This report represents the combination of two Phase III contract deliverables: Phase III. Deliverable 1.A. – FSP Cost Report, which specifies the 1) statewide and county‐specific per‐person annual cost average for FSP Adults, Older Adults, Children and Transition‐Age Youth and 2) proportion of funding by revenue source; and Phase III. Deliverable 1.B. – FSP Cost Offset Report, the Initial written report that specifies the financial impact of outcomes achieved in comparison with expenditures for FSP clients for at least one of the four age groups. 27 Although the technically accurate term is expenditure based on the data sources analyzed, this term is cumbersome, and not user‐friendly to the lay reader. Therefore, the term cost will be used in place of expenditure throughout this Report. 28 The terms cost savings and cost offsets are used interchangeably throughout the Report.
Draft Report – for Stakeholder Input
Full Service Partnerships: California’s Investment to Support Children and Transition‐Age Youth with Serious Emotional Disturbance and Adults and Older Adults with Severe Mental Illness
Page 2
Chapter I, Introduction, provides a brief introduction to the report and a short orientation for the reader to the contents of each chapter.
Chapter II, Involvement of Key Stakeholders, describes the process thus far for obtaining input from expert evaluation advisors and people with lived experience, and recommendations for next steps in terms of a participatory evaluation of cost offsets due to the impact of formal and informal peer networks.
Expenditures on Full Service Partnership Programs are presented in Chapter III. In plain language – this chapter contains the FSP cost per person by age group. There is a brief discussion of the methodology used to produce FSP cost per person, including the elements that went into compiling FSP cost. The calculation for participant service years is also presented. The statewide per‐person annual cost average by age group is shown in a table.
Chapter IV focuses on Cost Offsets for Full Service Partnership Programs. In this chapter, findings from outcome analysis of inpatient psychiatric hospitalization, inpatient hospitalization (acute), skilled nursing (non‐psychiatric) and incarceration are presented that illustrate how the savings due to reduction in number of days help pay for FSP programs.
Chapter V recommends next steps for this report, particularly as pertains to extending cost‐offset analyses to other areas, and describes the process for obtaining key stakeholder feedback in the coming months.
A Description of Full Service Partnership Services is provided in Appendix A. The process of conducting a systematic service assessment using each county’s CSS Plan, Annual Updates and other FSP‐related documents submitted by counties/municipalities for consideration is discussed in Chapter V, Next Steps. The purpose of presenting a description of planned FSP services (as described by counties in their Plans, Annual Updates and FSP‐related documents submitted for review) in this draft report is solely for stakeholder review and input, because summaries of FSP services planned in each county and statewide will be presented in the Final Report, to be released on September 30, 2012.
Draft Report – for Stakeholder Input
Full Service Partnerships: California’s Investment to Support Children and Transition‐Age Youth with Serious Emotional Disturbance and Adults and Older Adults with Severe Mental Illness
Page 3
II. Involvement of Key Stakeholders
The Expanded Statewide Evaluation of the Mental Health Services Act specifies that the evaluation team: Establish and maintain stakeholder engagement in the evaluation that is representative of a wide scope of expertise. Engagement will include:
• A process for input from individuals living with mental illness, family members/personal caregivers and representatives of culturally diverse unserved and underserved groups of all ages, and
• A process for input from researchers, data analysts and programmers who are responsible for local data evaluation efforts.
The focus of this chapter is to describe the process and contribution of engagement of stakeholders through seven key strategies:
1. Presentations to client and family groups/organizations representing unserved/underserved groups 2. Key stakeholder interviews with individuals representing client/family groups and organizations
representing unserved/underserved groups 3. Presentations to associations/service provider organizations 4. Key stakeholder interviews with individuals representing associations/service provider organizations 5. Formation of an Evaluation Advisory Group 6. Key stakeholder interviews with peer advocates and parent partners 7. Product review/feedback (further elaborated on in the final chapter, Next Steps)
1. Presentations to Client & Family Groups/Organizations Representing Unserved/ Underserved Groups
Outreach to client and family groups and organizations representing unserved and underserved groups was conducted early in the evaluation process. 29 An offer was made to stakeholder groups for presentation about the Statewide Evaluation of the Mental Health Services Act in person, through conference calls or through webinars. 30
A total of six (6) presentations were made during the spring/summer of 2011, during which feedback on the FSP Costs & Cost Offsets studies was actively sought. 31
With respect to the FSP Costs & Cost Offsets studies, the following themes emerged:
• Client and family groups want to review the draft report and need adequate time to do so: 32 o Reviewers want to know the disposition of their review comments (e.g., were they used in
producing the Final Report, and if not, why not?).
• An emphasis on recovery and resilience is sorely needed: o The majority of the data collected through the statewide Department of Mental Health system
(the Data Collection and Reporting System, known as the DCR) are consequence‐ focused. In lay
29 Late March‐July 2011. 30 The study as a whole was presented and feedback sought with the following considerations: a) reduce stakeholder burden (to avoid returning for every deliverable and thereby requiring multiple presentations/feedback sessions), b) budgetary constraints. 31 See Appendix C for a list of organizations. 32 Commitment was made by Dr. Harris to each group of stakeholders that they would be sent a copy of the draft report for review and input.
Draft Report – for Stakeholder Input
Full Service Partnerships: California’s Investment to Support Children and Transition‐Age Youth with Serious Emotional Disturbance and Adults and Older Adults with Severe Mental Illness
Page 4
terms, most of what is collected about FSP clients is negative (e.g., incarceration, hospitalization).
o Clients and families would like to see positive outcomes documented and somehow tied to savings to the system.
A key stakeholder group representing underserved and unserved individuals was very concerned that:
• Communities of color are not served in proportion to their actual numbers by the Full Service Partnership program.
The degree to which communities of color are being served by Full Service Partnerships merits investigation, and will be addressed in the Final Report (due September 30, 2012).
2. Key Stakeholder Interviews with Individuals Representing Client & Family Groups/ Organizations Representing Unserved/Underserved Groups
Stakeholder groups were contacted and offered participation in a presentation about the Statewide Evaluation of the MHSA, with an opportunity for comment and recommendation. The evaluation team met with four (4) organizations that requested in‐person meetings to gain a better understanding of the study. Two agencies for Older Adults opted not to participate in presentations but made the following input:
• The needs of Older Adults are not addressed by every county: o A cost‐offset study, therefore, may incorrectly assume that Older Adults do not have positive
outcomes, when the real problem is that there are not programs in place to a) recruit them and b) to specifically address their needs.33
o Among counties that do address the needs of Older Adults through Full Service Partnerships, some are implementing evidence‐based practices (such as IMPACT). However, IMPACT is also being implemented by some counties under the Prevention and Early Intervention component. 34 This fragmentation of funding even under MHSA may make it difficult to determine the true cost offsets for Older Adults.
The evaluation team took these concerns into consideration when conducting analyses of FSP costs and cost offsets by age group, determination of numbers served was critical. In addition, see the discussion in this chapter under the Evaluation Advisory Group for the process developed for documenting and summarizing FSP services and strategies.
The potential positive impact of evidence‐based practices on both costs and cost offsets should not be under‐estimated. The following assumptions may be tested (see Chapter V, Next Steps, for how we propose to test whether these assumptions are valid):
• Implementing an evidence‐based best practice may be more expensive because of additional staff training and ongoing supervision requirements (costs), and
• Implementing a proven practice that has previously shown demonstrable outcomes is likely to produce the same positive outcomes with FSP participants (cost offsets).
33 A thorough, systematic review of CSS Plans was conducted expressly for the purpose of identifying services for Older Adults, using a structured review tool, by one interviewee. She has given her permission to make the results available, on request. 34 Specifically, under Early Intervention.
Draft Report – for Stakeholder Input
Full Service Partnerships: California’s Investment to Support Children and Transition‐Age Youth with Serious Emotional Disturbance and Adults and Older Adults with Severe Mental Illness
Page 5
3. Presentations to Associations/Service Provider Agencies
Outreach to service provider agencies and community mental health associations/agencies was also conducted early in the Phase III evaluation.35 A total of six (6) presentations were made during the spring/summer of 2011, during which feedback on the FSP Costs & Cost Offsets studies was actively sought.36 This was the area that generated the most interest and enthusiasm among community mental health associations. 37
With respect to the FSP Costs & Cost Offsets studies, the following themes emerged:
• service provider agencies/community mental health associations are interested in reviewing the draft report. 38
• County contractors (e.g., community mental health providers) may provide MHSA services in a more cost‐effective manner than the county. This hypothesis should be tested.
The latter concern has clear implications for conduct of the cost and cost offset analyses. Accordingly, feasibility testing is discussed in the following section.
4. Interviews with Representatives from Associations/Service Provider Agencies
When the initial offer was extended to stakeholder groups for a presentation about the Statewide Evaluation of the MHSA, seven (7) organizations instead opted to meet in person or via conference call to gain a better understanding of the study. 39
The California Mental Health Planning Council, which recommended the original MHSA performance indicators, was one. The focus of their meeting was on Phase II Deliverable 2 (Statewide and County Indicator Report).
The remaining organizational representatives were interested in the FSP Costs & Cost Offsets Report. The themes that emerged during the interviews echoed those discovered during presentations made to agencies/associations.
In the summer of 2011, the only available data source was the Revenue and Expenditure Reports. The worksheet provided by the Department of Mental Health for documenting FSP expenditures by program is provided in Appendix E (Revenue & Expenditure Reports). The worksheet breaks out expenditures under FSP into county and contractor. Based on this initial information, we determined that the question (see the following page for a synopsis) posed by associations and service provider agencies merited feasibility testing:
• Do the available data support our ability to answer the question, “Do county contractors (e.g., community mental health providers) provide MHSA services in a more cost‐effective manner than the county?”
We laid out several questions to be answered during our exploratory process:
1. Are contractors identified by a unique identification number in the Revenue and Expenditure Report?
35 Late March‐ July 2011. 36 See Appendix C for a list of organizations. 37 MHSA coordinators were interested in the Statewide Evaluation as a whole. The main theme was informing them well in advance of any expectations involving data collection. 38 Commitment was made by Dr. Harris to each group of stakeholders that they would be sent a copy of the draft report for review and input. 39 The plan was that interviewees would report items of interest back to their constituency, given the busy agendas that most association meetings entailed. However, a subsequent presentation was scheduled for the California Mental Health Planning Council, following the initial interview.

Draft Report – for Stakeholder Input
Full Service Partnerships: California’s Investment to Support Children and Transition‐Age Youth with Serious Emotional Disturbance and Adults and Older Adults with Severe Mental Illness
Page 6
a. If yes, can this be tracked to individual client (services received) in the DCR? 2. Are contractors identified by name in the Revenue and Expenditure Report?
a. If yes, can this be tracked to individual client (services received) in the DCR?
The answers to #1 and #2 were no. In addition, we learned that although individual client service records in the DCR may specify the FSP “program” each person participated in, this “program” may have been implemented by any one of a number of contractors as well as the county itself. The DCR was not designed to capture detailed service‐exposure level data.
The next step was to examine County Cost Reports, with the goal of answering the following questions:
1. Can FSP expenditures be disentangled out of the larger MHSA costs contained in the Cost Report? a. If yes, can individual contractor FSP billing be traced through the Cost Report (thereby bypassing
the Revenue and Expenditure Reports altogether)?
After an exhaustive review of the Cost Report worksheets and consultation with a county fiscal expert (who completes the Cost Report worksheets annually) the answers were determined to be no.
In summary, we learned the following:
• Individual FSP client data in the DCR contain the general “program” an individual person participated in, but not the individual contractor that delivered the services nor the number of contacts, amount of time of each contact, etc.
• Individual contractors are not identified in any systematic way in the Revenue and Expenditure Report (RER). There is no way to link RER expenditure data by contractor to either the DCR or the Cost Report.
Counties would need to turn over individual‐level billing data to UCLA/EMT in order to answer the question as to whether contractors deliver FSP services in a more efficient manner compared with the county. We determined that requesting this level of participation from counties is not feasible for the following reasons:
• Burden on county mental health departments
• Confidentiality concerns
• Budget/time constraints
In sum, MHSOAC may determine that the question, “Do county contractors (e.g., community mental health providers) provide MHSA services in a more cost‐effective manner than the county?” posed by community mental health associations/service provider agencies merits investigation, and will develop a Request for Proposal in order to thoroughly study the issue, keeping in mind the data requirements outlined above.
5. Evaluation Advisory Group
The Evaluation Advisory Group (see Appendix C) explicitly advises on FSP costs and cost offsets. It is composed of nationally recognized evaluators and evaluation and fiscal staff from county mental health departments.
The group initially convened for an all‐day meeting on November 3, 2011, in Anaheim. A follow‐up meeting was held on February 6, 2012, in Encino. Each participant received a binder with PowerPoint slides that organized the meeting presentations and discussion, and backup materials for reference. The meeting produced two kinds of decisions:

Draft Report – for Stakeholder Input
Full Service Partnerships: California’s Investment to Support Children and Transition‐Age Youth with Serious Emotional Disturbance and Adults and Older Adults with Severe Mental Illness
Page 7
1. Recommended actions. After presentation of a required step in the cost estimation process and a recommended action or alternatives, the group offered comment and deliberated. If consensus was reached, a recommendation for a preferred action was made.
When consensus was not reached because of a need for further assessment, actions were recommended contingent on this assessment. Criteria for a final decision were typically identified.
2. Recommendations for further information from counties. In some instances it was necessary to get clarification on county data, fill gaps where information was missing in a county or gain clarification on critical points of information. The Advisory Group determined it was appropriate to contact counties through e‐mail to ask for clarifications or information specific to their county, as long as inquiries were brief and focused. When appropriate, the Advisory Group recommended queries to be made to selected counties. These Internet queries formed the basis of a web survey that was developed for county participation.
Evaluation Advisory Group input in the area of cost and cost‐offset methodology is best understood in the context of chapters devoted to these topics. Refer directly to Chapters III and IV for further discussion.
Full Service Partnership Services Description
For the purpose of this report and recognizing the need to be responsive to key stakeholder feedback, the UCLA/EMT team faced an immediate need to systematically categorize services across counties/municipalities in order to subsequently link specific services to specific age groups. This is important for the following reasons:
• FSP costs vary by county. One reason may be the depth and breadth of services offered under the Full Service Partnership Program.
• FSP costs vary by age group. See above.
• FSP cost offsets vary by county. One reason may be the depth and breadth of services offered under the Full Service Partnership Program.
• FSP cost offsets vary by age group. See above.
A report about FSP costs and cost offsets in the absence of information about FSP services and activities by age group is to present the proverbial black box. In addition, review of the Phase II Deliverable 1 MHSA Cost Report by county department of mental health stakeholders elicited feedback recommending description of Full Service Partnership programs, in order to provide the appropriate context within which to interpret findings.
Therefore, the Evaluation Advisory Group recommended documentation of FSP services by county and age group as an important analysis.
With the primary goal in mind of developing a standardized system of describing planned FSP services, the Community Services and Supports Plan (CSS Plan) and the attendant updates (Annual Updates through FY 10‐11) served as the basis for the initial FSP review and summary conducted by EMT Associates. The FSP Service Assessment for each county/municipality was conducted using a systematic review and summary tool developed by a consultant formerly employed with a large county department of mental health and directly involved in the evaluation of that county’s MHSA program. The focus of the tool was straightforward – with instructions to trained reviewers to indicate whether planned services were present or absent in the CSS Plan and/or Annual Updates. The rating of “present” or “absent” avoided any judgment about quality, adequacy, etc., as such judgments are inappropriate absent on‐site observation.

Draft Report – for Stakeholder Input
Full Service Partnerships: California’s Investment to Support Children and Transition‐Age Youth with Serious Emotional Disturbance and Adults and Older Adults with Severe Mental Illness
Page 8
The strategy of document review and summary was selected following discussion with the FSP Evaluation Advisory Group,40 due to budget limitations and concerns about county/municipal burden inherent in a site visit/on‐site service observation. The draft FSP Service Summary tool was reviewed at a FSP Evaluation Advisory Group meeting, and refined following that meeting.
Following the FSP Service Summary, counties/municipalities had the opportunity to review their individualized FSP Services Assessment, and to provide supplementary documentation for consideration in the event that critical services were not documented in the CSS Plan or Annual Updates. For example, one county submitted its FSP Implementation Manual for inclusion in its FSP Service Summary. When supplementary documentation was provided by a county or municipality, its specific, individualized FSP Service Summary was updated to reflect new information. The FSP Service Summary includes documentation of the source material, for county/municipal reference.
We have reviewed every county’s Full Service Partnership Plan and Annual Updates in order to generate a county‐specific FSP Service Summary. 41 The FSP Service Summary indicates whether a planned service/activity was present or absent for each age group.
The FSP Service Summary tool was first developed by an expert consultant and pilot tested on one county. The tool was then reviewed by the Evaluation Advisory Group. 42 Revisions were made to the tool based on feedback from the advisory group.
FSP Service Summaries were sent back to each county, along with the source location (basis for the present/absent rating).43 Counties were provided the opportunity for review/feedback, which included submission of documentary evidence to support FSP activities/practices in place. 44
We are in the process of incorporating the results of county feedback in order to update the FSP Assessments. Due to the volume of documentary material received from counties (e.g., FSP Procedures Manuals), updated FSP Assessment results will be incorporated into the Final Report, due September 30, 2012.
6. Interviews with Peer Advocates & Parent Partners
Following the series of presentations and interviews, the MHSA Statewide Evaluation team launched a participatory evaluation (Phase III Deliverable 2). In order to avoid burden on clients and families (and not work at cross‐purposes with the participatory evaluation), the Phase III Deliverable 1 process focused on methodology and input from the Evaluation Advisory Group during the period of intensive data collection for the participatory evaluation.
40 See Appendix C for a list of Evaluation Advisory Group members. 41 The decision was made to use available data (rather than conduct site visits to each county) in order to avoid burden to the counties and due to budgetary considerations. 42 Our consultant had worked as a Full Service Partnership Coordinator for a large county. The county reviewed was the one she had worked for, with its permission. Counties were provided the opportunity to provide additional documentary evidence because services may have changed following plan submission or a service may have inadvertently been left out of the plan – in short, the Evaluation Advisory Group noted that the Plans and Updates were not designed to capture everything offered through the Full Service Partnership, and therefore the opportunity to augment with additional data must be offered to counties. 43 For example, the page number in the original FSP Plan. We provided the source location to make it easier for counties to follow the logic for our ratings of whether a given service (e.g., wraparound) was present or absent. 44 One county requested a site visit in order to update its FSP Assessment. The FSP Assessment matrix accompanied the site visitor and was updated following the visit based on qualitative survey results (interview data with FSP staff).
Draft Report – for Stakeholder Input
Full Service Partnerships: California’s Investment to Support Children and Transition‐Age Youth with Serious Emotional Disturbance and Adults and Older Adults with Severe Mental Illness
Page 9
By June 2012, the participatory evaluation survey data collection period was winding down. A brief presentation was made to the Participatory Evaluation Consumer Advisory Board via conference call on June 5, 2012. The request was simple:
How can we learn more about the positive ways that FSP clients and families are contributing to their care, as they progress in their recovery (i.e., offsetting costs)?
We chose an exploratory approach for a number of reasons:
1. The Costs & Cost Offsets Deliverable has ample opportunities for review and feedback from all stakeholder groups, throughout all phases of development.
2. Clients and families clearly expressed the need (this speaks to the type of data currently collected under the DCR) to focus on positive outcomes.45
3. Clients and families are in the best position to inform us about what to look for in terms of potential offset areas.
4. Budget limitations and time constraints due to the nature of the deliverable and contract prevented us from launching a second participatory evaluation in which primary (new) data collection from clients and families could be the focus.
Therefore, the parameters of an exploratory approach required that no more than nine (9) peer advocates/parent partners be interviewed, and that one general question be posed (What are some of the ways you have seen people contribute to their care as they progress through recovery?), to be answered in no more than 15 minutes. A $25 gift certificate would be provided in appreciation for participation in the telephone interview. Peer advocates and parent partners were deemed excellent sources of information, given both their lived experience and the numbers of individuals and families mentored through the Full Service Partnership program.
Many wonderful examples of success emerged during the interviews, including a budding entrepreneur who had formerly been homeless. However, an unanticipated theme surfaced across the interviews. The potential for cost offsets to the system is great, but it is not being documented due to deficits in the DCR (see the graphic below):
• Peer networks (informal and formal): A recurring theme was the power of peers. Connection to others with lived experience was cited as the reason individuals:
o Became engaged in mental health services (where previous efforts had failed) o Were no longer homeless (able to maintain independent living) o Could “step down” in service intensity (presumably resulting in savings of county staff time, or
opening a slot for a new client) o Stayed out of the hospital (thanks to informal intervention by peers) o Transported their SED children to enrichment activities (thanks to peer carpooling)
These were but a few examples cited by the peers (employed by county mental health departments and county contractors).
45 Previous research by an Evaluation Advisory Group member on a subset of counties (representing the majority of the state’s population) using DCR data revealed that there is little change in employment and education outcomes, at least in the manner in which they are currently collected under the DCR paradigm. Therefore, it did not seem a worthwhile use of our resources to reinvent this particular wheel. There is no reason to expect that we would have found different results.

Draft Report – for Stakeholder Input
Full Service Partnerships: California’s Investment to Support Children and Transition‐Age Youth with Serious Emotional Disturbance and Adults and Older Adults with Severe Mental Illness
Page 10
The Key Event Tracking Form within the DCR requests that FSP clients be queried about time spent in volunteer activities. It fails to ask what volunteer activity they are engaged in. Therefore, time spent by FSP clients acting as informal peers/mentors for others is not documented.
Peer advocates indicated that many FSP clients do not engage in paid employment during their first year of recovery. Nonetheless, the time spent volunteering as a peer advocate provides a critical service on two fronts:
• An informal peer network is established within the county, providing a needed support system.
• Costs to the formal mental health system presumably are offset by the informal (and formal) peer support systems.
Time spent working in a formal peer support system is likewise not documented. The Key Event Tracking Form within the DCR requests that FSP clients be queried about time spent employed. It fails to ask about the nature of the employment the FSP clients are engaged in.
We recommend that the Mental Health Services Oversight and Accountability Commission consider funding a participatory evaluation to formally study the positive impact of peer networks. Such a study would provide a necessary balance to the preponderance of consequence‐focused data currently collected through the state’s DCR system.

Draft Report – for Stakeholder Input
Full Service Partnerships: California’s Investment to Support Children and Transition‐Age Youth with Serious Emotional Disturbance and Adults and Older Adults with Severe Mental Illness
Page 11
Exhibit II.1 Full Service Partnership Program – Hypothesized Relationship between Peer Networks and Cost Offsets
Peers make positive connections with each other.
Positive modeling via the peer advocates and parent partners.
Clubhouse or Wellness Center
Informal & Formal Peer Support Networks
Reduced reliance on staff
Greater independence
Reduced program costs

Draft Report – for Stakeholder Input
Full Service Partnerships: California’s Investment to Support Children and Transition‐Age Youth with Serious Emotional Disturbance and Adults and Older Adults with Severe Mental Illness
Page 12
7. Involvement of Key Stakeholders: Summary
In all, 23 presentations, interviews and conference calls were held with key stakeholders representing clients and families, service providers and community mental health associations from the end of March through July 2011.
An Evaluation Advisory Group was established, representing nationally recognized experts in cost evaluation and county department of mental health evaluators and fiscal staff. The group held two formal meetings and continues to deliberate via e‐mail.
Peer advocates and parent partners were interviewed in order to gain the perspective of individuals with lived experience on potential offsets that FSP participants contribute as they progress in recovery. Their input revealed a remarkable and unmeasured resource represented by peer networks. A recommendation has been advanced to formally study the impact of peer networks on the mental health system.
All stakeholders will be provided the opportunity to review and comment on this report. The process for doing so is described in Chapter V, Next Steps.

Draft Report – for Stakeholder Input
Full Service Partnerships: California’s Investment to Support Children and Transition‐Age Youth with Serious Emotional Disturbance and Adults and Older Adults with Severe Mental Illness
Page 13
III. Expenditures on Full Service Partnership Programs
Full Service Partnership expenditures 46 are the focus of this chapter. 47 Translated into plain language – what was spent on Full Service Partnership programs?
The deliverable is defined simply as follows:
Initial written report that specifies:
1) The statewide and county‐specific per‐person annual cost average and range for FSP Adults, Older Adults, Children and Transition‐Age Youth, and
2) The proportion of revenue by funding source.
The chapter opens with a description of our methodology – how we went about calculating the cost of Full Service Partnership programs. The chapter closes with statewide Full Service Partnership costs by age group.
a. Methodology
Expenditures on Full Service Partnerships (FSP) were analyzed and reported (through Fiscal Year 08‐09) as part of the Phase II Statewide Evaluation of the Mental Health Services Act, Deliverable 1. 48 The primary data source for determining FSP cost was the Revenue and Expenditure Reports. 49 Revenue and Expenditure Reports are completed by each county mental health department, and they document all monies spent and were available to be spent on mental health services through the Mental Health Services Act.
In the process of completing Phase II Deliverable 1, the UCLA/EMT Team summarized all public mental health expenditures on Full Service Partnerships documented in the Revenue and Expenditure Reports (RER). 50 Therefore, the RERs were deemed a logical data source to start with.
The initial question to be answered, in order for the analysis to proceed, relates directly back to the deliverable language (above):
Can FSP costs by age group be calculated using the RERs?
Without the ability to determine age‐group‐specific expenditures, the county‐specific and statewide cost average and range for FSP Adults, Older Adults, Children and Transition‐Age Youth cannot be determined.
46 Although the technically accurate term is expenditure based on the data sources analyzed, this term is cumbersome, and not user‐friendly to the lay reader. Therefore, the term cost will be used in place of expenditure throughout this Report. 47 Phase III. Deliverable 1.A. Initial written report that specifies 1) the statewide and county‐specific per‐person annual cost average and range for FSP Adults, Older adults, Children and Transition‐Age Youth and 2) the proportion of revenue by funding source. 48 http://mhsoac.ca.gov/Announcements/docs/Evaluation_Deliverable1A_Brief2_FSP.pdf California’s Investment in the Public Mental Health System: Proposition 63; Brief 2 of 7: Providing Community Services and Supports through Full Service Partnerships. 49 FY 2006‐07 was the earliest fiscal year for which Revenue and Expenditure Reports were submitted by counties. No counties submitted Revenue and Expenditure Reports (according to the Department of Mental Health) prior to FY 06‐07. 50 The expenditures for components authorized under the Mental Health Services Act and reported in the Phase II Deliverable 1 brief include: Mental Health Services Act, State General Fund, Other State Funds, Medi‐Cal FFP, Medicare, Other Federal Funds, Realignment, County Funds, Other Funds. The Final Report (due September 30, 2012) will include a breakout of total FSP expenditures for FY 08‐09 and 09‐10 by funding source. Breakout by age group is not possible due to the limitations of the RER, discussed in this report. It is not included in this report due to challenges inherent in merging in the full RER data set (see Appendix E).
Draft Report – for Stakeholder Input
Full Service Partnerships: California’s Investment to Support Children and Transition‐Age Youth with Serious Emotional Disturbance and Adults and Older Adults with Severe Mental Illness
Page 14
Therefore, it was imperative for the team to quickly identify a reliable and valid means of determining FSP costs by age group. 51
Recall the discussion of the Revenue and Expenditure Report limitations in Chapter II. The worksheet provided by the Department of Mental Health (FY 09‐10) for documenting FSP expenditures by program, the summary FSP worksheet, and the revised version issued to counties for both FY 08‐09 and FY 09‐10 are provided in Appendix E. 52
The initial questions posed about the FSP program worksheets (summarized in Chapter II) laid the groundwork for similar questions about the FSP programs:
1. Are FSP programs identified by a unique identification number in the Revenue and Expenditure Report? a. If yes, can this be tracked to individual client (services received) in the DCR?
2. Are FSP programs identified by name in the Revenue and Expenditure Report? a. If yes, can this be tracked to individual client (services received) in the DCR? b. If yes, can this be tracked to the CSS Plan and Annual Updates?
The answer to #1 was determined to be no. This posed obvious problems – the most troubling being:
• How can we reliably link a particular FSP worksheet with expenditures to a particular age group in the DCR?
An alternative was considered – perhaps FSP programs as identified in the RER worksheets could be tracked to the CSS Plan and Annual Updates. The team therefore embarked upon an exhaustive review process of attempting to match up every RER worksheet back to a named FSP program in the original CSS plan, and then to subsequent fiscal year Annual Updates.
The results were problematic for a number of reasons:
• Names of programs change from year to year in some counties but do not always change on the RER (or vice versa);
• Programs may be combined in a given fiscal year when they were broken out by age the previous year. For example, all small counties combined FSP breakout programs by age group into one omnibus FSP program in FY 09‐10;
• Programs disappear out of the RER but are not documented as to why they disappear in the Annual Update;
• New programs appear in the RER, but they are not documented in the original CSS Plan or the Annual Update;
• Programs are identified as FSP in the original CSS Plan/Annual Update, but no FSP expenditures appear in the RER;
51 Revenue and Expenditure Reports reviewed were those submitted by counties and municipalities to DMH as of October 1, 2011. Dr. Harris traveled to Sacramento and personally picked up an encrypted hard drive containing DCR data, Annual Updates, and FY 08‐09 and FY 09‐10 RERs (EMT already had FY 08‐09 RERs from the Phase II Deliverable 1 analysis). 52 Revised instructions were issued to counties on December 27, 2011, with a due date of January 31, 2012, for counties that had not yet submitted FY 08‐09 and FY 09‐10 RERs. FY 09‐10 is provided in the report, but the revised forms are identical to FY 08‐09. http://www.dmh.ca.gov/dmhdocs/docs/notices11/11‐16.pdf Although the revised instructions did not impact EMT’s time line (FY 09‐10 RERs provided by DMH were provided prior to the revised instructions issuance), the Evaluation Advisory Group will need to carefully consider whether this RER data can be used, given how different the instructions are from previous years.
Draft Report – for Stakeholder Input
Full Service Partnerships: California’s Investment to Support Children and Transition‐Age Youth with Serious Emotional Disturbance and Adults and Older Adults with Severe Mental Illness
Page 15
• Not all age groups that had been planned to be served by a program may, in actuality, be served (when DCR data is compared with planned budgets); and
• Target age groups may change from year to year.
The answer to the question, “Are FSP programs identified by name in the Revenue and Expenditure Report, and can they be tracked to individual FSPs in the DCR, and to the CSS Plan and Annual Updates?” is:
“It depends entirely on the county, the fiscal year and even the program in question.”
In addition, the answer to the question changes even within a given county, and within a single fiscal year.
However, barriers to extracting FSP cost by age group should not be seen as a poor reflection of county documentation. Indeed, the Revenue and Expenditure Reports were not designed for this purpose. Counties reported during the web survey process (additional data collection used for this deliverable, described later in this chapter) that they complied as best they could with the RER instructions provided, but that the RERs are not a reflection of county mental health accounting practices. Indeed, the prevailing sentiment among county fiscal staff may be summarized in one quote received:
“We simply don’t track our mental health spending this way.”
After spending 60 days of investigation, thoroughly exhausting these possibilities as potential data sources, the Evaluation Advisory Group was convened in order to seek expert guidance and input into resolution of the critical challenge of breaking out FSP costs into age groups in a reliable and valid manner.
The objectives of the first Evaluation Advisory Group meeting (held November 3, 2011 – see Chapter II for an introduction to the EAG) were:
a) To define the product necessary to meet the requirements of the deliverable; b) To identify feasible ways in which the deliverable may be improved (e.g., be made more informative and
useful in understanding what drives cost per client and cost differences across counties); c) To identify issues and solutions to the issues that need to be resolved to:
1) identify the data elements necessary to the desired products; 2) identify the data sources most suitable to producing these data elements; 3) identify issues and solutions concerning the exact configuration of data elements (e.g., the exact
definition of what FSP costs should include) appropriate to developing the products; 4) conduct the analysis; and 5) display findings; and
d) To suggest an organized set of steps to systematically resolve issues identified under c).
The results of the RER analysis were presented to the Evaluation Advisory Group, along with other potential data sources. Challenges associated with each potential data source are summarized in Exhibit III.1.
The EAG determined, during the deliberation process, that the critical question of FSP expenditures by age group would be difficult for EMT to answer using the available data sources. Although the total cost of Full Service Partnerships each fiscal year can be obtained from the RER (and indeed, was obtained and reported in Phase II Deliverable 1 for FY 08‐09), the RER falls short on its own in terms of providing a reliable and valid mechanism for breaking out the total cost by age group.

Draft Report – for Stakeholder Input
Full Service Partnerships: California’s Investment to Support Children and Transition‐Age Youth with Serious Emotional Disturbance and Adults and Older Adults with Severe Mental Illness
Page 16
Exhibit III.1 Available FSP Cost Data Sources & Limitations
COST ELEMENT
DATA SOURCE USE CHALLENGES PROPOSED SOLUTION(S)
Unit of Analysis
Revenue and Expenditure Report, FSP Program Worksheets
FSP program‐level expenditures
1) Expenditures at the program level, rather than individual per‐person FSP client costs (i.e., that would be tracked in Medi‐Cal billing data). Because of budgetary considerations, establishing a study in which we obtain individual‐level Medi‐Cal billing data across all counties and set up a comparison group in each county is not an option.
a. Our budget for this deliverable is about 20% of the UCSD budget (in which Dr. Gilmer’s group set up such a study, with a sampling of counties – EMT is charged with studying all counties).
1) Estimate per‐person cost
Average Annual County Cost
Revenue and Expenditure Report, FSP Programs Grand Total
Proxy for cost
1) Expenditures are not final, reconciled payments to county and therefore may be higher than true cost; inclusion of “other sources” in total may also inflate true cost53
2) Cannot link FSP Program expenditures clearly to individual FSP participants
3) Role of Outreach & Engagement and General System Development expenditures for programs with blended funding
1) Adjust FSP total expenditure proportionate to Cost Report Total54 (difference between MHSA line item on form 1995 and total MHSA expenditures on Revenue and Expenditure Report); Cost Report is not an option because we have no way to link Vendor ID to FSP program, and no way to disentangle FSP costs from the total MHSA costs reported on form 1995.
2) Use DCR data for number of participants.
3) Query on web survey about the proportion of O&E and GSD spent on FSP clients.
Age Groups CSS Plan & Annual Updates
FSP age group(s) served by program
1) Non‐standardized data source (narrative)2) Programs that serve multiple age groups
1) Survey counties about proportion of FSP costs per age group.
Estimation of Person Year for Per Capita Cost
CSS Plan & Annual Updates
Annual caseload (FY) – program capacity
Aggregate rather than individual‐level data 1) Use DCR data. 2) In addition, new challenges
are introduced, such as how to count persons who carry over from year to year, and persons who enter the program late in the year (compared with those who enter early).
3) Tracking service exposure is problematic, given the available data sources.
53 Reporting on the proportion of funding by other sources is a base requirement for this deliverable. 54 The latest Cost Report received is for FY 08‐09. There is no FY 09‐10 Cost Report against which to reconcile MHSA expenditures.

Draft Report – for Stakeholder Input
Full Service Partnerships: California’s Investment to Support Children and Transition‐Age Youth with Serious Emotional Disturbance and Adults and Older Adults with Severe Mental Illness
Page 17
Therefore, the absolute necessity of breaking out FSP expenditures by age group formed the basis for launching a county web survey. The Evaluation Advisory Group determined that only county department of mental health staff (preferably, fiscal staff) have the information needed to make determinations about how the total FSP cost for their county should be broken out by age group. Although a county survey represented a data collection burden, county‐informed breakouts were deemed to be far preferable to any educated guess on the part of the UCLA/EMT team.
Estimating cost for comparable units of service provides the foundation for assessing the return on the FSP service investment. The assessment of cost offset is accomplished through identifying how service costs result in substantial savings to the system (e.g., reduced hospitalization costs, reduced incarceration costs). The web survey was necessary to augment data already gathered from RERs; to ensure that all counties are adequately represented in the analysis; and to ensure the most accurate and feasible estimate of appropriate service costs.
1. Program Costs
The total amount expended on Full Service Partnerships in FY 08‐09 and FY 09‐10 (as reported by each county in its RER) served as the basis for the total Program Cost.55 Total Program Cost was only a starting point, however, given the need to break out cost by age group.
2. Age Groups
Per the MHSA Community Services and Supports Three‐Year Program and Expenditure Plan Requirements, “Each county must plan for each age group in their populations to be served.” (p. 13) 56 Age groups are defined as follows:
• Children, Youth and Families (CYF): Birth to 18 years, and special‐education pupils from birth to age 21 (p. 21)
• Transition‐Age Youth (TAY): 16 to 25 years (p. 21)
• Adults: No specific age range is given
• Older Adults: 60 years and older (p. 21)
The county web survey contained questions about the proportion of spending on Full Service Partnership services for each age group, for each fiscal year.
3. Housing
There was consensus among Evaluation Advisory Group members that housing is a critical aspect of FSP services, and an expensive service. 57 housing was therefore included as an FSP cost even though it is reported somewhat
55 Only one county, Del Norte, did not submit an FY 09‐10 RER. Therefore, expenditures as reported in its web survey served as the sole source for FSP FY 09‐10 expenditures. 56 http://www.dmh.ca.gov/dmhdocs/docs/letters05/05‐05CSS.pdf Children and adolescents identified as seriously emotionally disturbed (SED) are eligible for FSPs if they meet the criteria set forth in Welfare and Institutions Code section 5600.3, subdivision (a). Adults and older adults identified to have a serious mental disorder are eligible for FSPs if they meet the criteria set forth in subdivision (b) of section 5600.3. http://www.leginfo.ca.gov/cgi‐bin/displaycode?section=wic&group=05001‐06000&file=5600‐5623.5 California’s Welfare and Institutions Code is posted in its entirety on the website cited above, absent page numbers. Click on the link and the section cited will appear on screen, verbatim, as quoted.

Draft Report – for Stakeholder Input
Full Service Partnerships: California’s Investment to Support Children and Transition‐Age Youth with Serious Emotional Disturbance and Adults and Older Adults with Severe Mental Illness
Page 18
differently in some counties. There is a specific line item for housing (General System Development Housing line item), but it does not contain complete FSP housing expenditures in some counties. For counties that show no expenditures under the General System Development (GSD) Housing line item:
• One‐time‐only costs may be under the CSS “Administration” line item.
• Ongoing costs may be under the FSP “Operating” line item.
Housing is defined in the table below.
Exhibit III.2 Housing Definition (included in the County Web Survey)
Housing Support DMH Letter 06‐07
The cost of providing housing supports, including housing subsidies for permanent, transitional and temporary housing; master leases; motel and other housing vouchers; rental security deposits; first‐ and last‐month rental payments; and other fiscal housing supports. This does not include the capital costs used to purchase, build or rehab housing or the salaries and benefits of staff used to provide client housing supports.
Operating Support DMH Letter 06‐07
The operating costs of providing housing supports to clients, including building repair and maintenance, utilities, housing agency management fees, insurance, property taxes and assessments, credit reporting fees, and other operating costs incurred in providing client housing supports. This does not include the capital costs used to purchase, build or rehab housing or the salaries and benefits of staff used to provide client housing supports.
Housing Placement DMH Letter 05‐05 Age‐specific strategies:
CYF – Permanent supportive housing for homeless families and families reunifying after a child or parent has been in an institution (e.g., jail, juvenile hall or hospital) or other out‐of‐home placement
TAY, Adults, Older Adults: Supportive housing – permanent affordable housing with combined supports for independent living, including projects that meet the following criteria: (1) housing is permanent, meaning that each tenant may stay as long as he or she pays his or her share of rent and complies with the terms of a lease or rental agreement, (2) housing is affordable, meaning that each tenant pays no more than 30% to 50% of household income, and (3) tenants have access to an array of support services that are intended to support housing stability, recovery and resiliency, but participation in support services is not a requirement for tenancy. Supportive housing may be site‐based (all or a portion of the units in a building are designated for people with special needs, and supportive services are available on site) or scattered site (tenants have or rent houses at various locations in the community).
Housing options are available for Transition‐age Youth, Adults, and Older Adults who are single and those who choose to share housing, as well as families with children.
Breakout Reporting of Housing Costs Since housing is a core service for stabilizing clients, and is a major cost item, the EAG recommended that housing costs be broken out, presented and discussed as a key expenditure.
Counties were explicitly queried about the line item in which housing was reported on the RER. If it was reported on an FSP line item, the housing amount reported for the relevant age group (i.e., the age group for which housing
57 This does not include the MHSA Housing Program (Governor’s Housing Initiative). There was consensus among EAG members that this cost would be excluded from the analysis.

Draft Report – for Stakeholder Input
Full Service Partnerships: California’s Investment to Support Children and Transition‐Age Youth with Serious Emotional Disturbance and Adults and Older Adults with Severe Mental Illness
Page 19
is documented on an FSP line item) was subtracted from the FSP program cost total for that age group. 58 FSP cost by age‐group calculations using RER and web survey data were included as a worksheet in each county’s FSP Costs & Cost Offsets Excel file, provided to counties for initial review in May 2012. See Chapter V, Next Steps, for a discussion of the review and feedback process.
4. Outreach
The EAG agreed that outreach in order to recruit individuals and families into FSP programs is another critical aspect that should be represented in cost, though it may be reported outside the FSP RER worksheet.
There is a specific line item for Outreach in the CSS Program Worksheet, and counties may show outreach expenditures there (see Appendix E). For counties that show no expenditures under the outreach line item on their FSP program expenditure worksheets, these expenditures may be reported elsewhere. The web survey therefore contained specific questions about the cost of outreach for each fiscal year (specific to bringing potential FSP clients into service), and the proportion spent on each age group.
Counties that participated in the web survey were provided the opportunity to review the initial draft of FSP Costs & Cost Offsets in a county‐specific Excel file, distributed in May 2012.
The majority of counties participated in the web survey (N = 37; 63.8%).59 The populations of counties represented in this report for FY 09‐10 comprise the majority of the State of California (67.3%).60 The majority is also represented for FY 08‐09 (66.9%). Appendix D contains a list of county participants.
Although the original intent to include outreach costs represented the desire to document all that Full Service Partnership participants may receive, when counties reviewed the figures, consensus was that inclusion of outreach expenditures overinflated the cost of Full Service Partnership programs. In addition, counties indicated that drilling down on the exact outlay of outreach expenditures for FSP clients was difficult, when outreach is provided to a much broader population. Given concerns about inexactitude and overinflation of cost, outreach expenditures were removed from the calculations based on county feedback.
5. Operational Definitions
Through the process described in this chapter, counties were queried directly about the proportion of expenditures provided to each age group for Fiscal Years 08‐09 and 09‐10. The proportion61 by age group was
58 Without this adjustment, we would be counting housing costs twice – they are already included in the RER total, and then we would be counting them again from the county web survey (for those counties that document housing costs on a line item within FSP). 59 Three counties and one municipality submitted their web survey too late for inclusion but will be analyzed in time for distribution for county review on 7/27/12 and for inclusion in the Final Report. Note that one county was in start‐up during the entire study period and was consequently removed from the total N for purpose of calculation. Therefore, the N = 58 (rather than 59). 60 See Appendix D for a list of county participants. Population data were extracted by county and for the state, for 2008 (corresponding to FY 08‐09) and 2009 (corresponding to FY 09‐10), from census data: http://www.census.gov/popest/research/eval‐estimates/eval‐est2010.html 61 A small number of counties did not answer all questions, or did not answer for all age groups. For these counties, discrepancies were noted on the county‐specific matrix (e.g., no expenditure data for a specific age group, but there are data for that age group in the DCR). For counties that did not answer the question about the age breakout for supportive services, the original budget/annual update age breakouts were used to estimate the proportion of expenditures by age group (applied to the Revenue and Expenditure Report data. If the original budget/annual update numbers were unclear/not specific, the actual numbers served by age group in each fiscal year was used as the basis for developing proportions by age group. The county’s FSP costs by age group were then submitted to the county for review and input.

Draft Report – for Stakeholder Input
Full Service Partnerships: California’s Investment to Support Children and Transition‐Age Youth with Serious Emotional Disturbance and Adults and Older Adults with Severe Mental Illness
Page 20
then applied to expenditure data62 in order to arrive at Full Service Partnership cost per age group. 63 This process was followed for all counties in order to maintain uniformity and in order to rely upon county‐informed breakouts. 64
The definition of annual cost average for each age group, in each fiscal year, in each county is:
Aggregated Program Cost
per Age Group Standardized Client
Years per Age Group
“Program” refers to the summary of all programs operating within a county for each particular age group. This is the manner in which expenditures are rolled up and reported on the CSS “Program” worksheet.
“Cost” for a given fiscal year is defined as the aggregate cost of all programs for an age group, determined using the most recent revision of the Revenue and Expenditure (R&E) report for a given fiscal year that has been prepared by the county, in combination with information from that county via web survey that provides a determination as to how program costs should be broken out into age groups.
Program costs may be adjusted by housing that may be reported outside the FSP program expenditure sheets in some counties (e.g., on the CSS General System Development worksheet).
“Standardized Client Years” is defined as the number of full FSP client years of service provided across all programs regardless of numbers of clients entering or exiting, or the individual duration of services. This particular aspect of the calculation is discussed in more detail below (see 7. Standardized Client Years for further discussion).
6. Cost Components
The proposed data sources and procedures to meet the basic requirement of calculating the annualized number of clients and FSP program cost per age group are described in this section.
Numerator The numerator is the Aggregated Program Cost per Age Group. The data source was the Revenue and Expenditure Report, cumulative across FSP programs. Costs were limited to those reported for FSP clients, using funding sources identified in the R&E program summaries combined with information provided by counties via the web survey.
62 Counties were asked to report on the amount spent per age group on supportive services provided to Full Service Partnership participants by age group. Some counties accounted for all of their FSP expenditures using this method (verified by matching back to their Revenue and Expenditure Report). Other counties accounted for only a proportion. For counties that did not account for all Full Service Partnership line‐item expenditures in the web survey, the expenditures used for cost calculations defaulted to the Full Service Partnership line items in the county’s Revenue and Expenditure Report. 63 Not all counties serve all age groups, but the calculation for these counties was simple. For example, County X indicates that nothing was spent on Older Adults during FY 08‐09. Zero proportion of cost is multiplied by the total FSP expenditure amount, for a total cost of $0. The value $0 is reflected on County X’s FSP Costs & Cost Offsets Excel spreadsheet. 64 There are a few anomalies – counties that show no expenditures on a certain age group, and yet DCR data for this age group. In cases such as these, the anomaly is noted on the county worksheet, and counties will be provided another opportunity for review and feedback following distribution of revised FSP Costs & Cost Offsets Excel worksheets on July 27, 2012. See Chapter V, Next Steps, for more details.

Draft Report – for Stakeholder Input
Full Service Partnerships: California’s Investment to Support Children and Transition‐Age Youth with Serious Emotional Disturbance and Adults and Older Adults with Severe Mental Illness
Page 21
Denominator The denominator is the Standardized Client Years per Age Group. The data source was FSP clients as identified in the State Department of Mental Health’s Data Collection and Reporting system (DCR). The DCR was briefly introduced in Chapter II, Involvement of Key Stakeholders. The following description comes from Phase II Deliverable 2.E. (draft, p. 8):
The DCR system houses data for clients who are served through Full Service Partnership programs. Data from assessments – the Partnership Assessment Form (PAF), Key Event Tracking (KET) and Quarterly Assessment (3M) – are collected for clients in specific age categories.
• The PAF reflects client history and baseline information, including client education and/or employment, housing situation, legal issues, health status and substance use.
• The KET reflects any important changes in the client’s life such as housing, education and/or employment and legal issues during Full Service Partnership.
• The 3M is used to collect information quarterly on key areas such as education, health status, substance use, and legal issues.
See 7. Standardized Client Years for further discussion.
Fiscal Years Analyzed The two fiscal years (FY) selected for analysis were FY 08‐09 and FY 09‐10. These two years were selected as a result of available data in the DCR. Without DCR data for a majority of counties, Standardized Client Years per Age Group cannot be calculated (see Exhibit III.1 for a summary of the available data sources and their limitations). Data from earlier fiscal years are incomplete across California counties. 65 The rationale for the focus on later implementation years is that no statewide assumptions can be made in earlier fiscal years.
Start‐up costs66 will be discussed for contextual consideration in the Final version of this Report (due September 30, 2012), and are not included in the formula.67
FY 07‐08 is not included in the formula, or in this report, because DCR data are not available for a majority of counties.
7. Standardized Client Years
Standardized Client Years represent a numeric value in the denominator of our annual cost‐per‐FSP‐client rate calculation. Calculations are completed separately for each fiscal year and for each age group. The definition of this numeric value, and the rationale for this definition, are provided in this chapter.
Standardized Client Years are calculated through the following process (again, note that this process is run separately for each fiscal year and for each age group):
65 See Phase II Deliverable 2.E., – Priority Indicators Report. 66 In addition, external shocks to system (realignment and the end of AB 2034) occurred in earlier fiscal years, calling into question the ability to replicate the cost calculation into other fiscal years had earlier years been included in the analysis. Counties also provided evidence that RER instructions changed significantly from FY 06‐07 to FY 07‐08. Documentation may be provided, upon request. 67 Start‐up for each individual county is defined as the first two years of FSP expenditures. Therefore, the actual fiscal years vary, depending upon the county.

Draft Report – for Stakeholder Input
Full Service Partnerships: California’s Investment to Support Children and Transition‐Age Youth with Serious Emotional Disturbance and Adults and Older Adults with Severe Mental Illness
Page 22
• Identified all clients that were enrolled in FSP during the target fiscal year;
• Calculated the number of days that each was enrolled during the target fiscal year (see the discussion below, as there are nuances to this particular calculation);
• Summed number of days enrolled across all enrollees;
• Divided by 365 (the number of days in a year).
Enrollment is defined as the period of time that an individual is enrolled in and eligible for services in FSP. This definition is not dependent on being enrolled in any specific service or on receiving any specific support. The major assumption is that enrolled participants are receiving FSP services to meet their varying needs at a level that will help them achieve individualized service plan goals. These targets and the services received by individual participants will appropriately vary. Enrollment appropriate to this definition was initially defined by the partnership start and partnership status change dates entered in the Partnership Assessment Form (PAF).68
As has been the case with most MHSA data, however, realities of the data resulted in alternative strategies, described below under Challenges.
The primary concept that we measured was the number of persons served during each fiscal year (by age group). Of course, not everyone is enrolled continuously over an entire year. There are four different participation patterns that needed to be accounted for in our analysis (refer back to the second bullet point, above). We present them in each fiscal year, in order to avoid any confusion that calculations may have somehow been different for different fiscal years:
Fiscal Year 08‐09:
• Start date in FY 08‐09 and end date in FY 08‐09 69
• Start date before FY 08‐09 and end date in FY 08‐09
• Start date in FY 08‐09 and no end date (still enrolled)
• Start date before FY 08‐09 and no end date (still enrolled)
Fiscal Year 09‐10:
• Start date in FY 09‐10 and end date in FY 09‐10 70
• Start date before FY 09‐10 and end date in FY 09‐10
• Start date in FY 09‐10 and no end date (still enrolled)
• Start date before FY 09‐10 and no end date (still enrolled)
Examples are provided on the following page to illustrate the number of days calculated in each of the four categories.
68 The Partnership Status Change date on the PAF is updated automatically when there is a change in status on the KET or 3M. 69 We account for FSP clients with multiple start and stop dates within the same fiscal year. 70 We account for FSP clients with multiple start and stop dates within the same fiscal year.

Draft Report – for Stakeholder Input
Full Service Partnerships: California’s Investment to Support Children and Transition‐Age Youth with Serious Emotional Disturbance and Adults and Older Adults with Severe Mental Illness
Page 23
Here are some examples to illustrate start and end dates within the same fiscal year (FY 08‐09): Sample Client Start Date in FY 08‐09 End Date in FY 08‐09 # of Days
001 7/3/2008 1/30/2009 211
002 7/17/2008 5/1/2009 288
003 8/26/2008 12/15/2008 111
Here are some examples that show start dates before the fiscal year and end dates within the fiscal year (FY 08‐09):
Sample Client Start Date before FY 0809 End Date in FY 0809 # of Days
066 7/3/2007 7/15/2008 576
067 7/17/2007 7/15/2008 653
068 8/26/2007 8/22/2008 476
Below is an example of a start date within the fiscal year but no end date. (FY 09‐10). When there is no end date, the end date defaults to the end of the most recent fiscal year (June 30, 2012).
Sample Client Start Date in FY 0910 No End Date # of Days
100 7/1/2009 6/30/2012 1,094
Below is one example of a start date before the fiscal year, but no end date (FY 09‐10). When there is no end date, the end date defaults to the end of the most recent fiscal year (June 30, 2012).
Sample Client Start Date before FY 0910 No End Date # of Days
045 7/1/2008 6/30/2012 1,459
The examples above (number of days) are building blocks used in calculation of Standardized Client Years. 71 However, they do not represent the completion of the calculations, because they have not yet been tallied across all FSP clients in the age group in the fiscal year of interest, nor has the divisor of 365 been applied. The tables merely illustrate how calculations as described under the bolded bullet point are completed:
• Identified all clients that were enrolled in FSP during the target fiscal year;
• Calculated the number of days that each was enrolled during the target fiscal year;
• Summed number of days enrolled across all enrollees;
• Divided by 365 (the number of days in a year)
For the purpose of discussing FSP cost by age group, we are interested in the number of FSP clients within each age group who received services from the FSP program in each fiscal year. It doesn’t matter if some of these people
71 Keep in mind that the primary concept is to measure the number of persons served by FSP in each fiscal year. This is very different from the number of new enrollees each fiscal year. In Chapter IV, we explain why this difference is so important when we discuss cost offsets.

Draft Report – for Stakeholder Input
Full Service Partnerships: California’s Investment to Support Children and Transition‐Age Youth with Serious Emotional Disturbance and Adults and Older Adults with Severe Mental Illness
Page 24
are the same people in FY 08‐09 and FY 09‐10. The important consideration is, Did they receive FSP services in that fiscal year? If the answer is yes, then we counted them. How we counted and arrived at our final calculations is described below.
Challenges Through discussion with several counties following review of their draft FSP Costs & Cost Offsets Excel worksheets, one issue that came to the fore was the variation across counties in number of FSP clients served in each fiscal year. This feedback prompted further investigation of FSP clients identified as being served in each FY.
In reviewing DCR data for FY 08‐09 and 09‐10, we found cases with (the names in quotation marks represent actual DCR variable names):
• identical start (“PartnershipDate”) and change (“DatePartnershipStatusChange”) dates o Many cases are enrollees prior to FY 09‐10 – which suggest that this anomaly is not due to
clients recently entered into the system,
• a “PartnershipStatus” of “1” (indicating an active partner), and
• KET assessment dates subsequent to their “DatePartnershipStatusChange” – meaning that KET data were entered after the date of partnership status change, and somehow the DCR did not recognize that KET data were entered and update the DatePartnershipStatusChange variable (see example case below).
Subsequent KET assessments (KETs occurring after the original PAF) suggest that a change date equal to the start date (“DatePartnershipStatusChange”) for such cases is not accurate. The inaccuracy of these end dates prevented them from being included in our initial counts.72
The names across the table headers represent DCR variable names. The data shown below were extracted from an actual case out of the DCR to provide an example. The global identification number has been removed to protect confidentiality.
GlobalID PartnershipStatus PartnershipDate DatePartnershipStatusChange AssessmentDate_KET AssessmentDate_KET AssessmentDate_KET
xxxxxx 1 16‐Mar‐2007 16‐Mar‐2007 01‐Oct‐2009 16‐Oct‐2009 03‐Dec‐2009
In brief, the example above suggests that an FSP participant was discharged on the same day he or she was enrolled, yet the KET date clearly tells us that this is clearly not the case. This problem with the DCR system prevented cases such as these from being identified initially, given that our initial assumption was to use:
• “PartnershipDate” for the date of enrollment; and
• “DatePartnershipStatusChange” for the date of FSP conclusion
Another problem was identified in the DCR data:
• Start (“PartnershipDate”) and change (“DatePartnershipStatusChange”) dates prior to the FY being considered,
• “PartnershipStatus” of “1” (indicating an active partner), or “3” (indicating a re‐enrollee), and
72 A separate issue that should be followed up with DMH is why the DatePartnershipStatusChange is not automatically updated when KET is entered for these cases. This system glitch is troubling.

Draft Report – for Stakeholder Input
Full Service Partnerships: California’s Investment to Support Children and Transition‐Age Youth with Serious Emotional Disturbance and Adults and Older Adults with Severe Mental Illness
Page 25
• Subsequent KET assessments (in the current fiscal year – yet the CHANGE date is in a fiscal year prior to the fiscal years we are analyzing)
Again, these subsequent KET assessments (dates in the fiscal years we are interested in analyzing) suggest that change dates (“DatePartnershipStatusChange”) in prior fiscal years, outside of our analysis range, are not accurate. Thus, the inaccuracy of these change dates prevented them from being included in our initial counts.
The intricacies of the DCR system identified above also impact calculations of days of service. Given the anomalies uncovered, we came to the determination that the “Partnership Date,” “Date Partnership Status Change” and “Partnership Status” fields are required for accurate estimation of the number of service days each partner received during a given FY. Decision rules regarding interpretation of the values contained in these data fields are required so that days of service can be consistently calculated for all FSP clients served in a given FY. Decision rules for FSP clients based upon their partnership status are outlined below:
• For active partners (i.e., “PartnershipStatus” = 1 or 3), days of service were counted from FSP start date (“PartnershipDate”) or the beginning of the given FY (July 1 for Partnership Dates prior to the FY) to the end of the FY (June 30).
o Some active partners show identical “PartnershipDate” and “DatePartnershipStatusChange” and have KET assessments on the same date, within a given FY. For such cases, days of service were counted from “PartnershipDate” to the end of the given FY, as there is no indication of service end.
o Active partners with “PartnershipDate” and “DatePartnershipStatusChange” prior to the FY, some with subsequent KET assessments, other without subsequent assessments. Such cases were credited with a full FY of service (365 days), as these partners are active and have no indication of service end.
• For non‐active partners (i.e., PartnershipStatus = 0) with “DatePartnershipStatusChange” within the FY or subsequent to the end of the given FY, days of service were counted from start date (“PartnershipDate”) or the beginning of the given FY (July 1 for partnership dates prior to the FY) to a “DatePartnershipStatusChange” within the FY or the end of the FY (June 30).
o Some non‐active partners also show identical “PartnershipDate” and “DatePartnershipStatusChange,” and have KET assessments on the same date, within a given FY. These cases were defaulted to a single day of service.
Specific decision rules regarding the values (i.e., dates and partnership status) contained in these data files were required to produce accurate counts of service days for all FSP clients served in a given FY. These decision rules were outlined in order to provide the most conservative counts of service days per FSP client.
b. PerPerson Annual Cost Average by Age Group
The calculations shown in Tables III.1 and III.3 below use annualized cost per FSP client year as a standard metric for service costs across counties. The calculation of annualized cost per FSP client involved the following steps (recall from earlier in the chapter):
• Identified all clients that were enrolled in FSP during the target fiscal year;
• Calculated the number of days that each was enrolled during the target fiscal year;
• Summed number of days enrolled across all enrollees;
• Divided by 365.
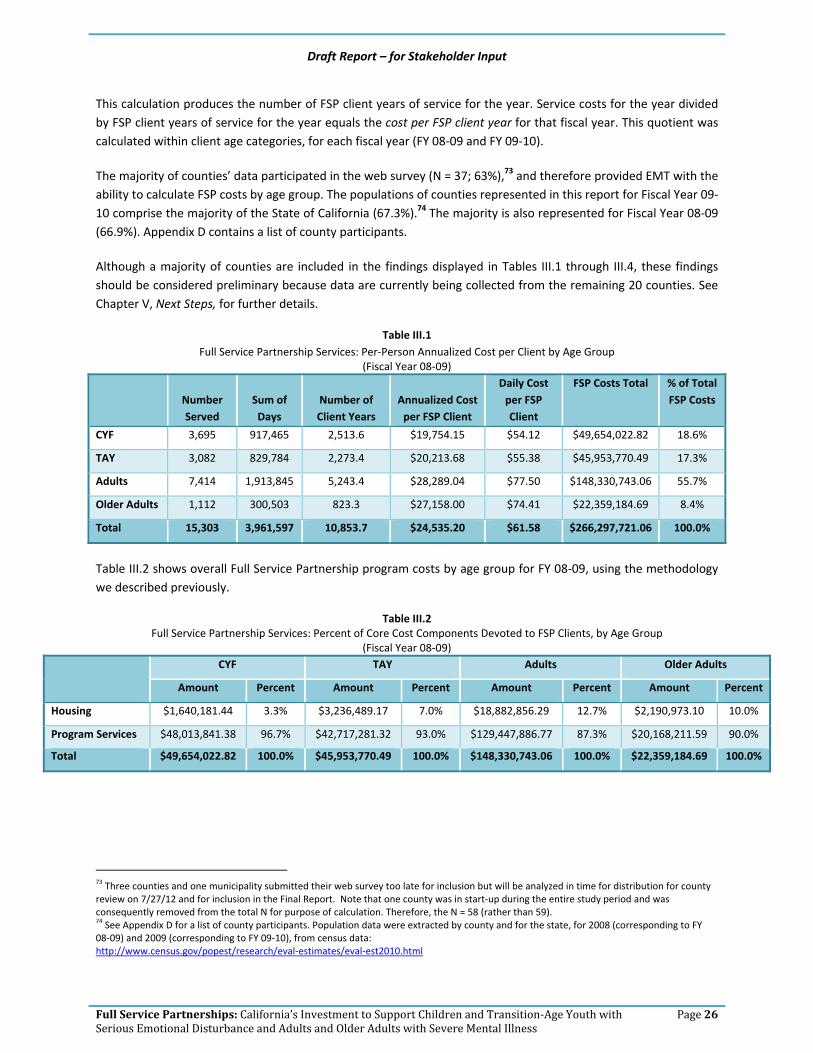
Draft Report – for Stakeholder Input
Full Service Partnerships: California’s Investment to Support Children and Transition‐Age Youth with Serious Emotional Disturbance and Adults and Older Adults with Severe Mental Illness
Page 26
This calculation produces the number of FSP client years of service for the year. Service costs for the year divided by FSP client years of service for the year equals the cost per FSP client year for that fiscal year. This quotient was calculated within client age categories, for each fiscal year (FY 08‐09 and FY 09‐10).
The majority of counties’ data participated in the web survey (N = 37; 63%),73 and therefore provided EMT with the ability to calculate FSP costs by age group. The populations of counties represented in this report for Fiscal Year 09‐10 comprise the majority of the State of California (67.3%).74 The majority is also represented for Fiscal Year 08‐09 (66.9%). Appendix D contains a list of county participants.
Although a majority of counties are included in the findings displayed in Tables III.1 through III.4, these findings should be considered preliminary because data are currently being collected from the remaining 20 counties. See Chapter V, Next Steps, for further details.
Table III.1 Full Service Partnership Services: Per‐Person Annualized Cost per Client by Age Group
(Fiscal Year 08‐09)
Number Served
Sum of Days
Number of Client Years
Annualized Cost per FSP Client
Daily Cost per FSP Client
FSP Costs Total % of Total FSP Costs
CYF 3,695 917,465 2,513.6 $19,754.15 $54.12 $49,654,022.82 18.6%
TAY 3,082 829,784 2,273.4 $20,213.68 $55.38 $45,953,770.49 17.3%
Adults 7,414 1,913,845 5,243.4 $28,289.04 $77.50 $148,330,743.06 55.7%
Older Adults 1,112 300,503 823.3 $27,158.00 $74.41 $22,359,184.69 8.4%
Total 15,303 3,961,597 10,853.7 $24,535.20 $61.58 $266,297,721.06 100.0%
Table III.2 shows overall Full Service Partnership program costs by age group for FY 08‐09, using the methodology we described previously.
Table III.2 Full Service Partnership Services: Percent of Core Cost Components Devoted to FSP Clients, by Age Group
(Fiscal Year 08‐09)
CYF TAY Adults Older Adults
Amount Percent Amount Percent Amount Percent Amount Percent
Housing $1,640,181.44 3.3% $3,236,489.17 7.0% $18,882,856.29 12.7% $2,190,973.10 10.0%
Program Services $48,013,841.38 96.7% $42,717,281.32 93.0% $129,447,886.77 87.3% $20,168,211.59 90.0%
Total $49,654,022.82 100.0% $45,953,770.49 100.0% $148,330,743.06 100.0% $22,359,184.69 100.0%
73 Three counties and one municipality submitted their web survey too late for inclusion but will be analyzed in time for distribution for county review on 7/27/12 and for inclusion in the Final Report. Note that one county was in start‐up during the entire study period and was consequently removed from the total N for purpose of calculation. Therefore, the N = 58 (rather than 59). 74 See Appendix D for a list of county participants. Population data were extracted by county and for the state, for 2008 (corresponding to FY 08‐09) and 2009 (corresponding to FY 09‐10), from census data: http://www.census.gov/popest/research/eval‐estimates/eval‐est2010.html
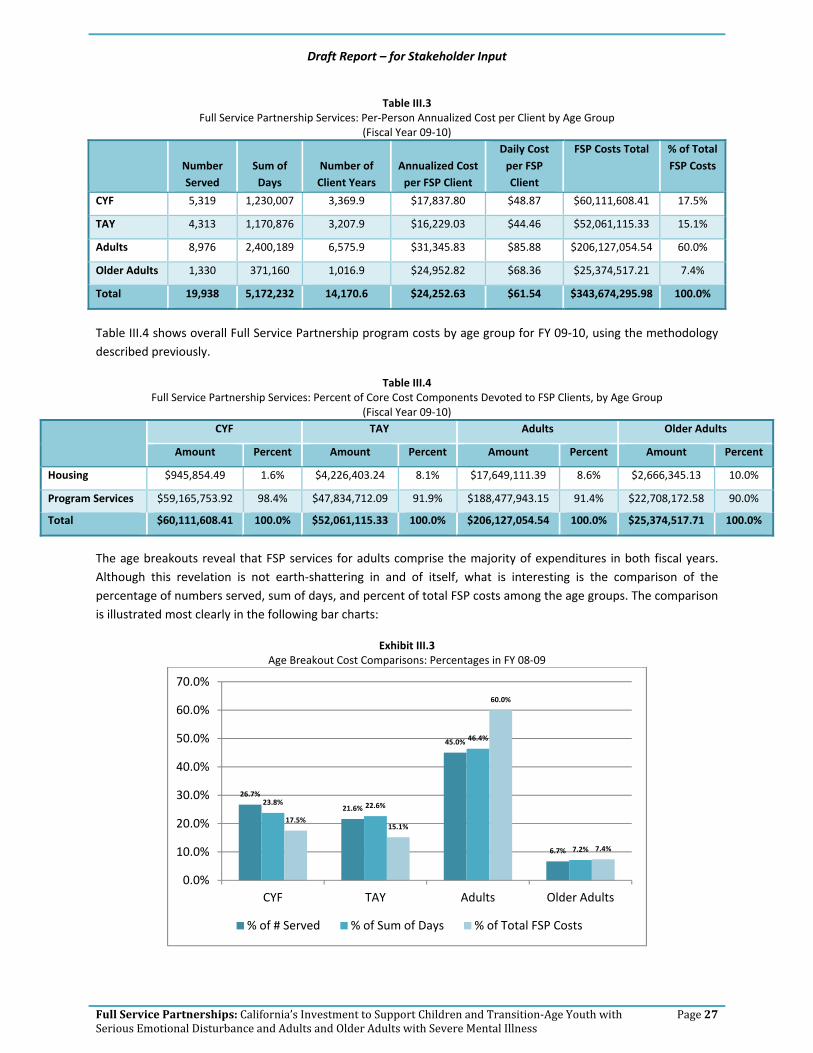
Draft Report – for Stakeholder Input
Full Service Partnerships: California’s Investment to Support Children and Transition‐Age Youth with Serious Emotional Disturbance and Adults and Older Adults with Severe Mental Illness
Page 27
Table III.3 Full Service Partnership Services: Per‐Person Annualized Cost per Client by Age Group
(Fiscal Year 09‐10)
Number Served
Sum of Days
Number of Client Years
Annualized Cost per FSP Client
Daily Cost per FSP Client
FSP Costs Total % of Total FSP Costs
CYF 5,319 1,230,007 3,369.9 $17,837.80 $48.87 $60,111,608.41 17.5%
TAY 4,313 1,170,876 3,207.9 $16,229.03 $44.46 $52,061,115.33 15.1%
Adults 8,976 2,400,189 6,575.9 $31,345.83 $85.88 $206,127,054.54 60.0%
Older Adults 1,330 371,160 1,016.9 $24,952.82 $68.36 $25,374,517.21 7.4%
Total 19,938 5,172,232 14,170.6 $24,252.63 $61.54 $343,674,295.98 100.0%
Table III.4 shows overall Full Service Partnership program costs by age group for FY 09‐10, using the methodology described previously.
Table III.4 Full Service Partnership Services: Percent of Core Cost Components Devoted to FSP Clients, by Age Group
(Fiscal Year 09‐10)
CYF TAY Adults Older Adults
Amount Percent Amount Percent Amount Percent Amount Percent
Housing $945,854.49 1.6% $4,226,403.24 8.1% $17,649,111.39 8.6% $2,666,345.13 10.0%
Program Services $59,165,753.92 98.4% $47,834,712.09 91.9% $188,477,943.15 91.4% $22,708,172.58 90.0%
Total $60,111,608.41 100.0% $52,061,115.33 100.0% $206,127,054.54 100.0% $25,374,517.71 100.0%
The age breakouts reveal that FSP services for adults comprise the majority of expenditures in both fiscal years. Although this revelation is not earth‐shattering in and of itself, what is interesting is the comparison of the percentage of numbers served, sum of days, and percent of total FSP costs among the age groups. The comparison is illustrated most clearly in the following bar charts:
Exhibit III.3 Age Breakout Cost Comparisons: Percentages in FY 08‐09
26.7%
21.6%
45.0%
6.7%
23.8% 22.6%
46.4%
7.2%
17.5%15.1%
60.0%
7.4%
0.0%
10.0%
20.0%
30.0%
40.0%
50.0%
60.0%
70.0%
CYF TAY Adults Older Adults
% of # Served % of Sum of Days % of Total FSP Costs

Draft Report – for Stakeholder Input
Full Service Partnerships: California’s Investment to Support Children and Transition‐Age Youth with Serious Emotional Disturbance and Adults and Older Adults with Severe Mental Illness
Page 28
Exhibit III.4 Age Breakout Cost Comparisons: Percentages in FY 09‐10
In both fiscal years, Older Adults are represented nearly equally in terms of the percentage of overall FSP participants, the percentage of overall number of days and the proportion (percentage) of overall FSP dollars spent on them. They are the only age group that exhibits this characteristic.
Adults, as previously noted, represent the group upon which the majority of FSP funds are spent. However, they represent only a plurality in terms of percentage of overall FSP participants and percentage of overall number of days. The argument may be advanced that the serious needs of Adults with mental illness require greater investment of resources, but the same argument could also be put forward on behalf of Older Adults. Further investigation is needed in order to better understand this pattern. 75
Children, Youth and Families and Transition‐Age Youth display the opposite pattern – the amounts spent on these two groups as a percentage of the overall total are proportionately less than their numbers and days of service. This expenditure pattern may be indicative of the early‐intervention nature of FSP services with these age groups.
c. Contextual Factors – Impact on Cost
Some small counties received additional time to fully implement Full Service Partnership programs.76 As a result, not all small counties were fully operational by FY 08‐09, and FSP costs varied widely in comparison with FY 09‐10. Although FSP funds were spent during FY 08‐09 by these small counties, FSP was not considered to be fully implemented. Due to major instability in FSP costs from FY 08‐09 and FY 09‐10, FY 08‐09 was set aside for these counties and not included for statewide analyses. See Appendix D for a list of the small counties for which FY 08‐09 was not included in the FY 08‐09 analysis.
75 See Chapter V, Next Steps, for hypotheses we are currently testing related to implementation of evidence‐based practices and potential impact on cost. 76 http://www.dmh.ca.gov/DMHDocs/docs/notices08/08‐02.pdf http://www.dmh.ca.gov/DMHDocs/docs/notices08/08‐19.pdf http://www.dmh.ca.gov/DMHDocs/docs/notices08/08‐36.pdf
26.7%
21.6%
45.0%
6.7%
23.8% 22.6%
46.4%
7.2%
17.5%15.1%
60.0%
7.4%
0.0%
10.0%
20.0%
30.0%
40.0%
50.0%
60.0%
70.0%
CYF TAY Adults Older Adults
% of # Served % of Sum of Days % of Total FSP Costs

Draft Report – for Stakeholder Input
Full Service Partnerships: California’s Investment to Support Children and Transition‐Age Youth with Serious Emotional Disturbance and Adults and Older Adults with Severe Mental Illness
Page 29
Note that setting aside a number of small counties should not be viewed as a poor reflection of FSP implementation by these counties. As noted above (and cited in the footnotes), the California Department of Mental Health fully recognized that small counties required additional time to fully ramp up and roll out Full Service Partnership services, and provided an exception in order to allow small counties additional time.
d. Summary
This report identifies the average statewide annual and per‐day cost of providing FSP services to clients in California. The costs of FSP services are calculated in two categories: program services – which includes activities required under the Mental Health Services Act, as well as any evidence‐based models and/or practices offered – and housing costs.77 While FSP clients may be represented in marginal additional costs (e.g., outreach) there is not a feasible way of parsing these expenditures, and impacts on cost estimates would be minor.
77 Housing is defined as Housing Support, Operating Support and Housing Placement. It does not include the Governor’s Housing Initiative.
Housing Support is the cost of housing subsidies for permanent, transitional and temporary housing; master leases; motel and other housing vouchers; rental security deposits; first and last month rental payments; and other fiscal housing supports. The operating costs of providing housing supports to clients, includes building repair and maintenance, utilities, housing agency management fees, insurance, property taxes and assessments, credit reporting fees, and other operating costs incurred in providing client housing supports. Housing placement is assistance in securing housing, including supportive housing – permanent affordable housing with combined supports for independent living.

Draft Report – for Stakeholder Input
Full Service Partnerships: California’s Investment to Support Children and Transition‐Age Youth with Serious Emotional Disturbance and Adults and Older Adults with Severe Mental Illness
Page 30
IV. Cost Offsets for Full Service Partnership Programs
One focus of this chapter is “whether costs incurred in providing mental health services … are offset by reduced costs elsewhere in the health care system.” 78 By virtue of the data collected at the time of intake and follow‐up, we have been able to expand exploration of cost reduction beyond the health care system, to include incarceration.
Specifically, we explore whether the costs of providing the Full Service Partnership are offset by reduced costs in:
• Acute care hospitalization (as defined in response to physical health needs – we examine psychiatric hospitalization as a separate area of offsets),
• Inpatient psychiatric hospitalization,
• Skilled nursing care (non‐psychiatric), and
• Incarceration in the following facilities: o Division of Juvenile Justice o Juvenile Hall/Camp o County Jail o State Prison
Results are presented for each age group.
a. Methodology
The analyses presented in this chapter use annual or annualized per client cost as comparable metrics for pre‐ (annual) and post‐FSP (annualized) entry costs for offset‐area data across counties. Please refer back to the detailed discussion in Chapter III that describes our methodology for calculating annualized cost per FSP client year. The detailed description of the methods for calculating annualized cost per FSP client need not be repeated here.
There are three new calculations that are completed when calculating cost offsets (regardless of whether we are calculating offsets for physical health, psychiatric inpatient hospitalization or incarceration). They are:
• New enrollees (FY 08‐09 and FY 09‐10)
• Annual per client offset area cost (as compared with annualized)
• Rate applied to arrive at cost offset (and then applied to number of days of acute hospitalization, etc.)
• After the number of days is multiplied by the rate, the annualized per‐client cost offset is produced
The methodology for each of these new calculations is described in this section.
1. New Enrollees
All cost‐offset analyses were limited to new enrollees in each fiscal year. First we explain what a new enrollee is, and then we will justify why limiting the cost analysis to new enrollees was imperative.
78 Fells, T. (1999). Is there a cost offset to psychotherapy? Journal of Psychotherapy Practice and Research, 8, 243, 247. Quote taken from p. 243.

Draft Report – for Stakeholder Input
Full Service Partnerships: California’s Investment to Support Children and Transition‐Age Youth with Serious Emotional Disturbance and Adults and Older Adults with Severe Mental Illness
Page 31
This new aspect of methodology for calculating cost offsets is actually part of a calculation introduced in Chapter III. Our new enrollees are the bolded groups. Recall the following:
Fiscal Year 08‐09
• Start date in FY 08‐09 and end date in FY 08‐09 79
• Start date before FY 08‐09 and end date in FY 08‐09
• Start date in FY 08‐09 and no end date (still enrolled)
• Start date before FY 08‐09 and no end date (still enrolled)
Fiscal Year 09‐10
• Start date in FY 09‐10 and end date in FY 09‐10 80
• Start date before FY 09‐10 and end date in FY 09‐10
• Start date in FY 09‐10 and no end date (still enrolled)
• Start date before FY 09‐10 and no end date (still enrolled)
A new enrollee is identified thus:
• FY 08‐09: Enrollment date between July 1, 2008, and June 30, 2009
• FY 09‐10: Enrollment date between July 1, 2009, and June 30, 2010
Any FSP client who did not meet these enrollment‐date criteria was excluded from the cost‐offset analysis.
• Enrollment date was the sole determining factor as to which fiscal year an FSP client was placed into for purpose of analysis.
• An FSP client appeared in only one data set (no one appeared in both fiscal years, despite the fact that an FSP client who enrolled in FY 08‐09 may still be enrolled in FY 09‐10). 81
It was critical to limit the cost‐offset analysis to new enrollees in order to compare the proverbial apples to apples. In brief:
• At intake, days of hospitalization and incarceration are queried for the 12 months prior to enrollment.
• In order to provide a valid comparison (apples to apples), the post‐comparison period had to be limited to the 12 months following enrollment.
2. Annual per‐Client Offset Area Cost
This concept is actually straightforward. Because the Partnership Assessment Form (PAF) contains questions for FSP clients about number of days hospitalized, etc. in the 12 months prior to enrollment, there is no need to apply an annualization formula. The period of time in question is already 12 months. Recall that PAF data are collected by individual counties, and then entered into the State of California Department of Mental Health’s Data Collection and Reporting System (DCR). EMT received the DCR data (updated through June 30, 2011) through the contract to conduct the Statewide Evaluation of the Mental Health Services Act.
79 We account for FSP clients with multiple start and stop dates within the same fiscal year. 80 We account for FSP clients with multiple start and stop dates within the same fiscal year. 81 Length of participation is handled through the annualization calculation. Refer back to the discussion of methods in Chapter III.

Draft Report – for Stakeholder Input
Full Service Partnerships: California’s Investment to Support Children and Transition‐Age Youth with Serious Emotional Disturbance and Adults and Older Adults with Severe Mental Illness
Page 32
Therefore, Annual per‐client offset area cost is calculated for the baseline (pre‐enrollment) through the following steps:
• Identified all clients who enrolled in FSP during the target fiscal year (see above for an explanation of how new enrollees are identified).
• Through intake interview data (PAF), identified the number of days of hospitalization, incarceration, etc. (see each cost‐offset area in this section for details), for each client.
• In the year prior to enrollment, summed across all clients, multiplied by the daily negotiated cost for the county (see each cost‐offset area in this section for details) and divided by the number of clients enrolled in FSP during the target year (total number of new enrollees – see Tables IV.29 and IV.30 in the Summary at the end of this chapter).
This quotient is the annual per‐client (offset area) cost for the baseline, the year prior to enrollment.
3. Annualized per‐Client Offset Area Cost
The manner in which annualization is calculated has already been described (Chapter III), and the methodology is no different when applied to cost offsets.
Annualized per‐client (offset area) cost is calculated for the period of time each client is in FSP following enrollment. This post‐enrollment offset area cost is calculated through the following steps:
• Identified all clients who enrolled in FSP during the target fiscal year (new enrollees), and the number of those who had been hospitalized, incarcerated, etc. (see each cost‐offset area in this section for the exact DCR variables that are used in the calculations);
• Through Key Event Tracking data (see Chapter III for an introduction to the KET, variables used when calculating number of days of FSP participation, and each cost‐offset area below for the specific cost‐offset variables used in analysis), identified:
o The number of days enrolled, and o Divided by 365 for each client. o This quotient is the annualization multiplier for each new enrollee. o The annualization multiplier is applied to all new enrollees, regardless of whether or not they
were hospitalized, incarcerated, etc. (see Chapter III for how days of enrollment are calculated)
• Identified o The number of days of hospitalization, incarceration, etc., for each client post‐enrollment, and o Multiplied by each client’s annualization multiplier.
New enrollees with zero (0) days (of hospitalization, for example) drop out of the analysis at this point, and we are left with those new enrollees with a number of days in the offset area of interest.
o This product is the annualized number of days of (cost offset area) for each new enrollee (who was hospitalized or incarcerated during the 12‐month follow‐up period).
• Summed annualized days of (cost‐offset area) across all new enrollees. o Recall that those who do not have any days of hospitalization, incarceration, etc., have dropped
out of the analysis at this point;

Draft Report – for Stakeholder Input
Full Service Partnerships: California’s Investment to Support Children and Transition‐Age Youth with Serious Emotional Disturbance and Adults and Older Adults with Severe Mental Illness
Page 33
o Multiplied by the daily negotiated cost of MH hospitalization, incarceration, etc., for the county (see each specific offset area in this chapter for where these rates were obtained, and the manner in which they were applied), and
o Divided by the number of new enrollees in FSP during the target year (total number of new enrollees – see Tables IV.29 and IV.30 in the Summary at the end of this chapter).
This quotient is the annualized per‐client hospitalization, incarceration, etc., cost for the post‐enrollment period.
Again, note that we limited the analyses to new enrollees in order to have a match with the 12‐month pre‐enrollment period. In essence, to compare the 12 months following enrollment with the 12 month period prior to enrollment (PAF question asks about the 12 months prior to enrollment when asking about hospitalization, etc.)
This chapter summarizes the program costs for clients who initially enrolled in FSP during the target fiscal year, the amount of offsets, and the percentage of one‐year program costs that have been saved in annualized health care, inpatient psychiatric hospitalization and incarceration costs through FSP participation by these new enrollees.
b. Acute Care Hospitalization (Physical Health)
The Substance Abuse and Mental Health Services Administration recently released a national study 82 indicating that adults (age 18 or older) with any mental illness (regardless of whether it was classified as severe mental illness) were more likely than adults without mental illness to have:
• High blood pressure
• Asthma
• Diabetes
• Heart disease
• Stroke
In addition, adults with mental illness were more likely to have used an emergency room and to have been hospitalized.83
1. Statewide Acute (Physical Health) Inpatient Hospitalization Rate
The Office of Statewide Health Planning and Development (OSHPD) is the source for the rates applied by county for acute inpatient care.84 Among the counties that participated in this initial round of FSP cost‐offset calculations, a “statewide” rate was calculated by calculating an average of the rates for counties that participated in this round of the study (see Appendix D for a list of counties that participated). The rate will be adjusted as additional counties participate in subsequent rounds of the study (see the final chapter on Next Steps).
The OSHPD data set (available for download from its website) includes all hospitals in each county. If a county has more than one hospital providing acute hospitalization services, an average within the county was first calculated in order to arrive at a rate for each county. Below is the definition of acute care hospital, as provided by OSHPD:
82 http://www.samhsa.gov/data/2k12/NSDUH103/SR103AdultsAMI2012.pdf Substance Abuse and Mental Health Services Administration (2012). Physical Health Conditions among Adults with Mental Illnesses. Washington, DC: Government Printing Office. Years analyzed included combined 2008 and 2009 National Survey on Drug Use and Health. 83 For non‐psychiatric reasons. SAMHSA analyzed psychiatric ER use and hospitalization separately. 84 http://www.oshpd.ca.gov/hid/Products/Hospitals/Utilization/Hospital_Utilization.html

Draft Report – for Stakeholder Input
Full Service Partnerships: California’s Investment to Support Children and Transition‐Age Youth with Serious Emotional Disturbance and Adults and Older Adults with Severe Mental Illness
Page 34
• Acute Care: The daily hospital service cost centers related to the provision of general acute care, such as Medical/Surgical Acute, Obstetrics Acute, Definitive Observation, Medical/Surgical Intensive Care and Coronary Care.
The specific rate used in calculations was the Total Net Inpatient Revenue per day from all payer sources. 85
2. DCR Variables Analyzed at Baseline & Follow‐Up
The Key Event Tracking Form86 does not indicate the specific facility in which an individual was hospitalized – only that an inpatient stay occurred for physical health reasons. Below are the exact variables we used out of the PAF and the KET, and their definitions. 87
• PAF (Intake/Baseline) Variable: MedicalHospital_PastTwelveDays 88 – Defined as: o RESIDENTIAL INFORMATION: Hospital ‐ Acute Medical Hospital; o Indicates the number of DAYS the partner has been living in this setting during the past 12
months; o Valid Codes: 0‐365
• KET (Follow‐Up) Variable: Current.1 through Current.155 = 8, which is a categorical variable assigned to represent Medical Hospital.
o The Current variables represent the residential status of the FSP at the time of each follow‐up. o Follow‐ups (as documented on the KET) are not conducted according to any pre‐determined time
frame, but rather are driven by Key Events occurring in the FSP client’s life (e.g., hospitalization, incarceration).
o The DCR allows for entry of up to 155 KETs.
A break in the discussion is in order here, to point out that this information, on its own, is insufficient to calculate the number of days that an FSP client was hospitalized for medical reasons (not for psychiatric reasons – we examine those separately). What the Current variable (code = 8) tells us is only that an FSP client was hospitalized for medical reasons, not how many days.
So the challenge for the analysis was how to determine the number of days of acute (physical) inpatient hospitalization, over 155 possible follow‐up points. This is the focus of the Calculations section that follows.
3. Calculations – Acute Medical (Physical Health) Inpatient Hospitalization
Accompanying each Current variable is a DateResidentialChange variable. This variable tells us on what date the FSP client’s residential setting changed.
Therefore, we developed a long set of programming commands in SPSS that did the following for each KET follow‐up period:
1. Selected only those FSP clients who were hospitalized for acute medical (physical health): Current = 8
85 The OSHPD worksheets are available online. http://www.oshpd.ca.gov/hid/Products/Hospitals/Utilization/Hospital_Utilization.html 86 The Key Event Tracking Form is collected by counties and entered into the DCR. EMT receives the data only for analysis. 87 Courtesy of California State University, Sacramento, currently the contractor managing the DCR. 88 Page 79, DCR Data Dictionary Final_20110915. California State University, Sacramento.

Draft Report – for Stakeholder Input
Full Service Partnerships: California’s Investment to Support Children and Transition‐Age Youth with Serious Emotional Disturbance and Adults and Older Adults with Severe Mental Illness
Page 35
2. Calculated the number of days hospitalized by taking the subsequent DateResidentialChange and subtracting the current DateResidentialChange
You might point out – “But wait! What about those who were still hospitalized at the second follow‐up?”
Their Current.2 status would still = 8, and their number of days would be calculated for the second time period. There are additional steps to these calculations:
3. After this process was repeated 155 times, the number of days hospitalized was summed for each FSP client to arrive at a grand total for each person.
o The sum is necessary in order to account for subsequent stays that cross KET administrations, as well as intermittent stays by the same person during his or her FSP involvement
4. We then took Days Enrolled and divided the figure into 365. Because this sounds strange, we illustrate below:
365 ‐‐‐‐‐‐
Days Enrolled
o Days Enrolled, when used in this formula, is not annualized. What we are interested in is the total period in which an FSP client was enrolled. What we produce is a proportion, which is then applied against the Number of Days Hospitalized to adjust for the period of time that a person was at risk for hospitalization. If we do not apply this adjustment, we would unfairly weight the results for or against people who were in the program for shorter or longer periods of time.
o Days Enrolled is therefore simply (you have seen these elements of the formula before, in Chapter III): 89
DatePartnershipStatusChange_KET – PartnershipDate90 5. The proportion calculated for each FSP client out of Step 4 is then multiplied by the sum of days
hospitalized in Step 3. This is how we arrive at the number of days hospitalized, without a bias for length of enrollment.
4. Findings – Acute Medical (Physical Health) Inpatient Hospitalization
Tables IV.1 through IV.4 present cost offsets for each of the age groups, in each fiscal year, for inpatient acute medical (physical health) hospitalization.
Table IV.1 represents FY 08‐09, and Table IV.3 FY 09‐10:
• 12 Months Pre‐Intake – The data displayed under any column marked “pre” correspond to those collected at baseline (refer back for the explanation about which variables we analyzed, and why). 12 Months Post‐Intake – The data displayed under any column marked “post” correspond to those collected in the follow‐up period (refer back for the explanation about which variables we analyzed, and why).
For baseline and follow‐up:
89 The only element missing from what was previously presented in Chapter III is the annualization factor (dividing it by 365). But it does not apply here – we are developing a proportion to be applied against number of days hospitalized. 90 Applying all of the caveats discussed in Chapter III, section c. Contextual Factors – Impact on Cost.
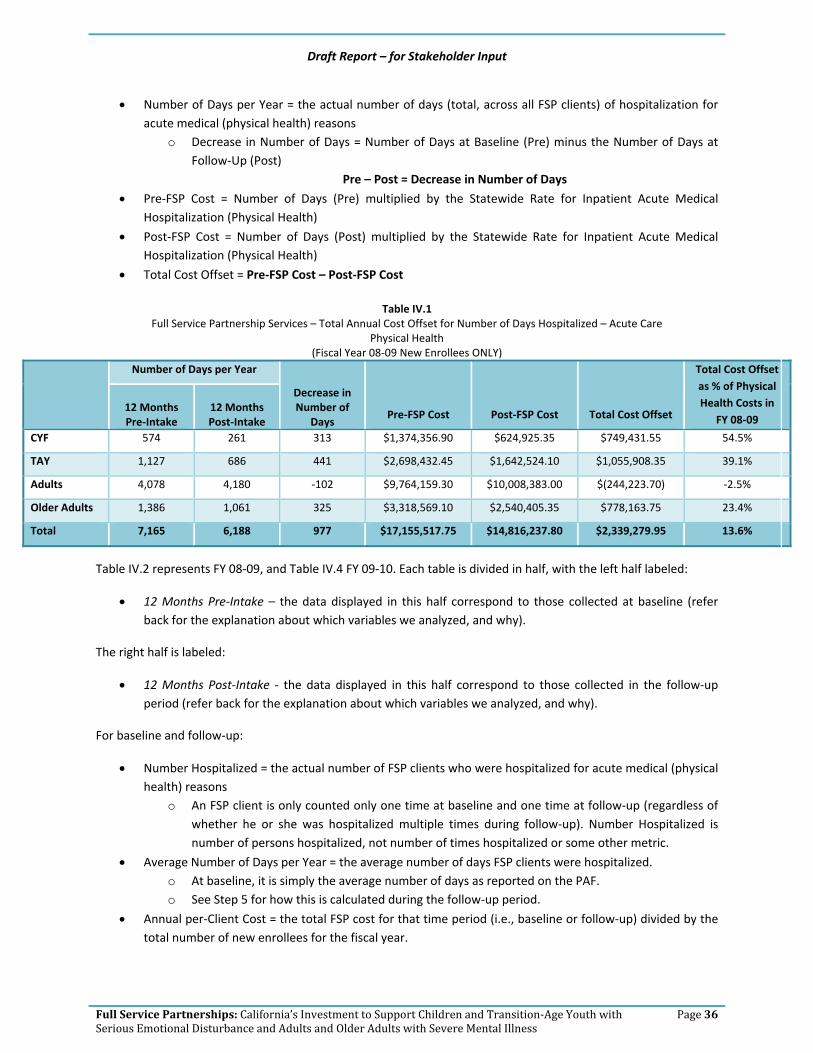
Draft Report – for Stakeholder Input
Full Service Partnerships: California’s Investment to Support Children and Transition‐Age Youth with Serious Emotional Disturbance and Adults and Older Adults with Severe Mental Illness
Page 36
• Number of Days per Year = the actual number of days (total, across all FSP clients) of hospitalization for acute medical (physical health) reasons
o Decrease in Number of Days = Number of Days at Baseline (Pre) minus the Number of Days at Follow‐Up (Post)
Pre – Post = Decrease in Number of Days
• Pre‐FSP Cost = Number of Days (Pre) multiplied by the Statewide Rate for Inpatient Acute Medical Hospitalization (Physical Health)
• Post‐FSP Cost = Number of Days (Post) multiplied by the Statewide Rate for Inpatient Acute Medical Hospitalization (Physical Health)
• Total Cost Offset = Pre‐FSP Cost – Post‐FSP Cost
Table IV.1 Full Service Partnership Services – Total Annual Cost Offset for Number of Days Hospitalized – Acute Care
Physical Health (Fiscal Year 08‐09 New Enrollees ONLY)
Number of Days per Year
Decrease in Number of
Days Pre‐FSP Cost Post‐FSP Cost Total Cost Offset
Total Cost Offset as % of Physical Health Costs in
FY 08‐09 12 Months Pre‐Intake
12 Months Post‐Intake
CYF 574 261 313 $1,374,356.90 $624,925.35 $749,431.55 54.5%
TAY 1,127 686 441 $2,698,432.45 $1,642,524.10 $1,055,908.35 39.1%
Adults 4,078 4,180 ‐102 $9,764,159.30 $10,008,383.00 $(244,223.70) ‐2.5%
Older Adults 1,386 1,061 325 $3,318,569.10 $2,540,405.35 $778,163.75 23.4%
Total 7,165 6,188 977 $17,155,517.75 $14,816,237.80 $2,339,279.95 13.6%
Table IV.2 represents FY 08‐09, and Table IV.4 FY 09‐10. Each table is divided in half, with the left half labeled:
• 12 Months Pre‐Intake – the data displayed in this half correspond to those collected at baseline (refer back for the explanation about which variables we analyzed, and why).
The right half is labeled:
• 12 Months Post‐Intake ‐ the data displayed in this half correspond to those collected in the follow‐up period (refer back for the explanation about which variables we analyzed, and why).
For baseline and follow‐up:
• Number Hospitalized = the actual number of FSP clients who were hospitalized for acute medical (physical health) reasons
o An FSP client is only counted only one time at baseline and one time at follow‐up (regardless of whether he or she was hospitalized multiple times during follow‐up). Number Hospitalized is number of persons hospitalized, not number of times hospitalized or some other metric.
• Average Number of Days per Year = the average number of days FSP clients were hospitalized. o At baseline, it is simply the average number of days as reported on the PAF. o See Step 5 for how this is calculated during the follow‐up period.
• Annual per‐Client Cost = the total FSP cost for that time period (i.e., baseline or follow‐up) divided by the total number of new enrollees for the fiscal year.

Draft Report – for Stakeholder Input
Full Service Partnerships: California’s Investment to Support Children and Transition‐Age Youth with Serious Emotional Disturbance and Adults and Older Adults with Severe Mental Illness
Page 37
o See the discussion above Table IV.1 for calculation of total FSP cost.
Table IV.2 Full Service Partnership Services – Annualized per‐Client Cost Offset for Number of Days Hospitalized – Acute Care
Physical Health (Fiscal Year 08‐09 New Enrollees ONLY)
12 Months Pre‐Intake 12 Months Post‐Intake
Number Hospitalized
Average Number of Days per Year
Annual per‐Client Cost
Number Hospitalized
Average Number of Days per Year
Annual per‐Client Cost
CYF 31 111.8 $891.28 13 103.1 $405.27
TAY 56 210.7 $2,019.78 58 171.3 $1,229.43
Adults 187 274.4 $3,516.08 266 135.2 $3,604.03
Older Adults 41 206.6 $9,218.25 62 98.2 $7,056.68
Total 315 803.5 399 507.8
Table IV.3
Full Service Partnership Services – Total Annual Cost Offset for Number of Days Hospitalized – Acute Care Physical Health
(Fiscal Year 09‐10 New Enrollees ONLY)
Number of Days per Year
Decrease in Number of
Days Pre‐FSP Cost Post‐FSP Cost
Total Cost Offset
Total Cost Offset as % of Physical Health Costs in
FY 09‐10 12 Months Pre‐Intake
12 Months Post‐Intake
CYF 273 489 ‐216 $704,020.59 $1,261,047.87 $(557,027.28) ‐79.1%
TAY 1,753 577 1,176 $4,520,688.99 $1,487,984.91 $3,032,704.08 67.1%
Adults 5,991 3,668 2,323 $15,449,770.53 $9,459,148.44 $5,990,622.09 38.8%
Older Adults 575 834 ‐259 $1,482,827.25 $2,150,744.22 $(667,916.97) ‐45.0%
Total 8,592 5,568 3,024 $22,157,307.36 $14,358,925.44 $7,798,381.92 35.2%
Table IV.4
Full Service Partnership Services – Annualized per‐Client Cost Offset for Number of Days Hospitalized – Acute Care Physical Health
(Fiscal Year 09‐10 New Enrollees ONLY) 12 Months Pre‐Intake 12 Months Post‐Intake
Number Hospitalized
Average Number of Days per Year
Annual per‐Client Cost
Number Hospitalized
Average Number of Days per Year
Annual per‐Client Cost
CYF 44 55.7 $286.54 20 257.9 $513.25
TAY 87 330.6 $2,608.59 50 119.2 $858.62
Adults 211 328.4 $5,788.60 189 182.9 $3,544.08
Older Adults 46 205.1 $4,141.98 54 169.6 $6,007.67
Total 388 919.8 313 729.6

Draft Report – for Stakeholder Input
Full Service Partnerships: California’s Investment to Support Children and Transition‐Age Youth with Serious Emotional Disturbance and Adults and Older Adults with Severe Mental Illness
Page 38
c. Inpatient Psychiatric Hospitalization
Inpatient Psychiatric Hospitalization is defined as services provided in an acute psychiatric hospital or a distinct acute psychiatric part of a general hospital that is approved by the Department of Health Services to provide psychiatric services. Those services are medically necessary for diagnosis or treatment of a mental disorder in accordance with Section 1820.205.91
1. Statewide Acute (Physical Health) Inpatient Hospitalization Rate
The County Cost Report is the source for the rates applied by county for inpatient psychiatric hospitalization (please see below for the definition of included facilities). The Cost Report is a report submitted to the California Department of Mental Health every year, documenting everything that the county has spent on mental health. The Cost Report is used as the basis for the California Department of Mental Health’s reconciliation of all county mental health costs within a fiscal year. In essence, billing from disparate sources (e.g., MHSA, Medi‐Cal) is all reconciled and comes together in final form in the Cost Report. 92
The form within the County Cost Report from which we extracted each county’s inpatient psychiatric rate is MH1966_HOSPINPT. Specifically, we used the Cost per Unit row. For the Cost Report, inpatient psychiatric services are considered Mode 5 – Service Function 10‐18:
• Mode 05: 24‐Hour Mode of Service – Services designed to provide a therapeutic environment of care and treatment within a residential setting. Depending on the severity of mental disorder and the need for related medical care, treatment would be provided in one of a variety of settings.
We included only the following types of facilities from Short‐Doyle/Medi‐Cal Modes, included in Cost Reports and CSI Mode 05:
• 05 – Psychiatric Health Facility, Adult Crisis Residential or Adult Residential
• 07 – Inpatient Psychiatric Hospital Services of an acute care general hospital
A “statewide” rate was determined by calculating an average of the rates for counties that participated in this round of the study (see Appendix D for a list of counties that participated). 93
The Key Event Tracking Form does not indicate the specific facility in which an individual was hospitalized for psychiatric reasons – only that a psychiatric hospitalization occurred. Therefore, if a county has more than one hospital providing psychiatric hospitalization services, an average within the county was first calculated in order to arrive at a rate for each county. An average rate within a county means:
• The rate for each hospital identified for that county (per the Cost Report – see above for the definition of what hospitals were included) is entered into a formula, and then the average is calculated.
• However, if the average is higher than the Statewide Maximum Allowance, the rate defaulted to the Statewide Maximum Allowance.
91 From County Cost Reports, Service Functions 10‐18: Hospital Inpatient. 92 Through a process of negotiation with the California Department of Mental Health, eventually a final, reconciled version of the Cost Report is produced. 93 However, if the county rate was higher than the Statewide Maximum Allowance (SMA), the SMA rate was used.

Draft Report – for Stakeholder Input
Full Service Partnerships: California’s Investment to Support Children and Transition‐Age Youth with Serious Emotional Disturbance and Adults and Older Adults with Severe Mental Illness
Page 39
Not all counties (notably some small, rural counties) have a facility in which to hospitalize individuals for psychiatric reasons. Absent a written agreement with a neighboring county for said services, the Statewide Maximum Allowance was applied for such counties.
The statewide inpatient psychiatric hospitalization rate will be adjusted as additional counties participate in subsequent rounds of the study (see the final chapter on Next Steps).
Psychiatric Care – the daily hospital service cost centers related to the provision of psychiatric care, including Psychiatric Acute – Adult and Psychiatric Intensive (Isolation) Care.
2. DCR Variables Analyzed at Baseline & Follow‐Up
The Key Event Tracking Form94 does not indicate the specific facility in which an individual was hospitalized – only that an inpatient stay occurred for psychiatric reasons. Below are the exact variables we used out of the PAF and the KET, and their definitions. 95
• PAF (Intake/Baseline) Variable: PsychiatricHospital_PastTwelveDays 96– Defined as: o RESIDENTIAL INFORMATION: Hospital – Acute Psychiatric Hospital/Psychiatric Health Facility
(PHF); o Indicates the number of DAYS the partner has been living in this setting during the past 12
months; o Valid Codes: 0‐365
• KET (Follow‐Up) Variable: Current.1 through Current.155 = 23, which is a categorical variable assigned to represent Psychiatric Hospital.
o The Current variables represent the residential status of the FSP client at the time of each follow‐up.
o Follow‐ups (as documented on the KET) are not conducted according to any pre‐determined time frame, but rather are driven by Key Events occurring in the FSP client’s life (e.g., hospitalization, incarceration).
o The DCR allows for entry of up to 155 KETs.
A break in the discussion is in order here, to point out that this information, on its own, is insufficient to calculate the number of days that an FSP client was hospitalized for psychiatric reasons (not for physical health reasons – we addressed that in the previous section of this chapter). What the Current variable (code = 23) tells us is only that an FSP client was hospitalized for psychiatric reasons, not how many days.
So the challenge for the analysis was how to determine the number of days of psychiatric inpatient hospitalization, over 155 possible follow‐up points. This is the focus of the Calculations section that follows.
3. Calculations – Inpatient Psychiatric Hospitalization
Accompanying each Current variable is a DateResidentialChange variable. This variable tells us on what date the FSP client’s residential setting changed.
94 The Key Event Tracking Form is collected by counties and entered into the DCR. EMT receives the data only for analysis. 95 Courtesy of California State University, Sacramento, currently the contractor managing the DCR. 96 Page 79, DCR Data Dictionary Final_20110915. California State University, Sacramento.

Draft Report – for Stakeholder Input
Full Service Partnerships: California’s Investment to Support Children and Transition‐Age Youth with Serious Emotional Disturbance and Adults and Older Adults with Severe Mental Illness
Page 40
Therefore, we developed a long set of programming commands in SPSS that did the following for each KET follow‐up period:
1. Selected only those FSP clients who were hospitalized for psychiatric reasons: Current = 23 2. Calculated the number of days hospitalized by taking the subsequent DateResidentialChange and
subtracting the current DateResidentialChange. 3. After this process was repeated 155 times, the number of days hospitalized (psychiatric) was summed for
each FSP client to arrive at a grand total for each person. o The sum is necessary in order to account for subsequent stays that cross KET administrations, as
well as intermittent stays by the same person during FSP involvement. 4. We then took Days Enrolled and divided the figure into 365:
365 ‐‐‐‐‐‐
Days Enrolled
o Days Enrolled, when used in this formula, is not annualized. What we are interested in is the total period that an FSP client was enrolled. What we produce is a proportion, which is then applied against the Number of Days Hospitalized (psychiatric) in order to adjust for the period of time that a person was at risk for hospitalization. If we do not apply this adjustment, we would unfairly weight the results for or against people who were in the program for shorter or longer periods of time.
o Days Enrolled is therefore simply (you have seen these elements of the formula before, in Chapter III): 97
DatePartnershipStatusChange_KET – PartnershipDate98 5. The proportion calculated for each FSP client out of Step 4 is then multiplied by the sum of days
hospitalized (psychiatric) in Step 3. This is how we arrive at the number of days hospitalized (psychiatric), without a bias for length of enrollment.
4. Findings – Inpatient Psychiatric Hospitalization
Tables IV.5 through IV.8 present cost offsets for each of the age groups, in each fiscal year, for inpatient psychiatric hospitalization.
Table IV.5 represents FY 08‐09, and Table IV.7 FY 09‐10:
• 12 Months Pre‐Intake – the data displayed under any column marked “pre” correspond to those collected at baseline (refer back for the explanation about which variables we analyzed, and why).
• 12 Months Post‐Intake – the data displayed under any column marked “post” correspond to those collected in the follow‐up period (refer back for the explanation about which variables we analyzed, and why).
For baseline and follow‐up:
97 The only element missing from what was previously presented in Chapter III is the annualization factor (dividing it by 365). But it does not apply here – we are developing a proportion to be applied against number of days hospitalized. 98 Applying all of the caveats discussed in Chapter III, section c. Contextual Factors – Impact on Cost.
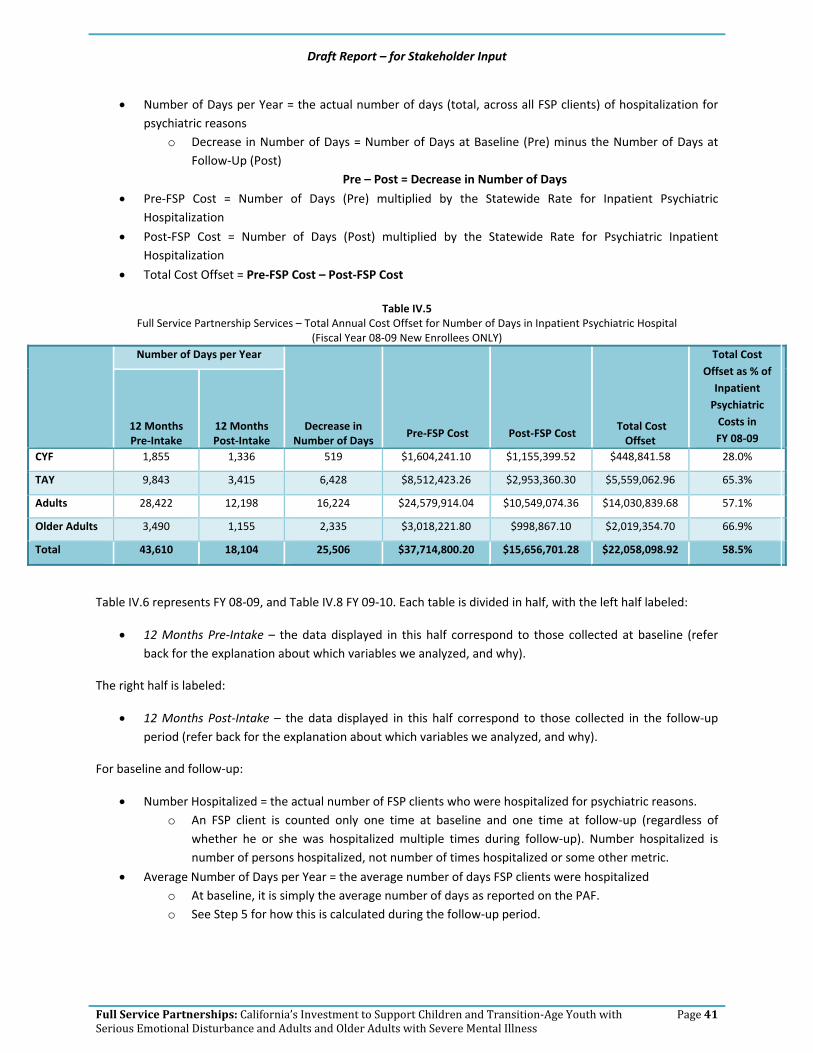
Draft Report – for Stakeholder Input
Full Service Partnerships: California’s Investment to Support Children and Transition‐Age Youth with Serious Emotional Disturbance and Adults and Older Adults with Severe Mental Illness
Page 41
• Number of Days per Year = the actual number of days (total, across all FSP clients) of hospitalization for psychiatric reasons
o Decrease in Number of Days = Number of Days at Baseline (Pre) minus the Number of Days at Follow‐Up (Post)
Pre – Post = Decrease in Number of Days
• Pre‐FSP Cost = Number of Days (Pre) multiplied by the Statewide Rate for Inpatient Psychiatric Hospitalization
• Post‐FSP Cost = Number of Days (Post) multiplied by the Statewide Rate for Psychiatric Inpatient Hospitalization
• Total Cost Offset = Pre‐FSP Cost – Post‐FSP Cost
Table IV.5 Full Service Partnership Services – Total Annual Cost Offset for Number of Days in Inpatient Psychiatric Hospital
(Fiscal Year 08‐09 New Enrollees ONLY)
Number of Days per Year
Decrease in Number of Days
Pre‐FSP Cost Post‐FSP Cost Total Cost Offset
Total Cost Offset as % of Inpatient Psychiatric Costs in FY 08‐09
12 Months Pre‐Intake
12 Months Post‐Intake
CYF 1,855 1,336 519 $1,604,241.10 $1,155,399.52 $448,841.58 28.0%
TAY 9,843 3,415 6,428 $8,512,423.26 $2,953,360.30 $5,559,062.96 65.3%
Adults 28,422 12,198 16,224 $24,579,914.04 $10,549,074.36 $14,030,839.68 57.1%
Older Adults 3,490 1,155 2,335 $3,018,221.80 $998,867.10 $2,019,354.70 66.9%
Total 43,610 18,104 25,506 $37,714,800.20 $15,656,701.28 $22,058,098.92 58.5%
Table IV.6 represents FY 08‐09, and Table IV.8 FY 09‐10. Each table is divided in half, with the left half labeled:
• 12 Months Pre‐Intake – the data displayed in this half correspond to those collected at baseline (refer back for the explanation about which variables we analyzed, and why).
The right half is labeled:
• 12 Months Post‐Intake – the data displayed in this half correspond to those collected in the follow‐up period (refer back for the explanation about which variables we analyzed, and why).
For baseline and follow‐up:
• Number Hospitalized = the actual number of FSP clients who were hospitalized for psychiatric reasons. o An FSP client is counted only one time at baseline and one time at follow‐up (regardless of
whether he or she was hospitalized multiple times during follow‐up). Number hospitalized is number of persons hospitalized, not number of times hospitalized or some other metric.
• Average Number of Days per Year = the average number of days FSP clients were hospitalized o At baseline, it is simply the average number of days as reported on the PAF. o See Step 5 for how this is calculated during the follow‐up period.

Draft Report – for Stakeholder Input
Full Service Partnerships: California’s Investment to Support Children and Transition‐Age Youth with Serious Emotional Disturbance and Adults and Older Adults with Severe Mental Illness
Page 42
• Annual per‐Client Cost = the total FSP cost for that time period (i.e., baseline or follow‐up) divided by the total number of new enrollees for the fiscal year
o See the discussion above Table IV.5 for calculation of total FSP cost.
Table IV.6 Full Service Partnership Services – Annualized per‐Client Cost Offset for Number of Days in Inpatient Psychiatric Hospital
(Fiscal Year 08‐09 New Enrollees ONLY) 12 Months Pre‐Intake 12 Months Post‐Intake
Number Hospitalized
Average Number of Days per Year
Annual per‐Client Cost
Number Hospitalized
Average Number of Days per Year
Annual per‐Client Cost
CYF 103 179.7 $1,040.36 93 192.8 $749.29
TAY 276 559.2 $6,371.57 186 271.3 $2,210.60
Adults 768 485.9 $8,851.25 558 480.7 $3,798.73
Older Adults 65 505.6 $8,383.95 38 248.1 $2,774.63
Total 1,212 1,730.4 875 1,192.8
Table IV.7
Full Service Partnership Services – Total Annual Cost Offset for Number of Days in Inpatient Psychiatric Hospital (Fiscal Year 09‐10 New Enrollees ONLY)
Number of Days per Year
Decrease in Number of
Days Pre‐FSP Cost Post‐FSP Cost
Total Cost Offset
Total Cost Offset as % of Inpatient
Psychiatric Costs in FY 09‐10
12 Months Pre‐Intake
12 Months Post‐Intake
CYF 2,933 2,165 768 $2,666,566.28 $1,968,331.40 $698,234.88 26.2%
TAY 11,047 5,023 6,024 $10,043,490.52 $4,566,710.68 $5,476,779.84 54.5%
Adults 38,499 16,490 22,009 $35,001,750.84 $14,992,048.40 $20,009,702.44 57.2%
Older Adults 3,959 1,659 2,300 $3,599,364.44 $1,508,296.44 $2,091,068.00 58.1%
Total 56,438 25,337 31,101 $51,311,172.08 $23,035,386.92 $28,275,785.16 55.1%
Table IV.8
Full Service Partnership Services – Annualized per‐Client Cost Offset for Number of Days in Inpatient Psychiatric Hospital (Fiscal Year 09‐10 New Enrollees ONLY)
12 Months Pre‐Intake 12 Months Post‐Intake
Number Hospitalized
Average Number of Days per Year
Annual per‐Client Cost
Number Hospitalized
Average Number of Days per Year
Annual per‐Client Cost
CYF 208 176.2 $1,085.29 124 95.2 $801.11
TAY 401 534.9 $5,795.44 194 619.8 $2,635.15
Adults 876 760.4 $13,114.18 552 503.1 $5,617.10
Older Adults 101 490.3 $10,054.09 57 234.4 $4,213.12
Total 1,586 1,961.8 927 1,452.5

Draft Report – for Stakeholder Input
Full Service Partnerships: California’s Investment to Support Children and Transition‐Age Youth with Serious Emotional Disturbance and Adults and Older Adults with Severe Mental Illness
Page 43
d. Skilled Nursing Facilities (NonPsychiatric)
A skilled nursing facility is a Medicare‐certified facility that provides skilled services such as overall management and evaluation of a patient care plan, ongoing assessment of rehabilitation needs, therapeutic exercises or activities, etc. 99
There is a distinction between the above and skilled nursing facilities that focus on psychiatric needs. For the purpose of this analysis, we are focusing on only the above. In the final report, we will include a separate analysis that addresses cost offsets for the following:
• Psychiatric skilled nursing facilities provide intervention for individuals requiring mental health treatment in a secured setting. The focus of these facilities is to stabilize psychiatric symptoms and treat medical conditions. 100
As you will read below, the DCR instruments also make a distinction between skilled nursing facilities focused on physical health needs (as distinguished from to psychiatric needs), as does the Office of Statewide Health Planning and Development (OSHPD), our “go‐to” source for statewide health‐related rates (needed to attach a cost to a day spent in a skilled nursing facility, for example).
1. Statewide Skilled Nursing Facility Rate (Non‐Psychiatric)
The Office of Statewide Health Planning and Development (OSHPD) is the source for the rates applied by county for skilled nursing facilities (non‐psychiatric). A “statewide” rate was calculated by averaging the rates for counties that participated in this round of the study (see Appendix D). The rate will be adjusted as additional counties participate in subsequent rounds of the study (see the final chapter on Next Steps).
The OSHPD data set (available for download from its website) includes all skilled nursing facilities in each county. The Key Event Tracking Form does not indicate the specific facility in which an individual was hospitalized – only that a stay in a skilled nursing facility occurred (the categorical code assigned tells us whether it was for psychiatric or non‐psychiatric reasons – refer back to the earlier sections on physical hospitalization and psychiatric hospitalization for a discussion about the KET and the use of categorical codes at follow‐up).
Therefore, if a county has more than one facility providing skilled nursing (non‐psychiatric) services, an average within the county was first calculated to arrive at a rate for each county.101 An average rate within a county means:
• The rate for each skilled nursing facility identified for that county (per OSHPD) are automatically tabulated and averaged in the OSHPD pivot table.
• OSHPD is able to distinguish between non‐psychiatric and psychiatric skilled nursing facility rates, thereby matching the DCR variable we analyzed (non‐psychiatric – please see below).
• We therefore downloaded the non‐psychiatric skilled nursing facility average rate from OSHPD.
99 http://www.medicareadvocacy.org/medicare‐info/skilled‐nursing‐facility‐snf‐services/ 100 http://www.dhhs.saccounty.net/BHS/Pages/Adult‐Mental‐Health/SP‐Psychiatric‐Skilled‐Nursing‐Facilities.aspx 101 The specific cell within the OSHPD Long Term Care pivot table is the profile tab, Health Care Expenses by Cost Center, Routine Services, Skilled Nursing, per Patient Day. http://www.oshpd.ca.gov/hid/Products/Hospitals/Utilization/Hospital_Utilization.html

Draft Report – for Stakeholder Input
Full Service Partnerships: California’s Investment to Support Children and Transition‐Age Youth with Serious Emotional Disturbance and Adults and Older Adults with Severe Mental Illness
Page 44
2. DCR Variables Analyzed at Baseline & Follow‐Up
Below are the exact variables we used out of the PAF and the KET, and their definitions. 102
• PAF (Intake/Baseline) Variable: NursingPhysical_PastTwelveDays 103– Defined as: o RESIDENTIAL INFORMATION: Skilled nursing facility (physical); o Indicates the number of DAYS the partner has been living in this setting during the past 12
months; o Valid Codes: 0‐365
• KET (Follow‐Up) Variable: Current.1 through Current.155 = 25, which is a categorical variable assigned to represent Skilled Nursing Facility (Physical).
o The Current variables represent the residential status of the FSP client at the time of each follow‐up.
o Follow‐ups (as documented on the KET) are not conducted according to any pre‐determined time frame, but rather are driven by Key Events occurring in the FSP client’s life (e.g., hospitalization, incarceration).
o The DCR allows for entry of up to 155 KETs.
This information, on its own, is insufficient to calculate the number of days that an FSP client was in a skilled nursing facility (physical; not for psychiatric reasons – we will address that in the final report – see Chapter V, Next Steps). What the Current variable (code = 25) tells us is only that an FSP client was in a skilled nursing facility for physical health reasons, not how many days.
So the challenge for the analysis was how to determine the number of days in a skilled nursing facility for physical health reasons, over 155 possible follow‐up points. This is the focus of the Calculations section that follows.
3. Calculations – Skilled Nursing Facility (Physical Health)
Accompanying each Current variable is a DateResidentialChange variable. This variable tells us on what date the client’s residential setting changed.
Therefore, we developed a long set of programming commands in SPSS that did the following for each KET follow‐up period:
1. Selected only those FSP clients who were in a skilled nursing facility for physical health reasons: Current = 25
2. Calculated the number of days in skilled nursing for physical health reasons by taking the subsequent DateResidentialChange and subtracting the current DateResidentialChange
3. After this process was repeated 155 times, the number of days in a skilled nursing facility (physical health) was summed for each FSP client to arrive at a grand total for each person.
o The sum is necessary in order to account for subsequent stays that cross KET administrations, as well as intermittent stays by the same person during his or her FSP involvement.
4. We then took Days Enrolled and divided the figure into 365:
102 Courtesy of California State University, Sacramento, currently the contractor managing the DCR. 103 Page 85, DCR Data Dictionary Final_20110915. California State University, Sacramento.
Draft Report – for Stakeholder Input
Full Service Partnerships: California’s Investment to Support Children and Transition‐Age Youth with Serious Emotional Disturbance and Adults and Older Adults with Severe Mental Illness
Page 45
365 ‐‐‐‐‐‐
Days Enrolled
o Days Enrolled, when used in this formula, is not annualized. What we are interested in is the total period in which an FSP client was enrolled. What we produce is a proportion, which is then applied against the Number of Days in Skilled Nursing Facility (physical health) in order to adjust for the period of time that a person was at risk for stay in a skilled nursing facility for physical health reasons. If we do not apply this adjustment, we would unfairly weight the results for or against people who were in the program for shorter or longer periods of time.
o Days Enrolled is therefore simply (you have seen these elements of the formula before, in Chapter III): 104
DatePartnershipStatusChange_KET – PartnershipDate105 5. The proportion calculated for each FSP client out of Step 4 is then multiplied by the sum of days in a
skilled nursing facility (physical health reasons) in Step 3. This is how we arrive at the number of days in a skilled nursing facility (physical health reasons), without a bias for length of enrollment.
4. Findings – Skilled Nursing Facility (Physical Health)
Tables IV.9 through IV.12 present cost offsets for each of the age groups, in each fiscal year, for inpatient psychiatric hospitalization.
Table IV.9 represents FY 08‐09, and Table IV.11 FY 09‐10:
• 12 Months Pre‐Intake – the data displayed under any column marked “pre” correspond to those collected at baseline (refer back for the explanation about which variables we analyzed, and why).
• 12 Months Post‐Intake – the data displayed under any column marked “post” correspond to those collected in the follow‐up period (refer back for the explanation about which variables we analyzed, and why).
For baseline and follow‐up:
• Number of Days per Year = the actual number of days (total, across all FSP clients) in a skilled nursing facility for physical health reasons
o Decrease in Number of Days = Number of Days at Baseline (Pre) minus the Number of Days at Follow‐Up (Post)
Pre – Post = Decrease in Number of Days
• Pre‐FSP Cost = Number of Days (Pre) multiplied by the Statewide Rate for Skilled Nursing Facility (Physical Health)
• Post‐FSP Cost = Number of Days (Post) multiplied by the Statewide Rate for Skilled Nursing Facility (Physical Health)
• Total Cost Offset = Pre‐FSP Cost – Post‐FSP Cost
104 The only element missing from what was previously presented in Chapter III is the annualization factor (dividing it by 365). But it does not apply here – we are developing a proportion to be applied against number of days hospitalized. 105 Applying all of the caveats discussed in Chapter III, section c. Contextual Factors – Impact on Cost.

Draft Report – for Stakeholder Input
Full Service Partnerships: California’s Investment to Support Children and Transition‐Age Youth with Serious Emotional Disturbance and Adults and Older Adults with Severe Mental Illness
Page 46
Table IV.9
Full Service Partnership Services – Total Annual Cost Offset for Number of Days in Skilled Nursing Facility Physical Health
(Fiscal Year 08‐09 New Enrollees ONLY)
Number of Days per Year
Decrease in Number of Days
Pre‐FSP Cost Post‐FSP Cost Total Cost Offset
Total Cost Offset as % of Skilled
Nursing (Physical Health) Costs in
FY 08‐09 12 Months Pre‐Intake
12 Months Post‐Intake
CYF 0 0 0 0 0 ‐‐ ‐‐
TAY 14 36 ‐22 1,149.12 2,954.99 (1,805.76) ‐157.1%
Adults 1,731 994 737 142,080.48 81,587.52 60,492.96 42.6%
Older Adults 1,611 535 1,076 132,230.88 43,912.80 88,318.08 66.8%
Total 3,356 1,565 1,791 275,460.48 128,455.20 147,005.28 53.4%
Table IV.10 represents FY 08‐09, and Table IV.12 FY 09‐10. Each table is divided in half, with the left half labeled:
• 12 Months Pre‐Intake – the data displayed in this half correspond to those collected at baseline (refer back for the explanation about which variables we analyzed, and why).
The right half is labeled:
• 12 Months Post‐Intake – the data displayed in this half correspond to those collected in the follow‐up period (refer back for the explanation about which variables we analyzed, and why).
For baseline and follow‐up:
• Number in Skilled Nursing Facility = the actual number of FSP clients who were in a skilled nursing facility for physical health reasons
o An FSP client is counted only one time at baseline and one time at follow‐up (regardless of whether he or she was in a skilled nursing facility multiple times during follow‐up). Number in Skilled Nursing Facility is number of persons in a skilled nursing facility, not number of times in a skilled nursing facility or some other metric.
• Average Number of Days per Year = the average number of days FSP clients were in a skilled nursing facility.
o At baseline, it is simply the average number of days as reported on the PAF. o See Step 5 for how this is calculated during the follow‐up period.
• Annual per‐Client Cost = the total FSP cost for that time period (i.e., baseline or follow‐up) divided by the total number of new enrollees for the fiscal year
o See the discussion above Table IV.9 for calculation of total FSP cost.

Draft Report – for Stakeholder Input
Full Service Partnerships: California’s Investment to Support Children and Transition‐Age Youth with Serious Emotional Disturbance and Adults and Older Adults with Severe Mental Illness
Page 47
Table IV.10 Full Service Partnership Services – Annualized per‐Client Cost Offset for Number of Days in Skilled Nursing Facility
Physical Health (Fiscal Year 08‐09 New Enrollees ONLY)
12 Months Pre‐Intake 12 Months Post‐Intake
Number in Skilled Nursing
Facility Average Number of Days per Year
Annual per‐Client Cost
Number Hospitalized
Average Number of Days per Year
Annual per‐Client Cost
CYF 0 0.0 0 0 0.0 0
TAY 1 14.0 $0.86 2 35.7 $2.21
Adults 18 246.5 $51.16 33 157.3 $29.38
Older Adults 19 857.2 $367.31 18 139.1 $121.98
Total 38 1,117.7 53 332.1
Table IV.11
Full Service Partnership Services – Total Annual Cost Offset for Number of Days in Skilled Nursing Facility Physical Health
(Fiscal Year 09‐10 New Enrollees ONLY)
Number of Days per Year
Decrease in Number of
Days Pre‐FSP Cost Post‐FSP Cost
Total Cost Offset
Total Cost Offset as % of Skilled
Nursing (Physical Health) Costs in
FY 09‐10 12 Months Pre‐Intake
12 Months Post‐Intake
CYF 0 0 0 0 0 ‐‐ ‐‐
TAY 10 0 10 $815.00 0 $815.00 100.0%
Adults 1,428 1,231 197 $116,382.00 $100,326.50 $16,055.50 13.8%
Older Adults 1,444 575 869 $117,686.00 $46,862.50 $70,823.50 60.2%
Total 2,882 1,806 1,076 $234,883.00 $147,189.00 $87,694.00 37.3%
Table IV.12
Full Service Partnership Services – Annualized per‐Client Cost Offset for Number of Days in Skilled Nursing Facility Physical Health
(Fiscal Year 09‐10 New Enrollees ONLY) 12 Months Pre‐Intake 12 Months Post‐Intake
Number in Skilled Nursing
Facility Average Number of Days per Year
Annual per‐Client Cost
Number Hospitalized
Average Number of Days per Year
Annual per‐Client Cost
CYF 0 0.0 0 0 0.0 0
TAY 1 10.0 $.31 0 0.0 0
Adults 18 453.0 $43.61 23 408.7 $37.59
Older Adults 18 500.3 $328.73 17 240.4 $130.90
Total 37 963.3 40 649.1

Draft Report – for Stakeholder Input
Full Service Partnerships: California’s Investment to Support Children and Transition‐Age Youth with Serious Emotional Disturbance and Adults and Older Adults with Severe Mental Illness
Page 48
e. Incarceration
Incarceration in four different types of facilities is presented in this section. Because the methodology is nearly identical, we present the discussion of rates, variables and calculations at the beginning of the section, followed by the findings.
Although we recognize that the methodology is complex, it is our assumption that, after seeing the calculations explained in the three previous sections (inpatient acute physical health hospitalization, inpatient psychiatric hospitalization, and skilled nursing facilities – physical health), familiarity allows us to group the incarceration variables together, and thereby avoid needless repetition.
Incarceration in the four facilities includes:
• Division of Juvenile Justice
• Juvenile Hall/Camp
• Jail
• Prison
1. Statewide Incarceration Rates
In this section, we present each of the sources for obtaining incarceration rates for the four facilities ‐
• Division of Juvenile Justice
• Juvenile Hall/Camp
• County Jail
• State Prison
Depending upon the source, additional calculations were conducted in order to arrive at a statewide average.
Division of Juvenile Justice The Division of Juvenile Justice provides education and treatment to California youth 12 to 25 years of age who have serious criminal backgrounds and exhibit the need for intensive treatment. Treatment programs can address such needs as violent and criminal behavior, sex offender behavior, and substance abuse and mental health issues.106
The Division of Juvenile Justice (DJJ) costs were divided by 365 to get the cost per day, as costs listed were the average annual cost per ward.107 This calculation results in an annualized rate.
106 http://www.cdcr.ca.gov/juvenile_justice/index.html 107 FY 2008‐2009 ‐Department of Finance. (2009) Corrections and Rehabilitation. 5225 Department of Corrections and Rehabilitation, California Budget 2009‐10. Sacramento, CA: State of California, Department of Finance FY 2009‐2010 ‐ California Correctional Peace Officers Association http://www.ccpoa.org/issues/ccpoa_on_prison_reform#juvenile‐justice

Draft Report – for Stakeholder Input
Full Service Partnerships: California’s Investment to Support Children and Transition‐Age Youth with Serious Emotional Disturbance and Adults and Older Adults with Severe Mental Illness
Page 49
Juvenile Halls and Camps Juvenile Halls and Camps (JHC) 108 provide secure detention and confinement to delinquent minors from 8 to 18 years of age who are awaiting adjudication and disposition. Camps also provide rehabilitative treatment, care and custody of minors who are wards of Juvenile Court. 109
The average daily cost survey contains the average daily population and average daily cost for Juvenile Halls and Camps as reported by the Probation Department for each county. Juvenile Hall rates are reported independently from the Camp rates in the Average Daily Cost Survey. 110 DCR data do not distinguish between Juvenile Halls or Camps, and so the rates from the Average Daily Cost Survey (completed by the California Department of Corrections) were averaged to get a combined rate. 111
Jail A Type II facility is a local detention facility that detains persons awaiting arraignment, post‐arraignment, and during the trial and sentencing period. A Type III facility is a local facility that detains convicted and sentenced persons. 112
The California Department of Corrections and Rehabilitation – Corrections Standards Authority (CSA) was the source for county jail costs. Specifically, the average cost per day was used as the rate. 113
Prison For FY 08‐09, the prison rate was obtained directly from the LAO (Legislative Analyst’s Office) Annual Costs to Incarcerate an Inmate in Prison for California on the Criminal Justice and Judiciary FAQ page. 114 The total line item was then divided by 365 to obtain the average cost per day. This calculation results in an annualized rate.
The prison rate for FY09‐10 was taken from the Key Facts section of page 17 in the DOF’s (Department of Finance) 2010‐11 Supplementary Budget Summary. 115 Although the document summarizes projected budget solutions for 2010‐11, the average cost presented is consistent with other reports/articles from various news outlets.
108 California Department of Corrections and Rehabilitation – Corrections Standards Authority (CSA): Average Cost Per Day – Juvenile Halls and Camps http://www.cdcr.ca.gov/csa/FSO/Average_Daily_Cost_Survey.html 109 http://www.laalmanac.com/crime/cr39.htm 110 California Department of Corrections and Rehabilitation – Corrections Standards Authority (CSA): Average Cost Per Day – Juvenile Halls and Camps http://www.cdcr.ca.gov/csa/FSO/Average_Daily_Cost_Survey.html 111 Not every county has both type of facility. CDCR is exact in their cost calculations, and only provides a daily cost for the exact type of facility in each county (i.e., daily cost is matched to a specific facility, and the exact number of individuals incarcerated during the year is accounted for). When creating an average cost per county, we only included the actual facilities operating in each county. For some counties, this will include juvenile halls and camps. For other counties, this will include just juvenile hall or just camp. For details on what type of facility each county operates, please follow the link below and look up the specific county you are interested in. California Department of Corrections and Rehabilitation – Corrections Standards Authority (CSA): Average Cost Per Day – Juvenile Halls and Camps http://www.cdcr.ca.gov/csa/FSO/Average_Daily_Cost_Survey.html 112 http://www.cdcr.ca.gov/CSA/FSO/Docs/6_2008%20Adult_T_24_FINAL_REGULATION_TEXT.pdf 113 Average Cost Per Day Type II and III Jails – http://www.cdcr.ca.gov/csa/FSO/Average_Daily_Cost_Survey.html 114 http://www.lao.ca.gov/laoapp/laomenus/sections/crim_justice/6_cj_inmatecost.aspx?catid=3 115 http://www.dof.ca.gov/budget/historical/2010‐11/governors/documents/Supplementary_Budget_Summary.pdf

Draft Report – for Stakeholder Input
Full Service Partnerships: California’s Investment to Support Children and Transition‐Age Youth with Serious Emotional Disturbance and Adults and Older Adults with Severe Mental Illness
Page 50
2. DCR Variables Analyzed at Baseline & Follow‐Up
Below are the exact variables we used out of the PAF and the KET, and their definitions. 116
Division of Juvenile Justice • PAF (Intake/Baseline) Variable: DJJ_PastTwelveDays 117– Defined as:
o RESIDENTIAL INFORMATION: Justice Placement – Division of Juvenile Justice; o Indicates the number of DAYS the partner has been living in this setting during the past 12
months; o Valid Codes: 0‐365
• KET (Follow‐Up) Variable: Current.1 through Current.155 = 16, which is a categorical variable assigned to represent Division of Juvenile Justice.
o The Current variables represent the residential status of the FSP client at the time of each follow‐up.
o Follow‐ups (as documented on the KET) are not conducted according to any pre‐determined time frame, but rather are driven by Key Events occurring in the FSP client’s life (e.g., hospitalization, incarceration).
o The DCR allows for entry of up to 155 KETs.
This information, on its own, is insufficient to calculate the number of days that an FSP client was in a Division of Juvenile Justice facility. What the Current variable (code = 16) tells us is only that an FSP client was in a Division of Juvenile Justice facility, not how many days.
Juvenile Halls and Camps • PAF (Intake/Baseline) Variable: JuvenileHall/Camp_PastTwelveDays 118– Defined as:
o RESIDENTIAL INFORMATION: Justice Placement – Juvenile Hall / Camp / Ranch; o Indicates the number of DAYS the partner has been living in this setting during the past 12
months; o Valid Codes: 0‐365
• KET (Follow‐Up) Variable: Current.1 through Current.155 = 15, which is a categorical variable assigned to represent Juvenile Hall/Camp. 119
o The Current variables represent the residential status of the FSP client at the time of each follow‐up.
o Follow‐ups (as documented on the KET) are not conducted according to any pre‐determined time frame, but rather are driven by Key Events occurring in the FSP client’s life (e.g., hospitalization, incarceration).
o The DCR allows for entry of up to 155 KETs.
116 Courtesy of California State University, Sacramento, currently the contractor managing the DCR. 117 Page 88, DCR Data Dictionary Final_20110915. California State University, Sacramento. There have been multiple releases of the DCR, and at least two in 2011 marked “Final.” This version will be provided upon request. 118 Page 88, DCR Data Dictionary Final_20110915. California State University, Sacramento. There have been multiple releases of the DCR, and at least two in 2011 marked “Final.” This version will be provided upon request. 119 California Department of Corrections and Rehabilitation – Corrections Standards Authority (CSA): Average Cost Per Day – Juvenile Halls and Camps http://www.cdcr.ca.gov/csa/FSO/Average_Daily_Cost_Survey.html
Draft Report – for Stakeholder Input
Full Service Partnerships: California’s Investment to Support Children and Transition‐Age Youth with Serious Emotional Disturbance and Adults and Older Adults with Severe Mental Illness
Page 51
This information, on its own, is insufficient to calculate the number of days that an FSP client was in a Juvenile Hall or a Juvenile Camp. What the Current variable (code = 15) tells us is only that an FSP client was in Juvenile Hall/Camp, not how many days.
Jail • PAF (Intake/Baseline) Variable: Jail_PastTwelveDays 120– Defined as:
o RESIDENTIAL INFORMATION: Justice Placement – Jail; o Indicates the number of DAYS the partner has been living in this setting during the past 12
months; o Valid Codes: 0‐365
• KET (Follow‐Up) Variable: Current.1 through Current.155 = 27, which is a categorical variable assigned to represent Jail. 121
o The Current variables represent the residential status of the FSP at the time of each follow‐up. o Follow‐ups (as documented on the KET) are not conducted according to any pre‐determined time
frame, but rather are driven by Key Events occurring in the FSP client’s life (e.g., hospitalization, incarceration).
o The DCR allows for entry of up to 155 KETs.
This information, on its own, is insufficient to calculate the number of days that an FSP client was in jail. What the Current variable (code = 27) tells us is only that an FSP client was in jail, not how many days.
Prison • PAF (Intake/Baseline) Variable: Prison_PastTwelveDays 122 – Defined as:
o RESIDENTIAL INFORMATION: Justice Placement – Prison; o Indicates the number of DAYS the partner has been living in this setting during the past 12
months; o Valid Codes: 0‐365
• KET (Follow‐Up) Variable: Current.1 through Current.155 = 26, which is a categorical variable assigned to represent Prison.123
o The Current variables represent the residential status of the FSP client at the time of each follow‐up.
o Follow‐ups (as documented on the KET) are not conducted according to any pre‐determined time frame, but rather are driven by Key Events occurring in the FSP client’s life (e.g., hospitalization, incarceration).
o The DCR allows for entry of up to 155 KETs/
This information, on its own, is insufficient to calculate the number of days that an FSP client was in prison. What the Current variable (code = 26) tells us is only that an FSP client was in prison, not how many days.
120 Page 89, DCR Data Dictionary Final_20110915. California State University, Sacramento. There have been multiple releases of the DCR, and at least two in 2011 marked “Final.” This version will be provided upon request. 121 http://www.cdcr.ca.gov/CSA/FSO/Docs/6_2008%20Adult_T_24_FINAL_REGULATION_TEXT.pdf 122 Page 90, DCR Data Dictionary Final_20110915. California State University. Sacramento. There have been multiple releases of the DCR, and at least two in 2011 marked “Final.” This version will be provided upon request. 123 http://www.lao.ca.gov/laoapp/laomenus/sections/crim_justice/6_cj_inmatecost.aspx?catid=3

Draft Report – for Stakeholder Input
Full Service Partnerships: California’s Investment to Support Children and Transition‐Age Youth with Serious Emotional Disturbance and Adults and Older Adults with Severe Mental Illness
Page 52
3. Calculations – Incarceration
Accompanying each Current variable is a DateResidentialChange variable. This variable tells us on what date the FSP client’s residential setting changed.
Therefore, we developed a long set of programming commands in SPSS that did the following for each KET follow‐up period:
1. Selected only those FSP clients who were incarcerated. As noted previously, these calculations were conducted separately for each of the incarceration categories.
2. Calculated the number of days in each incarceration category by taking the subsequent DateResidentialChange and subtracting the current DateResidentialChange
3. After this process was repeated 155 times (again, separately for each incarceration category), the number of days in each incarceration category was summed for each FSP client to arrive at a grand total for each person in each of the four categories.
o The sum is necessary in order to account for subsequent stays that cross KET administrations, as well as intermittent stays by the same person during his or her FSP involvement.
4. We then took Days Enrolled and divided the figure into 365:
365 ‐‐‐‐‐‐
Days Enrolled
o Days Enrolled, when used in this formula, is not annualized. What we are interested in is the total period in which an FSP client was enrolled. What we produce is a proportion, which is then applied against the Number of Days in each incarceration category (again, each of the steps we are laying out is run separately for each category, as you will see from the separate tables we display later in this section) in order to adjust for the period of time that a person was at risk for incarceration. If we do not apply this adjustment, we would unfairly weight the results for or against people who were in the program for shorter or longer periods of time.
o Days Enrolled is therefore simply (you have seen these elements of the formula before, in Chapter III): 124
DatePartnershipStatusChange_KET – PartnershipDate125 5. The proportion calculated for each FSP client out of Step 4 is then multiplied by the sum of days
incarcerated (separate for each facility) in Step 3. This is how we arrive at the number of days in incarceration for each facility, without a bias for length of enrollment.
4. Findings – Incarceration
Division of Juvenile Justice Tables IV.13 through IV.16 present Cost Offsets for each of the age groups, in each fiscal year, for the Division of Juvenile Justice.
Table IV.13 represents FY 08‐09, and Table IV.15 FY 09‐10:
124 The only element missing from what was previously presented in Chapter III is the annualization factor (dividing it by 365). But it does not apply here – we are developing a proportion to be applied against number of days hospitalized. 125 Applying all of the caveats discussed in Chapter III, section c. Contextual Factors – Impact on Cost.

Draft Report – for Stakeholder Input
Full Service Partnerships: California’s Investment to Support Children and Transition‐Age Youth with Serious Emotional Disturbance and Adults and Older Adults with Severe Mental Illness
Page 53
• 12 Months Pre‐Intake – the data displayed under any column marked “pre” correspond to those collected at baseline (refer back to the discussion earlier in the chapter for the explanation about which variables we analyzed, and why).
• 12 Months Post‐Intake – the data displayed under any column marked “post” correspond to those collected in the follow‐up period (refer back to the discussion earlier in this chapter for the explanation about which variables we analyzed, and why).
For baseline and follow‐up:
• Number of Days per Year = the actual number of days (total, across all FSP clients) in a DJJ facility o Decrease in Number of Days = Number of Days at Baseline (Pre) minus the Number of Days at
Follow‐Up (Post). Pre – Post = Decrease in Number of Days
• Pre‐FSP Cost = Number of Days (Pre) multiplied by the Statewide Rate for DJJ
• Post‐FSP Cost = Number of Days (Post) multiplied by the Statewide Rate for DJJ
• Total Cost Offset = Pre‐FSP Cost – Post‐FSP Cost
Table IV.13 Full Service Partnership Services – Total Annual Cost Offset for Number of Days in Division of Juvenile Justice Facility
(Fiscal Year 08‐09 New Enrollees ONLY)
Number of Days per Year Decrease in Number of
Days Pre‐FSP Cost
Post‐FSP
Cost
Total Cost
Offset
Total Cost Offset as % of DJJ Costs in FY 08‐09
12 Months Pre‐Intake
12 Months Post‐Intake
CYF 750 122 628 $480,885.00 $78,223.96 $402,661.04 83.7%
TAY 2,018 104 1,914 $1,293,901.24 $66,682.72 $1,227,218.52 94.8%
Adults 0 0 0 0 0 ‐‐ ‐‐
Older Adults 0 0 0 0 0 ‐‐ ‐‐
Total 2,768 226 2,542 $1,774,786.24 $144,906.68 $1,629,879.56 91.8%
Table IV.14 represents FY 08‐09, and Table IV.16 FY 09‐10. Each table is divided in half, with the left half labeled:
• 12 Months Pre‐Intake – the data displayed in this half correspond to those collected at baseline (refer back for the explanation about which variables we analyzed, and why).
The right half is labeled:
• 12 Months Post‐Intake – the data displayed in this half correspond to those collected in the follow‐up period (refer back for the explanation about which variables we analyzed, and why).
For baseline and follow‐up:
• Number Incarcerated = the actual number of FSP clients who were in a DJJ facility o An FSP client is counted only one time at baseline and one time at follow‐up (regardless of
whether he or she was in a DJJ facility multiple times during follow‐up). Number Incarcerated is number of persons in a DJJ facility, not number of times in a DJJ facility or some other metric.
• Average Number of Days per Year = the average number of days FSP clients were in a DJJ facility.

Draft Report – for Stakeholder Input
Full Service Partnerships: California’s Investment to Support Children and Transition‐Age Youth with Serious Emotional Disturbance and Adults and Older Adults with Severe Mental Illness
Page 54
o At baseline, it is simply the average number of days as reported on the PAF. o See Step 5 for how this is calculated during the follow‐up period.
• Annual per‐Client Cost = the total FSP cost for that time period (i.e., baseline or follow‐up) divided by the total number of new enrollees for the fiscal year
o See the discussion above the previous table for calculation of total FSP cost. Table IV.14
Full Service Partnership Services – Annualized per‐Client Cost Offset for Number of Days in Division of Juvenile Justice Facility (Fiscal Year 08‐09 New Enrollees ONLY)
12 Months Pre‐Intake 12 Months Post‐Intake
Number Incarcerated
Average Number of Days per Year
Annual per‐Client Cost
Number Incarcerated
Average Number of Days per Year
Annual per‐Client Cost
CYF 4 473.3 $311.86 4 122.9 $50.73
TAY 15 713.1 $968.49 2 103.2 0
Adults 0 0.0 0 0 0.0 0
Older Adults 0 0.0 0 0 0.0 0
Total 19 1,186.4 6 226.1
Table IV.15
Full Service Partnership Services – Total Annual Cost Offset for Number of Days in Division of Juvenile Justice Facility (Fiscal Year 09‐10 New Enrollees ONLY)
Number of Days per Year Decrease in Number of
Days Pre‐FSP Cost Post‐FSP Cost
Total Cost Offset
Total Cost Offset as % of DJJ Costs
in FY 09‐10
12 Months Pre‐Intake
12 Months Post‐Intake
CYF 201 4 197 $132,163.53 $2,630.12 $129,533.41 98.0%
TAY 1,240 7 1,233 $815,337.20 $4,602.71 $810,734.49 99.4%
Adults 0 0 0 0 0 ‐‐ ‐‐
Older Adults 0 0 0 0 0 ‐‐ ‐‐
Total 1,441 11 1,430 $947,500.73 $7,232.83 $940,267.90 99.2%
Table IV.16
Full Service Partnership Services – Annualized per‐Client Cost Offset for Number of Days in Division of Juvenile Justice Facility (Fiscal Year 09‐10 New Enrollees ONLY)
12 Months Pre‐Intake 12 Months Post‐Intake
Number Incarcerated
Average Number of Days per Year
Annual per‐Client Cost
Number Incarcerated
Average Number of Days per Year
Annual per‐Client Cost
CYF 6 102.5 $53.79 1 4.0 $1.07
TAY 16 355.2 $470.48 3 3.8 $2.66
Adults 0 0.0 0 0 0.0 0
Older Adults 0 0.0 0 0 0.0 0
Total 22 457.7 4 7.8

Draft Report – for Stakeholder Input
Full Service Partnerships: California’s Investment to Support Children and Transition‐Age Youth with Serious Emotional Disturbance and Adults and Older Adults with Severe Mental Illness
Page 55
Juvenile Halls and Camps Tables IV.17 through IV.20 present cost offsets for each of the age groups, in each fiscal year, for Juvenile Halls and Camps.
Table IV.17 represents FY 08‐09, and Table IV.19 FY 09‐10:
• 12 Months Pre‐Intake – the data displayed under any column marked “pre” correspond to those collected at baseline (refer back to the discussion earlier in the chapter for the explanation about which variables we analyzed, and why).
• 12 Months Post‐Intake – the data displayed under any column marked “post” correspond to those collected in the follow‐up period (refer back to the discussion earlier in this chapter for the explanation about which variables we analyzed, and why).
For baseline and follow‐up:
• Number of Days per Year = the actual number of days (total, across all FSP clients) in a Juvenile Hall and/or Camp
o Decrease in Number of Days = Number of Days at Baseline (Pre) minus the Number of Days at Follow‐Up (Post)
Pre – Post = Decrease in Number of Days
• Pre‐FSP Cost = Number of Days (Pre) multiplied by the Statewide Rate for Juvenile Halls/Camps
• Post‐FSP Cost = Number of Days (Post) multiplied by the Statewide Rate for Juvenile Halls/Camps
• Total Cost Offset = Pre‐FSP Cost – Post‐FSP Cost
Table IV.17 Full Service Partnership Services – Total Annual Cost Offset for Number of Days in Juvenile Hall/Camp
(Fiscal Year 08‐09 New Enrollees ONLY)
Number of Days per Year Decrease in Number of
Days Pre‐FSP Cost Post‐FSP Cost
Total Cost Offset
Total Cost Offset as % of Juvenile
Hall/Camp Costs in FY 08‐09
12 Months Pre‐Intake
12 Months Post‐Intake
CYF 3,764 3,374 390 $1,001,788.60 $897,990.10 $103,798.50 10.4%
TAY 10,845 2,087 8,758 $2,886,396.75 $555,455.05 $2,330,941.70 80.8%
Adults 0 0 0 0 0 ‐‐ ‐‐
Older Adults 0 0 0 0 0 ‐‐ ‐‐
Total 14,609 5,461 9,148 $3,888,185.35 $1,453,445.15 $2,434,740.20 62.2%
Table IV.18 represents FY 08‐09, and Table IV.20 FY 09‐10. Each table is divided in half, with the left half labeled:
• 12 Months Pre‐Intake – the data displayed in this half correspond to those collected at baseline (refer back for the explanation about which variables we analyzed, and why).
The right half is labeled:
• 12 Months Post‐Intake – the data displayed in this half correspond to those collected in the follow‐up period (refer back for the explanation about which variables we analyzed, and why).
For baseline and follow‐up:

Draft Report – for Stakeholder Input
Full Service Partnerships: California’s Investment to Support Children and Transition‐Age Youth with Serious Emotional Disturbance and Adults and Older Adults with Severe Mental Illness
Page 56
• Number Incarcerated = the actual number of FSP clients who were in a Juvenile Hall and/ or Camp o An FSP client is counted only one time at baseline and one time at follow‐up (regardless of
whether he or she was in a Juvenile Hall and/or Camp multiple times during follow‐up). Number Incarcerated is number of persons in Juvenile Hall/Camp, not number of times in Juvenile Hall/Camp or some other metric.
• Average Number of Days per Year = the average number of days FSP clients were in Juvenile Hall/Camp o At baseline, it is simply the average number of days as reported on the PAF. o See Step 5 for how this is calculated during the follow‐up period.
• Annual Per Client Cost = the total FSP cost for that time period (i.e., baseline or follow‐up) divided by the total number of new enrollees for the fiscal year
o See the discussion above the previous table for calculation of total FSP cost.
Table IV.18 Full Service Partnership Services – Annualized per‐Client Cost Offset for Number of Days in Juvenile Hall/Camp
(Fiscal Year 08‐09 New Enrollees ONLY) 12 Months Pre‐Intake 12 Months Post‐Intake
Number Incarcerated
Average Number of Days per Year
Annual per‐Client Cost
Number Incarcerated
Average Number of Days per Year
Annual per‐Client Cost
CYF 71 675.7 $649.67 64 767.6 $582.35
TAY 108 1,272.5 $2,160.48 48 403.4 $415.76
Adults 0 0.0 0 0 0.0 0
Older Adults 0 0.0 0 0 0.0 0
Total 179 1,948.2 112 1,171.0
Table IV.19
Full Service Partnership Services – Total Annual Cost Offset for Number of Days in Juvenile Hall/Camp (Fiscal Year 09‐10 New Enrollees ONLY)
Number of Days per Year Decrease in Number of
Days Pre‐FSP Cost Post‐FSP Cost
Total Cost Offset
Total Cost Offset as % of Juvenile
Hall/Camp Costs in FY 09‐10
12 Months Pre‐Intake
12 Months Post‐Intake
CYF 6,319 3,518 2,801 $1,681,801.85 $936,315.70 $745,486.15 44.3%
TAY 17,231 2,492 14,739 $4,586,030.65 $663,245.80 $3,922,784.85 85.5%
Adults 0 0 0 0 0 ‐‐ ‐‐
Older Adults 0 0 0 0 0 ‐‐ ‐‐
Total 23,550 6,010 17,540 $6,267,832.50 $1,599,561.50 $4,668,271.00 74.5%
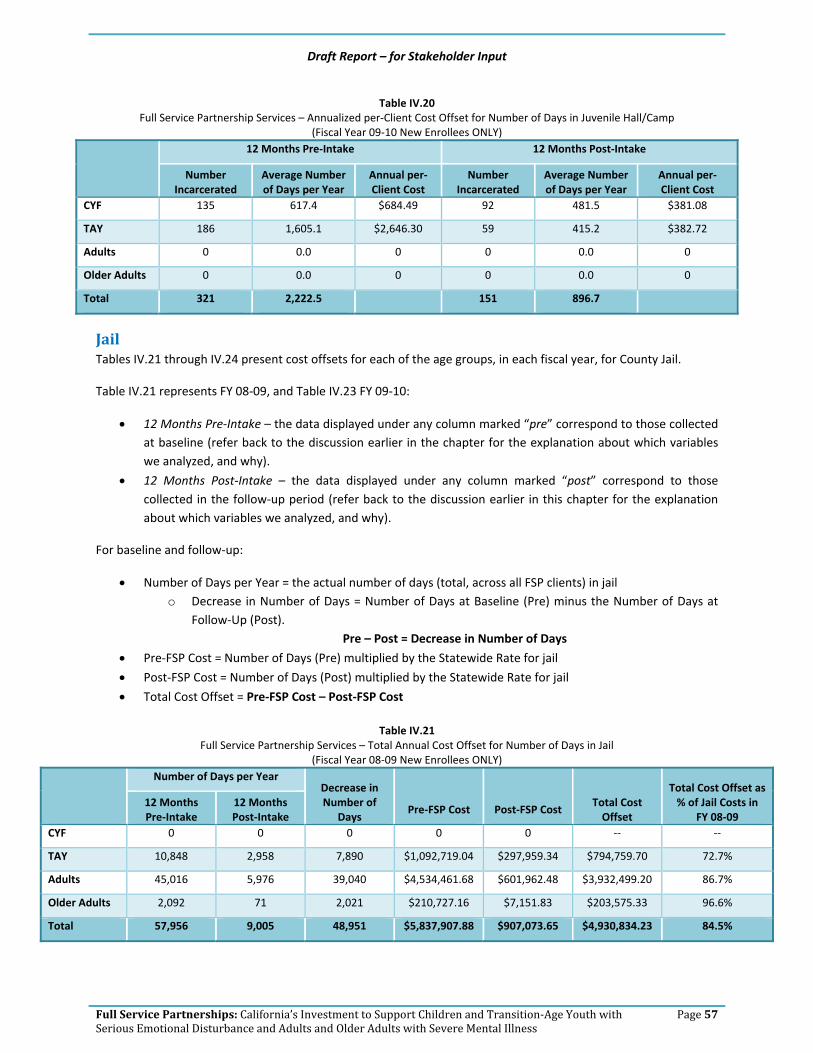
Draft Report – for Stakeholder Input
Full Service Partnerships: California’s Investment to Support Children and Transition‐Age Youth with Serious Emotional Disturbance and Adults and Older Adults with Severe Mental Illness
Page 57
Table IV.20 Full Service Partnership Services – Annualized per‐Client Cost Offset for Number of Days in Juvenile Hall/Camp
(Fiscal Year 09‐10 New Enrollees ONLY) 12 Months Pre‐Intake 12 Months Post‐Intake
Number Incarcerated
Average Number of Days per Year
Annual per‐Client Cost
Number Incarcerated
Average Number of Days per Year
Annual per‐Client Cost
CYF 135 617.4 $684.49 92 481.5 $381.08
TAY 186 1,605.1 $2,646.30 59 415.2 $382.72
Adults 0 0.0 0 0 0.0 0
Older Adults 0 0.0 0 0 0.0 0
Total 321 2,222.5 151 896.7
Jail Tables IV.21 through IV.24 present cost offsets for each of the age groups, in each fiscal year, for County Jail.
Table IV.21 represents FY 08‐09, and Table IV.23 FY 09‐10:
• 12 Months Pre‐Intake – the data displayed under any column marked “pre” correspond to those collected at baseline (refer back to the discussion earlier in the chapter for the explanation about which variables we analyzed, and why).
• 12 Months Post‐Intake – the data displayed under any column marked “post” correspond to those collected in the follow‐up period (refer back to the discussion earlier in this chapter for the explanation about which variables we analyzed, and why).
For baseline and follow‐up:
• Number of Days per Year = the actual number of days (total, across all FSP clients) in jail o Decrease in Number of Days = Number of Days at Baseline (Pre) minus the Number of Days at
Follow‐Up (Post). Pre – Post = Decrease in Number of Days
• Pre‐FSP Cost = Number of Days (Pre) multiplied by the Statewide Rate for jail
• Post‐FSP Cost = Number of Days (Post) multiplied by the Statewide Rate for jail
• Total Cost Offset = Pre‐FSP Cost – Post‐FSP Cost
Table IV.21 Full Service Partnership Services – Total Annual Cost Offset for Number of Days in Jail
(Fiscal Year 08‐09 New Enrollees ONLY)
Number of Days per Year Decrease in Number of
Days Pre‐FSP Cost Post‐FSP Cost
Total Cost Offset
Total Cost Offset as % of Jail Costs in
FY 08‐09 12 Months Pre‐Intake
12 Months Post‐Intake
CYF 0 0 0 0 0 ‐‐ ‐‐
TAY 10,848 2,958 7,890 $1,092,719.04 $297,959.34 $794,759.70 72.7%
Adults 45,016 5,976 39,040 $4,534,461.68 $601,962.48 $3,932,499.20 86.7%
Older Adults 2,092 71 2,021 $210,727.16 $7,151.83 $203,575.33 96.6%
Total 57,956 9,005 48,951 $5,837,907.88 $907,073.65 $4,930,834.23 84.5%

Draft Report – for Stakeholder Input
Full Service Partnerships: California’s Investment to Support Children and Transition‐Age Youth with Serious Emotional Disturbance and Adults and Older Adults with Severe Mental Illness
Page 58
Table IV.22 represents FY 08‐09, and Table IV.24 FY 09‐10. Each table is divided in half, with the left half labeled:
• 12 Months Pre‐Intake – the data displayed in this half correspond to those collected at baseline (refer back for the explanation about which variables we analyzed, and why).
The right half is labeled:
• 12 Months Post‐Intake – the data displayed in this half correspond to those collected in the follow‐up period (refer back for the explanation about which variables we analyzed, and why).
For baseline and follow‐up:
• Number Incarcerated = the actual number of FSP clients who were in jail o An FSP client is counted only one time at baseline and one time at follow‐up (regardless of
whether he or she was in jail multiple times during follow‐up). Number Incarcerated is number of persons in jail, not number of times in jail or some other metric.
• Average Number of Days per Year = the average number of days FSP clients were in jail o At baseline, it is simply the average number of days as reported on the PAF. o See Step 5 for how this is calculated during the follow‐up period.
• Annual per‐Client Cost = the total FSP cost for that time period (i.e., baseline or follow‐up) divided by the total number of new enrollees for the fiscal year
o See the discussion above the previous table for calculation of total FSP cost.
Table IV.22 Full Service Partnership Services – Annualized per‐Client Cost Offset for Number of Days in Jail
(Fiscal Year 08‐09 New Enrollees ONLY) 12 Months Pre‐Intake 12 Months Post‐Intake
Number Incarcerated
Average Number of Days per Year
Annual per‐Client Cost
Number Incarcerated
Average Number of Days per Year
Annual per‐Client Cost
CYF 0 0.0 0 0 0.0 0
TAY 143 1,113.4 $817.90 91 415.1 $223.02
Adults 463 1,258.2 $1,632.86 216 563.2 $216.77
Older Adults 13 517.8 $585.35 4 53.7 $19.87
Total 619 2,889.4 311 1,032.0

Draft Report – for Stakeholder Input
Full Service Partnerships: California’s Investment to Support Children and Transition‐Age Youth with Serious Emotional Disturbance and Adults and Older Adults with Severe Mental Illness
Page 59
Table IV.23 Full Service Partnership Services – Total Annual Cost Offset for Number of Days in Jail
(Fiscal Year 09‐10 New Enrollees ONLY)
Number of Days per Year Decrease in Number of
Days Pre‐FSP Cost Post‐FSP Cost
Total Cost Offset
Total Cost Offset as % of Jail Costs in
FY 09‐10 12 Months Pre‐Intake
12 Months Post‐Intake
CYF 0 0 0 0 0 ‐‐‐ ‐‐‐
TAY 12,132 3,988 8,144 $1,239,890.40 $407,573.60 $832,316.80 67.1%
Adults 40,214 6,352 33,862 $4,109,870.80 $649,174.40 $3,460,696.40 84.2%
Older Adults 1,265 183 1,082 $129,283.00 $18,702.60 $110,580.40 85.5%
Total 53,611 10,523 43,088 $5,479,044.20 $1,075,450.60 $4,403,593.60 80.4%
Table IV.24
Full Service Partnership Services – Annualized per‐Client Cost Offset for Number of Days in Jail (Fiscal Year 09‐10 New Enrollees ONLY)
12 Months Pre‐Intake 12 Months Post‐Intake
Number Incarcerated
Average Number of Days per Year
Annual per‐Client Cost
Number Incarcerated
Average Number of Days per Year
Annual per‐Client Cost
CYF 0 0.0 0 0 0.0 0
TAY 149 1,105.0 $715.46 94 950.9 $235.18
Adults 436 1,416.3 $1,539.85 186 511.6 $243.23
Older Adults 20 345.1 $361.13 6 120.2 $52.24
Total 605 2,866.4 286 1,582.7
Prison Tables IV.25 through IV.28 present cost offsets for each of the age groups, in each fiscal year, for State Prison.
Table IV.25 represents FY 08‐09, and Table IV.27 FY 09‐10:
• 12 Months Pre‐Intake – the data displayed under any column marked “pre” correspond to those collected at baseline (refer back to the discussion earlier in the chapter for the explanation about which variables we analyzed, and why).
• 12 Months Post‐Intake – the data displayed under any column marked “post” correspond to those collected in the follow‐up period (refer back to the discussion earlier in this chapter for the explanation about which variables we analyzed, and why).
For baseline and follow‐up:
• Number of Days per Year = the actual number of days (total, across all FSP clients) in prison o Decrease in Number of Days = Number of Days at Baseline (Pre) minus the Number of Days at
Follow‐Up (Post) Pre – Post = Decrease in Number of Days
• Pre‐FSP Cost = Number of Days (Pre) multiplied by the Statewide Rate for prison
• Post‐FSP Cost = Number of Days (Post) multiplied by the Statewide Rate for prison
• Total Cost Offset = Pre‐FSP Cost – Post‐FSP Cost

Draft Report – for Stakeholder Input
Full Service Partnerships: California’s Investment to Support Children and Transition‐Age Youth with Serious Emotional Disturbance and Adults and Older Adults with Severe Mental Illness
Page 60
Table IV.25 Full Service Partnership Services – Total Annual Cost Offset for Number of Days in Prison
(Fiscal Year 08‐09 New Enrollees ONLY)
Number of Days per Year
Decrease in Number of Days
Pre‐FSP Cost Post‐FSP Cost Total Cost Offset
Total Cost Offset as % of Prison
Costs in FY 08‐09
12 Months Pre‐Intake
12 Months Post‐Intake
CYF 0 0 0 0 0 ‐‐ ‐‐
TAY 668 25 643 $86,205.40 $3,226.25 $82,979.15 96.3%
Adults 1,807 0 1,807 $233,193.35 0 $233,193.35 100.0%
Older Adults 562 0 562 $72,526.10 0 $72,526.10 100.0%
Total 3,037 25 3,012 $391,924.85 $3,226.25 $388,698.60 99.2%
Table IV.26 represents FY 08‐09, and Table IV.28 FY 09‐10. Each table is divided in half, with the left half labeled:
• 12 Months Pre‐Intake – the data displayed in this half correspond to those collected at baseline (refer back for the explanation about which variables we analyzed, and why).
The right half is labeled:
• 12 Months Post‐Intake – the data displayed in this half correspond to those collected in the follow‐up period (refer back for the explanation about which variables we analyzed, and why).
For baseline and follow‐up:
• Number Incarcerated = the actual number of FSP clients who were in prison o An FSP client is counted only one time at baseline and one time at follow‐up (regardless of
whether he or she was in prison multiple times during follow‐up). Number Incarcerated is number of persons in prison, not number of times in prison or some other metric.
• Average Number of Days per Year = the average number of days FSP clients were in prison o At baseline, it is simply the average number of days as reported on the PAF. o See Step 5 for how this is calculated during the follow‐up period.
• Annual per‐Client Cost = the total FSP cost for that time period (i.e., baseline or follow‐up) divided by the total number of new enrollees for the fiscal year
o See the discussion above the previous table for calculation of total FSP cost.

Draft Report – for Stakeholder Input
Full Service Partnerships: California’s Investment to Support Children and Transition‐Age Youth with Serious Emotional Disturbance and Adults and Older Adults with Severe Mental Illness
Page 61
Table IV.26 Full Service Partnership Services – Annualized per‐Client Cost Offset for Number of Days in Prison
(Fiscal Year 08‐09 New Enrollees ONLY) 12 Months Pre‐Intake 12 Months Post‐Intake
Number Incarcerated
Average Number of Days per Year
Annual per‐Client Cost
Number Incarcerated
Average Number of Days per Year
Annual per‐Client Cost
CYF 0 0.0 0 0 0.0 0
TAY 3 424.0 $64.53 1 24.5 $2.41
Adults 16 1,036.5 $83.97 0 0.0 0
Older Adults 3 187.3 $201.46 0 0.0 0
Total 22 1,647.8 1 24.5
Table IV.27
Full Service Partnership Services – Total Annual Cost Offset for Number of Days in Prison (Fiscal Year 09‐10 New Enrollees ONLY)
Number of Days per Year Decrease in Number of
Days Pre‐FSP Cost Post‐FSP Cost
Total Cost Offset
Total Cost Offset as % of Prison Costs in
FY 09‐10 12 Months Pre‐Intake
12 Months Post‐Intake
CYF 0 0 0 0 0 ‐‐ ‐‐
TAY 498 180 318 $68,221.02 $24,658.20 $43,562.82 63.9%
Adults 2,137 0 2,137 $292,747.63 0 $292,747.63 100.0%
Older Adults 0 0 0 0 0 ‐‐ ‐‐
Total 2,635 180 2,455 $360,968.65 $24,658.20 $336,310.45 93.2%
Table IV.28
Full Service Partnership Services – Annualized per‐Client Cost Offset for Number of Days in Prison (Fiscal Year 09‐10 New Enrollees ONLY)
12 Months Pre‐Intake 12 Months Post‐Intake
Number Incarcerated
Average Number of Days per Year
Annual per‐Client Cost
Number Incarcerated
Average Number of Days per Year
Annual per‐Client Cost
CYF 0 0.0 0 0 0.0 0
TAY 4 398.0 $39.37 1 180.0 $14.23
Adults 13 1,094.5 $109.68 0 0.0 0
Older Adults 0 0.0 0 0 0.0 0
Total 17 1,492.5 1 180.0
f. Summary
This report identifies the cost savings that society realizes because these services have been provided. Of course, these savings are not the sole justification of expenditures, the prime purpose of the law is to improve services to mentally ill citizens most in need of assistance. However, it is a primary purpose of accountable and transparent public service to demonstrate the impacts of this needed and individually compassionate service on public concerns. Therefore, this analysis summarizes the savings that are incurred in a limited number of public services

Draft Report – for Stakeholder Input
Full Service Partnerships: California’s Investment to Support Children and Transition‐Age Youth with Serious Emotional Disturbance and Adults and Older Adults with Severe Mental Illness
Page 62
for the recipients of FSP services. To state this differently, this analysis assesses the costs to society with respect to health services that are incurred by persons facing severe mental health challenges, and public costs incurred because of criminal justice system involvement attributable to these challenges.
It is important to note that this is a conservative analysis. Costs that are not clearly attributable to FSP clients have not been included, and cost savings estimates have been indexed to conservative estimates of cost. As is widely recognized, estimating the costs of savings attributable to service is complex – from both a cost estimate and a benefit estimate point of view. At each step in these estimation processes, we have consciously adopted a conservative approach.
Per the MHSA Community Services and Supports Three‐Year Program and Expenditure Plan Requirements, “Each county must plan for each age group in their populations to be served.” (p. 13)126 Age groups are defined as follows:
• Children, Youth and Families (CYF): Birth to 18 years, and special‐education pupils from birth to age 21 (p. 21)
• Transition‐Age Youth (TAY): 16 to 25 years (p. 21)
• Adults: No specific age range is given
• Older Adults: 60 years and older (p. 21)
The majority of counties are included in this report (N = 37; 63%).127 The populations of counties represented in this report for FY 09‐10 comprise the majority of the State of California (67.3%).128 The majority are also represented for FY 08‐09 (66.9%).
Although a majority of counties are included in the findings displayed in this report, these findings should be considered preliminary because data are currently being collected from the remaining 20 counties.
FSP services are intensive to meet the needs of FSP‐targeted clients. This is driven primarily by the policy objective to meet the serious needs of the hardest‐to‐serve clients – those with severe mental illness. This policy objective includes meeting both the service and the quality‐of‐life needs of FSP clients and the social outcomes and services needs of California. To assess this complex balance of service objectives, this study has assessed a broad range of costs to citizens of California that are a consequence of service delivery to mental health clients most in need. Table IV.29 below represents costs of service and costs saved as a result of service for Fiscal Year (FY) 08‐09 new enrollees in FSP.
More specifically,
• Costs of service are program and housing costs for new clients in FY 08‐09 as discussed above; and
126 http://www.dmh.ca.gov/dmhdocs/docs/letters05/05‐05CSS.pdf Children and adolescents identified as seriously emotionally disturbed (SED) are eligible for FSPs if they meet the criteria set forth in Welfare and Institutions Code section 5600.3, subdivision (a). Adults and older adults identified to have a serious mental disorder are eligible for FSPs if they meet the criteria set forth in subdivision (b) of section 5600.3. http://www.leginfo.ca.gov/cgi‐bin/displaycode?section=wic&group=05001‐06000&file=5600‐5623.5 California’s Welfare and Institutions Code is posted in its entirety on the website cited above, absent page numbers. Click on the link and the section cited will appear on screen, verbatim, as quoted. 127 Three counties and one municipality submitted their web survey too late for inclusion in this report draft but will be analyzed in time for distribution for county review on 7/27/12 and for inclusion in the Final Report. The additional counties will bring the total number of participants to 41 (71%). Note that one county was in start‐up during the entire study period and was consequently removed from the total N for purpose of calculation. Therefore, the N = 58 (rather than 59). 128 See Appendix D of this report for a list of county participants.
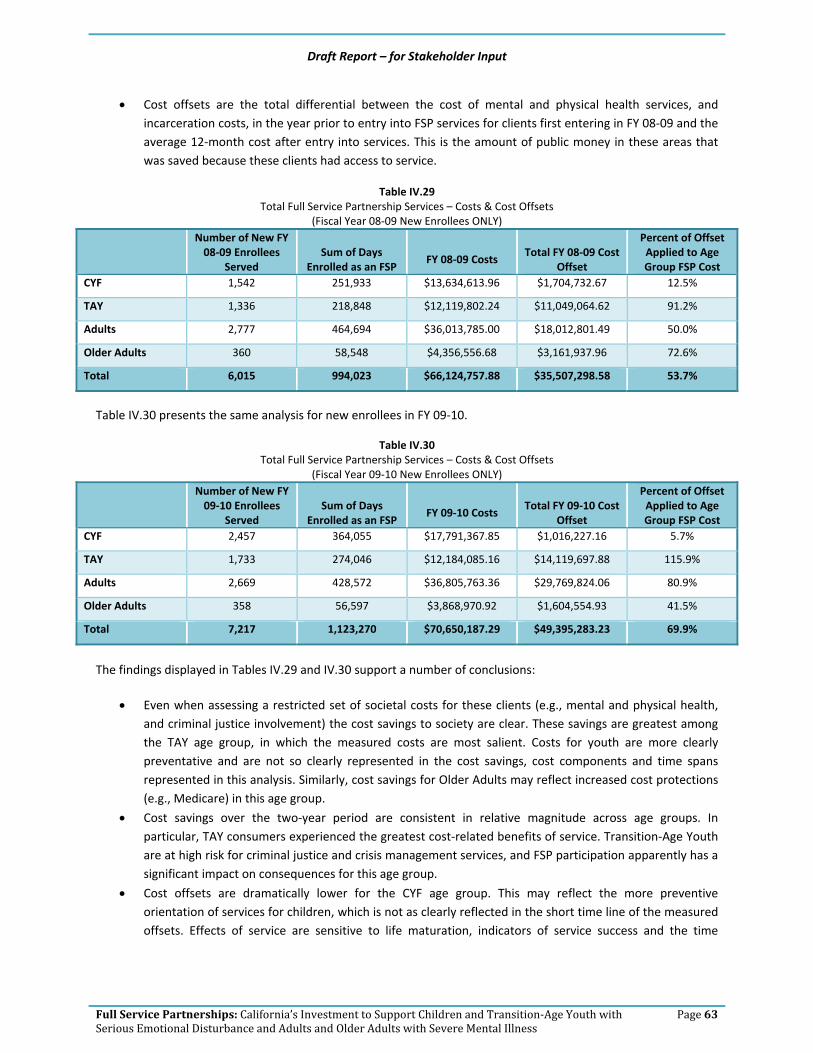
Draft Report – for Stakeholder Input
Full Service Partnerships: California’s Investment to Support Children and Transition‐Age Youth with Serious Emotional Disturbance and Adults and Older Adults with Severe Mental Illness
Page 63
• Cost offsets are the total differential between the cost of mental and physical health services, and incarceration costs, in the year prior to entry into FSP services for clients first entering in FY 08‐09 and the average 12‐month cost after entry into services. This is the amount of public money in these areas that was saved because these clients had access to service.
Table IV.29 Total Full Service Partnership Services – Costs & Cost Offsets
(Fiscal Year 08‐09 New Enrollees ONLY)
Number of New FY 08‐09 Enrollees
Served Sum of Days
Enrolled as an FSP FY 08‐09 Costs
Total FY 08‐09 Cost Offset
Percent of Offset Applied to Age Group FSP Cost
CYF 1,542 251,933 $13,634,613.96 $1,704,732.67 12.5%
TAY 1,336 218,848 $12,119,802.24 $11,049,064.62 91.2%
Adults 2,777 464,694 $36,013,785.00 $18,012,801.49 50.0%
Older Adults 360 58,548 $4,356,556.68 $3,161,937.96 72.6%
Total 6,015 994,023 $66,124,757.88 $35,507,298.58 53.7%
Table IV.30 presents the same analysis for new enrollees in FY 09‐10.
Table IV.30 Total Full Service Partnership Services – Costs & Cost Offsets
(Fiscal Year 09‐10 New Enrollees ONLY)
Number of New FY 09‐10 Enrollees
Served Sum of Days
Enrolled as an FSP FY 09‐10 Costs
Total FY 09‐10 Cost Offset
Percent of Offset Applied to Age Group FSP Cost
CYF 2,457 364,055 $17,791,367.85 $1,016,227.16 5.7%
TAY 1,733 274,046 $12,184,085.16 $14,119,697.88 115.9%
Adults 2,669 428,572 $36,805,763.36 $29,769,824.06 80.9%
Older Adults 358 56,597 $3,868,970.92 $1,604,554.93 41.5%
Total 7,217 1,123,270 $70,650,187.29 $49,395,283.23 69.9%
The findings displayed in Tables IV.29 and IV.30 support a number of conclusions:
• Even when assessing a restricted set of societal costs for these clients (e.g., mental and physical health, and criminal justice involvement) the cost savings to society are clear. These savings are greatest among the TAY age group, in which the measured costs are most salient. Costs for youth are more clearly preventative and are not so clearly represented in the cost savings, cost components and time spans represented in this analysis. Similarly, cost savings for Older Adults may reflect increased cost protections (e.g., Medicare) in this age group.
• Cost savings over the two‐year period are consistent in relative magnitude across age groups. In particular, TAY consumers experienced the greatest cost‐related benefits of service. Transition‐Age Youth are at high risk for criminal justice and crisis management services, and FSP participation apparently has a significant impact on consequences for this age group.
• Cost offsets are dramatically lower for the CYF age group. This may reflect the more preventive orientation of services for children, which is not as clearly reflected in the short time line of the measured offsets. Effects of service are sensitive to life maturation, indicators of service success and the time

Draft Report – for Stakeholder Input
Full Service Partnerships: California’s Investment to Support Children and Transition‐Age Youth with Serious Emotional Disturbance and Adults and Older Adults with Severe Mental Illness
Page 64
horizon of measured effects. Given these parameters, the FSP program shows strong effects for those age groups for which age parameters and potential outcome parameters are most appropriate.
In summary, this analysis of cost offsets in larger social costs attributable to participation in the FSP program documents positive results. Results for the TAY and Adult age groups, where the great majority of clients reside, are particularly positive. This reflects the greater risk for hospitalization and incarceration that exists among TAY and Adults. Overall, these results suggest a very positive treatment outcome, and return on investment, for FSP clients.
Table IV.31 Full Service Partnership Cost Offsets by Age & Offset Category
(Fiscal Year 08‐09 New Enrollees ONLY)
Psychiatric Physical Health Incarceration Total
Amount of Offset
% of Total Offset for Age Group
Amount of Offset
% of Total Offset for Age Group
Amount of Offset
% of Total Offset for Age Group
Amount of Offset
% of Total Offset across Age
Groups
CYF $448,841.58 26.3% $749, 431.55 44.0% $506,459.54 29.7% $1,704,732.67 5.0%
TAY $5,559,062.96 50.3% $1,054,102.59 9.5% $4,435,899.07 40.1% $11,049,064.62 32.6%
Adults $14,030,839.68 77.9% (‐$183,730.74) ‐1.0% $4,165,692.55 23.1% $18,012,801.49 53.1%
Older Adults $2,019,354.70 63.9% $866,481.83 27.4% $276,101.43 8.7% $3,161,937.96 9.3%
Total $22,058,098.92 62.1% $2,486,285.23 7.0% $9,384,152.59 30.9% $33,928,536.74 100.0%
Table IV.31 illustrates cost offsets by age and offset category. For Adults and Older Adults, the greatest proportion of offsets in FY 08‐09 is accounted for by inpatient psychiatric hospitalization.
Inpatient hospitalization (psychiatric) days represent the greatest proportion of cost offsets overall, among offset areas analyzed thus far and included in this draft report. The majority of TAY demonstrated savings in this area.
Physical health (inpatient hospitalization – acute and skilled nursing – non‐psychiatric) represents only seven percent of offsets overall. However, a plurality of CYF show the greatest proportion of offsets in this area. Adults overall do not show an offset in physical health, presumably because previously unmet chronic health needs are met through engagement and involvement in the FSP program.
Nearly one‐third of cost offsets resulted from savings in number of days incarcerated.
Percentage of overall offset represented by each age group (new enrollees only) is compared to their proportion in terms of overall numbers served, days of service, and costs.
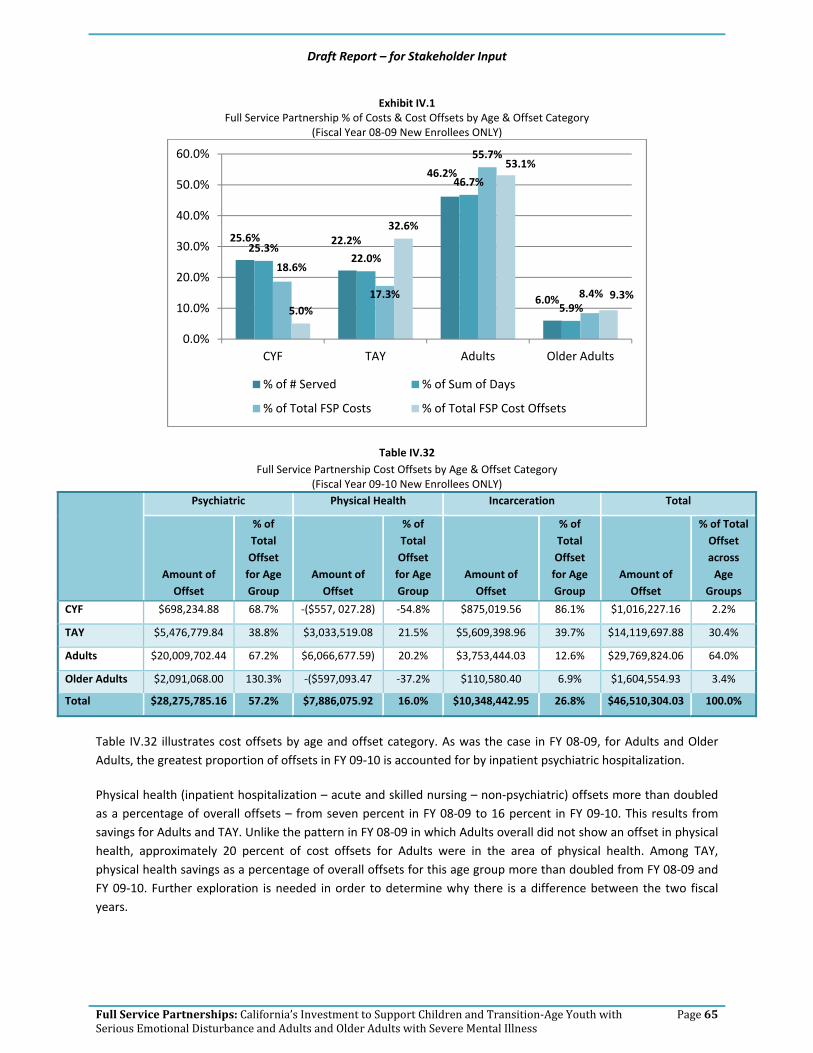
Draft Report – for Stakeholder Input
Full Service Partnerships: California’s Investment to Support Children and Transition‐Age Youth with Serious Emotional Disturbance and Adults and Older Adults with Severe Mental Illness
Page 65
Exhibit IV.1 Full Service Partnership % of Costs & Cost Offsets by Age & Offset Category
(Fiscal Year 08‐09 New Enrollees ONLY)
Table IV.32 Full Service Partnership Cost Offsets by Age & Offset Category
(Fiscal Year 09‐10 New Enrollees ONLY)
Psychiatric Physical Health Incarceration Total
Amount of Offset
% of Total Offset for Age Group
Amount of Offset
% of Total Offset for Age Group
Amount of Offset
% of Total Offset for Age Group
Amount of Offset
% of Total Offset across Age
Groups
CYF $698,234.88 68.7% ‐($557, 027.28) ‐54.8% $875,019.56 86.1% $1,016,227.16 2.2%
TAY $5,476,779.84 38.8% $3,033,519.08 21.5% $5,609,398.96 39.7% $14,119,697.88 30.4%
Adults $20,009,702.44 67.2% $6,066,677.59) 20.2% $3,753,444.03 12.6% $29,769,824.06 64.0%
Older Adults $2,091,068.00 130.3% ‐($597,093.47 ‐37.2% $110,580.40 6.9% $1,604,554.93 3.4%
Total $28,275,785.16 57.2% $7,886,075.92 16.0% $10,348,442.95 26.8% $46,510,304.03 100.0%
Table IV.32 illustrates cost offsets by age and offset category. As was the case in FY 08‐09, for Adults and Older Adults, the greatest proportion of offsets in FY 09‐10 is accounted for by inpatient psychiatric hospitalization.
Physical health (inpatient hospitalization – acute and skilled nursing – non‐psychiatric) offsets more than doubled as a percentage of overall offsets – from seven percent in FY 08‐09 to 16 percent in FY 09‐10. This results from savings for Adults and TAY. Unlike the pattern in FY 08‐09 in which Adults overall did not show an offset in physical health, approximately 20 percent of cost offsets for Adults were in the area of physical health. Among TAY, physical health savings as a percentage of overall offsets for this age group more than doubled from FY 08‐09 and FY 09‐10. Further exploration is needed in order to determine why there is a difference between the two fiscal years.
25.6% 22.2%
46.2%
6.0%
25.3%22.0%
46.7%
5.9%
18.6%
17.3%
55.7%
8.4%5.0%
32.6%
53.1%
9.3%
0.0%
10.0%
20.0%
30.0%
40.0%
50.0%
60.0%
CYF TAY Adults Older Adults
% of # Served % of Sum of Days
% of Total FSP Costs % of Total FSP Cost Offsets

Draft Report – for Stakeholder Input
Full Service Partnerships: California’s Investment to Support Children and Transition‐Age Youth with Serious Emotional Disturbance and Adults and Older Adults with Severe Mental Illness
Page 66
Exhibit IV.2 Full Service Partnership % of Costs & Cost Offsets by Age & Offset Category
(Fiscal Year 09‐10 New Enrollees ONLY)
Findings as illustrated in Exhibits IV.1 and IV.2 support the following conclusions:
• As was the case in FY 08‐09, offsets for TAY in FY 09‐10 are in far greater proportion to their numbers, days of service and costs when compared with other age groups’ offsets.
• The proportion of offsets for Older Adults declines in FY 09‐10, whereas in FY 08‐09, the percentage of cost offsets was on par with their numbers, days of service and the percent expended.
• As was exhibited in FY 08‐09, Adults in FY 09‐10 represent the age group on whom the greatest amount is spent, and as a proportion of overall offsets by age group, they also represent the greatest amount in terms of savings. In FY 09‐10, offsets for Adults exceeds cost of service for new enrollees.
• Savings for Children, Youth and Families as a whole represented only five percent in FY 08‐09 and less than three percent of cost offsets in FY 09‐10. However, this is in keeping with the focus on investing in the population to prevent later, more severe mental health problems.
Exhibits IV.3 through IV.6 illustrate the proportion of offset in each area for the age groups. The two fiscal years are combined in the pie charts. 129
129 As shown in Tables IV.31 and IV.32, some of the offset areas are in arrears (negative balance), and a pie chart cannot be created with a “negative slice.” However, a negative balance in any one offset area only appears in one fiscal year for any given age group. Thus, when the fiscal years are combined, a pie chart can be created.
34.0%
24.0%
37.0%
5.0%
32.4%24.4%
38.2%
5.0%
17.5%
15.1%
60.0%
7.4%
2.2%
30.4%
64.0%
3.4%
0.0%
10.0%
20.0%
30.0%
40.0%
50.0%
60.0%
70.0%
CYF TAY Adults Older Adults
% of # Served % of Sum of Days
% of Total FSP Costs % of Total FSP Cost Offsets

Draft Report – for Stakeholder Input
Full Service Partnerships: California’s Investment to Support Children and Transition‐Age Youth with Serious Emotional Disturbance and Adults and Older Adults with Severe Mental Illness
Page 67
Exhibit IV.3 . Full Service Partnership % of Cost Offsets w/in CYF Age Group
(FY 08‐09 & FY 09‐10 New Enrollees ONLY)
Exhibit IV.4. Full Service Partnership % of Cost Offsets w/in TAY Age Group
(FY 08‐09 & FY 09‐10 New Enrollees ONLY)
Physical Health $1,147,076.46
42%
Incarceration$192,404.27
7%
Psychiatric$1,381,479.10
51%
Psychiatric$11,035,842.80
44%
Physical Health$4,087,621.67
16%
Incarceration$10,045,298.03
40%
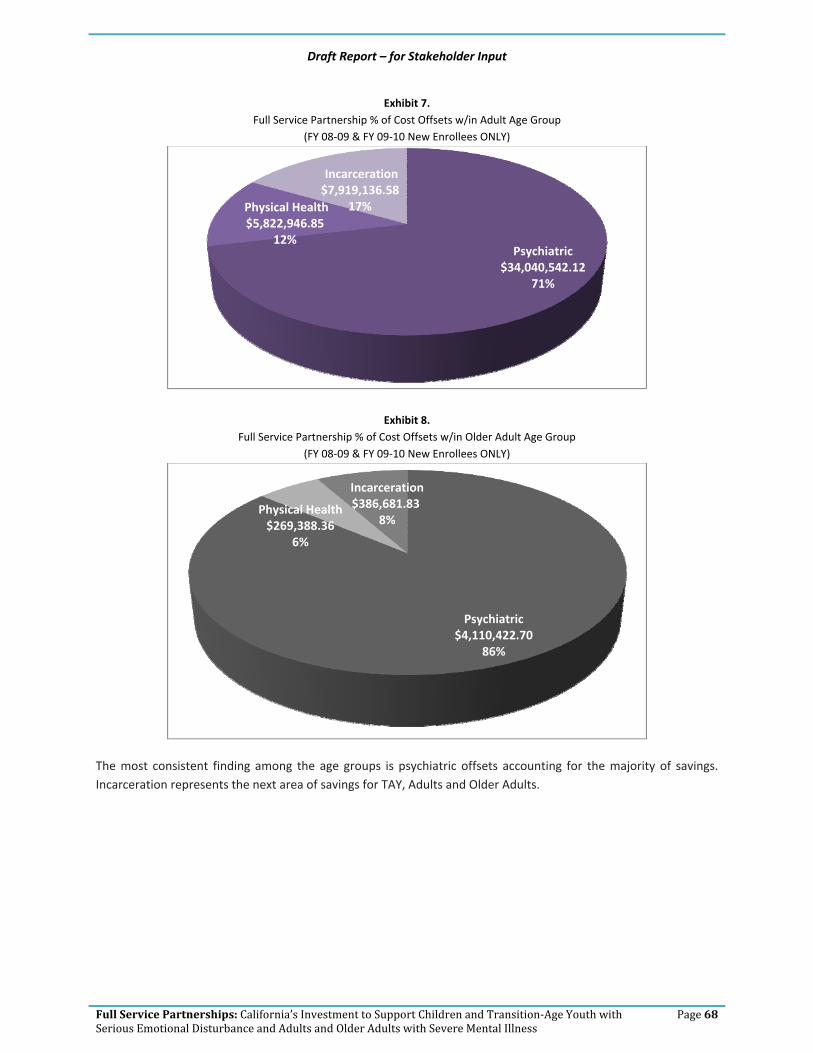
Draft Report – for Stakeholder Input
Full Service Partnerships: California’s Investment to Support Children and Transition‐Age Youth with Serious Emotional Disturbance and Adults and Older Adults with Severe Mental Illness
Page 68
Exhibit 7. Full Service Partnership % of Cost Offsets w/in Adult Age Group
(FY 08‐09 & FY 09‐10 New Enrollees ONLY)
Exhibit 8. Full Service Partnership % of Cost Offsets w/in Older Adult Age Group
(FY 08‐09 & FY 09‐10 New Enrollees ONLY)
The most consistent finding among the age groups is psychiatric offsets accounting for the majority of savings. Incarceration represents the next area of savings for TAY, Adults and Older Adults.
Psychiatric $34,040,542.12
71%
Physical Health$5,822,946.85
12%
Incarceration$7,919,136.58
17%
Psychiatric $4,110,422.70
86%
Physical Health $269,388.36
6%
Incarceration$386,681.83
8%

Draft Report – for Stakeholder Input
Full Service Partnerships: California’s Investment to Support Children and Transition‐Age Youth with Serious Emotional Disturbance and Adults and Older Adults with Severe Mental Illness
Page 69
V. Next Steps
This chapter describes our process for receiving stakeholder input, and next steps with regard to subsequent iterations of this report and the analyses that support findings to be contained therein.
a. Process for Stakeholder Input
Stakeholder input will be sought for two key deliverables: o This draft report o County‐specific tables depicting FSP costs and cost offsets130
1. Full Service Partnership Cost‐Offset Report
This report131 will be released publicly at the Mental Health Services Oversight and Accountability Commission meeting on July 26, 2012. Stakeholders may submit comments in writing via e‐mail to:
[email protected] Feedback must be submitted no later than August 26, in order to allow EMT sufficient time for revision to the Final Report due September 30, 2012.
2. County‐Specific FSP Costs & Cost‐Offset Tables
The majority of counties are included in this report (N = 37; 63.8%). The populations of counties (defined as people residing in the county, according to the 2010 census) represented in this report for Fiscal Year 2009‐10 comprise the majority of the State of California (67.3%).132 The majority are also represented for Fiscal Year 08‐09 (66.9%).
In order to include a county in the FSP Cost and Cost Offset Report, we needed Full Service Partnership costs broken out by age group. The only way to reliably and accurately obtain this information was to ask the counties directly. A web survey was launched in order to collect FSP Costs by Age Group. The majority of counties responded – 37 (63.8%). 133 Their FSP Costs and Cost Offsets by Age Group are included in this draft report. The remaining counties have been given until August 3 to respond, and hopefully every county will be included the final report.
County‐specific matrices that replicate the tables in this report will be distributed to participating counties on July 27, 2012. Counties have a 30‐day review and comment period. Feedback is due to EMT Associates no later than
130 The data contained in the county‐specific tables form the basis for creation of the statewide data set, summarized and reported here. 131 Phase III. Deliverable 1.C. Initial written report that specifies the financial impact of outcomes achieved in comparison with expenditures for FSP clients for each of the four age groups. 132 See Appendix D for a list of county participants. Population data were extracted by county and for the state, for 2008 (corresponding to FY 08‐09) and 2009 (corresponding to FY 09‐10), from census data: http://www.census.gov/popest/research/eval‐estimates/eval‐est2010.html 133 Three counties and one municipality submitted their web survey too late for inclusion in this report draft, but will be analyzed in time for distribution for county review on 7/27, and for inclusion in the Final Report. The additional counties/municipality will bring the total number of participants to 41 (71%). Note that one county was in start‐up during the entire study period, and was therefore removed from the total N for purpose of calculation. Therefore, the N = 58 (rather than 59). The link to census data is: http://www.census.gov/popest/research/eval‐estimates/eval‐est2010.html

Draft Report – for Stakeholder Input
Full Service Partnerships: California’s Investment to Support Children and Transition‐Age Youth with Serious Emotional Disturbance and Adults and Older Adults with Severe Mental Illness
Page 70
August 27, 2012. The deadline has been set in order to provide EMT with sufficient time to a) make necessary revisions and b) conduct cross‐county analyses for the Final Report, due September 30, 2012.134
However, an opportunity was provided to the remaining counties/municipalities to complete the web survey, by July 13. In order to include more counties, the deadline has been extended until August 3. Counties with complete web survey data will be analyzed and provided with a county‐specific matrix, following the procedures described in the paragraph above. As noted previously in Chapter III, input from the counties through the web survey is essential in determining the breakout of Full Service Partnership expenditures by age group:
• Children, Youth and Families
• Transition‐Age Youth
• Adults
• Older Adults
For those counties that are unable to participate in the web survey, EMT will attempt to break out FSP costs by age group. However, the extent to which we can do so is limited by the information available in the Full Service Partnership Plans and Annual Updates. It may not be possible to break out FSP costs for some counties, particularly those with FSP programs serving multiple age groups.135
b. Subsequent Reports
The report delivered to the MHSOAC on September 30, 2012, will be the Final Report. A compendium of feedback submitted and the disposition of each stakeholder’s comments will be contained in an appendix in the Final Report. The revision to this report will include data from additional counties, and the following additional offset areas:
• Long‐Term Care (number of days), 136 • Skilled Nursing (Psychiatric) (number of days), • Emergency Room Use (number of visits), and • Arrests (number of)
The Final Report will include FSP costs for additional counties. Refer to Chapter III for a discussion regarding the challenges inherent in calculating FSP costs by age group in the absence of web survey data. The exact, final number of participating counties therefore cannot be determined at this time. Absent FSP cost by age group data, cost offsets cannot be calculated. We are therefore working diligently with the California Mental Health Directors Association to encourage participation in the web survey by the remaining counties, in order to reach a participation rate of 75 percent (N = 44).
In summary, the Final Report will incorporate data from additional counties137 in order to develop revised:
134 Phase III. Deliverable 1.B. – Revised Deliverable 1.A. in response to stakeholder input, and Phase III. Deliverable 1.D. – Revised Deliverable 1.C. in response to stakeholder input. 135 Unless Housing is documented by the county in a specific line item, it is not possible to track. See the discussion of methods in Chapter III. 136 Institution for Mental Diseases (IMD) facilities/Mental Health Rehabilitation Centers (MHRC). Key Event Tracking data do not distinguish between the two. Therefore an average between the IMD and MHRC rate for the facilities contracted by each county was used as the basis for calculating the cost applied to the number of days in long term care.

Draft Report – for Stakeholder Input
Full Service Partnerships: California’s Investment to Support Children and Transition‐Age Youth with Serious Emotional Disturbance and Adults and Older Adults with Severe Mental Illness
Page 71
• Statewide and County Full Service Partnership Cost by Age Group o Children, Youth and Families o Transition‐Age Youth o Adults o Older Adults
• Statewide and County138 Full Service Partnership Cost Offsets by Age Group, in the following areas: Psychiatric
o Inpatient Psychiatric Hospitalization (number of days) o Long‐Term Care (number of days) o Skilled Nursing (Psychiatric) (number of days)
Non Psychiatric o Skilled Nursing (Non‐Psychiatric) (number of days) o Acute Inpatient Hospitalization (number of days) o Emergency Room Use (Non‐Psychiatric) (number of times)
Incarceration o Arrests (number of times) o Jail (number of days) o Prison (number of days) o Division of Juvenile Justice (number of days) o Juvenile Hall/Camp (number of days)
The Final Report will include also include a detailed description of the services and activities planned under the Full Service Partnership program. Tables will be presented throughout the report to summarize the wealth of strategies and activities planned in each county, along with a statewide summary.
All counties were provided the opportunity to review the FSP Service Description developed, and to submit documentary evidence for consideration (see Chapter II). EMT is in the process of review and revision based on the number of documents submitted by counties. The Final Report will include:
• FSP Service Description results in report (descriptive narrative), and
• The use of FSP Service Description in analyses to determine impact of services on costs and cost offsets.
Finally, a number of ancillary topics bear consideration and will be addressed in the Final Report. These topics include:
• FSP costs by funding source, for FY 08‐09 and FY 09‐10,139
• Discussion of web survey results and lessons learned about FSP costs, and
• Review of start‐up costs.
Determination on analysis of ethnic variables will be made following the feedback process on Phase II Deliverable 2.
137 As many of the remaining 15 counties/1 municipality that participate in the web survey. We cannot guarantee calculation of FSP cost by age group for any county that does not participate in the web survey, for the reasons outlined in this chapter. 138 Cost Offsets can be developed only for counties that submit data to the State Department of Mental Health’s Full Service Partnership (FSP) Data Collection and Reporting System (DCR). All of the variables used in the FSP Cost Offset analysis are contained in the DCR. EMT does not have access to non‐DCR data from counties. 139 It is not possible for counties to break this out by age group.

Draft Report – for Stakeholder Input
Full Service Partnerships: California’s Investment to Support Children and Transition‐Age Youth with Serious Emotional Disturbance and Adults and Older Adults with Severe Mental Illness
Page 72
Appendix A FSP Service Description

Draft Report – for Stakeholder Input
Full Service Partnerships: California’s Investment to Support Children and Transition‐Age Youth with Serious Emotional Disturbance and Adults and Older Adults with Severe Mental Illness
Page 73
Documenting in narrative form the essence of what constitutes a Full Service Partnership program has been approached in many different documents. Notably, the following bear mention:
• MHSA Statutes140
• DMH Letter 05‐05141
• CiMH FSP Toolkit Series142
The CiMH FSP Toolkit is notably different from the MHSA Statutes and DMH Letter 05‐05 because it documents clinical principles that ought to underlie FSP services for each age group. 143 Although the MHSA Statutes and DMH Letter 05‐05 also provide some description of clinical principles, for the most part the documents focus on the array of both required and potential practices for every age group. In essence, they represent a “checklist” of the:
• Services and practices required under MHSA funding for FSP, and
• Support services and evidence‐based practices that may be offered, dependent upon the needs inherent in each setting (with particular attention to age, gender, ethnic group, and language).
The process of taking the concepts as outlined in the MHSA Statutes and realizing them in each county/municipality became the purpose of DMH Letter 05‐05. This communiqué described the requirements of the Community Services and Supports Plan, of which FSP was a major component. Central to the plan was the expectation for constituent input into the selection of Community Services and Supports (including FSP) target populations and service strategies.
In response, each county/municipality embarked on a process of consulting with key stakeholders within the community and conducted needs assessments in order to determine priority services, strategies and populations. The process was organic,144 and no artificial time limit was imposed. The result was that the planning in some settings ranged from 9 to 12 months in order to ensure that all constituents were adequately “represented at the table.” The resulting findings and recommendations were compiled into each county’s/municipality’s Community Services and Supports Plan, and submitted to the Department of Mental Health for review and approval.
The manner in which FSP services are conceptualized is described in the following section, along with brief descriptions of the strategies identified in the CSS Plans and Annual Updates. The draft report planned for submission to the Mental Health Services Oversight and Accountability Commission will include a Statewide summary of the FSP services and strategies documented in CSS Plans and Annual Updates as being implemented in
140 California Code of Regulations, Title 9. Rehabilitative and Development Services. Division 1. Department of Mental Health. Chapter 14. Mental Health Services Act. Final Version 07‐08. Note that the Statutes in place for the majority of the time FSP services were planned are cited for the purpose of this report, not the current (2011) version of the Statutes. 141 http://www.dmh.ca.gov/dmhdocs/docs/letters05/05‐05CSS.pdf 142 California Institute for Mental Health (2010). Full Service Partnership Implementation Tool Kits. Sacramento: Author. 143 The scope of the CIMH FSP Toolkit best lends itself to a fidelity study of FSP implementation, a task beyond the scope of this contract due to the necessity to conduct site visits and observation of program implementation. We certainly recommend such study as a valuable endeavor in the future, however, after counties and municipalities have the opportunity to implement the Toolkit principles (following the necessary implementation training and technical assistance from CiMH). 144 http://www.dmh.ca.gov/dmhdocs/docs/letters05/05‐05CSS.pdf See p. 4 of the Mental Health Services Act Community Services and Supports Three‐Year Program and Expenditure Plan Requirements for Community Collaboration requirements during the required planning process. In addition, p. 5 clearly documents the requirement that the mental health system be client/family driven.

Draft Report – for Stakeholder Input
Full Service Partnerships: California’s Investment to Support Children and Transition‐Age Youth with Serious Emotional Disturbance and Adults and Older Adults with Severe Mental Illness
Page 74
California, in order to provide a uniquely individually‐tailored standard of care to individuals most in need of mental health services.145
a. Full Service Partnership Services
Full Service Partnership services (FSP) are most succinctly described as:
• A ‘Whatever It Takes’ approach means to find the methods and means to engage an individual, determine their needs, and create collaborative services and support to meet those needs. 146 (p. 13)
This brief description encapsulates all of the critical elements of the FSP “service package”
• Outreach/engagement,
• Program services (treatment, crisis intervention, and support services), and
• Housing.
The specific Full Service Partnership strategies planned by each county and municipality vary, dependent upon the:
• Needs of constituents identified during the extensive planning process that took place as a condition of, and prior to MHSA funding for FSP, and
• DMH plan review, input and approval process.
The planned strategies presented in this report represent options identified from the following sources:
• MHSA Statutes
• DMH Letters/Notices
• Literature Review
Descriptions of FSP services planned for implementation by counties/municipalities in FY 06‐07 through FY 09‐10 are provided in the following report sections, along with a summary of the number and percentage of counties/municipalities that planned to implement each practice.
1. Outreach & Engagement
The priority for FSP is to identify populations currently receiving little or no service, and conduct outreach to those populations. In addition, to engage with the intent of providing service:
• Underserved is defined as one who has been diagnosed with serious mental illness or serious emotional disturbance and is receiving services, but is not provided the necessary or appropriate opportunities to support his/her recovery, wellness, and/or resilience. The underserved may include but are not limited to:
1. Those who are poorly served that they are at risk of homelessness, institutionalization, incarceration, out‐of‐home placement or other serious consequences;
145 EMT is currently in the process of incorporating the FSP material submitted by counties for consideration, in response to the county review/comment period. EMT’s update to the FSP Assessment for each county will be completed in July, and incorporated into the report presented to the Commission. 146 California Institute for Mental Health (2010). Full Service Partnership Implementation Tool Kits. Sacramento: Author.

Draft Report – for Stakeholder Input
Full Service Partnerships: California’s Investment to Support Children and Transition‐Age Youth with Serious Emotional Disturbance and Adults and Older Adults with Severe Mental Illness
Page 75
2. Members of ethnic/racial, cultural, and linguistic populations that do not have access to mental health programs due to barriers such as poor identification of their mental health needs, poor engagement and outreach, limited language access, and lack of culturally competent services; and
3. Those in rural areas, Native American Rancherias and/or reservations who are not receiving sufficient services.
• Unserved are those who may have serious mental illness and/or serious emotional disturbance and are not receiving mental health services, including individuals who may have had only emergency or crisis‐oriented contacts and/or services from the County (p. 15). 147
2. Recruitment – Priority to Unserved Populations
As noted above, people who are in need but not engaged in services are a required priority for FSP services. In
addition, counties and municipalities are specifically charged with reducing ethnic and racial disparities. 148
3. Assessment & Planning
A key characteristic of the MHSA requirements for FSP Planning and Assessment is the proactive nature of the strategies. The pre‐existing standard of care statewide had been criticized as reactive and crisis‐oriented.149 The thoughtful assessment and planning process under the MHSA FSP service model involves defining the target population and ensuring that clients are engaged in services. In short, there is an emphasis on identifying potential client who will likely benefit from FSP services.
Clear Eligibility Criteria The following eligibility criteria are taken directly from MHSA statutes:
Children and adolescents identified as Seriously emotionally disturbed (SED) are eligible for FSPs if they meet the criteria set forth in Welfare and Institutions Code section 5600.3, subdivision (a). Adults and older adults identified to have a serious mental disorder are eligible for FSPs if they meet the criteria set forth in subdivision (b) of section 5600.3. 150
A. SED Children who fall into at least ONE of the following groups: GROUP 1: 1. As a result of the mental disorder, the child has substantial impairment in at least two of these areas:
• Self–care.
• School functioning.
• Family relationships.
• Ability to function in the community. AND 2. Either of the following occur:
• The child is at risk of or has already been removed from the home.
147 http://www.dmh.ca.gov/dmhdocs/docs/letters05/05‐05CSS.pdf 148 http://www.dmh.ca.gov/dmhdocs/docs/letters05/05‐05CSS.pdf 149 A hallmark of Prop 63 was the ability to take the success demonstrated through AB 34 and SB 2034 programs statewide. Prior to the passage of Prop 63, SB 2034 had expanded to only 30 counties. http://www.pendari.com/DMH/Books/MHSA_and_Transformation/files/mhsa_and_transformation.pdf 150 http://www.leginfo.ca.gov/cgi‐bin/displaycode?section=wic&group=05001‐06000&file=5600‐5623.5 California’s Welfare and Institutions Code is posted in its entirety on the website cited above, absent page numbers. Click on the link and the section cited will appear onscreen, verbatim, as quoted.

Draft Report – for Stakeholder Input
Full Service Partnerships: California’s Investment to Support Children and Transition‐Age Youth with Serious Emotional Disturbance and Adults and Older Adults with Severe Mental Illness
Page 76
• The mental disorder and impairments have been present for more than six months or are likely to continue for more than one year without treatment.
GROUP 2 – The child displays at least ONE of the following features: 1. Psychotic features. 2. Risk of suicide. 3. Risk of violence due to a mental disorder.
GROUP 3 – The child meets special education eligibility requirements under Chapter 26.5 of the Government Code.
B. SED Transition‐Age Youth (youth 16 years to 25 years old) who meet ALL of the following: 1. They fall into at least one of the groups in (A) above. 2. They are unserved or underserved. AND 3. They are in one of the following situations:
• Homeless or at risk of being homeless.
• Aging out of the child and youth mental health system
• Aging out of the child welfare systems
• Aging out of the juvenile justice system
• Involved in the criminal just system
• At risk of involuntary hospitalization or institutionalization, or
• Have experienced a first episode of serious mental illness
C. SMI Adults who meet ALL of the following. 1. Their mental disorder results in substantial functional impairments or symptoms, or they have a psychiatric
history that shows that, without treatment, there is an imminent risk of decompensation with substantial impairments or symptoms.
2. Due to mental functional impairment and circumstances, they are likely to become so disabled as to require public assistance, services, or entitlements. AND
3. They are in one of the following situations: a. They are unserved and one of the following:
• Homeless or at risk of becoming homeless.
• Involved in the criminal justice system.
• Frequent users of hospital or emergency room services as the primary resource for mental health treatment.
b. They are underserved and at risk of one of the following:
• Homelessness.
• Involvement in the criminal justice system.
• Institutionalization.
D. SMI Older Adults (an adult 60 years or older) who meet ALL of the following: 1. They meet the criteria in (C)(1) above. 2. Due to mental functional impairment and circumstances, they are likely to become so disabled as to require
public assistance, services, or entitlements. AND 3. They are in one of the following situations:
a. They are unserved and one of the following:
• Experiencing a reduction in personal and/or community functioning.
• Homeless.

Draft Report – for Stakeholder Input
Full Service Partnerships: California’s Investment to Support Children and Transition‐Age Youth with Serious Emotional Disturbance and Adults and Older Adults with Severe Mental Illness
Page 77
• At risk of becoming homeless.
• At risk of becoming institutionalized.
• At risk of out of home care.
• At risk of becoming frequent users of hospital and/or emergency room services as the primary resource for mental health treatment.
b. They are underserved and at risk of one of the following:
• Homelessness.
• Institutionalization.
• Nursing home or out‐of‐home care.
• Frequently using hospital and/or emergency room services as their primary resource for mental health treatment.
• Involvement in the criminal justice system.
Needs Assessment Guidelines were provided by the California Mental Health Director’s Association with respect to conducting needs assessment, in order to assist counties in implementation of Full Service Partnerships. 151 The guidelines, as outlined below, do not represent MHSA requirements, but rather, are an example of the tools counties made (and currently make) use of when formulating and adapting their FSP models. Formal needs assessment is defined by the use of an instrument that:
• Has been tested and proved reliable, and is used to help consumers and staff determine what services might be needed. Included in this assessment are:152
- The consumer’s current stage of engagement - Their current level of functional impairment - Their other medical problems or substance abuse - Their available family and community support - Their level of stress and their risk of harm (p. 1)
Individual Services and Supports Plan The individual services and supports plan is defined as a process of partnership that:
• Shall include individualized client/family‐driven mental health services and supports plans which emphasize recovery and resilience, and which offer integrated service experiences for clients and families. Individualized, comprehensive service plans help overcome the problems that result from fragmented or uncoordinated services and systems. (p. 5) 153
151 California Mental Health Directors Association, Adult System of Care Committee. (2008, April). Recommended Guidelines for Levels of
Service. http://www.cmhda.org/committees/documents/ASOC/Handouts/0806/0806_ASOC_Handouts_ASOC_LOS_policy_and_guidelines_April08_%286‐25‐08%29.pdf
152 California Mental Health Directors Association, Adult System of Care Committee. (2008, April). Recommended Guidelines for Levels of Service. http://www.cmhda.org/committees/documents/ASOC/Handouts/0806/0806_ASOC_Handouts_ASOC_LOS_policy_and_guidelines_April08_%286‐25‐08%29.pdf
153 California Department of Mental Health. (2005, August). Mental Health Services Act Community Services and Supports Three‐Year Program Expenditure Plan Requirements. http://www.dmh.ca.gov/dmhdocs/docs/letters05/05‐05CSS.pdf

Draft Report – for Stakeholder Input
Full Service Partnerships: California’s Investment to Support Children and Transition‐Age Youth with Serious Emotional Disturbance and Adults and Older Adults with Severe Mental Illness
Page 78
Service Delivery based on Needs Assessment & Individual Services and Supports Plan One goal of a transformed mental health system is to enter into partnership with clients and their families, and to provide services based on the client’s needs, rather than to try to fit the client into pre‐existing service models. This necessitates up‐front planning jointly with the client, accounting for individual needs and preferences.
4. Required MHSA Practices
The California Department of Mental Health outlined a series of expected “best practices” for counties and municipalities to implement when providing Full Service Partnership services. These practices, if implemented as intended, reflect a fundamental shift away from the practice of providing service at the clinic setting (the image of the metal detectors at the door and the crowded waiting room comes to mind) to providing services out in the community. The shift may be characterized as follows:
• Convenience of clients takes priority over convenience of clinical staff (re: scheduled meeting times, meeting in field vs. clinic);
• Small caseloads/personal interaction are preferable to large caseloads/little time with clients; and
• 24/7 availability of someone known to the client (clinician or peer paraprofessional) is the basic expectation, compared to a system in which clients in crisis can expect to be transferred to a county hotline after hours or to an on‐call clinician.
The end result of the shift should be a more humane manner of interacting with clients, and a more engaged clientele. Operational definitions for each of the MHSA requirements are provided below.
Low Caseload Per DMH guidance:
• All fully served individuals will have a single point of responsibility – Personal Service Coordinators for Adults, case managers for children and youth – with a caseload that is low enough so that:
1. Their availability to the individual and family is appropriate to their service needs, 2. They are able to provide intensive services and supports when needed, and 3. They can give the individual served and/or family member considerable personal attention. (p. 22)154
Early implementation instructions were provided to counties/municipalities during conference calls with DMH regarding suggested staff/client ratios. 155
Consumers/Family Members on Staff The initial CSS Plan instructions to counties and municipalities156 outline the expectation that clients and their family members will be involved in “all aspects of the public mental health system” (p. 3). DMH operationalized one aspect of what “involvement” equates to – “client and family‐operated services” (p. 3). The communiqué further provides examples of types of services and strategies that are appropriate for peer paraprofessionals and family members to operate for each age group. 154 Ibid. 155 Maria Iyog‐O’Malley, former MHSA Coordinator for the San Francisco Department of Mental Health, personal communication, February 1, 2012. When applying criteria to rating county/municipal plans, criteria were applied fractionally for counties/municipalities proposing caseloads smaller than 20. 156 Ibid.

Draft Report – for Stakeholder Input
Full Service Partnerships: California’s Investment to Support Children and Transition‐Age Youth with Serious Emotional Disturbance and Adults and Older Adults with Severe Mental Illness
Page 79
Tandem to each description is the expectation that paraprofessionals be appropriately trained, in order to provide them with the necessary skills and background to assist them in fulfilling their roles and feeling supported in doing so. Implicit is the expectation that the time of consumers and their families providing ground‐level expertise is valuable, and therefore, they should be compensated as paid staff members.157
24/7 Coverage The requirement for 24/7 coverage by a person known to the client/family represents a major advantage over the traditional system of care. Prior to the FSP program, clients in many counties could expect to either be directed to 911 in the event of a mental health crisis, or to a county hotline and a complete stranger. The 911 option represents an extremely costly option for what many times could be resolved by the intervention of a reasonable advocate (for example, intervening with a landlord threatening to evict the client in the middle of the night).158 The county hotline, on the other hand, although staffed by well‐meaning individuals, is impersonal and can be very inefficient when trying to assist individuals with very complicated needs and histories.
A staff member (clinician or paraprofessional) known to the client/family has the advantage of an existing alliance with the client/family, knows the client/family’s history, and has access to the community and other agencies that the client/family is engaged with for services. In short, the staff member can cut through red tape and quickly assist, where others would be faced with conducting detailed assessments or making decisions about emergency hospitalization.
The requirement for 24/7 coverage by a staff person known to the client/family has, in and of itself, enormous potential for savings in terms of reducing emergency hospitalizations (a hypothesis we explore, later in this report).
Services in the Community versus the Clinic Meeting clients/family members in settings that they are comfortable with, instead of asking them to come to foreign places for service, should not be a revolutionary concept. Yet the traditional public mental health system, in many regards, is still built around the old traditional concept that is prevalent in popular culture – the client coming in to the therapist’s office, with the traditional waiting room where the client checks in up at the front desk (except in some public mental health clinics, there is a security guard at the front door, and the client must first pass through a metal detector before they check in).
Contrast this setting to one that is more typical of social work – the professional or paraprofessional makes arrangements to meet the client/family at their home, or in a public setting comfortable to the family (e.g.,
157 The expectation that clients and family members will be employed on staff was stated explicitly in a briefing document produced by the Client and Family Leadership Committee in March 2011 (explicit recommendation). The Vision and Guiding Principles in place prior to this document, however, strongly recommend simply “increasing” the number of client and family‐run services (implicit recommendation). The only explicit requirement was the expansion of peer support (p. 25 of the Community Supports and Services Plan guidance), but there is no explicit requirement that these positions be paid. California MHSOAC Client and Family Leadership Committee. (2011, March). Transformation of the Mental Health System through Client and Family Leadership (DRAFT). http://www.mhsoac.ca.gov/meetings/docs/Meetings/2011/Mar/OAC_March2011_Tab4_DraftTransformationPaper.pdf California Department of Mental Health (DMH). (2005, February). Vision Statement and Guiding Principles for DMH Implementation of the Mental Health Services Act. http://www.dmh.ca.gov/prop_63/mhsa/docs/Vision_and_Guiding_Principles_2‐16‐05.pdf California Department of Mental Health. (2005, August). Mental Health Services Act Community Services and Supports Three‐Year Program Expenditure Plan Requirements. http://www.dmh.ca.gov/dmhdocs/docs/letters05/05‐05CSS.pdf 158 This author was one of the few LA County DMH FFS providers on call 24/7 (prior to MHSA), and provided just such an intervention for a Medi‐Cal client suffering from schizophrenia. This author (also a licensed psychologist) informed the landlord of her client’s rights under the law (eviction in the middle of the night without due notice was, of course, illegal). A more suitable (Section 8) placement was eventually found for this client.
Draft Report – for Stakeholder Input
Full Service Partnerships: California’s Investment to Support Children and Transition‐Age Youth with Serious Emotional Disturbance and Adults and Older Adults with Severe Mental Illness
Page 80
community center, park). There are no armed guards, no metal detectors – the message is one of alliance, not opposition. 159
5. MHSA Principles
In its “Vision and Guiding Principles” document published in 2005, the California Department of Mental Health acknowledged challenging the standard of care by articulating a set of recovery and resiliency‐oriented principles to guide implementation of the Mental Health Services Act.160 Due to the radical departure from what DMH termed “business as usual” (p. 1), guiding principles were laid out and defined to a certain degree (depending upon the principle and the level of abstraction). The foundational nature of the MHSA principles cannot be over‐stated. DMH referred to them in the Community Supports and Services Plan as “Essential Elements.” Further:
• There are five fundamental concepts inherent in the MHSA that must be embedded and continuously
addressed throughout the Program and Expenditure Plans submitted by counties. (p. 4) 161
The guiding principles and the operational definitions as originally described by DMH are below.
Client/FamilyDriven Mental Health System 162 The President’s New Freedom Commission on Mental Health 163 identified an inherent weakness in many public mental health systems ‐ clients and their family members did not have a meaningful say in the type of services they received, the service providers to which they were assigned, or how public mental health dollars were allocated toward service programs. Per the synopsis in DMH Letter 05‐05:
• Increasing opportunities to have greater choices over such things as types of service, providers, and how service dollars are spent, facilitates personal responsibility, creates an economic interest in obtaining and sustaining recovery, and shifts the incentives towards a system that promotes learning, self monitoring, and accountability. Increasing choice protects individuals and encourages quality. (p. 5) 164
Cultural Competence 165 The reduction of racial and cultural disparities in access to services and receipt of services is central to the MHSA vision. In addition, the following expectations are set forth:
• Implementation of more culturally and linguistically competent assessments and services that are responsive to a client’s and family’s culture, race, ethnicity, age, gender, sexual orientation and religious/spiritual beliefs. (p. 4) 166
159 This is not to negate the very real danger that clinicians sometimes face (e.g., the tragedy that prompted Laura’s Law). Nonetheless, the flexible nature of the FSP program allows counties/municipalities to develop appropriate outreach, recruitment, and screening practices that work toward bringing in those who will benefit from FSP services, and flag those for whom a community‐based intervention may not be appropriate due to staff safety and other concerns. 160 California Department of Mental Health (DMH). (2005, February). Vision Statement and Guiding Principles for DMH Implementation of the Mental Health Services Act. http://www.dmh.ca.gov/prop_63/mhsa/docs/Vision_and_Guiding_Principles_2‐16‐05.pdf 161 California Department of Mental Health. (2005, August). Mental Health Services Act Community Services and Supports Three‐Year Program Expenditure Plan Requirements. http://www.dmh.ca.gov/dmhdocs/docs/letters05/05‐05CSS.pdf 162 Ibid, p. 5. 163 New Freedom Commission on Mental Health (2003). Achieving the Promise: Transforming Mental Health Care in America. Executive Summary. DHHS Pub. No. SMA‐03‐3831. Rockville, MD. 164 California Department of Mental Health. (2005, August). Mental Health Services Act Community Services and Supports Three‐Year Program
Expenditure Plan Requirements. http://www.dmh.ca.gov/dmhdocs/docs/letters05/05‐05CSS.pdf 165 Ibid, p. 5.

Draft Report – for Stakeholder Input
Full Service Partnerships: California’s Investment to Support Children and Transition‐Age Youth with Serious Emotional Disturbance and Adults and Older Adults with Severe Mental Illness
Page 81
The manner in which counties and municipalities define culturally appropriate and linguistically competent assessments and services was not specified nor mandated in the Vision and Guiding Principles document. However, Community Services and Supports Plan guidance provided additional details about what was expected in order to realize the vision of cultural competence.167 In addition, DMH Cultural Competence Plan Requirements were cited as a reference source for counties/municipalities to refer to for further implementation guidance (p. 5).
Collaboration with Community Services The Vision and Guiding Principles document lays out the “big picture” with respect to collaboration:
• Significant increases in the numbers of agencies, employers, community based organizations and schools that recognize and participate in the creation of opportunities for education, jobs, housing, social relationships and meaningful contributions to community life for all, including persons with mental illness. (p. 4) 168
Collaboration with community services refers to the mechanics of interacting with interested parties in order to exchange information and share resources to support people in their recovery process.
Integrated Service Experience for Clients The hallmark of integrated service delivery is a “seamless” system of care, from the perspective of the client and family (p. 6). 169 In order to accomplish delivery of service that is integrated, a necessity is joint planning between the various agencies involved with the client/family. In the absence of coordinated service plans, individual agencies/providers continue to interact with clients/families in a “silo” manner. Clients/families experience disjointed interactions with multiple providers, who give sometimes conflicting messages and instructions. When the client/family is the focus (as discussed above), the paradigm shifts from the convenience of the provider/agency to developing a plan of care “to best address the individual/family’s needs.” (p. 6) 170
Wellness Focus (which includes Recovery & Resilience) This concept is one of the most revolutionary and important concepts in mental health. Although recovery has long been a cherished belief in the addiction field, this mantra has only been adopted on a broad scale in the field of mental health within the past decade.171 The Federal Substance Abuse and Mental Health Services Administration recently elevated recovery to even greater prominence in its 2011–14 strategic plan. Although the previous plan (2006–11) emphasized resiliency and recovery, the current plan is unequivocal in its language – Treatment is Effective. People recover. 172
6. Outpatient Mental Health Services
DMH Letter 05‐05 notes that clients and their families are to have access to:
166 California Department of Mental Health (DMH). (2005, February). Vision Statement and Guiding Principles for DMH Implementation of the
Mental Health Services Act. http://www.dmh.ca.gov/prop_63/mhsa/docs/Vision_and_Guiding_Principles_2‐16‐05.pdf 167 California Department of Mental Health. (2005, August). Mental Health Services Act Community Services and Supports Three‐Year Program
Expenditure Plan Requirements. http://www.dmh.ca.gov/dmhdocs/docs/letters05/05‐05CSS.pdf 168 Ibid. 169 Ibid. 170 Ibid. 171 Substance Abuse and Mental Health Services Administration. (2003). Strategies for Developing Treatment Programs for People With Co‐
Occurring Substance Abuse and Mental Disorders. SAMHSA Publication No. 3782. Rockville, MD: SAMHSA. http://www.fccmh.org/resources/docs/Strategies.pdf
172 Substance Abuse and Mental Health Services Administration. (2011). Leading Change: A Plan for SAMHSA’s Roles and Actions 2011‐2014 Executive Summary and Introduction. HHS Publication No. (SMA) 11‐4629 Summary. Rockville, MD: Substance Abuse and Mental Health Services Administration.

Draft Report – for Stakeholder Input
Full Service Partnerships: California’s Investment to Support Children and Transition‐Age Youth with Serious Emotional Disturbance and Adults and Older Adults with Severe Mental Illness
Page 82
• The full range of community‐based treatment, case management, and interagency system components required by children/transition age youth/adults/older adults. (p. 6) 173
The following are examples of outpatient mental health services:
• Individual and group therapy, 174
• Medication support, 175
• Crisis intervention, 176 and
• Case management/brokerage. 177
7. Outpatient Mental Health Services
The requirement to do “whatever it takes” for FSP clients implies a broad range of services and supports not typically associated with the traditional mental health model. Examples include:
Instrumental Support Services 178 DMH Letter 06‐07 provides clarification around the ability of FSP programs to meet the instrumental (daily living) needs of clients and their family members: The cost of providing supports to clients, family members, and caregivers including cash payments, vouchers, goods, services, items necessary for daily living (such as food, clothing, hygiene, etc.).
Educational/Employment Supplies Although not explicitly suggested in any DMH guidelines, some counties proposed assisting clients and families in obtaining school and work supplies (e.g., college text books, uniform for work).
Recreation/Social Activities Providing clients and families with meaningful opportunities to interact socially with peers in a relaxed setting is consistent with a recovery‐oriented model. The expectation (as described in the Community Services and Supports Plan Requirements) is for clients to be involved and engaged in the planning of recreational and social activities.
173 California Department of Mental Health. (2005, August). Mental Health Services Act Community Services and Supports Three‐Year Program
Expenditure Plan Requirements. http://www.dmh.ca.gov/dmhdocs/docs/letters05/05‐05CSS.pdf 174 California Department of Mental Health. (2008, July). Mental Health Medi‐Cal Billing Manual (Version 1.0). Sacramento: Author. DMH’s billing manual for Medi‐Cal mental health services describes individual and group therapy in terms of purpose, and describes the settings in which Medi‐Cal will not reimburse for service. Individual and group therapy are not described per se. Rather, activities that may occur during individual and group therapy are listed (e.g., assessment, planning, therapy). 4.2.12 Mental Health Services: Title 9, Section 1810.227, p. 4‐12. 175 Ibid. 4.2.12 Mental Health Services: Title 9, Section 1810.25, p. 4‐13. Medication Support Services are those services that include prescribing, administering, dispensing and monitoring psychiatric medications or biologicals that are necessary to alleviate the symptoms of mental illness. Service activities may include but are not limited to evaluation of the need for medication; and collateral and plan development related to the delivery of the service and/or assessment of the patient. (p. 4‐13) 176 Ibid. 4.2.12 Mental Health Services: Title 9, Section 1840.338 & 1840.348, p. 4‐13. The ability to intervene in a psychiatric emergency without the requirement to hospitalize is important to maintaining the liberty and self‐determination of clients in the public mental health system. Crisis Intervention (as compared to Crisis Stabilization) provides the mechanism for doing so in an outpatient setting. Another characteristic is the brevity of intervention length (less than 24), compared to the longer time frames employed for Crisis Stabilization. 177 Ibid. 4.2.12 Mental Health Services: Title 9, Section 1840.249, p. 4‐12. Case Management/Brokerage is a service that assists a patient to access needed medical, educational, social, pre‐vocational, rehabilitative, or other community services. The service activities may include, but are not limited to: communication, coordination, and referral; monitoring service delivery to ensure patient access to service and the service delivery system; monitoring the patient’s progress; placement services; and plan development. (italics added, p. 4‐12) 178 California Department of Mental Health (2006, August). Definitions for New Service Functions under Mode 60: Support Services. Sacramento: Author. http://www.dmh.ca.gov/dmhdocs/docs/Letters06/06‐07_EnclosureA_1.pdf This does not include housing supports and capital expenditures or the salaries and benefits of staff used to provide client flexible supports. (p. 1)

Draft Report – for Stakeholder Input
Full Service Partnerships: California’s Investment to Support Children and Transition‐Age Youth with Serious Emotional Disturbance and Adults and Older Adults with Severe Mental Illness
Page 83
Transportation A viable means to move about in the community is critical to full engagement as a citizen in a recovery‐oriented treatment program. Transportation therefore becomes the linkage for clients who may not otherwise have the means to move easily and freely about, particularly in rural counties with large geographic distances, 179 or in counties with long commute times due to heavy traffic.
Other Support Services • Respite Services 180
• Supportive Employment/Education 181
• Psychoeducation 182
• Family Education 183
• Parenting Education 184
• Intimate Partner Violence Services 185
8. Peer Support Services
One of the many services offered by Counties includes a team of peer clients and peer family member staff. The team consists of multicultural and bilingual staff, clients, and family members who are hired to assist in addressing elimination of disparities to underserved and unserved racial/ethnic clients and family members (p.26).186
It is recommended that members of the team: 1. Be knowledgeable of the barriers specific to targeted racial ethnic groups for whom county is trying to
increase access and appropriateness of care 2. Have knowledge of how to engage the gatekeepers of multicultural groups/communities
179 Transportation is particularly valuable in rural counties with little to no transportation infrastructure, and/or counties where long travel
times are required in order to access services. 180 California Department of Mental Health. (2005, August). Mental Health Services Act Community Services and Supports Three‐Year Program Expenditure Plan Requirements. http://www.dmh.ca.gov/dmhdocs/docs/letters05/05‐05CSS.pdf Respite services are allowable under the Full Service Partnership program for all age groups:
• Respite services for both children/youth and families (p. 27) • Respite housing for [adult] clients and families (p. 33) • In‐home respite services for families who are housing and supporting an older adult with mental illness (p. 36)
181 Ibid. Productive activities and personal growth opportunities including development of job options for clients such as social enterprises, agency‐supported positions, and competitive employment options as well as volunteerism and other creative activities. (pp. 32‐33) 182 A fully informed constituency is a critical element of the Mental Health Services Act. Toward that end, Full Service Partnership strategies include education about the mental health assessment and diagnosis process, the manner in which the service plan is development, treatment options, medication and client rights with respect to medication, and other relevant information. 183 Ibid. The Community Services and Supports Plan required Family Education be addressed as a strategy in the Full Service Partnership program. (p. 25) Suggested strategies include: CYF: Parental mental health education, with language access and culturally appropriate approaches; Supportive family partnership educational opportunities. (pp. 27‐28); TAY: Education for family and other caregivers as appropriate regarding the nature of medications, the expected benefits and potential side effects. (p. 30); Adults/Older Adults: Education for family and other caregivers as appropriate to maximize individual choice about the nature of medications, the expected side effects, and expected benefits, including alternatives. (p. 32) 184 Offering Parenting Education to family members caring for a child/youth with serious emotional disorders or, adults with serious mental illness who have children does not imply that they are poor parents in need of education. Rather, dealing with serious emotional disorders/serious mental illness can test the mettle of even the most patient and well‐educated parent. Learning about parenting in a safe environment that is free from judgment represents a “value‐added” service when peers can seek support from one another, as well as learn skills unique to their situation. 185 Specialized services to address the specific needs of individuals suffering from intimate partner violence may include counseling, placement in temporary protective shelter, assistance in obtaining a restraining order, guidance on legal rights, etc. 186 California Department of Mental Health (2005). Technical Assistance Documents: To Aid Counties in Preparing The Three‐Year Program and Expenditure Plan

Draft Report – for Stakeholder Input
Full Service Partnerships: California’s Investment to Support Children and Transition‐Age Youth with Serious Emotional Disturbance and Adults and Older Adults with Severe Mental Illness
Page 84
3. Encourage the leadership of clients and family members of these diverse groups. Leadership among racial/ethnic clients and family members is needed to give voices to these relatively unheard stakeholders
4. Include those who are bilingual to help address monolingual and bilingual clients who experience barriers to access to care
5. Help to create and imbed cultural and linguistically appropriate services in collaboration with other county client‐run programs, such as peer support programs, etc. (p.26).187
According to National Alliance Mental Illness in California, the Peer‐to‐Peer program is unique, experiential learning program for people with any serious mental illness who are interested in establishing and maintaining their wellness and recovery. 188
Specific Positions for Peers Peer teams are staffed by consumers and family members. When appropriate, they often take on roles such as Mentors, Counselors, Educators and Advocates, etc. Such team members are valuable in providing referrals to community resources and providing general support to their peers.
According to Peer Support among Inpatients in an Adult Mental Health Setting (2010), peer support is a thoughtful process that involves observing, reflecting, taking action, and evaluating outcomes. Supportive actions include helping with activities of daily living, sharing material goods, providing information and advice, sharing a social life, and offering emotional support. This leads to various positive outcomes for providers and recipients of peer support, such as improved mental health outcomes and quality of life (p. 589). 189
Peer staff members have often utilized such services in the past and, with proper training, are equipped to provide such services to other peers.
Strategies where Peers are part of the Team The Mental Health Services Act (MHSA) funds public mental health agencies in order to prepare to recruit, hire, train, support and retain multicultural clients, family members and parents/caregivers as employees 190 so that they are prepared to handle common issues.
According to Solomon (2004), peer support can be defined as ‘‘social emotional support, frequently coupled with instrumental support, that is mutually offered or provided by persons having a mental health condition to others sharing a similar mental health condition to bring about a desired social or personal change’’ (p. 699). 191
Peers often provide services such as outreach and engagement programs, run social and recreational activities; provide child care support, housing support and transportation; provide support with instrumental needs such as housekeeping, grocery shopping and other general needs. Peers also offer peer‐run self‐help classes, a warm‐line and Drop‐in Centers, where clients can go and receive support for specific needs.
Peers Augmenting the Overall Capacity of the Staff Team In a comprehensive review of self‐help and consumer‐operated programs to date, Campbell (2005) examined several studies of self‐help programs for mental health clients which, taken together, suggest that self‐help and
187 Ibid. 188 National Alliance Mental Illness California http://www.namicalifornia.org/program‐services.php?page=prog‐services‐home&lang=eng 189 Bouchard, L. (2010). Peer Support among Inpatients in an Adult Mental Health Setting. Issues In Mental Health Nursing, 31(9), 589‐598. 190 National Alliance Mental Illness California http://www.namicalifornia.org/education.php?page=working‐well‐together&lang=eng 191 As seen in Schutt, R. K., & Rogers, E. (2009). Empowerment and peer support: structure and process of self‐help in a consumer‐run center for individuals with mental illness. Journal Of Community Psychology, 37(6), 697‐710.

Draft Report – for Stakeholder Input
Full Service Partnerships: California’s Investment to Support Children and Transition‐Age Youth with Serious Emotional Disturbance and Adults and Older Adults with Severe Mental Illness
Page 85
peer support programs can promote empowerment and recovery increase social support, functioning, and activities (p. 699). 192 Participants learned from others how to meet the needs of people in situations similar to their own and then taught others how to meet their own needs in the same ways. Through this process of learning and sharing, Center participants developed a sense of their own capacities and strengthened their bonds with others (p.706). 193
Peers augment the program by running support groups an various topics, fill ethnic disparities, share their own personal stories and teach socialization and communication skills. Furthermore, peers are aware of community services and collaborate with other agencies in order to provide the best and most appropriate services to their peers.
9. Housing
The housing options under the Full Service Partnership reviewed and summarized for the purpose of this report are county‐directed housing efforts, not CalHFA Housing (the Governor’s Homelessness Initiative). County‐directed efforts were described in the Community Services and Supports Plan, 194 and further elaborated in DMH Letter 06–07, and do “not include the capital costs used to purchase, build or rehab housing or the salaries and benefits of staff used to provide client housing supports.” (p. 1) 195
Housing Support Housing Support refers to “The cost of providing housing supports, including housing subsidies for permanent, transitional and temporary housing; master leases; motel and other housing vouchers; rental security deposits; first and last month rental payments; and other fiscal housing supports.” (p. 1) 196
Operating Support Per DMH guidance, “The operating costs of providing housing supports to clients, including building repair and maintenance, utilities, housing agency management fees, insurance, property taxes and assessments, credit reporting fees, and other operating costs incurred in providing client housing supports.” (p. 1) 197
Housing Placement The Community Services and Supports Plan guidance notes “supportive housing” in particular as a desired strategy to assist clients and their families (p. 28). Supportive housing is further defined in the section describing appropriate strategies for Transition Age Youth: 1. Housing is permanent, meaning that each tenant may stay as long as he or she pays his or her share of rent
and complies with the terms of a lease or rental agreement, 2. Housing is affordable, meaning that each tenant pays no more than 30 percent to 50 percent of household
income, and
192 As seen in Schutt, R. K., & Rogers, E. (2009). Empowerment and peer support: structure and process of self‐help in a consumer‐run center for individuals with mental illness. Journal Of Community Psychology, 37(6), 697‐710. 193 Schutt, R. K., & Rogers, E. (2009). Empowerment and peer support: structure and process of self‐help in a consumer‐run center for individuals with mental illness. Journal Of Community Psychology, 37(6), 697‐710. 194 Ibid. 195 California Department of Mental Health (2006, August). Definitions for New Service Functions under Mode 60: Support Services. Sacramento: Author. http://www.dmh.ca.gov/dmhdocs/docs/Letters06/06‐07_EnclosureA_1.pdf 196 Ibid. 197 Ibid.

Draft Report – for Stakeholder Input
Full Service Partnerships: California’s Investment to Support Children and Transition‐Age Youth with Serious Emotional Disturbance and Adults and Older Adults with Severe Mental Illness
Page 86
3. Tenants have access to an array of support services that are intended to support housing stability, recovery and resiliency, but participation in support services is not a requirement for tenancy. (p. 29) 198
10. FSP Team Composition
Guidance for FSP team structure comes from the federal Substance Abuse and Mental Health Services Administration. Recommendations related to the number of psychiatrists, nurse practitioners, and social workers are provided. In addition, collaboration through a team approach is the recommended standard of care. 199
Number of Psychiatrist/Nurse Practitioner Staff Guidelines provided by the Substance Abuse and Mental Health Services Administration (SAMHSA) suggest that one full‐time psychiatrist be on staff for every 100 clients. In addition to serving as the program’s medical director, SAMHSA advises that the psychiatrist be fully integrated into the service team (rather than functioning solely to prescribe medication, as was the case historically). The other crucial team member is the nurse practitioner – two full‐time staff members are recommended for every 100 clients. 200
Number of Social Worker Staff SAMHSA guidelines suggest that a social worker on staff meet at least once a week with each client on his/her caseload. 201
Team Approach The SAMHSA stricture 202 to function as a team, rather than in independent silos fits nicely with the MHSA requirement for seamless, integrated services. 203
11. Co‐Occurring Disorders
Guidance provided by DMH in the Community Services and Supports Plan Requirements emphasizes the integration of substance use disorder services with mental health services into one services and supports plan. 204
Substance Abuse Treatment Services Additional recommendations include provision of service through an integrated team and in a parallel time frame, as compared with the “services as usual” model where mental health services and substance abuse treatment services are completely separate, and provided sequentially. 205
198 California Department of Mental Health. (2005, August). Mental Health Services Act Community Services and Supports Three‐Year Program Expenditure Plan Requirements. http://www.dmh.ca.gov/dmhdocs/docs/letters05/05‐05CSS.pdf 199 Substance Abuse and Mental Health Services Administration. (2008). Assertive Community Treatment: Building Your Program. DHHS Pub. No. SMA‐08‐4344, Rockville, MD: Center for Mental Health Services, Substance Abuse and Mental Health Services Administration, U.S. Department of Health and Human Services. When applying criteria to counties/municipalities with proposed caseloads fewer than 100, the ratio was applied fractionally. 200 Ibid. 201 Ibid. 202 Ibid. 203 California Department of Mental Health. (2005, August). Mental Health Services Act Community Services and Supports Three‐Year Program
Expenditure Plan Requirements. http://www.dmh.ca.gov/dmhdocs/docs/letters05/05‐05CSS.pdf 204 California Department of Mental Health. (2005, August). Mental Health Services Act Community Services and Supports Three‐Year Program
Expenditure Plan Requirements. http://www.dmh.ca.gov/dmhdocs/docs/letters05/05‐05CSS.pdf 205 Ibid.

Draft Report – for Stakeholder Input
Full Service Partnerships: California’s Investment to Support Children and Transition‐Age Youth with Serious Emotional Disturbance and Adults and Older Adults with Severe Mental Illness
Page 87
12. FSP Services Summary
The overall vision of doing “whatever it takes” to aid individuals with severe mental illness/serious emotional disturbance has given birth to an overall framework under which an organized array of services are provided across the State. Activities offered under the Full Service Partnership have been classified, for the purpose of analysis through the lens of cost offset, as basic or value‐added in nature.
Draft Report – for Stakeholder Input
Full Service Partnerships: California’s Investment to Support Children and Transition‐Age Youth with Serious Emotional Disturbance and Adults and Older Adults with Severe Mental Illness
Page 88
Appendix B Planned FSP Services by County (Note: In the Final Report, tables displaying services by county will be contained in this appendix. Service definitions precede the table. Hence the reason definition tables currently skip numbers in order to keep placeholders for the final tables with by‐county results. Statewide summary tables will be contained in the body of the Final Report, due September 30, 2012.)

Draft Report – for Stakeholder Input
Full Service Partnerships: California’s Investment to Support Children and Transition‐Age Youth with Serious Emotional Disturbance and Adults and Older Adults with Severe Mental Illness
Page 89
Table B.1 Counties Reporting Planned Implementation of Full Service Partnership Services to Children, Youth and Families (CYF):
Outreach, Recruitment, Assessment and Planning Key Terminology
SERVICE COMPONENT DEFINITION
Outreach to Underserved/ Unserved Populations
Outreach and Engagement Funding – funds for outreach and engagement of those populations that are currently receiving little or no service (DMH Letter 05‐05).
Underserved is defined as one who has been diagnosed with serious mental illness or serious emotional disturbance and is receiving services, but is not provided the necessary or appropriate opportunities to support his/her recovery, wellness, and/or resilience. The underserved may include but are not limited to:
1. Those who are poorly served that they are at risk of homelessness, institutionalization, incarceration, out‐of‐home placement or other serious consequences;
2. Members of ethnic/racial, cultural, and linguistic populations that do not have access to mental health programs due to barriers such as poor identification of their mental health needs, poor engagement and outreach, limited language access, and lack of culturally competent services; and
3. Those in rural areas, Native American Rancherias and/or reservations who are not receiving sufficient services.
Unserved are those who may have serious mental illness and/or serious emotional disturbance and are not receiving mental health services, including individuals who may have had only emergency or crisis‐oriented contacts and/or services from the County.
Recruitment – Priority to Unserved Populations
DMH Letter 05‐05
Counties must determine, through their planning process, which populations are the most appropriate to focus on during the first three years. These decisions should be made in the context of the community issues and mental health needs identified in selecting initial populations, specific attention should be paid to populations and individuals that are currently unserved, and to reducing racial/ethnic disparities.
Assessment & Planning – FSP Eligibility
Who is eligible for FSP? (Welfare & Institutions Code 5600)
Children and adolescents identified as Seriously emotionally disturbed (SED) are eligible for FSPs if they meet the criteria set forth in Welfare and Institutions Code section 5600.3, subdivision (a). Adults and older adults identified to have a serious mental disorder are eligible for FSPs if they meet the criteria set forth in subdivision (b) of section 5600.3.
A. SED Children who fall into at least ONE of the following groups: GROUP 1: 1. As a result of the mental disorder, the child has substantial impairment in at least two of these areas:
• Self–care.
• School functioning.
• Family relationships.
• Ability to function in the community. AND 2. Either of the following occur:
• The child is at risk of or has already been removed from the home.
• The mental disorder and impairments have been present for more than six months or are likely to continue for more than one year without treatment.
GROUP 2: The child displays at least ONE of the following features: 1. Psychotic features. 2. Risk of suicide. 3. Risk of violence due to a mental disorder.
GROUP 3: The child meets special education eligibility requirements under Chapter 26.5 of the Government Code.
http://www.leginfo.ca.gov/cgi‐bin/displaycode?section=wic&group=05001‐06000&file=5600‐5623.5
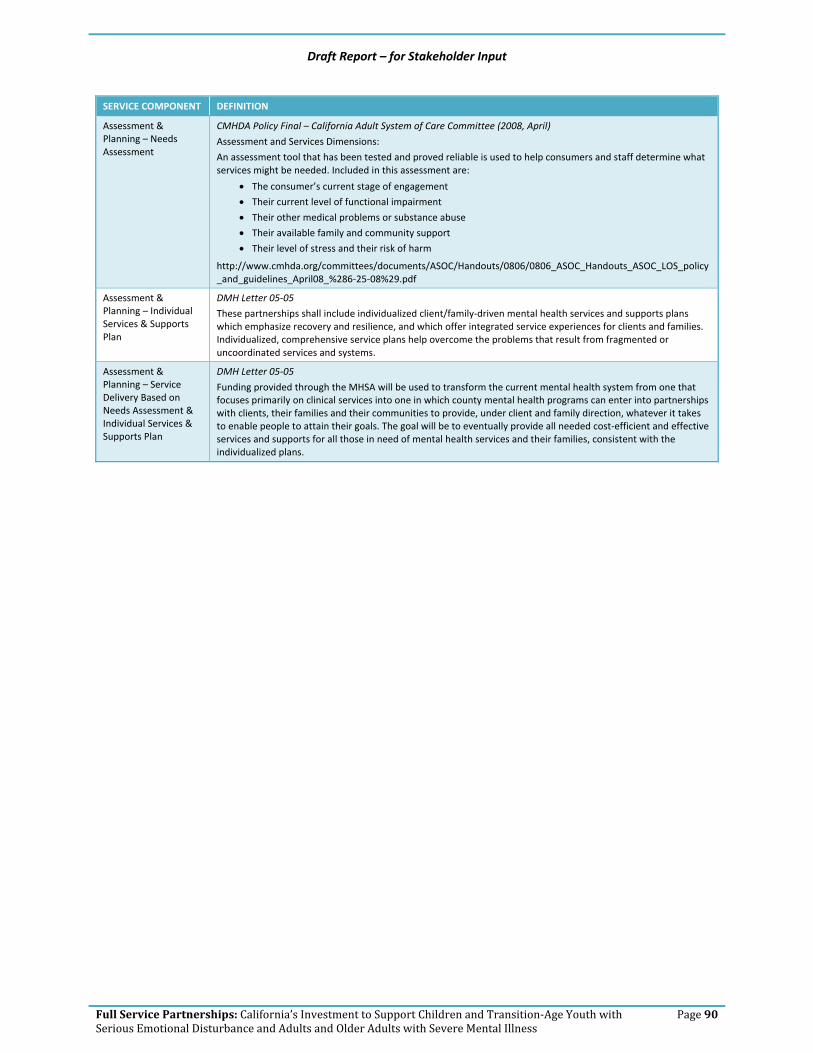
Draft Report – for Stakeholder Input
Full Service Partnerships: California’s Investment to Support Children and Transition‐Age Youth with Serious Emotional Disturbance and Adults and Older Adults with Severe Mental Illness
Page 90
SERVICE COMPONENT DEFINITION
Assessment & Planning – Needs Assessment
CMHDA Policy Final – California Adult System of Care Committee (2008, April)
Assessment and Services Dimensions:
An assessment tool that has been tested and proved reliable is used to help consumers and staff determine what services might be needed. Included in this assessment are:
• The consumer’s current stage of engagement
• Their current level of functional impairment
• Their other medical problems or substance abuse
• Their available family and community support
• Their level of stress and their risk of harm
http://www.cmhda.org/committees/documents/ASOC/Handouts/0806/0806_ASOC_Handouts_ASOC_LOS_policy_and_guidelines_April08_%286‐25‐08%29.pdf
Assessment & Planning – Individual Services & Supports Plan
DMH Letter 05‐05
These partnerships shall include individualized client/family‐driven mental health services and supports plans which emphasize recovery and resilience, and which offer integrated service experiences for clients and families. Individualized, comprehensive service plans help overcome the problems that result from fragmented or uncoordinated services and systems.
Assessment & Planning – Service Delivery Based on Needs Assessment & Individual Services & Supports Plan
DMH Letter 05‐05
Funding provided through the MHSA will be used to transform the current mental health system from one that focuses primarily on clinical services into one in which county mental health programs can enter into partnerships with clients, their families and their communities to provide, under client and family direction, whatever it takes to enable people to attain their goals. The goal will be to eventually provide all needed cost‐efficient and effective services and supports for all those in need of mental health services and their families, consistent with the individualized plans.
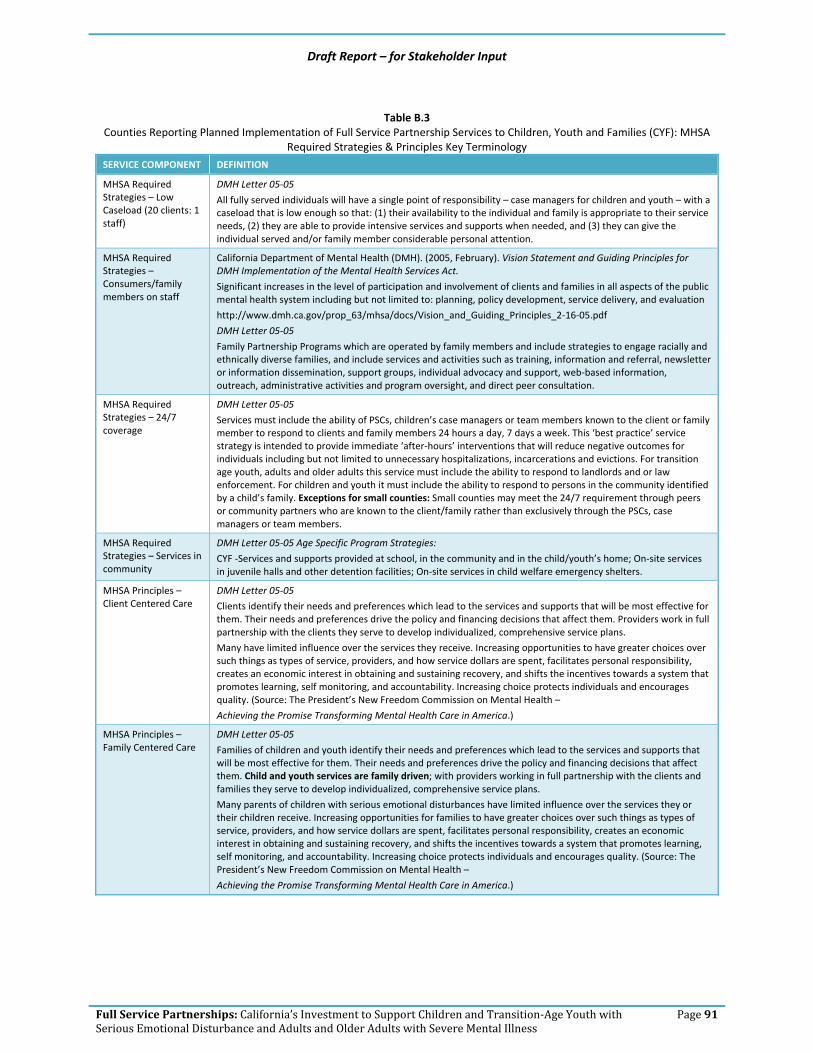
Draft Report – for Stakeholder Input
Full Service Partnerships: California’s Investment to Support Children and Transition‐Age Youth with Serious Emotional Disturbance and Adults and Older Adults with Severe Mental Illness
Page 91
Table B.3
Counties Reporting Planned Implementation of Full Service Partnership Services to Children, Youth and Families (CYF): MHSA Required Strategies & Principles Key Terminology
SERVICE COMPONENT DEFINITION
MHSA Required Strategies – Low Caseload (20 clients: 1 staff)
DMH Letter 05‐05
All fully served individuals will have a single point of responsibility – case managers for children and youth – with a caseload that is low enough so that: (1) their availability to the individual and family is appropriate to their service needs, (2) they are able to provide intensive services and supports when needed, and (3) they can give the individual served and/or family member considerable personal attention.
MHSA Required Strategies – Consumers/family members on staff
California Department of Mental Health (DMH). (2005, February). Vision Statement and Guiding Principles for DMH Implementation of the Mental Health Services Act.
Significant increases in the level of participation and involvement of clients and families in all aspects of the public mental health system including but not limited to: planning, policy development, service delivery, and evaluation
http://www.dmh.ca.gov/prop_63/mhsa/docs/Vision_and_Guiding_Principles_2‐16‐05.pdf
DMH Letter 05‐05
Family Partnership Programs which are operated by family members and include strategies to engage racially and ethnically diverse families, and include services and activities such as training, information and referral, newsletter or information dissemination, support groups, individual advocacy and support, web‐based information, outreach, administrative activities and program oversight, and direct peer consultation.
MHSA Required Strategies – 24/7 coverage
DMH Letter 05‐05
Services must include the ability of PSCs, children’s case managers or team members known to the client or family member to respond to clients and family members 24 hours a day, 7 days a week. This ‘best practice’ service strategy is intended to provide immediate ‘after‐hours’ interventions that will reduce negative outcomes for individuals including but not limited to unnecessary hospitalizations, incarcerations and evictions. For transition age youth, adults and older adults this service must include the ability to respond to landlords and or law enforcement. For children and youth it must include the ability to respond to persons in the community identified by a child’s family. Exceptions for small counties: Small counties may meet the 24/7 requirement through peers or community partners who are known to the client/family rather than exclusively through the PSCs, case managers or team members.
MHSA Required Strategies – Services in community
DMH Letter 05‐05 Age Specific Program Strategies:
CYF ‐Services and supports provided at school, in the community and in the child/youth’s home; On‐site services in juvenile halls and other detention facilities; On‐site services in child welfare emergency shelters.
MHSA Principles – Client Centered Care
DMH Letter 05‐05
Clients identify their needs and preferences which lead to the services and supports that will be most effective for them. Their needs and preferences drive the policy and financing decisions that affect them. Providers work in full partnership with the clients they serve to develop individualized, comprehensive service plans.
Many have limited influence over the services they receive. Increasing opportunities to have greater choices over such things as types of service, providers, and how service dollars are spent, facilitates personal responsibility, creates an economic interest in obtaining and sustaining recovery, and shifts the incentives towards a system that promotes learning, self monitoring, and accountability. Increasing choice protects individuals and encourages quality. (Source: The President’s New Freedom Commission on Mental Health –
Achieving the Promise Transforming Mental Health Care in America.)
MHSA Principles – Family Centered Care
DMH Letter 05‐05
Families of children and youth identify their needs and preferences which lead to the services and supports that will be most effective for them. Their needs and preferences drive the policy and financing decisions that affect them. Child and youth services are family driven; with providers working in full partnership with the clients and families they serve to develop individualized, comprehensive service plans.
Many parents of children with serious emotional disturbances have limited influence over the services they or their children receive. Increasing opportunities for families to have greater choices over such things as types of service, providers, and how service dollars are spent, facilitates personal responsibility, creates an economic interest in obtaining and sustaining recovery, and shifts the incentives towards a system that promotes learning, self monitoring, and accountability. Increasing choice protects individuals and encourages quality. (Source: The President’s New Freedom Commission on Mental Health –
Achieving the Promise Transforming Mental Health Care in America.)
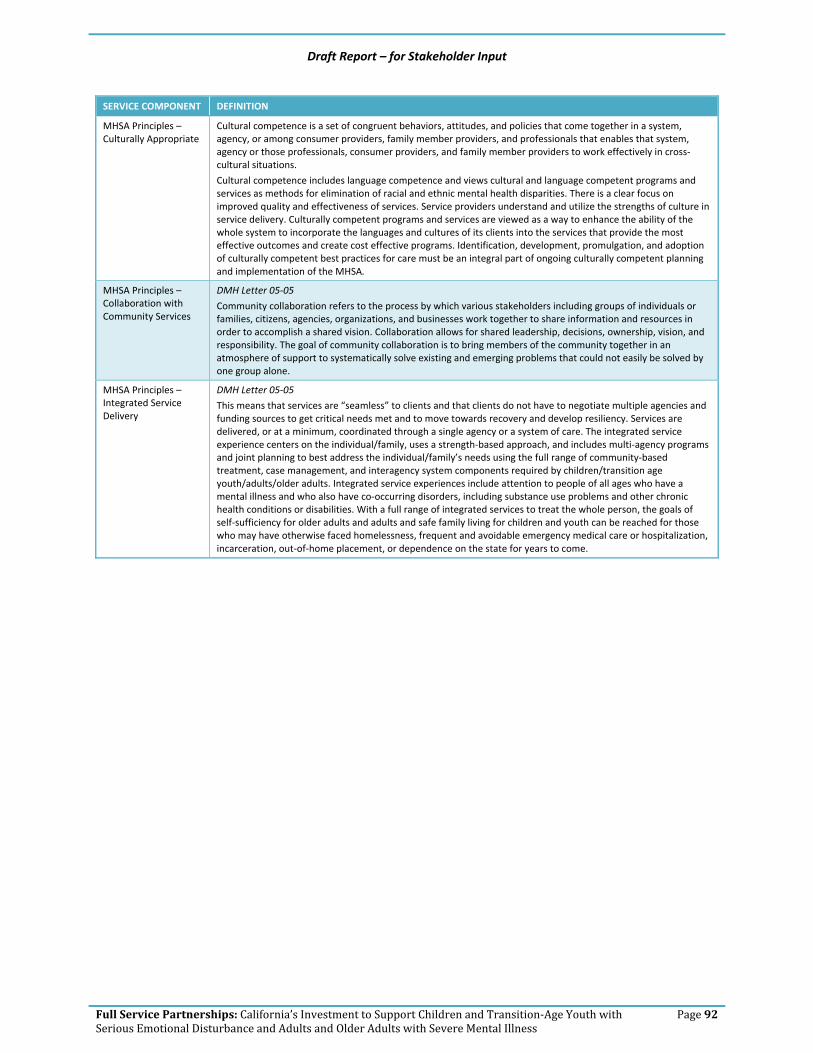
Draft Report – for Stakeholder Input
Full Service Partnerships: California’s Investment to Support Children and Transition‐Age Youth with Serious Emotional Disturbance and Adults and Older Adults with Severe Mental Illness
Page 92
SERVICE COMPONENT DEFINITION
MHSA Principles – Culturally Appropriate
Cultural competence is a set of congruent behaviors, attitudes, and policies that come together in a system, agency, or among consumer providers, family member providers, and professionals that enables that system, agency or those professionals, consumer providers, and family member providers to work effectively in cross‐cultural situations.
Cultural competence includes language competence and views cultural and language competent programs and services as methods for elimination of racial and ethnic mental health disparities. There is a clear focus on improved quality and effectiveness of services. Service providers understand and utilize the strengths of culture in service delivery. Culturally competent programs and services are viewed as a way to enhance the ability of the whole system to incorporate the languages and cultures of its clients into the services that provide the most effective outcomes and create cost effective programs. Identification, development, promulgation, and adoption of culturally competent best practices for care must be an integral part of ongoing culturally competent planning and implementation of the MHSA.
MHSA Principles – Collaboration with Community Services
DMH Letter 05‐05
Community collaboration refers to the process by which various stakeholders including groups of individuals or families, citizens, agencies, organizations, and businesses work together to share information and resources in order to accomplish a shared vision. Collaboration allows for shared leadership, decisions, ownership, vision, and responsibility. The goal of community collaboration is to bring members of the community together in an atmosphere of support to systematically solve existing and emerging problems that could not easily be solved by one group alone.
MHSA Principles – Integrated Service Delivery
DMH Letter 05‐05
This means that services are “seamless” to clients and that clients do not have to negotiate multiple agencies and funding sources to get critical needs met and to move towards recovery and develop resiliency. Services are delivered, or at a minimum, coordinated through a single agency or a system of care. The integrated service experience centers on the individual/family, uses a strength‐based approach, and includes multi‐agency programs and joint planning to best address the individual/family’s needs using the full range of community‐based treatment, case management, and interagency system components required by children/transition age youth/adults/older adults. Integrated service experiences include attention to people of all ages who have a mental illness and who also have co‐occurring disorders, including substance use problems and other chronic health conditions or disabilities. With a full range of integrated services to treat the whole person, the goals of self‐sufficiency for older adults and adults and safe family living for children and youth can be reached for those who may have otherwise faced homelessness, frequent and avoidable emergency medical care or hospitalization, incarceration, out‐of‐home placement, or dependence on the state for years to come.

Draft Report – for Stakeholder Input
Full Service Partnerships: California’s Investment to Support Children and Transition‐Age Youth with Serious Emotional Disturbance and Adults and Older Adults with Severe Mental Illness
Page 93
Table B.5 Counties Reporting Planned Implementation of Full Service Partnership Basic Services to Children, Youth, and Families (CYF):
Outpatient Mental Health Services Key Terminology
SERVICE COMPONENT DEFINITION
Individual Therapy Mental Health Medi‐Cal Billing Manual_V1‐0_07‐17‐08 Mental Health Services are individual or group therapy and intervention services designed to provide reduction of mental disability and restoration, improvement or maintenance of functioning consistent with the goals of learning, development, independent living and enhanced self‐sufficiency and that are not provided as a component of adult residential services, crisis residential treatment services, crisis intervention, crisis stabilization, day rehabilitation, or day treatment intensive. Service activities may include but are not limited to assessment, plan development, therapy, rehabilitation and collateral care.
Group Therapy Mental Health Medi‐Cal Billing Manual_V1‐0_07‐17‐08 Mental Health Services are individual or group therapy and intervention services designed to provide reduction of mental disability and restoration, improvement or maintenance of functioning consistent with the goals of learning, development, independent living and enhanced self‐sufficiency and that are not provided as a component of adult residential services, crisis residential treatment services, crisis intervention, crisis stabilization, day rehabilitation, or day treatment intensive. Service activities may include but are not limited to assessment, plan development, therapy, rehabilitation and collateral care.
Medication Support Mental Health Medi‐Cal Billing Manual_V1‐0_07‐17‐08 Medication Support Services are those services that include prescribing, administering, dispensing and monitoring psychiatric medications or biologicals that are necessary to alleviate the symptoms of mental illness. Service activities may include but are not limited to evaluation of the need for medication; evaluation of clinical effectiveness and side effects; the obtaining of informed consent; instruction in the use, risks and benefits of and alternatives for medication; and collateral and plan development related to the delivery of the service and/or assessment of the patient.
Crisis Intervention Mental Health Medi‐Cal Billing Manual_V1‐0_07‐17‐08 Crisis Intervention services last less than 24 hours, to or on behalf of a patient for a condition that requires more timely response than a regularly scheduled visit. Service activities include but are not limited to one or more of the following: assessment, collateral and therapy. Crisis intervention is distinguished from crisis stabilization by being delivered by providers who do not meet the crisis stabilization contact, site, and staffing requirements described in CCR, Title 9 Articles 1840.33862 and 1840.348.63
Medical Case Management
Mental Health Medi‐Cal Billing Manual_V1‐0_07‐17‐08 Case Management/Brokerage is a service that assists a patient to access needed Medical services. The service activities may include, but are not limited to: communication, coordination, and referral; monitoring service delivery to ensure patient access to service and the service delivery system; monitoring the patient’s progress; placement services; and plan development.
Social Case Management
Mental Health Medi‐Cal Billing Manual_V1‐0_07‐17‐08 Case Management/Brokerage is a service that assists a patient to access needed Social services. The service activities may include, but are not limited to: communication, coordination, and referral; monitoring service delivery to ensure patient access to service and the service delivery system; monitoring the patient’s progress; placement services; and plan development.
Rehabilitative Case Management
Mental Health Medi‐Cal Billing Manual_V1‐0_07‐17‐08 Case Management/Brokerage is a service that assists a patient to access needed rehabilitative services. The service activities may include, but are not limited to: communication, coordination, and referral; monitoring service delivery to ensure patient access to service and the service delivery system; monitoring the patient’s progress; placement services; and plan development.
Educational Case Management
Mental Health Medi‐Cal Billing Manual_V1‐0_07‐17‐08 Case Management/Brokerage is a service that assists a patient to access needed Educational services. The service activities may include, but are not limited to: communication, coordination, and referral; monitoring service delivery to ensure patient access to service and the service delivery system; monitoring the patient’s progress; placement services; and plan development.

Draft Report – for Stakeholder Input
Full Service Partnerships: California’s Investment to Support Children and Transition‐Age Youth with Serious Emotional Disturbance and Adults and Older Adults with Severe Mental Illness
Page 94
Table B.7 Counties Reporting Planned Implementation of Full Service Partnership Services to Children, Youth, and Families (CYF): Other
Supports & Support Services Key Terminology
SERVICE COMPONENT DEFINITION
Other Supports – Instrumental Needs
DMH Letter 06‐07 Client Flexible Support ServicesThe cost of providing supports to clients, family members, and caregivers including cash payments, vouchers, goods, services, items necessary for daily living (such as food, clothing, hygiene, etc.). This does not include housing supports and capital expenditures or the salaries and benefits of staff used to provide client flexible supports.
Other Supports – Cost of Health Care Treatment
MHSA Statutes (as of February 13, 2008), p. 25. The cost of the client’s physical healthcare.
Other Supports – Respite Services
DMH Letter 06‐07 Age Specific Program StrategiesCYF: Respite services for both children/youth and family members.
Support Services – Supportive Employment/ Education
DMH Letter 05‐05 Age Specific Program Strategies (p. 29)Youth Supportive employment including development of job options for young people, such as social enterprises, agency supported positions, and competitive employment options with equal pay and benefits. Supported Education Services for youth.
Support Services – Housing Case Management
Case Management/Brokerage is a service that assists a client in acquiring, maintaining, and retaining housing (non Medi‐Cal covered service).
Support Services – Psycho ‐Education
DMH Letter 05‐05 Age Specific Program StrategiesCYF: Education for children/youth and family or other caregivers regarding mental health diagnosis and assessment, medications, services and supports planning, treatment modalities, and other information related to children/youth’s mental health services and needs.
Support Services – Family Education
DMH Letter 05‐05 Age Specific Program StrategiesCYF ‐ Parental mental health education, with language access and culturally appropriate approaches; Supportive family partnership educational opportunities.
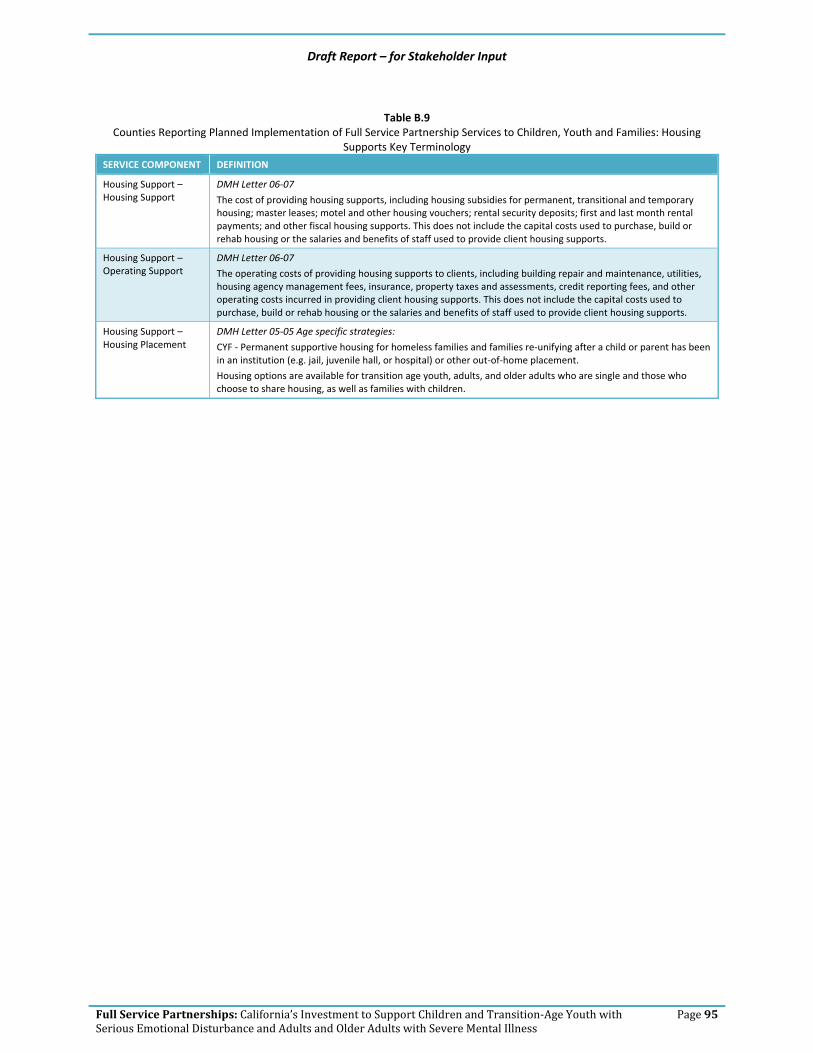
Draft Report – for Stakeholder Input
Full Service Partnerships: California’s Investment to Support Children and Transition‐Age Youth with Serious Emotional Disturbance and Adults and Older Adults with Severe Mental Illness
Page 95
Table B.9
Counties Reporting Planned Implementation of Full Service Partnership Services to Children, Youth and Families: Housing Supports Key Terminology
SERVICE COMPONENT DEFINITION
Housing Support – Housing Support
DMH Letter 06‐07
The cost of providing housing supports, including housing subsidies for permanent, transitional and temporary housing; master leases; motel and other housing vouchers; rental security deposits; first and last month rental payments; and other fiscal housing supports. This does not include the capital costs used to purchase, build or rehab housing or the salaries and benefits of staff used to provide client housing supports.
Housing Support – Operating Support
DMH Letter 06‐07
The operating costs of providing housing supports to clients, including building repair and maintenance, utilities, housing agency management fees, insurance, property taxes and assessments, credit reporting fees, and other operating costs incurred in providing client housing supports. This does not include the capital costs used to purchase, build or rehab housing or the salaries and benefits of staff used to provide client housing supports.
Housing Support – Housing Placement
DMH Letter 05‐05 Age specific strategies:
CYF ‐ Permanent supportive housing for homeless families and families re‐unifying after a child or parent has been in an institution (e.g. jail, juvenile hall, or hospital) or other out‐of‐home placement.
Housing options are available for transition age youth, adults, and older adults who are single and those who choose to share housing, as well as families with children.
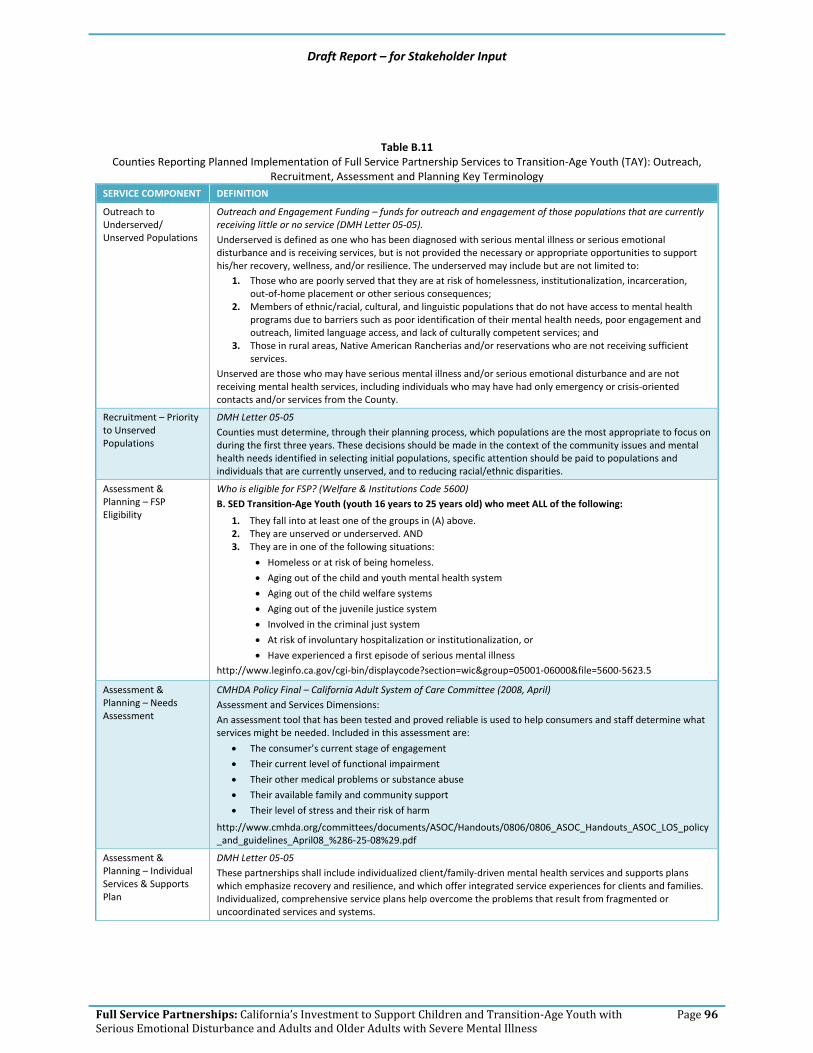
Draft Report – for Stakeholder Input
Full Service Partnerships: California’s Investment to Support Children and Transition‐Age Youth with Serious Emotional Disturbance and Adults and Older Adults with Severe Mental Illness
Page 96
Table B.11 Counties Reporting Planned Implementation of Full Service Partnership Services to Transition‐Age Youth (TAY): Outreach,
Recruitment, Assessment and Planning Key Terminology SERVICE COMPONENT DEFINITION
Outreach to Underserved/ Unserved Populations
Outreach and Engagement Funding – funds for outreach and engagement of those populations that are currently receiving little or no service (DMH Letter 05‐05). Underserved is defined as one who has been diagnosed with serious mental illness or serious emotional disturbance and is receiving services, but is not provided the necessary or appropriate opportunities to support his/her recovery, wellness, and/or resilience. The underserved may include but are not limited to:
1. Those who are poorly served that they are at risk of homelessness, institutionalization, incarceration, out‐of‐home placement or other serious consequences;
2. Members of ethnic/racial, cultural, and linguistic populations that do not have access to mental health programs due to barriers such as poor identification of their mental health needs, poor engagement and outreach, limited language access, and lack of culturally competent services; and
3. Those in rural areas, Native American Rancherias and/or reservations who are not receiving sufficient services.
Unserved are those who may have serious mental illness and/or serious emotional disturbance and are not receiving mental health services, including individuals who may have had only emergency or crisis‐oriented contacts and/or services from the County.
Recruitment – Priority to Unserved Populations
DMH Letter 05‐05 Counties must determine, through their planning process, which populations are the most appropriate to focus on during the first three years. These decisions should be made in the context of the community issues and mental health needs identified in selecting initial populations, specific attention should be paid to populations and individuals that are currently unserved, and to reducing racial/ethnic disparities.
Assessment & Planning – FSP Eligibility
Who is eligible for FSP? (Welfare & Institutions Code 5600) B. SED Transition‐Age Youth (youth 16 years to 25 years old) who meet ALL of the following:
1. They fall into at least one of the groups in (A) above. 2. They are unserved or underserved. AND 3. They are in one of the following situations:
• Homeless or at risk of being homeless.
• Aging out of the child and youth mental health system
• Aging out of the child welfare systems
• Aging out of the juvenile justice system
• Involved in the criminal just system
• At risk of involuntary hospitalization or institutionalization, or • Have experienced a first episode of serious mental illness
http://www.leginfo.ca.gov/cgi‐bin/displaycode?section=wic&group=05001‐06000&file=5600‐5623.5
Assessment & Planning – Needs Assessment
CMHDA Policy Final – California Adult System of Care Committee (2008, April) Assessment and Services Dimensions: An assessment tool that has been tested and proved reliable is used to help consumers and staff determine what services might be needed. Included in this assessment are:
• The consumer’s current stage of engagement
• Their current level of functional impairment
• Their other medical problems or substance abuse
• Their available family and community support
• Their level of stress and their risk of harm
http://www.cmhda.org/committees/documents/ASOC/Handouts/0806/0806_ASOC_Handouts_ASOC_LOS_policy_and_guidelines_April08_%286‐25‐08%29.pdf
Assessment & Planning – Individual Services & Supports Plan
DMH Letter 05‐05 These partnerships shall include individualized client/family‐driven mental health services and supports plans which emphasize recovery and resilience, and which offer integrated service experiences for clients and families. Individualized, comprehensive service plans help overcome the problems that result from fragmented or uncoordinated services and systems.

Full Service Partnerships: California’s Investment to Support Children and Transition‐Age Youth with Serious Emotional Disturbance and Adults and Older Adults with Severe Mental Illness
Page 97
SERVICE COMPONENT DEFINITION
Assessment & Planning – Service Delivery Based on Needs Assessment & Individual Services & Supports Plan
DMH Letter 05‐05 Funding provided through the MHSA will be used to transform the current mental health system from one that focuses primarily on clinical services into one in which county mental health programs can enter into partnerships with clients, their families and their communities to provide, under client and family direction, whatever it takes to enable people to attain their goals. The goal will be to eventually provide all needed cost‐efficient and effective services and supports for all those in need of mental health services and their families, consistent with the individualized plans.

Full Service Partnerships: California’s Investment to Support Children and Transition‐Age Youth with Serious Emotional Disturbance and Adults and Older Adults with Severe Mental Illness
Page 98
Table B.13
Counties Reporting Planned Implementation of Full Service Partnership Services to Transition Age Youth (TAY): MHSA Required Strategies & Principles Key Terminology
SERVICE COMPONENT DEFINITION
MHSA Required Strategies – Low Caseload (20 clients: 1 staff)
DMH Letter 05‐05 All fully served individuals will have a single point of responsibility – Personal Service Coordinators (PSCs) for adults – case managers for children and youth – with a caseload that is low enough so that: (1) their availability to the individual and family is appropriate to their service needs, (2) they are able to provide intensive services and supports when needed, and (3) they can give the individual served and/or family member considerable personal attention.
MHSA Required Strategies – Consumers/family members on staff
California Department of Mental Health (DMH). (2005, February). Vision Statement and Guiding Principles for DMH Implementation of the Mental Health Services Act. Significant increases in the level of participation and involvement of clients and families in all aspects of the public mental health system including but not limited to: planning, policy development, service delivery, and evaluation. http://www.dmh.ca.gov/prop_63/mhsa/docs/Vision_and_Guiding_Principles_2‐16‐05.pdf DMH Letter 05‐05 Development of self‐help, peer support and youth/family‐run programs, to add youth/families as providers in clinical settings and to develop youth training programs, including youth and family member leadership training programs.
MHSA Required Strategies – 24/7 coverage
DMH Letter 05‐05 Services must include the ability of PSCs, children’s case managers or team members known to the client or family member to respond to clients and family members 24 hours a day, 7 days a week. This ‘best practice’ service strategy is intended to provide immediate ‘after‐hours’ interventions that will reduce negative outcomes for individuals including but not limited to unnecessary hospitalizations, incarcerations and evictions. For transition age youth, adults and older adults this service must include the ability to respond to landlords and or law enforcement. For children and youth it must include the ability to respond to persons in the community identified by a child’s family. Exceptions for small counties: Small counties may meet the 24/7 requirement through peers or community partners who are known to the client/family rather than exclusively through the PSCs, case managers or team members.
MHSA Required Strategies – Services in community
DMH Letter 05‐05 Age Specific Program Strategies:TAY‐ Integrated physical and mental health services, which includes co‐location and/or collaboration with primary care clinics or other health care sites and providers to provide individualized, inter‐disciplinary, coordinated services; Services located in racial ethnic communities to reach children, youth and families who may be more responsive to services in these settings.
MHSA Principles – Client Centered Care
DMH Letter 05‐05 Clients identify their needs and preferences which lead to the services and supports that will be most effective for them. Their needs and preferences drive the policy and financing decisions that affect them. Providers work in full partnership with the clients they serve to develop individualized, comprehensive service plans. Many have limited influence over the services they receive. Increasing opportunities to have greater choices over such things as types of service, providers, and how service dollars are spent, facilitates personal responsibility, creates an economic interest in obtaining and sustaining recovery, and shifts the incentives towards a system that promotes learning, self monitoring, and accountability. Increasing choice protects individuals and encourages quality. (Source: The President’s New Freedom Commission on Mental Health – Achieving the Promise Transforming Mental Health Care in America.)
MHSA Principles – Family Centered Care
DMH Letter 05‐05 Families of children and youth identify their needs and preferences which lead to the services and supports that will be most effective for them. Their needs and preferences drive the policy and financing decisions that affect them. Child and youth services are family driven; with providers working in full partnership with the clients and families they serve to develop individualized, comprehensive service plans. Many parents of children with serious emotional disturbances have limited influence over the services they or their children receive. Increasing opportunities for families to have greater choices over such things as types of service, providers, and how service dollars are spent, facilitates personal responsibility, creates an economic interest in obtaining and sustaining recovery, and shifts the incentives towards a system that promotes learning, self monitoring, and accountability. Increasing choice protects individuals and encourages quality. (Source: The President’s New Freedom Commission on Mental Health – Achieving the Promise Transforming Mental Health Care in America.)
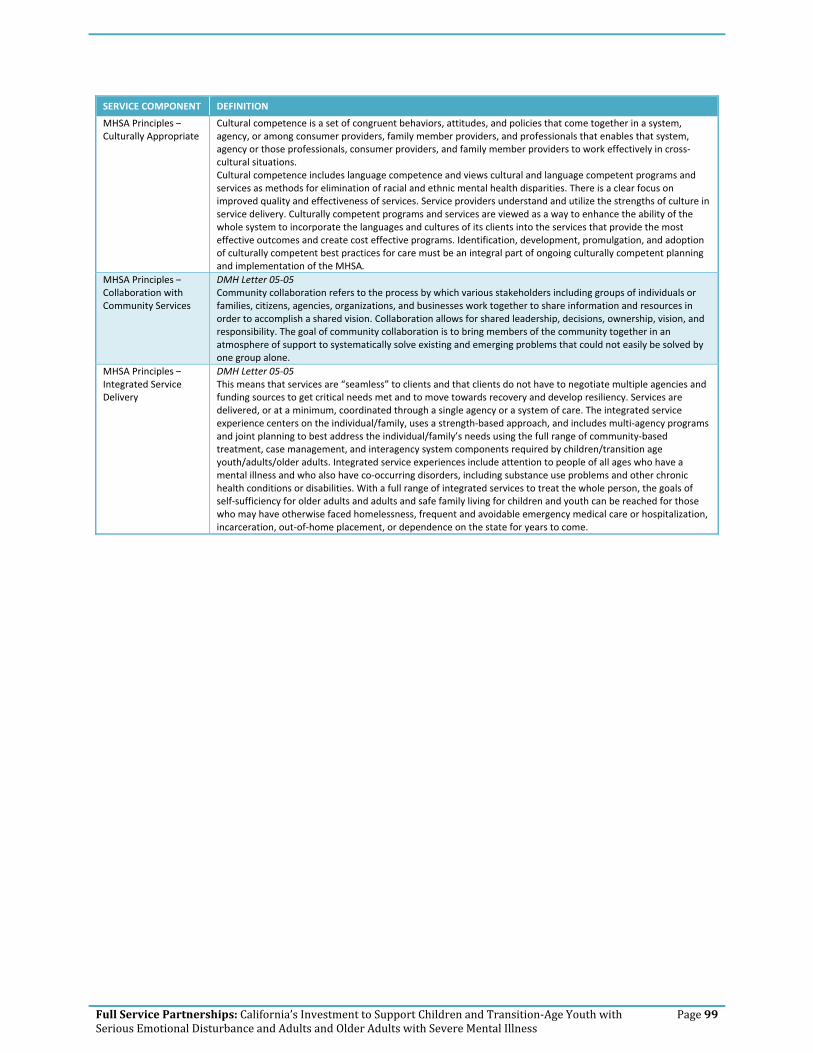
Full Service Partnerships: California’s Investment to Support Children and Transition‐Age Youth with Serious Emotional Disturbance and Adults and Older Adults with Severe Mental Illness
Page 99
SERVICE COMPONENT DEFINITION
MHSA Principles – Culturally Appropriate
Cultural competence is a set of congruent behaviors, attitudes, and policies that come together in a system, agency, or among consumer providers, family member providers, and professionals that enables that system, agency or those professionals, consumer providers, and family member providers to work effectively in cross‐cultural situations. Cultural competence includes language competence and views cultural and language competent programs and services as methods for elimination of racial and ethnic mental health disparities. There is a clear focus on improved quality and effectiveness of services. Service providers understand and utilize the strengths of culture in service delivery. Culturally competent programs and services are viewed as a way to enhance the ability of the whole system to incorporate the languages and cultures of its clients into the services that provide the most effective outcomes and create cost effective programs. Identification, development, promulgation, and adoption of culturally competent best practices for care must be an integral part of ongoing culturally competent planning and implementation of the MHSA.
MHSA Principles – Collaboration with Community Services
DMH Letter 05‐05 Community collaboration refers to the process by which various stakeholders including groups of individuals or families, citizens, agencies, organizations, and businesses work together to share information and resources in order to accomplish a shared vision. Collaboration allows for shared leadership, decisions, ownership, vision, and responsibility. The goal of community collaboration is to bring members of the community together in an atmosphere of support to systematically solve existing and emerging problems that could not easily be solved by one group alone.
MHSA Principles – Integrated Service Delivery
DMH Letter 05‐05 This means that services are “seamless” to clients and that clients do not have to negotiate multiple agencies and funding sources to get critical needs met and to move towards recovery and develop resiliency. Services are delivered, or at a minimum, coordinated through a single agency or a system of care. The integrated service experience centers on the individual/family, uses a strength‐based approach, and includes multi‐agency programs and joint planning to best address the individual/family’s needs using the full range of community‐based treatment, case management, and interagency system components required by children/transition age youth/adults/older adults. Integrated service experiences include attention to people of all ages who have a mental illness and who also have co‐occurring disorders, including substance use problems and other chronic health conditions or disabilities. With a full range of integrated services to treat the whole person, the goals of self‐sufficiency for older adults and adults and safe family living for children and youth can be reached for those who may have otherwise faced homelessness, frequent and avoidable emergency medical care or hospitalization, incarceration, out‐of‐home placement, or dependence on the state for years to come.

Full Service Partnerships: California’s Investment to Support Children and Transition‐Age Youth with Serious Emotional Disturbance and Adults and Older Adults with Severe Mental Illness
Page 100
Table B.15 Counties Reporting Planned Implementation of Full Service Partnership Services to Transition Age Youth (TAY): Outpatient
Mental Health Services Key Terminology
SERVICE COMPONENT DEFINITION
Individual Therapy Mental Health Medi‐Cal Billing Manual_V1‐0_07‐17‐08
Mental Health Services are individual or group therapy and intervention services designed to provide reduction of mental disability and restoration, improvement or maintenance of functioning consistent with the goals of learning, development, independent living and enhanced self‐sufficiency and that are not provided as a component of adult residential services, crisis residential treatment services, crisis intervention, crisis stabilization, day rehabilitation, or day treatment intensive. Service activities may include but are not limited to assessment, plan development, therapy, rehabilitation and collateral care.
Group Therapy Mental Health Medi‐Cal Billing Manual_V1‐0_07‐17‐08
Mental Health Services are individual or group therapy and intervention services designed to provide reduction of mental disability and restoration, improvement or maintenance of functioning consistent with the goals of learning, development, independent living and enhanced self‐sufficiency and that are not provided as a component of adult residential services, crisis residential treatment services, crisis intervention, crisis stabilization, day rehabilitation, or day treatment intensive. Service activities may include but are not limited to assessment, plan development, therapy, rehabilitation and collateral care.
Medication Support Mental Health Medi‐Cal Billing Manual_V1‐0_07‐17‐08
Medication Support Services are those services that include prescribing, administering, dispensing and monitoring psychiatric medications or biologicals that are necessary to alleviate the symptoms of mental illness. Service activities may include but are not limited to evaluation of the need for medication; evaluation of clinical effectiveness and side effects; the obtaining of informed consent; instruction in the use, risks and benefits of and alternatives for medication; and collateral and plan development related to the delivery of the service and/or assessment of the patient.
Crisis Intervention Mental Health Medi‐Cal Billing Manual_V1‐0_07‐17‐08
Crisis Intervention services last less than 24 hours, to or on behalf of a patient for a condition that requires more timely response than a regularly scheduled visit.
Service activities include but are not limited to one or more of the following: assessment, collateral and therapy. Crisis intervention is distinguished from crisis stabilization by being delivered by providers who do not meet the crisis stabilization contact, site, and staffing requirements described in CCR, Title 9 Articles 1840.33862 and 1840.348.63
Medical Case Management
Mental Health Medi‐Cal Billing Manual_V1‐0_07‐17‐08
Case Management/Brokerage is a service that assists a patient to access needed Medical services. The service activities may include, but are not limited to: communication, coordination, and referral; monitoring service delivery to ensure patient access to service and the service delivery system; monitoring the patient’s progress; placement services; and plan development.
Social Case Management
Mental Health Medi‐Cal Billing Manual_V1‐0_07‐17‐08
Case Management/Brokerage is a service that assists a patient to access needed Social services. The service activities may include, but are not limited to: communication, coordination, and referral; monitoring service delivery to ensure patient access to service and the service delivery system; monitoring the patient’s progress; placement services; and plan development.
Rehabilitative Case Management
Mental Health Medi‐Cal Billing Manual_V1‐0_07‐17‐08
Case Management/Brokerage is a service that assists a patient to access needed rehabilitative services. The service activities may include, but are not limited to: communication, coordination, and referral; monitoring service delivery to ensure patient access to service and the service delivery system; monitoring the patient’s progress; placement services; and plan development.
Educational Case Management
Mental Health Medi‐Cal Billing Manual_V1‐0_07‐17‐08
Case Management/Brokerage is a service that assists a patient to access needed Educational services. The service activities may include, but are not limited to: communication, coordination, and referral; monitoring service delivery to ensure patient access to service and the service delivery system; monitoring the patient’s progress; placement services; and plan development.
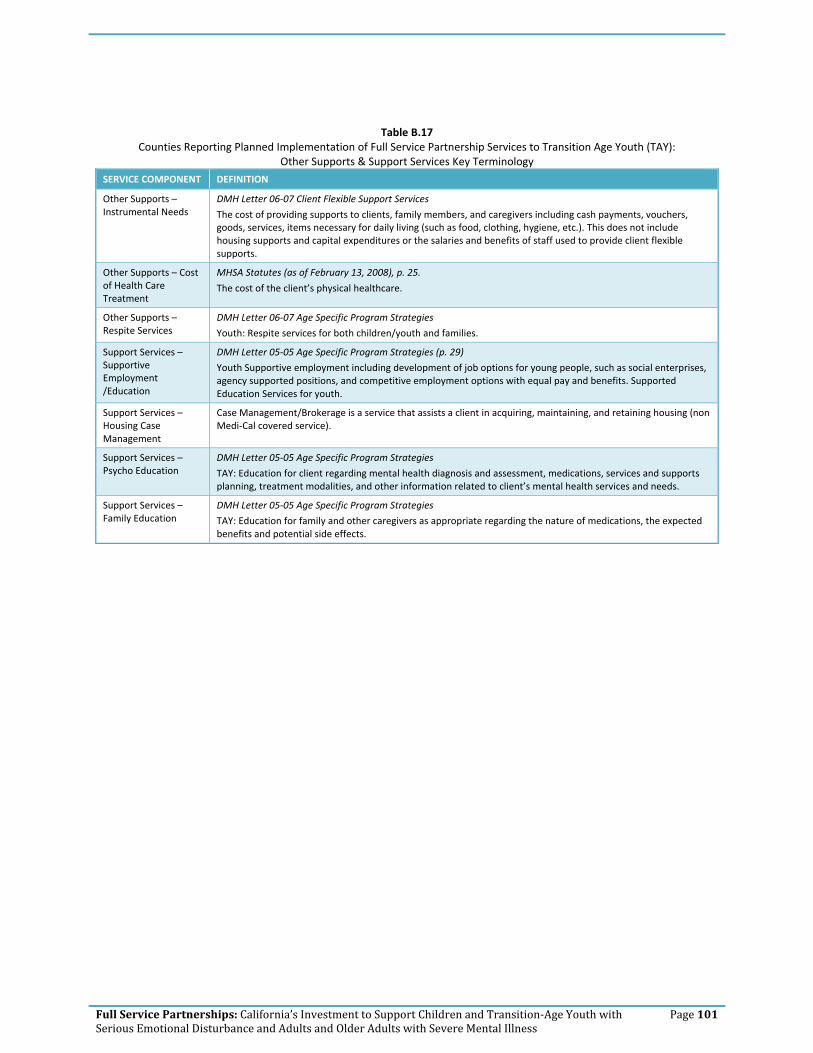
Full Service Partnerships: California’s Investment to Support Children and Transition‐Age Youth with Serious Emotional Disturbance and Adults and Older Adults with Severe Mental Illness
Page 101
Table B.17 Counties Reporting Planned Implementation of Full Service Partnership Services to Transition Age Youth (TAY):
Other Supports & Support Services Key Terminology
SERVICE COMPONENT DEFINITION
Other Supports – Instrumental Needs
DMH Letter 06‐07 Client Flexible Support Services
The cost of providing supports to clients, family members, and caregivers including cash payments, vouchers, goods, services, items necessary for daily living (such as food, clothing, hygiene, etc.). This does not include housing supports and capital expenditures or the salaries and benefits of staff used to provide client flexible supports.
Other Supports – Cost of Health Care Treatment
MHSA Statutes (as of February 13, 2008), p. 25.
The cost of the client’s physical healthcare.
Other Supports – Respite Services
DMH Letter 06‐07 Age Specific Program Strategies
Youth: Respite services for both children/youth and families.
Support Services – Supportive Employment /Education
DMH Letter 05‐05 Age Specific Program Strategies (p. 29)
Youth Supportive employment including development of job options for young people, such as social enterprises, agency supported positions, and competitive employment options with equal pay and benefits. Supported Education Services for youth.
Support Services – Housing Case Management
Case Management/Brokerage is a service that assists a client in acquiring, maintaining, and retaining housing (non Medi‐Cal covered service).
Support Services – Psycho Education
DMH Letter 05‐05 Age Specific Program Strategies
TAY: Education for client regarding mental health diagnosis and assessment, medications, services and supports planning, treatment modalities, and other information related to client’s mental health services and needs.
Support Services – Family Education
DMH Letter 05‐05 Age Specific Program Strategies
TAY: Education for family and other caregivers as appropriate regarding the nature of medications, the expected benefits and potential side effects.

Full Service Partnerships: California’s Investment to Support Children and Transition‐Age Youth with Serious Emotional Disturbance and Adults and Older Adults with Severe Mental Illness
Page 102
Table B.19
Counties Reporting Planned Implementation of Full Service Partnership Services to Transition Age Youth (TAY): Housing Supports Key Terminology
SERVICE COMPONENT DEFINITION
Housing Support – Housing Support
DMH Letter 06‐07
The cost of providing housing supports, including housing subsidies for permanent, transitional and temporary housing; master leases; motel and other housing vouchers; rental security deposits; first and last month rental payments; and other fiscal housing supports. This does not include the capital costs used to purchase, build or rehab housing or the salaries and benefits of staff used to provide client housing supports.
Housing Support – Operating Support
DMH Letter 06‐07
The operating costs of providing housing supports to clients, including building repair and maintenance, utilities, housing agency management fees, insurance, property taxes and assessments, credit reporting fees, and other operating costs incurred in providing client housing supports. This does not include the capital costs used to purchase, build or rehab housing or the salaries and benefits of staff used to provide client housing supports.
Housing Support – Housing Placement
DMH Letter 05‐05 Age specific strategies:
TAY, Adults, Older Adults: Supportive housing – permanent affordable housing with combined supports for independent living, including projects that meet the following criteria: (1) housing is permanent, meaning that each tenant may stay as long as he or she pays his or her share of rent and complies with the terms of a lease or rental agreement, (2) housing is affordable, meaning that each tenant pays no more than 30% to 50% of household income, and (3) tenants have access to an array of support services that are intended to support housing stability, recovery and resiliency, but participation in support services is not a requirement for tenancy. Supportive housing may be site‐based (all or a portion of the units in a building are designated for people with special needs, and supportive services are available on‐site) or scattered site (tenants have or rent houses at various locations in the community).
Housing options are available for transition age youth, adults, and older adults who are single and those who choose to share housing, as well as families with children.

Full Service Partnerships: California’s Investment to Support Children and Transition‐Age Youth with Serious Emotional Disturbance and Adults and Older Adults with Severe Mental Illness
Page 103
Table B.21
Counties Reporting Planned Implementation of Full Service Partnership Services to Adults: Outreach, Recruitment, Assessment and Planning Key Terminology
SERVICE COMPONENT DEFINITION
Outreach to Underserved/ Unserved Populations
Outreach and Engagement Funding – funds for outreach and engagement of those populations that are currently receiving little or no service (DMH Letter 05‐05).
Underserved is defined as one who has been diagnosed with serious mental illness or serious emotional disturbance and is receiving services, but is not provided the necessary or appropriate opportunities to support his/her recovery, wellness, and/or resilience. The underserved may include but are not limited to:
1. Those who are poorly served that they are at risk of homelessness, institutionalization, incarceration, out‐of‐home placement or other serious consequences;
2. Members of ethnic/racial, cultural, and linguistic populations that do not have access to mental health programs due to barriers such as poor identification of their mental health needs, poor engagement and outreach, limited language access, and lack of culturally competent services; and
3. Those in rural areas, Native American Rancherias and/or reservations who are not receiving sufficient services.
Unserved are those who may have serious mental illness and/or serious emotional disturbance and are not receiving mental health services, including individuals who may have had only emergency or crisis‐oriented contacts and/or services from the County.
Recruitment – Priority to Unserved Populations
DMH Letter 05‐05
Counties must determine, through their planning process, which populations are the most appropriate to focus on during the first three years. These decisions should be made in the context of the community issues and mental health needs identified in selecting initial populations, specific attention should be paid to populations and individuals that are currently unserved, and to reducing racial/ethnic disparities.
Assessment & Planning – FSP Eligibility
Who is eligible for FSP? (Welfare & Institutions Code 5600)
C. SMI Adults who meet ALL of the following.
1. Their mental disorder results in substantial functional impairments or symptoms, or they have a psychiatric history that shows that, without treatment, there is an imminent risk of decompensation with substantial impairments or symptoms.
2. Due to mental functional impairment and circumstances, they are likely to become so disabled as to require public assistance, services, or entitlements. AND
3. They are in one of the following situations: a. They are unserved and one of the following:
• Homeless or at risk of becoming homeless.
• Involved in the criminal justice system.
• Frequent users of hospital or emergency room services as the primary resource for mental health treatment.
b. They are underserved and at risk of one of the following:
• Homelessness. • Involvement in the criminal justice system. • Institutionalization.
http://www.leginfo.ca.gov/cgi‐bin/displaycode?section=wic&group=05001‐06000&file=5600‐5623.5
Assessment & Planning – Needs Assessment
CMHDA Policy Final – California Adult System of Care Committee (2008, April)
Assessment and Services Dimensions:
An assessment tool that has been tested and proved reliable is used to help consumers and staff determine what services might be needed. Included in this assessment are:
• The consumer’s current stage of engagement
• Their current level of functional impairment
• Their other medical problems or substance abuse
• Their available family and community support
• Their level of stress and their risk of harm
http://www.cmhda.org/committees/documents/ASOC/Handouts/0806/0806_ASOC_Handouts_ASOC_LOS_policy_and_guidelines_April08_%286‐25‐08%29.pdf

Full Service Partnerships: California’s Investment to Support Children and Transition‐Age Youth with Serious Emotional Disturbance and Adults and Older Adults with Severe Mental Illness
Page 104
SERVICE COMPONENT DEFINITION
Assessment & Planning – Individual Services & Supports Plan
DMH Letter 05‐05
These partnerships shall include individualized client/family‐driven mental health services and supports plans which emphasize recovery and resilience, and which offer integrated service experiences for clients and families. Individualized, comprehensive service plans help overcome the problems that result from fragmented or uncoordinated services and systems.
Assessment & Planning – Service Delivery Based on Needs Assessment & Individual Services & Supports Plan
DMH Letter 05‐05
Funding provided through the MHSA will be used to transform the current mental health system from one that focuses primarily on clinical services into one in which county mental health programs can enter into partnerships with clients, their families and their communities to provide, under client and family direction, whatever it takes to enable people to attain their goals. The goal will be to eventually provide all needed cost‐efficient and effective services and supports for all those in need of mental health services and their families, consistent with the individualized plans.

Full Service Partnerships: California’s Investment to Support Children and Transition‐Age Youth with Serious Emotional Disturbance and Adults and Older Adults with Severe Mental Illness
Page 105
Table B.23 Counties Reporting Planned Implementation of Full Service Partnership Services to Adults:
MHSA Required Strategies & Principles Key Terminology
SERVICE COMPONENT DEFINITION
MHSA Required Strategies – Low Caseload (20 clients: 1 staff)
DMH Letter 05‐05
All fully served individuals will have a single point of responsibility – Personal Service Coordinators (PSCs) for adults – with a caseload that is low enough so that: (1) their availability to the individual and family is appropriate to their service needs, (2) they are able to provide intensive services and supports when needed, and (3) they can give the individual served and/or family member considerable personal attention.
MHSA Required Strategies – Consumers/family members on staff
California Department of Mental Health (DMH). (2005, February). Vision Statement and Guiding Principles for DMH Implementation of the Mental Health Services Act.
Significant increases in the level of participation and involvement of clients and families in all aspects of the public mental health system including but not limited to: planning, policy development, service delivery, and evaluation.
http://www.dmh.ca.gov/prop_63/mhsa/docs/Vision_and_Guiding_Principles_2‐16‐05.pdf
DMH Letter 05‐05
Self‐help and client‐run programs such as drop‐in centers, club houses, anti‐stigma campaigns, job training classes, advocacy programs, and peer education.
MHSA Required Strategies – 24/7 coverage
DMH Letter 05‐05
Services must include the ability of PSCs, children’s case managers or team members known to the client or family member to respond to clients and family members 24 hours a day, 7 days a week. This ‘best practice’ service strategy is intended to provide immediate ‘after‐hours’ interventions that will reduce negative outcomes for individuals including but not limited to unnecessary hospitalizations, incarcerations and evictions. For transition age youth, adults and older adults this service must include the ability to respond to landlords and or law enforcement. For children and youth it must include the ability to respond to persons in the community identified by a child’s family.
Exceptions for small counties: Small counties may meet the 24/7 requirement through peers or community partners who are known to the client/family rather than exclusively through the PSCs, case managers or team members.
MHSA Required Strategies – services in community
DMH Letter 05‐05 Age Specific Program Strategies:
Adult/OA ‐ Integrated physical and mental health services, either co‐located or in collaboration with primary care; On‐site services in primary care clinics or other health care sites to provide individualized, inter‐disciplinary services coordinated with other health care providers; On‐site services or services in collaboration with faith‐based providers, churches, temples or similar settings where clients may feel more familiar and comfortable; linkage for these clients to the full range of services.
MHSA Principles – Client Centered Care
DMH Letter 05‐05
Adult clients identify their needs and preferences which lead to the services and supports that will be most effective for them. Their needs and preferences drive the policy and financing decisions that affect them.
Adult services are client centered; with providers working in full partnership with the clients and families they serve to develop individualized, comprehensive service plans.
Many adults with serious mental illness have limited influence over the services they or their children receive. Increasing opportunities for clients to have greater choices over such things as types of service, providers, and how service dollars are spent, facilitates personal responsibility, creates an economic interest in obtaining and sustaining recovery, and shifts the incentives towards a system that promotes learning, self monitoring, and accountability. Increasing choice protects individuals and encourages quality.
(Source cited in DMH Letter 05‐05: The President’s New Freedom Commission on Mental Health – Achieving the Promise Transforming Mental Health Care in America.)

Full Service Partnerships: California’s Investment to Support Children and Transition‐Age Youth with Serious Emotional Disturbance and Adults and Older Adults with Severe Mental Illness
Page 106
SERVICE COMPONENT DEFINITION
MHSA Principles – Culturally Appropriate
Cultural competence is a set of congruent behaviors, attitudes, and policies that come together in a system, agency, or among consumer providers, family member providers, and professionals that enables that system, agency or those professionals, consumer providers, and family member providers to work effectively in cross‐cultural situations.
Cultural competence includes language competence and views cultural and language competent programs and services as methods for elimination of racial and ethnic mental health disparities. There is a clear focus on improved quality and effectiveness of services. Service providers understand and utilize the strengths of culture in service delivery. Culturally competent programs and services are viewed as a way to enhance the ability of the whole system to incorporate the languages and cultures of its clients into the services that provide the most effective outcomes and create cost effective programs. Identification, development, promulgation, and adoption of culturally competent best practices for care must be an integral part of ongoing culturally competent planning and implementation of the MHSA.
MHSA Principles – Collaboration with Community Services
DMH Letter 05‐05
Community collaboration refers to the process by which various stakeholders including groups of individuals or families, citizens, agencies, organizations, and businesses work together to share information and resources in order to accomplish a shared vision. Collaboration allows for shared leadership, decisions, ownership, vision, and responsibility. The goal of community collaboration is to bring members of the community together in an atmosphere of support to systematically solve existing and emerging problems that could not easily be solved by one group alone.
MHSA Principles – Integrated Service Delivery
DMH Letter 05‐05
This means that services are “seamless” to clients and that clients do not have to negotiate multiple agencies and funding sources to get critical needs met and to move towards recovery and develop resiliency. Services are delivered, or at a minimum, coordinated through a single agency or a system of care. The integrated service experience centers on the individual/family, uses a strength‐based approach, and includes multi‐agency programs and joint planning to best address the individual/family’s needs using the full range of community‐based treatment, case management, and interagency system components required by children/transition age youth/adults/older adults. Integrated service experiences include attention to people of all ages who have a mental illness and who also have co‐occurring disorders, including substance use problems and other chronic health conditions or disabilities. With a full range of integrated services to treat the whole person, the goals of self‐sufficiency for older adults and adults and safe family living for children and youth can be reached for those who may have otherwise faced homelessness, frequent and avoidable emergency medical care or hospitalization, incarceration, out‐of‐home placement, or dependence on the state for years to come.

Full Service Partnerships: California’s Investment to Support Children and Transition‐Age Youth with Serious Emotional Disturbance and Adults and Older Adults with Severe Mental Illness
Page 107
Table B.25 Counties Reporting Planned Implementation of Full Service Partnership Services to Adults:
Outpatient Mental Health Services Key Terminology
SERVICE COMPONENT DEFINITION
Individual Therapy Mental Health Medi‐Cal Billing Manual_V1‐0_07‐17‐08
Mental Health Services are individual or group therapy and intervention services designed to provide reduction of mental disability and restoration, improvement or maintenance of functioning consistent with the goals of learning, development, independent living and enhanced self‐sufficiency and that are not provided as a component of adult residential services, crisis residential treatment services, crisis intervention, crisis stabilization, day rehabilitation, or day treatment intensive. Service activities may include but are not limited to assessment, plan development, therapy, rehabilitation and collateral care.
Group Therapy Mental Health Medi‐Cal Billing Manual_V1‐0_07‐17‐08
Mental Health Services are individual or group therapy and intervention services designed to provide reduction of mental disability and restoration, improvement or maintenance of functioning consistent with the goals of learning, development, independent living and enhanced self‐sufficiency and that are not provided as a component of adult residential services, crisis residential treatment services, crisis intervention, crisis stabilization, day rehabilitation, or day treatment intensive. Service activities may include but are not limited to assessment, plan development, therapy, rehabilitation and collateral care.
Medication Support Mental Health Medi‐Cal Billing Manual_V1‐0_07‐17‐08
Medication Support Services are those services that include prescribing, administering, dispensing and monitoring psychiatric medications or biologicals that are necessary to alleviate the symptoms of mental illness. Service activities may include but are not limited to evaluation of the need for medication; evaluation of clinical effectiveness and side effects; the obtaining of informed consent; instruction in the use, risks and benefits of and alternatives for medication; and collateral and plan development related to the delivery of the service and/or assessment of the patient.
Crisis Intervention Mental Health Medi‐Cal Billing Manual_V1‐0_07‐17‐08
Crisis Intervention services last less than 24 hours, to or on behalf of a patient for a condition that requires more timely response than a regularly scheduled visit.
Service activities include but are not limited to one or more of the following: assessment, collateral and therapy. Crisis intervention is distinguished from crisis stabilization by being delivered by providers who do not meet the crisis stabilization contact, site, and staffing requirements described in CCR, Title 9 Articles 1840.33862 and 1840.348.63
Medical Case Management
Mental Health Medi‐Cal Billing Manual_V1‐0_07‐17‐08
Case Management/Brokerage is a service that assists a patient to access needed Medical services. The service activities may include, but are not limited to: communication, coordination, and referral; monitoring service delivery to ensure patient access to service and the service delivery system; monitoring the patient’s progress; placement services; and plan development.
Social Case Management
Mental Health Medi‐Cal Billing Manual_V1‐0_07‐17‐08
Case Management/Brokerage is a service that assists a patient to access needed Social services. The service activities may include, but are not limited to: communication, coordination, and referral; monitoring service delivery to ensure patient access to service and the service delivery system; monitoring the patient’s progress; placement services; and plan development.
Rehabilitative Case Management
Mental Health Medi‐Cal Billing Manual_V1‐0_07‐17‐08
Case Management/Brokerage is a service that assists a patient to access needed rehabilitative services. The service activities may include, but are not limited to: communication, coordination, and referral; monitoring service delivery to ensure patient access to service and the service delivery system; monitoring the patient’s progress; placement services; and plan development.
Educational Case Management
Mental Health Medi‐Cal Billing Manual_V1‐0_07‐17‐08
Case Management/Brokerage is a service that assists a patient to access needed Educational services. The service activities may include, but are not limited to: communication, coordination, and referral; monitoring service delivery to ensure patient access to service and the service delivery system; monitoring the patient’s progress; placement services; and plan development.

Full Service Partnerships: California’s Investment to Support Children and Transition‐Age Youth with Serious Emotional Disturbance and Adults and Older Adults with Severe Mental Illness
Page 108
Table B.27
Counties Reporting Planned Implementation of Full Service Partnership Services to Adults: Other Supports & Support Services Key Terminology
SERVICE COMPONENT DEFINITION
Other Supports – Instrumental Needs
DMH Letter 06‐07 Client Flexible Support Services
The cost of providing supports to clients, family members, and caregivers including cash payments, vouchers, goods, services, items necessary for daily living (such as food, clothing, hygiene, etc.). This does not include housing supports and capital expenditures or the salaries and benefits of staff used to provide client flexible supports.
Other Supports – Cost of Health Care Treatment
MHSA Statutes (as of February 13, 2008), p. 25.
The cost of the client’s physical healthcare.
Other Supports – Respite Housing
DMH Letter 05‐05 Age Specific Program Strategies
Adults: Respite housing for clients and families.
Support Services – Supportive Employment /Education
DMH Letter 05‐05 Age Specific Program Strategies (pp. 32‐33)
Supportive employment and other productive activities and personal growth opportunities including development of job options for clients such as social enterprises, agency‐supported positions, and competitive employment options as well as volunteerism and other creative activities; Vocational services; Supportive education
Support Services – Housing Case Management
Case Management/Brokerage is a service that assists a client in acquiring, maintaining, and retaining housing (non Medi‐Cal covered service).
Support Services – Psycho Education
DMH Letter 05‐05 Age Specific Program Strategies
Adults: Education for client regarding mental health diagnosis and assessment, medications, services and supports planning, treatment modalities, and other information related to client’s mental health services and needs.
Support Services – Family Education
DMH Letter 05‐05 Age Specific Program Strategies
Adults/Older Adults: Education for family and other caregivers as appropriate to maximize individual choice about the nature of medications, the expected side effects, and expected benefits, including alternatives. .

Full Service Partnerships: California’s Investment to Support Children and Transition‐Age Youth with Serious Emotional Disturbance and Adults and Older Adults with Severe Mental Illness
Page 109
Table B.29
Counties Reporting Planned Implementation of Full Service Partnership Services to Adults: Housing Supports Key Terminology
SERVICE COMPONENT DEFINITION
Housing Support – Housing Support
DMH Letter 06‐07
The cost of providing housing supports, including housing subsidies for permanent, transitional and temporary housing; master leases; motel and other housing vouchers; rental security deposits; first and last month rental payments; and other fiscal housing supports. This does not include the capital costs used to purchase, build or rehab housing or the salaries and benefits of staff used to provide client housing supports.
Housing Support – Operating Support
DMH Letter 06‐07
The operating costs of providing housing supports to clients, including building repair and maintenance, utilities, housing agency management fees, insurance, property taxes and assessments, credit reporting fees, and other operating costs incurred in providing client housing supports. This does not include the capital costs used to purchase, build or rehab housing or the salaries and benefits of staff used to provide client housing supports.
Housing Support – Housing Placement
DMH Letter 05‐05 Age specific strategies:
Adults, Older Adults: Supportive housing – permanent affordable housing with combined supports for independent living, including projects that meet the following criteria: (1) housing is permanent, meaning that each tenant may stay as long as he or she pays his or her share of rent and complies with the terms of a lease or rental agreement, (2) housing is affordable, meaning that each tenant pays no more than 30% to 50% of household income, and (3) tenants have access to an array of support services that are intended to support housing stability, recovery and resiliency, but participation in support services is not a requirement for tenancy. Supportive housing may be site‐based (all or a portion of the units in a building are designated for people with special needs, and supportive services are available on‐site) or scattered site (tenants have or rent houses at various locations in the community).
Housing options are available for transition age youth, adults, and older adults who are single and those who choose to share housing, as well as families with children.

Full Service Partnerships: California’s Investment to Support Children and Transition‐Age Youth with Serious Emotional Disturbance and Adults and Older Adults with Severe Mental Illness
Page 110
Table A.31 Counties Reporting Planned Implementation of Full Service Partnership Services to Older Adults:
Outreach, Recruitment, Assessment and Planning Key Terminology
SERVICE COMPONENT DEFINITION
Outreach to Underserved/ Unserved Populations
Outreach and Engagement Funding – funds for outreach and engagement of those populations that are currently receiving little or no service (DMH Letter 05‐05).
Underserved is defined as one who has been diagnosed with serious mental illness or serious emotional disturbance and is receiving services, but is not provided the necessary or appropriate opportunities to support his/her recovery, wellness, and/or resilience. The underserved may include but are not limited to:
1. Those who are poorly served that they are at risk of homelessness, institutionalization, incarceration, out‐of‐home placement or other serious consequences;
2. Members of ethnic/racial, cultural, and linguistic populations that do not have access to mental health programs due to barriers such as poor identification of their mental health needs, poor engagement and outreach, limited language access, and lack of culturally competent services; and
3. Those in rural areas, Native American Rancherias and/or reservations who are not receiving sufficient services.
Unserved are those who may have serious mental illness and/or serious emotional disturbance and are not receiving mental health services, including individuals who may have had only emergency or crisis‐oriented contacts and/or services from the County.
Recruitment – Priority to Unserved Populations
DMH Letter 05‐05
Counties must determine, through their planning process, which populations are the most appropriate to focus on during the first three years. These decisions should be made in the context of the community issues and mental health needs identified in selecting initial populations, specific attention should be paid to populations and individuals that are currently unserved, and to reducing racial/ethnic disparities.
Assessment & Planning – FSP Eligibility
Who is eligible for FSP? (Welfare & Institutions Code, Section 5600)
D. SMI Older Adults (an adult 60 years or older) who meet ALL of the following:
1. They meet the criteria in (C)(1) above. 2. Due to mental functional impairment and circumstances, they are likely to become so disabled as to
require public assistance, services, or entitlements. AND
3. They are in one of the following situations:
a. They are unserved and one of the following:
• Experiencing a reduction in personal and/or community functioning.
• Homeless.
• At risk of becoming homeless.
• At risk of becoming institutionalized.
• At risk of out of home care.
• At risk of becoming frequent users of hospital and/or emergency room services as the primary resource for mental health treatment.
b. They are underserved and at risk of one of the following:
• Homelessness.
• Institutionalization.
• Nursing home or out‐of‐home care.
• Frequently using hospital and/or emergency room services as their primary resource for mental health treatment.
• Involvement in the criminal justice system.
http://www.leginfo.ca.gov/cgi‐bin/displaycode?section=wic&group=05001‐06000&file=5600‐5623.5

Full Service Partnerships: California’s Investment to Support Children and Transition‐Age Youth with Serious Emotional Disturbance and Adults and Older Adults with Severe Mental Illness
Page 111
SERVICE COMPONENT DEFINITION
Assessment & Planning – Needs Assessment
CMHDA Policy Final – California Adult System of Care Committee (2008, April)
Assessment and Services Dimensions:
An assessment tool that has been tested and proved reliable is used to help consumers and staff determine what services might be needed. Included in this assessment are:
• The consumer’s current stage of engagement
• Their current level of functional impairment
• Their other medical problems or substance abuse
• Their available family and community support
• Their level of stress and their risk of harm
http://www.cmhda.org/committees/documents/ASOC/Handouts/0806/0806_ASOC_Handouts_ASOC_LOS_policy_and_guidelines_April08_%286‐25‐08%29.pdf
Assessment & Planning – Individual Services & Supports Plan
DMH Letter 05‐05
These partnerships shall include individualized client/family‐driven mental health services and supports plans which emphasize recovery and resilience, and which offer integrated service experiences for clients and families. Individualized, comprehensive service plans help overcome the problems that result from fragmented or uncoordinated services and systems.
Assessment & Planning – Service Delivery Based on Needs Assessment & Individual Services & Supports Plan
DMH Letter 05‐05
Funding provided through the MHSA will be used to transform the current mental health system from one that focuses primarily on clinical services into one in which county mental health programs can enter into partnerships with clients, their families and their communities to provide, under client and family direction, whatever it takes to enable people to attain their goals. The goal will be to eventually provide all needed cost‐efficient and effective services and supports for all those in need of mental health services and their families, consistent with the individualized plans.
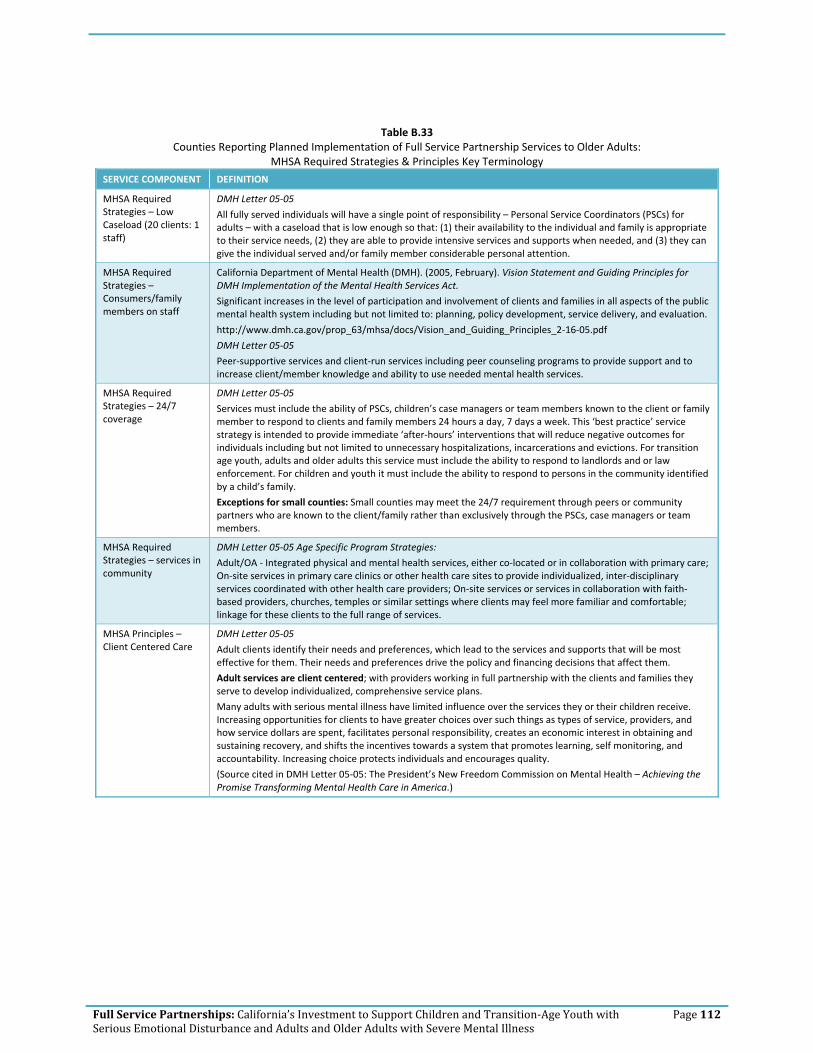
Full Service Partnerships: California’s Investment to Support Children and Transition‐Age Youth with Serious Emotional Disturbance and Adults and Older Adults with Severe Mental Illness
Page 112
Table B.33 Counties Reporting Planned Implementation of Full Service Partnership Services to Older Adults:
MHSA Required Strategies & Principles Key Terminology
SERVICE COMPONENT DEFINITION
MHSA Required Strategies – Low Caseload (20 clients: 1 staff)
DMH Letter 05‐05
All fully served individuals will have a single point of responsibility – Personal Service Coordinators (PSCs) for adults – with a caseload that is low enough so that: (1) their availability to the individual and family is appropriate to their service needs, (2) they are able to provide intensive services and supports when needed, and (3) they can give the individual served and/or family member considerable personal attention.
MHSA Required Strategies – Consumers/family members on staff
California Department of Mental Health (DMH). (2005, February). Vision Statement and Guiding Principles for DMH Implementation of the Mental Health Services Act.
Significant increases in the level of participation and involvement of clients and families in all aspects of the public mental health system including but not limited to: planning, policy development, service delivery, and evaluation.
http://www.dmh.ca.gov/prop_63/mhsa/docs/Vision_and_Guiding_Principles_2‐16‐05.pdf
DMH Letter 05‐05
Peer‐supportive services and client‐run services including peer counseling programs to provide support and to increase client/member knowledge and ability to use needed mental health services.
MHSA Required Strategies – 24/7 coverage
DMH Letter 05‐05
Services must include the ability of PSCs, children’s case managers or team members known to the client or family member to respond to clients and family members 24 hours a day, 7 days a week. This ‘best practice’ service strategy is intended to provide immediate ‘after‐hours’ interventions that will reduce negative outcomes for individuals including but not limited to unnecessary hospitalizations, incarcerations and evictions. For transition age youth, adults and older adults this service must include the ability to respond to landlords and or law enforcement. For children and youth it must include the ability to respond to persons in the community identified by a child’s family.
Exceptions for small counties: Small counties may meet the 24/7 requirement through peers or community partners who are known to the client/family rather than exclusively through the PSCs, case managers or team members.
MHSA Required Strategies – services in community
DMH Letter 05‐05 Age Specific Program Strategies:
Adult/OA ‐ Integrated physical and mental health services, either co‐located or in collaboration with primary care; On‐site services in primary care clinics or other health care sites to provide individualized, inter‐disciplinary services coordinated with other health care providers; On‐site services or services in collaboration with faith‐based providers, churches, temples or similar settings where clients may feel more familiar and comfortable; linkage for these clients to the full range of services.
MHSA Principles – Client Centered Care
DMH Letter 05‐05
Adult clients identify their needs and preferences, which lead to the services and supports that will be most effective for them. Their needs and preferences drive the policy and financing decisions that affect them.
Adult services are client centered; with providers working in full partnership with the clients and families they serve to develop individualized, comprehensive service plans.
Many adults with serious mental illness have limited influence over the services they or their children receive. Increasing opportunities for clients to have greater choices over such things as types of service, providers, and how service dollars are spent, facilitates personal responsibility, creates an economic interest in obtaining and sustaining recovery, and shifts the incentives towards a system that promotes learning, self monitoring, and accountability. Increasing choice protects individuals and encourages quality.
(Source cited in DMH Letter 05‐05: The President’s New Freedom Commission on Mental Health – Achieving the Promise Transforming Mental Health Care in America.)

Full Service Partnerships: California’s Investment to Support Children and Transition‐Age Youth with Serious Emotional Disturbance and Adults and Older Adults with Severe Mental Illness
Page 113
SERVICE COMPONENT DEFINITION
MHSA Principles – Culturally Appropriate
Cultural competence is a set of congruent behaviors, attitudes, and policies that come together in a system, agency, or among consumer providers, family member providers, and professionals that enables that system, agency or those professionals, consumer providers, and family member providers to work effectively in cross‐cultural situations.
Cultural competence includes language competence and views cultural and language competent programs and services as methods for elimination of racial and ethnic mental health disparities. There is a clear focus on improved quality and effectiveness of services. Service providers understand and utilize the strengths of culture in service delivery. Culturally competent programs and services are viewed as a way to enhance the ability of the whole system to incorporate the languages and cultures of its clients into the services that provide the most effective outcomes and create cost effective programs. Identification, development, promulgation, and adoption of culturally competent best practices for care must be an integral part of ongoing culturally competent planning and implementation of the MHSA.
MHSA Principles – Collaboration with Community Services
DMH Letter 05‐05
Community collaboration refers to the process by which various stakeholders including groups of individuals or families, citizens, agencies, organizations, and businesses work together to share information and resources in order to accomplish a shared vision. Collaboration allows for shared leadership, decisions, ownership, vision, and responsibility. The goal of community collaboration is to bring members of the community together in an atmosphere of support to systematically solve existing and emerging problems that could not easily be solved by one group alone.
MHSA Principles – Integrated Service Delivery
DMH Letter 05‐05
This means that services are “seamless” to clients and that clients do not have to negotiate multiple agencies and funding sources to get critical needs met and to move towards recovery and develop resiliency. Services are delivered, or at a minimum, coordinated through a single agency or a system of care. The integrated service experience centers on the individual/family, uses a strength‐based approach, and includes multi‐agency programs and joint planning to best address the individual/family’s needs using the full range of community‐based treatment, case management, and interagency system components required by children/transition age youth/adults/older adults. Integrated service experiences include attention to people of all ages who have a mental illness and who also have co‐occurring disorders, including substance use problems and other chronic health conditions or disabilities. With a full range of integrated services to treat the whole person, the goals of self‐sufficiency for older adults and adults and safe family living for children and youth can be reached for those who may have otherwise faced homelessness, frequent and avoidable emergency medical care or hospitalization, incarceration, out‐of‐home placement, or dependence on the state for years to come.
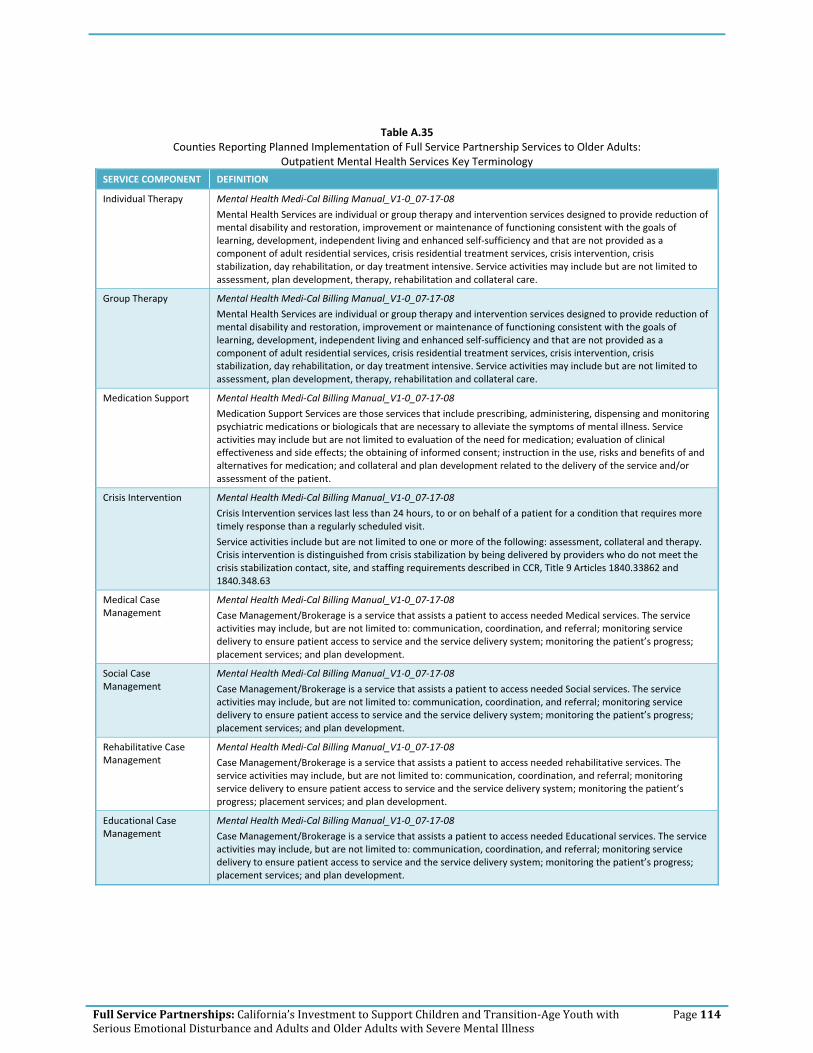
Full Service Partnerships: California’s Investment to Support Children and Transition‐Age Youth with Serious Emotional Disturbance and Adults and Older Adults with Severe Mental Illness
Page 114
Table A.35 Counties Reporting Planned Implementation of Full Service Partnership Services to Older Adults:
Outpatient Mental Health Services Key Terminology
SERVICE COMPONENT DEFINITION
Individual Therapy Mental Health Medi‐Cal Billing Manual_V1‐0_07‐17‐08
Mental Health Services are individual or group therapy and intervention services designed to provide reduction of mental disability and restoration, improvement or maintenance of functioning consistent with the goals of learning, development, independent living and enhanced self‐sufficiency and that are not provided as a component of adult residential services, crisis residential treatment services, crisis intervention, crisis stabilization, day rehabilitation, or day treatment intensive. Service activities may include but are not limited to assessment, plan development, therapy, rehabilitation and collateral care.
Group Therapy Mental Health Medi‐Cal Billing Manual_V1‐0_07‐17‐08
Mental Health Services are individual or group therapy and intervention services designed to provide reduction of mental disability and restoration, improvement or maintenance of functioning consistent with the goals of learning, development, independent living and enhanced self‐sufficiency and that are not provided as a component of adult residential services, crisis residential treatment services, crisis intervention, crisis stabilization, day rehabilitation, or day treatment intensive. Service activities may include but are not limited to assessment, plan development, therapy, rehabilitation and collateral care.
Medication Support Mental Health Medi‐Cal Billing Manual_V1‐0_07‐17‐08
Medication Support Services are those services that include prescribing, administering, dispensing and monitoring psychiatric medications or biologicals that are necessary to alleviate the symptoms of mental illness. Service activities may include but are not limited to evaluation of the need for medication; evaluation of clinical effectiveness and side effects; the obtaining of informed consent; instruction in the use, risks and benefits of and alternatives for medication; and collateral and plan development related to the delivery of the service and/or assessment of the patient.
Crisis Intervention Mental Health Medi‐Cal Billing Manual_V1‐0_07‐17‐08
Crisis Intervention services last less than 24 hours, to or on behalf of a patient for a condition that requires more timely response than a regularly scheduled visit.
Service activities include but are not limited to one or more of the following: assessment, collateral and therapy. Crisis intervention is distinguished from crisis stabilization by being delivered by providers who do not meet the crisis stabilization contact, site, and staffing requirements described in CCR, Title 9 Articles 1840.33862 and 1840.348.63
Medical Case Management
Mental Health Medi‐Cal Billing Manual_V1‐0_07‐17‐08
Case Management/Brokerage is a service that assists a patient to access needed Medical services. The service activities may include, but are not limited to: communication, coordination, and referral; monitoring service delivery to ensure patient access to service and the service delivery system; monitoring the patient’s progress; placement services; and plan development.
Social Case Management
Mental Health Medi‐Cal Billing Manual_V1‐0_07‐17‐08
Case Management/Brokerage is a service that assists a patient to access needed Social services. The service activities may include, but are not limited to: communication, coordination, and referral; monitoring service delivery to ensure patient access to service and the service delivery system; monitoring the patient’s progress; placement services; and plan development.
Rehabilitative Case Management
Mental Health Medi‐Cal Billing Manual_V1‐0_07‐17‐08
Case Management/Brokerage is a service that assists a patient to access needed rehabilitative services. The service activities may include, but are not limited to: communication, coordination, and referral; monitoring service delivery to ensure patient access to service and the service delivery system; monitoring the patient’s progress; placement services; and plan development.
Educational Case Management
Mental Health Medi‐Cal Billing Manual_V1‐0_07‐17‐08
Case Management/Brokerage is a service that assists a patient to access needed Educational services. The service activities may include, but are not limited to: communication, coordination, and referral; monitoring service delivery to ensure patient access to service and the service delivery system; monitoring the patient’s progress; placement services; and plan development.
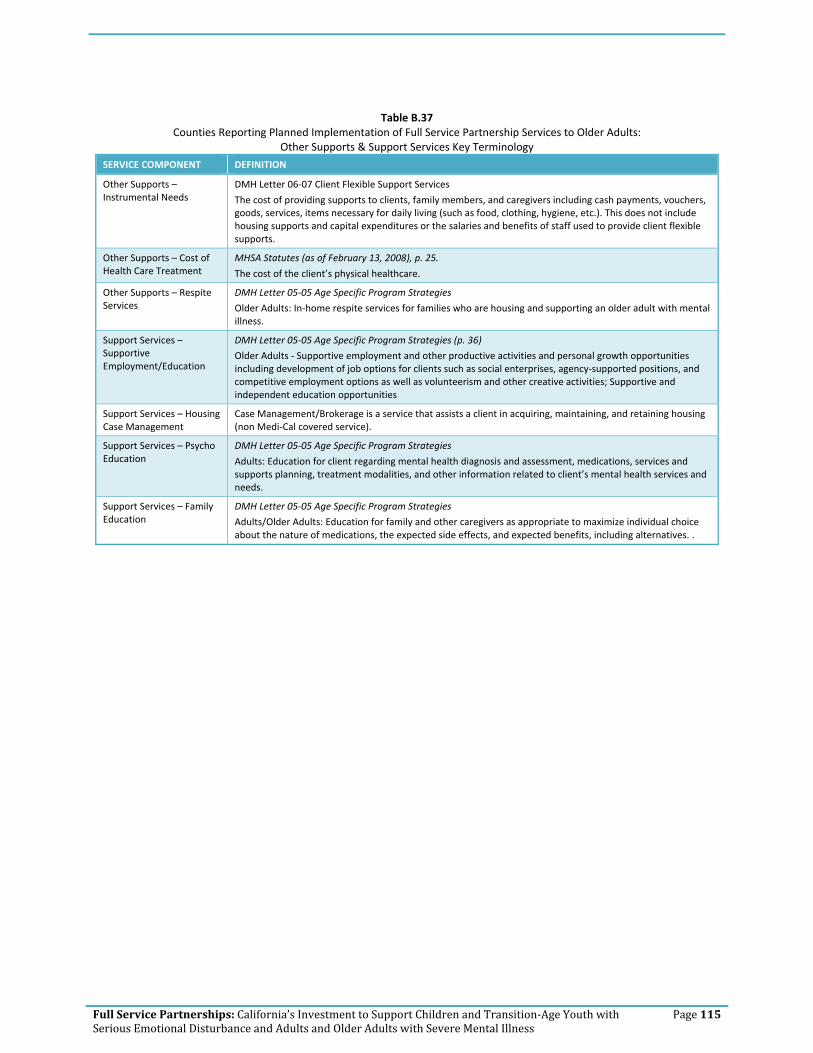
Full Service Partnerships: California’s Investment to Support Children and Transition‐Age Youth with Serious Emotional Disturbance and Adults and Older Adults with Severe Mental Illness
Page 115
Table B.37
Counties Reporting Planned Implementation of Full Service Partnership Services to Older Adults: Other Supports & Support Services Key Terminology
SERVICE COMPONENT DEFINITION
Other Supports – Instrumental Needs
DMH Letter 06‐07 Client Flexible Support Services
The cost of providing supports to clients, family members, and caregivers including cash payments, vouchers, goods, services, items necessary for daily living (such as food, clothing, hygiene, etc.). This does not include housing supports and capital expenditures or the salaries and benefits of staff used to provide client flexible supports.
Other Supports – Cost of Health Care Treatment
MHSA Statutes (as of February 13, 2008), p. 25.
The cost of the client’s physical healthcare.
Other Supports – Respite Services
DMH Letter 05‐05 Age Specific Program Strategies
Older Adults: In‐home respite services for families who are housing and supporting an older adult with mental illness.
Support Services – Supportive Employment/Education
DMH Letter 05‐05 Age Specific Program Strategies (p. 36)
Older Adults ‐ Supportive employment and other productive activities and personal growth opportunities including development of job options for clients such as social enterprises, agency‐supported positions, and competitive employment options as well as volunteerism and other creative activities; Supportive and independent education opportunities
Support Services – Housing Case Management
Case Management/Brokerage is a service that assists a client in acquiring, maintaining, and retaining housing (non Medi‐Cal covered service).
Support Services – Psycho Education
DMH Letter 05‐05 Age Specific Program Strategies
Adults: Education for client regarding mental health diagnosis and assessment, medications, services and supports planning, treatment modalities, and other information related to client’s mental health services and needs.
Support Services – Family Education
DMH Letter 05‐05 Age Specific Program Strategies
Adults/Older Adults: Education for family and other caregivers as appropriate to maximize individual choice about the nature of medications, the expected side effects, and expected benefits, including alternatives. .

Full Service Partnerships: California’s Investment to Support Children and Transition‐Age Youth with Serious Emotional Disturbance and Adults and Older Adults with Severe Mental Illness
Page 116
Table B.39
Counties Reporting Planned Implementation of Full Service Partnership Services to Older Adults: Housing Supports Key Terminology
SERVICE COMPONENT DEFINITION
Housing Support – Housing Support
DMH Letter 06‐07
The cost of providing housing supports, including housing subsidies for permanent, transitional and temporary housing; master leases; motel and other housing vouchers; rental security deposits; first and last month rental payments; and other fiscal housing supports. This does not include the capital costs used to purchase, build or rehab housing or the salaries and benefits of staff used to provide client housing supports.
Housing Support – Operating Support
DMH Letter 06‐07
The operating costs of providing housing supports to clients, including building repair and maintenance, utilities, housing agency management fees, insurance, property taxes and assessments, credit reporting fees, and other operating costs incurred in providing client housing supports. This does not include the capital costs used to purchase, build or rehab housing or the salaries and benefits of staff used to provide client housing supports.
Housing Support – Housing Placement
DMH Letter 05‐05 Age specific strategies:
Adults, Older Adults: Supportive housing – permanent affordable housing with combined supports for independent living, including projects that meet the following criteria: (1) housing is permanent, meaning that each tenant may stay as long as he or she pays his or her share of rent and complies with the terms of a lease or rental agreement, (2) housing is affordable, meaning that each tenant pays no more than 30% to 50% of household income, and (3) tenants have access to an array of support services that are intended to support housing stability, recovery and resiliency, but participation in support services is not a requirement for tenancy. Supportive housing may be site‐based (all or a portion of the units in a building are designated for people with special needs, and supportive services are available on‐site) or scattered site (tenants have or rent houses at various locations in the community).
Housing options are available for transition age youth, adults, and older adults who are single and those who choose to share housing, as well as families with children.

Full Service Partnerships: California’s Investment to Support Children and Transition‐Age Youth with Serious Emotional Disturbance and Adults and Older Adults with Severe Mental Illness
Page 117
Table B.41
Counties Reporting Planned Implementation of Full Service Partnership Services to Children, Youth, & Families (CYF): Mental Health Staff, Non‐Mental Health Services and Supports, Support Services, Co‐Occurring Disorders Treatment Key Terminology
SERVICE COMPONENT DEFINITION
Mental Health Staff – No. of Psychiatrist/Nurse Practitioner staff
US DHHS, SAMHSA, CMS ‐ Evaluating Your Program‐Assertive Community Treatment
For 100 consumers, at least 1 full‐time psychiatrist is assigned to work with the program. The psychiatrist serves as medical director for the team. In addition to medication monitoring, the psychiatrist functions as a fully integrated team member, participating in treatment planning and rehabilitation efforts.
At least 2 full‐time nurses are assigned to work with a 100‐consumer program. The full‐time RN has been found to be a critical ingredient in successful ACT programs. The nurses function as full members of the team, which includes conducting home visits, treatment planning, and daily team meetings. Nurses can help administer needed medications and serve to educate the team about important medication issues.
Mental Health Staff – No. of Social Worker staff (program staff)
US DHHS, SAMHSA, CMS ‐ Evaluating Your Program‐Assertive Community Treatment
Of sufficient size to consistently provide necessary staffing diversity and coverage. At least 10 FTE staff.
Mental Health Staff – Team Approach
US DHHS, SAMHSA, CMS ‐ Evaluating Your Program‐Assertive Community Treatment
Provide group functions as team rather than individual team members; team members know & work with all consumers.
Non Mental Health Services & Supports – Educational/ Employment Supplies
CYF, TAY: school supplies
Non Mental Health Services & Supports – Recreational & Social Activities
DMH Letter 05‐05 Age Specific Strategies
CYF ‐ Recreation and social activities.
Non Mental Health Services & Supports ‐ Transportation
DMH Letter 05‐05 Age Specific Strategies
CYF ‐ Transportation
Support Services – Education/ Employment Case Management (family)
Statutes Section 3620 (as of February 2008)
...and when appropriate, to assist the client’s family with obtaining education and employment (p. 25)
Support Services – Parenting Education
DMH Letter 05‐05 Age Specific Program Strategies
CYF – Family preservation services
Support Services – Intimate Partner Violence Services
DMH Letter 05‐05 Age Specific Program Strategies
Trauma‐informed services and trauma‐specific services (including intergenerational trauma services), particularly for young women with co‐occurring disorders
Co‐Occurring Substance Abuse treatment (non‐residential)
DMH Letter 05‐05 Age Specific Program Strategies
CYF ‐ Integrated services and supports for children/youth and their families with co‐occurring mental health and substance use disorders within the context of a single child/family services and supports plan.

Full Service Partnerships: California’s Investment to Support Children and Transition‐Age Youth with Serious Emotional Disturbance and Adults and Older Adults with Severe Mental Illness
Page 118
Table B.43
Counties Reporting Planned Implementation of Full Service Partnership Services to Children, Youth, & Families (CYF): Evidence‐Based Practices (Specific), Other Practices, Coordination, Discharge Planning Key Terminology
SERVICE COMPONENT DEFINITION
Evidence Based Practices – Cognitive Behavioral Therapy
(Adolescents) Cognitive behavioral therapy (CBT) is a psychotherapeutic approach: a talking therapy. CBT aims to solve problems concerning dysfunctional emotions, behaviors and cognitions through a goal‐oriented, systematic procedure in the present. The title is used in diverse ways to designate behavior therapy, cognitive therapy, and to refer to therapy based upon a combination of basic behavioral and cognitive research.[1]
There is empirical evidence that CBT is effective for the treatment of a variety of problems, including mood, anxiety, personality, eating, substance abuse, and psychotic disorders.[2][3] Treatment is sometimes manualized, with specific technique‐driven brief, direct, and time‐limited treatments for specific psychological disorders. CBT is used in individual therapy as well as group settings, and the techniques are often adapted for self‐help applications. Some clinicians and researchers are more cognitive oriented (e.g. cognitive restructuring), while others are more behaviorally oriented (in vivo exposure therapy). Other interventions combine both (e.g. imaginal exposure therapy).[4][5] 1 British Association for Behavioural and Cognitive Psychotherapies: What are Cognitive and/or Behavioural Psychotherapies? Retrieved on 2008‐11‐1
2 Butler AC, Chapman JE, Forman EM, Beck AT (January 2006). "The empirical status of cognitive‐behavioral therapy: a review of meta‐analyses". Clin Psychol Rev 26 (1): 17–31. doi:10.1016/j.cpr.2005.07.003. PMID 16199119.
3 Cooper, Mick (2008). Essential Research Findings in Counselling and Psychotherapy: The Facts are Friendly. SAGE Publications. ISBN 9781847870421.
4 Foa, E., Rothbaum, B., & Furr, J. (2111). Augmenting exposure therapy with other CBT procedures. Psychiatric Annals, 33(1), 47–56.
5 Abramowitz, J. S. & Kalsy. S. A. (2001) Recent Developments in the Cognitive‐Behavioral Treatment of Obsessive‐Compulsive Disorder. The Behavior Analyst Today, 2 (2), 141–146 http://www.baojournal.com
http://en.wikipedia.org/wiki/Cognitive_behavioral_therapy (downloaded from Wikipedia, 12/1/11)
Evidence Based Practices – Social Skills Training
(Children) Appropriate peer interaction, socially appropriate interaction with others (e.g., Dinosaur Program from Carolyn Webster‐Stratton’s Incredible Years program)
• Focus on cognitive, behavior & affect • Developmentally based • Evidence‐based • Video modeling • Role play, practice and rehearsal • Child size puppets, color cue cards • Stickers, incentives • Small group practice activities • Home assignments with parents
http://www.incredibleyears.com/download/incredible‐years‐presentation‐child‐training‐programs.pdf
Evidence Based Practices – Behavior Therapy
Behaviour therapy, or behavior therapy (behaviour modification) is an approach to psychotherapy based on learning theory which aims to treat psychopathology through techniques designed to reinforce desired and eliminate undesired behaviours.[1]
Functional analysis has even been applied to problems that therapists commonly encounter like client resistance, partially engaged clients and involuntary clients.[2][3] Applications to these problems have left clinicians with considerable tools for enhancing therapeutic effectiveness. One way to enhance therapeutic effectiveness is to use positive reinforcement or operant conditioning.
Many have argued that behaviour therapy is at least as effective as drug treatment for depression, ADHD, and OCD.[4] Considerable policy implications have been inspired by behavioural views of various forms of psychopathology. One form of behaviour therapy (habit reversal training) has been found to be highly effective for treating tics. 1 Behavior therapy. (n.d.). Memidex/WordNet. Retrieved July 15, 2010, from http://www.memidex.com/behaviour‐therapy 2 Cautilli, J.; Tillman, T.C.; Axelrod, S.; Dziewolska, H. & Hineline, P. (2006). Resistance Is Not Futile: An experimental analogue of the effects of consultee "resistance" on the consultant's therapeutic behavior in the consultation process: A replication and extension. IJBCT, 2(3), 362–76. BAO
3 Cautilli, J.D.; Riley‐Tillman, T.C.; Axelrod, S. & Hineline, P. (2005). Current Behavioral Models of Client and Consultee Resistance: A Critical Review. IJBCT, 1(2), 147–64 BAO
4 Flora, S.R. (2007). Taking America off Drugs: why behavioral therapy is more effective for treating ADHD, OCD, Depression, and other psychological problems. SUNY
http://en.wikipedia.org/wiki/Behaviour_therapy
Evidence Based Practices ‐ Modeling
Modeling or modeling in psychology is:
• A method used in specific techniques of psychotherapy whereby the client learns by imitation alone, without any specific verbal direction by the therapist (See Cognitive Behavior Therapy) and
• A general process in which persons serve as models for others, exhibiting the behavior to be imitated by the

Full Service Partnerships: California’s Investment to Support Children and Transition‐Age Youth with Serious Emotional Disturbance and Adults and Older Adults with Severe Mental Illness
Page 119
SERVICE COMPONENT DEFINITION
others[1][2] This process is most commonly discussed with respect to children in developmental psychology. 1 VandenBoss, Gary (2006) APA Dictionary of Psychology. Washington, DC: American Psychological Association 2 Westen, D.; Burton, L. & Kowalski, R. (2006) Psychology: Australian and New Zealand Edition. Milton, QLD. John Wiley and Sons.
http://en.wikipedia.org/wiki/Modelling_(psychology)
Evidence Based Practices – Family Psycho Education
Offered as part of an overall clinical treatment plan for individuals with mental illness to achieve the best possible outcome through active involvement of family members in treatment and management.
Core components include:
• Family Intervention Coordinator • Quality of clinician‐family alliance • Education curriculum • Structured problem‐solving technique
Evidence Based Practices – Multi Systemic Therapy
A practice that views the individual as nestled within a complex network of interconnected systems (family, school, peers). The goal is to facilitate and promote individual change in this natural environment. The caregiver(s) is viewed as the key to long‐term outcomes.
Evidence Based Practices – Therapeutic Foster Care
Services for children within private homes of trained families. The approach combines the normalizing influence of family‐based care with specialized treatment interventions, thereby creating a therapeutic environment in the context of a nurturing family home.
Evidence Based Practices – Parent Child Interaction Therapy
Parent‐Child Interaction Therapy (PCIT) is an empirically‐supported treatment for conduct‐disordered young children that places emphasis on improving the quality of the parent‐child relationship and changing parent‐child interaction patterns. In PCIT, parents are taught specific skills to establish a nurturing and secure relationship with their child while increasing their child’s prosocial behavior and decreasing negative behavior. This treatment focuses on two basic interactions: Child Directed Interaction (CDI) is similar to play therapy in that parents engage their child in a play situation with the goal of strengthening the parent‐child relationship; Parent Directed Interaction (PDI) resembles clinical behavior therapy in that parents learn to use specific behavior management techniques as they play with their child.
For a summary of PCIT and information about the future research directions of PCIT see: Zisser, A., & Eyberg, S.M. (2010). Treating oppositional behavior in children using parent‐child interaction therapy. In A.E. Kazdin &
J.R. Weisz (Eds.) Evidence‐based psychotherapies for children and adolescents (2nd ed., pp. 179‐193). New York: Guilford.
http://pcit.phhp.ufl.edu/
Evidence Based Practices ‐ Wraparound
DMH Letter 05‐05 Age Specific Program Strategies
The Wraparound Program includes services and supports which:
• Provide strength‐based, family‐driven services to children/youth and their families with multiple, complex mental health and behavioral needs
• Are based on a single individualized services and supports plan across systems • Allows for organization, implementation and oversight of an interagency plan as well as taking on the critical
tasks needed to support and serve the child/youth and family
Other Practices – Alternative Treatment
Statutes (as of February 2008)
Section 3360 Program Flexibility. The use of alternative practices, programs/procedures, and demonstration projects shall not be prohibited by these regulations.
Other Practices – Culturally Specific Treatment
DMH Letter 05‐05 Age Specific Program Strategies
Community cultural practices – traditional practitioners, natural healing practices and ceremonies recognized by communities in place of or in addition to mainstream services.
Coordination ‐ Hospital
Coordination for the purpose of facilitating discharge/re‐entry into the community
Coordination – Criminal Justice
DMH Letter 05‐05 Age Specific Program Strategies
Youth ‐ Services provided in jails and juvenile hall must be for the purpose of facilitating discharge.
Discharge Planning & Criteria
Clear criteria and process for moving clients into readiness for discharge from FSPs.
Building MHSA Programs – Mark Ragins
Create “graduation” rituals and services: It’s important to have a positive exit from the system (even for people who continue to take medications); there are serious personal issues for both the people taking the risk of moving on and for the caring staff they leave behind that need to be addressed. We need to remember that full recovery is far more common, and far more realistic, than we imagine. After a year, and flexibly on an ongoing basis, FSP clients should be reassessed for moving on to core services (or, more rarely, Wellness Center). Both staff and clients should view FSP as a transitional program to create a culture that promotes flow. There can be a substantial transitional period of co‐enrollment in both programs.
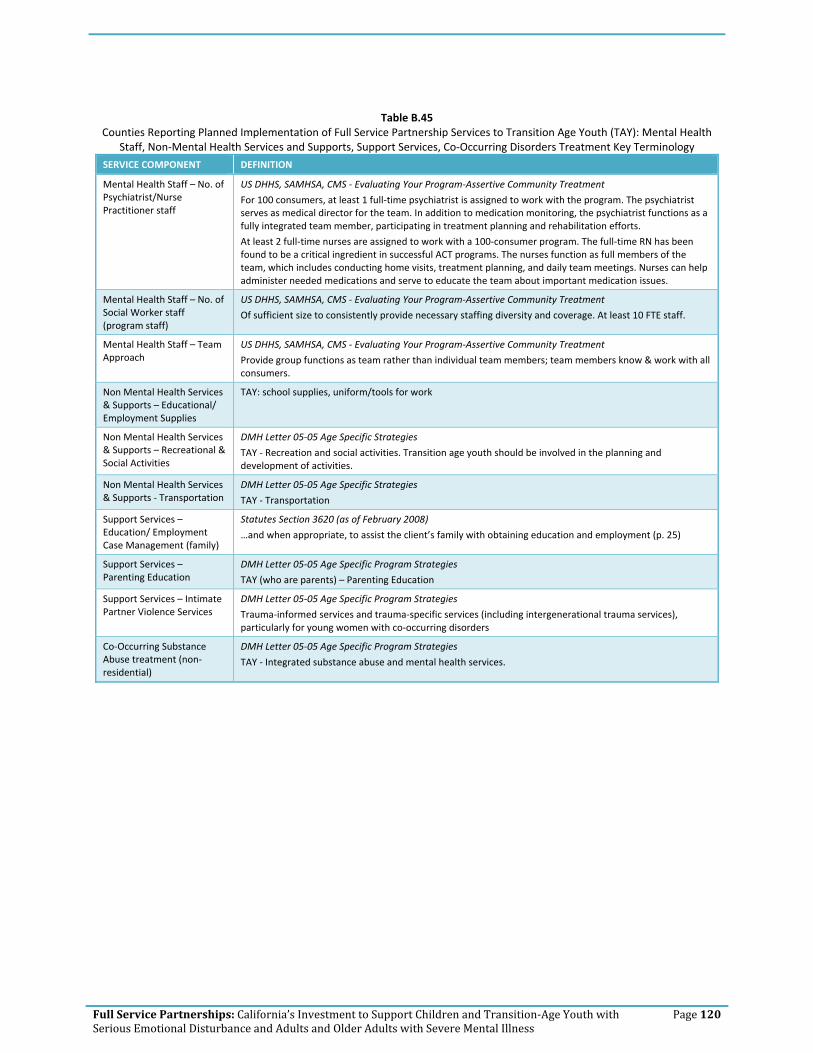
Full Service Partnerships: California’s Investment to Support Children and Transition‐Age Youth with Serious Emotional Disturbance and Adults and Older Adults with Severe Mental Illness
Page 120
Table B.45
Counties Reporting Planned Implementation of Full Service Partnership Services to Transition Age Youth (TAY): Mental Health Staff, Non‐Mental Health Services and Supports, Support Services, Co‐Occurring Disorders Treatment Key Terminology
SERVICE COMPONENT DEFINITION
Mental Health Staff – No. of Psychiatrist/Nurse Practitioner staff
US DHHS, SAMHSA, CMS ‐ Evaluating Your Program‐Assertive Community Treatment
For 100 consumers, at least 1 full‐time psychiatrist is assigned to work with the program. The psychiatrist serves as medical director for the team. In addition to medication monitoring, the psychiatrist functions as a fully integrated team member, participating in treatment planning and rehabilitation efforts.
At least 2 full‐time nurses are assigned to work with a 100‐consumer program. The full‐time RN has been found to be a critical ingredient in successful ACT programs. The nurses function as full members of the team, which includes conducting home visits, treatment planning, and daily team meetings. Nurses can help administer needed medications and serve to educate the team about important medication issues.
Mental Health Staff – No. of Social Worker staff (program staff)
US DHHS, SAMHSA, CMS ‐ Evaluating Your Program‐Assertive Community Treatment
Of sufficient size to consistently provide necessary staffing diversity and coverage. At least 10 FTE staff.
Mental Health Staff – Team Approach
US DHHS, SAMHSA, CMS ‐ Evaluating Your Program‐Assertive Community Treatment
Provide group functions as team rather than individual team members; team members know & work with all consumers.
Non Mental Health Services & Supports – Educational/ Employment Supplies
TAY: school supplies, uniform/tools for work
Non Mental Health Services & Supports – Recreational & Social Activities
DMH Letter 05‐05 Age Specific Strategies
TAY ‐ Recreation and social activities. Transition age youth should be involved in the planning and development of activities.
Non Mental Health Services & Supports ‐ Transportation
DMH Letter 05‐05 Age Specific Strategies
TAY ‐ Transportation
Support Services – Education/ Employment Case Management (family)
Statutes Section 3620 (as of February 2008)
…and when appropriate, to assist the client’s family with obtaining education and employment (p. 25)
Support Services – Parenting Education
DMH Letter 05‐05 Age Specific Program Strategies
TAY (who are parents) – Parenting Education
Support Services – Intimate Partner Violence Services
DMH Letter 05‐05 Age Specific Program Strategies
Trauma‐informed services and trauma‐specific services (including intergenerational trauma services), particularly for young women with co‐occurring disorders
Co‐Occurring Substance Abuse treatment (non‐residential)
DMH Letter 05‐05 Age Specific Program Strategies
TAY ‐ Integrated substance abuse and mental health services.

Full Service Partnerships: California’s Investment to Support Children and Transition‐Age Youth with Serious Emotional Disturbance and Adults and Older Adults with Severe Mental Illness
Page 121
Table B.47
Counties Reporting Planned Implementation of Full Service Partnership Services to Transition Age Youth (TAY): Evidence‐Based Practices (Specific), Other Practices, Coordination, Discharge Planning Key Terminology
SERVICE COMPONENT DEFINITION
Wellness Recovery Action Plan
WRAP was developed by Mary Ellen Copeland, Ph.D., for people struggling with mental health issues. The plan can be completed alone or with assistance. The key is that the process is directed by the individual. Key elements of WRAP include (from http://www.mentalhealthrecovery.com/wrap downloaded on 12/1/11):
• Wellness Toolbox • Daily Maintenance Plan • Identifying Triggers and an Action Plan • Identifying Early Warning Signs and an Action Plan • Identifying When Things Are Breaking Down and an Action Plan • Crisis Planning • Post Crisis Planning.
Evidence Based Practices – Cognitive Behavioral Therapy
Cognitive behavioral therapy (CBT) is a psychotherapeutic approach: a talking therapy. CBT aims to solve problems concerning dysfunctional emotions, behaviors and cognitions through a goal‐oriented, systematic procedure in the present. The title is used in diverse ways to designate behavior therapy, cognitive therapy, and to refer to therapy based upon a combination of basic behavioral and cognitive research.[1]
There is empirical evidence that CBT is effective for the treatment of a variety of problems, including mood, anxiety, personality, eating, substance abuse, and psychotic disorders.[2][3] Treatment is sometimes manualized, with specific technique‐driven brief, direct, and time‐limited treatments for specific psychological disorders. CBT is used in individual therapy as well as group settings, and the techniques are often adapted for self‐help applications. Some clinicians and researchers are more cognitive oriented (e.g. cognitive restructuring), while others are more behaviorally oriented (in vivo exposure therapy). Other interventions combine both (e.g. imaginal exposure therapy).[4][5] 1 British Association for Behavioural and Cognitive Psychotherapies: What are Cognitive and/or Behavioural Psychotherapies?
Retrieved on 2008‐11‐1 2 Butler AC, Chapman JE, Forman EM, Beck AT (January 2006). "The empirical status of cognitive‐behavioral therapy: a review
of meta‐analyses". Clin Psychol Rev 26 (1): 17–31. doi:10.1016/j.cpr.2005.07.003. PMID 16199119. 3 Cooper, Mick (2008). Essential Research Findings in Counselling and Psychotherapy: The Facts are Friendly. SAGE Publications.
ISBN 9781847870421. 4 Foa, E., Rothbaum, B., & Furr, J. (2111). Augmenting exposure therapy with other CBT procedures. Psychiatric Annals, 33(1),
47–56. 5 Abramowitz, J. S. & Kalsy. S. A. (2001) Recent Developments in the Cognitive‐Behavioral Treatment of Obsessive‐Compulsive
Disorder. The Behavior Analyst Today, 2 (2), 141–146 http://www.baojournal.com
http://en.wikipedia.org/wiki/Cognitive_behavioral_therapy (downloaded from Wikipedia, 12/1/11)
Evidence Based Practices – Social Skills Training
Transition Age Youth/Adults with schizophrenia often have very poor interpersonal skills. Making appropriate eye contact, controlling the volume of their voice, and participating in a conversation can all be difficult for them. The goal of social skills training is to teach patients basic life skills, including how to interact with other people.
A typical social skills training class might focus on only one feature of social interaction, like how to make good eye contact. Patients will learn about appropriate eye contact, practice using role play, and receive feedback from a therapist. After the lesson, patients will be asked to use this new skill in the real world and talk in the next session about how it worked.
Social skills training can also help patients learn a variety of basic skills, including taking care of basic hygiene, preparing meals, and managing their money. Classes might include basic cooking lessons, fire safety, or how to write a check. As you can see, social skills training is very different from psychotherapy. Indeed, Michael Green at the University of California, Los Angeles, has noted that social skills training is like taking dance lessons: It is a practical, hands‐on process.
http://www.health.am/psy/more/schizophrenia‐social‐skills‐training/
Evidence Based Practices – Dialectical Behavior Therapy
Dialectical behavior therapy (DBT) is a system of therapy originally developed by Marsha M. Linehan, a psychology researcher at the University of Washington, to treat people with borderline personality disorder (BPD).[1][2] DBT combines standard cognitive‐behavioral techniques for emotion regulation and reality‐testing with concepts of distress tolerance, acceptance, and mindful awareness largely derived from Buddhist meditative practice. DBT may be the first therapy that has been experimentally demonstrated to be generally effective in treating BPD.[3][4] A meta‐analysis found that DBT reached moderate effects.[5] Research indicates that DBT is also effective in treating patients who present varied symptoms and behaviors associated with spectrum mood disorders, including self‐injury.[6] Recent work suggests its effectiveness with sexual abuse survivors[7] and chemical dependency.[8] 1 Janowsky, David S. (1999). Psychotherapy indications and outcomes. Washington, DC: American Psychiatric Press. pp. 100.
ISBN 0‐88048‐761‐5. 2 Linehan, M. M. & Dimeff, L. (2001). Dialectical Behavior Therapy in a nutshell, The California Psychologist, 34, 10‐13. 3 Linehan, M. M.; Armstrong, H. E.; Suarez, A.; Allmon, D.; Heard, H. L. (1991). "Cognitive‐behavioral treatment of chronically

Full Service Partnerships: California’s Investment to Support Children and Transition‐Age Youth with Serious Emotional Disturbance and Adults and Older Adults with Severe Mental Illness
Page 122
SERVICE COMPONENT DEFINITION
parasuicidal borderline patients". Archives of General Psychiatry 48: 1060–64. 4 Linehan, M. M.; Heard, H. L.; Armstrong, H. E. (1993). "Naturalistic follow‐up of a behavioural treatment of chronically
parasuicidal borderline patients". Archives of General Psychiatry 50 (12): 971–974. PMID 8250683. 5 Öst, L. G. (2008). Efficacy of the third wave of behavioral therapies: A systematic review and meta‐analysis. Behaviour
Research and Therapy, 46, 296–321. 6 Brody, J. E. (2008, May 6). The growing wave of teenage self‐injury. New York Times. Retrieved July 1, 2008. 7 Decker, S.E.; Naugle, A.E. (2008). "DBT for Sexual Abuse Survivors: Current Status and Future Directions". Journal of behavior
Analysis of Offender and Victim: Treatment and Prevention 1 (4): 52–69. http://www.baojournal.com/JOBA‐OVTP/JOBA‐OVTP‐VOL‐1/JOBA‐OVTP‐1‐4.pdf.
8 [1] http://en.wikipedia.org/wiki/Dialectical_behavior_therapy
Evidence Based Practices – Behavior Therapy
Behaviour therapy, or behavior therapy (behaviour modification) is an approach to psychotherapy based on learning theory which aims to treat psychopathology through techniques designed to reinforce desired and eliminate undesired behaviours.[1]
Functional analysis has even been applied to problems that therapists commonly encounter like client resistance, partially engaged clients and involuntary clients.[2][3] Applications to these problems have left clinicians with considerable tools for enhancing therapeutic effectiveness. One way to enhance therapeutic effectiveness is to use positive reinforcement or operant conditioning.
Many have argued that behaviour therapy is at least as effective as drug treatment for depression, ADHD, and OCD.[4] Considerable policy implications have been inspired by behavioural views of various forms of psychopathology. One form of behaviour therapy (habit reversal training) has been found to be highly effective for treating tics. 1 Behavior therapy. (n.d.). Memidex/WordNet. Retrieved July 15, 2010, from http://www.memidex.com/behaviour‐therapy 2 Cautilli, J.; Tillman, T.C.; Axelrod, S.; Dziewolska, H. & Hineline, P. (2006). Resistance Is Not Futile: An experimental analogue of
the effects of consultee "resistance" on the consultant's therapeutic behavior in the consultation process: A replication and extension. IJBCT, 2(3), 362–76. BAO
3 Cautilli, J.D.; Riley‐Tillman, T.C.; Axelrod, S. & Hineline, P. (2005). Current Behavioral Models of Client and Consultee Resistance: A Critical Review. IJBCT, 1(2), 147–64 BAO
4 Flora, S.R. (2007). Taking America off Drugs: why behavioral therapy is more effective for treating ADHD, OCD, Depression, and other psychological problems. SUNY
http://en.wikipedia.org/wiki/Behaviour_therapy
Evidence Based Practices ‐ Modeling
Modeling or modeling in psychology is:
• A method used in specific techniques of psychotherapy whereby the client learns by imitation alone, without any specific verbal direction by the therapist (See Cognitive Behavior Therapy) and
• A general process in which persons serve as models for others, exhibiting the behavior to be imitated by the others[1][2] This process is most commonly discussed with respect to children in developmental psychology.
1 VandenBoss, Gary (2006) APA Dictionary of Psychology. Washington, DC: American Psychological Association 2 Westen, D.; Burton, L. & Kowalski, R. (2006) Psychology: Australian and New Zealand Edition. Milton, QLD. John Wiley and
Sons. http://en.wikipedia.org/wiki/Modelling_(psychology)
Evidence Based Practices – Family Psycho Education
Offered as part of an overall clinical treatment plan for individuals with mental illness to achieve the best possible outcome through active involvement of family members in treatment and management.
Core components include:
• Family Intervention Coordinator • Quality of clinician‐family alliance • Education curriculum • Structured problem‐solving technique
Evidence Based Practices – Multi Systemic Therapy
A practice that views the individual as nestled within a complex network of interconnected systems (family, school, peers). The goal is to facilitate and promote individual change in this natural environment. The caregiver(s) is viewed as the key to long‐term outcomes.
Other Practices – Alternative Treatment
Statutes (as of February 2008)
Section 3360 Program Flexibility. The use of alternative practices, programs/procedures, and demonstration projects shall not be prohibited by these regulations.
Other Practices – Culturally Specific Treatment
DMH Letter 05‐05 Age Specific Program Strategies
Community cultural practices – traditional practitioners, natural healing practices and ceremonies recognized by communities in place of or in addition to mainstream services.
Coordination ‐ Hospital
Coordination for the purpose of facilitating discharge/re‐entry into the community
Coordination – Criminal Justice
DMH Letter 05‐05 Age Specific Program Strategies
Youth ‐ Services provided in jails and juvenile hall must be for the purpose of facilitating discharge.

Full Service Partnerships: California’s Investment to Support Children and Transition‐Age Youth with Serious Emotional Disturbance and Adults and Older Adults with Severe Mental Illness
Page 123
SERVICE COMPONENT DEFINITION
Discharge Planning & Criteria
Clear criteria and process for moving clients into readiness for discharge from FSPs.
Building MHSA Programs – Mark Ragins
Create “graduation” rituals and services: It’s important to have a positive exit from the system (even for people who continue to take medications); there are serious personal issues for both the people taking the risk of moving on and for the caring staff they leave behind that need to be addressed. We need to remember that full recovery is far more common, and far more realistic, than we imagine. After a year, and flexibly on an ongoing basis, FSP clients should be reassessed for moving on to core services (or, more rarely, Wellness Center). Both staff and clients should view FSP as a transitional program to create a culture that promotes flow. There can be a substantial transitional period of co‐enrollment in both programs.

Full Service Partnerships: California’s Investment to Support Children and Transition‐Age Youth with Serious Emotional Disturbance and Adults and Older Adults with Severe Mental Illness
Page 124
Table B.49
Counties Reporting Planned Implementation of Full Service Partnership Services to Adults: Mental Health Staff, Non‐Mental Health Services and Supports, Support Services, Co‐Occurring Disorders Treatment Key Terminology
SERVICE COMPONENT DEFINITION
Mental Health Staff – No. of Psychiatrist/Nurse Practitioner staff
US DHHS, SAMHSA, CMS ‐ Evaluating Your Program‐Assertive Community Treatment
For 100 consumers, at least 1 full‐time psychiatrist is assigned to work with the program. The psychiatrist serves as medical director for the team. In addition to medication monitoring, the psychiatrist functions as a fully integrated team member, participating in treatment planning and rehabilitation efforts.
At least 2 full‐time nurses are assigned to work with a 100‐consumer program. The full‐time RN has been found to be a critical ingredient in successful ACT programs. The nurses function as full members of the team, which includes conducting home visits, treatment planning, and daily team meetings. Nurses can help administer needed medications and serve to educate the team about important medication issues.
Mental Health Staff – No. of Social Worker staff (program staff)
US DHHS, SAMHSA, CMS ‐ Evaluating Your Program‐Assertive Community Treatment
Of sufficient size to consistently provide necessary staffing diversity and coverage. At least 10 FTE staff.
Mental Health Staff – Team Approach
US DHHS, SAMHSA, CMS ‐ Evaluating Your Program‐Assertive Community Treatment
Provide group functions as team rather than individual team members; team members know & work with all consumers.
Non Mental Health Services & Supports – Educational/ Employment Supplies
Adults, Older Adults: tools for work, uniform, etc.
Non Mental Health Services & Supports – Recreational & Social Activities
DMH Letter 05‐05 Age Specific Strategies
Adults, Older Adults ‐ Self‐help and client‐run programs such as drop‐in centers, club houses.
Non Mental Health Services & Supports ‐ Transportation
DMH Letter 05‐05 Age Specific Strategies
Adults ‐Transportation
Support Services – Education/ Employment Case Management (family)
Statutes Section 3620 (as of February 2008)
…and when appropriate, to assist the client’s family with obtaining education and employment (p. 25)
Support Services – Parenting Education
DMH Letter 05‐05 Age Specific Program Strategies
Adults with children – parenting education
Support Services – Intimate Partner Violence Services
DMH Letter 05‐05 Age Specific Program Strategies
Trauma‐informed services and trauma‐specific services (including intergenerational trauma services).
Co‐Occurring Substance Abuse treatment (non‐residential)
DMH Letter 05‐05 Age Specific Program Strategies
Adults ‐ Integrated substance abuse and mental health services.
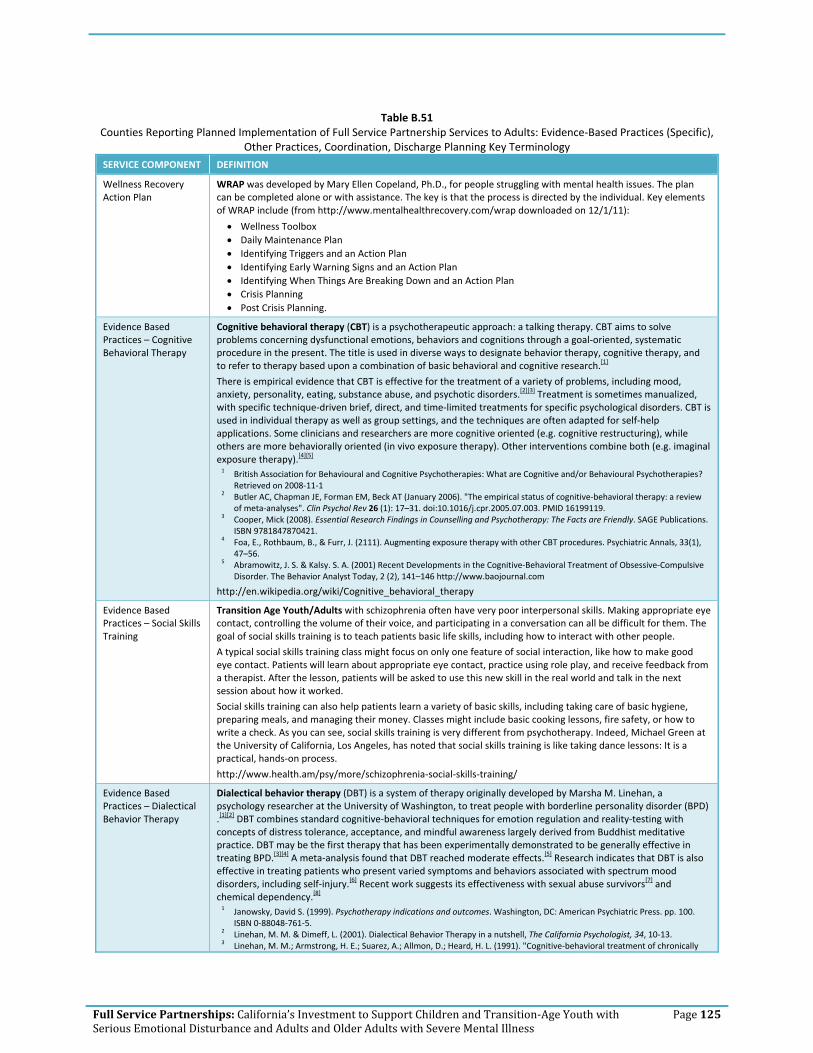
Full Service Partnerships: California’s Investment to Support Children and Transition‐Age Youth with Serious Emotional Disturbance and Adults and Older Adults with Severe Mental Illness
Page 125
Table B.51
Counties Reporting Planned Implementation of Full Service Partnership Services to Adults: Evidence‐Based Practices (Specific), Other Practices, Coordination, Discharge Planning Key Terminology
SERVICE COMPONENT DEFINITION
Wellness Recovery Action Plan
WRAP was developed by Mary Ellen Copeland, Ph.D., for people struggling with mental health issues. The plan can be completed alone or with assistance. The key is that the process is directed by the individual. Key elements of WRAP include (from http://www.mentalhealthrecovery.com/wrap downloaded on 12/1/11):
• Wellness Toolbox • Daily Maintenance Plan • Identifying Triggers and an Action Plan • Identifying Early Warning Signs and an Action Plan • Identifying When Things Are Breaking Down and an Action Plan • Crisis Planning • Post Crisis Planning.
Evidence Based Practices – Cognitive Behavioral Therapy
Cognitive behavioral therapy (CBT) is a psychotherapeutic approach: a talking therapy. CBT aims to solve problems concerning dysfunctional emotions, behaviors and cognitions through a goal‐oriented, systematic procedure in the present. The title is used in diverse ways to designate behavior therapy, cognitive therapy, and to refer to therapy based upon a combination of basic behavioral and cognitive research.[1]
There is empirical evidence that CBT is effective for the treatment of a variety of problems, including mood, anxiety, personality, eating, substance abuse, and psychotic disorders.[2][3] Treatment is sometimes manualized, with specific technique‐driven brief, direct, and time‐limited treatments for specific psychological disorders. CBT is used in individual therapy as well as group settings, and the techniques are often adapted for self‐help applications. Some clinicians and researchers are more cognitive oriented (e.g. cognitive restructuring), while others are more behaviorally oriented (in vivo exposure therapy). Other interventions combine both (e.g. imaginal exposure therapy).[4][5] 1 British Association for Behavioural and Cognitive Psychotherapies: What are Cognitive and/or Behavioural Psychotherapies?
Retrieved on 2008‐11‐1 2 Butler AC, Chapman JE, Forman EM, Beck AT (January 2006). "The empirical status of cognitive‐behavioral therapy: a review
of meta‐analyses". Clin Psychol Rev 26 (1): 17–31. doi:10.1016/j.cpr.2005.07.003. PMID 16199119. 3 Cooper, Mick (2008). Essential Research Findings in Counselling and Psychotherapy: The Facts are Friendly. SAGE Publications.
ISBN 9781847870421. 4 Foa, E., Rothbaum, B., & Furr, J. (2111). Augmenting exposure therapy with other CBT procedures. Psychiatric Annals, 33(1),
47–56. 5 Abramowitz, J. S. & Kalsy. S. A. (2001) Recent Developments in the Cognitive‐Behavioral Treatment of Obsessive‐Compulsive
Disorder. The Behavior Analyst Today, 2 (2), 141–146 http://www.baojournal.com
http://en.wikipedia.org/wiki/Cognitive_behavioral_therapy
Evidence Based Practices – Social Skills Training
Transition Age Youth/Adults with schizophrenia often have very poor interpersonal skills. Making appropriate eye contact, controlling the volume of their voice, and participating in a conversation can all be difficult for them. The goal of social skills training is to teach patients basic life skills, including how to interact with other people.
A typical social skills training class might focus on only one feature of social interaction, like how to make good eye contact. Patients will learn about appropriate eye contact, practice using role play, and receive feedback from a therapist. After the lesson, patients will be asked to use this new skill in the real world and talk in the next session about how it worked.
Social skills training can also help patients learn a variety of basic skills, including taking care of basic hygiene, preparing meals, and managing their money. Classes might include basic cooking lessons, fire safety, or how to write a check. As you can see, social skills training is very different from psychotherapy. Indeed, Michael Green at the University of California, Los Angeles, has noted that social skills training is like taking dance lessons: It is a practical, hands‐on process.
http://www.health.am/psy/more/schizophrenia‐social‐skills‐training/
Evidence Based Practices – Dialectical Behavior Therapy
Dialectical behavior therapy (DBT) is a system of therapy originally developed by Marsha M. Linehan, a psychology researcher at the University of Washington, to treat people with borderline personality disorder (BPD) .[1][2] DBT combines standard cognitive‐behavioral techniques for emotion regulation and reality‐testing with concepts of distress tolerance, acceptance, and mindful awareness largely derived from Buddhist meditative practice. DBT may be the first therapy that has been experimentally demonstrated to be generally effective in treating BPD.[3][4] A meta‐analysis found that DBT reached moderate effects.[5] Research indicates that DBT is also effective in treating patients who present varied symptoms and behaviors associated with spectrum mood disorders, including self‐injury.[6] Recent work suggests its effectiveness with sexual abuse survivors[7] and chemical dependency.[8] 1 Janowsky, David S. (1999). Psychotherapy indications and outcomes. Washington, DC: American Psychiatric Press. pp. 100.
ISBN 0‐88048‐761‐5. 2 Linehan, M. M. & Dimeff, L. (2001). Dialectical Behavior Therapy in a nutshell, The California Psychologist, 34, 10‐13. 3 Linehan, M. M.; Armstrong, H. E.; Suarez, A.; Allmon, D.; Heard, H. L. (1991). "Cognitive‐behavioral treatment of chronically

Full Service Partnerships: California’s Investment to Support Children and Transition‐Age Youth with Serious Emotional Disturbance and Adults and Older Adults with Severe Mental Illness
Page 126
SERVICE COMPONENT DEFINITION
parasuicidal borderline patients". Archives of General Psychiatry 48: 1060–64. 4 Linehan, M. M.; Heard, H. L.; Armstrong, H. E. (1993). "Naturalistic follow‐up of a behavioural treatment of chronically
parasuicidal borderline patients". Archives of General Psychiatry 50 (12): 971–974. PMID 8250683. 5 Öst, L. G. (2008). Efficacy of the third wave of behavioral therapies: A systematic review and meta‐analysis. Behaviour
Research and Therapy, 46, 296–321. 6 Brody, J. E. (2008, May 6). The growing wave of teenage self‐injury. New York Times. Retrieved July 1, 2008. 7 Decker, S.E.; Naugle, A.E. (2008). "DBT for Sexual Abuse Survivors: Current Status and Future Directions". Journal of behavior
Analysis of Offender and Victim: Treatment and Prevention 1 (4): 52–69. http://www.baojournal.com/JOBA‐OVTP/JOBA‐OVTP‐VOL‐1/JOBA‐OVTP‐1‐4.pdf.
8 [1]
http://en.wikipedia.org/wiki/Dialectical_behavior_therapy
Evidence Based Practices – Behavior Therapy
Behaviour therapy, or behavior therapy (behaviour modification) is an approach to psychotherapy based on learning theory which aims to treat psychopathology through techniques designed to reinforce desired and eliminate undesired behaviours.[1]
Functional analysis has even been applied to problems that therapists commonly encounter like client resistance, partially engaged clients and involuntary clients.[2][3] Applications to these problems have left clinicians with considerable tools for enhancing therapeutic effectiveness. One way to enhance therapeutic effectiveness is to use positive reinforcement or operant conditioning.
Many have argued that behaviour therapy is at least as effective as drug treatment for depression, ADHD, and OCD.[4] Considerable policy implications have been inspired by behavioural views of various forms of psychopathology. One form of behaviour therapy (habit reversal training) has been found to be highly effective for treating tics. 1 Behavior therapy. (n.d.). Memidex/WordNet. Retrieved July 15, 2010, from http://www.memidex.com/behaviour‐therapy 2 Cautilli, J.; Tillman, T.C.; Axelrod, S.; Dziewolska, H. & Hineline, P. (2006). Resistance Is Not Futile: An experimental analogue of
the effects of consultee "resistance" on the consultant's therapeutic behavior in the consultation process: A replication and extension. IJBCT, 2(3), 362–76. BAO
3 Cautilli, J.D.; Riley‐Tillman, T.C.; Axelrod, S. & Hineline, P. (2005). Current Behavioral Models of Client and Consultee Resistance: A Critical Review. IJBCT, 1(2), 147–64 BAO
4 Flora, S.R. (2007). Taking America off Drugs: why behavioral therapy is more effective for treating ADHD, OCD, Depression, and other psychological problems. SUNY
http://en.wikipedia.org/wiki/Behaviour_therapy
Evidence Based Practices ‐ Modeling
Modeling or modeling in psychology is:
• A method used in specific techniques of psychotherapy whereby the client learns by imitation alone, without any specific verbal direction by the therapist (See Cognitive Behavior Therapy) and
• A general process in which persons serve as models for others, exhibiting the behavior to be imitated by the others[1][2] This process is most commonly discussed with respect to children in developmental psychology.
1 VandenBoss, Gary (2006) APA Dictionary of Psychology. Washington, DC: American Psychological Association 2 Westen, D.; Burton, L. & Kowalski, R. (2006) Psychology: Australian and New Zealand Edition. Milton, QLD. John Wiley and
Sons. http://en.wikipedia.org/wiki/Modelling_(psychology)
Evidence Based Practices – Family Psychoeducation
Family Psychoeducation is offered as part of an overall clinical treatment plan for individuals with mental illness to achieve the best possible outcome through active involvement of family members in treatment and management.
Core components include:
• Family Intervention Coordinator • Quality of clinician‐family alliance • Education curriculum • Structured problem‐solving technique
Evidence Based Practices – Partners in Care
Partners in Care (PIC) is an intervention for use in managed primary care settings to improve the treatment of depression. PIC is based on collaborative care models, in which mental health is integrated with primary care. The program supports the detection, assessment, treatment choice, and management of patients with major depression or dysthymia by increasing collaboration among primary care clinicians, mental health specialists, nurses, and patients. For the managed care provider, the intervention goal is to increase the percentage of patients receiving appropriate treatment for depression. For patients, the program aims to improve quality of life and reduce depression symptoms.
The core elements of PIC include teamwork between specialists and generalists, case management by nurses, and patient education and empowerment. The intervention educates clinicians on the treatment of depression in the primary care setting while also giving them access to psychotherapists who can provide consultation on difficult cases and take referrals when needed. Health care organizations participating in PIC receive a package of materials designed to help them implement their own collaborative care model.
http://nrepp.samhsa.gov/ViewIntervention.aspx?id=126

Full Service Partnerships: California’s Investment to Support Children and Transition‐Age Youth with Serious Emotional Disturbance and Adults and Older Adults with Severe Mental Illness
Page 127
SERVICE COMPONENT DEFINITION
Other Practices – Alternative Treatment
Statutes (as of February 2008)
Section 3360 Program Flexibility. The use of alternative practices, programs/procedures, and demonstration projects shall not be prohibited by these regulations.
Other Practices – Culturally Specific Treatment
DMH Letter 05‐05 Age Specific Program Strategies
Community cultural practices – traditional practitioners, natural healing practices and ceremonies recognized by communities in place of or in addition to mainstream services.
Coordination ‐ Hospital
Coordination for the purpose of facilitating discharge/re‐entry into the community
Coordination – Criminal Justice
DMH Letter 05‐05 Age Specific Program Strategies
Adults/Older Adults ‐ Integrated services with law enforcement, probation and courts for the purpose of crisis response, pre‐ and post‐booking services, alternatives to jail for those with serious mental illness and/or collaboration to establish mental health courts for clients who have criminal justice charges. Integrated forensic programs include ones similar to those established pursuant to the Mentally Ill Offender Crime Reduction Grant Program.
Discharge Planning & Criteria
Clear criteria and process for moving clients into readiness for discharge from FSPs.
Building MHSA Programs – Mark Ragins
Create “graduation” rituals and services: It’s important to have a positive exit from the system (even for people who continue to take medications); there are serious personal issues for both the people taking the risk of moving on and for the caring staff they leave behind that need to be addressed. We need to remember that full recovery is far more common, and far more realistic, than we imagine. After a year, and flexibly on an ongoing basis, FSP clients should be reassessed for moving on to core services (or, more rarely, Wellness Center). Both staff and clients should view FSP as a transitional program to create a culture that promotes flow. There can be a substantial transitional period of co‐enrollment in both programs.

Full Service Partnerships: California’s Investment to Support Children and Transition‐Age Youth with Serious Emotional Disturbance and Adults and Older Adults with Severe Mental Illness
Page 128
Table B.53
Counties Reporting Planned Implementation of Full Service Partnership Services to Older Adults: Mental Health Staff, Non‐Mental Health Services and Supports, Support Services, Co‐Occurring Disorders Treatment Key Terminology
SERVICE COMPONENT DEFINITION
Mental Health Staff – No. of Psychiatrist/Nurse Practitioner staff
US DHHS, SAMHSA, CMS ‐ Evaluating Your Program‐Assertive Community Treatment
For 100 consumers, at least 1 full‐time psychiatrist is assigned to work with the program. The psychiatrist serves as medical director for the team. In addition to medication monitoring, the psychiatrist functions as a fully integrated team member, participating in treatment planning and rehabilitation efforts.
At least 2 full‐time nurses are assigned to work with a 100‐consumer program. The full‐time RN has been found to be a critical ingredient in successful ACT programs. The nurses function as full members of the team, which includes conducting home visits, treatment planning, and daily team meetings. Nurses can help administer needed medications and serve to educate the team about important medication issues.
Mental Health Staff – No. of Social Worker staff (program staff)
US DHHS, SAMHSA, CMS ‐ Evaluating Your Program‐Assertive Community Treatment
Of sufficient size to consistently provide necessary staffing diversity and coverage. At least 10 FTE staff.
Mental Health Staff – Team Approach
US DHHS, SAMHSA, CMS ‐ Evaluating Your Program‐Assertive Community Treatment
Provide group functions as team rather than individual team members; team members know & work with all consumers.
Non Mental Health Services & Supports – Educational/ Employment Supplies
Adults, Older Adults: tools for work, uniform, etc.
Non Mental Health Services & Supports – Recreational & Social Activities
DMH Letter 05‐05 Age Specific Strategies
Older Adults – Personal growth opportunities
Adults, Older Adults ‐ Self‐help and client‐run programs such as drop‐in centers, club houses.
Non Mental Health Services & Supports ‐ Transportation
DMH Letter 05‐05 Age Specific Strategies
Older Adults ‐ Transportation
Support Services – Education/ Employment Case Management (family)
Statutes Section 3620 (as of February 2008)
…and when appropriate, to assist the client’s family with obtaining education and employment (p. 25)
Support Services – Recreation Case Management
DMH Letter 05‐05 Age Specific Strategies
Older Adults …as well as volunteerism and other creative activities.
Support Services – Intimate Partner Violence Services
DMH Letter 05‐05 Age Specific Program Strategies
Trauma‐informed services and trauma‐specific services (including intergenerational trauma services).
Co‐Occurring Substance Abuse treatment (non‐residential)
DMH Letter 05‐05 Age Specific Program Strategies
Older Adults ‐ Integrated substance abuse and mental health services.
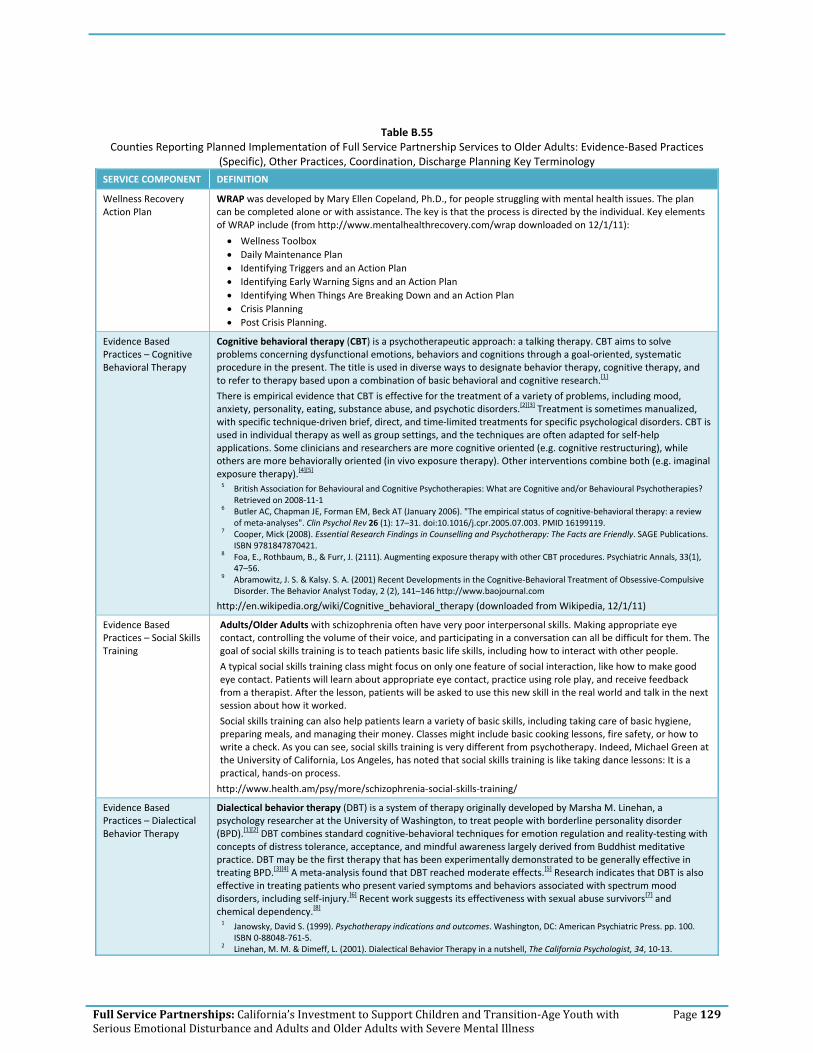
Full Service Partnerships: California’s Investment to Support Children and Transition‐Age Youth with Serious Emotional Disturbance and Adults and Older Adults with Severe Mental Illness
Page 129
Table B.55 Counties Reporting Planned Implementation of Full Service Partnership Services to Older Adults: Evidence‐Based Practices
(Specific), Other Practices, Coordination, Discharge Planning Key Terminology
SERVICE COMPONENT DEFINITION
Wellness Recovery Action Plan
WRAP was developed by Mary Ellen Copeland, Ph.D., for people struggling with mental health issues. The plan can be completed alone or with assistance. The key is that the process is directed by the individual. Key elements of WRAP include (from http://www.mentalhealthrecovery.com/wrap downloaded on 12/1/11):
• Wellness Toolbox • Daily Maintenance Plan • Identifying Triggers and an Action Plan • Identifying Early Warning Signs and an Action Plan • Identifying When Things Are Breaking Down and an Action Plan • Crisis Planning • Post Crisis Planning.
Evidence Based Practices – Cognitive Behavioral Therapy
Cognitive behavioral therapy (CBT) is a psychotherapeutic approach: a talking therapy. CBT aims to solve problems concerning dysfunctional emotions, behaviors and cognitions through a goal‐oriented, systematic procedure in the present. The title is used in diverse ways to designate behavior therapy, cognitive therapy, and to refer to therapy based upon a combination of basic behavioral and cognitive research.[1]
There is empirical evidence that CBT is effective for the treatment of a variety of problems, including mood, anxiety, personality, eating, substance abuse, and psychotic disorders.[2][3] Treatment is sometimes manualized, with specific technique‐driven brief, direct, and time‐limited treatments for specific psychological disorders. CBT is used in individual therapy as well as group settings, and the techniques are often adapted for self‐help applications. Some clinicians and researchers are more cognitive oriented (e.g. cognitive restructuring), while others are more behaviorally oriented (in vivo exposure therapy). Other interventions combine both (e.g. imaginal exposure therapy).[4][5] 5 British Association for Behavioural and Cognitive Psychotherapies: What are Cognitive and/or Behavioural Psychotherapies?
Retrieved on 2008‐11‐1 6 Butler AC, Chapman JE, Forman EM, Beck AT (January 2006). "The empirical status of cognitive‐behavioral therapy: a review
of meta‐analyses". Clin Psychol Rev 26 (1): 17–31. doi:10.1016/j.cpr.2005.07.003. PMID 16199119. 7 Cooper, Mick (2008). Essential Research Findings in Counselling and Psychotherapy: The Facts are Friendly. SAGE Publications.
ISBN 9781847870421. 8 Foa, E., Rothbaum, B., & Furr, J. (2111). Augmenting exposure therapy with other CBT procedures. Psychiatric Annals, 33(1),
47–56. 9 Abramowitz, J. S. & Kalsy. S. A. (2001) Recent Developments in the Cognitive‐Behavioral Treatment of Obsessive‐Compulsive
Disorder. The Behavior Analyst Today, 2 (2), 141–146 http://www.baojournal.com
http://en.wikipedia.org/wiki/Cognitive_behavioral_therapy (downloaded from Wikipedia, 12/1/11)
Evidence Based Practices – Social Skills Training
Adults/Older Adults with schizophrenia often have very poor interpersonal skills. Making appropriate eye contact, controlling the volume of their voice, and participating in a conversation can all be difficult for them. The goal of social skills training is to teach patients basic life skills, including how to interact with other people.
A typical social skills training class might focus on only one feature of social interaction, like how to make good eye contact. Patients will learn about appropriate eye contact, practice using role play, and receive feedback from a therapist. After the lesson, patients will be asked to use this new skill in the real world and talk in the next session about how it worked.
Social skills training can also help patients learn a variety of basic skills, including taking care of basic hygiene, preparing meals, and managing their money. Classes might include basic cooking lessons, fire safety, or how to write a check. As you can see, social skills training is very different from psychotherapy. Indeed, Michael Green at the University of California, Los Angeles, has noted that social skills training is like taking dance lessons: It is a practical, hands‐on process.
http://www.health.am/psy/more/schizophrenia‐social‐skills‐training/
Evidence Based Practices – Dialectical Behavior Therapy
Dialectical behavior therapy (DBT) is a system of therapy originally developed by Marsha M. Linehan, a psychology researcher at the University of Washington, to treat people with borderline personality disorder (BPD).[1][2] DBT combines standard cognitive‐behavioral techniques for emotion regulation and reality‐testing with concepts of distress tolerance, acceptance, and mindful awareness largely derived from Buddhist meditative practice. DBT may be the first therapy that has been experimentally demonstrated to be generally effective in treating BPD.[3][4] A meta‐analysis found that DBT reached moderate effects.[5] Research indicates that DBT is also effective in treating patients who present varied symptoms and behaviors associated with spectrum mood disorders, including self‐injury.[6] Recent work suggests its effectiveness with sexual abuse survivors[7] and chemical dependency.[8] 1 Janowsky, David S. (1999). Psychotherapy indications and outcomes. Washington, DC: American Psychiatric Press. pp. 100.
ISBN 0‐88048‐761‐5. 2 Linehan, M. M. & Dimeff, L. (2001). Dialectical Behavior Therapy in a nutshell, The California Psychologist, 34, 10‐13.

Full Service Partnerships: California’s Investment to Support Children and Transition‐Age Youth with Serious Emotional Disturbance and Adults and Older Adults with Severe Mental Illness
Page 130
SERVICE COMPONENT DEFINITION 3 Linehan, M. M.; Armstrong, H. E.; Suarez, A.; Allmon, D.; Heard, H. L. (1991). "Cognitive‐behavioral treatment of chronically
parasuicidal borderline patients". Archives of General Psychiatry 48: 1060–64. 4 Linehan, M. M.; Heard, H. L.; Armstrong, H. E. (1993). "Naturalistic follow‐up of a behavioural treatment of chronically
parasuicidal borderline patients". Archives of General Psychiatry 50 (12): 971–974. PMID 8250683. 5 Öst, L. G. (2008). Efficacy of the third wave of behavioral therapies: A systematic review and meta‐analysis. Behaviour
Research and Therapy, 46, 296–321. 6 Brody, J. E. (2008, May 6). The growing wave of teenage self‐injury. New York Times. Retrieved July 1, 2008. 7 Decker, S.E.; Naugle, A.E. (2008). "DBT for Sexual Abuse Survivors: Current Status and Future Directions". Journal of behavior
Analysis of Offender and Victim: Treatment and Prevention 1 (4): 52–69. http://www.baojournal.com/JOBA‐OVTP/JOBA‐OVTP‐VOL‐1/JOBA‐OVTP‐1‐4.pdf.
8 [1] http://en.wikipedia.org/wiki/Dialectical_behavior_therapy
Evidence Based Practices – Behavior Therapy
Behaviour therapy, or behavior therapy (behaviour modification) is an approach to psychotherapy based on learning theory which aims to treat psychopathology through techniques designed to reinforce desired and eliminate undesired behaviours.[1]
Functional analysis has even been applied to problems that therapists commonly encounter like client resistance, partially engaged clients and involuntary clients.[2][3] Applications to these problems have left clinicians with considerable tools for enhancing therapeutic effectiveness. One way to enhance therapeutic effectiveness is to use positive reinforcement or operant conditioning.
Many have argued that behaviour therapy is at least as effective as drug treatment for depression, ADHD, and OCD.[4] Considerable policy implications have been inspired by behavioural views of various forms of psychopathology. One form of behaviour therapy (habit reversal training) has been found to be highly effective for treating tics. 1 Behavior therapy. (n.d.). Memidex/WordNet. Retrieved July 15, 2010, from http://www.memidex.com/behaviour‐therapy 2 Cautilli, J.; Tillman, T.C.; Axelrod, S.; Dziewolska, H. & Hineline, P. (2006). Resistance Is Not Futile: An experimental analogue of
the effects of consultee "resistance" on the consultant's therapeutic behavior in the consultation process: A replication and extension. IJBCT, 2(3), 362–76. BAO
3 Cautilli, J.D.; Riley‐Tillman, T.C.; Axelrod, S. & Hineline, P. (2005). Current Behavioral Models of Client and Consultee Resistance: A Critical Review. IJBCT, 1(2), 147–64 BAO
4 Flora, S.R. (2007). Taking America off Drugs: why behavioral therapy is more effective for treating ADHD, OCD, Depression, and other psychological problems. SUNY
http://en.wikipedia.org/wiki/Behaviour_therapy
Evidence Based Practices ‐ Modeling
Modeling or modeling in psychology is:
• a method used in specific techniques of psychotherapy whereby the client learns by imitation alone, without any specific verbal direction by the therapist (See Cognitive Behavior Therapy) and
• a general process in which persons serve as models for others, exhibiting the behavior to be imitated by the others[1][2] This process is most commonly discussed with respect to children in developmental psychology.
1 VandenBoss, Gary (2006) APA Dictionary of Psychology. Washington, DC: American Psychological Association 2 Westen, D.; Burton, L. & Kowalski, R. (2006) Psychology: Australian and New Zealand Edition. Milton, QLD. John Wiley and
Sons. http://en.wikipedia.org/wiki/Modelling_(psychology)
Evidence Based Practices – Family Psychoeducation
Family Psychoeducation is offered as part of an overall clinical treatment plan for individuals with mental illness to achieve the best possible outcome through active involvement of family members in treatment and management.
Core components include:
• Family Intervention Coordinator • Quality of clinician‐family alliance • Education curriculum • Structured problem‐solving technique
Evidence Based Practices – Partners in Care
Partners in Care (PIC) is an intervention for use in managed primary care settings to improve the treatment of depression. PIC is based on collaborative care models, in which mental health is integrated with primary care. The program supports the detection, assessment, treatment choice, and management of patients with major depression or dysthymia by increasing collaboration among primary care clinicians, mental health specialists, nurses, and patients. For the managed care provider, the intervention goal is to increase the percentage of patients receiving appropriate treatment for depression. For patients, the program aims to improve quality of life and reduce depression symptoms.
The core elements of PIC include teamwork between specialists and generalists, case management by nurses, and patient education and empowerment. The intervention educates clinicians on the treatment of depression in the primary care setting while also giving them access to psychotherapists who can provide consultation on difficult cases and take referrals when needed. Health care organizations participating in PIC receive a package of materials designed to help them implement their own collaborative care model.
http://nrepp.samhsa.gov/ViewIntervention.aspx?id=126

Full Service Partnerships: California’s Investment to Support Children and Transition‐Age Youth with Serious Emotional Disturbance and Adults and Older Adults with Severe Mental Illness
Page 131
SERVICE COMPONENT DEFINITION
Evidence Based Practices ‐ IMPACT
IMPACT has demonstrated cost effectiveness and has been shown to reduce symptoms of depression in older adults. Five of the most essential elements of IMPACT are:
1. Collaborative care is the cornerstone of the IMPACT model; 2. Depression Care Manager; 3. Designated Psychiatrist; 4. Outcome measurement; and 5. Stepped care.
http://impact‐uw.org/about/key.html
Other Practices – Alternative Treatment
Statutes (as of February 2008)
Section 3360 Program Flexibility. The use of alternative practices, programs/procedures, and demonstration projects shall not be prohibited by these regulations.
Other Practices – Culturally Specific Treatment
DMH Letter 05‐05 Age Specific Program Strategies
Community cultural practices – traditional practitioners, natural healing practices and ceremonies recognized by communities in place of or in addition to mainstream services.
Coordination ‐ Hospital
Coordination for the purpose of facilitating discharge/re‐entry into the community
Coordination – Criminal Justice
DMH Letter 05‐05 Age Specific Program Strategies
Adults/Older Adults ‐ Integrated services with law enforcement, probation and courts for the purpose of crisis response, pre‐ and post‐booking services, alternatives to jail for those with serious mental illness and/or collaboration to establish mental health courts for clients who have criminal justice charges. Integrated forensic programs include ones similar to those established pursuant to the Mentally Ill Offender Crime Reduction Grant Program.
Discharge Planning & Criteria
Clear criteria and process for moving clients into readiness for discharge from FSPs.
Building MHSA Programs – Mark Ragins
Create “graduation” rituals and services: It’s important to have a positive exit from the system (even for people who continue to take medications); there are serious personal issues for both the people taking the risk of moving on and for the caring staff they leave behind that need to be addressed. We need to remember that full recovery is far more common, and far more realistic, than we imagine. After a year, and flexibly on an ongoing basis, FSP clients should be reassessed for moving on to core services (or, more rarely, Wellness Center). Both staff and clients should view FSP as a transitional program to create a culture that promotes flow. There can be a substantial transitional period of co‐enrollment in both programs.

Full Service Partnerships: California’s Investment to Support Children and Transition‐Age Youth with Serious Emotional Disturbance and Adults and Older Adults with Severe Mental Illness
Page 132
Appendix C Technical Appendix
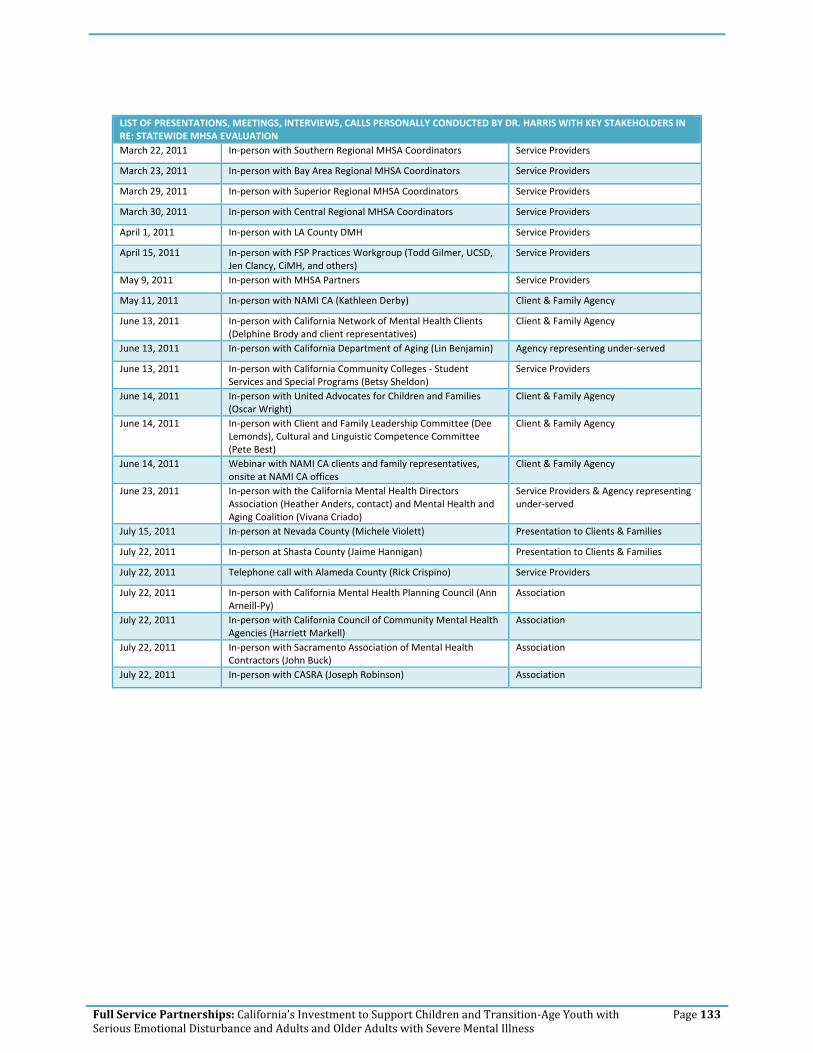
Full Service Partnerships: California’s Investment to Support Children and Transition‐Age Youth with Serious Emotional Disturbance and Adults and Older Adults with Severe Mental Illness
Page 133
LIST OF PRESENTATIONS, MEETINGS, INTERVIEWS, CALLS PERSONALLY CONDUCTED BY DR. HARRIS WITH KEY STAKEHOLDERS IN RE: STATEWIDE MHSA EVALUATION March 22, 2011 In‐person with Southern Regional MHSA Coordinators Service Providers
March 23, 2011 In‐person with Bay Area Regional MHSA Coordinators Service Providers
March 29, 2011 In‐person with Superior Regional MHSA Coordinators Service Providers
March 30, 2011 In‐person with Central Regional MHSA Coordinators Service Providers
April 1, 2011 In‐person with LA County DMH Service Providers
April 15, 2011 In‐person with FSP Practices Workgroup (Todd Gilmer, UCSD, Jen Clancy, CiMH, and others)
Service Providers
May 9, 2011 In‐person with MHSA Partners Service Providers
May 11, 2011 In‐person with NAMI CA (Kathleen Derby) Client & Family Agency
June 13, 2011 In‐person with California Network of Mental Health Clients (Delphine Brody and client representatives)
Client & Family Agency
June 13, 2011 In‐person with California Department of Aging (Lin Benjamin) Agency representing under‐served
June 13, 2011 In‐person with California Community Colleges ‐ Student Services and Special Programs (Betsy Sheldon)
Service Providers
June 14, 2011 In‐person with United Advocates for Children and Families (Oscar Wright)
Client & Family Agency
June 14, 2011 In‐person with Client and Family Leadership Committee (Dee Lemonds), Cultural and Linguistic Competence Committee (Pete Best)
Client & Family Agency
June 14, 2011 Webinar with NAMI CA clients and family representatives, onsite at NAMI CA offices
Client & Family Agency
June 23, 2011 In‐person with the California Mental Health Directors Association (Heather Anders, contact) and Mental Health and Aging Coalition (Vivana Criado)
Service Providers & Agency representing under‐served
July 15, 2011 In‐person at Nevada County (Michele Violett) Presentation to Clients & Families
July 22, 2011 In‐person at Shasta County (Jaime Hannigan) Presentation to Clients & Families
July 22, 2011 Telephone call with Alameda County (Rick Crispino) Service Providers
July 22, 2011 In‐person with California Mental Health Planning Council (Ann Arneill‐Py)
Association
July 22, 2011 In‐person with California Council of Community Mental Health Agencies (Harriett Markell)
Association
July 22, 2011 In‐person with Sacramento Association of Mental Health Contractors (John Buck)
Association
July 22, 2011 In‐person with CASRA (Joseph Robinson) Association

Full Service Partnerships: California’s Investment to Support Children and Transition‐Age Youth with Serious Emotional Disturbance and Adults and Older Adults with Severe Mental Illness
Page 134
Evaluation Advisory Group Members 1. Maria Iyog‐O’Malley, Former FSP Services Manager, San Francisco Department of Mental
Health/EMT Expert Consultant 2. Debbie Innes‐Gomberg, Los Angeles County Department of Mental Health 3. Christina Cordova, Orange County Health Authority 4. Keith Erselius, San Bernardino Behavioral Health 5. Ruben Gasco, San Bernardino Behavioral Health 6. Keith Haigh, San Bernardino Behavioral Health 7. Brian Yates, American University, EMT Expert Consultant 8. Todd Gilmer, University of San Diego, EMT Expert Consultant 9. Steve Hahn‐Smith, Contra Costa Health Services Department 10. Diane Prentiss, San Francisco Department of Public Health

Full Service Partnerships: California’s Investment to Support Children and Transition‐Age Youth with Serious Emotional Disturbance and Adults and Older Adults with Severe Mental Illness
Page 135
FSP Services Assessment Tool YES/NO
CYF TAY AD OA
1 Outreach to Underserved and Unserved Communities
2 Priority to Unserved Populations
3 FSP Eligibility (criteria)
3 Needs Assessment
3 Individual Services & Supports Plan
3 Service Delivery based on Needs Assessment & ISSP
4 Low Caseload
4 Consumer/Family Staff
4 24/7 Coverage
4 Services in Community v. in the Clinic
5 Client Centered Care
5 Family Centered Care
5 Culturally Appropriate
5 Collaboration with Community Services
5 Integrated Service Delivery
6 Individual Therapy
6 Group Therapy
6 Medication Support
6 Crisis Intervention
6 Employment Case Management
6 Medical Case Management
6 Social Case Management
6 Rehabilitative Case Management
6 Educational Case Management
6 Community Client Services
7 Case Management Support
7 Housing Case Management
7 Psychoeducation
7 Family Education
8 Instrumental Needs
8 Cost of Healthcare Treatment
8 Respite Care

Full Service Partnerships: California’s Investment to Support Children and Transition‐Age Youth with Serious Emotional Disturbance and Adults and Older Adults with Severe Mental Illness
Page 136
HOUSING YES/NO
CYF TAY AD OA
9 Housing Supports
9 Operating Support
9 Housing Placement
YES/NO
CYF TAY AD OA
10 Psychiatrist/NP staff
10 Social Worker staff
10 Team Approach
11 Educational/Employment Supplies
11 Recreational Activities
11 Transportation
12 Education/Employment Case Management
12 Recreational Case Management
12 Parenting Education
12 Intimate Partner Violence Services
13 Substance Abuse Treatment
14 Wellness Recovery Action Plan
14 Cognitive Behavioral Therapy
14 Dialectical Behavior Therapy
14 Social Skills Training
14 Behavior Therapy
14 Modeling
14 Family Psychoeducation
14 Partners in Care
14 IMPACT (Improving Mood‐‐Promoting Access to Collaborative Treatment)
14 Multisystemic Therapy
14 Therapeutic Foster Care
14 Psychoeducational Multi‐Family Groups
14 Parent‐Child Interaction Therapy
14 Wraparound
15 Alternative Treatment
15 Culturally Specific
16 Coordination w/Hospital
16 Coordination w/Criminal Justice
17 Discharge Planning / Criteria

Full Service Partnerships: California’s Investment to Support Children and Transition‐Age Youth with Serious Emotional Disturbance and Adults and Older Adults with Severe Mental Illness
Page 137
Average Daily Cost – Juvenile Halls & Camps

Full Service Partnerships: California’s Investment to Support Children and Transition‐Age Youth with Serious Emotional Disturbance and Adults and Older Adults with Severe Mental Illness
Page 138
This page is left intentionally blank

Full Service Partnerships: California’s Investment to Support Children and Transition‐Age Youth with Serious Emotional Disturbance and Adults and Older Adults with Severe Mental Illness
Page 139
This page is left intentionally blank

Full Service Partnerships: California’s Investment to Support Children and Transition‐Age Youth with Serious Emotional Disturbance and Adults and Older Adults with Severe Mental Illness
Page 140
Average Daily Cost – Type II and III Jails

Full Service Partnerships: California’s Investment to Support Children and Transition‐Age Youth with Serious Emotional Disturbance and Adults and Older Adults with Severe Mental Illness
Page 141
This page is left intentionally blank

Full Service Partnerships: California’s Investment to Support Children and Transition‐Age Youth with Serious Emotional Disturbance and Adults and Older Adults with Severe Mental Illness
Page 142
This page is left intentionally blank

Full Service Partnerships: California’s Investment to Support Children and Transition‐Age Youth with Serious Emotional Disturbance and Adults and Older Adults with Severe Mental Illness
Page 143
Appendix D County Participants

Full Service Partnerships: California’s Investment to Support Children and Transition‐Age Youth with Serious Emotional Disturbance and Adults and Older Adults with Severe Mental Illness
Page 144
County
Round 1 Study Participants206
FSP Costs by Age Group
# of FSPs/Days of Service by Age
Group
FSP Cost Offsets by Age Group
Notes
Alpine FY 08‐09 excluded from analysis; Not in
Statewide Data Collection System
Alameda Not in Statewide Data Collection System
Amador FY 08‐09 excluded from analysis
Berkeley Recently submitted web survey will be
included in Final Report; not in Statewide Data Collection System
Butte
Calaveras FY 08‐09 excluded from analysis;
Colusa FY 08‐09 excluded from analysis;
Contra Costa
Del Norte FY 08‐09 excluded from analysis;
El Dorado
Fresno
Glenn
Humboldt FY 08‐09 excluded from analysis;
Imperial
Inyo FY 08‐09 excluded from analysis;
Kern
Kings
Lake
Lassen FY 08‐09 excluded from analysis;
Los Angeles
Madera
Marin Not in Statewide Data Collection System
Mariposa
Mendocino
Merced
Modoc
Mono FY 08‐09 excluded from analysis;
Monterey Not in Statewide Data Collection System
Napa
Nevada
Orange Recently submitted web survey‐will be
included in Final Report
206 Berkeley City & Tri City indicated that they were in start‐up during the entire study period (FY 08‐09 and FY 09‐10). Start‐up years are not included in the calculations.

Full Service Partnerships: California’s Investment to Support Children and Transition‐Age Youth with Serious Emotional Disturbance and Adults and Older Adults with Severe Mental Illness
Page 145
County
Round 1 Study Participants206
FSP Costs by Age Group
# of FSPs/Days of Service by Age
Group
FSP Cost Offsets by Age Group
Notes
Placer
Plumas
Riverside Not in Statewide Data Collection System
Sacramento
San Benito
San Bernardino
San Diego
San Francisco
San Joaquin
San Luis Obispo
San Mateo
Santa Barbara Not in Statewide Data Collection System
Santa Clara
Santa Cruz
Shasta Notified that web survey is pending
Sierra Recently submitted web survey‐will be
included in Final Report
Siskiyou
Solano
Sonoma
Stanislaus
Sutter‐Yuba
Tehama FY 08‐09 excluded from analysis
Trinity
Tulare
Tuolumne
Ventura Recently submitted web survey‐will be
included in Final Report
Yolo
TOTAL 37 33 32

Full Service Partnerships: California’s Investment to Support Children and Transition‐Age Youth with Serious Emotional Disturbance and Adults and Older Adults with Severe Mental Illness
Page 146
Appendix E Revenue & Expenditure Reports

Full Service Partnerships: California’s Investment to Support Children and Transition‐Age Youth with Serious Emotional Disturbance and Adults and Older Adults with Severe Mental Illness
Page 147
Exhibit E.1 Full Service Partnership Program Worksheet: Revenue and Expenditure Report
(Fiscal Year 08‐09)

Full Service Partnerships: California’s Investment to Support Children and Transition‐Age Youth with Serious Emotional Disturbance and Adults and Older Adults with Severe Mental Illness
Page 148
This page is left intentionally blank

Full Service Partnerships: California’s Investment to Support Children and Transition‐Age Youth with Serious Emotional Disturbance and Adults and Older Adults with Severe Mental Illness
Page 149
Exhibit E.2 Full Service Partnership Program Worksheet: Revenue and Expenditure Report
(Fiscal Year 09‐10)

Full Service Partnerships: California’s Investment to Support Children and Transition‐Age Youth with Serious Emotional Disturbance and Adults and Older Adults with Severe Mental Illness
Page 150
This page is left intentionally blank

Full Service Partnerships: California’s Investment to Support Children and Transition‐Age Youth with Serious Emotional Disturbance and Adults and Older Adults with Severe Mental Illness
Page 151
Exhibit E.3 Full Service Partnership Summary Worksheet: Revenue and Expenditure Report
(Fiscal Year 09‐10)

Full Service Partnerships: California’s Investment to Support Children and Transition‐Age Youth with Serious Emotional Disturbance and Adults and Older Adults with Severe Mental Illness
Page 152
This page is left intentionally blank

Full Service Partnerships: California’s Investment to Support Children and Transition‐Age Youth with Serious Emotional Disturbance and Adults and Older Adults with Severe Mental Illness
Page 153
Exhibit III.4 Full Service Partnership Summary Worksheet: Revenue and Expenditure Report
(Revised ‐ Fiscal Year 09‐10)

Full Service Partnerships: California’s Investment to Support Children and Transition‐Age Youth with Serious Emotional Disturbance and Adults and Older Adults with Severe Mental Illness
Page 154
This page is left intentionally blank
Full Service Partnerships: California’s Investment to Support Children and Transition‐Age Youth with Serious Emotional Disturbance and Adults and Older Adults with Severe Mental Illness
Page 155
Revenue and Expenditure Reports
Process of Transferring Individual County Excel Files from FY 09‐10 into Master Cross‐Site File
The MHSA (FY: 06/07, 07/08, 08/09) Database was created in the Spring of 2011 in order to conduct analyses for Phase II Deliverable 1. It is an aggregated database containing fiscal data from a total of 59 California counties/municipalities spanning three fiscal year periods, covering 25 program data sets, sourced from 589 distinct file locations, containing a total of 4,498 unique variables, encompassing a grand total of 287,265 distinct data points. Fiscal Year 2006‐2007 contained 1,325 distinct variables provided by 57 counties/municipalities across 6 programs located within 57 separate files containing a total of 72,525 distinct data points. Fiscal Year 2007‐2008 contained 1,265 distinct variables provided by 59 counties/municipalities across 7 programs located within 60 separate files containing a total of 75,900 distinct data points. Fiscal Year 2008‐2009 contained 2,264 distinct variables provided by 59 counties/municipalities across 11 programs located within 472 separate files containing a total of 135,840 distinct data points. The MHSA Database was constructed through a process of template creation, formula crafting, running transfer protocols and performing validity checks. Templates were formed via construction of a list of all variables across each program over all three fiscal years. Formula were generated to transfer the values of individual cells to the database template and were compiled to transfer all the relevant data points within a given workbook and, subsequently, entire source‐file. Formulas were crafted for each of the unique variables contained within each program or workbook. Master formulae were crafted for each workbook within a file or fiscal year. The master formulae performed the relocation of each relevant data point, across all programs, within a given file or fiscal year. Transfer protocols were generated to perform manual and semi‐automated opening and closing of files, updating formula and transferring the relevant data values of each fiscal year to the database. Validity checks were performed throughout each stage of the process with full checks on each new formula, random spot checks, specific value checks and redundant report checks.
Challenges/Limitations
Complications in the construction of the database template arose from the systemic variance within a specific program across multiple fiscal years. Each program contains differing sets of reported variables across each fiscal year. Such complexity required the database construction and formulae formats to account for the disparate data formats. This was accomplished through the merger of otherwise identical
Full Service Partnerships: California’s Investment to Support Children and Transition‐Age Youth with Serious Emotional Disturbance and Adults and Older Adults with Severe Mental Illness
Page 156
variables names that were renamed and through the adjustment of cell‐specific spacing references in all formulae. Further complicating the construction of the database was the systemic variance between the three fiscal years in file sets and data locations. While fiscal years 2006‐2007 and 2007‐2008 are rather similar the 2008‐2009 fiscal year is provided in an entirely different file set format. Additionally, each fiscal year contains noteworthy variance in data locations from the other fiscal years. This complexity required the substantial retooling of the formula sets and numerous additional, unique formula sets to be constructed. However, the most severe complications came as a result of modifications performed by reporting counties to the file names, workbook names and, most significantly, workbook formats. Variances which caused transfer protocols to report incorrect and invalid data points, if not miss the source‐data entirely. These issues necessitated the manual reformatting of all files and workbooks locations found to be employing deviant standards and the subsequent manual operation of all associated transfer protocols. EMT hired a contractor to complete the initial extraction and merge. The contractor’s services have been retained to complete the extraction and merge for the FY 09‐10 data. However, in the interest of expediency, FSP totals were taken from RERs through transcription and input into county Costs & Cost Offsets worksheets (provided to counties for review). Totals were cross‐checked for accuracy. This initial process was much less costly and time‐consuming, and met the immediate deliverable deadline need.