Embed Size (px)
Citation preview

Helium: Exploration
Methodology for a
Strategic Resource
Diveena Danabalan
A Thesis presented for the degree of
Doctor of Philosophy
Department of Earth Sciences
Durham University
United Kingdom
June 2017

1
Contents
List of Figures 5
List of Tables 7
Abstract 9
Declaration 10
Copyright Statement 10
About the author 10
Acknowledgements 11
Chapter One: Introduction 13
1.1. Helium Exploration 14
1.1.1 Helium in the modern world 14
1.1.2. Types of helium reservoir 18
1.1.2.1. CO2-rich fields 19
1.1.2.2. CH4-rich fields 20
1.1.2.3. N2-rich fields 21
1.1.3. Introducing helium as a noble gas 22
1.1.3.1. Sources of helium 23
1.2. The other noble gases 24
1.2.1. Neon 24
1.2.2. Argon 25
1.2.3. Krypton and Xenon 26
1.3. The noble gases as geochemical tracers in natural gas systems 26
1.3.1. Crustal contributions to natural gas systems 28
1.3.2. Mantle contributions to natural gas systems 28
1.3.3. Groundwater contributions to natural gas systems 29
1.4. Literature review of the helium system 30
1.4.1. Generation and accumulation 30
1.4.2. Primary migration 32
1.4.3. Helium and associated carrier gases 33
1.4.4. Secondary migration 34
1.4.5. Entrapment and escape 36
1.5. Objectives and thesis outline 38
Chapter Two: Methods 40
2.1. Introduction 41
2.2. Sampling in the field 41
2.3. Analytical equipment 44
2.3.1. The Oxford Purification Line 44

2
2.4. Mass spectrometers 47
2.4.1. Helix SFT™
47
2.4.2. Argus VI™ 48
2.5. Blanks 49
2.6. Air standards 50
2.7. Sample loading and preparation 53
2.7.1. Helium measurements 55
2.7.2. Neon measurements 57
2.7.3. Argon, krypton and xenon measurements 57
2.8. Data reduction and error propagation 58
2.8.1. Data reduction 58
2.8.1.1. Concentration calculations 59
2.8.2. Error propagation 62
2.8.2.1. Worked error example for isotopic ratios 63
2.8.2.2. Propagating errors for isotopic abundance 65
Chapter Three: Economic Helium Reservoirs in the Mid-Continent
United States 66
3.1. Introduction 67
3.2. The geology of South-West Kansas and the Hugoton-Panhandle system 70
3.3. Sample collection and analytical techniques 83
3.4. Results 85
3.4.1. Noble gases 93
3.4.1.1. Helium 93
3.4.1.2. Neon 94
3.4.1.3. Argon 96
3.4.1.4. Krypton and Xenon 97
3.4.1.5. Crust-derived noble gases 98
3.4.1.6. Groundwater-derived noble gases 99
3.4.1.7. The interaction between 20
Ne and crust-derived isotopes 102
3.4.2. Other major gases 104
3.4.2.1. Methane 104
3.4.2.2. Nitrogen 104
3.4.3. Nitrogen and the noble gases 109
3.5. Discussion 113
3.5.1. Helium mass balance 113
3.5.1.1. In situ helium production 115
3.5.1.2. External sources of 4He production 117
3.5.2. Thermal controls on the release of radiogenic isotopes 122
3.5.3. Groundwater, N2, CH4 and the noble gases 129
3.5.4. The interaction between 4He, crustal N2, organic N2 and CH4 143
3.6. Summary 151
Chapter Four: The Geochemical Characteristics of the 4He-N2
source in Helium Systems 154
4.1. Introduction 155
4.2. Geological context of the N2-4He rich wells 156

3
4.2.1. Harley Dome, Grand Co., Utah, USA 158
4.2.2. Rudyard field, Hill Co., Montana, USA 161
4.2.3. International Helium Wood Mountain, Saskatchewan, Canada 165
4.3. Sample collection and analytical techniques 166
4.4. Results 168
4.4.1. Noble gases 171
4.4.1.1. Helium 171
4.4.1.2. Neon 172
4.4.1.3. Argon 174
4.4.1.4. Krypton and xenon 174
4.4.1.5. Crust-derived noble gases 175
4.4.1.6. Relationships between 20
Ne and the crust-derived 177
isotopes
4.4.2. Other major gases 180
4.4.2.1. Methane, ethane, propane and CO2 180
4.4.2.2. Nitrogen 181
4.4.3. Relationships between N2 and the crust-derived noble gases 182
4.5. Discussion 183
4.5.1. The N2 isotopic endmember for 4He 185
4.5.2. Groundwater (20
Ne) relationships with 4He and N2 189
4.5.3. Characterising the groundwater component of 4He-rich fields 192
4.6. Summary 196
Chapter Five: High Helium Systems in Tanzania 198
5.1. Introduction 199
5.2. The geological history of Tanzania 201
5.3. Prior precedent for 4He release in Tanzania 205
5.3.1. Determining the 4He potential of Tanzania 208
5.4. The geology of the study locations 212
5.4.1. Study area 1: The North Tanzanian Divergence 212
5.4.1.1. Eyasi 213
5.4.1.2. Balangida 213
5.4.1.3. Gonga 214
5.4.1.4. Mponde 215
5.4.2. Study area 2: The Mbeya Triple Junction 215
5.5. New results from Tanzania 217
5.5.1. Helium 220
5.5.2. Neon 220
5.5.3. Argon 221
5.6. Discussion 222
5.6.1. The uses of the radiogenic noble gases as a means of locating 4
He-rich areas 222
5.6.2. Compiling a ‘play fairway’ assessment of Tanzania 226
5.7. Summary 229

4
Chapter Six: The Principles of Helium Exploration 231
6.1. The Helium System 232
6.1.1. Generation 233
6.1.2. Maturation 234
6.1.3. Primary migration 236
6.1.4. Secondary migration 241
6.1.5. Accumulation in reservoirs 243
6.1.6. Trap efficiency, leakage and destruction 243
6.2. Summary 245
Chapter Seven: Conclusions and Further Work 247
7.1. Conclusions 248
7.1.1. Expanding the current helium exploration methodology 252
7.2. Further work 252
References 255
Appendices
Appendix A: Background geology of the Mid-Continent fields 281
Appendix B: Full dataset from thesis 286
Final word count: 69,116
(Word count excluding appendices and references = 55,488)

5
List of Figures
Chapter One: Introduction
Figure 1.1. The uses of helium in the USA as of 2017 15
Figure 1.2. Helium concentrations and reserve volumes for different types of
helium-rich field 19
Figure 1.3. The three sources of noble gases in shallow gas reservoirs 27
Chapter Two: Methods
Figure 2.1. Field sampling apparatus setup 43
Figure 2.2. Schematic of the Oxford Purification Line 47
Figure 2.3. Variance in signal for the overnight standards 52
Figure 2.4. Raw values for worked example of error propagation 63
Chapter Three: Economic Helium Reservoirs in the Mid-Continent
United States
Figure 3.1. Map of helium-rich occurrances in the USA 68
Figure 3.2. Sample areas map and cross section 72
Figure 3.3. Structural development of the geological features associated with
the study areas over time 75
Figure 3.4. General stratigraphic section of Kansas 77
Figure 3.5. Oil pathways out of the Anadarko and Ouachita Basins 78
Figure 3.6. BTU map of the Kansas study areas 80
Figure 3.7. Three neon isotope graph 96
Figure 3.8. Relationships between 20
Ne and the radiogenically produced
noble gases 103
Figure 3.9. Map and cross section of δ15
NN2 values for the study areas 106
Figure 3.10. Plots of N2/40
Ar and 4He/
40Ar vs
36Ar/
40Ar 108
Figure 3.11. Graph of N2 vs 4He trends 109
Figure 3.12. Plot of 4He/N2 vs. δ
15NN2 110
Figure 3.13. The relationship between radiogenic 4He and
40Ar* normalised
to nucleogenic 21
Ne* 125
Figure 3.14. Plots showing groundwater-derived 20
Ne vs the radiogenic
isotopes (4He,
21Ne* and
40Ar*) where both variables are
normalised to N2 131
Figure 3.15. Plots showing groundwater-derived 20
Ne vs the radiogenic
isotopes (4He,
21Ne* and
40Ar*) where both variables are
normalised to CH4 134
Chapter Four: The Geochemical Characteristics of the 4He-N2
source in Helium Systems
Figure 4.1. Locations of all N2-4He rich wells relative to regional structures 157
Figure 4.2. Location of the Harley Dome well relative to other geological
structures 158

6
Figure 4.3. Generalised cross section from the Paradox Basin to the
Uncompahgre Plateau 159
Figure 4.4. Locations of the Weil #1 well and International Helium
Wood Mtn well relative to local and regional geological
structures and cratonic provinces 162
Figure 4.5. Three neon isotope graph 173
Figure 4.6. Plot showing the relationship between radiogenic 4He and
40Ar*
normalised to nucleogenic 21
Ne* 176
Figure 4.7. Plots showing relationships between radiogenically and
nucleogenically derived components and groundwater-derived 20
Ne 179
Figure 4.8. Plot of N2 concentration vs 4He concentration 183
Figure 4.9. Plot of 4He/N2 vs. δ
15NN2 187
Figure 4.10. Plot showing groundwater-derived 20
Ne vs radiogenic-sourced 4He where both variables are normalised to N2 191
Figure 4.11. Plots showing groundwater-derived 20
Ne vs radiogenic 4He where both variables are normalised to N2 for thesis
dataset and data from Gilfillan (2006) 195
Chapter Five: High Helium Systems in Tanzania
Figure 5.1. The position of the study region in relation to the rest of Africa 200
Figure 5.2. Map showing rift sediments and volcanoes in relation to the
Tanzanian Craton and surrounding mobile belts 204
Figure 5.3. Maps showing the positioning of previous 4He concentrations in
comparison with new 4He concentration data and Ra values in the
North Tanzanian Divergence and Mbeya study areas 207
Figure 5.4. Helium production from different areas of the Tanzanian system
from the time since their last tectonic event (before the EARS) 212
Figure 5.5. Diagram showing the influence of binary mixing on spatial gas
trends within the Mbeya area 224
Figure 5.6. ‘Play fairway’ map showing potentially helium-rich basins in the
region around the Tanzanian Craton 227
Chapter Six: The Principles of Helium Exploration
Figure 6.1. Graph showing the relationship between Ra values, CO2 content,
N2 and distance from volcanic centres in the Eger rift 240

7
List of Tables
Chapter One: Introduction
Table 1.1. Helium closure temperatures for helium retentive minerals. 31
Chapter Three: Economic Helium Reservoirs in the Mid-Continent
United States
Table 3.1. Field data for reservoirs sampled including area and cumulative
gas production 82
Table 3.2. Noble gas ratios from this study and from Ballentine and
Sherwood-Lollar (2002) 86
Table 3.3. Noble gas concentrations from this study and the Ballentine and
Sherwood-Lollar (2002) 90
Table 3.4. Endmembers for three neon graph mixing lines 96
Table 3.5. Average radiogenic ratios of samples 99
Table 3.6. Estimated gas and helium reserves for all fields sampled 114
Table 3.7. Scenarios for the in situ production of 4He 116
Table 3.8. 4He production scenarios for external sources to fields 120
Table 3.9. Concentrations and ratios of the radiogenically produced
isotopes in samples 124
Table 3.10. Comparisons of N2 saturation in groundwater compared to
modern reservoir conditions 139
Table 3.11. Comparisons of 4He saturation in groundwater compared to
modern reservoir conditions 140
Table 3.12. Workthrough of hypothetical aquifer volumes associated with
study areas 142
Chapter Four: The Geochemical Characteristics of the 4He-N2
source in Helium Systems
Table 4.1. Noble gas ratios from N2-4He rich wells in this study 169
Table 4.2. Noble gas concentrations, N2 concentrations and N2 isotope
values from this study 170
Table 4.3. Concentrations and ratios of the radiogenically produced
isotopes in samples 176
Table 4.4. Comparisons of N2 saturation in groundwater compared to
modern reservoir conditions 190
Table 4.5. Comparisons of N2 saturation in groundwater compared to
modern reservoir conditions for CO2-rich helium reservoirs 193
Chapter Five: High Helium Systems in Tanzania
Table 5.1. Helium volume produced from different parts of the Tanzanian
system 210
Table 5.2. Noble gas ratios for both study areas 218

8
Table 5.3. Noble gas concentrations and N2 concentrations 219
Chapter Six: The Principles of Helium Exploration
Table 6.1. Synthesis of components of the helium exploration system
compared to the petroleum system 233
Table 6.2. Average depths of helium-producing reservoirs 236
Table 6.3. Possible mechanisms of secondary migration for the helium
system 242

9
Abstract
Helium: Exploration Methodology for a Strategic Resource
A thesis submitted to Durham University for the degree of Doctor of Philosophy by
Diveena Danabalan, June 2017
Helium exploration is still in its infancy. Noble gas and stable isotopic analyses have
proven to be effective tools in the past for determining the correlation between 4He and
associated N2 and the role of groundwater in the transport and focusing of these gases
alongside unrelated natural gases such as CH4 and CO2 into traps (Ballentine and Sherwood-
Lollar, 2002). In this thesis these tracers are used to further understand aspects of the helium
system such as source(s), gas migration pathways and trapping mechanisms and from this to
ultimately present a framework for a helium exploration method.
Geochemical studies were conducted on CH4-rich helium gas reservoirs in the Mid-
Continent US and, for the first time, on N2-rich helium gas reservoirs in Utah, Montana and
Saskatchewan, Canada. Both types of 4He-rich system showed consistent
4He-associated N2
endmembers with δ15
N values between -3.00‰ and +2.45‰; a range associated with low
grade metamorphic crustal sources indicating that the source of the economic 4He and
associated N2 in shallow reservoirs is likely derived from variable isotopic mixing between
the basement and overlying sediments.
From these studies it was also ascertained that in all fields the mechanism for 4He
and associated N2 degassing into reservoirs appears to be related in some degree to
groundwater and to the saturation threshold of 4He-associated N2 thereby defining possible
secondary migration pathways for the helium system.
New noble gas data from thermal springs in the West and East branches of the
Tanzanian section of the EARS show 4He concentrations of up to 10.5% indicating the
active release or primary migration of high helium and high N2 gases in the region. This
coupled with potential traps in the nearby Rukwa Basin could provide a high helium
reservoir in the future. First estimates for the basin, derived from 4He analyses (< 4%
4He)
combined with seismic and soil gas surveys for the basin translate to a P50 estimate of
probable reserves of 98 Bcf which would be enough to supply the current global helium
demand for ~14 years if current demand remains steady.

10
Declaration
No portion of the work referred to in this thesis has been submitted in support of an
application for another degree or qualification of this or any other university or other
institute of learning.
Copyright Statement
The copyright of this thesis rests with the author. No quotation from it should be
published without the author's prior written consent and information derived from it
should be acknowledged.
About the Author
The author graduated from the University of Bristol in 2012 having obtained an
undergraduate masters degree (MSci) with Upper Second Class Honours in
Environmental Geoscience. The author commenced the research presented in this
thesis in October 2012 under the co-supervision of Professor Jon Gluyas (Durham
University), Professor Chris Ballentine (University of Oxford) and Professor Colin
Macpherson (Durham University).
The sample collection trip to the USA and Canada was undertaken in June 2014 and
the samples from Tanzania were collected by Dr Pete Barry (University of Oxford)
and Thomas Abraham-James (Helium One) in November 2015.
The author has been fortunate enough to present the results from this thesis at the
Goldschmidt Conference in Prague, Czech Republic, 2015, the 6th
Cryogenic Cluster
Day, Rutherford Appleton Labs, 2015, the Goldschmidt Conference in Yokohama,
Japan, 2016 and the 7th
Cryogenic Cluster Day, Rutherford Appleton Labs, 2016.
Funding for this thesis was provided in full by Statoil ASA and in part by Helium
One and the Centre for Doctoral Training in Energy (Durham Energy Institute) at
Durham University.
11
Acknowledgements
I would first like to sincerely thank my supervisors Professor Jon Gluyas and Professor
Chris Ballentine for their support, feedback, discussions, encouragement and basically
superhuman efforts throughout this rollercoaster of a thesis. I would also like to thank
Professor Colin Macpherson for his helpful discussions and for setting me off on the right
path when I first got to Durham University and Professor Barbara Sherwood-Lollar and her
group for processing my nitrogen isotope data.
Huge thanks are given to Dr Pete Barry for his many contributions to this thesis including
liaising with Helium One and Dr Tom Darrah, sample collection and analysis and
discussions of results. Thanks are also given to Dr Jennifer Mabry, Dr Oliver Warr, Dr Rosie
Jones, Dr Michael Broadley, Dr Bastian Joachim and David Byrne of the Noble Group at
University of Oxford for teaching me pretty much everything they knew about noble gases,
mass spectrometry, the ins and outs of high pressure line maintenance, the importance of
helium leak testing (Olly!) and for being great fun both during the long lab days and after
work.
I would like to extend my thanks to Statoil ASA for funding my research and to my
supervisors at Statoil: Jens Emil Vindstad, Roger Hansen and Kati Tänavsuu-Milkeviciene.
I am grateful for the pro-activity of Bo and Scott Sears of Weil Helium and IACX without
whom I wouldn’t have my USA and Canada data. Thank you also to Thomas Abraham-
James and Josh Bluett of Helium One for your invaluable contributions to Chapter Five of
this thesis, for helping with sample collection, and for teaming up with us in your search for
helium in Tanzania. I wish you and everyone else at Helium One all the luck in the world-
here’s hoping for a new helium reserve!
Special thanks go to Dr Mel Murphy for checking in on me during weekend lab sessions,
Drs Anke Wohlers and Karen Fontijn for putting up with me gatecrashing their office on a
semi-regular basis with random conversations, to my fellow PhD students both past and
present at Durham University and University of Oxford, to my housemates over the years, to
everyone in the USA and Canada including Clyde Becker and Adam Standiford who helped
Chris and I with sampling and provided us with valuable background information, and to
Richard Clarke aka ‘Mr Helium’ for his discussions about the future of helium and for
furthering my understanding on an industrial level!
I would like to additionally thank my friends Joseph Hallett, Chelsey Lovell-Smith and
Saranja Sivachelvam for their unwavering support and optimism and for keeping me sane
through the difficult times.
My final thanks go to my parents and extended family for their love, prayers and support
throughout this thesis and always!

12
I and Pangur Ban, my cat,
'Tis a like task we are at;
Hunting mice is his delight,
Hunting words I sit all night.
Better far than praise of men
'Tis to sit with book and pen;
Pangur bears me no ill will;
He, too, plies his simple skill.
'Tis a merry thing to see
At our task how glad are we,
When at home we sit and find
Entertainment to our mind.
Oftentimes a mouse will stray
Into the hero Pangur's way;
Oftentimes my keen thought set
Takes a meaning in its net.
'Gainst the wall he sets his eye
Full and fierce and sharp and sly;
'Gainst the wall of knowledge I
All my little wisdom try.
When a mouse darts from its den
O how glad is Pangur then!
O what gladness do I prove
When I solve the doubts I love!
So in peace our tasks we ply,
Pangur Ban, my cat and I;
In our arts we find our bliss,
I have mine, and he has his.
Practice every day has made
Pangur perfect in his trade;
I get wisdom day and night,
Turning Darkness into light.
Pangur Bán
(Author unknown. Translated from the
original Irish by Robin Flower)

Chapter One: Introduction
13
Chapter One:
Introduction

Chapter One: Introduction
14
1.1 Helium Exploration
1.1.1. Helium in the modern world
The first instance of a significant discovery of inert gases was recorded in
1903 in Dexter, Kansas, USA while exploring for petroleum. Initially dubbed ‘wind
gas’ the gas was analysed and found to contain 1.84% helium, 82.70% N2 and
14.85% CH4 by volume and later to contain significant quantities of neon and argon
(Cady and McFarland, 1906; Cady and McFarland, 1907a; Cady and McFarland,
1907b).
Past this discovery the helium industry did not boom until after the First
World War (circa the end of 1918) when helium, due its inert and lighter than air
properties was of interest to the US armed forces for use in zeppelins, dirigibles and
balloons (Sears, 2012).
Since this period the demand for helium has grown rapidly as new
discoveries were made as to its unique properties such as its extremely low boiling
point (4.2K), non-flammability, small molecular size of 0.20 nm, and superfluid
properties below 2.2K, makes it an especially valuable element (Smith et al., 2004;
Broadhead, 2005). The largest usage of helium currently is by the cryogenic,
engineering and medical sectors as a coolant for superconducting magnets in
everything from mass spectrometers to MRI machines to particle accelerators such
as the Large Hadron Collider at CERN.
As of the end of 2016 the USGS has estimated that 30% of the USA’s
consumption of helium was used for MRI machines, 17% for lift, 14% for analytical
and laboratory applications, 9% for welding, 6% for engineering and scientific

Chapter One: Introduction
15
applications, 5% for leak detection, 5% for semiconductor manufacturing and 14%
for other minor applications (Figure 1.1).
Figure 1.1.: Chart showing the uses of helium in the USA as of 2016 (USGS, 2017).
Since the first discovery of helium-rich gas in Kansas numerous others were
made across the USA, in Wyoming, Oklahoma, Texas, Kansas, New Mexico, Utah,
Arizona, Montana and Colorado (USGS, 2017). Some of these fields contain up to
10% helium by volume, a significant proportion considering that the economic
threshold concentration for helium to be considered extractable is 0.3%; the
concentration at which its value equals approximately that of the remaining 99.7% of
the discovered CH4 gas volume.
Other discoveries of helium-rich gas have also been made in Canada,
Algeria, Poland, Russia, Germany, Hungary, Romania, Qatar, Kazakhstan, India,
Pakistan, China and the Timor Sea. World helium consumption has risen by around
130% over the past 10 years and is set to increase as technology advances (USGS,
2017).

Chapter One: Introduction
16
It has been noted that helium is technically a renewable resource due to the
continuing decay of U and Th in the Earth’s crust however this is over geological
timescales. While it is true that the Earth will not run out of helium, current reserves
of helium have the potential to become critical over human timescales, thereby
making it a non-renewable resource in this respect.
Current helium reserves in the USA are due to be sold off/run out by 2021
which places the onus on the larger fields of Hassi R’mel in Algeria and South Pars
in Qatar, which have recently come online, to supply the majority of the world’s
helium. This however is highly dependent on both the continuing need for Liquified
Natural Gas (LNG) which enables large volumes of helium to be produced from near
trace concentrations in the fields (0.05% He on average) and also on the political
stability of these regions. The issue of political stability with regards to helium
supply for the West also extends to potential fields in Russia which are currently
under development such as Chayandinskoye, Sobinskoye, Kovyktinskoye and
Yurubcheno-Tokhomskoye.
As of 2016 the USGS has estimated world reserves of helium of 51.9 billion
m3. Therefore, despite several new helium fields coming online such as in Algeria,
Qatar and Russia there is only enough helium left for approximately 230 years if we
assume that current demand remains the same (USGS, 2017).
Current helium reserves are set to decline to critically low levels in a few tens
of years making this a significant problem affecting many aspects of industry and
society. This has been shown by the need in the past for strategic shutdowns of
university hospital equipment around the UK (Connor, 2013; Stokes, 2013).
Recycling is rarely an option except in a laboratory setting, the containment
of helium is difficult and leakage from storage inevitably occurs over time due to its

Chapter One: Introduction
17
small atomic diameter. Once helium reaches the atmosphere it circulates for
approximately 1 Ma before being lost to space due to its escape velocity at Earth
temperatures in the exosphere exceeding the planet’s gravitational attraction
according to Jean’s escape (Torgersen, 1989; Pepin and Porcelli, 2002).
Current global helium reserves mosstly originate from serendipitous
discoveries and in all cases these were made when exploring for petroleum. This has
led to the mistaken general attitude that there is very little need to develop any
special geological expertise to target helium-rich gases in order to provide an
adequate supply of helium (Maione, 2004). Moreover many gas production
companies are unwittingly venting helium because they either do not test their gas or
if they do fail to recognise the value of this seemingly minor component (Clarke et
al., 2012).
In hydrocarbon fields helium and N2 are usually vented during the clean up
process. For one field this amounts to 300,000 ft3 per day of helium which is
shocking when it is considered that the LaBarge field (Wyoming, USA) initially
flowed approximately 270,000 ft3 per day and is now one of the four main producers
of helium in the USA (Gluyas, pers comm., 2012,).
Helium is not only valuable to industry, medicine, physics and engineering
but also to geoscientists due to its uses in quantifying groundwater interaction with
hydrocarbons, identifying the origin of natural gases and dating the age of
groundwater. These applications span not only scientific research but also the
petroleum, aviation, medical and nuclear industry to name but a few.

Chapter One: Introduction
18
1.1.2. Types of helium reservoir
Economically, a helium-rich gas field is classified as one which has a volume
percent of 0.3% or greater. However, in terms of geochemistry, a helium-rich field
can be classified as anything above 0.1%, due to helium being present in most fields
as trace amounts (<0.05%).
Producing helium-rich fields can be classified according to their primary gas
component as one of three main types:
1) N2-rich: examples - Harley Dome (USA), Pinta Dome (USA)
2) CO2-rich: examples – LaBarge (USA), Doe Canyon (USA)
3) CH4-rich: examples - North Dome-South Pars (Qatar/Iran), Hugoton-
Panhandle (USA), Hassi R’Mel (Algeria) (Figure 1.2)

Chapter One: Introduction
19
Figure 1.2.: Graph redrawn from Helium One, pers. comms., (2016) showing helium
concentration (%) against reserve volume (Bcf). Red circles indicate N2-rich fields, blue
circles indicate CH4-rich fields and green circles indicate CO2-rich fields.
1.1.2.1. CO2-rich fields
These are defined as fields where CO2 is the primary constituent of the gas
volume. Fields like this are often found in close proximity to helium-rich fields
where N2 is the main gas component. Major geochemical studies have been
conducted on CO2-rich gas fields before by both Zhou, (2004) and Gilfillan, (2006).
However, it is in rare cases that gas fields which are CO2-rich are also
classified as helium-rich in the economic sense e.g.: Doe Canyon and LaBarge
(Gilfillan, 2006; Merrill et al., 2014). This rarity is most likely due to the bulk of the
CO2 in high CO2 fields usually originating from a purely magmatic provenance

Chapter One: Introduction
20
whereas economic helium reservoirs usually contain a significant input from shallow
crustal sources. Therefore, this proportionally large magmatic input into reservoirs
has the potential to have a diluting effect on helium and associated crustal gases in
reservoirs (Weinlich et al., 1999; Barry et al., 2013; Chapter 5, this thesis).
1.1.2.2. CH4-rich fields
Methane is the most common gas which is trapped in producing field areas.
However, it is generated by a completely different process to helium and usually at
shallower depths and lower temperatures which may be factors which influence its
dominance in traps relative to helium.
Fields such as the Hugoton-Panhandle field, the North Dome-South Pars field
and Hassi R’Mel field are all examples of CH4-rich fields which are predominantly
sourced for natural gas and other petroleum products. However, these three fields fall
into two distinct categories.
The Hugoton-Panhandle is classified as a classic example of a helium-rich
field under economic terms i.e.: that it has at least 0.3% helium by volume of gas in
the reservoir. However, the Hassi R’mel and North Dome-South Pars fields are also
classified as helium-rich. Indeed, the South Pars part of this combined field contains
one of the largest helium reserves on Earth, dwarfing any currently producing in the
USA. Estimates of the helium reserve in this field run to around 10.1 billion m3; a
quarter of the current world helium reserve (USGS, 2017). Despite this, under
current economic considerations, the North Dome-South Pars field would not be
considered as a viable helium-rich field since this field only contains approximately
0.04% helium. Hassi R’mel also contains subpar concentrations of around 0.05%

Chapter One: Introduction
21
helium. However, due to the size of the reservoir, this equates to a diluted
concentration but a large overall volume thereby making these giant fields
economically viable.
1.1.2.3. N2-rich fields
Nitrogen-rich fields are a paradox in terms of helium concentrations. In all
instances of economic amounts of helium accumulating in natural gas fields, there is
always a related amount of nitrogen. Usually this ranges from a 0.02 to 0.20 ratio of
4He/N2. Nitrogen-rich fields like these can contain up to 10% helium by volume in
the USA. Outside of the USA however, very few nitrogen-rich fields have been
found; whether this is due to lack of knowledge, lack of relevant discoveries or
special geological circumstances occurring in the USA remains to be seen.
Despite helium-rich resources occurring in nitrogen-rich fields, in most cases
of high nitrogen fields (50%-88%) such as those in NW Germany, there is no
economic helium associated with these fields (Barnard and Cooper, 1983; Gerling et
al., 1999). Therefore, helium is always related to nitrogen however nitrogen is not
always related to helium.
Very few studies have been done on the relationship between helium and
nitrogen however there are hypotheses which are linked to the most prominent paper
on the topic by Ballentine and Sherwood Lollar (2002). By studying the noble gas
isotopes and stable isotopes it was found that radiogenic helium was associated with
a nitrogen component that showed a light δ15
N signature (-3.00‰). This indicated
that the helium and the nitrogen were sourced from the same rocks and that the
source of both the nitrogen and the helium was most likely the low temperature
metamorphism of basement rocks both in situ and from the surrounding region.

Chapter One: Introduction
22
1.1.3. Introducing helium as a noble gas
Helium is the second most common element in the universe and is believed
to be present in all natural gas fields as a trace component (<0.05 ppm). It is
classified as a noble gas.
The noble gases, which compose Group 18 of the periodic table, are known
for their chemical inertness as a result of their full outer shell electron configuration
(IUPAC, 2005). Under standard temperatures and pressures they exist in nature as
stable monatomic gases.
Helium has two stable isotopes: rare 3He, ‘primordial helium’, left over from
the formation of the Earth in the mantle, and prolific 4He, ‘radiogenic helium’, which
is a product of the alpha decay of 235
U, 238
U and 232
Th (Mamyrin and Tolstikhin,
1984; Oxburgh et al., 1986). Helium, as with all noble gases, is sourced from three
quantifiable sources: the atmosphere, the crust and the mantle. Helium associated
with economic reserves is always crust-dominated in source (Ballentine and
Sherwood-Lollar, 2002; Gilfillan, et al., 2008; Chapter 3 this thesis; Chapter 4 this
thesis).
The 3He isotope is largely associated with areas of tectonic and volcanic
activity along with passive degassing of the Earth (O'Nions and Oxburgh, 1988).
The most significant terrestrial sources of 3He are mid-ocean ridge and subduction
volcanism (Craig et al., 1975; Craig and Lupton, 1976; Torgersen, 1989).
The other major alternative source of 3He is thermal neutron capture by
6Li in
predominantly clay-rich areas (6Li(n,α)
3H(β
-) →
3He) (Hiyagon and Kennedy, 1992;
Ozima and Podosek, 2001; Ballentine and Burnard, 2002). However, this usually
only occurs within the upper few metres of the crust.

Chapter One: Introduction
23
Large concentrations of radiogenic 4He tend to be confined to areas which
contain high amounts of radioactive elements from the U and Th series. These are
often granitic bedrocks or sedimentary basins composed of igneous fragments and
shales. However, since there is a decreasing trend in terms of U and Th lower in the
crust-mantle boundary, there are still potential magmatic sources of 4He.
A small proportion of recorded 4He is derived from mantle sources (due to
the continuing decay of U and Th lower in the Earth’s asthenosphere), leading it to
be called ‘magmatic 4He’ (Tolstikhin, 1975; Ballentine et al., 1991; Ozima, 1994).
Large concentrations of magmatic 4He show a deep crustal input into systems.
Approximately 75% of 4He is produced in the upper 10 km of the crust due to
preferential partitioning of the incompatible U and Th isotopes into the crust
(Ballentine and Burnard, 2002).
1.1.3.1. Sources of helium
Crustal helium (4He) is usually found in natural systems as trace amounts
(<0.05 ppm) but concentrations higher than air (5.24 x 10⁻⁶
cm3STP(
4He)/cm
3) are
most associated with: groundwater, ancient brines, ancient pore water, natural gas
fields, Carlin type gold deposits, ore deposits, hydrothermal fluids, volcanic
degassing, oil field brines, lakes, ice, sediments and coal measures (Heaton, 1984;
Torgersen and Clarke, 1985; Torgersen and Ivey, 1985; Creedy, 1988; Ballentine et
al., 1991; Stute et al., 1992; Marty et al., 1993; Pinti and Marty, 1995; Stuart et al.,
1995; Ballentine et al., 1996; Pettke et al., 1997; Winckler et al., 1997; Pinti and
Marty, 1998; Burnard et al., 1999; Ballentine et al., 2002; Ballentine and Burnard,
2002; Ballentine and Sherwood-Lollar, 2002; Kipfer et al., 2002; Yang et al., 2003;

Chapter One: Introduction
24
Poreda et al., 2004; Graupner et al., 2006; Gilfillan et al., 2008; Holzner et al., 2008;
Ray et al., 2009; Zhou et al., 2012; Barry et al., 2013; Winckler and Severinghaus,
2013; Caracausi and Paternoster, 2015; Lowenstern et al., 2015; Tomonaga et al.,
2017). Out of these possible sources we will be addressing natural gas fields in more
detail later in this chapter due to their relevance to the helium exploration narrative.
1.2. The other noble gases
The stable isotopes of helium are often found in association with other stable
noble gas isotopes such as: 20
Ne, 21
Ne, 22
Ne, 36
Ar, 38
Ar and 40
Ar; which are either
radiogenically or nucleogenically sourced in the crust, mantle or atmosphere. The
descriptions below briefly detail the processes which source these other stable
isotopes.
1.2.1. Neon
Neon has three stable isotopes: 20
Ne, 21
Ne and 22
Ne. The production of 20
Ne
is primarily due to carbon-burning during stellar nucleosynthesis (12
C + 12
C 20
Ne
+ 4He) and was trapped by the Earth during accretion (Clayton, 2007). This accounts
for the high abundance of 20
Ne in our atmosphere. Since the production of 20
Ne in
the crust is negligible compared to 20
Ne sourced from the atmosphere any 20
Ne
detected in shallow reservoirs is determined to have been introduced into the system
by groundwater (Ballentine et al., 1991; Ozima and Podosek, 2001; Ballentine and
Burnard, 2002).

Chapter One: Introduction
25
The main pathways for the production of 21
Ne in the crust are determined by
oxygen (17,18
O(α,n)20,21
Ne) and magnesium (24,25
Mg(n,α)21,22
Ne) concentrations
(Ballentine and Burnard, 2002). In the crust the magnesium pathway only accounts
for <0.13% of total nucleogenic 21
Ne production and is considered more important in
mantle systems where it can make up 3.37-65.35% (Yatsevich and Honda, 1997;
Ballentine and Burnard, 2002).
The main nucleogenic production routes for 22
Ne in the crust are determined
by fluorine (19
F(α,n)22
Na(β+)22
Ne and 19
F(α,p)22
Ne) and magnesium
(24,25
Mg(n,α)21,22
Ne).
1.2.2. Argon
Argon has three stable isotopes: 40
Ar, 38
Ar and 36
Ar. The production of 40
Ar
is via electron capture during the decay of 40
K in the crust. 36
Ar production in the
crust is negligible (β-decay of 36
Cl) compared to atmosphere-derived 36
Ar which
dominates in systems that contact groundwater. 38
Ar excesses in the crust can be
produced by the decay of 35
Cl (35
Cl(α,p)38
Ar) and of 37
Cl (37
Cl(n,γ)38
Cl(β-)38
Ar)
(Ballentine and Burnard, 2002). The production of 38
Ar also strongly depends on the
siting of Cl relative to U and Th in the crust and is therefore sensitive to
radioelement heterogeneity. However, the majority of 38
Ar concentrations recorded
in shallow reservoirs are sourced from the atmosphere due to the low production
rates associated with 38
Ar in the crust.
1.2.3. Krypton and Xenon

Chapter One: Introduction
26
Both krypton and xenon have six stable isotopes each: 78
Kr, 80
Kr, 82
Kr, 83
Kr,
84Kr,
86Kr,
128Xe,
129Xe,
130Xe,
132Xe,
134Xe and
136Xe. In the case of krypton,
78Kr
and 86
Kr are observationally stable (Ozima and Podosek, 2001). The major stable
isotopes 83
Kr, 84
Kr, 86
Kr, 129
Xe, 132
Xe, 134
Xe and 136
Xe are produced by the fission of
238U.
1.3. The noble gases as geochemical tracers in natural gas systems
The isotopes of the noble gases (He, Ne, Ar, Kr and Xe) act as conservative
tracers in natural gas reservoirs. This is due to their properties as inert, unreactive
elements. As such, they are unaffected by chemical reactions which affect ratios of
other non-hydrocarbon gases within the reservoir fluids. However, once in the crust,
the noble gas characteristics of a fluid can be additionally altered by in situ
radiogenic production and physical processes such as phase fraction and diffusion.
Noble gas isotopic ratios and concentrations can be used to constrain the
origins of fluids, detect subsurface phase interactions and reveal the mechanism of
transport responsible for conveying the fluid to the reservoir (Ballentine et al., 1991;
Hiyagon and Kennedy, 1992; Pinti and Marty, 1995; Ballentine et al., 1996;
Torgersen and Kennedy, 1999; Ballentine et al., 2001; Ballentine et al., 2002;
Ballentine and Sherwood-Lollar, 2002; Lippmann et al., 2003; Gilfillan et al., 2008;
Zhou et al., 2012; Prinzhofer, 2013).
This is possible because noble gases are introduced into crustal reservoirs
from both the mantle and the atmosphere (Figure 1.3). In the petroleum industry,
four main isotopic ratios are used to quantify oil and gas exploration: 3He/
4He (Ra),
20Ne/
22Ne,
21Ne/
22Ne and
40Ar/
36Ar.

Chapter One: Introduction
27
Figure 1.3.: Diagram of a shallow natural gas reservoir showing the three distinct
sources of the noble gas isotopes measured in these reservoirs. The atmospherically-
sourced noble gases such as 20
Ne and 36
Ar are input into reservoirs due to air
equilibration with groundwater at recharge. The radiogenic noble gases such as 4He,
21Ne and
40Ar are predominantly produced, either directly by or as a by-product of, the
radioactive decay of U, Th and K in the crust. In reservoirs near areas of active
continental extension or magmatic activity an excess of mantle-sourced noble gas
isotopes; predominantly 3He will be present. The distinct isotopic compositions of the
noble gas isotopic ratios associated with these three sources enables the contribution
from each to be quantitatively resolved (from Gilfillan, 2006).
The 3He/
4He ratio is important because it reflects the binary mixing of
mantle/crustal helium sources. 3He/
4He ratios from samples (designated as R) are
normalised to the atmospheric 3He/
4He ratio of 1.4 x 10
-6 (designated as 1 Ra). It is
assumed that the endmembers for crust-derived radiogenic helium is 0.020 Ra, for a
Mid Ocean Ridge Basalt-derived (MORB) source it is 8.0 Ra and for a Sub-
Continental Lithospheric Mantle (SCLM) source it is 6.1 Ra (Craig and Lupton,
1981; Gautheron and Moreira, 2002).
Atmospheric contributions to 4He can be calculated by comparing the
4He/
20Ne ratios of samples to the
4He/
20Ne ratio of air (0.032) (Kipfer et al., 2002). If

Chapter One: Introduction
28
samples are significantly higher than the air value (order of magnitude or more) then
it can be safely assumed that there is no significant atmospheric contribution to the
Ra value for samples.
1.3.1. Crustal contributions to natural gas systems
Radiogenically and nucleogenically produced noble gases such as 4He,
21Ne,
40Ar and
136Xe can be found in excess of atmospheric contributions in natural gas
reservoirs. Excesses of noble gas isotopes in natural gas reservoirs can be generated
by: 1) addition of gases from a source separate to in situ production within the
reservoir or 2) closed system accumulation within the reservoir rock. Ultimately
excesses of noble gases in reservoirs are determined by the efficiencies associated
with noble gas escape from minerals, migration and trapping. The addition of crustal
noble gases to reservoirs results in measurements of low 3He/
4He ratios and high
21Ne/
22Ne and
40Ar/
36Ar ratios in gases.
1.3.2. Mantle contributions to natural gas systems
Mantle contributions to natural gas systems usually occur near areas of
volcanism or continental extension. Helium is usually a good tracer of a mantle
addition to crustal fluids due to its low abundance in the atmosphere (5.24 x 10⁻⁶
cm3
STP(4He)/cm
3) and isotopically distinct mantle and crust Ra values (8.0 Ra and 0.020
Ra respectively).
However, sometimes it is difficult to identify mantle-derived helium in
continental samples with relatively low Ra values because values between the

Chapter One: Introduction
29
average crustal radiogenic production ratio of 0.020 Ra and up to 0.10 Ra can be
attributed to other sources such as high local Li concentrations or cosmogenic 3He
implantation and release from sedimentary materials. In these cases a mantle
component is evidenced further when also accompanied by high 20
Ne/22
Ne ratios,
21Ne/
22Ne ratios and
40Ar/
36Ar ratios.
1.3.3. Groundwater contributions to natural gas systems
The atmospheric noble gases (20
Ne, 38
Ar, 36
Ar, 84
Kr, 130
Xe) are introduced
into the crust when dissolved in the groundwater during recharge. They are then
fractionated according to their relative solubilities in water leading to
Xe>Kr>Ar>Ne>He (Crovetto et al., 1982). The concentration of these gases in the
groundwater is dependent on several variables including the partial pressure of the
noble gases in the atmosphere (dictated by the equilibration altitude), the temperature
at which equilibration occurs (generally only relevant when calculating palaeo-
temperatures) and the volume of air trapped in groundwater by periodic fluctuations
in the vadose zone referred to as ‘excess air’ (Kipfer et al., 2002).
The salinity of the groundwater also has an effect on the amount of noble
gases dissolved within it. There is still an on-going debate as to whether this is due to
the salinity itself or simply the advanced age of the water. Once the fluids enter the
crust, the increase in hydrostatic and/or lithostatic pressure prevents the loss of noble
gases from the fluid, regardless of the temperature or salinity of the groundwater
(Ballentine et al., 2002).

Chapter One: Introduction
30
From these fundamental principles it can be seen that with careful measurement
these distinct sources can be distinguished isotopically from each other to show the
extent of crustal, mantle and atmospheric contributions to the reservoir fluid.
1.4. Literature review of the helium system
Since most economically viable helium deposits are found in natural gas
reservoirs which are already tapped for their petroleum potential we shall be splitting
the stages of the helium system along the lines of petroleum exploration: from source
to entrapment for ease of discussion.
1.4.1. Generation and accumulation
As outlined in Section 1.1.3. 4He, the dominant isotope of economically
viable helium gas in reservoirs, is radiogenically sourced from the decay of U and Th
isotopes over the entire crust whereas hydrocarbon products are biogenically sourced
from the decay of organic matter. Overlap of this source material occurs in shales
which can produce both hydrocarbons and 4He over geological time however this
will inevitably lead to the dilution of 4He concentrations produced from these source
rocks with increasing CH4 generation from maturation.
Crustal/cratonic rocks of Proterozoic to Archean age (< 3.8 Ga) are
predominantly metamorphic-granitic in character and rich in U and Th, thereby
enabling the production of 4He. Concentrations of
4He increase in the subsurface
over time as these cratons act as closed systems with helium either remaining within
producing minerals or either diffusing or being ejected into the fluid within the

Chapter One: Introduction
31
porosity of the rocks (Reimer, 1976; Bottomley et al., 1984; Zadnik and Jeffrey,
1985; Lippmann-Pipke et al., 2011; Holland et al., 2013).
The fraction of 4He lost by recoil is a strong function of the effective grain
size (sur-face to volume ratio of the grain). Low surface area/volume ratios of <0.03
μm-1
result in >90% retention of 4He in all but the most planar or acicular crystal
morphologies (Ballentine and Burnard, 2002). Therefore, as metamorphic grade and
crustal depth increase, the rate of recoil loss will decrease due to the average grain
size increasing.
Rates of 4He accumulation from crustal sources are controlled locally by
porosity, local advection/diffusion, compressive stresses and tectonics (Torgersen
and Ivey, 1985).
Over short time scales, helium accumulation is controlled by the radioactive
decay rate of U and Th. However on longer time scales it is controlled by the vertical
flux from 4He degassing plus the in situ rates (Torgersen and Clarke, 1987).
Over time, high volumes of 4He accumulate in the basement rock. However,
due to a combination of low concentration (ppm) and the ability of some minerals
such as apatite, zircon and titanite to retain helium below their closure temperatures;
the atoms need a mechanism for mass release (Table 1.1).
Mineral Closure temperature
range (°C) References
Apatite 55-100 Lippolt et al., 1994; Wolf
et al., 1996; Farley, 2000;
Farley, 2002; Shuster et
al., 2006
Hematite 90-250 Bähr et al., 1994; Farley,
2002
Zircon 180-200 Farley, 2002; Reiners,
2005; Reich et al., 2007;

Chapter One: Introduction
32
Cherniak et al., 2009
Garnet 590-630 Dunai and Roselieb, 1996;
Farley, 2002
Monazite 182-299 Boyce et al., 2005
Titanite 150-200 Reiners and Farley, 1999;
Farley, 2002
Uraninite ~200 Martel et al., 1990; Stuart
et al., 1994
Table 1.1.: Helium closure temperatures for helium retentive minerals. Variations in
closure temperature for individual minerals are due to combinations of differing grain
sizes and cooling rates.
1.4.2. Primary migration
There are two possible routes for helium to be released from basement rocks
in the concentrations found in the shallow crust: 1) mass diffusion of accumulated
helium produced from the decay of U and Th in the crust or 2) advection of
accumulated helium produced from the decay of U and Th in the crust.
Following calculations by Ballentine and Burnard (2002) diffusion as a major
mass transport mechanism is insignificant and transport to the shallow systems is
single phase. Walther and Orville (1982), using a theory of single pass flow
mechanics, calculated that during progressive metamorphism, dehydration and
carbonation reactions produce fluid which flows upwards due to its lower density
than the surrounding country rock. This can occur one of two ways: either through
convection or through what is known as ‘single pass flow’ where the fluid travels
vertically one way.
In order for fluids to convect, the rock must be able to maintain a hydrostatic
gradient within its fracture and pore networks. This involves balancing the difference
between the hydrostatic pressure and the higher lithostatic pressure of the overlying
rocks. However, if the rock strength is insufficient to hold open the pores and

Chapter One: Introduction
33
fractures then they will anneal until the fluid equilibrates to lithostatic pressures.
This mechanism results in ‘single pass flow’ as the fluids reach lithostatic pressure.
A possible reason that helium is released from source rocks and into
overlying strata is the impact of a geological event causing significant fracturing and
heating of the basement rock (Salah and Alsharhan, 1998). Events on a tectonic scale
which could cause intense fracturing and heating of the surrounding country rock
could either be an orogenic event, an extensional event (rifting) or deep burial
(diagenesis).
The vertical movement of fluids by deep faults most likely helps this method
of migration until it is further channelled into fractures or pore networks in the
shallow crust (Bebout and Carlson, 1986).
Diffusion alone is not enough to transport the volumes of helium found
concentrated in some shallow crustal areas, therefore helium gas must be subject to
advection in order to be distributed in the quantities found in the shallow crust.
1.4.3. Helium and associated carrier gases
The presence of nitrogen and carbon dioxide in large amounts in hydrocarbon
systems is now regarded with significantly more importance due to their proportions
determining the commercial value of the reservoir. However in the interest of helium
exploration, it is noted that producing fields consistently show high nitrogen coupled
with significant amounts of helium (Anderson and Hinson, 1950; Dobbin, 1968;
Dunlap, 1969; Stewart and Street, 1992; Ballentine and Sherwood Lollar, 2002;
Gilfillan et al., 2008; Chapter 3, this thesis; Chapter 4, this thesis).

Chapter One: Introduction
34
In recent sediments the main source of nitrogen is mainly the trapping of air
however nitrogen can also be released from organic matter during high temperature
thermal decay, from sediments and the basement during metamorphism, from air
being dissolved in groundwater and from localised mantle inputs (Stahl et al., 1977;
Kreulen et al., 1982; Haendel, et al., 1986; Coveney et al., 1987; Gold and Held,
1987; Jenden et al., 1988a; Bebout and Fogel, 1992; Boyd et al., 1993; Krooss et al.,
1993; Littke et al., 1995; Gerling et al., 1998; Bebout et al., 1999; Hutcheon, 1999;
Weinlich et al., 1999; Zhu et al., 2000; Boyd, 2001; Ballentine and Sherwood-Lollar,
2002).
There is evidence for separate systems for noble gas transport and
hydrocarbon transport in the subsurface and of admixtures of 4He and N2 which are
sourced from the same region of the crust giving credence to the concept of carrier
gases aiding the bulk advection of volumes of helium from depth to the shallow crust
(Gold and Held, 1987; Jenden et al., 1988a; Giggenbach and Poreda, 1993;
Ballentine and Sherwood-Lollar, 2002; Gilfillan et al., 2008; Chapter 3, this thesis;
Chapter 4, this thesis).
1.4.4. Secondary migration
For the purposes of the helium system this is defined as migration past the
limit for lithostatic pressure where there is interaction between circulating
groundwater and fluids from depth produced by primary migration. Due to the
change in pressure, there will be the potential for convection and not just single pass
flow. The migration of helium is assumed to be similarly governed to migration of
Chapter One: Introduction
35
petroleum, in that the balance between hydrostatic and lithostatic pressure are the
main causes followed by porosity, permeability and capillary pressure.
Due to the scale of the events which potentially release the volumes of
helium and associated gases, an equally large scale must also be applied to secondary
shallow migration via groundwater. During orogeny tectonic compression and
thrusting produce large overpressures, forcing fluids out towards the thrust front.
Although the flow rates in this scenario are not yet known, maximum velocities are
suggested to be around 0.5 m/yr for aquifers. This will dissipate quickly following
the relaxation of the stress (Garven et al., 1993). It thought that the compaction-
driven events which stimulated continental groundwater migration dissipated after a
few hundred years in the case of the Appalachian Orogeny, driving fluids from SE to
NW in periodic pulses.
The generation of basin-and-range formations on the west side of the USA
were most probably responsible for continental scale groundwater flow (west to east)
during the Late Cretaceous-Tertiary. The Sevier-Laramide Orogeny created the
Rocky Mountains and simultaneously uplifted the foreland platform to the east of the
deformation front (Garven, 1995). Evidence of this is prevalent on both sides of the
United States, both from the Sevier-Laramide Orogeny and the Appalachian
Orogeny on the east coast of the continent. Brines from the Colorado Front Range
(an offshoot of the Rocky Mountains) have been found in aquifers in Missouri
(Banner et al., 1989).
Lateral migration from different basins is also possible if there are carrier
beds within the underlying stratigraphy which contain good to excellent porosity
(Jenden et al., 1988b). Included within lateral migration is the effect of long distance
groundwater focusing on noble gas accumulation (Ballentine and Sherwood Lollar,

Chapter One: Introduction
36
2002). There is greater potential for this where fracture networks and faults intersect
groundwater flow (Ciotoli et al., 2005).
Torgersen and Clarke (1985), suggest that the accumulation of 4He in some
basins is governed by a combination of three distinct processes: 1) in situ release of
the products of the radioactive decay of U and Th (recoil), 2) the in situ weathering
of the basement rock releasing 4He which had accumulated along grain boundaries
and 3) another input from a different system i.e.: an outside input of 4He to the basin.
By this principle, outside input > recoil > weathering which is supported by the
helium mass balance conducted in Chapter 3 for helium-rich reservoirs in Kansas
and for the Hugoton-Panhandle gas field.
The focusing of noble gases is sometimes attributed to the gas phase
composed of CO2 stripping old groundwater containing accumulated 4He and
nitrogen (Ballentine et al., 2000; Gilfillan et al., 2008). CO2 flushing of magmatic
systems can also lead to a strong crustal overprint of 4He and
3He which have been
carried by the gas from depth. CO2 is released from the basement and clay layers by
heat like N2, however it is prone to being used up in other reactions and lost perhaps
attributing to its almost negative correlation to helium.
1.4.5. Entrapment and escape
In order for a trap to hold petroleum products in place, it must either be
sealed by an impermeable caprock or faulted against an impermeable rock type. It is
far more probable for gases which would normally remain in solution to exsolve in
the presence of another gas already filling the gas cap.
Chapter One: Introduction
37
The proportion of helium in pore spaces which is in solution is dependent on
the partial pressure of the helium. The total pressure in the pores is generally fixed
by the overburden pressure, which would mean that the partial pressure of helium is
reliant on the quantities of other gases present. This could explain why CO2 and N2
have often been cited as carriers (Newton and Round, 1961).
Alternatively helium gas atoms have a diameter of approximately 0.20 nm,
and the associated nitrogen gas molecules are larger at around 0.34 nm (Hunt, 1996).
Seals which contain other gases may not a good representation of a seal for helium
since seals which may seal CO2, might not hold helium according to its smaller
atomic diameter. Due to the small size, helium could very well diffuse through a seal
therefore seals with smaller pores will have a lower rate of diffusive loss
(Broadhead, 2005).
In a review of the world’s 176 giant gas fields, almost all of them were
dependent on shale or evaporite seals (62% and 38% respectively) (Grunau, 1981).
Seal thickness is also an issue, however it doesn’t linearly influence the amount of
hydrocarbon column to be held by a top seal.
The timing of trap formation is key for helium systems, especially for fields
which contain high levels of N2. Most traps which hold significant amounts of
helium gas were formed in the latter part of the Cenozoic which coincides with
several key orogenic events in the Earth’s history and seal sandstone or carbonate
reservoirs.
Rates of trap destruction through geological processes such as weathering,
erosion and tectonic events vary over time. Free gas can migrate upwards due to
differences in the specific weight between the gas and the surrounding fluids. It can
then escape through the caprock due to either natural fractures in the caprock,

Chapter One: Introduction
38
manmade fractures or the destruction of porosity which enables the smaller
molecular elements to escape (Robertson et al., 2012).
Complex fold belts and overthrust belts are commonly subject to seal
destruction. Of the world’s 25 largest gas fields, 21 are in cratonic settings and 4 are
in fold belts (Grunau, 1981). It is suggested in Ungerer et al., (1990) that gas escape
from some caprocks display a cycle of escape and replenishment and that others
show characteristic seismic ‘gas chimneys’ which indicate gas is escaping from the
caprock due to fractures (Løseth et al., 2003).
1.5. Objectives and thesis outline
Both scientific and industrial research into a unified helium exploration
method is either still in its infancy or not available for public consumption. Currently
there is only one study available which specifically records the geochemistry of a
high CH4-high 4He system and identifies a source and migration pathway into
reservoirs; and even this study was an examination of the N2 characteristics of the
system (Ballentine and Sherwood-Lollar, 2002).
To date this will be the first systematic study undertaken using noble gas
isotopes and stable isotope analyses to identify the source(s) of economic helium
reserves, the potential migration pathways which lead to its focusing into reservoirs
and its interaction with other gases which are found in the same reservoirs with the
aim of providing the first stage of a helium exploration method.
This thesis will accomplish this by: 1) providing a comprehensive noble gas
and stable isotope study focusing on 4He sourcing and migration pathways using 21
samples taken from helium-rich fields within 2 geological provinces (the Central
Chapter One: Introduction
39
Kansas Uplift and the Kansas Basin in the USA) which are compared to and with
measurements taken from the neighbouring Hugoton-Panhandle giant gas field
(Chapter 3), 2) identifying the isotopic character of the nitrogen endmember
associated with 4He by conducting a noble gas and stable isotope study on 3 samples
taken from high N2-high 4He wells from Utah, Montana and Saskatchewan, Canada
(Chapter 4) and 3) synthesising what we have learned from these regions of North
America into a helium exploration methodology which can then be used to identify
economic helium areas on another continent (Tanzania, Central Africa) (Chapter 5
and Chapter 6).
In addition to the introduction and objectives of this thesis outlined above
and the four data chapters this thesis also includes: the field sampling techniques and
experimental procedures used in all studies (Chapter 2) and a summary of the results,
overall conclusions and the potential for future work (Chapter 7).

Chapter Two: Methods
40
Chapter Two: Methods

Chapter Two: Methods
41
2.1 Introduction
The collection and analysis of noble gases in natural gas samples has been
documented by other authors (Zhou, 2004; Gilfillan, 2006) however there are five
main requirements for successful analyses: 1) the collection of the sample into a
sealed vessel which is either free from or minimally air contaminated and which will
not leak both gas out and air in over a significant timescale (years) 2) a purification
line with an ultra-high vacuum (UHV) of ~10-8
mbar and the maintenance of low
blank levels (ideally 1% of the sample/standard concentration or lower), 3) efficient
methods of removing reactive gases from the sample e.g.: nitrogen, carbon dioxide,
water, hydrogen, 4) a way to separate the noble gases so they can be analysed
individually and 5) specialised mass spectrometer(s) to analyse the stable isotopes of
the noble gases.
This chapter gives an overview of the design and commissioning of the
Oxford Purification Line and the methodology involved in line development, sample
analysis and sample collection in the field at the time of sample analyses (2015 to
2016).
2.2 Sampling in the field
The greatest challenge during the sampling of gases, oil or water is avoiding
or minimising air contamination. So as to minimise this the vessel containing the gas
sample must be considered helium leak-tight and to this end internally polished
refrigeration grade copper tubes were used (Beyerle et al., 2000; Hilton et al., 2002;
Zheng, 2004; Gilfillan, 2006). These copper tubes were approximately 70 cm in

Chapter Two: Methods
42
length and 10 mm outer diameter. Alongside these tubes was a portable stainless
steel rack and stainless steel clamps used for holding sample tubes in place and then
cold welding them shut after gas flushing.
When sampling from helium-rich natural gas reservoirs gases are taken
directly from the wellhead. The sampling setup commences when a single (or double
stage) regulator which is appropriate for the wellhead pressures (the maximum inlet
pressure for our regulator was 310 bar) is attached to a valve on the wellhead using a
suitable NPT fitting. The regulator is then attached to the end of the copper tube by a
length of heavy duty PVC pressure hose capable of withstanding pressures of at least
2 bar. Sample tubes can be attached in series when collecting more than one sample
from a wellsite. At the end of the series of copper tubes, another piece of the same
heavy duty hose is attached to act as an exhaust port (Figure 2.1).
Gas is then flushed through the copper tubes at around 1 bar or below (this is
the maximum pressure the copper tubes can withstand) for 5 mins. After flushing the
tubes, the tubes are clamped starting with the end of the tube furthest from the
wellhead and working backwards towards the wellhead. After this the tubes are
marked with the location, date and position in series with permanent marker on the
copper body and in pencil on strips of masking tape attached to either end of the
tube.
Individual copper tubes were wrapped in layers of bubble wrap to prevent
damage in transit before being packaged and shipped back to the United Kingdom
for gas analyses. Before samples could be shipped from locations appropriate MSDS
(Material Safety Data Sheets) were required for the contents of the samples and due
to the contents of samples being classified as Dangerous Goods I had to take a

Chapter Two: Methods
43
Dangerous Goods course in order to become IATA certified so that samples could be
flown back to the United Kingdom from the USA and Canada.
Figure 2.1.: Collection of natural gas samples from the Bonnie Carson #1 well using the
field sampling setup outlined above, Ford County, Kansas in 2014.

Chapter Two: Methods
44
2.3. Analytical equipment
2.3.1. The Oxford Purification Line
The first stage of the Oxford Purification Line is the Proc Line. It is based on
the construction of the MAP Extraction Line originally created in-house at
University of Manchester described in Gilfillan (2006). It acts as the primary area for
the removal of reactive gases such as N2, CH4, CO2 and the heavier hydrocarbons
and hydrogen from samples (Figure 2.2). The line is constructed of stainless steel
tubing (18 mm diameter) and bakeable all-metal valves.
The Proc Line is kept at approximately 10-8
mbar during the purification
process by a diaphragm backed turbomolecular pump which can also pump any part
of the line depending on the combination of open and closed valves thereby
achieving line maintenance.
The Proc Line also contains a Baratron® gauge which measures pressure up
to 1000 torr. This is located adjacent to the part of the line into which the pipette
volume is expanded and is used to calibrate the pressure of the sample admitted into
this section of the line relative to the background air pressure (760 torr).
A Pirani™ gauge is also attached to the line which measures the vacuum
pressure of the roughing line which is kept at around 10-3
mbar by a rotary pump
while pumping down a closed sample. A Magnetron™ gauge is attached to the line
adjacent to the turbomolecular pump and measures the vacuum pressure of the rest
of the line which is usually around 10-8
mbar.
The line also contains a lower sensitivity Hiden™ quadrupole mass
spectrometer (QUAD) described in Warr, (2013) which is exposed to a 1 cm3 aliquot

Chapter Two: Methods
45
of the sample before any of the cleaned sample is let into the prep section of the line
so as to gauge preliminary concentrations of the noble gases. The QUAD is kept
isolated from the rest of the line at UHV. This is achieved by a separate ion pump
which keeps the pressure around 10-9
mbar.
Gas samples are cleaned by being first equilibrated with a Ti-sponge furnace
operating at 950°C which removes reactive gases. The temperature of the Ti-sponge
furnace is then lowered to room temperature to remove hydrogen from the sample.
From here the sample is then expanded to two getters; one of which is a SAES GP50
Zr-alloy getter that operates at 523K thus removing any leftover active gases. The
other is a SAES NP10 getter which operates at near room temperature (295K) and
removes hydrogen from the gas sample.
The second part of the gas purification process is the Cryo Line (Figure 2.2).
To separate the inert noble gases, the sample is equilibrated with a stainless steel
water trap (operating at a temperature gradient set at 250K and 180K) to adsorb
water, and two refrigerated cryotraps to adsorb the noble gases. These three traps are
enclosed within a vacuum shroud to maintain thermal stability. The first trap (a Janis
24K Closed Cycle Refrigerator) uses a stainless steel sorb and operates at a
temperature of 31K so as to adsorb Ar, Kr and Xe. The second trap (a Janis 10K
Cycle Refrigerator) operates at 15K and adsorbs Ne onto a charcoal finger. Such low
temperatures are achieved by cooling the refrigerated via a two stage helium
expansion process. Temperatures on these traps are set by computer control and are
stable to ± 0.2K or better.
The last stage of the process, the Prep Line, contains both manual and
automatically controlled valves whereas both the Cryo Line and Proc Line contain
only manual valves. Individual noble gases are run through this part of the line and

Chapter Two: Methods
46
are sometimes split into smaller volumes depending on readings from the QUAD.
Helium is redirected through this line to the Helix SFT™ mass spectrometer or, if
concentrations are low, is adsorbed onto an activated charcoal cryotrap and then
heated up again and released into the mass spectrometer. Run times for Helix
analyses were approximately 15 minutes. Ne, Ar, Kr and Xe are equilibrated with
and measured by the Argus VI™ mass spectrometer. Run times for Ne were
approximately 10 minutes, for Ar approximately 10 mins and for Kr and Xe
approximately 20 minutes.
The Prep Line contains four getters, two of which are run similarly to the
getters on the Proc Line (one hot and one cold). The other two getters are held at a
constant temperature and are adjacent to the inlet valves of each mass spectrometer.
These extra getters are a precaution against any stray reactive gases entering the
mass spectrometers. The prep line is kept at UHV by a Varian ion pump at around
10-9
mbar.

Chapter Two: Methods
47
Figure 2.2: Schematic of the Oxford Purification Line.
2.4. Mass spectrometers
2.4.1 Helix SFT™

Chapter Two: Methods
48
Helium isotope measurements were conducted by the Helix SFT™ static
vacuum mass spectrometer (Thermo Scientific™). The Helix SFT™ contains a
magnetic sector analyser with a 35cm radius of curvature and 120º sector extended
geometry ion optics. The split flight tube is suited to the simultaneous collection and
analysis of both 3He and
4He. The spectrometer uses a Nier-type ion impact source
giving sensitivities of >2.0 x 10⁻⁴
Amp/Torr at <1.2 mA trap current for helium
(Nier, 1940). The Helix has an internal volume of approximately 1400cm3.
The Helix is fitted with a detector assembly comprising of a high mass
voltage depressed deep Faraday bucket and a low mass Balzers SEM ion counting
multiplier with an electrostatic analyser (ESA). The Faraday is fitted with a software
switchable 1 x 10¹¹
and 1 x 10¹²
Ω gain amplifier. During analysis, the Faraday is
used to determine 4He and the electron multiplier is set to measure
3He. The electron
multiplier has a maximum resolution of >700 which is necessary for the separation
of the 3He-HD
+ doublet and
3He
+ peaks. The Faraday has a lower resolution with a
maximum of >400. The low mass detector is also fitted with a 90°, 50mm energy
filter (ESA) which enables the system to measure extremely large ratios without
peak tailing.
A Varian VacIon Plus 40 StarCell™ ion pump maintains an ultra-high
vacuum in the spectrometer. Its pumping speed is 40L/sec. During sample analysis,
the mass spectrometer is isolated from the ion pump while a SAES Zr-Al alloy NP10
getter pump operating at room temperature removes any hydrogen still remaining in
the sample.
2.4.2 Argus VI™
Chapter Two: Methods
49
The Argus VI™ static vacuum mass spectrometer (Thermo Scientific™) is
used to measure the other noble gas isotopes: 20
Ne, 21
Ne, 22
Ne, 36
Ar, 38
Ar, 40
Ar, 78
Kr,
80Kr,
82Kr,
83Kr,
84Kr,
86Kr,
124Xe,
126Xe,
128Xe,
129Xe,
130Xe,
132Xe,
134Xe and
136Xe.
It is a stainless steel, single focus, extended geometry mass spectrometer with a 90°
sector and 13cm radius flight tube. The Argus contains a tapered flight tube and has
an internal volume of approximately 700cm3. The spectrometer uses a Nier-type
bright source giving sensitivities in excess of 1 x 10⁻³
Amp/Torr at 200 μA trap
current for argon (Nier, 1940).
The collector array contains 5 Faraday cups and a low mass CDD (compact
discrete dynode) ion counting multiplier. The Faraday cups are denoted as H1, H2,
AX, L1 and L2. H values denote high mass cups, AX denotes the axial cup and L
values denote low mass cups. Ion beams are measured relative to the axial cup. The
resolution of the system is defined by the collection apertures and is in the range of
225-250. The resolving slits and 1mm entry apertures are designed to give a
simultaneous collection of the Ar isotopes 36 to 40.
The ultra-high vacuum in the Argus is maintained by a Varian VacIon Plus
20 StarCell™ ion pump. This pumps at 20L/sec. During sample analysis the
spectrometer is isolated from the ion pump but sample gas is still exposed to a Sorb-
AC Zr-Al alloy SAES NP10 getter pump at room temperature to trap residual
hydrogen.
2.5. Blanks
Full line background blanks were measured prior to running each set of
samples through the purification system. This was done so as to check that there

Chapter Two: Methods
50
were no leaks in the line and also to check that there was no residual contamination
in either the line or the mass spectrometers from the previous samples. The
procedure for running both full line blanks and samples will be outlined below (2.8
Sample loading and preparation).
For all samples it was ensured that background blank levels were below 1%
of typical sample concentrations before proceeding with running samples. In the
event of high blank backgrounds (mostly from either helium or argon) the line was
left to bake overnight with another blank taken the following morning to recheck
blank levels.
Blank measurements over the course of the thesis were as follows; for the
USA and Canada samples: 4He = 1.63 x 10
-8 to 3.08 x 10
-6 cm
3STP/cm
3,
20Ne = 3.69
x 10-9
to 2.11 x 10⁻⁸
cm3STP/cm
3,
40Ar = 7.30 x 10
-6 to 8.01 x 10
-5 cm
3STP/cm
3. For
the Tanzania samples: 4He = 2.06 x 10
-9 to 4.63 x 10
-8 cm
3STP/cm
3,
20Ne = 2.49 x
10-9
to 3.73 x 10⁻⁹
cm3STP/cm
3,
40Ar = 1.66 x 10
-5 to 6.45 x 10
-5 cm
3STP/cm
3. These
concentrations are negligible compared to the sample concentrations for all isotopes.
2.6. Air standards
Full line air standards were run on a weekly basis and calibrated against
internal standards which were run every night following sample analyses from the
Prep Line. He, Ne, Kr and Xe overnight standards were purified from a stock air
cylinder on the Prep Line, whereas Ar running standards were run from a reduced
pressure, pre-cleaned Ar-cylinder also situated on the Prep Line.
The overnight standards for all noble gas isotopes were determined over a
concentration range which spanned two orders of magnitude, to ensure that samples

Chapter Two: Methods
51
could be normalised to similar abundance magnitude standards. These standards
primarily show whether there are any changes in mass spectrometer sensitivity but
can also show variations from normal background leftover by samples and over time
can show mass spectrometer drift. Due to the consistency of these internal standards
they are used to ascertain the noble gas isotopic ratios of samples (Figure 2.3).

Chapter Two: Methods
52

Chapter Two: Methods
53
Figure 2.3. Plots of the variance in signal measured for the internal overnight
standards for a) He, b) Ne and c) Ar against the standard number illustrating the
stability of both the Helix SFT™ and Argus VI™ mass spectrometers over a 2 week
period. Solid lines represent the mean for each element and dashed lines denote the 1σ
error bounds. Samples normalised to the internal standards propagate the error
through to the final uncertainty despite errors falling below 0.3%. Red circles denote
anomalous readings which were not taken into account for the mean and error. The
red circles for helium and neon were caused by a heater error on the cryotrap and the
red circle on the argon was potentially caused by a high argon background after a long
sample run.
Full line air standards are standards which are run in exactly the same way as
a sample and originate from the air standard bottle on the Proc Line which was
collected in University Parks, Oxford, UK on November 24, 2014. The standard
cylinder contains air at a known temperature, humidity and pressure of 4°C, 95% and
1027 mbar respectively. The concentrations of the noble gas isotopes in the air
standard were calculated from typical atmospheric partial pressures (Ozima and
Podosek, 2001; Ballentine and Burnard, 2002).
2.7. Sample loading and preparation
The first part of the process involves attaching the clamped copper tube
containing the sample gas to the inlet port (O2) of the Proc Line (Figure 2.2). Before
this, valves O1, O2, O3, O4 and O5 should be closed. Once the sample is
successfully attached O2 can be opened and also O3 (to the rotary pump) which will
start roughing the line. The line should reach around 1 x 10⁻³
mbar once vacuum is
achieved. Once vacuum is reached, close O3, O7 (to the Ti-furnace), O11 and O12 to
the getter valves and the C1 valve to the cryoline. Valves O4 and O5 are then opened
to the turbomolecular pump and the system is left to pump down to background
pressure overnight (10-8
mbar). Before the system is left for the night, the sample
inlet and roughing line are helium leak tested using the Hiden™ software.

Chapter Two: Methods
54
The next morning, once it has been ascertained that the pressure is at normal
background levels (10-8
mbar), the line is again helium leak tested before sample
release.
Once valves O1, O3, O4 and O5 are closed, the sample can be released into
the line by opening and removing the clamp and then clamping a v-notched copper
tube opener (collar) around the previously clamped section of tube. When the collar
is tightened it squeezes the clamped section open enabling gas to flow into the
sample inlet manifold.
Once in the sample inlet manifold the sample can then be isolated between
three calibrated sections of the Proc Line: 1) Section O1 to O4 designated the
‘manifold volume’ (78.5 cm3 ± 0.12%), 2) Section O4 to O5 designated the ‘pipette
volume’ (1.4 cm3 ± 2.06%) and 3) Section O5 to O8 designated the ‘calibrated
volume’ (previously calibrated by CJ Balletine and Z Zhang as 69.7 cm3 ± 0.5%).
Between the introduction of gas to each part of the line the sample is given 30
seconds to equilibrate.
For known high helium samples (8.0 x 10⁻³
cm3STP(
4He)/cm
3 ≤) the pipette
volume was isolated from the manifold volume and then introduced into the
calibrated volume. Once the correct volumes for samples are established the gas
sample can either be reduced to a lower pressure using the O6 and O8 valves or more
pressure can be generated by adding pipette amounts of gas from the manifold
volume. The safest course of action for an unknown sample, however, is to start off
with a pipette volume of the sample.
Once the sample is isolated between valves O4 and O7 and its final pressure
has been recorded it can then be introduced to the first stage of the cleanup process; a
Ti-sponge furnace (by opening valve O7) heated to 950°C for 15 mins. The furnace

Chapter Two: Methods
55
is then removed and the Ti-sponge cooled to room temperature for 20 mins to
remove excess hydrogen from the sample which could interfere with the 3He peak.
While the sample is being cleaned by the Ti-sponge valves O11 and O12 to the
getter block are reopened to prepare for the next stage of cleanup. Valve Q1, the inlet
to the QUAD pipette, is also opened during this time.
The line is then isolated from the turbomolecular pump by closing valve O9
before the sample is exposed to the getter block for 15 mins. The two Proc Line
getters outlined in Section 2.3.1 operate in the same manner as the Ti-sponge furnace
to remove any leftover reactive gases from the sample.
After this stage the sample is then introduced to the first trap in the Cryo Line
by opening valve C1 for 15 mins. After 15 mins, valve Q1 is closed, isolating the
QUAD pipette of the cleaned sample to be equilibrated with the Hiden™ QUAD
mass spectrometer as a first look at the isotopic abundances. This ensures the
separated noble gases can be reduced to levels safe for the mass spectrometers to
measure.
By opening valve C2 the rest of the gas sample is equilibrated with the
second cryogenic trap which adsorbs Ar, Kr and Xe over 15 mins. After this time the
sample is manually introduced to the final trap which adsorbs Ne leaving only He as
a free gas phase in the line. From this point onwards the system is mostly automated.
2.7.1 Helium measurements
Helium measurements are conducted on the Helix SFT™ mass spectrometer.
Dependent on the results of the Hiden™ isotopic scan, it can be established whether
helium is within safe limits for the machine by directly comparing a sample as it

Chapter Two: Methods
56
appears in the mass spectrometer (fA) to as it appears in the Hiden™. By using this
method as a first approximation it becomes apparent when helium levels are too high
for the Helix SFT™ to measure safely (over 50,000 fA). For most high helium
samples (8.0 x 10⁻³
cm3STP(
4He)/cm
3 ≤) another split is required before the sample
can enter the mass spectrometer.
There are three ways to further reduce sample volume if it becomes apparent
that certain isotopes (either 4He or
40Ar in high helium samples) are too high for
either mass spectrometer to run safely. In the Prep Line these are known as: 1) an
aux split: splitting the gas by expanding and isolating a portion in the auxillary
volume on the prep line before re-expanding the gas to the manifold from the
auxillary volume multiple times, 2) manifold split: expanding the gas into the
manifold volume before isolating the gas in just the manifold volume, or 3) pipette
split: expanding the gas into the pipette volume before isolating it, pumping out the
main manifold, and then re-expanding the pipette volume into the manifold volume.
The method used for all high helium samples was the more extreme pipette split
which was determined to be the equivalent of 2161±13 times less than the Prep Line
manifold volume and is taken into account when propagating the uncertainty on
sample concentrations.
Once the correct split has been conducted, helium is introduced into the Helix
SFT where 4He and
3He are measured simultaneously on the Faraday cup and CDD
respectively. Simultaneously, the system up to C3 (which is closed) is pumped out
by another turbomolecular pump, clearing the line of excess helium in preparation
for the release of Ne from the 31K charcoal trap. After the sample has finished
running the Helix SFT is manually pumped out.

Chapter Two: Methods
57
2.7.2 Neon measurements
The automated prep bench system can control both mass spectrometers
simultaneously, enabling Ne to be released while the Helix SFT™ is still measuring
helium isotopes. The charcoal finger behind valve C4 is heated to 90K and is left to
equilibrate for 15 mins. This releases all neon into a free gas phase in the line. The
gas is then split accordingly and released into the Argus VI™ mass spectrometer.
After 30 seconds to equilibrate the mass spectrometer is isolated during the
measurement. The Argus VI™ measures 20
Ne and 22
Ne on two Faraday cups (H2
and AX) and 21
Ne on the CDD. The peaks for 40
Ar++ and 44
CO2++ are also
measured to determine interference to 20
Ne and 22
Ne respectively. During the
measurement of neon isotopes the line is pumped back to the C3 valve to clear the
line of excess gases and after the measurement the mass spectrometer is
automatically pumped out.
2.7.3 Argon, krypton and xenon measurements
The heavy noble gases are released by a stepwise process of heating and
cooling on the 24K stainless steel trap. Argon is the first to be released by setting the
temperature of the trap to 60K for 15 mins before splitting the free gas phase and
inletting into the Argus VI™. The Argus measures 40
Ar on the H1 Faraday cup and
38Ar and
36Ar on the CDD by peak jumping. During this time the stainless steel trap
(second stage trap) is then subjected to three cycles of heating, cooling and then
pumping. The trap is heated to a maximum of 375K and then back down to 60K for
each temperature cycle. This trap temperature cycling releases most of the residual

Chapter Two: Methods
58
Ar in the Cryo Line so that there is minimal interference/suppression to the krypton
and xenon results.
The last stage of the process is the simultaneous release of krypton and
xenon. This is achieved by heating the stainless steel trap to 200K for 15 mins which
releases both elements into a free gas phase. The Argus VI™ has the capacity to
simultaneously analyse both krypton and xenon by peak jumping between the two
elements. Following the measurement the traps are raised to their maximum
temperature of 375K to release any residual sample and then both the Prep Line and
Proc Line systems are pumped out to their respective turbomolecular pumps. A
complete analysis of all noble gases including preparing the system takes
approximately 6 hours meaning that a maximum of 3 sample measurements could be
2.8. Data reduction and error propagation
2.8.1. Data reduction
Both the Helix SFT™ and Argus VI™ have the ability to automatically peak
centre once an isotopic peak has been identified within a set scan region. The Helix
SFT™ in the Oxford Noble lab is set to manually peak centre. This is achieved by
manually setting a scan range before inletting the sample or standard. The peak
centre can then be read off the graph and manually input into the system.
Once the peak centre has been identified the mass spectrometer determines
the signal intensity of the same point in the scan 30 times (Argus VI™) or 100 times
(Helix SFT™) to generate an exponential decay curve as a function of time for each

Chapter Two: Methods
59
isotope. A regression algorithm to the data gives both the initial signal intensity and
the uncertainty on that measurement.
Two types of error must be taken into account during the data reduction
phase: 1) internal error such as the precision to which the signal regression to t = 0
can be measured by the mass spectrometers and 2) external error or reproducibility
such as the variance in the isotope signals during the overnight internal standards
(Figure 2.3).
Due to the stability of both systems the errors for machine measurement are
consistently below 0.3% across all Faraday cups however errors on the CDDs tend to
be higher due to dependence on the counting statistic. Procedural blanks run after a
sample in the same way indicate that blank levels are below 1% of total major
isotope concentrations. This indicates that despite the high levels of 4He and
40Ar in
high helium samples the system pump down time is sufficient if running 2 samples a
day.
Corrections for doubly-charged 40
Ar++ were applied to 20
Ne data following
the methods of Niedermann et al., (1993) however it was not necessary to apply
CO2++ corrections to 22
Ne concentrations because CO2 backgrounds were observed
to be at the detection limit therefore rendering them insignificant.
2.8.1.1. Concentration calculations
Noble gas measurements are compared against a procedural air standard run
in exactly the same way as the sample in order to ascertain the isotope
concentrations. The partial pressures of noble gases are potentially subject to
changes in instrument sensitivity over time. The sensitivity of the system is checked

Chapter Two: Methods
60
daily by running internal standards over night. Procedural standards are run with
procedural blanks before each set of sample runs. These give a view of overall
changes to the full system.
In order to construct an equation which will enable us to discern the
concentration of a sample we need three primary assumptions: 1) the intensity of the
extrapolated measurement (fA) registered on the mass spectrometer is directly
proportional to the number of moles of an isotope in a sample i.e.: the linearity of the
system which was most likely determined at the beginning of system setup, 2) that
all noble gases conform to the laws governing an ideal gas and 3) that machine
stability is high thereby making any sensitivity correction by the internal standards
minimal (Figure 2.3).
From these assumptions we can derive a sensitivity correction (k) for
concentrations:
k =
(1)
where Ipp is the intensity (fA) of an internal standard run on the same day as the
procedural standard and Isp is the intensity (fA) of an internal standard run on the
same day as the sample. Due to the stability of the system, internal standards are less
than 1% different from each other, showing that machine sensitivity is in this case
negligible as a source of error.
From this we can derive:
(2)

Chapter Two: Methods
61
where I is the intensity of the mass spectrometer measurement (fA), k is the
correction for the sensitivity of the machine and n is the number of moles of a
specific isotope.
Using the third assumption of an ideal gas:
pVCi = nRT (3)
where p is pressure (Pa), V is volume (cm3), Ci is concentration of isotope, R is the
Universal Gas Constant (8.31 JK-1
mol-1
) and T is temperature (K). In order to
compare a proc standard to a sample:
(4)
where terms (1) relate to the sample and terms (2) relate to the procedural standard.
Terms R and T cancel each other out since similar isotopes are being compared (R)
and the Noble Lab is held at a constant temperature of 18°C.
By expanding equation (2) and assuming that variation in k is negligible:
(5)
From Equation (5), C1 can be derived and applied to raw data to determine sample
concentrations:

Chapter Two: Methods
62
C1 =
[cm
3 STP] (6)
2.8.2 Error propagation
All experimentally derived values are subject to a degree of uncertainty. In
order to calculate the error on a measurement all uncertainties must be accounted for
and either discarded as negligible or propagated accordingly for both noble gas
concentrations and ratios. This is achieved by determining the error on each part of
the process and then either applying the rules for the addition/subtraction of
measured quantities or the rules for multiplication/division of measured quantities.
An example of the rules behind addition/subtraction can be given by blank
correcting a sample.
In the simplest terms:
I1 – IB = IC (7)
where IB is the intensity (fA) of the background blank and IC is the intensity (fA) of
the corrected sample.
In order to propagate the error:
ICerr =
(8)

Chapter Two: Methods
63
Where ICerr is the error on IC, IBerr is the error associated with the background blank
and I1err is the error associated with the raw measurement for the sample.
This is used along with the rules for multiplying/dividing which can be
illustrated by the last stage of data reduction: normalising the sample to an air
standard to ascertain concentration. For this we use equation 6 to form the error
propagation equation:
(9)
where all terms using xerr are the propagated errors associated with the particular
components. Both equation 8 and equation 9 are used to propagate errors from the
raw dataset to isotopic concentrations and ratios.
2.8.2.1. Worked error example for isotopic ratios
This section outlines how to propagate errors for the 3He/
4He ratio (Ra) of the
Poverty Hill #1 sample from the Kansas Basin dataset in Chapter 3 (Figure 2.4).
Standard ID Date 4He 3He SE 4He SE 3He
Proc Blank #18 15-02-15 11:26 13.81096 N/A 0.002671 N/A
Proc Air #29 15-02-15 16:59 601.7589 0.014102 0.041232 0.000192
Poverty Hill #1 Sample #5819-02-15 12:26 38,406.99 0.075381 5.835369 0.00042

Chapter Two: Methods
64
Figure 2.4.: Table displaying raw signal data (fA) for the Poverty Hill #1 sample
and the blank and procedural standard associated with it.
1) Blank correct both the raw standard and sample data (if needed). For all data
in this thesis blank concentrations were less than 1% of sample
concentrations. Errors from this step can be calculated by summing in
quadrature:
√(5.84)2
+ (0.0027)2 = 5.84
From the above equation it can be calculated that the blank error contribution
is only 0.02% of the total sample intensity and for the procedural air standard
the blank is 0.01% of the total intensity.
2) To calculate the error on the 3He/
4He ratio once again sum the errors in
quadrature:
(√(5.84/38407)2+(0.00042/0.075)
2) x 1.9627 x 10
-6 = 1.094 x 10
-8
The error is now 0.56% of the total sample intensity and 1.36% of the total
air standard intensity which is due to the counting error on 3He.
3) The final step is calculating the error on the sample Ra ratio which
incorporates errors associated with the 4He internal standards and utilises
Equation 9:
(√(1.09 x 10⁻⁸
/1.96 x 10-6
)2+(1.42 x 10
-7/2.17 x 10
-5)2+(1.45 x 10
-7/2.44 x 10
-5)2) x
0.085 = 8.92 x 10⁻⁴

Chapter Two: Methods
65
At this stage the propagated error makes up 1.05% of the total sample ratio.
2.8.2.2. Propagating errors for isotopic abundance
This section outlines how to propagate the errors for the 4He concentration of
the Poverty Hill #1 gas sample. Error propagation for 4He concentration follows
directly on from the error propagation carried out for blank correction. The errors
associated with the blank corrected sample and the standard are summed in
quadrature in a similar fashion to step 3 of the previous section along with errors for:
volume, pressure, correcting for the prep pipette split relative to the prep manifold
volume, the average of the internal standards and the concentration of 4He in the
atmosphere at standard pressures and temperatures. Ultimately the propagated error
makes up 1.36% of the total sample concentration.

Chapter Three: Economic Helium Reservoirs in the Mid-Continent United States
66
Chapter Three: Economic
Helium Reservoirs in the
Mid-Continent United
States

Chapter Three: Economic Helium Reservoirs in the Mid-Continent United States
67
3.1. Introduction
Most of the helium-rich natural gas reservoirs discovered to date are in the
United States. From the first discovery of helium-rich natural gas in Dexter, Kansas
in 1903 (1.84% of total gas composition) to the finding of the highest concentrations
of commercial helium in 1950 at Pinta Dome, Arizona (<10% of total gas
composition) the USA has been the world’s largest producer, consumer and exporter
of helium gas. Commercial helium reservoirs are usually classified as those
containing over 0.3% helium by volume of gas. The USA contains over 100
identified high helium fields however 97% of its helium output is produced by two
fields: Riley Ridge (Wyoming) and the Hugoton-Panhandle giant gas field
(Oklahoma, Kansas and Texas) (Figure 3.1.). Enriched helium gas from the
Hugoton-Panhandle is also stored in the Cliffside Federal Reserve located in Bush
Dome. Together these fields constitute an estimated reserve of 20.6 x 10⁹ m
3 (USGS,
2017).

Chapter Three: Economic Helium Reservoirs in the Mid-Continent United States
68
Figure 3.1.: Map of the United States showing identified helium-rich wells since 1970
(from American Physical Society et al., 2016).
With the now large scale production of liquified natural gas (LNG) in Qatar
and Algeria, and the large gas volumes involved, the economic concentration
threshold for helium in natural gas has been lowered in these locations. The helium
reserve associated with Qatar’s South Pars Field (the world’s largest gas field) is
estimated to be 10.1 x 10⁹ m
3 despite helium concentrations in the field of around
0.04% (USGS, 2017).
The helium in these natural gas reservoirs consists of the more ubiquitous
4He isotope which is generated by the alpha decay of uranium and thorium in the
Earth’s crust. Both stable isotopes of helium (4He and
3He) can also be sourced from
the mantle and, in the case of seeps and contaminated samples, from the atmosphere
(Ozima and Podosek, 2001; Ballentine and Burnard, 2002).

Chapter Three: Economic Helium Reservoirs in the Mid-Continent United States
69
The determination of where economic quantities of helium has originated and
how it has migrated into gas traps can be determined by using other noble gases as
tracers (Ne, Ar, Kr and Xe) alongside major stable isotope systems such as those
associated with N2, CO2 and C.
Producing helium fields fall into three categories: N2-rich, CH4-rich or CO2-
rich. N2-rich fields often contain negligible amounts of CH4 and CO2 however
significant concentrations of N2 are always found in CH4 and CO2-rich systems. This
is hypothetically due to N2 acting as a carrier gas for helium to enable advection
from the deep crust into shallow regions (Etiope and Lombardi, 1996; Etiope and
Martinelli, 2002; Ballentine and Burnard, 2002; Fu et al., 2005; Fu et al., 2008;
Walia et al., 2009; Hong et al., 2010).
The most detailed geochemical study on a CH4-rich helium system was
conducted on the Hugoton-Panhandle giant gas field. This is particularly significant
since the Hugoton-Panhandle is a major producer of the USA’s helium. From this
previous study a correlation was found between N2 (concentrations and isotopes)
derived from the crystalline basement and crustal 4He with atmospherically sourced
20Ne derived from groundwater. Since both N2 and
4He came from the same source
and isotopic ratios indicated mixing of the gases before interaction with groundwater
it was determined that they were released together during low grade metamorphism.
Once in the shallow crust the two gases dissolved and were accumulated into
overlying laterally flowing west-east groundwater. Later this groundwater may have
contacted a discrete gas phase, in this case CH4, in pre-existing traps, at which point
the dissolved 4He and N2 were released and partitioned into the methane (Ballentine
and Sherwood-Lollar, 2002).

Chapter Three: Economic Helium Reservoirs in the Mid-Continent United States
70
Results from the previous study allow us to ask new questions: what tectonic
processes are responsible for the release of helium? Do high helium fields show local
or regional trends? What are the directions and length scales associated with regional
groundwater flow? What role does stratigraphy play in the occurrence of helium-rich
fields? When and from where were hydrocarbons introduced into reservoirs and
what degree of control does this timing have over helium accumulations? Is there
evidence for the interaction of multiple sources of helium into the system? This
chapter endeavours to address at least a few of these questions.
3.2. The geology of South-West Kansas and the Hugoton-Panhandle system
The Kansas Basin lies to the east of the Hugoton-Panhandle giant gas field in
the region known as the Hugoton Embayment of the Anadarko Basin. Individual
fields within the basin range from single wells to the 47.9 km2 Hanston-Oppy Field
which has over 100 wells.
The Kansas Basin can be divided into the Hugoton Embayment and the
Dodge City Embayment (McClellan, 1930; Maher and Collins, 1949; Jewett, 1951;
Huffman, 1959). Both are considered to be the northward extension of the Anadarko
Basin into western Kansas (Merriam, 1963). The basin is approximately 74,074 km2
and plunges south into the 150,219 km2 Anadarko Basin where sediments thicken to
around 9500 ft. The Anadarko Basin is of Palaeozoic origin with initial formation in
the Cambrian as an extension of the southern Oklahoma aulacogen (Ballentine and
Sherwood-Lollar, 2002; Bowen and Weimer, 2003).
The Central Kansas Uplift, the north-eastern confining structure of the
Kansas Basin, is thought to be south-eastward trending offshoot of the Precambrian-
Chapter Three: Economic Helium Reservoirs in the Mid-Continent United States
71
age Transcontinental Arch (Koester, 1935; Rascoe Jr, 1962; Merriam, 1963; Rascoe
Jr and Adler, 1983; Lam and Yarger, 1989).
The Kansas Basin is structurally confined on three sides: to the west by the
Sierra Grande Uplift and Las Animas arch of Colorado, to the east by the Central
Kansas Uplift (~14,763 km2), Pratt Anticline and Cambridge Arch and to the south
by the Amarillo-Wichita Uplift in Texas and Oklahoma (Merriam, 1963; Adler et al.,
1971; Rascoe Jr and Adler, 1983). To the north the basin pinches out against the
Central Kansas Uplift and Las Animas Arch (Figure 3.1).

Chapter Three: Economic Helium Reservoirs in the Mid-Continent United States
72
Figure 3.2.: a) Locations of the Kansas Basin study area, Hugoton-Panhandle and
Central Kansas Uplift (CKU) in relation to other geological features. Contains features
from Ballentine and Sherwood-Lollar, (2002) and Merriam (1963). b) The cross section
of A-A’ from the Keyes Dome in the Hugoton field to the Kautz #1 well on the Central
Kansas Uplift including the positioning of several sample wells along the cross section.
Wells #1 Blew and #1 O Slash which have dashed lines are projected from their
positioning further south of the cross section line. Strata displayed show formation tops
for all except the Stone Corral member.

Chapter Three: Economic Helium Reservoirs in the Mid-Continent United States
73
The Kansas Basin lies on the southern-most part of the stable North
American cratonic complex (Merriam, 1963). The 1.8-1.1 Ga Yavapai-Mazatzal
Precambrian basement complex beneath Kansas is an extension of the Archean-aged
stable continental craton formed from younger accretionary terranes (Hamilton and
Kroner, 1981; Condie, 1982; Bowring and Karlstrom, 1990; Shaw and Karlstrom,
1999; Magnani et al., 2004). Subduction of arc terranes during this period led to the
younger Precambrian basement beneath Kansas becoming a mixture of rhyolite,
metasediments and granite (Landes, 1927). These basement blocks are highly
fractured and faulted (Gerhard, 2004; Merriam, 2010).
The basement beneath Kansas can be split into a roughly north-south divide.
The north consists of a ~1.63 Ga terrane of sheared igneous and metamorphic rocks
whereas the south consists of a younger (1.48-1.34 Ga) terrane which is mainly
unmetamorphosed rhyolitic to dacitic volcanics, and associated epizonal plutons
which is similar to the basement underlying Oklahoma and the Texas Panhandle.
The northern terrane is similar in rock type and age to exposed Precambrian
rocks from the Front Range in Colorado. The sheared granites within the terrane
record chlorite and epidote and no medium or high metamorphic indicators.
Alongside these are younger, unmetamorphosed granites similar to those
encountered in the south of the region which have been dated to 1.48-1.34 Ga.
Metamorphic rocks within the terrane are mainly quartzite or schist
indicating a metasedimentary origin. Within the Stevens and Scott counties, which
are part of the Kansas Hugoton gas field, zircon U–Pb ages vary between 1.37-1.38
Ga from basement granites. In the southern terrane no rocks older than 1.2 Ga are
present (Bickford et al., 1981).

Chapter Three: Economic Helium Reservoirs in the Mid-Continent United States
74
The south-west of Kansas was subject to two major episodes of cratonic
epeirogeny the first occurring at the end of the Devonian which uplifted an existing
active Precambrian structure to create the Central Kansas Arch; the precursor to the
Central Kansas Uplift. The arch separated the North Kansas Basin from the
Southwest Kansas Basin (ancestral Hugoton Embayment). This marked the start of
an extended period of uplift for the Central Kansas Arch and downwarping for the
Southwest Kansas Basin (Figure 3.3a).
The Amarillo-Wichita uplift in Texas began around the Mid-Devonian and
ended in the late Morrowan (early Pennsylvanian) by which time the uplift had been
block faulted into a mountain chain. The Anadarko and Palo Duro Basins in
Oklahoma and Texas were separated in the Mississippian during the uplift of the
Amarillo-Wichita mountains (Eddleman, 1961). After the Amarillo-Wichita uplift
the Anadarko Basin continued to subside and take on an asymmetric look as it was
infilled by sediments.
During the Pennsylvanian many of the geological structures still present in
the modern day developed due to a second stage of epeirogeny such as the Hugoton
Embayment, the Central Kansas Uplift and the Pratt Anticline (Koester, 1935;
Merriam, 1963) (Figure 3.3b). At this time the Central Kansas Uplift was elevated
and folded along a northeast-southwest trend. The Keyes Dome in the extreme
south-west of the Hugoton field actively uplifted from the end of the Mississippian
to the end of the Pennsylvanian restricting input into the Hugoton from the southwest
(Merriam, 1963).
In the Permian uplift on the Central Kansas Uplift ceased around the
Hutchinson and it tilted to the SE. Downwarping of the Hugoton Embayment also

Chapter Three: Economic Helium Reservoirs in the Mid-Continent United States
75
stopped around the same time. At the end of the Wolfcampian the Anadarko Basin
became landlocked thereby ending significant sedimentation.

Chapter Three: Economic Helium Reservoirs in the Mid-Continent United States
76

Chapter Three: Economic Helium Reservoirs in the Mid-Continent United States
77
Figure 3.3.: The structural development of the geological features of Kansas over time
(modified from Merriam, 1963): a) pre-Mississippian post-Devonian; b) pre-
Desmoinesian post-Mississippian and; c) Mesozoic. The red box denotes the area of
interest for the study.
During the Tertiary, the area between eastern Colorado and western Kansas
tilted eastwards forming a homocline which affected only the post-Palaeozoic layers.
This is thought to have been influenced by the uplift of the Las Animas Arch on the
Colorado-Kansas border during the late Cretaceous to Eocene (Jewett and Merriam,
1959; Merriam, 1963; Rascoe Jr, 1978; Bowen and Weimer, 2003; Merriam, 2010).
Economic helium deposits in the Kansas region have been found in
Palaeozoic strata (in dolomite, limestone and sandstone) from the Permian Chase
Group down to the Ordovician Arbuckle Group (Figure 3.4). In the sampled fields
from the south-west, gas production zones come from two geological layers: the
Permian and the Carboniferous (Pennsylvanian/Mississippian) (Appendix A).
Helium-rich gas appears to be concentrated in specific layers in the
subsurface. Layers inbetween these may also contain helium except at sub-economic
concentrations.

Chapter Three: Economic Helium Reservoirs in the Mid-Continent United States
78
Figure 3.4.: General stratigraphy of Kansas in relation to known helium reservoirs
(modified from Newell et al., 1987).

Chapter Three: Economic Helium Reservoirs in the Mid-Continent United States
79
Throughout the Hugoton Embayment, helium accumulations are associated
with high concentrations of N2. As with the Hugoton-Panhandle, the hydrocarbons
associated with these localised fields are thought to have been generated in the
Anadarko Basin to the south as early as 350 Ma; with maximum temperatures
reached in the Pennsylvanian (Schmoker, 1989).
Figure 3.5: Map of Kansas showing approximate migration pathways for oils
generated in the Ouachita and Anadarko basins, and local generation in the Forest
City basin (modified from Gerhard, 2004). There is a migration shadow in the Salina
basin where faults defining the Central Kansas Uplift and Nemaha Ridge acted as
barriers to flow into the basin and instead channelled oils north-westward and north-
eastward. ‘Ordo’ (Ordovician) and ‘Dev’ (Devonian) denote the primary contributing
migratory oil source. Red boxes denote study areas from this study (Kansas Basin and
Central Kansas Uplift).
The idea of the long distance migration of hydrocarbons in this region was
postulated by Rich (1931) and Walters (1958) for the origin of oils in the Central
Kansas Uplift and Burruss and Hatch (1989) for the source of oils in the Cambridge
Arch due to the similarities between the chemistry of the oils found in these regions

Chapter Three: Economic Helium Reservoirs in the Mid-Continent United States
80
and those sourced from the Anadarko Basin (Figure 3.5). This combined with
evidence of the thermal immaturity of Permian and Pennsylvanian rocks in the
province is indicative of the gas being emplaced by migration and differential
entrapment (Higley, 1995; Gerhard, 2004).
Nitrogen is always associated with economic concentrations of helium but
helium is not always associated with high nitrogen concentrations. This is due to the
multiple sources of N2 compared with helium such as atmospheric nitrogen, nitrogen
released from rocks during metamorphism and nitrogen generated by the high
temperature thermal maturation of hydrocarbons (Pierce et al., 1964; Poreda et al.,
1986; Gold and Held, 1987; Jenden et al., 1988a; Jenden and Kaplan, 1989; Stilwell,
1989; Hiyagon and Kennedy, 1992; Krooss et al., 1995; Littke et al., 1995;
Hutcheon, 1999; Ballentine and Burnard, 2002; Ballentine and Sherwood-Lollar,
2002).
In the Hugoton-Panhandle two types of N2 were found: N2 which was
associated with 4He was of metamorphosed metasedimentary origin and N2 which
was not associated with 4He was generated by the thermal cracking of hydrocarbons
in the Anadarko Basin (Ballentine and Sherwood-Lollar, 2002). It is postulated that
the N2 associated with 4He acts as a carrier gas enabling the advection of helium to
shallow layers via fault and fracture systems (Etiope and Lombardi, 1996; Etiope
and Martinelli, 2002; Ballentine and Burnard, 2002; Fu et al., 2005; Fu et al., 2008;
Walia et al., 2009; Hong et al., 2010).
Typically 4He/N2 ratios for a producing helium field fall into a narrow range
between 0.02 to 0.20 which the Hugoton-Panhandle exemplifies (0.020-0.049 across
the field and at most 0.077 in the Bush Dome; Pierce et al., 1964; Gold and Held,
1987; Jenden et al., 1988b; Ballentine and Sherwood-Lollar, 2002).

Chapter Three: Economic Helium Reservoirs in the Mid-Continent United States
81
Fields sampled in this study were from a modest area within the Kansas
Basin and Central Kansas Uplift and are compared with the larger Hugoton-
Panhandle system (~200 km2 compared to ~20,000 km
2) (Figure 3.6). Specifically
21 fields were sampled in three counties: Ford, Hodgeman and Ness. Samples from
the Central Kansas Uplift were taken from the Stafford and Barton counties (Table
3.1). Samples from this study are then combined with data taken from Ballentine and
Sherwood-Lollar, 2002 for the Kansas section of the Hugoton-Panhandle to
complete the dataset.
Figure 3.6.: BTU map of the Kansas Basin, Central Kansas Uplift and Hugoton field
showing sample positioning in relation to contours (Clyde Becker, pers comms, 2014).
Kansas Hugoton data (yellow diamonds) was taken from Ballentine and Sherwood-
Lollar, (2002).
We collected a total of 19 samples from the Kansas Basin and Central Kansas
Uplift to add to the suite of 30 samples from the Hugoton-Panhandle (split into
Kansas Hugoton, Guymon Hugoton and Texas Panhandle). Seventeen samples are

Chapter Three: Economic Helium Reservoirs in the Mid-Continent United States
82
from the Kansas Basin and these are split into two groups designated Kansas Basin
Permian (KBP) and Kansas Basin Cretaceous (KBC). Two samples are from the
Central Kansas Uplift (CKU) however since they show significant differences in
isotopic character will be referred to separately where appropriate (Table 3.2 and
3.3).

Chapter Three: Economic Helium Reservoirs in the Mid-Continent United States
83
Table 3.1.: Data regarding the fields sampled from in the Kansas Basin and Central Kansas Uplift (this study). Field names, areas and cumulative
gas production were taken from the Kansas Geological Society Oil and Gas database.
Field name Associated sample well County Producing reservoir Field area (km2)
Cumulative gas
production (m3)
Carson Bonnie Carson #1 Ford Morrow Sands 4.7 2.26 x 10⁶
Maverick Maverick #1 Ford Morrow Sands 0.6 6.89 x 10⁴
Blew (wildcat) #1 Blew Ford Morrow Sands N/A 1.49 x 10⁶
Lamb Lamb-Lance #1 Ford Mississippian 0.6 2.33 x 10⁷
Steel #1 O Slash-Hill Trust Ford Mississippian 3.8 2.97 x 10⁷
Barrick Barricklow Unit #1 Hodgeman Chase Group 3.0 7.57 x 10⁶
Wieland North Selfridge no.1-A Hodgeman Chase Group 24.4 4.95 x 10⁶
Wieland Wieland no.1-A Hodgeman Chase Group 0.6 7.52 x 10⁶
Hanston-Oppy Oppy-Burke no.1 Hodgeman Chase Group 64.6 7.34 x 10⁶
Groner Lewis Trust #1 Hodgeman Chase Group 24.4 2.18 x 10⁷
Saw Log Creek Southeast Strecker no.1 Hodgeman Chase Group 20.9 5.21 x 10⁶
Saw Log Creek Gleason #1 Hodgeman Chase Group 31.4 4.71 x 10⁶
Jetport Jetmore-Bradford no.1 Hodgeman Chase Group 0.6 5.91 x 10⁶
Stella B Benish no.1 Hodgeman Chase Group 0.6 8.62 x 10⁶
Don Poverty Hill no.1 Hodgeman Chase Group 31.4 2.51 x 10⁶
Neho Shank #1 Ness Chase Group 0.6 8.22 x 10⁶
Barricklow East McFadden no.1 Ness Chase Group 0.6 4.67 x 10⁶
Leesburgh McCune 1-A Stafford Chase Group 7.7 1.09 x 10⁷
Bahr Kautz #1 Barton Chase Group 1.2 2.19 x 10⁷

Chapter Three: Economic Helium Reservoirs in the Mid-Continent United States
84
3.3. Sample collection and analytical techniques
Samples were collected in the field directly from the wellhead by connecting
a high pressure regulator with a 3/4" NPT adaptor to the wellhead. The regulator was
then attached to a 70 cm length of internally polished, refrigeration grade copper
tubing with a diameter of 3/8” via a length of high pressure hose. Well gas was then
flushed through the collection apparatus at pressures around 1 bar (atmospheric) for
approximately 10 minutes so as to decrease the possibility of air contamination
before the copper tube was cold welded at both ends by closing a pair of stainless
steel clamps. This follows the same procedures as Ballentine and Sherwood-Lollar,
(2002), Zhou, (2004) and Gilfillan, (2006).
Splits of each sample were taken in the lab not only for the purpose of
determining noble gas isotopic composition and concentration but also for the
analysis of nitrogen concentration and isotopes by University of Toronto. Noble gas
analyses were carried out at the Noble Lab at University of Oxford.
Stable helium isotopes 3He and
4He were specifically measured on the Helix
SFT mass spectrometer which has a split flight tube. This gives it the ability to
simultaneously measure both isotopes thereby decreasing the error on the
measurement.
All stable isotopes of the other noble gases (Ne, Ar, Kr, Xe) were measured
on the Argus VI mass spectrometer. Ne and Ar were analysed individually by
stepwise heating of the cryotrap purification system while Kr and Xe were analysed
together by peak jumping (see Methods Chapter).
Before each sample run a blank and standard were run a day in advance using
the same procedure as a sample to check standard reproducibility and background

Chapter Three: Economic Helium Reservoirs in the Mid-Continent United States
85
levels of residual gas. These are used in conjunction with automated standards run
nightly which check system stability, mass spectrometer drift and daily changes in
system conditions to calculate sample concentrations. Due to the consistency of these
overnight standards they are used to ascertain the ratio of samples from the same
day.
All data errors are quoted at the 1σ level of confidence and include the
analytical, blank and standard errors. In the case of concentration errors the
expansion volume, pressure and relative prep volume errors are also included. All
error corrections on noble gas analyses were made during data reduction.
Due to the radiogenic nature of the majority of the samples, errors were 1.0%
to 4.3% for helium ratios however this does not affect sample reproducibility. Ratios
were the most affected in this respect due to the statistical counting error on the very
low 3He signal which at that early a stage in the laboratory setup was not yet
optimally adjusted.
During analyses mass peaks 40
Ar++
and 44
CO2++
which could cause major
interference to 20
Ne and 22
Ne signals respectively were monitored. Across all
samples it was determined that the 22
Ne signal of the sample was high enough that
the 44
CO2++
contribution was below 1% and therefore negligible. Corrections were
made accordingly to the 20
Ne signal of samples for 40
Ar++
interference during data
reduction which varied between 10.6% to 11.7% 40
Ar++
contribution following the
methods of Niedermann et al. (1993). Uncertainities in 40
Ar++
contribution were
propagated through to the final calculated error.
Nitrogen isotope analysis for CKU, KBP and KBC samples was undertaken
at University of Toronto using procedures detailed in Ballentine and Sherwood-
Lollar (2002) and Sherwood-Lollar et al., (1997). Individual errors on the δ15
N (‰)

Chapter Three: Economic Helium Reservoirs in the Mid-Continent United States
86
results range between ±0.01 to 0.90‰. For Ballentine and Sherwood-Lollar samples
δ15
N (‰) errors are all ±0.20‰.
3.4. Results
In all samples the 4
He/20
Ne ratio, which is an indicator of air contamination,
is >18,000 compared with 0.032 for air (Kipfer et al., 2002). This shows there is
negligible air-helium contribution to these samples indicating that any differences
between the predominantly crustal 3He/
4He ratios are due to discrete mantle
contributions.

Chapter Three: Economic Helium Reservoirs in the Mid-Continent United States
87
Sample well and
geological province
Location
Lat/Long
Producing
formation
3He/
4He
(Ra) 20
Ne/22
Ne 21
Ne/22
Ne 40
Ar/36
Ar 38
Ar/36
Ar
Central Kansas Uplift
Kautz #1 38°27'4.92"N,
98°57'17.45"W
Chase Group 0.11 (0.008) 9.32 (0.029) 0.053
(0.0006)
1410 (3) 0.189
(0.0005)
0.12 (0.003) 9.30 (0.029) 0.053
(0.0006)
1409 (3) 0.189
(0.0005)
McCune 1-A 37°53'27.09"N,
98°41'59.37"W
Chase Group 0.08 (0.002) 9.49 (0.033) 0.045
(0.0005)
592 (1) 0.187
(0.0005)
Kansas Basin
Carboniferous
Bonnie Carson #1 37°41'47.10"N,
99°51'36.38"W
Morrow Sands 0.09 (0.003) 9.18 (0.028) 0.058
(0.0006)
1718 (3) 0.183
(0.0006)
Maverick #1 37°41'16.43"N,
99°50'58.85"W
Morrow Sands 0.10 (0.001) 8.95 (0.028) 0.063
(0.0007)
2142 (5) 0.187
(0.0008)
#1 Blew 37°37'35.27"N,
99°48'38.53"W
Morrow Sands 0.09 (0.002) 9.13 (0.028) 0.055
(0.0006)
1642 (3) 0.185
(0.0006)
#1 O Slash-Hill Trust 37°38'31.47"N,
99°47'46.52"W
Mississippian 0.10 (0.001) 9.16 (0.028) 0.056
(0.0006)
1494 (4) 0.184
(0.0009)
Lamb Lance #1 37°37'44.59"N,
99°44'52.86"W
Mississippian 0.09 (0.003) 9.14 (0.028) 0.060
(0.0006)
1635 (4) 0.185
(0.0008)
Kansas Basin Permian
Barricklow Unit #1 38°15'13.98"N,
99°38'17.73"W
Chase Group 0.10 (0.001) 9.74 (0.030) 0.042
(0.0004)
588 (1) 0.189
(0.0005)
Shank no. 1 38°15'45.71"N,
99°41'48.81"W
Chase Group 0.09 (0.001) 9.71 (0.030) 0.040
(0.0004)
584 (1) 0.189
(0.0005)
McFadden no. 1 38°16'52.86"N,
99°42'56.11"W
Chase Group 0.13 (0.002) 9.74 (0.030) 0.041
(0.0004)
604 (1) 0.189
(0.0005)

Chapter Three: Economic Helium Reservoirs in the Mid-Continent United States
88
Selfridge no. 1-A 38°14'7.62"N,
99°45'21.74"W
Chase Group 0.13 (0.002) 9.75 (0.030) 0.042
(0.0004)
583 (1) 0.189
(0.0005)
Wieland no. 1-A 38°13'19.77"N,
99°44'39.21"W
Chase Group 0.11 (0.001) 9.74 (0.030) 0.042
(0.0004)
591 (2) 0.190 (0.001)
Oppy-Burke no. 1 38° 7'26.40"N,
99°46'37.57"W
Chase Group 0.07 (0.001) 9.73 (0.030) 0.044
(0.0005)
554 (2) 0.189 (0.001)
Lewis Trust #1 38° 5'2.84"N,
99°34'14.74"W
Chase Group 0.10 (0.002) 9.68 (0.030) 0.043
(0.0005)
555 (1) 0.186
(0.0007)
Strecker no. 1 37°59'4.10"N,
99°38'13.99"W
Chase Group 0.06 (0.002) 9.57 (0.030) 0.044
(0.0005)
555 (3) 0.195 (0.004)
0.06 (0.003) 9.56 (0.032) 0.045
(0.0005)
Gleason #1 37°59'14.11"N,
99°36'31.71"W
Chase Group 0.06 (0.001) 9.72 (0.030) 0.044
(0.0005)
537 (1) 0.189
(0.0006)
Jetmore-Bradford no. 1 37°58'15.58"N,
99°53'37.79"W
Chase Group 0.06 (0.002) 9.62 (0.030) 0.044
(0.0005)
525 (1) 0.187
(0.0007)
Benish no. 1 37°58'59.37"N,
99°57'47.65"W
Chase Group 0.06 (0.001) 9.75 (0.030) 0.044
(0.0005)
547 (2) 0.191 (0.001)
Poverty Hill no. 1 38°1'30.37"N,
99°55'13.08"W
Chase Group 0.08 (0.001) 9.81 (0.031) 0.043
(0.0004)
569 (1) 0.191
(0.0006)
*Kansas Hugoton
Ratzlaff D ‘A’ #1 38°2'12.2"N,
101°16'43.7"W
Chase Group 0.16 (0.005) 9.70 (0.050) 0.039
(0.0004)
818 (10) nr
Hefner Gas Unit #1 37°56'5.8"N,
101°23'18.9"W
Chase Group 0.16 (0.005) 9.74 (0.053) 0.039
(0.0005)
851 (11) nr
Guldner Unit #1 37°43'43.0"N,
101°39'46.9"W
Chase Group 0.14 (0.004) 9.73 (0.041) 0.040
(0.0005)
835 (16) nr
Guldner Unit #2 37°43'43.0"N,
101°39'46.9"W
Panoma 0.15 (0.004) 9.66 (0.025) 0.044
(0.0009)
889 (5) nr
Campbell, R.W. #2 37°35'0.8"N,
101°37'35.7"W
Chase Group nr

Chapter Three: Economic Helium Reservoirs in the Mid-Continent United States
89
Keller, Ernest #2 37°29'47.5"N,
101°16'49.3"W
Chase Group 0.20 (0.006) 9.66 (0.059) 0.041
(0.0005)
1066 (11) nr
Jarvis Unit #2 37°29'47.5"N,
101°17'54.9"W
Panoma 0.20 (0.006) 9.68 (0.061) 0.041
(0.0006)
1038 (20) nr
Ball, Clyde H. #2 37°28'3.1"N,
101°27'45.3"W
Panoma 9.61 (0.027) 0.051
(0.0011)
974 (47) nr
Wright “C” Unit #1 37°24'34.2"N,
101°31'2.1"W
Chase Group 0.18 (0.005) 9.69 (0.018) 0.039
(0.0008)
948 (6) nr
Baughman H-2 37°14'2.7"N,
100°50'22.7"W
Chase Group 9.69 (0.018) 0.040
(0.0008)
977 (10) nr
Crayton A-1 37°15'47.6"N,
101°36'3.5"W
Chase Group 0.19 (0.006) 9.70 (0.039) 0.040
(0.0006)
969 (25) nr
Mills C-1 37°6'10.6"N,
101°9'57.4"W
Chase Group 0.21 (0.006) 9.71 (0.030) 0.045
(0.0009)
1155 (29) nr
Parsley A-1 37°2'40.7"N,
101°6'41.6"W
Chase Group 0.21 (0.006) 9.80 (0.034) 0.040
(0.0005)
925 (12) nr
Oberly A-1 37°13'10.2"N,
102°1'4.4"W
Greenwood 0.19 (0.006) 9.73 (0.035) 0.039
(0.0005)
830 (13) nr
Tucker B-1 37°4'25.7"N,
101°44'45.6"W
Chase Group 0.19 (0.006) 9.80 (0.043) 0.041
(0.0007)
967 (18) nr
Barnes A-1 37°0'3.4"N, 101°49'6.6"W
Greenwood 9.68 (0.015) 0.041
(0.0008)
913 (18) nr
*Guymon Hugoton nr
Hill A-1 36°52'15.9"N,
101°42'44.0"W
Chase Group nr
Buzzard D-1 36°47'56.8"N,
101°44'7.9"W
Chase Group 0.19 (0.006) 9.81 (0.038) 0.039
(0.0006)
938 (26) nr
Stonebraker A-69 36°38'21.0"N,
101°45'12.5"W
Chase Group
0.21 (0.006) 9.91 (0.023) 0.038
(0.0003)
1113 (7) nr
*Texas Panhandle nr
Coffee Estate #1 36°3.365'N, 101°43.052'W Brown Dolomite 0.24 (0.007) 9.63 (0.025) 0.042
(0.0009)
1156 (7) nr

Chapter Three: Economic Helium Reservoirs in the Mid-Continent United States
90
Blake Trust Estate #2 36° 4.230'N, 101°
40.905'W
Brown Dolomite 0.25 (0.007) 9.77 (0.029) 0.040
(0.0004)
1105 (25) nr
Mary A Long #1 36° 18.131'N, 101°
45.307'W
Brown Dolomite 0.20 (0.006) 9.67 (0.039) 0.040
(0.0005)
1039 (17) nr
Donelson et al #1 36° 20.790'N, 101°
59.721'W
Brown Dolomite 0.21 (0.006) 9.83 (0.027) 0.037
(0.0003)
1076 (7) nr
Sarah Claybaugh #1 36° 22.496'N, 101°
59.681'W
Brown Dolomite 0.18 (0.005) 9.80 (0.046) 0.037
(0.0004)
865 (33) nr
Cameron Walls #1 36° 16.436'N, 101°
58.614'W
Brown Dolomite 9.66 (0.040) 0.040
(0.0005)
1112 (15) nr
Horner #1 36° 4.847'N, 102° 6.201'W Brown Dolomite 9.65 (0.025) 0.043
(0.0009)
1058 (14) nr
Whitherbee #2 36° 6.224'N, 101°
49.193'W
Brown Dolomite 0.21 (0.006) 9.69 (0.036) 0.040
(0.0005)
983 (11) nr
Flores 23 36° 2.738'N, 101°
48.120'W
Brown Dolomite 9.59 (0.025) 0.040
(0.0008)
1118 (12) nr
Nisbett #1 36° 0.146'N, 101°
52.410'W
Brown Dolomite 0.19 (0.006) 9.62 (0.032) 0.041
(0.0005)
1045 (9) nr
McDade #2 + #5 35° 54.124'N, 102°
2.606'W
Brown Dolomite 0.18 (0.005) nr
Brumley A #1 35° 57.554'N, 101°
55.098'W
Brown Dolomite
nr
Table 3.2.: Noble gas ratios from this study and from Ballentine and Sherwood-Lollar, 2002 for the Hugoton-Panhandle (starred sections). 1σ errors
for samples are shown in brackets. Nr in the table denotes the 38
Ar/36
Ar values were not recorded in Ballentine and Sherwood-Lollar, 2002.

Chapter Three: Economic Helium Reservoirs in the Mid-Continent United States
91
Sample well and
geological
province
4He concentration
(x 10-2
) (cm3 STP)
20Ne
concentration
(x 10-7
) (cm3
STP)
40Ar
concentration
(x 10-4
) (cm3
STP)
84Kr
concentration
(x 10-8
) (cm3
STP)
130Xe
concentration
(x 10-10
) (cm3
STP)
N2
concentration
(±5%) (cm3
STP)
δ15
N(N2)
(±0.2‰)
Central Kansas
Uplift
Kautz #1 2.12 (0.025) 1.78 (0.011) 56.6 (0.57) 1.21 (0.02) 0.31 (0.01) 0.373 2.45 (0.07)
2.13 (0.025) 1.77 (0.011) 57.0 (0.57)
McCune 1-A 0.86 (0.011)
1.71 (0.017) 2.16 (0.22) 1.25 (0.02) 0.99 (0.01) 0.237 3.45 (0.07)
Kansas Basin
Carboniferous
Bonnie Carson #1 1.22 (0.013) 2.75 (0.030) 9.67 (0.083) 1.49 (0.05) 3.10 (0.05) 0.198 3.80 (0.14)
Maverick #1 2.47 (0.025) 4.78 (0.051) 19.6 (0.16) 2.43 (0.07) 12.84 (0.12) 0.508 6.50 (0.42)
#1 Blew 1.31 (0.013) 4.31 (0.046) 14.0 (0.12) 2.32 (0.07) 4.42 (0.07) 0.339 1.85 (0.21)
#1 O Slash-Hill Trust 0.48 (0.007) 1.56 (0.017) 4.88 (0.042) 0.63 (0.19) 1.91 (0.03) 0.102
Lamb Lance #1 0.58 (0.006) 1.43 (0.015) 4.72 (0.041) 0.32 (0.10) 1.52 (0.01) 0.092 2.90 (0.07)
Kansas Basin
Permian
Barricklow Unit #1 1.22 (0.020) 2.93 (0.044) 4.66 (0.071) 1.84 (0.04) 1.27 (0.02) 0.369 4.03 (0.90)
Shank no. 1 1.15 (0.019) 3.04 (0.046) 3.49 (0.053) 1.86 (0.04) 1.28 (0.02) 0.387 4.70 (0.28)
McFadden no. 1 1.16 (0.019) 3.07 (0.047) 5.01 (0.076) 1.92 (0.04) 1.27 (0.02) 0.416 1.45 (0.07)
Selfridge no. 1-A 1.08 (0.018) 2.56 (0.039) 4.17 (0.063) 1.65 (0.03) 1.21 (0.02) 0.338 2.20 (0.35)
Wieland no. 1-A 1.15 (0.019) 2.63 (0.040) 4.00 (0.061) 1.70 (0.03) 1.19 (0.02) 0.341 3.10 (0.14)
Oppy-Burke no. 1 0.96 (0.016) 2.03 (0.031) 3.03 (0.046) 1.45 (0.03) 1.15 (0.02) 0.330 4.00 (0.14)
Lewis Trust #1 1.00 (0.010) 2.03 (0.028) 3.82 (0.034) 1.29 (0.01) 0.96 (0.02) 0.280
Strecker no. 1 0.87 (0.014) 1.82 (0.028) 2.75 (0.042) 1.35 (0.03) 1.08 (0.02) 0.220 3.45 (0.21)
0.87 (0.012) 1.77 (0.030)
Gleason #1 0.86 (0.014) 1.80 (0.027) 2.87 (0.044) 1.40 (0.03) 1.17 (0.02) 0.264 3.70 (0.14)

Chapter Three: Economic Helium Reservoirs in the Mid-Continent United States
92
Jetmore-Bradford no.
1
1.05 (0.011) 2.13 (0.028) 4.03 (0.035) 1.39 (0.01) 1.52 (0.03) 0.280 2.45 (0.21)
Benish no. 1 0.95 (0.016) 2.02 (0.031) 3.03 (0.046) 1.46 (0.03) 1.15 (0.02) 0.275 2.99 (0.01)
Poverty Hill no. 1 0.89 (0.015) 1.83 (0.028) 3.30 (0.050) 1.53 (0.03) 1.18 (0.02) 0.311 4.00 (0.14)
*Kansas Hugoton
Ratzlaff D ‘A’ #1 0.48 (0.024) 5.53 (0.28) Nm Nm 0.189 8.7
Hefner Gas Unit #1 0.40 (0.020) 1.08 (0.075) 5.12 (0.26) Nm Nm 0.181 7.8
Guldner Unit #1 0.50 (0.025) 1.56 (0.11) 5.75 (0.29) Nm Nm 0.207 9.4
Guldner Unit #2 0.43 (0.004) 1.41 (0.012) 5.10 (0.050) Nm Nm 0.203 9.0
Campbell, R.W. #2 0.40 (0.020) 4.42 (0.22) Nm Nm 0.154 8.0
Keller, Ernest #2 0.38 (0.019) 0.86 (0.060) 4.68 (0.23) Nm Nm 0.145 6.4
Jarvis Unit #2 0.39 (0.020) 1.07 (0.075) 4.27 (0.21) Nm Nm 0.148 6.5
Ball, Clyde H. #2 0.35 (0.004) 1.11 (0.011) 4.58 (0.26) Nm Nm 0.151
Wright “C” Unit #1 0.37 (0.004) 1.19 (0.012) 4.44 (0.050) Nm Nm 0.156 7.8
Baughman H-2 0.58 (0.006) 1.80 (0.018) 5.92 (0.090) Nm Nm 0.178 6.5
Crayton A-1 0.43 (0.021) 1.19 (0.083) 4.62 (0.23) Nm Nm 0.166 7.5
Mills C-1 0.38 (0.004) 1.03 (0.010) 4.46 (0.16) Nm Nm 0.127 5.3
Parsley A-1 0.57 (0.028) 1.23 (0.086) 4.19 (0.21) Nm Nm 0.152 6.7
Oberly A-1 0.49 (0.025) 1.61 (0.013) 4.46 (0.22) Nm Nm 0.208 7.1
Tucker B-1 0.39 (0.020) 0.99 (0.079) 5.38 (0.27) Nm Nm 0.147 7.1
Barnes A-1 0.41 (0.004) 1.57 (0.016) 4.21 (0.16) Nm Nm 0.203 8.5
*Guymon Hugoton
Hill A-1 0.40 (0.020) 5.23 (0.26) Nm Nm 0.146 5.7
Buzzard D-1 0.45 (0.023) 1.58 (0.11) 7.10 (0.36) Nm Nm 0.184 6.9
Stonebraker A-69 0.65 (0.032) 2.35 (0.16) 9.30 (0.47) Nm Nm 0.214 6.1
*Texas Panhandle
Coffee Estate #1 0.63 (0.006) 1.93 (0.019) 7.21 (0.080) Nm Nm 0.136 4.5
Blake Trust Estate #2 1.05 (0.052) 2.92 (0.21) 10.73 (0.54) Nm Nm 0.214 5.3
Mary A Long #1 0.76 (0.038) 1.98 (0.14) 7.66 (0.38) Nm Nm 0.165 4.9

Chapter Three: Economic Helium Reservoirs in the Mid-Continent United States
93
Donelson et al #1 0.98 (0.049) 5.03 (0.35) Nm Nm 0.258 4.9
Sarah Claybaugh #1 0.92 (0.046) 4.96 (0.35) Nm Nm 0.253 4.4
Cameron Walls #1 0.66 (0.033) 1.75 (0.12) 7.97 (0.49) Nm Nm 0.180 5.3
Horner #1 0.92 (0.009) 3.69 (0.031) 10.99 (0.24) Nm Nm 0.220 5.0
Whitherbee #2 0.35 (0.018) 0.82 (0.057) 7.10 (0.35) Nm Nm 0.080 3.6
Flores 23 0.61 (0.006) 1.75 (0.018) 6.97 (0.12) Nm Nm 0.135 4.0
Nisbett #1 0.55 (0.027) 1.52 (0.11) 5.86 (0.29) Nm Nm 0.141 3.4
McDade #2 + #5 0.29 (0.015) 2.73 (0.14) Nm Nm 0.066 2.7
Brumley A #1 0.33 (0.017) Nm Nm 0.089
2.7
Table 3.3.: Noble gas concentrations from this study and the Ballentine and Sherwood-Lollar, 2002 study on the Hugoton-Panhandle (starred
sections). Nitrogen concentrations for CKU, KBP and KBC samples are taken from the KGS database and are deemed to be within acceptable limits
due to 4He concentrations from this study being within 1σ error of previously recorded helium concentrations from wells. 1σ errors for samples
appear in column headers as % or in brackets if variable.

Chapter Three: Economic Helium Reservoirs in the Mid-Continent United States
94
3.4.1. Noble Gases
3.4.1.1. Helium
The 3He/
4He ratio (Ra) varies noticeably between the Kansas Hugoton and
the Kansas Basin and CKU regions. Across the Hugoton-Panhandle 3He/
4He ratios
vary between 0.14 to 0.25 Ra. Across both the Kansas Basin and CKU, 3He/
4He
ratios range from 0.06 to 0.13 Ra. Within the Kansas Basin subgroups the KBC has a
very narrow range of ratios from 0.09 to 0.10 Ra whereas the KBP has a wider range
from 0.06 to 0.13 Ra.
There also appear to be opposing spatial trends to the KBP and Hugoton-
Panhandle samples. The Hugoton-Panhandle samples have the highest 3He/
4He
ratios to the south whereas the highest KBP 3He/
4He ratios are towards the north.
Concentrations of 4He are high throughout the Kansas Basin and CKU
sample set and range from 4.8 x 10⁻³
to 2.47 x 10⁻²
cm3STP(
4He)/cm
3 whereas the
Hugoton-Panhandle concentrations lie within a narrower range of 3.5 x 10⁻³
to 1.05 x
10-2
cm3STP(
4He)/cm
3 indicating that helium gas across the field is relatively well
mixed.
Within the Kansas Basin region it can be seen that the subsets KBC and KBP
have overlapping concentrations and ratios with KBC having a greater range of
concentrations to KBP (4.8 x 10⁻³
to 2.47 x 10⁻²
cm3STP(
4He)/cm
3 compared to 8.6 x
10-3
to 1.22 x 10⁻²
cm3STP(
4He)/cm
3). Across all samples there is no obvious spatial
trend to the helium concentrations or any relationship to depth.
Due to the high concentrations of 4He in all well gases, magmatic
3He
concentrations across the Kansas Basin (KBC and KBP) and CKU range between

Chapter Three: Economic Helium Reservoirs in the Mid-Continent United States
95
5.81 x 10⁻¹⁰
and 3.13 x 10⁻⁹
cm3STP(
3He)/cm
3 which directly compare to values
calculated for the complete Hugoton-Panhandle dataset of 6.8 x 10⁻¹⁰
to 3.3 x 10⁻⁹
cm3STP(
3He)/cm
3 (Ballentine and Sherwood-Lollar, 2002). Magmatic contributions
to the 4He in the Kansas Basin and CKU samples are between 0.5-1.4% assuming a
crustal end member of 0.02 Ra and a mantle end member of 8.0 Ra (Ballentine and
Sherwood-Lollar, 2002). This again compares to the Hugoton-Panhandle which
shows magmatic 4He contributions of between 1.5-2.8%.
3.4.1.2. Neon
Concentrations of 20
Ne across the Kansas Basin and CKU range from 1.43 x
10-7
to 4.78 x 10⁻⁷
cm3STP(
20Ne)/cm
3 which falls within the range for the Hugoton-
Panhandle (0.86 x 10⁻⁷
to 5.0 x 10⁻⁷
cm3STP(
20Ne)/cm
3).
20Ne/
22Ne in the Kansas
Basin-CKU system varies between 8.95 to 9.81 (compared with the air value of 9.8).
Within this the Kansas Basin shows a split in 20
Ne/22
Ne between the subsets. The
KBC displays lower 20
Ne/22
Ne values (8.95 to 9.18) than the KBP (9.61 to 9.81)
which falls within the range of the Hugoton-Panhandle (9.59 to 9.91).
The 21
Ne/22
Ne ratio in the Kansas Basin and CKU has a range of 0.040 to
0.063 (compared with the air value of 0.029). All samples show ratios which are
distinct from air indicating a resolvable excess of 21
Ne (referred to as 21
Ne*). Once
again there is a split in the Kansas Basin subsets with the KBC showing higher ratios
than the KBP (0.055-0.063 compared with 0.040-0.044). Ratios for the KBP again
fall within range of the Hugoton-Panhandle (0.037-0.051).
The endmembers for 20
Ne/22
Ne and 21
Ne/22
Ne are well defined for air, crust
and mantle contributions and can be affected by both mass fractionation and mixing
Chapter Three: Economic Helium Reservoirs in the Mid-Continent United States
96
between groups (Table 3.4). From the three neon isotopic graph it can be seen that
all systems are spread along two mixing lines between air and the crust (Figure 3.7).
Both CKU and KBC samples fall along the mixing line for modern crust which is
younger than the Archean. Samples from the KBP and Hugoton-Panhandle regions
show potential mixing between mantle, Archean crust and Precambrian crust
however this is difficult to determine given the relatively narrow sample range.
Mixing between the two crustal lines is either caused by mass fractionation or a
small mantle addition.
21Ne* contributions to
21Ne concentrations in the CKU vary from 34.8%-
45.5%. In the KBC they are between 47.2-53.5% and in the KBP they are from 28.2-
34.5%. The KBP samples fall within the range of the Hugoton-Panhandle (21.0-
42.7%).
The mantle and crustal contributions to the 21
Ne concentration can be
calculated from 20
Ne/21
Ne/22
Ne using methods outlined in Ballentine and O’Nions,
1992 and Ballentine, 1997. In all systems crustal 21
Ne* dominates however in the
CKU and KBC systems 21
Ne* is almost entirely sourced from the crust (assuming
that the air, crust and mantle endmembers are distinct and well defined). The CKU
samples contain mantle 21
Ne* (21
Ne*mntl) components which constitutes 1.3-1.5% of
the total 21
Ne concentration of the gases. The KBC contains 21
Ne*mntl components of
up to 2.0% of the 21
Ne concentration. In the KBP and Hugoton-Panhandle there are
resolvable mantle components with a maximum of 13.9% 21
Ne*mntl in the KBP and
up to 15.0% 21
Ne*mntl in the Hugoton-Panhandle field.

Chapter Three: Economic Helium Reservoirs in the Mid-Continent United States
97
Figure 3.7.: Three neon isotope graph showing isotopic ratios in samples relative to
predefined mixing lines for air-crust and air-mantle mixtures (Table 3.4.). All samples
show significant excesses of 21
Ne/22
Ne. For the air-average crust mixing line the lower 21
Ne/22
Ne endmember value of 0.47 is used for the data due to the goodness of fit with
regard to the majority of samples.
End member 20
Ne/22
Ne 21
Ne/22
Ne Reference
Air 9.80 0.029 Ballentine and
Burnard, 2002
Archean crust 0 3.30±0.2 Lippmann-Pipke et
al., 2011
Precambrian crust 0 0.47± Kennedy, 1990
MORB mantle 12.5 0.0677 Ballentine and
Holland, 2008
Table 3.4.: Endmembers for three neon graph mixing lines.
3.4.1.3 Argon

Chapter Three: Economic Helium Reservoirs in the Mid-Continent United States
98
The 40
Ar/36
Ar ratios in the Kansas Basin-CKU systems vary from 525 to
2142 which is split again between the KBC and KBP. On average the KBC has a
ratio of 1726 ± 246 and the KBP has a ratio of 566 ± 24 compared to the air ratio of
295.5. All samples have a resolvable 40
Ar excess (denoted as 40
Ar*). In these
samples it is not possible to separate out crust from mantle contributions with regard
to 40
Ar*, however, given the geological context, it can be assumed that the dominant
contribution is from the crust. 40
Ar* constitutes 43.7-86.2% of the Kansas Basin and
CKU 40
Ar concentrations. This can be further differentiated into the KBC (80.2-
86.2%) and the KBP (43.7-51.1%). Neither subset falls into the 63.9-74.4% range
for the Hugoton-Panhandle.
The ratios of 38
Ar/36
Ar for samples, which determine atmospheric
contributions, differ depending on the geological system. For KBP samples the range
is narrow and falls between 0.186 to 0.191 compared with the air value of 0.188. All
KBP samples except the Wieland no.1-A, Strecker no.1, Benish no.1, Poverty Hill
no.1 and Lewis Trust #1 wells fall within 1σ of the air value. KBC samples have a
range from 0.183 to 0.187. The Maverick #1 well is the only well from this sample
subset within 1σ of the air value; all others are significantly below the air value but
within 1σ error of each other. Both CKU samples fall just outside the 1σ error of the
air ratio. McCune 1-A falls below the air value and Kautz #1 is above the air ratio.
Hugoton-Panhandle ratios are not available however they are assumed to be within
1σ error of the air ratio since they are undocumented.
3.4.1.4 Krypton and Xenon

Chapter Three: Economic Helium Reservoirs in the Mid-Continent United States
99
In the CKU samples 84
Kr concentrations vary between 1.20 x 10⁻⁸
and 1.25 x
10-8
cm3STP(
84Kr)/cm
3. In the KBC concentrations range from 3.19 x 10
-9 and 2.43
x 10-8
cm3STP(
84Kr)/cm
3. There is a marked differentiation within the KBC between
samples from the Mississippian and the Morrow of up to ~7.6 times more 84
Kr in the
Morrow compared with the Mississippian. In the KBP concentrations fall within a
narrow range of 1.29 x 10⁻⁸
to 1.92 x 10⁻⁸
cm3STP(
84Kr)/cm
3. In general the wells to
the north of the study area are higher in 84
Kr concentration than those in the south
however there is no obvious spatial trend.
In the CKU 130
Xe concentrations are between 3.20 x 10⁻¹¹
and 9.87 x 10⁻¹¹
cm3STP(
130Xe)/cm
3. In the KBC concentrations range between 1.51 x 10
-10 and 1.28
x 10-9
cm3STP(
130Xe)/cm
3 and exhibit the same differentiation between the
Mississippian and Morrow strata as for 84
Kr except the difference is greater at up to
~8.5 times more 130
Xe in the Morrow than in the Mississippian. The KBP shows
concentrations of 9.57 x 10⁻¹¹
to 1.52 x 10⁻¹⁰
cm3STP(
130Xe)/cm
3.
3.4.1.5 Crust-derived noble gases
The average 4He/
21Ne* ratios for the KBC, KBP and Hugoton-Panhandle are:
1.2 x 10⁷, 3.2 x 10
7 and 2.8 x 10
7 (Table 3.5). All ratios except for the KBC are
significantly higher than the average 4He/
21Ne* value of 1.71 x 10
7 (Ballentine and
Burnard, 2002). Correction of both the 4He and
21Ne* isotopes for magmatic
contributions does not affect this discrepancy.
The average 4He/
40Ar* ratio for the KBC (13.7) is within range of the
average ratio for the Hugoton-Panhandle (12.5). The KBP has a far higher average of
59.8. Wells in the CKU show two distinct 4He/
40Ar* ratios of 4.7 in the Kautz #1

Chapter Three: Economic Helium Reservoirs in the Mid-Continent United States
100
well and 7.9 in the McCune 1-A well both of which are close to the average crustal
4He/
40Ar* ratio of 5.0 (Taylor and McLennan, 1985; Ballentine and Burnard, 2002).
In all cases both the 4He/
40Ar* ratio and
4He/
21Ne* are significantly higher
than average observed and predicted crustal ratios except in the case of the KBC.
The 40
Ar*/21
Ne* ratio for the Hugoton-Panhandle comes close to values predicted
for the crust (2.4 x 10⁶ compared with 3.05 x 10
6). Across the Kansas Basin subsets
40Ar*/
21Ne* ratios are significantly lower than those for the average crust (5.4 x 10
5
for the KBP and 8.8 x 10⁵ for the KBC) (Table 3.5). Ratios corrected for
21Ne*
magmatic contributions increase this discrepancy.
Table 3.5.: Average radiogenic ratios of samples.
3.4.1.6 Groundwater-derived noble gases
Well name/geological
province 4He/
40Ar*
4He/
21Ne*
40Ar*/
21Ne*
Hugoton-Panhandle
(average) 12.46 ± 2.48 2.85 ± (0.62) x 10
7
2.43 ± (0.81) x
106
Kansas Hugoton 13.26 ± 2.46 2.85 ± (0.70) x 107
2.19 ± (0.59) x
106
Guymon Hugoton 9.40 ± 0.09 2.93 ± (0.001) x 107
3.12 ± (0.03) x
106
Texas Panhandle 11.73 ± 2.10 2.83 ± (0.61) x 107
2.66 ± (1.09) x
106
Kansas Basin
Carboniferous 13.72 ± 1.75 1.21 ± (0.16) x 10
7
8.83 ± (0.53) x
105
Kansas Basin Permian 59.81 ± 7.63 3.16 ± (0.14) x 107
5.38 ± (0.83) x
105
Kautz #1 (CKU) 4.73 ± 0.17 4.59 ± (0.29) x 107
9.70 ± (1.58) x
106
McCune 1-A (CKU) 7.94 ± 0.54 3.05 ± (0.33) x 107
3.84 ± (0.82) x
106
Average upper crust
(theoretical) (Ballentine and
Burnard, 2002)
6.0 2.33 ± (0.44) x 107
3.88 ± (0.73) x
106
Average upper crust
(observed) (Ballentine and
Burnard, 2002)
5.0±1.0 1.71 ± (0.09) x 107
3.60 ± (1.27) x
106

Chapter Three: Economic Helium Reservoirs in the Mid-Continent United States
101
The isotopes 20
Ne, 36
Ar, 84
Kr and 130
Xe are predominantly introduced into
shallow crustal systems by being dissolved into groundwater (ASW). As such, when
they are then partitioned into gas or oil, they can be used as indicators of
groundwater interaction with the reservoir (Ballentine, 1991; Ballentine and
Burnard, 2002; Gilfillan et al., 2008; Zhou et al., 2012).
In the CKU 20
Ne/36
Ar ratios are similar for the McCune 1-A and Kautz #1
wells (0.04-0.05). These ratios are up to 3.3 times lower than the ASW ratio (with
ASW being 0.154 assuming an equilibration temperature of 10°C, pressure of 1 atm,
an excess air component of 10% Ne and freshwater) (Kipfer et al., 2002). KBC
samples range between 0.477-0.521 with all samples being below the air ratio
(0.524) and significantly higher than the ASW ratio. KBP samples range between
0.277 and 0.509 which are significantly higher than the ASW ratio but also lower
than the air ratio.
84Kr/
36Ar ratios for both CKU samples are uniform at 0.003 which is
approximately 11 times lower than the ASW ratio of 0.040 at 10°C and 7 times
lower than the air ratio of 0.021. 130
Xe/36
Ar ratios for the same samples are different
at 0.00001 for Kautz #1 and 0.00003 for McCune 1-A. Both ratios are 14.5 to 51.3
times lower than the ASW ratio of 0.00041 at 10°C and 4.2 to 14.7 times lower than
the air ratio of 0.00011.
In the KBC samples there is a marked difference between the 84
Kr/36
Ar ratios
in the Mississippian and Morrow samples. Mississippian samples range from
significantly below the air ratio at 0.011 to 0.019 which is within error of the air ratio
(0.021). In the Morrow samples 84
Kr/36
Ar ratios are remarkably uniform and range
between 0.026 and 0.027. All three samples are significantly above the air ratio but
Chapter Three: Economic Helium Reservoirs in the Mid-Continent United States
102
below the ASW ratio (0.040). 130
Xe/36
Ar ratios lie within a narrow range for most
samples in the KBC suite at 0.00052 to 0.00058 with a local maximum at the
Maverick #1 well of 0.0014. All samples are significantly above the ASW ratio
(0.00041).
84Kr/
36Ar ratios for KBP samples range between 0.018 to 0.031 indicating
that all samples lie between the air ratio (0.021) and the ASW ratio (0.040).
130Xe/
36Ar ratios for these samples are between 0.00014 and 0.00022. All samples
are significantly above the air ratio (0.00011) and below the ASW ratio (0.00041).
The characteristics of the groundwater-derived noble gas ratios vary
dependent on the subset. Noble gas solubility in water increases with elemental mass
where Ne<Ar<Kr<Xe. When looking at the fractionation patterns in the subsets and
at their relationships to crustal isotopic ratios (4He/
21Ne* and
4He/
40Ar*) there are no
clear relationships. This could indicate either that the process responsible for the
fractionation of the groundwater-derived noble gases does not significantly affect the
crustal noble gases or that the fractionation of the groundwater derived component
occurred prior to mixing with the crustal gases in the reservoir.
The KBC subset shows 20
Ne/36
Ar and 84
Kr/36
Ar ratios which are between
ASW and air but 130
Xe/36
Ar ratios which are above ASW indicating an excess of
xenon. This trend is similarly seen in 136
Xe/36
Ar ratios from this sample set. This
trend in the groundwater-sourced isotopes could potentially be caused by the
introduction of xenon isotopes from another source mixed with isotopes sourced
from partially fractionated groundwater. The alternative source for the xenon
isotopes could potentially be either from the underlying sediments or from an
associated oil phase (Zhou et al., 2005).

Chapter Three: Economic Helium Reservoirs in the Mid-Continent United States
103
In the CKU, the lower than ASW characteristics of all groundwater isotopic
ratios potentially points to (along with having the highest 4He/
20Ne ratios of 5.01 x
104 to 1.19 x 10
5) minimal to potentially no significant groundwater interaction.
In the KBP samples the pattern of 20
Ne/36
Ar,84
Kr/36
Ar and 130
Xe/36
Ar ratios
which all fall between air and ASW ratios points to varying degrees of degassing of
groundwater since none of the samples are fully at equilibrium with the groundwater
ratio of 0.154. The higher than groundwater ASW ratios, especially for 20
Ne/36
Ar,
could be an indicator of multiple stage solubility fractionation where the original gas
has undergone several dissolution-exsolution events which would preferentially
enrich 20
Ne relative to 36
Ar.
3.4.1.7 The interaction between 20
Ne and crust-derived isotopes
The correlation between atmosphere-derived 20
Ne and radiogenically-
produced 4He was first noted in the Ballentine and Sherwood-Lollar (2002) study on
the Hugoton-Panhandle. The strong positive correlation indicates that these two
differently sourced isotopes were potentially mixed prior to the degassing of
groundwater into reservoirs. Since the primary source of 20
Ne in the subsurface is
air-saturated groundwater this shows that groundwater plays a major role in the
transport of 4He to these reservoirs.
Similarly to the Hugoton-Panhandle there is a positive correlation between
4He and
20Ne across all subsets from this study. Alongside this we also see positive
correlations between the other radiogenic noble gas isotopes (21
Ne* and 40
Ar*) and
20Ne (Figure 3.8).

Chapter Three: Economic Helium Reservoirs in the Mid-Continent United States
104
Figure 3.8.: Plots showing the strong positive correlation between radiogenically and nucleogenically derived components a) 4He, b)
21Ne*, c)
40Ar*
and groundwater-derived 20
Ne. All lines fall within error of the origin. There appear to be several potential trends associated with each isotope as
outlined here: a) i) the original trend from Ballentine and Sherwood-Lollar which discounts the outlying Donelson et al., and Sarah Claybaugh wells,
ii) the southern wells of the KBP dataset (Oppy-Burke no.1, Benish no. 1, Poverty Hill no. 1, Strecker no. 1, Jetmore-Bradford no. 1, Gleason 1 and
Lewis Trust 1). b) i) the Hugoton-Panhandle dataset excluding the Donelson et al., and Sarah Claybaugh wells, and ii) the KBC dataset. c) i) the
KBP dataset and ii) the combined Hugoton-Panhandle and KBC datasets.

Chapter Three: Economic Helium Reservoirs in the Mid-Continent United States
105
The upper and lower boundary trends for each radiogenic isotope vary
depending on subset. Only the subsets of the Hugoton-Panhandle fall along the same
trend each time. Mixing can be seen between each of the upper and lower trends
indicating that strata and depth is, for the most part, irrelevant in these systems
especially in the case of 4He.
3.4.2. Other Major Gases
3.4.2.1. Methane
Across the KBP samples, the gas composition includes methane at
concentrations between 56.0-73.6%. When compared with the Hugoton-Panhandle
(56.1-71.5%) these concentrations fall within the same range. Data for the KBC is
more limited and ranges between 42.2-59.1%. CKU well gases contain between
60.6% CH4 (Kautz #1) and 72.4% CH4 (McCune 1-A). Isotopic analyses of CH4
were conducted on the Hugoton Panhandle gases by Ballentine and Sherwood-Lollar
(2002) and δ13
CCH4 values range between -41.80‰ and -45.10‰. Isotopic analysis
of the CH4 component for the CKU, KBC and KBP wells was not conducted.
3.4.2.2. Nitrogen
Nitrogen concentrations vary across the Kansas Basin dependent on subset.
In the KBC N2 concentrations range from 9-51% and in the KBP from 22-42%. In
the CKU samples N2 concentrations vary between 31-37%. Isotopic δ15
N values vary
widely in the KBC from between +1.85‰ to +6.50‰ and similarly in the KBP

Chapter Three: Economic Helium Reservoirs in the Mid-Continent United States
106
samples which are between +1.45‰ to +4.70‰. Isotopic δ15
N values in the CKU
samples fall within range of both the KBP and KBC with the McCune 1-A well at
+3.45‰ and the Kautz #1 well at +2.45‰.
Nitrogen concentrations from the Hugoton-Panhandle can be split between
the Kansas Hugoton-Guymon Hugoton system (12.7-21.4%) and the Texas
Panhandle (6.6-25.8%). Isotopic δ15
N values show a transition between these two
systems with the Hugoton system showing values of +5.30‰ to +9.40‰ and of
between +2.70‰ to +5.30‰ for the Texas Panhandle.
In general there is a trend in the Permian (Chase Group) samples in the
Kansas Hugoton field from west to east of a decrease in δ15
N values coinciding with
a well-recognised low BTU rim which sits on the northern and eastern edges of the
Hugoton-Panhandle field (Figure 3.9a). This also shows the updip filling of the
Kansas Hugoton by high BTU gases after eastward tilting caused by the Laramide
Orogeny (Sorenson, 2005). In general there is a decrease in δ15
N values from SW to
NE across the Kansas study regions (Figure 3.9b).

Chapter Three: Economic Helium Reservoirs in the Mid-Continent United States
107
Figure 3.9.: a) Map of the Hugoton-Panhandle system and surrounding geological
features including study areas with δ15
NN2 (‰) values displayed, b) The change in δ15

Chapter Three: Economic Helium Reservoirs in the Mid-Continent United States
108
values from SW to NE across the study areas from A-A’ in a). The distance between
wells is measured relative to distance from Barnes A-1.
Although the lowest value of N2/40
Ar for the Texas samples and both CKU
samples are in the same range as the atmospheric and groundwater values it is clear
that the variation across the sample sets are not caused by significant mixing with
these components (Figure 3.10). This indicates that there is negligible addition of
air-derived N2 to the N2 concentrations found across all datasets alongside air
saturated groundwater which at most may only be affecting one well (Kautz #1).
Since air-derived N2 can be ruled out, this leaves three other potential
sources: mantle sourced, crust sourced and hydrocarbon sourced. It is possible to
estimate the percentage of mantle contribution across the dataset. The derived
N2/3He ratio for a MORB-like mantle is 6 x 10
6 (Ballentine and Sherwood-Lollar,
2002). When this is applied to the previously calculated mantle 3He concentration in
samples, this gives a mantle N2 contribution to total concentrations of between 1.7-
5.7% for the Kansas Basin-CKU system. Mantle N2 contributions to the Hugoton-
Panhandle N2 concentrations range between 2.6-10.1% and on average are higher in
the Texas Panhandle than in the Kansas Hugoton-Guymon Hugoton region (7.3 ±
1.5% compared with 4.1 ± 1.1%).
From the above calculation it can be determined that overall less than 10% of
N2 concentrations can be attributed to mantle contributions and therefore the
majority of N2 present must be attributed to a combination of either the thermal
cracking of hydrocarbons or thermal release from the crust.

Chapter Three: Economic Helium Reservoirs in the Mid-Continent United States
109
Figure 3.10.: a) Plot of N2/
40Ar vs.
36Ar/
40Ar compared with values for air and ASW.
This diagram shows that nitrogen for all samples cannot be explained by mixing with a
dissolved air component and there is instead a separate mixing line which encompasses
the Hugoton-Panhandle, KBC and McCune 1-A samples. b) Plot of 4He/
36Ar vs.
40Ar/
36Ar compared with values for air and ASW. Like the N2 component the
4He
component cannot be explained by either air or ASW and therefore most likely
migrated with the N2 indicating either a similar source, migration mechanism or both.

Chapter Three: Economic Helium Reservoirs in the Mid-Continent United States
110
3.4.3. Nitrogen and the noble gases
Across all samples 4He concentrations are strongly positively correlated with
N2 concentrations (Figure 3.11). 4He/N2 ratios in the Texas Panhandle and Kansas
Hugoton-Guymon Hugoton gases show a split in ratio (0.020-0.037 in
Kansas/Guymon Hugoton and 0.036-0.049 for the Texas Panhandle) from north to
south as evidenced in both Gold and Held, (1987) and Ballentine and Sherwood-
Lollar, (2002).
There also appears to be significant overlap between the KBP, KBC, CKU
and the Texas Panhandle subset which breaks with this spatial trend. There are no
readily resolvable spatial trends within individual subsets.
Figure 3.11.: Plot of N2 concentration versus 4He concentration showing a split in ratio
between the KBP and Kansas Hugoton samples and the Texas Panhandle and KBC
samples. Values in the Kansas Hugoton are as low as 0.020 and values in the KBC are
as high as 0.063. The 4He/N2 ratio of 0.077 comes from the average of samples taken
from the Bush Dome which lies at the southern end of the Hugoton-Panhandle field

Chapter Three: Economic Helium Reservoirs in the Mid-Continent United States
111
(Gold and Held, 1987). It is taken to be the pure 4He endmember in associated N2
calculations for the region following on from Ballentine and Sherwood-Lollar, (2002)
due to it being the upper limit of 4He/N2 ratios taken from the Texas Panhandle region.
Figure 3.12.: Plot of
4He/N2 vs. δ
15N(N2). Mixing lines shown a) for the KBP and Kansas
Hugoton samples, and b) the KBC samples excluding the anomalously low #1 Blew well
(circled).
Similar to the previous study there appears to be a correlation between 4He
and N2 for the new samples indicating a link between two potentially differently
sourced components (Ballentine and Sherwood-Lollar, 2002) (Figure 3.12).
Following on from this we propose two new mixing lines (a and b) which utilise
three nitrogen endmembers; two of which are associated with high concentrations of
4He and low δ
15N values and one which is shared by both mixing lines and is
characterised by low concentrations of 4He and high δ
15N values. Since the Hugoton-
Panhandle samples show mixing between all nitrogen endmembers we can assume
that they are applicable to all datasets to varying degrees.
The lower and upper boundaries which encompass the bulk of the datasets
intersect at a point determined as the δ15
N value of +14.60‰ which corresponds to a

Chapter Three: Economic Helium Reservoirs in the Mid-Continent United States
112
lowered 4He/N2 ratio of 0.015. This low-
4He associated nitrogen endmember directly
compares to the ‘non-4He associated’ endmember calculated in Ballentine and
Sherwood-Lollar, (2002) of +13.00‰. The narrow range of these endmember values
indicates a common source of low 4He-associated nitrogen for most of the Hugoton-
Panhandle, Kansas Basin and CKU system. The δ15
N values for this endmember fit
into the range quoted by Zhu et al., (2000) for gases derived from the late stage
denitrification of post-mature sedimentary organic matter (δ15
N = +4.00‰ to
+18.00‰).
Extrapolating the original mixing line from Ballentine and Sherwood-Lollar
(2002) to determine the high 4He-associated nitrogen endmember produces a
significantly less enriched δ15
N value of -5.00±0.30‰ when considering an
endmember with the 4He/N2 ratio of 0.077 (Gold and Held, 1987; Ballentine and
Sherwood-Lollar, 2002). This directly compares to the value of -3.00‰ calculated
for the same 4He-associated nitrogen endmember calculated in Ballentine and
Sherwood-Lollar, (2002).
Despite the observation that both new 4He-associated nitrogen endmembers
have 4He/N2 ratios which are significantly different to the
4He/N2 ratio of 0.077 used
by Ballentine and Sherwood-Lollar, (2002), if it is assumed that their δ15
N isotopic
endmembers fall within the same narrow range of δ15
N values (-5.00‰ to -3.00‰) it
could indicate that they most likely share a source from the low temperature
metamorphism of the crust (-5‰ to +4‰) (Haendel et al., 1986; Kreulen et al.,
1982; Bebout and Fogel, 1992; Bebout et al., 1999; Zhu et al., 2000; Ballentine and
Sherwood-Lollar, 2002).
Alternatively, if it is assumed that the lowest δ15
N values from each boundary
(+1.85‰ for the upper boundary and +1.45‰ for the lower boundary) are

Chapter Three: Economic Helium Reservoirs in the Mid-Continent United States
113
representative of being close to the original δ15
N endmember in the area then the
metamorphism of ammonium clay minerals in sediments could also be a sourcing
option (+1‰ to +4‰). Both modern sediments and metamorphosed rocks up to
greenschist facies show indistinguishable δ15
N value ranges (Zhu et al., 2000; Boyd,
2001).
Ammonium (NH4+) bound in clays makes up < 60% of sedimentary nitrogen
(Ader et al., 2016). In this form it is highly thermally stable and therefore cannot be
released by temperature alone under geological conditions in study areas since
temperatures must exceed 500°C (Whelan et al., 1988; Zhu et al., 2000). There is
only evidence of low temperature regional metamorphism to, at most, greenschist
facies near the Amarillo-Wichita Uplift making this an unlikely scenario (Nicholas
and Rozendal, 1975; Cardott, 1988).
The limited number of studies on the thermal maturation of organic matter
during burial diagenesis shows that it does not significantly modify the nitrogen
isotopic composition of either bulk sediments or kerogens relative to clay minerals
within a closed system (Williams et al., 1995; Mingram et al., 2005; Adler et al.,
2016).
Another method of releasing ammonium from clays is fluid-rock interactions
with highly saline brines (Mingram et al., 2005). Ammonium is known to be highly
soluble in groundwater and past literature has shown that migrating hydrocarbon
phases tend to become enriched in 15
N as they move through authigenic illite
(Williams et al., 1995). However, without δ15
N and N2 whole rock analyses for the
study areas it is difficult to determine exactly which rocks N2 has been sourced from
or whether the gases measured in fields have either experienced δ15
N enrichment
during migration or from mixing with a more δ15
N enriched gas component.

Chapter Three: Economic Helium Reservoirs in the Mid-Continent United States
114
If we assume that the high 4He-associated nitrogen endmember has a δ
15N
value of approximately -3.00‰ then the 4He/N2 ratio for mixing line (a) has a value
of 0.043 whereas mixing line (b) has a ratio of 0.089. Alternatively if we assume that
the high 4He-associated endmember δ
15N value for produced gas had a value of
+1.00‰ which encompasses both metamorphosed crust and ammonium release from
clays then the 4He/N2 ratio for mixing line (a) has a value of 0.036 and mixing line
(b) has a ratio of 0.072.
The differences in 4He/N2 ratios between the mixing line endmembers could
be caused by a variety of factors including: differing accumulation times before
release, variations in the N2 content of the source rock(s), differences in U content
relative to N2 in the various source rocks or variable dilution of the 4He/N2 ratio by
CH4.
In summary the bulk of the dataset can be explained by mixing between three
nitrogen endmembers, one of which is associated with low concentrations of 4He and
two which are associated with high 4He concentrations. These endmembers may
share similar 4He and N2 release mechanisms but potentially not the same
combination of source rocks.
3.5 Discussion
3.5.1 Helium mass balance
Calculating the total 4He produced by U and Th decay over specific time
periods can help to estimate the volume of rock needed to generate the volume of
4He occurring in study area reservoirs.

Chapter Three: Economic Helium Reservoirs in the Mid-Continent United States
115
As there are no estimates for the reserve volumes associated with sample
fields we calculated minimum reserve estimates for the 4He produced from each field
by first estimating the original gas in place (OGIP) using a basic volumetric equation
(Equation 1):
OGIP(SCM) = Ahϕ(1-Sw)/Bgi (1)
where A = area of reservoir (m2) in our case assumed to be the same area as the
field; h = thickness of pay zone (m) estimated from log data; ϕ = porosity (decimal)
from log data; Sw = connate water saturation (decimal) estimated from drill stem
tests and Bgi = formation volume factor for the gas at initial conditions (m3/SCM)
(Table 3.6).
For fields where there was insufficient information provided to determine a
plausible estimate (Bahr, Blew, Lamb and Stella B) it was assumed that the
cumulative production to date represented 50% of the OGIP replicating recovery
estimates (see Table 3.1).
Field name Producing reservoir Estimated OGIP
(m3)
Estimated helium
reserves (m3)
Bahr Chase Group 4.39 x 10⁷ 9.28 x 10
5
Leesburgh Chase Group 1.72 x 10⁸ 1.48 x 10
6
Carson Morrow Sands 6.85 x 10⁶ 8.38 x 10
4
Maverick Morrow Sands 8.51 x 10⁵ 2.10 x 10
4
Blew (single well) Morrow Sands 2.98 x 10⁶ 3.92 x 10
4
Steel Mississippian 1.05 x 10⁸ 5.02 x 10
5
Lamb Mississippian 4.66 x 10⁷ 2.71 x 10
5
Barrick Chase Group 6.30 x 10⁷ 7.70 x 10
5
Neho Chase Group 2.51 x 10⁷ 2.89 x 10
5
Barricklow East Chase Group 5.20 x 10⁷ 6.06 x 10
5
Wieland North Chase Group 1.11 x 10⁹ 1.20 x 10
7
Wieland Chase Group 4.93 x 10⁷ 5.67 x 10
5
Hanston-Oppy Chase Group 1.64 x 10⁹ 1.57 x 10
7
Groner Chase Group 8.82 x 10⁸ 8.84 x 10
6
Saw Log Creek Chase Group 1.84 x 10⁹ 1.60 x 10
7

Chapter Three: Economic Helium Reservoirs in the Mid-Continent United States
116
Southeast
Saw Log Creek Chase Group 4.07 x 10⁷ 3.50 x 10
5
Jetport Chase Group 2.92 x 10⁷ 3.08 x 10
5
Stella B Chase Group 1.72 x 10⁷ 8.21 x 10
4
Don Chase Group 2.12 x 10⁹ 1.89 x 10
7
Hugoton-Panhandle Chase Group 1.85 x 10¹²
1.11 x 10¹⁰
Table 3.6.: Estimated gas and helium reserves for all fields studied. Information
regarding all fields in the table can be found on the KGS Oil and Gas Lease Database.
The estimate for the Hugoton-Panhandle OGIP is from Dubois, (2007). 4He estimates
for the Hugoton-Panhandle are based off an average concentration of 0.6% (Ballentine
and Sherwood-Lollar, 2002).
The total estimated OGIP from sampled fields in the study regions is 8.25 x
109 m
3. With the individual
4He content from all wells (0.48-2.12%) this gives an in
place 4He estimate total of 7.78 x 10
7 m
3 which is approximately 0.7% of the
Hugoton-Panhandle 4He volume.
3.5.1.1. In situ 4He production
To determine where 4He in the Hugoton-Panhandle and Kansas System has
been sourced from we need to determine whether the 4He volumes in reservoirs have
been generated in situ or externally. Below we present three scenarios for the time
period following 250 Ma (after the deposition of the evaporite caprock across the
region):
1. Volume of 4He produced by the reservoir over 250 Ma within field areas.
2. Area required to source the in place volume of 4He in reservoirs.
3. Volume of 4He produced by an enriched reservoir (20.5 ppm U); which
only applies to the Hugoton-Panhandle and KBP subsets (Luczaj and
Goldstein, 2000).

Chapter Three: Economic Helium Reservoirs in the Mid-Continent United States
117
We have given all producing reservoirs within the study areas (Chase Group,
Council Grove Group, Brown Dolomite, Morrow Sands and Mississippian) an
average crust composition of 2.8 ppm U and 10.7 ppm Th, an average crust density
of 2.7 cm3/g, an average porosity of 13% and an average thickness of 100 m for the
Chase Group reservoirs in the KBP, 170 m for Hugoton-Panhandle areas, 15 m for
the Morrow sands and 36 m for the CKU area (Halverson, 1988; Luczaj and
Goldstein, 2000; Dubois et al., 2006; KGS, 2017).
We assume 100% release, transport and trapping efficiency which, while
unrealistic, represents a minimum value for areal extent required and for gas
volumes produced (Table 3.7).
Region and in
place helium (m3)
Scenario Helium volume
produced (m3)
Source area
needed (km2)
Percentage
of in place 4He (%)
Hugoton-
Panhandle (1.11 x
1010
)
1 1.85 x 10⁹ 2.5 x 10
4 17
2 1.11 x 10¹⁰
1.1 x 10⁵ 100
3 7.84 x 10⁹ 2.5 x 10
4 71
KBP (7.45 x 10⁷)
1 3.21 x 10⁶ 203.0 4
2 7.45 x 10⁷ 1.50 x 10
3 100
3 1.39 x 10⁷ 203.0 19
KBC (9.17 x 10⁵)
1 6.25 x 10⁴ 9.8 7
2 9.17 x 10⁵ 124.6 100
CKU (2.40 x 10⁶)
1 1.37 x 10⁵ 8.9 6
2 2.40 x 10⁶ 135.9 100
Table 3.7.: Scenarios for the in situ production of 4He. Scenario 3 does not apply to
either the KBC or CKU due to there being no evidence for enrichment in these regions.
All of the above scenarios show that in situ production alone is not a viable
explanation for the total 4He volume in reservoirs. At most in situ production makes
up 17% of the 4He volume within reservoirs meaning that the other 83% must be
sourced externally; either from sediments or the basement. Given the depths of these
reservoirs and the palaeothermal gradient associated with the neighbouring
Anadarko Basin (24°C/km) it is unlikely that a significant proportion of 4He atoms

Chapter Three: Economic Helium Reservoirs in the Mid-Continent United States
118
were released from producing minerals such as apatite and zircon (see Table 1.1)
(Lee and Deming, 1999; Lee and Deming, 2002).
Enrichment by U in reservoirs (Scenario 3) can potentially make up to 71%
of the volume however this assumes homogeneity when in reality it would most
likely be highly heterogeneous throughout the reservoir making it unlikely to be a
prolific source of 4He enrichment except on a local scale.
In terms of areal extent (Scenario 2), the Hugoton-Panhandle would require
in situ production from an area approximately 4 times bigger than the field itself, the
KBP requires an area 7 times larger, the KBC 12 times bigger and the CKU 15 times
its area in order to source 4He volumes purely from continuous reservoir strata.
Since these scenarios all require 100% efficiency of release, migration,
focusing and trapping the area required would in reality be even larger than these
estimates therefore ruling out significant input from in situ production.
3.5.1.2. External sources of 4He production
When considering alternative sources of 4He the next step is to examine the
viability of the associated underlying sediments and the basement rock down to 10
km beneath the fields due to ~ 90% of the Earth’s 4He being produced in the upper
10 km of the crust (Ballentine and Burnard, 2002).
Sediments below the evaporite seal in the deepest part of the Hugoton-
Panhandle to the top of the Precambrian basement are approximately 1.7 km thick,
shallowing to around 0.90 km thick in the KBP study area and then to approximately
0.60 km thick in the CKU (Figure 3.2b). In the KBC study area the sedimentary

Chapter Three: Economic Helium Reservoirs in the Mid-Continent United States
119
package below the Morrow (Pennsylvanian) is approximately 0.50 km thick (KGS,
2017).
For the following scenarios we consider three time periods after events which
may have affected the study areas and caused the reset of 4He production: 1) 530 Ma
(the time period since the last perturbation of the Precambrian basement), 2) 300 Ma
(the time period following the inception of the Anadarko Basin) and 3) 250 Ma (the
time period after the emplacement of the evaporite seal on the region). For the
periods of 530 Ma and 300 Ma we assume that there is no significant 4He loss during
the emplacement of sedimentary layers.
Due to the variable composition of the underlying sediments and the variable
but unknown composition of the basement we have given them an average crust
composition of 2.8 ppm U and 10.7 ppm Th, an average crust density of 2.7 cm3/g
and we have assigned an average porosity of 13% to the sediments and 5% porosity
to the basement assuming granite is the primary component (Flawn, 1956; Bickford
et al., 1981).
When we consider the external sources of 4He we can estimate an upper limit
for the bulk release of 4He from minerals according to temperature at depth.
4He is
released from apatite at temperatures between 55-100°C (on average 70°C), zircon
between 170-200°C and titanite around 200°C (Ballentine et al., 1994; Wolf et al.,
1996; Ballentine and Sherwood-Lollar, 2002; Shuster et al., 2006; Reich et al., 2007;
Hunt et al., 2012). For the purposes of our calculations we will use the lowest
recorded 4He closure temperature in apatites of 55°C as the limit of the
4He release
window throughout the crust. It is assumed that above this temperature 100% of 4He
atoms will be released from minerals and below this temperature 100% of 4He atoms
are preferentially retained by minerals. The above scenarios are presented for the

Chapter Three: Economic Helium Reservoirs in the Mid-Continent United States
120
estimated average palaeothermal gradient of the Anadarko Basin (24°C/km) at a
surface temperature of 15°C (Table 3.8).

Chapter Three: Economic Helium Reservoirs in the Mid-Continent United States
121
Region and
in place 4He
(m3)
Producing
layer
Time
period
(Ma)
Depth range
from top to
bottom of
producing
area (km)
4He volume
produced (m3)
at 100%
release
% of 4He
generation
from source
needed for
volume in
reservoir
Thickness of
strata within 4He release
window with
thermal
gradient of
24°C/km
(km)
4He volume produced (m
3)
within release window
with thermal gradient of
24°C/km
% of 4He generation from
source needed for volume
in reservoir
Hugoton-
Panhandle
(1.11 x 10¹⁰)
Sediments
530
0.6-2.3
3.47 x 10¹⁰ 32
0.6
1.22 x 10¹⁰ 91
300 1.93 x 10¹⁰ 57 6.83 x 10⁹ 100
250 1.61 x 10¹⁰ 69 5.67 x 10⁹ 100
Basement
530
2.3-10.0
1.72 x 10¹¹ 6
7.7
1.72 x 10¹¹ 6
300 9.57 x 10¹⁰ 12 9.57 x 10¹⁰ 12
250 7.95 x 10¹⁰ 14 7.95 x 10¹⁰ 14
KBP (7.45 x
107)
Sediments
530
0.7-1.6
1.52 x 10⁸ 49
0 No significant input 100 300 8.46 x 10⁷ 88
250 7.02 x 10⁷ 100
Basement
530
1.6-10.0
1.55 x 10⁹ 5
8.4
1.55 x 10⁹ 5
300 8.62 x 10⁸ 9 8.62 x 10⁸ 9
250 7.16 x 10⁸ 10 7.16 x 10⁸ 10
KBC (9.17 x
105)
Sediments
530
1.5-2.0
4.05 x 10⁶ 23
0.3
2.43 x 10⁶ 38
300 2.26 x 10⁶ 41 1.35 x 10⁶ 68
250 1.87 x 10⁶ 49 1.12 x 10⁶ 82
Basement
530
2.0-10.0
7.07 x 10⁷ 1
8.0
7.07 x 10⁷ 1
300 3.94 x 10⁷ 2 3.94 x 10⁷ 2
250 3.28 x 10⁷ 3 3.28 x 10⁷ 3
CKU (2.40 x
106)
Sediments
530
0.5-1.1
4.43 x 10⁶ 54
0 No significant input 100 300 2.47 x 10⁶ 97
250 2.05 x 10⁶ 100
Basement
530
1.1-10.0
7.17 x 10⁷ 3
8.3
6.69 x 10⁷ 4
300 4.00 x 10⁷ 6 3.73 x 10⁷ 6
250 3.32 x 10⁷ 7 3.10 x 10⁷ 8
Table 3.8.: 4He production scenarios for external sources to fields.

Chapter Three: Economic Helium Reservoirs in the Mid-Continent United States
122
The respective 4He volumes associated with the Hugoton-Panhandle, KBP,
KBC and CKU could have conceivably been generated by either the underlying
sediments (sandstone, limestone, dolomite and shale) or the basement rocks or a
combination of the two.
However, if it is then assumed that near 100% 4He release occurs above
mineral closure temperatures over the geological timescales considered, 82-100%
4He generation would have had to occur in the Hugoton-Panhandle and KBC fields
and remain in fields for over 250 Ma in order to source 4He volumes. Conversely,
the KBP and CKU areas sediments are currently below the closure temperature of
producing minerals, implying that the contribution of the sediments to 4He reservoir
volumes in these areas is negligible.
An alternative source of 4He which also needs to be considered is black shale
such as the Mississippian-Devonian aged Woodford Shale primarily located in the
Anadarko Basin. The Anadarko Basin contains on average 0.07% 4He which
amounts to approximately 5.0 x 10¹⁰
m3 of in place
4He (Dong et al., 2012; Ellis,
2014). The shale, which contains on average 38.5 ppm U and 6.3 ppm Th and is
~100 m thick, could have produced the 4He volumes observed in the Anadarko Basin
over the course of 300 Ma; however it would require near 100% release and trapping
of 4He atoms (Krystyniak, 2003; Paxton et al., 2006). The < 11 km thick package of
sediments in the basin of average U and Th content and 13% porosity could also
have generated the volumes of 4He in all study areas over 250 Ma.
An added complication is that present day depths within the study areas do
not represent maximum depths within individual study regions. However, it is not
known what the maximum depths for the KBC and KBP regions would have been or
when these were reached; the CKU has been an area of near-continual uplift.

Chapter Three: Economic Helium Reservoirs in the Mid-Continent United States
123
Maximum depths in the Hugoton-Panhandle, reached in the early Tertiary (~
65 Ma), were 1.37-1.62 km for the Wolfcampian (Sorenson, 2005). This would have
increased the thickness of sediments within the 4He release window to an average of
~1.1 km thick over the course of the Late Permian (250 Ma) to the present. Even
with this increased release window it would require 100% of all 4He atoms within
the Hugoton-Panhandle to be released and retained within the field to generate
helium volumes which is unlikely.
With several options for the source of 4He it is difficult to determine with
certainty the true source of the helium simply from a mass balance due to the large
uncertainties in release efficiency, helium loss during erosional periods and lateral
migration in and out of fields over geological time. The area needed for sourcing the
helium could be orders of magnitude larger than is calculated here. At the very least
our first order calculations indicate that there is either: 1) a variable basement input
into fields, or 2) focusing/migration of 4He from a larger sedimentary area.
Despite these uncertainties it is clear that the source of the helium is
predominantly from the shallow crust; most likely from differing combinations of
sediments and basement rocks, however, it has also been observed in this study that
a discrete deep crustal component is also involved which has delivered mantle-
derived 3He,
4He,
21Ne* and N2 into these shallow reservoirs as well. These
components could not have been generated in situ from the sediments or from a
hypothetical purely granitic basement complex therefore we need to examine the
mechanisms involved in not only sourcing the mantle component but ultimately also
the mixing and focusing of all gas components into reservoirs.
3.5.2 Thermal controls on the release of radiogenic isotopes

Chapter Three: Economic Helium Reservoirs in the Mid-Continent United States
124
The ratios and concentrations of the radiogenically produced isotopes in the
well gases across the dataset vary considerably dependent on the study area (Table
3.9). In this section we expand on the observations presented in Section 3.4.1.5.

125
Table 3.9: Concentrations and ratios of the radiogenically produced isotopes in samples. Errors are to 1σ.
Well name/geological province 4He/
40Ar*
4He/
21Ne*
40Ar*/
21Ne*
21Ne* (%)
40Ar* (%)
Hugoton-Panhandle (average) 12.46 ± 2.48 2.85 ± (0.62) x 107 2.43 ± (0.81) x 10
6 28.6 ± 4.3 69.9 ± 3.2
Kansas Hugoton 13.26 ± 2.46 2.85 ± (0.70) x 107 2.19 ± (0.59) x 10
6 30.1 ± 4.6 68.4 ± 3.1
Guymon Hugoton 9.40 ± 0.09 2.93 ± (0.001) x 107 3.12 ± (0.03) x 10
6 24.6 ± 0.4 71.0 ± 3.5
Texas Panhandle 11.73 ± 2.10 2.83 ± (0.61) x 107 2.66 ± (1.09) x 10
6 27.3 ± 3.6 72.5 ± 1.4
Kansas Basin Carboniferous 13.72 ± 1.75 1.21 ± (0.16) x 107 8.83 ± (0.53) x 10
5 49.8 ± 2.5 82.6 ± 2.2
Kansas Basin Permian 59.81 ± 7.63 3.16 ± (0.14) x 107 5.38 ± (0.83) x 10
5 32.0 ± 2.2 47.7 ± 2.3
Kautz #1 (CKU) 4.73 ± 0.14 4.59 ± (0.29) x 107 9.70 ± (0.66) x 10
6 45.5 ± 7.3 79.0 ± 2.8
McCune 1-A (CKU) 7.94 ± 0.43 3.05 ± (0.33) x 107 3.84 ± (0.46) x 10
6 34.8 ± 7.0 50.1 ± 3.4
Average upper crust (theoretical) (Ozima and
Podosek, 2001; Ballentine and Burnard, 2002) 6.0 2.33 ± (0.44) x 10
7 3.88 ± (0.73) x 10
6
Average upper crust (observed) (Ballentine and
Burnard, 2002) 5.0±1.0 1.71 ± (0.09) x 10
7 3.60 ± (1.27) x 10
6
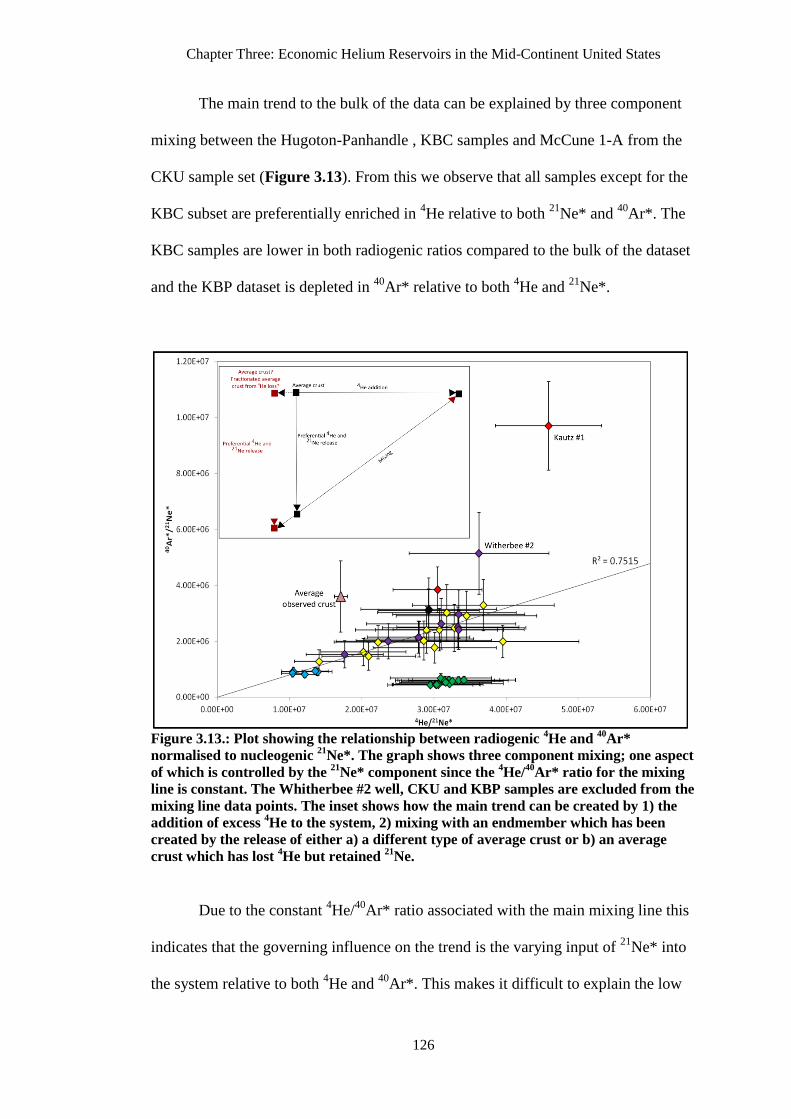
Chapter Three: Economic Helium Reservoirs in the Mid-Continent United States
126
The main trend to the bulk of the data can be explained by three component
mixing between the Hugoton-Panhandle , KBC samples and McCune 1-A from the
CKU sample set (Figure 3.13). From this we observe that all samples except for the
KBC subset are preferentially enriched in 4He relative to both
21Ne* and
40Ar*. The
KBC samples are lower in both radiogenic ratios compared to the bulk of the dataset
and the KBP dataset is depleted in 40
Ar* relative to both 4He and
21Ne*.
Figure 3.13.: Plot showing the relationship between radiogenic
4He and
40Ar*
normalised to nucleogenic 21
Ne*. The graph shows three component mixing; one aspect
of which is controlled by the 21
Ne* component since the 4He/
40Ar* ratio for the mixing
line is constant. The Whitherbee #2 well, CKU and KBP samples are excluded from the
mixing line data points. The inset shows how the main trend can be created by 1) the
addition of excess 4He to the system, 2) mixing with an endmember which has been
created by the release of either a) a different type of average crust or b) an average
crust which has lost 4He but retained
21Ne.
Due to the constant 4He/
40Ar* ratio associated with the main mixing line this
indicates that the governing influence on the trend is the varying input of 21
Ne* into
the system relative to both 4He and
40Ar*. This makes it difficult to explain the low

Chapter Three: Economic Helium Reservoirs in the Mid-Continent United States
127
4He/
21Ne*-low
40Ar*/
21Ne* endmember since there is no source which could
produce 21
Ne* without 4He increasing proportionally with it due to the main
mechanism for 21
Ne production being the 18
O(α,n)21
Ne route where the α particles
are produced by U and Th decay and eventually stabilise to form 4He.
Solubility fractionation between gas, oil and water phases has also been
known to fractionate 40
Ar*/21
Ne* more than 4He/
21Ne* due to the similarity between
He and Ne solubility (Ballentine et al., 1991; Ballentine and O’Nions, 1994;
Ballentine and Burnard, 2002; Ballentine and Sherwood-Lollar, 2002; Gilfillan,
2006). However, this would also fractionate 20
Ne/36
Ar accordingly and there is no
clear relationships seen between 20
Ne/36
Ar and any of the crust-derived noble gas
ratios. While there may be an argument for the single stage degassing of
groundwater for the KBC samples and a potential multi-stage solubility fractionation
process affecting the KBP samples these are beyond the scope of this work and
require further investigation therefore we need an alternative mechanism.
Lower than average 4He/
21Ne* crustal ratios have been recorded before in
Kyser and Rison, 1982 and have been factored into average crustal estimates (1.08 x
107 from Ballentine and O’Nions, 1991). The KBC samples are also within range of
the lowest of the Kansas Hugoton samples; Clyde H. Ball #2 which also shows
enrichment in 21
Ne* compared to the other wells in the locality (21
Ne*= 42.7% when
the local average is 28.6% for the Kansas Hugoton). The low value for the Kyser and
Rison paper, however, refers to mafic lavas generated from fractionated melts which
have preferentially lost their 4He and retained
21Ne and
40Ar during metasomatism
leaving them with a lower than average 4He/
21Ne* ratio.
This mechanism could explain the higher 21
Ne* excesses in certain samples if
either: 1) the underlying basement, while being predominantly granitic, also

Chapter Three: Economic Helium Reservoirs in the Mid-Continent United States
128
consisted of rapidly cooled, fractionated solidified melts which had retained most of
their nucleogenic 21
Ne* or more reasonably, 2) the 4He endmember associated with
the KBC region experienced metasomatism early in its geological history leading to
the preferential loss of 4He and resulting in a lowered
4He/
21Ne* ratio before release
and mixing with the enriched 4He/
21Ne* endmember associated with the Hugoton-
Panhandle samples or, 3) the 4He endmember associated with the KBC is sourced
from a different type of average crust which has below normal average crustal
4He/
21Ne* ratios as a result of being affected by magmatism (Kyser and Rison, 1982;
Ballentine, 1991; Ballentine et al., 2001; Ballentine and Burnard, 2002).
Mafic and felsic terranes ranging from gabbro to rhyolite to granite have been
identified in the Precambrian and Cambrian in Kansas, Oklahoma and Texas (Flawn,
1954; Merriam et al., 1961; Bickford et al., 1981; Yarger, 1981; Adams and Keller,
1994) however the entire basement complex beneath southwestern Kansas has not
been fully mapped to the extent of the southeast of Kansas therefore there is no way
to truly determine if the cause of the lowered radiogenic ratios is local or due to
sourcing from a different region of the crust.
The study areas all show evidence of a shallow crustal thermal regime where
4He and
21Ne is preferentially released over
40Ar. The decoupling of
4He and
21Ne*
from 40
Ar* typically occurs at depths above 6 km under regular geothermal
conditions (30°C/km with a surface temperature of 15°C) based on the argon closure
temperature in quartz (~200°C) and the average helium closure temperature in
apatite (~70°C) (Ballentine et al., 1994; Ballentine and Sherwood-Lollar, 2002; Hunt
et al., 2012). These closure temperatures are highly dependent on both the grainsize
and the retentivity of the minerals housing the radioelements.

Chapter Three: Economic Helium Reservoirs in the Mid-Continent United States
129
Another possible source of 40
Ar* contributions to reservoirs could be the
production and release of the isotope from K-rich clays associated with shales.
However, for smectite-illite clays closure temperatures for 40
Ar fall within the range
of 190°C-350°C which would be achieved at depths > 7 km (given a 24°C/km
thermal gradient for the Anadarko Basin) (Daniels et al., 1994; Lee and Deming,
2002; Duvall et al., 2011).
This is supported by the K/Ar and Rb/Sr dating of NH4-bearing illites in
Appalachian anthracites which demonstrate the ability of illite to retain 40
Ar over
significant geological time periods (≤ 253±8 Ma) after temperatures exceeded 200°C
during the Alleghanian Orogeny (Daniels et al., 1994). This makes it highly unlikely
that K-rich clay minerals at the shallow reservoir depths within all study areas
contributed significant 40
Ar concentrations to reservoirs since there is no evidence of
sedimentary temperatures exceeding 190°C.
Alkhammali, (2015) also records that Woodford Shale samples in Oklahoma
at depths shallower than 2.3 km show good correlations between K and 40
Ar
concentrations enabling the dating of the authigenic illite clays to specific
Mississippian stages; indicating low losses of 40
Ar from the shale.
The recrystallisation of clays has also been thought to release 40
Ar generated
within its structure however in oceanic illite-smectite clays it was found that smectite
samples from the Pacific preferentially acted as traps for the heavy noble gases (Ar,
Kr and Xe) (Clauer, 2006). The Woodford Shale within the Anadarko Basin
depocenter, thought to be a potential source for the low 4He associated endmember,
could hypothetically also be associated with a portion of the 40
Ar* concentrations
observed in fields. Phase changes related to a change in ordering from R=0 to R≥1
illite within shales occurs around 100°C. During this phase change K+ is released

Chapter Three: Economic Helium Reservoirs in the Mid-Continent United States
130
into solution (Whittington II, 2009). No doubt 40
Ar*, produced from the decay of 40
K
would also be released into solution, however, how much of this free K and 40
Ar is
recaptured by the newly formed illite is unknown. The Woodford Shale currently lies
at depths between 0.5 to 4.0 km deep; indicating that under a geothermal gradient of
24°C/km this would place parts of the basin > 3.5 km within this illite phase change
window.
In summary there appears to be at least two sources of 4He associated with
the study areas. One of these sources is from the shallow crust and characterised by
the preferential addition of 4He; the other source is associated with enrichment in
21Ne* and
40Ar* relative to
4He and indicates potential fractionation but also
increasing temperature which corresponds to depths > 7 km in the crust. This deeper
source most likely also corresponds to the area(s) sourcing the magmatic gases
associated with samples.
3.5.3. Groundwater, N2, CH4 and the noble gases
Crust-derived 4He,
21Ne* and
40Ar* concentrations are positively correlated
with groundwater-derived 20
Ne concentrations in the KBC, KBP and Hugoton-
Panhandle (Figure 3.8). This indicates that these disparate components are closely
linked but with systematic differences which may relate to the three component
mixing shown between 4He, N2 and the isotopes of N2 in Figure 3.12.
By assessing the variation of CH4 and N2 concentrations with 20
Ne and the
crust-derived radiogenic isotopes we can investigate migration pathways and the
constraints these may place on sources for 4He and the other radiogenically sourced
gases.

Chapter Three: Economic Helium Reservoirs in the Mid-Continent United States
131
Plots for the crustal-sourced noble gases and 20
Ne normalised to N2 show that
most data points fall along up to two mixing lines which are within error of the
origin (Figure 3.14). There are different endmembers for 20
Ne/4He,
20Ne/
21Ne* and
20Ne/
40Ar* which are indicators of differing degrees of groundwater contact
associated with sample subsets. These can vary for a number of reasons including
migration distance (greater contact time with groundwater), differing rates of
accumulation or of different migration routes in the crust. Mixing between the
dominant trends is also observed with the most scatter occurring in the graph
associated with 4He and the least in the graph associated with
40Ar*.
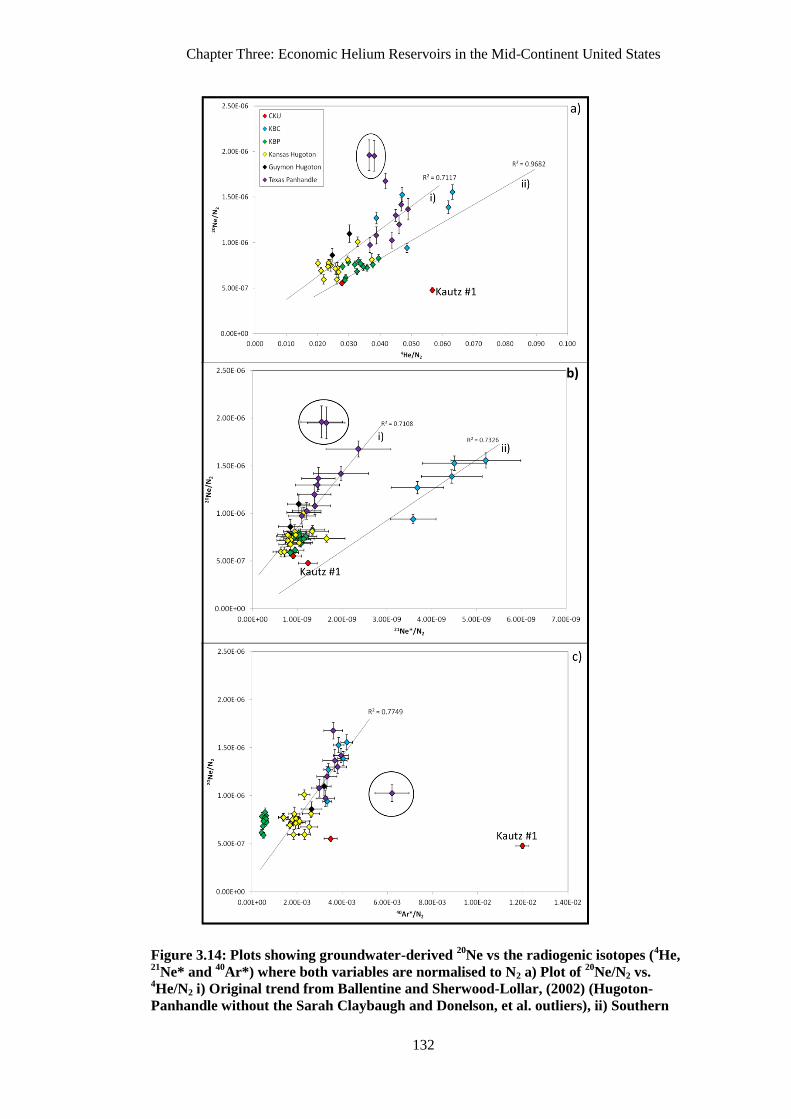
Chapter Three: Economic Helium Reservoirs in the Mid-Continent United States
132
Figure 3.14: Plots showing groundwater-derived 20
Ne vs the radiogenic isotopes (4He,
21Ne* and
40Ar*) where both variables are normalised to N2 a) Plot of
20Ne/N2 vs.
4He/N2 i) Original trend from Ballentine and Sherwood-Lollar, (2002) (Hugoton-
Panhandle without the Sarah Claybaugh and Donelson, et al. outliers), ii) Southern
b)

Chapter Three: Economic Helium Reservoirs in the Mid-Continent United States
133
KBP samples, b) Plot of 20
Ne/N2 vs. 21
Ne*/N2 i) Hugoton-Panhandle without Sarah
Claybaugh and Donelson et al., outliers ii) KBC samples. c) Plot of 20
Ne/N2 vs. 40
Ar*/N2
which shows only one trendline involving the Hugoton-Panhandle dataset (without
Witherbee) and the KBC samples. The intersection of all lines of best fit are within
error of the origin.
The graphs associated with the 4He and
21Ne* isotopes show two dominant
positive trends which indicate that three endmembers can be assigned to the datasets.
One of these endmembers is a shared nitrogen endmember for both mixing lines and
is associated with low to no 4He,
21Ne* or
20Ne. This potentially confirms the
existence of the same non-4He associated, δ
15N enriched nitrogen endmember
observed in Figure 3.12 which is thought to be associated with the overmature
production of hydrocarbons.
The two nitrogen endmembers enriched in 4He and
20Ne are also consistent
with the δ15
N depleted nitrogen endmembers observed in Figure 3.12 which
indicates that not only are these nitrogen endmembers associated with crust-sourced
N2 and high 4He but that these crustal-derived endmembers are also associated with
groundwater. This implies that for the majority of samples 4He and crustal-N2 were
mixed in groundwater before degassing occurred since only then would there be an
association between all three components. This is consistent with observations
reached in Ballentine and Sherwood-Lollar, (2002) and shows that the mixing of
crust derived components with groundwater has happened on not just a field scale
but on a regional scale.
Unlike the 4He and
21Ne* graphs the
40Ar* graph shows a single mixing line
which passes within error of the origin and encompasses only the KBC and
Hugoton-Panhandle datasets. The graph consists of two endmembers both of which
are similar to those described above for 4He and
21Ne*: 1) a nitrogen endmember
which is associated with low 40
Ar* or 20
Ne and 2) a nitrogen endmember associated
Chapter Three: Economic Helium Reservoirs in the Mid-Continent United States
134
with high 40
Ar* and 20
Ne. These nitrogen endmembers are also associated with: 1) an
enriched δ15
N endmember which is similar to that seen in Figure 3.12 and is likely
associated with the overmature production of hydrocarbons, and 2) a depleted δ15
N
endmember which is associated with a crustal source (graph not included).
This singular mixing line could indicate a shared source for both the crustal-
sourced N2 and the radiogenically sourced 40
Ar*. This commonality between the
Hugoton-Panhandle and the KBC subsets is reflected by the similar 4He/
40Ar* shown
in Figure 3.13.
Assuming that the significant 40
Ar* concentrations associated with samples
show the introduction of a source to the systems which has close to crustal
production 4He/
40Ar* ratios (~ 5.0) then the above average
4He/
40Ar* ratios
associated with the Hugoton-Panhandle and KBC systems could be the result of the
overprinting of this signal by 4He produced from shallower crust which also
accumulated in the groundwater.
In the CH4 graphs, all subsets apart from the Kautz #1 well in the CKU
exhibit three component mixing (Figure 3.15). Since all trend lines pass within error
of the origin one of the endmembers uniformly shows an input of CH4 which is not
necessarily associated with any of the radiogenic isotopes or 20
Ne. This also does not
indicate that this CH4 endmember is associated with the low-4He associated N2
endmember observed in Figure 3.14.

Chapter Three: Economic Helium Reservoirs in the Mid-Continent United States
135

Chapter Three: Economic Helium Reservoirs in the Mid-Continent United States
136
Figure 3.15.: Plots showing groundwater-derived 20
Ne vs the radiogenic isotopes (4He,
21Ne* and
40Ar*) where both variables are normalised to CH4. a) Plot of
20Ne/CH4 vs.
4He/CH4. All lines pass within error of the origin. The north and south groups within
the KBP appear to have different gradients however this could be due to CH4 dilution.
i) trend line for the Hugoton-Panhandle dataset excluding the Sarah Claybaugh and
Donelson et al., wells, ii) southern KBP samples. b) Plot of 20
Ne/CH4 vs. 21
Ne*/CH4. All
lines pass within error of the origin. i) trend line for the Hugoton-Panhandle and KBP
dataset excluding the Sarah Claybaugh and Donelson et al., wells, ii) KBC samples. c)
Plot of 20
Ne/CH4 vs. 40
Ar*/CH4. All lines pass within error of the origin. i) KBP samples
and ii) KBC and Hugoton-Panhandle samples. All excluded samples are circled.
When we consider the isotopic ratios for N2 and CH4, given the large
variation in δ15
N values (+1.45‰ to +9.40‰) compared to the very narrow range of
δ13
C values observed for the Hugoton-Panhandle in Ballentine and Sherwood-Lollar,
2002 (-41.8‰ to -45.1‰) it shows that unlike the variable δ15
N values for N2 there
is no direct relationship between the δ13
C values, or CH4 concentrations and the
noble gas concentrations and ratios.
CH4 isotopic values indicate that the gas source was a moderately mature,
oil-producing, marine rock in contrast to the low-radiogenic associated N2
endmember which instead indicates a post-mature sedimentary source (Ballentine
and Sherwood-Lollar, 2002).
The most probable explanation for this phenomenon is that although these
gases may have been sourced from the same region (the Anadarko Basin) they were
produced under different thermal regimes. This shows that either they were sourced
at different times during the formation of hydrocarbons or that they were sourced
from separate strata.
The other endmembers are associated with high radiogenic content and high
20Ne relative to CH4 indicating that groundwater contact is the primary determining
factor for the mixing line gradients whereas CH4 acts as a dilutant for both
radiogenic and groundwater-derived isotopes.

Chapter Three: Economic Helium Reservoirs in the Mid-Continent United States
137
In summary, in all samples it appears that the degree of groundwater contact
primarily determines both radiogenic content and, in the case of N2, the 4He-
associated N2 content. There are also two low-radiogenic endmember gases (CH4
and N2) which most likely originate from the Anadarko Basin and act as variable
dilutants to the subsets.
Further support for the prior mixing of crust-sourced radiogenic components
and crust-sourced 4He-associated N2 can be derived from the previously observed
mixing relationship between crust-sourced 4He-associated N2 with groundwater-
sourced 20
Ne prior to degassing into trapping structures. By using the known 20
Ne
concentration of modern ASW we can compare an estimate of the 4He-associated N2
concentration in groundwater with the saturation threshold of N2 in the same
groundwater. This can help us to determine whether the crust-sourced 4He-associated
N2 could have been present as a free gas phase therefore facilitating the degassing of
the radiogenic isotopes from groundwater or if CH4 (the dominant hydrocarbon gas
phase in fields) needed to be present before degassing could occur.
If we make the assumption that all crust-derived N2 is associated with high
4He and therefore also with total concentrations of
20Ne we can correct N2
concentrations for low-4He associated N2 using either of the δ
15N values assigned to
the two high 4He-associated N2 endmembers (-3.00‰ or +1.00‰). As an example,
correcting for the δ15
N endmember of -3.00‰ gives average N2/20
Ne ratios of: 5.08 x
105
for the Hugoton-Panhandle, 8.86 x 10⁵ for the KBP, 5.4 x 10
5 for the KBC, 1.44
x 106
for Kautz #1 and 1.15 x 10⁶
for McCune 1-A (Table 3.10).
Next we need to calculate the N2 concentrations required in ASW in order to
source the total concentration of high 4He-associated N2 measured in reservoirs. This

Chapter Three: Economic Helium Reservoirs in the Mid-Continent United States
138
is then compared to the calculated saturation threshold for N2 in ASW under present
reservoir conditions which are outlined in Table 3.10.
Modern groundwater equilibrated at 1000 m altitude at 10°C with a 10%
excess air Ne addition contains 1.8 x 10⁻⁷
cm3STP(
20Ne)/cm
3. Using this, the
groundwater which degassed the total 4He-associated N2 in the Hugoton-Panhandle
would have a N2 concentration of 0.09 cm3STP(N2)/cm
3. By taking into account the
current reservoir conditions in the study areas e.g.: for the Hugoton-Panhandle
(where temperature = 310 K, pressure = 30 bar and salinity = 4 M NaCl) we can
calculate that the same groundwater would become saturated in N2 at a concentration
of 0.24 cm3STP(N2)/cm
3 (Pierce et al., 1964; Battino,1983; Ballentine and
Sherwood-Lollar, 2002).
Therefore, in the Hugoton-Panhandle, under present reservoir conditions,
there would not be enough high 4He-associated N2 in the source groundwater to form
a free gas phase by itself. In the past, the pressure would have had to be 2.0-2.7 times
lower for a N2 gas phase to form, making it unlikely that a free N2 gas phase existed
before the introduction of a hydrocarbon gas phase given the geological history of
the field.
The Hugoton-Panhandle was subject to an extended period of burial starting
from the Cambrian until a period of uplift began shortly after the early Tertiary
culminating in modern day pressures (Sorenson, 2005). Therefore, since modern day
pressures are the lowest the field has experienced since its inception, CH4 and low
4He-associated N2 needed to be present in traps before high
4He-associated N2,
4He,
3He and
20Ne could exsolve from groundwater.
It is interesting that the Hugoton-Panhandle and the KBC contain similar
high 4He-associated N2 concentrations in groundwater. The KBC and Hugoton-

Chapter Three: Economic Helium Reservoirs in the Mid-Continent United States
139
Panhandle also lie along the same mixing line with regard to radiogenic content
(Figure 3.13). This could indicate a regional groundwater source which
encompasses both the Hugoton-Panhandle and KBC study areas.
In the KBP, conversely, under current reservoir temperatures and pressures
groundwater becomes saturated in N2 at 0.08 cm3STP(N2)/cm
3. Therefore the current
high 4He associated N2 concentration in the groundwater is 2-2.5 times higher than
the saturation threshold indicating that concentrations of high 4He-associated N2 are
high enough in the groundwater to form a free gas phase. This means that there was
either an external influx of high 4He-associated N2 into the system or that the system
either underwent significant uplift or the removal of overburden during the Late
Tertiary facilitated the lowering of pressure (Sorenson, 2005). More importantly it
indicates that the degassing of groundwater associated with the KBP is not
dependent on the presence of CH4 in traps compared to the Hugoton-Panhandle and
KBC systems; both of which are below the N2 saturation threshold.
The CKU samples are similar to the KBP samples; they also show high 4He-
associated N2 concentrations which are significantly above the saturation threshold
indicating that they are not dependent on a CH4 gas phase to facilitate groundwater
degassing. The Kautz #1 well is also the most oversaturated in high 4He-associated
N2 with concentrations 4.3-5.5 times greater than the N2 saturation threshold. This,
alongside the 4He/
40Ar* of the gas, most likely indicates the input of some of the
high 4He-associated N2 as a free gas phase from depth however we have limited
information on the field geology to comment on whether this was facilitated by a
fault or by proximity to basement outcrops.
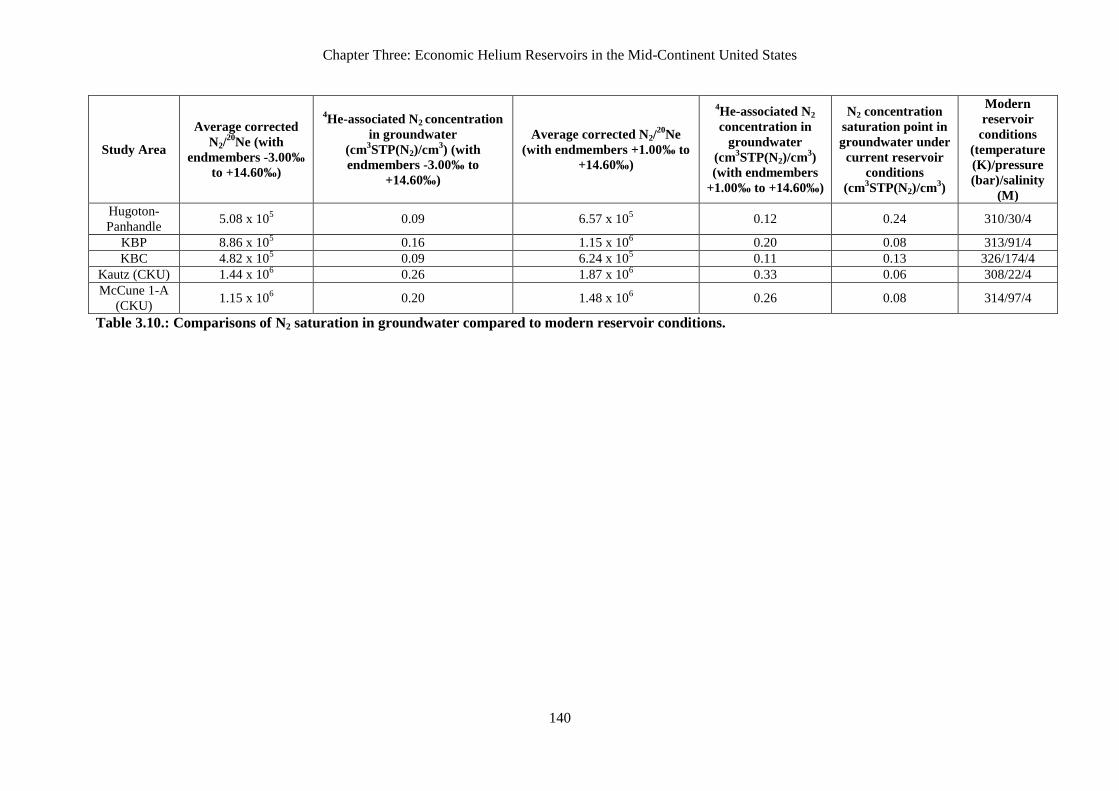
Chapter Three: Economic Helium Reservoirs in the Mid-Continent United States
140
Study Area
Average corrected
N2/20
Ne (with
endmembers -3.00‰
to +14.60‰)
4He-associated N2 concentration
in groundwater
(cm3STP(N2)/cm
3) (with
endmembers -3.00‰ to
+14.60‰)
Average corrected N2/20
Ne
(with endmembers +1.00‰ to
+14.60‰)
4He-associated N2
concentration in
groundwater
(cm3STP(N2)/cm
3)
(with endmembers
+1.00‰ to +14.60‰)
N2 concentration
saturation point in
groundwater under
current reservoir
conditions
(cm3STP(N2)/cm
3)
Modern
reservoir
conditions
(temperature
(K)/pressure
(bar)/salinity
(M)
Hugoton-
Panhandle 5.08 x 10
5 0.09 6.57 x 10
5 0.12 0.24 310/30/4
KBP 8.86 x 10⁵ 0.16 1.15 x 10
6 0.20 0.08 313/91/4
KBC 4.82 x 10⁵ 0.09 6.24 x 10
5 0.11 0.13 326/174/4
Kautz (CKU) 1.44 x 10⁶ 0.26 1.87 x 10
6 0.33 0.06 308/22/4
McCune 1-A
(CKU) 1.15 x 10
6 0.20 1.48 x 10
6 0.26 0.08 314/97/4
Table 3.10.: Comparisons of N2 saturation in groundwater compared to modern reservoir conditions.

Chapter Three: Economic Helium Reservoirs in the Mid-Continent United States
141
We can also check the saturation threshold for 4He in these systems by
following a similar methodology and assuming that all of the 4He in reservoirs is
associated with the 20
Ne (Table 3.11).
Study Area Average 4He/
20Ne
4He concentration in
groundwater
(cm3STP(
4He)/cm
3)
4He concentration
saturation point in
groundwater under
current reservoir
conditions
(cm3STP(
4He)/cm
3)
Hugoton-
Panhandle 3.33 x 10
4 0.006 0.10
KBP 4.51 x 10⁴ 0.008 0.03
KBC 3.96 x 10⁴ 0.007 0.06
Kautz (CKU) 1.19 x 10⁵ 0.02 0.01
McCune 1-A
(CKU) 5.01 x 10
4 0.009 0.04
Table 3.11.: Comparisons of 4He saturation in groundwater compared to modern
reservoir conditions.
For all subsets except Kautz #1 from the CKU subset, 4He concentrations in
groundwater are lower than the 4He saturation point in groundwater, meaning that
there would have to be other gases present in the reservoir before 4He would exsolve
from solution; in this case low 4He-associated N2 and CH4. However, unusually, in
the case of Kautz #1, concentrations of 4He are locally high enough in the
groundwater to be forming a free gas phase which is most likely directly related to
the oversaturation observed for 4He-associated N2 (Table 3.10).
In summary it is observed that the Hugoton-Panhandle and KBC reservoirs,
which are undersaturated in 4He-associated N2 relative to modern day reservoir
conditions, in the past required a CH4 gas phase to already be present in order for
crustal N2 and the 4He associated with it to exsolve from the groundwater. However,
in the case of the CKU and the KBP samples, under current reservoir temperatures
and pressures 4He-associated N2 is oversaturated in groundwater and is therefore

Chapter Three: Economic Helium Reservoirs in the Mid-Continent United States
142
capable of exsolving to form a free gas phase and causing related 4He exsolution
from the groundwater and into the gas phase. In the Kautz #1 well there may also be
an input of deep crustal free gas (4He-associated N2,
4He,
21Ne* and
40Ar*) which
causes the amplified oversaturation observed in the reservoir.
Following on from Ballentine and Sherwood-Lollar, (2002) we can use a
simple mass balance to assess the volumes of groundwater involved in the degassing
of 4He in each subset. The
20Ne/
36Ar ratios observed in samples vary between each
subset which implies different degassing processes affecting each study region
however the coupling between 4He and
20Ne is observed across all samples (Figure
3.8). We assume that despite the differences in the degassing process which
produced the varying 20
Ne and 36
Ar concentrations in the subsets that the process is
efficient thereby enabling us to determine a minimum volume of groundwater which
has interacted with 4He from the
20Ne concentrations (Ballentine et al., 1991;
Ballentine and Sherwood-Lollar, 2002).
For these calculations we use the same derived 20
Ne concentration in
groundwater as for the N2 saturation calculations (1.8 x 10⁻⁷
cm3STP(
20Ne)/cm
3).
Using the individual 4He/
20Ne ratios of the Hugoton-Panhandle samples relative to
the 4He concentrations gives an average
20Ne concentration of 1.85 x 10
-7
cm3STP(
20Ne)/cm
3) across the field. Therefore, for an estimated OGIP volume (and
therefore reservoir gas volume) of 1.85 x 10¹²
m3STP in the Hugoton-Panhandle, this
gives a total volume of 20
Ne of 3.41 x 10⁵
m3STP(
20Ne) for the field. Assuming the
total degassing of 20
Ne this is the equivalent of 1913 km3 of groundwater.
In a reservoir of 15% porosity (from Ballentine and Sherwood-Lollar, 2002)
the above volume of groundwater would occupy a rock volume of 12,756 km3
(Table 3.12). To place this in perspective, this is equivalent to the static volume of

Chapter Three: Economic Helium Reservoirs in the Mid-Continent United States
143
water in an arbitrarily 100 m-thick 15% porosity aquifer covering an area of 127,560
km2.
All subsets apart from the KBC are assigned a 100 m thick aquifer. For the
KBC the assumption is made that the aquifer is the 30 m thick Mississippian aquifer
(Nissen et al., 2004).
Study Area
Average 20
Ne
concentration
(cm3
STP(20
Ne)/cm3)
Estimated
reservoir
gas
volume
(m3)
Groundwater
volume
involved
(km3)
Aquifer
volume
with
15%
porosity
(km3)
Aquifer
area
(km2)
Hugoton-
Panhandle 1.85 x 10
-7 2.30 x 10
12 1913 12,756 127,560
KBP 2.32 x 10⁻⁷
5.90 x 10⁹ 8 51 512
KBC 2.96 x 10⁻⁷
5.80 x 10⁷ 0.1 0.6 21
CKU 1.75 x 10⁻⁷
7.03 x 10⁷ 0.07 0.5 5
Table 3.12: Workthrough of hypothetical aquifer volumes associated with study areas.
From the minimum aquifer volumes calculated the Hugoton-Panhandle
requires an aquifer over 6 times its own area whereas the KBP, KBC and CKU study
areas require areas 2.5, 2.1 and 0.6 times their own area. This demonstrates that the
hypothetical aquifer for each study area except for the CKU is potentially large
enough to act as an overlying regional focus for 4He produced from the crust both
within and outside of the study areas enabling the mixing of components from both
the deep and shallow crust before they are focused into trapping structures. This fits
with the 4He mass balance calculations which also support an external source of
4He
which has: 1) been focused into the reservoirs, 2) is not necessarily confined to the
field areas and 3) would compensate for less than 100% release and trapping
efficiency.

Chapter Three: Economic Helium Reservoirs in the Mid-Continent United States
144
The CKU is unusual in that not only do groundwater volumes appear to
support localised production but both well samples also record relatively little
groundwater interaction when 4He/
20Ne ratios are examined. This could indicate that
groundwater is not the only pathway which has brought high 4He concentrations into
these shallow reservoirs. Another pathway could have been migration from depth of
a free gas phase containing 4He which was also proposed as a pathway for one of the
sources of crustal N2 for the CKU system.
In summary, groundwater generally plays a critical role in both mixing and
focusing crustal N2 and 4He into pre-existing traps. In the CKU and KBP, the
presence of gas phase CH4 in reservoirs is not required to degas N2 and therefore 4He
from the groundwater whereas in the Hugoton-Panhandle and KBC crustal N2
concentrations are undersaturated in groundwater indicating that a CH4 gas phase
needed to be in place before isotopic partitioning between gas and groundwater.
3.5.4. The interaction between 4He, crustal N2, organic N2 and CH4
From the previous sections it has been observed that externally produced
radiogenic 4He and high
4He-associated N2 from both the deep and shallow crust
encounters laterally moving groundwater. The deep and shallow components were
then pre-mixed in the groundwater before degassing into pre-existing traps which,
depending on the study area, either contained a hydrocarbon gas phase or was
already degassing due to oversaturation by high 4He-associated N2 before
encountering a hydrocarbon phase.
The hydrocarbon gas phase and low 4He-associated N2 gas do not appear to
be co-genetic or related to the groundwater system indicating movement as a

Chapter Three: Economic Helium Reservoirs in the Mid-Continent United States
145
separate free gas phase into traps (Figure 3.14). The presence of low concentrations
of 4He,
20Ne,
21Ne* and
40Ar* in these hydrocarbon gases are likely due to the
stripping of groundwater as the hydrocarbons migrated southwards into the Texas
Panhandle and northwards up the Anadarko shelf and up the Central Kansas Uplift.
When considering the 4He system in these study regions we need to consider
the interactions between at least four components as a minimum. High 4He-
associated N2 and 4He are coupled by both source and groundwater whereas the low
4He-associated N2 and CH4 are most likely sourced from different strata in the
Anadarko Basin.
In the Hugoton-Panhandle gas field the way these components interact may
be explained by the following events:
From the late Pennsylvanian onwards hydrocarbons were produced from
strata in the Anadarko Basin ranging between Ordovician to Pennsylvanian-age. The
most prolific of these strata was the Devonian-Mississippian aged Woodford Shale
which is widely thought to be the primary producer of all gas associated with Mid-
continental fields. Gases containing CH4, low 4He-associated N2 and low
concentrations of 4He,
21Ne*,
20Ne and
40Ar* were focused southwards into the
Panhandle field which gradually filled until the early Tertiary (Carr et al., 2003;
Sorenson, 2005).
In the Mesozoic the lowest Palaeozoic layers in the Anadarko Basin
(presumably the Cambrian and Ordovician) entered overmaturity whereas the
Woodford Shale would have reached maturity; the products of these layers would
have still filled the Panhandle until the Early Tertiary making it conceivable that the
mature CH4 and overmature low 4He-associated N2 were both sourced from the
Anadarko Basin but were generated under different thermal conditions and added to

Chapter Three: Economic Helium Reservoirs in the Mid-Continent United States
146
the field together. Until the early Tertiary the Texas Panhandle contained most of the
Permian reservoir gas observed in the Mid-continent (Sorenson, 2005).
The introduction of CH4 into the Panhandle could have caused static
undegassed groundwater which already contained 4He and its related isotopes
3He,
20Ne and high
4He-associated N2 to begin degassing throughout the field.
Alternatively, later external groundwater moving through the system degassed into
capped reservoirs when it contacted CH4 and low 4He-associated N2 already in place.
Groundwater flow in the Panhandle section of the Hugoton-Panhandle is
observed to be dynamically SW to NE and started during the Early Tertiary. In the
adjoining Palo Duro Basin flow is from west to east with sources in New Mexico
(Larson, 1971; Gosselin et al., 1992; Ballentine and Sherwood-Lollar, 2002;
Sorenson, 2005). In the Hugoton section of the field groundwater contact is lower
and more irregular than in the Panhandle section potentially due to varying distance
from the main groundwater contact for the field (Figure 3.8). There is evidence of
the encroachment of the regional Cedar Hills aquifer into the south of Kansas
(Morton and Stevens counties) which shows salt dissolution from west to east
however the timing and extent of this event is uncertain since it appears to be fairly
localised (Sorenson, 1996; Young et al., 2005).
Determining the gas-water contact in the Hugoton part of the field is
complicated by faults acting as flow barriers and log interpretation difficulties
caused by water saturation in some areas but not others, loss of reservoir quality due
to thin, heterogenous strata and the compartmentalisation of strata generally below
the Chase Group in the Fort Riley formation due to faulting (Olson et al., 1997;
Sorenson, 2005). However, palaeoflow in this region is generally thought to be from

Chapter Three: Economic Helium Reservoirs in the Mid-Continent United States
147
west to east and the current groundwater contact is thought to be updip to the west
and flattens out towards the east of the field (Larson, 1971; Sorenson, 2005).
Across the Hugoton-Panhandle N2/20
Ne ratios which have been corrected for
low 4He-associated N2 display uniform ratios (on average: N2/
20Ne = 6.57±(1.57) x
105 ). This could be caused by either: 1) high
4He-associated N2,
4He and associated
gases degassed from a static body of water which was contacted by varying
concentrations of CH4 and low 4He-associated N2 across the field during filling or 2)
groundwater rich in high 4He-associated N2,
4He and associated gases contacted the
Panhandle section of the field flowing from SW to NE. Scenario 2 would have
delivered the highest concentrations of crustal and magmatic gases to the Panhandle
versus the Hugoton part of the field which is seen with regard to the distribution of
4He, crustal N2,
20Ne, δ
15N values and Ra values. Subsequent mixing with the more
‘sedimentary influenced’ Hugoton section of the field could then have produced the
trends seen within the dataset.
During the late Tertiary post-Laramide erosion and evaporite dissolution
of outcrops to the east of Kansas removed 700-1700 m of Cretaceous to Permian
overburden. Sorenson proposes that this led to a drop in the overall pressure of the
region as the interconnected hydraulic head exceeded the outcrop elevations and
discharged eastwards having been previously controlled by burial depth (Schmoker,
1989; Carter et al., 1998; Sorenson, 2005).
This loss of pressure in the region caused hydrocarbon gases which were
filling the Panhandle to spill northwards into the Hugoton section of the field, which
due to the eastward tilt generated by the Laramide Orogeny filled up westward and
northward first which is mirrored by the N2 isotope data from the region (Figure
3.9). The initial pressure decrease in the Hugoton section of the field would not have

Chapter Three: Economic Helium Reservoirs in the Mid-Continent United States
148
been enough to bring the current concentrations of crustal N2 into the gas phase,
however the introduction of CH4 and organic N2 from the south most likely started
the degassing of crustal N2, 4He and the other noble gases out of solution in the
Hugoton section of the field.
If we examine the Hugoton field, we notice that there is a general trend
towards increasing 4He-associated N2 input to well gases which are situated in the
‘low BTU rim’ area which partially occupies the east of the field. However there are
only three wells which potentially occupy this position (Baughman H-2, Mills C-1
and Parsley A-1) and have had nitrogen isotope analysis conducted on them but it
would be interesting to see if this trend for increasing amounts of high 4He-
associated N2 is also observed in the low BTU gases encountered in the Bradshaw
and Byerly fields to the north of the Hugoton field. This would imply that as
groundwater derived high 4He-associated N2 and
4He degassed it migrated north and
east in response to both the drop in reservoir pressure and the introduction of CH4
and low 4He-associated N2 filling the Hugoton (Sorenson, 2005).
Due to the lack of magmatism in the region since the Cambrian local
sourcing of the magmatic components in the gas seems unlikely so we are more
inclined to support their transport by groundwater. The Hugoton-Panhandle may
exhibit higher 3He/
4He ratios (Ra) than the other study areas due to it being the first
point of contact for groundwater bearing a latter addition of magmatic gases
(Cenozoic to Quaternary) either from the vicinity of the Sierra Grande Uplift (W to
E) or from further SW in New Mexico into the Texas Panhandle portion of the field
(Staudacher, 1987; Ballentine and Sherwood-Lollar, 2002). It is likely that crustal
gases are still migrating into the Panhandle region given the observations made in
Pierce et al., (1964) of elevated helium concentrations along the south-west

Chapter Three: Economic Helium Reservoirs in the Mid-Continent United States
149
boundary of the Panhandle field. This also serves to potentially pinpoint the area of
entry of enriched crustal gases into the field which implies that a substantial area
including the Palo Duro Basin and parts of New Mexico could be involved in the
sourcing of the helium in the study areas.
A detailed geological history of the Kansas Basin and Central Kansas Uplift
is unavailable at this time and any information on these study areas pales in
comparison to the number of studies on the Hugoton-Panhandle. We will assume
that the Kansas Basin, like the Hugoton-Panhandle, experienced downwarping until
the early Tertiary whereas the Central Kansas Uplift experienced uplift until the
Permian (Merriam, 1963; Sorenson, 2005).
When compared to the Hugoton part of the Hugoton-Panhandle the CKU,
KBP and KBC areas all contain significantly higher amounts of high 4He-associated
N2 (46-75% of the N2 concentration in well gases compared to 39-53% for the
Hugoton (Kansas and Guymon)) however they have similar amounts of high 4He
associated N2 to the Texas Panhandle (53-68% of the N2 concentration in well gases)
when using the δ15
N value -3.00‰.
The KBP and CKU areas have groundwater associated with them that is
oversaturated in N2 given current reservoir conditions. While it is possible that
reservoirs were at higher pressures in the past thereby increasing the saturation
threshold it is more likely that high 4He-associated N2 and
4He was exsolving into
traps in these regions before the introduction of low 4He- associated N2 and CH4
from the south.
If pressures were initially keeping gases in solution it would take a pressure
increase of at least ~2 times that of modern day conditions in the KBP to raise the
saturation point of N2 in the groundwater system. This is a narrower tipping point

Chapter Three: Economic Helium Reservoirs in the Mid-Continent United States
150
than that associated with the CKU samples which range between 2.5 and 5.5 times
greater than the N2 saturation threshold depending on the high 4He-associated N2
endmember value used. This discrepancy can be explained in two ways: firstly the
CKU was an area of continued uplift from the Precambrian to the Permian relative to
the Hugoton Embayment which in counterpoint was downwarped. Temperatures and
pressures in the Hugoton Embayment relative to the CKU would have been higher
overall due to burial thereby raising the saturation threshold for gases in that region.
Secondly, Sorenson, (2005) refers to a period in the late Tertiary when erosion and
evaporite dissolution of outcrops to the east of Kansas removed Cretaceous to
Permian overburden. This may have affected the Central Kansas Uplift by lowering
pressures and therefore decreasing the N2 saturation threshold in the region causing
high 4He-associated N2 to exsolve out of groundwater.
In summary, in the KBP and CKU 4He and high
4He-associated N2 which
was exsolving out of solution due to low pressures and possibly a depressurisation
event (the CKU may have already been exsolving high 4He-associated N2 and
4He
before this due to lower pressures) interacted with northward moving CH4 and low
4He-associated N2 sourced from the Anadarko Basin.
We cannot identify at which stage of thermal maturity the CH4 and N2 were
sourced in either the KBP or CKU due to lack of δ13
C values for samples however
since low 4He-associated N2 is present in the hydrocarbon gas it is likely that the
gases found in these fields were sourced during the Mesozoic and the less enriched
δ15
N values associated with the fields represents the dilution of an in place gas phase
by migrating hydrocarbons.
During the beginning of the Mesozoic the Hugoton Embayment was tilted
westwards by the Western Interior Seaway which might explain why the wells which

Chapter Three: Economic Helium Reservoirs in the Mid-Continent United States
151
would have been updip of this tilt (the eastern-most wells of the KBP) generally have
the highest δ15
N values in the study area (+3.45‰ to +4.70‰) (Sorenson, 2005).
It is difficult to determine what has affected each individual field in terms of
its δ15
N value which does not appear to fit any specific pattern. The variation may be
due to local effects which we do not currently have the geological information to
comment on. Gases in these fields are a mixture of low 4He-associated N2 which has
migrated northwards from the Anadarko Basin and high 4He-associated gases which
exhibit a predominantly shallow crustal radiogenic signature with 4He/N2 ratios
similar to the Hugoton part of the Hugoton-Panhandle field. This could indicate that
both the KBP and Hugoton field are dominated by a shallow sedimentary component
relative to a groundwater-driven basement/deep-sourced helium and nitrogen input.
In the CKU there either appears to be a general dilution of pre-existing gas
from south to north due to the addition of hydrocarbons from the Anadarko Basin or
there has also been an addition of 4He and
4He-associated gases to local reservoirs
either due to advection up faults or proximity to basement outcrops on the uplift.
These reservoir gases show predominantly basement-derived radiogenic ratios and
high 4He/N2 ratios relative to any sedimentary component.
The KBC samples which lie to the south of the study region and are close to
the Anadarko Basin show the same dependence as the Hugoton-Panhandle on CH4 to
start 4He and
4He-associated N2 exsolution. The KBC may also have experienced the
same depressurisation as the overlying layers due to there being evidence of
communication between the Carboniferous and Permian layers in the study areas
however it was not enough to bring 4He-associated N2 out of solution until CH4
migration out of the Anadarko Basin given current pressures and temperatures.

Chapter Three: Economic Helium Reservoirs in the Mid-Continent United States
152
The margin for reaching the saturation threshold in the KBC requires the
pressure to be lowered to only 1.2-1.4 times that of modern day pressures before
exsolution occurs therefore if any of the wells experienced a pressure fluctuation
then 4He-associated N2 would have exsolved without the need for CH4. Since only
one of the wells in the KBC, Maverick #1, shows δ15
N values similar to that in the
Hugoton-Panhandle and a correspondingly lower high 4He-associated N2 component,
the other wells may either have experienced degassing at some point in their history
which would have generated the low δ15
N values and high 4He and
4He-associated
N2 components.
The KBC also displays mixing with the Hugoton-Panhandle gas field
(Figure 3.8, Figure 3.13, Table 3.9) which is probably due to both areas sharing a
groundwater source. The well furthest to the east of the Hugoton field, Baughman H-
2, appears to show a decrease in N2/20
Ne indicating an increase in 20
Ne and therefore
groundwater contact. However, this is only one well and may be a local effect. There
does not appear to be any significant groundwater interaction with the eastern edge
of the Hugoton field showing that the system is potentially isolated from the regional
groundwater sourcing the Panhandle and KBC areas.
The KBP may also be within the same groundwater catchment however there
appears to be at least two episodes of degassing and re-solution associated with the
gas which is beyond the scope of this work.
3.6. Summary
The gases associated with reservoirs in the Hugoton-Panhandle, Kansas
Basin and Central Kansas Uplift areas are all composed of four main components:

Chapter Three: Economic Helium Reservoirs in the Mid-Continent United States
153
4He, CH4, organic N2 and
4He-associated N2 which are derived from a combination
of three possible sources.
The CH4 and low 4He-associated N2 components in all study areas are
sourced from the Anadarko Basin however they were not generated within the same
strata and they show low groundwater interaction; potentially indicating that the 20
Ne
associated with these components was stripped from porewater during migration. By
using a combination of δ15
N values and noble gas isotopes we established that the
low 4He-associated N2 endmember is shared by all samples and is characterised by
δ15
N = +14.60‰ which falls within the range of overmature sediments.
The bulk of the 4He and high
4He-associated N2 components show strong
associations with groundwater and there are two crustal N2 endmembers which can
either be characterised by: 1) δ15
N = -3.00‰, 4He/N2 = 0.043 and 2) δ
15N = -3.00‰,
4He/N2 = 0.089 or 3) δ
15N = +1.00‰,
4He/N2 = 0.036 and 4) δ
15N = +1.00‰,
4He/N2
= 0.072. Despite the differences in 4He/N2, the δ
15N values calculated fall within a
narrow range and are consistent with two types of crust; either a low grade
metamorphic release from the basement or the release of ammonia from clays.
The most likely scenario is that endmember 2) is the N2 endmember for the
basement in the region and endmember 3) is the N2 endmember for the sediments
(release of ammonia from clays). Samples show variable mixing between all three of
these endmembers.
Similar N2/20
Ne ratios and the same radiogenic mixing line indicates a
common groundwater source for both the Texas Panhandle and KBC areas. The
CKU wells indicate very little groundwater contact and gas in these reservoirs is
thought to have a significant portion added from depth by advection up faults.

Chapter Three: Economic Helium Reservoirs in the Mid-Continent United States
154
In the Hugoton-Panhandle and the KBC, groundwater is undersaturated in
high 4He associated N2 indicating the need for CH4 and organic N2 to already be in
place in order for the dissolved isotopes to partition into the reservoir as a gas phase.
The KBP and CKU on the other hand are oversaturated in high 4He-associated N2
therefore isotopes dissolved in the groundwater were already exsolving into the gas
phase in reservoirs before CH4 and N2 migrated into the reservoirs.
The 4He mass balances for the different study areas indicate that only up to
17% of the 4He found in reservoirs could have been sourced in situ, indicating that
the area involved with the sourcing of the 4He is not confined to the boundaries of
the study areas and most likely covers a significant portions of Texas and New
Mexico.

Chapter Four: The Geochemical Characteristics of the 4He-N2 source in Helium Systems
155
Chapter Four: The
Geochemical
Characteristics of the 4He-
N2 source in Helium
Systems

Chapter Four: The Geochemical Characteristics of the 4He-N2 source in Helium Systems
156
4.1 Introduction
Since the first discovery of natural gas containing 1.84% helium in Dexter,
Kansas in 1903 the USA has been the world’s largest producer, consumer and
exporter of helium. Total helium reserves and resources (including measured,
probable, possible and speculative) in the USA are estimated to be 20.6 x 10⁹ m
3
which is roughly 40% of the world’s total estimated helium reserves (USGS, 2017).
Commercially viable helium reservoirs are classified as those containing over
0.3% helium by volume of gas. The USA contains over 100 identified high helium
fields (defined as containing 0.3% by gas volume helium) however 92% of its
measured helium reserves are contained in three fields: Riley Ridge (Wyoming), the
Hugoton-Panhandle giant gas field (Oklahoma, Kansas and Texas) and the Cliffside
Federal Reserve situated in Bush Dome (which contains enriched helium gas from
the Hugoton-Panhandle).
Large scale, high volume production of liquified natural gas (LNG) in Qatar
and Algeria has enabled separation of helium as a by-product of the cryogenic
process involved. For such LNG plants the economic limit for concentration of
helium in the original natural gas is lower at <0.1%. The helium reserve associated
with Qatar’s North Dome Field (the world’s largest gas field) is estimated to be 10.1
x 109 m
3 despite helium concentrations in the field of around 0.04%. The helium
reserves estimated for this field is the equivalent of approximately 20% of the total
estimated world helium reserves (USGS, 2017).
Producing helium fields predominantly fall into three categories as defined
by the primary gas component: N2-rich (Pinta Dome, Harley Dome), CH4-rich
(Hugoton-Panhandle, North Dome/South Pars) and CO2-rich (LaBarge/Riley Ridge,

Chapter Four: The Geochemical Characteristics of the 4He-N2 source in Helium Systems
157
Doe Canyon). To date, most geochemical studies have been conducted on CH4-rich
high helium systems e.g.: the Hugoton-Panhandle and smaller fields in the Kansas
Basin and Central Kansas Uplift, and on CO2-rich high helium systems e.g.:
LaBarge/Riley Ridge and Doe Canyon (Ballentine and Sherwood-Lollar, 2002;
Gilfillan et al., 2008; Merrill et al., 2014; Chapter 3, this thesis). In this study we
present new data on N2-rich high helium systems from three wells in Utah, Montana
and Saskatchewan, Canada.
Following on from previous studies on the Hugoton-Panhandle, Kansas
Basin and Central Kansas Uplift systems we attempt to constrain the communal
crustal N2 isotopic endmember linked with high 4He concentrations in these regional
systems (Ballentine and Sherwood-Lollar, 2002; Chapter 3).
By using data from these new N2-rich wells which contain minimal CH4 and
therefore N2 linked to the production of hydrocarbons we can potentially determine
the N2 isotope endmember associated with the crust for these systems and whether it
is related to the endmember in the previous studies.
4.2 Geological context of the N2-4He rich wells
All N2-4He rich wells discussed in the sections below differ from the
Hugoton-Panhandle, Kansas Basin and Central Kansas Uplift samples discussed in
the previous chapter in that they are all orders of magnitude smaller and are N2-rich
4He systems rather than CH4-rich
4He systems (Figure 4.1).

Chapter Four: The Geochemical Characteristics of the 4He-N2 source in Helium Systems
158
Figure 4.1: Locations of all N2-4He rich wells relative to regional structures and the
Hugoton-Panhandle gas field.

Chapter Four: The Geochemical Characteristics of the 4He-N2 source in Helium Systems
159
4.2.1 Harley Dome, Grand Co, Utah, USA
The Harley Dome field is a NW plunging faulted anticline which lies on the
Uncompahgre Uplift; a 100 mile long NW-SE trending reactivated basement fault
spanning Colorado and Utah which has a maximum displacement of 500 ft (Keebler,
1956; Young, 1983). Harley Dome has 90 ft of structural closure (Dobbin, 1935)
(Figure 4.2).
Figure 4.2.: Location of Harley Dome (orange) relative to local geological structures.
Redrawn and modified from Case, 1966.

Chapter Four: The Geochemical Characteristics of the 4He-N2 source in Helium Systems
160
Helium-rich gas was discovered in the Entrada Sandstone (Jurassic) and also
the Salt Wash member of the Morrison Formation (Jurassic) (Dobbin, 1935; Otto
and Picard, 1976; Young, 1983). Documented percentages of helium record around
7% in the Entrada Sandstone and 2% in the Morrison Formation (Dobbin, 1935;
Winchester, 1935; Burchell, 1964). Readings from the Cretaceous-aged Dakota
Formation show 0.2% helium with an 84.2% methane content (Stowe, 1972; Young
1983). The Entrada Sandstone reservoir at Harley Dome is only 300 m above the
Precambrian-aged basement (1.05-1.81 Ma) due to the uplifted and eroded basement
core beneath (Osmond, 1964; Morgan and Chidsey Jr, 1991) (Figure 4.3).
Figure 4.3.: Generalised cross section from the Paradox Basin to the Uncompahgre
Plateau where Harley Dome is located. Modified from Young, (1983). The producing
reservoir for the Harley Dome field is circled in red on the diagram.
The Uncompahgre Uplift is a reactivated fault block of the Ancestral Rocky
Mountains; an amagmatic, intraplate, crustal-scale system of uplifts and basins

Chapter Four: The Geochemical Characteristics of the 4He-N2 source in Helium Systems
161
which occurred in the Carboniferous (Kluth et al., 1998; Kluth and DuChene, 2009).
It separates the Piceance Basin in Colorado from the Paradox Basin in Utah and acts
as the eastern boundary of the Colorado Plateau. The NW trending fault forms an
upwarp up to 100 miles long across the Colorado Plateau. The region shows
evidence of multiple reactivations of Precambrian basement faults culminating in the
formation of the current geological structures during the Laramide orogeny (Case,
1966).
The start of the Uncompahgre Uplift began in the SE of Utah during the
Pennsylvanian and moved NW into the Permian displaying vertical displacement of
several thousand feet (Baars and Stevenson, 1981). This pattern of activation was
due to pre-existing lines of weakness in the underlying Precambrian rocks which
were established as long ago as 1.7 Ga (Baars and Stevenson, 1981; Heyman, 1983).
During the Laramide Orogeny the Uncomphagre Uplift potentially acted as an
immovable basement fault block, deflecting thrusting from the event to maintain the
Colorado Plateau (Stokes, 1976; Baars and Stevenson, 1981). Movement along the
Uncompahgre fault ceased by the middle of the Triassic (Elston and Shoemaker,
1960).
The basement complex of the Uncompahgre Uplift and Plateau is composed
of a combination of gneiss and granite. Samples collected from the top of the
basement in the Uncompahgre Plateau in Rønnevik et al., (2017) show ages ranging
from 1.8-1.6 Ga (indicating either the age of the original Yavapai-Mazatzal province
or the age of granitic plutons in the region) from zircons to 63.5±4.0 Ma from
apatites. This lowered age indicates that temperatures in the region rose above ~70°C
(the apatite closure temperature) but did not reach the temperatures necessary to
cause the reset of zircon fission track ages (180-200°C) (Lippolt et al., 1994; Wolf et
Chapter Four: The Geochemical Characteristics of the 4He-N2 source in Helium Systems
162
al., 1996; Farley, 2000; Farley, 2002; Reiners, 2005; Shuster et al., 2006; Reich et
al., 2007; Cherniak et al., 2009; Hunt et al., 2012).
Subsequent modelling of the thermal history of the plateau suggests that
maximum burial occurred around 80 Ma. Temperatures at the top of the basement
are thought to have reached at least 90°C which corresponds to a burial depth of ~3
km (given a surface temperature of 11°C and a thermal of 25-30°C). This was
followed by uplift, exhumation and cooling during the Laramide Orogeny (65-60
Ma). It has also been suggested that a minor reheating event (50-80°C) occurred
during the early Oligocene which may be related to either elevated thermal gradients
or magmatism in the region (Rønnevik et al., 2017).
4.2.2 Rudyard field, Hill Co, Montana, USA
The Rudyard field is located on the Rudyard anticline; a minor structural
feature on the flank of the larger Sweetgrass Arch. The Sweetgrass Arch is a broad,
NW trending, structural upwarp which spans over 51,800 km2 in northern Montana.
The arch was initially created in the Precambrian/Cambrian with further epeirogenic
movement in the Jurassic however the current arch configuration is due to
deformation during the late stages of the Laramide orogeny (Peterson, 1957;
Nordquist and Leskela, 1968; Shepard and Bartow, 1968).
The east flank of the Sweetgrass Arch, where the Rudyard field is situated,
dips homoclinally until interrupted by two major areas of Tertiary igneous activity:
the Sweetgrass Hills (consisting of laccoliths) and the Highwood Mountains
(consisting of dikes, sills, laccoliths and extrusive rocks) (Figure 4.4).

Chapter Four: The Geochemical Characteristics of the 4He-N2 source in Helium Systems
163
Figure 4.4.: Locations of the Weil #1 well (blue) and International Helium Wood Mtn
well (pink) relative to local and regional geological structures and cratonic provinces.
The grey area denotes basement of < 2.5 Ga which includes the Wyoming craton and
Medicine Hat block. Modified from Vervoort et al., (2016).
The Rudyard field lies within the Western Canadian Sedimentary Basin
(WCSB). The Rudyard Anticline is a laccolith which intruded into the Cambrian
layer from the Precambrian below. Several of these laccoliths have been drilled and
documented in the region and are aligned along a NE trend which mirrors underlying
basement faults in the region (Connolly, 2012).
The underlying Precambrian rocks in the region are designated as part of the
Great Falls Tectonic Zone (GFTZ); a zone of NE-trending lineaments and high angle
faults which coincides with a zone of Tertiary-age magmatism. This zone stretches
from the Snake River Plain in SE Idaho to Saskatchewan (Armstrong, 1974; O’Neill
and Lopez, 1985; Dudás, 1991; Mueller et al., 2002). There are currently opposing
hypotheses as to how the GFTZ formed. Both Mueller et al., (2002) and Holm and
Schneider, (2002)’s geochronological and geochemical studies favour the

Chapter Four: The Geochemical Characteristics of the 4He-N2 source in Helium Systems
164
explanation that the GFTZ is a Palaeoproterozoic suture zone which developed due
to the subduction of a segment of oceanic crust and associated depleted mantle
which separated the Wyoming block from the Hearne-Medicine Hat block during the
formation of southern Laurentia whereas Boerner et al., (1998) found minimal
evidence to support this in their geophysical study and instead favoured the
explanation that the GFTZ is an Archean-aged reactivated intracontinental shear
zone. Recent work by Gifford, (2013) concludes that the GFTZ formed along the
margin of the Medicine Hat Block where it was subsequently reworked by collision
with the Wyoming Craton sometime after 1.8 Ga supporting the conclusions made
by both Mueller et al., (2002) and Holm and Schneider, (2002).
On a continental scale, the GFTZ is taken as the marker for the NW boundary
of the Wyoming craton (Condie, 1976; O’Neill and Lopez, 1985; Mueller et al.,
2002).
During the Tertiary (Eocene), the GFTZ Precambrian faults served as
conduits for potassic extrusives during a pulse of magmatic activity (O'Brien et al.,
1991; Lopez, 2000; Connelly, 2012). Occurring around 50 Ma this short-lived pulse
of activity started in what is now Idaho and moved northwards through Montana into
what is now Canada (Connelly, 2012). Geochemical and mineralogical analyses of
extrusives and intrusives from the region point to the interaction of a partially
melting asthenospheric mantle wedge (most likely the subducted Farallon plate) with
the Wyoming craton (O’Brien et al., 1991; O’Brien et al., 1995).
Basement outcrop exposures in the GFTZ at localities such as the Little Belt
Mountains show Palaeoproterozoic dioritic orthogneisses and migmatites which
have been intruded by mafic (amphibolites) dikes, pegmatites and post-tectonic

Chapter Four: The Geochemical Characteristics of the 4He-N2 source in Helium Systems
165
leucogranites. U-Pb and Ar-Ar ages from the location range from between 1.77-1.88
Ga (Gifford et al., 2014).
Despite evidence for basement faults acting as conduits the region has been
very stable over the course of geologic time with no evidence of significant
movement along the faults beneath the Rudyard field since the Precambrian
(Connelly, 2012).
Producing helium zones of interest in the Rudyard field are the Ordovician-
age Red River Formation and the Devonian-age Souris River Formation.
The Red River Formation, which contains a highly porous and permeable
dolomite gas pay zone, is divided into an Upper Member which is present in all
wells in the region and a Lower Member which is absent in the Weil #1 well. An
anhydrite bed known as the ‘Last Anhydrite’ forms an effective seal on top of the
Upper Red River Member in the Weil #1 well (Connelly, 2012). Reports show that
gases from this layer are predominantly high N2, high helium and the Lower Red
River Member is thought to be a stratigraphic trap leading to the hypothesis that the
gas found in the Upper Red River Member at Weil #1 is remigrated gas from the
Lower Red River Member however this has yet to be confirmed.
The Souris River Formation, which unconformably overlies the Red River
Formation, consists of a series of anhydrite-dolomite-limestone cycles and is thought
to be a structural trap. Gas shows have been recorded in dolomite beds underlying an
anhydrite layer. Reports of gas shows from this layer show considerable diversity
with records of N2, CH4, He and CO2. This has been interpreted as lack of
communication between the Devonian and Ordovician reservoirs which is also
suggested from differing pressure data from the two reservoirs (Connelly, 2012).

Chapter Four: The Geochemical Characteristics of the 4He-N2 source in Helium Systems
166
Pinch-out stratigraphic traps in the Sweetgrass Arch region have reportedly
been in place for around 500 Ma and the timing of the laccolith formation beneath
Rudyard is approximately 50 Ma (Connelly, 2012).
4.2.3 International Helium Wood Mountain, Saskatchewan, Canada
International Helium Wood Mountain is a single well located approximately
270 km NE of the Rudyard Anticline. It is situated on the east flank of the Bowdoin
Dome (Thompson, 1964). The Bowdoin Dome is a large structural uplift of
approximately 1550 km2 on the west flank of the intracratonic Williston Basin. It
plunges northwards from central Montana into Canada (Schroth, 1953; Rice et al.,
1990) (Figure 4.4). The basement beneath the Bowdoin Dome is highly fractured
and these fractures extend into southern Saskatchewan (Dyck and Dunn, 1986; Shurr
et al., 1993).
The helium reservoir at the Wood Mountain site is the Cambrian Deadwood
Formation. Despite the thickening of Cambrian-age sediments towards the Williston
Basin centre, for the most part, the sediment patterns for the Deadwood formation
show no evidence of basinal control on sedimentation (Kent, 1987).
The basement beneath the Wood Mountain field is most likely made up of a
significant Archean crustal component from either the Wyoming Craton or the
Medicine Hat Block. There is evidence from Sm-Nd dating in Collerson et al.,
(1990) that the south Saskatchewan region shows differential reworking of Archean-
aged crust by the Trans-Hudsonian orogeny due to the spread in ages (3.04-2.25 Ga).
Basement cores from southern Saskatchewan are composed of meta-igneous and

Chapter Four: The Geochemical Characteristics of the 4He-N2 source in Helium Systems
167
metasedimentary rocks which range from amphibolite facies to granulite facies
metamorphism.
In the Swift Current area, to the NW of the Wood Mtn well, the basement
consists of mafic tonalitic gneiss, massive orthoquartzite, granites, felsic volcanics
and high-level porphyry intrusions. Granitoids were extruded into Archean-aged
gneisses around 1.76 Ga (Collerson et al., 1990). The occurance of these granitoids
in the SW of Saskatchewan was broadly interpreted to be a potential continuation of
the NE-trending Great Falls Tectonic Zone termed the Swift Current Anorogenic
Province.
4.3 Sample collection and analytical techniques
Samples were collected in the field directly from the wellhead by connecting
a high pressure regulator with a 3/4" NPT adaptor to the wellhead. The regulator was
then attached to a 70 cm length of internally polished, refrigeration grade copper
tubing with a diameter of 3/8” via a length of high pressure hose. Well gas was then
flushed through the collection apparatus at pressures around 1 bar (atmospheric) for
approximately 10 minutes so as to decrease the possibility of air contamination
before the copper tube was cold welded at both ends by closing a pair of stainless
steel clamps. This follows the same procedures as Ballentine and Sherwood-Lollar,
(2002), Zhou, (2004) and Gilfillan, (2006).
Splits of each sample were taken in the lab not only for the purpose of
determining noble gas isotopic composition and concentration but also for the
analysis of nitrogen concentration and isotopes by University of Toronto. Noble gas
analyses were carried out at the Noble Lab at University of Oxford.

Chapter Four: The Geochemical Characteristics of the 4He-N2 source in Helium Systems
168
Stable helium isotopes 3He and
4He were specifically measured on the Helix
SFT mass spectrometer which has a split flight tube. This gives it the ability to
simultaneously measure both isotopes thereby decreasing the error on the
measurement.
All stable isotopes of the other noble gases (Ne, Ar, Kr and Xe) were
measured on the Argus VI mass spectrometer (see Methods Chapter).
All data errors are quoted at the 1σ level of confidence and include the
analytical, blank and standard errors. In the case of concentration errors the
expansion volume, pressure and relative prep volume errors are also included. All
error corrections on noble gas analyses were made during data reduction.
Due to the radiogenic nature of the majority of the samples, errors were 1.1%
to 2.3% for helium ratios however this does not affect sample reproducibility. Ratios
were the most affected in this respect due to the statistical counting error on the very
low 3He signal which at that early a stage in the laboratory setup was not yet
optimally adjusted.
During analyses mass peaks 40
Ar++
and 44
CO2++
which could cause major
interference to 20
Ne and 22
Ne signals respectively were monitored. Across all
samples it was determined that the 22
Ne signal of the sample was high enough that
the 44
CO2++
contribution was below 1% and therefore negligible. Corrections were
made accordingly to the 20
Ne signal of samples for 40
Ar++
interference during data
reduction which varied between 10.6% to 11.7% 40
Ar++
contribution following the
methods of Niedermann et al. (1993). Uncertainties in 40
Ar++
contribution were
propagated through to the final calculated error.
Nitrogen isotope analysis for all samples was undertaken at University of
Toronto using procedures detailed in Ballentine and Sherwood Lollar (2002) and

Chapter Four: The Geochemical Characteristics of the 4He-N2 source in Helium Systems
169
Sherwood Lollar et al., (1997). Individual errors on the δ15
N (‰) results range
between ±0.06 to 0.46‰.
4.4. Results
A total of 3 samples were collected from across North America for this part
of the study. These were collected from N2-4He rich wells at: Harley Dome in Utah,
Rudyard field in Montana and Wood Mountain in Saskatchewan, Canada.
Results discussed in the following sections pertain to the N2-4He rich wells
sampled only. For information on the Hugoton-Panhandle, CKU and Kansas Basin
samples please see Chapter 3.
In all samples 4He/
20Ne ratios are significantly higher than that of air (0.032)
and range between 18,616 and 219,090 (Kipfer et al., 2002). This indicates that there
is a negligible air contribution to 4He in samples and that increases to
3He/
4He ratios
are likely due to resolvable mantle contributions.

Chapter Four: The Geochemical Characteristics of the 4He-N2 source in Helium Systems
170
Sample well and
geological
province
Location
Lat/Long
Producing
Formation
Geological age
of formation 3He/
4He
(Ra) 20
Ne/22
Ne 21
Ne/22
Ne 40
Ar/36
Ar 38
Ar/36
Ar
Colorado Plateau
Harley Dome #1 39°11'13.32"N, 109°
8'52.95"W
Entrada
Sandstone
Jurassic 0.10
(0.001)
9.00
(0.029)
0.083
(0.0009)
4452 (10) 0.190
(0.002)
Harley Dome #1 0.11
(0.001)
9.03
(0.029)
0.083
(0.0009)
4448 (10)
Great Falls Tectonic
Zone
Weil #1 48°40'24.75"N,
110°33'44.44"W
Red River Ordovician 0.74 (0.01) 10.21
(0.037)
0.067
(0.0007)
8839 (50) 0.185
(0.003)
Weil #1 0.73 (0.01) 10.21
(0.034)
0.067
(0.0007)
International Helium
Wood Mountain
49°22'21.15"N, 107°
0'45.76"W
Deadwood
Formation
Cambrian 0.18
(0.004)
9.78
(0.036)
0.071
(0.0008)
7118 (33) 0.188
(0.004)
Table 4.1.: Noble gas ratios from N2-4He rich wells in this study. 1σ errors for samples are shown in brackets.

Chapter Four: The Geochemical Characteristics of the 4He-N2 source in Helium Systems
171
Table 4.2.: Noble gas concentrations, N2 concentrations and N2 isotope values from this study. Nitrogen concentrations for the samples are taken
from IACX well tests and are deemed to be within acceptable limits due to 4He concentrations from this study being within 1σ error of previously
recorded helium concentrations from wells. 1σ errors for samples appear in column headers as % or in brackets if variable.
Sample well and
geological province
4He concentration
(x 10-2
) (cm3 STP)
20Ne
concentration
(x 10-7
) (cm3
STP)
40Ar
concentration (x
10-4
) (cm3 STP)
84Kr
concentration
(x 10-8
) (cm3
STP)
130Xe
concentration
(x 10-10
) (cm3
STP)
N2
concentration
(±5%) (cm3
STP)
δ15
N(N2)
Colorado Plateau
Harley Dome #1 7.18 (0.10) 3.27 (0.031) 36.11 (0.34) 2.90 (0.09) 2.81 (0.03) 0.844 1.00 (0.06)
Harley Dome #1 7.03 (0.10) 3.24 (0.031) 35.83 (0.33)
Great Falls
Tectonic Zone
Weil #1 0.98 (0.01) 1.01 (0.010) 22.75 (0.23) 0.66 (0.02) 0.56 (0.01) 0.955 2.40 (0.20)
Weil #1 1.00 (0.01) 1.02 (0.010)
International Helium
Wood Mountain
1.06 (0.02) 0.84 (0.086) 19.92 (0.20) 0.70 (0.03) 0.79 (0.01) 0.960 1.40 (0.46)
Chapter Four: The Geochemical Characteristics of the 4He-N2 source in Helium Systems
172
4.4.1 Noble gases
4.4.1.1 Helium
The Ra values of the N2-4He rich samples (where 1 Ra is relative to the
atmospheric 3He/
4He ratio of 1.4 x 10
-6) vary dependent on location. The Harley
Dome well has a Ra value of 0.10, Weil #1 has a Ra value of 0.70 and International
Helium Wood Mountain has a Ra value of 0.17. The Ra values for these wells are
comparable to the Ra values from the Hugoton-Panhandle which range between 0.14
to 0.25 Ra. Out of the N2-4He rich samples only International Helium Wood
Mountain falls within the range of the Hugoton-Panhandle samples.
Magmatic contributions to the 4He concentration in samples are: 1.0% in the
Harley Dome sample, 8.6% in the Weil #1 sample and 1.8% in the International
Helium Wood Mtn sample, assuming a crustal endmember of 0.02 Ra and a MORB
mantle endmember of 8.0 Ra.
Concentrations of 4He in samples range from: 9.8 x 10
-3 cm
3STP(
4He)/cm
3 in
the Weil #1 well, to 1.06 x 10⁻²
cm3STP(
4He)/cm
3 in the International Helium Wood
Mtn sample, to 7.18 x 10⁻²
cm3STP(
4He)/cm
3 in the Harley Dome well.
Corresponding 3He concentrations for each sample are: 9.64 x 10
-9
cm3STP(
3He)/cm
3 for Weil #1, 2.46 x 10
-9 cm
3STP(
3He)/cm
3 for International
Helium Wood Mtn, and 1.00 x 10⁻⁸
cm3STP(
3He) for Harley Dome. Once again only
International Helium Wood Mtn falls into the range of a CH4-rich 4He system such
as the Hugoton-Panhandle gas field which has 3He concentrations between 6.8 x 10
-
10 to 3.3 x 10
-9 cm
3STP(
3He)/cm
3 (Ballentine and Sherwood, 2002; this study
Chapter 3).

Chapter Four: The Geochemical Characteristics of the 4He-N2 source in Helium Systems
173
4.4.1.2. Neon
20Ne concentrations in the N2-
4He rich well gases varies between samples
from: 0.84 x 10⁻⁷
cm3STP(
20Ne)/cm
3 in the International Helium Wood Mtn well to
1.01 x 10⁻⁷
cm3STP(
20Ne)/cm
3 in the Weil #1 well to 5.03 x 10
-7 cm
3STP(
20Ne)/cm
3.
These concentrations all fall within range of the 20
Ne concentrations recorded in the
Hugoton-Panhandle sample set which vary between 0.86 x 10⁻⁷
to 5.0 x 10⁻⁷
cm3STP(
20Ne)/cm
3 (Ballentine and Sherwood-Lollar, 2002; this thesis Chapter 3).
20Ne/
22Ne ratios across the N2-
4He rich wells varies between: 10.21 for the
Weil #1 well, 9.78 for the International Helium Wood Mtn sample and 9.00 for the
Harley Dome sample when compared with the air value of 9.80. Out of the N2-4He
rich wells International Helium Wood Mtn is again the only sample which falls into
the same range as the Hugoton-Panhandle samples of between 9.59 to 9.91.
The 21
Ne/22
Ne ratios are: 0.067 for Weil #1, 0.071 for International Helium
Wood Mtn and 0.083 for Harley Dome compared with the air value of 0.029. All N2-
4He rich samples show ratios which are significantly higher than the air ratio
indicating significant resolvable excesses of 21
Ne (21
Ne*). In these samples this
excess varies from 57.0%-65.4% of the 21
Ne concentration of the gas. All N2-4He
rich samples are significantly more enriched in 21
Ne* than samples from the
Hugoton-Panhandle dataset which exhibit 21
Ne concentrations ranging between
0.037-0.051.
The air, crust and mantle endmembers of 20
Ne/22
Ne and 21
Ne/22
Ne are well
defined and can be affected by both mass fractionation and mixing between
endmember groups. From the three neon isotopic graph it can be seen that the N2-
4He rich wells show potential mixing between different endmembers (Figure 4.5).

Chapter Four: The Geochemical Characteristics of the 4He-N2 source in Helium Systems
174
The Harley Dome sample can be interpreted as mass fractionation and/or a
mantle component addition has affected the sample which should fall along the air-
modern crust mixing line but is still close to it. It is notable that the CKU and KBC
samples from the Kansas sample set fall along the same air-crust mixing line which
could indicate that the CKU, KBC and Harley Dome share the same source rock.
Samples Weil #1 and International Helium Wood Mtn appear to be related to
the air-Archean crust mixing line identified by Lippmann-Pipke et al., (2011). This
could indicate a significant basement input to both these samples from crust which is
older than that associated with the CKU, KBC and Harley Dome samples.
Figure 4.5.: Three neon isotope graph showing isotopic ratios in samples relative to
predefined mixing lines for air-crust and air-mantle mixtures. All samples show
significant excesses of 21
Ne/22
Ne.
The mantle and crustal contributions to the 21
Ne* concentration can be
calculated from 20
Ne/21
Ne/22
Ne using methods outlined in Ballentine and O’Nions,
(1992) and Ballentine, (1997) assuming no mass fractionation of the samples. In all

Chapter Four: The Geochemical Characteristics of the 4He-N2 source in Helium Systems
175
N2-4He rich wells crustal
21Ne* dominates
21Ne* concentrations. The
21Ne*
concentration at the Harley Dome well is 99% sourced from modern crust with a
maximum resolvable MORB mantle component of 1%. The other N2-4He rich wells
have a maximum resolvable MORB mantle component of 2% for International
Helium Wood Mtn and 18% for Weil #1 when the source is assumed to be the
Archean aged endmember.
4.4.1.3 Argon
The 40
Ar/36
Ar ratios between the N2-4He rich samples vary from: 4452 in the
Harley Dome well, 7118 at International Helium Wood Mtn and 8839 at the Weil #1
well. All ratios are significantly higher than air which has a 40
Ar/36
Ar ratio of 295.5
indicating that there is a resolvable excess of radiogenic 40
Ar (40
Ar*). The 40
Ar*
concentration contributes between 93.4 to 96.7% of the total 40
Ar concentration
(Table 4.3).
It is not possible to separate out crust from mantle contributions with regard
to 40
Ar* in the N2-4He rich samples however it can be assumed that the dominant
contribution is from the crust with a potential mantle contribution to the Weil #1
well.
The ratios of atmospherically derived 38
Ar/36
Ar for samples Weil #1 and
International Helium Wood Mtn are within 1σ error of air values (where 38
Ar/36
Ar of
air = 0.188) (Table 4.1). The 38
Ar/36
Ar value for the Harley Dome sample is within
2σ of air.
4.4.1.4. Krypton and xenon

Chapter Four: The Geochemical Characteristics of the 4He-N2 source in Helium Systems
176
In the N2-4He rich wells
84Kr concentrations range from: 6.58 x 10
-9
cm3STP(
84Kr)/cm
3 in the Weil #1 well, 7.05 x 10
-9 cm
3STP(
84Kr)/cm
3 in the
International Helium Wood Mtn well and 2.90 x 10⁻⁸
cm3STP(
84Kr)/cm
3 in the
Harley Dome well. The Weil #1 and International Helium Wood Mtn wells have
84Kr concentrations in samples which are within 1σ error of each other whereas the
Harley Dome well has approximately 4 times more 84
Kr than those wells (Table
4.2).
The wells show 130
Xe concentrations from: 5.59 x 10⁻¹¹
cm3STP(
130Xe)/cm
3
in the Weil #1 well, 7.88 x 10⁻¹¹
cm3STP(
130Xe)/cm
3 for the International Helium
Wood Mtn well and 2.81 x 10⁻¹⁰
cm3STP(
130Xe)/cm
3 in the Harley Dome well.
Unlike for 84
Kr concentrations, Weil #1 and International Helium Wood Mtn are not
within 1σ error of each other and Harley Dome has up to 5 times more 130
Xe than
both these wells.
4.4.1.5. Crust-derived noble gases
The 4He/
21Ne* ratios for samples from this study are presented in Table 4.3.
All ratios for the N2-4He rich wells are significantly higher than the average observed
4He/
21Ne* value of 1.71±(0.09) x 10
7 and fall within range of values from the
Hugoton-Panhandle field (2.85±(0.62) x 107) (Ballentine and Burnard, 2002;
Ballentine and Sherwood-Lollar, 2002). However, both the Weil #1 and International
Helium Wood Mtn samples fall within error of theoretical values for crustal
4He/
21Ne* (2.33±(0.44) x 10
7). For the Harley Dome and International Helium Wood
Mtn wells the correction of both 4He and
21Ne* isotopes for magmatic contributions

Chapter Four: The Geochemical Characteristics of the 4He-N2 source in Helium Systems
177
does not significantly affect 4He/
21Ne* ratios however correction increases the
4He/
21Ne* ratio associated with the Weil #1 well gas.
Figure 4.6.: Plot showing the relationship between radiogenic 4He and
40Ar*
normalised to nucleogenic 21
Ne*.
Table 4.3.: Concentrations and ratios of the radiogenically produced isotopes in
samples. Errors are to 1σ.
Well name/geological
province 4He/
40Ar*
4He/
21Ne*
40Ar*/
21Ne*
21Ne*
(%)
40Ar*
(%)
Harley Dome 21.29 ±
0.50
3.66 ±
(0.16) x
107
1.72 ± (0.78)
x 106
64.3 93.4
Weil 4.45 ±
0.14
3.09 ±
(0.40) x
107
6.95 ± (0.92)
x 106
57.0 96.7
International Helium
Wood Mtn
5.56 ±
0.15
2.45 ±
(0.16) x
107
4.39 ± (0.30)
x 106
58.2 95.8
Average upper crust
(theoretical) (Ballentine
and Burnard, 2002)
6.0
2.33 ±
(0.44) x
107
3.88 ± (0.73)
x 106
Average upper crust
(observed) (Ballentine
and Burnard, 2002)
5.0±1.0
1.71 ±
(0.09) x
107
3.60 ± (1.27)
x 106

Chapter Four: The Geochemical Characteristics of the 4He-N2 source in Helium Systems
178
The northern-most N2-4He rich wells Weil #1 (Montana) and International
Helium Wood Mtn (Saskatchewan) show 4He/
40Ar* ratios which are within error of
average observed crustal production values (5.0 ±1.0). The Harley Dome well shows
4He/
40Ar* ratios which are higher than both the average crustal
4He/
40Ar* ratio and
4He/
40Ar* ratios measured in the Hugoton-Panhandle system (12.46±2.48) (Figure
4.6).
The 40
Ar*/21
Ne* ratios for the Weil #1 and International Helium Wood Mtn
wells fall close to and within error of the observed 40
Ar*/21
Ne* ratios for the average
crust as well as each other (6.95 x 10⁶ and 4.39 x 10
6 compared with 3.60±(1.27) x
106). The
40Ar*/
21Ne* ratio for the Harley Dome well is significantly lower than
average crustal ratio (1.72 x 10⁶ compared with 3.60±(1.27) x 10
6).
Only the Harley Dome well directly compares to 40
Ar*/21
Ne* ratios from the
Hugoton-Panhandle field (2.43 ± (0.81) x 106) despite the Hugoton-Panhandle, Weil
#1 and International Helium Wood Mtn falling within the range of average
40Ar*/
21Ne* crustal values. When ratios are corrected for magmatic contributions to
the 21
Ne* concentrations discrepancies from the average crustal 40
Ar*/21
Ne* increase
significantly for the Weil #1 well and less significantly for Harley Dome and
International Helium Wood Mtn.
In summary the Weil #1 and International Helium Wood Mtn wells show
4He/
21Ne* ratios,
40Ar*/
21Ne* ratios and
4He/
40Ar* ratios which are within error of
average crustal values whereas the Harley Dome well shows preferential enrichment
in 4He relative to
21Ne* and
40Ar*.
4.4.1.6. Relationships between 20
Ne and the crust-derived isotopes

Chapter Four: The Geochemical Characteristics of the 4He-N2 source in Helium Systems
179
Correlations between atmosphere-sourced 20
Ne and radiogenically-sourced
4He have been noted in studies on the Hugoton-Panhandle and also in Chapter 3 of
this thesis with regards to the Kansas Basin and Central Kansas Uplift (Ballentine
and Sherwood-Lollar, 2002). Strong positive correlations between these two
separately generated isotopes is thought to show mixing of the isotopes prior to their
degassing into reservoirs which is an indicator of varying degrees of groundwater
contact with the radioisotopes.
Since the N2-4He wells are all single wells with no spatial connection we
assume that groundwater does play a role in their individual sourcing such that
without the influence of groundwater there are no radioisotopes in the reservoir gas;
however this may not necessarily be the case (Figure 4.7).

Chapter Four: The Geochemical Characteristics of the 4He-N2 source in Helium Systems
180
Figure 4.7.: Plots showing positive correlations between radiogenically and
nucleogenically derived components a) 4He, b)
21Ne*, c)
40Ar* and groundwater-derived
20Ne. All lines and hypothetical lines (dashed) fall within error of the origin. Mixing lines
i) and ii) are trends observed in the previous chapter. Separate trends are observed for
the Weil #1 and International Helium Wood Mtn wells and the Harley Dome well with
the assumption that the radiogenic and nucleogenic isotopes in each well have been
degassed from groundwater.

Chapter Four: The Geochemical Characteristics of the 4He-N2 source in Helium Systems
181
It can be seen from the graphs that Weil #1 and International Helium Wood
Mtn appear to have very similar 4He/
20Ne ratios and
21Ne*/
20Ne ratios. These
radioisotopes have also experienced a greater degree of groundwater contact than the
4He and
21Ne* concentrations associated with the sample from Harley Dome.
However, the reverse to the above observations is seen in the graph for 20
Ne
vs 40
Ar* which appears to show mixing between the samples from Weil #1 and
International Helium Wood Mtn. These samples also show a lesser degree of
groundwater contact for 40
Ar* concentrations in the Weil #1 and International
Helium Wood Mtn samples compared with the Harley Dome sample. This shows the
fractionation of 40
Ar* relative to 4He and
21Ne* in the Harley Dome well which is
mirrored in the radiogenic ratios associated with the well (Figure 4.3). This
fractionation could have been caused by the inefficient release of 40
Ar* from
minerals compared with 4He and
21Ne* which is caused by the low thermal regime of
the region (Ballentine et al., 1994; Ballentine and Sherwood-Lollar, 2002).
4.4.2. Other Major Gases
4.4.2.1. Methane, ethane, propane and CO2
Methane is also present in the N2-4He wells with concentrations ranging
from: 2.5% in the Weil #1 well, 2.9% in the International Helium Wood Mountain
well and 7.5% in the Harley Dome well. Ethane and propane are also present in
Harley Dome and Weil #1 wells (0.23% and 0.02% in the Harley Dome well and
0.13% and 0.10% in the Weil #1). Due to the lack of data for International Helium
Wood Mtn we are unable to comment on any other associated gases. There is no

Chapter Four: The Geochemical Characteristics of the 4He-N2 source in Helium Systems
182
mention in previous literature as to the source of the methane or higher homologues
measured in reservoirs.
Carbon dioxide is present in gases from the Harley Dome and Weil #1 wells
(1.13% and 0.42%) of unknown origin.
4.4.2.2. Nitrogen
Nitrogen concentrations in the N2-4He rich wells are: 95.5% in the Weil #1
well, 96.0% in the International Helium Wood Mtn and 84.4% in the Harley Dome
well. Isotopic δ15
N values span a very narrow range for the N2-4He rich wells and
are: +2.40‰ in the Weil #1 well, +1.40‰ in the International Helium Wood Mtn
well and +1.00‰ in the Harley Dome well.
Due to the higher than air ratios associated with N2/40
Ar associated with all
N2-4He wells (233.8 to 482.0 compared with the air N2/
40Ar value of 84.0) we can
assume that there have been negligible additions of air-derived N2 to the samples or
air saturated water which has a N2/40
Ar ratio of 44.0.
This leaves three other possibilities as to the origin of the nitrogen in
samples: the crust, the mantle or the thermal cracking of over-mature hydrocarbons.
If we assume a N2/3He ratio for a Mid-Oceanic Ridge Basalt (MORB) mantle of 6 x
106 we can calculate the proportions of mantle-derived N2 associated with the
samples (Ballentine and Sherwood-Lollar, 2002). This gives mantle-derived N2
contributions to the N2 concentrations of samples of: 6.1% for the Weil #1 well,
1.5% for the International Helium Wood Mtn well and 7.1% for the Harley Dome
well.

Chapter Four: The Geochemical Characteristics of the 4He-N2 source in Helium Systems
183
Less than 8% of the total nitrogen in wells is associated with a mantle source
therefore the majority of the N2 concentrations measured in wells must be sourced by
a combination of crust and hydrocarbons. However, because CH4 concentrations
measured in wells are less than 8% of the total gas concentration it is more likely that
the majority of the N2 was sourced from crustal rocks.
4.4.3. Relationships between N2 and the crust-derived noble gases
In general high N2 concentrations are positively correlated with high 4He
concentrations although in the case of the Weil #1 and International Helium Wood
Mtn wells this is not necessarily the case when compared with the Harley Dome well
(Figure 4.8). In the Weil #1 and International Wood Mtn wells 4He/N2 ratios are the
same at 0.010 whereas in the Harley Dome well the 4He/N2 ratio is 0.085. While the
4He concentrations in the Weil #1 and International Wood Mtn wells are not the
lowest sampled in the entire dataset (Appendix B), their N2 concentrations are the
highest in the wells sampled. This combination of factors places them outside the
‘lower limit’ for 4He/N2 ratios associated with helium producing fields of between
0.02 and 0.20 into which the Harley Dome sample still fits.
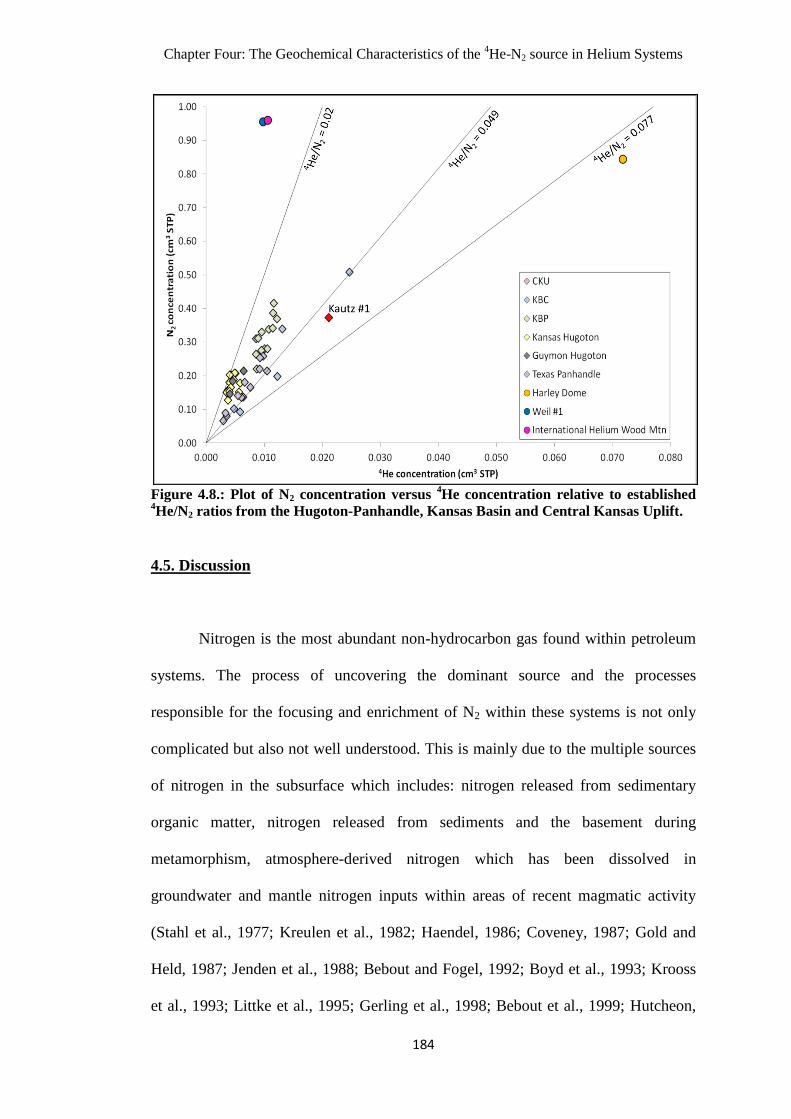
Chapter Four: The Geochemical Characteristics of the 4He-N2 source in Helium Systems
184
Figure 4.8.: Plot of N2 concentration versus
4He concentration relative to established
4He/N2 ratios from the Hugoton-Panhandle, Kansas Basin and Central Kansas Uplift.
4.5. Discussion
Nitrogen is the most abundant non-hydrocarbon gas found within petroleum
systems. The process of uncovering the dominant source and the processes
responsible for the focusing and enrichment of N2 within these systems is not only
complicated but also not well understood. This is mainly due to the multiple sources
of nitrogen in the subsurface which includes: nitrogen released from sedimentary
organic matter, nitrogen released from sediments and the basement during
metamorphism, atmosphere-derived nitrogen which has been dissolved in
groundwater and mantle nitrogen inputs within areas of recent magmatic activity
(Stahl et al., 1977; Kreulen et al., 1982; Haendel, 1986; Coveney, 1987; Gold and
Held, 1987; Jenden et al., 1988; Bebout and Fogel, 1992; Boyd et al., 1993; Krooss
et al., 1993; Littke et al., 1995; Gerling et al., 1998; Bebout et al., 1999; Hutcheon,

Chapter Four: The Geochemical Characteristics of the 4He-N2 source in Helium Systems
185
1999; Weinlich et al., 1999; Zhu et al., 2000; Boyd, 2001; Ballentine and Sherwood-
Lollar, 2002).
This problem with identifying the nitrogen endmembers associated with
gases is complicated further; not only by the overlapping ranges quoted for the
nitrogen isotopic values of the nitrogen endmembers but also by the uncertainty in
the isotopic range of the endmembers (Zhu et al., 2000; Boyd, 2001).
It has been noted in previous literature that occasionally high N2
concentrations are associated with high 4He concentrations in gas fields (Cady and
McFarland, 1906; Cady and McFarland, 1907a; Dobbin, 1935; Zartman and
Wasserburg, 1961; Pierce et al., 1964; Poreda et al., 1986; Gold and Held, 1987;
Jenden et al., 1988b; Jenden and Kaplan, 1989; Stilwell, 1989; Hiyagon and
Kennedy, 1992; Hutcheon, 1999; Ballentine and Sherwood-Lollar, 2002; Gilfillan,
2006). Fields which produce 4He-rich gases (where
4He makes up 0.1%≤ of the gas
volume) almost always contains high N2 concentrations; usually within a 4He/N2
range of 0.02 to 0.20. However, the inverse is not true; we do not always find high
4He concentrations in conjunction with high N2 concentrations which shows the
variation of N2 sources within natural gas fields.
The close association of N2 with crustal-radiogenic sourced 4He has been
used to support a metasedimentary or crystalline origin for the associated nitrogen.
This was also proposed as the source of the N2 endmember associated with 4He in
the previous chapter which expanded on the study conducted on the Hugoton-
Panhandle by Ballentine and Sherwood-Lollar (Jenden et al., 1988b; Ballentine and
Sherwood-Lollar, 2002).
In this section we discuss the possible origins and characteristics of the 4He-
associated N2 endmember as characterised by the 3 sampled N2-4He-rich wells and

Chapter Four: The Geochemical Characteristics of the 4He-N2 source in Helium Systems
186
whether this component is related to groundwater in the regions in a similar way to
the CH4-4He rich Hugoton-Panhandle, Kansas Basin, or Central Kansas Uplift study
areas outlined in the previous chapter. We then apply these characteristics to
literature values from CO2-4He fields: McCallum, McElmo Dome, St John’s Dome
and Doe Canyon to observe whether we can determine the local/regional controls on
the 4
He source to all wells (Gilfillan et al., 2008).
4.5.1. The N2 isotopic endmember for 4He
In the previous chapter we expanded on the study conducted by Ballentine
and Sherwood-Lollar in 2002 on the CH4-4He rich Hugoton-Panhandle gas system
and identified that most samples from the Hugoton-Panhandle, Kansas Basin and
Central Kansas Uplift could be adequately explained by the three component mixing
of two 4He associated N2 endmembers of varying
4He/N2 endmember composition
(0.089 for the upper mixing line and a hypothetical lower mixing line with an
endmember at least twice as low) and a common N2 endmember which was not
associated with 4He and had an enriched δ
15N isotopic value of approximately
+14.60‰ (Figure 4.9).
It is difficult to determine the cause of the low 4He/N2 ratios below the lower
limit mixing line however it is either due to mixing between a lower 4He/N2
endmember which is unique to those samples and the rest of the dataset or that the
gases in those reservoirs have experienced greater dilution by the migration of CH4
from the prolifically hydrocarbon-producing Anadarko Basin located to the south of
the study areas.

Chapter Four: The Geochemical Characteristics of the 4He-N2 source in Helium Systems
187
Interestingly the 4He-associated N2 endmembers appeared to fall within a
very narrow δ15
N range and were in agreement with the δ15
N value of -3.00‰
calculated in the previous study by Ballentine and Sherwood-Lollar, (2002). This
alongside evidence from the associated radiogenic ratios of the gases and the helium
mass balance calculated for the system led us to the conclusion that both these 4He-
associated N2 endmembers were dominantly sourced from the low temperature
metamorphism of the crust (Zhu et al., 2000).
Despite the agreement between both studies of the potential source for the
4He associated N2 endmember none of the CH4-rich wells sampled were within range
of the endmember nitrogen isotopic value to confirm this extrapolation. To better
constrain these endmember characteristics, we sampled 3 N2-rich 4He wells for
which there was a lack of publically available noble gas analyses until this study.
In the graph below we present the first evidence which may confirm the
consistently low δ15
N characteristic of the N2 endmember predominantly associated
with the source of 4He in North American high
4He well gases.

Chapter Four: The Geochemical Characteristics of the 4He-N2 source in Helium Systems
188
Figure 4.9.: Plot of 4He/N2 vs. δ
15N(N2). Mixing lines shown are a) the KBC samples
excluding the anomalously low #1 Blew well (circled), b) International Helium Wood
Mtn and Weil #1 wells and, c) the KBP and Kansas Hugoton samples.
From Figure 4.9 it can be observed that there is a commonality between the
Harley Dome sample and the KBC wells which make up the upper mixing limit of
the Mid-Continent dataset from the previous chapter. This is particularly of interest
since these wells are seemingly unrelated; they have significantly different
geological histories and are over 800 km apart, however, they share nearly the same
enriched 4He/N2 endmember and potentially the same δ
15N isotopic endmember.
This is most likely either due to common process or a common source rock for 4He
and N2.
As a single well it is difficult to determine whether the δ15
N value of the
Harley Dome sample is the product of mixing between multiple N2 endmembers or
is the representation of just one N2 endmember.

Chapter Four: The Geochemical Characteristics of the 4He-N2 source in Helium Systems
189
From the composition of the noble gas isotopes outlined in the results section
the radiogenic and nucleogenic content of the gas is not purely crust-derived which
gives a potential mantle-sourced contribution to the Harley Dome system of
approximately 7%. This concentration of N2 is not significant to the total N2
concentration and therefore mixing would most likely not affect the δ15
N value
indicating that the dominant source of N2 and 4He to the reservoir is either from the
release of ammonium from clay-rich sediments (+1‰ to +4‰) or from the low
temperature metamorphism of the crust (-5‰ to +4‰) (Zhu et al., 2000).
Another interpretation of the Harley Dome sample is that it experienced an
input from an enriched N2 endmember which has been sourced from devolatilised
crust that has degassed most of its 4He and has become progressively enriched in
15N
over time (Haendel et al., 1986; Boyd, 2001). However, the Harley Dome sample
radiogenic isotopes show high 4He/
21Ne* concentrations and low
40Ar*/
21Ne* ratios
therefore it is unlikely that high heat and pressure has facilitated the release of 4He in
this region otherwise radiogenic ratios would exhibit close to average crust
radiogenic ratios instead of radiogenic ratios which indicate a low temperature,
relatively shallow thermal environment.
The International Helium Wood Mtn and Weil #1 wells also indicate a
commonality between their 4He/N2 endmember ratio which is around 6 times lower
than the Harley Dome 4He/N2 endmember ratio. These wells show similar
4He/N2
ratios, radiogenic ratios and fall within a very narrow range of N2 isotopic values
(+1.45‰ to +2.45‰). These wells either share a regional source rock or a similar
production and mixing mechanism is at work in both locations.
Despite the narrow range of N2 isotopic values shared by the high N2-4He
wells there is a wide range of 4He/N2 values associated with these wells. These

Chapter Four: The Geochemical Characteristics of the 4He-N2 source in Helium Systems
190
differences in ratio could be caused by: differing accumulation times before release,
variations in the N2 content of the source rock, differences in uranium content
relative to N2 in the source rock or dilution of the 4He/N2 by CH4 due to prior
degassing of N2 and 4He before the introduction of a hydrocarbon gas phase such as
in the KBP fields (Chapter 3, this thesis).
The common characteristics between these wells appear to be dependent on
region but represent the regional release of 4He and
4He-associated N2 with distinct
4He/N2 endmember ratios. Since these are regional trends the systems still need a
focusing mechanism which, like in the Hugoton-Panhandle system, could be
provided by groundwater.
4.5.2. Groundwater (20
Ne) relationships with 4He and N2
In the previous chapter it was determine that groundwater (examined via the
proxy of the 20
Ne isotope) played a major role in transporting and focusing 4He and
4He-associated N2 in the Hugoton-Panhandle, Kansas Basin and Central Kansas
Uplift systems. Three main interactions were seen in well gases based on mixing
trends and the saturation threshold calculated for each study area: 1) groundwater
was under-saturated relative to depth and pressure controlled saturation threshold
leading to 4He-associated N2 degassing in the presence of CH4, 2) groundwater was
oversaturated in 4He-associated N2 relative to depth and pressure controlled
saturation threshold leading to 4He-associated N2 degassing without the need for CH4
to be present as a gas phase and 3) groundwater was heavily oversaturated in 4He-
associated N2 relative to depth and pressure controlled saturation threshold leading to

Chapter Four: The Geochemical Characteristics of the 4He-N2 source in Helium Systems
191
the conclusion that a significant portion of the gas present was transported into the
reservoir as a free gas phase from depth.
In this section we perform similar calculations to those in Chapter 3 Section
3.4.1.7. to not only calculate whether the groundwater at the time of field discovery
would have been oversaturated or undersaturated in 4He-associated N2 but also, if the
reservoir is oversaturated, to determine at what depth the saturation threshold starts.
In the following calculations presented in Table 4.4, all N2 in the N2-4He rich
wells is assumed to be sourced from the groundwater.
Study
Area
N2/20
Ne
(x 106)
4He-associated
N2
concentration
in groundwater
(cm3STP(N2)/
cm3)
N2 concentration
saturation point
in groundwater
under reservoir
conditions
(cm3STP(N2)/
cm3)
Reservoir
conditions:
pressure
(atm)/
salinity
(M)NaCl/
depth (m)
Depth at
which
saturation
threshold
is reached
under
reservoir
conditions
(m)
Harley
Dome 2.58 0.46 0.18 10.5/0.17/288 1050
Weil #1 9.46 1.69 0.89 129.3/4/1676 3130
Internation
al Helium
Wood Mtn
11.37 2.03 1.28 190.5/4/2499 3570
Table 4.4.: Comparisons of N2 saturation in groundwater compared to modern
reservoir conditions. Reservoir conditions for the Harley Dome well sourced from
Dobbin, (1935) and Downs, (2009); reservoir conditions for the Weil #1 well sourced
from Connelly, (2012); reservoir conditions for the International Helium Wood Mtn
well sourced from Thompson, (1964).
From the calculations of 4He-associated N2 observed in the fields it can be
seen that all three N2-4He rich wells contain groundwater oversaturated in
4He-
associated N2. The Harley Dome well is the most oversaturated of these wells at
approximately 2.6 times higher than the N2 saturation threshold. Notably the
International Helium Wood Mtn and Weil #1 wells are 1.6-1.9 times higher than the
N2 saturation threshold. The oversaturation of these wells indicates that a pre-

Chapter Four: The Geochemical Characteristics of the 4He-N2 source in Helium Systems
192
existing gas cap was not required for 4He-associated N2 to begin degassing and that
the 4He and N2 in these systems is almost entirely sourced from groundwater.
In all wells the depth of the limit of the N2 saturation threshold appears to
start within the underlying basement, indicating the potential for the mobilisation
and degassing of fluids containing 4He-associated N2 and
4He from depths up to 3.5
km below the producing reservoir in the case of the International Helium Wood Mtn.
The shallow depth (~1 km) associated with the Harley Dome field N2
saturation threshold supports the radiogenic ratios exhibited (Figure 4.6) which
indicate a low temperature, shallow crustal source. The same can be observed of the
deeper crustal saturation threshold associated with the Weil #1 and International
Helium Wood Mtn wells which show radiogenic ratios similar to average crustal
values (Figure 4.10).
Figure 4.10.: Plot showing groundwater-derived 20
Ne vs radiogenic-sourced 4He where
both variables are normalised to N2. Mixing lines a) and b) are from the previous
dataset (Chapter 3, this thesis). Hypothetical mixing lines (dashed): c) includes only the
International Helium Wood Mtn and Weil #1 wells and d) includes only the Harley
Dome sample. The area highlighted red denotes a potential zone of low groundwater
Kautz #1

Chapter Four: The Geochemical Characteristics of the 4He-N2 source in Helium Systems
193
contact with gases which may indicate that sample gases were exsolved into traps
shortly after mixing with groundwater.
From Figure 4.10 the N2-4He-rich wells have all experienced significantly
less groundwater contact than the CH4-rich Hugoton-Panhandle and Kansas Basin
systems except for the Kautz #1 well from the CKU samples which falls along
mixing line c) associated with the International Helium Wood Mtn and Weil #1
wells. The International Helium Wood Mtn and Weil #1 wells have 4He/N2 and
20Ne/N2 ratios which are within error of each other which potentially indicates both a
similar source and amount of groundwater contact.
The N2-4He rich wells and the Kautz #1 well all fall within a lower
groundwater contact region (designated on Figure 4.10. as a highlighted red zone)
which could indicate the degassing of a significant portion of the 4He-associated N2
and 4He as a free gas phase; a condition which is stipulated for explaining the highly
oversaturated Kautz #1 well (Chapter 3, this thesis). However, we do not observe the
extent of oversaturation seen in the Kautz #1 well in any of the N2-4He wells; in fact
the extent of oversaturation in these wells is similar to that seen in the KBP and
McCune 1-A wells from the Kansas Basin and Central Kansas Uplift datasets.
We propose that this similarity could still be due to the introduction of a free
gas phase contacting groundwater before degassing into reservoirs so reservoirs
which show an oversaturation of 4He-associated N2 greater than ~2x the saturation
limit may indicate the interaction of a free gas phase with groundwater; the higher
the degree of oversaturation, the less contact the free gas phase has had with local
groundwater.
4.5.3. Characterising the groundwater component of 4He-rich fields

Chapter Four: The Geochemical Characteristics of the 4He-N2 source in Helium Systems
194
By looking at other wells and calculating saturation thresholds for literature
data we may be able to begin to characterise the groundwater relationship between
4He-rich fields (<0.1%
4He). The
4He-rich fields for which N2 saturation is
calculated below are all CO2-4He rich fields from Gilfillan et al., (2008) due to the
scarcity of noble gas datasets for 4He-rich fields. The assumption is made that all N2
in these fields is sourced from the crust and therefore associated with the 4He.
Study
Area
Average
N2/20
Ne
(x 107)
Range of 4He-
associated N2
concentration in
groundwater
(cm3STP(N2)/cm
3)
Range of N2
concentration
saturation points in
groundwater under
reservoir
conditions
(cm3STP(N2)/cm
3)
Depth
range
(m)
Depth at
which max
saturation
threshold is
reached
under
reservoir
conditions
(m)
McCallum
Field,
Colorado,
USA
1.57 1.39-5.19 1.06-1.29 1500-
1900 4890
McElmo
Dome,
Colorado,
USA
0.65 0.61-2.52 1.45-2.09 1800-
2600 3010
Doe
Canyon,
Colorado,
USA
0.24 0.43 0.35 2550 3050
St John’s
Dome,
Arizona,
USA
0.05 0.08-0.09 0.39 200-
700
Table 4.5.: Comparisons of N2 saturation in groundwater compared to modern
reservoir conditions for CO2-rich helium reservoirs. For McCallum and St John’s
Dome a hydrostatic gradient (1 atm/m) and a salinity of 4M is assumed due to lack of
data on these aspects of reservoir conditions. Reservoir depths are sourced from
Gilfillan, (2006) except for: 1) the Doe Canyon well which has instead derived the depth
of the reservoir from the USGS, 1995 and the reservoir pressure of 51.0 atm from Back
et al., (2012) and 2) McElmo Dome which was calculated with a pressure of 175.6 atm
at 2107.7 m depth and salinity of 0.86M NaCl from Gerling, (1983). The temperature
gradient at locations is assumed to be 30°C/km.

Chapter Four: The Geochemical Characteristics of the 4He-N2 source in Helium Systems
195
Unlike the N2-4He rich wells there are variations within the different CO2-
rich fields. In the McCallum Field all wells sampled by Gilfillan et al., (2008) are
oversaturated with regard to the N2 saturation threshold at that depth whereas St
John’s Dome is undersaturated with N2 concentrations approximately 4 times lower
than the saturation threshold. From the previous study this indicates to us that the
4He associated N2 gas in St John’s Dome required an in-place gas phase before
groundwater degassing of N2 and 4He took place. In this case the in place gas phase
was most likely CO2 instead of CH4. This is the opposite of the McCallum field
which, due to N2 oversaturation of the groundwater, did not require an in place gas
phase to begin degassing N2 and presumably associated 4He into pre-existing traps.
This was then most likely diluted by the introduction of CO2 into the reservoir.
Despite the low 20
Ne associated with the field, the McElmo Dome shows
under-saturation of N2 in groundwater relative to the N2 saturation threshold except
in one well, HD-2, which is oversaturated in N2. There is no clear geological reason
as to why this well would be unique however the N2/20
Ne ratio from that well is
within 1σ error of other wells which are below the saturation threshold, therefore
given the large uncertainty associated with the reservoir parameters too it is likely
that all wells at McElmo Dome are under-saturated in N2. Interestingly the Doe
Canyon reservoir, which is oversaturated in N2, is only 5 km away from McElmo
Dome but is apparently from a separate, structurally isolated field (Gilfillan, 2006).
Gilfillan et al., (2008) postulated that there were active groundwater flow
regimes associated with the McElmo Dome, St John’s Dome and McCallum field
which was causing the re-dissolution of CO2 into the groundwater phase due to an
influx of undersaturated freshwater. This influx of freshwater potentially containing
4He-associated N2 and associated radiogenic gases (
4He,
21Ne* and
40Ar*) may have

Chapter Four: The Geochemical Characteristics of the 4He-N2 source in Helium Systems
196
contacted the resident CO2 gas phase which lead to the degassing of 4He-associated
N2 and associated gases into these reservoirs while at the same time CO2 was being
dissolved into solution; a similar mechanism to that associated with the CH4-rich
Hugoton-Panhandle and KBC datasets. Data from the St John’s Dome also shows
that 4He and N2 are positively correlated to closer proximity and depth to the gas-
water contact in the fields (Gilfillan, 2006).
The McCallum field may not have as straightforward a mechanism as St
John’s Dome and McElmo Dome since it also seems to have a significant CH4
component associated with reservoir gases; the source of which has not been
determined and the groundwater-derived noble gases from the field indicate that
closed system batch equilibration (either dissolution into or degassing of noble gases
from groundwater) may have occurred across the field.
Figure 4.11.: Plots showing groundwater-derived
20Ne vs radiogenic
4He where both
variables are normalised to N2. a) Original trend from Ballentine and Sherwood-
Lollar, (2002) (Hugoton-Panhandle without the Sarah Claybaugh and Donelson, et al.
samples), b) Southern KBP samples. The intersection of all lines of best-fit are within
error of the origin.
a) b)

Chapter Four: The Geochemical Characteristics of the 4He-N2 source in Helium Systems
197
Despite the lack of N2 isotopic data from these fields if we apply the same
assumptions to CO2-rich fields as with N2-rich and CH4-rich fields then the 4He in
these fields should be associated with a crust-sourced N2 component which are both
positively correlated with groundwater (20
Ne). However we do not have enough data
at this time to definitively confirm this for these fields.
4.6. Summary
Spatially unrelated N2-4He rich wells from both the south and north of North
America show a relatively narrow range of N2 isotopes which are preferentially
depleted in 15
N (+1.00‰ to +2.45‰) indicating a source which is most likely low
temperature metamorphosed crust. In the northern wells (International Helium Wood
Mtn and Weil #1) radiogenic ratios are within error of average crustal ratios and this
combined with the depth of wells to basement most likely indicates that the source is
from the underlying basement, however, for the Harley Dome well, the source is
considerably shallower (< 1km) and could be either basement or sediment derived.
Despite the narrow range of δ15
N values, these wells have a wide range of
4He/N2 endmembers which are remarkably consistent within each locality (0.010 to
0.011 in the north and 0.085 to 0.089 in the south). This polarisation of the 4He/N2
endmembers may either be related to the chemical composition of the underlying
source rocks in the regions or the accumulation time within the source rocks before
the release of 4He-associated N2 and associated radiogenic isotopes.
All N2-4He rich wells show consistently less groundwater contact than in the
Hugoton-Panhandle-Kansas Basin dataset and lie in the range of the Kautz #1 well

Chapter Four: The Geochemical Characteristics of the 4He-N2 source in Helium Systems
198
from the Central Kansas Uplift samples which may indicate contact between a free
gas phase and groundwater before degassing into reservoirs. CO2-rich wells in the
south record 4He/N2 ratios of up to 0.254 in the Doe Canyon field showing
enrichment in 4He which could be explained by a longer accumulation time in the
crust before release.
In all fields the mechanism for 4He and associated N2 degassing into
reservoirs appears to be related to the groundwater and the saturation threshold of
4He associated N2. In cases where the groundwater is oversaturated in
4He-associated
N2, groundwater degassing will occur without the need for a primary gas cap such as
CH4 or CO2 to be present in the reservoir, occasionally allowing the formation of N2-
rich 4He field unless it is diluted by another gas. Conversely, in cases where the
groundwater is undersaturated in N2, contacting a primary gas cap is needed in order
for the exsolution of 4He-associated N2 to occur and with it
4He and other associated
noble gas isotopes.

Chapter Five: High helium systems in Tanzania
199
Chapter Five: High
helium systems in
Tanzania

Chapter Five: High helium systems in Tanzania
200
5.1. Introduction
Following on from previous chapters the key geological features which an
area must have in order to be considered potentially helium-rich are: 1) an area of
stable crust which has been quiescent for a significant period of geological time, 2)
the area has then been disturbed by a more recent tectonic event such as orogeny or
rifting and 3) there are trapping structures in place for the released crust-derived
gases from the tectonic event.
An area which potentially fits all three of these key features is Tanzania
which contains: 1) the Archean-aged Tanzanian Craton and surrounding mobile belts
which have been stable since at most 2.7 Ga, 2) rifting and associated volcanism
occurred around the craton and mobile belts from approximately 25 Ma onwards and
3) trapping structures have been reported in this region for the rift basins in the
Western Rift Arm such as the Rukwa Basin and the Albert Basin (Figure 5.1). The
Rukwa Basin is of particular interest for helium exploration due to recent
developments in the region by the exploration company Helium One.
The region surrounding the Tanzanian Craton offers a unique opportunity for
a first look at a ‘play fairway’ analysis for helium exploration which could
potentially be used to further narrow down basin areas that could contain helium-rich
reservoirs. The following sections detail the stages involved in the ‘play fairway’
analysis of the Tanzania region and culminate in a ‘play fairway’ analysis of the
areas surrounding the craton.

Chapter Five: High helium systems in Tanzania
201
Figure 5.1.: Modified from Chorowicz, (2005). The position of the full study region in
relation to the rest of Africa (red box).

Chapter Five: High helium systems in Tanzania
202
5.2. The geological history of Tanzania
The Archean-aged Tanzanian Craton, which has been radiometrically dated
as between 2.5-1.8 Ga, lies in the centre of Tanzania within the East African Plateau
in-between two branches of the East African Rift System (EARS) (Figure 5.2). It is
approximately 350,000 km2 and has an average elevation of 1.3 km (Weeraratne et
al., 2003). The craton was emplaced around approximately 2.7 Ga and is primarily
composed of granite-greenstone terranes with ages upward of 2.4 Ga (Pinna et al.,
1994; Dawson, 2008). Greenstone belts within the craton typically show greenschist
to amphibolites facies metamorphic grade however granulite facies metamorphism is
present within the Dodoman gneiss belts to the south. This shift in metamorphic
grade from north to south has been speculated to be due to domains within the craton
being produced from different depths of the crust (Borg and Shackleton, 1997).
The Tanzanian Craton has experienced several collisional events in the early
stages of its geological history resulting in the mobile belts surrounding its
perimeter. The Usagara (2.0-1.8 Ga) and Ubendian (2.1-1.8 Ga) mobile belts formed
via subduction-related accretion against the craton in the early Proterozoic to the
southeast and southwest (Quennell et al., 1956; Dawson, 2008; Boniface et al.,
2012).
Metamorphism within the Usagaran Belt has been determined as
predominantly high-grade granulite and eclogite facies with a low-grade overprint
from reworking by the Pan-African Orogeny (Lenoir et al., 1994; Möller et al.,
1995). The Ubendian Belt has a similar composition to the Usagaran and displays
the same degree of medium to high-grade granulite facies metamorphism with
terranes within the belt consisting of gneiss and granite. Localised eclogite facies in
Chapter Five: High helium systems in Tanzania
203
the region point to maximum temperatures of 17 kbar and 900°C. Close to the
Rungwe Volcanic Province (RVP) in the south, the Mbozi terrane contains syenite
and granulite (Lenoir et al., 1994).
The eastern Mozambique Belt was formed by a younger, late Proterozoic
oblique collisional event (<1.3 Ga) thought to be between east and west Gondwana
and was subsequently reworked by the multistage Pan African Orogeny (950-550
Ma) (Muhongo and Lenoir, 1994; Lenoir et al., 1994; Mruma, 1995; Fritz et al.,
2005; Vogt et al., 2006; Dawson, 2008; Macheyeki et al., 2008). Within the belt,
estimated values for peak granulite facies metamorphism are 12–13 kbar and 750–
800°C. Post this stage retrogression to amphibolites facies occurred (Sommer et al.,
2003).
The Cenozoic-aged East African Rift System (EARS) is one of the few
modern examples of a currently active intracontinental rift zone. The EARS consists
of two main branches: the younger, less volcanically active Western rift valley and
the older, volcanic Eastern (Gregory) rift valley. The Eastern Branch of the EARS is
approximately 2200 km long and runs from the Afar Triangle in the north to
terminate against the Tanzanian Craton at the North Tanzanian Divergence whereas
the Western Branch is approximately 2100 km long running from Lake Albert to
Lake Malawi.
In Tanzania the initiation of the first stage of rifting for the south propagating
Western branch is determined to be around 12 Ma whereas most of the Eastern
branch of the EARS had been established by approximately 20 Ma (Delvaux, 1991;
Wescott et al., 1991; Burke, 1996; Morley et al., 1999; Nyblade and Brazier, 2002).
More recently the Western Branch has been determined to have been initiated earlier
than previously measured at around 25 Ma (Roberts et al., 2012).

Chapter Five: High helium systems in Tanzania
204
The pattern of EARS rifting around the Tanzanian Craton, most likely caused
by the displacement of melt from a shallow plume beneath the craton, has been
preferentially channelled by the mobile belts which have thinner, weaker lithosphere
beneath them than the craton and therefore presented areas of weakness susceptible
to fault reactivation and volcanism (Ebinger et al., 1997; Weeraratne et al., 2003)
(Figure 5.2). This ensures that faulting caused by the rift arms is confined to the
edges of the craton which has left the majority of the cratonic interior untouched.

Chapter Five: High helium systems in Tanzania
205
Figure 5.2: Map showing rift sediments (yellow) and volcanoes (orange triangles) in relation to the Tanzanian Craton (red dashed line), surrounding
mobile belts, and the study areas (North Tanzanian Divergence (red box) and the Mbeya area (blue box).

Chapter Five: High helium systems in Tanzania
206
Within the EARS rift arms are half graben rift basins. The infilling sediments in
these basins are usually from Permian to Pliocene in age and show evidence of the
more recent local tectonic events which shaped the region (Delvaux et al., 1991;
Roberts et al., 2004; Roberts et al., 2012). In the Western rift branch these
sedimentary sequences can be up to 11 km thick in some basins including the Rukwa
Basin (the site of one of the samples from the Mbeya study area) (Wheeler and
Karson, 1994).
5.3. Prior precedent for 4He release in Tanzania
From the previous section we have established the presence of three
components in Tanzania which would aid in producing viable helium-rich reservoirs:
1) a stable craton and surrounding mobile belts which have been tectonically
quiescent for at up to 2.5 Ga, 2) a younger tectonic event (25-20 Ma) which is
causing heating and faulting of the previously stable crust and 3) localised
sedimentary basins near the tectonic event which may contain trapping structures.
From previous literature and this study we also have evidence that thermal springs in
the region are actively producing high N2 and 4He gases; another indication that this
region may contain viable helium reservoirs.
Thermal springs, both high temperature and low temperature are common but
unevenly distributed features within the EARS and have attracted interest in the past
due to their potential for commercial salt deposits, noble gases and geothermal
energy (Nzaro, 1970; Omenda, 2005; Macheyeki et al., 2008; Delvaux et al., 2010;
Kalberkamp et al., 2010; Kraml et al., 2010; Kraml et al., 2014; Harðarson, 2014;
Kandie, 2014).

Chapter Five: High helium systems in Tanzania
207
Thermal spring systems clearly follow parallel to the fault systems providing
further evidence that these faults are open and active and linked to an underground
geothermal system which has been of interest in the past (Hochstein, 2000;
Mnjokava, 2007).
Gas samples for this study were taken from thermal springs at 7 locations:
Eyasi, Balangida, Gonga, Mponde, Ivuna (Rukwa Basin), Idindiro and Rukwa in 2
main areas on both the Eastern and Western rift branches: 1) on the Eastern Branch
the study area (red box) is within the Northern Tanzanian Divergence and 2) on the
Western Branch the study area (blue box) is the Rukwa Basin and Rungwe Volcanic
Province (Figure 5.2).
Previous literature measuring the gas composition of the thermal springs in
our first sample study area the North Tanzanian Divergence (NTD) was recorded by
James (1967a) who found that the gas emanating from the thermal springs at the
locations was predominantly N2 and 4He-rich (Figure 5.3a).
James (1967b) determined that in general the thermal springs in the Northern
Tanzanian Divergence area were situated within basement rocks in basins or areas
with little to no overlying sediments. It was also observed that the thermal springs
were relatively far from centres of volcanic activity such as the Crater Highlands and
that most springs in that region were connected with major faults which were most
likely basement-linked faults (Macheyeki et al., 2008).
James (1967b) proposed a mixed mantle-meteoric source for the origin of
gases from the thermal springs however, until this study, no isotopic analyses were
conducted on the gases to either confirm or reject this hypothesis.

Chapter Five: High helium systems in Tanzania
208
Figure 5.3.: Maps showing the positioning of previous 4He concentrations (blue circles)
in comparison with new 4He concentration data and Ra values in the NTD and Mbeya
study areas (yellow circles). a) NTD study area; old data is from James (1967) and is in
relation to the craton margin (red line), volcanoes (orange triangles) and main faults
(black lines). NMBR stands for (Natron-Manyara-Balangida Rift). b) Mbeya study

Chapter Five: High helium systems in Tanzania
209
area; old data is from James, (1967a) and Barry et al., (2013) and is in relation to
volcanoes (orange triangles) and main faults (black lines).
Literature values can be found in both James, (1967a) and Barry et al., 2013 on our
second study area in the Western branch of the EARS (Figure 5.3b).
Barry et al., (2013) measured low 4He concentrations and high CO2
concentrations in sampled thermal springs from the Ngozi-Songwe hydrothermal
system and the Rungwe Volcanic Province (RVP) consisting of the Ngozi, Rungwe
and Keijo volcanoes. They concluded from gas and water analyses that the amount
of crustal contamination seen in their samples was controlled by: 1) the proximity of
the sample areas to the RVP, 2) the extent of the gas interaction with the
hydrothermal system and 3) the extent of rifting in the region which controls the
release and therefore input of crustal 4He.
In contrast, James, (1967a) recorded high concentrations of 4He within the
Rukwa Basin of around 4.2% and high N2 with it which potentially substantiates the
observations made by Barry et al of increasing crustal signal distal from volcanoes in
the region.
5.3.1. Determining the 4He potential of Tanzania
Now that we have identified Tanzania as an area which fulfils two of the
criteria for our helium exploration methology: 1) it has an area/areas of crust which
have been stable for a long period of geological time enabling them to accumulate
high 4He concentrations (the Tanzanian Craton and surrounding mobile belts from at
most 2.7 Ga) and 2) these areas of crust have been disturbed by a relatively recent
tectonic event (the EARS from 25-20 Ma depending on the rift branch) plus an extra

Chapter Five: High helium systems in Tanzania
210
point 3) active degassing of N2-4He rich gases from thermal springs, we can perform
a simple 4He mass balance calculation to estimate the maximum volume of
4He
which can potentially be produced within the Tanzanian system and compare this to
estimates from the under investigation Rukwa Basin.
Within the Tanzanian helium system we can identify 4 distinct producing
areas of interest which are related to the sample study areas outlined in the previous
section. These areas are: 1) the Tanzanian Craton (350,000 km2), 2) the Ubendian
Belt (75,000 km2), 3) the Usagara Belt (57,600 km
2), 4) the North Tanzanian
Divergence (NTD) which consists of parts of the reworked Usagaran Belt,
Mozambique Belt and the Tanzanian Craton however for the purposes of the
calculation is confined to the Gregory (Eastern) rift arm (42,500 km2), and on a local
scale 5) the Rukwa Basin within the Ubendian Belt (12,800 km2) (Figure 5.4).
For each crustal production area it is assumed due to the information
available on the underlying basement that: 1) the crust to a depth of 10 km is a
potential source of 4He, 2) the bulk homogenous crust has an average U and Th
content (2.8 ppm and 10.7 ppm respectively) despite measurements regarding the
Musoma-Mara greenstone belt (Tanzanian Craton) of < 18.70 ppm U and < 52.1
ppm Th (Manya et al., 2007; Mshiu and Maboko, 2012), 3) the basement has an
average crustal density of 2.7 cm3/g and 4) the basement is primarily granitic and has
an average porosity of 0.64% (Chaki et al., 2008).
Differing metamorphic grades within lithologies can be responsible for the
redistribution of uranium and thorium in the crust. It has been shown in studies that a
degree of U depletion and redistribution occurs when rocks pass from pyroxene
facies to granulite facies during high grade metamorphism which can be as severe as
< 75% (Moorbath et al., 1969; Rosholt et al., 1973). Whether this has occurred

Chapter Five: High helium systems in Tanzania
211
within the study areas is uncertain since no whole rock analyses for U-Th-Pb have
been conducted on either the Ubendian or Usagaran Belts. However, in the
Mozambique Belt overprinting by several thermal events can be deduced from U-Pb
dating of zircons from the region; indicating U and Pb loss as the zircons were reset
by each event (Coolen et al., 1982). In an attempt to constrain this factor the
youngest zircon ages recorded in each region are taken to be the last time the system
was reset by a major thermotectonic event and that since the event average U
concentrations have been generating 4He volumes.
For the Rukwa Basin two scenarios are considered: 1) time since the
underlying basement was last disturbed by a tectono-thermal event and 2) time since
the first deposition of sediments in the basin (the Karoo Supergroup). For the
calculations the thickness of sediments in the Rukwa Basin is averaged to be 7.5 km
(Delvaux et al., 1998) and the porosity is averaged to be 16.5% (Baiyegunhi et al.,
2014) (Table 5.1).
Region and age of last
major thermotectonic
zircon reset event prior to
rifting
Reset event
Helium
volume
produced
(m3)
Source area
(km2)
References
Tanzanian Craton (2.4 Ga) Last phase of
metamorphism 1.7 x 10
13 350,000
Pinna et al.,
1994;
Weeraratne
et al., 2003
Ubendian Belt (570 Ma)
Reworking
during the
Pan-African
Orogeny
7.4 x 10¹¹
75,000
Boniface et
al., 2012;
Boniface
and Schenk,
2012
Southern Usagaran Belt
(570 Ma)
Reworking
during the
Pan-African
Orogeny
5.7 x 10¹¹
57,600
Reddy et
al., 2004;
Boniface et
al., 2012
North Tanzanian
Divergence (2.0 Ga)
Accretion onto
the Tanzanian
craton
1.6 x 10¹²
42,500
Ebinger et
al., 1997;
Dawson,
2008

Chapter Five: High helium systems in Tanzania
212
Rukwa Basin (basement)
(570 Ma)
Reworking
during the
Pan-African
Orogeny
1.3 x 10¹¹
12,800
Wescott et
al., 1991;
Boniface et
al., 2012
Rukwa Basin (sediments)
(260 Ma)
Deposition of
the Karoo
Supergroup
3.3 x 10¹⁰
12,800
Wescott et
al., 1991;
Delvaux et
al., 1998;
Baiyegunhi
et al., 2014
Table 5.1.: Helium volume produced from different parts of the Tanzanian system.
When the 4He volumes calculated above are compared to the probable
4He
reserves calculated for the Rukwa Basin of 1.5 x 10⁹ m
3 it is observed that the
basement beneath the Rukwa Basin could supply the entire reserve by releasing only
1.2% of its produced 4He volume when efficient migration and trapping in the region
are assumed.
The Tanzanian Craton and the surrounding mobile belts have the capability
of producing vast 4He volumes totalling at least 2.0 x 10
13 m
3 (STP) since the last
period of crust stability before rifting. From the above helium mass balance
calculations it is apparent that generating a reserve on the potential scale of the
Rukwa Basin does not require the efficient release of gases from source in this
region and that the release of helium-rich gases is still occurring during modern
times which could indicate that newer traps are being filled in the Tanzania region.
The potential reserves estimated for the Rukwa Basin are the equivalent of the
supply for approximately 14 years worth of global helium demand.
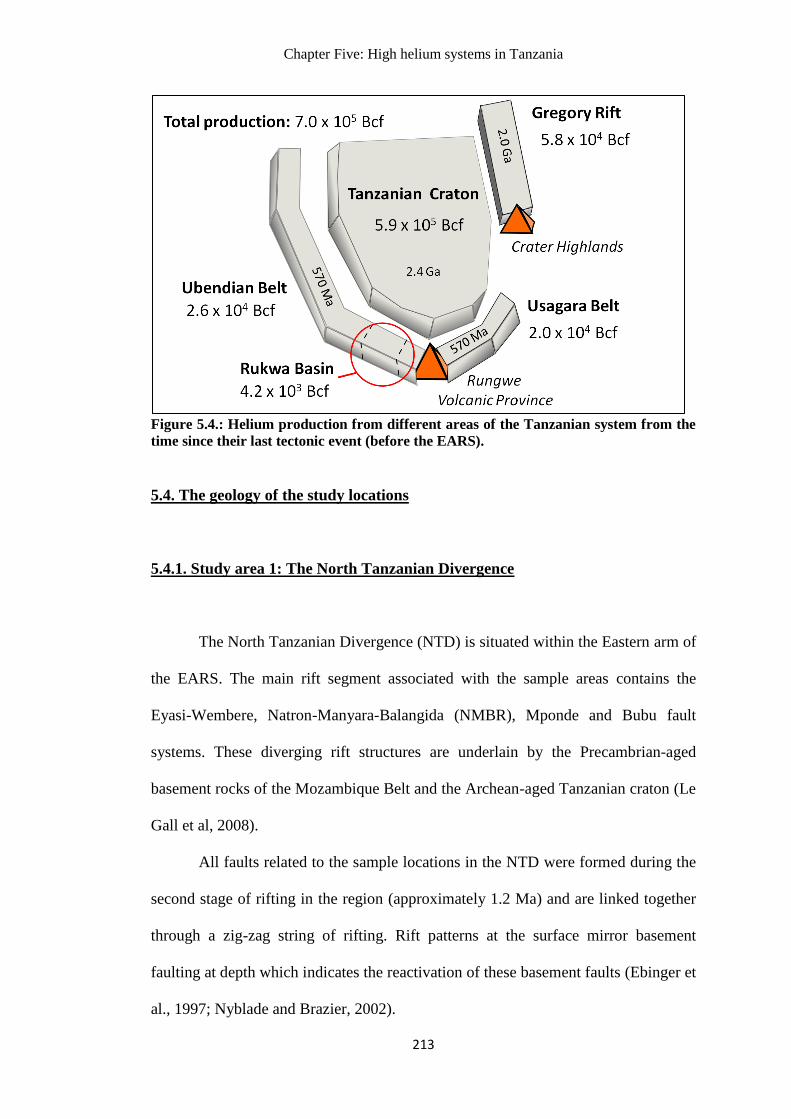
Chapter Five: High helium systems in Tanzania
213
Figure 5.4.: Helium production from different areas of the Tanzanian system from the
time since their last tectonic event (before the EARS).
5.4. The geology of the study locations
5.4.1. Study area 1: The North Tanzanian Divergence
The North Tanzanian Divergence (NTD) is situated within the Eastern arm of
the EARS. The main rift segment associated with the sample areas contains the
Eyasi-Wembere, Natron-Manyara-Balangida (NMBR), Mponde and Bubu fault
systems. These diverging rift structures are underlain by the Precambrian-aged
basement rocks of the Mozambique Belt and the Archean-aged Tanzanian craton (Le
Gall et al, 2008).
All faults related to the sample locations in the NTD were formed during the
second stage of rifting in the region (approximately 1.2 Ma) and are linked together
through a zig-zag string of rifting. Rift patterns at the surface mirror basement
faulting at depth which indicates the reactivation of these basement faults (Ebinger et
al., 1997; Nyblade and Brazier, 2002).

Chapter Five: High helium systems in Tanzania
214
Fault-bounded half-graben basins up to 3 km deep are only documented
along the Eyasi and Manyara parts of the rift (Ebinger et al., 1997).
The rift structures in the NTD do not represent the termination of the Eastern
rift system; EARS related extension still exists approximately 600 km south of the
region where it may link into the Western branch of the EARS around the Mbeya
Triple Junction (Le Gall et al., 2004; Le Gall et al., 2008).
5.4.1.1. Eyasi
The Eyasi Basin is a half-graben split into two sub-basins. The sub-basins are
thought to either be separated by a section of uplifted basement beneath the main
basin) or by a transfer fault (Ebinger et al., 1997; Foster et al., 1997). The eastern
part of the basin is strongly bounded by the Eyasi fault (100 km long) to the NW. On
the opposite side of the basin the faults are smaller in length (<10 km) and probably
represent faulting of the central basement upwarp that splits the main basin in two.
The Eyasi Basin is relatively shallow (1-2 km) (Ebinger et al., 1997; Dawson, 2008).
Volcanic units at Eyasi are only exposed at the northern-most margin of the
basin which is the nearest to the Crater Highlands. These volcanics are derived from
the nearby Crater Highlands; specifically from eruptions of the Lemagrut and
Oldeani volcanoes around approximately 5.5 Ma.
The last movement along the Eyasi-Wembere Fault has been dated to after
3.1 Ma ± 0.3 Ma which postdates the formation of the Crater Highlands.
5.4.1.2. Balangida
The thermal spring is situated in the half-graben Balangida Basin which lies
along the Balangida fault. The Balangida Basin is separated from the Manyara Basin

Chapter Five: High helium systems in Tanzania
215
by uplifted metamorphic rocks (Dawson, 2008). Nearby volcanoes are Hanang (1.5-
0.9 Ma) and Labait; with Hanang occupying the eastern end of the Balangida Basin.
There is a potential high temperature thermal anomaly around the southern end of
the east propagating rift near Labait which may indicate that this rift arm is still
propagating (Foster et al., 1997; Dawson, 2008).
Archean-aged basement rocks of the Tanzanian craton are exposed
throughout the area indicating very little cumulative extension and subsidence took
place. The depth of the Balangida Basin is believed to be very shallow compared
with other rift basins in the same region and has been estimated to have a depth of <
1 km (Ebinger et al., 1997; Dawson, 2008).
Balangida and Eyasi are thought to be linked by rifting in the area via two
branches of the Eastern Rift (the Natron-Manyara-Balangida and the Eyasi-
Wembere). These two rifts are known to transect the boundary between Archean and
Proterozoic aged crust (Foster et al., 1997).
5.4.1.3. Gonga
The Gonga thermal spring is situated on a segment of the Bubu fault; a
seismically active normal fault. Evidence of oldest event along the Bubu fault was
carbon dated to a maximum of 8536 years indicating that it is a very recent fault
which is prone to cyclic earthquake events (Macheyeki et al., 2012). Predicted
earthquakes for some of the fault segments are up to magnitude 7.8 indicating the
fault is potentially deep and the throw on most of the fault segments are on a km
scale.

Chapter Five: High helium systems in Tanzania
216
The Bubu fault crosses the Chenene Mountains which was uplifted by a
thrust fault between the Mozambique Belt and the Tanzanian Craton (Macheyeki et
al., 2008; Msabi, 2010).
5.4.1.4. Mponde
The Mponde thermal spring is situated on the Mponde fault which is a
seismically active normal fault within the Tanzanian craton (Macheyeki et al., 2008;
Macheyeki et al., 2012). There is not much background literature around this area
aside from previous gas component measurements of the thermal springs (James,
1967a; Walker, 1969).
5.4.2. Study area 2: The Mbeya Triple Junction
The Mbeya Triple Junction is thought to be an accommodation or transfer
zone between the Rukwa, Livingstone and Usangu rift segments (Ebinger et al.,
1989; Morley et al., 1990; Delvaux and Hanon, 1991; Delvaux, 2001). The Mbeya
Triple Junction acts as the confluence for the Eastern and Western rift branches with
the RVP in the middle of all three rift segments (Delvaux and Hanon, 1991;
Mnjokava, 2007; Fontijn et al., 2010; Barry et al., 2013).
The Rukwa-Livingstone rift segment developed during the Permian-Triassic
and was rejuvenated during the Mesozoic. The Usangu Basin developed in the
Cenozoic which coincided with the second reactivation of the Rukwa-Livingstone
rift segment and the onset of volcanism in the RVP (Ebinger et al., 1989; Delvaux
and Hanon, 1991; Delvaux et al., 1992).

Chapter Five: High helium systems in Tanzania
217
The Rukwa Basin, a NW trending half-graben, is bordered by the SW
dipping Lupa fault which runs approximately NW-SE towards the RVP and the
Livingstone rift segment. The orientation of the basin is thought to have been
determined by the fabric of the pre-existing Precambrian Ubendian belt and
Permian-aged rift alignment beneath the basin. The basin lies between the Tanganika
and Malawi rifts (Delvaux and Hanon, 1991; Morley et al., 1992; Delvaux, 2001;
Roberts et al., 2012).
The Rukwa Basin contains up to 11 km thick sediments and is currently
under investigation for its viability as a high helium reservoir by the helium
exploration company Helium One.
5.5. New results from Tanzania
In this section we present both the gas composition and noble gas makeup of
the thermal spring gases sampled within the two study areas outlined in previous
sections. All samples were collected by Dr Pete Barry (University of Oxford) and
Thomas Abraham-James (Helium One). All noble gas measurements were conducted
at the Noble Lab, University of Oxford and gas compositional analyses were
conducted by Dr Thomas Darrah at Mendenhall Laboratory, Ohio (Tables 5.3 and
5.4).
In all samples 4He/
20Ne ratios are significantly higher than that of air (0.032)
and range between 330 and 8920. Air corrections to Ra ratios in samples have no
significant effect on the Ra value. This indicates that there are negligible air
contributions to 4He concentrations in samples which means that
3He/
4He ratios

Chapter Five: High helium systems in Tanzania
218
which deviate from purely crustal ratios (0.020 Ra) are likely due to resolvable
mantle contributions.

Chapter Five: High helium systems in Tanzania
219
Table 5.2.: Noble gas ratios for both study regions. 1σ errors for samples are shown in brackets.
Sample name 3He/
4He (Ra)
20Ne/
22Ne
21Ne/
22Ne
40Ar/
36Ar
38Ar/
36Ar
Study area 1 (NTD)
Balangida 0.053 (0.001) 9.74 (0.030) 0.031 (0.0003) 544 (1.2) 0.186 (0.0005)
Balangida 0.052 (0.001) 9.73 (0.030) 0.031 (0.0003) 549 (1.0) 0.186 (0.0005)
Gonga 0.039 (0.001) 9.71 (0.030) 0.029 (0.0003) 432 (1.1) 0.183 (0.0006)
Eyasi 0.046 (0.004) 9.72 (0.030) 0.029 (0.0003) 440 (1.5) 0.187 (0.0006)
Mponde 0.040 (0.002) 9.71 (0.030) 0.030 (0.0004) 410 (0.8) 0.184 (0.0005)
Study area 2 (Mbeya)
Idindiro 0.69 (0.01) 10.04 (0.033) 0.030 (0.0003) 303 (0.2) 0.187 (0.0003)
Rukwa 3.45 (0.005) 10.04 (0.033) 0.030 (0.0003) 331 (0.9) 0.182 (0.001)
Rukwa 3.45 (0.005) 10.04 (0.033) 0.030 (0.0004) 336 (0.6) 0.184 (0.001)
Ivuna 0.18 (0.01) 9.68 (0.029) 0.032 (0.0004) 787 (0.8) 0.185 (0.0003)
Air (Porcelli et al., 2002) 1 9.80 (0.080) 0.029 (0.0003) 295.5 (0.5) 0.188 (0.0004)

Chapter Five: High helium systems in Tanzania
220
Table 5.3.: Noble gas concentrations and N2 concentrations from this study. 1σ errors for samples appear in brackets except for N2 where no errors
were provided.
Sample name 4He concentration (cm
3 STP)
(x 10-2
)
20Ne concentration (cm
3 STP)
(x 10-5
)
40Ar concentration (cm
3 STP)
(x 10-2
)
N2 concentration (cm3
STP)
Study area 1 (NTD)
Balangida 10.6 (0.42) 1.19 (0.015) 1.47 (0.042) 0.90
Balangida 10.4 (0.42) 1.17 (0.016) 1.59 (0.021) 0.90
Gonga 8.4 (0.35) 1.88 (0.033) 1.69 (0.043) 0.95
Eyasi 4.3 (0.29) 1.30 (0.016) 1.21 (0.020) 0.95
Mponde 2.7 (0.11) 1.10 (0.019) 1.11 (0.019)
Study area 2 (Mbeya)
Idindiro 0.04 (0.002) 0.028 (0.0004) 0.73 (0.017)
Rukwa 0.0047 (0.0002) 0.014 (0.0004) 0.029 (0.0008)
Rukwa 0.0043 (0.0002) 0.012 (0.0003) 0.025 (0.0006)
Ivuna 2.5 (0.04) 0.22 (0.0011) 0.46 (0.002) 0.96
Air (Porcelli et al.,
2002) 0.000524 (0.000006) 1.65 (0.0036) 0.93 (0.001) 0.78

Chapter Five: High helium systems in Tanzania
221
5.5.1. Helium
The 3He/
4He ratio (Ra) varies considerably both between and within study
areas. Samples from study area 1 (NTD) have consistently low Ra values which
range between 0.039 to 0.053 whereas samples from study area 2 (Mbeya) have a
larger range of values between 0.18 to 3.45. From the Ra values alone it can be
observed that samples from study area 1 show predominantly crustal Ra values
(where 0.020 Ra = crust) whereas study area 2 shows a move towards a more
magmatic signature (where 6.10 Ra = Sub-Continental Lithospheric Mantle or
SCLM) (Gautheron and Moreira, 2002).
Concentrations of 4He are above air concentrations throughout the samples
however there is a significant split in concentration between the NTD samples and
the Mbeya samples. Samples from the NTD are consistently high 4He; ranging from
2.7 x 10⁻²
to 10.6 x 10⁻²
cm3STP(
4He)/cm
3 whereas the Mbeya study area contains
samples which show differences of orders of magnitude in 4He concentrations from
4.3 x 10-5
to x 2.5 x 10-2
cm3STP(
4He)/cm
3 (Figure 5.3).
Magmatic contributions to the 4He concentrations in the NTD samples are
between 0.3% and 0.5% assuming a crustal endmember of 0.020 Ra and a SCLM
endmember of 6.10 Ra and magmatic contributions to 4He concentrations in the
Mbeya study area are significantly higher at 2.6% to 56.5%.
5.5.2. Neon
The concentration of 20
Ne in both study areas varies depending on the area.
In the NTD samples concentrations range from 1.10 x 10⁻⁵
to 1.88 x 10⁻⁵

Chapter Five: High helium systems in Tanzania
222
cm3STP(
20Ne)/cm
3 whereas the samples from the Mbeya study area exhibit lower
concentrations of 20
Ne of between 1.20 x 10⁻⁷
to 2.20 x 10⁻⁶
cm3STP(
20Ne)/cm
3
(Table 5.3).
20Ne/
22Ne ratios and
21Ne/
22Ne ratios in the study areas all fall within 1σ error
of air values (where the air 20
Ne/22
Ne ratio = 9.80 and 21
Ne/22
Ne ratio = 0.029)
(Table 5.2).
5.5.3 Argon
The 40
Ar/36
Ar ratios in the Tanzanian study areas show variations within the
study areas. In the NTD samples ratios vary between 410 and 549 and within the
Mbeya area samples range from 303 to 787 compared with the air ratio of 295.5.
Due to all samples being significantly above the air ratio it can be observed that all
samples have a resolvable 40
Ar excess (40
Ar*). 40
Ar* contributes 27.9-46.1% of the
NTD samples 40
Ar concentrations and 2.3-62.4% of 40
Ar concentrations in the
Mbeya study area.
The ratios of 38
Ar/36
Ar for samples, which determine atmospheric
contributions to gases, are all within 2σ of the air ratio (0.188).

Chapter Five: High helium systems in Tanzania
223
5.6. Discussion
5.6.1. The uses of the radiogenic noble gases as a means of locating 4He-rich
areas
The Tanzanian study areas present a unique opportunity to explore the uses
of the noble gases as a surface tracer for locating potential high 4He reservoirs. This
methodology is entirely dependent on gas escape features in the locality such as the
thermal springs.
It can be observed from the gas composition of samples that all samples
containing 4He concentrations which exceed the economic threshold for viable
reservoirs (0.1% <) contain high concentrations of N2 as well (90% <).
In the Mbeya study area a trend towards high 4He concentrations, associated
high N2 concentrations and low Ra values (indicating a predominantly crustal input)
within the southern Rukwa Basin is seen whereas closer to the currently active RVP
high CO2, low N2, low 4He and high Ra values (consistent with a predominantly
mantle input) are observed (Darrah, pers comms, 2016). This trend was also
observed within the RVP by Barry et al., (2013).
As noted in Section 5.2.2. similar spatial patterns of 3He/
4He (Ra), N2
concentrations and CO2 concentrations versus distance from volcanic centres have
been observed in other regions and in all cases is thought to indicate binary mixing
between a pure crustal endmember and a mantle endmember which is either SCLM
or MORB related (Sano et al., 1984; Marty et al., 1989; Hilton et al.,1993; Van Soest
et al., 1998; Weinlich et al., 1999; Barry et al., 2013).
Chapter Five: High helium systems in Tanzania
224
If we assume that 3He/
4He (Ra) values are primarily controlled by the extent
of mixing between crust-derived N2 and associated 4He with concentrations of
mantle-derived CO2 and associated 3He we can construct a simple binary mixing
model for SCLM mantle (6.1 Ra) with a crustal endmember of (0.020 Ra) so as to
ascertain 1) whether binary mixing applies to our sample areas and 2) the effect of
the mixing of 4He associated N2 on the
4He/
40Ar* ratios in the areas.
For the mixing model we assume that the pure crustal endmember
concentrations are represented by the Balangida sample from the NTD study area
since the sample does not show significant fractionation and contains the highest
concentrations of 4He (10.5%). N2 concentrations for this endmember are determined
to be 89.0% with no CO2 content. The mantle endmember is taken to be SCLM at
6.1 Ra with CO2 concentrations of 99.9% and no N2 content (Figure 5.5).

Chapter Five: High helium systems in Tanzania
225
Figure 5.5.: Diagram showing the influence of binary mixing on spatial gas trends within the Mbeya area. Close to volcanic centres CO2 and Ra
values increase whereas N2, 4He and
4He/
40Ar* ratios decrease. Further away from the active volcano increases in N2,
4He,
4He/
40Ar* ratios and
decreases in CO2 and Ra value are seen.

Chapter Five: High helium systems in Tanzania
226
Samples from both study areas fall along a binary mixing trend between
crust-derived gases and mantle-derived gases. Closer to the active volcanic centres in
the RVP there appears to be a dilution of magmatic gases produced by volcanism in
the region by the older, dominant crust surrounding it which is also releasing
accumulated gases due to the ongoing rifting. This binary relationship between crust
and mantle gases indicates, in the context of helium exploration, that close to an
active volcanic centre, 4He concentrations will be diluted by CO2 concentration and
associated gases whereas 135 km away from the RVP a return to economic 4He
concentrations in gases is observed.
This adds another dimension to the process of helium exploration when in
areas where active volcanism is occurring and should be taken into account in future
studies which establish the boundary around active volcanic provinces where the risk
from CO2 dilution becomes too high to establish a high helium reservoir.
Helium volumes and the nitrogen associated with them in the study areas are
being released from the basement and sediments by the heat generated by rifting and
volcanism in the region. Helium then either diffuses into the overlying sediments
until it is dissolved and transported elsewhere by hydrothermal systems or advects
straight into reservoirs if underlying faults and fractures are present (Sano et al.,
1988; Kennedy and Van Soest, 2005).
In some areas, such as in the Rukwa Basin, helium can potentially be trapped
by stratigraphic traps and overlying salt layers. However, in areas which have high
helium seeps, helium and associated gases can advect with nitrogen as a carrier gas
up open faults and escape at the surface as a macroseep (Etiope and Martinelli, 2002;
Walia et al., 2005). It is probable that these areas also contain active detectable soil

Chapter Five: High helium systems in Tanzania
227
gas microseeps which can aid in the identification of reservoirs (Guerra and
Lombardi, 2001).
5.6.2. Compiling a ‘play fairway’ assessment of Tanzania
From the above sections it has been established that the rocks within the
Tanzania Craton and the regions surrounding the central craton have the potential to
generate large volumes of helium and that this accumulated helium is currently being
released by the heat generated by a potential shallow plume beneath the Tanzanian
Craton which also causes associated volcanism (such as the Rungwe Volcanic
Province, the Crater Highlands and the Kivu Volcanic Province), geothermal activity
and rifting in the region.
The release of accumulated crustal 4He and associated N2 (< 10.5%
4He) can
be seen in the study area locations (Mbeya and the NDT) and has also been recorded
in Uvinza (an area approximately 90 km to the east of Lake Tanganiyka) with gases
measuring < 2.5% 4He (Pflumio et al., 1994). In this region there are also potential
trapping structures in place such as in the Rukwa Rift and the Albertine Graben
(which consists of Lake Albert, Lake George, Lake Edward and Lake Kivu)
(Abeinomugisha and Kasande, 2012; Abraham-James, pers comms, 2016). The ‘play
fairway’ map showing potential basins which may contain high helium reservoirs in
relation to the craton, volcanic centres and known trapping structures has been
derived by combining information from Section 5.6.1 and Figure 5.3 (Figure 5.6).

Chapter Five: High helium systems in Tanzania
228
Figure 5.6.: ‘Play fairway’ map showing potentially helium-rich basins in the region
around the Tanzanian Craton. Black striped circles indicate an inferred 100 km radius
CO2 dilution zone around active volcanic provinces in the region, black dashed lines
around basins indicate potential helium-rich prospects which are uncertain due to
missing information and basins outlined with solid black lines indicate basins with the
best helium potential in the region.
The potential dilution effect observed from active volcanic provinces
following on from trends seen in the Mbeya region (Section 5.6.1) is now taken into
account by assuming a CO2 dilution zone of approximately 100 km radius around the
centre of each province. Although the CO2 dilution zone is likely to vary for each
volcanic province according to factors such as available fluid migration pathways,
the rates and volumes of the CO2 flux from depth, the locations and timing of the
activity of volcanoes in the region. However despite this uncertainty as to the precise
boundaries of the CO2 dilution zone an area like the Albertine Graben (to the NW of
the map) can be excluded from being potentially helium-rich due to this effect. This
is supported further by evidence from this region which shows that Lake Kivu
contains high concentrations of CH4, CO2 and mantle-derived helium and that seeps
around Lake Albert are oil and gas rich with the hydrocarbon gases present in

Chapter Five: High helium systems in Tanzania
229
reservoirs showing CO2 contamination (Schoell et al., 1988; Tedesco et al., 2010;
Abeinomugisha and Kasande, 2012).
Areas which contain basins outlined by dashed lines indicate potential
helium-rich locations which may be rendered void by as yet unknown elements. The
Lake Tanganyika area appears to be a good prospect due to both its size and the
distance from current volcanic activity. There are helium-rich springs to the east of
the area in Uvinza which degas gases which are 2.5% 4He and have an R/Ra value of
0.28 Ra; indicating a preferentially crust-dominated input to gases however gases
have not yet been sampled from the hydrothermal vents beneath the lake the helium-
rich springs at Uvinza could just be a localised occurrence (Kraml et al., 2016).
At the same time the ‘play fairway’ map indicates that the north of the
Tanganyika rift may be experiencing the introduction of magmatic fluids.
Hydrothermal fields at the north end of Lake Tanganyika at Pemba and Cape Banza
record fluids which contain predominantly magmatic-origin CO2 (60% to 90%) and
CH4 with heavier hydrocarbons (Botz and Stoffers, 1993; Tiercelin et al., 1993).
Currently Lake Tanganyika is thought to be an excellent oil prospect which
may indicate the presence of viable trapping structure in the rift basin though this
remains to be seen as drilling has yet to take place.
Similarly the NDT study area is also ringed as a potentially helium-rich
location, however this is hampered by the caveat that the sediments in this region are
very shallow compared to those seen in the rift basins in the Western Branch (< 2 km
in depth) and that trapping structures in this region are as of yet unknown due to lack
of seismic surveying in the region.
The solidly ringed Rukwa Basin contains currently what is considered the
best helium prospect in the region due to a combination of all of the points on the
Chapter Five: High helium systems in Tanzania
230
helium exploration method alongside seismic surveys conducted by Helium One in
the region which show the presence of potential trapping structures. Once again the
results from target reservoirs in the basin remain to be seen, however the P50
estimate for helium reserves in the Rukwa Basin which has been calculated by an
independent company from helium measurements in this study currently stands at 98
Bcf or 2.78 x 10⁹ m
3.
5.7. Summary
New noble gas data from the West and East branches of the Tanzanian
section of the EARS shows 4He concentrations of up to 10.5%. This combined with
the potential 4He generated by the Tanzanian Craton and surrounding mobile belts of
approximately 7.0 x 10⁵ Bcf implies that even with highly inefficient release,
migration and trapping there could be many potential high helium reservoirs in the
region on the scale of that predicted for the Rukwa Basin (98 Bcf).
In the Mbeya study area (which contains the Rukwa Basin and RVP) crustal
helium charge and associated N2 released by rifting is diluted by CO2 produced by
active volcanoes in the region whereas further away (approximately 135 km) N2 and
high helium dominate (< 2.5% 4He).
This can enable the determination of a ‘goldilocks zone’ for the purposes of
helium exploration in areas experiencing active volcanism. The limit of the zone will
be close enough to thermal sources (either the thermal aureole from magma
chambers or rifting) for helium to be released but without significant CO2 dilution by
nearby volcanoes.

Chapter Five: High helium systems in Tanzania
231
In the Rukwa Basin, which is currently under investigation as a high helium
reservoir first estimates derived from our 4He analyses combined with seismic
surveys for the basin translates to probable reserves of 98 Bcf which would be
enough to supply the current global helium demand for ~ 14 years if current demand
remains the same.

Chapter Six: The Principles of Helium Exploration
232
Chapter Six: The
Principles of Helium
Exploration

Chapter Six: The Principles of Helium Exploration
233
6.1. The Helium System
It has been established in Chapter 1 that all helium-producing reserves to date
have been discovered serendipitously when the target of the exploration was
petroleum. In order to ascertain the viability of an area for petroleum exploitation oil
and gas companies consider potential source rocks, burial temperatures and depths,
migration pathways and regional reservoir/seal combinations also known as ‘play
fairways’ which were explored in Chapter 5 for the Tanzanian system.
These well established hydrocarbon exploration protocols have been adapted
to instead make helium the prospecting target. Following this approach similar
questions to those put forward by hydrocarbon exploration arise:
1. How and where is helium generated?
2. How physically and thermally stable are these environments to allow helium
accumulation?
3. How is accumulated helium released from source rocks (primary migration)?
4. How does helium move significant lateral distances from the source rock into
reservoir areas (secondary migration)?
5. How does helium rich gas accumulate and remain in reservoirs (focusing and
trapping mechanisms)?
6. How do potentially helium-rich gas accumulations become compromised
over geological time periods (trap destruction and/or leakage)?
If we compare the helium system to the hydrocarbon system we begin to see
immediate differences at every developmental stage from source to accumulation in

Chapter Six: The Principles of Helium Exploration
234
reservoir. The only stage which helium and petroleum seem to have in common is
the final stage: trap integrity and longevity (Table 6.1). In order to identify potential
high helium systems we need to identify the characteristics of the areas which are
most likely to facilitate each stage.
Stage Petroleum System Helium System
Source Organic matter U
238
, U235
and Th232
decay in
the crust produce alpha
particles
Maturation Burial and consequential heating Time to accumulate (stable
crust) vs volume of stable crust
Primary
migration Pressure driven (phase change
from solid kerogen to fluid
petroleum results in volume
increase)
Heating to above mineral
closure temperatures, fracturing
of rocks and minerals, mineral
dissolution
Secondary
migration Buoyancy driven Groundwater/buoyancy
driven/stripping
Accumulation
in reservoir Beneath caprock, capillary entry
pressure seal Exsolution in presence of
existing gas phase beneath
caprock/degassing of
oversaturated
groundwater/direct input into
trap of a free gas phase Trap integrity
& longevity Microseepage, capillary failure,
fracture failure, tectonic
destruction of trap
Microseepage, capillary failure,
fracture failure, tectonic
destruction of trap
Table 6.1.: Synthesis of components of the helium exploration system compared to the
petroleum system.
6.1.1. Generation and accumulation

Chapter Six: The Principles of Helium Exploration
235
The dominant stable isotope of helium, 4He, is radiogenically sourced from
the alpha decay of 238
U, 235
U and 232
Th in the crust, whereas petroleum products are
predominantly biogenically sourced from the thermal decay of organic matter.
Basement rocks and cratons of Proterozoic and Archean age (0.54 Ga to 3.8
Ga respectively) such as the Canadian Shield or the Yavapai-Mazatzal Province in
the southern USA are predominantly metamorphic or granitic in character and
contain crustal average or higher concentrations of U and Th (≤ 2.8 ppm and 10.7
ppm respectively). These basement rocks alongside more modern sediments (< 1.8
Ga) of average U and Th content have equal capability of producing 4He however
the constraint of time on the system is crucial for the production of significant
helium volumes.
6.1.2. Maturation
Concentrations of 4He will naturally increase in the subsurface over time
given adequate periods of quiescence with some of the helium remaining in the rocks
and some of it being ejected into the fluid within the porosity of the rocks as a
consequence of its penetration distance (Reimer, 1976; Bottomley et al., 1984;
Zadnik and Jeffrey, 1985; Lippmann-Pipke et al., 2011; Holland et al., 2013).
In past studies it has been shown that continental cratons have acted as closed
systems which allowed helium to accumulate over billions of years leading to
concentrations of helium in pore water as high as 9.82 x 10⁻²
cm3g
-1water in the
Kaapvaal Craton (Western Australia) and 6.20 x 10⁻⁴
cm3g
-1water in the Greenland
Craton (Zadnik and Jeffrey, 1985; Lippmann-Pipke et al., 2011).

Chapter Six: The Principles of Helium Exploration
236
Additionally, in the Canadian Precambrian Shield, evidence from noble gas
ratios shows that pockets of water have been isolated and accumulating radiogenic
noble gases since the Precambrian with residence times calculated of 1.1±0.6 Ga
(Holland et al., 2013; Warr et al., 2017).
Due to a combination of low helium concentrations across the entire crust
(ppm) and the ability of producing minerals such as zircon, apatite and titanite to
retain helium below their closure temperatures can hinder the release of helium in
the shallow crust. The lowest closure temperatures are associated with apatite and
are ~ 70°C; indicating that under a normal crustal temperature gradient of 30°C/km
helium would start being released from minerals at around 2 km or deeper given a
surface temperature of 10°C. Given that most helium-rich gas reservoirs occur at
shallower depths than this and at higher concentrations this indicates that the helium
atoms need not only a mechanism for bulk release but also for focusing (Table 6.2.).
Field and location Producing
reservoir
Helium
concentration
(%)
Depth of
producing
reservoir
(km)
References
Hugoton-Panhandle,
Kansas/Oklahoma/Texas,
USA
Chase Group
(Permian)/
Council Grove
Group
(Permian)/Brown
Dolomite
(Permian)
0.60 (average) 0.90
Ballentine
and
Sherwood-
Lollar,
2002; Gage
and
Driskill,
2005
Woodside, Utah, USA Kaibab
(Permian) 1.31 0.95
Morgan
and
Chidsey Jr,
1991;
Harris,
1993
Harley Dome, Utah,
USA
Entrada
(Jurassic) 7.02-7.18 0.26
Dobbin,
1968

Chapter Six: The Principles of Helium Exploration
237
Model Dome, Colorado,
USA
Entrada
(Jurassic) 7.00-8.34 0.31
Dobbin,
1968
Greenwood, Kansas,
USA
Topeka
(Pennsylvanian)
and Wabaunsee
(Pennsylvanian)
0.52-0.70 0.94
Wingerter,
1968; Gage
and
Driskill,
2005
McElmo Dome,
Colorado, USA
Leadville
(Mississippian) ≤ 0.71 0.50
Gerling,
1983;
Gilfillan,
2006;
Gilfillan et
al., 2008
LaBarge, Wyoming,
USA
Madison
(Mississippian) 0.50-0.73 4.42-5.03
Hamak,
1989;
Stewart
and Street,
1992; De
Bruin,
1995;
Martin et
al., 2008;
Merrill et
al., 2014
Table 6.2.: Average depths of a selection of helium-producing reservoirs in the USA.
6.1.3. Primary migration
The primary migration of helium is a two stage process compared with the
hydrocarbon system which involves the pressurised expulsion of liquid and gaseous
hydrocarbons from the source rock cause by a time/temperature driven phase change
from solid kerogen. Helium primary migration not only involves migration out of the
source rock but also the added complication of migration out of the original host
minerals.
Radiogenic 4He produced from the alpha decay of
238U,
235U and
232Th
usually occurs within 10-20 microns of the parent radioelement which is defined as

Chapter Six: The Principles of Helium Exploration
238
the penetration distance of the original alpha particle. As this is usually within the
length-scale of the host minerals, helium can become trapped both within the mineral
matrix and on mineral grain boundaries depending on the penetration distance.
Diffusion rates for helium out of fine-grained minerals (~0.1 mm) range
between 10-18
cm2s
-1 and 10
-22cm
2s
-1 for temperatures up to 150°C (Lippolt and
Weigel, 1988; Trull et al., 1991; Ballentine and Burnard, 2002). In order for
diffusion to occur in the subsurface a concentration gradient must first be established
between the producing mineral and the surrounding pore space which is determined
by helium concentrations in minerals being higher than the equilibrium concentration
of the pore space.
The bulk diffusion of 4He in the crust is severely limited in terms of length
scale. Experiments involving incremental heating alone conducted by Hussain
(1997) show diffusion rates of approximately 1 x 10-15
cm2s
-1 at 20°C in granite in
contrast to the high 4He diffusivities of between 2 x 10
-5 cm
2s
-1 to 1 x 10
-6 cm
2s
-1
calculated for the Great Artesian Basin (Queensland, Australia) by Torgersen (1989).
Such high diffusivities shows that the transport of 4He in this location was not
diffusion and was more likely tied to the movement of fluid (4He diffusivity in water
is 4.2 x 10⁻⁵
cm2s
-1 from Jähne et al., (1987)). Therefore if most
4He found in
reservoirs is assumed to be from the underlying crust, diffusion rates dictate that this
process would be orders of magnitude slower than bulk transport by fluids.
While in general, diffusion from depth can be discounted as a significant
contribution to observed reservoir 4He concentrations (0.1%<) in the case of CH4-
rich fields like the Hugoton-Panhandle the role of diffusion versus advection is less
clear and there is a possibility at depths above mineral closure temperatures that
Chapter Six: The Principles of Helium Exploration
239
there can be local diffusive contributions to 4He reservoirs due to the rock volumes
involved (Chapter 3 this thesis).
The other mechanism which could cause the migration of helium in bulk is
advection. However, in order for the advection of helium to occur, two events must
occur first: 1) a thermal event which is high enough to overcome the closure
temperature associated with the various minerals within which helium is trapped and
2) a fluid e.g.: N2 or CO2 to facilitate bulk movement out of the source rock. Both
conditions require a significant change in the regional thermal gradient; most likely
caused by tectonism such as extensional rifting, orogeny or volcanic activity. Any
process which mobilises the carrier fluid involved in the predominantly vertical
transport of 4He has the capacity to move it over large distances.
An example of the primary migration of 4He is currently occurring within
Yellowstone National Park in the USA. Lowenstern et al., (2015), in their study on
the gas geochemistry associated with the supervolcano, calculated that the 4He flux
from Yellowstone was tens to hundreds of times higher than the underlying crust
could support. From this they speculated that the supervolcano was heating the 2.8
Ga Wyoming craton and releasing the 4He accumulated within this source since at
least 2.3 Ga over the course of 2 Ma.
Evidence of a carrier gas involved with the advection of 4He can be seen by
the constant presence of N2 in these high-helium reservoirs (4He/N2 ratios in natural
gas fields typically range between 0.02 to 0.20).
That radiogenically produced helium should be associated with non-
radiogenic nitrogen suggests a common source for both gases. It has been found that
the δ15
N composition of the N2 endmember associated with economic 4He deposits
falls consistently within a very narrow range (-3.00‰ to +2.45‰) which compares

Chapter Six: The Principles of Helium Exploration
240
to the ranges seen from both low temperature metamorphism of the crust (-5.00‰ to
+4.00‰) and the release of ammonium from clays (+1‰ to +4‰) (Ballentine and
Sherwood-Lollar, 2002; Chapter 3 this thesis; Chapter 4 this thesis).
The link between 4He and N2 during primary migration can be seen in a study
from the Eger Rift by Weinlich et al., 1999 with an added caveat; while this region
exemplifies primary migration for the helium system, it is also shows the potential
dilution of 4He and N2-rich gases by the addition of magmatically-sourced CO2 and
associated gases in a tectonically active region.
Gases from the Eger Rift in Central Europe infer a CO2 dilution trend which
correlates with distance from volcanoes in the area (Figure 6.1). From this study
Weinlich et al., (1999) found that closer to the volcanoes the CO2 content and Ra
values associated with gases increased whereas N2 concentrations decreased
(indicating a greater input of mantle content) whereas further from the volcanic
centres the CO2 of the gas content decreased as did the Ra value whereas N2
concentrations increased, indicating a return to crustal input.

Chapter Six: The Principles of Helium Exploration
241
Figure 6.1.: Graph redrawn from Weinlich et al., (1999) showing the relationship between Ra values, He content, CO2 content, N2 content and
distance from volcanic centres. The numbers in boxes indicate average He volume percentages at sampled sites. Points without numbers recorded
trace amounts of helium in the original paper.

Chapter Six: The Principles of Helium Exploration
242
Therefore in the right geological setting, the thermal aureole associated with
magmatism may provide the heating needed to release helium from its source
however if the trap is situated too close to the volcanic centre all that will be found in
reservoirs will be predominantly CO2.
If a trap is already in place when tectonism occurs there is a possibility that
the primary migration of 4He and N2 as a free gas phase may be all that is needed to
generate a helium-rich reservoir, however it would most likely be localised in scale
(low volume but high concentration) and probably fault facilitated. This can be
evidenced by areas such as Yellowstone and the Eger Rift which show the primary
migration stage of gases high in helium but which lack local trapping structures in
the case of Yellowstone therefore these large volumes of 4He are lost to the
atmosphere.
However, primary migration alone cannot explain the presence of large
volume helium-rich reservoirs in areas which have not experienced any recent
tectonic activity such as Kansas. In the case of these reservoirs secondary migration
or predominantly lateral migration is required.
6.1.4. Secondary migration
In natural systems 4He and N2 are often discovered together with CO2 or CH4
which indicates that the same processes and geological structures that control where
CO2 and CH4 are trapped also apply to these gases. The presence of CO2 or CH4 in
trapping structures can also play an important role in helium trapping as outlined
below.
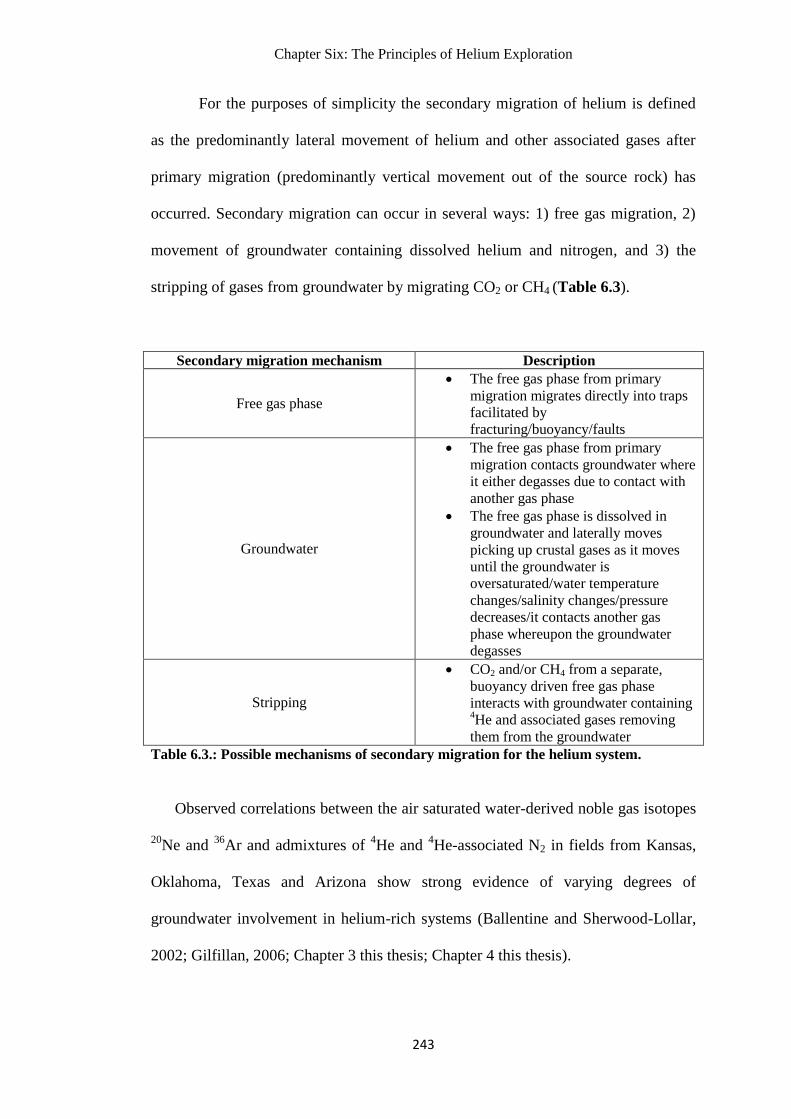
Chapter Six: The Principles of Helium Exploration
243
For the purposes of simplicity the secondary migration of helium is defined
as the predominantly lateral movement of helium and other associated gases after
primary migration (predominantly vertical movement out of the source rock) has
occurred. Secondary migration can occur in several ways: 1) free gas migration, 2)
movement of groundwater containing dissolved helium and nitrogen, and 3) the
stripping of gases from groundwater by migrating CO2 or CH4 (Table 6.3).
Secondary migration mechanism Description
Free gas phase
The free gas phase from primary
migration migrates directly into traps
facilitated by
fracturing/buoyancy/faults
Groundwater
The free gas phase from primary
migration contacts groundwater where
it either degasses due to contact with
another gas phase
The free gas phase is dissolved in
groundwater and laterally moves
picking up crustal gases as it moves
until the groundwater is
oversaturated/water temperature
changes/salinity changes/pressure
decreases/it contacts another gas
phase whereupon the groundwater
degasses
Stripping
CO2 and/or CH4 from a separate,
buoyancy driven free gas phase
interacts with groundwater containing 4He and associated gases removing
them from the groundwater
Table 6.3.: Possible mechanisms of secondary migration for the helium system.
Observed correlations between the air saturated water-derived noble gas isotopes
20Ne and
36Ar and admixtures of
4He and
4He-associated N2 in fields from Kansas,
Oklahoma, Texas and Arizona show strong evidence of varying degrees of
groundwater involvement in helium-rich systems (Ballentine and Sherwood-Lollar,
2002; Gilfillan, 2006; Chapter 3 this thesis; Chapter 4 this thesis).

Chapter Six: The Principles of Helium Exploration
244
6.1.5. Accumulation in reservoirs
When groundwater that contains dissolved helium and associated N2 is
equilibrated with CO2 or CH4 gases, the more insoluble 4He and N2 gases will
exsolve from the groundwater. In this case a pre-existing gas phase composed of
CO2 or CH4 is essential for causing the degassing of groundwater containing
accumulated 4He and
4He-associated N2 into the trapping structure.
An alternative which has been observed in the Kansas Basin Permian and
Central Kansas Uplift wells from Chapter 3 and the N2-4He rich wells from Chapter
4 is the possibility of a groundwater which is already oversaturated in 4He-associated
N2 degassing into reservoirs before the interaction of a separate CH4 or CO2 gas
phase sourced from a different location.
Once 4He and
4He-associated N2 has migrated into a gas trapping structure
the preservation of 4He in that reservoir is subject to balancing the rate at which
4He
is supplied to the deposit with the efficiency of the seal or trap to contain it. Trap
destruction or a leaky seal will result in loss of 4He and the other gases from the trap.
6.1.6. Trap efficiency, leakage and destruction
Since helium and petroleum gases can occupy the same trap, the main
variable which determines whether helium is still present after a significant amount
of geological time is the stability of the trapping structure. Most of hypotheses for
helium entrapment are based on the same principles as petroleum entrapment, except
with greater attention paid to the pore throat radius of sealing rocks due to the small
atomic radius of helium due to its potential propensity for microseepage.

Chapter Six: The Principles of Helium Exploration
245
One hypothesis is that helium needs a tight sealing caprock such as an
evaporite (halite or anhydrite layer) to remain emplaced for large amounts of
geological time without significant leakage via diffusion (Broadhead and Gillard,
2004; Broadhead, 2005).
When examining fields where prolific helium discoveries have been made, it
can be seen, for the most part, that this hypothesis holds. The Middle East contains
some of the world’s largest reserves of helium gas, (the South Pars Field, Persian
Gulf contains what amounts to a quarter of the world’s helium reserve and has made
Qatar the second largest producer of helium after the USA), however the
concentration of helium contained in the gas is low. At only 0.05% of the gas being
helium it is the volume of the reservoir which makes the reserve commercially
viable.
Fields in the USA contain reservoirs which are orders of magnitude smaller
than those in the Middle East but contain higher concentrations of helium; some as
high as 10%. All of these fields are overlain by either a halite or anhydrite layer.
While evaporite deposits always make the best reservoir seals due to their
lack of pores and ductility, it may be possible that other caprock types could also
suffice since helium is never naturally the primary gas in a reservoir and would
therefore be in an admixture with other gases (N2, CO2 or CH4). In a natural system
helium would be dependent on the partial pressures of the other gases in the reservoir
for mobility since the total pressure in reservoir pores is generally fixed by the
overburden pressure. Therefore, hypothetically, as long as the reservoir pressure
does not exceed capillary entry pressures in the caprock helium should remain in the
trap along with the other gases and would only begin to leak if the trap was
breached. Further work is needed to determine the mobility of helium admixtures

Chapter Six: The Principles of Helium Exploration
246
under typical helium-rich reservoir conditions (underpressured systems) and by
modelling different reservoir sealing rocks which is beyond the scope of this thesis.
Trap leakage occurs when the seal capping a reservoir is breached. It usually
occurs in one of two ways; either via capillary failure (the most likely scenario under
hydrostatic pressures or moderate overpressures) or via fracture failure which usually
only occurs in reservoirs which are highly overpressured and these pressures exceed
the minimum stress and tensile strength of the sealing rocks. Adding overpressure to
a system can also result in trap leakage depending on the seal capacity for failure
which increases with increasing pore throat radius.
Helium-rich reservoirs usually record discovery pressures which are
underpressured relative to hydrostatic pressure therefore it is likely that the reservoir
pore pressures in viable reservoirs were too low over time to cause seal failure
especially in areas sealed by salt deposits which have no pores and are therefore not
susceptible to capillary failure.
However, the older the reservoir, the more likely it is that the trap will be
disturbed by any active tectonics in the region, causing the loss of the reservoir
contents over time. If helium-enriched gas is not supplied on a constant basis, it is
likely that disturbed fields which would have been helium-rich are either dry or
contain rejuvenated primary gas.
6.2. Summary
Every helium-producing reserve around the globe has been discovered by
accident when exploration companies were searching for petroleum gas. This chapter
presents the potential framework for a helium exploration methodology which at its

Chapter Six: The Principles of Helium Exploration
247
core requires six components: 1) an area of shallow crust, 2) stability for a
significant period of geological history to enable helium accumulation in source
rocks, 3) a younger tectonic event which aids the release of accumulated helium, 4)
secondary migration to trap via gas stripping or groundwater interaction, 5) viable
traps to be in place enabling a helium-rich gas reservoir to accumulate and 6) a
significant volume of helium to remain in traps until discovery.
This exploration strategy has been successfully tested in the Tanzanian
section of the East African Rift System where high-N2 seeps produce up to 10.5%
4He and minimal hydrocarbon gases (Chapter 5). This has enabled the quantity of
recoverable helium in the Rukwa Basin to be estimated as ~98 Bcf.

Chapter Seven: Conclusions and Further Work
248
Chapter Seven:
Conclusions and Further
Work

Chapter Seven: Conclusions and Further Work
249
7.1. Conclusions
Global helium reserves to date have originated from chance discoveries made
by oil and gas companies while exploring for petroleum. Despite the many and
varied uses of helium there has been no impetus to develop an exploration
methodology targeting helium-rich gas reservoirs in order to provide and ensure an
adequate supply of helium in a similar manner to petroleum products. This thesis
synthesises data from both past and current studies of helium-rich reservoirs to
provide both a unique insight into the helium system in different regions and the
framework for a helium exploration methodology.
In the USA, which contains the highest total of helium-rich (>0.3% of total)
gas discoveries to date, the gases associated with reservoirs in the Hugoton-
Panhandle, Kansas Basin and Central Kansas Uplift areas of the central USA are
predominantly composed of: 4He, CH4, N2 derived from organic matter and
4He-
associated N2. In these reservoirs the CH4 and low 4He-associated N2 gases were
most likely sourced from the Anadarko Basin to the south of the study regions
however they were not generated together and show little to no involvement with
groundwater compared with the 4He and high
4He-associated N2 gases.
By using a combination of δ15
N values and noble gas isotopes it was also
established that the low 4He-associated N2 endmember, which is shared by all
sampled reservoirs in that region, is characterised by δ15
N = +14.60‰ which is
characteristic of an overmature, hydrocarbon-producing sedimentary source.
The 4He and
4He-associated N2 components have two distinct high
4He-
associated N2 endmembers which can be characterised by: 1) δ15
N = +1.00‰,
4He/N2 = 0.036 and 2) δ
15N = -3.00‰,
4He/N2 = 0.089. The endmember δ
15N values

Chapter Seven: Conclusions and Further Work
250
calculated fall within a narrow range and, when combined with 4He mass balance
calculations, are consistent with a low grade metamorphic crustal source for the bulk
of both 4He and high
4He-associated N2 which could be derived from variable
mixing between sediments and basement rocks in study areas.
N2/20
Ne ratios and the same radiogenic mixing line indicate a common
groundwater source for both the Texas Panhandle and KBC areas and potentially the
KBP area. In contrast the CKU wells indicate little to no groundwater contact and
crust-derived gases in these reservoirs are thought to have had a significant portion
added by fault-facilitated advection from depth.
In the Hugoton-Panhandle and the KBC area, groundwater is undersaturated
in 4He associated N2 indicating that a gas phase consisting of CH4 and organic N2
needed to already be present in order for the dissolved isotopes to partition into the
reservoir gas cap. The KBP and CKU, conversely, are oversaturated in 4He-
associated N2 indicating that isotopes dissolved in the groundwater were already
exsolving into the gas phase in reservoirs before CH4 and N2 migrated into the
reservoirs.
4He mass balances calculated for these study areas indicate that <17% of the
4He volumes in reservoirs could have been produced in situ, which implies that the
area involved with sourcing 4He is not confined to the boundaries of the study areas
and could cover a significant portion of Kansas, Texas and New Mexico.
On a regional scale, the first noble gas and stable isotope data from N2-4He
rich wells from the south and north of North America (Utah, Montana and
Saskatchewan) consistently record a narrow range of δ15
N values (+1.00‰ to
+2.45‰) which likely confirms that the source of the 4He and associated N2 in
helium-rich reservoirs is low temperature metamorphosed crust.

Chapter Seven: Conclusions and Further Work
251
In the northern wells (International Helium Wood Mtn, SK and Weil #1, MT)
radiogenic noble gas ratios are within error of average crustal production ratios
which, when combined with the depth of the reservoir strata, indicates that the
source is most likely from the underlying basement, however, for the Harley Dome
well, the source is considerably shallower (< 1 km) and is probably also
predominantly sourced from the underlying uplifted basement.
Despite the narrow range of δ15
N values, these wells all have a wide range of
4He/N2 end member values which are consistent within each locality (0.010 to 0.011
in the north and 0.085 to 0.089 in the south). The difference in these 4He/N2 end-
members may either be related to variations in the chemical composition of the
underlying source rocks in the regions or to the accumulation time within the source
rocks before the release of high 4He-associated N2 and
4He.
All of the N2-4He rich wells show consistently less groundwater contact than
in the Hugoton-Panhandle-Kansas Basin dataset and lie in the range of the Kautz #1
well from the Central Kansas Uplift samples which may indicate contact between a
free gas phase and groundwater before degassing into reservoirs.
In all fields the mechanism for 4He and associated N2 degassing into
reservoirs appears to be related in some degree to groundwater and the saturation
threshold of 4He associated N2. In cases where the groundwater is oversaturated in
4He-associated N2, groundwater degassing will occur without the need for a primary
gas cap such as CH4 or CO2 to be present in the reservoir, occasionally allowing the
formation of N2-rich 4He field unless it is diluted by another gas. Conversely, in
cases where the groundwater is undersaturated in N2, contacting a primary gas cap is
needed in order for the exsolution of high 4He-associated N2 to occur and with it
4He
and other associated noble gas isotopes.

Chapter Seven: Conclusions and Further Work
252
New noble gas data from thermal springs in the West and East branches of
the Tanzanian section of the EARS show 4He concentrations of up to 10.5%
indicating the active release of high helium and high N2 gases in the region. This
combined with the potential 4He volumes generated by the Tanzanian Craton and
surrounding mobile belts of approximately 7.0 x 10⁵ Bcf implies that even with
highly inefficient gas release from source rocks there could be many potential high
helium reservoirs in the region on the scale of that predicted for the Rukwa Basin (98
Bcf).
In the Mbeya study area (which contains the Rukwa Basin and the Rungwe
Volcanic Province) crustal 4He and associated N2 which is released by heating and
rifting is diluted by CO2 produced by active volcanoes in the region whereas further
from the volcanic province (approximately 135 km) N2 and high helium dominate (<
2.5% 4He).
In future the seeps in this region could be used to generate models to
determine a zone for the CO2 dilution of the crust-sourced gases. Hypothetically the
limit of the zone will be close enough to thermal sources (either the thermal aureole
from magma chambers or rifting) for helium to be released but without significant
CO2 dilution by nearby volcanoes.
In the Rukwa Basin, which is currently under investigation as a high helium
reservoir, first estimates derived from 4He analyses from Chapter Five combined
with seismic surveys for the basin translate to a P50 estimate of probable reserves of
98 Bcf which would be enough to supply the current global helium demand for ~ 14
years if current demand remains the same.
Despite the estimated volume of the helium reserves being low when
compared with other fields such as South Pars in Qatar/Iran and Chayandinskoye in

Chapter Seven: Conclusions and Further Work
253
Russia, if a viable helium reserve is discovered in the Rukwa Basin, the implications
are huge; firstly because this will have been the first time that a helium reserve has
been found on purpose as the target of exploration and secondly it will prove that our
helium exploration method is valid (Chapter Five, this thesis).
7.1.1. Expanding the current helium exploration methodology
The framework for a helium exploration methodology requires these
components as a starting point: 1) an area of old granitic crust (source) which has
been quiescent for a significant period of geological time generating and
accumulating dispersed helium, 2) a relatively younger tectonic event which disturbs
this area aiding the primary migration of accumulated helium from the source, 3)
secondary migration pathways such as groundwater can play a major role in the
lateral transport of helium away from sources and 4) viable traps to be in place
enabling a helium-rich gas accumulation to form either from the emplacement of a
free gas phase or from exsolution from groundwater.
Now that we understand the source of helium and the mechanisms involved
in primary migration, secondary migration and accumulation we can use a systematic
approach to identifying areas around the globe which are likely to contain
commercially attractive helium accumulations.
7.2. Further Work
This thesis represents the first geochemical survey purely conducted for the
purposes of characterising helium-rich systems with the end goal of creating a

Chapter Seven: Conclusions and Further Work
254
unifying method for helium exploration which can be applied to new regions in the
same way as hydrocarbon exploration and it provides a starting point for other
studies on helium-rich systems. Noble gas and stable isotopic analyses have been
shown to be very effective tools in characterising the source, migration pathways and
potential exsolution mechanisms for helium into trapping structures and should be
used in further work pertaining to better identifying elements of the helium system.
Geochemical surveys involving more samples are needed from helium-rich
reservoirs especially for N2-rich wells and CO2-rich wells to better understand the
helium system on a local scale with a view to comparing areas within countries on a
regional scale and finally across countries on a global scale. This could aid in the
understanding of why fields in areas like Colorado, Utah and Arizona contain
helium-rich fields interspersed with CO2-rich and CH4-rich fields; an example of this
would be the isotopic analysis of carbon isotopes for CO2 and CH4 alongside the
analyses of N2 and the noble gases in helium-rich reservoirs as this would aid in
better establishing the source and timing of the primary gas phase into the trap and
how this has affected the partitioning of helium and other associated gases.
There is also the potential for the exploration of the diversity of the crustal
4He/N2 end member ratios and whether in N2-rich high helium reservoirs it is related
to either the whole rock elemental abundance of the craton which sourced the gases
or to the timing of the release of the gases i.e.: the lower the 4He/N2 ratio the earlier
in the geological history of the area the release event occurred due to less time
accumulating 4He relative to N2.
There is more scope for exploring the role of groundwater in high helium
systems including identifying the 4He-associated N2 groundwater saturation point for
each reservoir and how far in excess of this limit is required to classify whether

Chapter Seven: Conclusions and Further Work
255
helium in a reservoir has partitioned from a laterally moving, oversaturated
groundwater versus from a free gas phase from primary migration contacting
groundwater before locally degassing into reservoirs.
Helium-rich reservoirs which have been geochemically analysed should be
compiled in a publically available database similar to global petroleum fields to aid
future researchers.
An aspect of the helium system which has not yet been explored is trap
integrity over time. The modelling of trap integrity for helium admixtures and for
different caprock types could be crucial to understanding how a reservoir retains its
helium over long periods of geological time and what factors could affect this
leading to a loss of the reservoir contents.
Further modelling work could be done following on from this thesis on
risking the dilution of potential high helium reservoirs by CO2 in volcanically active
areas such as the EARS and by CH4 in/near areas which are hydrocarbon-producing
basins.

256
References
Abeinomugisha, D., and Kasande, R. (2012). Tectonic control on Hydrocarbon
Accumulation in the Intra-Continental Albertine Graben of the East African Rift System, in
D. Gao, ed., Tectonics and sedimentation: Implications for petroleum systems: AAPG
Memoir 100. pp. 209-228.
Ader, M., Thomazo, C., Sansjofre, P., Busigny, V., Papineau, D., Laffont, R., Cartigny, P.,
& Halverson, G. P. (2016). Interpretation of the nitrogen isotopic composition of
Precambrian sedimentary rocks: Assumptions and perspectives. Chemical Geology, 429, 93-
110.
Alkhammali, S. A. (2015). Geochemical and clay mineralogical characteristics of the
Woodford Shale, Payne County, Oklahoma. Kansas State University. (MS Thesis). pp 82.
American Physical Society, Materials Research Society & American Chemical Society.
(2016). Responding to the U.S. Research Community’s Liquid Helium Crisis: An Action
Plan to Preserve U.S. Innovation. Retrieved from: https://www.aps.org/policy/reports/popa-
reports/upload/HeliumReport.pdf (Accessed 14 November 2017).
Adams, D. C., & Keller, G. R. (1994). Possible extension of the Midcontinent Rift in west
Texas and eastern New Mexico. Canadian Journal of Earth Sciences, 31(4), 709-720.
Adler, F. J., Caplan, W. M., & Carlson, M. P. (1971). Future petroleum provinces of the
Mid-Continent, Region 7. Future petroleum provinces of the United States—Their geology
and potential: AAPG Memoir, 15, 985-1123.
Allis, R., Chidsey, T., Gwynn, W., Morgan, C., White, S., Adams, M., & Moore, J. (2001,
May). Natural CO2 reservoirs on the Colorado Plateau and southern Rocky Mountains:
Candidates for CO2 sequestration. In: Proceedings of the First National Conference on
Carbon Sequestration, 14-17.
Anderson, C. C., & Hinson, H. H. (1950). Helium-bearing natural gases of the United
States- analyses and analytical methods. Bureau of Mines, Washington, DC (USA); Bureau
of Mines, Amarillo, Tex.(USA), Bulletin 486, pp. 141.
Armstrong, R. L. (1974). Magmatism, orogenic timing, and orogenic diachronism in the
Cordillera from Mexico to Canada. Nature, 247, 348-351.
Baars, D. L., and Stevenson, G. M. (1981). Tectonic evolution of the Paradox basin, Utah
and Colorado. In: D. L. Wiegand, ed., Geology of the Paradox Basin, Rocky Mountain
Association of Geologists, 1981 Field Conference, pp. 23-31.
Back, H. O., Calaprice, F., Condon, C., de Haas, E., Ford, R., Galbiati, C., Goretti, A.,
Hohman, T., Inanni, A., Loer, B., Montanari, D., Nelson, A., and Pocar, A. (2012). First
large scale production of low radioactivity argon from underground sources. pp. 5:
https://arxiv.org/pdf/1204.6024.pdf (Accessed 13 December 2017).
Bähr, R., Lippolt, H. J., & Wernicke, R. S. (1994). Temperature‐induced 4He degassing of
specularite and botryoidal hematite: A 4He retentivity study. J. Geophys. Res., 99(B9),
17695-17707.
Baiyegunhi, C., Oloniniyi, T. L., & Gwavava, O. (2014). The correlation of dry density and
porosity of some rocks from the Karoo Supergroup: A case study of selected rock types

257
between Grahamstown and Queenstown in the Eastern Cape Province, South Africa. IOSR
Journal of Engineering, 4(12), 30-40.
Ballentine, C. J., O'Nions, R. K., Oxburgh, E. R., Horvath, F., & Deak, J. (1991). Rare gas
constraints on hydrocarbon accumulation, crustal degassing and groundwater flow in the
Pannonian Basin. Earth and Planetary Science Letters, 105(1-3), 229-246.
Ballentine, C. J., & O'Nions, R. K. (1992). The nature of mantle neon contributions to
Vienna Basin hydrocarbon reservoirs. Earth and Planetary Science Letters, 113(4), 553-567.
Ballentine, C. J., Mazurek, M., & Gautschi, A. (1994). Thermal constraints on crustal rare
gas release and migration: Evidence from Alpine fluid inclusions. Geochimica et
cosmochimica acta, 58(20), 4333-4348.
Ballentine, C. J., O'Nions, R. K., & Coleman, M. L. (1996). A Magnus opus: Helium, neon,
and argon isotopes in a North Sea oilfield. Geochimica et Cosmochimica Acta, 60(5), 831-
849.
Ballentine, C. J. (1997). Resolving the mantle He/Ne and crustal 21
Ne/22
Ne in well gases.
Earth and Planetary Science Letters, 152(1), 233-249.
Ballentine, C. J., Schoell, M., Coleman, D., & Cain, B. A. (2000). Magmatic CO2 in natural
gases in the Permian Basin, west Texas: Identifying the regional source and filling history.
Journal of Geochemical Exploration, 69, 59-63.
Ballentine, C. J., Schoell, M., Coleman, D., & Cain, B. A. (2001). 300-Myr-old magmatic
CO2 in natural gas reservoirs of the west Texas Permian basin. Nature, 409(6818), 327.
Ballentine, C. J., Burgess, R., & Marty, B. (2002). Tracing fluid origin, transport and
interaction in the crust. Reviews in mineralogy and geochemistry, 47(1), 539-614.
Ballentine, C. J., & Burnard, P. G. (2002). Production, release and transport of noble gases
in the continental crust. Reviews in mineralogy and geochemistry, 47(1), 481-538.
Ballentine, C. J., & Lollar, B. S. (2002). Regional groundwater focusing of nitrogen and
noble gases into the Hugoton-Panhandle giant gas field, USA. Geochimica et Cosmochimica
Acta, 66(14), 2483-2497.
Ballentine, C. J., & Holland, G. (2008). What CO2 well gases tell us about the origin of
noble gases in the mantle and their relationship to the atmosphere. Philosophical
Transactions of the Royal Society of London A: Mathematical, Physical and Engineering
Sciences, 366(1883), 4183-4203.
Banner, J. L., Wasserburg, G. J., Dobson, P. F., Carpenter, A. B., & Moore, C. H. (1989).
Isotopic and trace element constraints on the origin and evolution of saline groundwaters
from central Missouri. Geochimica et Cosmochimica Acta, 53(2), 383-398.
Barnard, P. C., & Cooper, B. S. (1983). A review of geochemical data related to the
northwest European gas province. Geological Society, London, Special Publications, 12(1),
19-33.
Barry, P. H., Hilton, D. R., Fischer, T. P., De Moor, J. M., Mangasini, F., & Ramirez, C.
(2013). Helium and carbon isotope systematics of cold “mazuku” CO2 vents and
hydrothermal gases and fluids from Rungwe Volcanic Province, southern Tanzania.
Chemical Geology, 339, 141-156.

258
Battino R. (1983). Nitrogen and air. In Solubility Data Series, Vol. 10. International Union
of Pure and Applied Chemistry (IUPAC), Pergamon Press, Oxford.
Bebout, G. E., & Carlson, W. D. (1986). Fluid evolution and transport during
metamorphism: evidence from the Llano Uplift, Texas. Contributions to Mineralogy and
Petrology, 92(4), 518-529.
Bebout, G. E., & Fogel, M. L. (1992). Nitrogen-isotope compositions of metasedimentary
rocks in the Catalina Schist, California: implications for metamorphic devolatilization
history. Geochimica et Cosmochimica Acta, 56(7), 2839-2849.
Bebout, G. E., Cooper, D. C., Bradley, A. D., & Sadofsky, S. J. (1999). Nitrogen-isotope
record of fluid-rock interactions in the Skiddaw Aureole and granite, English Lake District.
American Mineralogist, 84(10), 1495-1505.
Bernet, M. (2009). A field-based estimate of the zircon fission-track closure temperature.
Chemical Geology, 259(3), 181-189.
Beyerle, U., Aeschbach-Hertig, W., Imboden, D. M., Baur, H., Graf, T., & Kipfer, R.
(2000). A mass spectrometric system for the analysis of noble gases and tritium from water
samples. Environmental Science & Technology, 34(10), 2042-2050.
Bickford, M. E., Harrower, K. L., Hoppe, W. J., Nelson, B. K., Nusbaum, R. L., & Thomas,
J. J. (1981). Rb-Sr and U-Pb geochronology and distribution of rock types in the
Precambrian basement of Missouri and Kansas. Geological Society of America Bulletin,
92(6), 323-341.
Boerner, D. E., Craven, J. A., Kurtz, R. D., Ross, G. M., & Jones, F. W. (1998). The Great
Falls Tectonic Zone: suture or intracontinental shear zone?. Canadian Journal of Earth
Sciences, 35(2), 175-183.
Boniface, N., & Schenk, V. (2012). Neoproterozoic eclogites in the Paleoproterozoic
Ubendian Belt of Tanzania: evidence for a Pan-African suture between the Bangweulu
Block and the Tanzania Craton. Precambrian Research, 208, 72-89.
Boniface, N., Schenk, V., & Appel, P. (2012). Paleoproterozoic eclogites of MORB-type
chemistry and three Proterozoic orogenic cycles in the Ubendian Belt (Tanzania): Evidence
from monazite and zircon geochronology, and geochemistry. Precambrian Research, 192,
16-33.
Borg, G., & Shackleton, R. M. (1997). The Tanzania and NE-Zaire Cratons. Oxford
Monographs on Geology and Geophysics, 35, 608-619.
Bottomley, D. J., Ross, J. D., & Clarke, W. B. (1984). Helium and neon isotope
geochemistry of some ground waters from the Canadian Precambrian Shield. Geochimica et
Cosmochimica Acta, 48(10), 1973-1985.
Botz, R. W., & Stoffers, P. (1993). Light hydrocarbon gases in Lake Tanganyika
hydrothermal fluids (east-central Africa). Chemical geology, 104(1), 217-224.
Bowen, D. W., & Weimer, P. (2003). Regional sequence stratigraphic setting and reservoir
geology of Morrow incised-valley sandstones (lower Pennsylvanian), eastern Colorado and
western Kansas. AAPG bulletin, 87(5), 781-815.

259
Bowring, S. A., & Karlstrom, K. E. (1990). Growth, stabilization, and reactivation of
Proterozoic lithosphere in the southwestern United States. Geology, 18(12), 1203-1206.
Boyce, J. W., Hodges, K. V., Olszewski, W. J., & Jercinovic, M. J. (2005). He diffusion in
monazite: Implications for (U‐Th)/He thermochronometry. Geochemistry, Geophysics,
Geosystems, 6(12).
Boyd, S. R., Hall, A., & Pillinger, C. T. (1993). The measurement of δ15N in crustal rocks
by static vacuum mass spectrometry: Application to the origin of the ammonium in the
Cornubian batholith, southwest England. Geochimica et Cosmochimica Acta, 57(6), 1339-
1347.
Boyd, S. R. (2001). Ammonium as a biomarker in Precambrian metasediments.
Precambrian Research, 108(1), 159-173.
Broadhead, R. F., & Gillard, L. (2004). Helium in New Mexico: Geologic Distribution and
Exploration Possibilities: New Mexico Bureau of Geology and Mineral Resources. Open
File Report 483, 1-62.
Broadhead, R. F. (2005). Helium in New Mexico—geologic distribution, resource demand,
and exploration possibilities. New Mexico Geology, 27(4), 93-101.
Burchell, P. W. (1964). Historical development of oil and gas production in Utah’s Uinta
Basin. In: Guidebook, Thirteenth Annual Field Conference: Intermountain Association of
Petroleum Geologists, pp. 184-185.
Burke, K. (1996). Africa's Distinctive Behavior Over the Past 30 Million Years. Houston
Geological Society Bulletin, Volume 38, No. 7, March 1996. pp. 10-10.
Burnard, P. G., Hu, R. Z., Turner, G., & Bi, X. W. (1999). Mantle, crustal and atmospheric
noble gases in Ailaoshan gold deposits, Yunnan Province, China. Geochimica et
Cosmochimica Acta, 63(10), 1595-1604.
Burruss, R. C., and Hatch, J. R. (1989). Geochemistry of oils and hydrocarbon source rocks,
Greater Anadarko Basin: Evidence for multiple sources of oils and long-distance oil
migration, in K. S. Johnson, ed., Anadarko Basin: 1988 Symposium Oklahoma Geological
Survey Circular 90, pp 53–64.
Cady, H. P., & McFarland, D. F. (1906). Helium in natural gas. Science, 24(611), 344-344.
Cady, H. P., & McFarland, D. F. (1907a). THE OCCURRENCE OF HELIUM IN
NATURAL GAS AND THE COMPOSITION OF NATURAL GAS. Journal of the
American Chemical Society, 29(11), 1523-1536.
Cady, H. P., & McFarland, D. F. (1907b). Neon and Argon in Natural Gas. Transactions of
the Kansas Academy of Science (1903-), 21, 64-65.
Caracausi, A., & Paternoster, M. (2015). Radiogenic helium degassing and rock fracturing:
A case study of the southern Apennines active tectonic region. Journal of Geophysical
Research: Solid Earth, 120(4), 2200-2211.
Cardott, B. J. (1988). Thermal maturation of the Woodford Shale in the Anadarko basin. In
Anadarko basin symposium, pp. 32-46.
260
Carr, T. R., Dean K. M., Dubois, M. K., Gerlach, P., Maroney, M. H., Morrison, E., Newell,
K. D., Noah, K. E., and Poelchau, H. (2003). Use of information technology for integrated
reservoir characterization of Permian gas fields of the Hugoton em-bayment: Kansas
Geological Survey Open File Report 2003-29:
http://www.kgs.ku.edu/PRS/publication/2003/ofr2003-29/index.html (Accessed 11
November, 2017).
Carter, L. S., Kelley, S. A., Blackwell, D. D., & Naeser, N. D. (1998). Heat flow and thermal
history of the Anadarko Basin, Oklahoma. AAPG bulletin, 82(2), 291-316.
Case, J. E. (1966). Geophysical anomalies over Precambrian rocks, northwestern
Uncompahgre Plateau, Utah and Colorado. AAPG Bulletin, 50(7), 1423-1443.
Chaki, S., Takarli, M., & Agbodjan, W. P. (2008). Influence of thermal damage on physical
properties of a granite rock: porosity, permeability and ultrasonic wave evolutions.
Construction and Building Materials, 22(7), 1456-1461.
Chaudhuri, S., Broedel, V., & Clauer, N. (1987). Strontium isotopic evolution of oil-field
waters from carbonate reservoir rocks in Bindley field, central Kansas, USA. Geochimica et
Cosmochimica Acta, 51(1), 45-53.
Cherniak, D. J., Watson, E. B., & Thomas, J. B. (2009). Diffusion of helium in zircon and
apatite. Chemical Geology, 268(1), 155-166.
Chidsey, T. C., Jr., Eby, D. E., and Lorenz, D. M. (1996). Geological and reservoir
characterization of small shallow-shelf carbonate fields, southern Paradox Basin,
Utah. In: A.C. Huffman, Jr., W. R. Lund, and L. H. Godwin, eds., Geology and Resources of
the Paradox Basin: Utah Geological Association Guidebook 25, 39-56.
Chorowicz, J. (2005). The east African rift system. Journal of African Earth Sciences, 43(1),
379-410.
Ciotoli, G., Etiope, G., Guerra, M., Lombardi, S., Duddridge, G. A., & Grainger, P. (2005).
Migration of gas injected into a fault in low-permeability ground. Quarterly Journal of
Engineering Geology and Hydrogeology, 38(3), 305-320.
Clark, S. L. (1987). Seismic stratigraphy of early Pennsylvanian Morrowan sandstones,
Minneola complex, Ford and Clark counties, Kansas. AAPG Bulletin, 71(11), 1329-1341.
Clark, M. (1981). Helium in Wyoming. Energy Resources of Wyoming; 32nd
Annual Field
Conference Guidebook, 1981, Wyoming Geological Association, pp. 119-130.
Clarke, R. H., Nuttall, W. J., & Glowacki, B. A. (2012). Introduction, in W. J. Nuttall, R. H.
Clarke & B. A. Glowacki, eds., The Future of Helium as a Natural Resource, Abingdon,
United Kingdom: Routledge, pp. 1-14.
Clauer, N. (2006). Towards an isotopic modeling of the illitization process based on data of
illite-type fundamental particles from mixed-layer illite-smectite. Clays and Clay Minerals,
54(1), 116-127.
Clayton, R. N. (2007). Isotopes: from Earth to the solar system. Annu. Rev. Earth Planet.
Sci., 35, 1-19.
Collerson, K. D., Lewry, J. F., Bickford, M. E., & Van Schmus, W. R. (1990). Crustal
evolution of the buried Precambrian of southern Saskatchewan: Implications for diamond

261
exploration. In L. S. Beck, C. T. Harper, Eds., Modern Exploration Techniques,
Saskatchewan Geological Society Special Publication Number 10, pp. 150-165.
Condie, K. C. (1976). Trace-element geochemistry of Archean greenstone belts. Earth-
Science Reviews, 12(4), 393-417.
Condie, K. C. (1982). Plate-tectonics model for Proterozoic continental accretion in the
southwestern United States. Geology, 10(1), 37-42.
Connolly, M., J. (2012). Summary Report for the Rudyard Field 2012 Deep Drilling
Program, Weil #1. Hill Co., Montana: Brainstorm Energy. pp. 42.
Connor, S. (2013, January 4). A ballooning problem: the great helium shortage. The
Independent. Retrieved from http://www.independent.co.uk
Coolen, J. J. M. M. M., Priem, H. N. A., Verdurmen, E. T., & Verschure, R. H. (1982).
Possible zircon U-Pb evidence for Pan-African granulite-facies metamorphism in the
Mozambique belt of southern Tanzania. Precambrian Research, 17(1), 31-40.
Coveney Jr, R. M., Goebel, E. D., Zeller, E. J., Dreschhoff, G. A., & Angino, E. E. (1987).
Serpentinization and the origin of hydrogen gas in Kansas. AAPG Bulletin, 71(1), 39-48.
Craig, H., Clarke, W. B., & Beg, M. A. (1975). Excess 3He in deep water on the East Pacific
Rise. Earth and Planetary Science Letters, 26(2), 125-132.
Craig, H., & Lupton, J. E. (1976). Primordial neon, helium, and hydrogen in oceanic basalts.
Earth and Planetary Science Letters, 31(3), 369-385.
Craig, H., & Lupton, J. E. (1981). 11. HELIUM-3 AND MANTLE VOLATILES IN THE
OCEAN AND THE OCEANIC CRUST. The oceanic lithosphere, 7, 391.
Creedy, D. P. (1988). Geological controls on the formation and distribution of gas in British
coal measure strata. International Journal of Coal Geology, 10(1), 1-31.
Crovetto, R., Fernández‐Prini, R., & Japas, M. L. (1982). Solubilities of inert gases and
methane in H2O and in D2O in the temperature range of 300 to 600 K. The Journal of
Chemical Physics, 76(2), 1077-1086.
Daniels, E. J., Aronson, J. L., Altaner, S. P., & Clauer, N. (1994). Late Permian age of NH4-
bearing illite in anthracite from eastern Pennsylvania: Temporal limits on coalification in the
central Appalachians. Geological Society of America Bulletin, 106(6), 760-766.
Dawson, J. B. (2008). The Gregory rift valley and Neogene-recent volcanoes of northern
Tanzania. Geological Society of London, London.
Delvaux, D., & Hanon, M. (1991). Neotectonics of the Mbeya area, SW Tanzania. Annual
report of the Royal Museum of Central Africa, Department of Geology and Mineralogy,
1992, 87-97.
Delvaux, D., Levi, K., Kajara, R., & Sarota, J. (1992). Cenozoic paleostress and kinematic
evolution of the Rukwa–North Malawi rift valley (East African Rift System). Bulletin des
Centres de Recherche Exploration-Production ElfAquitaine, 16, 383-406.

262
Delvaux, D., Kervyn, F., Vittori, E., Kajara, R. S. A., & Kilembe, E. (1998). Late
Quaternary tectonic activity and lake level change in the Rukwa Rift Basin. Journal of
African Earth Sciences, 26(3), 397-421.
Delvaux, D. (2001). Karoo rifting in western Tanzania: Precursor of Gondwana breakup.
Contributions to geology and paleontology of Gondwana in honor of Helmut Wopfner:
Cologne, Geological Institute, University of Cologne, 111-125.
Delvaux, D., Kraml, M., Sierralta, M., Wittenberg, A., Mayalla, J. W., Kabaka, K., Makene,
C., & GEOTHERM Working Group. (2010). Surface Exploration of a Viable Geothermal
Resource in Mbeya area, SW Tanzania. Part I: Geology of the Ngozi–Songwe Geothermal
System. In: Proceedings of the World Geothermal Congress, Bali, Indonesia, pp. 25-29.
Dobbin, C. E. (1935). Geology of natural gases rich in helium, nitrogen, carbon dioxide, and
hydrogen sulfide. In: H. A. Ley, ed., Geology of Natural Gas, Tulsa, Oklahoma. The
American Association of Petroleum Geologists Bulletin, pp. 1053–1072.
Dobbin, C. E. (1968). Geology of natural gases rich in helium, nitrogen, carbon dioxide, and
hydrogen sulphide. In: B. W. Beebe and B. F. Curtis, eds., Natural gases of North America,
v. 2: AAPG Memoir 9, pp. 1957 – 1969.
Dong, Z., Holditch, S., McVay, D., & Ayers, W. B. (2012). Global unconventional gas
resource assessment. SPE Economics & Management, 4(04), 222-234.
Downey, M. W. (1984). Evaluating seals for hydrocarbon accumulations. AAPG bulletin,
68(11), 1752-1763.
Downs, W. (2009). Influence of Injected Brine Water at Westwater Farms on Spanish
Valley Well Water Quality.
http://www.riversimulator.org/Resources/farcountry/OilGas/WestwaterFarms/SEC/DownsG
eologicReport.pdf (Accessed 10 November 2017). Dubois, M. K., Byrnes, A. P., Bohling, G. C., and Doveton, J. H. (2006). Multiscale
geologic and petrophysical modeling of the giant Hugoton gas field (Permian), Kansas and
Oklahoma, U.S.A. In: P. M. Harris and L. J. Weber, eds., Giant hydrocarbon reservoirs of
the world: From rocks to reservoir characterization and modeling: AAPG Memoir 88/SEPM
Special Publication, pp. 307-353.
Dubois, M. K. (2007). Ramp-scale geomodel for reservoir and stratigraphic analysis of the
Hugoton field (Wolfcampian, midcontinent USA) University of Kansas. (PhD Thesis). pp.
320.
Dudás, F. Ö. (1991). Geochemistry of igneous rocks from the Crazy Mountains, Montana,
and tectonic models for the Montana alkalic province. Journal of Geophysical Research:
Solid Earth, 96(B8), 13261-13277.
Dunai, T. J., & Roselieb, K. (1996). Sorption and diffusion of helium in garnet: implications
for volatile tracing and dating. Earth and planetary science letters, 139(3-4), 411-421.
Dunlap, R. E. (1969). The geology of the Pinta Dome-Navajo Springs helium fields, Apache
County, Arizona. University of Arizona. (MS Thesis). pp. 94.
Duvall, A. R., Clark, M. K., van der Pluijm, B. A., & Li, C. (2011). Direct dating of Eocene
reverse faulting in northeastern Tibet using Ar-dating of fault clays and low-temperature
thermochronometry. Earth and Planetary Science Letters, 304(3), 520-526.

263
Dyck, W., & Dunn, C. E. (1986). Helium and methane anomalies in domestic well waters in
southwestern Saskatchewan, Canada, and their relationship to other dissolved constituents,
oil and gas fields, and tectonic patterns. Journal of Geophysical Research: Solid Earth,
91(B12), 12343-12353.
Ebinger, C. J., Deino, A. L., Drake, R. E., & Tesha, A. L. (1989). Chronology of volcanism
and rift basin propagation- Rungwe volcanic province, East Africa. Journal of Geophysical
Research, 94(11), 15785-15803.
Ebinger, C., Djomani, Y. P., Mbede, E., Foster, A., & Dawson, J. B. (1997). Rifting
Archaean lithosphere: the Eyasi-Manyara-Natron rifts, East Africa. Journal of the
Geological Society, 154(6), 947-960.
Eddleman, M. W. (1961). Tectonics and geologic history of the Texas and Oklahoma
panhandles. In: C. R. Wagner, D. R. Cooley, W. W. Brashear, and M. W. Eddleman, eds.,
Oil and gas field of the Texas and Oklahoma panhandles: Panhandle Geological Society, pp.
61–68.
Ellis, G.S. (2014). Geochemistry of natural gases of the Anadarko Basin, Chapter 4.
In: D. K. Higley, compiler, Petroleum systems and assessment of undiscovered oil and gas
in the Anadarko Basin Province, Colorado, Kansas, Oklahoma, and Texas—USGS Province
58: U.S. Geological Survey Digital Data Series DDS–69–EE, pp 31.
Elston, D. P., & Shoemaker, E. M. (1960). Late Paleozoic and early Mesozoic structural
history of the Uncompahgre front. In: K.G. Smith. ed., Geology of the Paradox Basin Fold
and Fault Belt, Third Field Conference, 1960, Four Corners Geological Society. pp. 47-55.
Etiope, G., & Lombardi, S. (1996). Laboratory simulation of geogas microbubble flow.
Environmental Geology, 27(3), 226-232.
Etiope, G., & Martinelli, G. (2002). Migration of carrier and trace gases in the geosphere: an
overview. Physics of the earth and planetary interiors, 129(3), 185-204.
Farley, K. A. (2000). Helium diffusion from apatite: General behavior as illustrated by
Durango fluorapatite. Journal of Geophysical Research B, 105(B2), 2903-2914.
Farley, K. A. (2002). (U-Th)/He dating: Techniques, calibrations, and applications. Reviews
in Mineralogy and Geochemistry, 47(1), 819-844.
Flawn, P. T. (1954). Texas basement rocks: a progress report. AAPG Bulletin, 38(5), 900-
912.
Flawn, P. T. (1956). Basement rocks of Texas and southeast New Mexico: Bureau of
Economic Geology, University of Texas Publications, no. 5605, pp. 261.
Fontijn, K., Delvaux, D., Ernst, G. G., Kervyn, M., Mbede, E., & Jacobs, P. (2010). Tectonic
control over active volcanism at a range of scales: Case of the Rungwe Volcanic Province,
SW Tanzania; and hazard implications. Journal of African Earth Sciences, 58(5), 764-777.
Foster, A., Ebinger, C., Mbede, E., & Rex, D. (1997). Tectonic development of the northern
Tanzanian sector of the East African Rift System. Journal of the Geological Society, 154(4),
689-700.

264
Fritz, H., Tenczer, V., Hauzenberger, C. A., Wallbrecher, E., Hoinkes, G., Muhongo, S., &
Mogessie, A. (2005). Central Tanzanian tectonic map: a step forward to decipher
Proterozoic structural events in the East African Orogen. Tectonics, 24(6).
Fu, C. C., Yang, T. F., Walia, V., & Chen, C. H. (2005). Reconnaissance of soil gas
composition over the buried fault and fracture zone in southern Taiwan. Geochemical
Journal, 39(5), 427-439.
Fu, C. C., Yang, T. F., Du, J., Walia, V., Chen, Y. G., Liu, T. K., & Chen, C. H. (2008).
Variations of helium and radon concentrations in soil gases from an active fault zone in
southern Taiwan. Radiation Measurements, 43, S348-S352.
Gage, B. D., & Driskill, D. L. (2005). Analyses of Natural Gases, 2002-2004.
https://www.blm.gov/nstc/library/pdf/TN418.pdf (Accessed 20 November 2017).
Garven, G., Ge, S., Person, M. A., & Sverjensky, D. A. (1993). Genesis of stratabound ore
deposits in the Midcontinent basins of North America; 1, The role of regional groundwater
flow. American Journal of Science, 293(6), 497-568.
Garven, G. (1995). Continental-scale groundwater flow and geologic processes. Annual
Review of Earth and Planetary Sciences, 23(1), 89-117.
Gautheron, C., & Moreira, M. (2002). Helium signature of the subcontinental lithospheric
mantle. Earth and Planetary Science Letters, 199(1), 39-47.
Gerhard, L. C. (2004). A new look at an old petroleum province: Kansas Geological Survey,
Current Research in Earth Sciences, Bulletin 250, pt. 1, pp. 27:
http://www.kgs.ku.edu/Current/2004/Gerhard/index.html (Accessed 12 December 2017).
Gerling, C. R. (1983). McElmo Dome Leadville carbon dioxide field, Colorado. In: Fassett,
J.E., ed., Oil and Gas Fields of the Four Corners Area, Volume III: Four Corners Geological
Society, pp 735-739.
Gerling, P. (1998). New aspects on the origin of nitrogen in natural gas in Northern
Germany. In Fuel and Energy Abstracts,Vol. 3, No. 39, pp. 185.
Gerling, P., Geluk, M. C., Kockel, F., Lokhorst, A., Lott, G. K., & Nicholson, R. A. (1999).
’NW European Gas Atlas’–new implications for the Carboniferous gas plays in the western
part of the Southern Permian Basin. In: Geological Society, London, Petroleum Geology
Conference series, Vol. 5, No. 1, pp. 799-808. Geological Society of London.
Gifford, J. N. (2013). Precambrian crustal evolution of the Great Falls Tectonic Zone.
University of Florida. (PhD Thesis). pp 212.
Gifford, J. N., Mueller, P. A., Foster, D. A., & Mogk, D. W. (2014). Precambrian crustal
evolution in the Great Falls tectonic zone: Insights from xenoliths from the Montana Alkali
Province. The Journal of Geology, 122(5), 531-548.
Giggenbach, W. F., & Poreda, R. J. (1993). Helium isotopic and chemical composition of
gases from volcanic-hydrothermal systems in the Philippines. Geothermics, 22(5-6), 369-
380.
Gilfillan, S. M. (2006). Deep magmatic degassing and the Colorado Plateau uplift.
University of Manchester. (PhD Thesis). pp 141.

265
Gilfillan, S. M., Ballentine, C. J., Holland, G., Blagburn, D., Lollar, B. S., Stevens, S.,
Schoell, M., & Cassidy, M. (2008). The noble gas geochemistry of natural CO2 gas
reservoirs from the Colorado Plateau and Rocky Mountain provinces, USA. Geochimica et
Cosmochimica Acta, 72(4), 1174-1198.
Gold, T., & Held, M. (1987). HELIUM‐NITROGEN‐METHANE SYSTEMATICS IN
NATURAL GASES OF TEXAS AND KANSAS. Journal of Petroleum Geology, 10(4),
415-424.
Gosselin, D. C., Smith, M. R., Lepel, E. A., & Laul, J. C. (1992). Rare earth elements in
chloride-rich groundwater, Palo Duro Basin, Texas, USA. Geochimica et Cosmochimica
Acta, 56(4), 1495-1505.
Graupner, T., Niedermann, S., Kempe, U., Klemd, R., & Bechtel, A. (2006). Origin of ore
fluids in the Muruntau gold system: constraints from noble gas, carbon isotope and halogen
data. Geochimica et Cosmochimica Acta, 70(21), 5356-5370.
Grunau, H. R. (1981). Worldwide Review of Seals for Major Accumulations of Natural Gas:
ABSTRACT. AAPG Bulletin, 65(5), 933-933.
Guerra, M., & Lombardi, S. (2001). Soil-gas method for tracing neotectonic faults in clay
basins: the Pisticci field (Southern Italy). Tectonophysics, 339(3), 511-522.
Haendel, D., Mühle, K., Nitzsche, H. M., Stiehl, G., & Wand, U. (1986). Isotopic variations
of the fixed nitrogen in metamorphic rocks. Geochimica et cosmochimica Acta, 50(5), 749-
758.
Halverson, J. R. (1988). Seismic expression of the Upper Morrow sands, western Anadarko
Basin. Geophysics, 53(3), 290-303.
Hamak, J. E. (1989). Helium Resources of Wyoming. Gas Resources of Wyoming; 40th
Annual Field Conference Guidebook, 1989, Wyoming Geological Association, pp 117-121.
Hamilton, W., & Kroner, A. (1981). Crustal evolution by arc magmatism [and discussion].
Philosophical Transactions of the Royal Society of London A: Mathematical, Physical and
Engineering Sciences, 301(1461), 279-291.
Harðarson, B. S. (2014). Structural geology of the western branch of the East African Rift:
tectonics, volcanology and geothermal activity. Presented at Short Course IX on Exploration
for Geothermal Resources, organized by UNU-GTP, GDC and KenGen, at Lake Bogoria
and Lake Naivasha, Kenya, Nov. 2-23, 2014. pp. 14:
https://rafhladan.is/bitstream/handle/10802/9124/UNU-GTP-SC-19-0301.pdf (Accessed 13
December 2017).
Harris, J. E. (1993). Woodside: T. 18-20 S., R. 13-14 E., SLPM Emery County, Utah, Oil
and Gas Fields of Utah, Utah Geological Association.
Haynes, E. H. (1967). Developments in Eastern and Northwestern Colorado and Western
Nebraska in 1966. AAPG Bulletin, 51(6), 1124-1128.
Heaton, T. H. E. (1984). Rates and sources of 4He accumulation in groundwater.
Hydrological sciences journal, 29(1), 29-47.
Hemsell, C. C. (1939). Geology of Hugoton gas field of southwestern Kansas. AAPG
Bulletin, 23(7), 1054-1067.

266
Henry, M. E., & Hester, T. C. (1995). Morrow Sandstone Gas and Oil Stratigraphic Play in
Kansas Geological Survey, Digital Petroleum Atlas
http://www.kgs.ku.edu/DPA/frontEnd/Anadarko/Morrow/provSum.html
Heyman, O. G. (1983). Distribution and structural geometry of faults and folds along the
northwestern Uncompahgre uplift, western Colorado and eastern Utah. Northern Paradox
Basin - Uncompahgre Uplift, 1983, Grand Junction Geological Society. pp. 45-57.
Higley, D. K. (1995). Cambridge Arch/Central Kansas Uplift Province: Kansas Geological
Survey, Digital Petroleum Atlas: http://www.kgs.ku.edu/DPA/NMC/Prov/cambridge.html
(Accessed 12 December 2017).
Hilton, D. R., Hammerschmidt, K., Teufel, S., & Friedrichsen, H. (1993). Helium isotope
characteristics of Andean geothermal fluids and lavas. Earth and Planetary Science Letters,
120(3-4), 265-282.
Hilton, D. R., Fischer, T. P., & Marty, B. (2002). Noble gases in subduction zones and
volatile recycling. Rev Mineral Geochem, 47, 319-370.
Hiyagon, H., & Kennedy, B. M. (1992). Noble gases in CH4-rich gas fields, Alberta,
Canada. Geochimica et Cosmochimica Acta, 56(4), 1569-1589.
Hochstein, M. P., Temu, E. P., & Moshy, C. M. A. (2000). Geothermal resources of
Tanzania. In: Proceedings World Geothermal Congress 2000, May 28-June 10, Kyushu-
Tohoku, Japan, pp. 1233-1237.
Holland, G., Lollar, B. S., Li, L., Lacrampe-Couloume, G., Slater, G. F., & Ballentine, C. J.
(2013). Deep fracture fluids isolated in the crust since the Precambrian era. Nature,
497(7449), 357.
Holm, D., & Schneider, D. (2002). 40
Ar/39
Ar evidence for ca. 1800 Ma tectonothermal
activity along the Great Falls tectonic zone, central Montana. Canadian Journal of Earth
Sciences, 39(12), 1719-1728.
Holzner, C. P., McGinnis, D. F., Schubert, C. J., Kipfer, R., & Imboden, D. M. (2008).
Noble gas anomalies related to high-intensity methane gas seeps in the Black Sea. Earth and
Planetary Science Letters, 265(3), 396-409.
Hong, W. L., Yang, T. F., Walia, V., Lin, S. J., Fu, C. C., Chen, Y. G., Sano, Y., Chen, C.H.,
& Wen, K. L. (2010). Nitrogen as the carrier gas for helium emission along an active fault in
NW Taiwan. Applied Geochemistry, 25(4), 593-601.
Huffman, G. G. (1959). Pre-Desmoinesian isopachous and paleogeologic studies in central
Mid-Continent region. AAPG Bulletin, 43(11), 2541-2574.
Hunt, J. M. (1996). Petroleum geochemistry and geology, second edition: W .H. Freeman
and Company, New York, 743.
Hunt, A. G., Darrah, T. H., & Poreda, R. J. (2012). Determining the source and genetic
fingerprint of natural gases using noble gas geochemistry: A northern Appalachian Basin
case study. Aapg Bulletin, 96(10), 1785-1811.
Hutcheon, I. (1999). Controls on the distribution of non-hydrocarbon gases in the Alberta
Basin. Bulletin of Canadian Petroleum Geology, 47(4), 573-593.

267
Hussain, N. (1997). Flux of 4He from Carnmenellis granite: modelling of an HDR
geothermal reservoir. Applied geochemistry, 12(1), 1-8.
International Union of Pure and Applied Chemistry. (2005). Nomenclature of Inorganic
Chemistry, IUPAC Recommendations 2005 by N. G. Connelly, T. Damhus, R. M. Hartshorn
& A. T. Hutton. Retrieved from the IUPAC website:
http://old.iupac.org/publications/books/rbook/Red_Book_2005.pdf (Accessed 12 October
2017).
Jähne, B., Heinz, G., & Dietrich, W. (1987). Measurement of the diffusion coefficients of
sparingly soluble gases in water. Journal of Geophysical Research: Oceans, 92(C10),
10767-10776.
James, T. C. (1967a). Thermal springs in Tanzania. Institution of Mining and Metallurgy,
Transactions/Section B (Applied Earth Science) 76, B1–B18 in Macheyeki, A. S., Delvaux,
D., De Batist, M., & Mruma, A. (2008). Fault kinematics and tectonic stress in the
seismically active Manyara–Dodoma Rift segment in Central Tanzania–Implications for the
East African Rift. Journal of African Earth Sciences, 51(4), 163-188.
James, T. C. (1967b). Thermal springs in Tanzania – discussions and conclusions. Institution
of Mining and Metallurgy, Transactions/Section B (Applied Earth Science) 76, B168–B174
in Macheyeki, A. S., Delvaux, D., De Batist, M., & Mruma, A. (2008). Fault kinematics and
tectonic stress in the seismically active Manyara–Dodoma Rift segment in Central
Tanzania–Implications for the East African Rift. Journal of African Earth Sciences, 51(4),
163-188.
Jenden, P. D., Kaplan, I. R., Poreda, R., & Craig, H. (1988a). Origin of nitrogen-rich natural
gases in the California Great Valley: evidence from helium, carbon and nitrogen isotope
ratios. Geochimica et Cosmochimica Acta, 52(4), 851-861.
Jenden, P. D., Newell, K. D., Kaplan, I. R., & Watney, W. L. (1988b). Composition and
stable-isotope geochemistry of natural gases from Kansas, Midcontinent, USA. Chemical
Geology, 71(1-3), 117-147.
Jenden, P. D., & Kaplan, I. R. (1989). Origin of natural gas in Sacramento Basin, California.
AAPG Bulletin, 73(4), 431-453.
Jewett, J. M. (1951). Geologic structures in Kansas: Kansas Geological Survey, Bulletin 90,
pt. 6, pp. 105-172.
Jewett, J. M., & Merriam, D. F. (1959). Geologic framework of Kansas; a review for
geophysicists. In Symposium on geophysics in Kansas: Kansas Geological Survey Bulletin,
Vol. 137, pp. 9-52.
Kalberkamp, U., Schaumann, G., Ndonde, P.B., Chiragwile, S.A., Mwano, J.M., and
GEOTHERM working group, 2010. Surface exploration of a viable geothermal resource in
Mbeya area, SW Tanzania. Part III: Geophysics. Proceedings, World Geothermal Congress
2010, Bali, Indonesia 25 – 29 April 2010, pp. 6.
Kandie, R. J. (2014). EASTERN RIFT STRUCTURAL GEOLOGY–TECTONICS,
VOLCANOLOGY AND GEOTHERMAL. Presented at Short Course IX on Exploration for
Geothermal Resources, organized by UNU-GTP, GDC and KenGen, at Lake Bogoria and
Lake Naivasha, Kenya, Nov. 2-24, 2014, pp. 6:

268
https://rafhladan.is/bitstream/handle/10802/9126/UNU-GTP-SC-19-0303.pdf (Accessed 13
December, 2017).
Kansas Geological Survey, Production from Kansas Oil and Gas Leases:
http://www.kgs.ku.edu/Magellan/Field/lease.html (Accessed 4 May 2017).
Kansas Geological Survey, Geology of Riley and Geary Counties:
http://www.kgs.ku.edu/General/Geology/Riley/strat03c.html (Accessed 4 May 2017).
Keebler, W. E. (1956). Cottonwood-Harley Dome area, Grand County, Utah. Geology and
Economic Deposits of East Central Utah, Seventh Annual Field Conference: Utah
Geological Association, pp. 190-194.
Kennedy, B. M., Hiyagon, H., & Reynolds, J. H. (1990). Crustal neon: a striking uniformity.
Earth and Planetary Science Letters, 98(3-4), 277-286.
Kennedy, B. M., & van Soest, M. C. (2006). A helium isotope perspective on the Dixie
Valley, Nevada, hydrothermal system. Geothermics, 35(1), 26-43.
Kent, D. M. (1987). Paleotectonic controls on sedimentation in the northern Williston Basin,
Saskatchewan. In: J. A. Peterson, D. M. Kent, S. B. Anderson, R. H. Pilatzke and M. W.
Longman, eds., Williston Basin: Anatomy of a Cratonic Oil Province, Rocky Mountain
Association of Geologists, pp. 45-56.
Kim, D., Philp, R. P., & Sorenson, R. P. (2010). Geochemical characterization of solid
bitumen in the Chesterian (Mississippian) sandstone reservoir of the Hitch field, southwest
Kansas. AAPG bulletin, 94(7), 1031-1057.
Kipfer, R., Aeschbach-Hertig, W., Peeters, F., & Stute, M. (2002). Noble gases in lakes and
ground waters. Reviews in mineralogy and geochemistry, 47(1), 615-700.
Kluth, C. F., Ye, H., Royden, L., Burchfiel, C., & Schuepbach, M. (1998). Late Paleozoic
Deformation of Interior North America: The Greater Ancestral Rocky Mountains:
Discussion & Reply. AAPG bulletin, 82(12), 2272-2276.
Kluth, C. F., & DuChene, H. R. (2009). Late Pennsylvanian and Early Permian structural
geology and tectonic history of the Paradox Basin and Uncompahgre Uplift, Colorado and
Utah. In: W. S. Houston, L. L. Wray and P. G. Moreland, eds., The Paradox Basin Revisited
– New Developments in Petroleum Systems and Basin Analysis, Rocky Mountain
Association of Geologists, pp. 178-197.
Koester, E. A. (1935). Geology of central Kansas uplift. AAPG Bulletin, 19(10), 1405-1426.
Kraml, M., Mnjokava, T.T., Mayalla, J.W., Kabaka, K., and GEOTHERM working group.
(2010). Surface exploration of a viable geothermal resource in Mbeya area, SW Tanzania -
Part II: Geochemistry. Proceedings World Geothermal Congress 2010, Bali, Indonesia, 25 –
29 April 2010, pp. 8.
Kraml, M., Ochmann, N., Leible, D., Klin g, T., Chiragwile, S.A., Jodocy, M., Kreuter, H.,
and GPT Exploration Team. (2014). Results of the pre-feasibility study on Ngozi geothermal
project in Tanzania. Proceedings, 5th African Rift Geothermal Conference, 29-31 Oct. 2014,
Arusha, Tanzania.
Kraml, M., Kaudse, T., Aeschbach, W., & Tanzanian Exploration Team. (2016). THE
SEARCH FOR VOLCANIC HEAT SOURCES IN TANZANIA: A HELIUM ISOTOPE

269
PERSPECTIVE. Proceedings, 6th African Rift Geothermal Conference, 2–4 November 2016,
Addis Ababa, Ethiopia.
Kreulen, R., & Schuiling, R. D. (1982). N2-CH4z. sbnd; CO2 fluids during formation of the
Dôme de l'Agout, France. Geochimica et Cosmochimica Acta, 46(2), 193-203.
Krooss, B. M., Littke, R., Müller, B., Frielingsdorf, J., Schwochau, K., & Idiz, E. F. (1995).
Generation of nitrogen and methane from sedimentary organic matter: implications on the
dynamics of natural gas accumulations. Chemical Geology, 126(3), 291-318.
Krystyniak, A. M. (2005). Outcrop-based gamma ray characterization of the Woodford
Shale of south-central Oklahoma. Oklahoma State University. (MS Thesis). pp 131.
Kyser, T. K., & Rison, W. (1982). Systematics of rare gas isotopes in basic lavas and
ultramafic xenoliths. Journal of Geophysical Research: Solid Earth, 87(B7), 5611-5630.
Lam, C. K., & Yarger, H. L. (1989). State gravity map of Kansas. Kansas Geological
Survey. Bulletin, 226, 185-196.
Landes, K. K. (1927). A petrographic study of the pre-Cambrian of Kansas. AAPG Bulletin,
11(8), 821-824.
Larson, T. G. (1971). Hydrodynamic Interpretation of Mid-Continent: Region 7 in M 15:
Future Petroleum Provinces of the United States--Their Geology and Potential, Volume 2,
pp. 1043-1046.
Lee, Y., & Deming, D. (1999). Heat flow and thermal history of the Anadarko Basin and the
western Oklahoma Platform. Tectonophysics, 313(4), 399-410.
Lee, Y., & Deming, D. (2002). Overpressures in the Anadarko basin, southwestern
Oklahoma: Static or dynamic? AAPG bulletin, 86(1), 145-160.
Le Gall, B., Gernigon, L., Rolet, J., Ebinger, C., Gloaguen, R., Nilsen, O., Dypvik, H.,
Deffontaines, B., & Mruma, A. (2004). Neogene-Holocene rift propagation in central
Tanzania: Morphostructural and aeromagnetic evidence from the Kilombero area.
Geological Society of America Bulletin, 116(3-4), 490-510.
Le Gall, B., Nonnotte, P., Rolet, J., Benoit, M., Guillou, H., Mousseau-Nonnotte, M.,
Albaric, J., & Deverchère, J. (2008). Rift propagation at craton margin.: Distribution of
faulting and volcanism in the North Tanzanian Divergence (East Africa) during Neogene
times. Tectonophysics, 448(1), 1-19.
Lenoir, J. L., Liégeois, J. P., Theunissen, K., & Klerkx, J. (1994). The Palaeoproterozoic
Ubendian shear belt in Tanzania: geochronology and structure. Journal of African Earth
Sciences, 19(3), 169-184.
Li, L., Lollar, B. S., Li, H., Wortmann, U. G., & Lacrampe-Couloume, G. (2012).
Ammonium stability and nitrogen isotope fractionations for–NH3 (aq)–NH3 (gas) systems at
20–70° C and pH of 2–13: Applications to habitability and nitrogen cycling in low-
temperature hydrothermal systems. Geochimica et Cosmochimica Acta, 84, 280-296.
Lippmann, J., Stute, M., Torgersen, T., Moser, D. P., Hall, J. A., Lin, L., Borcsik, M., &
Onstott, T. C. (2003). Dating ultra-deep mine waters with noble gases and 36
Cl,
Witwatersrand Basin, South Africa. Geochimica et Cosmochimica Acta, 67(23), 4597-4619.

270
Lippmann-Pipke, J., Lollar, B. S., Niedermann, S., Stroncik, N. A., Naumann, R., van
Heerden, E., & Onstott, T. C. (2011). Neon identifies two billion year old fluid component
in Kaapvaal Craton. Chemical Geology, 283(3), 287-296.
Lippolt, H. J., & Weigel, E. (1988). 4He diffusion in
40Ar-retentive minerals. Geochimica et
Cosmochimica Acta, 52(6), 1449-1458.
Lippolt, H. J., Leitz, M., Wernicke, R. S., & Hagedorn, B. (1994).
(Uranium+thorium)/helium dating of apatite: experience with samples from different
geochemical environments. Chemical Geology, 112(1-2), 179-191.
Littke, R., Krooss, B., Idiz, E., & Frielingsdorf, J. (1995). Molecular nitrogen in natural gas
accumulations: generation from sedimentary organic matter at high temperatures. AAPG
bulletin, 79(3), 410-430.
Lopez, D. A. (2000). Geologic Summary of the Sweet Grass Hills, Liberty and Toole
Counties, Montana. Montana Geological Society: 50th Anniversary Symposium:
Montana/Alberta Thrust Belt and Adjacent Foreland: Volume I, pp. 27-46.
Løseth, H., Wensaas, L., Arntsen, B., & Hovland, M. (2003). Gas and fluid injection
triggering shallow mud mobilization in the Hordaland Group, North Sea. Geological
Society, London, Special Publications, 216(1), 139-157.
Lowenstern, J. B., Bergfeld, D., Evans, W. C., & Hunt, A. G. (2015). Origins of geothermal
gases at Yellowstone. Journal of Volcanology and Geothermal Research, 302, 87-101.
Luczaj, J. A., & Goldstein, R. H. (2000). Diagenesis of the Lower Permian Krider Member,
southwest Kansas, USA: fluid-inclusion, U-Pb, and fission-track evidence for reflux
dolomitization during latest Permian time. Journal of Sedimentary Research, 70(3).
Lukert, L. H. (1949). Subsurface Cross Sections from Marion County Kansas, to Osage
County, Oklahoma. AAPG Bulletin, 33(2), 131-152.
Macheyeki, A. S., Delvaux, D., De Batist, M., & Mruma, A. (2008). Fault kinematics and
tectonic stress in the seismically active Manyara–Dodoma Rift segment in Central
Tanzania–Implications for the East African Rift. Journal of African Earth Sciences, 51(4),
163-188.
Macheyeki, A. S., Delvaux, D., Batist, M. D., & Mruma, A. (2012). Paleoseismic
Investigations along the Bubu Fault, Dodoma-Tanzania. Tanzania Journal of Science, 38(2),
138-154.
Magnani, M. B., Miller, K. C., Levander, A., & Karlstrom, K. (2004). The Yavapai-
Mazatzal boundary: A long-lived tectonic element in the lithosphere of southwestern North
America. Geological Society of America Bulletin, 116(9-10), 1137-1142.
Maher, J. C., & Collins, J. B. (1949). Pre-Pennsylvanian geology of southwestern Kansas,
southeastern Colorado, and the Oklahoma Panhandle. Tulsa Geological Society Digest:
Tulsa Geological Society, Vol. 17, pp 43-47.
Maione, S. J. (2004). Helium Exploration–A 21st Century Challenge. Houston Geological
Society Bulletin, Vol. 46, No. 6, pp. 27-28 and 30.

271
Mamyrin, B. A., & Tolstikhin, I. N. (1984). Helium isotopes in nature, volume 3 of
Developments in Geochemistry (first ed.), Elsevier, Amsterdam, New York, Tokyo.
Manya, S., Maboko, M. A., & Nakamura, E. (2007). The geochemistry of high-Mg andesite
and associated adakitic rocks in the Musoma-Mara Greenstone Belt, northern Tanzania:
Possible evidence for Neoarchaean ridge subduction?. Precambrian Research, 159(3), 241-
259.
Martel, D. J., O'Nions, R. K., Hilton, D. R., & Oxburgh, E. R. (1990). The role of element
distribution in production and release of radiogenic helium: The Carnmenellis Granite,
southwest England. Chemical Geology, 88(3-4), 207-221.
Martin, T. G., Smith, S. N., & Bondos, J. (2008). Materials and Corrosion History With
Labarge Madison Production: A 20 Year Story Of Success. Paper, 8634, 16-20.
Marty, B., Jambon, A., & Sano, Y. (1989). Helium isotopes and CO2 in volcanic gases of
Japan. Chemical Geology, 76(1-2), 25-40.
Marty, B., Torgersen, T., Meynier, V., O'Nions, R. K., & Marsily, G. (1993). Helium isotope
fluxes and groundwater ages in the Dogger Aquifer, Paris Basin. Water resources research,
29(4), 1025-1035.
McClellan, H. W. (1930). Subsurface distribution of pre-Mississippian rocks of Kansas and
Oklahoma. AAPG Bulletin, 14(12), 1535-1556.
Merriam, D. F., Cole, V. B., & Hambleton, W. W. (1961). Distribution of Precambrian
Basement Rock Types in Kansas: GEOLOGICAL NOTES. AAPG Bulletin, 45(12), 2018-
2024.
Merriam, D. F. (1963). The Geologic History of Kansas. Kansas Geological Survey, Bulletin
162, pp 317.
Merriam, D. F. (2010). The geology and petroleum resources of Kansas: A review from
alpha to omega or from the Pleistocene to the Precambrian. Natural resources research,
19(4), 293-316.
Merrill, M. D., Hunt, A. G., & Lohr, C. D. (2014). Noble gas geochemistry investigation of
high CO2 natural gas at the LaBarge Platform, Wyoming, USA. Energy Procedia, 63, 4186-
4190.
Mingram, B., Hoth, P., Lüders, V., & Harlov, D. (2005). The significance of fixed
ammonium in Palaeozoic sediments for the generation of nitrogen-rich natural gases in the
North German Basin. International Journal of Earth Sciences, 94(5-6), 1010-1022.
Mnjokava, T. T. (2007). Interpretation of Exploration Geochemical Data for Geothermal
Fluids from the Geothermal Field of the Rungwe Volcanic Area, SW-Tanzania. UNU-GTP
Reykjavík, Iceland, Reports, (14), 303-332.
Möller, A., Appel, P., Mezger, K., & Schenk, V. (1995). Evidence for a 2 Ga subduction
zone: eclogites in the Usagaran belt of Tanzania. Geology, 23(12), 1067-1070.
Moorbath, S., Welke, H., & Gale, N. H. (1969). The significance of lead isotope studies in
ancient, high-grade metamorphic basement complexes, as exemplified by the Lewisian rocks
of northwest Scotland. Earth and Planetary Science Letters, 6(4), 245-256.

272
Morgan, C. D., & Chidsey Jr, T. C. (1991). Gordon creek, Farnham dome, and Woodside
fields, carbon and Emery Counties, Utah. In: T. C. Chidsey Jr., ed., Geology of East-Central
Utah, Utah Geological Association Publication, vol. 19, pp. 301–309.
Morley, C. K., Nelson, R. A., Patton, T. L., & Munn, S. G. (1990). Transfer zones in the
East African rift system and their relevance to hydrocarbon exploration in rifts (1). AAPG
Bulletin, 74(8), 1234-1253.
Morley, C. K., Cunningham, S. M., Harper, R. M., & Wescott, W. A. (1992). Geology and
geophysics of the Rukwa rift, East Africa. Tectonics, 11(1), 69-81.
Morley, C. K., Karanja, F. M., Wescott, W. A., Stone, D. M., Harper, R. M., Wigger, S. T.,
& Day, R. A. (1999). Geology and geophysics of the Rukwa rift. In: C. K. Morley, ed.,
Geoscience of rift systems—evolution of East Africa: AAPG Studies in Geology 44, p. 91–
110.
Mruma, A. H. (1995). Stratigraphy and palaeodepositional environment of the
Palaeoproterozoic volcano-sedimentary Konse Group in Tanzania. Journal of African Earth
Sciences, 21(2), 281-290.
Msabi, M. M. (2010). Seismic source zonation for the northern Tanzania divergence.
University of Dar es Salaam, (MS Thesis). pp. 125.
Mshiu, E. E., & Maboko, M. A. (2012). Geochemistry and petrogenesis of the late Archaean
high-K granites in the southern Musoma-Mara Greenstone Belt: Their influence in evolution
of Archaean Tanzania Craton. Journal of African Earth Sciences, 66, 1-12.
Mueller, P. A., Heatherington, A. L., Kelly, D. M., Wooden, J. L., & Mogk, D. W. (2002).
Paleoproterozoic crust within the Great Falls tectonic zone: Implications for the assembly of
southern Laurentia. Geology, 30(2), 127-130.
Muhongo, S., & Lenoir, J. L. (1994). Pan-African granulite-facies metamorphism in the
Mozambique Belt of Tanzania: U-Pb zircon geochronology. Journal of the Geological
Society, 151(2), 343-347.
Newell, K. D., Watney, W. L., Cheng, S. W. L., and Brownrigg, R. L. (1987). Stratigraphic
and spatial distribution of oil and gas production in Kansas: Kansas Geological Survey,
Subsurface Geology Series 9, pp 86:
http://www.kgs.ku.edu/Publications/Bulletins/Sub9/index.html (Accessed 12 December
2017).
Newton, R., & Round, G. F. (1961). The diffusion of helium through sedimentary rocks.
Geochimica et Cosmochimica Acta, 22(2), 106-132.
Nicholas, R. L., & Rozendal, R. A. (1975). Subsurface positive elements within Ouachita
foldbelt in Texas and their relation to Paleozoic cratonic margin. AAPG Bulletin, 59(2), 193-
216.
Niedermann, S., Graf, T., & Marti, K. (1993). Mass spectrometric identification of cosmic-
ray-produced neon in terrestrial rocks with multiple neon components. Earth and Planetary
Science Letters, 118(1-4), 65-73.
Nier, A. O. (1940). A mass spectrometer for routine isotope abundance measurements.
Review of Scientific Instruments, 11(7), 212-216.

273
Nissen, S. E., Marfurt, K. J., & Carr, T. R. (2004). Identifying subtle fracture trends in the
Mississippian saline aquifer unit using new 3-D seismic attributes. Kansas Geological
Survey Open File Report 2004-56: http://www.kgs.ku.edu/PRS/publication/2004/2004-56
(Accessed 4 December 2017).
Nordquist, J. W., & Leskela, W. (1968). Natural gas in Sweetgrass Arch area, northwestern
Montana. AAPG Memoir 9, vol. 1, pp. 736 -759. Nyblade, A. A., & Brazier, R. A. (2002). Precambrian lithospheric controls on the
development of the East African rift system. Geology, 30(8), 755-758.
Nzaro, M. A. (1970). Geothermal resources of Tanzania. Geothermics, 2, 1039-1043.
O'Brien, H. E., Irving, A. J., & McCallum, I. S. (1991). Eocene potassic magmatism in the
Highwood Mountains, Montana: petrology, geochemistry, and tectonic implications. Journal
of Geophysical Research: Solid Earth, 96(B8), 13237-13260.
O'Brien, H. E., Irving, A. J., McCallum, I. S., & Thirlwall, M. F. (1995). Strontium,
neodymium, and lead isotopic evidence for the interaction of post-subduction asthenospheric
potassic mafic magmas of the Highwood Mountains, Montana, USA, with ancient Wyoming
craton lithospheric mantle. Geochimica et Cosmochimica Acta, 59(21), 4539-4556.
Olson, T. M., Babcock, J. A., Prasad, K. V. K., Boughton, S. D., Wagner, P. D., Franklin,
M. H., & Thompson, K. A. (1997). Reservoir characterization of the giant Hugoton gas
field, Kansas. AAPG bulletin, 81(11), 1785-1803.
O'Neill, J. M., & Lopez, D. A. (1985). Character and regional significance of Great Falls
tectonic zone, east-central Idaho and west-central Montana. AAPG Bulletin, 69(3), 437-447.
Omenda, P. A. (2005). The geology and geothermal activity of the East African Rift System.
In: Workshop for Decision Makers on Geothermal Projects and Management. Naivasha,
Kenya, pp. 1-10. http://www.os.is/gogn/unu-gtp-sc/UNU-GTP-SC-01-03.pdf (Accessed 7
November 2017).
O'Nions, R. K., & Oxburgh, E. R. (1988). Helium, volatile fluxes and the development of
continental crust. Earth and Planetary Science Letters, 90(3), 331-347.
Osmond, J. C. (1964). Tectonic history of the Uinta basin, Utah. In E. F. Sabatka, ed.,
Guidebook to the geology and mineral resources of the Uinta basin: Intermountain
Association of Petroleum Geologists 13th Annual Field Conference Guidebook, pp. 47–58.
Otto, E.P. and Picard, M.D. (1976). Petrology of Entrada Sandstone (Jurassic), northeastern
Utah. In: Symposium on the Geology of the Cordilleran Hingeline, Rocky Mountain
Association of Geologists, pp. 231- 245.
Oxburgh, E. R., O'Nions, R. K., & Hill, R. I. (1986). Helium isotopes in sedimentary basins.
Nature, 324, 632-635.
Ozima, M. (1994). Noble gas state in the mantle. Reviews of Geophysics, 32(4), 405-426.
Ozima, M., & Podosek, F. A. (2001). Noble Gas Geochemistry (2nd
Edition). Cambridge
University Press. pp. 302.

274
Paxton, S. T., Cruse, A. M., & Krystyniak, A. M. (2006). Detailed fingerprints of global sea-
level change revealed in Upper Devonian/Mississippian Woodford Shale of south-central
Oklahoma. In: AAPG Annual Meeting, Search and Discovery Article (Vol. 40211).
Pepin, R. O., & Porcelli, D. (2002). Origin of noble gases in the terrestrial planets. Reviews
in Mineralogy and Geochemistry, 47(1), 191-246.
Peterson, J. A. (1957). Marine Jurassic of northern Rocky Mountains and Williston Basin.
AAPG Bulletin, 41(3), 399-440.
Pettke, T., Frei, R., Kramers, J. D., & Villa, I. M. (1997). Isotope systematics in vein gold
from Brusson, Val d'Ayas (NW Italy) 3.(U+ Th) He and KAr in native Au and its fluid
inclusions. Chemical geology, 135(3-4), 173-187.
Pierce A. P., Gott G. B., and Mytton J. W. (1964) Uranium and helium in the Panhandle gas
field, Texas, and adjacent areas. In: USGS Prof. Pap., Vol. 454-G, pp. 57.
Pinna, P., Calvez, J. Y., Abessolo, A., Angel, J. M., Mekoulou-Mekoulou, T., Mananga, G.,
& Vernhet, Y. (1994). Neoproterozoic events in the Tcholliré area: Pan-African crustal
growth and geodynamics in central-northern Cameroon (Adamawa and North Provinces).
Journal of African Earth Sciences, 18(4), 347-353.
Pinti, D. L., & Marty, B. (1995). Noble gases in crude oils from the Paris Basin, France:
Implications for the origin of fluids and constraints on oil-water-gas interactions.
Geochimica et Cosmochimica Acta, 59(16), 3389-3404.
Pinti, D. L., & Marty, B. (1998). The origin of helium in deep sedimentary aquifers and the
problem of dating very old groundwaters. Geological Society, London, Special Publications,
144(1), 53-68.
Pflumio, C., Boulègue, J., & Tiercelin, J. J. (1994). Hydrothermal activity in the northern
Tanganyika rift, East Africa. Chemical Geology, 116(1-2), 85-109.
Poreda, R. J., Jenden, P. D., Kaplan, I. R., & Craig, H. (1986). Mantle helium in Sacramento
basin natural gas wells. Geochimica et Cosmochimica Acta, 50(12), 2847-2853.
Poreda, R. J., Hunt, A. G., Lyons, W. B., & Welch, K. A. (2004). The helium isotopic
chemistry of Lake Bonney, Taylor Valley, Antarctica: Timing of late Holocene climate
change in Antarctica. Aquatic Geochemistry, 10(3-4), 353-371.
Prinzhofer, A. (2013). Noble gases in oil and gas accumulations. In The Noble Gases as
Geochemical Tracers (pp. 225-247). Springer Berlin Heidelberg.
Quennell, A. M. (1956). The Bukoban System of East Africa. In Report of the International
Geological Congress, 20th Session, Mexico, pp. 281-307.
Rascoe Jr., B. (1962). Regional stratigraphic analysis of Pennsylvanian and Permian rocks in
western mid-continent, Colorado, Kansas, Oklahoma, Texas. AAPG Bulletin, 46(8), 1345-
1370.
Rascoe Jr., B. (1978). Late Paleozoic structural evolution of the Las Animas Arch, in J. D.
Pruit, ed., Energy resources of the Denver basin: Rocky Mountain Association of
Geologists, pp. 113–127.

275
Rascoe Jr., B., and Adler, F. J. (1983). Permo-Carboniferous hydro-carbon accumulations,
Mid-continent, U.S.A.: AAPG Bulletin, v. 67, p. 979 – 1001.
Ray, M. C., Hilton, D. R., Muñoz, J., Fischer, T. P., & Shaw, A. M. (2009). The effects of
volatile recycling, degassing and crustal contamination on the helium and carbon
geochemistry of hydrothermal fluids from the Southern Volcanic Zone of Chile. Chemical
Geology, 266(1), 38-49.
Reddy, S. M., Collins, A. S., Buchan, C., & Mruma, A. H. (2004). Heterogeneous excess
argon and Neoproterozoic heating in the Usagaran Orogen, Tanzania, revealed by single
grain 40
Ar/39
Ar thermochronology. Journal of African Earth Sciences, 39(3), 165-176.
Reich, M., Ewing, R. C., Ehlers, T. A., & Becker, U. (2007). Low-temperature anisotropic
diffusion of helium in zircon: implications for zircon (U–Th)/He thermochronometry.
Geochimica et Cosmochimica Acta, 71(12), 3119-3130.
Reimer, G. M. (1976). Helium detection as a guide for uranium exploration. US Geological
Survey. Open File Report 76-240, 1-14.
Reiners, P. W., & Farley, K. A. (1999). Helium diffusion and (U–Th)/He
thermochronometry of titanite. Geochimica et Cosmochimica Acta, 63(22), 3845-3859.
Reiners, P. W. (2005). Zircon (U-Th)/He thermochronometry. Reviews in Mineralogy and
Geochemistry, 58(1), 151-179.
Rice, D. D., Nydegger, G. L., & Brown, C. A. (1990). Bowdoin Field--USA Bowdoin
Dome, Williston Basin. In E. A. Beaumont and N. H. Foster, eds., Structural traps III,
tectonic fold and fault traps: AAPG Treatise of Petroleum Geology, pp. 337–355.
Rich, J. L. (1931). Source and date of accumulation of oil in granite ridge pools of Kansas
and Oklahoma. AAPG Bulletin, 15(12), 1431-1452.
Roberts, E. M., O'Connor, P. M., Gottfried, M. D., Stevens, N., Kapalima, S., & Ngasala, S.
(2004). Revised stratigraphy and age of the Red Sandstone Group in the Rukwa Rift Basin,
Tanzania. Cretaceous Research, 25(5), 749-759.
Roberts, E. M., Stevens, N. J., O’Connor, P. M., Dirks, P. H. G. M., Gottfried, M. D., Clyde,
W. C., Armstrong, R. A., Kemp, A. I. S., and Hemming, S. (2012). Initiation of the western
branch of the East African Rift coeval with the eastern branch. Nature Geoscience, 5(4),
289-294.
Robertson, J. O., Chilingar, G. V., Khilyuk, L. F., & Endres, B. (2012). Migration of Gas
from Oil/Gas Fields. Energy Sources, Part A: Recovery, Utilization, and Environmental
Effects, 34(15), 1436-1447.
Rønnevik, C., Ksienzyk, A. K., Fossen, H., & Jacobs, J. (2017). Thermal evolution and
exhumation history of the Uncompahgre Plateau (northeastern Colorado Plateau), based on
apatite fission track and (U-Th)-He thermochronology and zircon U-Pb dating. Geosphere,
13(2), 518-537.
Rosholt, J. N., Zartman, R. E., & Nkomo, I. T. (1973). Lead isotope systematics and
uranium depletion in the Granite Mountains, Wyoming. Geological Society of America
Bulletin, 84(3), 989-1002.

276
Salah, M. G., & Alsharhan, A. S. (1998). The Precambrian basement: a major reservoir in
the rifted basin, Gulf of Suez. Journal of Petroleum Science and Engineering, 19(3), 201-
222.
Sano, Y., Nakamura, Y., Wakita, H., Urabe, A., & Tominaga, T. (1984). Helium-3 emission
related to volcanic activity. Science, 224, 150-152.
Sano, Y., Nakamura, Y., Notsu, K., & Wakita, H. (1988). Influence of volcanic eruptions on
helium isotope ratios in hydrothermal systems induced by volcanic eruptions. Geochimica et
Cosmochimica Acta, 52(5), 1305-1308.
Sawin, R.S., Franseen, E.K., Watney, W.L., West, R.R., and Ludvigson, G.A. (2009). New
Stratigraphic Rank for the Carboniferous, Mississippian, and Pennsylvanian in Kansas; in,
Current Research in Earth Sciences: Kansas Geological Survey, Bulletin 256, part 1.
http://www.kgs.ku.edu/Current/2009/Sawin/index.html (Accessed 5 October 2017).
Sears, B. (2012). A history of the helium industry. In: W. J. Nuttall, R. H. Clarke & B. A.
Glowacki. eds., The Future of Helium as a Natural Resource. Abingdon, United Kingdom:
Routledge, pp. 15-47.
Schmoker, J. W. (1989). Thermal maturity of the Anadarko basin, in K. S. Johnson, ed.,
Anadarko basin symposium: Oklahoma Geological Survey Circular 90, pp 25–31.
Schroth, H. A. (1953). Bowdoin Dome, Montana. In Billings Geological Society,
Guidebook: Fourth Annual Field Conference, September 10-12, 1953, pp.137-141.
Schoell, M., Tietze, K., & Schoberth, S. M. (1988). Origin of methane in Lake Kivu (east-
central Africa). Chemical geology, 71(1-3), 257-265.
Seneshen, D. M., Chidsey Jr, T. C., Morgan, C. D., & Berg, M. D. V. (2009). New
techniques for new discoveries–results from the Lisbon Field area, Paradox Basin, Utah.
Shaw, C. A., & Karlstrom, K. E. (1999). The Yavapai-Mazatzal crustal boundary in the
southern Rocky Mountains. Rocky Mountain Geology, 34(1), 37-52.
Shepard, W., & Bartow, B. (1986). Tectonic history of the Sweetgrass arch, a key to finding
new hydrocarbons, Montana and Alberta. In: J. H. Noll and K. M. Doyle, eds., Rocky
Mountain oil and gas fields: Wyoming Geological Association 1986 Symposium, pp. 9–19.
Sherwood-Lollar, B., Ballentine, C. J., & Onions, R. K. (1997). The fate of mantle-derived
carbon in a continental sedimentary basin: integration of C/He relationships and stable
isotope signatures. Geochimica et Cosmochimica Acta, 61(11), 2295-2307.
Shurr, G. W., Wosick, F. D., & Rice, D. D. (1993). Regional Pressure Patterns as Evidence
for Fractured Reservoirs in the Bowdoin and Phillips Sandstones on Bowdoin Dome,
Montana. In: L. D. V. Hunter, ed., Energy and mineral resources of central Montana:
Montana Geological Society, pp. 117–127.
Shuster, D. L., Flowers, R. M., & Farley, K. A. (2006). The influence of natural radiation
damage on helium diffusion kinetics in apatite. Earth and Planetary Science Letters, 249(3),
148-161.
Smith, D., Goodwin, T., Schillinger, J. (2004). Challenges to the Worldwide Supply of
Helium in the Next Decade, AIP Conference Proceedings, pp. 119.

277
Sommer, H., Kröner, A., Hauzenberger, C., Muhongo, S., & Wingate, M. T. D. (2003).
Metamorphic petrology and zircon geochronology of high‐grade rocks from the central
Mozambique Belt of Tanzania: crustal recycling of Archean and Palaeoproterozoic material
during the Pan‐African orogeny. Journal of Metamorphic Geology, 21(9), 915-934.
Sorenson, R. P. (1996). Dissolution of Stone Corral Salt in the Hugoton Embayment: Tulsa
Geological Society, Digest, pp. 322–330.
Sorenson, R. P. (2005). A dynamic model for the Permian Panhandle and Hugoton fields,
western Anadarko basin. AAPG bulletin, 89(7), 921-938.
Stahl, W. J. (1977). Carbon and nitrogen isotopes in hydrocarbon research and exploration.
Chemical Geology, 20, 121-149.
Staudacher, T. (1987). Upper mantle origin for Harding County well gases. Nature, 325,
605-607.
Stewart, W. W., & Street, B. A. (1992). Labarge Anticline. Wyoming Oil and Gas Fields
Symposium, Greater Green River Basin and Overthrust Belt: Wyoming Geological
Association, pp. 200-205.
Stilwell D. P. (1989). CO2 resources of the Moxa Arch and the Madison Reservoir.
Wyoming Geological Association Fortieth Field Conference Guidebook - Gas Resources of
Wyoming, pp. 105–115.
Stokes, W. L. (1976). What is the Wasatch Line? In: J. G. Hill, ed., Geology of the
Cordilleran hinge line: Rocky Mountain Geologists Symposium, Denver, Colorado, pp. 11–
25.
Stokes, M. (2013, January 4). Our research is on ice due to shortage of helium. The
Independent. Retrieved from http://www.independent.co.uk
Stowe, C. (1972). Oil and gas production in Utah to 1970, Utah Geological and
Mineralogical Survey, Bulletin 94, pp. 108-110.
Stuart, F., Turner, G., & Taylor, R. (1994). He–Ar isotope systematics of fluid inclusions:
resolving mantle and crustal contributions to hydrothermal fluids. Noble Gas Geochemistry
and Cosmochemistry, 261-277.
Stuart, F. M., Burnard, P. G., Taylor, R. E. A., & Turner, G. (1995). Resolving mantle and
crustal contributions to ancient hydrothermal fluids: He-Ar isotopes in fluid inclusions from
Dae Hwa W-Mo mineralisation, South Korea. Geochimica et Cosmochimica Acta, 59(22),
4663-4673.
Stute, M., Sonntag, C., Déak, J., & Schlosser, P. (1992). Helium in deep circulating
groundwater in the Great Hungarian Plain: Flow dynamics and crustal and mantle helium
fluxes. Geochimica et Cosmochimica Acta, 56(5), 2051-2067.
Taylor, S. R., and McLennan, S. M. (1985). The Continental Crust: its Composition and
Evolution. Blackwell Scientific Publications. pp. 328.
Tedesco, D., Tassi, F., Vaselli, O., Poreda, R. J., Darrah, T., Cuoco, E., & Yalire, M. M.
(2010). Gas isotopic signatures (He, C, and Ar) in the Lake Kivu region (western branch of
the East African rift system): Geodynamic and volcanological implications. Journal of
Geophysical Research: Solid Earth, 115(B1).

278
Thompson, J. A. (1964). The occurrence of helium in the Cambrian near Swift Current,
Saskatchewan. In: 3rd
International Williston Basin Symposium. pp. 179-184.
Tiercelin, J. J., Pflumio, C., Castrec, M., Boulégue, J., Gente, P., Rolet, J., Coussement, C.,
Stetter, K.O., Huber, R., Buku, S., & Mifundu, W. (1993). Hydrothermal vents in Lake
Tanganyika, East African, Rift system. Geology, 21(6), 499-502.
Tolstikhin, I. N. (1975). Helium isotopes in the Earth's interior and in the atmosphere: a
degassing model of the Earth. Earth and Planetary Science Letters, 26(1), 88-96.
Tomonaga, Y., Marzocchi, R., Pera, S., Pfeifer, H. R., Kipfer, R., Decrouy, L., &
Vennemann, T. (2017). Using noble-gas and stable-isotope data to determine groundwater
origin and flow regimes: Application to the Ceneri Base Tunnel (Switzerland). Journal of
Hydrology, 545, 395-409.
Torgersen, T., & Clarke, W. B. (1985). Helium accumulation in groundwater, I: An
evaluation of sources and the continental flux of crustal 4He in the Great Artesian Basin,
Australia. Geochimica et Cosmochimica Acta, 49(5), 1211-1218.
Torgersen, T., & Ivey, G. N. (1985). Helium accumulation in groundwater. II: A model for
the accumulation of the crustal 4He degassing flux. Geochimica et Cosmochimica Acta,
49(11), 2445-2452.
Torgersen, T. (1989). Terrestrial helium degassing fluxes and the atmospheric helium
budget: Implications with respect to the degassing processes of continental crust. Chemical
Geology: Isotope Geoscience section, 79(1), 1-14.
Torgersen, T., & Kennedy, B. M. (1999). Air-Xe enrichments in Elk Hills oil field gases:
role of water in migration and storage. Earth and Planetary Science Letters, 167(3), 239-
253.
Trull, T. W., Kurz, M. D., & Jenkins, W. J. (1991). Diffusion of cosmogenic3He in olivine
and quartz: implications for surface exposure dating. Earth and Planetary Science Letters,
103(1-4), 241-256.
Ungerer, P., Burrus, J., Doligez, B., Chenet, P. Y., & Bessis, F. (1990). Basin Evaluation by
Integrated Two-Dimensional Modeling of Heat Transfer, Fluid Flow, Hydrocarbon
Generation, and Migration (1). AAPG Bulletin, 74(3), 309-335.
United States Geological Survey. (2017). Mineral Commodity Summaries 2017: Helium by
J. E. Hamak. Retrieved from the USGS website:
https://minerals.usgs.gov/minerals/pubs/commodity/helium/mcs-2017-heliu.pdf (Accessed
10 October 2017).
Van Soest, M. C., Hilton, D. R., & Kreulen, R. (1998). Tracing crustal and slab
contributions to arc magmatism in the Lesser Antilles island arc using helium and carbon
relationships in geothermal fluids. Geochimica et Cosmochimica Acta, 62(19), 3323-3335.
Veroda, V. J. (1958). Morrow Rocks of Western Kansas and Panhandle Counties of
Oklahoma: ABSTRACT. AAPG Bulletin, 42(1), 214-215.
Vervoort, J. D., Lewis, R. S., Fisher, C., Gaschnig, R. M., Jansen, A. C., & Brewer, R.
(2016). Neoarchean and Paleoproterozoic crystalline basement rocks of north-central Idaho:

279
Constraints on the formation of western Laurentia. Geological Society of America Bulletin,
128(1-2), 94-109.
Vogt, M., Kröner, A., Poller, U., Sommer, H., Muhongo, S., & Wingate, M. T. D. (2006).
Archaean and Palaeoproterozoic gneisses reworked during a Neoproterozoic (Pan-African)
high-grade event in the Mozambique belt of East Africa: Structural relationships and zircon
ages from the Kidatu area, central Tanzania. Journal of African Earth Sciences, 45(2), 139-
155.
Walia, V., Yang, T. F., Hong, W. L., Lin, S. J., Fu, C. C., Wen, K. L., & Chen, C. H. (2009).
Geochemical variation of soil–gas composition for fault trace and earthquake precursory
studies along the Hsincheng fault in NW Taiwan. Applied Radiation and Isotopes, 67(10),
1855-1863.
Walker, B. G. (1969). Springs of deep seated origin in Tanzania. In: Proceedings of the
XXIII International Geological Congress, Vol. 19, pp. 171-180.
Walters, R. F. (1958). Differential entrapment of oil and gas in Arbuckle dolomite of central
Kansas. AAPG Bulletin, 42(9), 2133-2173.
Walther, J. V., & Orville, P. M. (1982). Volatile production and transport in regional
metamorphism. Contributions to Mineralogy and Petrology, 79(3), 252-257.
Warr, O. W. P. (2013). Understanding phase behaviour in the geological storage of carbon
dioxide. University of Manchester. (PhD Thesis). pp. 265.
Warr, O., Lollar, B. S., Fellowes, J., Sutcliffe, C. N., McDermott, J. M., Holland, G., Mabry,
J. C., & Ballentine, C. J. (2017). Tracing ancient hydrogeological fracture network age and
compartmentalisation using noble gases. Geochimica et Cosmochimica Acta.
Weeraratne, D. S., Forsyth, D. W., Fischer, K. M., & Nyblade, A. A. (2003). Evidence for
an upper mantle plume beneath the Tanzanian craton from Rayleigh wave tomography.
Journal of Geophysical Research: Solid Earth, 108(B9).
Weinlich, F. H., Bräuer, K., Kämpf, H., Strauch, G., Tesař, J., & Weise, S. M. (1999). An
active subcontinental mantle volatile system in the western Eger rift, Central Europe: Gas
flux, isotopic (He, C, and N) and compositional fingerprints. Geochimica et Cosmochimica
Acta, 63(21), 3653-3671.
Wescott, W. A., Krebs, W. N., Engelhardt, D. W., & Cunningham, S. M. (1991). New
Biostratigraphic Age Dates from the Lake Rukwa Rift Basin in Western Tanzania: Geologic
Note (1). AAPG Bulletin, 75(7), 1255-1263.
Wheeler, W. H., & Karson, J. A. (1994). Extension and subsidence adjacent to a" weak"
continental transform: An example from the Rukwa rift, East Africa. Geology, 22(7), 625-
628.
Whelan, J. K., Solomon, P. R., Deshpande, G. V., & Carangelo, R. M. (1988).
Thermogravimetric Fourier transform infrared spectroscopy (TG-FTIR) of petroleum source
rocks. Initial results. Energy & fuels, 2(1), 65-73.
Whittington II, R. A. (2009). Clay Mineralogy and Illite Crystallinity in the Late Devonian
to Early Mississippian Woodford Shale in the Arbuckle Mountains, Oklahoma, USA.
Georgia State University. (MS Thesis). pp. 139.

280
Williams, L. B., Ferrell, R. E., Hutcheon, I., Bakel, A. J., Walsh, M. M., & Krouse, H. R.
(1995). Nitrogen isotope geochemistry of organic matter and minerals during diagenesis and
hydrocarbon migration. Geochimica et Cosmochimica Acta, 59(4), 765-779.
Winchester, D. E. (1935). Natural Gas in Colorado, Northern New Mexico and Utah, in
Geology of natural gas: Am. Assoc. Petroleum Geologists, pp. 363-384.
Winckler, G., Suess, E., Wallmann, K., de Lange, G. J., Westbrook, G. K., & Bayer, R.
(1997). Excess helium and argon of radiogenic origin in Mediterranean brine basins. Earth
and planetary science letters, 151(3-4), 225-231.
Winckler, G., & Severinghaus, J. P. (2013). Noble Gases in Ice Cores: Indicators of the
Earth’s Climate History. In: The Noble Gases as Geochemical Tracers, pp. 33-53. Springer,
Berlin, Heidelberg.
Wingerter, H. R. (1968). B. Greenwood Gas Field, Kansas, Colorado, and Oklahoma:
Natural Gas in Kansas. In M 9: Natural Gases of North America, Volume Two, AAPG
Special Volumes, pp. 1557-1566.
Wolf, R. A., Farley, K. A., & Silver, L. T. (1996). Helium diffusion and low-temperature
thermochronometry of apatite. Geochimica et Cosmochimica Acta, 60(21), 4231-4240.
Yang, J. H., Wu, F. Y., & Wilde, S. A. (2003). A review of the geodynamic setting of large-
scale Late Mesozoic gold mineralization in the North China Craton: an association with
lithospheric thinning. Ore Geology Reviews, 23(3), 125-152.
Yarger, H. L. (1981). Aeromagnetic survey of Kansas. Eos, Transactions American
Geophysical Union, 62(17), 169-178.
Yatsevich, I., & Honda, M. (1997). Production of nucleogenic neon in the Earth from natural
radioactive decay. Journal of Geophysical Research: Solid Earth, 102(B5), 10291-10298.
Young, R. G. (1983). Petroleum in northeastern Grand County, Utah, in W. R. Averett, ed.,
Northern Paradox Basin – Uncompahgre Uplift: Grand Juction Geological Society Field
Trip, October 1-2, 1983, pp. 1-7.
Young, D. P., Macfarlane, P. A., Whittemore, D. O., & Wilson, B. B. (2005). Hydrogeologic
characteristics and hydrologic changes in the Cimarron River basin, southwestern Kansas.
Kansas Geological Survey Open File Report 2005-26:
http://www.kgs.ku.edu/Hydro/Publications/2005/OFR05_26/index.html (Accessed 4
December 2017).
Zadnik, M. G., & Jeffery, P. M. (1985). Radiogenic neon in an Archaean anorthosite.
Chemical Geology: Isotope Geoscience section, 52(1), 119-125.
Zartman, R. E., Wasserburg, G. J., & Reynolds, J. H. (1961). Helium, argon, and carbon in
some natural gases. Journal of Geophysical Research, 66(1), 277-306.
Zhou, Z. (2004). Development of the noble gas tool to quantify natural gas and groundwater
interaction in the subsurface. ETH Zurich. (PhD Thesis). pp. 167.
Zhou, Z., Ballentine, C. J., Kipfer, R., Schoell, M., & Thibodeaux, S. (2005). Noble gas
tracing of groundwater/coalbed methane interaction in the San Juan Basin, USA.
Geochimica et Cosmochimica Acta, 69(23), 5413-5428.

281
Zhou, Z., Ballentine, C. J., Schoell, M., & Stevens, S. H. (2012). Identifying and quantifying
natural CO2 sequestration processes over geological timescales: the Jackson Dome CO2
Deposit, USA. Geochimica et Cosmochimica Acta, 86, 257-275.
Zhu, Y., Shi, B., & Fang, C. (2000). The isotopic compositions of molecular nitrogen:
implications on their origins in natural gas accumulations. Chemical Geology, 164(3), 321-
330.

282
Appendix A- Further information on the Mid-Continent fields (Chapter 3)
Geology of the Kansas Basin Carboniferous samples
Five oil and/or gas production wells were sampled in Ford County and are
denoted in the main text as the KBC (Kansas Basin Carboniferous) samples.
The producing layers for helium-rich gases are part of the Carboniferous
system and are denoted as the Upper Mississippian (possibly the Chesterian however
this is never made clear) and the Morrow sands (Pennsylvanian) in the KGS database
literature (KGS, 2017) (Figure A1).
The Morrow formation consists of rhythmic alternations of thin crinoidal,
glauconitic limestone, glauconitic sandstone and shale beds. Producing layers
associated with the Morrow sandstones are lenticular and usually around 15ft thick
in Ford County (Veroda, 1958; Rascoe Jr, 1962; Clark, 1987). Reservoir porosities
average 13% and the sands are generally fine-grained and well cemented (Henry and
Hester, 1995).
The Chesterian series of the Upper Mississippian lies unconformably beneath
the Lower Pennsylvanian Morrow and is made up of the Chester shale and Ste.
Genevieve limestone (Kim et al., 2010). The Chesterian series is up to 200ft thick in
the Hugoton Embayment (Clark, 1987).
Gas compositions for strata in the various fields are recorded in Table B1.

283
Figure A1: Stratigraphic section from North America compared to the stratigraphy
classification of the rest of the world. Red circles indicate the helium-rich producing
reservoirs for the KBC samples (modified from Sawin et al., 2009).
Geology of the Kansas Basin Permian samples
Twelve samples were taken from fields in the Hodgeman and Ness counties.
In each case the producing reservoir sampled was the Lower Permian (Chase Group)
similar to the Hugoton-Panhandle giant gas field (Figure A2). The Chase Group
consists of a 200 to 400ft thick series of alternating carbonate, shale and siltstone
units from the Wreford Limestone (oldest) to the Herrington Limestone Member
(youngest) (Lukert, 1949; Jenden et al., 1988b; KGS, 2017). Limestone reservoirs in
the Chase Group which produce helium-rich gas are the Florence (33 to 45ft thick),
Fort Riley (approximately 35ft thick), Towanda (approximately 15ft thick), Winfield
(approximately 95ft thick) and Herrington-Krider (around 20ft thick) (Hemsell,
1939; KGS, 2017) (Table A1).

284
Figure A2: Stratigraphic section from Kansas for the Permian. Red circles indicate the
helium-rich producing reservoirs for the KBP samples.
Central Kansas Uplift sample backgrounds
Two fields located on the Central Kansas Uplift (Bahr and Leesburgh)
produce helium-rich gas from limestone reservoirs in the Lower Permian Chase
group (Winfield and Towanda) and, in the case of the Leesburgh field, from the
Lower Permian Council Grove Group (Cottonwood formation; 42ft thick) and from
the Upper Pennsylvanian Wabaunsee Group (Bern formation; approximately 78ft
thick) (KGS, 2017).
The fields are missing the Mississippian and lower Pennsylvanian layers due
to uplift and erosion of the basement complex during the Carboniferous (Merriam,
1963; Chaudhuri et al., 1986).

285
Field name Field owner Field type Age of producing strata Producing strata
Depth of
producing strata
(m)
Initial
Bottomhole
pressure (Psia)
Gas composition
(CH4/N2/CO2/He/
other gases) (%)
Carson Ritchie
Exploration Inc Oil and
gas
Mississippian/
Pennsylvanian Chesterian/Morrow 1493 2318 nr/19.8/0.1/nr/nr
Maverick Ritchie
Exploration Inc Oil and
gas Pennsylvanian Morrow 1556 2469 42.2/50.8/0/2.5/4.5
#1 Blew
(single
well)
Ritchie
Exploration Inc Oil and
gas Pennsylvanian Morrow 1543 nr 59.1/33.9/0.1/1.2/5.7
Steel Ritchie
Exploration Inc Oil and
gas Mississippian Mississippian 1586 2544
nr/9.5-10.2/0.09-
0.14/nr/nr
Lamb Ritchie
Exploration Inc Gas Mississippian Mississippian 1799 2744 nr/9.2/0.1/nr/nr
Neho Becker Oil
Corp Gas Permian Krider/Winfield 733 1126 59.8/38.4/0.03/1.1/0.7
Barricklow
East
Becker Oil
Corp Gas Permian Winfield/Towanda 738 1258 56.8/41.3/0.05/1.1/0.7
Barrick Becker Oil
Corp Gas Permian Krider/Winfield 747 1147 61.9/36.5/0.03/1.1/0.5
Wieland
North
Becker Oil
Corp Oil and
gas Permian Krider/Winfield 756 1290 64.3/33.8/0/1.1/0.8
Wieland Becker Oil
Corp Oil and
gas Permian Krider/Winfield 806 1238 64.6/33.5/0/1.1/0.8
Hanston-
Oppy
Becker Oil
Corp Oil and
gas Permian Krider/Winfield 830 1279 64.9/33.0/0.05/1.0/1.1
Groner Becker Oil
Corp Gas Permian Krider/Towanda 782 1294 69.9/28.0/0/0.93/1.2
Sawlog
Creek
Southeast
Becker Oil
Corp Oil and
gas Permian Krider/Florence 844 1439 75.8/22.2/0.06/0.90/1.1
Jetport Becker Oil Oil and Permian Winfield 853 1456 70.8/27.4/0/0.93/0.9

286
Corp gas
Stella B Becker Oil
Corp Gas Permian Krider 831 1418 71.2/27.0/0.03/0.91/0.9
Don Becker Oil
Corp Oil and
gas Permian Krider/Fort Riley/Florence 857 1462 66.7/31.6/0/0.95/0.7
Leesburgh Becker Oil
Corp
Oil and
gas Permian/
Pennsylvanian
Winfield/Towanda/
Cottonwood/Bern 920 1413 72.4/23.7/0.08/0.86/3.0
Bahr Becker Oil
Corp
Oil and
gas Permian Winfield 579 319 69.5/23.6/1.43/1.3/4.1
Table A1: Synthesis of data from the Kansas Geological Survey, Digital Petroleum Database regarding the sampled fields. Parts marked with (nr) indicate where
data was either not recorded or unavailable.

287
Appendix B: Combined datasets for all North American
samples
Figure B1: Concentrations and ratios of the radiogenically produced isotopes
in samples. Errors are to 1σ.
Well name/geological
province 4He/
40Ar*
4He/
21Ne*
40Ar*/
21Ne*
Hugoton-Panhandle
(average)
12.46 ±
2.48 2.85 ± (0.62) x 10
7
2.43 ± (0.81) x
106
Kansas Hugoton 13.26 ±
2.46 2.85 ± (0.70) x 10
7
2.19 ± (0.59) x
106
Guymon Hugoton 9.40 ± 0.09 2.93 ± (0.001) x
107
3.12 ± (0.03) x
106
Texas Panhandle 11.73 ±
2.10 2.83 ± (0.61) x 10
7
2.66 ± (1.09) x
106
Kansas Basin
Carboniferous (average)
13.72 ±
1.75 1.21 ± (0.16) x 10
7
8.83 ± (0.53) x
105
Kansas Basin Permian
(average)
59.81 ±
7.63 3.16 ± (0.14) x 10
7
5.38 ± (0.83) x
105
Kautz #1 (CKU) 4.73 ± 0.17 4.59 ± (0.29) x 107
9.70 ± (1.58) x
106
McCune 1-A (CKU) 7.94 ± 0.54 3.05 ± (0.33) x 107
3.84 ± (0.82) x
106
Harley Dome 21.29 ±
0.50 3.66 ± (0.16) x 10
7
1.72 ± (0.78) x
106
Weil 4.45 ± 0.14 3.09 ± (0.40) x 107
6.95 ± (0.92) x
106
International Helium Wood
Mtn 5.56 ± 0.15 2.45 ± (0.16) x 10
7
4.39 ± (0.30) x
106
Average upper crust
(theoretical) (Ballentine
and Burnard, 2002)
6.0 2.33 ± (0.44) x 107
3.88 ± (0.73) x
106
Average upper crust
(observed) (Ballentine and
Burnard, 2002)
5.0±1.0 1.71 ± (0.09) x 107
3.60 ± (1.27) x
106

288
Sample well and
geological province
Location
Lat/Long
Producing
formation 3He/
4He (Ra)
20Ne/
22Ne
21Ne/
22Ne
40Ar/
36Ar
38Ar/
36Ar
Central Kansas Uplift
Kautz #1 38°27'4.92"N,
98°57'17.45"W
Chase Group 0.11 (0.008) 9.32 (0.029) 0.053 (0.0006) 1410 (3) 0.189 (0.0005)
0.12 (0.003) 9.30 (0.029) 0.053 (0.0006) 1409 (3) 0.189 (0.0005)
McCune 1-A 37°53'27.09"N,
98°41'59.37"W
Chase Group 0.08 (0.002) 9.49 (0.033) 0.045 (0.0005) 592 (1) 0.187 (0.0005)
Kansas Basin
Carboniferous
Bonnie Carson #1 37°41'47.10"N,
99°51'36.38"W
Morrow Sands 0.09 (0.003) 9.18 (0.028) 0.058 (0.0006) 1718 (3) 0.183 (0.0006)
Maverick #1 37°41'16.43"N,
99°50'58.85"W
Morrow Sands 0.10 (0.001) 8.95 (0.028) 0.063 (0.0007) 2142 (5) 0.187 (0.0008)
#1 Blew 37°37'35.27"N,
99°48'38.53"W
Morrow Sands 0.09 (0.002) 9.13 (0.028) 0.055 (0.0006) 1642 (3) 0.185 (0.0006)
#1 O Slash-Hill Trust 37°38'31.47"N,
99°47'46.52"W
Mississippian 0.10 (0.001) 9.16 (0.028) 0.056 (0.0006) 1494 (4) 0.184 (0.0009)
Lamb Lance #1 37°37'44.59"N,
99°44'52.86"W
Mississippian 0.09 (0.003) 9.14 (0.028) 0.060 (0.0006) 1635 (4) 0.185 (0.0008)
Kansas Basin Permian
Barricklow Unit #1 38°15'13.98"N,
99°38'17.73"W
Chase Group 0.10 (0.001) 9.74 (0.030) 0.042 (0.0004) 588 (1) 0.189 (0.0005)
Shank no. 1 38°15'45.71"N,
99°41'48.81"W
Chase Group 0.09 (0.001) 9.71 (0.030) 0.040 (0.0004) 584 (1) 0.189 (0.0005)
McFadden no. 1 38°16'52.86"N,
99°42'56.11"W
Chase Group 0.13 (0.002) 9.74 (0.030) 0.041 (0.0004) 604 (1) 0.189 (0.0005)
Selfridge no. 1-A 38°14'7.62"N,
99°45'21.74"W
Chase Group 0.13 (0.002) 9.75 (0.030) 0.042 (0.0004) 583 (1) 0.189 (0.0005)

289
Wieland no. 1-A 38°13'19.77"N,
99°44'39.21"W
Chase Group 0.11 (0.001) 9.74 (0.030) 0.042 (0.0004) 591 (2) 0.190 (0.001)
Oppy-Burke no. 1 38° 7'26.40"N,
99°46'37.57"W
Chase Group 0.07 (0.001) 9.73 (0.030) 0.044 (0.0005) 554 (2) 0.189 (0.001)
Lewis Trust #1 38° 5'2.84"N, 99°34'14.74"W Chase Group 0.10 (0.002) 9.68 (0.030) 0.043 (0.0005) 555 (1) 0.186 (0.0007)
Strecker no. 1 37°59'4.10"N,
99°38'13.99"W
Chase Group 0.06 (0.002) 9.57 (0.030) 0.044 (0.0005) 555 (3) 0.195 (0.004)
0.06 (0.003) 9.56 (0.032) 0.045 (0.0005)
Gleason #1 37°59'14.11"N,
99°36'31.71"W
Chase Group 0.06 (0.001) 9.72 (0.030) 0.044 (0.0005) 537 (1) 0.189 (0.0006)
Jetmore-Bradford no. 1 37°58'15.58"N,
99°53'37.79"W
Chase Group 0.06 (0.002) 9.62 (0.030) 0.044 (0.0005) 525 (1) 0.187 (0.0007)
Benish no. 1 37°58'59.37"N,
99°57'47.65"W
Chase Group 0.06 (0.001) 9.75 (0.030) 0.044 (0.0005) 547 (2) 0.191 (0.001)
Poverty Hill no. 1 38°1'30.37"N,
99°55'13.08"W
Chase Group 0.08 (0.001) 9.81 (0.031) 0.043 (0.0004) 569 (1) 0.191 (0.0006)
*Kansas Hugoton
Ratzlaff D ‘A’ #1 38°2'12.2"N, 101°16'43.7"W Chase Group 0.16 (0.005) 9.70 (0.050) 0.039 (0.0004) 818 (10) nr
Hefner Gas Unit #1 37°56'5.8"N, 101°23'18.9"W Chase Group 0.16 (0.005) 9.74 (0.053) 0.039 (0.0005) 851 (11) nr
Guldner Unit #1 37°43'43.0"N,
101°39'46.9"W
Chase Group 0.14 (0.004) 9.73 (0.041) 0.040 (0.0005) 835 (16) nr
Guldner Unit #2 37°43'43.0"N,
101°39'46.9"W
Panoma 0.15 (0.004) 9.66 (0.025) 0.044 (0.0009) 889 (5) nr
Campbell, R.W. #2 37°35'0.8"N, 101°37'35.7"W Chase Group nr
Keller, Ernest #2 37°29'47.5"N,
101°16'49.3"W
Chase Group 0.20 (0.006) 9.66 (0.059) 0.041 (0.0005) 1066 (11) nr
Jarvis Unit #2 37°29'47.5"N,
101°17'54.9"W
Panoma 0.20 (0.006) 9.68 (0.061) 0.041 (0.0006) 1038 (20) nr
Ball, Clyde H. #2 37°28'3.1"N, 101°27'45.3"W Panoma 9.61 (0.027) 0.051 (0.0011) 974 (47) nr
Wright “C” Unit #1 37°24'34.2"N, 101°31'2.1"W Chase Group 0.18 (0.005) 9.69 (0.018) 0.039 (0.0008) 948 (6) nr
Baughman H-2 37°14'2.7"N, 100°50'22.7"W Chase Group 9.69 (0.018) 0.040 (0.0008) 977 (10) nr
Crayton A-1 37°15'47.6"N, 101°36'3.5"W Chase Group 0.19 (0.006) 9.70 (0.039) 0.040 (0.0006) 969 (25) nr

290
Mills C-1 37°6'10.6"N, 101°9'57.4"W Chase Group 0.21 (0.006) 9.71 (0.030) 0.045 (0.0009) 1155 (29) nr
Parsley A-1 37°2'40.7"N, 101°6'41.6"W Chase Group 0.21 (0.006) 9.80 (0.034) 0.040 (0.0005) 925 (12) nr
Oberly A-1 37°13'10.2"N, 102°1'4.4"W Greenwood 0.19 (0.006) 9.73 (0.035) 0.039 (0.0005) 830 (13) nr
Tucker B-1 37°4'25.7"N, 101°44'45.6"W Chase Group 0.19 (0.006) 9.80 (0.043) 0.041 (0.0007) 967 (18) nr
Barnes A-1 37°0'3.4"N, 101°49'6.6"W
Greenwood 9.68 (0.015) 0.041 (0.0008) 913 (18) nr
*Guymon Hugoton nr
Hill A-1 36°52'15.9"N,
101°42'44.0"W
Chase Group nr
Buzzard D-1 36°47'56.8"N, 101°44'7.9"W Chase Group 0.19 (0.006) 9.81 (0.038) 0.039 (0.0006) 938 (26) nr
Stonebraker A-69 36°38'21.0"N,
101°45'12.5"W
Chase Group
0.21 (0.006) 9.91 (0.023) 0.038 (0.0003) 1113 (7) nr
*Texas Panhandle nr
Coffee Estate #1 36°3.365'N, 101°43.052'W Brown Dolomite 0.24 (0.007) 9.63 (0.025) 0.042 (0.0009) 1156 (7) nr
Blake Trust Estate #2 36° 4.230'N, 101° 40.905'W Brown Dolomite 0.25 (0.007) 9.77 (0.029) 0.040 (0.0004) 1105 (25) nr
Mary A Long #1 36° 18.131'N, 101° 45.307'W Brown Dolomite 0.20 (0.006) 9.67 (0.039) 0.040 (0.0005) 1039 (17) nr
Donelson et al #1 36° 20.790'N, 101° 59.721'W Brown Dolomite 0.21 (0.006) 9.83 (0.027) 0.037 (0.0003) 1076 (7) nr
Sarah Claybaugh #1 36° 22.496'N, 101° 59.681'W Brown Dolomite 0.18 (0.005) 9.80 (0.046) 0.037 (0.0004) 865 (33) nr
Cameron Walls #1 36° 16.436'N, 101° 58.614'W Brown Dolomite 9.66 (0.040) 0.040 (0.0005) 1112 (15) nr
Horner #1 36° 4.847'N, 102° 6.201'W Brown Dolomite 9.65 (0.025) 0.043 (0.0009) 1058 (14) nr
Whitherbee #2 36° 6.224'N, 101° 49.193'W Brown Dolomite 0.21 (0.006) 9.69 (0.036) 0.040 (0.0005) 983 (11) nr
Flores 23 36° 2.738'N, 101° 48.120'W Brown Dolomite 9.59 (0.025) 0.040 (0.0008) 1118 (12) nr
Nisbett #1 36° 0.146'N, 101° 52.410'W Brown Dolomite 0.19 (0.006) 9.62 (0.032) 0.041 (0.0005) 1045 (9) nr
McDade #2 + #5 35° 54.124'N, 102° 2.606'W Brown Dolomite 0.18 (0.005) nr
Brumley A #1 35° 57.554'N, 101° 55.098'W Brown Dolomite
nr
Colorado Plateau
Harley Dome #1 39°11'13.32"N, 109°
8'52.95"W
Entrada Sandstone 0.10 (0.001) 9.00 (0.029) 0.083 (0.0009) 4452 (10) 0.190 (0.002)
Harley Dome #1 0.11 (0.001) 9.03 (0.029) 0.083 (0.0009) 4448 (10)
Great Falls Tectonic Zone
Weil #1 48°40'24.75"N, Red River 0.74 (0.01) 10.21 (0.037) 0.067 (0.0007) 8839 (50) 0.185 (0.003)

291
110°33'44.44"W
Weil #1
International Helium Wood
Mountain
49°22'21.15"N, 107°
0'45.76"W
Deadwood
Formation
0.73 (0.01) 10.21 (0.034) 0.067 (0.0007)
0.18 (0.004) 9.78 (0.036) 0.071 (0.0008) 7118 (33) 0.188 (0.004)
Figure B2: Noble gas ratios from the Mid-Continent study (Chapter 3), the N2-rich 4He gas wells study (Chapter 4) and from Ballentine and Sherwood-Lollar,
2002 for the Hugoton-Panhandle (starred sections). 1σ errors for samples are shown in brackets. Nr in the table denotes the 38
Ar/36
Ar values were not recorded.
Sample well and
geological province
4He concentration
(x 10-2
) (cm3 STP)
20Ne concentration
(x 10-7
) (cm3 STP)
40Ar concentration
(x 10-4
) (cm3 STP)
84Kr
concentration
(x 10-8
) (cm3
STP)
130Xe
concentration
(x 10-10
) (cm3
STP)
N2 concentration
(±5%) (cm3 STP)
δ15
N(N2)
(±0.2‰)
Central Kansas
Uplift
Kautz #1 2.12 (0.025) 1.78 (0.011) 56.6 (0.57) 1.21 (0.02) 0.31 (0.01) 0.373 2.45 (0.07)
2.13 (0.025) 1.77 (0.011) 57.0 (0.57)
McCune 1-A 0.86 (0.011)
1.71 (0.017) 2.16 (0.22) 1.25 (0.02) 0.99 (0.01) 0.237 3.45 (0.07)
Kansas Basin
Carboniferous
Bonnie Carson #1 1.22 (0.013) 2.75 (0.030) 9.67 (0.083) 1.49 (0.05) 3.10 (0.05) 0.198 3.80 (0.14)

292
Maverick #1 2.47 (0.025) 4.78 (0.051) 19.6 (0.16) 2.43 (0.07) 12.84 (0.12) 0.508 6.50 (0.42)
#1 Blew 1.31 (0.013) 4.31 (0.046) 14.0 (0.12) 2.32 (0.07) 4.42 (0.07) 0.339 1.85 (0.21)
#1 O Slash-Hill Trust 0.48 (0.007) 1.56 (0.017) 4.88 (0.042) 0.63 (0.19) 1.91 (0.03) 0.102
Lamb Lance #1 0.58 (0.006) 1.43 (0.015) 4.72 (0.041) 0.32 (0.10) 1.52 (0.01) 0.092 2.90 (0.07)
Kansas Basin
Permian
Barricklow Unit #1 1.22 (0.020) 2.93 (0.044) 4.66 (0.071) 1.84 (0.04) 1.27 (0.02) 0.369 4.03 (0.90)
Shank no. 1 1.15 (0.019) 3.04 (0.046) 3.49 (0.053) 1.86 (0.04) 1.28 (0.02) 0.387 4.70 (0.28)
McFadden no. 1 1.16 (0.019) 3.07 (0.047) 5.01 (0.076) 1.92 (0.04) 1.27 (0.02) 0.416 1.45 (0.07)
Selfridge no. 1-A 1.08 (0.018) 2.56 (0.039) 4.17 (0.063) 1.65 (0.03) 1.21 (0.02) 0.338 2.20 (0.35)
Wieland no. 1-A 1.15 (0.019) 2.63 (0.040) 4.00 (0.061) 1.70 (0.03) 1.19 (0.02) 0.341 3.10 (0.14)
Oppy-Burke no. 1 0.96 (0.016) 2.03 (0.031) 3.03 (0.046) 1.45 (0.03) 1.15 (0.02) 0.330 4.00 (0.14)
Lewis Trust #1 1.00 (0.010) 2.03 (0.028) 3.82 (0.034) 1.29 (0.01) 0.96 (0.02) 0.280
Strecker no. 1 0.87 (0.014) 1.82 (0.028) 2.75 (0.042) 1.35 (0.03) 1.08 (0.02) 0.220 3.45 (0.21)
0.87 (0.012) 1.77 (0.030)
Gleason #1 0.86 (0.014) 1.80 (0.027) 2.87 (0.044) 1.40 (0.03) 1.17 (0.02) 0.264 3.70 (0.14)
Jetmore-Bradford no. 1 1.05 (0.011) 2.13 (0.028) 4.03 (0.035) 1.39 (0.01) 1.52 (0.03) 0.280 2.45 (0.21)

293
Benish no. 1 0.95 (0.016) 2.02 (0.031) 3.03 (0.046) 1.46 (0.03) 1.15 (0.02) 0.275 2.99 (0.01)
Poverty Hill no. 1 0.89 (0.015) 1.83 (0.028) 3.30 (0.050) 1.53 (0.03) 1.18 (0.02) 0.311 4.00 (0.14)
*Kansas Hugoton
Ratzlaff D ‘A’ #1 0.48 (0.024) 5.53 (0.28) nm nm 0.189 8.7
Hefner Gas Unit #1 0.40 (0.020) 1.08 (0.075) 5.12 (0.26) nm nm 0.181 7.8
Guldner Unit #1 0.50 (0.025) 1.56 (0.11) 5.75 (0.29) nm nm 0.207 9.4
Guldner Unit #2 0.43 (0.004) 1.41 (0.012) 5.10 (0.050) nm nm 0.203 9.0
Campbell, R.W. #2 0.40 (0.020) 4.42 (0.22) nm nm 0.154 8.0
Keller, Ernest #2 0.38 (0.019) 0.86 (0.060) 4.68 (0.23) nm nm 0.145 6.4
Jarvis Unit #2 0.39 (0.020) 1.07 (0.075) 4.27 (0.21) nm nm 0.148 6.5
Ball, Clyde H. #2 0.35 (0.004) 1.11 (0.011) 4.58 (0.26) nm nm 0.151
Wright “C” Unit #1 0.37 (0.004) 1.19 (0.012) 4.44 (0.050) nm nm 0.156 7.8
Baughman H-2 0.58 (0.006) 1.80 (0.018) 5.92 (0.090) nm nm 0.178 6.5
Crayton A-1 0.43 (0.021) 1.19 (0.083) 4.62 (0.23) nm nm 0.166 7.5
Mills C-1 0.38 (0.004) 1.03 (0.010) 4.46 (0.16) nm nm 0.127 5.3
Parsley A-1 0.57 (0.028) 1.23 (0.086) 4.19 (0.21) nm nm 0.152 6.7
Oberly A-1 0.49 (0.025) 1.61 (0.013) 4.46 (0.22) nm nm 0.208 7.1

294
Tucker B-1 0.39 (0.020) 0.99 (0.079) 5.38 (0.27) nm nm 0.147 7.1
Barnes A-1 0.41 (0.004) 1.57 (0.016) 4.21 (0.16) nm nm 0.203 8.5
*Guymon Hugoton
Hill A-1 0.40 (0.020) 5.23 (0.26) nm nm 0.146 5.7
Buzzard D-1 0.45 (0.023) 1.58 (0.11) 7.10 (0.36) nm nm 0.184 6.9
Stonebraker A-69 0.65 (0.032) 2.35 (0.16) 9.30 (0.47) nm nm 0.214 6.1
*Texas Panhandle
Coffee Estate #1 0.63 (0.006) 1.93 (0.019) 7.21 (0.080) nm nm 0.136 4.5
Blake Trust Estate #2 1.05 (0.052) 2.92 (0.21) 10.73 (0.54) nm nm 0.214 5.3
Mary A Long #1 0.76 (0.038) 1.98 (0.14) 7.66 (0.38) nm nm 0.165 4.9
Donelson et al #1 0.98 (0.049) 5.03 (0.35) nm nm 0.258 4.9
Sarah Claybaugh #1 0.92 (0.046) 4.96 (0.35) nm nm 0.253 4.4
Cameron Walls #1 0.66 (0.033) 1.75 (0.12) 7.97 (0.49) nm nm 0.180 5.3
Horner #1 0.92 (0.009) 3.69 (0.031) 10.99 (0.24) nm nm 0.220 5.0
Whitherbee #2 0.35 (0.018) 0.82 (0.057) 7.10 (0.35) nm nm 0.080 3.6
Flores 23 0.61 (0.006) 1.75 (0.018) 6.97 (0.12) nm nm 0.135 4.0

295
Nisbett #1 0.55 (0.027) 1.52 (0.11) 5.86 (0.29) nm nm 0.141 3.4
McDade #2 + #5 0.29 (0.015) 2.73 (0.14) nm nm 0.066 2.7
Brumley A #1 0.33 (0.017) nm nm
0.089
2.7
Colorado Plateau
Harley Dome #1 7.18 (0.10) 3.27 (0.031) 36.11 (0.34) 2.90 (0.09) 2.81 (0.03) 0.844 1.00 (0.06)
Harley Dome #1 7.03 (0.10) 3.24 (0.031) 35.83 (0.33)
Great Falls Tectonic
Zone
Weil #1 0.98 (0.01) 1.01 (0.010) 22.75 (0.23) 0.66 (0.02) 0.56 (0.01) 0.955 2.40 (0.20)
Weil #1 1.00 (0.01) 1.02 (0.010)
International Helium
Wood Mountain 1.06 (0.02) 0.84 (0.086) 19.92 (0.20) 0.70 (0.03) 0.79 (0.01) 0.960 1.40 (0.46)
Table B3: Noble gas concentrations from the Mid-Continent study (Chapter 3), the N2-rich 4He gas wells study (Chapter 4) and the Ballentine and Sherwood-
Lollar, (2002) study on the Hugoton-Panhandle (starred sections). Nitrogen concentrations for CKU, KBP and KBC samples are taken from the KGS database
and are deemed to be within acceptable limits due to 4He concentrations from the study being within 1σ error of previously recorded helium concentrations from
wells. Nitrogen concentrations for the N2-rich 4He wells are taken from well tests conducted by IACX and Weil Helium and are deemed to be within acceptable
limits due to 4He concentrations from the study being within 1σ error of previously recorded helium concentrations from wells. 1σ errors for samples appear in
column headers as % or in brackets if variable.