Embed Size (px)
Citation preview
Full wwPDB X-ray Structure Validation Report i○
Mar 13, 2018 – 05:52 pm GMT
PDB ID : 5XRITitle : Galectin-10/Charcot-Leyden crystal protein-C29A crystal structure
Authors : Su, J.Deposited on : 2017-06-08
Resolution : 1.68 Å(reported)
This is a Full wwPDB X-ray Structure Validation Report for a publicly released PDB entry.
We welcome your comments at [email protected] user guide is available at
https://www.wwpdb.org/validation/2017/XrayValidationReportHelpwith specific help available everywhere you see the i○ symbol.
The following versions of software and data (see references i○) were used in the production of this report:
MolProbity : 4.02b-467Mogul : 1.7.3 (157068), CSD as539be (2018)
Xtriage (Phenix) : 1.13EDS : trunk31020
Percentile statistics : 20171227.v01 (using entries in the PDB archive December 27th 2017)Refmac : 5.8.0158CCP4 : 7.0 (Gargrove)
Ideal geometry (proteins) : Engh & Huber (2001)Ideal geometry (DNA, RNA) : Parkinson et al. (1996)
Validation Pipeline (wwPDB-VP) : trunk31020
Page 2 Full wwPDB X-ray Structure Validation Report 5XRI
1 Overall quality at a glance i○
The following experimental techniques were used to determine the structure:X-RAY DIFFRACTION
The reported resolution of this entry is 1.68 Å.
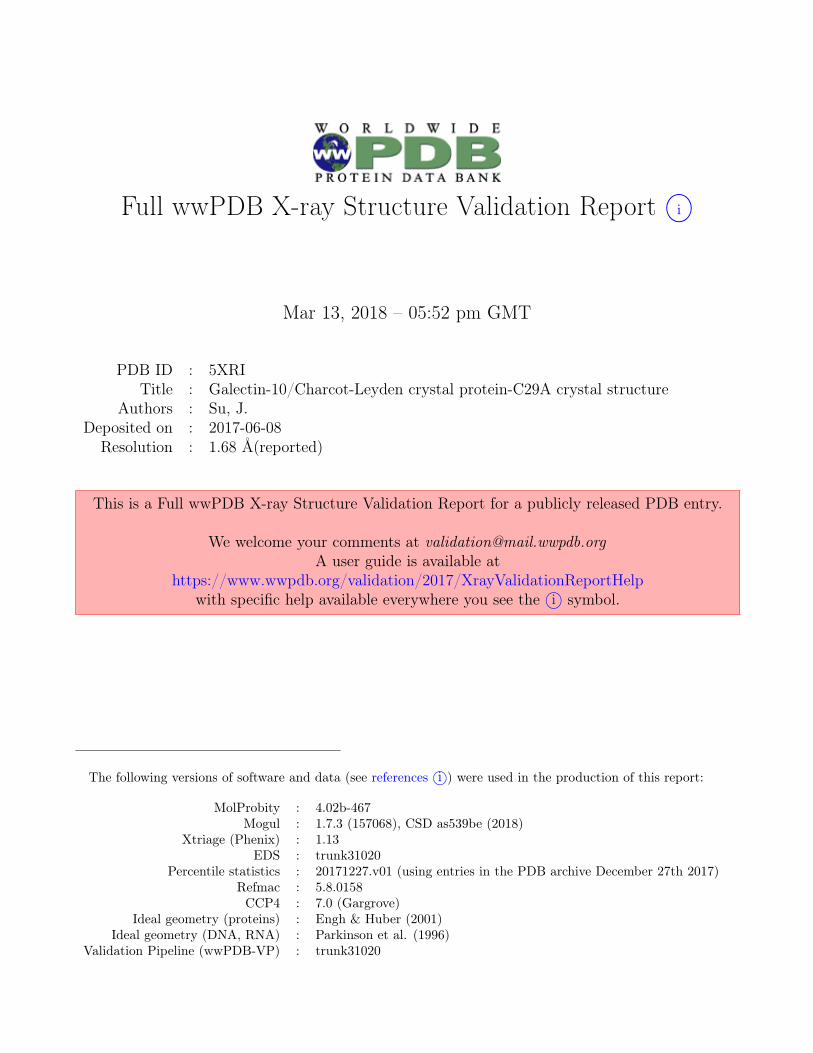
Percentile scores (ranging between 0-100) for global validation metrics of the entry are shown inthe following graphic. The table shows the number of entries on which the scores are based.
Metric Whole archive(#Entries)
Similar resolution(#Entries, resolution range(Å))
Rfree 111664 5816 (1.70-1.66)Clashscore 122126 6305 (1.70-1.66)
Ramachandran outliers 120053 6198 (1.70-1.66)Sidechain outliers 120020 6197 (1.70-1.66)RSRZ outliers 108989 5700 (1.70-1.66)
The table below summarises the geometric issues observed across the polymeric chains and their fitto the electron density. The red, orange, yellow and green segments on the lower bar indicate thefraction of residues that contain outliers for >=3, 2, 1 and 0 types of geometric quality criteria. Agrey segment represents the fraction of residues that are not modelled. The numeric value for eachfraction is indicated below the corresponding segment, with a dot representing fractions <=5%The upper red bar (where present) indicates the fraction of residues that have poor fit to theelectron density. The numeric value is given above the bar.
Mol Chain Length Quality of chain
1 A 145
Page 3 Full wwPDB X-ray Structure Validation Report 5XRI
2 Entry composition i○
There are 3 unique types of molecules in this entry. The entry contains 1252 atoms, of which 0are hydrogens and 0 are deuteriums.
In the tables below, the ZeroOcc column contains the number of atoms modelled with zero occu-pancy, the AltConf column contains the number of residues with at least one atom in alternateconformation and the Trace column contains the number of residues modelled with at most 2atoms.
• Molecule 1 is a protein called Galectin-10.
Mol Chain Residues Atoms ZeroOcc AltConf Trace
1 A 138 Total C N O S1083 698 179 200 6 0 2 0
There are 4 discrepancies between the modelled and reference sequences:
Chain Residue Modelled Actual Comment ReferenceA -2 GLY - expression tag UNP Q05315A -1 SER - expression tag UNP Q05315A 0 HIS - expression tag UNP Q05315A 29 ALA CYS engineered mutation UNP Q05315
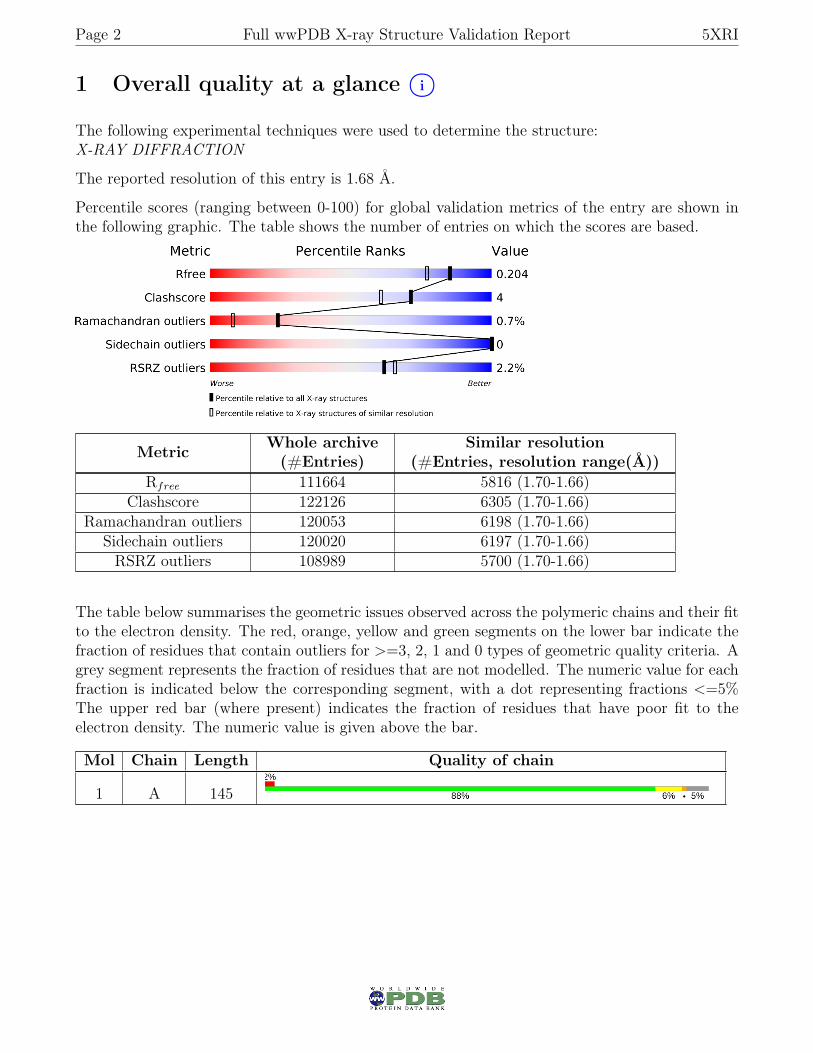
• Molecule 2 is GLYCEROL (three-letter code: GOL) (formula: C3H8O3).
Mol Chain Residues Atoms ZeroOcc AltConf
2 A 1 Total C O6 3 3 0 0
Page 4 Full wwPDB X-ray Structure Validation Report 5XRI
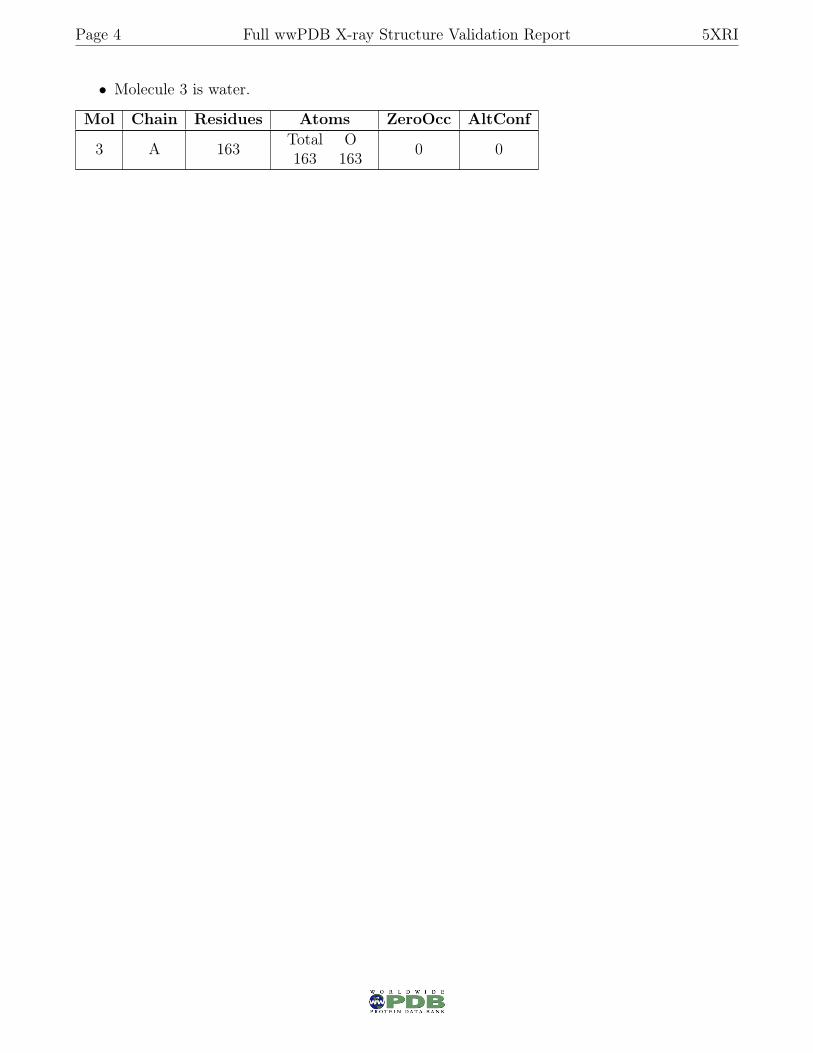
• Molecule 3 is water.
Mol Chain Residues Atoms ZeroOcc AltConf
3 A 163 Total O163 163 0 0

Page 5 Full wwPDB X-ray Structure Validation Report 5XRI
3 Residue-property plots i○
These plots are drawn for all protein, RNA and DNA chains in the entry. The first graphic fora chain summarises the proportions of the various outlier classes displayed in the second graphic.The second graphic shows the sequence view annotated by issues in geometryand electron density.Residues are color-coded according to the number of geometric quality criteria for which theycontain at least one outlier: green = 0, yellow = 1, orange = 2 and red = 3 or more. A red dotabove a residue indicates a poor fit to the electron density (RSRZ > 2). Stretches of 2 or moreconsecutive residues without any outlier are shown as a green connector. Residues present in thesample, but not in the model, are shown in grey.
• Molecule 1: Galectin-10
Chain A:
GLY
SER
HIS
MET
S2•
L3•
I22
L36
K73
Q74
Q75
R128
D129
I130
S131
L132
T133
Y139•
LEU
LYS
ARG
Page 6 Full wwPDB X-ray Structure Validation Report 5XRI
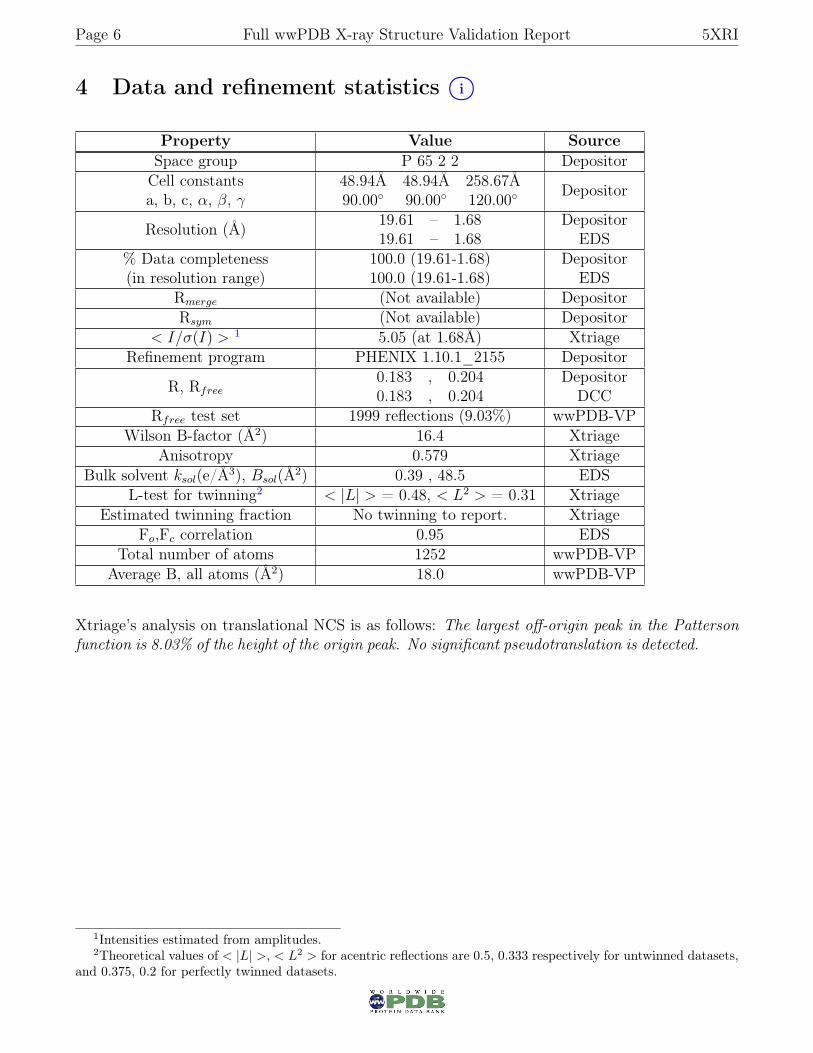
4 Data and refinement statistics i○
Property Value SourceSpace group P 65 2 2 DepositorCell constantsa, b, c, α, β, γ
48.94Å 48.94Å 258.67Å90.00◦ 90.00◦ 120.00◦ Depositor
Resolution (Å) 19.61 – 1.6819.61 – 1.68
DepositorEDS
% Data completeness(in resolution range)
100.0 (19.61-1.68)100.0 (19.61-1.68)
DepositorEDS
Rmerge (Not available) DepositorRsym (Not available) Depositor
< I/σ(I) > 1 5.05 (at 1.68Å) XtriageRefinement program PHENIX 1.10.1_2155 Depositor
R, Rfree0.183 , 0.2040.183 , 0.204
DepositorDCC
Rfree test set 1999 reflections (9.03%) wwPDB-VPWilson B-factor (Å2) 16.4 Xtriage
Anisotropy 0.579 XtriageBulk solvent ksol(e/Å3), Bsol(Å2) 0.39 , 48.5 EDS
L-test for twinning2 < |L| > = 0.48, < L2 > = 0.31 XtriageEstimated twinning fraction No twinning to report. Xtriage
Fo,Fc correlation 0.95 EDSTotal number of atoms 1252 wwPDB-VP
Average B, all atoms (Å2) 18.0 wwPDB-VP
Xtriage’s analysis on translational NCS is as follows: The largest off-origin peak in the Pattersonfunction is 8.03% of the height of the origin peak. No significant pseudotranslation is detected.
1Intensities estimated from amplitudes.2Theoretical values of < |L| >, < L2 > for acentric reflections are 0.5, 0.333 respectively for untwinned datasets,
and 0.375, 0.2 for perfectly twinned datasets.
Page 7 Full wwPDB X-ray Structure Validation Report 5XRI
5 Model quality i○
5.1 Standard geometry i○
Bond lengths and bond angles in the following residue types are not validated in this section:GOL
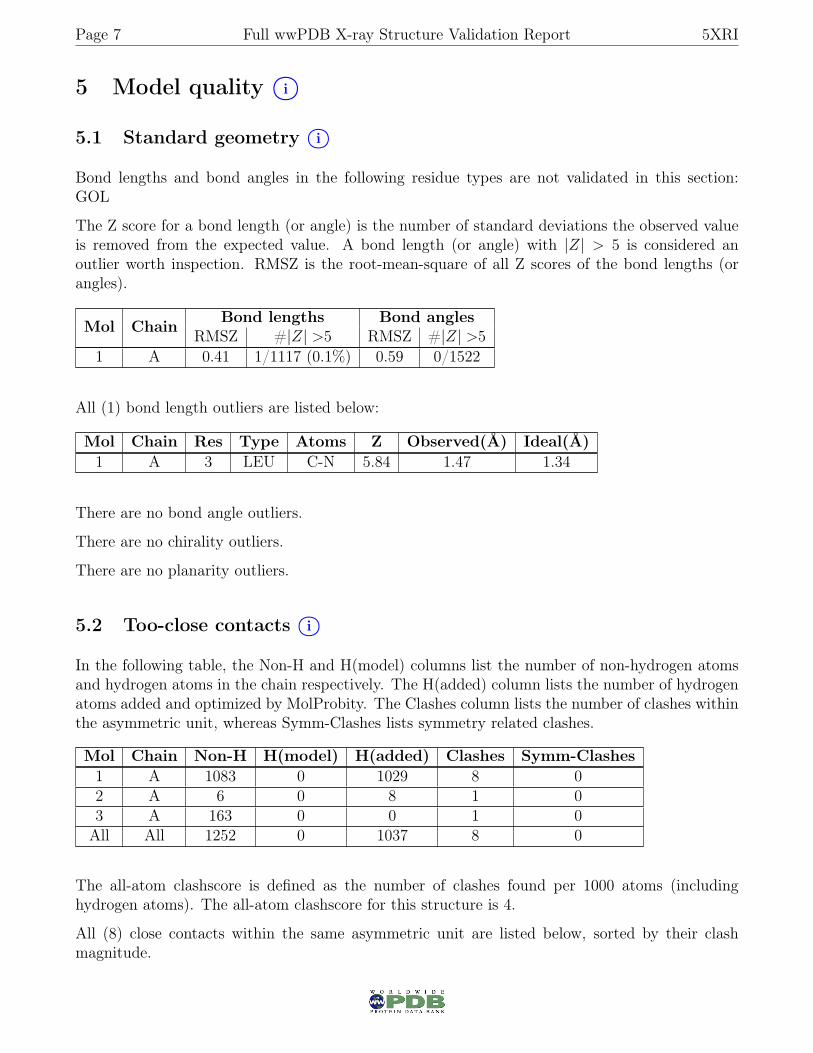
The Z score for a bond length (or angle) is the number of standard deviations the observed valueis removed from the expected value. A bond length (or angle) with |Z| > 5 is considered anoutlier worth inspection. RMSZ is the root-mean-square of all Z scores of the bond lengths (orangles).
Mol Chain Bond lengths Bond anglesRMSZ #|Z| >5 RMSZ #|Z| >5
1 A 0.41 1/1117 (0.1%) 0.59 0/1522
All (1) bond length outliers are listed below:
Mol Chain Res Type Atoms Z Observed(Å) Ideal(Å)1 A 3 LEU C-N 5.84 1.47 1.34
There are no bond angle outliers.
There are no chirality outliers.
There are no planarity outliers.
5.2 Too-close contacts i○
In the following table, the Non-H and H(model) columns list the number of non-hydrogen atomsand hydrogen atoms in the chain respectively. The H(added) column lists the number of hydrogenatoms added and optimized by MolProbity. The Clashes column lists the number of clashes withinthe asymmetric unit, whereas Symm-Clashes lists symmetry related clashes.
Mol Chain Non-H H(model) H(added) Clashes Symm-Clashes1 A 1083 0 1029 8 02 A 6 0 8 1 03 A 163 0 0 1 0All All 1252 0 1037 8 0
The all-atom clashscore is defined as the number of clashes found per 1000 atoms (includinghydrogen atoms). The all-atom clashscore for this structure is 4.
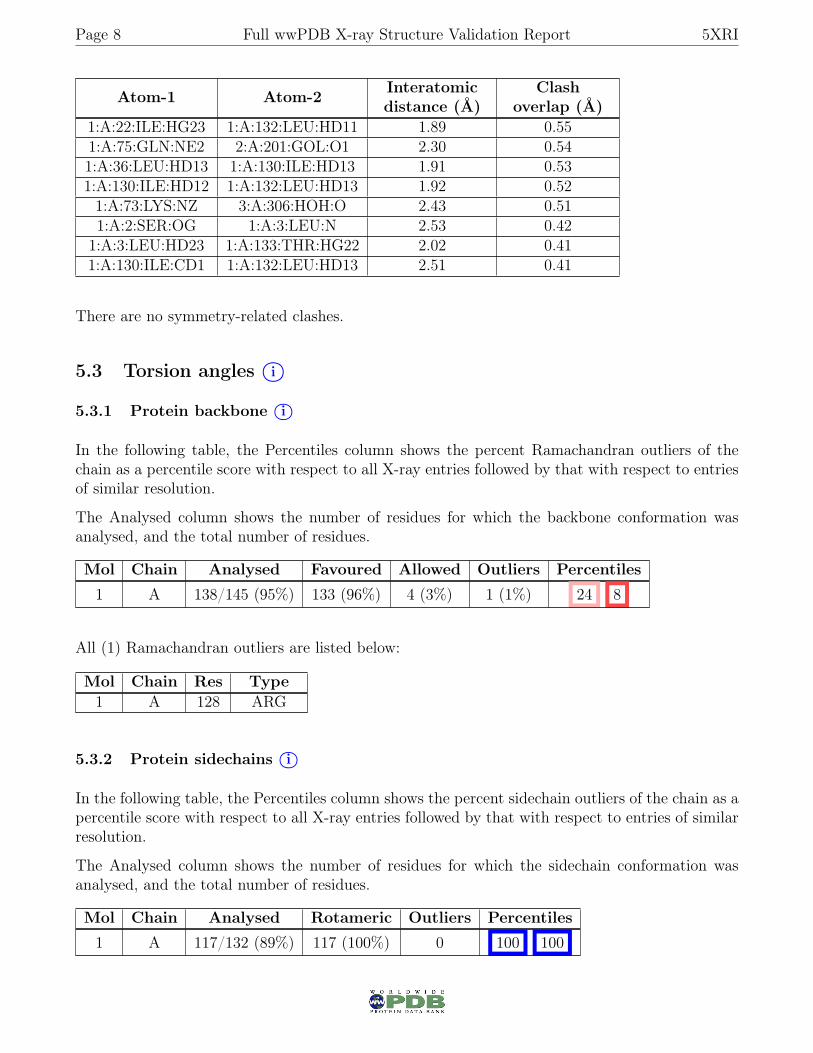
All (8) close contacts within the same asymmetric unit are listed below, sorted by their clashmagnitude.
Page 8 Full wwPDB X-ray Structure Validation Report 5XRI
Atom-1 Atom-2 Interatomicdistance (Å)
Clashoverlap (Å)
1:A:22:ILE:HG23 1:A:132:LEU:HD11 1.89 0.551:A:75:GLN:NE2 2:A:201:GOL:O1 2.30 0.541:A:36:LEU:HD13 1:A:130:ILE:HD13 1.91 0.531:A:130:ILE:HD12 1:A:132:LEU:HD13 1.92 0.521:A:73:LYS:NZ 3:A:306:HOH:O 2.43 0.511:A:2:SER:OG 1:A:3:LEU:N 2.53 0.42
1:A:3:LEU:HD23 1:A:133:THR:HG22 2.02 0.411:A:130:ILE:CD1 1:A:132:LEU:HD13 2.51 0.41
There are no symmetry-related clashes.
5.3 Torsion angles i○
5.3.1 Protein backbone i○
In the following table, the Percentiles column shows the percent Ramachandran outliers of thechain as a percentile score with respect to all X-ray entries followed by that with respect to entriesof similar resolution.
The Analysed column shows the number of residues for which the backbone conformation wasanalysed, and the total number of residues.
Mol Chain Analysed Favoured Allowed Outliers Percentiles
1 A 138/145 (95%) 133 (96%) 4 (3%) 1 (1%) 24 8
All (1) Ramachandran outliers are listed below:
Mol Chain Res Type1 A 128 ARG
5.3.2 Protein sidechains i○
In the following table, the Percentiles column shows the percent sidechain outliers of the chain as apercentile score with respect to all X-ray entries followed by that with respect to entries of similarresolution.
The Analysed column shows the number of residues for which the sidechain conformation wasanalysed, and the total number of residues.
Mol Chain Analysed Rotameric Outliers Percentiles
1 A 117/132 (89%) 117 (100%) 0 100 100
Page 9 Full wwPDB X-ray Structure Validation Report 5XRI
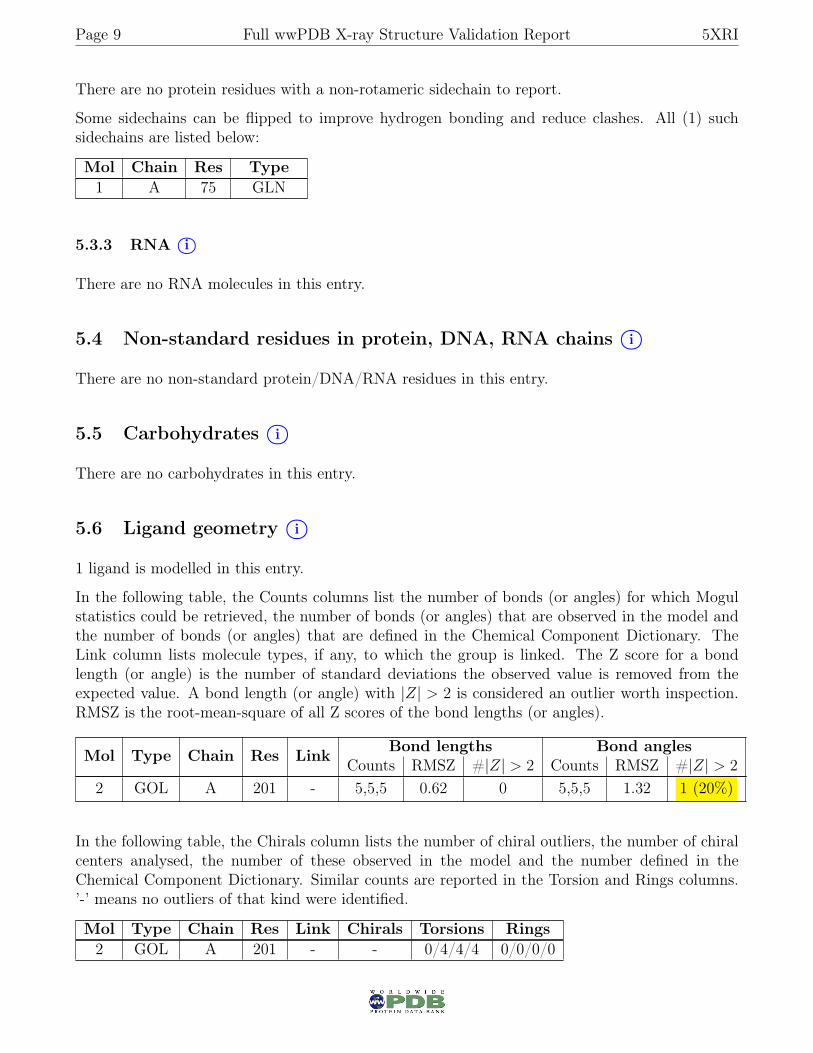
There are no protein residues with a non-rotameric sidechain to report.
Some sidechains can be flipped to improve hydrogen bonding and reduce clashes. All (1) suchsidechains are listed below:
Mol Chain Res Type1 A 75 GLN
5.3.3 RNA i○
There are no RNA molecules in this entry.
5.4 Non-standard residues in protein, DNA, RNA chains i○
There are no non-standard protein/DNA/RNA residues in this entry.
5.5 Carbohydrates i○
There are no carbohydrates in this entry.
5.6 Ligand geometry i○
1 ligand is modelled in this entry.
In the following table, the Counts columns list the number of bonds (or angles) for which Mogulstatistics could be retrieved, the number of bonds (or angles) that are observed in the model andthe number of bonds (or angles) that are defined in the Chemical Component Dictionary. TheLink column lists molecule types, if any, to which the group is linked. The Z score for a bondlength (or angle) is the number of standard deviations the observed value is removed from theexpected value. A bond length (or angle) with |Z| > 2 is considered an outlier worth inspection.RMSZ is the root-mean-square of all Z scores of the bond lengths (or angles).
Mol Type Chain Res Link Bond lengths Bond anglesCounts RMSZ #|Z| > 2 Counts RMSZ #|Z| > 2
2 GOL A 201 - 5,5,5 0.62 0 5,5,5 1.32 1 (20%)
In the following table, the Chirals column lists the number of chiral outliers, the number of chiralcenters analysed, the number of these observed in the model and the number defined in theChemical Component Dictionary. Similar counts are reported in the Torsion and Rings columns.’-’ means no outliers of that kind were identified.
Mol Type Chain Res Link Chirals Torsions Rings2 GOL A 201 - - 0/4/4/4 0/0/0/0
Page 10 Full wwPDB X-ray Structure Validation Report 5XRI
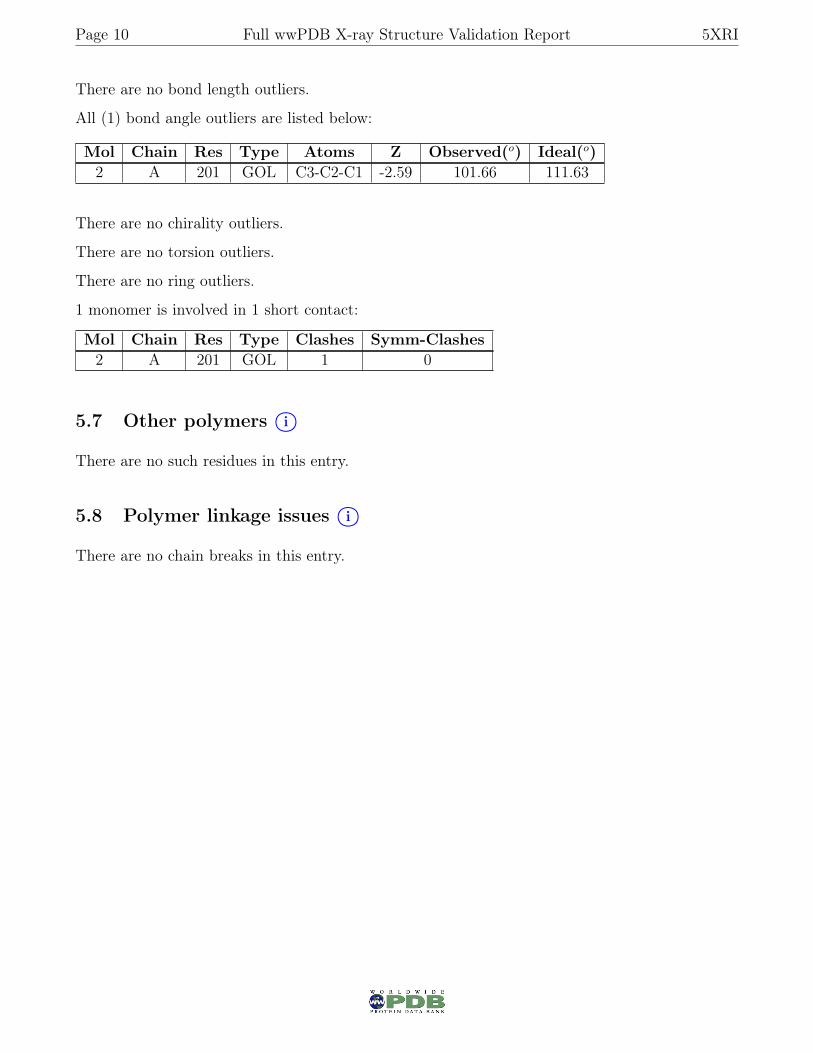
There are no bond length outliers.
All (1) bond angle outliers are listed below:
Mol Chain Res Type Atoms Z Observed(o) Ideal(o)2 A 201 GOL C3-C2-C1 -2.59 101.66 111.63
There are no chirality outliers.
There are no torsion outliers.
There are no ring outliers.
1 monomer is involved in 1 short contact:
Mol Chain Res Type Clashes Symm-Clashes2 A 201 GOL 1 0
5.7 Other polymers i○
There are no such residues in this entry.
5.8 Polymer linkage issues i○
There are no chain breaks in this entry.
Page 11 Full wwPDB X-ray Structure Validation Report 5XRI
6 Fit of model and data i○
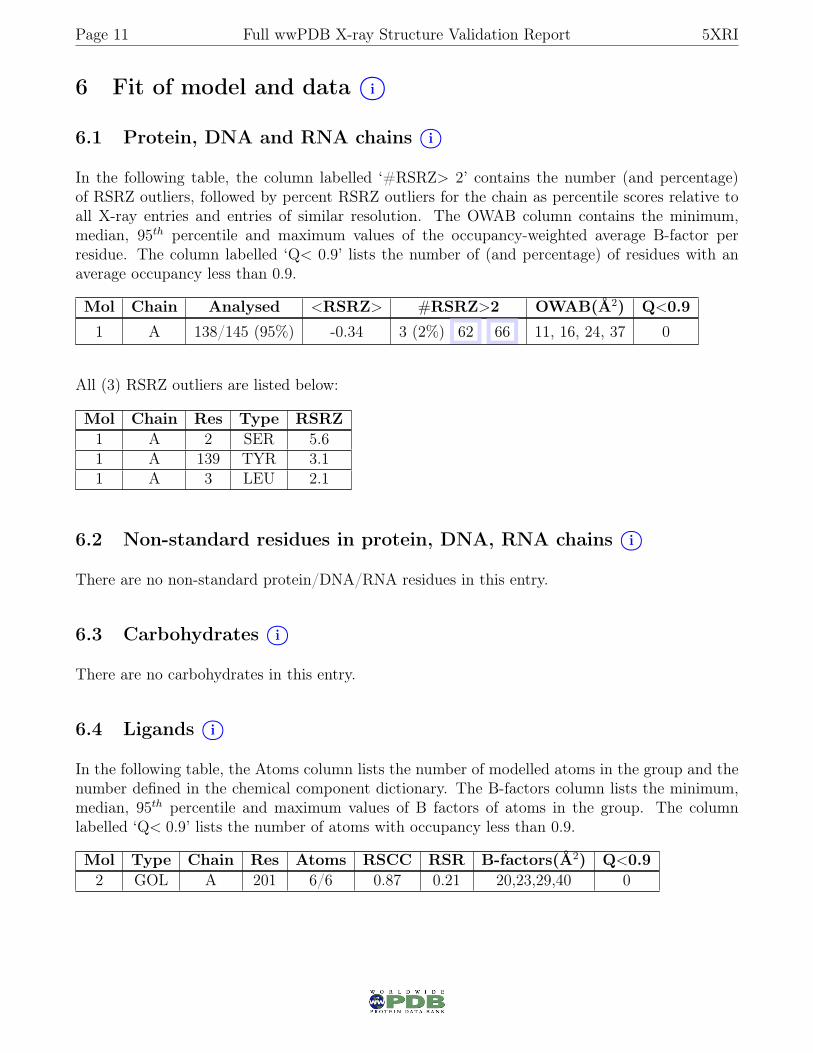
6.1 Protein, DNA and RNA chains i○
In the following table, the column labelled ‘#RSRZ> 2’ contains the number (and percentage)of RSRZ outliers, followed by percent RSRZ outliers for the chain as percentile scores relative toall X-ray entries and entries of similar resolution. The OWAB column contains the minimum,median, 95th percentile and maximum values of the occupancy-weighted average B-factor perresidue. The column labelled ‘Q< 0.9’ lists the number of (and percentage) of residues with anaverage occupancy less than 0.9.
Mol Chain Analysed <RSRZ> #RSRZ>2 OWAB(Å2) Q<0.9
1 A 138/145 (95%) -0.34 3 (2%) 62 66 11, 16, 24, 37 0
All (3) RSRZ outliers are listed below:
Mol Chain Res Type RSRZ1 A 2 SER 5.61 A 139 TYR 3.11 A 3 LEU 2.1
6.2 Non-standard residues in protein, DNA, RNA chains i○
There are no non-standard protein/DNA/RNA residues in this entry.
6.3 Carbohydrates i○
There are no carbohydrates in this entry.
6.4 Ligands i○
In the following table, the Atoms column lists the number of modelled atoms in the group and thenumber defined in the chemical component dictionary. The B-factors column lists the minimum,median, 95th percentile and maximum values of B factors of atoms in the group. The columnlabelled ‘Q< 0.9’ lists the number of atoms with occupancy less than 0.9.
Mol Type Chain Res Atoms RSCC RSR B-factors(Å2) Q<0.92 GOL A 201 6/6 0.87 0.21 20,23,29,40 0

Page 12 Full wwPDB X-ray Structure Validation Report 5XRI
6.5 Other polymers i○
There are no such residues in this entry.