Embed Size (px)
Citation preview

Full wwPDB X-ray Structure Validation Report i○
Mar 9, 2018 – 06:33 pm GMT
PDB ID : 5CNYTitle : Crystal Structure of human zinc insulin at pH 5.5
Authors : Palmieri, L.C.; Lima, L.M.T.R.Deposited on : 2015-07-18
Resolution : 1.70 Å(reported)
This is a Full wwPDB X-ray Structure Validation Report for a publicly released PDB entry.
We welcome your comments at [email protected] user guide is available at
https://www.wwpdb.org/validation/2017/XrayValidationReportHelpwith specific help available everywhere you see the i○ symbol.
The following versions of software and data (see references i○) were used in the production of this report:
MolProbity : 4.02b-467Xtriage (Phenix) : 1.13
EDS : trunk30967Percentile statistics : 20171227.v01 (using entries in the PDB archive December 27th 2017)
Refmac : 5.8.0158CCP4 : 7.0 (Gargrove)
Ideal geometry (proteins) : Engh & Huber (2001)Ideal geometry (DNA, RNA) : Parkinson et al. (1996)
Validation Pipeline (wwPDB-VP) : trunk30967

Page 2 Full wwPDB X-ray Structure Validation Report 5CNY
1 Overall quality at a glance i○
The following experimental techniques were used to determine the structure:X-RAY DIFFRACTION
The reported resolution of this entry is 1.70 Å.
Percentile scores (ranging between 0-100) for global validation metrics of the entry are shown inthe following graphic. The table shows the number of entries on which the scores are based.
Metric Whole archive(#Entries)
Similar resolution(#Entries, resolution range(Å))
Rfree 111664 3793 (1.70-1.70)Clashscore 122126 4167 (1.70-1.70)
Ramachandran outliers 120053 4100 (1.70-1.70)Sidechain outliers 120020 4100 (1.70-1.70)RSRZ outliers 108989 3718 (1.70-1.70)
The table below summarises the geometric issues observed across the polymeric chains and their fitto the electron density. The red, orange, yellow and green segments on the lower bar indicate thefraction of residues that contain outliers for >=3, 2, 1 and 0 types of geometric quality criteria. Agrey segment represents the fraction of residues that are not modelled. The numeric value for eachfraction is indicated below the corresponding segment, with a dot representing fractions <=5%The upper red bar (where present) indicates the fraction of residues that have poor fit to theelectron density. The numeric value is given above the bar.
Mol Chain Length Quality of chain
1 A 21
1 C 21
2 B 30
2 D 30

Page 3 Full wwPDB X-ray Structure Validation Report 5CNY
2 Entry composition i○
There are 5 unique types of molecules in this entry. The entry contains 968 atoms, of which 0 arehydrogens and 0 are deuteriums.
In the tables below, the ZeroOcc column contains the number of atoms modelled with zero occu-pancy, the AltConf column contains the number of residues with at least one atom in alternateconformation and the Trace column contains the number of residues modelled with at most 2atoms.
• Molecule 1 is a protein called Insulin.
Mol Chain Residues Atoms ZeroOcc AltConf Trace
1 A 21 Total C N O S163 99 25 35 4 0 0 0
1 C 21 Total C N O S178 106 28 40 4 0 2 0
• Molecule 2 is a protein called Insulin.
Mol Chain Residues Atoms ZeroOcc AltConf Trace
2 B 30 Total C N O S274 177 48 47 2 0 4 0
2 D 30 Total C N O S261 172 42 45 2 0 2 0
• Molecule 3 is ZINC ION (three-letter code: ZN) (formula: Zn).
Mol Chain Residues Atoms ZeroOcc AltConf
3 B 1 Total Zn1 1 0 0
3 D 1 Total Zn1 1 0 0
• Molecule 4 is CHLORIDE ION (three-letter code: CL) (formula: Cl).
Mol Chain Residues Atoms ZeroOcc AltConf
4 B 1 Total Cl1 1 0 0
4 D 1 Total Cl1 1 0 0
• Molecule 5 is water.

Page 4 Full wwPDB X-ray Structure Validation Report 5CNY
Mol Chain Residues Atoms ZeroOcc AltConf
5 A 15 Total O15 15 0 0
5 B 30 Total O30 30 0 0
5 C 12 Total O12 12 0 0
5 D 31 Total O31 31 0 0

Page 5 Full wwPDB X-ray Structure Validation Report 5CNY
3 Residue-property plots i○
These plots are drawn for all protein, RNA and DNA chains in the entry. The first graphic fora chain summarises the proportions of the various outlier classes displayed in the second graphic.The second graphic shows the sequence view annotated by issues in geometryand electron density.Residues are color-coded according to the number of geometric quality criteria for which theycontain at least one outlier: green = 0, yellow = 1, orange = 2 and red = 3 or more. A red dotabove a residue indicates a poor fit to the electron density (RSRZ > 2). Stretches of 2 or moreconsecutive residues without any outlier are shown as a green connector. Residues present in thesample, but not in the model, are shown in grey.
• Molecule 1: Insulin
Chain A:
G1 S12
E17
N21
• Molecule 1: Insulin
Chain C:
G1 Y19
C20
N21
• Molecule 2: Insulin
Chain B:
F1•
V2•
N3 Q4 S9 V12
L17
V18
E21
T27
P28
K29
T30
• Molecule 2: Insulin
Chain D:
F1 L17
E21
R22
T27
T30•

Page 6 Full wwPDB X-ray Structure Validation Report 5CNY
4 Data and refinement statistics i○
Property Value SourceSpace group H 3 DepositorCell constantsa, b, c, α, β, γ
81.76Å 81.76Å 33.74Å90.00◦ 90.00◦ 120.00◦ Depositor
Resolution (Å) 13.63 – 1.7013.63 – 1.70
DepositorEDS
% Data completeness(in resolution range)
93.1 (13.63-1.70)93.3 (13.63-1.70)
DepositorEDS
Rmerge 0.04 DepositorRsym (Not available) Depositor
< I/σ(I) > 1 3.43 (at 1.70Å) XtriageRefinement program REFMAC 5.7.0029 Depositor
R, Rfree0.155 , 0.2130.156 , 0.202
DepositorDCC
Rfree test set 414 reflections (4.80%) wwPDB-VPWilson B-factor (Å2) 11.6 Xtriage
Anisotropy 0.050 XtriageBulk solvent ksol(e/Å3), Bsol(Å2) 0.40 , 45.3 EDS
L-test for twinning2 < |L| > = 0.50, < L2 > = 0.33 XtriageEstimated twinning fraction 0.020 for h,-h-k,-l Xtriage
Fo,Fc correlation 0.96 EDSTotal number of atoms 968 wwPDB-VP
Average B, all atoms (Å2) 18.0 wwPDB-VP
Xtriage’s analysis on translational NCS is as follows: The largest off-origin peak in the Patter-son function is 14.19% of the height of the origin peak. No significant pseudotranslation is de-tected.
1Intensities estimated from amplitudes.2Theoretical values of < |L| >, < L2 > for acentric reflections are 0.5, 0.333 respectively for untwinned datasets,
and 0.375, 0.2 for perfectly twinned datasets.

Page 7 Full wwPDB X-ray Structure Validation Report 5CNY
5 Model quality i○
5.1 Standard geometry i○
Bond lengths and bond angles in the following residue types are not validated in this section: ZN,CL
The Z score for a bond length (or angle) is the number of standard deviations the observed valueis removed from the expected value. A bond length (or angle) with |Z| > 5 is considered anoutlier worth inspection. RMSZ is the root-mean-square of all Z scores of the bond lengths (orangles).
Mol Chain Bond lengths Bond anglesRMSZ #|Z| >5 RMSZ #|Z| >5
1 A 0.91 0/164 0.78 0/2201 C 1.07 0/178 1.06 0/2362 B 0.97 0/280 0.94 0/3752 D 0.99 0/269 0.94 0/363All All 0.99 0/891 0.94 0/1194
There are no bond length outliers.
There are no bond angle outliers.
There are no chirality outliers.
There are no planarity outliers.
5.2 Too-close contacts i○
In the following table, the Non-H and H(model) columns list the number of non-hydrogen atomsand hydrogen atoms in the chain respectively. The H(added) column lists the number of hydrogenatoms added and optimized by MolProbity. The Clashes column lists the number of clashes withinthe asymmetric unit, whereas Symm-Clashes lists symmetry related clashes.
Mol Chain Non-H H(model) H(added) Clashes Symm-Clashes1 A 163 0 149 3 01 C 178 0 159 3 02 B 274 0 268 11 02 D 261 0 245 6 03 B 1 0 0 0 03 D 1 0 0 1 04 B 1 0 0 0 04 D 1 0 0 1 05 A 15 0 0 1 0
Continued on next page...

Page 8 Full wwPDB X-ray Structure Validation Report 5CNY
Continued from previous page...Mol Chain Non-H H(model) H(added) Clashes Symm-Clashes5 B 30 0 0 6 05 C 12 0 0 0 05 D 31 0 0 4 0All All 968 0 821 19 0
The all-atom clashscore is defined as the number of clashes found per 1000 atoms (includinghydrogen atoms). The all-atom clashscore for this structure is 11.
All (19) close contacts within the same asymmetric unit are listed below, sorted by their clashmagnitude.
Atom-1 Atom-2 Interatomicdistance (Å)
Clashoverlap (Å)
2:D:27:THR:HB 5:D:208:HOH:O 1.43 1.172:B:3:ASN:O 5:B:201:HOH:O 1.86 0.922:B:4:GLN:O 5:B:202:HOH:O 1.89 0.91
1:C:21[A]:ASN:HB2 2:D:22:ARG:O 1.84 0.772:D:21[B]:GLU:OE2 5:D:201:HOH:O 2.13 0.675:B:222:HOH:O 2:D:27:THR:HG23 1.98 0.643:D:101:ZN:ZN 4:D:102:CL:CL 1.84 0.641:A:17:GLU:HG2 2:B:18:VAL:CG1 2.27 0.632:B:27:THR:HG22 1:C:21[A]:ASN:OD1 2.04 0.572:B:9[A]:SER:HB3 5:B:212:HOH:O 2.10 0.512:D:17:LEU:HD21 5:D:231:HOH:O 2.16 0.442:D:27:THR:CB 5:D:208:HOH:O 2.26 0.431:C:19:TYR:N 1:C:19:TYR:CD2 2.86 0.432:B:4:GLN:HA 5:B:201:HOH:O 2.18 0.42
2:B:21:GLU:HG2 5:B:223:HOH:O 2.19 0.425:A:107:HOH:O 2:B:4:GLN:HG2 2.20 0.421:A:12:SER:HB3 2:B:3:ASN:HD21 1.84 0.412:B:9[B]:SER:HA 2:B:12:VAL:HG22 2.02 0.411:A:17:GLU:HG2 2:B:18:VAL:HG13 2.02 0.40
There are no symmetry-related clashes.
5.3 Torsion angles i○
5.3.1 Protein backbone i○
In the following table, the Percentiles column shows the percent Ramachandran outliers of thechain as a percentile score with respect to all X-ray entries followed by that with respect to entriesof similar resolution.

Page 9 Full wwPDB X-ray Structure Validation Report 5CNY
The Analysed column shows the number of residues for which the backbone conformation wasanalysed, and the total number of residues.
Mol Chain Analysed Favoured Allowed Outliers Percentiles
1 A 19/21 (90%) 17 (90%) 2 (10%) 0 100 100
1 C 20/21 (95%) 18 (90%) 2 (10%) 0 100 100
2 B 31/30 (103%) 31 (100%) 0 0 100 100
2 D 30/30 (100%) 30 (100%) 0 0 100 100
All All 100/102 (98%) 96 (96%) 4 (4%) 0 100 100
There are no Ramachandran outliers to report.
5.3.2 Protein sidechains i○
In the following table, the Percentiles column shows the percent sidechain outliers of the chain as apercentile score with respect to all X-ray entries followed by that with respect to entries of similarresolution.
The Analysed column shows the number of residues for which the sidechain conformation wasanalysed, and the total number of residues.
Mol Chain Analysed Rotameric Outliers Percentiles
1 A 20/20 (100%) 20 (100%) 0 100 100
1 C 22/20 (110%) 22 (100%) 0 100 100
2 B 30/26 (115%) 27 (90%) 3 (10%) 8 1
2 D 28/26 (108%) 27 (96%) 1 (4%) 38 17
All All 100/92 (109%) 96 (96%) 4 (4%) 41 14
All (4) residues with a non-rotameric sidechain are listed below:
Mol Chain Res Type2 B 17 LEU2 B 29[A] LYS2 B 29[B] LYS2 D 30 THR
Some sidechains can be flipped to improve hydrogen bonding and reduce clashes. All (1) suchsidechains are listed below:
Mol Chain Res Type2 B 3 ASN

Page 10 Full wwPDB X-ray Structure Validation Report 5CNY
5.3.3 RNA i○
There are no RNA molecules in this entry.
5.4 Non-standard residues in protein, DNA, RNA chains i○
There are no non-standard protein/DNA/RNA residues in this entry.
5.5 Carbohydrates i○
There are no carbohydrates in this entry.
5.6 Ligand geometry i○
Of 4 ligands modelled in this entry, 4 are monoatomic - leaving 0 for Mogul analysis.
There are no bond length outliers.
There are no bond angle outliers.
There are no chirality outliers.
There are no torsion outliers.
There are no ring outliers.
No monomer is involved in short contacts.
5.7 Other polymers i○
There are no such residues in this entry.
5.8 Polymer linkage issues i○
There are no chain breaks in this entry.

Page 11 Full wwPDB X-ray Structure Validation Report 5CNY
6 Fit of model and data i○
6.1 Protein, DNA and RNA chains i○
In the following table, the column labelled ‘#RSRZ> 2’ contains the number (and percentage)of RSRZ outliers, followed by percent RSRZ outliers for the chain as percentile scores relative toall X-ray entries and entries of similar resolution. The OWAB column contains the minimum,median, 95th percentile and maximum values of the occupancy-weighted average B-factor perresidue. The column labelled ‘Q< 0.9’ lists the number of (and percentage) of residues with anaverage occupancy less than 0.9.
Mol Chain Analysed <RSRZ> #RSRZ>2 OWAB(Å2) Q<0.9
1 A 21/21 (100%) -0.20 0 100 100 12, 18, 24, 28 0
1 C 21/21 (100%) -0.29 0 100 100 10, 15, 18, 19 0
2 B 30/30 (100%) -0.03 2 (6%) 18 20 8, 14, 36, 42 0
2 D 30/30 (100%) 0.04 1 (3%) 46 51 9, 14, 28, 49 0
All All 102/102 (100%) -0.10 3 (2%) 51 56 8, 15, 29, 49 0
All (3) RSRZ outliers are listed below:
Mol Chain Res Type RSRZ2 D 30 THR 3.62 B 1 PHE 2.92 B 2 VAL 2.6
6.2 Non-standard residues in protein, DNA, RNA chains i○
There are no non-standard protein/DNA/RNA residues in this entry.
6.3 Carbohydrates i○
There are no carbohydrates in this entry.
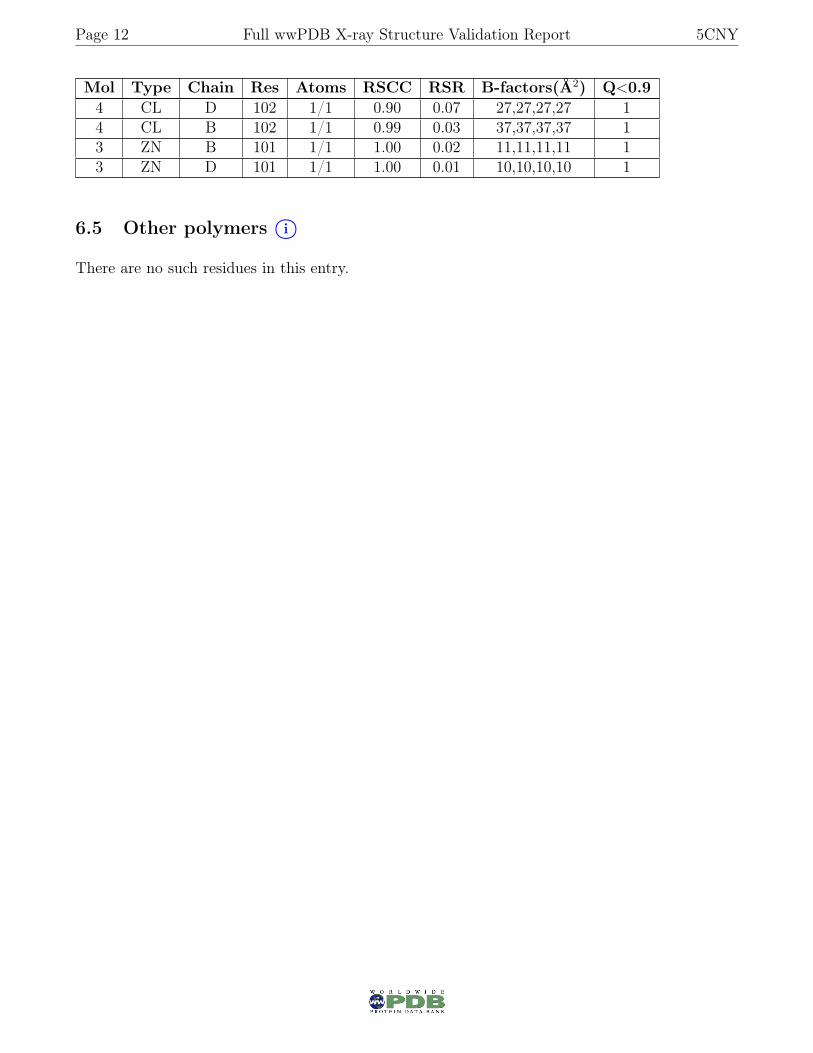
6.4 Ligands i○
In the following table, the Atoms column lists the number of modelled atoms in the group and thenumber defined in the chemical component dictionary. The B-factors column lists the minimum,median, 95th percentile and maximum values of B factors of atoms in the group. The columnlabelled ‘Q< 0.9’ lists the number of atoms with occupancy less than 0.9.
Page 12 Full wwPDB X-ray Structure Validation Report 5CNY
Mol Type Chain Res Atoms RSCC RSR B-factors(Å2) Q<0.94 CL D 102 1/1 0.90 0.07 27,27,27,27 14 CL B 102 1/1 0.99 0.03 37,37,37,37 13 ZN B 101 1/1 1.00 0.02 11,11,11,11 13 ZN D 101 1/1 1.00 0.01 10,10,10,10 1
6.5 Other polymers i○
There are no such residues in this entry.