Embed Size (px)
Citation preview

Full Year 2021Trading Update
2
Basis of preparation BASIS OF PRESENTATIONThis investor presentation constitutes a trading update for Virgin Money UK PLC for the year ended 30 September 2021 and is unaudited. This investor presentation is not, nor is it intended to be, apreliminary statement of annual results. Due to the results presented in this presentation being unaudited and not having been agreed with the Company's auditors as would be required for apreliminary statement of annual results, further adjustment could arise from the finalisation of the audit which would be reflected in the audited financial statements when published, however VirginMoney UK PLC confirms that it is not aware of, nor has the company been notified of, any matter which may result in the need to make a change to the information in this update in connection withfinalising the audit. This investor presentation relates to the trading update of the same date. The audited financial statements will be included in the Group’s Annual Report and Accounts which isexpected to be published on 24 November 2021.
This investor presentation provides an update on the Group’s acceleration of its Digital First strategy, following the conclusion of its digital strategy review which was announced at the time of its H1results.
Virgin Money UK PLC (‘Virgin Money’, ‘VMUK’ or ‘the Company’), together with its subsidiary undertakings (which together comprise ‘the Group’), operate under the Clydesdale Bank, Yorkshire Bank,and Virgin Money brands.
The information in this investor presentation is unaudited and does not constitute statutory accounts within the meaning of Section 434 of the Companies Act 2006 (the “Act”). Statutory accounts forthe year ended 30 September 2020 have been delivered to the Registrar of Companies and contained an unqualified audit report under Section 495 of the Act, which did not draw attention to anymatters by way of emphasis and did not contain any statements under Section 498 of the Act.
Accelerating Digital
Chief Executive OfficerDAVID DUFFY
The figures, commentary and comparisons set out in this presentation are based on the anticipated FY21 results as set out in the announcement of 4 November 2021, which are unaudited and have yet to be agreed with Virgin Money’s auditors and so could be subject to change.

4
Strong expected financial performance in FY21
• NIM of 1.62% for FY21 vs 1.56% for FY20; exit rate of 1.70% for Q4
• Relationship deposits +19% YoY; FY21 cost of deposits reduced 37bps vs FY20
• Stable lending balances with significantly above-market growth in credit cards
• FY 21 costs down 2% to £902m
• Integration & Transformation substantially completed
• Accelerating digital to drive productivity and growth
• Improving economic forecasts led to £217m writeback of provisions across H2
• Asset quality remains resilient but strong provision coverage maintained at 70bps
• ECL release of £131m; (18)bps cost of risk for FY21
• Capital remains robust: CET1 ratio improved to 14.9%1
• Strong TNAV progression; improved 46p to 290p during FY21
• Board intends to recommend dividend of 1p per share2
Underlying profit before tax
£801m
Robust CET1ratio1
14.9%
Efficiency
Asset quality
Balance sheetmix
Balance sheet
strength
Statutory ROTE
10.2%
1 IFRS 9 transitional basis; 14.4% CET1 ratio excluding the benefit from the change in treatment of software intangible assets2 Subject to finalisation of full year results and shareholder approval
Statutory profit before tax
£417m
5
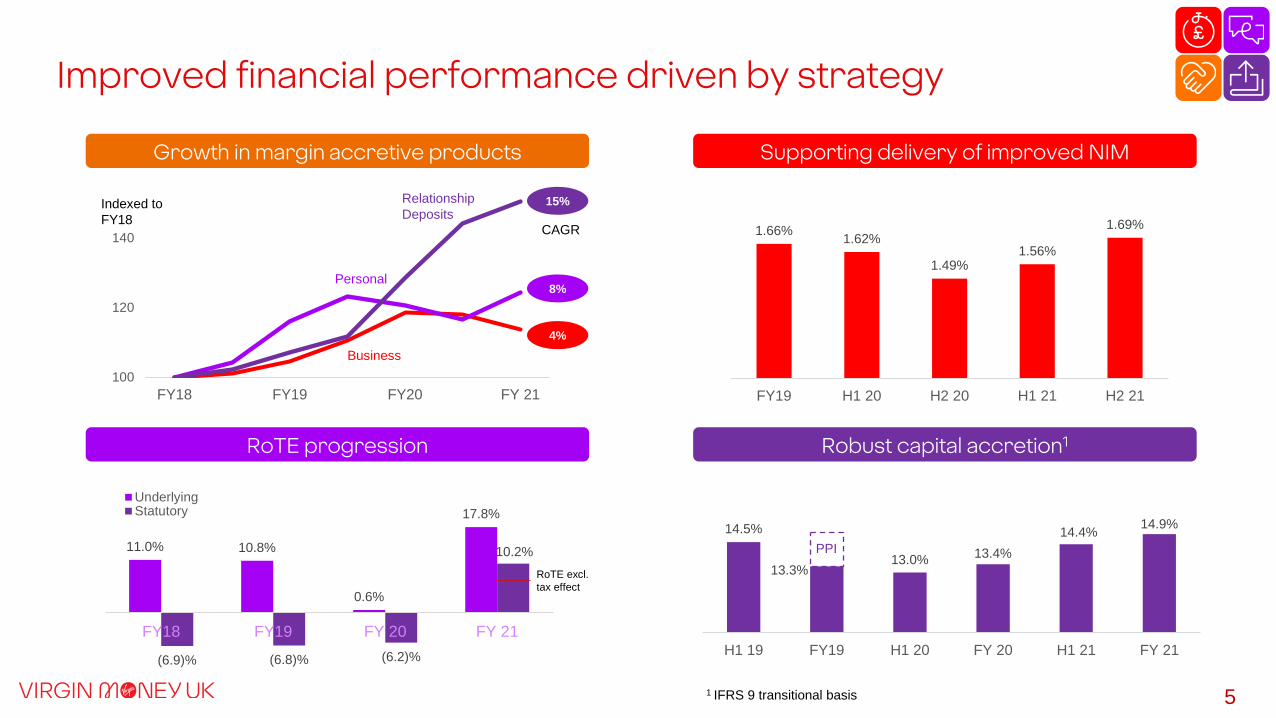
Improved financial performance driven by strategy
Growth in margin accretive products
100
120
140
FY18 FY19 FY20 FY 21
Business
Relationship Deposits
Personal
Indexed to FY18
15%
8%
4%
CAGR 1.66% 1.62%
1.49%1.56%
1.69%
FY19 H1 20 H2 20 H1 21 H2 21
14.5%
13.3%13.0% 13.4%
14.4% 14.9%
H1 19 FY19 H1 20 FY 20 H1 21 FY 21
PPI
Supporting delivery of improved NIM
Robust capital accretion1RoTE progression
11.0% 10.8%
0.6%
17.8%
(6.9)% (6.8)% (6.2)%
10.2%
FY18 FY19 FY 20 FY 21
UnderlyingStatutory
RoTE excl. tax effect
1 IFRS 9 transitional basis
6(0.2)%
0.0%
0.2%
0.4%
0.6%
0.8%
O/N 1Y 2Y 3Y 4Y 5Y 6Y 7Y 8Y 9Y 10Y
Q1 21 Q3 21 Q4 21
GBP SONIA swap curve
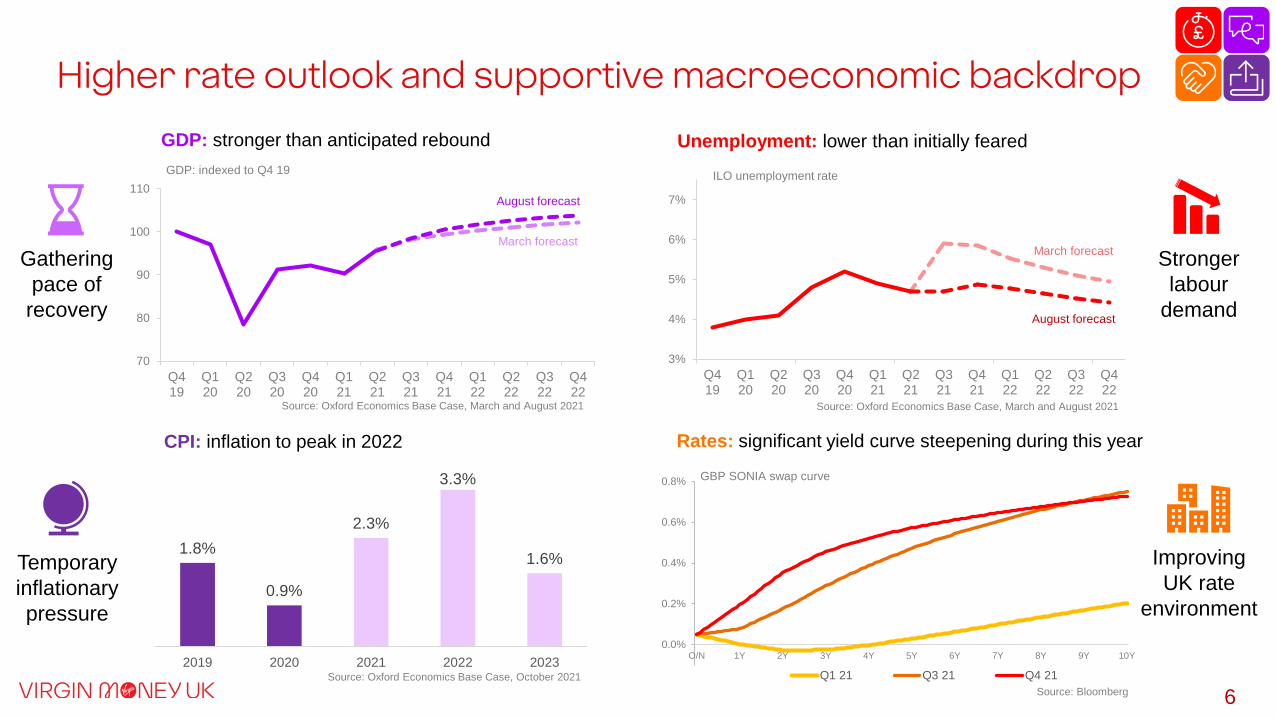
Higher rate outlook and supportive macroeconomic backdrop
70
80
90
100
110
Q419
Q120
Q220
Q320
Q420
Q121
Q221
Q321
Q421
Q122
Q222
Q322
Q422
GDP: indexed to Q4 19
3%
4%
5%
6%
7%
Q419
Q120
Q220
Q320
Q420
Q121
Q221
Q321
Q421
Q122
Q222
Q322
Q422
ILO unemployment rate
August forecast
March forecast
Source: Bloomberg
Source: Oxford Economics Base Case, March and August 2021
Unemployment: lower than initially fearedGDP: stronger than anticipated rebound
Rates: significant yield curve steepening during this yearCPI: inflation to peak in 2022
Temporary inflationary pressure
Improving UK rate
environment
Gathering pace of recovery
Stronger labour
demand
August forecast
March forecast
Source: Oxford Economics Base Case, March and August 2021
1.8%
0.9%
2.3%
3.3%
1.6%
2019 2020 2021 2022 2023Source: Oxford Economics Base Case, October 2021

7
FSMA Part VII delivered
c.20% reduction in staff
44% decrease in branch network to 131 stores1
38% reduction in main offices to 8 sites
Significant progress on synergies
2.7m accounts rebranded
c.2.5m customers using VM mobile apps
Consolidated data warehouse contains over 3,000 differing data sets for over 8m customer accounts
Successfully delivered integration and rebranding
Delivered integration and synergies While rebranding and starting to digitise the bank
3 legacy brands converged into 1
Store network fully rebranded
Vast majority of products now sold under VM brand, attracting more affluent customers
• 95% growth in new PCA sales YOY
• 100% new BCA sales VM branded
• 100% credit card sales under VM/VAA brand
Launch of national digital business bank
Launched innovative branded services such as Money on your Mind and Brighter Money Bundles
1 Including branch reductions announced 30 September 2021
8
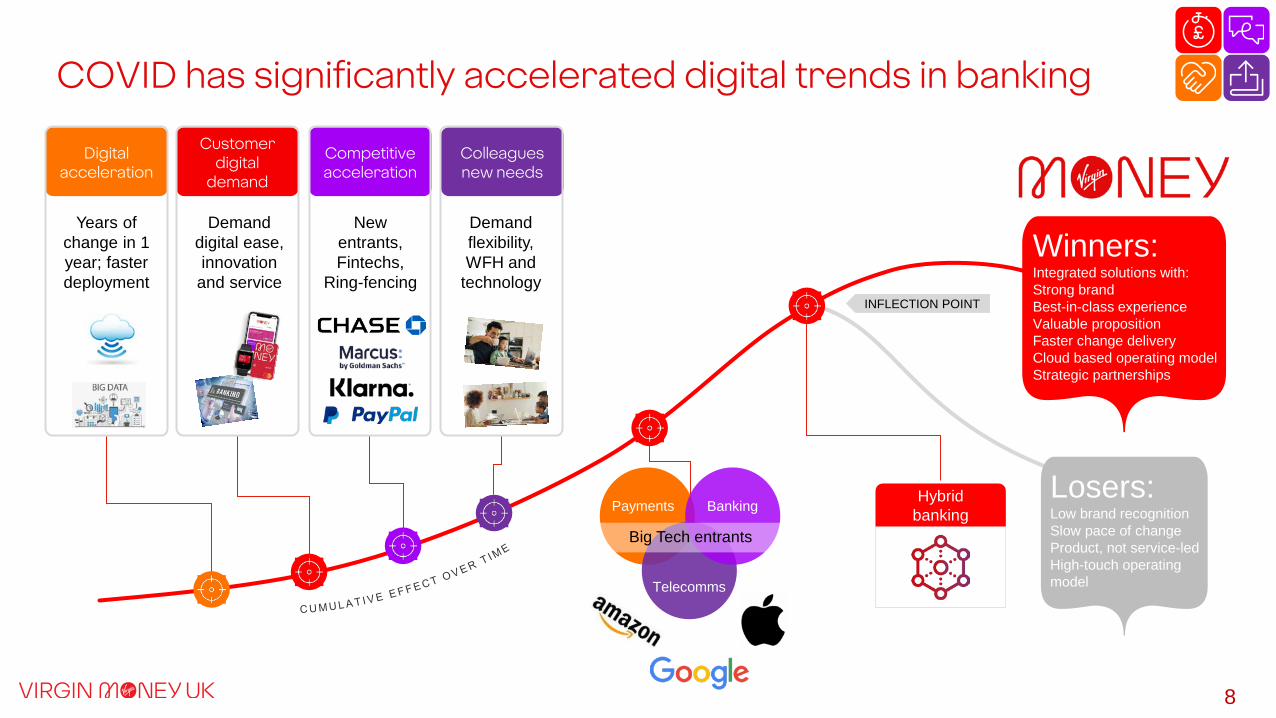
COVID has significantly accelerated digital trends in banking
Winners: Integrated solutions with: Strong brandBest-in-class experienceValuable propositionFaster change deliveryCloud based operating modelStrategic partnerships
Hybrid banking
Losers:Low brand recognition Slow pace of changeProduct, not service-led High-touch operating model
INFLECTION POINT
Payments Banking
Telecomms
Big Tech entrants
Digital acceleration
Customer digital
demand
Competitive acceleration
Colleagues new needs
Years of change in 1 year; faster deployment
New entrants,Fintechs,
Ring-fencing
Demand digital ease, innovation
and service
Demand flexibility, WFH and
technology
9
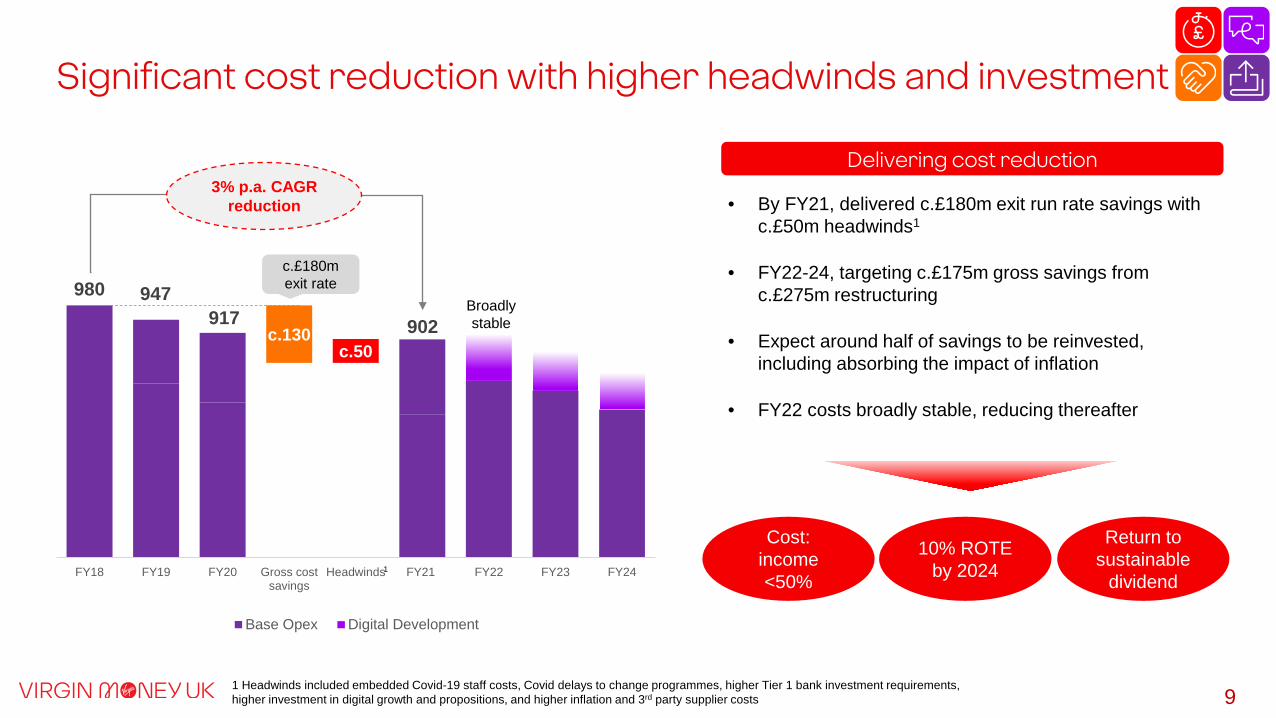
c.130c.50
980 947 917
FY18 FY19 FY20 Gross costsavings
Headwinds FY21 FY22 FY23 FY24
Base Opex Digital Development
3% p.a. CAGR reduction
902Broadly stable
c.£180m exit rate
• By FY21, delivered c.£180m exit run rate savings with c.£50m headwinds1
• FY22-24, targeting c.£175m gross savings from c.£275m restructuring
• Expect around half of savings to be reinvested, including absorbing the impact of inflation
• FY22 costs broadly stable, reducing thereafter
Cost: income <50%
Return to sustainable
dividend
10% ROTE by 2024
Delivering cost reduction
1 Headwinds included embedded Covid-19 staff costs, Covid delays to change programmes, higher Tier 1 bank investment requirements, higher investment in digital growth and propositions, and higher inflation and 3rd party supplier costs
1
Significant cost reduction with higher headwinds and investment
10
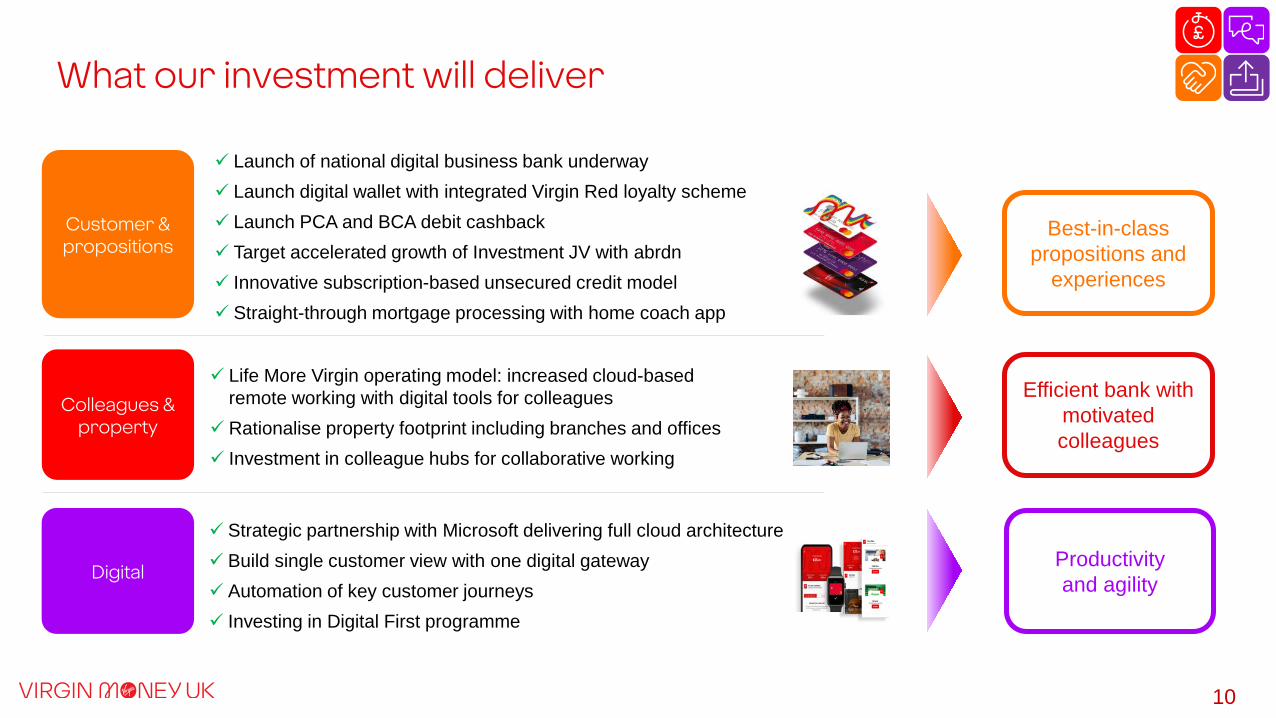
Launch of national digital business bank underway Launch digital wallet with integrated Virgin Red loyalty scheme Launch PCA and BCA debit cashback Target accelerated growth of Investment JV with abrdn Innovative subscription-based unsecured credit model Straight-through mortgage processing with home coach app
Strategic partnership with Microsoft delivering full cloud architecture Build single customer view with one digital gateway Automation of key customer journeys Investing in Digital First programme
Customer & propositions
Colleagues & property
Digital
Life More Virgin operating model: increased cloud-based remote working with digital tools for colleagues
Rationalise property footprint including branches and offices Investment in colleague hubs for collaborative working
Best-in-class propositions and
experiences
Efficient bank with motivated colleagues
Productivity and agility
What our investment will deliver
11
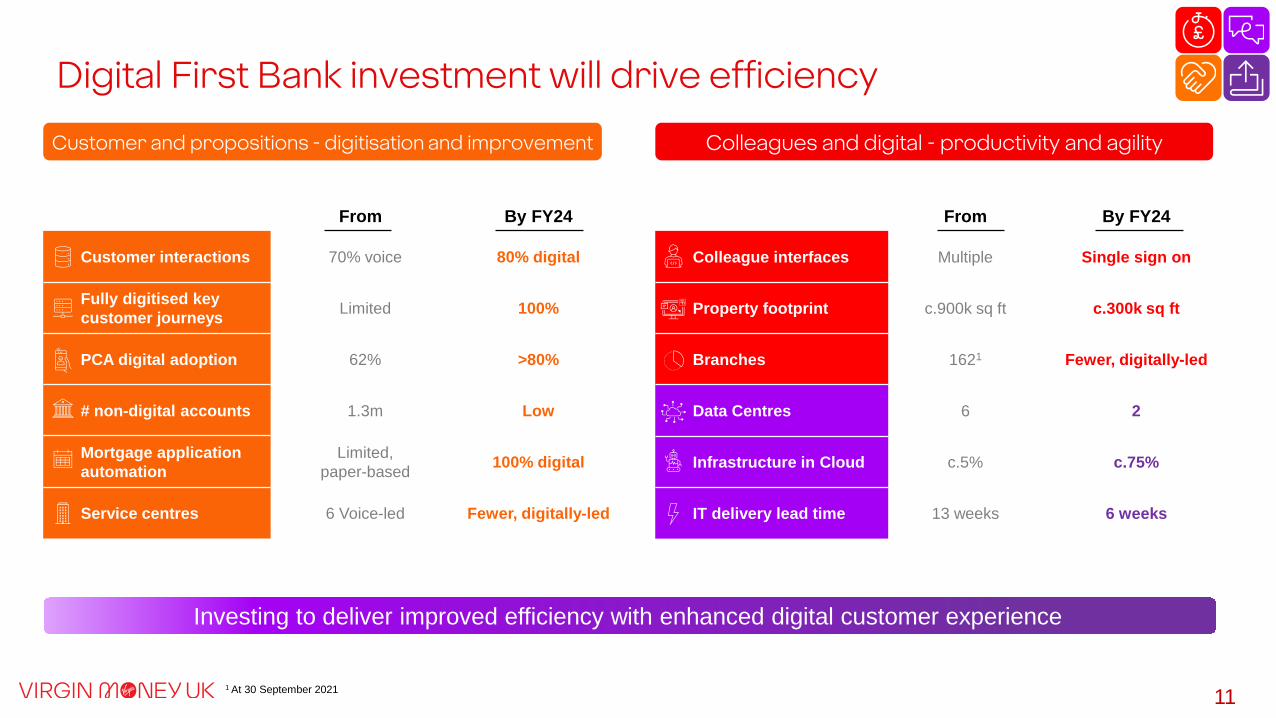
From By FY24
Customer interactions 70% voice 80% digital
Fully digitised key customer journeys Limited 100%
PCA digital adoption 62% >80%
# non-digital accounts 1.3m Low
Mortgage application automation
Limited, paper-based 100% digital
Service centres 6 Voice-led Fewer, digitally-led
Digital First Bank investment will drive efficiency
Colleagues and digital - productivity and agilityCustomer and propositions - digitisation and improvement
Investing to deliver improved efficiency with enhanced digital customer experience
From By FY24
Colleague interfaces Multiple Single sign on
Property footprint c.900k sq ft c.300k sq ft
Branches 1621 Fewer, digitally-led
Data Centres 6 2
Infrastructure in Cloud c.5% c.75%
IT delivery lead time 13 weeks 6 weeks
1 At 30 September 2021
12
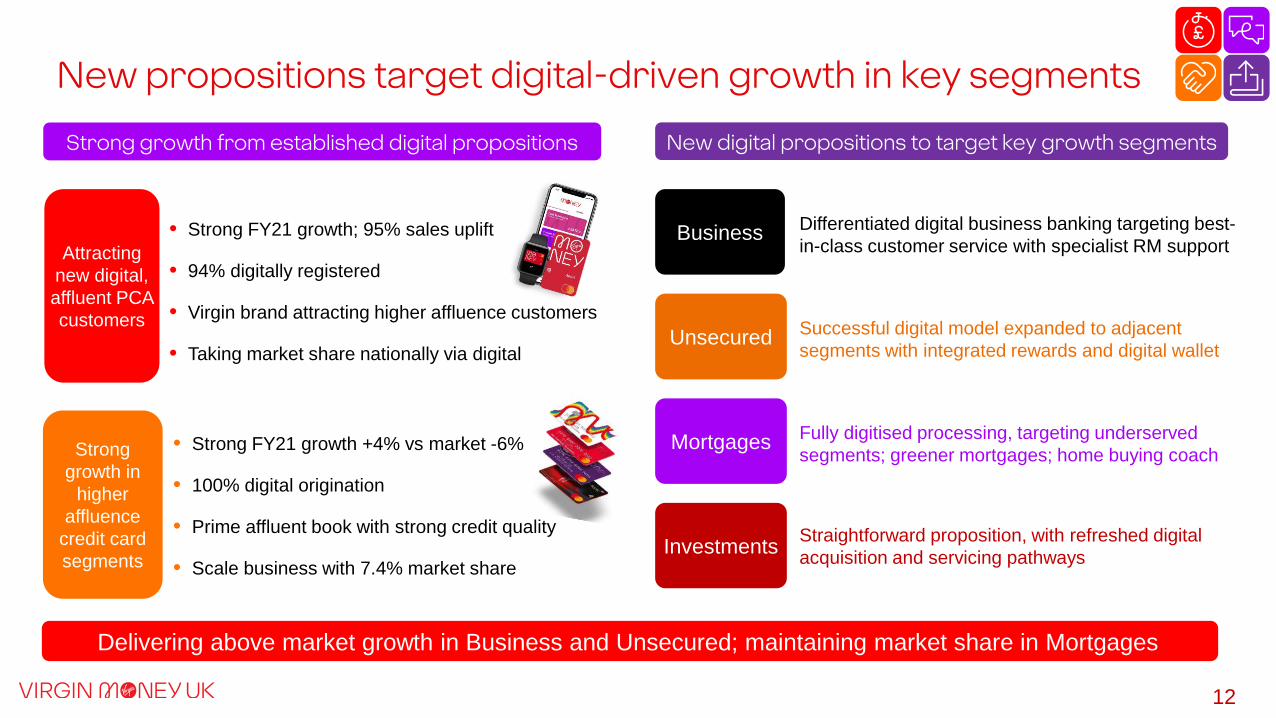
• Strong FY21 growth; 95% sales uplift
• 94% digitally registered
• Virgin brand attracting higher affluence customers
• Taking market share nationally via digital
New propositions target digital-driven growth in key segments
Strong growth in
higher affluence
credit card segments
Attracting new digital, affluent PCA customers
New digital propositions to target key growth segments
• Strong FY21 growth +4% vs market -6%
• 100% digital origination
• Prime affluent book with strong credit quality
• Scale business with 7.4% market share
Successful digital model expanded to adjacent segments with integrated rewards and digital wallet Unsecured
Business Differentiated digital business banking targeting best-in-class customer service with specialist RM support
Mortgages
Investments
Fully digitised processing, targeting underserved segments; greener mortgages; home buying coach
Straightforward proposition, with refreshed digital acquisition and servicing pathways
Strong growth from established digital propositions
Delivering above market growth in Business and Unsecured; maintaining market share in Mortgages

13
Strong pipeline of propositions to drive growth
Mortgage application automation
Greener mortgages upgrades
Launch BTL for Limited Companies
M-Track launch
Unsecured Gen-Z subscription
launch
Business digital
marketplace launch
Credit card instalments
launch
Debit card Cashback
launch
Digital Wallet first release
Unsecured product
expansion
Virgin rewards launch
H1 FY22 H2 FY22 Outer years
Extend new-build
proposition
Digital investment
platform launch
Digital investment proposition integration
Premier M account launch
Youth current account launch
Lending into later life launch
Business ESG product
enhancementsDigital Wallet full release
Full partner integration for digital
Business bank
Mortgage straight through
processing delivered
Home ownership ecosystem
launch
Pension platform
enrichment

14
Expect further update in 2022
Developing differentiated capabilities Compelling competitive attributes
Developing valuable customer proposition
Credit and debit loyalty / Virgin Money cashback
Full functionality of all major competitors
Fully integrated into digital business bank
Differentiated rewards model as a currency
Trusted brand with broader opportunity
1 Digital wallets securely store virtual versions of debit and credit cards, allowing digital payment capability
• Collaborating with Global Payments to deliver digital wallet1 with full BNPL capability and loyalty scheme
• Integrated brand experience and value proposition
• Best-in-class digital merchant services proposition with integrated customer data and insights
• Potential opportunity for customers to ‘Earn and Burn’ Virgin points
• Available to all UK consumers
Launching a Digital Wallet with Virgin Red loyalty opportunity
Chief Financial OfficerCLIFFORD ABRAHAMS
Financial Results
The figures, commentary and comparisons set out in this presentation are based on the anticipated FY21 results as set out in the announcement of 4 November 2021, which are unaudited and have yet to be agreed with Virgin Money’s auditors and so could be subject to change.
16
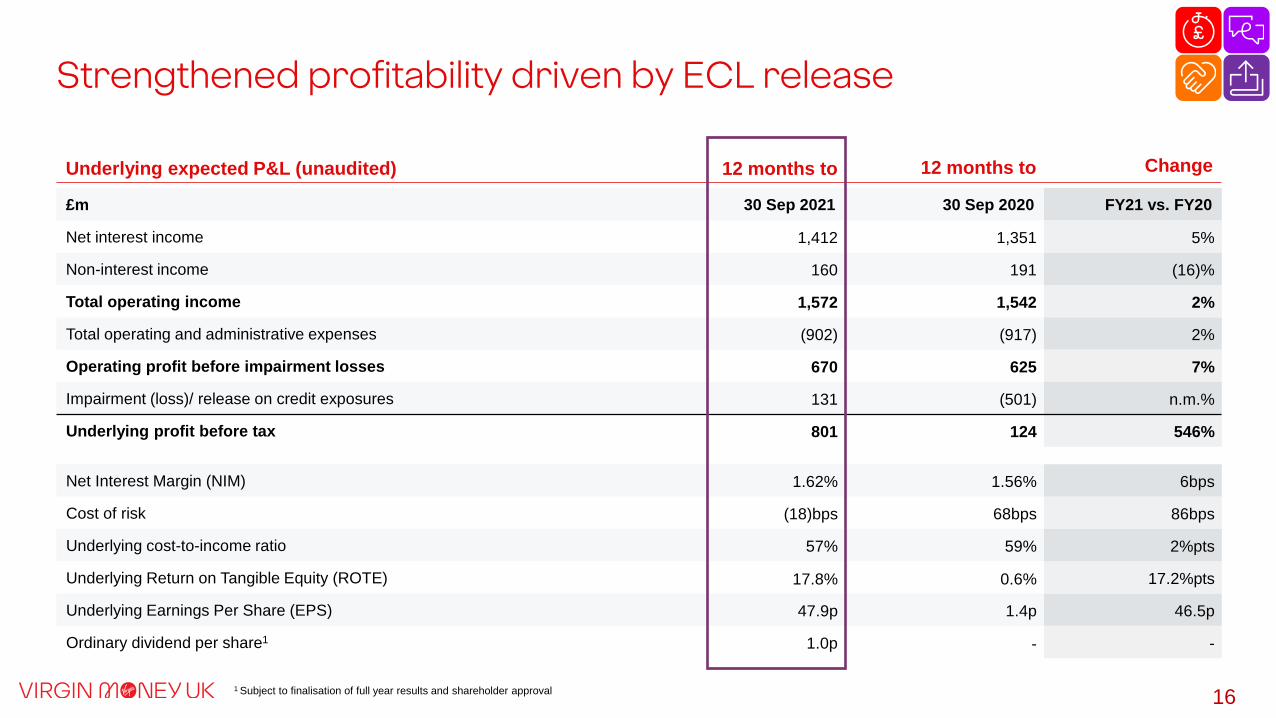
£m 30 Sep 2021 30 Sep 2020 FY21 vs. FY20
Net interest income 1,412 1,351 5%
Non-interest income 160 191 (16)%
Total operating income 1,572 1,542 2%
Total operating and administrative expenses (902) (917) 2%
Operating profit before impairment losses 670 625 7%
Impairment (loss)/ release on credit exposures 131 (501) n.m.%
Underlying profit before tax 801 124 546%
Net Interest Margin (NIM) 1.62% 1.56% 6bps
Cost of risk (18)bps 68bps 86bps
Underlying cost-to-income ratio 57% 59% 2%pts
Underlying Return on Tangible Equity (ROTE) 17.8% 0.6% 17.2%pts
Underlying Earnings Per Share (EPS) 47.9p 1.4p 46.5p
Ordinary dividend per share1 1.0p - -
Underlying expected P&L (unaudited) 12 months to Change
Strengthened profitability driven by ECL release
12 months to
1 Subject to finalisation of full year results and shareholder approval
17
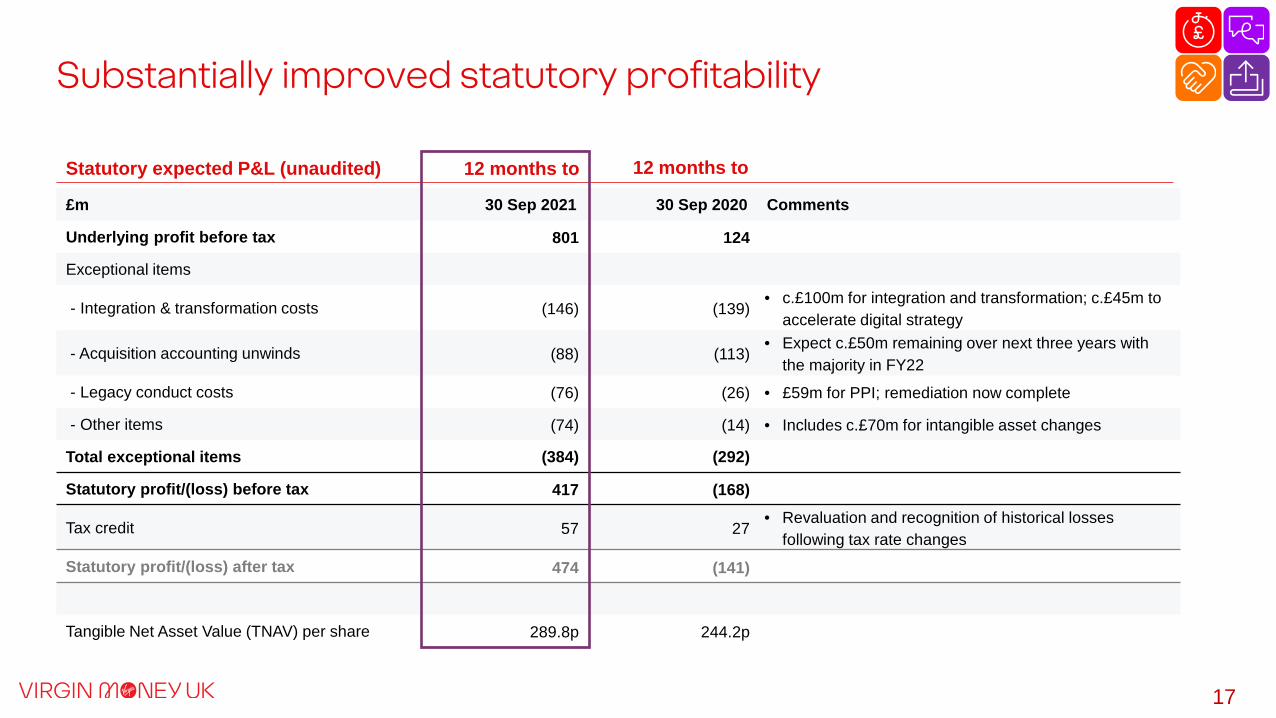
£m 30 Sep 2021 30 Sep 2020 Comments
Underlying profit before tax 801 124
Exceptional items
- Integration & transformation costs (146) (139)• c.£100m for integration and transformation; c.£45m to
accelerate digital strategy
- Acquisition accounting unwinds (88) (113)• Expect c.£50m remaining over next three years with
the majority in FY22- Legacy conduct costs (76) (26) • £59m for PPI; remediation now complete
- Other items (74) (14) • Includes c.£70m for intangible asset changes
Total exceptional items (384) (292)
Statutory profit/(loss) before tax 417 (168)
Tax credit 57 27• Revaluation and recognition of historical losses
following tax rate changesStatutory profit/(loss) after tax 474 (141)
Tangible Net Asset Value (TNAV) per share 289.8p 244.2p
Statutory expected P&L (unaudited) 12 months to
Substantially improved statutory profitability
12 months to

18
Retain funding flexibility and managing wholesale mix
Delivering funding mix improvement and lower cost of funds
Strong growth in relationship deposits
Wholesale funding balances £bn
8.8 7.7
5.4 5.9
Sep-20 Sep-21
14.2 13.6
Due to other banksDebt securities TFS/TFSME
Customer deposit balances £bn
21.1 15.0
20.721.3
25.7 30.6
Sep-20 Sep-21
Term deposits Non-linked savings Relationship deposits
Cost (bps) 90 53LDR 107% 108%
67.5 66.9
(0.9)% (4.4)%
19%
Cost (bps) 142 130TFS/TFSME (% of lending) 7% 8%
(29)%
19
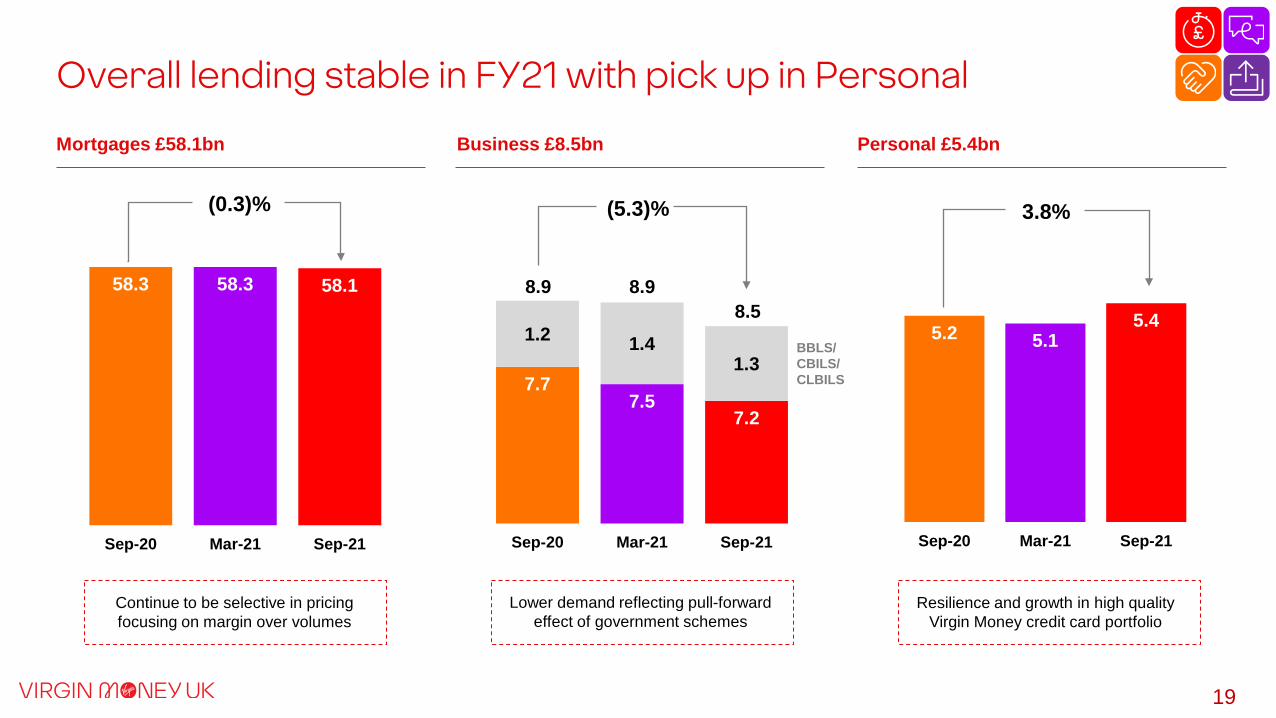
Overall lending stable in FY21 with pick up in Personal
Mortgages £58.1bn
58.3 58.3 58.1
Sep-20 Mar-21 Sep-21
7.77.5
7.2
1.2 1.41.3
Sep-20 Mar-21 Sep-21
8.9
5.2 5.15.4
Sep-20 Mar-21 Sep-21
(0.3)% (5.3)% 3.8%
Continue to be selective in pricing focusing on margin over volumes
Lower demand reflecting pull-forward effect of government schemes
Resilience and growth in high quality Virgin Money credit card portfolio
Business £8.5bn Personal £5.4bn
BBLS/ CBILS/ CLBILS
8.58.9
20
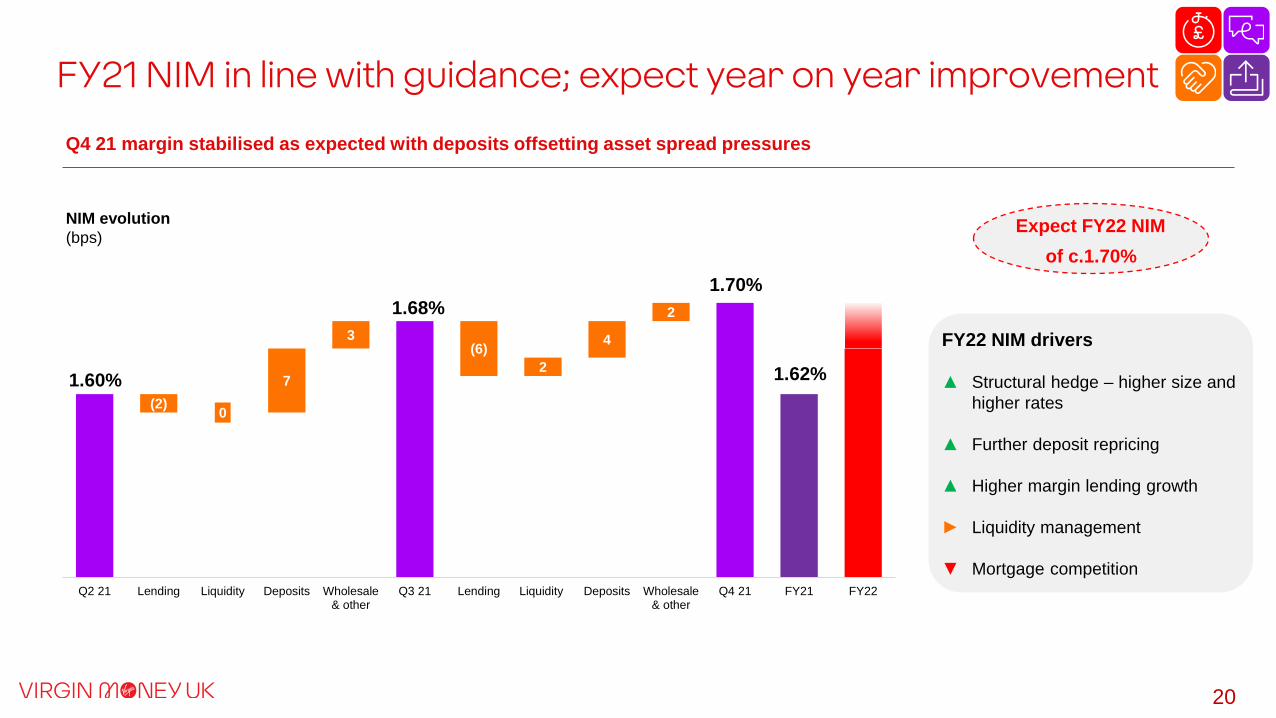
Q4 21 margin stabilised as expected with deposits offsetting asset spread pressures
FY21 NIM in line with guidance; expect year on year improvement
NIM evolution (bps) Expect FY22 NIM
of c.1.70%
(2) 0
7
3(6)
2
4
2
Q2 21 Lending Liquidity Deposits Wholesale& other
Q3 21 Lending Liquidity Deposits Wholesale& other
Q4 21 FY21 FY22
1.60% 1.62%
1.70%1.68%
FY22 NIM drivers
▲ Structural hedge – higher size and higher rates
▲ Further deposit repricing
▲ Higher margin lending growth
► Liquidity management
▼ Mortgage competition

21
c.210
c.150c.120
c.30
FY 20 FY 21 FY 22Previous hedge New hedge
Increased size of the structural hedge Further increase in hedge capacity driving NII
Further expansion – implemented during Q1 22
• Hedge increased by c.£6bn to c.£32bn following methodology review in H2 of rate sensitive balances and behavioural life of deposits
• Hedge benefits from rolling maturing balances at more elevated swap rates
• Expect gross contribution to be meaningfully higher in FY22 vs. FY21
NII impact Sensitivity + 25 bps
Sensitivity - 25 bps
Sep-21 actual c.£30m c.£(25)m
Pro-forma for Q1 22 hedge increase c.£20m c.£(10)m
Gross interest income contributions2
£m
Proforma 1yr rate sensitivity to parallel shift, on larger hedge:
• Lower sensitivity post hedge increase reflects additional value locked in and lower exposure to quantum and timing of BBR changes
2 Gross interest income
Jun-21 Sep-21 Q1 22
25 26
0.29% 0.32% c.32Gross Yield
Hedge Notional£bn c.0.45%
1 £25.9bn reported at H1 included £0.9bn of AT1 previously included in the structural hedge; this is now hedged to call date and so excluded from hedge analysis
1
Expanding our structural hedge
22
Key initiatives
• Acceleration of abrdn JV/Wealth opportunity
• Build out of Business fee-earning services
• Personal unsecured expansion and growth
• Launch digital wallet with integrated payments & loyalty
Further opportunities to drive incremental other income
6 6(3)
5
4628
2629
39
3736
40
7
46
4
1
11
16
16
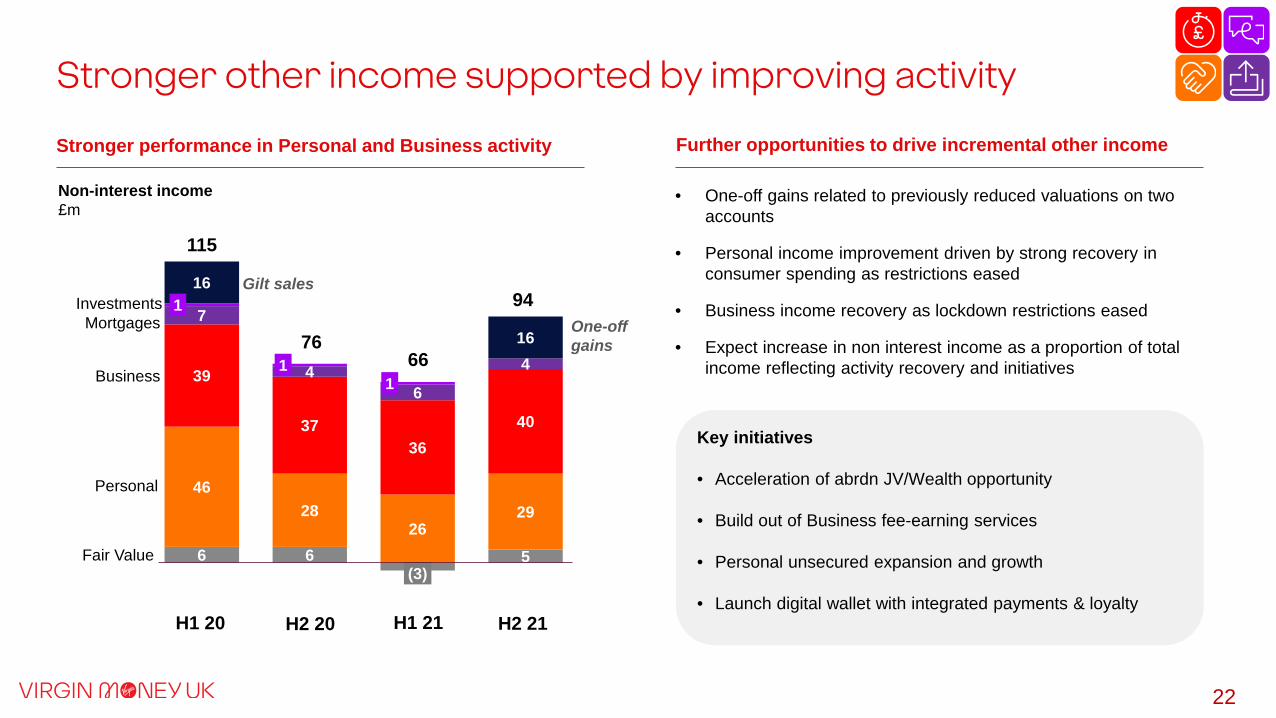
Stronger performance in Personal and Business activity
Non-interest income£m
• One-off gains related to previously reduced valuations on two accounts
• Personal income improvement driven by strong recovery in consumer spending as restrictions eased
• Business income recovery as lockdown restrictions eased
• Expect increase in non interest income as a proportion of total income reflecting activity recovery and initiatives
H1 20
66
Mortgages
Business
Personal
Investments
Fair Value
H2 21
One-off gains
H1 21H2 20
76
115
Gilt sales94
Stronger other income supported by improving activity
23
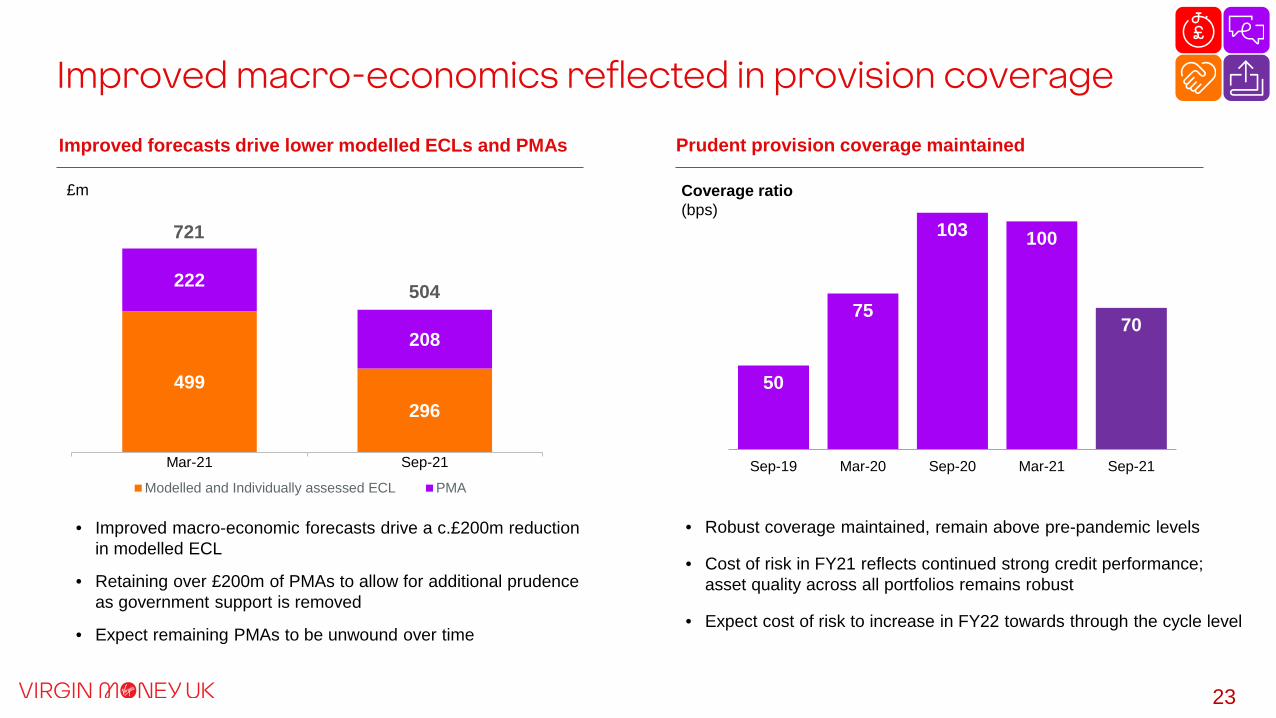
Prudent provision coverage maintainedImproved forecasts drive lower modelled ECLs and PMAs
Improved macro-economics reflected in provision coverage
• Robust coverage maintained, remain above pre-pandemic levels
• Cost of risk in FY21 reflects continued strong credit performance; asset quality across all portfolios remains robust
• Expect cost of risk to increase in FY22 towards through the cycle level
• Improved macro-economic forecasts drive a c.£200m reduction in modelled ECL
• Retaining over £200m of PMAs to allow for additional prudence as government support is removed
• Expect remaining PMAs to be unwound over time
50
75
103 100
70
Sep-19 Mar-20 Sep-20 Mar-21 Sep-21
£m Coverage ratio (bps)
499296
222
208
Mar-21 Sep-21
Modelled and Individually assessed ECL PMA
721
504
24
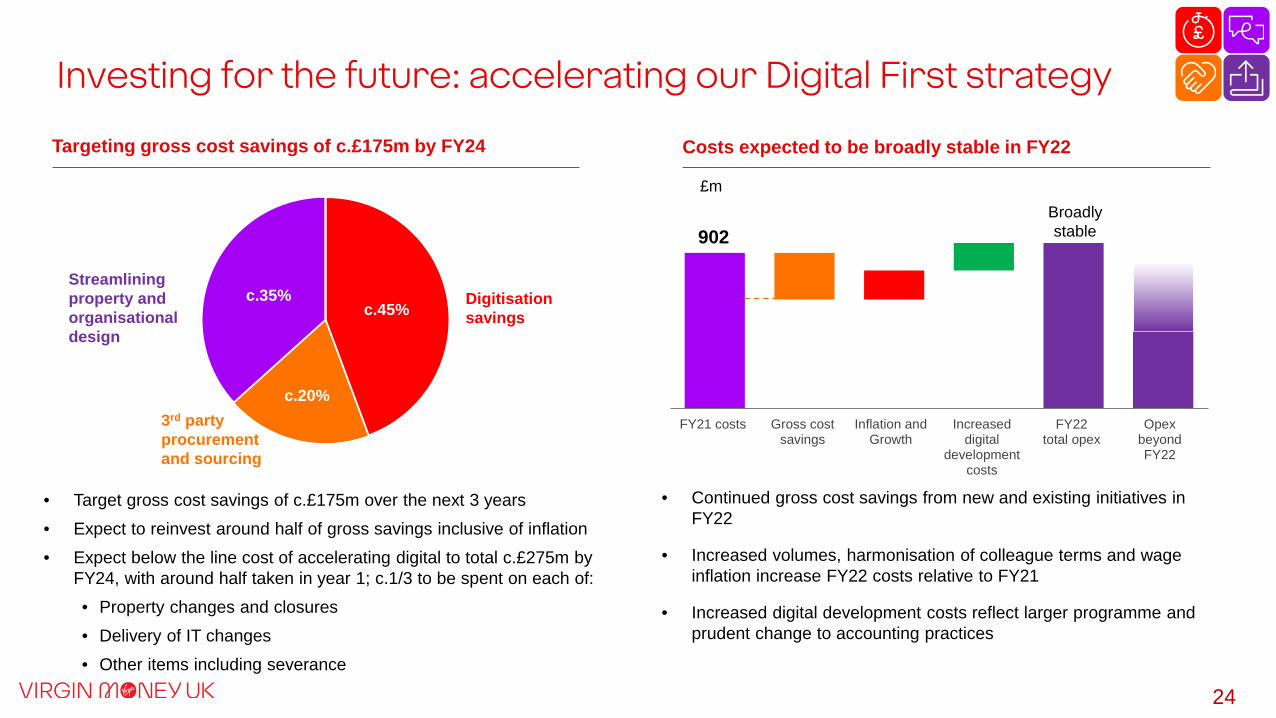
Targeting gross cost savings of c.£175m by FY24
Investing for the future: accelerating our Digital First strategy
• Continued gross cost savings from new and existing initiatives in FY22
• Increased volumes, harmonisation of colleague terms and wage inflation increase FY22 costs relative to FY21
• Increased digital development costs reflect larger programme and prudent change to accounting practices
FY21 costs Gross costsavings
Inflation andGrowth
Increaseddigital
developmentcosts
FY22total opex
OpexbeyondFY22
902
£m
Costs expected to be broadly stable in FY22
Broadly stable
c.45%
c.20%
c.35%Streamlining property and organisational design
Digitisation savings
3rd party procurement and sourcing
• Target gross cost savings of c.£175m over the next 3 years• Expect to reinvest around half of gross savings inclusive of inflation• Expect below the line cost of accelerating digital to total c.£275m by
FY24, with around half taken in year 1; c.1/3 to be spent on each of:• Property changes and closures• Delivery of IT changes• Other items including severance
25
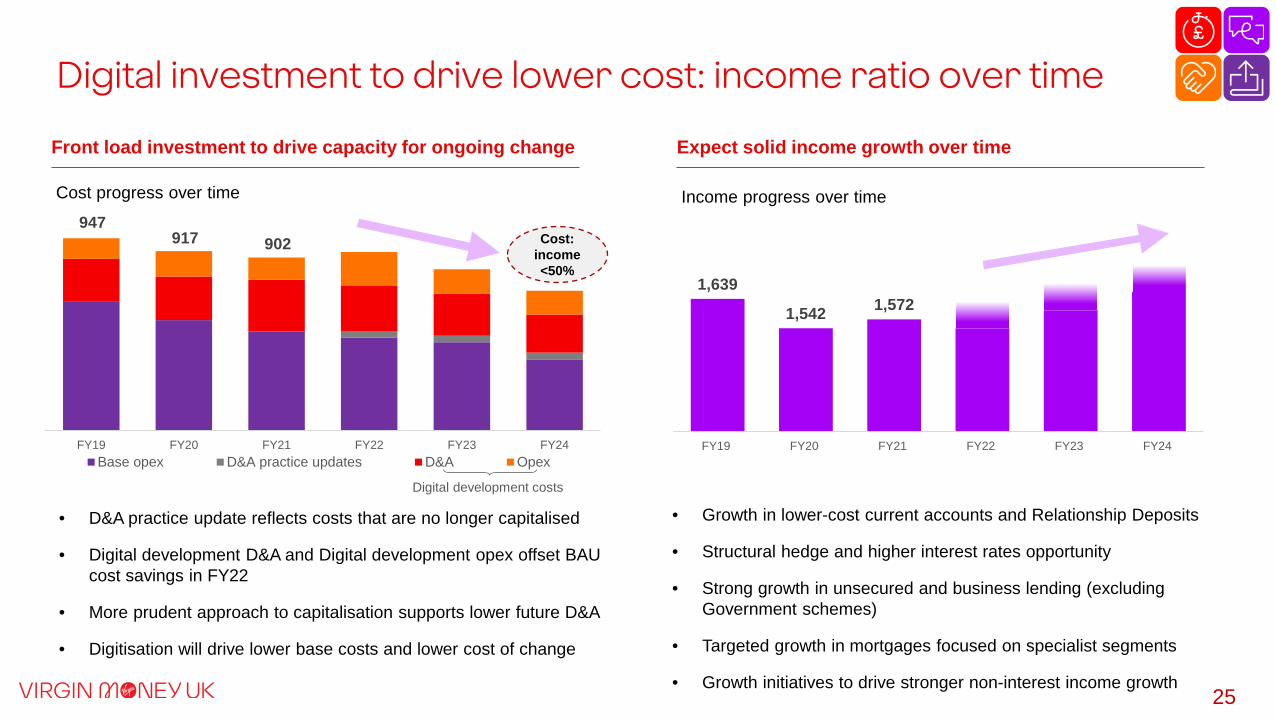
947917 902
FY19 FY20 FY21 FY22 FY23 FY24Base opex D&A practice updates D&A Opex
• Growth in lower-cost current accounts and Relationship Deposits
• Structural hedge and higher interest rates opportunity
• Strong growth in unsecured and business lending (excluding Government schemes)
• Targeted growth in mortgages focused on specialist segments
• Growth initiatives to drive stronger non-interest income growth
Digital investment to drive lower cost: income ratio over time
Front load investment to drive capacity for ongoing change
Cost progress over time
Expect solid income growth over time
Cost: income <50%
1,639
1,542 1,572
FY19 FY20 FY21 FY22 FY23 FY24
Income progress over time
• D&A practice update reflects costs that are no longer capitalised
• Digital development D&A and Digital development opex offset BAU cost savings in FY22
• More prudent approach to capitalisation supports lower future D&A
• Digitisation will drive lower base costs and lower cost of change
Digital development costs

26
216
(44)(24)
(29) (6) (11)53
19 (23)
Sep-20 Underlyingprofit
RWAs AT1distributions
Integration andtransformation
costs
Acquisitionaccounting
unwind
Conduct Expecteddividend
Other Impact of CRRsoftware
intangible assetrelief
Sep-21 CRD IVMinimum
13.4%
Improved capital generation
CET1 ratio evolution (bps)
Underlying capital generation 212bps
14.9%
20.2% Total capital ratio 22.0% 4.9% UK leverage ratio 5.2%28.4% MREL ratio 31.9%
CET1 Management
Buffer c.£1.4bn3
1 Includes final pension scheme payment – c.15bps headwind2 CET1 ratio excluding the benefit from the change in treatment of software intangible assets in the period3 IFRS 9 transitional basis; CRDIV minimum of 9.2% as at Sept-21, CET1 Pillar 2A requirement reduced 50bps in October to give updated CRDIV minimum of 8.7%
14.4%ex-software2
1
27
FY22 outlook
NIM
Costs
FY22 NIM expected to be c.170bps
Underlying costs expected to be broadly stable in FY22
Medium-term outlook confirmed
Medium-term outlook
DividendSST outcome and impairment outlook key inputs to capital framework and dividend policy
Expect to deliver a statutory double digit return in FY24RoTE
Cost: Income ratio to be <50%Costs
Mix-driven NIM expansion; OOI to rise as proportion of incomeIncome
Growth Above market growth in Business & Unsecured; maintain mortgage share
Restructuring costs
Expect c.£275m across FY22-FY24, with around half in FY22
Cost of risk Expect cost of risk to rise towards through the cycle range
Gross cost savings of c.£175m by FY24; c.50% to be reinvested, including offsetting inflation
Gross savings
Conclusion
Chief Executive OfficerDAVID DUFFY
29
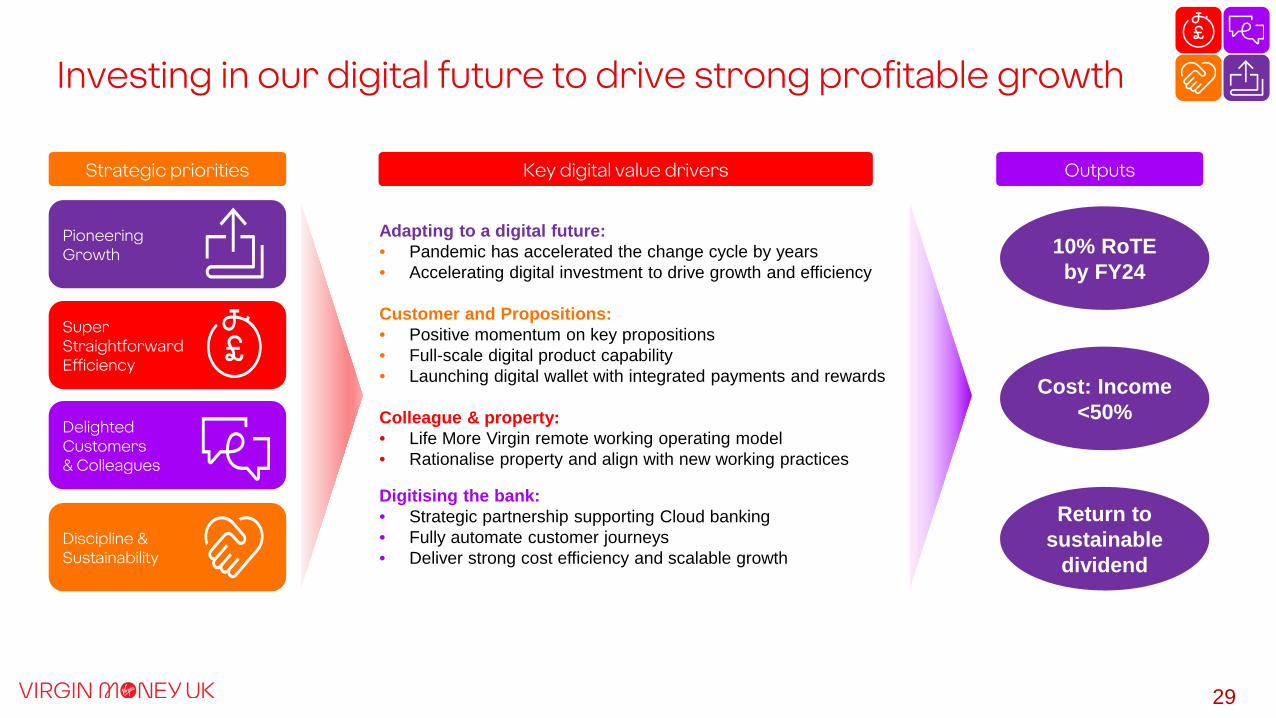
10% RoTEby FY24
Cost: Income <50%
Return to sustainable
dividend
Adapting to a digital future:• Pandemic has accelerated the change cycle by years• Accelerating digital investment to drive growth and efficiency
Customer and Propositions:• Positive momentum on key propositions • Full-scale digital product capability • Launching digital wallet with integrated payments and rewards
Colleague & property:• Life More Virgin remote working operating model• Rationalise property and align with new working practices
Digitising the bank:• Strategic partnership supporting Cloud banking• Fully automate customer journeys • Deliver strong cost efficiency and scalable growth
PioneeringGrowth
Super Straightforward Efficiency
Delighted Customers & Colleagues
Discipline & Sustainability
Key digital value drivers OutputsStrategic priorities
Investing in our digital future to drive strong profitable growth

Q&A
Chief Executive OfficerDAVID DUFFY
Chief Financial Officer
CLIFFORD ABRAHAMS

31
Amil Nathwani
Senior Manager, Investor Relations
m: +44 7702 100 398
Investor Relations Contacts
Richard Smith
Head of Investor Relations
m: +44 7483 399 303
Martin Pollard
Senior Manager, Investor Relations
m: +44 7894 814 195
Gareth McCrorie
Manager, Investor Relations
m: +44 7483 918 836

Appendix
32
33
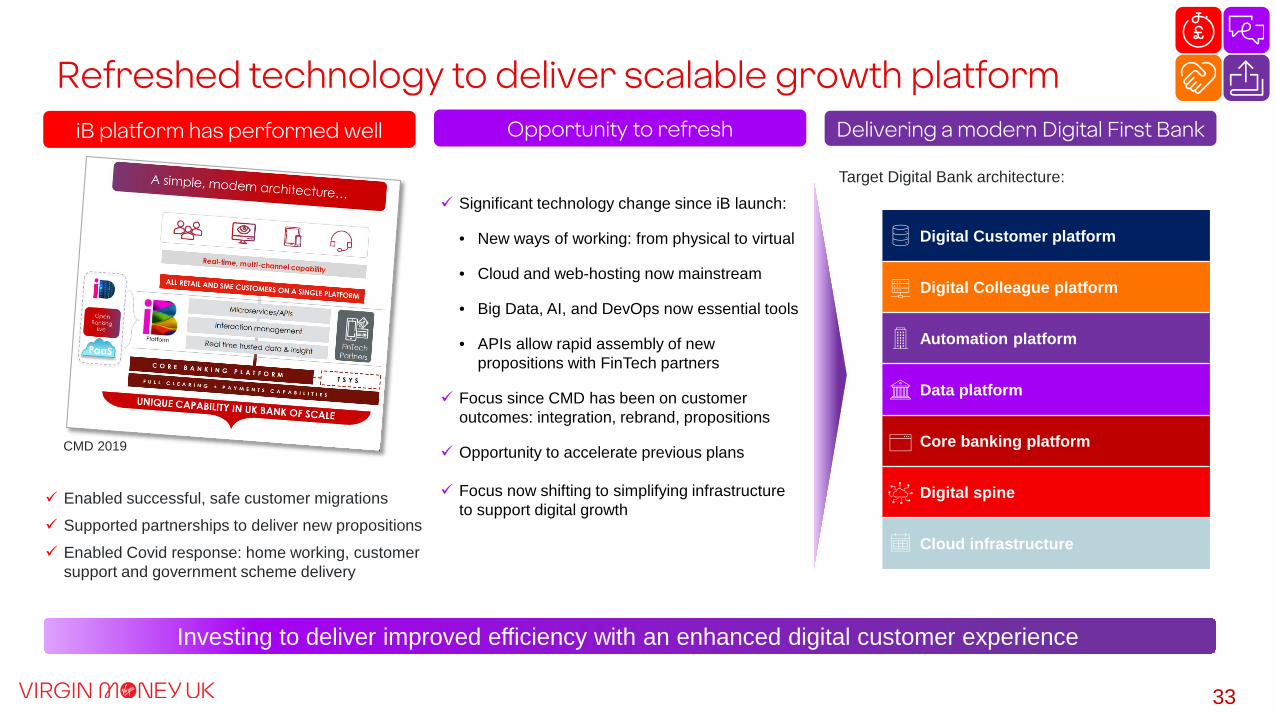
Refreshed technology to deliver scalable growth platformDelivering a modern Digital First BankiB platform has performed well
Investing to deliver improved efficiency with an enhanced digital customer experience
Digital Customer platform
Digital Colleague platform
Automation platform
Data platform
Core banking platform
Digital spine
Cloud infrastructure
Opportunity to refresh
Enabled successful, safe customer migrations Supported partnerships to deliver new propositions Enabled Covid response: home working, customer
support and government scheme delivery
CMD 2019
Significant technology change since iB launch:
• New ways of working: from physical to virtual
• Cloud and web-hosting now mainstream
• Big Data, AI, and DevOps now essential tools
• APIs allow rapid assembly of new propositions with FinTech partners
Focus since CMD has been on customer outcomes: integration, rebrand, propositions
Opportunity to accelerate previous plans
Focus now shifting to simplifying infrastructure to support digital growth
Target Digital Bank architecture:
34
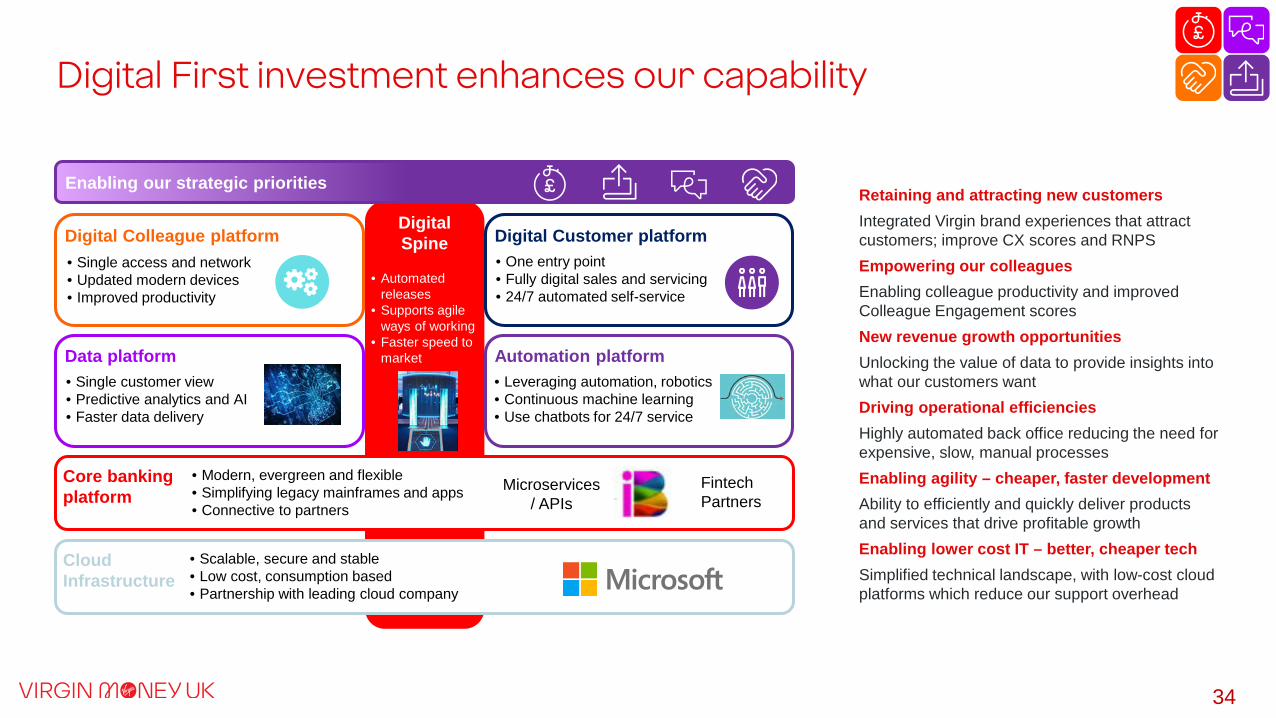
Digital First investment enhances our capability
Digital Spine Digital Customer platformDigital Colleague platform
Data platform Automation platform
Core banking platform
• One entry point• Fully digital sales and servicing• 24/7 automated self-service
• Single customer view• Predictive analytics and AI• Faster data delivery
• Leveraging automation, robotics• Continuous machine learning• Use chatbots for 24/7 service
• Modern, evergreen and flexible• Simplifying legacy mainframes and apps• Connective to partners
• Automated releases
• Supports agile ways of working
• Faster speed to market
• Single access and network• Updated modern devices• Improved productivity
Enabling our strategic prioritiesRetaining and attracting new customersIntegrated Virgin brand experiences that attract customers; improve CX scores and RNPSEmpowering our colleaguesEnabling colleague productivity and improved Colleague Engagement scoresNew revenue growth opportunitiesUnlocking the value of data to provide insights intowhat our customers wantDriving operational efficiencies Highly automated back office reducing the need for expensive, slow, manual processes Enabling agility – cheaper, faster developmentAbility to efficiently and quickly deliver products and services that drive profitable growthEnabling lower cost IT – better, cheaper techSimplified technical landscape, with low-cost cloud platforms which reduce our support overhead
Cloud Infrastructure
• Scalable, secure and stable• Low cost, consumption based• Partnership with leading cloud company
Fintech Partners
Microservices / APIs
35
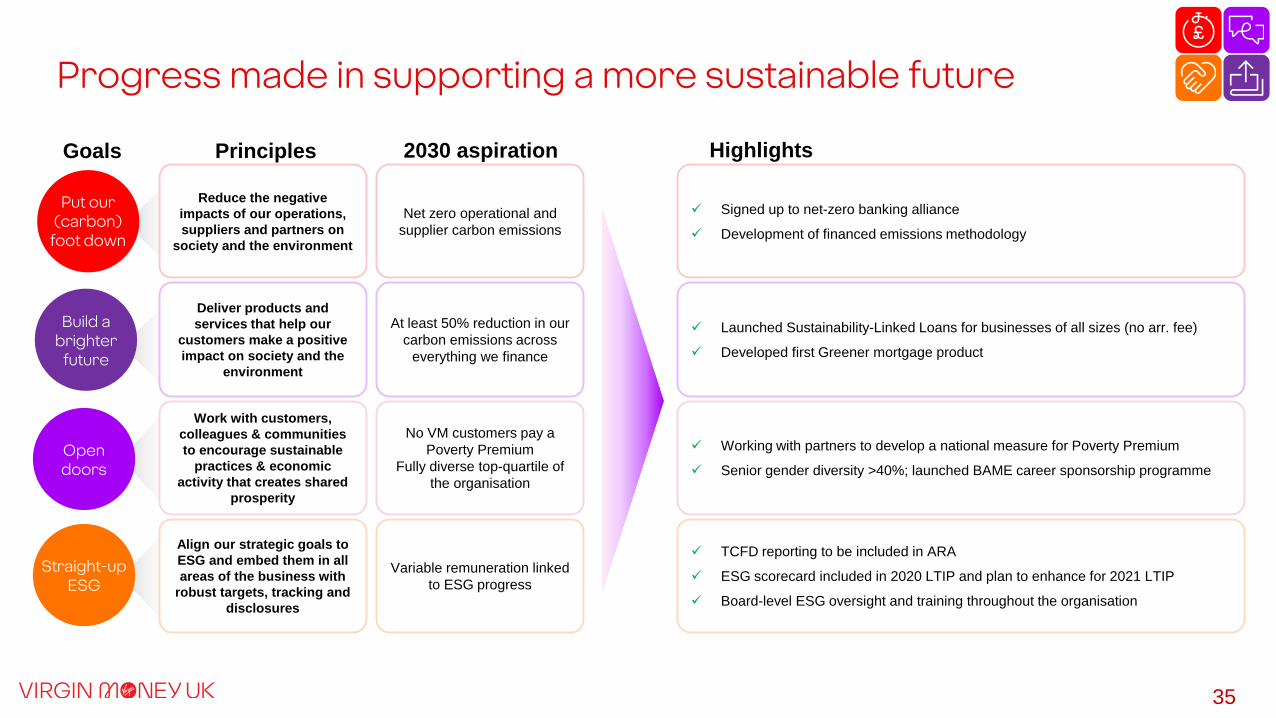
Deliver products and services that help our
customers make a positive impact on society and the
environment
Build a brighter
future
Put our (carbon)
foot down
Reduce the negative impacts of our operations, suppliers and partners on
society and the environment
Open doors
Work with customers, colleagues & communities to encourage sustainable
practices & economic activity that creates shared
prosperity
Align our strategic goals to ESG and embed them in all areas of the business with
robust targets, tracking and disclosures
Build a brighter
future
Straight-up ESG
PrinciplesGoals Highlights
At least 50% reduction in our carbon emissions across
everything we finance
Net zero operational and supplier carbon emissions
No VM customers pay a Poverty Premium
Fully diverse top-quartile of the organisation
Variable remuneration linked to ESG progress
2030 aspiration
Launched Sustainability-Linked Loans for businesses of all sizes (no arr. fee)
Developed first Greener mortgage product
Signed up to net-zero banking alliance
Development of financed emissions methodology
Working with partners to develop a national measure for Poverty Premium
Senior gender diversity >40%; launched BAME career sponsorship programme
TCFD reporting to be included in ARA
ESG scorecard included in 2020 LTIP and plan to enhance for 2021 LTIP
Board-level ESG oversight and training throughout the organisation
Progress made in supporting a more sustainable future
3603/11/2021Title here
DisclaimerForward looking statements The information in this document may include forward looking statements, which are based on assumptions, expectations, valuations, targets, estimates, forecasts and projections about future events. These can be identified by the use of words such as 'expects', 'aims', 'targets', 'seeks', 'anticipates', 'plans', 'intends', 'prospects', 'outlooks', 'projects', ‘forecasts’ 'believes', 'estimates', 'potential', 'possible', and similar words or phrases. These forward looking statements, as well as those included in any other material discussed at any presentation, are subject to risks, uncertainties and assumptions about the Group and its securities, investments, and the environment in which it operates, including, among other things, the development of its business and strategy, any acquisitions, combinations, disposals or other corporate activity undertaken by the Group (including but not limited to the integration of the business of Virgin Money Holdings (UK) plc and its subsidiaries into the Group), trends in its operating industry, changes to customer behaviours and covenant, macroeconomic and/or geopolitical factors, the repercussions of the outbreak of coronaviruses (including but not limited to the COVID-19 outbreak), changes to its board and/ or employee composition, exposures to terrorist activity, IT system failures, cyber-crime, fraud and pension scheme liabilities, changes to law and/or the policies and practices of the Bank of England, the FCA and/or other regulatory and governmental bodies, inflation, deflation, interest rates, exchange rates, changes in the liquidity, capital, funding and/or asset position and/or credit ratings of the Group, future capital expenditures and acquisitions, the repercussions of the UK’s exit from the EU (including any change to the UK’s currency and the terms of any trade agreements (or lack thereof) between the UK and the EU), Eurozone instability, and any referendum on Scottish independence.
In light of these risks, uncertainties and assumptions, the events in the forward looking statements may not occur. Forward looking statements involve inherent risks and uncertainties. Other events not taken into account may occur and may significantly affect the analysis of the forward looking statements. No member of the Group or their respective directors, officers, employees, agents, advisers or affiliates gives any assurance that any such projections or estimates will be realised or that actual returns or other results will not be materially lower than those set out in this document and/ or discussed at any presentation. All forward looking statements should be viewed as hypothetical. No representation or warranty is made that any forward looking statement will come to pass. No member of the Group or their respective directors, officers, employees, agents, advisers or affiliates undertakes any obligation to update or revise any such forward looking statement following the publication of this document nor accepts any responsibility, liability or duty of care whatsoever for (whether in contract, tort or otherwise) or makes any representation or warranty, express or implied, as to the truth, fullness, fairness, merchantability, accuracy, sufficiency or completeness of the information in this document or the materials used in and/ or discussed at, any presentation.
Certain industry, market and competitive position data contained in this document and the materials used in and/ or discussed at, any presentation, comes from official or third party sources. There is no guarantee of the accuracy or completeness of such data. While the Group reasonably believes that each of these publications, studies and surveys has been prepared by a reputable source, no member of the Group or their respective directors, officers, employees, agents, advisers or affiliates have independently verified the data. In addition, certain of the industry, market and competitive position data contained in this document and the materials used in and/ or discussed at, any presentation, comes from the Group’s own internal research and estimates based on the knowledge and experience of the Group’s management in the markets in which the Group operates. While the Group reasonably believes that such research and estimates are reasonable and reliable, they, and their underlying methodology and assumptions, have not been verified by any independent source for accuracy or completeness, and are subject to change. Accordingly, undue reliance should not be placed on any of the industry, market or competitive position data contained in this document and the materials used in and/ or discussed at, any presentation.
The information, statements and opinions contained in this document do not constitute or form part of, and should not be construed as, any public offer under any applicable legislation or an offer to sell or solicitation of any offer to buy any securities or financial instruments or any advice or recommendation with respect to such securities or other financial instruments. The distribution of this document in certain jurisdictions may be restricted by law. Recipients are required by the Group to inform themselves about and to observe any such restrictions. No liability to any person is accepted in relation to the distribution or possession of this document in any jurisdiction. The information, statements and opinions contained in this document and the materials used in and/ or discussed at, any presentation are subject to change.
Certain figures contained in this document, including financial information, may have been subject to rounding adjustments and foreign exchange conversions. Accordingly, in certain instances, the sum or percentage change of the numbers contained in this document may not conform exactly to the total figure given.

Full Year 2021Trading Update


![[ 'Pearson 2017 Q1 Trading Update' ]](https://img.pdfslide.net/doc/110x75/6169ec4111a7b741a34cdcbc/-pearson-2017-q1-trading-update-.jpg)