Embed Size (px)
Citation preview

Full Year Results 11 May, 2016

C&C Group plc | Slide 2 C&C Group plc | Slide 2
This presentation has been prepared solely in connection with the financial results of C&C Group plc (the "Company") for the period ended 29 February, 2016 and should be read in conjunction with the announcement of the financial results of the Company for the period ended 29 February, 2016, released 11 May, 2016 (the “2016 Full Year Results Announcement”). For the purposes of this notice, the presentation that follows shall mean and include the slides that follow, the oral presentation of the slides by the Company, the question-and-answer session that follows that oral presentation, hard and electronic copies of this document and any materials distributed at, or in connection with, that presentation. This presentation is not intended to and does not constitute or form part of any offer, or invitation, or solicitation of any offer to issue, underwrite, subscribe for, or otherwise acquire or dispose of any shares or other securities of the Company in any jurisdiction or an inducement to enter into investment activity. No part of this presentation, nor the fact of its distribution, should form the basis of, or be relied on in connection with, any contract or commitment or investment decision whatsoever. The presentation contains forward-looking statements, including statements about the Company's intentions, beliefs and expectations. These statements are based on the Company's current plans, estimates and projections, as well as the Company's expectations of external conditions and events. Forward-looking statements involve inherent risks and uncertainties, are based on certain assumptions and speak only as of the date they are made. The Company undertakes no duty to and will not necessarily update any such statements in light of new information or future events, except to the extent required by any applicable law or regulation. Recipients of this presentation are therefore cautioned that a number of important factors could cause actual results or outcomes to differ materially from those expressed in any forward-looking statements. Past performance is no guide to future performance and persons needing advice should consult an independent financial adviser. Your attention is drawn to the ‘Principal Risks and Uncertainties’ set out on pages 16 and 17 of the Company’s 2016 Full Year Results Announcement. The risks described, however, are not exhaustive and there may be other risks which may have an adverse effect on the business, financial condition, results or future prospects of the Company. Bulmers Ltd of Clonmel, Ireland, a company within the C&C Group, owns the trade mark BULMERS® in the Republic of Ireland. Bulmers Ltd is not connected with HP Bulmer Ltd of Hereford, UK. BULMERS ® Original Vintage Cider produced by Bulmers Ltd of Clonmel, Ireland is sold outside the Republic of Ireland under the name MAGNERS® Original Irish Cider. For further information see www.candcgroupplc.com
Disclaimer

C&C Group plc | Slide 3 C&C Group plc | Slide 3
FY2016 Overview
€103 million Operating Profit
Down 10.3%
€663 million Net Revenue
Down 3.1%
1.33x Net Debt to EBITDA
Strong balance sheet and flexibility
€126.4 million Free cash flow (Pre exceptionals)
103% Conversion of EBITDA
€76.6 million Share Buyback
€100 million to be complete by July ‘16
27% growth in final dividend to 8.92 cent
Full year dividend +18.7% to 13.65 cent

C&C Group plc | Slide 4 C&C Group plc | Slide 4
FY2016 Overview
Bulmers & Tennent’s brand strength
Short term challenges
Investment for the long term
Business stability
Speciality Brand Growth
Magners Original volume & share growth
Scaled up investment plans
Agreement with Pabst Brewing Company – long-term growth prospect
Cider & Beer: strong double-digit growth
Performing in all territories; new distribution agreements Export
Ireland
Scotland
C&C Brands
N. America

C&C Group plc | Slide 5 C&C Group plc | Slide 5
FY2016 Overview | Key P&L Items
€ million except per share measures FY2016 FY2015 Change
Operating profit (before exceptionals) 103.2 115.0 (10.3%)
Net finance costs (8.6) (8.8) (2.3%)
Income tax expense (before exceptionals) (13.8) (14.6) (5.5%)
Effective tax rate* 14.6% 13.7% +0.9ppts
Profit after tax (before exceptionals) 80.8 91.5 (11.7%)
Exceptionals (net of tax) 33.4 172.5 NM**
Profit after tax (post exceptionals) 47.4 (81.0) NM**
Adjusted diluted EPS 24.2 cent 27.2 cent (11.0%)
* Effective tax rate is calculated based on the profit before tax excluding the Group’s share of equity accounted investees’ (loss) after tax ** Not meaningful
115
+3.9
(10.3)
(4.8)
Flat +0.5
(1.1)
103.2
FY1
5
Cu
rre
ncy
Irel
and
Sco
tlan
d
C&
C B
ran
ds
Exp
ort
No
rth
Am
eri
ca
FY1
6
Operating profit Before exceptionals

C&C Group plc | Slide 6 C&C Group plc | Slide 6
FY2016 | Attractive Free Cash flow
103.2 +19.4
+50.1
(1.1)
(9.2) (5.7)
(10.2) (6.5)
(13.6)
126.4
(13.0)
113.4
80
100
120
140
160
180
OperatingProfit
Dep./Amort. WorkingCapital
TradeLending
CapEx &Disp.
Proceeds
FinanceCosts
TaxPaid
Pensions Other FCF beforeexceptionals
ExceptionalItems
FreeCashflow
103.1% EBITDA
92.5% EBITDA
• Capex below depreciation
• Working capital efficiency focus
• Risk management on pensions
• Conversion at 103% is 42 ppt improvement on prior year
€m

C&C Group plc | Slide 7 C&C Group plc | Slide 7
FY2016 | Strong Balance Sheet
(157.8)
+113.4
(34.8) (3.3)
(76.6)
+0.5
(4.4) (163.0)
(200.0)
(150.0)
(100.0)
(50.0)
0.0
Net debt - 1 Mar2015
Free cash flow Dividends paid Acquisitions Share Buyback Exercise of shareoptions
Other Net debt - 29 Feb2016
Net Debt to EBITDA
1.33x
• Capital return of €115m: dividend (€39m including scrip) and share buyback (€77m)
• Minimal change in net debt (ex currency)
• Flexibility and strength maintained
€m

C&C Group plc | Slide 8 C&C Group plc | Slide 8
FY2016 | Progressive & Attractive Dividend
4
6
8
10
12
14
FY 2010 FY 2011 FY 2012 FY 2013 FY 2014 FY 2015 FY 2016
+24%
+7%
+10%
+14%
+15%
+19%
€ cent
13.65 cent
• Proposed final dividend of 8.92 cent: +27% increase
• Full year dividend of 13.65 cent: +18.7% increase
• Progressive dividend policy +14% CAGR (5yr)
…..................confidence in earnings and cash generation

FY2016
SEGMENT
REVIEW
C&C Group plc | Slide 10 C&C Group plc | Slide 10
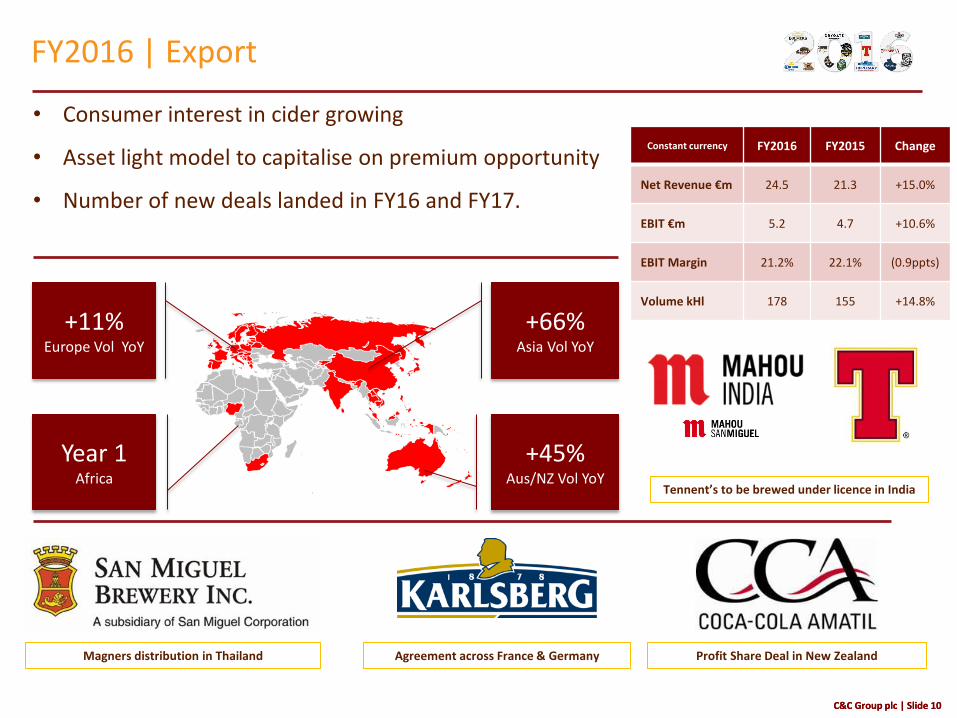
FY2016 | Export
Agreement across France & Germany Profit Share Deal in New Zealand Magners distribution in Thailand
+11% Europe Vol YoY
Year 1 Africa
+66% Asia Vol YoY
+45% Aus/NZ Vol YoY
Constant currency FY2016 FY2015 Change
Net Revenue €m 24.5 21.3 +15.0%
EBIT €m 5.2 4.7 +10.6%
EBIT Margin 21.2% 22.1% (0.9ppts)
Volume kHl 178 155 +14.8%
• Consumer interest in cider growing
• Asset light model to capitalise on premium opportunity
• Number of new deals landed in FY16 and FY17.
Tennent’s to be brewed under licence in India

C&C Group plc | Slide 11 C&C Group plc | Slide 11
FY2016 | Ireland
Review
• LAD category modest volume growth
• Consumer shift to ‘premium’ umbrella
• Changing competitor dynamics
• Weather impact
• Brand investment increased
Looking Ahead
• Focussed investment in Bulmers
• Build from rate of sale advantage
• Expansion in Premium portfolio
• Repeat successes: Corona 30%+ year 1
► Operating stability = better commercial focus
Constant currency FY2016 FY2015 Change
Net Revenue €m 261.6 292.2 (10.5%)
EBIT €m 49.0 59.3 (17.4%)
EBIT Margin 18.7% 20.3% (1.6ppts)
Volume kHl 1,711 1,824 (6.2%)

C&C Group plc | Slide 12 C&C Group plc | Slide 12
FY2016 | Scotland
Constant currency FY2016 FY2015 Change
Net Revenue €m 227.4 244.1 (6.8%)
EBIT €m 37.9 42.7 (11.2%)
EBIT Margin 16.7% 17.5% (0.8ppts)
Volume kHl 1,414 1,504 (6.0%)
Review
• Consumption impacted by legislation
• Tennent’s performed in line with market
• Brand health boost from digital media
• Drygate at volume capacity
Looking Ahead
• Combine ‘Push & Pull’ for Tennent’s
• Increased portfolio contribution from premium
Heverlee, Menabrea, Drygate
• Improve customer yield through service
► Operating stability = better commercial focus

C&C Group plc | Slide 13 C&C Group plc | Slide 13
FY2016 | C&C Brands
Constant currency FY2016 FY2015 Change
Net Revenue €m 103.8 116.8 (11.1%)
EBIT €m 10.5 10.5 Unch.
EBIT Margin 10.1% 9.0% +1.1ppts
Volume kHl 1,273 1,435 (11.3%)
Review
• Modest decline in cider category
• Retailer driven range rationalisation
• Increasing importance of authenticity
• Magners Original absolute and share growth
• Cost reductions delivered
• Business stabilised
Looking Ahead
• Draught recovery adding to Magners momentum
• Comprehensive, up-weighted Magners investment plan
• Growing portfolio; relevance of Premium
Pabst, Menabrea & specialist ciders
C&C Group plc | Slide 14 C&C Group plc | Slide 14
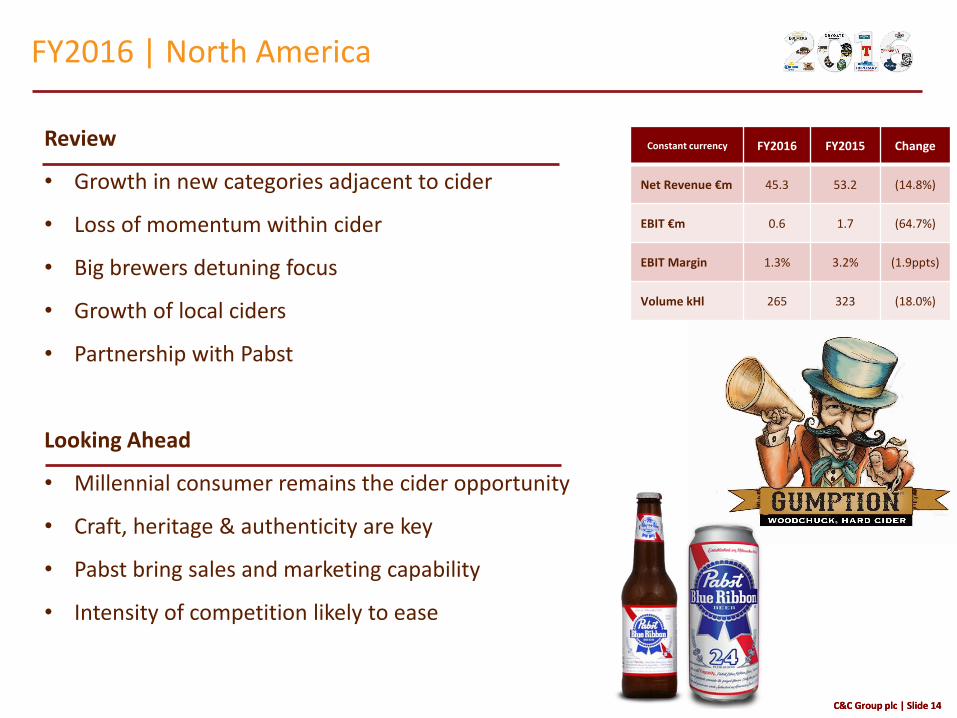
FY2016 | North America
Review
• Growth in new categories adjacent to cider
• Loss of momentum within cider
• Big brewers detuning focus
• Growth of local ciders
• Partnership with Pabst
Looking Ahead
• Millennial consumer remains the cider opportunity
• Craft, heritage & authenticity are key
• Pabst bring sales and marketing capability
• Intensity of competition likely to ease
Constant currency FY2016 FY2015 Change
Net Revenue €m 45.3 53.2 (14.8%)
EBIT €m 0.6 1.7 (64.7%)
EBIT Margin 1.3% 3.2% (1.9ppts)
Volume kHl 265 323 (18.0%)

OUTLOOK

C&C Group plc | Slide 16 C&C Group plc | Slide 16
Capital Allocation
Preference Capital Return
Already Committed 1 Proposed FY16 Final Dividend +27%
• FY16 dividend cover 1.8x • Confidence in earnings & cash
2 Share Buyback
• Complete €100m by July 2016
Absent the right Deal
1 FY17 Guidance • Progressive dividend • Return surplus cash
2 FY18 Guidance
• Dividend cover: 1.8x to 2x • Leverage: 2x Net Debt/EBITDA
Invest for Growth
Economics Stack
Right Strategically
Industry consolidation may present opportunity

C&C Group plc | Slide 17 C&C Group plc | Slide 17
FY2016 Summary
• Strength in core markets
• Magners Original growing domestically and in export
• ‘Craft’ effect creating premium opportunity
• Attractive brand export growth potential of C&C
• Agreement with Pabst Brewing Company – long-term growth prospect
• Cash & balance sheet stability and flexibility

Q&A