Embed Size (px)
Citation preview

FULL YEAR RESULTS 2019
6 February 2020

1
Certain information contained in this document, other than historical information, may constitute forward-looking
statements or unaudited financial forecasts. These forward-looking statements and forecasts are subject to risks and
uncertainties that could cause actual results to differ materially from those projected. These forward-looking statements and
forecasts are presented at the date of this document and, other than as required by applicable law, Publicis Groupe does not
assume any obligation to update them to reflect new information or events or for any other reason. Publicis Groupe urges
you to carefully consider the risk factors that may affect its business, as set out in the Registration Document filed with the
French Autorité des Marchés Financiers (AMF) and which is available on the website of Publicis Groupe
(www.publicisgroupe.com), including an unfavorable economic climate, an extremely competitive market sector, the
possibility that our clients could seek to terminate their contracts with us at short notice, the fact that a substantial part of
the Group’s revenue is derived from certain key clients, conflicts of interest between advertisers active in the same sector,
the Group’s dependence on its directors and employees, laws and regulations which apply to the Group’s business, legal
action brought against the Group based on allegations that certain of the Group’s commercials are deceptive or misleading,
the strategy of growing through acquisitions, the depreciation of goodwill and assets listed on the Group’s balance sheet,
the Group’s presence in emerging markets, exposure to liquidity risk, a drop in the Group’s credit rating and exposure to the
risks of financial markets.
DISCLAIMER
2
2019 FINANCIAL
RESULTS
2020PRIORITIES
& OUTLOOKQ&A
FULLYEAR 2019
HIGHLIGHTS
3
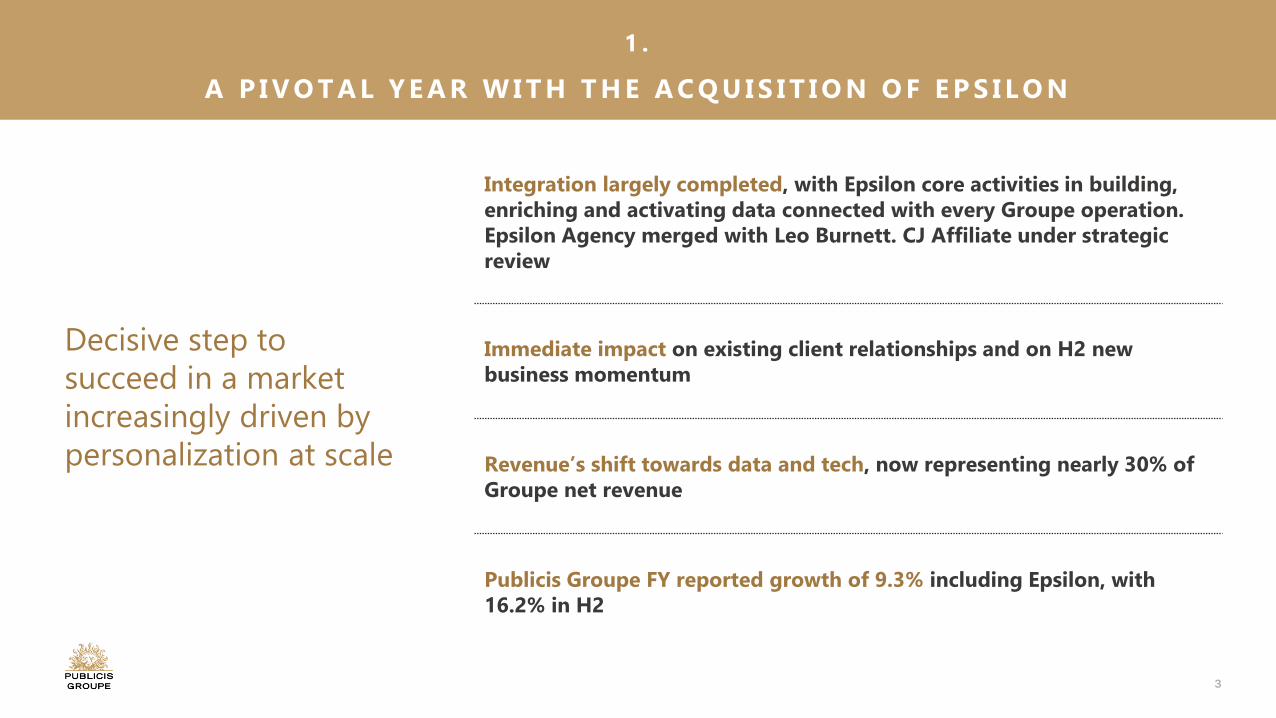
Decisive step to
succeed in a market
increasingly driven by
personalization at scale
1 .
A P I V O T A L Y E A R W I T H T H E A C Q U I S I T I O N O F E P S I L O N
Integration largely completed, with Epsilon core activities in building, enriching and activating data connected with every Groupe operation. Epsilon Agency merged with Leo Burnett. CJ Affiliate under strategic review
Immediate impact on existing client relationships and on H2 new business momentum
Revenue’s shift towards data and tech, now representing nearly 30% of Groupe net revenue
Publicis Groupe FY reported growth of 9.3% including Epsilon, with 16.2% in H2
4
2 .
O R G A N I C G R O W T H I M P A C T E D B Y W E L L - I D E N T I F I E D C H A L L E N G E S
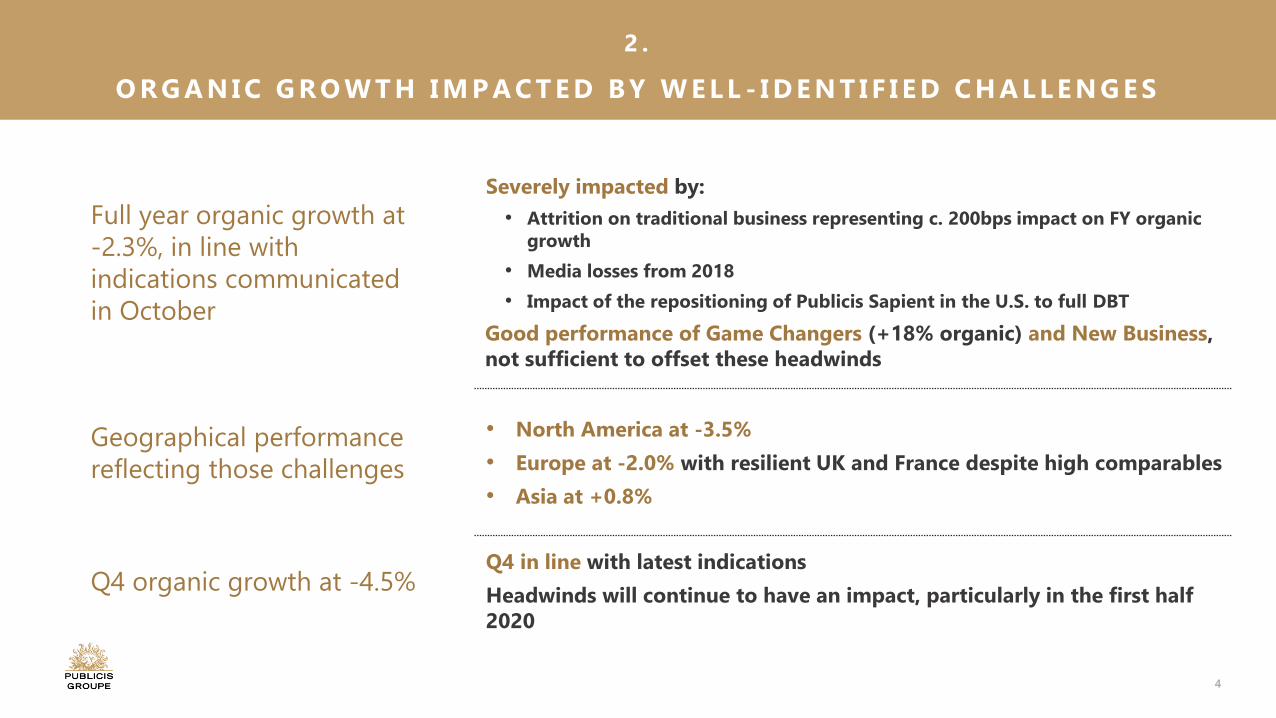
Severely impacted by:
• Attrition on traditional business representing c. 200bps impact on FY organic growth
• Media losses from 2018
• Impact of the repositioning of Publicis Sapient in the U.S. to full DBT
Good performance of Game Changers (+18% organic) and New Business, not sufficient to offset these headwinds
• North America at -3.5%
• Europe at -2.0% with resilient UK and France despite high comparables
• Asia at +0.8%
Q4 in line with latest indications
Headwinds will continue to have an impact, particularly in the first half 2020
Full year organic growth at
-2.3%, in line with
indications communicated
in October
Geographical performance
reflecting those challenges
Q4 organic growth at -4.5%
5
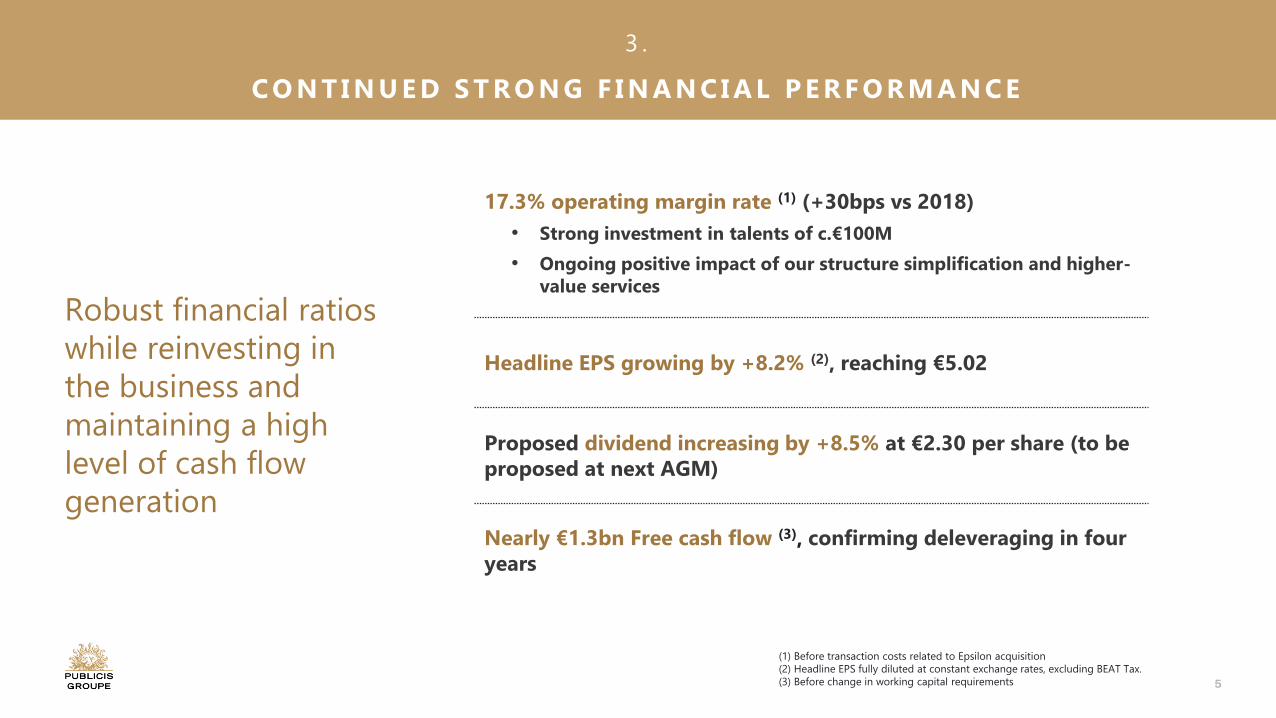
Robust financial ratios
while reinvesting in
the business and
maintaining a high
level of cash flow
generation
(1) Before transaction costs related to Epsilon acquisition
(2) Headline EPS fully diluted at constant exchange rates, excluding BEAT Tax.
(3) Before change in working capital requirements
3 .
C O N T I N U E D S T R O N G F I N A N C I A L P E R F O R M A N C E
17.3% operating margin rate (1) (+30bps vs 2018)
• Strong investment in talents of c.€100M
• Ongoing positive impact of our structure simplification and higher-value services
Headline EPS growing by +8.2% (2), reaching €5.02
Proposed dividend increasing by +8.5% at €2.30 per share (to be proposed at next AGM)
Nearly €1.3bn Free cash flow (3), confirming deleveraging in four years
6
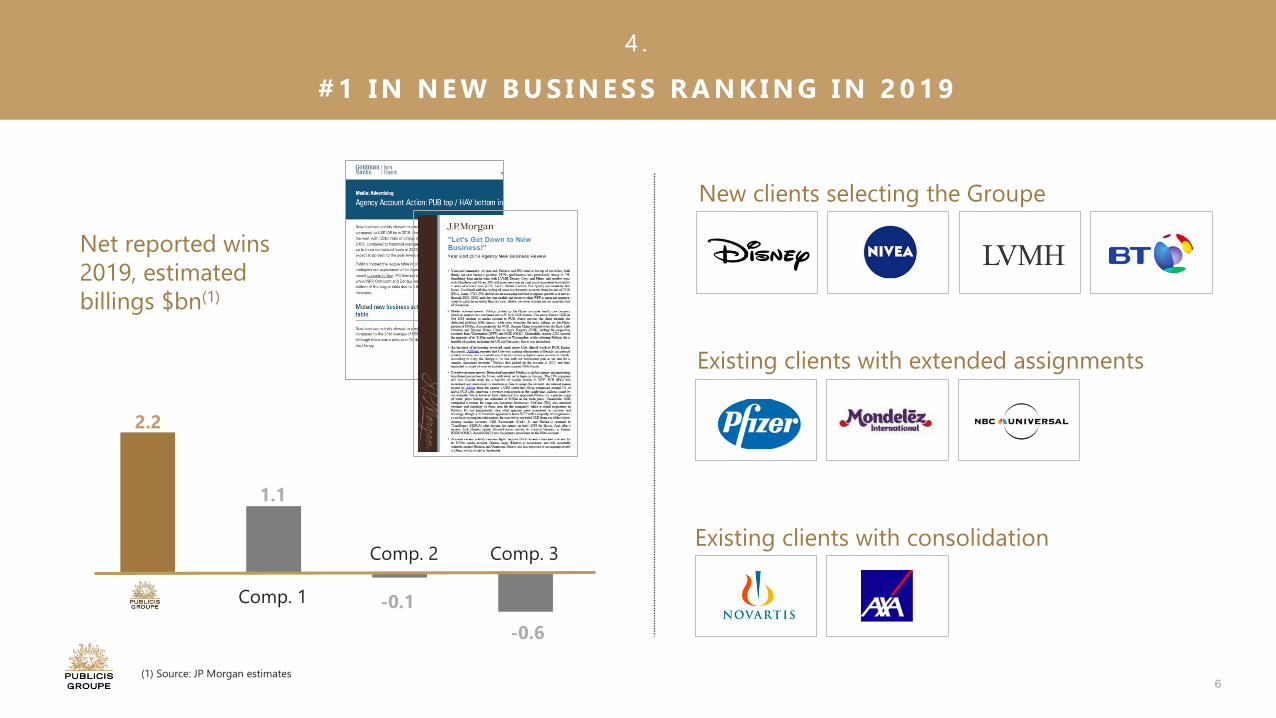
Net reported wins
2019, estimated
billings $bn(1)
2.2
1.1
-0.1Comp. 1
Comp. 2 Comp. 3
4 .
# 1 I N N E W B U S I N E S S R A N K I N G I N 2 0 1 9
New clients selecting the Groupe
Existing clients with extended assignments
Existing clients with consolidation
-0.6
(1) Source: JP Morgan estimates

7
2019 FINANCIAL
RESULTS
2020PRIORITIES
& OUTLOOKQ&A
FULLYEAR 2019
HIGHLIGHTS

8
(EUR million) Q1 Q2 Q3 Q4 FY
2019 net revenue 2,118 2,234 2,577 2,871 9,800
2018 net revenue 2,082 2,198 2,197 2,492 8,969
Reported growth +1.7% +1.6% +17.3% +15.2% +9.3%
Organic growth -1.8%(1) +0.1% -2.7% -4.5% -2.3%
(1) -1.6% Excluding PHS
NET REVENUE
9
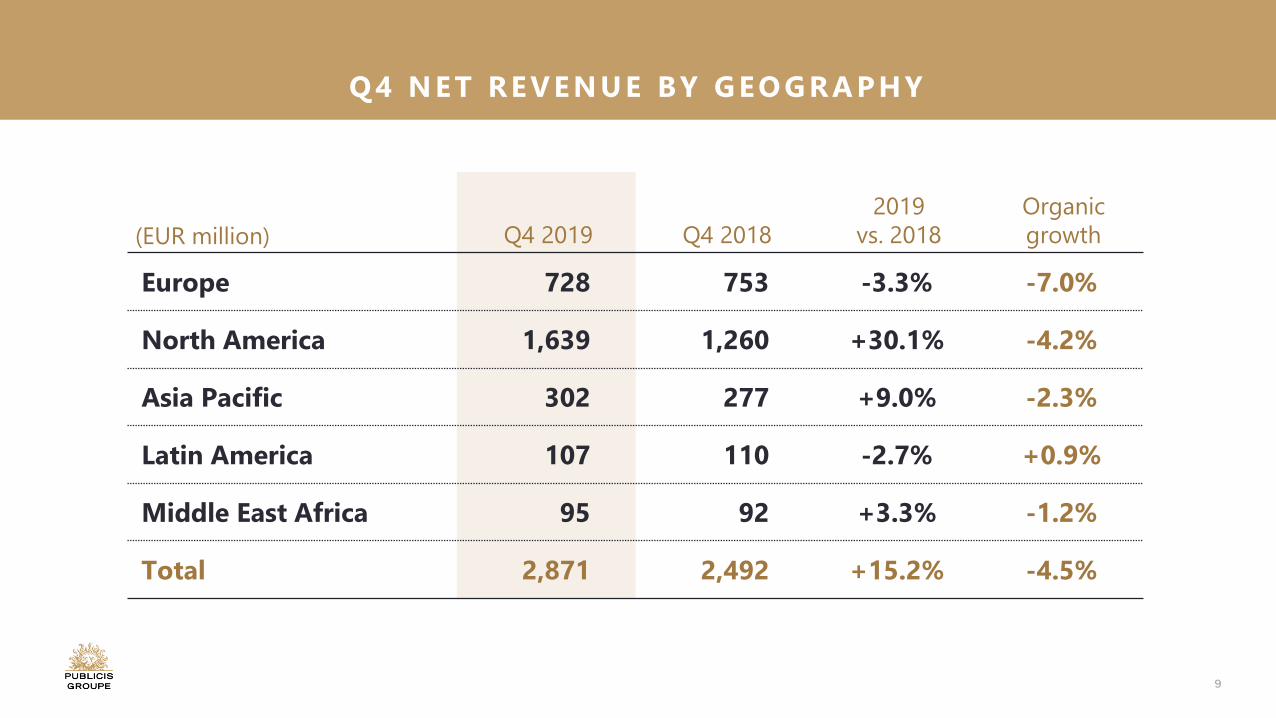
(EUR million) Q4 2019 Q4 2018
2019
vs. 2018
Organic
growth
Europe 728 753 -3.3% -7.0%
North America 1,639 1,260 +30.1% -4.2%
Asia Pacific 302 277 +9.0% -2.3%
Latin America 107 110 -2.7% +0.9%
Middle East Africa 95 92 +3.3% -1.2%
Total 2,871 2,492 +15.2% -4.5%
Q4 NET REVENUE BY GEOGRAPHY
10
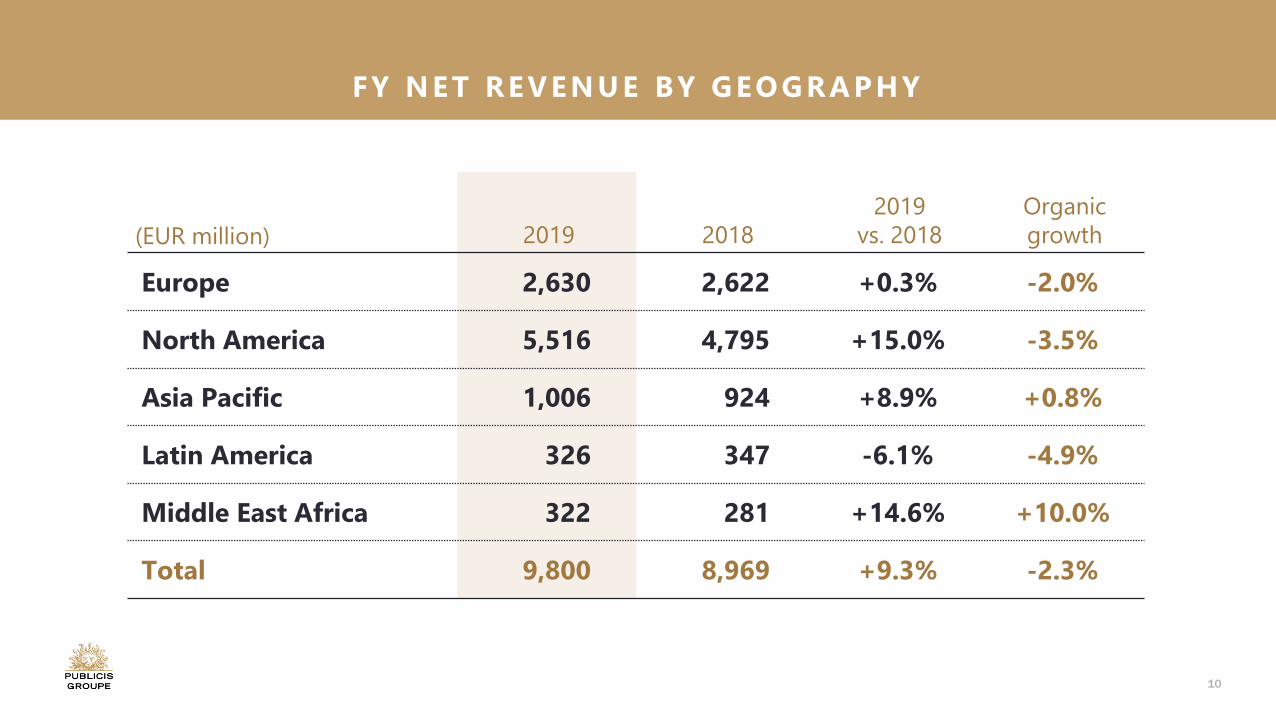
(EUR million) 2019 2018
2019
vs. 2018
Organic
growth
Europe 2,630 2,622 +0.3% -2.0%
North America 5,516 4,795 +15.0% -3.5%
Asia Pacific 1,006 924 +8.9% +0.8%
Latin America 326 347 -6.1% -4.9%
Middle East Africa 322 281 +14.6% +10.0%
Total 9,800 8,969 +9.3% -2.3%
FY NET REVENUE BY GEOGRAPHY
11
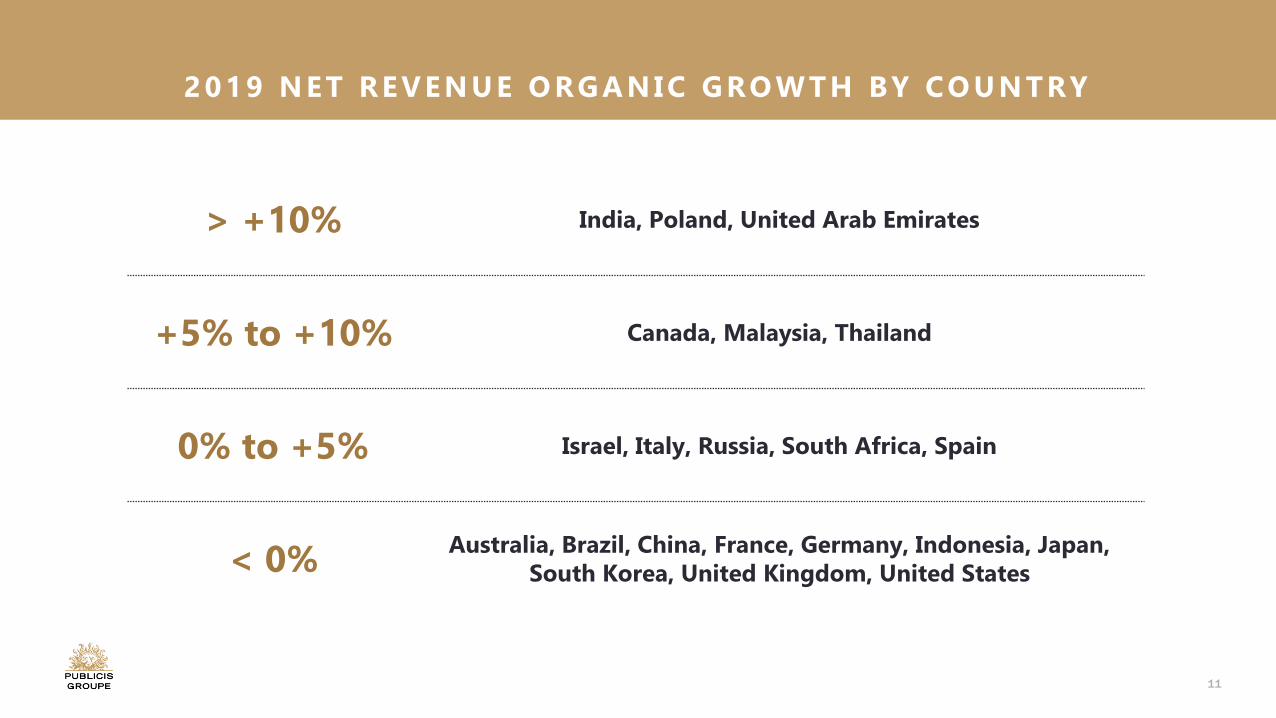
> +10% India, Poland, United Arab Emirates
+5% to +10% Canada, Malaysia, Thailand
0% to +5% Israel, Italy, Russia, South Africa, Spain
< 0%Australia, Brazil, China, France, Germany, Indonesia, Japan,
South Korea, United Kingdom, United States
2019 N ET REVEN UE ORGAN IC GROWTH BY COUN TRY
12
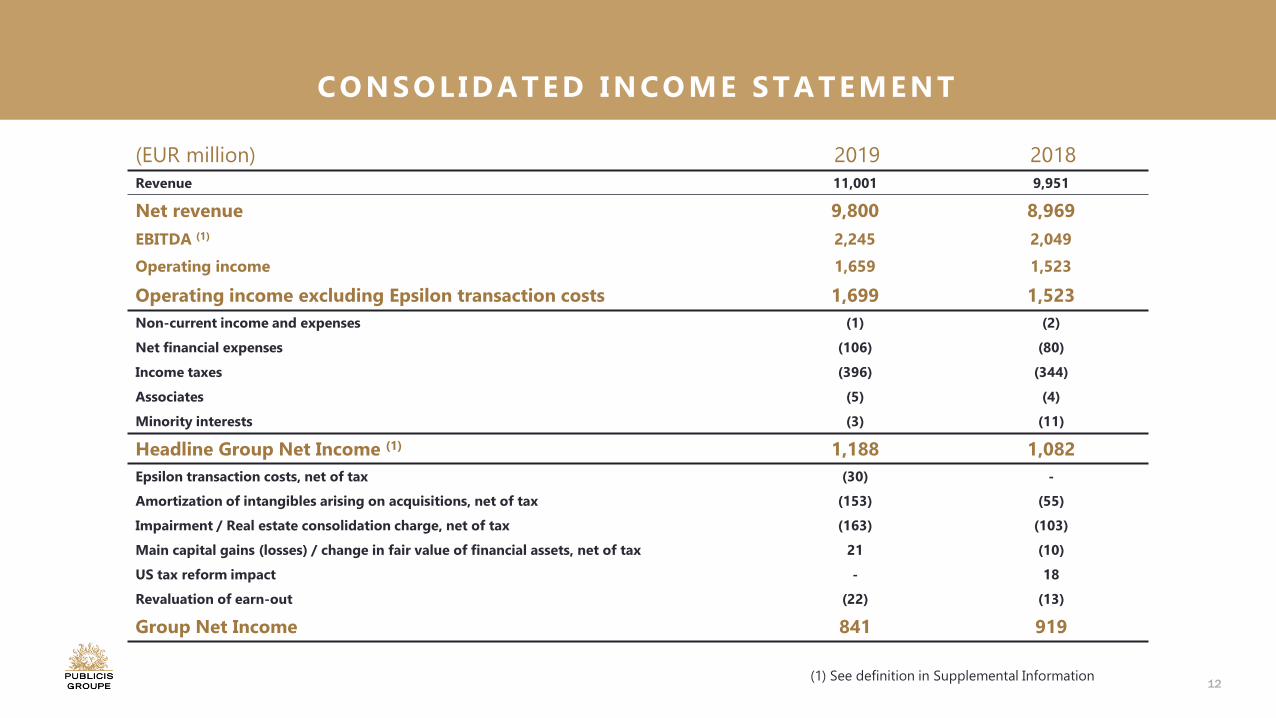
(EUR million) 2019 2018
Revenue 11,001 9,951
Net revenue 9,800 8,969
EBITDA (1) 2,245 2,049
Operating income 1,659 1,523
Operating income excluding Epsilon transaction costs 1,699 1,523
Non-current income and expenses (1) (2)
Net financial expenses (106) (80)
Income taxes (396) (344)
Associates (5) (4)
Minority interests (3) (11)
Headline Group Net Income (1) 1,188 1,082
Epsilon transaction costs, net of tax (30) -
Amortization of intangibles arising on acquisitions, net of tax (153) (55)
Impairment / Real estate consolidation charge, net of tax (163) (103)
Main capital gains (losses) / change in fair value of financial assets, net of tax 21 (10)
US tax reform impact - 18
Revaluation of earn-out (22) (13)
Group Net Income 841 919
(1) See definition in Supplemental Information
CONSOLIDATED INCOME STATEMENT
13
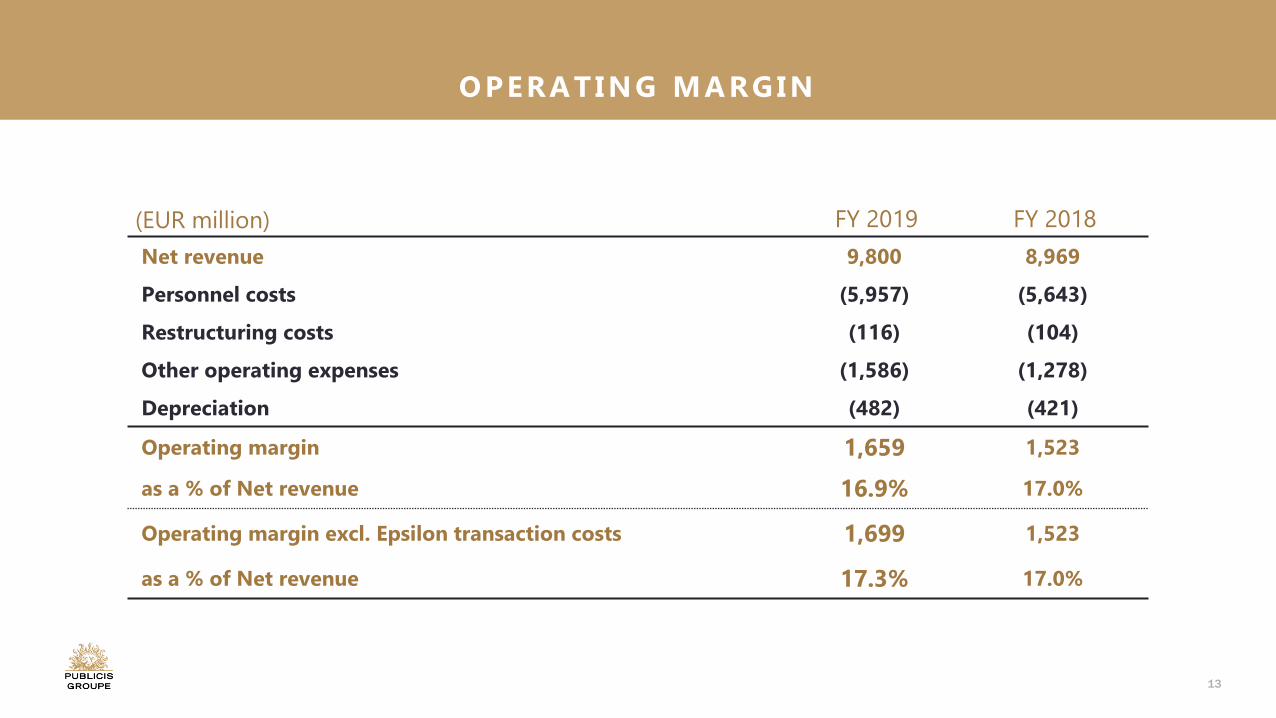
(EUR million) FY 2019 FY 2018
Net revenue 9,800 8,969
Personnel costs (5,957) (5,643)
Restructuring costs (116) (104)
Other operating expenses (1,586) (1,278)
Depreciation (482) (421)
Operating margin 1,659 1,523
as a % of Net revenue 16.9% 17.0%
Operating margin excl. Epsilon transaction costs 1,699 1,523
as a % of Net revenue 17.3% 17.0%
OPERATING MARGIN
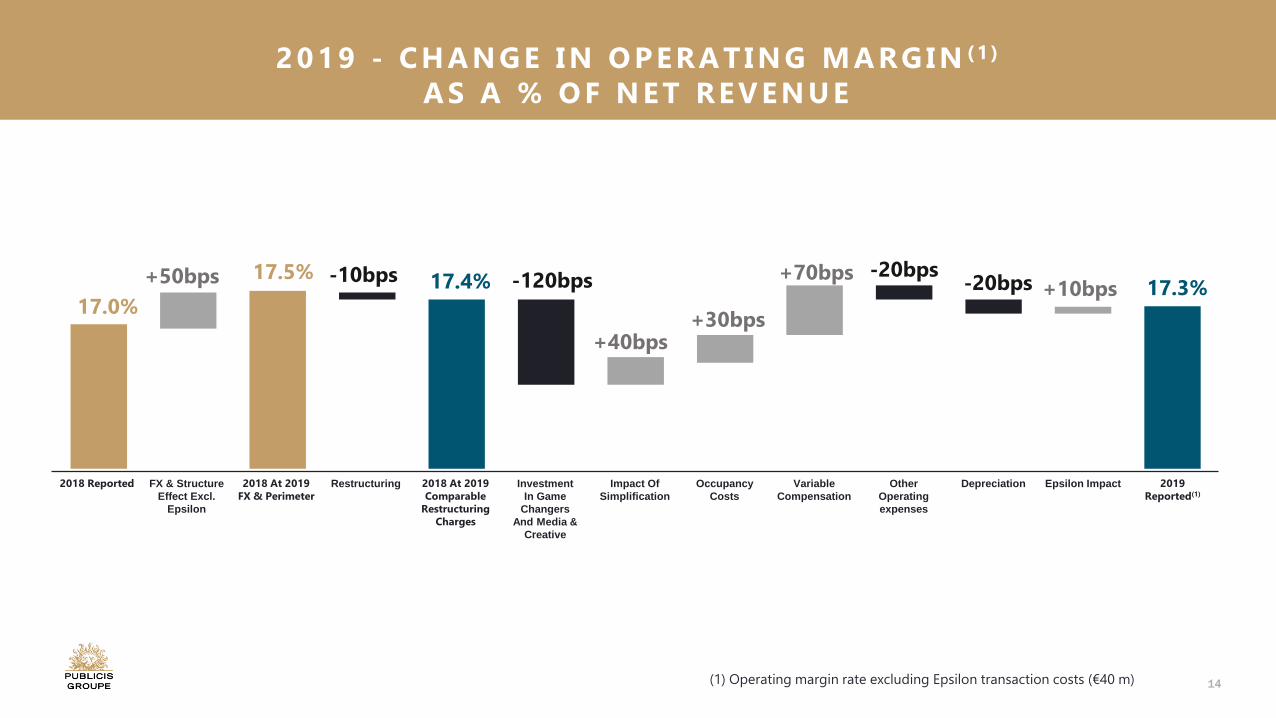
14(1) Operating margin rate excluding Epsilon transaction costs (€40 m)
2019 - CHANGE IN OPERATING MARGIN (1 )
AS A % OF NET REVENUE
2018 Reported FX & Structure
Effect Excl.
Epsilon
2018 At 2019 FX & Perimeter
Restructuring 2018 At 2019 Comparable
Restructuring Charges
Investment
In Game
Changers
And Media &
Creative
Impact Of
Simplification
Occupancy
Costs
Variable
Compensation
Other
Operating
expenses
Depreciation Epsilon Impact 2019 Reported(1)
17.0%
17.5% 17.4% 17.3%+10bps-20bps-20bps+70bps
+30bps+40bps
+50bps -120bps-10bps
15
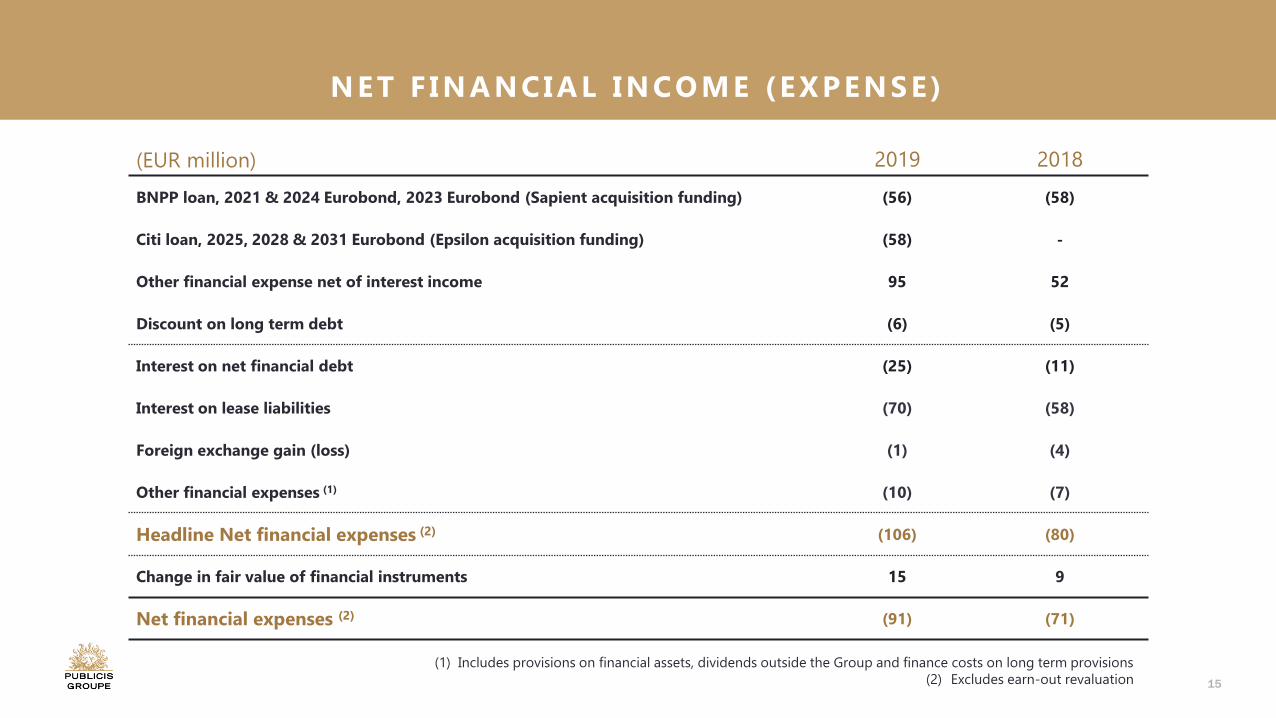
(EUR million) 2019 2018
BNPP loan, 2021 & 2024 Eurobond, 2023 Eurobond (Sapient acquisition funding) (56) (58)
Citi loan, 2025, 2028 & 2031 Eurobond (Epsilon acquisition funding) (58) -
Other financial expense net of interest income 95 52
Discount on long term debt (6) (5)
Interest on net financial debt (25) (11)
Interest on lease liabilities (70) (58)
Foreign exchange gain (loss) (1) (4)
Other financial expenses (1) (10) (7)
Headline Net financial expenses (2) (106) (80)
Change in fair value of financial instruments 15 9
Net financial expenses (2) (91) (71)
(1) Includes provisions on financial assets, dividends outside the Group and finance costs on long term provisions
(2) Excludes earn-out revaluation
NET F INANCIAL INCOME (EXPENSE)
16
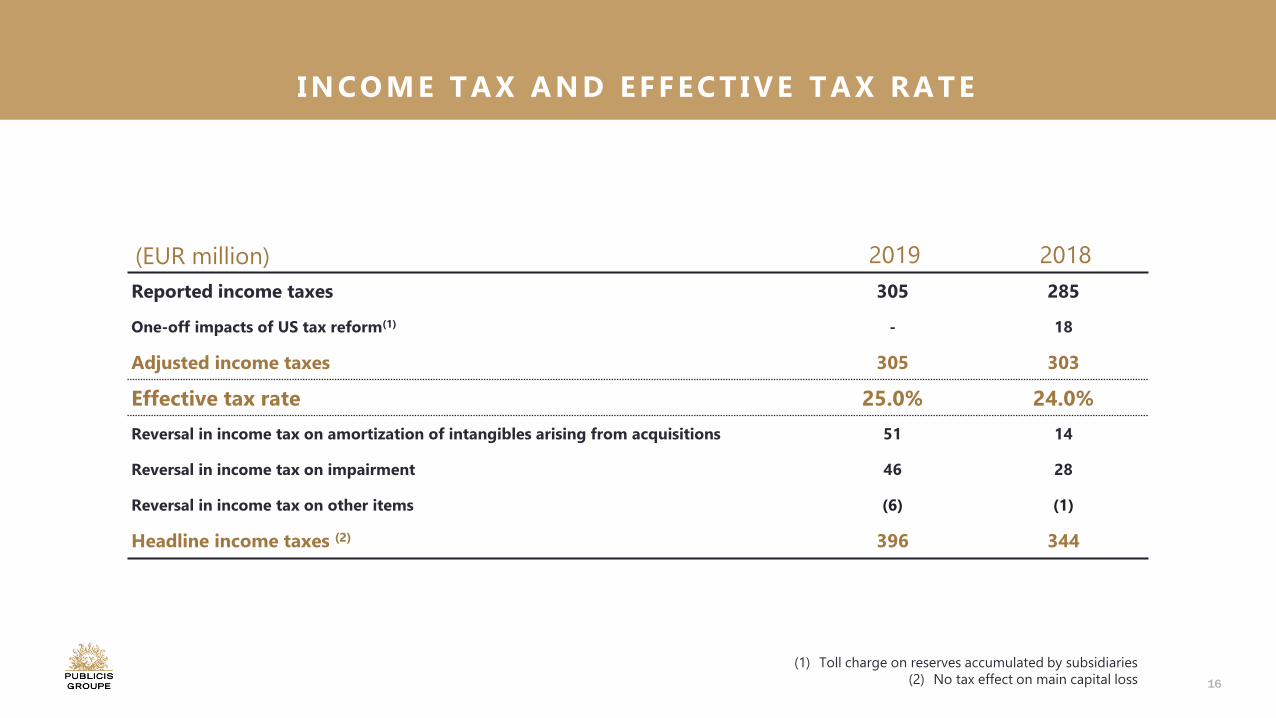
(EUR million) 2019 2018
Reported income taxes 305 285
One-off impacts of US tax reform(1) - 18
Adjusted income taxes 305 303
Effective tax rate 25.0% 24.0%
Reversal in income tax on amortization of intangibles arising from acquisitions 51 14
Reversal in income tax on impairment 46 28
Reversal in income tax on other items (6) (1)
Headline income taxes (2) 396 344
(1) Toll charge on reserves accumulated by subsidiaries
(2) No tax effect on main capital loss
INCOME TAX AND EFFECTIVE TAX RATE
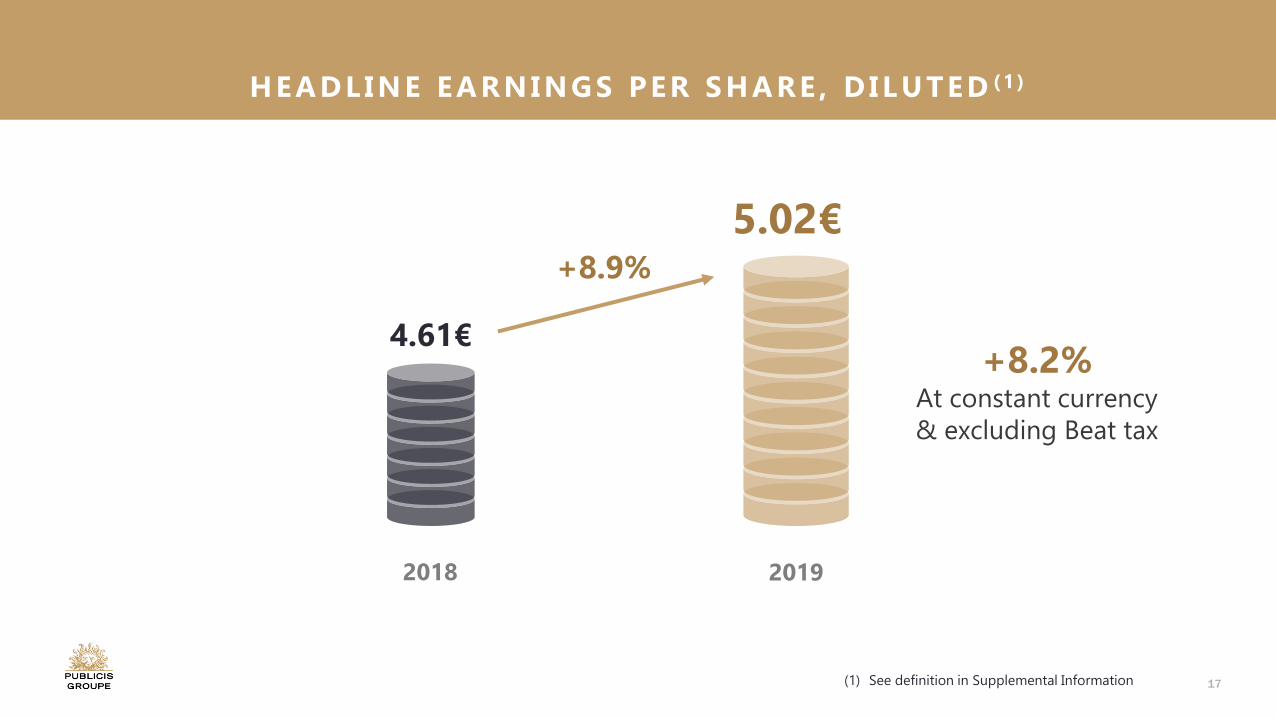
17
2018 2019
4.61€
+8.9%
(1) See definition in Supplemental Information
5.02€
+8.2%At constant currency
& excluding Beat tax
HEADLINE EARNINGS PER SHARE , D ILUTED (1 )
18
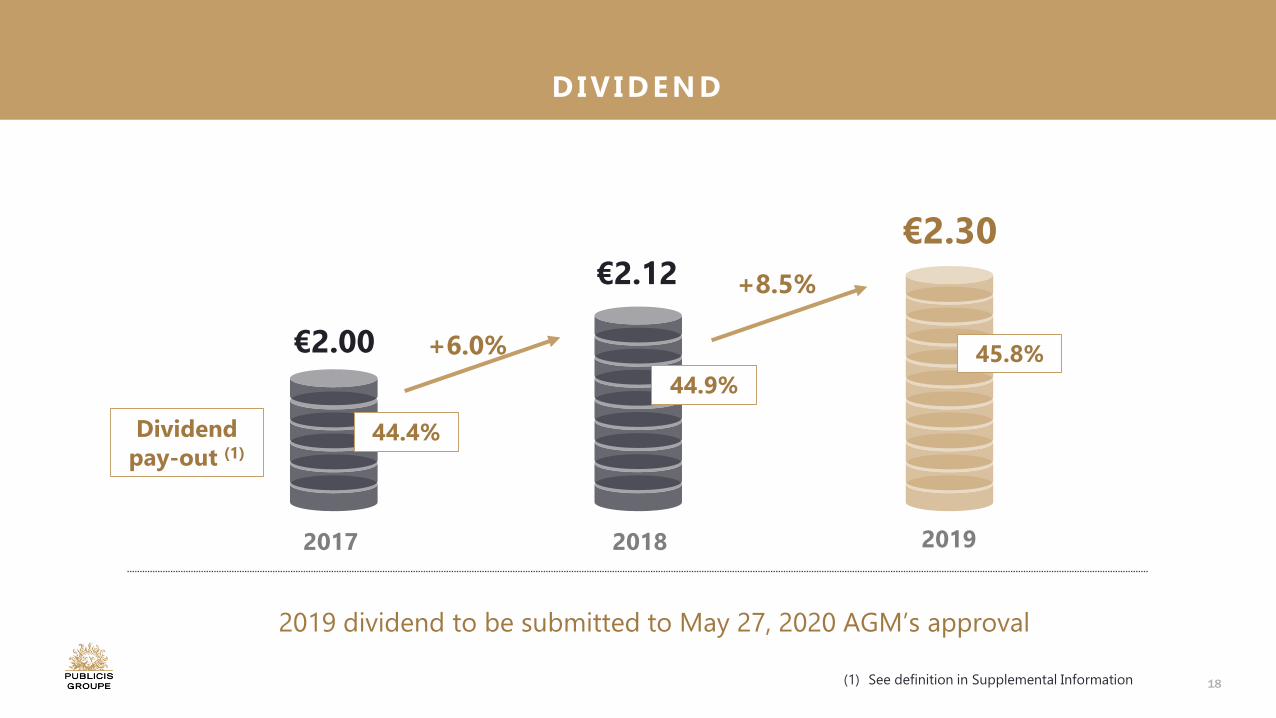
2017 2018 2019
€2.00
€2.12
€2.30
+6.0%
+8.5%
Dividendpay-out (1)
44.4%
44.9%
45.8%
2019 dividend to be submitted to May 27, 2020 AGM’s approval
(1) See definition in Supplemental Information
DIVIDEND
19
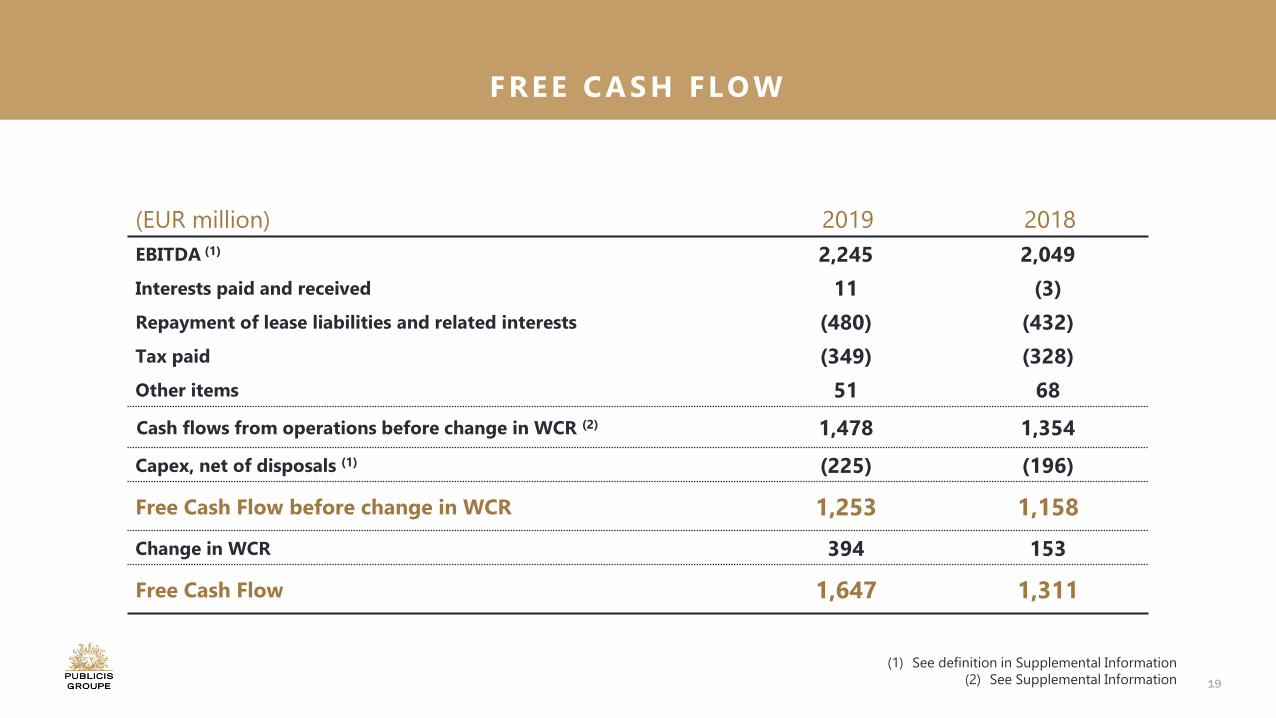
(EUR million) 2019 2018
EBITDA (1) 2,245 2,049
Interests paid and received 11 (3)
Repayment of lease liabilities and related interests (480) (432)
Tax paid (349) (328)
Other items 51 68
Cash flows from operations before change in WCR (2) 1,478 1,354
Capex, net of disposals (1) (225) (196)
Free Cash Flow before change in WCR 1,253 1,158
Change in WCR 394 153
Free Cash Flow 1,647 1,311
(1) See definition in Supplemental Information
(2) See Supplemental Information
FREE CASH FLOW
20
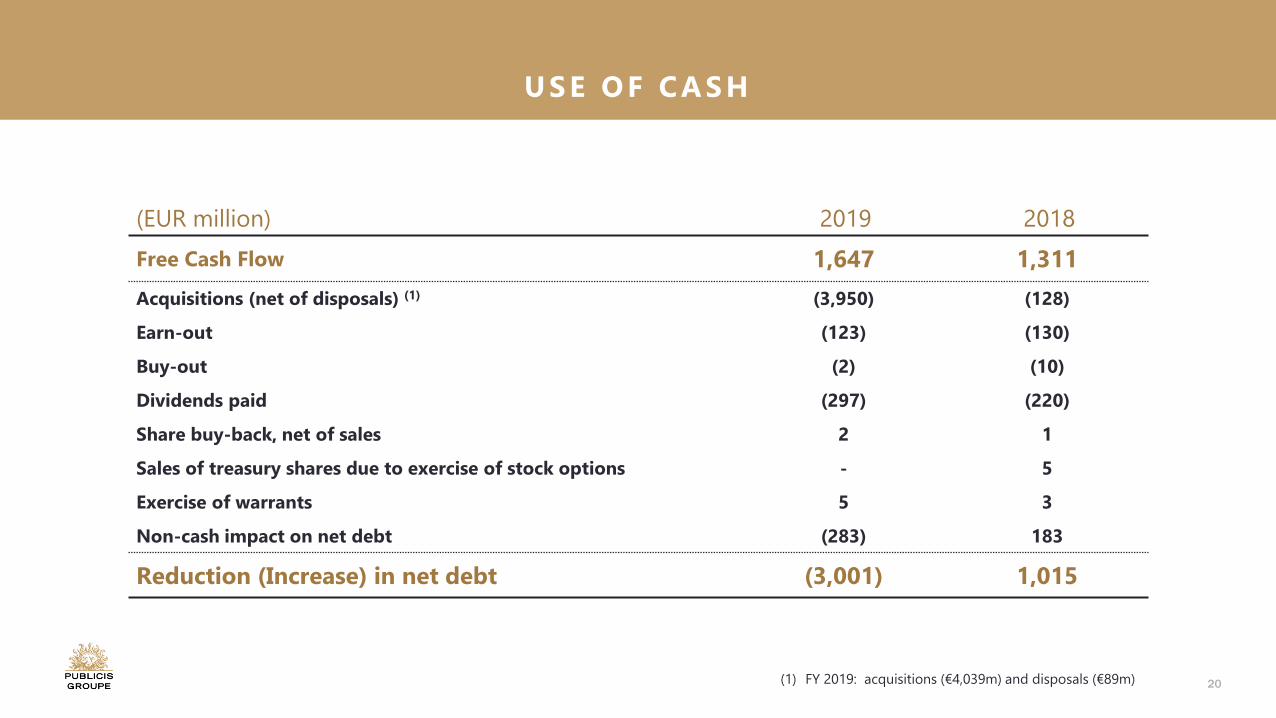
(EUR million) 2019 2018
Free Cash Flow 1,647 1,311
Acquisitions (net of disposals) (1) (3,950) (128)
Earn-out (123) (130)
Buy-out (2) (10)
Dividends paid (297) (220)
Share buy-back, net of sales 2 1
Sales of treasury shares due to exercise of stock options - 5
Exercise of warrants 5 3
Non-cash impact on net debt (283) 183
Reduction (Increase) in net debt (3,001) 1,015
(1) FY 2019: acquisitions (€4,039m) and disposals (€89m)
USE OF CASH
21
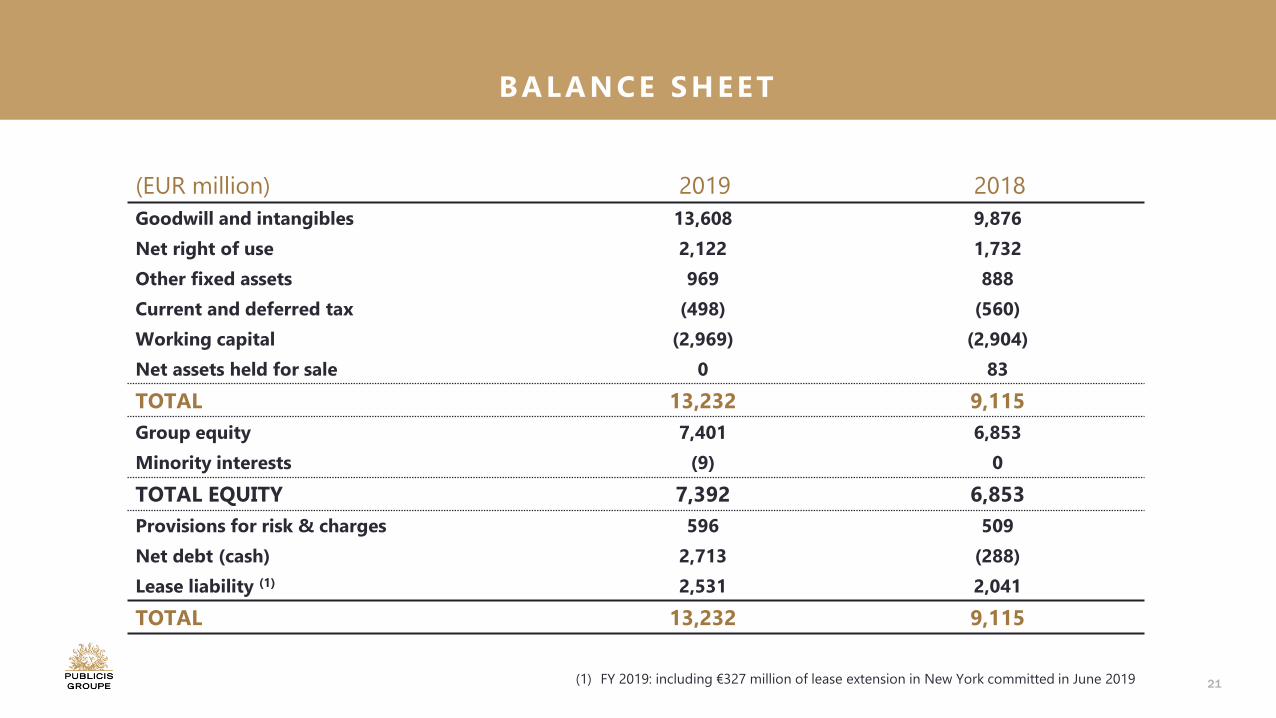
(EUR million) 2019 2018
Goodwill and intangibles 13,608 9,876
Net right of use 2,122 1,732
Other fixed assets 969 888
Current and deferred tax (498) (560)
Working capital (2,969) (2,904)
Net assets held for sale 0 83
TOTAL 13,232 9,115
Group equity 7,401 6,853
Minority interests (9) 0
TOTAL EQUITY 7,392 6,853
Provisions for risk & charges 596 509
Net debt (cash) 2,713 (288)
Lease liability (1) 2,531 2,041
TOTAL 13,232 9,115
(1) FY 2019: including €327 million of lease extension in New York committed in June 2019
BALANCE SHEET
22
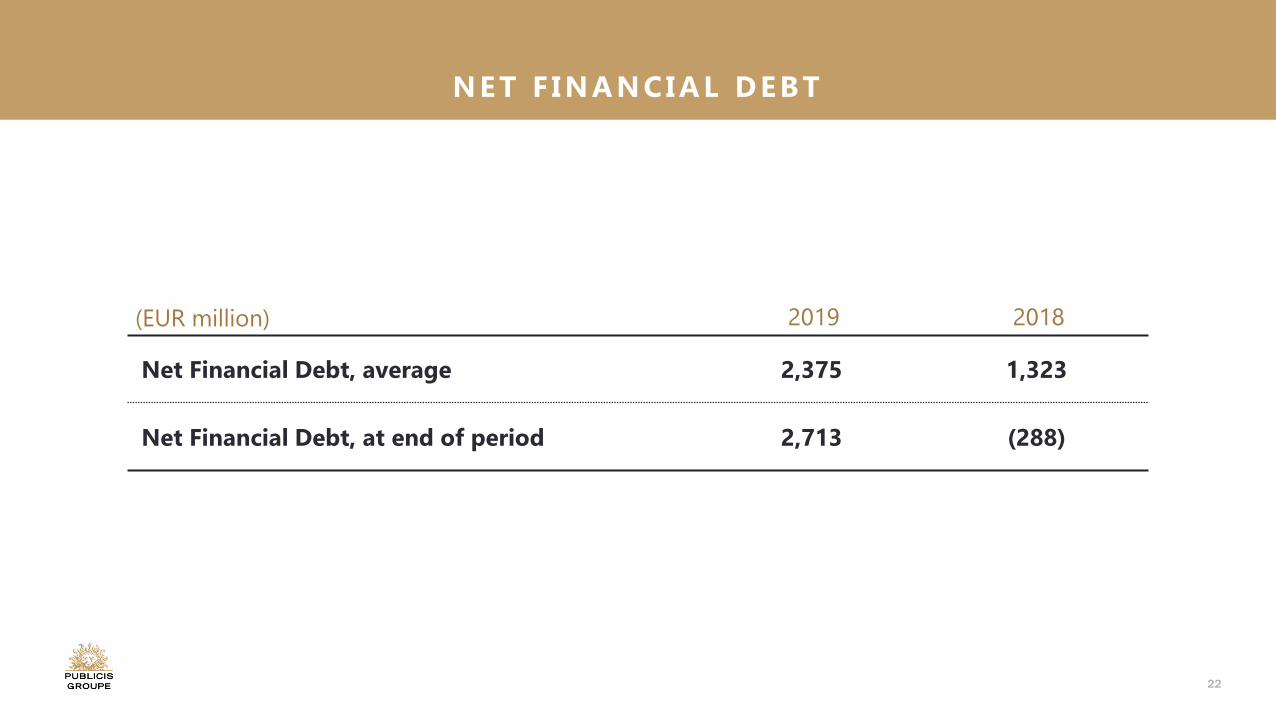
(EUR million) 2019 2018
Net Financial Debt, average 2,375 1,323
Net Financial Debt, at end of period 2,713 (288)
NET F INANCIAL DEBT
23
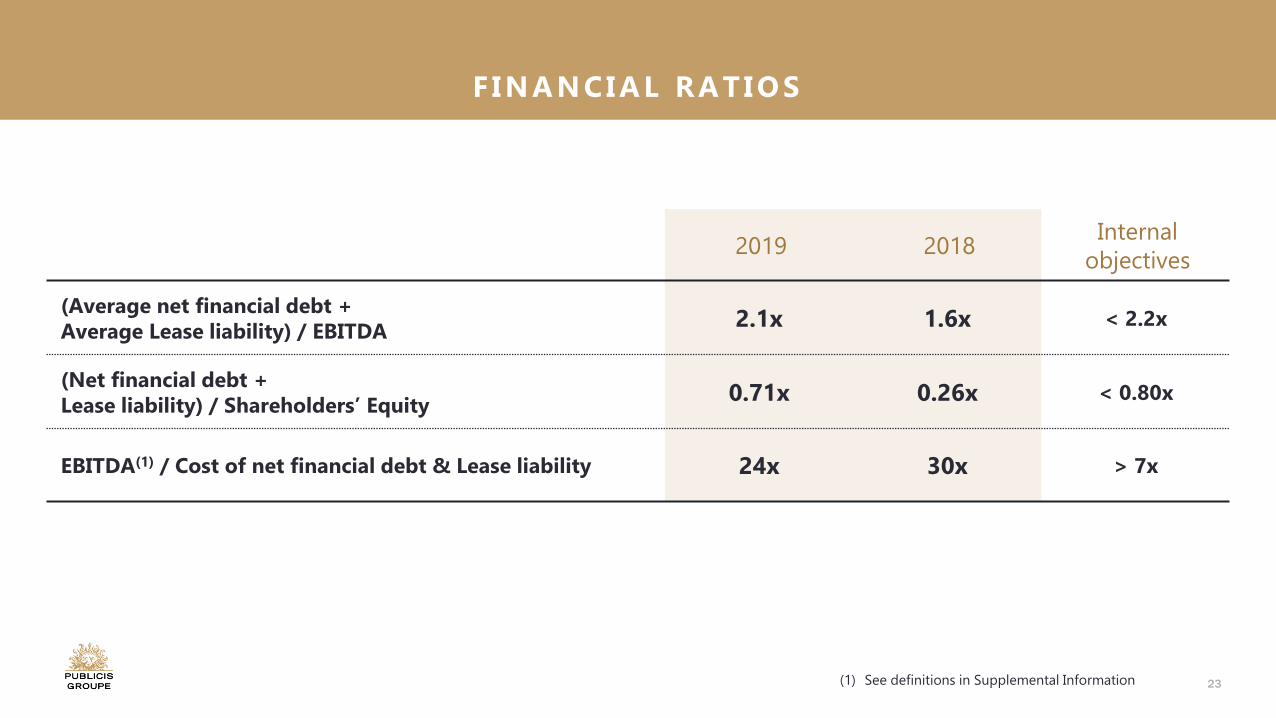
2019 2018Internal
objectives
(Average net financial debt + Average Lease liability) / EBITDA
2.1x 1.6x < 2.2x
(Net financial debt + Lease liability) / Shareholders’ Equity
0.71x 0.26x < 0.80x
EBITDA(1) / Cost of net financial debt & Lease liability 24x 30x > 7x
(1) See definitions in Supplemental Information
F INANCIAL RATIOS
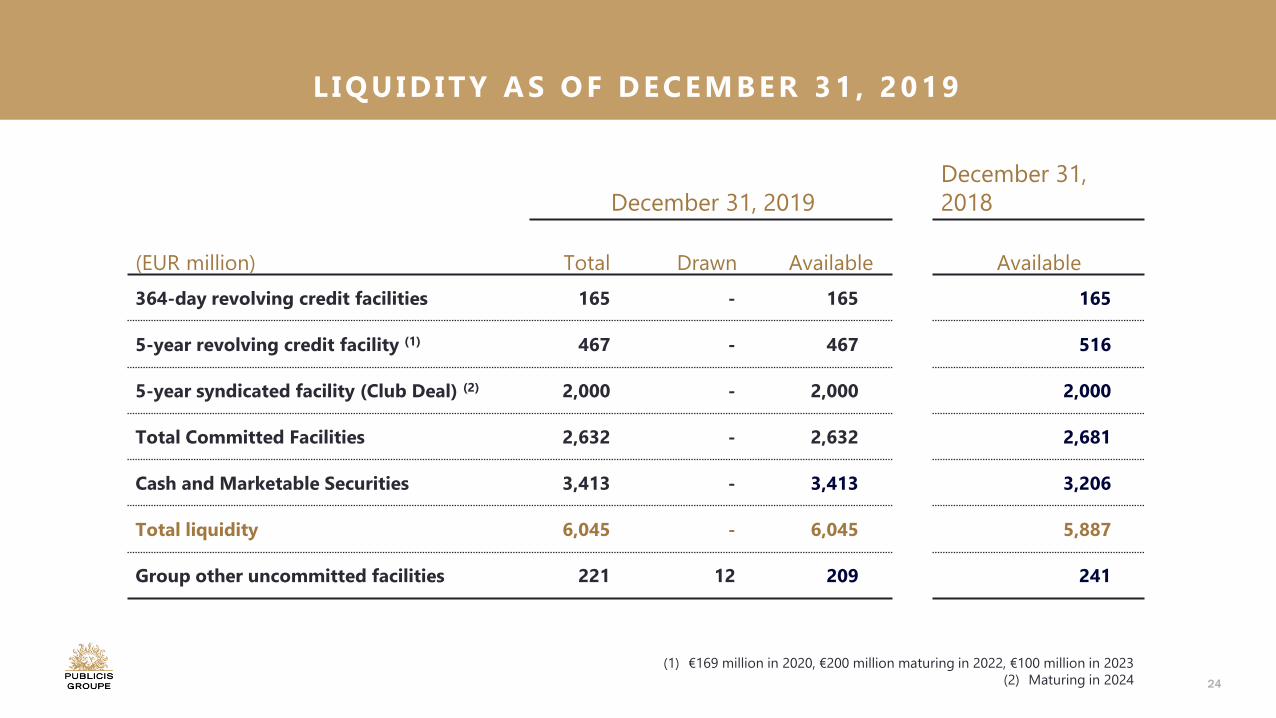
24
(1) €169 million in 2020, €200 million maturing in 2022, €100 million in 2023
(2) Maturing in 2024
December 31, 2019
December 31,
2018
(EUR million) Total Drawn Available Available
364-day revolving credit facilities 165 - 165 165
5-year revolving credit facility (1) 467 - 467 516
5-year syndicated facility (Club Deal) (2) 2,000 - 2,000 2,000
Total Committed Facilities 2,632 - 2,632 2,681
Cash and Marketable Securities 3,413 - 3,413 3,206
Total liquidity 6,045 - 6,045 5,887
Group other uncommitted facilities 221 12 209 241
L IQUIDITY AS OF DECEMBER 31 , 2019
25
2019 FINANCIAL
RESULTS
FULLYEAR 2019
HIGHLIGHTSQ&A
2020PRIORITIES& OUTLOOK
26
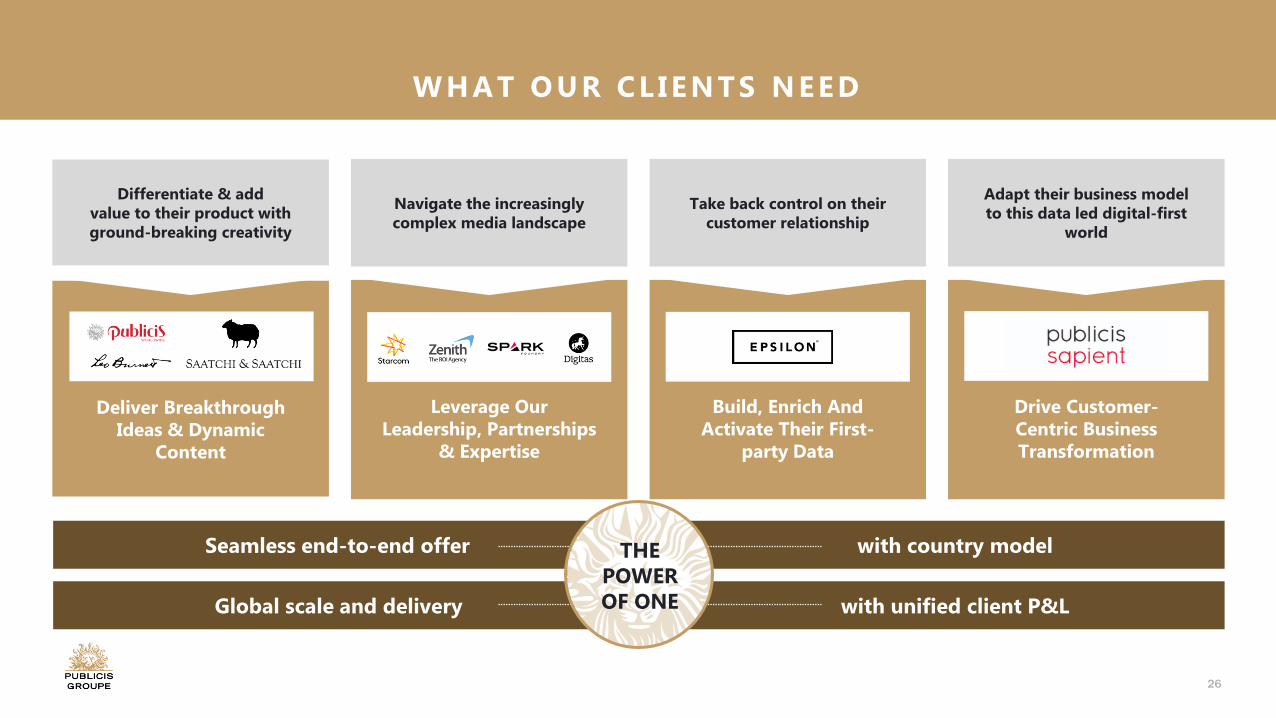
WHAT OUR CL IENTS NEED
Differentiate & addvalue to their product with ground-breaking creativity
Navigate the increasingly complex media landscape
Adapt their business model to this data led digital-first
world
Take back control on their customer relationship
Deliver Breakthrough Ideas & Dynamic
Content
Leverage Our Leadership, Partnerships
& Expertise
Drive Customer-Centric Business Transformation
Build, Enrich And Activate Their First-
party Data
Seamless end-to-end offer with country model
Global scale and delivery with unified client P&L
THE POWER OF ONE

27
4 STEPS FOR
OUR ORGANIC GROWTH
RECOVERY ROADMAP
28
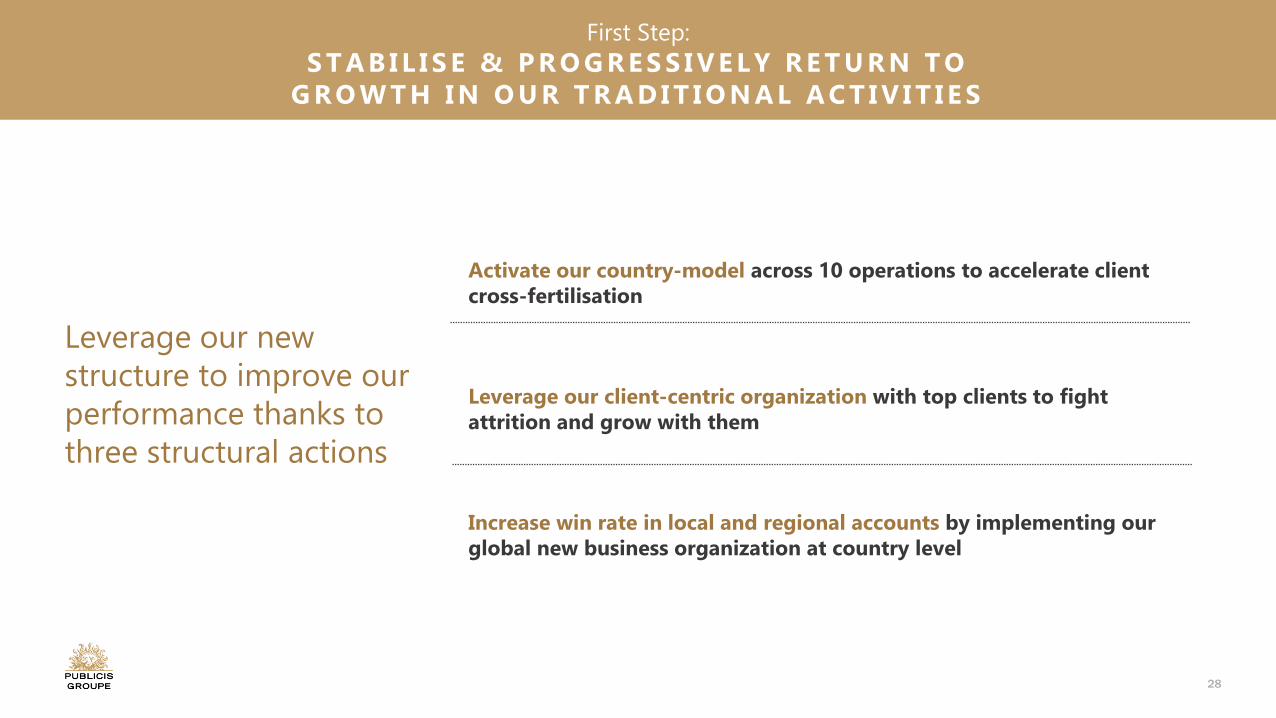
Activate our country-model across 10 operations to accelerate client cross-fertilisation
Leverage our client-centric organization with top clients to fight attrition and grow with them
Increase win rate in local and regional accounts by implementing our global new business organization at country level
Leverage our new
structure to improve our
performance thanks to
three structural actions
First Step:
S T A B I L I S E & P R O G R E S S I V E L Y R E T U R N T OG R O W T H I N O U R T R A D I T I O N A L A C T I V I T I E S
29
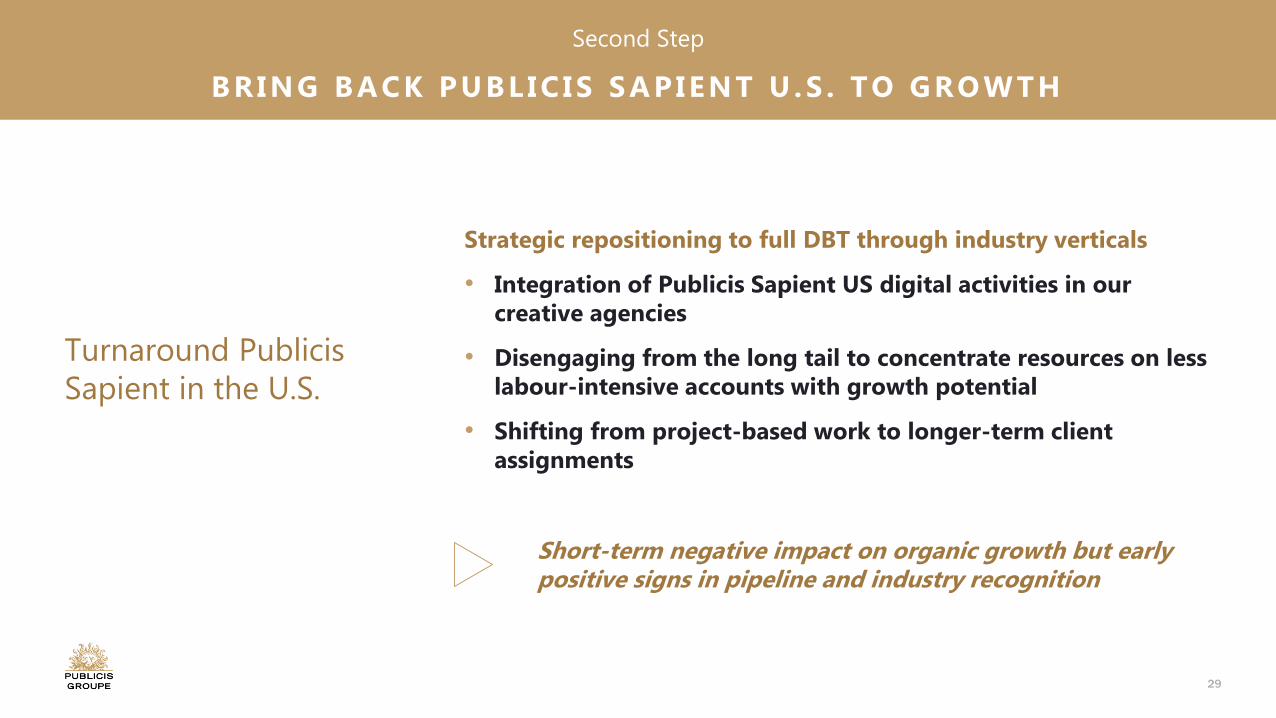
Turnaround Publicis
Sapient in the U.S.
Strategic repositioning to full DBT through industry verticals
• Integration of Publicis Sapient US digital activities in our creative agencies
• Disengaging from the long tail to concentrate resources on less labour-intensive accounts with growth potential
• Shifting from project-based work to longer-term client assignments
Short-term negative impact on organic growth but early positive signs in pipeline and industry recognition
Second Step
BRING BACK PUBL IC IS SAPIENT U .S . TO GROWTH
30
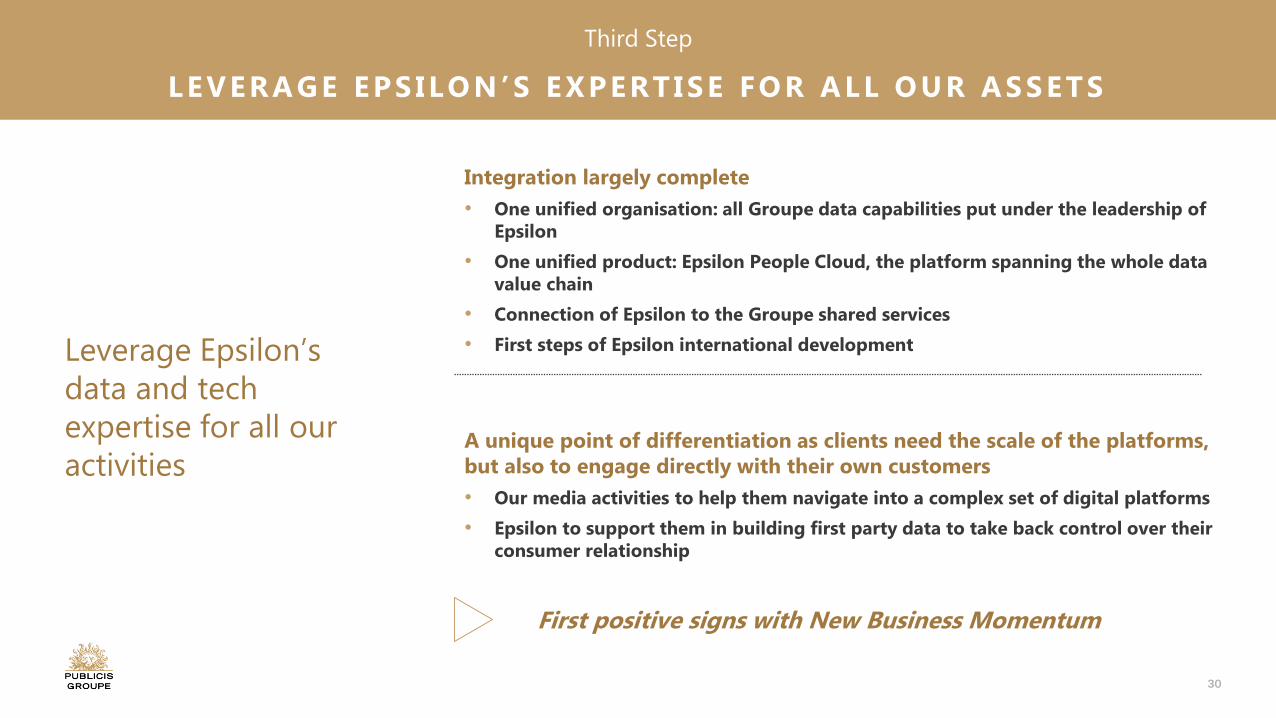
Integration largely complete
• One unified organisation: all Groupe data capabilities put under the leadership of Epsilon
• One unified product: Epsilon People Cloud, the platform spanning the whole data value chain
• Connection of Epsilon to the Groupe shared services
• First steps of Epsilon international development
A unique point of differentiation as clients need the scale of the platforms, but also to engage directly with their own customers
• Our media activities to help them navigate into a complex set of digital platforms
• Epsilon to support them in building first party data to take back control over their consumer relationship
Leverage Epsilon’s
data and tech
expertise for all our
activities
First positive signs with New Business Momentum
Third Step
LEVERAGE EPS ILON’S EXPERTISE FOR ALL OUR ASSETS
31
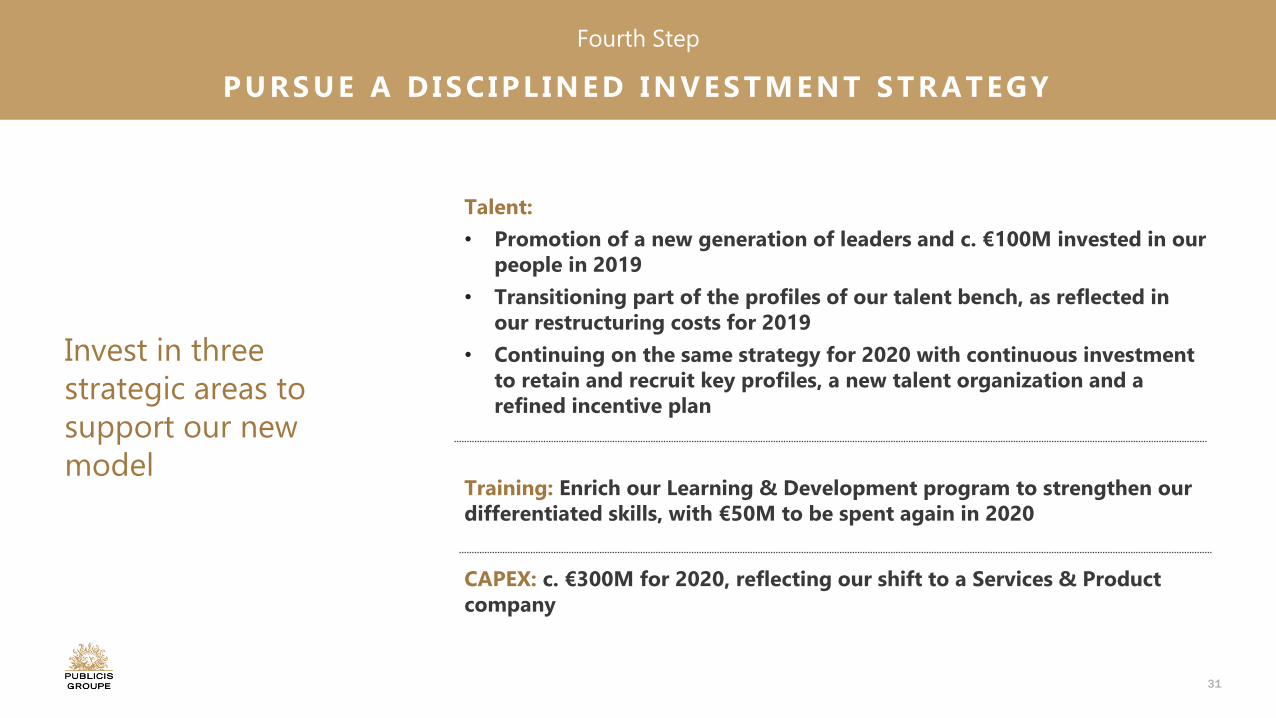
Talent:
• Promotion of a new generation of leaders and c. €100M invested in our people in 2019
• Transitioning part of the profiles of our talent bench, as reflected in our restructuring costs for 2019
• Continuing on the same strategy for 2020 with continuous investment to retain and recruit key profiles, a new talent organization and a refined incentive plan
Training: Enrich our Learning & Development program to strengthen our differentiated skills, with €50M to be spent again in 2020
CAPEX: c. €300M for 2020, reflecting our shift to a Services & Product company
Fourth Step
PURSUE A D ISC IPL INED INVESTMENT STRATEGY
Invest in three
strategic areas to
support our new
model
32
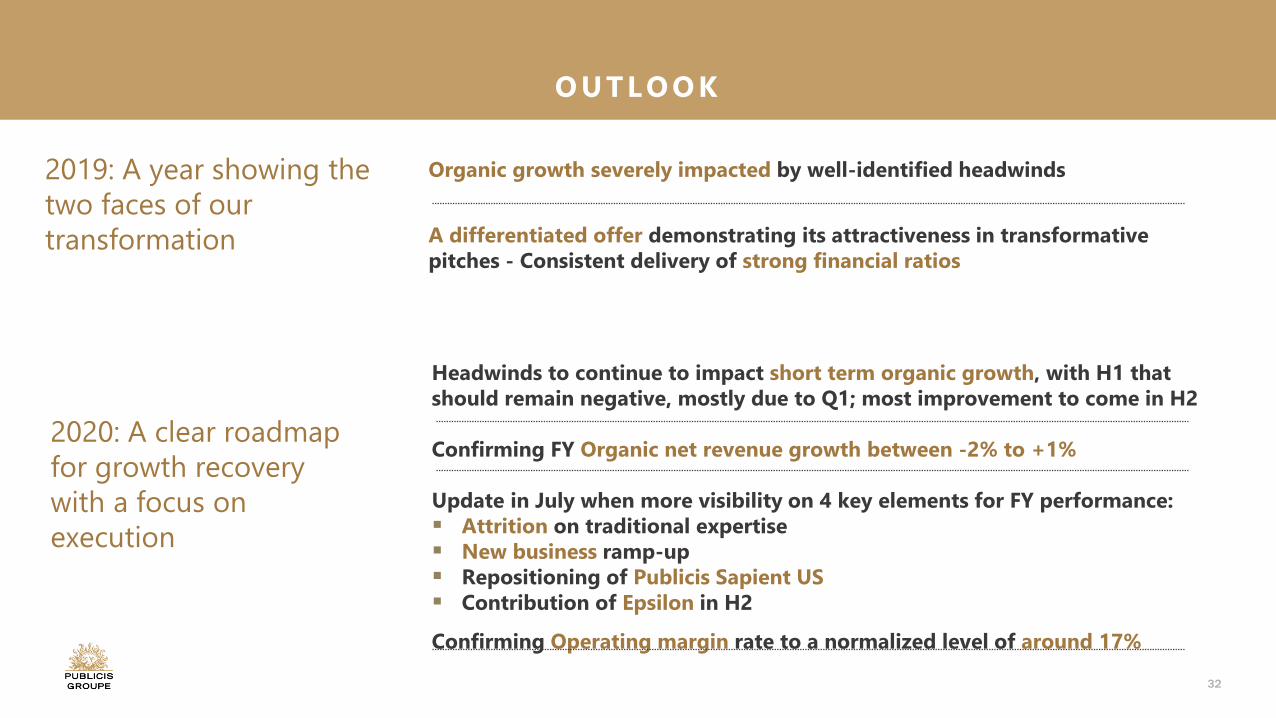
Headwinds to continue to impact short term organic growth, with H1 that should remain negative, mostly due to Q1; most improvement to come in H2
Confirming FY Organic net revenue growth between -2% to +1%
Update in July when more visibility on 4 key elements for FY performance: Attrition on traditional expertise New business ramp-up Repositioning of Publicis Sapient US Contribution of Epsilon in H2
Confirming Operating margin rate to a normalized level of around 17%
2019: A year showing the
two faces of our
transformation
2020: A clear roadmap
for growth recovery
with a focus on
execution
Organic growth severely impacted by well-identified headwinds
A differentiated offer demonstrating its attractiveness in transformative pitches - Consistent delivery of strong financial ratios
OUTLOOK

Supplemental information
34
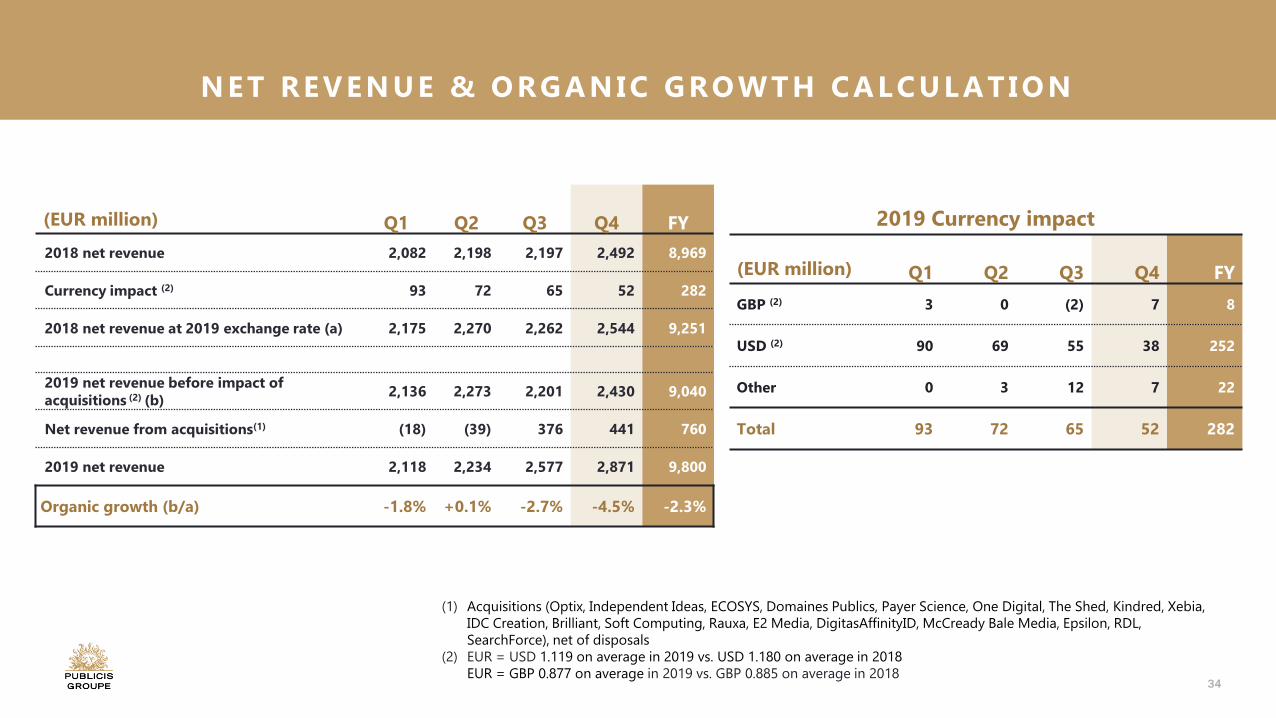
2019 Currency impact
(EUR million) Q1 Q2 Q3 Q4 FY
GBP (2) 3 0 (2) 7 8
USD (2) 90 69 55 38 252
Other 0 3 12 7 22
Total 93 72 65 52 282
(EUR million) Q1 Q2 Q3 Q4 FY
2018 net revenue 2,082 2,198 2,197 2,492 8,969
Currency impact (2) 93 72 65 52 282
2018 net revenue at 2019 exchange rate (a) 2,175 2,270 2,262 2,544 9,251
2019 net revenue before impact of acquisitions (2) (b)
2,136 2,273 2,201 2,430 9,040
Net revenue from acquisitions(1) (18) (39) 376 441 760
2019 net revenue 2,118 2,234 2,577 2,871 9,800
Organic growth (b/a) -1.8% +0.1% -2.7% -4.5% ---2.3%
(1) Acquisitions (Optix, Independent Ideas, ECOSYS, Domaines Publics, Payer Science, One Digital, The Shed, Kindred, Xebia,
IDC Creation, Brilliant, Soft Computing, Rauxa, E2 Media, DigitasAffinityID, McCready Bale Media, Epsilon, RDL,
SearchForce), net of disposals
(2) EUR = USD 1.119 on average in 2019 vs. USD 1.180 on average in 2018
EUR = GBP 0.877 on average in 2019 vs. GBP 0.885 on average in 2018
NET REVENUE & ORGANIC GROWTH CALCULATION
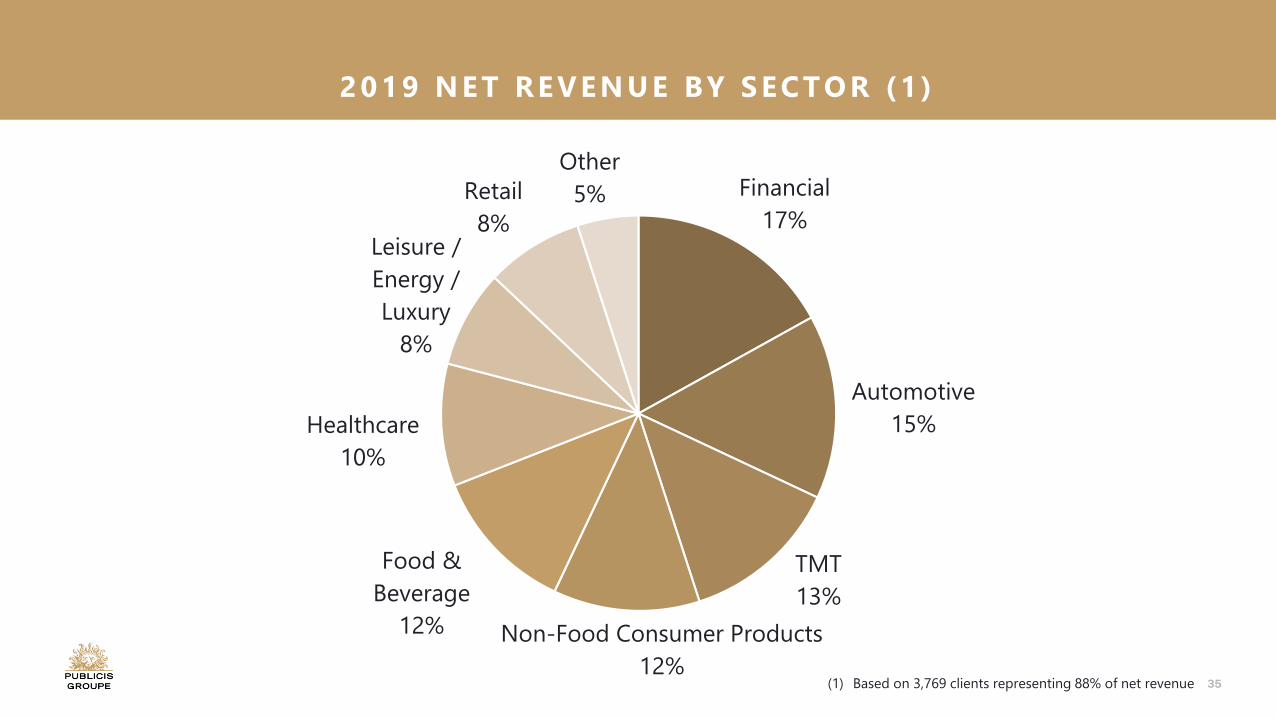
35(1) Based on 3,769 clients representing 88% of net revenue
2019 NET REVENUE BY SECTOR (1 )
Financial
17%
Automotive
15%
TMT
13%
Non-Food Consumer Products
12%
Food &
Beverage
12%
Healthcare
10%
Leisure /
Energy /
Luxury
8%
Retail
8%
Other
5%
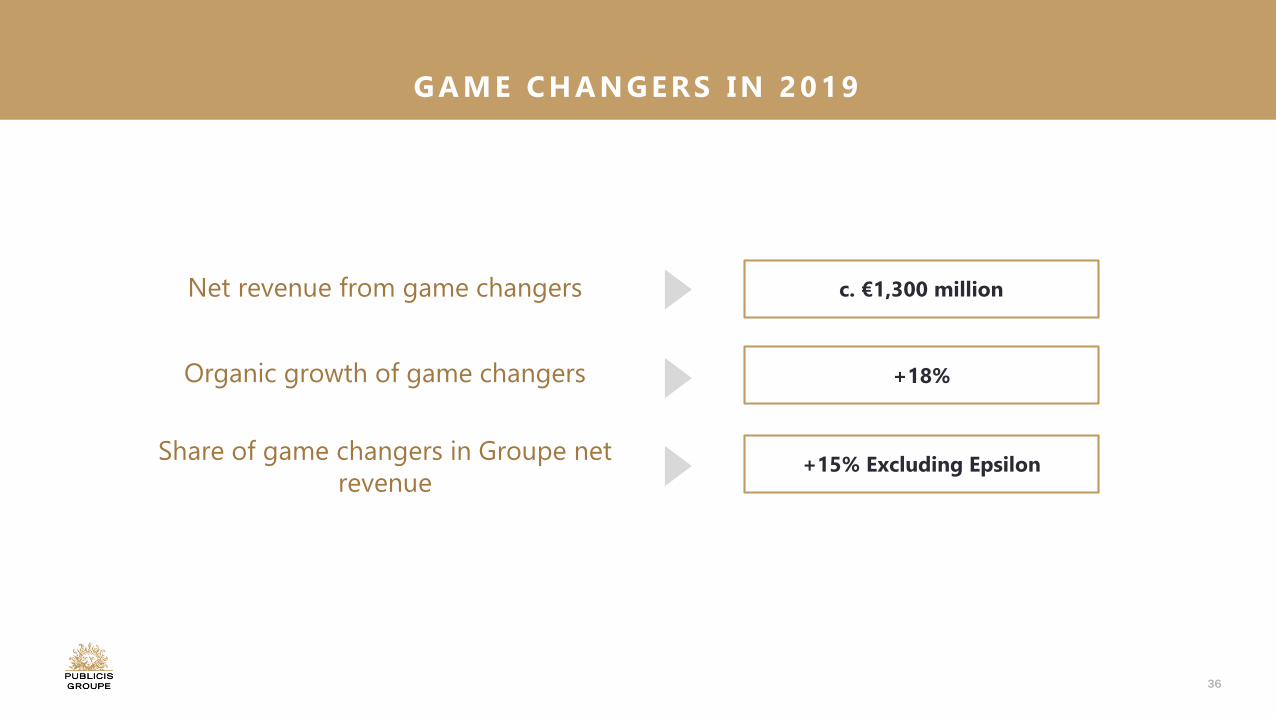
36
Net revenue from game changers
Share of game changers in Groupe net
revenue
c. €1,300 million
+15% Excluding Epsilon
Organic growth of game changers +18%
GAME CHANGERS IN 2019
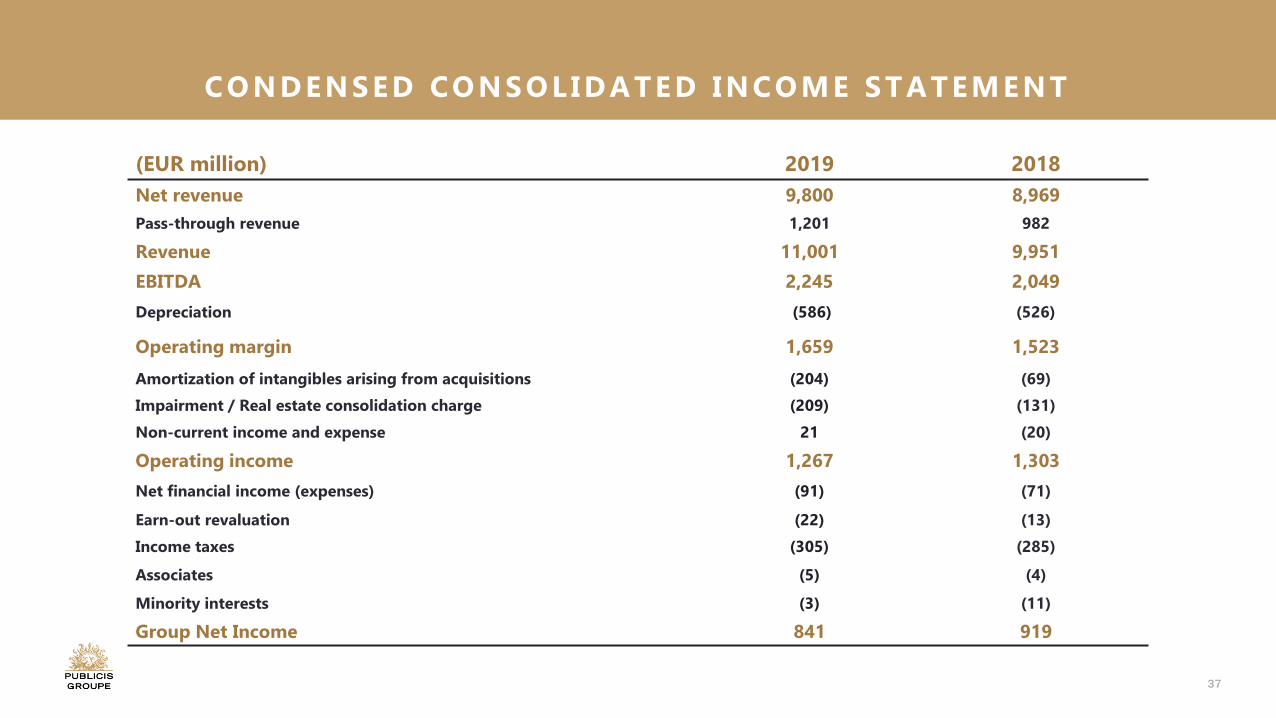
37
(EUR million) 2019 2018
Net revenue 9,800 8,969
Pass-through revenue 1,201 982
Revenue 11,001 9,951
EBITDA 2,245 2,049
Depreciation (586) (526)
Operating margin 1,659 1,523
Amortization of intangibles arising from acquisitions (204) (69)
Impairment / Real estate consolidation charge (209) (131)
Non-current income and expense 21 (20)
Operating income 1,267 1,303
Net financial income (expenses) (91) (71)
Earn-out revaluation (22) (13)
Income taxes (305) (285)
Associates (5) (4)
Minority interests (3) (11)
Group Net Income 841 919
CONDENSED CONSOLIDATED INCOME STATEMENT
38
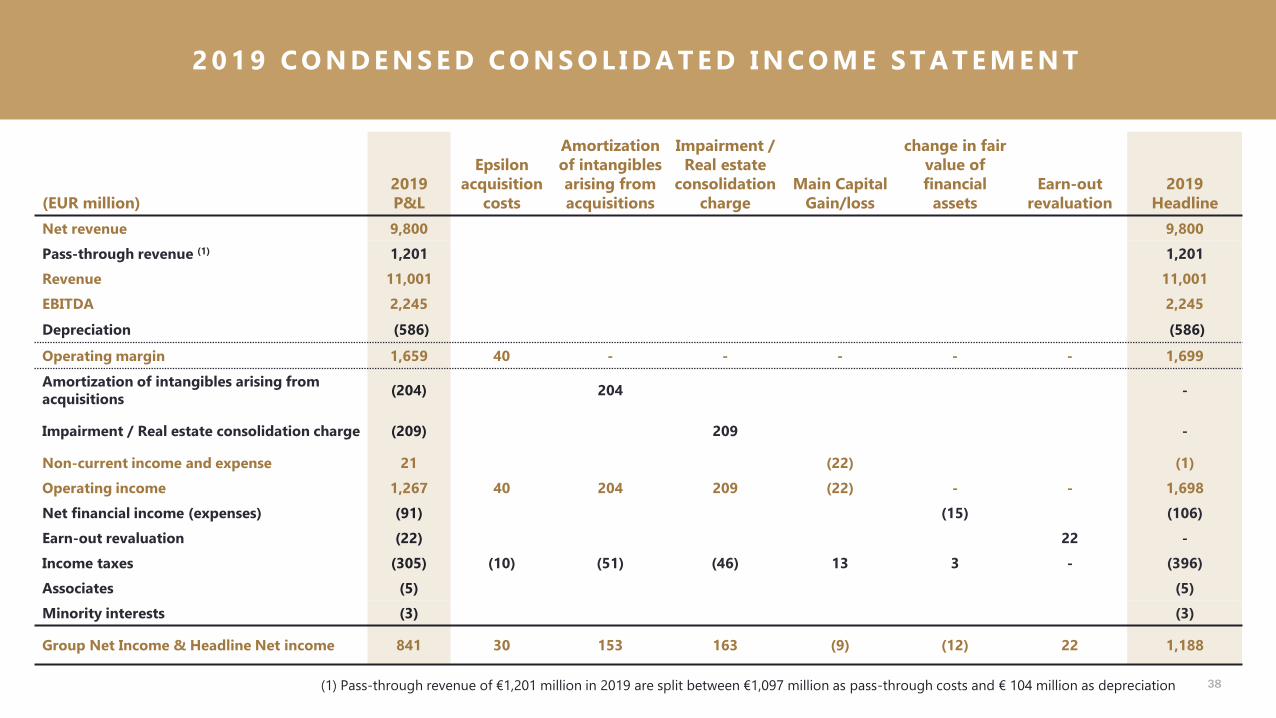
3
82 0 1 9 C O N D E N S E D C O N S O L I D A T E D I N C O M E S T A T E M E N T
(EUR million)2019P&L
Epsilon acquisition
costs
Amortization of intangibles arising from acquisitions
Impairment / Real estate
consolidation charge
Main Capital Gain/loss
change in fair value of financial
assetsEarn-out
revaluation2019
Headline
Net revenue 9,800 9,800
Pass-through revenue (1) 1,201 1,201
Revenue 11,001 11,001
EBITDA 2,245 2,245
Depreciation (586) (586)
Operating margin 1,659 40 - - - - - 1,699
Amortization of intangibles arising from acquisitions
(204) 204 -
Impairment / Real estate consolidation charge (209) 209 -
Non-current income and expense 21 (22) (1)
Operating income 1,267 40 204 209 (22) - - 1,698
Net financial income (expenses) (91) (15) (106)
Earn-out revaluation (22) 22 -
Income taxes (305) (10) (51) (46) 13 3 - (396)
Associates (5) (5)
Minority interests (3) (3)
Group Net Income & Headline Net income 841 30 153 163 (9) (12) 22 1,188
(1) Pass-through revenue of €1,201 million in 2019 are split between €1,097 million as pass-through costs and € 104 million as depreciation
39
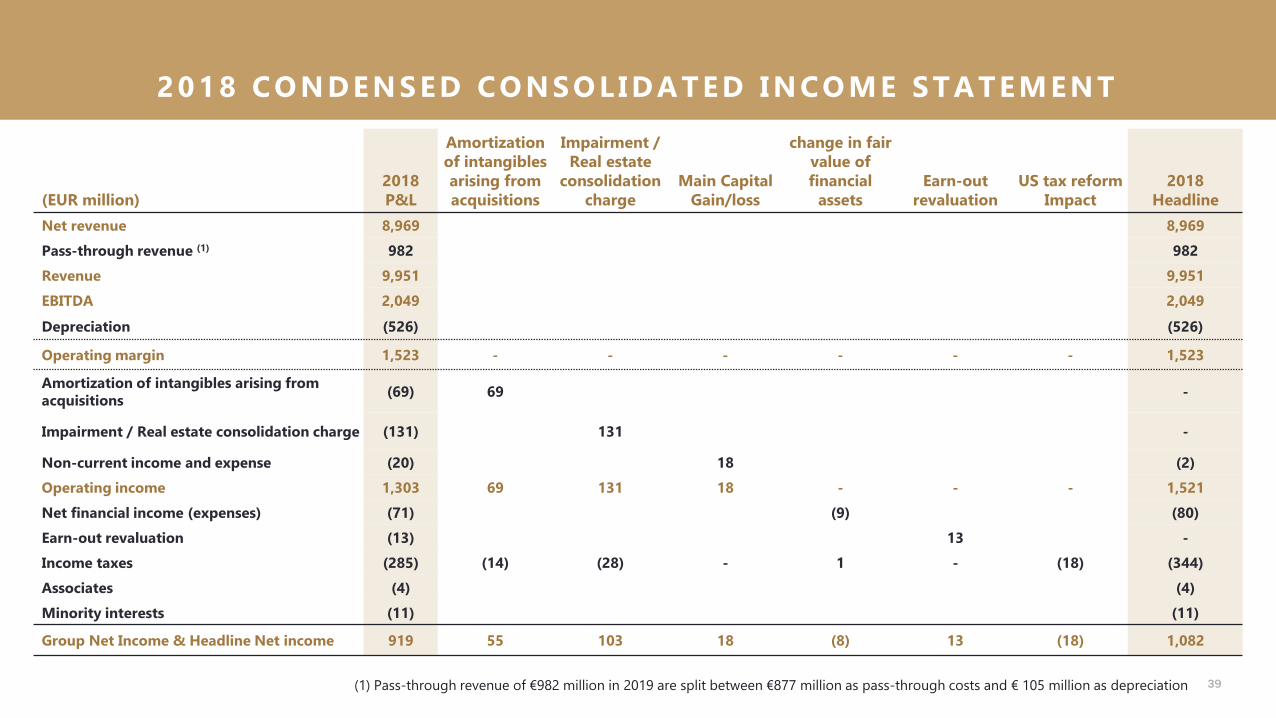
(EUR million)2018P&L
Amortization of intangibles arising from acquisitions
Impairment / Real estate
consolidation charge
Main Capital Gain/loss
change in fair value of financial
assetsEarn-out
revaluationUS tax reform
Impact2018
Headline
Net revenue 8,969 8,969
Pass-through revenue (1) 982 982
Revenue 9,951 9,951
EBITDA 2,049 2,049
Depreciation (526) (526)
Operating margin 1,523 - - - - - - 1,523
Amortization of intangibles arising from acquisitions
(69) 69 -
Impairment / Real estate consolidation charge (131) 131 -
Non-current income and expense (20) 18 (2)
Operating income 1,303 69 131 18 - - - 1,521
Net financial income (expenses) (71) (9) (80)
Earn-out revaluation (13) 13 -
Income taxes (285) (14) (28) - 1 - (18) (344)
Associates (4) (4)
Minority interests (11) (11)
Group Net Income & Headline Net income 919 55 103 18 (8) 13 (18) 1,082
(1) Pass-through revenue of €982 million in 2019 are split between €877 million as pass-through costs and € 105 million as depreciation
2018 CONDENSED CONSOLIDATED INCOME STATEMENT
40
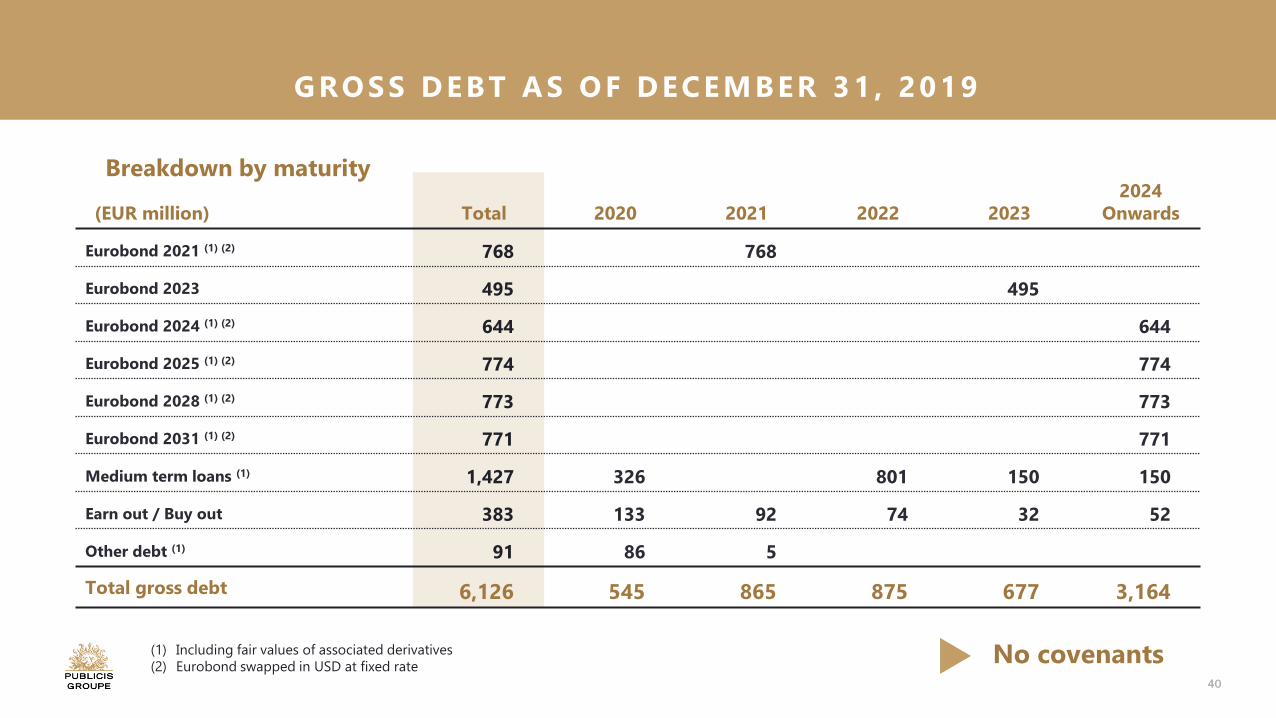
(EUR million) Total 2020 2021 2022 20232024
Onwards
Eurobond 2021 (1) (2) 768 768
Eurobond 2023 495 495
Eurobond 2024 (1) (2) 644 644
Eurobond 2025 (1) (2) 774 774
Eurobond 2028 (1) (2) 773 773
Eurobond 2031 (1) (2) 771 771
Medium term loans (1) 1,427 326 801 150 150
Earn out / Buy out 383 133 92 74 32 52
Other debt (1) 91 86 5
Total gross debt 6,126 545 865 875 677 3,164
Breakdown by maturity
(1) Including fair values of associated derivatives
(2) Eurobond swapped in USD at fixed rateNo covenants
GROSS DEBT AS OF DECEMBER 31 , 2019
41
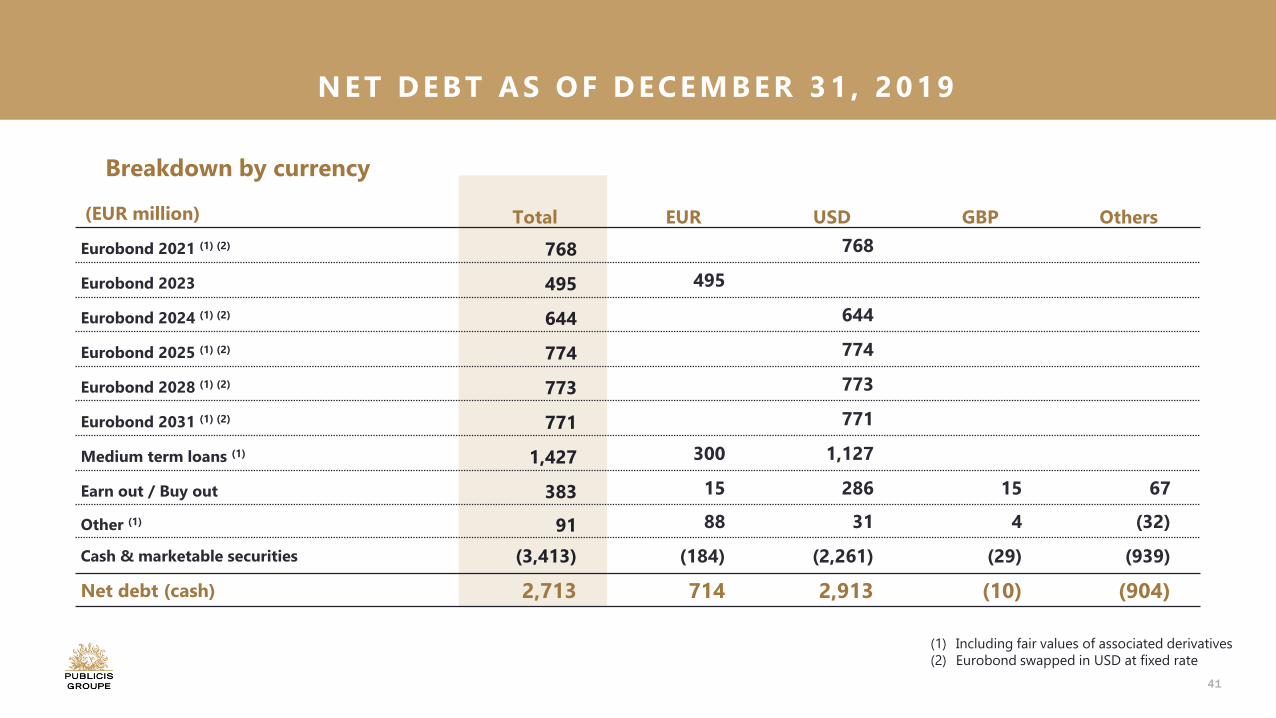
(EUR million) Total EUR USD GBP Others
Eurobond 2021 (1) (2) 768 768
Eurobond 2023 495 495
Eurobond 2024 (1) (2) 644 644
Eurobond 2025 (1) (2) 774 774
Eurobond 2028 (1) (2) 773 773
Eurobond 2031 (1) (2) 771 771
Medium term loans (1) 1,427 300 1,127
Earn out / Buy out 383 15 286 15 67
Other (1) 91 88 31 4 (32)
Cash & marketable securities (3,413) (184) (2,261) (29) (939)
Net debt (cash) 2,713 714 2,913 (10) (904)
(1) Including fair values of associated derivatives
(2) Eurobond swapped in USD at fixed rate
Breakdown by currency
NET DEBT AS OF DECEMBER 31 , 2019
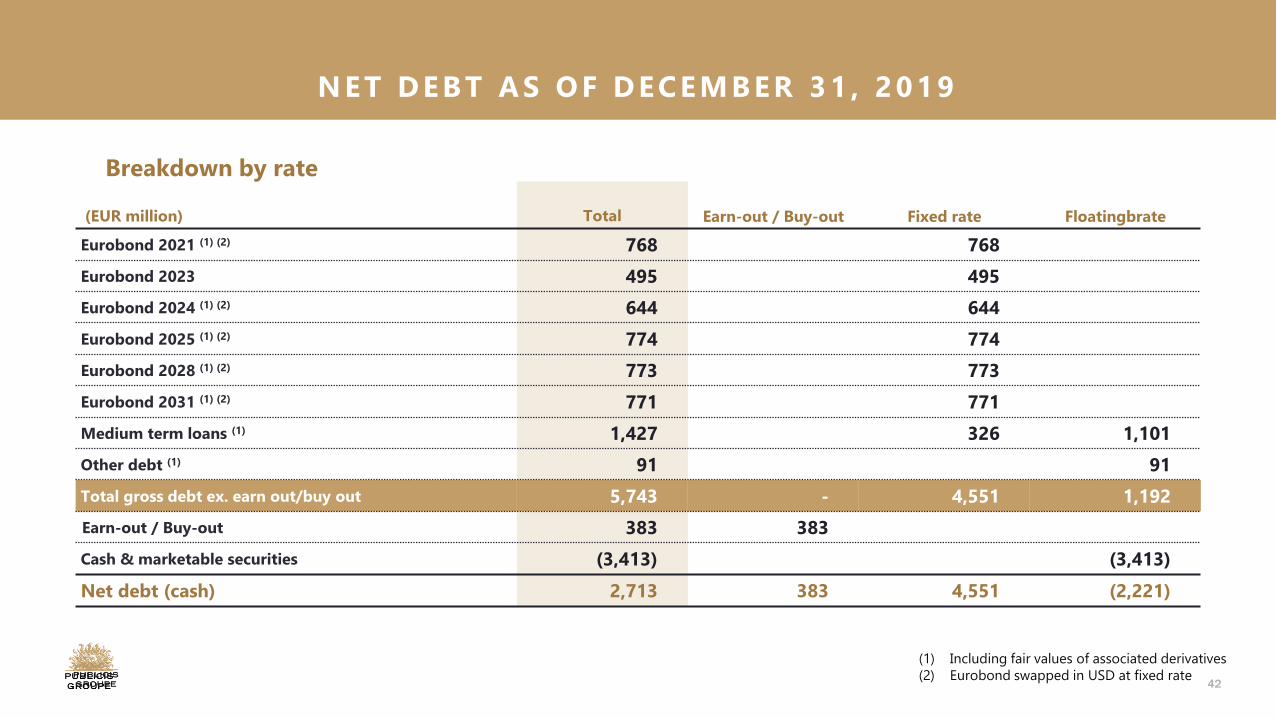
42
(EUR million) Total Earn-out / Buy-out Fixed rate Floatingbrate
Eurobond 2021 (1) (2) 768 768
Eurobond 2023 495 495
Eurobond 2024 (1) (2) 644 644
Eurobond 2025 (1) (2) 774 774
Eurobond 2028 (1) (2) 773 773
Eurobond 2031 (1) (2) 771 771
Medium term loans (1) 1,427 326 1,101
Other debt (1) 91 91
Total gross debt ex. earn out/buy out 5,743 - 4,551 1,192
Earn-out / Buy-out 383 383
Cash & marketable securities (3,413) (3,413)
Net debt (cash) 2,713 383 4,551 (2,221)
(1) Including fair values of associated derivatives
(2) Eurobond swapped in USD at fixed rate
NET DEBT AS OF DECEMBER 31 , 2019
Breakdown by rate
43
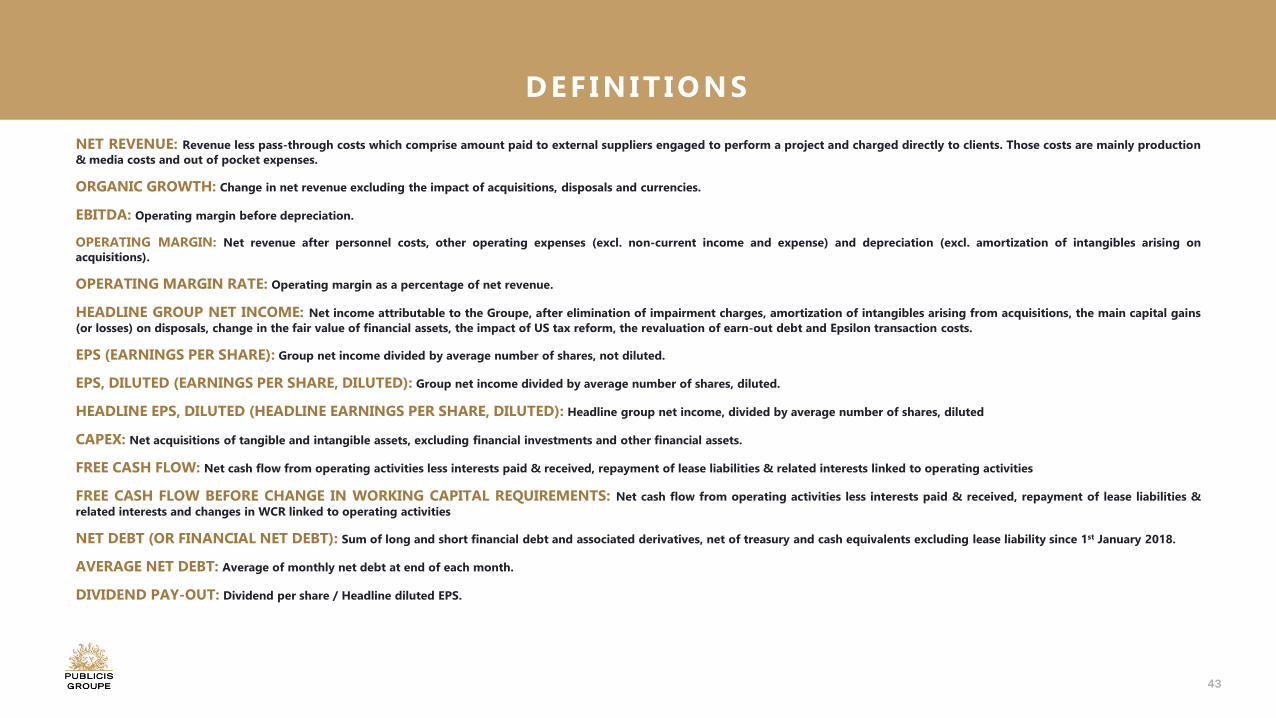
NET REVENUE: Revenue less pass-through costs which comprise amount paid to external suppliers engaged to perform a project and charged directly to clients. Those costs are mainly production
& media costs and out of pocket expenses.
ORGANIC GROWTH: Change in net revenue excluding the impact of acquisitions, disposals and currencies.
EBITDA: Operating margin before depreciation.
OPERATING MARGIN: Net revenue after personnel costs, other operating expenses (excl. non-current income and expense) and depreciation (excl. amortization of intangibles arising on
acquisitions).
OPERATING MARGIN RATE: Operating margin as a percentage of net revenue.
HEADLINE GROUP NET INCOME: Net income attributable to the Groupe, after elimination of impairment charges, amortization of intangibles arising from acquisitions, the main capital gains
(or losses) on disposals, change in the fair value of financial assets, the impact of US tax reform, the revaluation of earn-out debt and Epsilon transaction costs.
EPS (EARNINGS PER SHARE): Group net income divided by average number of shares, not diluted.
EPS, DILUTED (EARNINGS PER SHARE, DILUTED): Group net income divided by average number of shares, diluted.
HEADLINE EPS, DILUTED (HEADLINE EARNINGS PER SHARE, DILUTED): Headline group net income, divided by average number of shares, diluted
CAPEX: Net acquisitions of tangible and intangible assets, excluding financial investments and other financial assets.
FREE CASH FLOW: Net cash flow from operating activities less interests paid & received, repayment of lease liabilities & related interests linked to operating activities
FREE CASH FLOW BEFORE CHANGE IN WORKING CAPITAL REQUIREMENTS: Net cash flow from operating activities less interests paid & received, repayment of lease liabilities &
related interests and changes in WCR linked to operating activities
NET DEBT (OR FINANCIAL NET DEBT): Sum of long and short financial debt and associated derivatives, net of treasury and cash equivalents excluding lease liability since 1st January 2018.
AVERAGE NET DEBT: Average of monthly net debt at end of each month.
DIVIDEND PAY-OUT: Dividend per share / Headline diluted EPS.
DEF INIT IONS

44
Press
Delphine Stricker, Group Communications Director
Tel. + 33 6 38 81 40 00 / Email. [email protected]
Investor Relations
Alessandra Girolami, Vice-President Investor Relations & Strategic Financial Planning
Tel. + 33 1 44 43 77 88 / Email. [email protected]
Brice Paris, Investor Relations Manager
Tel. + 33 1 44 43 79 26 / Email. [email protected]
Download the Publicis IR app, the Publicis Groupe Investor Relations app dedicated to investors, analysts and media.
Available for free at the following stores: App Store: https://itunes.apple.com/us/app/publicis-ir/id1350661093?ls=1&mt=8
Google Play Store: https://play.google.com/store/apps/details?id=com.symexeconomics.pub.fr&hl=en
Publicis Groupe│133, Champs Elysées│F-75380 Paris Cedex 08│www.publicisgroupe.com│@publicisgroupe
CONTACT