Embed Size (px)
Citation preview

22 August 2013
Results for announcement to the market In accordance with the listing rules, please find attached the following documents relating to ERM Power’s results for the 12 months ended 30 June 2013: 1. ASX Appendix 4E 2. Annual Financial Report
2.1. Management Discussion and Analysis 2.2. Directors’ Report and Remuneration Report 2.3. Annual Financial Statements
Peter Jans Group General Counsel & Company Secretary ERM Power Limited

Notification in Accordance with Listing Rule 4.3A
(The amount and percentage changes are in relation to the previous corresponding period)
1. Results for the year FY 2013 FY 2012$'000 $'000
1.1. Revenue from ordinary activities:
1.1.1. Revenue from ordinary activities:
ERM Power Limited and controlled entities up 67% to 1,569,570 937,926
1.1.2. Revenue from ordinary activities excluding discount on acquisition
ERM Power Limited and controlled entities up 71% to 1,569,570 918,858
1.2. Profit from ordinary activities:
1.2.1. EBITDAIF*:
ERM Power Limited and controlled entities down 18% to 69,821 85,390
1.2.1. EBITDAIF* excluding discount on acquisition:
ERM Power Limited and controlled entities up 5% to 69,821 66,322
1.2.2. Underlying profit after tax attributable to equity holders**:
ERM Power Limited and controlled entities down 48% to 15,671 30,311
1.2.3. Underlying profit after tax attributable to equity holders** excluding discount on acquisition:
ERM Power Limited and controlled entities up 39% to 15,671 11,243
1.3. Net profit for the period attributable to equity holders:
1.3.1. Net profit for the period attributable to equity holders:
ERM Power Limited and controlled entities up 7% to 36,539 34,156
1.3.2. Net profit for the period attributable to equity holders excluding discount on acquisition:
ERM Power Limited and controlled entities up 142% to 36,539 15,088
Appendix 4EERM Power Limited
ABN 28 122 259 223
Results for announcement to the marketfor the year ended 30 June 2013
(*earnings before interest, tax, depreciation, amortisation, impairment and net fair value gains/losses on financial instruments designated at fair value through profit and loss)
(**underlying profit is statutory profit after tax adjusted for the impact of unrealised changes in fair values of financial instruments and reflects the ongoing performance of the business)

2. Dividend
4. Commentary on the results for the year
5. Net tangible assets per share 2013 2012Cents Cents
Net tangible assets (cents per share) 131 107
6. Entities in which control was gained or lost during the periodDuring the period 1 July 2012 to 30 June 2013 the Company did not gain or lose control of any entities.
7. Details of associates and joint ventures
The following entities are proportionately consolidated as joint venture entities:- NewGen Power Neerabup Pty Ltd (50%)- NewGen Neerabup Pty Ltd (50%)- NewGen Neerabup Partnership (50%)- Queensland Electricity Investors Pty Ltd (50%)- ERM Power Trust (50%)
8. Audit of financial statements
The annual financial statements have been audited and are not subject to dispute or qualification.
3. Brief explanation of any of the figures reported above or other items of importance not previously released to the market
The attached Directors' Report and Management Discussion and Analysis provide further information and explanation.
The attached Directors' Report and Management Discussion and Analysis provide further information and explanation.
A fully franked final dividend of 5.5 cents per share (2012: 4.5 cents) has been declared and will be paid on 17 October 2013. Record date is 17 September 2013. The Company’s shares will trade ex-dividend from 11 September 2013.
An interim fully franked 5 cents per share (2012: 4 cents) dividend was declared on 21 February 2013 and paid on 26 April 2013 to shareholders on record at 26 March 2013.
A final fully franked 4.5 cents per share dividend was declared on 21 August 2012 and paid on 16 October 2012 to shareholders on record at 17 September 2012.
The Company’s dividend reinvestment plan (DRP) will apply to this dividend with no discount. The last date for receipt of notifications to participate in the DRP is 17 September 2013.

ERM Power Limited
Annual Financial Report
for the year ended 30 June 2013

ERM Power Limited Annual Financial Report FOR THE YEAR ENDED 30 JUNE 2013
1
Contents Page Management Discussion and Analysis 2 Directors’ Report 19 Remuneration Report 26 Annual Financial Statements 36 Directors’ Declaration 95 Independent Auditor’s Report 96

ERM Power Limited Management Discussion and Analysis FOR THE YEAR ENDED 30 JUNE 2013
2
Contents Page 1. FY 2013 highlights and FY 2014 guidance 3 2. Group overview 4 3. Review of operating results 5 3.1 Summary of Group financial results 5 3.2 Operating division results 6 3.2.1 Electricity sales 6 3.2.2 Generation 7 3.2.3 Gas 7 3.2.4 Corporate 8 3.3 Cash flow 9 3.4 Review of financial position 9 3.4.1 Significant balance sheet movements 9 3.4.2 Net debt and capital structure 10 3.4.3 Dividend strategy and history 11 4. Business strategies and future prospects 11 4.1 Electricity sales 11 4.2 Generation 11 4.3 Other (Gas and Corporate) 11 5. Safety, environment and community 12 5.1 Safety 12 5.2 Environment 12 5.3 Community 12 Non-IFRS financial information 13 Appendices 14 Glossary 18
ERM Power Limited (ERM Power, Company, Group, we, our) was listed on the Australian Securities Exchange on 10 December 2010. This review is for the year ended 30 June 2013 with comparison against the previous corresponding period ended 30 June 2012 (previous year or previous period). All reference to $ is a reference to Australian dollars unless otherwise stated. Individual items and totals are rounded to the nearest appropriate number or decimal. Some totals may not add down the page due to rounding of individual components.

ERM Power Limited Management Discussion and Analysis (continued) FOR THE YEAR ENDED 30 JUNE 2013
3
1. FY 2013 HIGHLIGHTS AND FY 2014 GUIDANCE
Rated number 1 for customer satisfaction in the electricity business customer market
For the second year in a row, we were rated number 11 for customer satisfaction in the sale of electricity to the commercial and industrial (C&I) business customer market, up from 86% in 2011, to 93% in 2012.
Electricity Sales up 34% to 11.1 TWh
Electricity sales continued to grow strongly, up 34% to 11 TWh for the year, from 8 TWh in the previous year.
Record forward sales contracts in place
As of 30 June 2013, forward contracted electricity sales were a record 20 TWh, comprising more than 12 TWh for the immediate following year to June 2014, and a total of 19 TWh over the two years to June 2015, locking in the continuing strong growth of electricity sales by ERM Power.
Electricity sales revenue up 77% to $1.49 billion
Electricity sales revenue for the year increased by 77% over the previous year, from $842m to $1,493m. The increase in electricity sales revenue over and above the sales volume increase was the result of additional revenue created by environmental legislation (including impact of the new carbon tax), and increased network costs (passed through to customers without transaction margin).
Generation revenue up 2.4% to $72.7 million
Generation asset returns and operating services continued to deliver positive revenue and EBITDAIF returns. New generation developments remained on hold as a result of declining electricity demands.
EBITDAIF2 (adjusted for significant items) up 12% to $78.4m
Group EBITDAIF for the year, which contains a number of significant items, was $69.8m compared to $85.4m in the previous year. EBITDAIF excluding significant items was up 12% to $78.4m from $70.1m in the previous year. Appendix A1.2 contains a reconciliation of the significant items. Our electricity sales business increased its EBITDAIF by 36% to $42m, from $30.9m in the previous year, and our generation business by 15% to $39.2m from $34m.
Underlying Profit2 (adjusted for significant items) up 44% to $20.0m
Underlying profit after tax includes various items (including the $19.1m discount on acquisition in the previous year) that were not part of general operations. Excluding these, Underlying Profit was $20.0m compared to $13.9m in the previous year, an increase of 44%.
Final dividend of 5.5 cents per share to be paid on 17 October 2013
A fully franked final dividend of 5.5 cents per share has been declared and will be paid on 17 October 2013. The record date is 17 September 2013. The Company’s shares will trade ex-dividend from 11 September 2013. This dividend is 1 cent higher than last year’s final dividend.
FY14 Guidance
For the year ended 30 June 2014 we forecast EBITDAIF of $79m - $86m and Underlying Profit of $21m - $24m. This forecast excludes any arbitration income or expenses and includes costs associated with developing new businesses.
1 Based on UMI survey results – refer glossary for further details 2 Significant items include the discount on acquisition, costs in respect of the Neerabup contractor arbitration, costs incurred in respect of developing our capability to sell electricity to small to medium enterprise (SME) customers and staff rationalisation costs. Refer Appendix A1.2 for reconciliation and summary of significant items, and glossary for definition of EBITDAIF and underlying earnings
FY 2013 FY 2012 FY 2011
Electricity sold (TWh) 11.1 8.3 5.6
Electricity sales business revenue ($m) 1,493.0 842.4 486.7
Generation revenue ($m) 72.7 71.0 55.8
EBITDAIF excluding significant items2 ($m) 78.4 70.1 40.2
Underly ing Profit excluding significant items2 ($m) 20.0 13.9 6.2
Div idends paid (cents per share) 9.5 7.5 -

ERM Power Limited
Management Discussion and Analysis (continued) FOR THE YEAR ENDED 30 JUNE 2013
4
2. GROUP OVERVIEW
ERM Power Limited is a diversified energy company that operates electricity sales, electricity generation, and gas exploration and production businesses.
Our aspiration is to be the preferred supplier of energy to Australian business customers.
We are licensed to sell electricity in all Australian states and territories and are the 4th largest seller3 of electricity by volume in the National Electricity Market. We focus on selling electricity exclusively to business customers, with this segment of the market comprising approximately 12% of all customers and 70% of all electricity sold in Australia.
We own and operate 442 megawatts of low emission gas-fired power generation power stations, comprising 83.33% of the 332 megawatt (MW) Oakey Power Station (Oakey) and 50% of the 330MW Neerabup Power Station (Neerabup). We are one of Australia’s largest power development companies having led the development of more than 2,000MW of gas-fired power generation. Completed projects include the Oakey, Braemar 1 and Braemar 2 power stations in Queensland, the Uranquinty power station in New South Wales and the Kwinana and Neerabup power stations in Western Australia.
We have participated in two successive commercial gas/condensate discoveries (processing facility commissioning under way) and have equity interests in almost 12,000 km² of gas exploration acreage across Australia. Exploration tenements include conventional gas, condensate, oil and shale gas prospects. We also hold strategic shareholdings in gas exploration companies.
The diverse nature of the Group necessitates different measures to be applied to each of its operating businesses in assessing performance.
The strategic priorities of each operating business and key performance indicators and operating metrics are set out below.
Electricity sales Generation Other (Gas and Corporate)
Strategic priorities Strategic priorities Strategic priorities
- Increase market penetration - Generate appropriate average gross
margins - Enter new segments of the business
electricity market - Maintain leading customer
satisfaction position with customers
- Safe and reliable operations - Exploit merchant opportunities - Generate a stable return on assets - Identify and where appropriate,
develop new generation projects - Utilise industry expertise in operating
power stations
- Enhance value of existing gas assets - Identify and pursue new gas
investment opportunities - Attract external capital as required - Identify and pursue investment
opportunities that have strategic and commercial value
Key performance indicators and operating metrics
Key performance indicators and operating metrics
Key performance indicators and operating metrics
- Sales (load sold) - Gross margin in $ per MWh - Operating cost per in $ per MWh - Collection rate - Billing accuracy - Customer satisfaction - Demand response - Investment opportunities
- Safety - Reliability - Availability - Operating income - Fuel and operating costs - Investment opportunities
- Safety - Reliability - Availability - Production volumes - Operating cost - Reserves - Investment opportunities
3 ERM Power’s forecast league table for volume of electricity sold in the National Electricity Market (NEM) for FY 2013. The analysis draws on 2011 SRES scheme liability data, ERM Power signed contracts and broad assumptions about the market and participants. This is not an independently verified forecast.

ERM Power Limited
Management Discussion and Analysis (continued) FOR THE YEAR ENDED 30 JUNE 2013
5
3. REVIEW OF OPERATING RESULTS
3.1 Summary of Group financial results
$m FY 2013 FY 2012 Change Change %
Revenue 1,569.6 918.9 650.7 71%
Discount on acquisition - 19.1 (19.1) -100%
Expenses (1,499.8) (852.6) (647.2) -76%
EBITDAIF 69.8 85.4 (15.6) -18%
Depreciation and amortisation (14.0) (17.9) 3.9 22%
Net fair value gain on financial instruments 29.8 5.5 24.3 442%
Finance expense (31.8) (29.5) (2.3) -8%
Profit before tax 53.8 43.5 10.3 24%
Tax expense (15.3) (6.9) (8.4) -122%
Statutory net profit after tax (NPAT) 38.5 36.6 1.9 5%
Non-controlling interest (1.9) (2.4) 0.5 21%
Add back:
Net fair value gain on financial instruments after tax (20.9) (3.9) (17.0) -436%
Underlying NPAT 15.7 30.3 (14.6) -48%
Underlying NPAT excluding discount on acquisition 15.7 11.2 4.5 40%
8.9 6.8 2.1 31%
Div idends paid (cents per share) 9.5 7.5 2.0 27%
Underly ing EPS (cents per share) excluding discount on
acquisition
Group EBITDAIF for the year was $69.8m compared to $85.4m in the previous year. On a like for like basis, EBITDAIF (i.e. excluding the $19.1m discount on acquisition in the previous year and other significant items4) was 12% higher. The increase is attributable to our electricity sales business. Depreciation and amortisation decreased by $3.9m primarily as a result of a prospective change in the expected useful life of certain components of the Oakey and Neerabup power stations. Finance charges increased as a result of a full year’s use of the Macquarie working capital facility first established in the previous year. The increase in the tax expense is due to the discount on acquisition in the previous year, which is not tax affected. Group underlying earnings for the year were $15.7m compared to $30.3m in the previous year. On a like for like basis, Underlying Profit (i.e. excluding the $19.1m discount on acquisition in the previous year) was 40% higher.
Dividends paid during the year per share were 27% higher than the prior year and excluding the discount on acquisition recognised in 2012, were broadly in line with underlying earnings per share.
4 Refer Appendix A1.2 for reconciliation and summary of significant items

ERM Power Limited
Management Discussion and Analysis (continued) FOR THE YEAR ENDED 30 JUNE 2013
6
3.2 Operating division results
3.2.1 Electricity sales
FY 2013 FY 2012 Change Change %
EBITDAIF5 ($m) 42.0 30.9 11.1 36%
Sales load (TWh) 11.1 8.3 2.8 34%
Total revenue excluding interest income ($m) 1,490.1 838.8 651.3 78%
Contestable revenue ($m) 894.4 521.9 372.5 71%
Gross margin ($m) 51.7 36.8 14.9 40%
Operating expenses5 ($m) (12.5) (8.7) (3.8) -44%
Gross margin $ per MWh 4.67 4.45 0.22 5%
Operating expenses5 $ per MWh 1.13 1.06 0.07 -7%
FY 2013 financial performance
Our revenue figures have two components, contestable and pass-through. Contestable is that component on which we earn a margin and pass-through, being network charges, on which we do not. Contestable revenue per MWh increased by 29% to $81 in the year compared to $63 in the previous year. This increase was largely the effect of the introduction of the new carbon tax on 1 July 2012. We estimate that this new tax increased the wholesale price of electricity by approximately $20 per MWh for the year.
During the year, gross margin per MWh increased to $4.67 from $4.45 in the previous year reflecting the higher average margins in our portfolio. Operating costs5 per MWh have remained steady after adjusting for costs incurred for the first time in developing new business streams and advertising and branding costs.
Sales volume continues to grow strongly. This, combined with the 17% increase in forward contracted sales for the next two financial years, positions us for continued growth in the future. The geographic diversification continues with sales volumes outside Queensland rising by 2.8 TWh or 77% from 3.7 TWh to 6.5 TWh. During the year we achieved growth in Victoria of 129% and 69% in NSW. Sales volume in Queensland was steady at the previous year level, at 4.6 TWh, but with a 72% increase in customer meter numbers.
Reliance on single large customers continues to fall with sales to the average large customer falling to 2.3% of the portfolio from 4.9% in 2012.
Entry into the SME market
On 1 July 2013, we served our first customer in the Small to Medium Enterprise (SME) business customer market. This was the culmination of more than a year of preparation and positions us to expand our business customer offering. We have started with a multi- site base of customers representing a load of approximately 600 GWh over 3 years. During 2014 we intend to roll this offering out to single site customers in addition to further multi-site customers.
Customer satisfaction
In 2012 we achieved a rating of 93% in customer satisfaction6. This compared to 86% in 2011 despite increasing sales load by more than 30%. Our customers are 5 times more likely to be very satisfied (44%) than the average of our competitors.
Operational performance
Our billing accuracy exceeded 99.8% for the year and our billing collection rate exceeded 99.98%. Our conservative electricity price risk management policies remain paramount. We have achieved these industry leading performance levels by designing, building, owning and operating our own retailing processes and IT systems.
5 Adjusted for significant items. Refer Appendix A1.2 for summary of significant items
6 Based on UMI survey results – refer glossary for further details

ERM Power Limited
Management Discussion and Analysis (continued) FOR THE YEAR ENDED 30 JUNE 2013
7
3.2.2 Generation
$m FY 2013 FY 2012 Change Change %
Revenue
Oakey 39.2 34.0 5.2 15%
Neerabup 26.6 28.9 (2.3) -8%
Generation development and operations 6.9 8.1 (1.2) -15%
Total revenue 72.7 71.0 1.7 2%
EBITDAIF
Oakey 28.8 27.4 1.4 5%
Neerabup 21.7 23.6 (1.9) -8%
Generation development and operations (7.0) (6.7) (0.3) -4%
Discount on acquisition - 19.1 (19.1) -100%
Total EBITDAIF 43.5 63.4 (19.9) -31%
FY 2013 financial performance
Generation revenue for Oakey increased principally as a result of running more on diesel than gas this year. Revenue includes the cost of diesel, which is fully recovered under its off-take agreement.
EBITDAIF from generation development and operations includes costs associated with the Neerabup contractor arbitration and with some staff restructuring costs incurred during the year.
The previous year included a discount on acquisition of the controlling interest in Oakey.
Further details regarding the power station assets are contained in Appendix A1.4.
Generation development activities
Development opportunities continue to be limited by low demand. Our East coast projects are well positioned to support electricity sales growth as an alternative to buying market product. In Western Australia, we are well positioned in the mid-west minerals province. We also maintain an interest in pursuing well-priced assets in the NEM.
Power station operating performance
Oakey continues to operate as a peaking plant, having been called to run for less than 1% of the year. It ran on both gas and diesel fuel in response to dispatch directions under its off-take agreement. Oakey maintained its outstanding availability and overall performance record, with no unplanned outages during the year. Neerabup operated for 1.21% of the year with high availability and an exceptionally low forced outage rate of below 0.1%.
Safety
During the year we continued to maintain an outstanding safety record with no lost-time injuries from any staff or contractors on the facilities during commercial operation.
3.2.3 Gas
$m FY 2013 FY 2012 Change Change %
Exploration expenditure capitalised 7.4 2.6 4.8 185%
Development expenditure capitalised 8.3 - 8.3
EBITDAIF (0.8) (1.0) 0.2 20%
FY 2013 performance
Our gas business has performed well but delays on the start-up of the Red Gully processing facility have resulted in an EBITDAIF loss compared to an expected neutral position. Full production is imminent with gas and condensate sale contracts with Alcoa and BP.

ERM Power Limited
Management Discussion and Analysis (continued) FOR THE YEAR ENDED 30 JUNE 2013
8
We have exploration acreage positions on the West and East coasts of Australia with sizable potential recoverable reserves of gas and oil/condensate. The West coast positions also include shale gas prospectivity. Our current focus is on the West coast with near term activities planned for enhancing the value of investments. Our East coast opportunities are demonstrated by a gas discovery which lead ERM to invest in the prospective tenements.
The Wannamal three-dimensional seismic acquisition in WA EP389 was successfully completed and is currently being processed. The seismic will help de-risk known prospects for potential development and supply to the Red Gully gas/condensate plant. Additional wells are planned for this facility.
The Black Arrow well in WA EP432 will be drilled once final approvals are obtained, providing ERM with additional equity in this tenement which has conventional oil and gas prospects and significant Shale Gas prospectivity.
Planning of the North Erregulla 3D seismic program in EP426 is advanced, to employ modern technologies which could capitalise on the historical identification of oil in a nearby well.
We continue to consider opportunities to realise full value from our gas business including a possible demerger to enable the business to attract external capital for future growth.
3.2.4 Corporate
$m FY 2013 FY2012 Change Change %
Interest revenue 2.3 2.8 (0.5) -18%
Other revenue 1.5 2.6 (1.1) -42%
Revenue 3.8 5.4 (1.6) -30%
Office and property expenses (3.6) (2.1) (1.5) -71%
Other expenses (1.7) (1.8) 0.1 6%
Payroll and related expenses (9.7) (9.4) (0.3) -3%
Expenses (15.0) (13.3) (1.7) -13%
EBITDAIF (11.2) (7.9) (3.3) -42%
FY 2013 financial performance
Revenue was $1.6m lower than the previous year as a result of lower consulting and other income and lower interest revenue on cash deposits held. Office and property expenses increased in aggregate as a result of moving to larger premises to accommodate further growth and one-off costs resulting from the move of premises.

ERM Power Limited
Management Discussion and Analysis (continued) FOR THE YEAR ENDED 30 JUNE 2013
9
3.3 Cash flow
$m FY 2013 FY 2012 Change
Operating cashflow 99.0 39.7 59.3
Investing cashflow (40.7) (71.1) 30.4
Financing cashflow 17.4 (15.3) 32.7
Total net change in cash 75.7 (46.7) 122.4
Net cash flow from operating activities for the year was $99m compared to $39.7m in the previous year. This improvement is a result of growth in the business together with favourable working capital movements between the two periods. The previous year had unusually high purchases of renewable energy certificates leading up to key surrender dates in the second half of the year. This reflected the uncertainty resulting from the first calendar year of operation of the newly separated large scale generation and small scale technology certificates.
The reconciliation of EBITDAIF to operating cash flows, together with a summary of cash flows, is shown in Appendix A1.3.
Investing cash flows in the previous year included the purchase of the controlling interest in Oakey whilst the current year included higher cash outflows due to higher investment in gas development and exploration as well as development spending in respect of the SME business.
Financing cash flow included net proceeds of $58m following the successful capital raising in June 2013. A further $10m from a shareholder share purchase plan was received after year end.
3.4 Review of financial position
3.4.1 Significant balance sheet movements
$m FY 2013 FY 2012 Change Change %
Cash and cash equivalents 215.4 139.7 75.7 54%
Net working capital 6.7 11.2 (4.5) -40%
PPE, gas and intangible assets 482.0 462.1 19.9 4%
Net derivative financial instruments (37.3) (74.9) 37.6 50%
Net deferred tax liabilities (60.7) (52.6) (8.1) 15%
Borrowings (338.9) (308.5) (30.4) -10%
Other assets and liabilities 4.7 4.8 (0.1) -2%
Net assets 271.9 181.8 90.1 50%
Net assets increased $90m during the year. This was principally the result of the successful capital raising in June 2013, which added $58m of cash net of transaction costs, as well as favourable movements in the mark to market value of derivative financial instruments of $26m (net of deferred tax).
A full reconciliation of the $75.7m cash movement to EBITDAIF is provided in Appendix A1.3.
Contracts to sell electricity to consumers do not presently meet the definition of a financial instrument. This precludes the recognition of mark to market movements of opposing sell side contracts to an economic hedge being recognised in the statutory accounts. Only the buy side hedge contracts may be recognised for accounting purposes. The value of these customer contracts, together with internally generated intellectual property in respect of systems used as part of the electricity sales operation represent the main assets not recognised for accounting purposes.
A significant portion of both tangible property, plant and equipment and borrowings continues to relate to the generation business, whilst the less capital intensive electricity sales business continues to require further cash and cash equivalent prudential support as load sold to customers increases.

ERM Power Limited
Management Discussion and Analysis (continued) FOR THE YEAR ENDED 30 JUNE 2013
10
3.4.2 Net debt and capital structure
$m FY 2013 FY2012 Change
Corporate facilities - 15.2 (15.2)
Electricity sales working capital facility 59.1 34.2 24.9
Electricity sales environmental certificate financing 36.4 - 36.4
Term debt - recourse to Oakey Power Station project only 40.5 56.5 (16.0)
Term debt - recourse to Neerabup Power Station project only 160.8 163.0 (2.2)
Convertible notes - recourse to Neerabup Power Station project only 40.0 40.0 -
Convertible notes redemption premium * 5.2 4.0 1.2
Capitalised borrowing costs ** (3.1) (4.4) 1.3
338.9 308.5 30.4
* Redemption premium payable on maturity of notes in February 2023 of $20m. A lower redemption premium is payable on
early redemption up until 30 September 2016. Early redemption is at the option of ERM. For accounting purposes, the
maximum redemption premium of $20m is accumulated up until February 2023 using the effective interest rate method. The
effective interest rate is the rate that exactly discounts the $20m through the expected life of the convertible note.
** For accounting purposes the cost associated with establishing term and other long-term debt facilities is amortised over the
life of the respective financial liability .
During the year, the corporate facility debt of $15m was repaid. An additional financial liability relating to a sale and repurchase agreement for renewable energy certificates is recognised at 30 June 2013. The equivalent renewable energy certificate assets, over which ERM has the right of repurchase, are included within inventory at 30 June 2013. During the year approximately $16m was repaid on the term debt for the Oakey power station. This facility is due to be fully repaid by 31 December 2014.
A significant portion of the Group debt relates to long-term funding of Oakey and Neerabup. This debt is recourse only to the respective power station assets. The financing of each power station is under-pinned by power off-take agreements with investment grade counter parties.
To consider the risk of the Company’s capital structure it is appropriate to segregate the projects from the rest of the Group. The table below illustrates the gearing and interest cover for the Group. When the Oakey and Neerabup assets and associated non-recourse debt are excluded the Group has no net debt.
$m FY 2013 FY 2012 Change
Capital Risk Management
Current borrowings 122.3 72.0 50.3
Non-current borrowings 216.6 236.5 (19.9)
Total debt 338.9 308.5 30.4
Cash and cash equivalents (215.4) (139.6) (75.8)
Net debt 123.5 168.9 (45.4)
Total equity excluding reserves 306.6 218.1 88.5
Total capital 430.1 387.0 43.1
Gearing percentage 29% 44% 15%
EBITDA interest cover ratio 2.19 2.25 (0.06)
Gearing percentage is calculated as net debt divided by total capital. Net debt is calculated as total interest-bearing borrowings less cash and cash equivalents. Total capital is calculated as ‘equity’ as shown in the statement of financial position plus net debt less reserves attributable to fair value adjustments.

ERM Power Limited
Management Discussion and Analysis (continued) FOR THE YEAR ENDED 30 JUNE 2013
11
3.4.3 Dividend strategy and history
Dividends to shareholders have been at or above the 2 year forecast in the 2010 prospectus increasing at 0.5 cents per half year. This reflects the growth in the electricity sales business and the fact that the power stations are self-funding their project finance obligations. Total shareholder return over the period since the IPO on 10 December 2010 is more than 60%.
4. BUSINESS STRATEGIES AND FUTURE PROSPECTS
4.1 Electricity sales
Since our electricity sales business was established in 2007, we have grown to a position where we are now the 4th largest electricity supplier7 in the NEM with our market share at approximately 5.6% of the market. Prior to our IPO, we had focussed on penetrating the Queensland market, the limitation being insufficient prudential support to actively penetrate other markets. Since the IPO, and the resulting capital injection, we have made significant inroads into the NSW and Victorian markets growing at 69% and 129% respectively over the last year.
We started serving the SME segment of the NEM on 1 July 2013. We secured a multi-site base load of approximately 10,000 customers in NSW with a 3 year term and will target further multi-site customers as part of our growth plans. In addition, we plan to launch an online single site offering to SME customers in the 2014 financial year. The success of the online offering will be largely reliant on a focussed marketing program. We will be offering SME customers better service and value as we have in the C&I market and can see no reason why the success we have enjoyed in penetrating the C&I segment cannot be replicated in the SME segment over time.
In the coming financial year we will review and where accretive to shareholder returns, consider opportunities to establish a gas retailing operation in the eastern states. Gas retailing is a natural extensions of our business customer retailing activities. Many of our existing customers are gas users and have been enquiring as to when we will begin gas retailing. The risk and operational mechanics are similar to electricity and the business already has many staff with gas retailing experience.
4.2 Generation
The Oakey and Neerabup power stations occupy strategic peaking electricity supply positions in the markets in which they operate. Both plants are fully contracted to investment grade counterparties.
Oakey will come off contract in January 2015 at which time it will also be debt free. Subject to market conditions improving ERM will likely utilise the product internally and leverage vertical integration benefits and merchant operating opportunities. In time Oakey will crystallise its full value via vertical integration within ERM or via recontracting or sale when supply and demand tightens.
Neerabup is in the early years of its off-take and project financing arrangements and is expected to continue to operate and self-fund its debt servicing obligations until it too reaches the stage that Oakey is about to reach and be uncontracted, debt free and likely to be in near new condition.
4.3 Other (Gas and Corporate)
Gas
ERM Gas has an established strategic ownership stake in the Exploration Permit EP389 and the Red Gully gas processing facility, the closest oil and gas production centre to the Perth market. This project has also involved forming relationships with Alcoa (Western Australia’s largest gas purchaser) and BP Kwinana (condensate sales). We are now well positioned for development of step out prospects as additional discoveries are made. Three-dimensional seismic is currently being processed to delineate the next locations for near term drilling.
We are earning additional equity in the EP432 tenement (from 13.9% to 52.8%) when the Black Arrow well is drilled. Black Arrow is targeting a shallow oil prospect in a tenement which has also been identified as having significant Shale Gas potential.
Corporate
We have decided to establish a meter service business to provide meter services to our electricity sales business and also other retailers. We have the technical and commercial capability to develop this business which has strong strategic and commercial prospects.
7 ERM Power’s forecast league table for volume of electricity sold in the National Electricity Market (NEM) for FY 2013. The analysis draws on 2011 SRES
scheme liability data, ERM Power signed contracts and broad assumptions about the market and participants. This is not an independently verified forecast.

ERM Power Limited Management Discussion and Analysis (continued) FOR THE YEAR ENDED 30 JUNE 2013
12
5. SAFETY, ENVIRONMENT AND COMMUNITY
5.1 Safety Our key safety vision is to achieve “Zero Harm” to any employee or contractor, and our safety performance is measured by recording the number of injuries experienced in a year. Our employees once again achieved the safety vision of “Zero Harm” by not incurring any recordable injuries during the year. This is an excellent achievement. One medical treatment injury was incurred by a contractor working at an ERM Power operated power station. There were no permanent injuries or lost time injuries during the year. Our safety performance is the result of a commitment to implementing safety programs that focus on the key factors that could potentially lead to injuries. Our Health, Safety, Environment and Sustainability Policy provides a pathway to achieving “Zero Harm” in the workplace.
5.2 Environment Our key environmental value is to care for people and the planet, and our environmental performance is measured by recording the number of environmental incidents in a year, and monitoring carbon emissions and water usage. During the year we did not experience any reportable environmental incidents and nor were there any breaches of any environmental licence conditions. During the year Neerabup and Oakey’s carbon dioxide emissions were in line with expectations and the carbon emission intensity of the facilities were less than the average carbon emissions intensity in each state. Water usage at our power stations is low in comparison to other technologies, with little domestic fresh water used in the operation of the facilities. There were no unexpected changes in water usage at Oakey and Neerabup during the year.
5.3 Community We are proud to contribute to the communities in which we operate through partnership and sponsorship programs. We are committed to building positive and long lasting relationships by providing financial support and contributing skills, expertise and knowledge through these programs. We made donations to, or otherwise supported, a range of charities and arts, sporting and other community organisations and events either directly, or together with our partners. Our donations and support included: Gold sponsorship of the National Trust Brisbane City Hall Appeal. Sponsorship of Oakey High School students to compete in the Science and Engineering Challenge at Geelong, Victoria. Support of The Duke of Edinburgh’s Award Ambassador. Provision of tickets for Toowoomba secondary school students to attend performances by the Queensland Symphony Orchestra and
the Camerata of St John’s Chamber Orchestra. Sponsorship of the Dalby Day Nursery & Preschool Kids on Art Show. Sponsorship of the Ipswich Energy representative basketball team to travel to Rockhampton to compete in the state championships. Contributions to Australian Cancer Research, the Cure Cancer Foundation and the AEIOU Foundation. Community events such as a special bowls event at Southport Bowls Club.
We also engaged with the Wellington community in New South Wales though sponsorship of the 2012 Wellington Eisteddfod.

ERM Power Limited
Management Discussion and Analysis (continued) FOR THE YEAR ENDED 30 JUNE 2013
13
NON-IFRS FINANCIAL INFORMATION
The directors believe the presentation of certain non-IFRS financial measures is useful for the users of this document as they reflect the underlying financial performance of the business.
The non-IFRS financial measures include but are not limited to:
1. EBITDAIF - Earnings before interest, tax, depreciation, amortisation, impairment and net fair value gains / losses on financial instruments designated at fair value through profit and loss and gains/losses on onerous contracts.
2. Underlying Profit - Statutory net profit after tax attributable to equity holders of the Company after excluding the after tax effect of unrealised marked to market changes in the fair value of financial instruments, impairment and gains/losses on onerous contracts.
A reconciliation of Underlying Profit and EBITDAIF is detailed in Appendix A1.1 of this document. The above non-IFRS financial measures have not been subject to review or audit. However, the Company’s auditor, PricewaterhouseCoopers, have separately undertaken a set of procedures to agree the non-IFRS financial measures disclosed to the books and records of the consolidated entity.
The directors believe that EBITDAIF and Underlying Profit provide the most meaningful indicators of the Group’s underlying business performance.
The Group is required to value its forward electricity purchase contracts at market prices at each reporting date. Changes in values between reporting dates are recognised as unrealised gains or losses in the particular reporting period. These fair value gains net of tax are the only adjustments made to Statutory Profit to arrive at underlying profit for each of the years presented.

ERM Power Limited
Management Discussion and Analysis (continued) FOR THE YEAR ENDED 30 JUNE 2013
14
APPENDICES A1.1 Reconciliation of EBITDAIF to Underlying Profit
$m FY 2013 FY 2012 Change Change %
EBITDAIF 69.8 85.4 (15.6) -18%
Depreciation and amortisation (14.0) (17.9) 3.9 22%
Finance expense (31.8) (29.5) (2.3) -8%
Underly ing profit before tax 24.0 38.0 (14.0) -37%
Income tax expense attributed to underly ing profit (6.4) (5.3) (1.1) -21%
Non-controlling interest (1.9) (2.4) 0.5 21%
15.7 30.3 (14.6) -48%
Items excluded from underly ing profit:
- Net fair value gain on financial instruments 29.8 5.5 24.3 442%
- Tax credit on items excluded from underly ing profit (8.9) (1.6) (7.3) 456%
- Non-controlling interest 1.9 2.4 (0.5) 21%
Statutory profit after tax 38.5 36.6 1.9 5%
Underly ing profit after tax attributable to equity holders of
the Company
The reconciling items shown above are the unrealised changes in market values of financial instruments that the Group routinely enters into as part of risk management.

ERM Power Limited
Management Discussion and Analysis (continued) FOR THE YEAR ENDED 30 JUNE 2013
15
A1.2 Reconciliation of significant items
To allow shareholders to make an informed assessment of operating performance for the period, a number of significant items of revenue or expense in each period have been identified and excluded to calculate an adjusted underlying EBITDAIF and NPAT measure. These items may relate to one-off transactions or revenue or costs recognised during the period that are not expected to routinely occur as part of the Group’s normal operations. A reconciliation of adjusted EBITDAIF and adjusted underlying earnings are shown in the tables below. The discount on acquisition in respect of the purchase of the controlling interest in the Oakey Power station in 2012 is also reflected as a significant item adjustment.
$m FY 2013 FY 2012
Statutory EBITDAIF 69.8 85.4
Significant item adjustments
- Discount on acquisition - (19.1)
- Other significant items 8.6 3.8
Adjusted EBITDAIF 78.4 70.1
$m FY 2013 FY 2012
Statutory underly ing NPAT 15.7 30.3
Significant item adjustments
- Discount on acquisition - (19.1)
- Other significant items 4.3 2.7
Adjusted underly ing NPAT 20.0 13.9
The below table sets out the adjusting items recognised above together with the breakdown between operating segments:
$m FY 2013 FY 2012
EBITDAIF adjustments
a. SME start-up and marketing campaign costs 3.4 -
b. Restructuring costs 0.8 -
c. Arbitration costs 4.4 3.8
Total EBITDAIF adjusting items 8.6 3.8
d. Prospective depreciation adjustment (2.4) -
e. Tax effect of significant items (1.9) (1.1)
Total underlying profit adjusting items 4.3 2.7
a) Costs incurred in respect of developing our capability to sell electricity to SME customers and advertising and branding expenditure
in respect of the advertising campaign and brand launch earlier in the financial year (attributable to the electricity sales division).
b) Staff rationalisation costs (attributable to the following divisions - $0.3m electricity sales, $0.4m generation, $0.1m corporate).
c) Costs in respect of the Neerabup contractor arbitration (attributable to the generation division).
d) Revision to the estimated useful lives of certain components of the power generation assets, which was applied prospectively from 1
July 2012 (attributable to the generation division).
e) Tax effect of total gross adjustments.
ERM Power Limited
Management Discussion and Analysis (continued) FOR THE YEAR ENDED 30 JUNE 2013
16
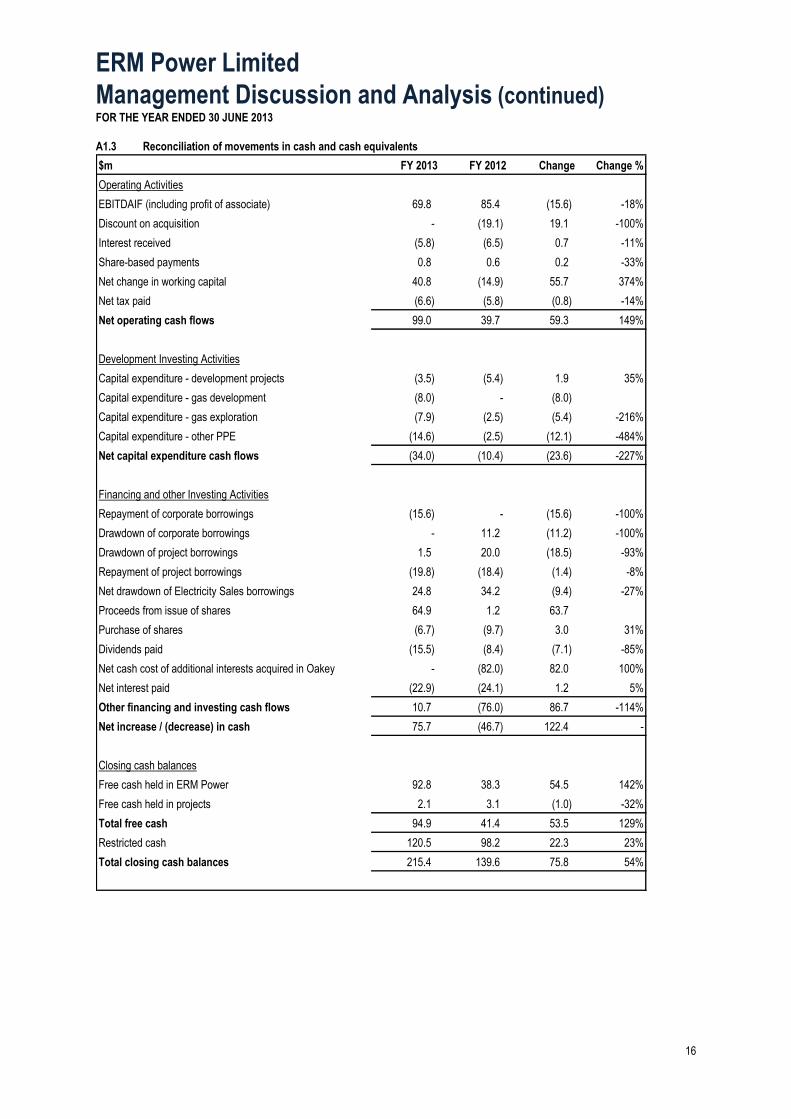
A1.3 Reconciliation of movements in cash and cash equivalents
$m FY 2013 FY 2012 Change Change %
Operating Activities
EBITDAIF (including profit of associate) 69.8 85.4 (15.6) -18%
Discount on acquisition - (19.1) 19.1 -100%
Interest received (5.8) (6.5) 0.7 -11%
Share-based payments 0.8 0.6 0.2 -33%
Net change in working capital 40.8 (14.9) 55.7 374%
Net tax paid (6.6) (5.8) (0.8) -14%
Net operating cash flows 99.0 39.7 59.3 149%
Development Investing Activities
Capital expenditure - development projects (3.5) (5.4) 1.9 35%
Capital expenditure - gas development (8.0) - (8.0)
Capital expenditure - gas exploration (7.9) (2.5) (5.4) -216%
Capital expenditure - other PPE (14.6) (2.5) (12.1) -484%
Net capital expenditure cash flows (34.0) (10.4) (23.6) -227%
Financing and other Investing Activities
Repayment of corporate borrowings (15.6) - (15.6) -100%
Drawdown of corporate borrowings - 11.2 (11.2) -100%
Drawdown of project borrowings 1.5 20.0 (18.5) -93%
Repayment of project borrowings (19.8) (18.4) (1.4) -8%
Net drawdown of Electricity Sales borrowings 24.8 34.2 (9.4) -27%
Proceeds from issue of shares 64.9 1.2 63.7
Purchase of shares (6.7) (9.7) 3.0 31%
Dividends paid (15.5) (8.4) (7.1) -85%
Net cash cost of additional interests acquired in Oakey - (82.0) 82.0 100%
Net interest paid (22.9) (24.1) 1.2 5%
Other financing and investing cash flows 10.7 (76.0) 86.7 -114%
Net increase / (decrease) in cash 75.7 (46.7) 122.4 -
Closing cash balances
Free cash held in ERM Power 92.8 38.3 54.5 142%
Free cash held in projects 2.1 3.1 (1.0) -32%
Total free cash 94.9 41.4 53.5 129%
Restricted cash 120.5 98.2 22.3 23%
Total closing cash balances 215.4 139.6 75.8 54%

ERM Power Limited
Management Discussion and Analysis (continued) FOR THE YEAR ENDED 30 JUNE 2013
17
A1.4 Power station assets
$m FY 2013 FY 2012 Change Change %
Oakey power station (100%)
Property, plant and equipment 234.1 240.1 (6.0) -2%
Net tangible assets 209.3 197.5 11.8 6%
Borrowings 38.9 53.9 (15.0) -28%
EBITDA 28.8 27.4 1.4 5%
EBIT 21.2 17.4 3.8 22%
Interest expense (4.7) (4.9) 0.2 -4%
Depreciation (7.7) (10.0) 2.3 23%
$m FY 2013 FY 2012 Change Change %
Neerabup power station (50% )
Property, plant and equipment 177.8 181.9 (4.1) -2%
Net tangible assets (10.5) (10.2) (0.3) 3%
Borrowings 204.5 205.2 (0.7) -
EBITDA 21.7 23.6 (1.9) -8%
EBIT 17.4 16.8 0.6 4%
Interest expense (17.8) (18.4) 0.6 -3%
Depreciation (4.3) (6.7) 2.4 36%

ERM Power Limited Management Discussion and Analysis (continued) FOR THE YEAR ENDED 30 JUNE 2013
18
GLOSSARY $m Millions of dollars
C&I Commercial and Industrial
Contestable Revenue Contestable revenue is the electricity sales revenue component on which we earn a margin and excludes pass-through items such as network charges.
EBITDAIF Earnings before interest, tax, depreciation, amortisation, impairment and net fair value gains / losses on financial instruments designated at fair value through profit and loss and gains/losses on onerous contracts.
EBIT Earnings before interest and taxes
FY Financial year ended or ending 30 June
GWh Gigawatt hours, abbreviated as GWh, is a unit of energy representing one billion watt hours
IFRS International Financial Reporting Standards
MWh Megawatt hours, abbreviated as MWh, is a unit of energy representing one million watt hours
NEM The National Electricity Market
NPAT Net profit after tax
SME Small to Medium Enterprise
TWh Terawatt hours, abbreviated as TWh, is a unit of energy representing one thousand gigawatt hours (GWh)
UMI Survey Utility Market Intelligence (UMI) 2012 survey of retail electricity industry by independent research company The NTF Group in November and December 2012, and January 2013 (17th year of Survey). The 2012 UMI survey was based on a survey of 495 C&I customers, drawn in approximately equal proportions from the five major energy retailers.
Underlying Profit Statutory net profit after tax attributable to equity holders of the Company after excluding the after tax effect of unrealised marked to market changes in the fair value of financial instruments, impairment and gains/losses on onerous contracts.

ERM Power Limited
Directors’ Report FOR THE YEAR ENDED 30 JUNE 2013
19
In accordance with the Corporations Act 2001, the directors of ERM Power Limited (“Company”) report on the Company and the consolidated entity ERM Power Group (“Group”), being the Company and its controlled entities, for the year ended 30 June 2013 (“the year”).
1. PRINCIPAL ACTIVITIES
The principal activities of the Group during the year were:
electricity sales to business;
generation of electricity; and
gas exploration and procurement.
2. OPERATING RESULTS FOR THE YEAR
A review of the operating results of the Group can be found in the Management Discussion and Analysis (“MD&A”) on pages 2 to 18.
3. REVIEW OF OPERATIONS A review of the operations of the Group can be found in the MD&A on pages 2 to 18.
4. BUSINESS STRATEGIES AND PROSPECTS A review of the business strategies and prospects of the Group can be found in the MD&A on pages 2 to 18.
5. SIGNIFICANT CHANGES IN THE STATE OF AFFAIRS
5.1 Increase in electricity sales working capital facility In September 2012, the financing facility with Macquarie was increased by $45 million, of which the working capital component
increase was $40 million. The total facility with Macquarie at 30 June 2013 was $195 million. The facility increase provides funding support for growth in existing commercial and industrial sales markets as well as for entry into the small to medium enterprise (SME) market.
5.2 Increase in East coast gas interests In September 2012, the Group acquired a direct interest in three petroleum exploration permits in the Clarence Moreton Basin on
the NSW East coast and took a placement of shares in Red Sky Energy Limited. The transaction allows the Group to farm into these prospective gas tenements on the East coast, and provides optionality to acquire 100% ownership interests in these tenements for a period of 38 months.
5.3 Marketing campaign During the year the Company undertook its first marketing campaign at a cost of approximately $1 million. The campaign has been well received by both new and existing customers. Previous market research highlighted that ERM was not well known by most of our competitor’s customers. The marketing campaign targeted business energy customers large and small.
5.4 Entry into the SME market During the year the Company prepared to enter the SME market. Entering the SME market with the same operational excellence
focus as our large customer business is our immediate goal.
6. EVENTS AFTER BALANCE DATE
In July 2013 the Company successfully completed a share purchase plan raising $10 million. Since 30 June 2013 there have been no other matters or circumstances not otherwise dealt with in the Financial Report that have
significantly or may significantly affect the Group. 7. LIKELY DEVELOPMENTS AND EXPECTED RESULTS Apart from the matters referred to in the MD&A on pages 2 to 18, information as to other likely developments in the operations of the Group and the expected results of those operations in subsequent financial years has not been included in this report because the directors believe this could result in unreasonable prejudice to the Group. 8. PROCEEDINGS ON BEHALF OF THE COMPANY No person has brought or intervened in on behalf of the Company with an application for leave under section 237 of the Corporations Act (2001).

ERM Power Limited
Directors’ Report (continued) FOR THE YEAR ENDED 30 JUNE 2013
20
9. DIVIDENDS Subsequent to year end, the directors have declared a final dividend in respect of the 2013 financial year as follows:
Amount: 5.5 cents per share Franking: Fully franked Date Payable: 17 October 2013
The dividend has not been provided for in the 2013 financial statements. During the year the Company paid an interim fully franked dividend of 5.0 cents per share (2012: 4.0 cents), together with a fully franked final dividend of 4.5 cents per share in respect of the previous year. 10. SHARE OPTIONS
10.1 Unissued shares As at the date of this report, there were 1,477,794 options on issue, exercisable into fully paid ordinary shares. The options do not carry any entitlement to participate in any share issue of the Company. In respect of those options with a 2017 expiry date, the options lapse on termination of employment, unless otherwise determined by the board. Expiry date Quantity Exercise price
1 November 2017 1,235,088 275 cents
8 November 2017 242,706 275 cents
10.2 Shares issued on exercise of options 8,488,868 ordinary shares were issued during the year on the exercise of options at an exercise price of $0.806 per share. The options were issued in June 2008. No amounts are unpaid on any of the shares. 11. DIRECTORS AND COMPANY SECRETARIES The directors of the Company during the year and up to the date of this report are:
Anthony (Tony) Bellas Independent Non-Executive Chairman1
Trevor St Baker Non-Executive Deputy Chairman and Founder2
Martin Greenberg Independent Non-Executive Director
Brett Heading Independent Non-Executive Director
Antonino (Tony) Iannello Independent Non-Executive Director
Philip St Baker Managing Director and CEO
1 Tony Bellas replaced Trevor St Baker as Chairman on 21 October 2011 2 Trevor St Baker was appointed Deputy Chairman on 22 February 2012
Information on Directors and Company Secretaries Anthony Bellas MBA, BEc, DipEd, CPA, FAIM, MAICD. Tony was appointed as Chairman of the Company on 21 October 2011, having served as director since December 2009. He brings almost 25 years of policy and operational experience in the energy industry to the business. Tony was previously CEO of the Seymour Group, one of Queensland’s largest private investment and development companies. Prior to joining the Seymour Group, Tony held the position of CEO of Ergon Energy, a Queensland Government-owned corporation involved in electricity distribution and retailing. Before that, he was CEO of CS Energy, also a Queensland Government-owned corporation and the State’s largest electricity generation company, operating over 3,500 MW of gas-fired and coal-fired plant at four locations. Tony had a long career with Queensland Treasury, achieving the position of Deputy Under Treasurer. In 2000, as an Assistant Under Treasurer, he was responsible for the Industry and Energy Division of Queensland Treasury and was heavily involved in formulating the State Government’s energy strategy. Tony is a director of the listed companies shown below and is also a director of Gasfields Water Management Pty Ltd, Loch Explorations Pty Ltd, QIP Coal Pty Ltd, West Bengal Resources (Australia) Pty Ltd and the Endeavour Foundation.

ERM Power Limited
Directors’ Report (continued) FOR THE YEAR ENDED 30 JUNE 2013
21
Other listed company directorships in the last three years: Shine Corporate Ltd Since March 2013
Corporate Travel Management Limited Since June 2010 Guilford Coal Limited (December 2010 - June 2012) Watpac Limited (December 2007 - October 2010) Special Responsibilities Chairman of the Nomination Committee and a member of the Audit and Risk Committee, the Remuneration Committee and the Health, Safety, Environment and Sustainability Committee. Trevor St Baker BEng, BA, FAusIMM, FIEAust, FAIE, MAICD
Trevor founded ERM Power and is currently a Non-Executive Director and Deputy Chairman. Trevor has over 50 years’ experience in the energy industry, including 23 years in planning and leadership roles within NSW and Queensland public utilities. These roles incorporated the establishment of the first Energy Resources Division in Queensland in 1975 and subsequent deregulation of power station fuel procurement in the State, development of Blackwater and Curragh steaming coal developments, and long term coal procurement to underpin the Gladstone, Tarong, Callide B and Stanwell power station developments.
In 1980 Trevor founded companies which have evolved into ERM Power. For the first 15 years, as Principal of ERM Consultants Pty Ltd, Trevor created a successful boutique energy consulting and advisory firm. In the late 1990’s, as Executive Chairman of Energy Resource Managers Pty Ltd, Trevor established one of Australia’s first private power development companies, developing firstly the Oakey power station, in Queensland, and then a further five new gas-fired power stations, in Western Australia, NSW and Queensland. Since 2006, ERM Power has successfully diversified to become an integrated energy company which operates electricity sales, generation and gas businesses.
Trevor plays an active role in the broader energy industry with current positions including Chairman of the National Generators Forum Limited, and non-executive director roles on the boards of the Energy Policy Institute of Australia Limited, Queensland Resources Council Ltd, Master Electricians Australia Limited and Safety Connect Australian Pty Ltd, as well as SMR Nuclear Technology Pty Ltd and Tritium Pty Ltd. He also co-founded St Baker Wilkes Indigenous Educational Foundation Limited, of which he is the Chairman.
Special Responsibilities
Member of the Audit and Risk Committee and the Nomination Committee, Director of Oakey Power Holdings Pty Ltd since 2000 and Chairman of the operating committee of NewGen Neerabup Partnership.
Martin Greenberg BBus, DipCom, FCPA, JP, MAICD Martin was appointed as a director in July 2007, bringing finance credentials and business experience spanning 35 years. Martin is currently the Managing Director of Apollan Investments Group, a Sydney based company specialising in venture capital, corporate finance, securities, and general investment. He is also the current Chairman of Selector Funds Management Ltd and Liquid Capital Management (Australasia) Pty Ltd. From 1986 to 1999, Martin was a director of Babcock & Brown, an international investment bank. Prior to this he was a director of Morgan Grenfell Australia Limited and a Senior Vice President with Security Pacific Group in London. Martin has been a director of several public companies in Australia and New Zealand and has an extensive range of national and international contacts and experience, accumulated over the past 35 years. Special Responsibilities Chairman of the Audit and Risk Committee, and member of the Remuneration Committee and the Nomination Committee.

ERM Power Limited
Directors’ Report (continued) FOR THE YEAR ENDED 30 JUNE 2013
22
Brett Heading BCom, LLB (Hons), FAICD Brett was appointed as a director in October 2010 bringing extensive experience as a corporate lawyer and company director. Brett has specialised in corporate law for 25 years, including mergers and acquisitions, capital raising, ASX listings and advising boards of listed and unlisted public companies and government-owned corporations. He has been a partner of McCullough Robertson Lawyers since 1985 and was appointed Chairman of Partners in 2004. Brett has been a director of the listed companies shown below and a number of unlisted companies. He has also held roles on Federal Government boards, having been a longstanding member of the Takeovers Panel (1998 to 2009) and the Board of Taxation (2000 to 2009). Other listed company directorships in the last three years: Invion Limited Since February 2012 Trinity Limited Since August 2009 ChemGenex Pharmaceuticals Limited (June 2002 - July 2011) Special Responsibilities Member of the Remuneration Committee and Nomination Committee. Antonino Iannello BCom, FCPA, SFFSIA, Harvard Business School Advanced Management Program, FAICD Tony was appointed as a director in July 2010, bringing to the business more than 30 years of banking and energy experience. He is a director of the listed companies shown below. He is the Non-Executive Chairman of HBF Health Ltd, MG Kailis Group, and D’Orsogna Ltd. He is a director of St Baker Wilkes Indigenous Educational Foundation Limited, Water Corporation of Western Australia, and a member of The Murdoch University Senate. Prior to embarking on a career as a non-executive director, Tony was the Managing Director of Western Power Corporation until its separation into four separate businesses. Previously he held a number of senior executive positions at BankWest. Other listed company directorships in the last three years: Energia Minerals Limited Since March 2010 SP Ausnet* Since June 2006 Aviva Corporation Limited (February 2008 - November 2010) *The SP Ausnet “stapled group” of companies comprises SP Australia Networks (Distribution) Ltd, SP Australia Networks (Transmission) Ltd & SP Australia Networks (Finance) Trust. Special Responsibilities Chairman of the Remuneration Committee and member of the Audit and Risk Committee and Nomination Committee. Philip St Baker BEng, MAICD Philip was appointed as Managing Director and CEO in July 2006. Since this time the company has transformed from a successful and emerging private power development company with annual turnover under $10 million, into one of Australia’s fastest growing diversified energy companies listed on the Australian Securities Exchange with annual turnover in excess of $1 billion.
Today the company operates electricity sales, generation and gas businesses, and is well on its way to achieving its aspiration to become the preferred energy supplier to business customers across Australia.
Philip has more than 20 years of international experience in the resources and energy industry including exploration, mining, processing, smelting, refining, power and gas. Prior roles also include Vice President of Queensland Nickel QNI and CEO of NewGen Power. Special Responsibilities Chairman of Oakey Power Holdings Pty Ltd and chairman of the Heath, Safety, Environment and Sustainability Committee.

ERM Power Limited
Directors’ Report (continued) FOR THE YEAR ENDED 30 JUNE 2013
23
Company Secretaries Peter Jans LLB (Hons), MA Peter joined the Group in July 2007 and was appointed as Company Secretary in March 2008. He is an affiliate of the Institute of Chartered Secretaries, a member of the Queensland Law Society, Barrister and a Solicitor of the Supreme Court of Victoria and a Solicitor of the Supreme Court of Queensland and the High Court of Australia. He has practised as a lawyer for over 30 years in the corporate, property, international investment, energy and resource sectors. After an active career in private practice, Peter became General Counsel of CS Energy in the late 1990s and was involved in major electricity generation projects, including Callide C, Swanbank E and Kogan Creek. Peter was General Counsel and Company Secretary of Queensland Gas Company Limited from April 2005 until July 2007, during which period the company transformed from junior explorer to a major gas producer. Special Responsibilities Peter’s role and responsibility covers the whole of the Group’s broader business plans and portfolios, including business development, construction and operations, sales and gas activities. Peter is responsible for all aspects of the Group’s legal dealings, and for compliance and corporate governance. Graeme Walker BCom, CA, CA(SA), FAICD Graeme joined the Group in April 2009 and was appointed as joint Company Secretary in December 2009. As Chief Financial Officer, he is responsible for the financial management and control of the Group. Graeme has served as CFO of a number of major ASX-listed companies in the resources sector, including Normandy Mining Limited and Ampolex Limited, where he was involved in significant business growth and corporate activity. He subsequently provided consulting services to a number of companies, advising on financial and commercial services, as well as interim management. During this time he was also involved in the listing of a number of resource companies, as a non-executive director.
12. MEETINGS OF DIRECTORS The number of meetings of the board of directors and each board committee held during the financial year, and the numbers of meetings attended by each director are as follows:
Board meetings
Meetings of committees
Audit & Risk Nomination Remuneration
A B A B A B A B
Tony Bellas 12 13 5 5 1 1 2 2
Trevor St Baker 11 13 5 5 0 1 ** **
Martin Greenberg 12 13 5 5 1 1 2 2
Brett Heading 11 13 ** ** 0 1 2 2
Tony Iannello 13 13 5 5 1 1 2 2
Philip St Baker 13 13 ** ** ** ** ** **
A = number of meetings attended
B = number of meetings held during the time the director held office during the year
** = Not a member of the relevant committee
The Group has a Health, Safety, Environment and Sustainability Committee. Committee members include the Chairman, the Managing Director and other senior management. This committee met four times during the financial year.

ERM Power Limited
Directors’ Report (continued) FOR THE YEAR ENDED 30 JUNE 2013
24
13. DIRECTORS’ INTERESTS The relevant interest of each director in the share capital of the Company at the date of this report, as notified by directors to the ASX in accordance with Section 205G of the Corporations Act, is a follows:
Ordinary shares Options to acquire ordinary shares
Tony Bellas 106,250 -
Trevor St Baker 85,200,647 -
Martin Greenberg 571,794 -
Brett Heading 14,285 -
Tony Iannello 125,694 -
Philip St Baker 5,968,022 242,706
14. ENVIRONMENTAL REGULATION AND PERFORMANCE The Group’s environmental obligations are regulated by relevant federal, state and local government ordinances. During the year ended 30 June 2013, the Group did not experience any reportable environmental incidents and nor were there any breaches of any environmental licence conditions. 15. INDEMNIFICATION AND INSURANCE OF OFFICERS Insurance and indemnity arrangements are in place for directors and officers of the Group. Disclosure of premiums and coverage is not permitted by the contract of insurance. To the extent permitted by law, the Group indemnifies every person who is or has been an officer against:
any liability to any person (other than the Company, related entities or a major shareholder) incurred whilst acting in that capacity and in good faith; and
costs and expenses incurred by that person in that capacity in successfully defending legal proceedings and ancillary matters.
For this purpose, “officer” means any company secretary or any person who makes or participates in making decisions that affect the whole, or a substantial part of the business of the Company or Group. 16. AUDITOR’S INDEPENDENCE DECLARATION A copy of the auditor’s independence declaration as required under section 307C of the Corporations Act 2001 is included in the Annual Financial Statements which accompany this report.
17. NON AUDIT SERVICES Non-audit services provided by the Group’s auditors PricewaterhouseCoopers were in relation to advice and certain agreed upon procedures. The directors are satisfied that the provision of non-audit services is compatible with the general standard of independence for auditors imposed by the Corporations Act 2001.
Amounts received or due and receivable by PricewaterhouseCoopers Australia for non-audit services:
2013
$
2012
$
Other agreed-upon procedures in relation to the entity and any other entity in the consolidated Group
199,930 70,000
18. ROUNDING OF AMOUNTS The amounts contained in this report and in the financial report have been rounded to the nearest thousand dollars (where rounding is applicable) under the option available to the Group and the Company under ASIC Class Order 98/100. The Group and the Company are entities to which the class order applies.

ERM Power Limited
Directors’ Report (continued) FOR THE YEAR ENDED 30 JUNE 2013
25
19. REMUNERATION REPORT The Remuneration Report is attached and forms part of this report.
This report is made in accordance with a resolution of the board of directors.
Tony Bellas
Chairman
22 August 2013

ERM Power Limited
Remuneration Report FOR THE YEAR ENDED 30 JUNE 2013
26
The directors present the Remuneration Report for ERM Power Limited (“Company”) and its consolidated entities (“Group”) for the year ended 30 June 2013.
1. REMUNERATION FRAMEWORK
1.1 Role of the Remuneration Committee The Remuneration Committee ensures that the remuneration of directors and senior executives is consistent with market practice and sufficient to ensure that the Company can attract, develop and retain the best individuals. The committee reviews the remuneration of the Managing Director and senior executives against the market, and against Group and individual performance. It also reviews non-executive directors’ fees against the market, with due regard to responsibilities and demands on time. The committee oversees governance procedures and policy on remuneration including:
General remuneration practices,
Performance management,
Equity plans and incentive schemes, and
Recruitment and termination.
Through the committee, the board ensures that the Company’s remuneration philosophy and strategy continues to be focused to:
Attract, develop and retain first class director and executive talent
Create a high performance culture by driving and rewarding executives for achievement of the Company's strategy and business objectives
Link incentives to the creation of shareholder value
In undertaking its work, the committee seeks the advice of external remuneration consultants who provide analysis to ensure remuneration levels are set to reflect the market for comparable roles. In May 2013, the committee employed the services of Ernst & Young (“EY”) to provide benchmarking analysis and review the remuneration framework of the non-executive directors, the Managing Director and senior executives. No remuneration recommendations were made by EY in relation to any of the Key Management Personnel as defined by the Corporations Amendment (Improving Accountability on Director and Executive Remuneration) Act 2011 for FY 2013.
1.2 Key Management Personnel Key Management Personnel (“KMP”) are those persons having authority and responsibility for planning, directing and controlling the activities of the Group, directly or indirectly and include directors’ of the Company. The term KMP refers to the following persons who were KMPs during the financial year. Unless otherwise indicated, they were KMPs for the entire year. Non-Executive Directors Tony Bellas Trevor St Baker Martin Greenberg Brett Heading Tony Iannello Senior Executives Philip St Baker Managing Director and CEO William (Mitch) Anderson CEO – Electricity Sales Peter Jans Group General Counsel and Company Secretary Derek McKay CEO – Generation Graeme Walker Chief Financial Officer

ERM Power Limited
Remuneration Report (continued) FOR THE YEAR ENDED 30 JUNE 2013
27
2. REMUNERATION
2.1 Fees payable to Non-Executive Directors Fees are determined by the demands on, and responsibilities of directors and are reviewed annually by the board. Independent advice is sought from remuneration consultants to ensure directors’ fees are appropriate and in line with the market. The latest review of fees was conducted in June 2013. Non-Executive directors’ fees are determined within an aggregate fee pool limit of $800,000, which limit was approved by shareholders at the annual general meeting held on 7 June 2010. Fees received by each director comprise a base fee together with additional fees dependent on the various offices they hold as set out in Table 1, with superannuation contributions made at the rates and limits prescribed from time to time by legislation. Non-Executive directors do not receive any performance-related remuneration. The accounting value of fees paid to each non-executive director is shown in Table 2. Table 1 – Directors’ Fees Structure
Non-Executive Director Fees (excluding superannuation) 2013
$
20121
$
Chairman 160,000 160,000
Non-Executive directors 105,000 105,000
Additional fees
Audit Committee - chairman 20,000 20,000
Audit Committee - member 10,000 10,000
Remuneration Committee - chairman 10,000 10,000
Remuneration Committee - member 5,000 5,000
Representation on non-wholly owned subsidiary boards 25,000 each 25,000 each
1. 2012 fee changes implemented on 22 October 2011
Table 2 – Directors’ Fees
Short-term benefits Post-
employment benefits
Total remuneration per income statement5
Cash salary and fees
Non-monetary benefits1
Superannuation entitlement
$ $ $ $
Tony Bellas2 2013 175,000 9,940 15,750 200,690
2012 161,371 2,016 14,523 177,910
Trevor St Baker2 2013 165,000 19,910 14,850 199,760
2012 183,226 7,891 16,490 207,607
Martin Greenberg 2013 130,000 - 11,700 141,700
2012 126,774 - 11,410 138,184
Brett Heading3 2013 119,900 - - 119,900
2012 127,001 - - 127,001
Tony Iannello4 2013 125,000 - 11,250 136,250
2012 125,000 - 11,250 136,250
Total 2013 714,900 29,850 53,550 798,300
2012 723,372 9,907 53,673 786,952
1. Non-monetary benefits include car parking benefits and FBT. 2. Tony Bellas replaced Trevor St Baker as Chairman on 21 October 2011 3. Appointed on 12 October 2010. Remuneration in 2012 included $7,101 that related to the prior financial year (2011). 4. Appointed on 19 July 2010. 5. The value of remuneration consisting of options was nil in both 2013 and 2012.

ERM Power Limited
Remuneration Report (continued) FOR THE YEAR ENDED 30 JUNE 2013
28
2.2 Remuneration of Managing Director and Senior Executives The objective of the Company’s executive remuneration framework is to ensure that reward for performance is competitive and appropriate for the results delivered. The framework aligns executive remuneration with the achievement of strategic objectives and the creation of the value for shareholders, and conforms to market practice. The board ensures that executive reward satisfies the following key criteria for good reward governance practices:
Competitiveness and reasonableness,
Acceptability to shareholders,
Performance linkage/alignment of executive remuneration, and
Transparency.
Senior executives are remunerated by way of a mix of fixed and variable remuneration in a manner that motivates them to pursue the long term growth and success of the Group. The components of remuneration are:
Base pay and benefits, including superannuation,
Short term and long term incentives, and
Other cash or equity based discretionary incentives.
Short term incentives are focused on achieving annual profit and operational targets, whilst long term incentives are focused on achieving long term growth. The board considers this combination an effective way to align incentives to shareholder value. In accordance with the objective of ensuring that executive remuneration is aligned to Group performance, a significant portion of executives target pay is at risk. The remuneration target is for a fixed remuneration level around the mean and a total remuneration close to or above the 75th percentile of comparator groups on achieving strong performance. Table 3 sets out the executives’ target remuneration mix for the 2013 financial year. Table 3 – Executive Target Remuneration Mix
Base pay and superannuation
Target short term
incentive
Target long term incentive
Total target remuneration
Managing Director and CEO 45% 25% 30% 100%
Other Senior Executives 60% 23% 17% 100%
2.2.1 Base salary and benefits Remuneration and other terms of employment for the Managing Director and the other senior executives are formalised in service agreements. Each of these agreements specify the components of remuneration to which they are entitled and outline base salary, the provision of incentives, and other benefits including superannuation and salary continuance insurance. External remuneration consultants provide analysis and advice to ensure executive remuneration is set at levels that reflect the market for comparable positions. Remuneration is reviewed annually to ensure that it is competitive with the market. Remuneration is also reviewed on promotion or change of role. There are no guaranteed base salary increases included in executive service agreements. Tables 5 at the end of this section provides details of total remuneration during the financial year to the Managing Director and each of the named executives. 2.2.2 Incentive Schemes Variable remuneration is in the form of short term (“STI”) and long term (“LTI”) incentives which represent at risk remuneration. STIs are paid annually against agreed objective key performance indicators (“KPIs”) which are designed to align the interests of the Company and its shareholders. Achievement is assessed annually. LTIs are accrued over a number of years and earned through satisfaction of performance and service conditions. STIs are paid in the form of cash or equity, or a combination of these. LTIs are paid in the form of equity. The trading of equities which vest under incentive schemes is required to comply with the Company’s Securities Trading Policy. This policy prohibits any employees or directors from entering into any scheme, arrangement or agreement under which the economic benefit derived by the employee or director, in relation to an equity–based incentive award or grant made by the Company is altered, irrespective of the outcome under that incentive award or grant, other than as permitted in any approved share or option plan, or as authorised by the board. For shareholders, benefits associated with the incentive schemes include:
Focus on performance improvement at all levels of the Group, with year-on-year earnings growth a core component,

ERM Power Limited
Remuneration Report (continued) FOR THE YEAR ENDED 30 JUNE 2013
29
Focus on sustained growth in shareholder wealth, consisting of dividend and share price growth, and delivering the greatest returns on assets, and
The ability to attract and retain high calibre executives. For employees, benefits associated with the incentive schemes include:
Provision of clear targets, stretch targets and structures for achieving rewards,
Recognition and reward for achievement, capability and experience, and
Delivery of reward for contribution to growth in shareholder wealth.
KPIs include both financial and non-financial measures using a balanced scorecard approach, and reflect the key measures of success as determined by the board. These include, but are not limited to, a range of measures such as:
Zero Harm – safety and environment performance measures, including lost time and medically treated injury frequency rates,
Financial Measures – including earnings before interest, tax, depreciation, amortisation and net fair value changes in financial instruments, cash flow management, etc., and
Market based – shareholder returns, earnings per share, etc.
Short term incentives
STIs are provided to most employees. They have three components; individual, team and corporate. Each of these components is allocated a weighting and include both targets and stretch targets that are set at the beginning of each financial year. The Managing Director’s targets and the corporate targets are set by the board, whilst the individual and team targets are set under the direction of the Managing Director. At the end of each financial year, achievement of targets is measured and applied against the target rate determined for each individual. These rates range between 10% and 40% of annual average fixed remuneration, with the stretch target potential to achieve up to 150% of these levels (i.e. 15% to 60%). STIs are calculated and paid following adoption of the Group’s annual financial results. Payment may be offered by way of cash and/or equity at the election of the board. Any equity, provided through an equity incentive plan, vests immediately. STIs can be paid to employees who ceased employment during the year on a pro-rata basis at the discretion of the board. Based on the achievements of the Group’s results for year ending 2012, the remuneration committee determined that the financial performance exceeded targets and awarded 127.5% of the target opportunity for the Managing Director and corporate target for the 2012 STI. In making this assessment, the committee included the following factors in its considerations;
17-20% improvement in Underlying Profit and Earnings per Share against the Prospectus,
Successful acquisition of an increased interest in the Oakey power station, and
Continuing growth in the electricity sales business.
Table 4 provides details of the STIs paid to KMPs in the current financial year following the outcome of 2012 results and the comparatives for the 2011 STI paid in the 2012 financial year.

ERM Power Limited
Remuneration Report (continued) FOR THE YEAR ENDED 30 JUNE 2013
30
Table 4 – STI Achievement
2012 STI 2011 STI
Actual Maximum Actual Maximum
Philip St Baker 51% 60% 52% 60%
Mitch Anderson 38% 45% 40% 45%
Peter Jans 38% 45% 40% 45%
Derek McKay 42% 45% 40% 45%
Graeme Walker 37% 45% 38% 45%
The Managing Directors’ and corporate target for the 2013 financial year includes the following elements and weightings as set by the remuneration committee at the beginning of the financial year, and align to the Group’s strategic and business objectives. These objectives and weightings are reviewed annually;
40% profit delivery against the approved budget indicators,
35% positioning of the company,
20% strategy execution, and
5% for successful talent management including succession plans.
Deductions of 30% may apply if safety or compliance targets, or other governance standards are not met.
The remuneration committee is responsible for determining the STI to be paid based on an assessment of whether the KPIs are met. To assist in this assessment, the committee receives detailed reports on performance from management. The committee has the discretion to adjust short-term incentives downwards in light of unexpected or unintended circumstances. Although a general provision has been made for incentive payments for FY 2013, to be paid in FY 2014, the allocation of payments to specific individuals and the form, whether to be taken in cash or equity, has not yet been determined. Any equity grants to Philip St Baker will be subject to shareholder approval at the 2013 Annual General Meeting. Long term incentives LTIs are provided to selected employees in the form of equity via the Company’s Long Term Incentive Share Trust (“LTIST”). The equity will only vest if certain performance measures are met and the employees are still employed at the end of the vesting period. An LTI issue was made in the 2013 financial year with vesting subject to continuation of employment through to 30 June 2015 and total security holder return (“TSR”) performance. The TSR vesting condition is measured against the TSR performance of a comparator group over the same three year period. The comparator group comprises companies of comparable market capitalisation together with additional selected companies from the energy and utilities sector. For the LTI offered in 2013, the comparator group consists of the following entities: [ASX: Company Name]
AGK: AGL Energy CUE: Cue Energy Resources LNG: Liquefied Natural Gas RRS: Range Resources ALS: Alesco CVN: Carnarvon Petroleum MEO: Meo Australia SEA: Sundance Energy Australia ANG: Austin Engineering DLS: Drillsearch Energy MIO: Miclyn Express Offshore SKI: Spark Infrastructure Group APA: APA Group DTE: Dart Energy MLD: Maca SPN: SP Ausnet APK: Australian Power & Gas DUE: Duet Group MPO: Molopo Energy SSN: Samson Oil & Gas AWE: Awe DYL: Deep Yellow MSF: MSF Sugar SXY: Senex Energy AZZ: Antares Energy EGO: Empire Oil & Gas NDO: Nido Petroleum TAP: Tap Oil BUL: Blue Energy ENV: Envestra NXS: Nexus Energy TFC: TFS CCC: Continental Coal GDY: Geodynamics ORG: Origin Energy (ex Boral) TOE: Toro Energy CIF: Challenger Infrastructure Fund HDF: Hastings Diversified Utilities Fund RES: Resource Generation WOR: Worley Parsons CNX: Carbon Energy HUN: Hunnu Coal RIA: Rialto Energy WTP: Watpac COE: Cooper Energy HZN: Horizon Oil ROC: Roc Oil Company COK: Cockatoo Coal IFN: Infigen Energy
Any company which is not listed on the last day of the performance period will be removed from the comparator group for the purposes of the TSR calculation. At the end of the three year period, TSR vesting is granted on the following basis:
Less than or equal to 50th percentile = 0%
Greater than 50th to less than or equal to 75th percentile = 50% to 100% (linear)
75th percentile and higher = 100%.

ERM Power Limited
Remuneration Report (continued) FOR THE YEAR ENDED 30 JUNE 2013
31
The LTI target rate determined for each individual is based on a percentage of annual average fixed remuneration, and for the 2013 financial year it was based on the maximum awards of 75% for the Managing Director, 40% for other executive KMP and 30% for other selected senior executives. The corresponding equity is issued into the LTIST and will vest subject to satisfaction of the performance condition assessed following adoption of the Group’s annual financial results for the third year. Early vesting, or non-forfeiture on cessation of employment prior to vesting, may occur in the following circumstances, subject to compliance with the listing rules, and the achievement of any relevant performance hurdles:
on a change of control of ERM Power which shall be determined by a material change in the composition of the board, such change being initiated as a result of a change of ownership of the ERM Power’s shares and the purchaser of the shares requiring (or agreeing with other shareholders to require) that change in board composition, or in other circumstances that the board determines appropriate; and
on termination of employment due to redundancy, death or permanent disability, or in circumstances that the board determines appropriate.
Table 7 details the long term incentive allocated to executive KMP in the current financial year and for which the allocation to Philip St Baker was approved by shareholders at the 2012 Annual General Meeting. This long term incentive is, for accounting purposes, expensed over the vesting period to June 2015.

ERM Power Limited
Remuneration Report (continued) FOR THE YEAR ENDED 30 JUNE 2013
32
Table 5 - Executive Remuneration
Executive Remuneration
Post-
employment
benefits
$ $ $ $ $ $ $ $ $ $
2013 597,133 57,235 297,110 c 53,742 253,917 22,563 1,281,700 0% (322,078) 72,508 1,032,130
2012 582,569 4,459 259,215 e 52,431 145,544 4,404 1,048,622 1% (142,214) - 906,408
Mitch Anderson 2013 366,438 18,545 136,741 c 32,979 97,438 7,125 659,266 0% (93,770) 31,779 597,275
2012 357,500 45,424 128,863 c 32,175 61,331 17,490 642,783 1% (103,073) - 539,709
Peter Jans 2013 367,211 6,390 137,032 c 33,049 97,644 14,602 655,928 0% (116,375) 31,844 571,397
2012 358,255 12,202 130,763 c 32,243 61,460 2,904 597,827 1% (74,345) - 523,482
Derek McKay 2013 366,438 4,667 149,257 c 32,979 97,438 16,521 667,300 0% (116,039) 31,779 583,040
2012 357,500 510 128,863 c 32,175 61,331 3,366 583,745 1% (62,726) - 521,019
Graeme Walker 2013 330,000 (2,743) 111,261 c 29,700 84,550 643 553,411 0% (80,190) 27,694 500,915
2012 302,752 5,696 108,408 e 27,248 52,726 1,873 498,703 1% (58,193) - 440,510
3. Non-monetary benefits include salary continuance insurance premiums, car parking benefits and FBT.
7. No accrual for long service leave was made prior to the 2012 financial year.
Supplementary Information6
Short term benefits
LSL
Accrual7
Short-term
incentive4
Total
remuneration
per income
statement6
% related
to the
value of
optionsOther equity
benefits6
Expensed in Income Statement6
Less:
Long term
benefits and
annual leave
accounting
accruals
Add: Vested
Other equity-
based
payments
Total
remuneration
vested
Philip St Baker1
Long term benefits
Base salary
cash2
Non-monetary
benefits and
annual leave
accrual3
Super-
annuation
entitlement5
1. Managing Director & CEO.
4. The short term incentive paid relates to performance in the previous year. Payments were made in cash ("c") or equity ("e").
6. The amounts shown are as expensed in the income statement but do not reflect the benefit actually received by the executive in that year. In accordance with AASB2, these amounts include a portion of the value of equity that
has not vested during the financial year as well as the present value of expected dividends over the vesting period. The amount included as remuneration does not necessarily reflect the benefit (if any) that may ultimately be
realised by the executive if vesting occurs. Supplementary Information is provided to reflect the vested remuneration actually received by the executive in that year.
2. Each executive is employeed under an on-going service agreement for which the termination benefits are payable at the option of the company in lieu of notice, other than termination for cause, on the basis of 6 months salary,
with the exception of the Managing Director, whose termination benefit is provided as 12 month salary in lieu of notice.
5. Superannuation entitlements represent contractual obligations under service agreements and not necessarily the amounts actually contributed which vary according to individual circumstances, but are no less than the
Company’s obligations.

ERM Power Limited
Remuneration Report (continued) FOR THE YEAR ENDED 30 JUNE 2013
33
Table 6 - Terms and conditions of equity grants
The terms and conditions of each grant of a cash bonus, performance-related bonus or share-based compensation benefit affecting compensation of KMP in the current or a future reporting period are as follows:
Grant date Nature of compensation Service and performance
criteria
Changes in terms or
conditions since grant
date
% Paid in FY2013
% Vested in FY2013
% Forfeited in FY2013
Vesting
Nov-12 Long term incentive
LTIST
See Remuneration Report section 2.2.2
N/A 100% - - Jun-15
Sept-12 Short term incentive 2012
Cash
See Remuneration Report section 2.2.2
N/A 100% 100% - Sept-12
Nov-11 Long term incentive
LTIST
See 2012 Remuneration Report section 2.2.2
N/A 0% - - Jun-14
Nov-10 Other incentive
IPO Retention
Service condition only
N/A 0% 100% 0% 3 business days after 2012 Financial Statements are signed
Nov-10 Other incentive
IPO Retention
Service condition only
N/A 0% 0% 0% 3 business days after 2013 Financial Statements are signed

ERM Power Limited
Remuneration Report (continued) FOR THE YEAR ENDED 30 JUNE 2013
34
A detailed breakdown of the accounting expense of long term equity benefits to disclosed executives, and the maximum value of the grant that may vest in future financial years is shown in Table 7.
Table 7- Long Term Equity Benefits
FY $ $ $ $ $ $
2015 134,611 - 134,611 360,314 - 360,314
2014 256,946 5,796 262,742 316,396 94,388 410,784
2013 213,428 40,489 253,917 - 72,508 72,508
2012 71,725 73,819 145,544 - - -
2015 44,057 - 44,057 117,927 - 117,927
2014 94,105 2,518 96,623 129,440 41,367 170,807
2013 79,862 17,576 97,438 - 31,779 31,779
2012 29,343 31,988 61,331 - - -
2015 44,150 - 44,150 118,176 - 118,176
2014 94,304 2,523 96,827 129,713 41,454 171,167
2013 80,031 17,613 97,644 - 31,844 31,844
2012 29,405 32,055 61,460 - - -
2015 44,057 - 44,057 117,927 - 117,927
2014 94,105 2,518 96,623 129,440 41,367 170,807
2013 79,862 17,576 97,438 - 31,779 31,779
2012 29,343 31,988 61,331 - - -
2015 39,676 - 39,676 106,200 - 106,200
2014 82,059 2,195 84,254 109,617 36,050 145,667
2013 69,233 15,317 84,550 - 27,694 27,694
2012 24,850 27,876 52,726 - - -
2. The amounts shown are as expensed in the income statement but do not reflect the benefit actually received
by the executive in each respective year. In accordance with AASB2, these amounts represent a portion of the
value of equity that has not vested during financial year as well as the present value of expected dividends over
the vesting period. The amount included as remuneration does not necessarily reflect the benefit (if any) that may
ultimately be realised by each executive if vesting occurs. Supplementary Information is provided to reflect the
maximum vested long-term equity benefit receivable by each executive.
Long-term
Equity
Benefits
Executive
Remuneration
Philip St Baker1
1. Managing Director & CEO
Mitch Anderson
Peter Jans
Derek McKay
Graeme Walker
Expensed in income statement2
Remuneration
per income
statement
Supplementary Information2
Long Term
Equity
Benefits
Vesting
Long-term
Incentive
Long-term
Incentive
Other
Incentives:
IPO
Retention
Other
Incentives:
IPO
Retention

ERM Power Limited
Remuneration Report (continued) FOR THE YEAR ENDED 30 JUNE 2013
35
3. Additional Remuneration Disclosures
3.1 Share price and consequences of performance on shareholder wealth The Company’s shares were listed on the ASX in December 2010 at a listing price of $1.75. Table 8 shows selected Group financial data for the current and previous years, and the effect of the Group’s performance on shareholder value.
Table 8 – Shareholder Wealth Financial Data
Year ended
30 June 2013
Year ended
30 June 2012
Year ended
30 June 2011
Actual Actual Actual
Revenue and other income ($’000) 1,569,570 937,926 549,814
EBITDAIF1 ($’000) 69,821 85,390 46,407
Net Profit After Tax2 ($’000) 36,539 34,156 16,176
Underlying Net Profit After Tax2
($’000) 15,671 30,311 6,245
Basic Earnings per Share (cents) 20.8 20.7 11.7
Underlying Earnings per Share
(cents) 8.9 18.4 4.5
Dividend per share (cents) 10.5 8.5 3.5
Closing share price at 30 June ($) 2.50 2.00 1.57
1. EBITDAIF is Earnings Before Interest, Tax, Depreciation, Amortisation, Impairment and fair value gains/losses on Financial instruments. 2. NPAT and Underlying Net Profit After Tax attributable to equity holders of the Company.
3.2 Details of option grants No options were issued during financial year 2013. Options granted to KMP in November 2010 vested 3 business days after 2012 Financial Statements were signed. No options lapsed during the period.
3.3 Shares issued on the exercise of remuneration options Details of ordinary shares issued as result of the exercise of remuneration options to key management personnel during the financial year are set out in Table 9. No amounts are unpaid on any shares issued on the exercise of options.
Table 9 – KMP Options exercised
Key Management Personnel Date of exercise Exercise price Number of ordinary shares issued on
exercise
Value at exercise date1
Philip St Baker 31/05/2013 $0.806 833,870 $1,454,269
1. The value of options exercised is calculated as the market price of the Company’s shares on the Australian Securities Exchange as at the close of trading on the date the options were exercised, after deducting the exercise price.
3.4 Loans to directors and employees Information on loans to directors and employees including amounts, interest rates and repayment terms are set out in the financial statements.
3.5 Voting and comments received at the 2012 Annual General Meeting The Company remuneration report for the 2012 financial year was approved by shareholders at the 2012 Annual General Meeting by a show of hands. The Company did not receive any specific feedback at the AGM or through the year on its remuneration practices.

0
ERM Power Limited
Annual Financial Statements
for the year ended 30 June 2013

ERM Power Limited
Annual Financial Statements FOR THE YEAR ENDED 30 JUNE 2013
37
Contents Page
Auditor’s Independence Declaration 38
Financial Statements
Consolidated Income Statement 39
Consolidated Statement of Comprehensive Income 40
Consolidated Statement of Financial Position 41
Consolidated Statement of Changes in Equity 42
Consolidated Statement of Cash Flows 43
Notes to the Consolidated Financial Statements 44
Directors’ Declaration 95
Independent Auditors Report 96
The financial statements were authorised for issue by the directors on 22 August 2013. The directors have the power to amend and reissue the financial statements. These financial statements cover ERM Power Limited as a consolidated entity comprising ERM Power Limited and its controlled entities. The Group’s functional and presentation currency is Australian dollars (AUD). ERM Power Limited is a company limited by shares, incorporated and domiciled in Australia. Its registered office and principal place of business is set out on page 45
A description of the Group’s operations and of its principal activities is included in the review of operations and activities in the Directors’ Report on pages 19 to 35. The Directors’ Report does not form part of the annual financial statements.
ABN 28 122 259 223

PricewaterhouseCoopers, ABN 52 780 433 757Riverside Centre, 123 Eagle Street, BRISBANE QLD 4000, GPO Box 150, BRISBANE QLD 4001T: +61 7 3257 5000, F: +61 7 3257 5999, www.pwc.com.au
Liability limited by a scheme approved under Professional Standards Legislation.
Auditors’ Independence Declaration
As lead auditor for the audit of ERM Power Limited for the year ended 30 June 2013, I declare that to
the best of my knowledge and belief, there have been:
a) no contraventions of the auditor independence requirements of the Corporations Act 2001 in
relation to the audit; and
b) no contraventions of any applicable code of professional conduct in relation to the audit.
This declaration is in respect of ERM Power Limited and the entities it controlled during the period.
Timothy J Allman Brisbane
Partner 22 August 2013
PricewaterhouseCoopers

ERM Power Limited
Consolidated Income Statement FOR THE YEAR ENDED 30 JUNE 2013
39
The above Consolidated Income Statement should be read in conjunction with the accompanying notes.
Operational business segment performance and underlying profit of the consolidated entity is presented in note 2 together with a reconciliation between statutory profit attributable to members of the parent entity and underlying profit.
Note 2013 2012
$’000 $’000
CONTINUING OPERATIONS
Revenue 5 1,569,322 918,060
Other income 248 798
Discount on acquisition 35 - 19,068
Total revenue 1,569,570 937,926
Expenses 6 (1,499,749) (852,536)
EBITDAIF 69,821 85,390
Depreciation and amortisation (14,037) (17,908)
Net fair value gain on financial instruments designated at fair value through profit or loss
7
29,812
5,492
Results from operating activities 85,596 72,974
Finance expense 8 (31,853) (29,466)
Profit before income tax 53,743 43,508
Income tax expense 9 (15,274) (6,941)
Profit for the year 38,469 36,567
Non-controlling interest (1,930) (2,411)
Profit for the year attributable to equity holders of the Company 36,539 34,156
Earnings per share based on earnings attributable to the ordinary equity holders of the Company
Cents Cents
Basic earnings per share 37 20.80 20.74
Diluted earnings per share 37 20.80 20.34

ERM Power Limited
Consolidated Statement of Comprehensive Income FOR THE YEAR ENDED 30 JUNE 2013
40
Note 2013 2012
$’000 $’000
Profit for the year 38,469 36,567
Other comprehensive income
Items that may be reclassified subsequently to profit and loss
Changes in the fair value of cash flow hedges (net of tax) 27 5,459 (16,964)
Items that will not be reclassified subsequently to profit and loss
Changes in the fair value of financial assets at fair value through other comprehensive income (net of tax)
27 (4,472) (2,671)
Other comprehensive income for the year, net of tax 987 (19,635)
Non-controlling interest 28 (96)
Other comprehensive income for the year attributable to equity holders of the Company
959 (19,539)
Total comprehensive income for the year 39,456 16,932
Total comprehensive income for the year attributable to:
Equity holders of the Company 37,498 14,617
Non-controlling interest 1,958 2,315
39,456 16,932
The above Consolidated Statement of Comprehensive Income should be read in conjunction with the accompanying notes.

ERM Power Limited
Consolidated Statement of Financial Position AS AT 30 JUNE 2013
The above Consolidated Statement of Financial Position should be read in conjunction with the accompanying notes.
41
Note 2013 2012
ASSETS $’000 $’000
Current Assets
Cash and cash equivalents 11 207,878 136,369
Trade and other receivables at amortised cost 13 157,338 86,900
Inventories 14 63,453 45,632
Other assets 15 8,474 10,925
Derivative financial instruments 17 27,622 13,763
Total Current Assets 464,765 293,589
Non-Current Assets
Cash and cash equivalents 11 7,477 3,246
Trade and other receivables 13 1,446 1,605
Financial assets at fair value through other comprehensive income 16 6,187 5,855
Derivative financial instruments 17 20 9
Property, plant and equipment 19 446,392 445,780
Exploration and evaluation costs 20 12,448 13,985
Gas assets 21 17,309 -
Deferred tax assets 9 5,845 15,604
Intangible assets 22 5,851 2,368
Total Non-Current Assets 502,975 488,452
TOTAL ASSETS 967,740 782,041
LIABILITIES
Current Liabilities
Trade and other payables 23 221,624 131,993
Current tax liabilities 9 1,498 1,279
Borrowings 24 95,498 49,366
Borrowings – limited recourse 24 26,790 22,622
Derivative financial instruments 17 17,757 13,297
Provisions 25 1,818 1,394
Total Current Liabilities 364,985 219,951
Non-Current Liabilities
Borrowings – limited recourse 24 216,563 236,490
Derivative financial instruments 17 47,167 75,330
Deferred tax liabilities 9 66,588 68,176
Provisions 25 594 338
Total Non-Current Liabilities 330,912 380,334
TOTAL LIABILITIES 695,897 600,285
NET ASSETS 271,843 181,756
EQUITY
Contributed equity 26 233,291 166,660
Reserves 27 (34,776) (36,313)
Retained earnings 50,820 30,859
Capital and reserves attributable to owners of ERM Power Limited 249,335 161,206
Non-controlling interest 22,508 20,550
TOTAL EQUITY 271,843 181,756

ERM Power Limited
Consolidated Statement of Changes in Equity FOR THE YEAR ENDED 30 JUNE 2013
42
Note
Contributed equity
Reserves Retained earnings
Total Non-
controlling interests
Total equity
$'000 $'000 $'000 $'000 $'000 $'000
Balance at 1 July 2011 160,239 (11,555) 9,015 157,699 - 157,699
Profit for the period - - 34,156 34,156 2,411 36,567 Other comprehensive income - (19,539) - (19,539) (96) (19,635)
Total comprehensive income for the year - (19,539) 34,156 14,617 2,315 16,932 Transactions with owners in their capacity as owners:
Dividends paid 10 3,900 - (12,312) (8,412) - (8,412) Issue of shares and share options exercised pursuant to employee incentive scheme 26 4,226 - - 4,226 - 4,226
Purchase of treasury shares 26 (1,705) - - (1,705) - (1,705) Share based payment expense 28 - 649 - 649 - 649 Non-controlling interest on acquisition of subsidiaries 35 - - - - 42,918 42,918 Acquisition of controlling share in subsidiaries 36 - - - - (30,551) (30,551) Transactions with non-controlling interests 36 - (5,868) - (5,868) 5,868 -
Balance at 30 June 2012 166,660 (36,313) 30,859 161,206 20,550 181,756
Profit for the period - - 36,539 36,539 1,930 38,469 Other comprehensive income - 959 - 959 28 987
Total comprehensive income for the year - 959 36,539 37,498 1,958 39,456
Transactions with owners in their capacity as owners:
Dividends paid 10 1,104 - (16,578) (15,474) - (15,474) Issue of shares and share options exercised pursuant to employee incentive scheme 26 8,959 (175) - 8,784 - 8,784 Contribution of equity from capital raising net of transaction costs 26 58,511 - - 58,511 - 58,511
Purchase of treasury shares 26 (1,943) - - (1,943) - (1,943) Share based payment expense 28 - 753 - 753 - 753
Balance at 30 June 2013 233,291 (34,776) 50,820 249,335 22,508 271,843
The above Consolidated Statement of Changes in Equity should be read in conjunction with the accompanying notes.

ERM Power Limited
Consolidated Statement of Cash Flows FOR THE YEAR ENDED 30 JUNE 2013
43
Note 2013 2012
$‘000 $‘000
Cash flows from operating activities
Receipts from customers (inclusive of goods and services tax) 1,652,153 1,000,393
Payments to suppliers and employees (inclusive of goods and services tax) (1,546,529) (954,865)
Income tax paid (6,627) (5,831)
Net cash flows from operating activities 12 98,997 39,697
Cash flows from investing activities
Payments for gas exploration and evaluation (7,853) (2,550)
Payments for gas development assets (8,019) -
Payments for plant and equipment (13,494) (7,888)
Payments for intangible assets (4,634) -
Purchase of shares in listed companies (6,720) (9,656)
Net cash paid as part of business combination 35 - (51,050)
Net cash flows used in investing activities (40,720) (71,144)
Cash flows from financing activities
Proceeds from borrowings including receivables financing facility 1,755,457 596,426
Repayments of borrowings including receivables financing facility (1,746,150) (551,018)
Proceeds from borrowings – limited recourse 1,500 20,000
Repayments of borrowings – limited recourse (19,793) (18,358)
Transactions with non-controlling interests 36 - (31,011)
Finance costs (28,686) (30,727)
Interest received 5,745 6,533
Dividends paid 10 (15,474) (8,412)
Issue of shares on capital raising net of transaction costs 26 58,023 -
Cash received on exercise of share options 26 6,841 1,274
Net cash flows from / (used in) financing activities 17,463 (15,293)
Net increase / (decrease) in cash and cash equivalents 75,740 (46,740)
Cash and cash equivalents at the beginning of the year 139,615 186,355
Cash and cash equivalents at the end of the year 11 215,355 139,615
The above Consolidated Statement of Cash Flows should be read in conjunction with the accompanying notes.

ERM Power Limited
Notes to the Consolidated Financial Statements FOR THE YEAR ENDED 30 JUNE 2013
44
INDEX TO NOTES TO THE CONSOLIDATED FINANCIAL STATEMENTS PAGE
1 SUMMARY OF SIGNIFICANT ACCOUNTING POLICIES 45
2 SEGMENT REPORT 57
3 FINANCIAL RISK MANAGEMENT 59
4 CRITICAL ACCOUNTING ESTIMATES AND JUDGEMENTS 64
5 REVENUE 65
6 EXPENSES 66
7 NET FAIR VALUE GAIN ON FINANCIAL INSTRUMENTS DESIGNATED AT FAIR VALUE THROUGH PROFIT AND LOSS
66
8 FINANCE EXPENSE 66
9 INCOME TAX 67
10 DIVIDENDS PAID AND PROPOSED 70
11 CASH AND CASH EQUIVALENTS 70
12 RECONCILIATION OF CASH FLOWS FROM OPERATING ACTIVITIES 71
13 TRADE AND OTHER RECEIVABLES AT AMORTISED COST 72
14 INVENTORIES 73
15 OTHER ASSETS 73
16 FINANCIAL ASSETS AT FAIR VALUE THROUGH OTHER COMPREHENSIVE INCOME 73
17 DERIVATIVE FINANCIAL INSTRUMENTS 74
18 INVESTMENTS IN CONTROLLED ENTITIES 75
19 PROPERTY, PLANT AND EQUIPMENT 76
20 EXPLORATION AND EVALUATION COSTS 77
21 GAS ASSETS 77
22 INTANGIBLE ASSETS 78
23 TRADE AND OTHER PAYABLES 78
24 BORROWINGS 79
25 PROVISIONS 80
26 CONTRIBUTED EQUITY 81
27 RESERVES 82
28 SHARE BASED PAYMENTS 83
29 PARENT ENTITY FINANCIAL INFORMATION 85
30 COMMITMENTS AND CONTINGENCIES 86
31 INTERESTS IN JOINTLY CONTROLLED ENTITIES AND JOINT VENTURE OPERATIONS 88
32 RELATED PARTY DISCLOSURES 89
33 KEY MANAGEMENT PERSONNEL DISCLOSURES 90
34 AUDITORS’ REMUNERATION 93
35 BUSINESS COMBINATION 93
36 TRANSACTIONS WITH NON-CONTROLLING INTERESTS 94
37 EARNINGS PER SHARE 94
38 EVENTS AFTER THE REPORTING PERIOD 94

ERM Power Limited
Notes to the Consolidated Financial Statements (continued) FOR THE YEAR ENDED 30 JUNE 2013
45
These financial statements cover ERM Power Limited the consolidated entity (‘Group’ or ‘consolidated entity’) consisting of ERM Power Limited and its subsidiaries. The report is presented in Australian dollars.
ERM Power Limited is incorporated and domiciled in Australia. Its registered office and place of business is Level 52, 111 Eagle Street, Brisbane, Queensland 4000.
A description of the nature of the Group's operations and of its principal activities is included in the review of operations and activities in the Directors' report on pages 19 to 35.
This report was authorised for issue by the directors on 22 August 2013.
1. SUMMARY OF SIGNIFICANT ACCOUNTING POLICIES
The principal accounting policies adopted in the preparation of the financial report are set out below. These policies have been consistently applied to all the years presented, unless otherwise stated. ERM Power Limited is a for-profit entity for the purpose of preparing the financial statements.
(a) Basis of preparation
This general purpose financial report has been prepared in accordance with Australian Accounting Standards, other authoritative pronouncements of the Australian Accounting Standards Board and the Corporations Act 2001.
Compliance with IFRS
The consolidated financial statements of the Group comply with International Financial Reporting Standards (IFRS) as issued by the International Accounting Standards Board (IASB).
Early adoption of Australian Accounting Standards
The Group has elected to early adopt AASB 9 Financial Instruments (December 2009) and AASB 2009-11 Amendments to Australian Accounting Standards arising from AASB 9 from 1 July 2012, because the new accounting policies provide more reliable and relevant information for users to assess the amounts, timing and uncertainty of future cash flows. In accordance with the transition provisions, comparative figures have not been restated.
AASB 9 specifies the basis for classifying and measuring financial assets. Classification is determined based on the Group’s business model and the contractual cash flow characteristics of the financial assets. Financial assets will be classified as either amortised cost or fair value. AASB 9 replaces the classification and measurement requirements relating to financial assets in AASB 139 Financial Instruments: Recognition and measurement (AASB 139).
As permitted under the transitional provisions, the group has elected not to adopt the December 2010 revised version of AASB 9 which addresses the accounting for financial liabilities and the derecognition of financial assets and liabilities, nor the September 2012 revised version of AASB 9 which addresses the recognition and measurement of financial instruments.
A financial asset is measured at amortised cost if the following conditions are met:
I. The objective of the Group’s business model in relation to those instruments is to hold the asset to collect the contractual cash flows; and
II. The contractual cash flows give rise, on specified dates, to cash flows that are solely payments of principal and interest on the principal outstanding.
If these criteria are not met then the financial asset must be classified as fair value through profit or loss except as discussed below.
Under AASB 9 only equity instruments that are not held for trading are able to be classified as fair value through other comprehensive income rather than fair value through profit or loss. On disposal, in contrast to AASB 139, the cumulative gains or losses recognised in equity over the period the Group held the equity instrument are transferred directly to retained earnings and are not permitted to be recognised in profit or loss.
The change in accounting policy was applied to those financial assets that the Group held at the date of initial application of AASB 9 (1 July 2012) or acquired subsequent to that date. Financial instruments disposed of prior to 1 July 2012 were accounted for under AASB 139. In accordance with AASB 9, the classification of financial assets that the Group held at the date of initial application was determined based on conditions that existed at that date.
There was no impact on either the consolidated statement of comprehensive income or the consolidated statement of financial position from reclassifying financial assets at 1 July 2012.
Reclassification of financial assets at the date of initial application of AASB 9
The following table shows the classification and carrying amount of the Group’s financial assets on 1 July 2012 (the date the Group first applied AASB 9 (December 2009)) as they were previously classified under AASB 139 and as they now appear on initial application of AASB 9.
$’000 Original classification under AASB 139
New classification under AASB 9
Original carrying amount under AASB
139
New carrying amount under AASB 9
Derivative financial instrument assets
Fair value through profit or loss
Fair value through profit or loss 13,772 13,772
Shares held in publicly listed companies*
Available for sale Fair value through other comprehensive income 5,855 5,855
Trade and other receivables Loans and receivables Amortised cost 6,733 6,733
Cash and cash equivalents Loans and receivables Amortised cost 139,615 139,615
* these equity instruments represent investment holdings that the Group intends to hold for the long-term. Accordingly, the Group has determined that it is appropriate to use the election in AASB 9 to recognise these instruments at fair value through other comprehensive income.

ERM Power Limited
Notes to the Consolidated Financial Statements (continued) FOR THE YEAR ENDED 30 JUNE 2013
46
1. SUMMARY OF SIGNIFICANT ACCOUNTING POLICIES (continued)
(a) Basis of preparation (continued)
Historical cost convention
These financial statements have been prepared under the historical cost convention, as modified by the revaluation of financial assets and liabilities (including derivative financial instruments) at fair value through profit and loss.
Critical accounting estimates
The preparation of financial statements requires the use of certain critical accounting estimates. It also requires management to exercise its judgement in the process of applying the Group’s accounting policies. Information regarding critical accounting estimates is provided in note 4.
(b) Principles of consolidation
Subsidiaries
The consolidated financial statements incorporate the assets and liabilities of all subsidiaries of ERM Power Limited as at 30 June 2013 and the results of all its subsidiaries for the year then ended.
Subsidiaries are all those entities (including special purpose entities) over which the Group has the power to govern their financial and operating policies, generally accompanying a shareholding of more than one-half of the voting rights. The existence and effect of potential voting rights that are currently exercisable or convertible are considered when assessing whether the Group controls another entity.
Subsidiaries are fully consolidated from the date on which control is transferred to the Group. They are de-consolidated from the date that control ceases.
The acquisition method of accounting is used to account for the acquisition of subsidiaries by the Group that were not previously under common control.
On an acquisition-by-acquisition basis, the Group recognises any non-controlling interest in the acquiree either at fair value or at the non-controlling interest's proportionate share of the acquiree’s net identifiable assets. Non-controlling interests in the results and equity of subsidiaries are shown separately in the consolidated income statement, statement of comprehensive income, statement of changes in equity and statement of financial position respectively.
The financial statements of subsidiaries are prepared for the same reporting period as the parent company, using consistent accounting policies.
Intercompany balances, transactions and unrealised gains resulting from intra-Group transactions have been eliminated in full. Unrealised losses are also eliminated unless the transaction provides evidence of the impairment of the asset transferred.
Investments in subsidiaries are accounted for at cost less any impairment in the individual financial statements of ERM Power Limited.
Changes in ownership interests
The Group treats transactions with non‑controlling interests that do not result in a loss of control as transactions with equity owners of the
Group. A change in ownership interest results in an adjustment between the carrying amounts of the controlling and non‑controlling interests to
reflect their relative interests in the subsidiary. Any difference between the amount of the adjustment to non‑controlling interests and any
consideration paid or received is recognised in a separate reserve within equity attributable to owners of ERM Power Limited. When the Group ceases to have control, joint control or significant influence, any retained interest in the entity is remeasured to its fair value with the change in carrying amount recognised in profit or loss. The fair value is the initial carrying amount for the purposes of subsequently accounting for the retained interest as an associate, jointly controlled entity or financial asset. In addition, any amounts previously recognised in other comprehensive income in respect of that entity are accounted for as if the group had directly disposed of the related assets or liabilities. This may mean that amounts previously recognised in other comprehensive income are reclassified to profit or loss.
Associates
Associates are all entities over which the Group has significant influence but not control, generally accompanying a shareholding of between 20% and 50% of the voting rights. Investments in associates are accounted for in the consolidated financial statements using the equity method of accounting.
The Group’s share of its associates’ post-acquisition profits or losses is recognised in the income statement, and its share of post-acquisition movements in reserves is recognised in reserves. The cumulative post-acquisition movements are adjusted against the carrying amount of the investment. Dividends receivable from associates are recognised in the consolidated financial statements by reducing the carrying amount of the investment.
When the Group’s share of losses in an associate equals or exceeds its interest in the associate, including any other unsecured receivables, the Group does not recognise further losses, unless it has incurred obligations or made payments on behalf of the investment.
Unrealised gains on transactions between the Group and its associates are eliminated to the extent of the Group’s interest in the associates. Unrealised losses are also eliminated unless the transaction provides evidence of an impairment of the asset transferred. Accounting policies of associates have been changed where necessary to ensure consistency with the policies adopted by the Group.
Jointly controlled entities
Jointly controlled entities are those entities over whose activities the entity has joint control, established by a contractual agreement. In the consolidated financial statements, investments in jointly controlled entities, including partnerships, are accounted for using the proportionate consolidation method of accounting.
The proportionate interests in the assets, liabilities, income and expenses of a jointly controlled entity are incorporated in the financial statements under the appropriate headings. Transactions and balances between the Group and jointly controlled entities are eliminated to the extent of the Group’s proportionate interests.

ERM Power Limited
Notes to the Consolidated Financial Statements (continued) FOR THE YEAR ENDED 30 JUNE 2013
47
1. SUMMARY OF SIGNIFICANT ACCOUNTING POLICIES (continued)
(b) Principles of consolidation (continued)
Employee share trusts
The Group has formed trusts to administer the Group's employee share schemes. The trusts are consolidated, as the substance of the relationship is that the trusts are controlled by the Group. Shares held by the trusts are disclosed as treasury shares and deducted from contributed equity.
(c) Parent entity financial information
The financial information for the parent entity, ERM Power Limited, disclosed in note 29 has been prepared on the same basis as the consolidated financial statements, except as set out below:
(i) Investments in subsidiaries, associates and joint venture entities
Investments in subsidiaries, associates and joint venture entities are accounted for at cost in the financial statements of ERM Power Limited. Dividends received from associates are recognised in the parent entity’s profit or loss, rather than being deducted from the carrying amount of these investments.
(ii) Financial Guarantees
Where the parent entity provides financial guarantees in relation to loans and payables of subsidiaries for no compensation, the fair values of these guarantees are accounted for as contributions and recognised as part of the cost of the investments.
(iii) Share-based payments
The grant by the Company of options over its equity instruments to the employees of subsidiary undertakings in the Group is treated as a capital contribution to that subsidiary undertaking. The fair value of employee services received, measured by reference to the grant date fair value, is recognised over the vesting period as an increase to investment in subsidiary undertakings, with a corresponding credit to equity.
(iv) Tax consolidation legislation
ERM Power Limited and its wholly-owned Australian controlled entities have implemented the tax consolidation legislation.
The head entity ERM Power Limited, and the controlled entities in the tax consolidated group, account for their own current and deferred tax amounts. These tax amounts are measured as if each entity in the tax consolidated group continues to be a standalone taxpayer in its own right.
In addition to its own current and deferred tax amounts, ERM Power Limited also recognises the current tax liabilities (or assets) and the deferred tax assets arising from unused tax losses and unused tax credits assumed from controlled entities in the tax consolidated group.
Assets or liabilities arising under tax funding agreements with the tax consolidated entities are recognised as amounts receivable from or payable to other entities in the Group.
Any difference between the amounts assumed and amounts receivable or payable under the tax funding agreement are recognised as a contribution to (or distribution from) wholly-owned tax consolidated entities.
(d) Segment reporting
The consolidated entity determines and presents operating segments based on the information that is internally provided to the Managing Director who is the chief operating decision maker. The Managing Director regularly receives financial information on the underlying profit of each operating segment and the statutory profit.
An operating segment is a distinguishable component of an entity that engages in business activity from which it may earn revenues and incur expenses (including revenues and expenses relating to transactions with other components of the same entity), and whose operating results are regularly reviewed by the chief operating decision maker to make decisions about resources to be allocated to the segment.
(e) Foreign currency translation
Functional and presentation currency
The consolidated financial statements are presented in Australian dollars, which is the functional and presentation currency of each of the Group companies.
Transactions and balances
Foreign currency transactions are translated into the functional currency at the rate of exchange at the date of the transaction. Foreign exchange gains and losses resulting from the settlement of such transactions, and from the translation at year end exchange rates of monetary assets and liabilities denominated in foreign currencies, are recognised in the income statement, except when deferred in equity as qualifying cash flow hedges.
(f) Cash and cash equivalents
Cash and cash equivalents comprise cash on hand, deposits held at call with financial institutions, and other short-term highly liquid investments with original maturities of three months or less that are readily convertible into known amounts of cash and which are subject to an insignificant risk of changes in value, net of any bank overdrafts. These assets are stated at nominal values.
Cash that is reserved and its use specifically restricted for maintenance and / or debt servicing under the Group’s borrowing agreements is defined as restricted cash. Restricted cash is shown at the balance date according to the timing of its release. Accordingly, cash that cannot be applied or used within the next 12 months is shown as a non-current asset. All other cash and cash equivalents are shown as current assets.

ERM Power Limited
Notes to the Consolidated Financial Statements (continued) FOR THE YEAR ENDED 30 JUNE 2013
48
1. SUMMARY OF SIGNIFICANT ACCOUNTING POLICIES (continued)
(g) Trade and other receivables
All trade and other debtors are recognised initially at fair value and subsequently measured at amortised cost using the original effective interest method less allowances for doubtful debts. Collectability is reviewed on an ongoing basis. An allowance for doubtful debts is made when there is objective evidence that the Group will not be able to collect any amounts due according to original terms. The amount of the allowance is the difference between the asset’s carrying amount and the present value of the estimated future cash flows discounted at the effective interest rate. The amount of the impairment loss is recognised in the income statement.
Trade receivables are those due for settlement no more than 30 days from the date of invoice.
(h) Inventories
Stocks and materials are valued at the lower of cost and estimated net realisable value.
Renewable energy certificates
Renewable energy certificates held by the Group are accounted for as commodity inventories. The Group participates in the purchase and sale of a range of renewable energy certificates, including both mandatory and voluntary schemes.
Purchased renewable energy certificates are initially recognised at cost within inventories on settlement date. Subsequent measurement is at the lower of cost or net realisable value, with losses arising from changes in realisable value being recognised in the income statement in the period of the change.
(i) Financial assets
Investments are recognised and derecognised on trade date where the purchase or sale of an investment is under a contract whose terms require delivery of the investment within the timeframe established by the market concerned, and are initially measured at fair value.
Subsequent to initial recognition, investments in associates are accounted for under the equity method in the consolidated financial statements. Further information regarding equity accounted investments is detailed in note 1(b).
Classification and measurement prior to 1 July 2012
Other financial assets are classified into the following categories: financial assets ‘at fair value through profit or loss’, ‘held-to-maturity investments’, ‘available-for-sale’ financial assets, and ‘loans and receivables’. The classification depends on the nature and purpose of the financial assets and is determined at the time of initial recognition. Further information on the categories of financial assets held by the Group during the financial year is provided below.
Financial assets at fair value through profit or loss
Financial assets are classified as financial assets at fair value through profit or loss where the financial asset:
has been acquired principally for the purpose of selling in the near future
is a derivative that is not designated and effective as a hedging instrument.
Loans and receivables
Trade receivables, loans and other receivables that have fixed or determinable payments that are not quoted in an active market are classified as ‘loans and receivables’. Loans and receivables are measured at amortised cost using the effective interest method less impairment. Interest income is recognised by applying the effective interest rate.
Available for sale financial assets
Available for sale financial assets, comprising principally marketable equity securities, are non‑derivatives that are either designated in this
category or not classified in any of the other categories. They are included in non‑current assets unless the investment matures or
management intends to dispose of the investment within 12 months of the end of the reporting period. Investments are designated as available
‑for‑sale if they do not have fixed maturities and fixed or determinable payments and management intends to hold them for the medium to
long term. Changes in the fair value of other monetary and non-monetary securities classified as available-for-sale are recognised in other comprehensive income. On disposal of the investment accumulated changes in fair value are recognised in profit and loss.
Classification and measurement from 1 July 2012
From 1 July 2012 the Group classifies its financial assets as either amortised cost or fair value. The classification depends on the Group’s business model for managing the financial assets and the contractual terms of the cash flows.
(i) Financial assets – at amortised cost
A financial asset is classified as at amortised cost only if both of the following criteria are met:
the asset is held within a business model with the objective to collect the contractual cash flows, and
the contractual terms give rise on specified dates to cash flows that are solely payments of principal and interest on the principal outstanding.
The nature of any derivatives embedded in the financial asset are considered in determining whether the cash flows of the investment are solely payment of principal and interest on the principal outstanding and are not accounted for separately.
(ii) Financial assets – at fair value through profit or loss
If either of the two criteria above are not met, the financial asset is classified as at fair value through profit or loss.
The Group has not designated any financial assets as measured at fair value through profit or loss so as to specifically eliminate or significantly reduce an accounting mismatch. The Group is required to reclassify all affected financial assets when and only when its business model for managing those assets changes.
(iii) Equity investments
All equity investments are measured at fair value. Equity investments that are held for trading are measured at fair value through profit or loss. For all other equity investments, the Group can make an irrevocable election at initial recognition of each investment to recognise changes in fair value through other comprehensive income rather than profit or loss.

ERM Power Limited
Notes to the Consolidated Financial Statements (continued) FOR THE YEAR ENDED 30 JUNE 2013
49
1. SUMMARY OF SIGNIFICANT ACCOUNTING POLICIES (continued)
(i) Financial assets (continued)
At initial recognition, the Group measures a financial asset at its fair value plus, in the case of a financial asset not at fair value through profit or loss, transaction costs that are directly attributable to the acquisition of the financial asset. Transaction costs of financial assets carried at fair value through profit or loss are expensed in profit or loss.
A gain or loss on a financial asset that is subsequently measured at fair value and is not part of a hedging relationship is recognised in profit or loss and presented net in the income statement within other income or other expenses in the period in which it arises.
A gain or loss on a financial asset that is subsequently measured at amortised cost and is not part of a hedging relationship is recognised in profit or loss when the financial asset is derecognised or impaired and through the amortisation process using the effective interest rate method.
The Group subsequently measures all equity investments at fair value. Where the Group’s management has elected to present fair value gains and losses on equity investments in other comprehensive income, there is no subsequent reclassification of fair value gains and losses to profit or loss. Dividends from such investments continue to be recognised in profit or loss as other revenue when the Group’s right to receive payments is established and as long as they represent a return on investment.
Changes in the fair value of financial assets at fair value through profit or loss are recognised in other income or other expenses in the income statement as applicable. Interest income from these financial assets is included in the net gains/(losses). Dividend income is presented as other revenue.
De-recognition of financial assets
The Group derecognises a financial asset only when the contractual rights to the cash flows from the asset expire, or it transfers the financial asset and substantially all the risks and rewards of ownership of the asset to another entity. If the Group neither transfers nor retains substantially all the risks and rewards of ownership and continues to control the transferred asset, the Group recognises its retained interest in the asset and an associated liability for amounts it may have to pay. If the Group retains substantially all the risks and rewards of ownership of a transferred financial asset, the Group continues to recognise the financial asset and also recognises a collateralised borrowing for the proceeds received.
Impairment of financial assets
Financial assets, other than those at fair value through profit or loss, are assessed for indicators of impairment at each balance date. Financial assets are impaired where there is objective evidence that as a result of one or more events that occurred after the initial recognition of the financial asset the estimated future cash flows of the investment have been impacted.
For financial assets carried at amortised cost, the amount of the impairment is the difference between the asset’s carrying amount and the present value of estimated future cash flows, discounted at the original effective interest rate.
The carrying amount of financial assets including uncollectable trade receivables is reduced by the impairment loss through the use of an allowance account. Subsequent recoveries of amounts previously written off are credited against the allowance account. Changes in the carrying amount of the allowance account are recognised in profit or loss.
With the exception of available-for-sale equity instruments, if in a subsequent period the amount of the impairment loss decreases and the decrease can be related objectively to an event occurring after the impairment was recognised, the previously recognised impairment loss is reversed through profit or loss to the extent the carrying amount of the investment at the date the impairment is reversed does not exceed what the amortised cost would have been had the impairment not been recognised.
Effective interest method
The effective interest method is a method of calculating the amortised cost of a financial asset and of allocating interest income over the relevant period. The effective interest rate is the rate that exactly discounts estimated future cash receipts (including all transaction costs and other premiums or discounts) through the expected life of the financial asset, or, where appropriate, a shorter period.
Income is recognised on an effective interest rate basis for debt instruments other than those financial assets ‘at fair value through profit or loss’.
(j) Capitalised work in progress
Costs incurred in relation to the development of a project, including the cost of construction, are recorded as capitalised work in progress when these costs are incurred prior to the establishment of a development vehicle. Development expenditure is recorded as capitalised work in progress only if development costs can be measured reliably, the project is technically and commercially feasible, future economic benefits are probable, and the Group intends to and has sufficient resources to complete development and to use or sell the asset. Development costs relating to project costs incurred may include legal fees, insurance costs, independent engineer costs, borrowing costs, environmental impact study fees, and direct labour and overhead costs.
Capitalised work in progress is measured at cost less accumulated impairment losses.
The recovery of these costs usually occurs at financial close of a project at which time these costs are transferred to a development vehicle.

ERM Power Limited
Notes to the Consolidated Financial Statements (continued) FOR THE YEAR ENDED 30 JUNE 2013
50
1. SUMMARY OF SIGNIFICANT ACCOUNTING POLICIES (continued)
(k) Derivative financial instruments
ERM Power Retail Pty Ltd, one of the subsidiaries in the Group, routinely enters into forward sales contracts (“Contracts”) related to the provision of electricity in the Australian National Electricity Market (“NEM”). The Contracts are exclusively entered into with large industrial, commercial and government entities under term contracts. All of the electricity provided under these Contracts is traded in the NEM spot market.
ERM Power Retail Pty Ltd also enters into a variety of electricity derivative transactions (“Derivatives”) as part of an overall strategy to hedge the exposure to Contract prices. ERM Power Retail Pty Ltd manages all of its Contracts and Derivatives as part of an overall commodity trading strategy.
Revenue from the Contracts is recognised in accordance with the revenue recognition policy in note 1(y). Derivatives are initially recognised at fair value on the date the derivative contract is entered into, and are subsequently remeasured to their fair value at each balance date. Derivatives are carried in the statement of financial position as assets when the fair value is positive and as liabilities when the fair value is negative. The resulting gain or loss arising from the revaluation is recognised in the income statement in the period it arises.
Hedge accounting
The Group designates interest rate swaps as cash flow hedges. At the inception of the hedge relationship the entity documents the relationship between the hedging instrument and hedged item, along with its risk management objectives and its strategy for undertaking various hedge transactions. Furthermore, at the inception of the hedge and on an ongoing basis, the Group documents whether the hedging instrument that is used in a hedging relationship is highly effective in offsetting changes in cash flows of the hedged item.
Cash flow hedge
The effective portion of changes in the fair value of derivatives that are designated and qualify as cash flow hedges are deferred in equity. The gain or loss relating to the ineffective portion is recognised immediately in profit or loss. Amounts deferred in equity are recycled in profit or loss in the periods when the hedged item is recognised in profit or loss in the same line as the recognised hedged item. However, when the forecast transaction that is hedged results in the recognition of a non-financial asset or a non-financial liability, the gains and losses previously deferred in equity are transferred from equity and included in the initial measurement of the cost of the asset or liability.
Hedge accounting is discontinued when the Group revokes the hedging relationship, the hedging instrument expires or is sold, terminated, or exercised, or no longer qualifies for hedge accounting. Any cumulative gain or loss deferred in equity at that time remains in equity and is recognised when the forecast transaction is ultimately recognised in profit or loss. When a forecast transaction is no longer expected to occur, the cumulative gain or loss that was deferred in equity is recognised immediately in profit or loss.
(l) Fair value estimation
The fair value of financial assets and financial liabilities must be estimated for recognition and measurement or for disclosure purposes.
The fair value of financial instruments traded in active markets (such as publicly traded derivatives, and trading and available-for-sale securities) is based on quoted market prices at the balance date. The quoted market price used for financial assets held by the Group is the current bid price; the appropriate quoted market price for financial liabilities is the current ask price.
The fair value of financial instruments that are not traded in an active market is determined using a variety of valuation techniques and assumptions that are based on market conditions existing at each balance date. Quoted market prices or dealer quotes for similar instruments are used for long-term debt instruments held. Other techniques, such as estimated discounted cash flows, are used to determine fair value for the remaining financial instruments. The fair value of forward exchange contracts is determined using market exchange rates and published forward margins at balance date.
The nominal value less estimated credit adjustments of trade receivables and payables is assumed to approximate their fair value. For disclosure purposes the fair value of financial liabilities is estimated by discounting the future contractual cash flows at the current market interest rate that is available to the Group for similar financial instruments.
(m) Property, plant and equipment
Items of property, plant and equipment are initially measured at historical cost less depreciation. Historical cost includes expenditure that is directly attributable to the acquisition of the items. Cost may also include transfers from equity of any gains / losses on qualifying cash flow hedges of foreign currency purchases of property, plant and equipment.
Subsequent costs are included in the asset’s carrying amount or recognised as a separate asset, as appropriate, only when it is probable that future economic benefits associated with the item will flow to the Group and the cost of the item can be measured reliably. All repairs and maintenance expenses are charged to the income statement during the financial period in which they are incurred.
Subsequent impairment losses are recognised in accordance with note 1(p).
Depreciation
Land and capital work in progress are not depreciated. Depreciation on the other assets is calculated using the straight-line method to allocate their cost, net of their residual values, over their estimated useful lives, as follows:
Leasehold improvements the lesser of the remaining lease term and the life of the asset
Motor vehicles 3 – 6 years
Plant and equipment 1 – 50 years
IT Equipment 1 – 3 years
Furniture and equipment 1 – 10 years
Capital work in progress comprises costs incurred to date on construction of power generation plants. Asset residual values and useful lives are reviewed and adjusted if appropriate at each balance date. Gains and losses on disposals are determined by comparing the proceeds to the carrying amount. These are included in the income statement.

ERM Power Limited
Notes to the Consolidated Financial Statements (continued) FOR THE YEAR ENDED 30 JUNE 2013
51
1. SUMMARY OF SIGNIFICANT ACCOUNTING POLICIES (continued)
(n) Gas assets
Exploration and evaluation costs
Exploration and evaluation expenditure incurred is accumulated in respect of each identifiable area of interest. Such expenditure comprises net direct costs and an appropriate portion of related overhead expenditure but does not include overheads or administration expenditure not having a specific nexus with a particular area of interest. Exploration and evaluation expenditure is only capitalised from the point when the rights to tenure of the area are granted. All exploration and evaluation costs are capitalised to the extent that they are expected to be recouped through the successful development of the area or where activities in the area have not yet reached a stage which permits reasonable assessment of the existence of economically recoverable reserves and active or significant operations in relation to the area are continuing.
The probability of expected future economic benefits is assessed using reasonable and supportable assumptions that represent management’s best estimate of the set of economic conditions that will exist over the useful life of the asset. In this assessment, greater weighting is given to available external evidence. Exploration and evaluation assets will be reclassified as development assets at the point in which technical feasibility and commercial viability of extracting gas are demonstrated or a petroleum lease is granted. Exploration and evaluation assets are assessed for impairment and any impairment loss is recognised before reclassification. Accumulated costs in relation to an abandoned area are written off in full against profit in the year in which the decision to abandon is made.
Farm-outs
The Group does not record any expenditure made by the farmee on its account. It also does not recognise any gain or loss on its exploration and evaluation farm-out arrangements, but redesignates any costs previously capitalised in relation to the whole interest as relating to the partial interest retained. Any cash consideration received directly from the farmee is credited against costs previously capitalised in relation to the whole interest with any excess accounted for by the farmor as a gain on disposal.
Development assets
At the point in which technical feasibility and commercial viability of extraction of gas is demonstrated or a petroleum lease is granted, an area of interest enters the development phase. Expenditure on the construction, installation or completion of infrastructure facilities such as platforms, pipelines and the drilling of development wells, including unsuccessful development or delineation wells for the relevant area of interest, is capitalised within development assets.
Gas assets in production
On commencement of commercial production, development assets for production wells are reclassified as gas assets in production. Ongoing costs of continuing to develop production reserves, costs to expand or replace plant and equipment and any associated land and buildings are also capitalised within gas assets.
Depreciation
Gas assets in production are depreciated using the units of production (UOP) method over total proved developed and undeveloped reserves or resources. Each reserve or resource life, which is assessed annually, has regard to both its physical life limitations and to present assessments of economically recoverable reserves or resources at which the gas asset is located. These calculations require the use of estimates and assumptions, including the amount of recoverable reserves or resources and estimates of future capital expenditure. The calculation of the UOP rate of depreciation could be impacted to the extent that actual production in the future is different from current forecast production based on total proved reserves or resources, or future capital expenditure estimates changes. Changes to reserves or resources could arise due to changes in the factors or assumptions used in estimating reserves or resources. Changes are accounted for prospectively.
(o) Intangible assets
Goodwill
Goodwill is measured as described in note 1(q). Goodwill on acquisitions of subsidiaries is included in intangible assets. Goodwill on acquisitions of associates is included in investments in associates. Goodwill is allocated to cash-generating units for the purpose of impairment testing. The allocation is made to those cash-generating units or groups of cash-generating units that are expected to benefit from the business combination in which the goodwill arose, identified according to operating segments.
Software
Computer software is either purchased or developed within the organisation and is recorded at cost less accumulated amortisation and impairment losses. Amortisation is calculated using the straight line method over the estimated useful lives. Depending on the individual software, the estimated useful life ranges between 3 and 10 years.
Customer acquisition costs
The direct costs of establishing customer contracts are recognised as an asset when the customer contract is expected to provide a future economic benefit to the Group. Direct costs are amortised over the average contract term of 2.5 years.
(p) Impairment of assets
Assets that are subject to depreciation are reviewed for impairment whenever events or changes in circumstances indicate that the carrying amount may not be recoverable. An impairment loss is recognised for the amount by which the asset’s carrying amount exceeds its recoverable amount. The recoverable amount is the higher of an asset’s fair value less costs to sell and its value in use. For the purposes of assessing impairment, assets are grouped at the lowest levels for which there are separately identifiable cash flows.
Intangible assets, including exploration and evaluation assets, are assessed for impairment when facts and circumstances suggest that the carrying amount may exceed its recoverable amount.
Goodwill and intangible assets that have an indefinite useful life are not subject to amortisation and are tested annually for impairment, or more frequently if events or changes in circumstances indicate that they might be impaired.

ERM Power Limited
Notes to the Consolidated Financial Statements (continued) FOR THE YEAR ENDED 30 JUNE 2013
52
1. SUMMARY OF SIGNIFICANT ACCOUNTING POLICIES (continued)
(q) Business combinations
The acquisition method of accounting is used to account for all business combinations, regardless of whether equity instruments or other assets are acquired. The consideration transferred for the acquisition of a subsidiary comprises the fair values of the assets transferred, the liabilities incurred and the equity interests issued by the Group. The consideration transferred also includes the fair value of any asset or liability resulting from a contingent consideration arrangement and the fair value of any pre-existing equity interest in the subsidiary. Acquisition-related costs are expensed as incurred. Identifiable assets acquired and liabilities and contingent liabilities assumed in a business combination are, with limited exceptions, measured initially at their fair values at the acquisition date. On an acquisition-by-acquisition basis, the Group recognises any non-controlling interest in the acquiree either at fair value or at the non-controlling interest's proportionate share of the acquiree’s net identifiable assets. The excess of the consideration transferred, the amount of any non-controlling interest in the acquire and the acquisition-date fair value of any previous equity interest in the acquiree over the fair value of the group's share of the net identifiable assets acquired is recorded as goodwill. If those amounts are less than the fair value of the net identifiable assets of the subsidiary acquired and the measurement of all amounts has been reviewed, the difference is recognised directly in profit or loss as a discount on acquisition. Where settlement of any part of cash consideration is deferred, the amounts payable in the future are discounted to their present value as at the date of exchange. The discount rate used is the entity's incremental borrowing rate, being the rate at which a similar borrowing could be obtained from an independent financier under comparable terms and conditions. Contingent consideration is classified either as equity or a financial liability. Amounts classified as a financial liability are subsequently remeasured to fair value with changes in fair value recognised in profit or loss.
(r) Trade and other payables
These amounts represent liabilities for goods and services provided to the Group prior to the end of the financial period and which are unpaid. The amounts are unsecured and are usually paid within 60 days of recognition.
(s) Provisions
Onerous contracts
Obligations arising under onerous contracts are recognised and measured as a provision. An onerous contract is considered to exist where the Group has a contract under which the unavoidable costs of meeting the obligations under the contract exceed the economic benefits expected to be derived from it.
(t) Other financial liabilities
Other financial liabilities, including borrowings, are initially recognised at fair value, net of transaction costs.
Other financial liabilities are subsequently measured at amortised cost using the effective interest method, with interest expense recognised on an effective yield basis.
The effective interest method is a method of calculating the amortised cost of a financial liability and of allocating interest expense over the relevant period. The effective interest rate is the rate that exactly discounts estimated future cash payments through the expected life of the financial liability, or, where appropriate, a shorter period.
(u) Employee benefits
Wages and salaries, annual leave and sick leave
Liabilities arising in respect of wages and salaries, annual leave and any other employee entitlements expected to be settled within 12 months of balance date are measured at the amounts expected to be paid when the liabilities are settled.
Long service leave
Long service leave liabilities are measured at the present value of the estimated future cash outflow to be made in respect of services provided by employees up to balance date. Consideration is given to expected future wage and salary levels, projected employee movements and periods of service. Expected future payments are discounted using market yields at balance date on government bonds with terms to maturity that match, as closely as possible, the estimated future cash flows.
Bonus plans
Liabilities for employee benefits in the form of bonus plans are recognised in liabilities when it is probable that the liability will be settled and there are formal terms in place to determine the amount of the benefit.
Liabilities for bonus plans are expected to be settled within 12 months and are measured at the amounts expected to be paid when they are settled.
Equity-based compensation benefits
Equity-based compensation benefits are provided to employees via employee and executive equity plans.
The fair value of options or shares issued to employees is recognised as an employee benefit expense with a corresponding increase in equity. The fair value is measured at grant date and recognised in the option reserve or share-based payment reserve over the period during which the employees become unconditionally entitled to the equity. When the shares are issued, or the options exercised, the value is transferred to contributed equity.
The fair value of options at grant date is determined using the Black Scholes method that takes into account the value of the underlying share at grant date, the term of the vesting period, exercise price and expiry date.
The assessed fair value of shares granted to employees is allocated equally over the period from issue to the actual or expected vesting date.
Refer to note 28 for further details.

ERM Power Limited
Notes to the Consolidated Financial Statements (continued) FOR THE YEAR ENDED 30 JUNE 2013
53
1. SUMMARY OF SIGNIFICANT ACCOUNTING POLICIES (continued)
(v) Assets available for sale
Non-current assets and disposal groups are classified as held for sale if their carrying amount will be recovered principally through a sale transaction rather than through continuing use. This condition is regarded as met only when the sale is highly probable and the asset (or disposal group) is available for immediate sale in its present condition. Management must be committed to the sale which should be expected to qualify for recognition as a completed sale within one year from the date of classification. Non-current assets (and disposal groups) classified as held for sale are measured at the lower of their previous carrying amount and fair value less costs to sell.
(w) Earnings per share
Basic earnings per share are calculated by dividing:
The profit attributable to owners of the Company, excluding any cost of servicing equity other than ordinary shares
By the weighted average number of ordinary shares outstanding during the financial year, adjusted for bonus elements ordinary shares issued during the year and excluding treasury shares.
Diluted earnings per share
Diluted earnings per share adjust the figures used in the determination of basic earnings per share to take into account:
The after income tax effect of interest and other financing cost associated with dilutive potential ordinary shares, and
The weighted average number of additional ordinary shares that would have been outstanding assuming the conversation of all dilutive potential ordinary shares.
(x) Contributed equity
Ordinary shares
Ordinary shares are classified as equity. Incremental costs directly attributable to the issue of ordinary shares and share options are recognised as a deduction from equity, net of any tax effects.
Preference share capital
Preference share capital is classified as equity if it is non-redeemable, or redeemable only at the entity’s option, and any dividends are discretionary. Dividends thereon are recognised as distributions within equity upon declaration by the directors.
Preference share capital is classified as a liability if it is redeemable on a specific date or at the option of the shareholders, or if dividend payments are not discretionary. Dividends thereon are recognised as interest expense in profit or loss.
(y) Revenue recognition
The Group recognises revenue when the amount of revenue can be reliably measured, it is probable that future economic benefits will flow to the entity and specific criteria have been met for each of the Group’s activities as outlined below.
Revenue is measured at the fair value of the consideration received or receivable. Amounts disclosed as revenue are net of trade allowances and duties and taxes paid. Electricity sales revenue from sales contracts is recognised on measurement of electrical consumption at the metering point, as specified in each contractual agreement, and is billed monthly in arrears. At each balance date, sales and receivables include an amount of sales delivered to customers but not yet billed and recognised as accrued income. Generation revenue is recognised from the generation of electricity when the electricity has been supplied to customers.
Interest revenue is recognised on a time proportional basis taking into account the interest rates applicable to the financial assets. All revenue is stated net of goods and services tax.
Project management fees are calculated based on current contractual guidelines and include project success fees earned at financial close. The Group’s share of capitalised project management fees is eliminated on consolidation.
(z) Cost of sales
Cost of sales is recognised as those costs directly attributable to the goods sold and includes the costs of electricity, materials and associated distribution expenses. Electricity costs are based upon spot prices for electricity as established by the Australian Energy Market Operator (AEMO) and the outcomes of derivative financial instruments entered into for the purpose of risk management (refer to note 1(k)).
(aa) Borrowings
Borrowings are initially recognised at fair value, net of transaction costs incurred. Borrowings are subsequently measured at amortised cost. Any difference between the proceeds (net of transaction costs) and the redemption amount is recognised in profit or loss over the period of the borrowings using the effective interest method. Fees paid on the establishment of loan facilities are recognised as transaction costs of the loan to the extent that it is probable that some or all of the facility will be drawn down. In this case, the fee is deferred until the draw down occurs. To the extent there is no evidence that it is probable that some or all of the facility will be drawn down, the fee is capitalised as a prepayment for liquidity services and amortised over the period of the facility to which it relates.
Preference shares, which are mandatorily redeemable on a specific date, are classified as liabilities. The dividends on these preference shares are recognised in profit or loss as finance costs.
The fair value of the liability portion of a convertible bond is determined using a market interest rate for an equivalent non-convertible bond. This amount is recorded as a liability on an amortised cost basis using the effective interest rate method until extinguished on conversion or maturity of the bonds. The remainder of the proceeds is allocated to the conversion option. This is recognised and included in shareholders' equity, net of income tax effects.
Borrowings are removed from the statement of financial position when the obligation specified in the contract is discharged, cancelled or expired. The difference between the carrying amount of a financial liability that has been extinguished or transferred to another party and the consideration paid, including any non-cash assets transferred or liabilities assumed, is recognised in profit or loss as other income or finance costs. Borrowings are classified as current liabilities unless the Group has an unconditional right to defer settlement of the liability for at least 12 months after the reporting period.

ERM Power Limited
Notes to the Consolidated Financial Statements (continued) FOR THE YEAR ENDED 30 JUNE 2013
54
1. SUMMARY OF SIGNIFICANT ACCOUNTING POLICIES (continued)
(bb) Borrowing costs
Borrowing costs incurred for the construction of any qualifying asset are capitalised during the period of time that is required to complete and prepare the asset for its intended use or sale. Other borrowing costs are expensed.
The capitalisation rate used to determine the amount of borrowing costs to be capitalised to each project is the effective interest rate applicable to the specific borrowings at a project level during the year.
(cc) Leases
Finance leases, which transfer to the Group substantially all the risks and benefits incidental to ownership of the leased item, are capitalised at the inception of the lease at the fair value of the leased property or, if lower, at the present value of the minimum lease payments.
Lease payments are apportioned between the finance charges and reduction of the lease liability so as to achieve a constant rate of interest on the remaining balance of the liability. Finance charges are charged directly against income.
Capitalised leased assets are depreciated over the shorter of the estimated useful life of the asset or the lease term.
Leases where the lessor retains substantially all the risks and benefits of ownership of the asset are classified as operating leases. Operating lease payments are recognised as an expense in the income statement on a straight-line basis over the lease term.
(dd) Income tax
Income tax expense or revenue for the period is the tax payable on the current period’s taxable income based on the prevailing income tax rate adjusted by changes in deferred tax assets and liabilities attributable to temporary differences and to unused tax losses.
The current income tax charge is calculated on the basis of tax laws enacted or substantively enacted at the end of the reporting period in the countries where the Company's subsidiaries and associates operate and generate taxable income. Management periodically evaluates positions taken in tax returns with respect to situations in which applicable tax regulation is subject to interpretation. It establishes provisions where appropriate on the basis of amounts expected to be paid to the tax authorities.
Deferred income tax is provided in full, using the liability method, on temporary differences arising between the tax bases of assets and liabilities and their carrying amounts in the consolidated financial statements. However, deferred income tax is not accounted for if it arises from initial recognition of an asset or liability in a transaction other than a business combination that at the time of the transaction affects neither accounting nor taxable profit or loss.
Deferred income tax is determined using tax rates (and laws) that have been enacted or substantially enacted by the balance date and are
expected to apply when the related deferred income tax asset is realised or the deferred income tax liability is settled.
Deferred tax assets are recognised for deductible temporary differences and unused tax losses only if it is probable that future taxable amounts will be available to utilise those temporary differences and losses.
Deferred tax liabilities and assets are not recognised for temporary differences between the carrying amount and tax bases of investments in controlled entities where the entity is able to control the timing of the reversal of the temporary differences and it is probable that the differences will not reverse in the foreseeable future.
Deferred tax assets and liabilities are offset when there is a legally enforceable right to offset current tax assets and liabilities and when the deferred tax balances relate to the same taxation authority. Current tax assets and tax liabilities are offset where the entity has a legally enforceable right to offset and intends either to settle on a net basis, or to realise the asset and settle the liability simultaneously.
Current and deferred tax is recognised in profit or loss, except to the extent that it relates to items recognised in other comprehensive income or directly in equity. In this case, the tax is also recognised in other comprehensive income or directly in equity, respectively.
(ee) Goods and services tax (GST)
Revenues, expenses and assets are recognised net of the amount of associated GST, unless the GST incurred is not recoverable from the taxation authority. In this case it is recognised as part of the cost of acquisition of the asset or as part of the expense.
Receivables and payables are stated inclusive of the amount of GST receivable or payable. The net amount of GST recoverable from, or payable to, the taxation authority is included with other receivables or payables at the balance date.
Cash flows are presented on a gross basis. The GST components of cash flows arising from investing or financing activities which are recoverable from, or payable to the taxation authority, are presented as operating cash flows.
(ff) Dividends
Provision is made for the amount of any dividend declared, appropriately authorised, no longer at the discretion of the entity and not distributed during the reporting period.
(gg) Rounding of amounts
The Group is of a kind referred to in Class Order 98/100, issued by the Australian Securities and Investments Commission, relating to the ''rounding off'' of amounts in the financial statements. Amounts in the financial statements have been rounded off in accordance with that class order to the nearest thousand dollars, or in certain cases, the nearest dollar.

ERM Power Limited
Notes to the Consolidated Financial Statements (continued) FOR THE YEAR ENDED 30 JUNE 2013
55
1. SUMMARY OF SIGNIFICANT ACCOUNTING POLICIES (continued)
(hh) New accounting standards and interpretations
Certain new accounting standards and interpretations have been published that are not mandatory for 30 June 2013 reporting periods. Unless stated otherwise below, the Group is currently in the process of assessing the impact of these standards and amendments and is yet to decide whether to early adopt any of the new and amended standards. AASB 9 Financial Instruments, AASB 2010-7 Amendments to Australian Accounting Standards arising from AASB 9 (December 2010) and AASB 2012-6 Amendments to Australian Accounting Standards – Mandatory Effective Date of AASB 9 and Transition Disclosures (effective from 1 January 2015). AASB 9 Financial Instruments addresses the classification, measurement and derecognition of financial assets and financial liabilities. The standard is not applicable until 1 January 2015 but is available for early adoption. AASB 10 Consolidated Financial Statements, AASB 11 Joint Arrangements, AASB 12 Disclosure of Interests in Other Entities, revised AASB 127 Separate Financial Statements, AASB 128 Investments in Associates and Joint Ventures, AASB 2011-7 Amendments to Australian Accounting Standards arising from the Consolidation and Joint Arrangements Standards and AASB 2012-10 Amendments to Australian Accounting Standards – Transition Guidance and Other Amendments (effective 1 January 2013). In August 2011, the AASB issued a suite of five new and amended standards which address the accounting for joint arrangements, consolidated financial statements and associated disclosures. AASB 10 replaces all of the guidance on control and consolidation in AASB 127 Consolidated and separate financial statements, and Interpretation 12 Consolidation – special purpose entities. The core principle that a consolidated entity presents a parent and its subsidiaries as if they are a single economic entity remains unchanged, as do the mechanics of consolidation. However, the standard introduces a single definition of control that applies to all entities. It focuses on the need to have both power and rights or exposure to variable returns before control is present. Power is the current ability to direct the activities that significantly influence returns. Returns must vary and can be positive, negative or both. There is also new guidance on participating and protective rights and on agent / principal relationships. AASB 11 introduces a principles based approach to accounting for joint arrangements. The focus is no longer on the legal structure of joint arrangements, but rather on how rights and obligations are shared by the parties to the joint arrangement. Based on the assessment of rights and obligations, a joint arrangement will be classified as either a joint operation or joint venture. Joint ventures are accounted for using the equity method, and the choice to proportionately consolidate will no longer be permitted. Parties to a joint operation will account their share of revenues, expenses, assets and liabilities in much the same way as under the previous standard. AASB 11 also provides guidance for parties that participate in joint arrangements but do not share joint control. AASB 12 sets out the required disclosures for entities reporting under the two new standards, AASB 10 and AASB 11, and replaces the disclosure requirements currently found in AASB 128. Amendments to AASB 128 provide clarification that an entity continues to apply the equity method and does not remeasure its retained interest as part of ownership changes where a joint venture becomes an associate, and vice versa. The amendments also introduce a “partial disposal” concept. These standards are effective for annual periods beginning on or after 1 January 2013 with early adoption permitted. The Group does not expect the accounting for joint arrangements in place at 30 June 2013 to change significantly under the above new and amended standards. AASB 13 Fair value measurement (effective 1 January 2013). AASB 13 was released in September 2011. AASB 13 explains how to measure fair value and aims to enhance fair value disclosures. The standard is not applicable for annual periods until 1 January 2013 but is available for early adoption. Revised AASB 119 Employee Benefits, AASB 2011-10 Amendments to Australian Accounting Standards arising from AASB 119 (September 2011) and AASB 2011-11 Amendments to AASB 119 (September 2011) arising from Reduced Disclosure Requirements (effective 1 January 2013). In September 2011, the AASB released a revised standard on accounting for employee benefits. It requires the recognition of all re-measurements of defined benefit liabilities / assets immediately in other comprehensive income (removal of the so-called 'corridor' method) and the calculation of a net interest expense or income by applying the discount rate to the net defined benefit liability or asset. This replaces the expected return on plan assets that is currently included in profit or loss. The standard also introduces a number of additional disclosures for defined benefit liabilities / assets and could affect the timing of the recognition of termination benefits. The amendments will have to be implemented retrospectively. Since the Group does not have any defined benefit obligations, the amendments will not have any impact on the Group's financial statements. AASB 119 (2011)is effective for annual periods beginning on or after 1 January 2013 with early adoption permitted. AASB 2011-4 Amendments to Australian Accounting Standards to Remove Individual Key Management Personnel Disclosure Requirements (effective 1 July 2013). In July 2011 the AASB decided to remove the individual key management personnel (KMP) disclosure requirements from AASB 124 Related Party Disclosures, to achieve consistency with the international equivalent standard and remove a duplication of the requirements with the Corporations Act 2001. While this will reduce the disclosures that are currently required in the notes to the financial statements, it will not affect any of the amounts recognised in the financial statements. The amendments apply from 1 July 2013 and cannot be adopted early. The Corporations Act requirements in relation to remuneration reports will remain unchanged for now, but these requirements are currently subject to review and may also be revised in the near future. The amendments apply from 1 July 2013. AASB 2011-6 Amendments to Australian Accounting Standards – Extending Relief from Consolidation, the Equity Method and Proportionate Consolidation – Reduced Disclosure Requirements AASB 2011-6 provides relief from consolidation, the equity method and proportionate consolidation to not-for-profit entities and entities reporting under the reduced disclosure regime under certain circumstances. They will not affect the financial statements of the Group. The amendments apply from 1 July 2013.

ERM Power Limited
Notes to the Consolidated Financial Statements (continued) FOR THE YEAR ENDED 30 JUNE 2013
56
1. SUMMARY OF SIGNIFICANT ACCOUNTING POLICIES (continued)
(hh) New accounting standards and interpretations (continued)
AASB 2012-3 Offsetting Financial Assets and Financial Liabilities (effective 1 July 2014). The amendments do not change the current offsetting rules in AASB 132, but they clarify that the right of set-off must be available today (ie not contingent on a future event) and must be legally enforceable in the normal course of business as well as in the event of default, insolvency or bankruptcy. The amendments apply from 1 July 2014. AASB 2012-2 Disclosures – Offsetting Financial Assets and Financial Liabilities (effective 1 July 2013). There are more extensive disclosures which focus on quantitative information about recognised financial instruments that are offset in the statement of financial position, as well as those recognised financial instruments that are subject to master netting or similar arrangements, irrespective of whether they are offset. The amendments apply from 1 July 2013. AASB 2012-5 Amendments to Australian Accounting Standards arising from Annual Improvements 2009-2011 Cycle (effective 1 July 2013). The annual improvements project makes minor but necessary annual amendments to Australian Accounting Standards. The amendments apply from 1 July 2013.

ERM Power Limited
Notes to the Consolidated Financial Statements (continued) FOR THE YEAR ENDED 30 JUNE 2013
57
2. SEGMENT REPORT
Electricity Sales Generation Assets Other Total
$’000 2013 2012 2013 2012 2013 2012 2013 2012
Non-statutory revenue
Non-statutory revenue 1,493,032 842,395 72,734 72,244 5,146 5,325 1,570,912 919,964
Other income - - 5 30 243 768 248 798
Discount on acquisition - - - 19,068 - - - 19,068
Intersegment sales elimination - - - (1,229) (1,590) (675) (1,590) (1,904)
Total segment revenue 1,493,032 842,395 72,739 90,113 3,799 5,418 1,569,570 937,926
Less Expenses (1,454,742) (811,447) (29,211) (26,736) (15,796) (14,353) (1,499,749) (852,536)
EBITDAIF(i) 38,290 30,948 43,528 63,377 (11,997) (8,935) 69,821 85,390
Depreciation and amortisation (936) (174) (11,980) (16,736) (1,121) (998) (14,037) (17,908)
Finance expenses (6,857) (3,591) (22,503) (23,353) (2,493) (2,522) (31,853) (29,466)
Underlying profit before income tax 30,497 27,183 9,045 23,288 (15,611) (12,455) 23,931 38,016
Income tax expense attributed to underlying profit (6,330) (5,294)
Non-controlling interest (1,930) (2,411)
Underlying profit after tax attributable to equity holders of the Company 15,671 30,311
Impact of items excluded from underlying profit:
Net fair value gains on financial instruments designated as fair value through profit or loss 29,812 5,492
Tax credit on items excluded from underlying profit (8,944) (1,647)
Statutory profit after tax attributable to equity holders of the Company 36,539 34,156
Non-controlling interest 1,930 2,411
Statutory profit after tax 38,469 36,567
(i) Earnings before interest, tax, depreciation, amortisation, impairment, net fair value gains / losses on financial instruments designated at fair value through profit and loss and gains/losses on onerous contracts
The prior period segment disclosures have been adjusted to consolidate all generation activities of the Group into one segment reflecting the way in which this segment is reviewed and managed from 1 July 2012.
Revenue in the Other segment comprises interest, consulting and other income.

ERM Power Limited
Notes to the Consolidated Financial Statements (continued) FOR THE YEAR ENDED 30 JUNE 2013
58
2. SEGMENT REPORT (continued)
Electricity Sales Generation Assets Other Total
$’000 2013 2012 2013 2012 2013 2012 2013 2012
Assets
Total segment assets 360,106 222,497 467,443 470,441 134,346 73,499 961,895 766,437
Current and deferred tax assets 5,845 15,604
Total assets 967,740 782,041
Liabilities
Total segment liabilities 332,566 201,366 282,042 304,910 13,203 24,554 627,811 530,830
Current and deferred tax liabilities 68,086 69,455
Total liabilities 695,897 600,285
SEGMENT DESCRIPTION Management has determined the operating segments based on reports reviewed by the Managing Director who is the chief operating decision maker for the consolidated entity. The Managing Director regularly receives financial information on the underlying profit of each operating segment so as to assess the ongoing performance of each segment and to enable a relevant comparison to budget and forecast underlying profit. The prior period segment disclosures have been adjusted to consolidate all generation activities of the Group into one segment reflecting the way in which this segment is reviewed and managed from 1 July 2012. Segment assets and liabilities have been amended in the prior year to exclude inter-segment assets and liabilities from each reportable segment. Business segments: Products and services: ERM Sales Electricity sales to large commercial, industrial and government customers Generation Assets Gas-fired power generation assets and delivery of power generation solutions, from the initial concept through to development and operations Other Gas and Corporate Sales between segments are carried out at arm’s length and are eliminated on consolidation. No single customer amounts to 10% or more of the consolidated entity’s total external revenue for either the current or comparative period. All segment activity takes place in Australia.

ERM Power Limited
Notes to the Consolidated Financial Statements (continued) FOR THE YEAR ENDED 30 JUNE 2013
59
3. FINANCIAL RISK MANAGEMENT
A. Financial risk management objectives
The Group’s activities are exposed to a variety of financial risks, including market risk (commodity price, interest rate and foreign currency rate), credit risk and liquidity risk. The Group’s overall risk management strategy focuses on the unpredictability of markets and seeks to minimise potential adverse effects on the financial performance of the Group. The Group uses a variety of derivative financial instruments such as electricity derivatives and interest rate swaps to hedge against certain risk exposures.
The Group uses different methods to measure the different types of risk to which it is exposed. These methods include sensitivity analysis in the case of interest rate, foreign exchange and other price risks, and ageing analysis for credit risk. The Group holds the following financial instruments:
CONSOLIDATED
2013 2012
$’000 $’000
Financial assets
Derivative financial instruments 27,642 13,772
Equity investments 6,187 5,855
Loans and receivables 18,084 6,733
Cash and cash equivalents 215,355 139,615
267,268 165,975
Financial liabilities
Derivative financial instruments 64,924 88,627
Other financial liabilities at amortised cost 560,475 440,471
625,399 529,098
CONSOLIDATED
2013 2012
$’000 $’000
Financial assets by category
Financial assets at fair value through profit or loss 27,642 13,772
Amortised cost financial assets 233,439 146,348
Financial assets at fair value through other comprehensive income 6,187 5,855
267,268 165,975
(a) Market risk
Electricity pool price risk
Group
The Group is exposed to fluctuations in wholesale market electricity prices as a result of electricity generation and sales.
Group policies prescribe active management of exposures arising from forecast electricity sales within prescribed limits. In doing so, various hedging contracts have been entered into with individual market participants. Any unhedged position has the potential for variation in net profit from fluctuations in electricity pool prices.
ERM Power Retail Pty Ltd, one of the subsidiaries of the Group, routinely enters into forward sales contracts for the provision of electricity. The Group is exposed to a market risk of price fluctuations between the fixed price of these contracts and the relevant spot price of the electricity pool at the time of usage. The majority of this exposure to fluctuations in wholesale market electricity prices is managed through the use of various types of hedging contracts. The hedge portfolio consists predominantly of swaps, caps, futures and options. Electricity derivatives are either entered into in separate agreements or arise as embedded derivatives. Whilst the Group recognises the fair value of electricity derivative contracts for accounting purposes, the Group is not permitted to similarly recognise the fair value of the sales contracts that form the other side of the economic hedging relationship.
The following tables summarise the impact of a 10% change in the relevant forward prices for wholesale market electricity prices for the Group at the balance date, while all other variables were held constant.

ERM Power Limited
Notes to the Consolidated Financial Statements (continued) FOR THE YEAR ENDED 30 JUNE 2013
60
3. FINANCIAL RISK MANAGEMENT (continued)
A. Financial risk management objectives (continued)
(a) Market risk (continued)
Electricity sales sensitivity
The impact disclosed below summarises the sensitivity on the unrealised mark to market of electricity derivatives contracts only and does not include any corresponding movement in the value of customer contracts, which would vary in the opposite direction to the underlying hedge.
Increase by
10% Decrease by 10%
2013 $’000 $’000
Net profit / (loss) 75,915 (75,599)
Equity increase / (decrease) - -
2012
Net profit / (loss) 61,518 (61,402)
Equity increase / (decrease) - -
Sensitivity of 10% has been selected as this is considered reasonably possible based on industry standard benchmarks and historical volatilities.
Electricity generation sensitivity
The impact disclosed below summarises the sensitivity on the profit of generating assets held by the Group.
Increase by
10% Decrease by 10%
2013 $’000 $’000
Net profit / (loss) 117 (117)
Equity increase / (decrease) - -
2012
Net profit / (loss) 51 (51)
Equity increase / (decrease) - -
Sensitivity of 10% has been selected as this is considered reasonably possible based on industry standard benchmarks and historical volatilities.
Interest rate risk
The Group is exposed to interest rate risk on the funds it borrows at floating interest rates and on cash deposits. The risk is managed by entering into interest rate swap contracts. The sensitivity analysis to net profit (being profit before tax) and equity has been determined based on the exposure to interest rates at the balance date and assumes that there are concurrent movements in interest rates and parallel shifts in the yield curves. A sensitivity of 100 basis points has been selected as this is considered reasonable given the current level of short term and long term interest rates.
At balance date, if interest rates had been 100 basis points higher / lower and all other variables were held constant, the impact on the Group would be:
Increase by
100bps Decrease by 100bps
2013 $’000 $’000
Net profit / (loss) 589 (589)
Other equity increase / (decrease) - -
2012
Net profit / (loss) (21) 21
Other equity increase / (decrease) - -
The impact on net profit is largely due to the Group’s exposure to interest rates on its non-hedged variable rate limited recourse borrowings and cash assets.

ERM Power Limited
Notes to the Consolidated Financial Statements (continued) FOR THE YEAR ENDED 30 JUNE 2013
61
3. FINANCIAL RISK MANAGEMENT (continued)
A. Financial risk management objectives (continued)
(b) Credit risk
Credit risk refers to the loss that would occur if a debtor or other counterparty fails to perform under its contractual obligations. The carrying amounts of financial assets recognised at balance date best represents the Group’s maximum exposure to credit risk at balance date. The Group seeks to limit its exposure to credit risks as follows:
conducting appropriate due diligence on counterparties before entering into arrangements with them;
depending on the outcome of the credit assessment, obtaining collateral with a value in excess of the counterparties’ obligations to the Group – providing a ‘margin of safety’ against loss; and
for derivative counterparties, using primarily high credit quality counterparties, in addition to utilising ISDA master agreements with derivative counterparties in order to limit the exposure to credit risk.
The Group has no significant concentrations of credit risk. The credit qualities of all financial assets are consistently monitored in order to identify any potential adverse changes in the credit quality.
Concentrations of credit risk
The Group minimises concentrations of credit risk in relation to debtors by undertaking transactions with a large number of customers from across a broad range of industries within the business segments in which the Group operates, such that there are no significant concentrations of credit risk within the Group at balance date. Credit risk to trade debtors is managed through setting normal payment terms of up to 30 days and through continual risk assessment of debtors with material balances. Credit risk to electricity debtors is managed through system driven credit management processes. The process commences after due date. For some debtors the Group may also obtain security in the form of guarantees, deeds of undertaking, or letters of credit which can be called upon if the counterparty is in default under the terms of the agreement.
The ageing of receivables as at balance date was as follows:
Total $’000
< 30 days $’000
31-60 days $’000
> 60 days $’000
2013 Impaired (i) PDNI (ii) Impaired (i) PDNI (ii)
Consolidated
Trade receivables 15,746 14,356 44 1,210 129 180
Other receivables (iii) 2,338 23 - - - 2,315
18,084 14,379 44 1,210 129 2,495
2012
Consolidated
Trade receivables 4,272 4,068 5 150 370 54
Other receivables (iii) 2,461 - - - - 2,461
6,733 4,068 5 150 370 2,515
The majority of year-end debtors relate to electricity.
(i) Impaired balance represents account balances deemed to be irrecoverable by the Group at balance date. A provision for doubtful debts has been provided for.
(ii) Past due not impaired (PDNI) represents account balances deemed to be outstanding for greater than 30 days but are still considered to be recoverable in the ordinary course of business. Included in the Group’s trade receivable balance are debtors with a carrying amount of $1,383,056 (2012: $154,570) which are past due at balance date for which the Group has not provided as there has not been a significant change in credit quality and the amounts are still considered recoverable. The Group does not have any collateral over these balances.
(iii) Other receivables are neither past due or impaired and relate principally to employee shareholder loans, which are subject to loan deeds.

ERM Power Limited
Notes to the Consolidated Financial Statements (continued) FOR THE YEAR ENDED 30 JUNE 2013
62
3. FINANCIAL RISK MANAGEMENT (continued)
A. Financial risk management objectives (continued)
(c) Liquidity risk
Liquidity risk is the risk that the Group will not be able to meet its financial obligations as they fall due. Prudent liquidity risk management implies maintaining sufficient cash and marketable securities, the availability of funding through an adequate amount of committed credit facilities and the ability to close out market positions. The Group manages liquidity risk by continuously monitoring forecast and actual cash flows and matching the maturity profiles of financial assets and liabilities. Surplus funds are generally only invested in instruments that are tradeable in highly liquid markets. Information regarding undrawn finance facilities available as at 30 June 2013 is contained in Note 24.
Maturities of financial liabilities
The table below analyses the Group’s financial liabilities, including net and gross settled derivative financial instruments, into relevant maturity groupings based on the remaining period at balance date to the contractual maturity date. The amounts disclosed in the table are the contractual undiscounted cash flows. For interest rate swaps the cash flows have been estimated using forward interest rates applicable at balance date. For electricity derivatives the cash flows have been estimated using forward electricity prices at balance date.
Financial liabilities
≤1 year $’000
1 to 5 years $’000
>5 years $’000
Discount $’000
Total $’000
Consolidated
2013
Trade payables 156,060 - - - 156,060
Other payables 64,954 - - - 64,954
Interest bearing liabilities 95,498 - - - 95,498
Interest bearing liabilities – limited recourse (i) 31,243 66,302 163,717 (17,909) 243,353
Derivatives 25,114 39,810 - - 64,924
372,869 106,112 163,717 (17,909) 624,789
2012 Trade payables 88,230 - - - 88,230
Other payables 43,763 - - - 43,763
Interest bearing liabilities 49,366 - - - 49,366
Interest bearing liabilities – limited recourse (i) 26,342 93,216 159,997 (20,443) 259,112
Derivatives 25,793 62,834 - - 88,627
233,494 156,050 159,997 (20,443) 529,098
(i) Recourse limited to assets of the Neerabup Partnership and Oakey Power Holdings Pty Ltd. Refer note 24 for further details.

ERM Power Limited
Notes to the Consolidated Financial Statements (continued) FOR THE YEAR ENDED 30 JUNE 2013
63
3. FINANCIAL RISK MANAGEMENT (continued)
B. Significant accounting policies
Details of the significant accounting policies and methods adopted, including the criteria for recognition, the basis of measurement and the basis on which income and expenses are recognised in respect of each class of financial asset, financial liability and equity instrument are disclosed in note 1 to the financial statements.
C. Fair value of financial instruments The directors are of the opinion that the carrying amount of financial assets and financial liabilities recorded in the financial statements approximates their fair values. The fair values of financial assets and financial liabilities are determined as follows:
the fair value of financial assets and financial liabilities with standard terms and conditions, and traded on active liquid markets, is determined with reference to quoted market prices.
the fair value of other financial assets and financial liabilities is determined in accordance with generally accepted pricing models based on discounted cash flow analyses.
the fair value of derivative instruments included in hedging assets and liabilities is calculated using quoted prices. The fair value of financial instruments that are not traded in an active market (for example, over-the-counter derivatives) is determined using valuation techniques. The Group uses a variety of methods, such as estimated discounted cash flows, and makes assumptions that are based on market conditions existing at each balance date. These amounts reflect the estimated amount which the Group would be required to pay or receive to terminate (or replace) the contracts at their current market rates at balance date.
The fair value of financial assets and financial liabilities must be estimated for recognition and measurement or for disclosure purposes. The following table presents the Group’s assets and liabilities measured and recognised at fair value at 30 June 2013.
As at 30 June 2013 Level 1 Level 2 Level 3 Total $'000 $'000 $'000 $'000 Assets
Electricity derivatives contracts - 27,642 - 27,642
Financial assets at fair value through other comprehensive income 6,187 - - 6,187
Total assets 6,187 27,642 - 33,829
Liabilities
Electricity derivatives contracts 5,504 25,616 - 31,120
Derivatives used for hedging - 33,804 - 33,804
Total liabilities 5,504 59,420 - 64,924
As at 30 June 2012 Level 1 Level 2 Level 3 Total $'000 $'000 $'000 $'000 Assets
Electricity derivatives contracts - 13,772 - 13,772
Financial assets at fair value through other comprehensive income 5,855 - - 5,855
Total assets 5,855 13,772 - 19,627
Liabilities
Electricity derivatives contracts 1,879 45,145 - 47,024
Derivatives used for hedging - 41,603 - 41,603
Total liabilities 1,879 86,748 - 88,627
Level 1 The fair value of financial instruments traded in active markets is based on quoted market prices at the end of the reporting period. The quoted market price used for financial assets held by the Group is the current bid price. Level 2 The fair values of financial instruments that are not traded in an active market are determined using valuation techniques. The Group uses a variety of methods and makes assumptions that are based on market conditions existing at the end of each reporting period. Quoted market prices or dealer quotes for similar instruments are used to estimate fair value for long-term debt for disclosure purposes. Other techniques, such as estimated discounted cash flows, are used to determine fair value for the remaining financial instruments. The fair value of interest rate swaps is calculated as the present value of the estimated future cash flows. Level 3
A valuation technique for these instruments is based on significant unobservable inputs.

ERM Power Limited
Notes to the Consolidated Financial Statements (continued) FOR THE YEAR ENDED 30 JUNE 2013
64
3. FINANCIAL RISK MANAGEMENT (continued)
D. Capital risk management
The Group manages its capital so that it will be able to continue as a going concern while maximising the return to stakeholders through an appropriate mix of debt and equity. This approach is consistent with prior years. The capital structure of the Group as at balance date consists of total corporate facilities, as listed in note 24, total limited recourse facilities as listed in note 24 and equity, comprising issued capital, reserves and retained earnings as listed in notes 26 and 27.
In order to maintain or adjust the capital structure, the Group may adjust the amount of dividends paid to shareholders, return capital to shareholders, issue new shares or sell assets to reduce debt.
The Group is required to provide prudential credit support to various parties which it does through the provision of bank guarantees or cash collateral. It also has a working capital facility in place which is settled each month. A large percentage of the Group debt is in the form of limited recourse project finance provided directly to power stations in which the Group has an interest. During the financial year ended 30 June 2013 the entity complied with all applicable debt covenants.
The quantitative analysis of the Group’s gearing structure is illustrated below. To consider the risk of the company’s capital structure it is appropriate to segregate the projects from the rest of the Group. The table below illustrates the gearing and interest cover for the Group. When the Oakey and Neerabup assets and associated limited recourse debt are excluded the Group has no net debt.
CONSOLIDATED
2013 2012
$’000 $’000
Current borrowings 122,288 71,988
Non-current borrowings 216,563 236,490
Total debt 338,851 308,478
Cash and cash equivalents (215,355) (139,615)
Net debt 123,496 168,863
Total equity excluding reserves 306,619 218,069
Total capital 430,115 386,932
Gearing percentage 29% 44%
EBITDA Interest cover ratio 2.19 2.25
Gearing percentage is calculated as net debt divided by total capital. Net debt is calculated as total interest-bearing borrowings less cash and cash equivalents. Total capital is calculated as ‘equity’ as shown in the statement of financial position plus net debt less reserves attributable to fair value adjustments.
4. CRITICAL ACCOUNTING ESTIMATES AND JUDGEMENTS
Estimates and judgements are continually evaluated and are based on historical experience and other factors, including expectations of future events that may have a financial impact on the Group and that are believed to be reasonable under the circumstances.
(a) Critical accounting estimates and assumptions The Group makes estimates and assumptions concerning variables. The estimates and assumptions that have a significant risk of causing a material adjustment to the carrying amounts of assets and liabilities within the next financial year are discussed below. Impact of Carbon Tax on carrying value of assets Directors are of the view that the Clean Energy Futures Act passed by the Australian Federal Parliament in November 2011 will not have any negative impact on the recoverability of any assets of the Group. Share-based payment transactions The Company measures the cost of shares and options issued to employees and third parties by reference to the fair value of the equity instruments at the date at which they are granted. Details regarding the terms and conditions upon which the instruments were granted and methodology for determining fair value at grant date are available in note 28. Deferred tax assets The Group has recognised deferred tax assets relating to carried forward tax losses to the extent there are sufficient taxable temporary differences (deferred tax liabilities) relating to the same taxation authority against which the unused tax losses can be utilised. However, utilisation of the tax losses also depends on the ability of the entity to satisfy certain tests at the time the losses are recouped.

ERM Power Limited
Notes to the Consolidated Financial Statements (continued) FOR THE YEAR ENDED 30 JUNE 2013
65
4. CRITICAL ACCOUNTING ESTIMATES AND JUDGEMENTS (continued)
(b) Critical judgements in applying the entity’s accounting policies Recoverability of exploration costs All exploration, evaluation and development costs are capitalised to the extent that they are expected to be recouped through the successful development of the area or where activities in the area have not yet reached a stage which permits reasonable assessment of the existence of economically recoverable reserves and active or significant operations in relation to the area are continuing. The probability of expected future economic benefits is assessed using reasonable and supportable assumptions that represent management’s best estimate of the set of economic conditions that will exist over the useful life of the asset. In this assessment, greater weighting is given to available external evidence. Exploration and evaluation assets are reclassified as development assets at the point in which technical feasibility and commercial viability of extracting gas are demonstrated or a petroleum lease is granted. Exploration and evaluation assets are assessed for impairment and any impairment loss recognised before reclassification. Revision of useful lives of plant and equipment During the year the estimated useful lives for certain components of generation assets were revised. The revision has been applied prospectively from 1 July 2012 and has resulted in a reduction in depreciation expense for the 12 months ended 30 June 2013 of $2.4 million. An equivalent reduction is expected to apply for future periods subject to any further reassessment of useful life.
Fair value of financial instruments The fair value of financial assets and financial liabilities are estimated for recognition and measurement and for disclosure purposes. Management uses its judgement in selecting appropriate valuation techniques for financial instruments not quoted in active markets. Valuation techniques commonly used by market practitioners are applied. For derivative financial instruments, assumptions are made based on quoted market rates adjusted for specific features of the instrument. Other financial instruments are valued using a discounted cash flow analysis based on assumptions supported, where possible, by observable market prices and rates. Refer to note 3 for further details of valuation methods used by the Group to determine fair value. Purchase price allocation AASB 3 Business Combinations requires the recognition of fair value estimates of assets and liabilities acquired. By the nature of these estimates, judgements are made on the allocation of the purchase consideration.
CONSOLIDATED
2013 2012
$’000 $’000
5. REVENUE
Revenue from Continuing Operations
Sale of electricity 1,490,147 838,753
Electricity generation revenue 65,228 61,887
Operations income and project fees 6,112 8,325
Interest income 5,842 7,460
Consulting and other income 1,993 1,635
1,569,322 918,060
Refer to note 2 for further information regarding transactions between entities within the Group that have been eliminated on consolidation.

ERM Power Limited
Notes to the Consolidated Financial Statements (continued) FOR THE YEAR ENDED 30 JUNE 2013
66
CONSOLIDATED
2013 2012
$’000 $’000
6. EXPENSES
Cost of electricity sales 1,438,257 801,816
Cost of electricity generation 9,371 5,388
Employee benefits expense 30,524 25,566
Other expenses 21,597 19,766
1,499,749 852,536
Included in the above are:
Rental expenses relating to operating leases 3,250 1,477
Defined contribution superannuation expense 2,092 2,186
Equity settled share based payment compensation 753 649
CONSOLIDATED
2013 2012
$’000 $’000
7. NET FAIR VALUE GAIN ON FINANCIAL INSTRUMENTS DESIGNATED AT FAIR VALUE THROUGH PROFIT AND LOSS
Unrealised
Electricity derivative contracts 29,812 5,492
29,812 5,492
In the absence of hedge accounting, the Group’s electricity derivatives are designated at fair value through profit or loss.
CONSOLIDATED
2013 2012
$’000 $’000
8. FINANCE EXPENSE
Borrowing costs – bank loans 18,131 19,721
Borrowing costs – receivables financing facility 5,510 2,107
Borrowing costs – convertible notes 4,196 4,344
Other borrowing costs 4,016 3,294
31,853 29,466

ERM Power Limited
Notes to the Consolidated Financial Statements (continued) FOR THE YEAR ENDED 30 JUNE 2013
67
CONSOLIDATED
2013 2012
$’000 $’000
9. INCOME TAX
(a) Income tax expense
Income tax comprises:
Current tax expense 6,990 5,418
Deferred tax expense 8,595 1,345
Adjustment to deferred tax of prior periods (311) -
Under provided in prior years - 178
Income tax expense 15,274 6,941
Deferred income tax included in income tax expense comprises:
Decrease in deferred tax assets 4,249 1,238
Increase in deferred tax liabilities 4,036 107
Deferred income tax expense 8,285 1,345
(b) Numerical reconciliation of prima facie tax benefit to prima facie tax
Profit from continuing operations 53,743 43,508
Income tax expense calculated at 30% 16,123 13,052
Effect of expenses that are not deductible in determining taxable profit 89 17
Other permanent differences1 (627) (6,306)
Adjustment to deferred tax of prior periods (311) -
Under provided in prior year - 178
Income tax expense 15,274 6,941
(c) Amounts recognised directly in other comprehensive income
(Increase) / decrease in equity due to current and deferred amounts charged directly to equity during the period:
Net tax effect of amounts charged to cash flow hedge reserve (2,345) (7,228)
Net tax effect of amounts charged to transactions with non-controlling interests reserve - (443)
Net tax effect of amounts charged to fair value reserve 1,916 (1,145)
Net tax effect of amounts charged to share capital 543 -
Net tax effect of amounts charged to non-controlling interest - (42)
114 (8,858)
1 2012 includes the tax effect of the discount on acquisition of Oakey Power Station during the year ended 30 June 2012. Refer note 35 for further details.

ERM Power Limited
Notes to the Consolidated Financial Statements (continued) FOR THE YEAR ENDED 30 JUNE 2013
68
CONSOLIDATED
2013 2012
$’000 $’000
9. INCOME TAX (continued)
(d) Tax losses
Tax losses for which deferred tax asset is recognised in the current period 15,400 11,600
Potential tax benefit at 30% 4,620 3,480
(e) Current tax liabilities
Current tax payables: 1,498 1,279
Income tax payable 1,498 1,279
(f) Recognised deferred tax assets and deferred tax liabilities
Deferred tax assets
Carried forward income tax losses 19,079 14,459
Derivative financial instruments 11,320 22,467
Employee provisions 2,716 1,799
Financial assets at fair value through other comprehensive income 3,061 1,145
Other 362 803
36,538 40,673
Set-off of deferred tax liabilities (30,693) (25,069)
Net deferred tax assets 5,845 15,604
Deferred tax liabilities
Property, plant and equipment (89,042) (87,236)
Capitalised gas exploration costs (6,379) (4,196)
Other (1,860) (1,813)
(97,281) (93,245)
Set-off of deferred tax assets 30,693 25,069
Net deferred tax liabilities (66,588) (68,176)
Tax consolidation
The Company and its wholly-owned Australian controlled entities, has implemented the tax consolidation legislation. The entities in the tax consolidated group have entered into tax sharing agreements which, in the opinion of the directors, limits the joint and several liability of the wholly-owned entities in the case of a default by the head entity being ERM Power Limited. The entities in the tax consolidated group have also entered into tax funding agreements under which the wholly-owned entities fully compensate the head entity for any current tax payable assumed and are compensated by the head entity for any current tax receivable and deferred tax assets relating to unused tax losses or unused tax credits that are transferred to the head entity under the tax consolidation legislation. The funding amounts are determined by reference to the amounts recognised in the wholly-owned entities’ financial statements. The amounts receivable/payable under the tax funding agreement are due upon receipt of the funding advice from the head entity, which is issued as soon as practicable after the end of each financial year. The head entity may also require payment of interim funding amounts to assist with its obligations to pay tax instalments. The funding amounts are recognised as current intercompany receivables or payables.

ERM Power Limited
Notes to the Consolidated Financial Statements (continued) FOR THE YEAR ENDED 30 JUNE 2013
69
9. INCOME TAX (continued)
Movements in temporary differences - consolidated
Opening balance
Recognised in income statement
Recognised in equity
Acquisition of controlled
entities
Closing balance
2013 $'000 $'000 $'000 $'000 $'000
Deferred tax assets
Carried forward income tax losses 14,459 4,620 - - 19,079
Net derivative financial liabilities 22,467 (8,802) (2,345) - 11,320
Employee provisions 1,799 917 - - 2,716
Financial assets at fair value through other comprehensive income
1,145 - 1,916 - 3,061
Other items 803 (984) 543 362
40,673 (4,249) 114 - 36,538
Deferred tax liabilities
Capitalised gas exploration costs (4,196) (2,183) - - (6,379)
Property, plant and equipment (87,236) (1,806) - - (89,042)
Other items (1,813) (47) - - (1,860)
(93,245) (4,036) - - (97,281)
2012 $'000 $'000 $'000 $'000 $'000
Deferred tax assets
Carried forward tax losses 10,979 3,480 - - 14,459
Net derivative financial liabilities 17,189 (1,992) 7,270 - 22,467
Employee provisions 1,519 280 - - 1,799
Financial assets at fair value through other comprehensive income
- - 1,145 - 1,145
Other items 42 720 41 803
29,729 2,488 8,415 41 40,673
Deferred tax liabilities
Capitalised gas exploration costs (3,660) (536) - - (4,196)
Property, plant and equipment (14,969) (2,266) - (70,001) (87,236)
Other items (1,071) (1,031) 443 (154) (1,813)
(19,700) (3,833) 443 (70,155) (93,245)

ERM Power Limited
Notes to the Consolidated Financial Statements (continued) FOR THE YEAR ENDED 30 JUNE 2013
70
10. DIVIDENDS PAID AND PROPOSED
During the year ended 30 June 2013, the Company paid a fully franked final dividend for the year ended 30 June 2012 of 4.5 cents per share
and an interim dividend for the year ended 30 June 2013 of 5 cents per share (2012: 4 cents).
After 30 June 2013 the following dividends were proposed by the directors. The dividends have not been provided for and there are no income
tax consequences.
Cents per
share
Total amount
Franked Date of payment
$’000
Final ordinary 5.5 11,183 11,183 17/10/2013
2013 2012
$’000 $’000
Franking credits available to shareholders in subsequent years 17,770 19,353
The franking account balance is adjusted for:
franking credits that will arise from the payment of income tax;
franking debits that will arise from the payment of dividends recognised as a liability at the reporting date; and
franking credits that will arise from the receipt of dividends recognised as receivables at the reporting date.
The consolidated amounts include franking credits that would be available to the parent entity if distributable profits of subsidiaries not included within the tax consolidated group were paid as dividends. The impact on the franking account of the dividend recommended by the directors since the end of the reporting period, but not recognised as a liability at the reporting date, will be a reduction in the franking account of $4,792,847.
CONSOLIDATED
2013 2012
$’000 $’000
11. CASH AND CASH EQUIVALENTS
Current
Non-restricted cash at bank and cash on hand 94,869 41,405
Restricted cash 113,009 94,964
207,878 136,369
Non-current
Restricted cash 7,477 3,246
7,477 3,246
Total cash and cash equivalents 215,355 139,615
Restricted cash 120,486 98,210
Non-restricted cash 94,869 41,405
215,355 139,615
The cash and cash equivalents are bearing interest at rates between nil and 4.65%. Restricted cash Restricted cash deposits are held as cash-backed guarantees in respect of coupon payments due for the convertible notes issued and to provide credit support for the Group’s electricity derivative contracts. The restricted cash deposits, held on term deposit, are bearing interest at rates between 2% and 4.65%.
Term deposits 93,971 36,741
Other restricted cash deposits 26,515 61,469
120,486 98,210

ERM Power Limited
Notes to the Consolidated Financial Statements (continued) FOR THE YEAR ENDED 30 JUNE 2013
71
Note CONSOLIDATED
2013 2012
$’000 $’000
12. RECONCILIATION OF CASH FLOWS FROM OPERATING ACTIVITIES
Net profit after tax 38,469 36,567
Adjustments for:
Depreciation and amortisation of non-current assets 14,037 17,908
Interest income (5,842) (6,533)
Share based payment expense 753 649
Business combination transaction costs 35 - 729
Discount on acquisition of controlling interest in subsidiary 35 - (19,068)
Net fair value gains on financial instruments and inventory (29,812) (5,492)
Finance costs 31,853 29,466
Transfers to / (from) provisions:
Employee entitlements 672 (614)
Changes in assets and liabilities net of business combination:
(Increase) / decrease in trade and other receivables (70,069) (38,519)
(Increase) / decrease in other assets 823 (6,256)
(Increase) / decrease in inventories 19,049 (41,167)
Decrease / (Increase) in deferred tax assets 4,135 (5,577)
Increase / (decrease) in deferred tax liabilities 4,036 6,877
(Decrease) / increase in current tax liability 219 (409)
(Decrease) / increase in trade and other payables 90,674 71,136
Net cash provided by operating activities 98,997 39,697
Disclosure of financing facilities
Refer to note 24 for information regarding financing facilities.

ERM Power Limited
Notes to the Consolidated Financial Statements (continued) FOR THE YEAR ENDED 30 JUNE 2013
72
Note CONSOLIDATED
2013 2012
$’000 $’000
13. TRADE AND OTHER RECEIVABLES AT AMORTISED COST
Current
Trade receivables (i) 15,746 4,272
Other receivables 486 374
Amounts receivable from employee shareholders (ii) 406 482
16,638 5,128
Accrued income (iii) 140,700 81,772
157,338 86,900
Non-current
Amounts receivable from employee shareholders (ii) 1,446 1,605
1,446 1,605
(i) Trade receivables are non-interest bearing and are generally on 30-day terms. An allowance for doubtful debts is made when there is objective evidence that a trade receivable is impaired. An allowance of $173,069 (2012: $374,238) has been recognised as an expense for the current year for specific debtors for which such evidence exists. The amount of the allowance / impairment loss is measured as the difference between the carrying amount of the trade receivables and the estimated future cash flows expected to be received from the relevant debtors.
(ii) Employee shareholder loans are subject to loan deeds and interest is charged at the FBT benchmark rate.
(iii) Accrued income represents electricity amounts due to be invoiced on 1 July.
Details regarding the effective interest rate and credit risk of current receivables are disclosed in note 3.
Impaired receivables and receivables past due
None of the non-current receivables are impaired or past due. The carrying amounts of non-current receivables are equal to the fair values.
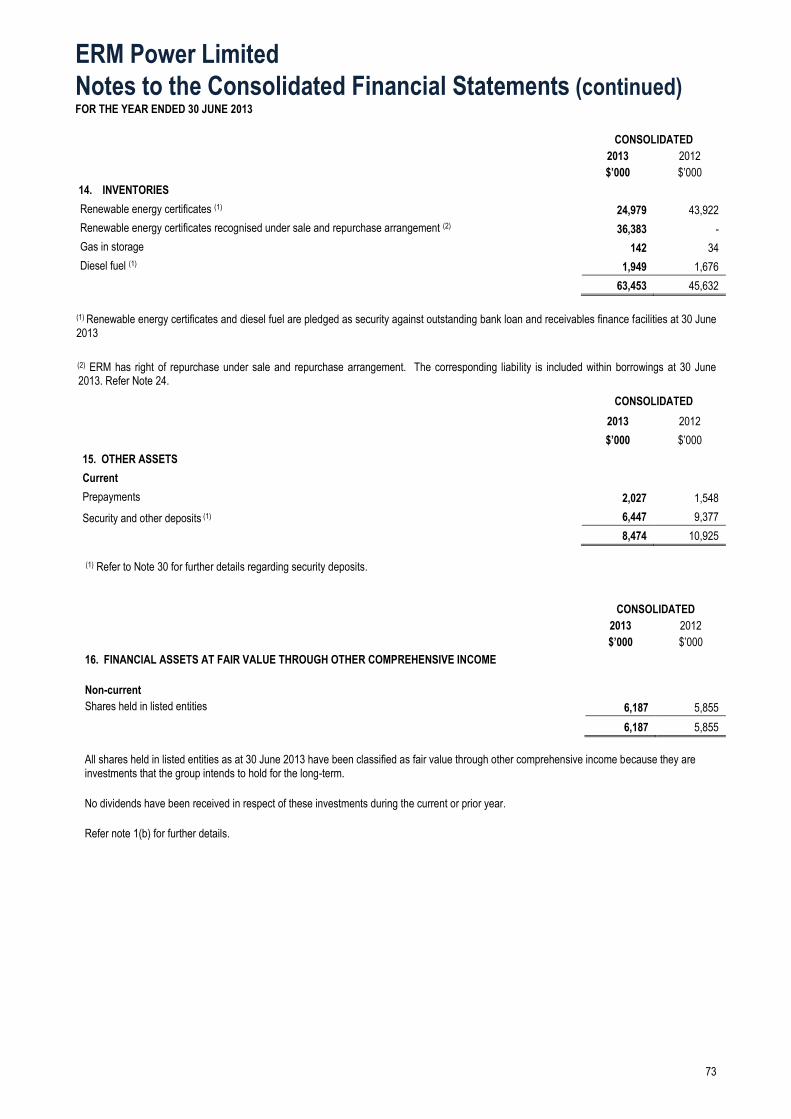
ERM Power Limited
Notes to the Consolidated Financial Statements (continued) FOR THE YEAR ENDED 30 JUNE 2013
73
CONSOLIDATED
2013 2012
$’000 $’000
14. INVENTORIES
Renewable energy certificates (1) 24,979 43,922
Renewable energy certificates recognised under sale and repurchase arrangement (2) 36,383 -
Gas in storage 142 34
Diesel fuel (1) 1,949 1,676
63,453 45,632
(1) Renewable energy certificates and diesel fuel are pledged as security against outstanding bank loan and receivables finance facilities at 30 June 2013
(2) ERM has right of repurchase under sale and repurchase arrangement. The corresponding liability is included within borrowings at 30 June 2013. Refer Note 24.
CONSOLIDATED
2013 2012
$’000 $’000
15. OTHER ASSETS
Current
Prepayments 2,027 1,548
Security and other deposits (1) 6,447 9,377
8,474 10,925
(1) Refer to Note 30 for further details regarding security deposits.
CONSOLIDATED
2013 2012
$’000 $’000
16. FINANCIAL ASSETS AT FAIR VALUE THROUGH OTHER COMPREHENSIVE INCOME
Non-current
Shares held in listed entities 6,187 5,855
6,187 5,855
All shares held in listed entities as at 30 June 2013 have been classified as fair value through other comprehensive income because they are investments that the group intends to hold for the long-term.
No dividends have been received in respect of these investments during the current or prior year.
Refer note 1(b) for further details.

ERM Power Limited
Notes to the Consolidated Financial Statements (continued) FOR THE YEAR ENDED 30 JUNE 2013
74
CONSOLIDATED
2013 2012
$’000 $’000
17. DERIVATIVE FINANCIAL INSTRUMENTS
Current assets
Electricity derivatives 27,622 13,763
27,622 13,763
Non-current assets
Electricity derivatives 20 9
20 9
Current liabilities
Electricity derivatives 17,757 13,297
17,757 13,297
Non-current liabilities
Electricity derivatives 13,363 33,727
Interest rate swaps 33,804 41,603
47,167 75,330
Derivative financial instruments used by the Group
The Group is party to derivative financial instruments in the normal course of business acquired in order to hedge exposure to fluctuations in electricity prices and interest and foreign exchange rates in accordance with the Group’s financial risk management policies.
All electricity derivatives are measured at fair value through profit and loss.
Interest rate swap contracts - cash flow hedges
The Neerabup partnership and Oakey Power Holdings Pty Ltd have limited recourse, variable interest rate project finance in place. This variable interest has been swapped into fixed.
Swaps currently in place for the Neerabup partnership cover approximately 97% (2012: 97%) of the variable loan principal outstanding and are timed to expire as each loan repayment falls due. The fixed interest rate is 7.189% (2012: 7.189%) and the variable rate is 1.1% above the BBSY rate which at the end of the reporting period was 2.87% (2012: 3.58%).
Swaps currently in place for Oakey Power Holdings Pty Ltd cover approximately 100% (2012: 100%) of the variable loan principal outstanding and are timed to expire as each loan repayment falls due. The fixed interest rate is 4.16% (2012: 4.16%) and the variable rate is 2.75% above the BBSY rate which at the end of the reporting period was 2.87% (2012: 3.58%).
The contracts require settlement of net interest receivable or payable each 90 days. The settlement dates coincide with the dates on which interest is payable on the underlying debt. The contracts are settled on a net basis.
The gain or loss from re-measurement of hedging instruments at fair values is recognised in other comprehensive income and deferred in equity in the hedging reserve, to the extent that the hedge is effective. It is reclassified into profit or loss when the hedged interest expense is recognised. There was no hedge ineffectiveness in the current or prior year.
Electricity derivative contracts held for trading
The maximum exposure to credit risk at the end of the reporting period is the carrying amount of each class of derivative financial asset.
Derivative financial instruments designated as cash flow hedges
The following table indicates the periods in which the cash flows associated with cash flow hedges are expected to impact profit or loss and the fair value of the related hedging instruments.
CONSOLIDATED
2013 2012
$’000 $’000
Liabilities
Interest rate swaps
12 months or less 7,359 6,675
1-2 years 5,994 6,288
2-5 years 11,135 16,268
More than 5 years 9,316 12,372
33,804 41,603

ERM Power Limited
Notes to the Consolidated Financial Statements (continued) FOR THE YEAR ENDED 30 JUNE 2013
75
18. INVESTMENT IN CONTROLLED ENTITIES
Name
Place of incorporation
Percentage of equity interest held by the Company
2013 2012
DIRECT HOLDINGS % %
ACN 162 696 335 Pty Ltd QLD 100 -
ERM Braemar 3 Power Pty Ltd QLD 100 100
ERM Financial Services Pty Ltd QLD 100 100
ERM Gas Pty Ltd QLD 100 100
ERM Holdings Pty Ltd QLD 100 100
ERM Neerabup Holdings Pty Ltd QLD 100 100
ERM Neerabup Power Pty Ltd VIC 100 100
ERM Oakey Power Holdings Pty Ltd NSW 100 100
ERM Power Developments Pty Ltd VIC 100 100
ERM Power Executive Option Plan Managers Pty Ltd NSW 100 100
ERM Power Generation Pty Ltd VIC 50 50
ERM Power Retail Pty Ltd VIC 100 100
ERM Power Services Pty Ltd VIC 100 100
ERM Power Utility Systems Pty Ltd QLD 100 100
ERM Wellington 1 Holdings Pty Ltd QLD 100 100
INDIRECT HOLDINGS
Braemar 3 Holdings Pty Ltd QLD 100 100
Elrex Pty Ltd NSW 83.3 83.3
ERM Braemar 3 Pty Ltd QLD 100 100
ERM Gas WA01 Pty Ltd VIC 100 100
ERM Land Holdings Pty Ltd QLD 100 100
ERM Neerabup Pty Ltd VIC 100 100
ERM Power Generation Pty Ltd VIC 50 50
MetroWest Pty Ltd QLD 100 100
Oakey Power Holdings Pty Ltd ACT 83.3 83.3
Oakey Power Pty Ltd ACT 83.3 83.3
Oakey Power Finance Pty Ltd ACT 83.3 83.3
Oakey Power Operations Pty Ltd ACT 83.3 83.3
Oakey Power Constructions Pty Ltd ACT 83.3 83.3
Private Power Investors Pty Ltd ACT 83.3 83.3
SAGE Utility Systems Pty Ltd VIC 100 100
The consolidated financial statements incorporate the assets, liabilities and results of the above principal subsidiaries in accordance with the accounting policy described in note 1(b). The equity interest is equal to the proportion of voting power held.

ERM Power Limited
Notes to the Consolidated Financial Statements (continued) FOR THE YEAR ENDED 30 JUNE 2013
76
19. PROPERTY, PLANT AND EQUIPMENT
CONSOLIDATED
2013
Land
$’000
Capital work in progress
$’000
Plant and equipment
$’000
Furniture, fittings and
improvements
$’000
Total
$’000
Cost 22,835 26,851 481,056 9,307 540,049
Accumulated depreciation and impairment - - (90,457) (3,200) (93,657)
Net carrying amount at 30 June 2013 22,835 26,851 390,599 6,107 446,392
Opening net carrying amount at 1 July 2012 21,091 21,581 401,971 1,137 445,780
Additions 1,744 5,270 577 5,945 13,536
Disposals - - (32) (6) (38)
Depreciation - - (11,917) (969) (12,886)
Closing net carrying amount at 30 June 2013 22,835 26,851 390,599 6,107 446,392
CONSOLIDATED
2012
Land
$’000
Capital work in progress
$’000
Plant and equipment
$’000
Furniture, fittings and
improvements
$’000
Total
$’000
Cost 21,091 21,581 480,508 3,673 526,853
Accumulated depreciation and impairment - - (78,537) (2,536) (81,073)
Net carrying amount at 30 June 2012 21,091 21,581 401,971 1,137 445,780
Opening net carrying amount at 1 July 2011 9,830 15,876 179,582 463 205,751
Additions - 5,705 371 1,172 7,248
Acquired through business combination 11,308 - 238,735 - 250,043
Disposals (47) - - - (47)
Depreciation - - (16,717) (498) (17,215)
Closing net carrying amount at 30 June 2012 21,091 21,581 401,971 1,137 445,780
Capital work in progress relates to capitalised costs for power station projects.
Each of the Group’s current generation assets, the Oakey and Neerabup power stations, are project financed by limited recourse debt, meaning the security of project lenders does not extend beyond the particular generation asset. The Group also raised funds for its equity investment in the Neerabup power station by issuing notes in 2008. Those notes are limited-recourse to the Group’s interest in the Neerabup power station.
Refer note 24 for details regarding recourse and limited recourse borrowings of the Group.

ERM Power Limited
Notes to the Consolidated Financial Statements (continued) FOR THE YEAR ENDED 30 JUNE 2013
77
CONSOLIDATED
2013 2012
$’000 $’000
20. EXPLORATION AND EVALUATION COSTS
Cost (gross carrying amount) 12,448 13,985
Accumulated amortisation and impairment - -
Net carrying amount 12,448 13,985
Reconciliations
Net of accumulated amortisation and impairment at start of year 13,985 11,435
Additions 7,425 2,550
Transfers to gas assets (8,962) -
Net of accumulated amortisation and impairment at end of year 12,448 13,985
CONSOLIDATED
2013 2012
$’000 $’000
21. GAS ASSETS
Assets in development
Cost (gross carrying amount) 17,309 -
Accumulated amortisation and impairment - -
Net carrying amount 17,309 -
Reconciliations
Net of accumulated amortisation and impairment at start of year - -
Transfer from exploration and evaluation costs 8,962 -
Additions 8,347 -
Net of accumulated amortisation and impairment at end of year 17,309 -

ERM Power Limited
Notes to the Consolidated Financial Statements (continued) FOR THE YEAR ENDED 30 JUNE 2013
78
22. INTANGIBLE ASSETS
CONSOLIDATED Capital work in progress
$’000
Software internally
generated
$’000
Software
$’000
Customer acquisition
costs
$’000
Total
$’000
Cost 1,130 2,259 3,356 2,381 9,126
Accumulated depreciation and impairment - (1,207) (1,683) (385) (3,275)
Net carrying amount at 30 June 2013 1,130 1,052 1,673 1,996 5,851
Opening net carrying amount at 1 July 2012 - 367 2,001 - 2,368
Additions 1,130 1,020 103 2,381 4,634
Amortisation - (335) (431) (385) (1,151)
Closing net carrying amount at 30 June 2013 1,130 1,052 1,673 1,996 5,851
CONSOLIDATED Capital work in progress
$’000
Software internally
generated
$’000
Software
$’000
Customer acquisition
costs
$’000
Total
$’000
Cost - 1,239 3,254 - 4,493
Accumulated depreciation and impairment - (872) (1,253) - (2,125)
Net carrying amount at 30 June 2012 - 367 2,001 - 2,368
Opening net carrying amount at 1 July 2011 - 122 2,465 - 2,587
Additions - 411 62 - 473
Amortisation - (166) (526) - (692)
Closing net carrying amount at 30 June 2012 - 367 2,001 - 2,368
Amortisation of intangible assets is included in depreciation and amortisation expense in the income statement.
CONSOLIDATED
2013 2012
$’000 $’000
23. TRADE AND OTHER PAYABLES
Current
Trade creditors and accruals 156,670 88,230
Other creditors 64,954 43,763
221,624 131,993

ERM Power Limited
Notes to the Consolidated Financial Statements (continued) FOR THE YEAR ENDED 30 JUNE 2013
79
Note CONSOLIDATED
2013 2012
$’000 $’000
24. BORROWINGS
Current
Secured
Bank loan - Receivables financing facility (i) 59,115 34,208
Bank loan - Inventory repurchase (ii) 36,383 -
95,498 34,208
Unsecured
Other loans (iii) - 15,158
- 15,158
Secured - limited recourse
Bank loan - Neerabup working capital facility (iv) 3,000 1,500
Bank loan - Neerabup term facility (current portion) (v) 4,453 3,720
Bank loan - Oakey term facility (current portion) (vi) 19,337 17,402
26,790 22,622
Total current borrowings 122,288 71,988
Non-current
Secured - limited recourse
Bank loan - Neerabup term facility (v) 151,818 156,051
Bank loan - Oakey term facility (vi) 19,561 36,472
Convertible notes (vii) 45,184 43,967
216,563 236,490
Total non-current borrowings 216,563 236,490
Total borrowings 338,851 308,478
Information on credit risk, fair value and interest rate risk exposure of the Group is provided at note 3. (i) Amounts drawn down on receivables financing facility secured against billed and unbilled electricity sales customer revenue receivables. (ii) Sale and repurchase agreement in respect of renewable energy certificates. The equivalent renewable energy certificate assets, over which
ERM has the right of repurchase, are included within inventory at 30 June 2013. (iii) Loans in relation to funding of additional 50% interest in Oakey acquisition. Loans were interest bearing at 12% per annum. (iv) Amounts drawn down on a limited recourse bank working capital facility by Neerabup Partnership. This debt has recourse to the assets of
Neerabup Partnership only. (v) Amounts drawn down on a limited recourse term debt facility in respect of the Neerabup Partnership. This debt has recourse to the assets of
Neerabup Partnership only. (vi) Amounts drawn down on a limited recourse term debt facility in respect of the Oakey Power Station. This debt has recourse to the assets of
Oakey Power Holdings Pty Ltd only. (vii) Convertible notes are redeemable by the issuer from 30 September 2010 until maturity in February 2023. Notes have a coupon rate that is
variable based on BBSY plus 4%. The notes are accounted for using the effective interest method at 8.84% (2012: 10.5%). The notes can only be converted to shares in the issuing subsidiary upon failure to redeem them at maturity or other named event of default. The notes have recourse to the Group’s 50% interest in the Neerabup partnership only.

ERM Power Limited
Notes to the Consolidated Financial Statements (continued) FOR THE YEAR ENDED 30 JUNE 2013
80
24. BORROWINGS (continued)
Financing facilities available
The Group’s financing facilities predominantly relate to limited recourse power station development activities. Funding is drawn down progressively according to project time lines. At balance date, the following financing facilities had been negotiated and were available:
CONSOLIDATED
2013 2012
$’000 $’000
Total facilities - bank loans 377,645 296,155
Facilities used at balance date - bank loans 336,760 269,363
Facilities unused at balance date - bank loans 40,885 26,792
CONSOLIDATED
2013 2012
$’000 $’000
25. PROVISIONS
Current
Employee benefits - annual leave 1,818 1,394
1,818 1,394
Non-current
Employee benefits - long service leave 594 338
594 338
Movements in provisions
Carrying amount at start of the year 1,732 1,129
Additional provision recognised and charged to profit and loss 1,871 1,720
Amounts used during the year (1,191) (1,117)
2,412 1,732
The entire amount of the annual leave provision is presented as current since the Group does not have an unconditional right to defer settlement for any of these obligations. However, based on past experience, the Group does not expect all employees to take the full amount of accrued leave or require payment within the next 12 months.

ERM Power Limited
Notes to the Consolidated Financial Statements (continued) FOR THE YEAR ENDED 30 JUNE 2013
81
Note CONSOLIDATED CONSOLIDATED
2013 2012 2013 2012
Number of shares
Number of shares
$’000
$’000
26. CONTRIBUTED EQUITY
27. z
Issued ordinary shares – fully paid 26(a) 203,332,935 168,295,039 237,837 169,263
Treasury shares 26(b) (2,642,681) (1,650,796) (4,546) (2,603)
200,690,254 166,644,243 233,291 166,660
(a) Movement in ordinary share capital
At the beginning of the period 168,295,039 162,140,656 169,263 161,137
Issue of shares – employee incentive scheme 991,885 1,989,747 2,024 2,952
Issue of shares – dividend reinvestment plan 416,590 2,584,295 1,104 3,900
Vesting and exercise of options 8,629,421 1,580,341 6,935 1,274
Issue of shares – capital raising (net of transaction costs) 25,000,000 - 58,511 -
At the end of the period 203,332,935 168,295,039 237,837 169,263
(b) Terms and conditions of contributed equity
Ordinary shares
During the year ended 30 June 2013, the Company conducted a capital raising issuing a total 25 million ordinary fully paid shares at $2.40 per share raising a total of $60 million less transaction costs of $2.1 million before tax. Ordinary shares have the right to receive dividends as declared and, in the event of winding up the Company, to participate in the proceeds from the sale of all surplus assets in proportion to the number of shares held. Ordinary shares entitle their holder to one vote, either in person or by proxy, at a meeting of the Company. Ordinary shares have no par value and the Company does not have a limited amount of authorised capital. Treasury shares
Treasury shares are shares that are held in trust for the purpose of issuing shares under employee share incentive schemes. Details of shares and options issued under employee share schemes (see note 28).

ERM Power Limited
Notes to the Consolidated Financial Statements (continued) FOR THE YEAR ENDED 30 JUNE 2013
82
Note CONSOLIDATED
2013 2012
$’000 $’000
27. RESERVES
Cash flow hedge reserve (23,595) (29,026)
Fair value reserve (7,143) (2,671)
Transactions with non-controlling interests (5,868) (5,868)
Share based payment reserve 1,830 1,252
(34,776) (36,313)
Movements
Cash flow hedge reserve
Balance at the beginning of the year (29,026) (12,158)
Revaluation - gross
7,758 (24,096)
Revaluation - deferred tax
(2,327) 7,228
Balance at the end of the year (23,595) (29,026)
Fair value reserve
Balance at the beginning of the year (2,671) -
Revaluation - gross (6,388) (3,816)
Revaluation - deferred tax
1,916 1,145
Balance at the end of the year (7,143) (2,671)
Share based payment reserve
Balance at the beginning of the year 1,252 603
Share based payments vested (175) -
Share based payment expense 753 649
Balance at the end of the year 1,830 1,252
Transactions with non-controlling interests reserve
Balance at the beginning of the year
(5,868) -
Acquisition of additional ownership in Oakey Power Holdings Pty Ltd
36 - (5,868)
Balance at the end of the year
(5,868) (5,868)
(a) Cash flow hedge reserve The cash flow hedge reserve comprises the effective portion of the cumulative net change in the fair value of cash flow hedging instruments related to hedged transactions that have not yet occurred.
(b) Fair value reserve Changes in the fair value and exchange differences arising on translation of investments, such as equities classified as fair value through other comprehensive income, are recognised in other comprehensive income, as described in note 1(i) and accumulated in a separate reserve within equity. (c) Transactions with non-controlling interests This reserve is used to record the differences described in note 1(b) which may arise as a result of transactions with non-controlling interests that do not result in a loss of control. (d) Share based payment reserve
The share‑based payments reserve is used to recognise:
the grant date fair value of options issued to employees but not exercised
the grant date fair value of shares issued to employees
the issue of shares held by the LTIST and LTIOT Employee Share Trusts to employees. Refer to note 28 for details of the employee share and option incentive schemes.

ERM Power Limited
Notes to the Consolidated Financial Statements (continued) FOR THE YEAR ENDED 30 JUNE 2013
83
28. SHARE BASED PAYMENTS
(a) Long term incentives The objective of the Long Term Incentive Scheme is to provide incentives to focus on long term shareholder returns. Participation in the scheme is open to selected employees (including the Managing Director) who are invited by the Board. These incentive awards were granted by way of offers to participate in both the Long Term Incentive Share Trust (LTIST) and the Long Term Incentive Option Trust (LTIOT).
i. LTIST
Shares are acquired by a trustee who holds those shares on behalf of participants. The shares are acquired by the trustee either subscribing for new shares or purchasing shares on market. Vesting conditions may be a combination of service and performance hurdles, as determined by the directors.
Participants hold their interest in the LTIST through units, where one unit represents one share. Participants are issued units at the prevailing market value of the shares. A participant may instruct the trustee how to exercise its vote in the case of a poll at a meeting of ERM Power. If the participant’s employment ceases prior to the shares vesting, the participant’s units in the LTIST are forfeited.
Early vesting may occur in the following circumstances, subject to the participant achieving any relevant performance hurdles, as set out below:
On termination of employment due to redundancy, death or permanent disability, or in circumstances that the Board determines appropriate.
On a change of control of ERM Power, being a material change in the composition of the Board initiated as a result of a change of ownership of shares and the purchaser of the shares requiring (or agreeing with other shareholders to require) that change in Board composition, or in other circumstances that the Board determines appropriate.
The fair value is independently determined using a Monte Carlo simulation (using a Black-Scholes framework). The model inputs for restricted shares granted are shown in the table below.
2013 financial year grant 2012 financial year grant
Assessed fair value per share at grant date $1.51 $1.33
Number of units allocated under the plan during the financial year 991,885 1,144,270
Share price at grant date $2.01 $1.50
Exercise price Nil Nil
Expected price volatility of the Company’s shares based on historic volatility 33.8% 30%
Risk free interest rate 2.65% 3.19%
Expected vesting date 3 years after issue 3 years after issue
Dividend yield 5.72% 6%
Proportion subject to vesting on satisfaction of total security holder return (TSR) performance
100%
50%
Proportion subject to vesting on satisfaction of earnings per share (EPS) growth performance
0%
50%
ii. LTIOT and other option grants Options were granted during the 2008 and 2011 financial years. No options have been granted subsequent to the 2011 financial year.
2011 financial year grant - LTIOT
Participants were issued units at the prevailing market value of the options. If the participant’s employment ceases prior to the options vesting, their units will be forfeited. The assessed fair value at grant date of options granted during the year ended 30 June 2011 was 10.43 cents. The fair value at grant date is determined using a Black-Scholes option pricing model that takes into account the exercise price, the term of the option, the share price at grant date and expected price volatility of the underlying share, the expected dividend yield and the risk free interest rate for the term of the option.
Early vesting may occur in the same circumstances as the LTIST, subject to achieving any relevant performance hurdles.

ERM Power Limited
Notes to the Consolidated Financial Statements (continued) FOR THE YEAR ENDED 30 JUNE 2013
84
28. SHARE BASED PAYMENTS (Continued)
ii. LTIOT and other option grants (Continued)
2008 financial year grant
In June 2008, the Company granted options with a five year exercise period and an exercise price of $0.806. There were no performance conditions attached to the options.
The assessed fair value at grant date of options granted during the year ended 30 June 2008 was 8.97 cents. The fair value at grant date is determined using a Black-Scholes option pricing model that takes into account the exercise price, the term of the option, the share price at grant date and expected price volatility of the underlying share, the expected dividend yield and the risk free interest rate for the term of the option.
Details of movements in each option plan are set out below.
Financial year
Grant Date Expiry date Exercise
price
Balance at start of the
year
Granted during the
year
Forfeited during the
year
Options exercised during the
year
Balance at end of the
year
Vested and exercisable at end of the
year
Number Number Number Number Number Number
2011 1/11/2010 1/11/2017 $2.75 1,276,762 - 41,674 - 1,235,088 1,235,088
2011 8/11/2010 8/11/2017 $2.75 242,706 - - - 242,706 242,706
2008 6/06/2008 6/06/2013 $0.806 8,388,868 - - 8,388,868 - -
2008 30/06/2008 30/06/2013 $0.806 100,000 - - 100,000 - -
Total
10,008,336 - 41,674 8,488,868 1,477,794 1,477,794
The weighted average remaining contractual life of options outstanding at the end of the period is 4.4 years. The weighted average share price from 1 July 2012 to 30 June 2013 was $2.3030 (2012: $1.6853)
(b) Other awards The Company may offer awards outside of the standard incentive plans. In June 2012, 261,782 Performance Rights were granted as part of an employee retention strategy. The Performance Rights are subject to a 5 year vesting period and will be satisfied, at the Board’s discretion, in cash or shares, subject to continuous full-time employment with the Company. The notional share price at grant date was $1.91 per share. The vesting value will be the number of Performance Rights held, multiplied by the higher of either the notional issue price, or the 20 day VWAP at the vesting date.
(c) Amounts expensed in respect of share-based payment transactions Expenses recognised in respect of share-based payment transactions during the period as part of employee benefit expense:
CONSOLIDATED
2013 2012
$’000 $’000
Shares issued under long term employee share scheme 753 649
753 649

ERM Power Limited
Notes to the Consolidated Financial Statements (continued) FOR THE YEAR ENDED 30 JUNE 2013
85
29. PARENT ENTITY FINANCIAL INFORMATION
(a) Summary financial information The individual financial statements for the parent entity show the following aggregate amounts
2013 2012
Statement of financial position $’000 $’000
Current Assets 84,418 68,394
Total Assets 242,589 211,763
Current Liabilities 7,921 6,280
Total liabilities 7,921 20,823
Net assets 234,668 190,940
Shareholders’ equity
Contributed equity 237,837 169,263
Treasury shares (4,546) (2,603)
Fair value reserves (7,143) (2,671)
Share option reserve 1,830 1,252
Retained earnings 6,690 25,699
Total equity 234,668 190,940
Loss for the year (2,431) (9,830)
Other comprehensive income (4,472) (2,671)
Total comprehensive loss (6,903) (12,501)
(b) Guarantees entered into by the parent entity The Company does not have any guarantees entered into by the parent entity at 30 June 2013.
(c) Contingent liabilities of the parent entity The Company does not have any contingent liabilities at 30 June 2013.
(d) Contractual commitments for acquisition of property, plant and equipment
There are no contractual commitments for the acquisition of property, plant and equipment at 30 June 2013.

ERM Power Limited
Notes to the Consolidated Financial Statements (continued) FOR THE YEAR ENDED 30 JUNE 2013
86
CONSOLIDATED
2013 2012
$’000 $’000
30. COMMITMENTS AND CONTINGENCIES
(a) Capital expenditure commitments
Estimated capital expenditure contracted for at balance date, not provided for but payable (including share of associates and joint ventures):
– not later than one year 1,418 1,262
– later than one year and not later than five years - -
– later than five years - -
1,418 1,262
(b) Lease expenditure commitments
Operating leases (non-cancellable):
Minimum lease payments
– not later than one year 1,556 1,388
– later than one year and not later than five years 15,892 14,676
– later than five years 21,403 18,646
Aggregate lease expenditure contracted for at balance date 38,851 34,710
The Group leases office premises in Brisbane, Sydney, Melbourne and Perth. Operating lease commitments shown above are net of any cash incentives under the respective lease agreements.

ERM Power Limited
Notes to the Consolidated Financial Statements (continued) FOR THE YEAR ENDED 30 JUNE 2013
87
30. COMMITMENTS AND CONTINGENCIES (Continued)
(c) Contingent liabilities
Details of contingent liabilities are set out below. The directors are of the opinion that provisions are not required in respect of these items as it is not probable that a future sacrifice of economic benefits will be required or the amount is not capable of reliable measurement.
CONSOLIDATED
CONSOLIDATED 2013 2012
$’000 $’000
Bank guarantees - Australian Energy Market Operator and other counterparties (i) 112,164 85,860
Bank guarantees - Lease arrangements (ii) 3,320 623
Futures margin deposits (iii) 26,209 11,764
Security deposits (iv) 5,971 9,246
Bank guarantees - Western Power (v) 300 300
Bank guarantees - Powerlink (vi) 2,200 2,200
Bank guarantees - Neerabup / Contractor dispute (vii) 1,750 1,750
Bank guarantees - AGL Hydro Partnership (viii) 4,227 4,227
Bank guarantees – NSW exploration licence (ix) 60 -
156,201 115,970
(i) The Group has provided bank guarantees in favour of the Australian Energy Market Operator (formerly National Electricity Market
Management Company) to support its obligations to purchase electricity from the National Electricity Market. Bank guarantees have also been provided to various counterparties in relation to electricity derivatives.
(ii) The Group has provided bank guarantees in relation to lease arrangements for premises in Brisbane, Sydney and Melbourne. These guarantees are supported by term deposits.
(iii) Futures margin deposits represent interest bearing cash lodged with the Group’s futures clearing brokers. The deposits are in relation to various futures contracts on the Australian Stock Exchange and may be retained by the clearing brokers in the event that the Group does not meet its contractual obligations.
(iv) Security deposits represent interest bearing cash lodged as eligible credit support with various counterparties to the Group’s electricity derivative contracts and may be retained by those counterparties in the event that the Group does not meet its contractual obligations.
(v) The Group has provided a bank guarantee in favour of Western Power. This can be called upon if the Neerabup partnership fails to pay its monthly transmission invoices.
(vi) The Group has provided a bank guarantee in favour of Powerlink for $2.2 million under a Connection Agreement. This guarantee is supported by a term deposit.
(vii) The Group has provided a bank guarantee in favour of its partner in the Neerabup Partnership under an indemnity agreement for a contractor dispute. Conneq Infrastructure Services (Australia) Pty Limited (formerly Bilfinger Berger Services (Australia) Pty Limited (Conneq) served a notice of dispute on the NewGen Neerabup Partnership on 27 August 2010 in relation to a liquidated damages claim made by the NewGen Neerabup Partnership and also alleging several breaches of the balance of plant contract. The notice of dispute claims that Conneq is not liable to pay a sum of approximately $12.0 million levied against it by the NewGen Neerabup Partnership as liquidated damages for certain delays under the balance of plant contract. The notice also alleges that the NewGen Neerabup Partnership has failed to pay Conneq a sum of approximately $770,000 and also claims the sum of approximately $8.0 million for delay costs. The dispute is currently being progressed through arbitration in line with the dispute resolution provisions contained within the contract. Should the dispute settle in favour of the Partnership the Group expects to recognise the settlement proceeds as revenue. Should the dispute settle in favour of Conneq, the Group expects to recognise the settlement costs as an additional cost of constructing the Neerabup power station. These costs will be capitalised and depreciated.
(viii) The Group has provided a bank guarantee in favour of the AGL Hydro Partnership in the event that there are damages resulting from the Oakey power station failing an annual capacity test.
(ix) The Group has provided bank guarantees in favour of the NSW Government in connection with its gas exploration licences in NSW. These guarantees are supported by term deposits.

ERM Power Limited
Notes to the Consolidated Financial Statements (continued) FOR THE YEAR ENDED 30 JUNE 2013
88
Interest Held
31. INTERESTS IN JOINTLY CONTROLLED ENTITIES AND JOINT VENTURE OPERATIONS 2013
%
2012
%
(a) Jointly controlled entities
As at 30 June 2013, the Group has the following interests in power station projects with other external parties:
Name
NewGen Power Neerabup Pty Ltd 50 50
NewGen Neerabup Pty Ltd 50 50
NewGen Neerabup Partnership 50 50
ERM Power Trust 50 50
Queensland Electricity Investors Pty Ltd 50 50
CONSOLIDATED
2013 2012
Net assets employed in the jointly controlled entities are included in the financial statements as follows:
$’000 $’000
CURRENT ASSETS
Cash and cash equivalents 10,458 8,965
Trade and other receivables 3,379 3,545
Inventories 142 33
Other assets 195 177
TOTAL CURRENT ASSETS 14,174 12,720
NON-CURRENT ASSETS
Property, plant and equipment 188,425 192,714
TOTAL NON-CURRENT ASSETS 188,425 192,714
TOTAL ASSETS 202,599 205,434
CURRENT LIABILITIES
Trade and other payables 587 540
Borrowings 7,453 5,220
Provisions 69 33
TOTAL CURRENT LIABILITIES 8,109 5,793
NON-CURRENT LIABILITIES
Borrowings 151,817 156,051
Derivative financial instruments 33,220 40,778
TOTAL NON-CURRENT LIABILITIES 185,037 196,829
TOTAL LIABILITIES 193,146 202,622
NET ASSETS 9,453 2,812
Capital expenditure commitments
Estimated capital expenditure contracted for at balance date, not provided for but payable
– not later than one year - 66
– later than one year and not later than five years - -
– later than five years - -
- 66

ERM Power Limited
Notes to the Consolidated Financial Statements (continued) FOR THE YEAR ENDED 30 JUNE 2013
89
31. INTERESTS IN JOINTLY CONTROLLED ENTITIES AND JOINT VENTURE OPERATIONS (Continued)
(b) Joint venture operations
The consolidated entity holds interests in a number of unincorporated joint ventures. The principal activities of these joint ventures are gas exploration, development and production.
32. RELATED PARTY DISCLOSURES
Parent Company
ERM Power Limited is the parent entity of the consolidated entity. Balances and transactions between the Parent entity and its wholly owned subsidiaries (which are related parties) have been eliminated on consolidation and are not disclosed in this note. Details of transactions between the consolidated entity and other related parties are disclosed below.
Trevor St Baker and his related parties had a controlling shareholding in the Company at 30 June 2013.
Equity interests in subsidiaries and jointly controlled entities
Details of interests in subsidiaries are set out in note 18.
Details of interests in jointly controlled entities are set out in note 31.
Key management personnel
Disclosures relating to key management personnel are set out in note 33 and the Directors’ Report.
Transactions with related parties
CONSOLIDATED
2013 2012
Transaction type $ $
Loans from directors
Loans received (i) - 800,000
Loan repayments (ii) 5,200,000 -
Interest and facility fees paid on director loans (i) 630,838 849,381
Director related entity transactions
Consulting fees (iii) 245,000 239,167
(i) Loan of $5.2 million ($0.8 million advanced on 4 July 2011) from a related entity of Trevor St Baker in relation to funding of additional 50% interest in Oakey acquisition. Loan is interest bearing at 12% per annum. Facility fees of $228,800 paid during the year ended 30 June 2012.
(ii) Loans of $5.2 million from a director related entity bearing interest at 12% per annum were repaid during the year ended 30 June 2013. (iii) ERM Power has a consulting agreement with Sunset Power Pty Ltd (a related party of Trevor St Baker). Under this agreement ERM Power
pays Sunset Power Pty Ltd (“Sunset”) a fee of $3,500 per day for services provided (up to a maximum of 70 days per annum). Sunset is also entitled to be reimbursed for all reasonable expenses incurred in providing these services. The consulting agreement may be terminated by giving 30 days written notice or immediately if Sunset breaches the agreement.
Other related party transactions During the year ended 30 June 2013, Stephen St Baker and Andrew St Baker were employed by the Company on terms and conditions no more favourable than those that would have been adopted if dealing at arm’s length with an unrelated person. Total payments for the year ended 30 June 2013 were $234,588 (2012: $462,394).
Minor surplus IT equipment was offered for sale to all employees under a closed bid process, in which some key management personnel have participated.
There is no allowance account for impaired receivables in relation to any outstanding balances, and no expense has been recognised in respect of impaired receivables due from related parties.
CONSOLIDATED
2013 2012
$ $
Transactions with jointly controlled entities:
Net loans advanced / (repaid) 121,244 (1,249,907)
Current trade receivables 184,661 86,671
Current trade payables (344,799) (29,619)
Project fees and operations management fees 2,639,924 3,193,020

ERM Power Limited
Notes to the Consolidated Financial Statements (continued) FOR THE YEAR ENDED 30 JUNE 2013
90
33. KEY MANAGEMENT PERSONNEL DISCLOSURES
(a) Key management personnel compensation
CONSOLIDATED
2013 2012
$ $
Short-term employee benefits
2,942,715 2,782,978
Post-employment benefits 243,903 206,309
Termination benefits - -
Share-based payments 630,988 382,393
3,817,606 3,371,680
Detailed remuneration disclosures are provided in the remuneration report. (b) Equity instruments disclosures
The number of shares and options held during the financial year by each director of the Group are disclosed in the Directors’ Report.
Option holdings
$
Balance at the start
of the year
Granted as compensation
Options exercised
Other
Changes(1)
Balance at the end
of the year
2013 Vested and exercisable
Unvested Vested and exercisable
Unvested
$ $ $ $ $ $ $
Directors of ERM Power Limited
Tony Bellas - - - - - - -
Trevor St Baker - - - (10,000) 10,000 - -
Martin Greenberg 354,726 - - - (354,726) - -
Brett Heading - - - - - - -
Tony Iannello - - - - - - -
Philip St Baker 833,870 242,706 - (833,870) - 242,706 -
Other key management personnel of the Group
William (Mitch) Anderson 196,872 106,364 - - (196,872) 106,364 -
Peters Jans 429,754 106,590 - - (429,754) 106,590 -
Derek McKay 125,000 106,364 - - (125,000) 106,364 -
Graeme Walker 30,000 92,700 - - (30,000) 92,700 -
(1) Options bought or sold

ERM Power Limited
Notes to the Consolidated Financial Statements (continued) FOR THE YEAR ENDED 30 JUNE 2013
91
33. KEY MANAGEMENT PERSONNEL DISCLOSURES (continued)
(b) Equity instruments disclosures (continued)
Option holdings
Balance at the start
of the year
Granted as compensation
Options exercised
Other
Changes(1)
Balance at the end
of the year
2012 Vested and exercisable
Unvested Vested and exercisable
Unvested
$ $ $ $ $ $ $
Directors of ERM Power Limited
Tony Bellas - - - - - - -
Trevor St Baker - - - - - - -
Martin Greenberg 354,726 - - - - 354,726 -
Brett Heading - - - - - - -
Tony Iannello - - - - - - -
Philip St Baker 833,870 242,706 - - - 833,870 242,706
Other key management personnel of the Group
William (Mitch) Anderson 666,872 106,364 - (470,000) - 196,872 106,364
Peters Jans 457,010 106,590 - - (27,256) 429,754 106,590
Derek McKay 250,000 106,364 - - (125,000) 125,000 106,364
Graeme Walker - 92,700 - - 30,000 30,000 92,700
(1) Options bought or sold
Share holdings
Balance at the start
of the year
Granted as compensation
Options exercised
Other
Changes(1)
Balance at the end
of the year
2013 Vested Unvested Vested Unvested
$ $ $ $ $ $ $
Directors of ERM Power Limited
Tony Bellas 100,000 - - - 6,250 106,250 -
Trevor St Baker 85,752,905 - - 10,000 (562,258) 85,200,647 -
Martin Greenberg 571,794 - - - - 571,794 -
Brett Heading 14,285 - - - - 14,285 -
Tony Iannello 114,285 - - - 11,409 125,694 -
Philip St Baker 4,176,926 319,630 238,777 833,870 398,819 5,436,583 531,439
Other key management personnel of the Group
William (Mitch) Anderson 967,852 133,123 78,149 - - 979,672 199,452
Peters Jans 205,885 133,403 78,314 - (217,505) 224 199,873
Derek McKay 260,194 133,123 78,149 - - 272,014 199,452
Graeme Walker 467,446 113,608 70,378 - (477,746) - 173,686
(1) On and off market movements, dividend reinvestment plan, cessation of relevant interests etc

ERM Power Limited
Notes to the Consolidated Financial Statements (continued) FOR THE YEAR ENDED 30 JUNE 2013
92
33. KEY MANAGEMENT PERSONNEL DISCLOSURES (continued)
(b) Equity instruments disclosures (continued)
Share holdings
Balance at the start
of the year
Granted as compensation
Options exercised
Other
Changes(1)
Balance at the end
of the year
2012 Vested Unvested Vested Unvested
$ $ $ $ $ $ $
Directors of ERM Power Limited
Tony Bellas 100,000 - - - - 100,000 -
Trevor St Baker 84,704,918 - - - 1,047,987 85,752,905 -
Martin Greenberg 571,794 - - - - 571,794 -
Brett Heading 14,285 - - - - 14,285 -
Tony Iannello 114,285 - - - - 114,285 -
Philip St Baker 3,932,830 80,904 415,761 - 67,061 4,176,926 319,630
Other key management personnel of the Group
William (Mitch) Anderson 497,852 35,458 97,665 470,000 - 967,852 133,123
Peters Jans 199,927 35,532 97,871 - 5,958 205,885 133,403
Derek McKay 260,194 35,458 97,665 - - 260,194 133,123
Graeme Walker 375,404 30,900 156,747 - 18,003 467,446 113,608
(1) On and off market movements, dividend reinvestment plan, cessation of relevant interests etc
(c) Loans to key management personnel
Details of loans made to key management personnel of the Group, including their related parties, are set out below.
Total individual loans
$
Balance at the start of the year
Interest paid and payable for the
year
Interest not charged
Balance at the end of the year
Number in Group at the end of the
year
2013 1,167,039 75,854 - 1,029,380 4
2012 1,246,996 88,604 - 1,167,039 4
Total Individuals with loans above $100,000 during the financial year
$
Balance at the start of the year
Interest paid and payable for the
year
Interest not charged
Balance at the end of the year
Number in Group at the end of the
year
2013 1,088,869 70,822 - 955,904 3
2012 1,166,570 83,181 - 1,088,869 3
The above loans include employee shareholder loans. In 2007 and 2008, ERM Power made offers to certain senior executives to participate in a share loan incentive plan. ERM Power provided loans to participants to enable them to subscribe for shares. The loans are subject to loan deeds and are interest bearing at the FBT benchmark rate with recourse limited to the value of the shares. The loans are repayable in the event of termination of employment or otherwise between seven and 10 years from the date of advance.
Key management personnel and their related parties with loans greater than $100,000 at 30 June 2013 and 30 June 2012 include Philip St Baker, Mitch Anderson and Andrew St Baker as a related party of Philip St Baker. The highest indebtedness of each key management personnel was $699,210 for Philip St Baker and $227,583 for Mitch Anderson.
Further details regarding director loans and other director transactions are included in Note 32 and the Directors’ Report.

ERM Power Limited
Notes to the Consolidated Financial Statements (continued) FOR THE YEAR ENDED 30 JUNE 2013
93
CONSOLIDATED
2013 2012
34. AUDITORS’ REMUNERATION $ $
Amounts received or due and receivable by PricewaterhouseCoopers Australia for:
An audit or review of the financial report of the entity and any other entity in the Group 513,834 542,850
513,834 542,850
Amounts received or due and receivable by PricewaterhouseCoopers Australia for non-audit services:
Other agreed-upon procedures in relation to the entity and any other entity in the consolidated Group
199,930 70,000
199,930 70,000
35. BUSINESS COMBINATION
Prior year acquisition – acquisition of additional 50% interest in the Oakey Power Station
On 1 July 2011 the Group acquired an additional 50% interest in Oakey Power Holdings Pty Ltd (OPH) taking the Group’s total shareholding in OPH and interest in the Oakey Power Station from 12.5% to 62.5%. During the period ended 31 December 2012 accounting for the acquisition was finalised with no adjustments to provisional fair values as disclosed in the Group’s annual financial statements for the year ended 30 June 2012.
$’000
Purchase consideration
Cash paid 62,533
Total purchase consideration 62,533
$’000
Acquisition of subsidiary net of cash acquired
Cash balances acquired 12,212
Cash paid (62,533)
Direct cash costs of acquisition (729)
Net cash outflow (51,050)
Discount on acquisition
The discount on acquisition of $19 million arose due to the sale price being limited through both a forced sale and pre-emptive rights. This has been recognised as other income.
Acquisition related costs
$0.7 million of acquisition related costs are included in profit and loss for the period ended 30 June 2012 in expenses.
Revenue and profit contribution
The acquired business contributed revenues of $34 million and net profit of $8.7 million to the Group for the period from 1 July 2011 to 30 June 2012 excluding the minority interest share. In addition, the Group recognised revenue of $19 million representing a discount on the acquisition of the controlling interest.

ERM Power Limited
Notes to the Consolidated Financial Statements (continued) FOR THE YEAR ENDED 30 JUNE 2013
94
36. TRANSACTIONS WITH NON-CONTROLLING INTERESTS
In January 2012, a wholly owned subsidiary of ERM Power Limited acquired an additional interest in Oakey Power Holdings Pty Ltd “OPH”. At the same time, OPH conducted a share buyback and an unrelated private investor in OPH also increased its respective interest in OPH. The effect of the transaction was such that the non-controlling interest was reduced from 37.5% to 16.7% at a total cash cost of $31 million. The carrying amount of the non-controlling interest in OPH on the date of the acquisition following the share buy-back was $19 million. The Group has recognised an increase in the non-controlling interest of $5.8 million and a decrease in equity attributable to ERM Power Limited of $5.8 million.
CONSOLIDATED
2013 2012
$’000 $’000
Adjustment to non-controlling interest - (24,683)
Consideration paid inclusive of transaction costs net of tax - 30,551
Excess of consideration paid - 5,868
Excess of consideration paid is recognised in the transactions with non-controlling interests reserve within equity
CONSOLIDATED CONSOLIDATED
2013
Number
'000
2012
Number '000
2013
Cents
2012
Cents
37. EARNINGS PER SHARE
Basic earnings per share 175,666 164,668 20.80 20.74
Diluted earnings per share 175,666 167,913 20.80 20.34
Reconciliation of weighted average number of ordinary shares
Weighted average number used in calculating basic earnings per share 175,666 164,668
Effect of share options on issue - 3,245
Weighted average number used in calculating diluted earnings per share 175,666 167,913
Information concerning earnings per share Options Options granted are considered to be potential ordinary shares and taken into account in the determination of diluted earnings per share. They are not included in the determination of basic earnings per share.
38. EVENTS AFTER THE REPORTING PERIOD
In July 2013 the Company successfully completed a share purchase plan raising $10 million. Since 30 June 2013 there have been no other matters or circumstances not otherwise dealt with in the Financial Report that have significantly or
may significantly affect the Group.

ERM Power Limited
Directors’ Declaration
95
In the opinion of the directors of ERM Power Limited (“Company”): (a) the financial statements and notes set out on pages 36 to 94 are in accordance with the Corporations Act 2001, including:
i. giving a true and fair view of the financial position of the consolidated entity as at 30 June 2013 and of its performance for the year then ended, and
ii. complying with Australian Accounting Standards (including the Australian Accounting Interpretations), the Corporations Regulations 2001 and other mandatory professional reporting requirements.
(b) the financial report complies with International Financial Reporting Standards as disclosed in note 1;
(c) there are reasonable grounds to believe that the Company will be able to pay its debts as and when they become due and payable;
Note 1(a) confirms that the financial statements also comply with International Financial Reporting Standards as issued by the International Accounting Standards Board. The directors have been given the declarations by the chief executive officer and chief financial officer required by section 295A of the Corporations Act 2001.
Signed in accordance with a resolution of the directors:
Tony Bellas
Chairman
22 August 2013

PricewaterhouseCoopers, ABN 52 780 433 757Riverside Centre, 123 Eagle Street, BRISBANE QLD 4000, GPO Box 150, BRISBANE QLD 4001T: +61 7 3257 5000, F: +61 7 3257 5999, www.pwc.com.au
Liability limited by a scheme approved under Professional Standards Legislation.
Independent auditor’s report to the members of ERM PowerLimited
Report on the financial reportWe have audited the accompanying financial report of ERM Power Limited (the company), whichcomprises the statement of financial position as at 30 June 2013, the income statement, statement ofcomprehensive income, statement of changes in equity and statement of cash flows for the year endedon that date, a summary of significant accounting policies, other explanatory notes and the directors’declaration for ERM Power Limited (the consolidated entity). The consolidated entity comprises thecompany and the entities it controlled at year’s end or from time to time during the financial year.
Directors’ responsibility for the financial reportThe directors of the company are responsible for the preparation of the financial report that gives atrue and fair view in accordance with Australian Accounting Standards and the Corporations Act 2001and for such internal control as the directors determine is necessary to enable the preparation of thefinancial report that is free from material misstatement, whether due to fraud or error. In Note 1(a),the directors also state, in accordance with Accounting Standard AASB 101 Presentation of FinancialStatements, that the financial statements comply with International Financial Reporting Standards.
Auditor’s responsibilityOur responsibility is to express an opinion on the financial report based on our audit. We conductedour audit in accordance with Australian Auditing Standards. Those standards require that we complywith relevant ethical requirements relating to audit engagements and plan and perform the audit toobtain reasonable assurance whether the financial report is free from material misstatement.
An audit involves performing procedures to obtain audit evidence about the amounts and disclosuresin the financial report. The procedures selected depend on the auditor’s judgement, including theassessment of the risks of material misstatement of the financial report, whether due to fraud or error.In making those risk assessments, the auditor considers internal control relevant to the consolidatedentity’s preparation and fair presentation of the financial report in order to design audit proceduresthat are appropriate in the circumstances, but not for the purpose of expressing an opinion on theeffectiveness of the entity’s internal control. An audit also includes evaluating the appropriateness ofaccounting policies used and the reasonableness of accounting estimates made by the directors, as wellas evaluating the overall presentation of the financial report.
We believe that the audit evidence we have obtained is sufficient and appropriate to provide a basis forour audit opinion.
IndependenceIn conducting our audit, we have complied with the independence requirements of the CorporationsAct 2001.

Auditor’s opinionIn our opinion:
1. the financial report of ERM Power Limited is in accordance with the Corporations Act 2001,including:
2. giving a true and fair view of the consolidated entity's financial position as at 30 June2013 and of its performance for the year ended on that date; and
3. complying with Australian Accounting Standards (including the Australian AccountingInterpretations) and the Corporations Regulations 2001.
4. the financial report and notes also comply with International Financial Reporting Standards asdisclosed in Note 1(a).
Report on the Remuneration ReportWe have audited the remuneration report included in pages 26 to 35 of the directors’ report for theyear ended 30 June 2013. The directors of the company are responsible for the preparation andpresentation of the remuneration report in accordance with section 300A of the Corporations Act2001. Our responsibility is to express an opinion on the remuneration report, based on our auditconducted in accordance with Australian Auditing Standards.
Auditor’s opinionIn our opinion, the remuneration report of ERM Power Limited for the year ended 30 June 2013,complies with section 300A of the Corporations Act 2001.
Matters relating to the electronic presentation of the auditedfinancial reportThis auditor’s report relates to the financial report and remuneration report of ERM Power Limited(the company) for the year ended 30 June 2013 included on ERM Power Limited’s web site. Thecompany’s directors are responsible for the integrity of ERM Power Limited’s web site. We have notbeen engaged to report on the integrity of this web site. The auditor’s report refers only to the financialreport and remuneration report named above. It does not provide an opinion on any other informationwhich may have been hyperlinked to/from the financial report or the remuneration report. If users ofthis report are concerned with the inherent risks arising from electronic data communications they areadvised to refer to the hard copy of the audited financial report and remuneration report to confirmthe information included in the audited financial report and remuneration report presented on thisweb site.
PricewaterhouseCoopers
Timothy J Allman BrisbanePartner 22 August 2013

Corporate Information
Directors
A Bellas (Non-Executive Chairman)
T St Baker (Non-Executive Deputy Chairman and Founder)
M Greenberg
B Heading
A Iannello P St Baker
Principal Place of Business
Level 52
One One One Eagle Street
Brisbane QLD 4000
Telephone: (07) 3020 5100
Facsimile: (07) 3220 6110
Company Secretaries
P Jans
G Walker
Bankers
National Australia Bank Limited
Macquarie Bank Limited
Registered Office
Level 52
One One One Eagle Street
Brisbane QLD 4000
Telephone: (07) 3020 5100
Facsimile: (07) 3220 6110
Auditors
PricewaterhouseCoopers
Internet Address
www.ermpower.com.au