Embed Size (px)
Citation preview
Full year results presentation
22 May 2018
Total AUM up 20% to €28.7bn, with €7.8bn of new money raised
Fundraising driven by our Senior Debt Partners strategy raising €4.2bn and growing momentum across our
European capital markets strategies
Third party fee earning AUM up 12% in the year to €21.0bn
Strong deployment across strategies, up 21% to €4.9bn. Continued focus on investment discipline in a
competitive market
Portfolios continue to perform well with all funds on course to meet or exceed applicable hurdle rates
Excellent start to the new financial year. Europe Fund VII fundraising is well advanced, with €2.6bn raised to
date. With a target size of €4bn we are scaling this strategy to reflect the level of investment opportunities
2
Fundraising and capital deployment at record levels Operational highlights
3
Fund management profits up 29%; driving dividend growth Financial highlights
Fund Management Company profits up 29% to £95.3m (2017: £74.0m), with third party fee¹ income up 21%
Investment Company profits¹ lower at £79.5m (2017: £163.5m), due to lower investment income
Group profit before tax¹ of £174.8m (2017: £237.5m)
Final ordinary dividend up 8% to 21.0 pence per share. Total ordinary dividends in the year up 11% to 30.0
pence per share
Total ordinary dividends represent 110% of post tax FMC profits (2017: 128%); we are ahead of plan in
covering ordinary dividends from FMC profits
¹These are non IFRS GAAP alternative performance measures and represent internally reported numbers excluding the impact of fair value movements on derivatives
(FY18: £6.5m; FY17: £1.3m). Internally reported numbers exclude the impact of the consolidation of 14 credit funds following the adoption of IFRS 10
4
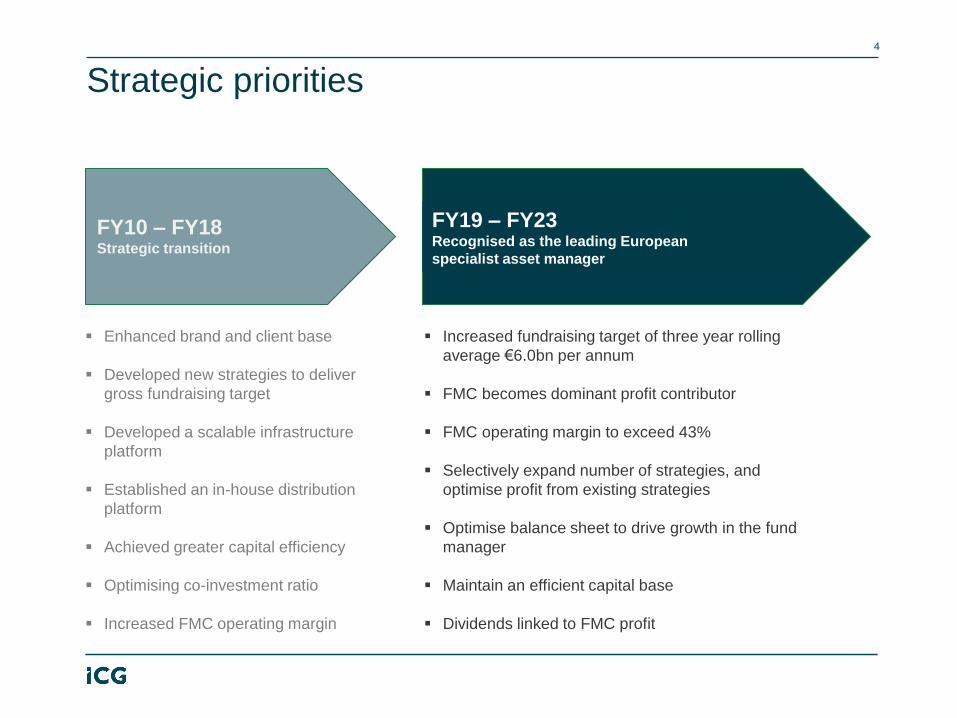
Strategic priorities
Enhanced brand and client base
Developed new strategies to deliver
gross fundraising target
Developed a scalable infrastructure
platform
Established an in-house distribution
platform
Achieved greater capital efficiency
Optimising co-investment ratio
Increased FMC operating margin
Increased fundraising target of three year rolling
average €6.0bn per annum
FMC becomes dominant profit contributor
FMC operating margin to exceed 43%
Selectively expand number of strategies, and
optimise profit from existing strategies
Optimise balance sheet to drive growth in the fund
manager
Maintain an efficient capital base
Dividends linked to FMC profit
FY19 – FY23 Recognised as the leading European
specialist asset manager
FY10 – FY18 Strategic transition
Financial Review
5
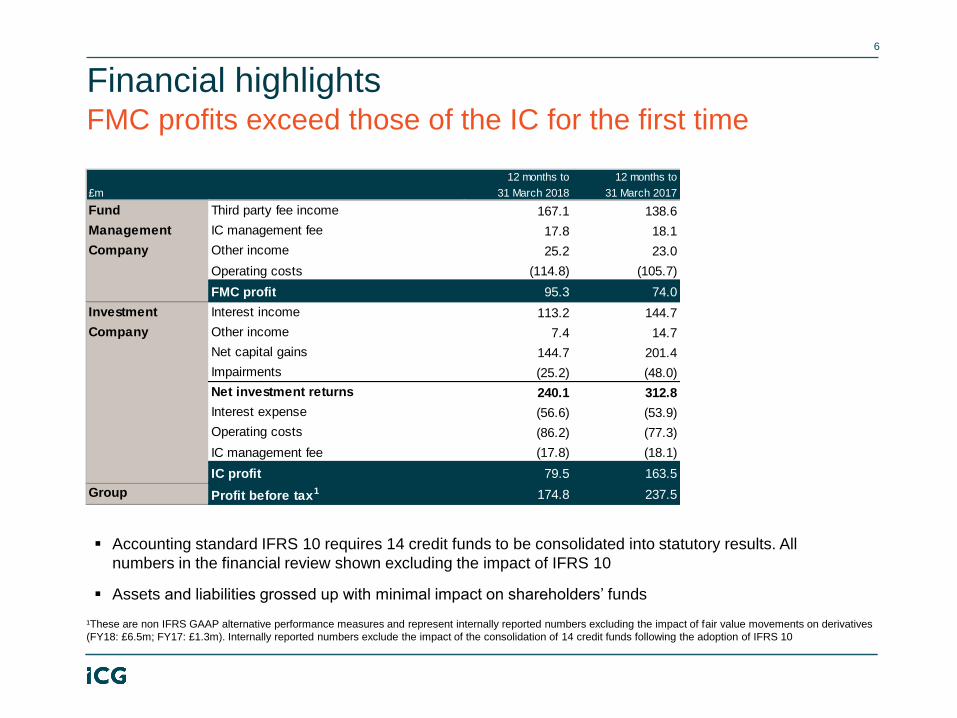
FMC profits exceed those of the IC for the first time
6
Financial highlights
Accounting standard IFRS 10 requires 14 credit funds to be consolidated into statutory results. All
numbers in the financial review shown excluding the impact of IFRS 10
Assets and liabilities grossed up with minimal impact on shareholders’ funds
¹These are non IFRS GAAP alternative performance measures and represent internally reported numbers excluding the impact of fair value movements on derivatives
(FY18: £6.5m; FY17: £1.3m). Internally reported numbers exclude the impact of the consolidation of 14 credit funds following the adoption of IFRS 10
12 months to 12 months to
£m 31 March 2018 31 March 2017
Fund Third party fee income 167.1 138.6
Management IC management fee 17.8 18.1
Company Other income 25.2 23.0
Operating costs (114.8) (105.7)
FMC profit 95.3 74.0
Investment Interest income 113.2 144.7
Company Other income 7.4 14.7
Net capital gains 144.7 201.4
Impairments (25.2) (48.0)
Net investment returns 240.1 312.8
Interest expense (56.6) (53.9)
Operating costs (86.2) (77.3)
IC management fee (17.8) (18.1)
IC profit 79.5 163.5
Group Profit before tax1 174.8 237.5
7
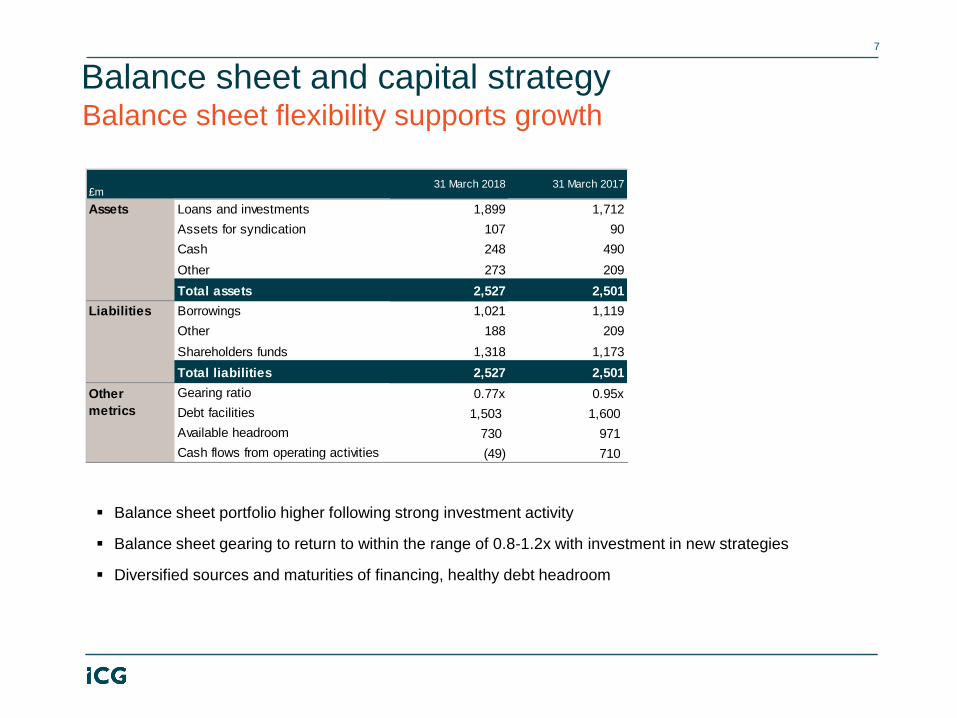
Balance sheet portfolio higher following strong investment activity
Balance sheet gearing to return to within the range of 0.8-1.2x with investment in new strategies
Diversified sources and maturities of financing, healthy debt headroom
Balance sheet and capital strategy Balance sheet flexibility supports growth
£m 31 March 2018 31 March 2017
Assets Loans and investments 1,899 1,712
Assets for syndication 107 90
Cash 248 490
Other 273 209
Total assets 2,527 2,501
Liabilities Borrowings 1,021 1,119
Other 188 209
Shareholders funds 1,318 1,173
Total liabilities 2,527 2,501
Gearing ratio 0.77x 0.95x
Debt facilities 1,503 1,600
Available headroom 730 971
Cash flows from operating activities (49) 710
Other
metrics
Fund Management Company
8
9
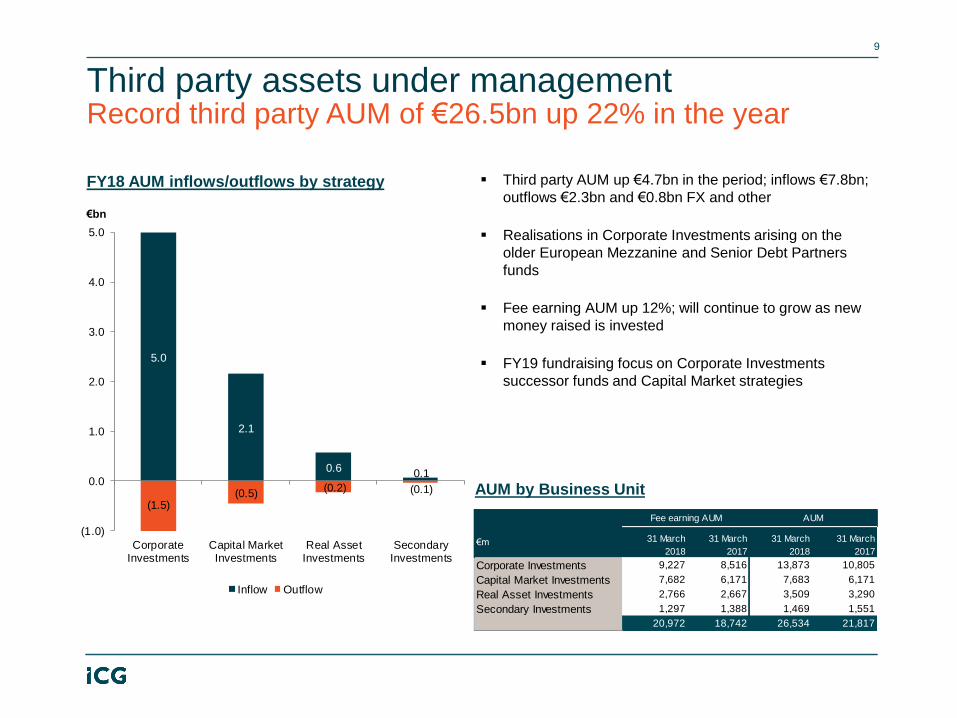
Record third party AUM of €26.5bn up 22% in the year
Third party AUM up €4.7bn in the period; inflows €7.8bn;
outflows €2.3bn and €0.8bn FX and other
Realisations in Corporate Investments arising on the
older European Mezzanine and Senior Debt Partners
funds
Fee earning AUM up 12%; will continue to grow as new
money raised is invested
FY19 fundraising focus on Corporate Investments
successor funds and Capital Market strategies
Third party assets under management
FY18 AUM inflows/outflows by strategy
AUM by Business Unit
5.0
2.1
0.60.1
(1.5)(0.5)
(0.2) (0.1)
(1.0)
0.0
1.0
2.0
3.0
4.0
5.0
CorporateInvestments
Capital MarketInvestments
Real AssetInvestments
SecondaryInvestments
€bn
Inflow Outflow
€m 31 March
2018
31 March
2017
31 March
2018
31 March
2017
Corporate Investments 9,227 8,516 13,873 10,805
Capital Market Investments 7,682 6,171 7,683 6,171
Real Asset Investments 2,766 2,667 3,509 3,290
Secondary Investments 1,297 1,388 1,469 1,551
20,972 18,742 26,534 21,817
Fee earning AUM AUM
10
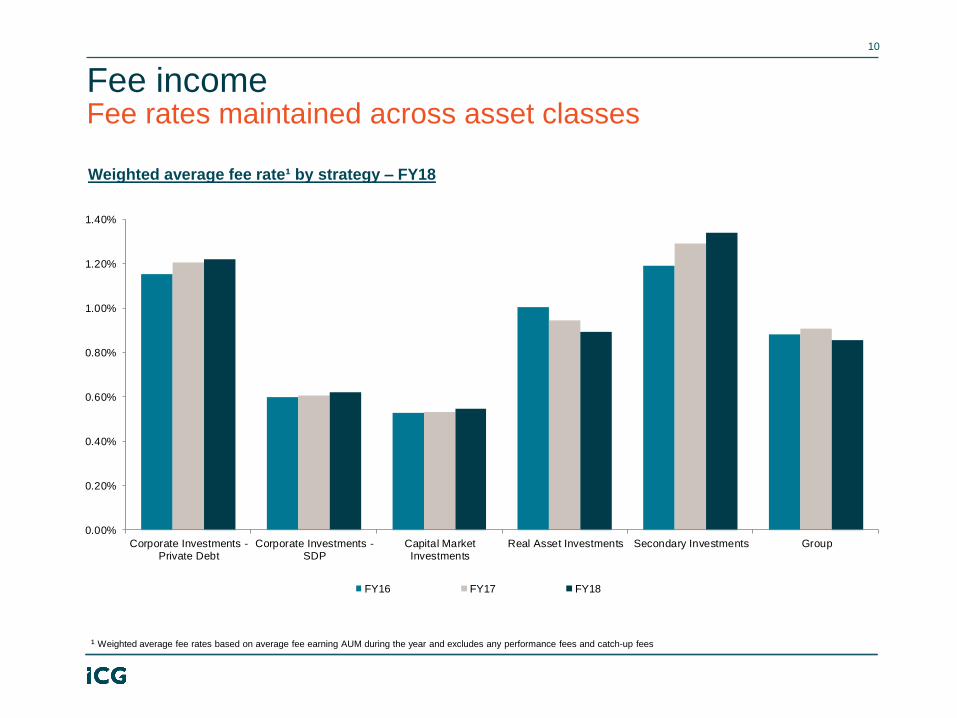
Fee rates maintained across asset classes Fee income
¹ Weighted average fee rates based on average fee earning AUM during the year and excludes any performance fees and catch-up fees
Weighted average fee rate¹ by strategy – FY18
0.00%
0.20%
0.40%
0.60%
0.80%
1.00%
1.20%
1.40%
Corporate Investments -Private Debt
Corporate Investments -SDP
Capital MarketInvestments
Real Asset Investments Secondary Investments Group
FY16 FY17 FY18
PEFI
Euro Mezz
Longbow Partnership Capital
Strategic Equity
Asia Pac
SDP
US CLOs
European CLOs
Longbow Senior Debt
Liquids / Loans
-400
-200
-
200
400
600
800
1,000
1,200
0.00% 0.20% 0.40% 0.60% 0.80% 1.00% 1.20% 1.40% 1.60% 1.80%
Net movement in Fee Earning AUM (€m)
Weighted avg. fee rate %
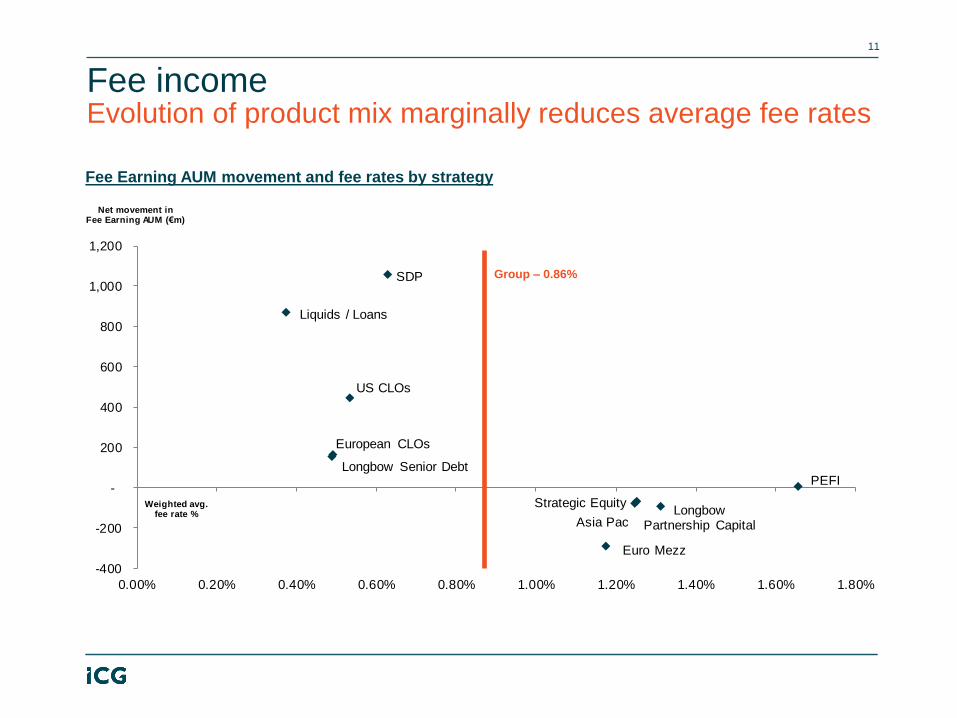
11
Evolution of product mix marginally reduces average fee rates Fee income
Fee Earning AUM movement and fee rates by strategy
Group – 0.86%
0%
5%
10%
15%
20%
25%
30%
35%
40%
45%
50%
0
50
100
150
200
250
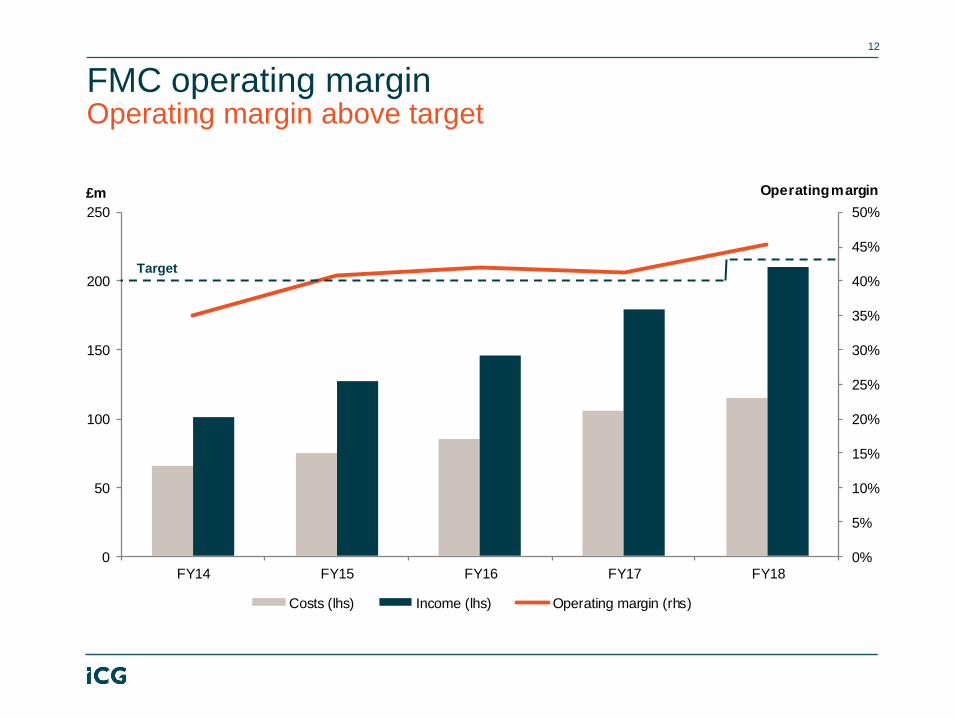
FY14 FY15 FY16 FY17 FY18
Operating margin£m
Costs (lhs) Income (lhs) Operating margin (rhs)
12
Operating margin above target FMC operating margin
Target

13
Costs in line with expectations FMC operating costs
Increase in staff costs reflects investment in capital market and senior debt strategies
New remuneration policy has increased the weighting to cash incentives for infrastructure and junior team
members
12 months to 12 months to
£m 31 March 2018 31 March 2017
Investment team staff costs 28.0 13% 25.7 14%
Marketing staff costs 5.2 3% 4.6 3%
Infrastructure staff costs 8.9 4% 8.7 5%
Staff costs 42.1 20% 39.0 22%
Cash incentives 24.7 12% 15.0 8%
Deferred aw ards 16.1 8% 18.8 10%
Incentive schemes 40.8 20% 33.8 18%
Other non staff costs 29.4 14% 29.9 17%
Placement fees 2.5 1% 3.0 2%
Total 114.8 55% 105.7 59%
% FMC
revenue
% FMC
revenue
Investment Company
14
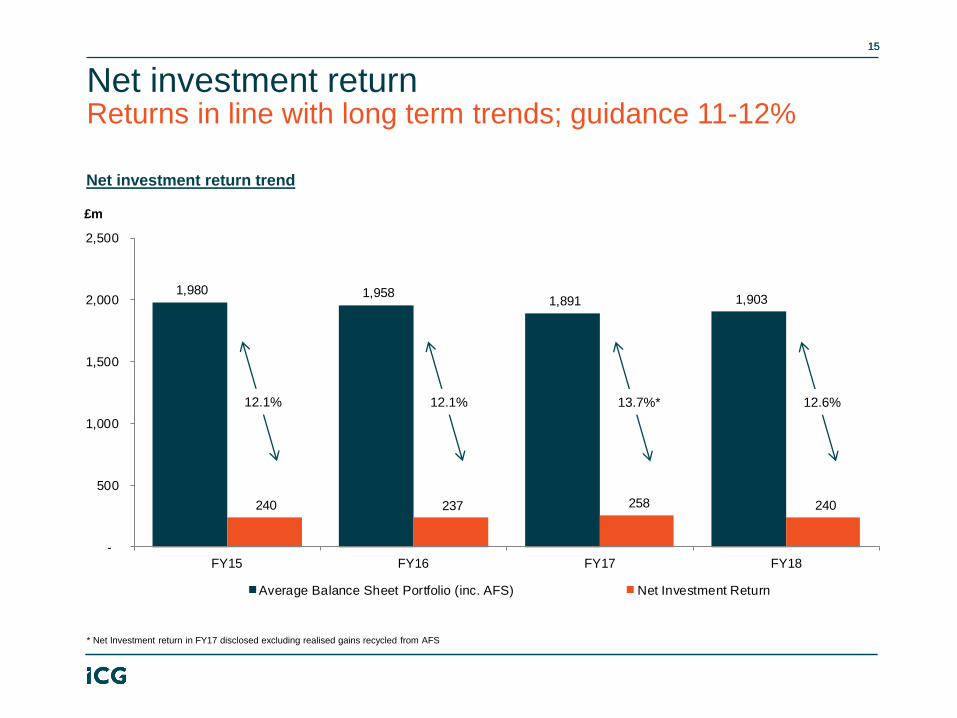
1,980 1,958 1,891 1,903
240 237 258 240
-
500
1,000
1,500
2,000
2,500
FY15 FY16 FY17 FY18
£m
Average Balance Sheet Portfolio (inc. AFS) Net Investment Return
15
Returns in line with long term trends; guidance 11-12%
Net investment return
15
12.1% 12.1% 13.7%* 12.6%
* Net Investment return in FY17 disclosed excluding realised gains recycled from AFS
Net investment return trend
16
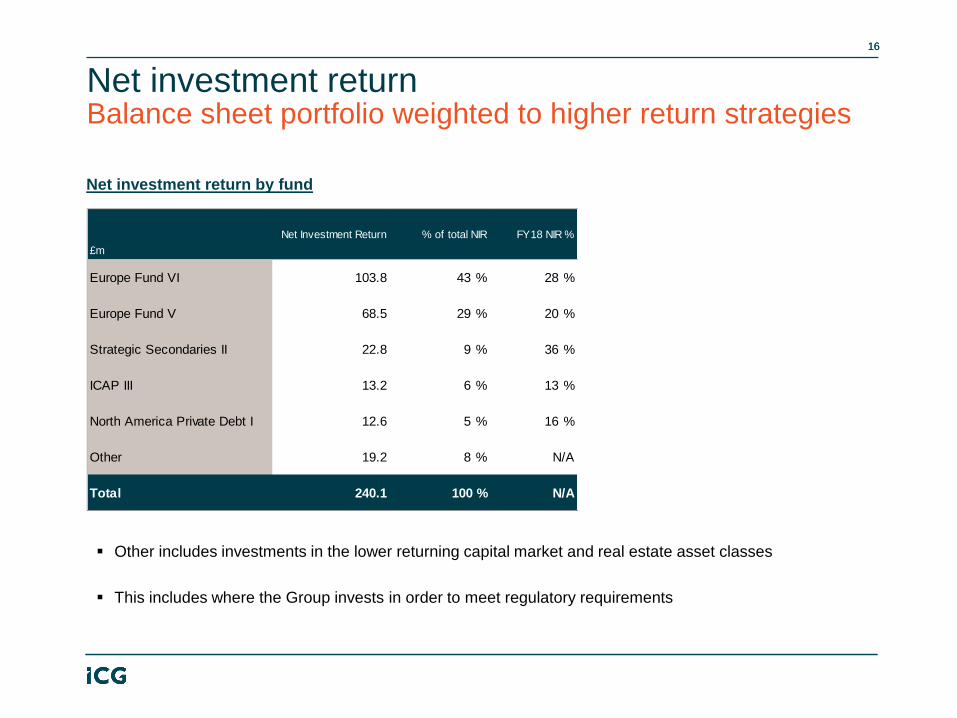
Balance sheet portfolio weighted to higher return strategies Net investment return
16
Net investment return by fund
Other includes investments in the lower returning capital market and real estate asset classes
This includes where the Group invests in order to meet regulatory requirements
£m
Net Investment Return % of total NIR FY18 NIR %
Europe Fund VI 103.8 43 % 28 %
Europe Fund V 68.5 29 % 20 %
Strategic Secondaries II 22.8 9 % 36 %
ICAP III 13.2 6 % 13 %
North America Private Debt I 12.6 5 % 16 %
Other 19.2 8 % N/A
Total 240.1 100 % N/A
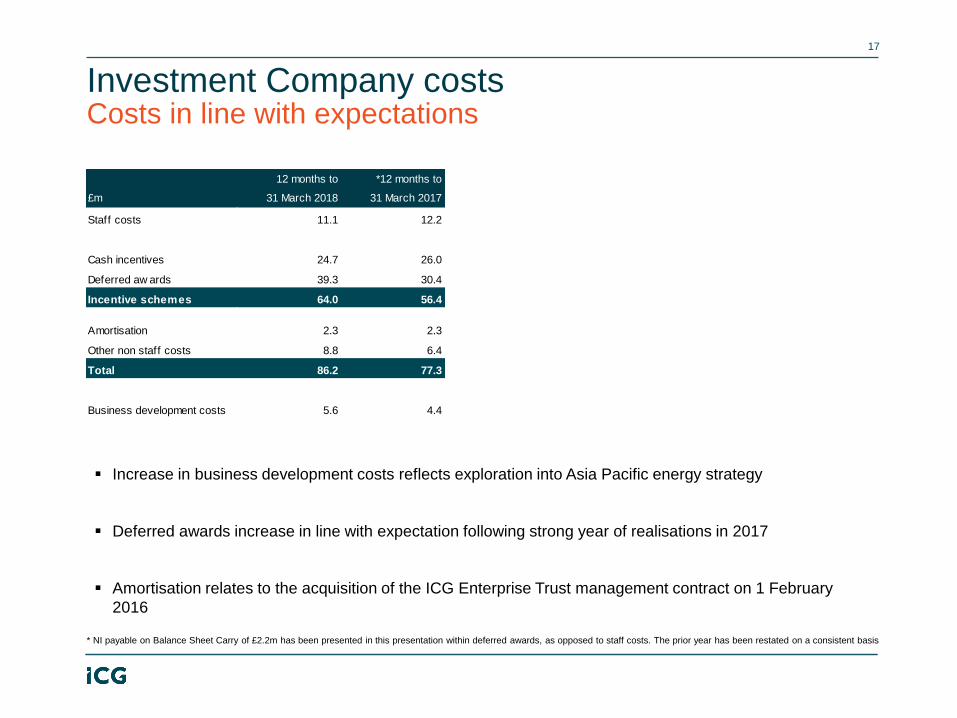
17
Costs in line with expectations
Investment Company costs
Increase in business development costs reflects exploration into Asia Pacific energy strategy
Deferred awards increase in line with expectation following strong year of realisations in 2017
Amortisation relates to the acquisition of the ICG Enterprise Trust management contract on 1 February
2016
12 months to *12 months to
£m 31 March 2018 31 March 2017
Staff costs 11.1 12.2
Cash incentives 24.7 26.0
Deferred aw ards 39.3 30.4
Incentive schemes 64.0 56.4
Amortisation 2.3 2.3
Other non staff costs 8.8 6.4
Total 86.2 77.3
Business development costs 5.6 4.4
* NI payable on Balance Sheet Carry of £2.2m has been presented in this presentation within deferred awards, as opposed to staff costs. The prior year has been restated on a consistent basis
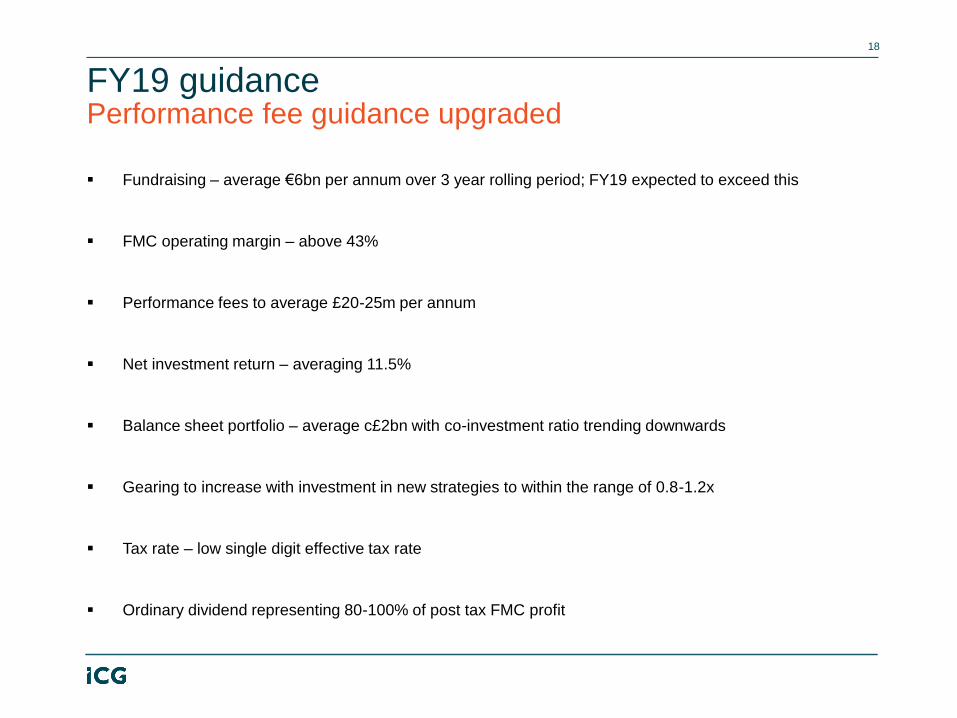
Performance fee guidance upgraded
Fundraising – average €6bn per annum over 3 year rolling period; FY19 expected to exceed this
FMC operating margin – above 43%
Performance fees to average £20-25m per annum
Net investment return – averaging 11.5%
Balance sheet portfolio – average c£2bn with co-investment ratio trending downwards
Gearing to increase with investment in new strategies to within the range of 0.8-1.2x
Tax rate – low single digit effective tax rate
Ordinary dividend representing 80-100% of post tax FMC profit
18
FY19 guidance

Operating Review
19

20
To grow our specialist asset management activities Our strategy
20
Generate strong shareholder returns to invest in growth and pay sustainable dividends
Manage
portfolios to
maximise
value
Invest
selectively
Grow assets
under
management

Investing
21
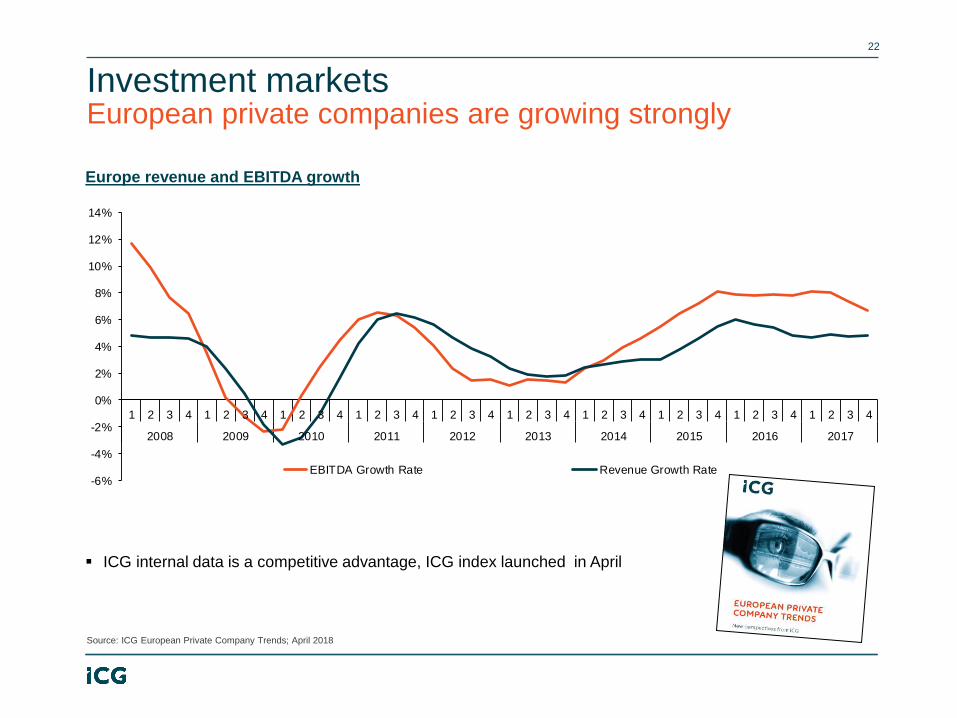
22
European private companies are growing strongly Investment markets
-6%
-4%
-2%
0%
2%
4%
6%
8%
10%
12%
14%
1 2 3 4 1 2 3 4 1 2 3 4 1 2 3 4 1 2 3 4 1 2 3 4 1 2 3 4 1 2 3 4 1 2 3 4 1 2 3 4
2008 2009 2010 2011 2012 2013 2014 2015 2016 2017
EBITDA Growth Rate Revenue Growth Rate
Europe revenue and EBITDA growth
Source: ICG European Private Company Trends; April 2018
ICG internal data is a competitive advantage, ICG index launched in April
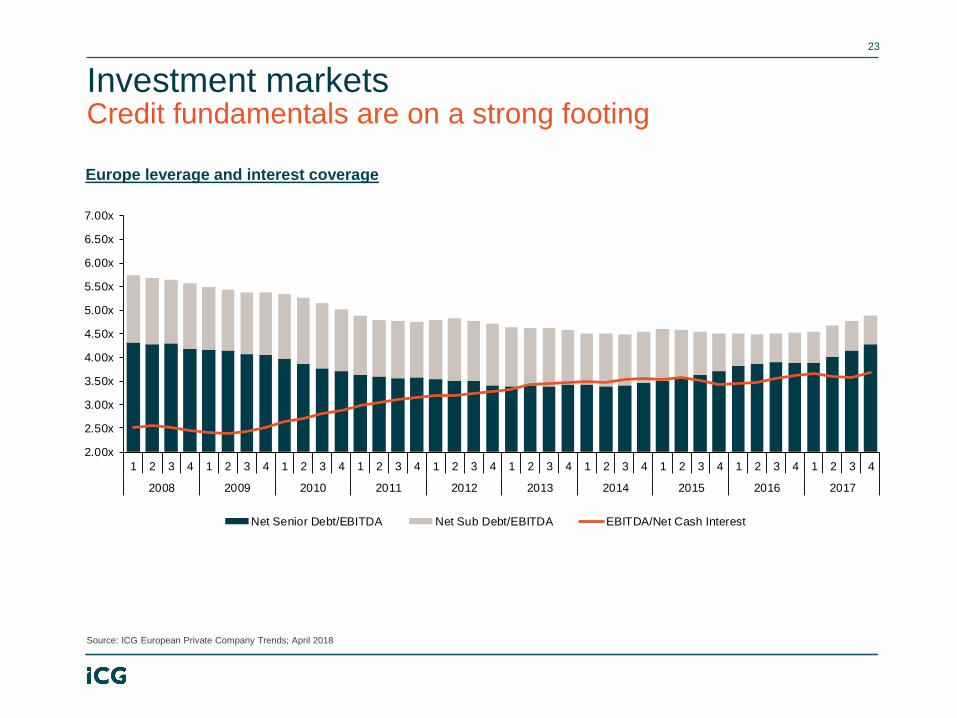
23
Credit fundamentals are on a strong footing Investment markets
2.00x
2.50x
3.00x
3.50x
4.00x
4.50x
5.00x
5.50x
6.00x
6.50x
7.00x
1 2 3 4 1 2 3 4 1 2 3 4 1 2 3 4 1 2 3 4 1 2 3 4 1 2 3 4 1 2 3 4 1 2 3 4 1 2 3 4
2008 2009 2010 2011 2012 2013 2014 2015 2016 2017
Net Senior Debt/EBITDA Net Sub Debt/EBITDA EBITDA/Net Cash Interest
Europe leverage and interest coverage
Source: ICG European Private Company Trends; April 2018
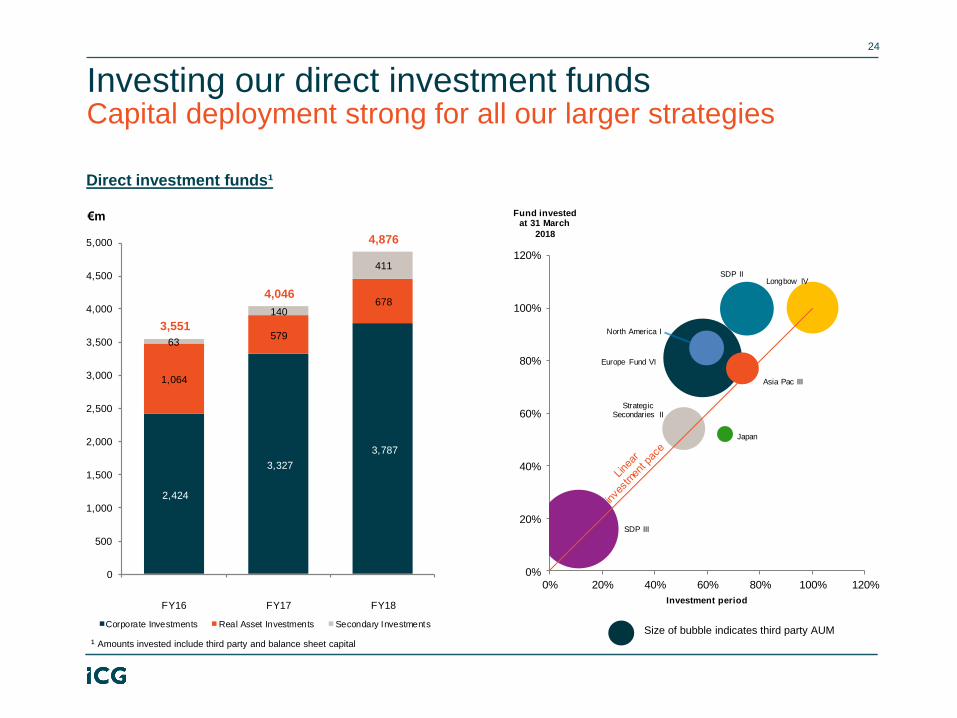
2,424
3,327
3,787
1,064
579
678
63
140
411
0
500
1,000
1,500
2,000
2,500
3,000
3,500
4,000
4,500
5,000
FY16 FY17 FY18
€m
Corporate Investments Real Asset Investments Secondary Investments
24
Capital deployment strong for all our larger strategies Investing our direct investment funds
4,046
3,551
Direct investment funds¹
Size of bubble indicates third party AUM
¹ Amounts invested include third party and balance sheet capital
North America I
Longbow IV
Europe Fund VI
SDP II
Japan
Asia Pac III
SDP III
Strategic Secondaries II
0%
20%
40%
60%
80%
100%
120%
0% 20% 40% 60% 80% 100% 120%
Fund invested at 31 March
2018
Investment period
4,876
Managing Investments
25
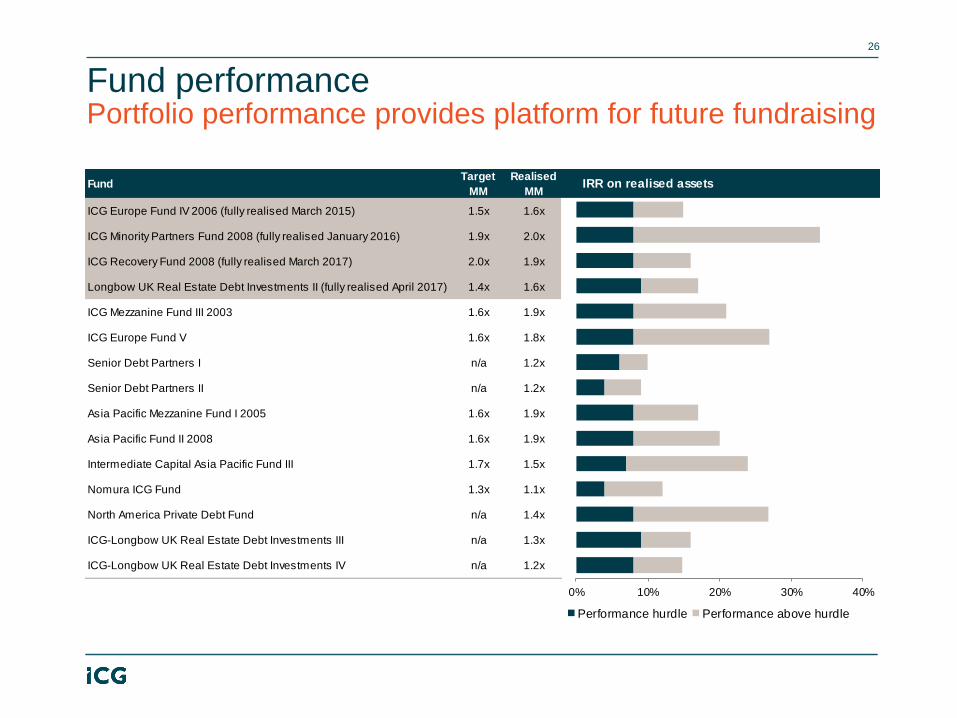
26
Portfolio performance provides platform for future fundraising Fund performance
FundTarget
MM
Realised
MM
ICG Europe Fund IV 2006 (fully realised March 2015) 1.5x 1.6x
ICG Minority Partners Fund 2008 (fully realised January 2016) 1.9x 2.0x
ICG Recovery Fund 2008 (fully realised March 2017) 2.0x 1.9x
Longbow UK Real Estate Debt Investments II (fully realised April 2017) 1.4x 1.6x
ICG Mezzanine Fund III 2003 1.6x 1.9x
ICG Europe Fund V 1.6x 1.8x
Senior Debt Partners I n/a 1.2x
Senior Debt Partners II n/a 1.2x
Asia Pacific Mezzanine Fund I 2005 1.6x 1.9x
Asia Pacific Fund II 2008 1.6x 1.9x
Intermediate Capital Asia Pacific Fund III 1.7x 1.5x
Nomura ICG Fund 1.3x 1.1x
North America Private Debt Fund n/a 1.4x
ICG-Longbow UK Real Estate Debt Investments III n/a 1.3x
ICG-Longbow UK Real Estate Debt Investments IV n/a 1.2x
IRR on realised assets
0% 10% 20% 30% 40%
Performance hurdle Performance above hurdle
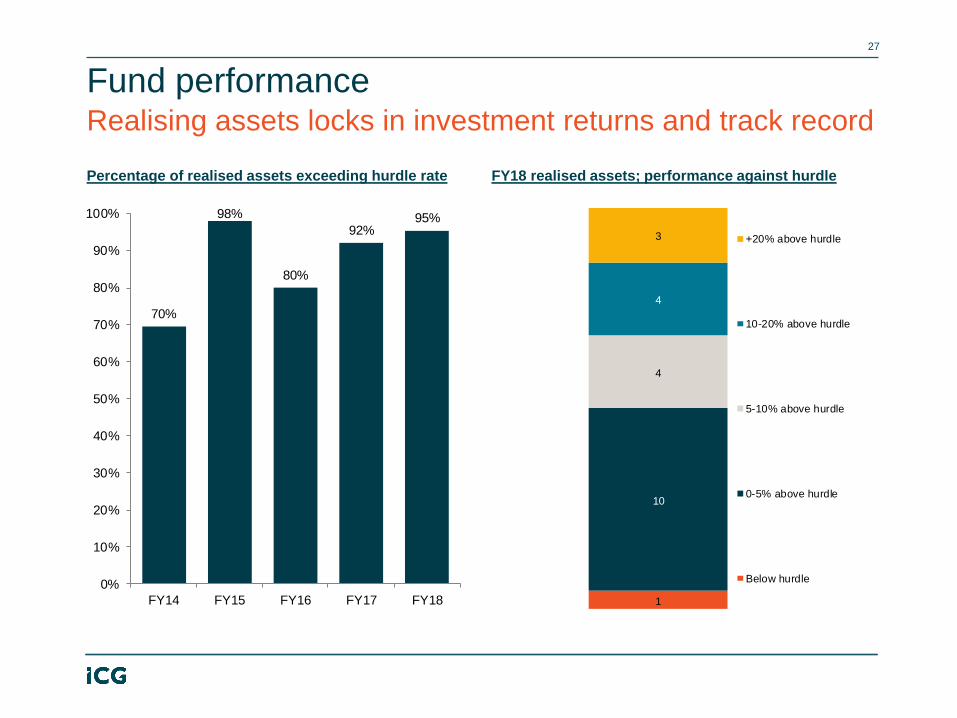
27
Fund performance
Realising assets locks in investment returns and track record
Percentage of realised assets exceeding hurdle rate
FY18 realised assets; performance against hurdle
1
10
4
4
3 +20% above hurdle
10-20% above hurdle
5-10% above hurdle
0-5% above hurdle
Below hurdle
70%
98%
80%
92%95%
0%
10%
20%
30%
40%
50%
60%
70%
80%
90%
100%
FY14 FY15 FY16 FY17 FY18
Fundraising
28
3.8
6.4
5.2
4.0
7.8
0
1
2
3
4
5
6
7
8
9
FY14 FY15 FY16 FY17 FY18
€bn
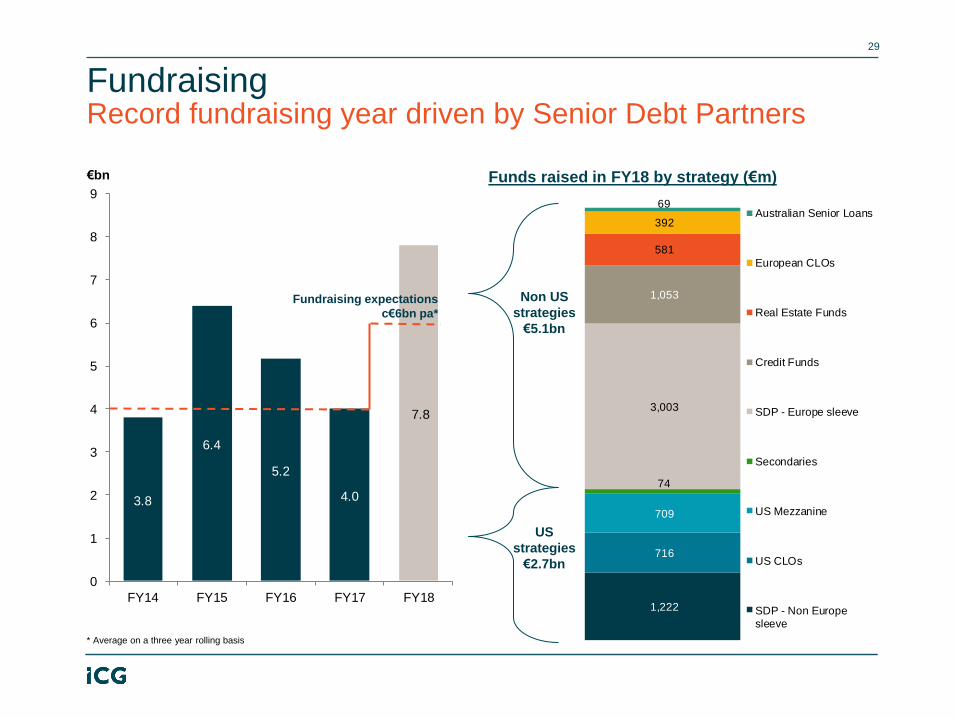
29
Record fundraising year driven by Senior Debt Partners Fundraising
Funds raised in FY18 by strategy (€m)
Fundraising expectations
c€6bn pa*
Non US
strategies
€5.1bn
US
strategies
€2.7bn
* Average on a three year rolling basis
1,222
716
709
74
3,003
1,053
69
392
581
Australian Senior Loans
European CLOs
Real Estate Funds
Credit Funds
SDP - Europe sleeve
Secondaries
US Mezzanine
US CLOs
SDP - Non Europesleeve

30
Fundraising gathering pace reflecting recent investment Fundraising – Capital Markets
Funds raised over the last 5 years by strategy (€m)
Investing in diversified portfolios capturing
inherent inefficiencies in alternative credit.
Targeting management fees of 150bps
Multi-asset approach; senior secured
loans, special situations, CLO debt / equity,
high yield bonds. Targeting management
fees of 45-75bps
Strategy seeks to construct diversified
portfolios, primarily investing in senior
secured floating rate loans. Management
fees of 40-60bps
30
149 247
47
806
77 50
52
72
56
195
-
200
400
600
800
1,000
1,200
FY14 FY15 FY16 FY17 FY18
€m
Liquids/Loans Total Credit Alternative Credit

North America Private Debt Fund II
Note : Arrows indicate changes in timing
FY 19
31
Strategic Equity Fund III Secondary
Investments
European Loans, High Yield & Multi-Asset Credit
Global Loans & Structured Credit
CLOs
Capital Market
Investments
Excellent start to FY19 and strong fundraising pipeline Fundraising outlook
31
UK Real Estate Fund V
UK Real Estate Senior Debt Real Asset
Investments
UK Real Estate Development
Europe Fund VII
Australian Senior Loans
Corporate
Investments
Asia Pacific Fund IV
FY 20
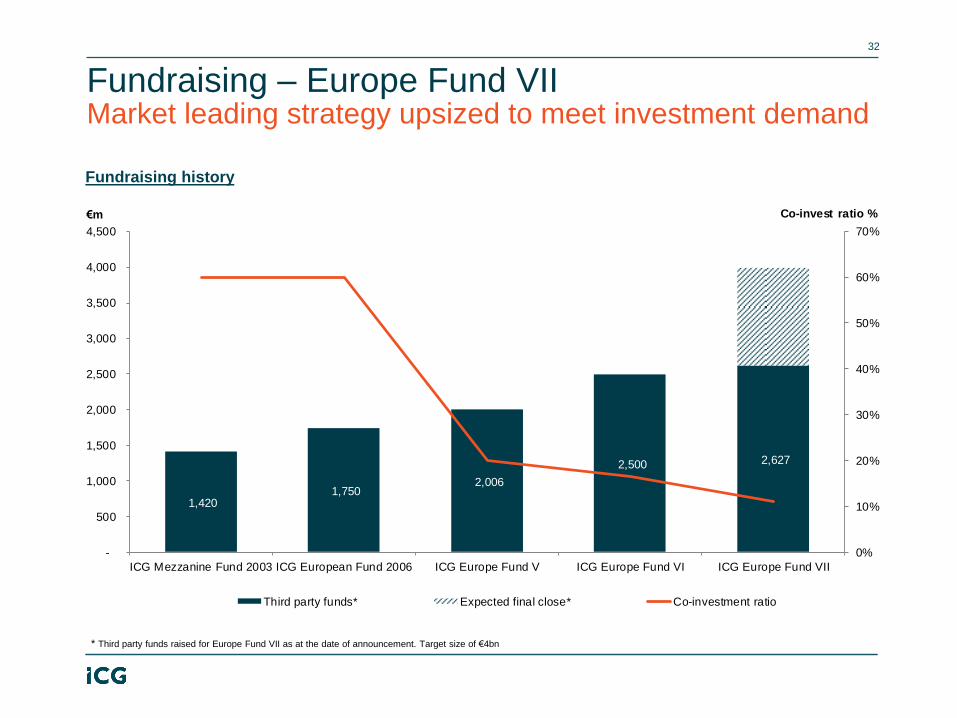
32
Market leading strategy upsized to meet investment demand Fundraising – Europe Fund VII
Fundraising history
* Third party funds raised for Europe Fund VII as at the date of announcement. Target size of €4bn
1,420 1,750
2,006
2,500 2,627
0%
10%
20%
30%
40%
50%
60%
70%
-
500
1,000
1,500
2,000
2,500
3,000
3,500
4,000
4,500
ICG Mezzanine Fund 2003 ICG European Fund 2006 ICG Europe Fund V ICG Europe Fund VI ICG Europe Fund VII
Co-invest ratio %€m
Third party funds* Expected final close* Co-investment ratio

33
Reduction in discounts increasing fee rates fund on fund Fundraising – Europe Fund VII
Europe Fund VI investment trajectory Fee rate progression
Size of bubble indicates invested capital
Today
31 March 2018
30 September 2017
31 March 2017
30 September 2016
31 March 2016
30 September 2015
0%
20%
40%
60%
80%
100%
120%
0% 20% 40% 60% 80% 100%
Fund invested
Investment period
1.25%
1.34%
1.40%+
1.15%
1.20%
1.25%
1.30%
1.35%
1.40%
1.45%
Fund V Fund VI Fund VII
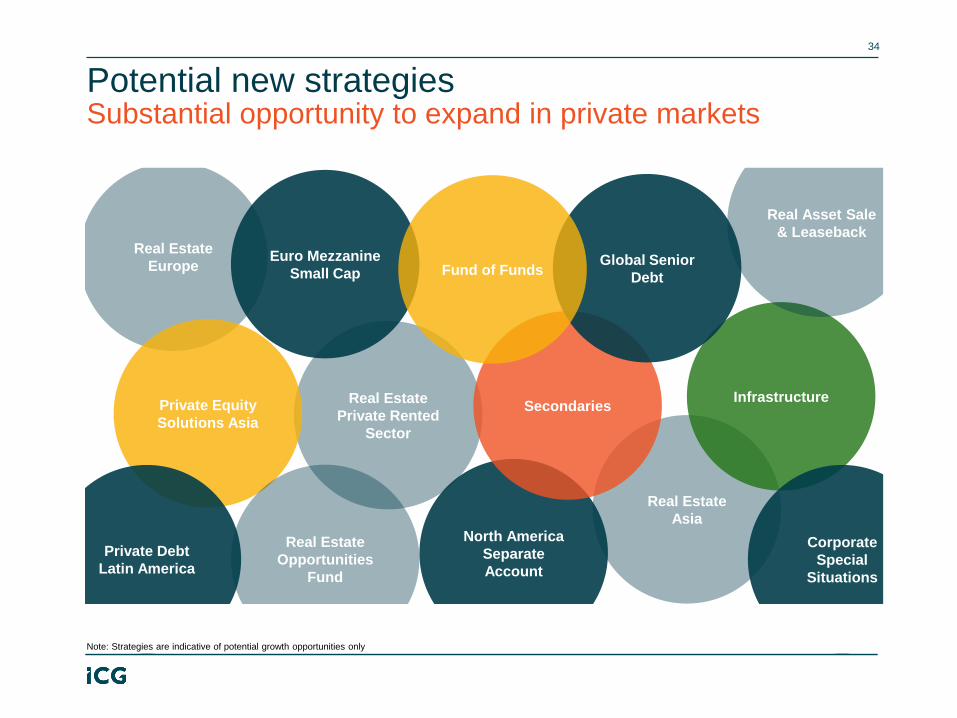
Real Estate
Private Rented
Sector
Real Estate
Europe
Private Equity
Solutions Asia
Real Estate
Asia
Real Estate
Opportunities
Fund
North America
Separate
Account
Euro Mezzanine
Small Cap
Secondaries Infrastructure
Private Debt
Latin America
Corporate
Special
Situations
Real Asset Sale
& Leaseback
34
Substantial opportunity to expand in private markets Potential new strategies
Global Senior
Debt Fund of Funds
Note: Strategies are indicative of potential growth opportunities only

Wrap Up
35
36
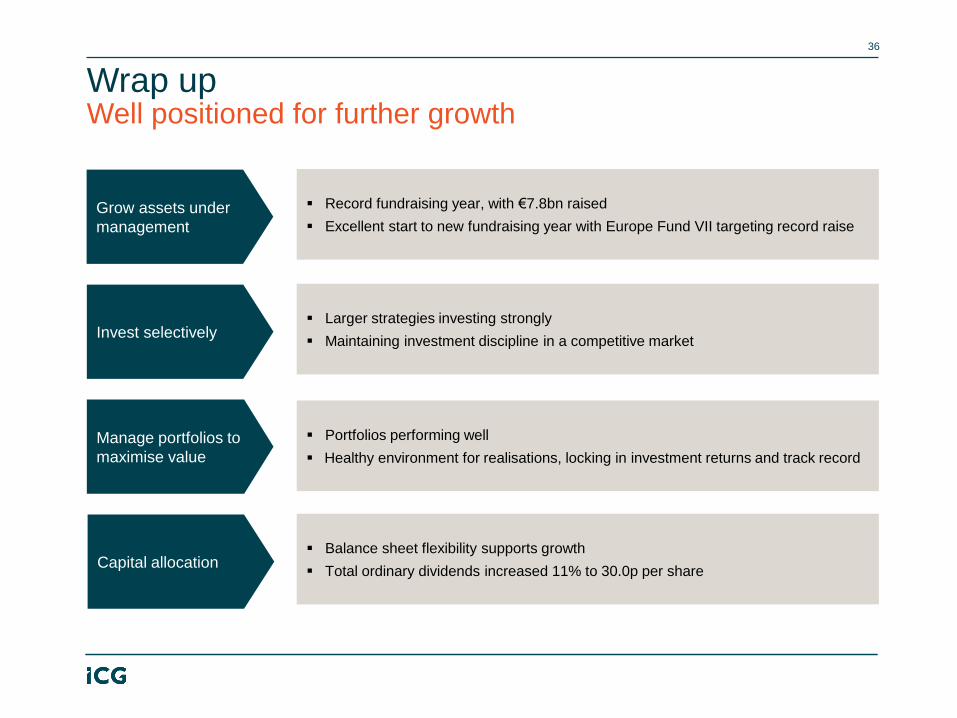
Well positioned for further growth Wrap up
Grow assets under
management
Invest selectively
Manage portfolios to
maximise value
Capital allocation
Record fundraising year, with €7.8bn raised
Excellent start to new fundraising year with Europe Fund VII targeting record raise
Larger strategies investing strongly
Maintaining investment discipline in a competitive market
Portfolios performing well
Healthy environment for realisations, locking in investment returns and track record
Balance sheet flexibility supports growth
Total ordinary dividends increased 11% to 30.0p per share

Q&A
37

Appendix
38
39
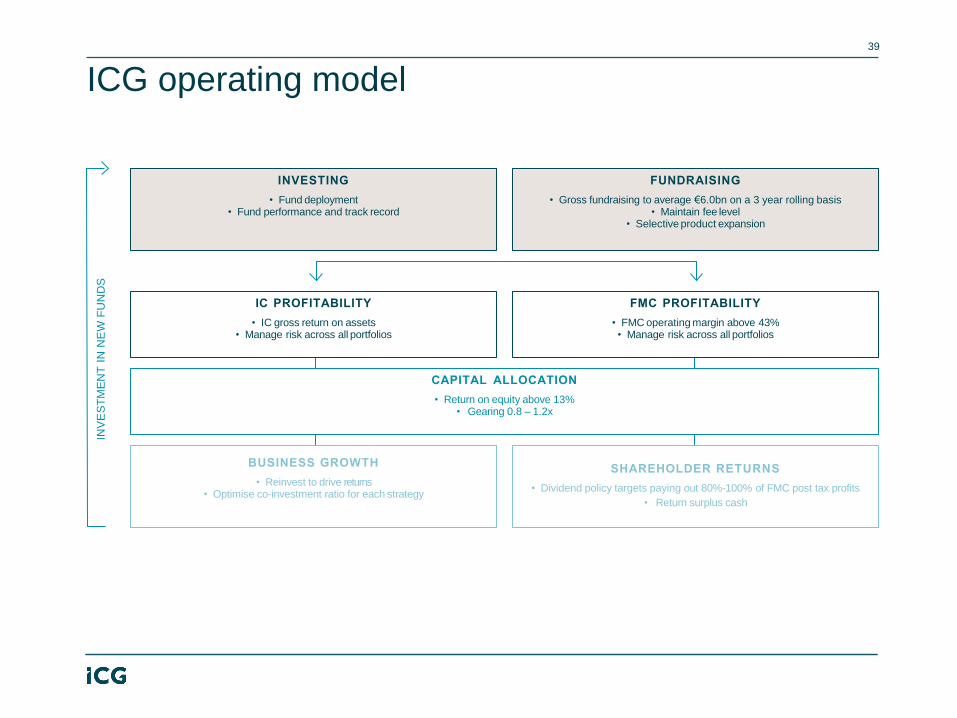
ICG operating model
FUNDRAISING
• Gross fundraising to average €6.0bn on a 3 year rolling basis • Maintain fee level
• Selective product expansion
INVESTING
• Fund deployment • Fund performance and track record
CAPITAL ALLOCATION
• Return on equity above 13% • Gearing 0.8 – 1.2x
IC PROFITABILITY
• IC gross return on assets • Manage risk across all portfolios
FMC PROFITABILITY
• FMC operating margin above 43% • Manage risk across all portfolios
SHAREHOLDER RETURNS
• Dividend policy targets paying out 80%-100% of FMC post tax profits
• Return surplus cash
BUSINESS GROWTH
• Reinvest to drive returns • Optimise co-investment ratio for each strategy
INV
ES
TM
EN
T I
N N
EW
FU
ND
S
THE MATERIALS BEING PROVIDED TO YOU ARE INTENDED ONLY FOR INFORMATIONAL PURPOSES AND CONVENIENT REFERENCE AND MAY NOT BE RELIED UPON FOR ANY PURPOSE. THIS INFORMATION IS NOT INTENDED TO PROVIDE, AND SHOULD NOT BE RELIED UPON, FOR ACCOUNTING, LEGAL, TAX ADVICE OR INVESTMENT RECOMMENDATIONS ALTHOUGH INFORMATION HAS BEEN OBTAINED FROM AND IS BASED UPON SOURCES THAT INTERMEDIATE CAPITAL GROUP PLC ("ICG PLC") CONSIDERS RELIABLE, WE DO NOT GUARANTEE ITS ACCURACY AND IT MAY BE INCOMPLETE OR CONDENSED. ALL OPINIONS, PROJECTIONS AND ESTIMATES CONSTITUTE THE JUDGMENT OF ICG PLC AS OF THE DATE OF THE MATERIALS AND ARE SUBJECT TO CHANGE WITHOUT NOTICE. ICG PLC DISCLAIMS AND HEREBY EXCLUDES ALL LIABILITY AND THEREFORE ACCEPTS NO RESPONSIBILITY FOR ANY LOSS (WHETHER DIRECT OR INDIRECT) ARISING FOR ANY ACTION TAKEN OR NOT TAKEN BY ANYONE USING THE INFORMATION CONTAINED THEREIN. THESE MATERIALS ARE NOT INTENDED AS AN OFFER OR SOLICITATION WITH RESPECT TO THE PURCHASE OR SALE OF ANY SECURITY OR INVESTMENT INTEREST AND MAY NOT BE RELIED UPON IN EVALUATING THE MERITS OF INVESTING IN ANY INVESTMENT INTERESTS. THESE MATERIALS ARE NOT INTENDED FOR DISTRIBUTION TO, OR USE BY ANY PERSON OR ENTITY IN ANY JURISDICTION OR COUNTRY WHERE SUCH DISTRIBUTION OR USE WOULD BE CONTRARY TO LOCAL LAW OR REGULATION. NEITHER ICG PLC OR ANY OF ITS AFFILIATES MAKES ANY REPRESENTATION OR WARRANTY, EXPRESS OR IMPLIED AS TO THE ACCURACY OR COMPLETENESS OF THE INFORMATION CONTAINED HEREIN, AND NOTHING CONTAINED HEREIN SHALL BE RELIED UPON AS A PROMISE OR REPRESENTATION WHETHER AS TO PAST OR FUTURE PERFORMANCE.
THESE MATERIALS (INCLUDING THEIR CONTENTS) ARE CONFIDENTIAL, BEING FOR USE ONLY BY THE PERSONS TO WHOM THEY ARE ISSUED. DISTRIBUTION OF THESE MATERIALS TO ANY PERSON OTHER THAN THE PERSON TO WHOM THIS INFORMATION WAS ORIGINALLY DELIVERED AND TO SUCH PERSON’S ADVISORS IS UNAUTHORISED AND ANY REPRODUCTION OF THESE MATERIALS, IN WHOLE OR IN PART, OR THE DISCLOSURE OF ANY OF THEIR CONTENTS, WITHOUT THE PRIOR CONSENT OF ICG PLC OR ITS AFFILIATES IS PROHIBITED. THIS COMMUNICATION IS LIMITED TO AND DIRECTED TO THOSE PERSONS INVITED TO THE PRESENTATION. IT IS THEREFORE ONLY DIRECTED AT PROFESSIONAL CLIENTS, AS DEFINED BY THE FINANCIAL CONDUCT AUTHORITY. ANY OTHER PERSONS SHOULD NOT SEEK TO RELY UPON THE INFORMATION CONTAINED HEREIN. COLLECTIVE INVESTMENT SCHEMES REFERRED TO HEREIN ARE NOT REGULATED FOR THE PURPOSES OF THE UK’S FINANCIAL SERVICES AND MARKETS ACT 2000 AND ARE NOT AVAILABLE TO MEMBERS OF THE GENERAL PUBLIC. ICG PLC IS AUTHORISED AND REGULATED IN THE UNITED KINGDOM BY THE FINANCIAL CONDUCT AUTHORITY.
THESE MATERIALS ARE NOT FOR PUBLICATION, RELEASE OR DISTRIBUTION IN AND MAY NOT BE TAKEN OR TRANSMITTED INTO THE UNITED STATES OF AMERICA, CANADA, JAPAN, SOUTH AFRICA OR AUSTRALIA AND MAY NOT BE COPIED, FORWARDED, DISTRIBUTED OR TRANSMITTED IN OR INTO THE UNITED STATES OF AMERICA, CANADA, JAPAN OR AUSTRALIA OR ANY OTHER JURISDICTION WHERE TO DO SO WOULD BE UNLAWFUL. THE DISTRIBUTION OF THESE MATERIALS IN ANY OTHER JURISDICTIONS MAY BE RESTRICTED BY LAW AND PERSONS INTO WHOSE POSSESSION THESE MATERIALS COME SHOULD INFORM THEMSELVES ABOUT, AND OBSERVE ANY SUCH RESTRICTIONS. ANY FAILURE TO COMPLY WITH SUCH RESTRICTIONS MAY CONSTITUTE A VIOLATION OF THE LAWS OF THE UNITED STATES, CANADA, JAPAN OR AUSTRALIA OR ANY OTHER SUCH JURISDICTION.
THESE MATERIALS DO NOT AND ARE NOT INTENDED TO CONSTITUTE, AND SHOULD NOT BE CONSTRUED AS, AN OFFER, INDUCEMENT, INVITATION OR COMMITMENT TO PURCHASE, SUBSCRIBE TO, PROVIDE OR SELL ANY SECURITIES, SERVICES OR PRODUCTS OF INTERMEDIATE CAPITAL GROUP PLC (“ICG PLC”) IN ANY JURISDICTION OR TO PROVIDE ANY RECOMMENDATIONS FOR FINANCIAL, SECURITIES, INVESTMENT OR OTHER ADVICE OR TO TAKE ANY DECISION.
40
Disclaimer