Embed Size (px)
Citation preview
Submitted 16 November 2015Accepted 16 January 2016Published 22 February 2016
Corresponding authorVing Ching Chong,[email protected]
Academic editorMaría Ángeles Esteban
Additional Information andDeclarations can be found onpage 12
DOI 10.7717/peerj.1664
Copyright2016 Salimi et al.
Distributed underCreative Commons CC-BY 4.0
OPEN ACCESS
Fully-automated identification of fishspecies based on otolith contour: usingshort-time Fourier transform anddiscriminant analysis (STFT-DA)Nima Salimi1, Kar Hoe Loh2, Sarinder Kaur Dhillon1 and Ving Ching Chong1,2
1 Institute of Biological Sciences, University of Malaya, Kuala Lumpur, Malaysia2 Institute of Ocean & Earth Sciences, University of Malaya, Kuala Lumpur, Malaysia
ABSTRACTBackground. Fish species may be identified based on their unique otolith shape orcontour. Several pattern recognitionmethods have been proposed to classify fish speciesthrough morphological features of the otolith contours. However, there has been nofully-automated species identification model with the accuracy higher than 80%. Thepurpose of the current study is to develop a fully-automatedmodel, based on the otolithcontours, to identify the fish species with the high classification accuracy.Methods. Images of the right sagittal otoliths of 14 fish species from three familiesnamely Sciaenidae, Ariidae, and Engraulidae were used to develop the proposedidentification model. Short-time Fourier transform (STFT) was used, for the first timein the area of otolith shape analysis, to extract important features of the otolith contours.Discriminant Analysis (DA), as a classification technique, was used to train and test themodel based on the extracted features.Results. Performance of the model was demonstrated using species from three familiesseparately, as well as all species combined. Overall classification accuracy of the modelwas greater than 90% for all cases. In addition, effects of STFT variables on theperformance of the identification model were explored in this study.Conclusions. Short-time Fourier transform could determine important features of theotolith outlines. The fully-automated model proposed in this study (STFT-DA) couldpredict species of an unknown specimen with acceptable identification accuracy. Themodel codes can be accessed at http://mybiodiversityontologies.um.edu.my/Otolith/and https://peerj.com/preprints/1517/. The current model has flexibility to be used formore species and families in future studies.
Subjects Aquaculture, Fisheries and Fish Science, Bioinformatics, Marine Biology, Taxonomy,Computational ScienceKeywords Automated taxon identification, Otolith shape analysis, Short-time Fourier transform,Discriminant analysis
INTRODUCTIONAutomated taxon identification (ATI) systems which rely on pattern recognitionand machine learning techniques have been developed in different areas of biology(Arbuckle et al., 2001; Chun et al., 2007; Cope et al., 2012; Culverhouse et al., 1996;
How to cite this article Salimi et al. (2016), Fully-automated identification of fish species based on otolith contour: using short-timeFourier transform and discriminant analysis (STFT-DA). PeerJ 4:e1664; DOI 10.7717/peerj.1664
Dietrich & Pooley, 1994; Farr & Chesmore, 2007; Gaston & O’Neill, 2004; Jonker et al.,2000; La Salle et al., 2009; Larios et al., 2008;MacLeod, Benfield & Culverhouse, 2010; Parisi-Baradad et al., 2010; Potamitis, 2014;Watson, O’Neill & Kitching, 2003;Watson & Dallwitz,1991; Zhao et al., 2013). In marine biology, identification of the fish species based onthe otolith image analysis has been an interesting area due to its applications in thepalaeontological and ecological sciences (Aguirre & Lombarte, 1999; Arellano et al., 1995;Bowen, 2000; Fitch & Brownell Jr, 1968; Lombarte & Castellón, 1991; Reichenbacher et al.,2007). Parisi-Baradad et al. (2010) developed the first automated taxon classificationsystem through the shape analysis of the otolith contour. In order to extract the importantmorphological features of the otolith contour, external outline of the otolith was firstconverted to a one-dimensional (1D) signal. This representative signal was obtained bycalculating the distances between the outline points and the center of gravity of the otolithimage. Then, wavelet transform (WT)was applied on the 1D signal to extract useful featuresof the otolith outline. Using WT, irregularities of the otolith contours were quantified andlocalized appropriately; this is the advantage of WT over other feature extractors suchas Fourier transform (FT) and elliptical Fourier descriptors (EFD) used in the otherstudies (Parisi-Baradad et al., 2005; Sadighzadeh et al., 2012). Even though their proposedmodel could identify the family of the specimens with 94% accuracy, the performance ofthe system dropped significantly at the species level (72%) (Parisi-Baradad et al., 2010).Therefore, the aim of the present study is to develop a fully-automated identificationmodelwith improved classification accuracy at the level of species.
Fourteen fish species from three different families namely Engraulidae, Sciaenidae, andAriidae were used in this study. Short-time Fourier transform (STFT) is a conventionalsignal processing technique (Allen, 1997; Oppenheim, Schafer & Buck, 1999; Rabiner &Schafer, 1978) which to our knowledge has not yet been employed in the area of otolithimage processing. STFT was applied in this study to extract morphological features of theotolith contours.
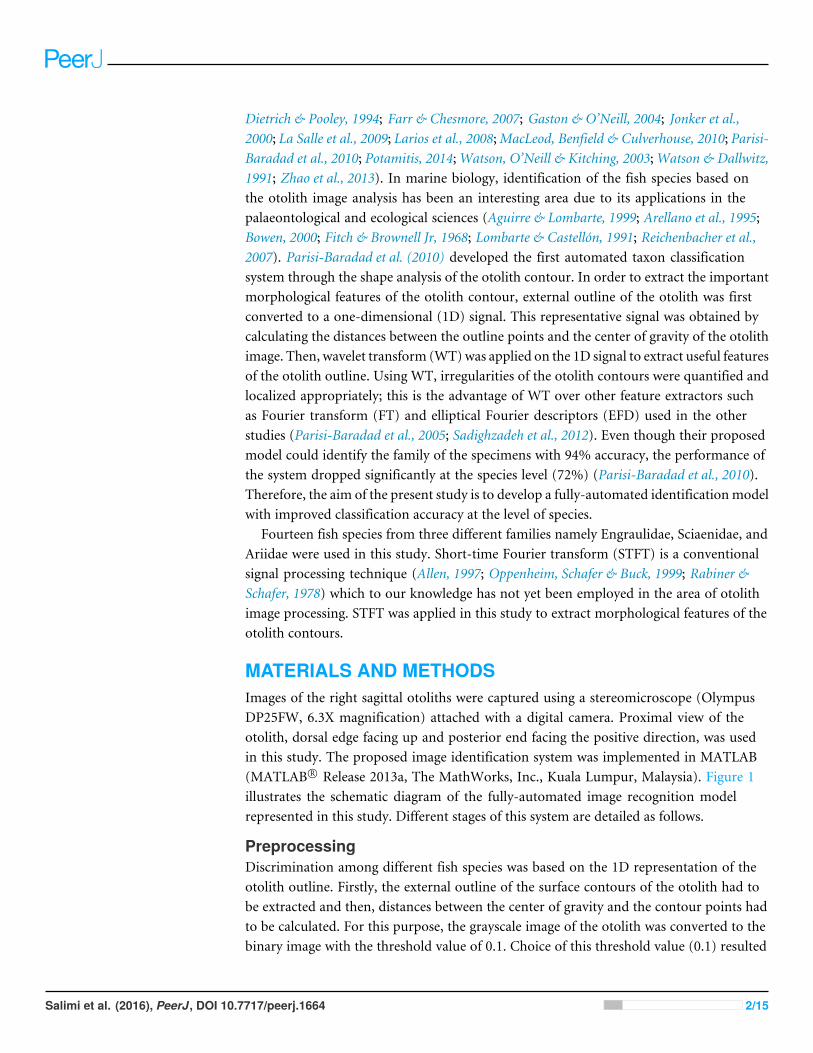
MATERIALS AND METHODSImages of the right sagittal otoliths were captured using a stereomicroscope (OlympusDP25FW, 6.3X magnification) attached with a digital camera. Proximal view of theotolith, dorsal edge facing up and posterior end facing the positive direction, was usedin this study. The proposed image identification system was implemented in MATLAB(MATLAB R© Release 2013a, The MathWorks, Inc., Kuala Lumpur, Malaysia). Figure 1illustrates the schematic diagram of the fully-automated image recognition modelrepresented in this study. Different stages of this system are detailed as follows.
PreprocessingDiscrimination among different fish species was based on the 1D representation of theotolith outline. Firstly, the external outline of the surface contours of the otolith had tobe extracted and then, distances between the center of gravity and the contour points hadto be calculated. For this purpose, the grayscale image of the otolith was converted to thebinary image with the threshold value of 0.1. Choice of this threshold value (0.1) resulted
Salimi et al. (2016), PeerJ, DOI 10.7717/peerj.1664 2/15
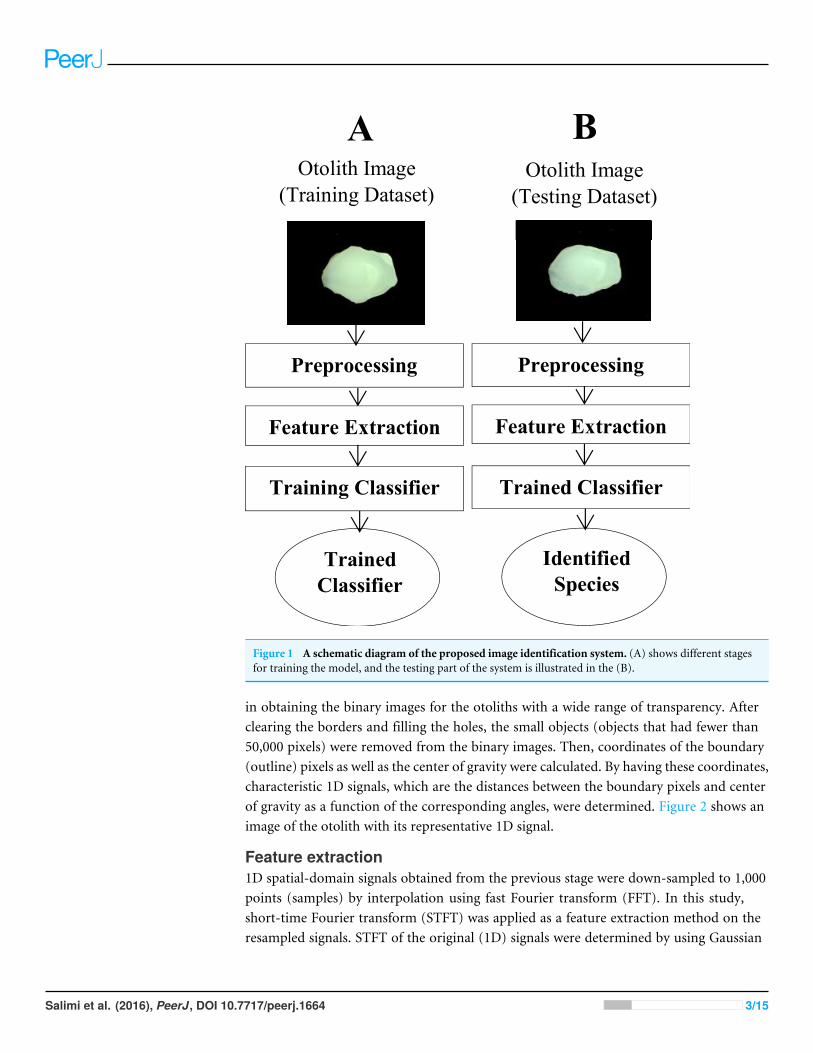
Figure 1 A schematic diagram of the proposed image identification system. (A) shows different stagesfor training the model, and the testing part of the system is illustrated in the (B).
in obtaining the binary images for the otoliths with a wide range of transparency. Afterclearing the borders and filling the holes, the small objects (objects that had fewer than50,000 pixels) were removed from the binary images. Then, coordinates of the boundary(outline) pixels as well as the center of gravity were calculated. By having these coordinates,characteristic 1D signals, which are the distances between the boundary pixels and centerof gravity as a function of the corresponding angles, were determined. Figure 2 shows animage of the otolith with its representative 1D signal.
Feature extraction1D spatial-domain signals obtained from the previous stage were down-sampled to 1,000points (samples) by interpolation using fast Fourier transform (FFT). In this study,short-time Fourier transform (STFT) was applied as a feature extraction method on theresampled signals. STFT of the original (1D) signals were determined by using Gaussian
Salimi et al. (2016), PeerJ, DOI 10.7717/peerj.1664 3/15
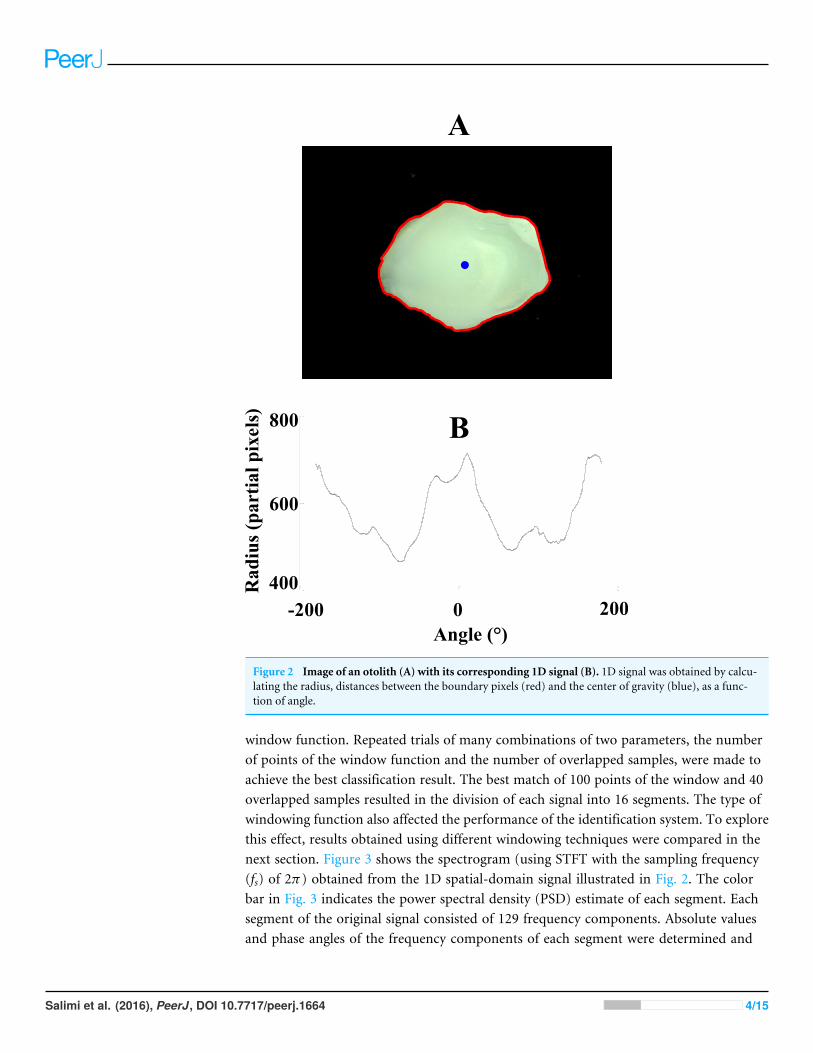
Figure 2 Image of an otolith (A) with its corresponding 1D signal (B). 1D signal was obtained by calcu-lating the radius, distances between the boundary pixels (red) and the center of gravity (blue), as a func-tion of angle.
window function. Repeated trials of many combinations of two parameters, the numberof points of the window function and the number of overlapped samples, were made toachieve the best classification result. The best match of 100 points of the window and 40overlapped samples resulted in the division of each signal into 16 segments. The type ofwindowing function also affected the performance of the identification system. To explorethis effect, results obtained using different windowing techniques were compared in thenext section. Figure 3 shows the spectrogram (using STFT with the sampling frequency(fs) of 2π) obtained from the 1D spatial-domain signal illustrated in Fig. 2. The colorbar in Fig. 3 indicates the power spectral density (PSD) estimate of each segment. Eachsegment of the original signal consisted of 129 frequency components. Absolute valuesand phase angles of the frequency components of each segment were determined and
Salimi et al. (2016), PeerJ, DOI 10.7717/peerj.1664 4/15
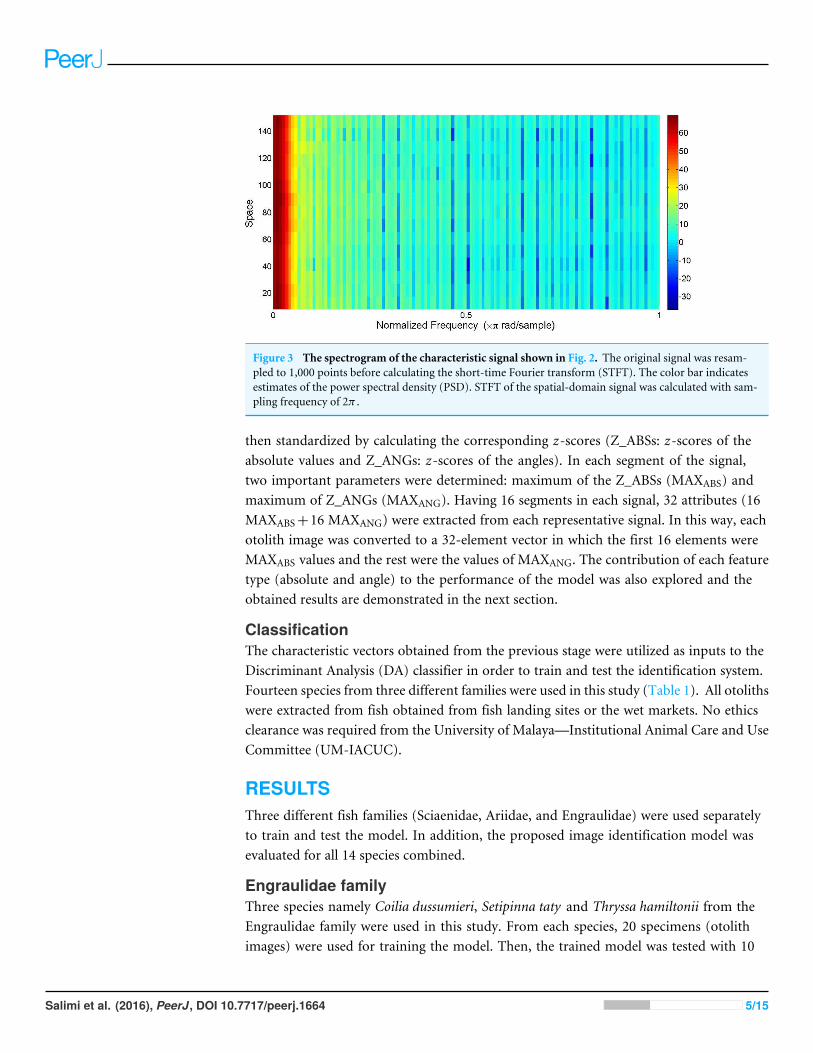
Figure 3 The spectrogram of the characteristic signal shown in Fig. 2. The original signal was resam-pled to 1,000 points before calculating the short-time Fourier transform (STFT). The color bar indicatesestimates of the power spectral density (PSD). STFT of the spatial-domain signal was calculated with sam-pling frequency of 2π .
then standardized by calculating the corresponding z-scores (Z_ABSs: z-scores of theabsolute values and Z_ANGs: z-scores of the angles). In each segment of the signal,two important parameters were determined: maximum of the Z_ABSs (MAXABS) andmaximum of Z_ANGs (MAXANG). Having 16 segments in each signal, 32 attributes (16MAXABS+16 MAXANG) were extracted from each representative signal. In this way, eachotolith image was converted to a 32-element vector in which the first 16 elements wereMAXABS values and the rest were the values of MAXANG. The contribution of each featuretype (absolute and angle) to the performance of the model was also explored and theobtained results are demonstrated in the next section.
ClassificationThe characteristic vectors obtained from the previous stage were utilized as inputs to theDiscriminant Analysis (DA) classifier in order to train and test the identification system.Fourteen species from three different families were used in this study (Table 1). All otolithswere extracted from fish obtained from fish landing sites or the wet markets. No ethicsclearance was required from the University of Malaya—Institutional Animal Care and UseCommittee (UM-IACUC).
RESULTSThree different fish families (Sciaenidae, Ariidae, and Engraulidae) were used separatelyto train and test the model. In addition, the proposed image identification model wasevaluated for all 14 species combined.
Engraulidae familyThree species namely Coilia dussumieri, Setipinna taty and Thryssa hamiltonii from theEngraulidae family were used in this study. From each species, 20 specimens (otolithimages) were used for training the model. Then, the trained model was tested with 10
Salimi et al. (2016), PeerJ, DOI 10.7717/peerj.1664 5/15
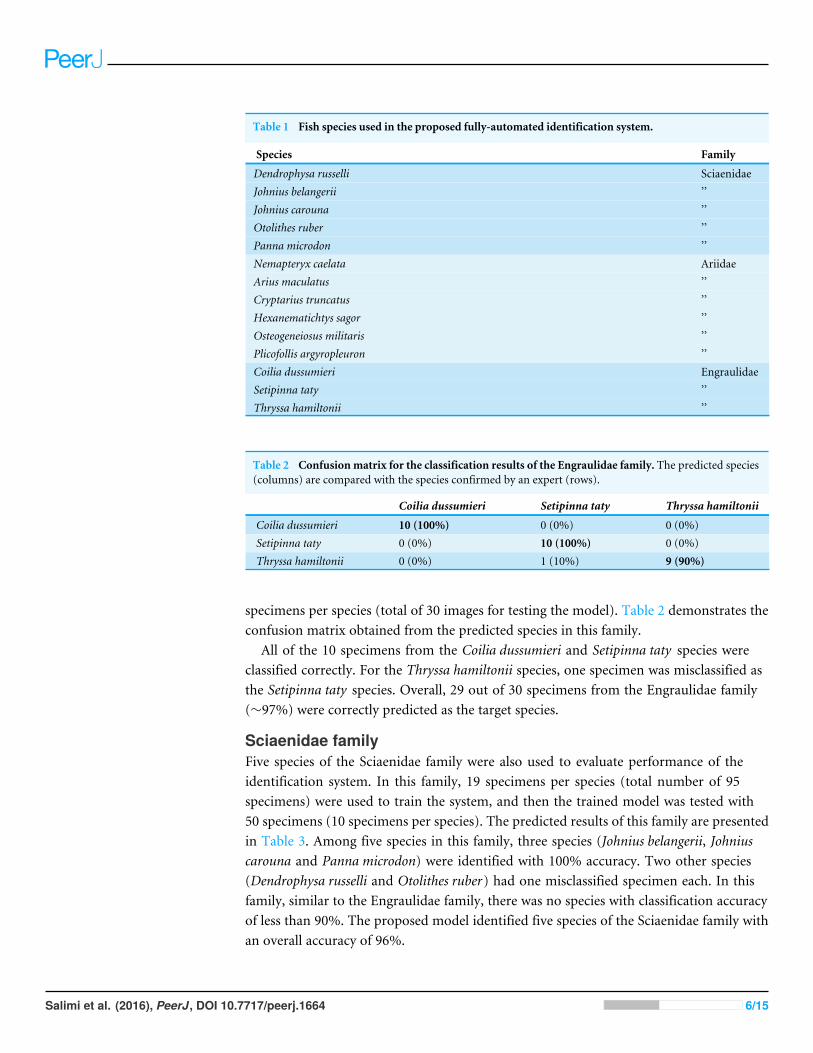
Table 1 Fish species used in the proposed fully-automated identification system.
Species Family
Dendrophysa russelli SciaenidaeJohnius belangerii ’’Johnius carouna ’’Otolithes ruber ’’Panna microdon ’’Nemapteryx caelata AriidaeArius maculatus ’’Cryptarius truncatus ’’Hexanematichtys sagor ’’Osteogeneiosus militaris ’’Plicofollis argyropleuron ’’Coilia dussumieri EngraulidaeSetipinna taty ’’Thryssa hamiltonii ’’
Table 2 Confusionmatrix for the classification results of the Engraulidae family. The predicted species(columns) are compared with the species confirmed by an expert (rows).
Coilia dussumieri Setipinna taty Thryssa hamiltonii
Coilia dussumieri 10 (100%) 0 (0%) 0 (0%)Setipinna taty 0 (0%) 10 (100%) 0 (0%)Thryssa hamiltonii 0 (0%) 1 (10%) 9 (90%)
specimens per species (total of 30 images for testing the model). Table 2 demonstrates theconfusion matrix obtained from the predicted species in this family.
All of the 10 specimens from the Coilia dussumieri and Setipinna taty species wereclassified correctly. For the Thryssa hamiltonii species, one specimen was misclassified asthe Setipinna taty species. Overall, 29 out of 30 specimens from the Engraulidae family(∼97%) were correctly predicted as the target species.
Sciaenidae familyFive species of the Sciaenidae family were also used to evaluate performance of theidentification system. In this family, 19 specimens per species (total number of 95specimens) were used to train the system, and then the trained model was tested with50 specimens (10 specimens per species). The predicted results of this family are presentedin Table 3. Among five species in this family, three species (Johnius belangerii, Johniuscarouna and Panna microdon) were identified with 100% accuracy. Two other species(Dendrophysa russelli and Otolithes ruber) had one misclassified specimen each. In thisfamily, similar to the Engraulidae family, there was no species with classification accuracyof less than 90%. The proposed model identified five species of the Sciaenidae family withan overall accuracy of 96%.
Salimi et al. (2016), PeerJ, DOI 10.7717/peerj.1664 6/15
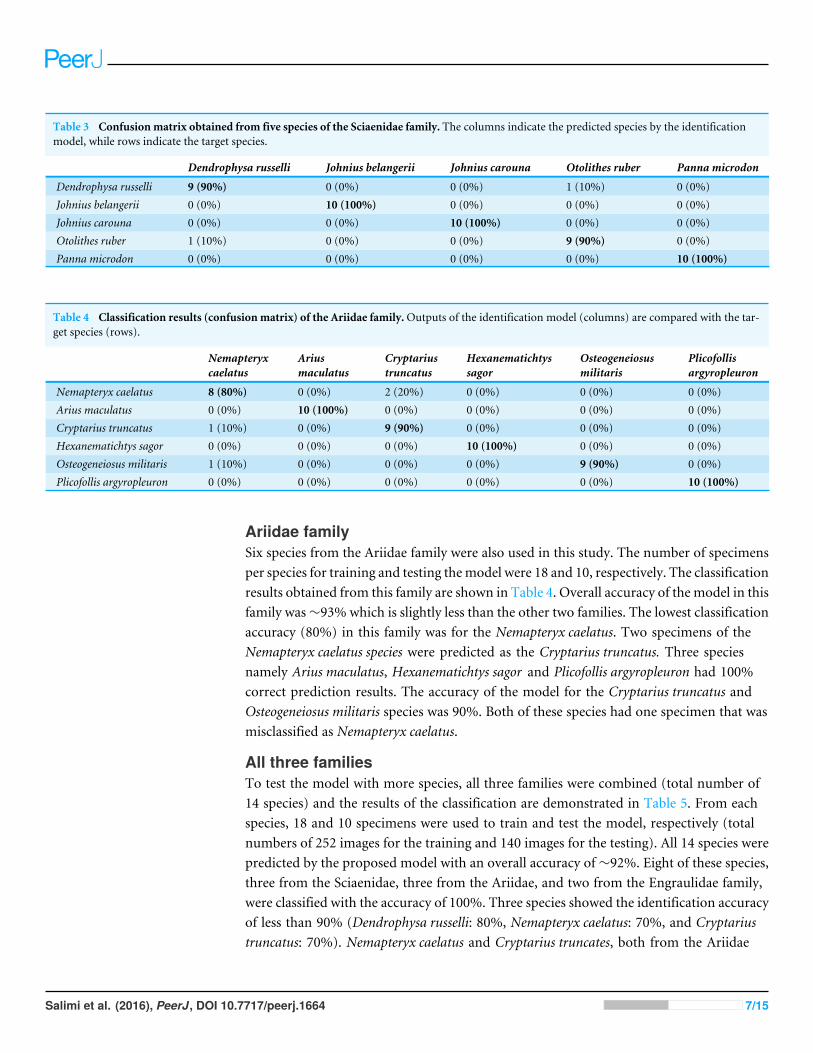
Table 3 Confusionmatrix obtained from five species of the Sciaenidae family. The columns indicate the predicted species by the identificationmodel, while rows indicate the target species.
Dendrophysa russelli Johnius belangerii Johnius carouna Otolithes ruber Panna microdon
Dendrophysa russelli 9 (90%) 0 (0%) 0 (0%) 1 (10%) 0 (0%)Johnius belangerii 0 (0%) 10 (100%) 0 (0%) 0 (0%) 0 (0%)Johnius carouna 0 (0%) 0 (0%) 10 (100%) 0 (0%) 0 (0%)Otolithes ruber 1 (10%) 0 (0%) 0 (0%) 9 (90%) 0 (0%)Panna microdon 0 (0%) 0 (0%) 0 (0%) 0 (0%) 10 (100%)
Table 4 Classification results (confusionmatrix) of the Ariidae family.Outputs of the identification model (columns) are compared with the tar-get species (rows).
Nemapteryxcaelatus
Ariusmaculatus
Cryptariustruncatus
Hexanematichtyssagor
Osteogeneiosusmilitaris
Plicofollisargyropleuron
Nemapteryx caelatus 8 (80%) 0 (0%) 2 (20%) 0 (0%) 0 (0%) 0 (0%)Arius maculatus 0 (0%) 10 (100%) 0 (0%) 0 (0%) 0 (0%) 0 (0%)Cryptarius truncatus 1 (10%) 0 (0%) 9 (90%) 0 (0%) 0 (0%) 0 (0%)Hexanematichtys sagor 0 (0%) 0 (0%) 0 (0%) 10 (100%) 0 (0%) 0 (0%)Osteogeneiosus militaris 1 (10%) 0 (0%) 0 (0%) 0 (0%) 9 (90%) 0 (0%)Plicofollis argyropleuron 0 (0%) 0 (0%) 0 (0%) 0 (0%) 0 (0%) 10 (100%)
Ariidae familySix species from the Ariidae family were also used in this study. The number of specimensper species for training and testing themodel were 18 and 10, respectively. The classificationresults obtained from this family are shown in Table 4. Overall accuracy of the model in thisfamily was∼93% which is slightly less than the other two families. The lowest classificationaccuracy (80%) in this family was for the Nemapteryx caelatus. Two specimens of theNemapteryx caelatus species were predicted as the Cryptarius truncatus. Three speciesnamely Arius maculatus, Hexanematichtys sagor and Plicofollis argyropleuron had 100%correct prediction results. The accuracy of the model for the Cryptarius truncatus andOsteogeneiosus militaris species was 90%. Both of these species had one specimen that wasmisclassified as Nemapteryx caelatus.
All three familiesTo test the model with more species, all three families were combined (total number of14 species) and the results of the classification are demonstrated in Table 5. From eachspecies, 18 and 10 specimens were used to train and test the model, respectively (totalnumbers of 252 images for the training and 140 images for the testing). All 14 species werepredicted by the proposed model with an overall accuracy of∼92%. Eight of these species,three from the Sciaenidae, three from the Ariidae, and two from the Engraulidae family,were classified with the accuracy of 100%. Three species showed the identification accuracyof less than 90% (Dendrophysa russelli: 80%, Nemapteryx caelatus: 70%, and Cryptariustruncatus: 70%). Nemapteryx caelatus and Cryptarius truncates, both from the Ariidae
Salimi et al. (2016), PeerJ, DOI 10.7717/peerj.1664 7/15
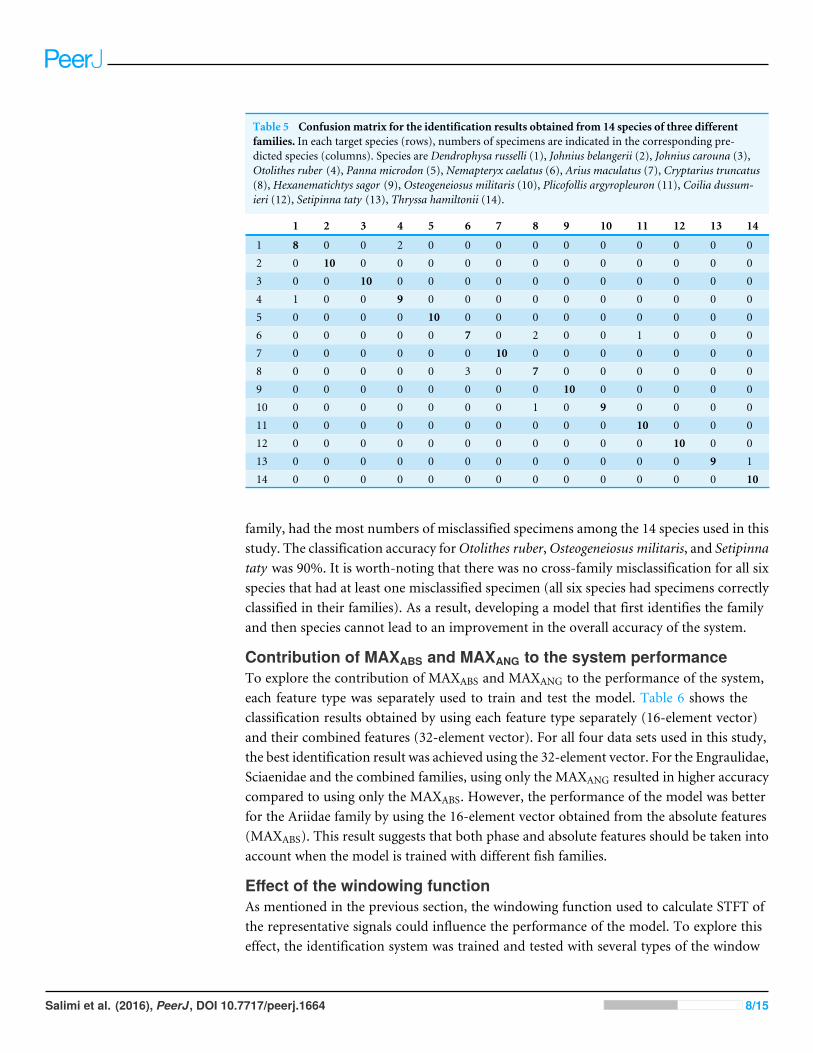
Table 5 Confusionmatrix for the identification results obtained from 14 species of three differentfamilies. In each target species (rows), numbers of specimens are indicated in the corresponding pre-dicted species (columns). Species are Dendrophysa russelli (1), Johnius belangerii (2), Johnius carouna (3),Otolithes ruber (4), Panna microdon (5), Nemapteryx caelatus (6), Arius maculatus (7), Cryptarius truncatus(8), Hexanematichtys sagor (9), Osteogeneiosus militaris (10), Plicofollis argyropleuron (11), Coilia dussum-ieri (12), Setipinna taty (13), Thryssa hamiltonii (14).
1 2 3 4 5 6 7 8 9 10 11 12 13 14
1 8 0 0 2 0 0 0 0 0 0 0 0 0 02 0 10 0 0 0 0 0 0 0 0 0 0 0 03 0 0 10 0 0 0 0 0 0 0 0 0 0 04 1 0 0 9 0 0 0 0 0 0 0 0 0 05 0 0 0 0 10 0 0 0 0 0 0 0 0 06 0 0 0 0 0 7 0 2 0 0 1 0 0 07 0 0 0 0 0 0 10 0 0 0 0 0 0 08 0 0 0 0 0 3 0 7 0 0 0 0 0 09 0 0 0 0 0 0 0 0 10 0 0 0 0 010 0 0 0 0 0 0 0 1 0 9 0 0 0 011 0 0 0 0 0 0 0 0 0 0 10 0 0 012 0 0 0 0 0 0 0 0 0 0 0 10 0 013 0 0 0 0 0 0 0 0 0 0 0 0 9 114 0 0 0 0 0 0 0 0 0 0 0 0 0 10
family, had the most numbers of misclassified specimens among the 14 species used in thisstudy. The classification accuracy forOtolithes ruber,Osteogeneiosus militaris, and Setipinnataty was 90%. It is worth-noting that there was no cross-family misclassification for all sixspecies that had at least one misclassified specimen (all six species had specimens correctlyclassified in their families). As a result, developing a model that first identifies the familyand then species cannot lead to an improvement in the overall accuracy of the system.
Contribution of MAXABS and MAXANG to the system performanceTo explore the contribution of MAXABS and MAXANG to the performance of the system,each feature type was separately used to train and test the model. Table 6 shows theclassification results obtained by using each feature type separately (16-element vector)and their combined features (32-element vector). For all four data sets used in this study,the best identification result was achieved using the 32-element vector. For the Engraulidae,Sciaenidae and the combined families, using only the MAXANG resulted in higher accuracycompared to using only the MAXABS. However, the performance of the model was betterfor the Ariidae family by using the 16-element vector obtained from the absolute features(MAXABS). This result suggests that both phase and absolute features should be taken intoaccount when the model is trained with different fish families.
Effect of the windowing functionAs mentioned in the previous section, the windowing function used to calculate STFT ofthe representative signals could influence the performance of the model. To explore thiseffect, the identification system was trained and tested with several types of the window
Salimi et al. (2016), PeerJ, DOI 10.7717/peerj.1664 8/15
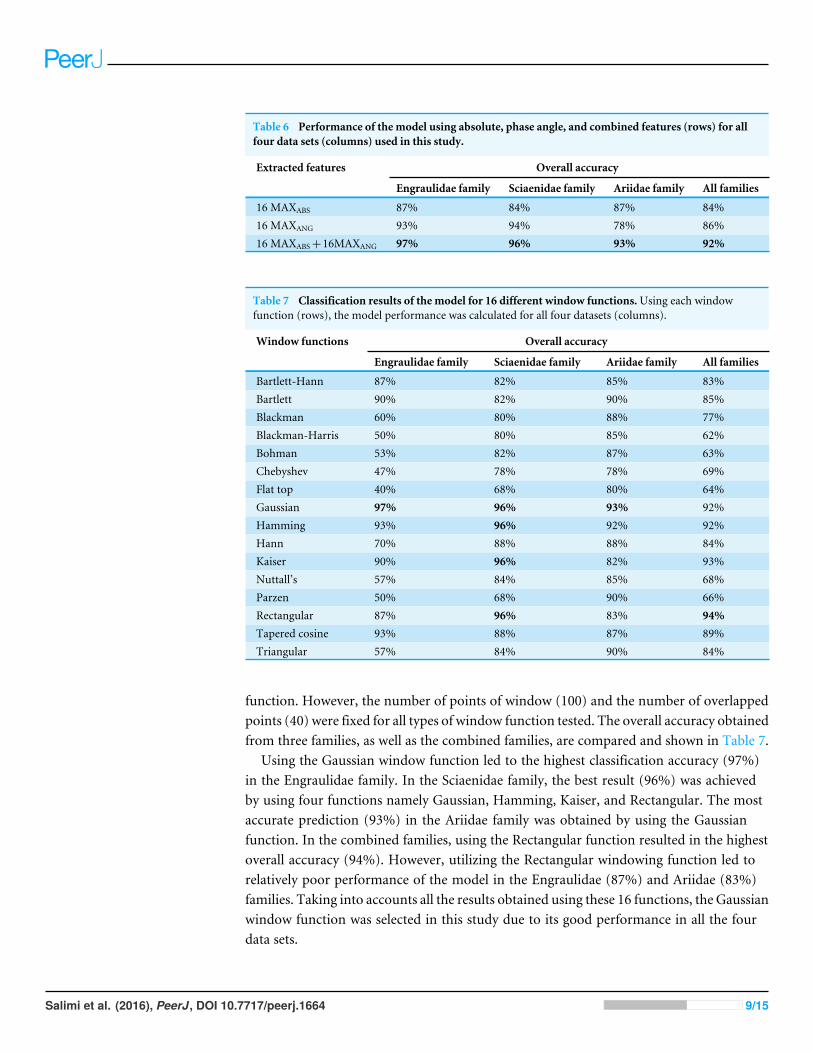
Table 6 Performance of the model using absolute, phase angle, and combined features (rows) for allfour data sets (columns) used in this study.
Extracted features Overall accuracy
Engraulidae family Sciaenidae family Ariidae family All families
16 MAXABS 87% 84% 87% 84%16 MAXANG 93% 94% 78% 86%16 MAXABS+16MAXANG 97% 96% 93% 92%
Table 7 Classification results of the model for 16 different window functions.Using each windowfunction (rows), the model performance was calculated for all four datasets (columns).
Window functions Overall accuracy
Engraulidae family Sciaenidae family Ariidae family All families
Bartlett-Hann 87% 82% 85% 83%Bartlett 90% 82% 90% 85%Blackman 60% 80% 88% 77%Blackman-Harris 50% 80% 85% 62%Bohman 53% 82% 87% 63%Chebyshev 47% 78% 78% 69%Flat top 40% 68% 80% 64%Gaussian 97% 96% 93% 92%Hamming 93% 96% 92% 92%Hann 70% 88% 88% 84%Kaiser 90% 96% 82% 93%Nuttall’s 57% 84% 85% 68%Parzen 50% 68% 90% 66%Rectangular 87% 96% 83% 94%Tapered cosine 93% 88% 87% 89%Triangular 57% 84% 90% 84%
function. However, the number of points of window (100) and the number of overlappedpoints (40) were fixed for all types of window function tested. The overall accuracy obtainedfrom three families, as well as the combined families, are compared and shown in Table 7.
Using the Gaussian window function led to the highest classification accuracy (97%)in the Engraulidae family. In the Sciaenidae family, the best result (96%) was achievedby using four functions namely Gaussian, Hamming, Kaiser, and Rectangular. The mostaccurate prediction (93%) in the Ariidae family was obtained by using the Gaussianfunction. In the combined families, using the Rectangular function resulted in the highestoverall accuracy (94%). However, utilizing the Rectangular windowing function led torelatively poor performance of the model in the Engraulidae (87%) and Ariidae (83%)families. Taking into accounts all the results obtained using these 16 functions, the Gaussianwindow function was selected in this study due to its good performance in all the fourdata sets.
Salimi et al. (2016), PeerJ, DOI 10.7717/peerj.1664 9/15
DISCUSSIONThe identification model proposed in this study could predict the species of an unknownspecimen from the Engraulidae, Sciaenidae, and Ariidae family with the overall accuracy of97%, 96%, and 93%, respectively. Even after combining three families the accuracy of themodel remained above 90% (∼92%), which is noticeably higher than the results obtainedby the identification model proposed in the most related study (∼72%) (Parisi-Baradad etal., 2010). It is noted that training datasets used in the present study were relatively small(19, 20, and 18 specimens per species for Sciaenidae, Engraulidae, and Ariidae family,respectively). Using more samples in the training sets could lead to increasing the accuracyof the model.
Two spectral analysis methods namely Fourier transform (FT) and wavelet transform(WT) have been applied in the previous studies as the feature extractors (Castonguay,Simard & Gagnon, 1991; Parisi-Baradad et al., 2005; Parisi-Baradad et al., 2010). Short-time Fourier transform (STFT) has been utilized in the present study, for the first timein the area of otolith image recognition, to extract the spectral features of the 1D signalobtained from the fish otolith contour. By using the maximum (standardized) values ofthe absolutes and phase angles of the STFT-transformed signal, a relatively low number offeatures (32) was extracted which is desired for the classification systems applying machinelearning techniques. On the other hand, multiscale decomposition of the 1D signal usingwavelet transform (WT) as proposed by Parisi-Baradad et al. (2005) and Parisi-Baradad etal. (2010) resulted in the extraction of a large number of attributes.
As was demonstrated in the previous section (Table 7), the choice of window functionhad a direct effect on the performance of the system. In addition to the type of windowingfunction, the number of points of the window function and the number of overlappedsamples played important roles in the classification results. The proposed model was alsotested with a variety of these two parameters (not reported here), and the best matchwas selected (i.e., 100 window points and 40 overlapped samples). Each 1D signal wasbroken into 16 segments by setting these two parameters to the optimized values. Thesetwo parameters were however optimized for the Gaussian window only. The performanceof other window types (see Table 7) may be increased by changing the values of these twoparameters (i.e., changing the number of segments/spatial resolution).
In this study, only proximal view of the otolith image was used to develop theidentification model. However, adding other views (e.g., anterior, dorsal) could leadto improving the performance of the model. Adding other views would be more crucialwhen other families and species are added to the system. The same procedure, as used forthe proximal view, can be applied on the other views of the otolith image. However, othertypes of the window function, probably with different spatial resolutions, could be moreeffective in analyzing the other views. In that case, a characteristic vector can be extractedfrom each view of the otolith. Consequently, each specimen can be represented by acombination of up to six vectors (depending on the number of views), rather than only onevector corresponding to the proximal view. By this way, more important morphologicalfeatures could be extracted from the otolith contour.
Salimi et al. (2016), PeerJ, DOI 10.7717/peerj.1664 10/15
Two classification techniques namely Decision Tree and Discriminant Analysis weretested in this study (the results obtained by the Decision Tree are not shown here) andthe latter was selected due to more accurate results. However, there are other classificationmethods such as Naive Bayes, Nearest Neighbors, Support Vector Machine, and NeuralNetwork which may improve the performance of the model in future studies.
Comparison among existing otolith classification models, in terms of correct speciesidentification, is a difficult task since these models are developed based on differentdatasets (different fish species obtained from different geographical regions). For instance,the AFORO database of fish otoliths, as used by Parisi-Baradad et al. (2010), consistedof 420 species from mainly western Mediterranean and Antarctic waters (Lombarte etal., 2006; Parisi-Baradad et al., 2010). However, the performance of the automated taxonidentification (ATI) model of Parisi-Baradad et al. (2010) was evaluated based on only fivespecies (from five families) in one test, and 50 species (from 35 families) in another test. Inboth tests, the accuracy of the ATI model at the species level was 72%. The STFT-DAmodelproposed in the present study classified five species within the same family (Sciaenidae)with an overall accuracy of 96%; while 14 species (from three families) were classified withan overall 92% accuracy. The STFT-DA model could also be tested with species from theAFORO or other databases if the model is trained with sufficient number of samples perspecies from the corresponding databases. It is expected that the addition of more speciesto the STFT-DA model would decrease the prediction accuracy. On the other hand, modelprediction of species may be improved if the size of the training sets is increased, moreoutline features as in other views are added, or better classification techniques are used.Moreover, combining the outline features extracted by the STFT-DA model with othermorphological attributes such as features of the sulcus acusticus (Tuset, Lombarte & Assis,2008) may further improve classification accuracy for databases comprising a large numberof species. Nonetheless, given the high number of marine fish species in the world, so farover 15,300 species reported by the first Census of Marine Life (ScienceDaily, 2003), a morepragmatic approach would be to limit the number of species by classifying them within asmaller geographical region, water body, country or fish habitat.
CONCLUSIONSA fully-automated identification system (STFT-DA) has been proposed in this studyto classify the fish species based on the morphological characteristics of the otolithoutline contour. Fourteen species from three families were used to develop and evaluateperformance of the model. Combining the short-time Fourier transform (STFT), as thefeature extractor, with the Discriminant Analysis (DA), as the classifier, led to improvingthe accuracy of the species classification in comparison with the existing automated model.The STFT windowing as well as classification technique had significant effects on theperformance of the model. Future enhancements of the proposed model may be needed toinclude more species into the system.
Salimi et al. (2016), PeerJ, DOI 10.7717/peerj.1664 11/15
ACKNOWLEDGEMENTSWe would like to thank Cecilia Chu and Suellina Binti Sulaiman for capturing the otolithimages. The University of Malaya is acknowledged for providing research facilities.
ADDITIONAL INFORMATION AND DECLARATIONS
FundingThis work was supported by University of Malaya Research Grants (UMRG), RP008-2012Cand RP008-2012A. The funders had no role in study design, data collection and analysis,decision to publish, or preparation of the manuscript.
Grant DisclosuresThe following grant information was disclosed by the authors:University of Malaya Research Grants (UMRG): RP008-2012C, RP008-2012A.
Competing InterestsThe authors declare there are no competing interests.
Author Contributions• Nima Salimi conceived and designed the experiments, performed the experiments,analyzed the data, contributed reagents/materials/analysis tools, wrote the paper,prepared figures and/or tables.• Kar Hoe Loh performed the experiments, contributed reagents/materials/analysis tools,reviewed drafts of the paper.• Sarinder Kaur Dhillon and Ving Ching Chong conceived and designed the experiments,reviewed drafts of the paper.
Animal EthicsThe following information was supplied relating to ethical approvals (i.e., approving bodyand any reference numbers):
1. University of Malaya-Institutional Animal Care and Use Committee (UM-IACUC).2. No approval was required since project was based on dead fish collected from fish
landings.
Data AvailabilityThe following information was supplied regarding data availability:
Data sets (Otolith images) as well as MATLAB codes are available as SupplementalInformation.
Supplemental InformationSupplemental information for this article can be found online at http://dx.doi.org/10.7717/peerj.1664#supplemental-information.
Salimi et al. (2016), PeerJ, DOI 10.7717/peerj.1664 12/15
REFERENCESAguirre H, Lombarte A. 1999. Ecomorphological comparisons of sagittae in Mullus
barbatus and M. surmuletus. Journal of Fish Biology 55:105–114DOI 10.1111/j.1095-8649.1999.tb00660.x.
Allen JB. 1997. Short term spectral analysis, synthesis, and modification by discreteFourier transform. IEEE Transactions on Acoustics, Speech and Signal Processing4:21–24.
Arbuckle T, Schröder S, Steinhage V,Wittmann D. 2001. Biodiversity informatics inaction: identification and monitoring of bee species using ABIS. In: Proc 15th intsymp informatics for environmental protection. 425–430.
Arellano R, Hamerlynck O, VincxM,Mees J, Hostens K, GijselinckW. 1995.Changes in the ratio of the sulcus acusticus area to the sagitta area of Pomatoschis-tus minutus and P. lozanoi (Pisces, Gobiidae).Marine Biology 122:355–360DOI 10.1007/BF00350868.
BowenW. 2000. Reconstruction of pinniped diets: accounting for complete digestion ofotoliths and cephalopod beaks. Canadian Journal of Fisheries and Aquatic Sciences57:898–905 DOI 10.1139/f00-032.
CastonguayM, Simard P, Gagnon P. 1991. Usefulness of Fourier analysis of otolithshape for Atlantic mackerel (Scomber scombrus) stock discrimination. CanadianJournal of Fisheries and Aquatic Sciences 48:296–302 DOI 10.1139/f91-041.
Chun J, Lee J-H, Jung Y, KimM, Kim S, Kim BK, Lim Y-W. 2007. EzTaxon: a web-based tool for the identification of prokaryotes based on 16S ribosomal RNAgene sequences. International Journal of Systematic and Evolutionary Microbiology57:2259–2261 DOI 10.1099/ijs.0.64915-0.
Cope JS, Corney D, Clark JY, Remagnino P,Wilkin P. 2012. Plant species identifi-cation using digital morphometrics: a review. Expert Systems with Applications39:7562–7573 DOI 10.1016/j.eswa.2012.01.073.
Culverhouse PF, Simpson R, Ellis R, Lindley J, Williams R, Parsini T, Reguera B, BravoI, Zoppoli R, Earnshaw G. 1996. Automatic classification of field-collected dinoflag-ellates by artificial neural network.Marine Ecology Progress Series 139:281–287DOI 10.3354/meps139281.
Dietrich CH, Pooley CD. 1994. Automated identification of leafhoppers (Homoptera:Cicadellidae: Draeculacephala Ball). Annals of the Entomological Society of America87:412–423 DOI 10.1093/aesa/87.4.412.
Farr I, Chesmore D. 2007. Automated bioacoustic detection and identification of wood-boring insects for quarantine screening and insect ecology. In: Proceedings of theinternational conference on bioacoustics. 201–208.
Fitch JE, Brownell Jr RL. 1968. Fish otoliths in cetacean stomachs and their importancein interpreting feeding habits. Journal of the Fisheries Board of Canada 25:2561–2574DOI 10.1139/f68-227.
Salimi et al. (2016), PeerJ, DOI 10.7717/peerj.1664 13/15
Gaston KJ, O’Neill MA. 2004. Automated species identification: why not? PhilosophicalTransactions of the Royal Society of London B: Biological Sciences 359:655–667DOI 10.1098/rstb.2003.1442.
Jonker R, Groben R, Tarran G, Medlin L, Wilkins M, García L, Zabala L, BoddyL. 2000. Automated identification and characterisation of microbial popula-tions using flow cytometry: the AIMS project. Scientia Marina 64:225–234DOI 10.3989/scimar.2000.64n2225.
Larios N, Deng H, ZhangW, Sarpola M, Yuen J, Paasch R, Moldenke A, Lytle DA,Correa SR, Mortensen EN. 2008. Automated insect identification through concate-nated histograms of local appearance features: feature vector generation and regiondetection for deformable objects.Machine Vision and Applications 19:105–123DOI 10.1007/s00138-007-0086-y.
La Salle J, Wheeler Q, Jackway P,Winterton S, Hobern D, Lovell D. 2009. Acceleratingtaxonomic discovery through automated character extraction. Zootaxa 2217:43–55.
Lombarte A, Castellón A. 1991. Interspecific and intraspecific otolith variability in thegenus Merluccius as determined by image analysis. Canadian Journal of Zoology69:2442–2449 DOI 10.1139/z91-343.
Lombarte A, Chic Ò, Parisi-Baradad V, Olivella R, Piera J, García-Ladona E. 2006. Aweb-based environment for shape analysis of fish otoliths. The AFORO database.Scientia Marina 70:147–152 DOI 10.3989/scimar.2006.70n1147.
MacLeod N, Benfield M, Culverhouse P. 2010. Time to automate identification. Nature467:154–155 DOI 10.1038/467154a.
Oppenheim AV, Schafer RW, Buck JR. 1999.Discrete-time signal processing . 2nd edition.Upper Saddle River: Prentice Hall.
Parisi-Baradad V, Lombarte A, García-Ladona E, Cabestany J, Piera J, Chic O. 2005.Otolith shape contour analysis using affine transformation invariant wavelettransforms and curvature scale space representation.Marine and Freshwater Research56:795–804 DOI 10.1071/MF04162.
Parisi-Baradad V, Manjabacas A, Lombarte A, Olivella R, Chic Ò, Piera J, García-Ladona E. 2010. Automated Taxon Identification of Teleost fishes using an otolithonline database—AFORO. Fisheries Research 105:13–20DOI 10.1016/j.fishres.2010.02.005.
Potamitis I. 2014. Automatic classification of a taxon-rich community recorded in thewild. PLoS ONE 9(5):e96936.
Rabiner LR, Schafer RW. 1978.Digital processing of speech signals. Englewood Cliffs:Prentice Hall.
Reichenbacher B, Sienknecht U, Küchenhoff H, Fenske N. 2007. Combined otolithmorphology and morphometry for assessing taxonomy and diversity in fossiland extant killifish (Aphanius,† Prolebias). Journal of Morphology 268:898–915DOI 10.1002/jmor.10561.
Sadighzadeh Z, Tuset VM, Valinassab T, DadpourMR, Lombarte A. 2012. Comparisonof different otolith shape descriptors and morphometrics for the identification
Salimi et al. (2016), PeerJ, DOI 10.7717/peerj.1664 14/15
of closely related species of Lutjanus spp. from the Persian Gulf.Marine BiologyResearch 8:802–814 DOI 10.1080/17451000.2012.692163.
ScienceDaily. 2003.How many fish in the sea? census of marine life launches first report.Available at http://www.sciencedaily.com/ releases/ 2003/10/031024064333.htm.
Tuset VM, Lombarte A, Assis CA. 2008. Otolith atlas for the western Mediterranean,north and central eastern Atlantic. Scientia Marina 72:7–198DOI 10.3989/scimar.2008.72s17.
Watson L, Dallwitz MJ. 1991. The families of angiosperms: automated descriptions, withinteractive identification and information retrieval. Australian Systematic Botany4:681–695 DOI 10.1071/SB9910681.
Watson AT, O’Neill MA, Kitching IJ. 2003. Automated identification of live moths(Macrolepidoptera) using digital automated identification system (daisy). Systematicsand Biodiversity 1:287–300 DOI 10.1017/S1477200003001208.
Zhao G, Krishnamurthy S, Cai Z, Popov VL, Travassos da Rosa AP, Guzman H,Cao S, Virgin HW, Tesh RB,Wang D. 2013. Identification of novel virusesusing VirusHunter–an automated data analysis pipeline. PLoS ONE 8:e78470DOI 10.1371/journal.pone.0078470.
Salimi et al. (2016), PeerJ, DOI 10.7717/peerj.1664 15/15