Embed Size (px)
DESCRIPTION
Fun with Stats and Spreadsheets: Real-World Tips to Leverage Domino Server Statistics. Andy Pedisich Technotics. Why Attend This Session?. Understanding statistics your servers deliver can help you to be a better administrator You can pro-actively address problems - PowerPoint PPT Presentation
Citation preview

© 2011 Wellesley Information Services. All rights reserved.
Fun with Stats and Spreadsheets:Real-World Tips to Leverage Domino Server StatisticsAndy PedisichTechnotics

Why Attend This Session?
• Understanding statistics your servers deliver can help you to be a better administrator You can pro-actively address problems You can determine answers and fixes to problems that come up
by looking at historical and current data• The problem is, much of this data is hard to find
Especially if your environment is not configured to collect it• This session will show you how to extract the Domino data you
need to successfully run your domain And it will show you very shortly how to calculate the disk
space you’re saving using DAOS
2

3
What We’ll Cover …
• Gearing up for advanced statistical analysis• Calculating the space saved by using DAOS• Creating an efficient statistic collection architecture• Customizing the STATREP.NSF (Monitoring Results DB)• Mastering the basics of statistical data extraction• Scooping out hidden data to analyze and chart• Wrap-up
4
Building a Strong Foundation for Statistical Analysis
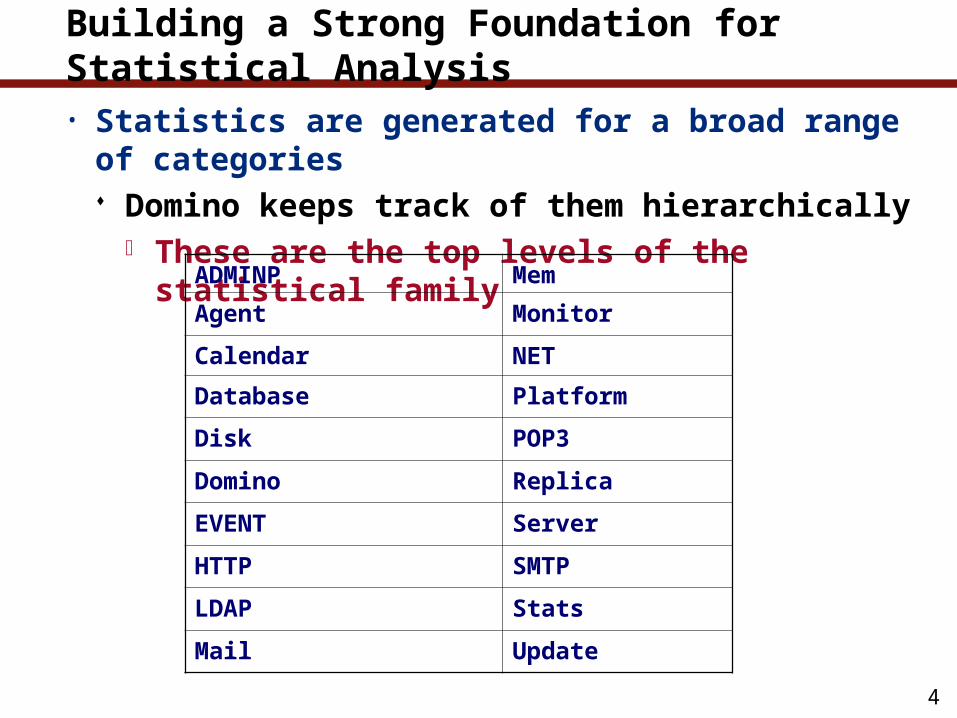
• Statistics are generated for a broad range of categories Domino keeps track of them hierarchically
These are the top levels of the statistical family
ADMINP Mem
Agent Monitor
Calendar NET
Database Platform
Disk POP3
Domino Replica
EVENT Server
HTTP SMTP
LDAP Stats
Mail Update

5
Statistics Subcategory Families
• Each statistic has a multitude of sub-categories This snapshot from the Administrator client shows some of the
families in the statistical hierarchy “Agent” has a “Daily” sub-family, for example

6
Ask for Them by Name
• Domino will produce a list of all the statistics it generates using the following console command: Show stat
• You can get a list of the sub-family of a statistical hierarchy using the following console command format: Show stat top level hierarchy As in the following example:
Show stat mail

7
Drilling Down Statistics from the Console
• Use the global asterisk “*” character to see specific portions of the sub-hierarchy You can use SH instead of SHOW If you only want Server.Users hierarchy, use the global “*”
Show stat mail.deliveredsize.* Or you can abbreviate the console command
Sh stat mail.deliver*

8
The Four General Types of Statistics
1. Stats that don’t change after starting a Domino server Disk.D.Size = 71,847,784,448 Server.Version.Notes = Release 7.0.2
These have great value because they can be used to help produce an inventory of server platform configurations
2. Stats that are snapshots of a current moment Mem.Free = 942,411,776 Server.AvailabilityIndex = 83
Valuable because they show what’s happening now Can be used for problem determination

9
The Four General Types of Statistics (cont.)
3. Stats that are calculated SMTP.SessionDuration.Ave = 4 SMTP.SessionDuration.Max = 593
They are calculated from the time a server starts These can help you understand trends
4. Stats that are cumulative Mail.TotalKBTransferred.SMTP = 4,267,804,067 Server.Trans.Total = 394,385
They are also accumulated from the time the server starts But they only have value if extracted and analyzed
Which is precisely what we are going to do

10
What We’ll Cover …
• Gearing up for advanced statistical analysis• Calculating the space saved by using DAOS• Creating an efficient statistic collection architecture• Customizing the STATREP.NSF (Monitoring Results DB)• Mastering the basics of statistical data extraction• Scooping out hidden data to analyze and chart• Wrap-up

Let’s Have Some Fun With a Spreadsheet and DAOS
• Domino Attachment and Object Service can save you disk space When using DAOS, Domino saves attachments in an internal
repository If any other document in any other file or files have that same
document, Domino saves a reference to the file Attachments are only stored once on the server even
though they might be used in hundreds of databases• That’s why DAOS saves disk space
But now that you’ve implemented DAOS, how much disk space have you saved Wouldn’t you like to know how much
precious disk space you’ve saved?
11

How to Calculate DAOS Disk Space Savings
• Your DAOS data must be on a separate drive outside of the data directory of the server to use this formula Here’s the formula to determine DAOS disk space savings
DAOS Savings =Logical Size of all databases – (Physical size of data directory + Physical size of DAOS directory)
• You can get all three of these statistics using the Notes Administrator client You have to dig a little to get them, but they are all there
12
Using the Notes Administrator Client to Get These Stats
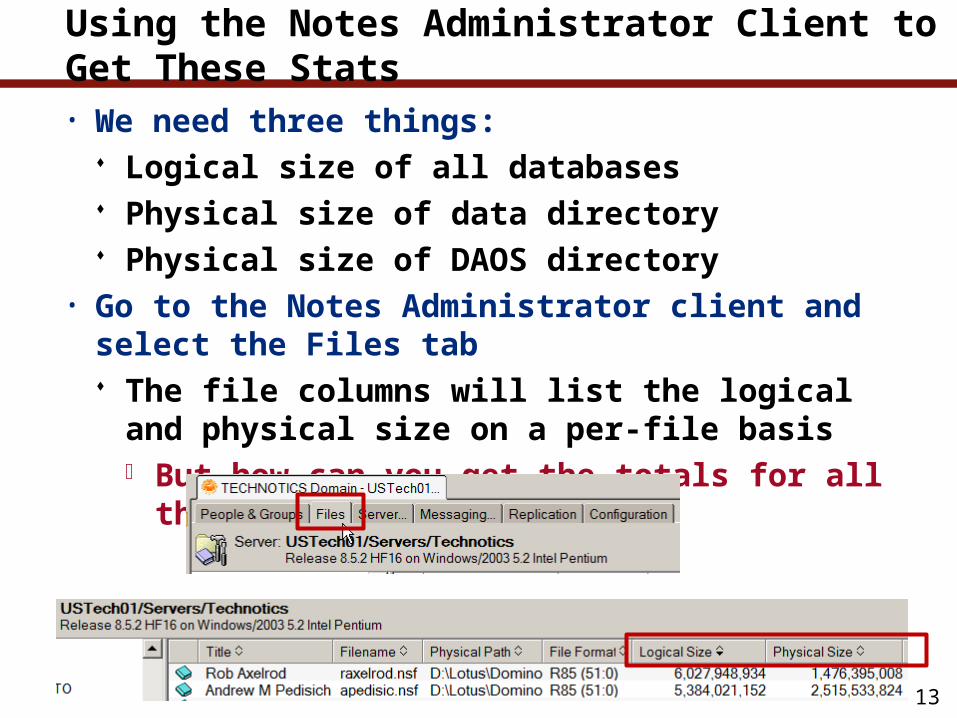
• We need three things: Logical size of all databases Physical size of data directory Physical size of DAOS directory
• Go to the Notes Administrator client and select the Files tab The file columns will list the logical and physical size on a per-
file basis But how can you get the totals for all the files?
13

Getting a List of All the Files
• In the Notes Administrator Client using the Files tab, click on the All button on the top right of the screen This will change the way the files on the server are displayed
You’ll no longer see folders
14

The Tree View Changes Into a List of Every File
• You’ll see a complete list of all files on the server But you won’t see the sum of each column
This data needs to be taken into a spreadsheet for further analysis Note in the screen shot that every directory is listed
15

Select All
• Use the Edit menu to select all records being displayed on the Notes Administrator Client Or you can select one of the records and do a Ctrl A
All the records will be selected
16

Copy the Records to the Clipboard
• Use the Edit Copy menu or do a Ctrl C on the keyboard to copy all the records Then open your spreadsheet
17

Paste Into Your Spreadsheet
• Use the Edit Paste menu sequence or a Ctrl V to paste the contents of your clipboard The contents of the File tab which listed the disk stats for all of
the files on your server will be pasted into the spreadsheet Now we can use formulas to do some calculations
18

You Might Want to Widen a Few Columns
• Widen the columns for Logical Size and Physical Size just to see what you are working with Remember, you need the total Logical Size, which is how big
the databases would be if all the attachments were contained in the database And you need the total Physical Size, which is how big the
databases actually are
19

Add @Sum Formulas to Logical and Physical Columns
• Use an @sum formula to total the disk size at the bottom of the logical size and physical size columns You can do this also by going to the bottom of each of the
columns and clicking the autosum formula option This is an Office 2007 screen shot
You now have 2 of the 3 stats you need
20

You Need the Size of the DAOS Storage
• To get the size of the DAOS storage, you have to query the statistics on the server Do this by entering the following using the Notes administrator
client server console Show stat disk.*
• Among the disk statistics will be the free space and size of the disk that houses the DAOS store Copy them to the clipboard
21

Using the Excel 2007 Import Wizard
• If you are using Excel 2007 you can use Paste Special, and use the text import wizard to allow the disk size values to be pasted into cell Otherwise you will have to copy the numbers out of the line of
statistics you pasted in
22

Paste into the Spreadsheet
• Paste them into the bottom of the spreadsheet Use a formula to subtract the DAOS free space from the total
DAOS space allocated That will give you the space used by DAOS
23

Create the Final Formula
• Create a formula DAOS Savings = Logical Size of all databases –
(Physical size of data directory + Physical size of DAOS directory) It’s something great to show management
•
24

25
What We’ll Cover …
• Gearing up for advanced statistical analysis• Calculating the space saved by using DAOS• Creating an efficient statistic collection architecture• Customizing the STATREP.NSF (Monitoring Results DB)• Mastering the basics of statistical data extraction• Scooping out hidden data to analyze and chart• Wrap-up

26
The Two Things Needed
• Two things are required for statistics collection: The Collect task must be running on any server that is
designated to collect the statistics Not all servers should run the Collect task
The EVENTS4 database must have at least one Statistics Collection document Statistics should be collected centrally on one or two servers
so that the data is easy to get to Stats should be collected every hour to be effective
EVENTS4 should be the same replica on all servers in the domain

27
We Know What the Replica ID Should Be for EVENTS4
• The replica ID of system databases, such as EVENTS4, is derived from the replica ID of the address book
Database Replica ID
NAMES.NSF 852564AC:004EBCCF
CATALOG.NSF 852564AC:014EBCCF
EVENTS4.NSF 852564AC:024EBCCF
ADMIN4.NSF 852564AC:034EBCCF Notice that the first two numbers after the colon for the
EVENTS4.NSF replica are 02 Make sure that EVENTS4.NSF is the same replica ID
throughout the domain by opening it and putting it on your desktop

28
Want to Add Every EVENTS4.NSF to Your Desktop?
• Add this code to a button on your toolbar This is courtesy of Thomas Bahn
www.assono.de/blog
_names := @Subset(@MailDbName; 1) : "names.nsf";
_servers := @PickList([Custom]; _names; "Servers"; "Select servers"; "Select servers to add database from"; 3);
_db := @Prompt([OkCancelEdit]; "Enter database"; "Enter the file name and path of the database to add."; "log.nsf");
@For( n := 1; n <= @Elements(_servers); n := n + 1; @Command([AddDatabase]; _servers[n] : _db) )

29
Add a Database to the Desktop
• This code will prompt you to pick the servers that have the database you want on your desktop Then it will prompt for the name of the database
And open it on all the servers you’ve selected• Use it to make sure all the EVENTS4.NSF are the same replica in
your domain

30
A Required Design, but No Required Name
• There has to be a Statrep.nsf on every server It is used by the server to store monitoring data
It must be designed using the Statrep5.ntf Monitoring Results template Its default title is Monitoring Results
• But you don’t have to use one of those for your statistic collection repository Create your own collection points and give the database a
unique name
City Collecting Server Monitoring Results DB New York USNYAdmin1 USStatrep.nsf
Amsterdam EUNeHub01 EUStatrep.nsf

31
What We’ll Cover …
• Gearing up for advanced statistical analysis• Calculating the space saved by using DAOS• Creating an efficient statistic collection architecture• Customizing the STATREP.NSF (Monitoring Results DB)• Mastering the basics of statistical data extraction• Scooping out hidden data to analyze and chart• Wrap-up

32
Why Would the Statrep.nsf Need Customization?
• The Statrep database is surprisingly lacking in value• There are eight views of statistical data in Statrep
The Calendaring & Scheduling and Clusters views lack any substantial information
The Communications view strictly shows dial-up stats What year is this?

33
More Marginal Views
• The Mail & Database view is not bad• The Network view is useless• The Platform and System views have some OK data
But they still contain some questionable data

34
Web Server Stats Documents
• Web server stats documents are strangely empty Mostly because they reference stats that aren’t there
And I need views to really get trend information!

35
Web Server Stats
• If you are running Domino Web Access, you’re probably very interested in how your Web servers are doing You’d like to know how much work is being done
• But the Web Server/Web Retriever view is also useless The columns reference fields that don’t exist!

36
Documents Have Better Content Than Views
• In most cases, the documents in the Statrep database have much better content than the views The statistics in the document are just really hard to use
You really need the context of seeing many samples in a column format to make sense out of it

Everything Is Everywhere
• Keep in mind that every single statistic that is generated is contained in every document in the Monitoring Results database You just can’t see it all because it’s not in views or documents
And views are the most important place to have it because that’s where it gives you the ability to compare samples And analyze trends
37

The Stats Are There, Now You See Them
• There is a new, customized version of the Monitoring Results database on your conference CD called: TechnoticsR85Statrep.ntf
It has all the views that are on the original Statrep
Plus over a dozen additional views to help you analyze the stats your servers generate
38

Here’s a View You Can Use
• That same TechnoticsR85Statrep.ntf has a handy view for looking at Web action
39

40
Agents No Longer Have Secrets
• Are you wondering how many minutes the agent manager used running resource-hungry agents? Now you have a view to help you see it hour by hour
No more guesswork about server conditions

41
Even Platform Statistics Are Available
• The Platform Statistics view will show important aspects of the OS and platform supporting your server Keep in mind that these platform statistics are momentary
snapshots produced by the underlying OS Their sample rates are different than the performance
monitoring tools available with your platform Therefore the results will not always be exactly the same
as your platform results The view adds all updall and agent manager threads

42
Disk Statistics Are Available, Too
• The views focus on two important aspects of disk performance Disk utilization and disk queue length
High disk queue lengths can indicate hardware issues Not all platforms produce the same statistics for
disk information

43
Plus, a View to Help Analyze Shrinking Disk Space
• Showing free disk space by the hour will help you determine the cause of extreme disk space usage This view is built for Domino running on Wintel

TechnoticsR85Statrep.ntf
44

A Couple of Caveats About the Customized Statrep
• Some views expose the following statistics Agent.Daily.UsedRunTime and Agent.Hourly.UsedRunTime
This stat generated the agent runs in seconds• Some versions of Domino produce this stat as a text field, others
as a numeric field A formula converts it to a numeric field
This might not be necessary in your domain @If(@IsAvailable(Agent.Hourly.UsedRunTime);
(@TextToNumber(@LeftBack(Agent.Hourly.UsedRunTime;8))/60);“N/A”)
The formula also converts the statistic from seconds to minutes
45

46
One More Caveat
• A few views display disk utilization statistics such as: Platform.LogicalDisk.2.AvgQueueLen.Avg
• Disk statistic names vary from platform to platform AIX and iSeries systems can have much longer device names Even in the Wintel platform they can be listed as:
Logical disks Physical disks
• Be sure to check Statrep to see how it is represented in your domain You might find it necessary to customize all disk views for your
own environment

47
What We’ll Cover …
• Gearing up for advanced statistical analysis• Calculating the space saved by using DAOS• Creating an efficient statistic collection architecture• Customizing the STATREP.NSF (Monitoring Results DB)• Mastering the basics of statistical data extraction• Scooping out hidden data to analyze and chart• Wrap-up

48
The Statrep Template’s Only Export View
• The default Lotus Statrep template’s Spreadsheet Export view just doesn’t seem to give us enough power Pulling the data into Excel, then analyzing and graphing the
data can often give you amazing insight into usage patterns This information will be invaluable when:
Trying to consolidate servers Troubleshooting performance issues

49
Analysis Tools
• Let’s cover the basics of the Statrep views used in the data export process And the special Excel spreadsheet that contains custom
formulas

50
You Need a Better View of the Situation
• The data export views are designed to be exported as CSV files Each has key fields that are important to the export
Hour and Day generate an integer that represents the hour of the day and a day of the week Hour 15 = 3:00 PM Day 1 = Sunday, Day 7 = Saturday These are used in hourly and daily calculations in
pivot tables

51
Export Views Are All Flat Views
• Any view that is used for exporting data is flat, not categorized This makes it easier to manipulate in pivot tables in Excel
• There are columns in the export views that appear to have no data They will be filled with a formula when brought into Excel
52
Formulas Are Already Available
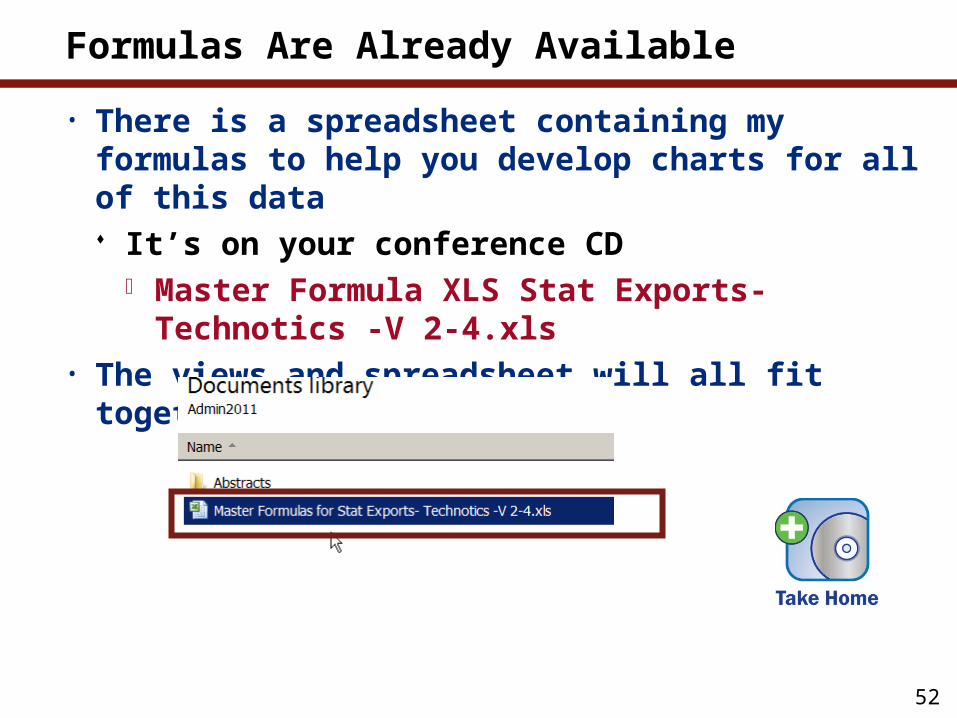
• There is a spreadsheet containing my formulas to help you develop charts for all of this data It’s on your conference CD
Master Formula XLS Stat Exports- Technotics -V 2-4.xls• The views and spreadsheet will all fit together in a few moments

53
What We’ll Cover …
• Gearing up for advanced statistical analysis• Calculating the space saved by using DAOS• Creating an efficient statistic collection architecture• Customizing the STATREP.NSF (Monitoring Results DB)• Mastering the basics of statistical data extraction• Scooping out hidden data to analyze and chart• Wrap-up

54
Transactions Per Hour
• This can be a very important statistic if you are thinking about consolidation Use time span to sample all servers for the best results
It will allow you to compare apples to apples And because all the export data contains a reference to the day
of the week, you could select the data for Monday through Friday to get the significant averages

55
Examining Transactions
• If a few servers are performing badly, you might want to know how many transactions they are processing Especially if the servers have the same hardware
And if they have a similar number of mail users assigned • I want to compare these servers statistically
What I want to know is: How many users are hitting these systems? How many transactions are these servers being forced
to make? And I want to know these things on a PER HOUR basis

56
Start by Going to the Export Transactions/Users View
• Analysis starts with Export Transactions/Users view I don’t hesitate to add new views to Statrep
I don’t change the old ones, I just add new ones• Note that Trans/Total is a cumulative stat
And the Trans/Hour column is blank We have a custom formula to apply to this column after the
data is exported into MS Excel

57
Next, Export View to CSV File
• I export the contents of the view to a CSV file The file is always called DELME.CSV so I can find it
It’s overwritten each time I do an export It’s a good idea to grab the View titles
The import is fast

58
Next, Open the Special Spreadsheet
• Start Excel and open the spreadsheet containing the formulas to help you develop charts for all of this data Master Formulas for Stat Exports- Technotics -V 2-4.xls

59
What’s in the Spreadsheet?
• The spreadsheet contains the formulas that will help to break down server activity into per hour averages Don’t worry about the #value errors
Then open the DELME.CSV file

60
We’re into Microsoft Excel for the Analysis
• Next, we open the DELME.CSV in Excel Excel knows we want to import it because it’s a CSV file
It opens quickly with no further prompts

61
The Data Is Now in Excel
• The view brought it in sorted by Server and Collection Time Remember, we’d like to see the number of transactions
per hour With the way this spreadsheet is set up, it’s pretty easy to
construct a formula where we simply: Subtract the last hour’s number of transactions from this
hour’s transactions to get the number per hour Transactions per hours = Last hour’s transactions -
Current hour’s transactions

62
Tricky Calculations – Server Restarts and Stuff
• Except sometimes when servers are restarted Then the cumulative stats start over
• Or when the next server starts being listed in the statistics You have to be careful not to subtract without paying attention
to these things
63
Special Formulas to the Rescue
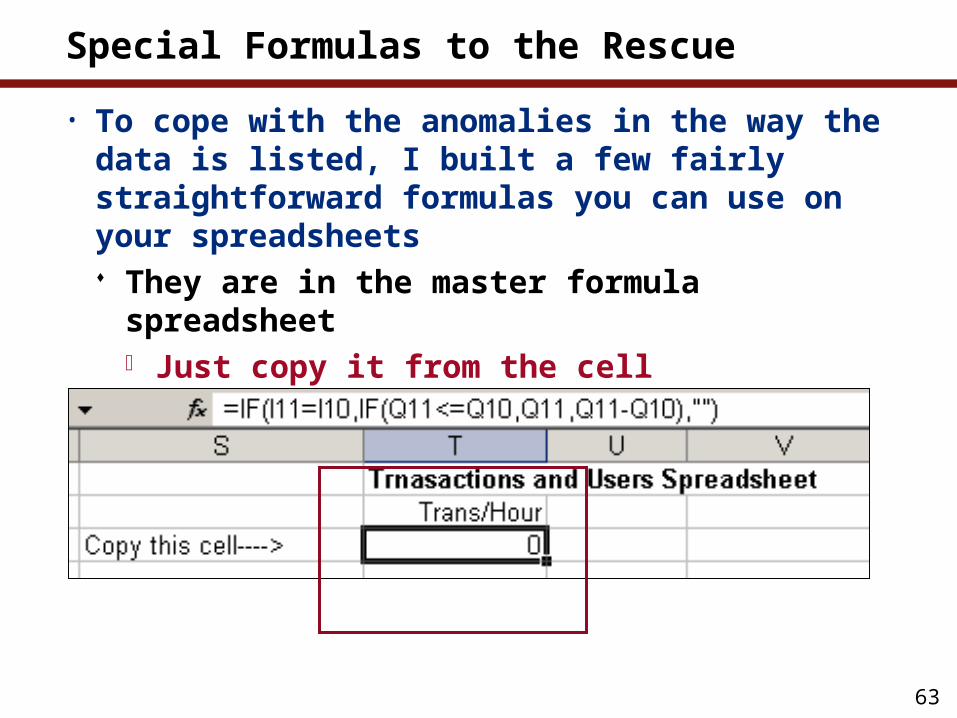
• To cope with the anomalies in the way the data is listed, I built a few fairly straightforward formulas you can use on your spreadsheets They are in the master formula spreadsheet
Just copy it from the cell

64
Insert the Copied Cells
• Move to the delme.csv spreadsheet• Then use the Insert menu to insert the copied cells into your
spreadsheet Move the cells to the right or down to get them out of the way
You’ll be copying the proper formula into your spreadsheet• Copy that formula down your entire column of data
Save your spreadsheet as an XLS

65
Copy That Cell Down
• We’re going to make a Pivot Table with our data The Pivot Table will take our data and let us easily manipulate it
and graph it Select all the data, including the column titles, and use the
menu to select PivotTable and PivotChart Report

66
Take Defaults
• If you’re new at this, just take the default answers for the questions Excel asks

67
The End of the World as You Know It
• It drops you into the Pivot Table function where you have a field list to drag and drop into the table

68
Drag Server to the Column Top
• Drag Server to the column top and Hour to the row names column

69
Drag the Data to the Center of the Table
• Drag the data you want to the table itself It defaults to the “Count of Trans/Hour”
But you’ll want to change it to Average, and format it to look nice, too

70
There You Have It
• You now have a nice breakdown of the average number of transactions per hour, per server

71
Easy to Manipulate
• It’s easy to remove servers and add them back again And it’s easy to pick the hours that you are interested in, too

72
Graphing Your Results
• This is where it really gets cool Just click on the Chart Wizard
And …

73
Bingo, You Have an Instant Chart
• Stacked bar isn’t what we want, but that was quick!
74
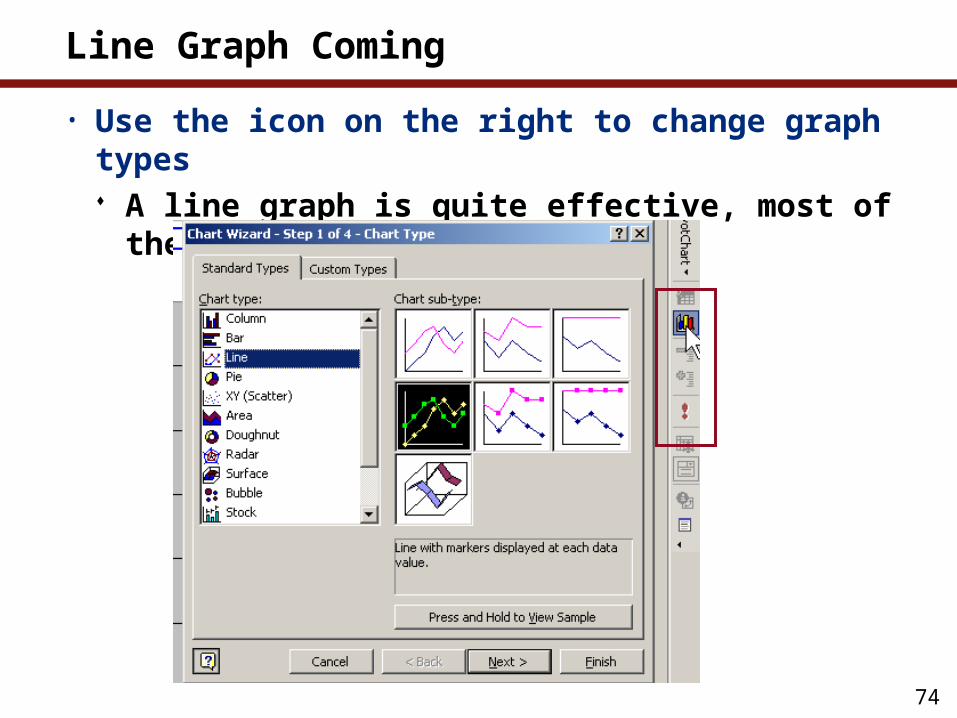
Line Graph Coming
• Use the icon on the right to change graph types A line graph is quite effective, most of the time

75
Here’s the Line Graph You Ordered
• Simple, fast, and straightforward This is an average of transactions per hour

76
Demonstration: Exporting Data and Creating Pivot Table
77
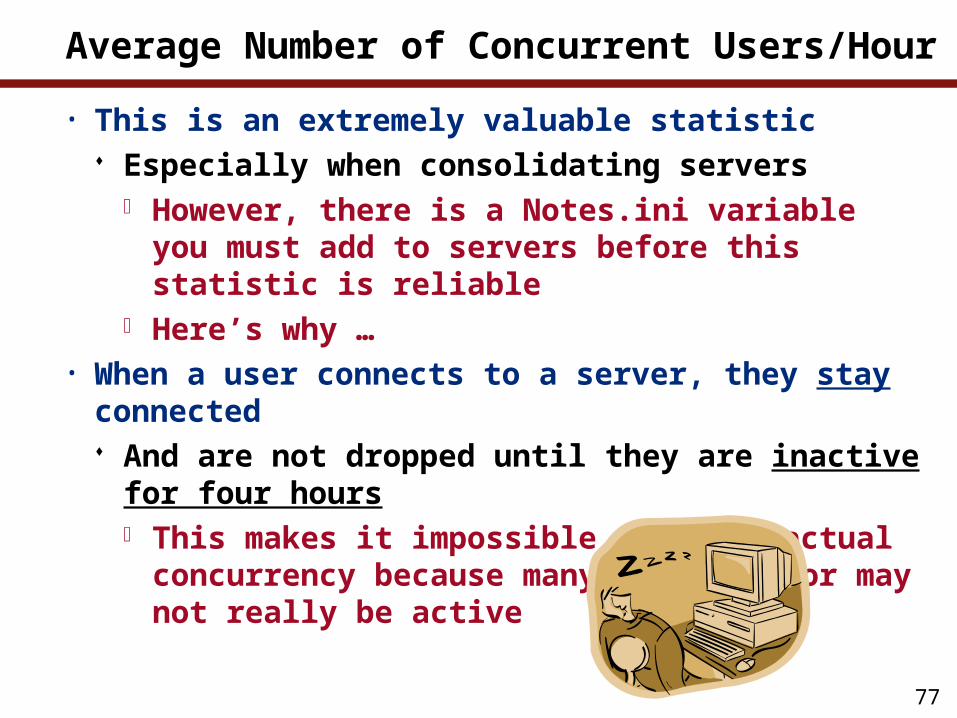
Average Number of Concurrent Users/Hour
• This is an extremely valuable statistic Especially when consolidating servers
However, there is a Notes.ini variable you must add to servers before this statistic is reliable
Here’s why …• When a user connects to a server, they stay connected
And are not dropped until they are inactive for four hours This makes it impossible to track actual concurrency
because many users may or may not really be active

78
Preventing Idle Connections
• To prevent these idle sessions from taking up valuable resources, add this to the Notes.ini of all servers Server_Session_Timeout = 30
Sets number of minutes of inactivity after which a server automatically terminates network and mobile connections Users will not have to re-enter a password if they become
active after the time limit• The minimum recommended setting is 30-45 minutes
A lower setting may negatively impact server performance• Now it’s easy to chart user concurrency using the same
spreadsheet we just developed

79
Change the Field List Easily
• It’s easy to remove the field Trans/Hour off the chart, and replace it with the Average of Users

80
Dress It Up for a Presentation
• You can fix it up and format it if you need to make a presentation from the data

81
Five Export Views
• There are five different export views on the Admin 2008 Statrep template from Technotics Messaging Mail Routed SMTP Mail Routed ExportTransaction/Users Export CPU Util Export Agent Stats
• Along with the other customviews mentioned earlier

82
Messaging Mail Routed and SMTP Mail Routed
• The views for exporting the Messaging Mail Routedand SMTP Mail Routed views use a spreadsheet technique similar to the one used for analyzing transactions per hour But there are opportunities for analyzing
Average SMTP Messages processed per hour Average SMTP Message Size processed per hour Average Message Recipients processed per hour Average Mail Total Processed per hour

83
Spreadsheet Concepts Similar
• You will need to copy a group of formula cells instead of just one Insert the copied cells the same way as described earlier in this
presentation
84
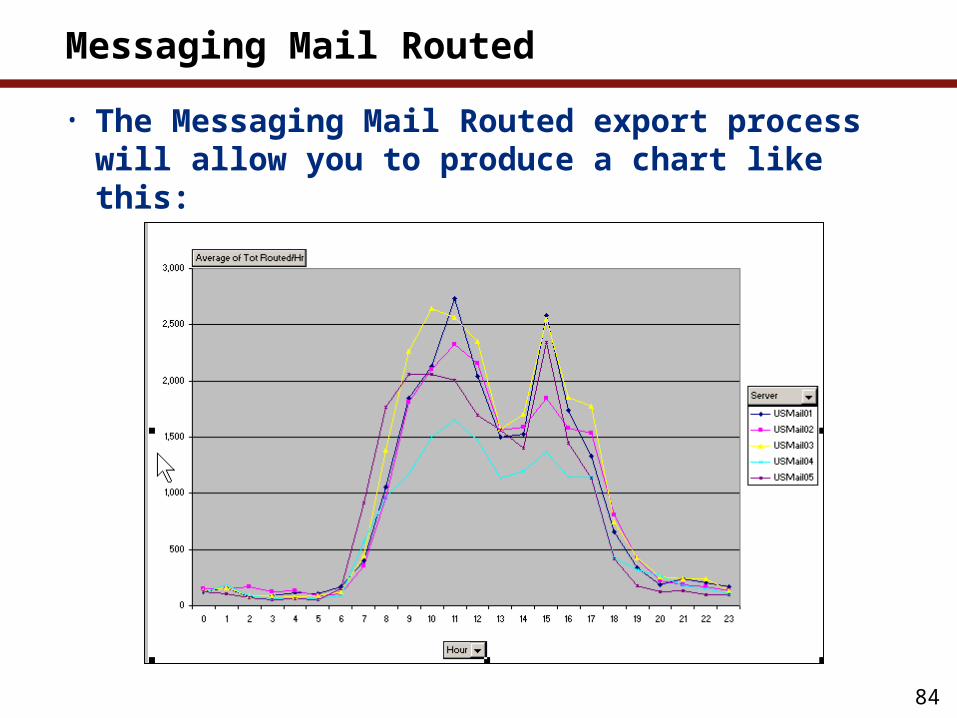
Messaging Mail Routed
• The Messaging Mail Routed export process will allow you to produce a chart like this:

85
SMTP Mail Routed
• The SMTP Mail Routed will allow you to easily make a chart that looks like this:

86
Export CPU Utilization
• The Export CPU Utilization will give you a lot of different charts, like this nice one averaging transactions per minute:

87
What We’ll Cover …
• Gearing up for advanced statistical analysis• Calculating the space saved by using DAOS• Creating an efficient statistic collection architecture• Customizing the STATREP.NSF (Monitoring Results DB)• Mastering the basics of statistical data extraction• Scooping out hidden data to analyze and chart• Wrap-up

88
Resources
• How can the actual disk savings from DAOS be computed? www-304.ibm.com/support/docview.wss?uid=swg21418283
• Description of HTTP statistics for a Lotus Domino server www-1.ibm.com/support/docview.wss?uid=swg21207314
• Thomas Bahn’s blog with code to easily add databases from any and all servers to your desktop www.assono.de/blog/d6plinks/Add-Database-From-Servers-To-
Workspace• How does the notes.ini file parameter 'server_session_timeout'
affect server performance? www-304.ibm.com/support/docview.wss?uid=swg21293213

89
7 Key Points to Take Home
• The Collect task should only be run on certain servers in the infrastructure that are designated statistic collectors Collect should not be run on every server
• Cumulative statistics are only valuable if you perform some very basic calculations
• Monitor cluster replication stats weekly to make sure the queues aren’t long and the work queue depth is short
• High disk queue lengths sometimes indicate failing or misconfigured hardware

90
7 Key Points to Take Home (cont.)
• There is a Platform.Process.$$$.PctCpuUtil stat for each process you run Make sure to analyze tasks for their CPU usage
• The Statrep database has issues, so don’t be bashful about creating your own views
• Pulling exported data into Excel is a powerful way to analyze data in new ways