Embed Size (px)
Citation preview

THE HONG KONG POLYTECHNIC UNIVERSITY
INSTITUTE OF TEXTILES AND CLOTHING
Function-led Design of Multifunctional Stimuli-responsive
Superhydrophobic Surface Based on Hierarchical
Graphene-Titania Nanocoating
LIU Yang
A Thesis Submitted in Partial Fulfillment of the
Requirements for the Degree of Doctor of Philosophy
August 2016

Abstract
With the advancements in both nanotechnology and micro-fabrication techniques,
the development of superhydrophobic surface (SHS) enters a new era which
highlights the significance of multifunctionality, tunable surface property, and
smart response. Novel multifunctional SHS may accomplish multiple tasks
simultaneously in real-field applications while tunable surface property can
effectively induce smart responses on the SHS, which further benefit the
functional optimization, life cycle, and prompt the total system efficiency of SHS.
Based on the clear understanding of the application requirement and the material
property, function-led design of SHS can be realized so that high performance
SHS are achieved with reduced cost and optimized functions. In order to
fabricate SHS with highly interactive interfacial dynamics, graphene, one of the
thinnest among the existing materials, was chosen and applied to the flexible
textile fabrics. Extremely strong bonding was observed between graphene and
the fibers, and the thin sheets of graphene were also observed to tightly wrap
according to the surface profiles of the fibers. Surprisingly, the hydrophilic
cotton fabric became hydrophobic with a graphene loading of only 0.5 wt%. By
further upgrading the monolayer graphene coating on the fabric, a nanofilm of
titania (TiO2) was subsequently applied onto the graphene surface which created
a hierarchical surface structure showing superhydrophobicity. As a result of the
photoactivity of TiO2, UV-triggered superhydrophilic conversion can be readily
achieved on this novel SHS. Enhanced control over the conversion rate and the

wettability were also achieved due to the interfacial charge transfer interaction
between TiO2 and graphene. Tunable adhesion, spreading, and transport of water
droplets can be realized on the as-obtained hierarchical graphene-TiO2 (GT) SHS,
which can further transform the GT-SHS into a versatile platform for
micro-droplet/fluid manipulation. Multiple functions of application significance,
i.e. directional water transport, micro-droplet storage and transfer, self-cleaning
and gas sensing, are readily demonstrated on GT-SHS; exceptional oil/water
separation performance is also shown by the membrane based on GT-SHS.
Therefore, potent potential in the sweat and moisture management of quick-dry
garment, micro-volume droplet storage, and oily water treatment can be
anticipated for the novel stimuli-responsive GT-SHS. To speak further, being
perceived as an essential bridging step between the fundamental research and
practical application, the function-led design criterion can be envisaged as the
new guiding code for the research and development of SHS.

Table of contents
TABLE OF CONTENTS Chapter 1. Introduction ....................................................................................... 1
1.1 Research background ................................................................................ 1
1.2 Objectives .................................................................................................. 4
1.3 Framework of the thesis ............................................................................ 4
Chapter 2. Literature review ............................................................................... 7
2.1 The Young's equation and superhydrophobic state ................................... 7
2.2 Development in the forms and functions of superhydrophobic surface . 10
2.2.1 “Lotus effect” and dual roughness ................................................ 11
2.2.2 Fabrication of SHS on flat solid surface: chemical etching .......... 12
2.2.3 Fabrication of SHS on flat solid surface: physical etching ........... 14
2.2.4 Fabrication of ordered SHS on flat solid surface: photolithography
................................................................................................................ 16
2.2.5 Fabrication of ordered SHS on flat solid surface: replica molding
& chemical vapor deposition ................................................................. 18
2.2.6 Fabrication of SHS on non-flat solid surface: low surface energy
coating .................................................................................................... 27
2.3 New concept based advanced superhydrophobic surface with substantial
robustness ...................................................................................................... 31
2.4 Significance of the research .................................................................... 44
Chapter 3. Methodology .................................................................................... 46
3.1 Materials .................................................................................................. 46
3.2 Synthesis of graphene oxide ................................................................... 46
3.3 Synthesis of titania nanosol ..................................................................... 48
3.4 Microstructure characterization .............................................................. 48
3.5 Surface property characterization ........................................................... 49
3.6 Contact angle measurement .................................................................... 50
3.7 UV-induced superhydrophilic conversion on GT fabric ......................... 51
3.8 Fabrication of GT fabric based micro-droplet sensor arrays for gas
Table of contents
sensing ........................................................................................................... 51
3.9 Oil/water separation test on GT-fabric .................................................... 52
Chapter 4. Surface energy engineering on cotton fabric using graphene ..... 53
4.1 Introduction ............................................................................................. 53
4.2 Fabrication of graphene nanocoating on cotton fabric ............................ 54
4.3 Tuning the surface wettability of G-fabric .............................................. 60
Chapter 5. Surface energy engineering on G-fabric surface using titania ... 65
5.1 Introduction ............................................................................................. 65
5.2 Synthesis of titania sol-gel with homogeneous nanoparticle size
distribution .................................................................................................... 66
5.3 Fabrication of titania nanofilm on G-fabric ............................................ 68
5.4 Tuning the surface wettability of GT-fabric ............................................ 72
Chapter 6. Advanced applications of superhydrophobic hierarchical
graphene/TiO2 surface ....................................................................................... 74
6.1 Introduction ............................................................................................. 74
6.2 Directional water transport ...................................................................... 75
6.3 Microfluid manipulation ......................................................................... 82
6.4 Oil-water separation ................................................................................ 86
Chapter 7. Mechanism study on TiO2 superhydrophilic conversion and
graphene/titania interfacial interaction ........................................................... 90
7.1 Introduction ............................................................................................. 90
7.2 Macroscopical surface change of titania during UV radiation ................ 90
7.3 Microscopical surface change of titania during UV radiation ................ 95
7.4 Interfacial interaction between graphene and titania ............................ 100
Chapter 8. Conclusion and future work......................................................... 105
References ......................................................................................................... 110

List of symbols and abbreviations
List of Symbols and Abbreviations
SHS Superhydrophobic Surface
3D Three Dimensional
GT Hierarchical Graphene/Titania Surface
GO Graphene Oxide
SEM Scanning Electron Microscopy
TEM Transmission Electron Microscopy
HRTEM High Resolution Transmission Electron
Microscopy
SAED Selected Area Electron Diffraction
AFM Atomic Force Microscopy
XRD X-ray Diffractometry
EDX Energy Dispersive X-ray Spectroscopy
XPS X-ray Photoelectron Spectroscopy
CCD Charged Coupled Device
UV Ultra-Violet
θ, θY Young’s Contact Angle
θ* Apparent Contact Angle
θc Critical Contact Angle between Wenzel
and Cassie States
φs Solid Fraction at the three phase
contact line
List of symbols and abbreviations
γ Surface Tension
WCA Water Contact Angle
SA Sliding Angle
HF Hydrofluoric Acid
RF-PECVD Radio Frequency Plasma Enhanced
Chemical Vapor Deposition
PMMA Poly(methyl methacrylate)
RIE Reactive Ion Etching
SMP Shape Memory Polymer
PDMS Polydimethylsiloxane
AR Aspect Ratio
PTFE Poly(tetrafluoroethylene)
FAS Fluoroalkylsilane
SLIPS Slippery Liquid Infused Porous
Surfaces
PS Polystyrene
PP Polypropylene
NP Nanoparticle
AATCC American Association of Textile
Chemists and Colorists

Chapter 1
1
Chapter 1. Introduction
1.1 Research background
Superhydrophobic surface (SHS) is referred to the surface of solids which has a
water contact angle larger than 150° and sliding angle smaller than 5°.[1] The
SHS exists both in nature and can be engineered artificially. Intriguingly, a large
number of species, including insects, plants and birds, possess the SHS
characteristics, as the surface of their shells, leaves and feathers clearly exhibits
high functional performance of water-repellent and stimuli-responsive
microfluidic dynamics.[2] Gaining insights from the great nature, the scientific
community has devoted to the development of SHS for several decades, inspiring
by the extreme efficiency, durability and sustainability of the master-pieces of
natural SHS. Since the first reveal of "lotus effect" by Barthlott et al. in 1992,
extensive research effort has been contributed to the understanding of the internal
mechanism of this phenomenon and transfer the essential knowledge into real
artificial SHS.[3] Inherited from natural SHS, the artificial SHS also possess the
characteristics of high water contact angle and low sliding angle, demonstrating
both low adhesion to water droplets and high repellency to flowing water streams.
Based on the "lotus effect", the artificial SHS can be realized by sufficing two
dominating factors: the formation of micro- and nano-scale dual roughness
surface texture and low surface energy coating.[4] To speak further, the dual

Chapter 1
2
roughness factor minimizes the contact between solid and liquid as the cohesion
force between the water molecules overcomes the adhesion force between water
and solid surface; while the low surface energy coating maximizes the contact
angle between the solid and water, which synergistically induces the super
water-repellent property.
Started from the SHS that impedes the contact of static water droplets, the
development of artificial SHS experiences tremendous growth in recent decades.
Multivariant processing techniques, such as lithography, etching and 3D printing,
have been utilized to fabricate artificial SHS; and the interdisciplinary
manipulation of nanotechnology in constructing the hierarchical surface
micro-textures significantly enhances the functional performance of the artificial
SHS to unprecedented level.[5-10] Being moved from experimental to practical,
microscopic to macroscopic, and static to dynamic, the state-of-the-art artificial
SHS is now possessing the new characteristics of: (i) extremely anti-wetting
property even to liquids with substantially low surface tension (i.e. fluorine
liquids); (ii) stimuli-responsive and tunable wetting pattern on the surface regions;
(iii) multifunctionality and high durability suited for the real-field application.
In order to obtain the targeted functions to fulfill the application requirement,
function-led design is necessary for realizing the form and structure of SHS in a
cost-effective manner.[11-13] Based on the end-user requirements, the targeted

Chapter 1
3
functions of SHS are properly identified and selected, which are subsequently
realized by the integration of different materials and structures. High-end
applications may require advanced engineering over the forms and structures of
the materials, where the nanotechnology and advanced fabrication techniques can
find their places. Given that the exact knowledge regarding the chemical,
physical, and mechanical properties of the materials is acquired, one can easily
fit the materials or their combinations to the functional requirements of the end
product, and also predicts their potential performance. On the other hand, by
designing the microscopic and macroscopic structures of the device, different
material components can be extensively integrated, where high intensity of
interfacial area is formed. And enhanced functional performance can be
anticipated from these synergistically interfacial interactions at the versatile
material interfaces.
Along with the innovations in the fields of information technology and the rise of
interdisciplinary research, new opportunities and challenges are emerging for the
science community which require the discovery of new knowledge and solutions.
A broad perspective from engineering to commercialization is necessary to fulfill
the advanced missions in science and technology in the coming era of open
science and boost the technology transfer. Therefore, the function-led design of
multifunctional stimuli-responsive SHS is of both present and future significance
as conceptual methodology to inspire the related research.

Chapter 1
4
1.2 Objectives
(i) Design and development of a stimuli-responsive multifunctional SHS which is
capable of tuning the water spreading and adhesion on its surface, as well as
switches between superhydrophilicity and superhydrophobicity.
(ii) Understand the mechanisms involved in the interfacial interactions and their
influences on the surface wettability.
(iii) Develop a smart textile coating based on the stimuli-responsive SHS,
manipulate the microfluidic behavior within the fabric matrix and evaluate the
functional performance of the coating in various novel applications.
(iv) Apply the function-led design criterion in the research process of the SHS,
compared the research output between the non-function-led design and
function-led design, and generate informative suggestions for conducting the
research in the function-led process.
1.3 Framework of the thesis
The thesis comprehensively demonstrates the engineering approaches used to
obtain the full-spectrum wettability tuning on cotton fabric and the underlying
mechanisms involved were also dedicatedly discussed.

Chapter 1
5
Chapter 1 introduces the basic concept of superhydrophobic surface and its brief
research history.
Chapter 2 reviews the theories developed for superhydrophobic surface and the
core concepts involved in the design of superhydrophobic surface.
State-of-the-art research on the superhydrophobic surface and new innovative
concepts are also highlighted.
Chapter 3 describes the synthesis approaches used to fabricate the advanced
nanostructured materials and the research methodologies involved in the
characterization of the surface properties of the as-obtained nanomaterials.
Chapter 4 depicts the fabrication process of the hydrophobic graphene coated
cotton fabric (G-fabric) and the related characterizations. The tuning of surface
wettability of G-fabric is also demonstrated.
Chapter 5 demonstrates the fabrication process of the superhydrophobic cotton
fabric with hierarchically nanostructured graphene/titania surface coating
(GT-fabric). The surface morphology, chemical composition and full-spectrum
tuning of surface wettability on GT-fabric are also characterized and described.

Chapter 1
6
Chapter 6 presents the advanced applications of GT-fabric as a result of its
full-spectrum tunable surface wettability. Multiple novel functions with practical
significance, such as directional water transport, microfluid manipulation and
oil-water separation, are realized using the GT-fabric.
Chapter 7 depicts the mechanism study on the superhydrophilic conversion of
TiO2 surface during ultra-violet (UV) radiation. New perspectives on the
conversion mechanism are provided by investigating the interfacial interaction
between graphene and TiO2, and the structural reconfiguration on TiO2 from the
atomic scale to macro scale.
Chapter 8 summarizes the research and findings in the thesis and provides
insights into the function-led design of superhydrophobic surface. Suggestions
for the future developmental trends of superhydrophobic surface are also
provided.

Chapter 2
7
Chapter 2. Literature review
2.1 The Young's equation and superhydrophobic state
In 1805, Sir Thomas Young firstly published the discovery on the theory of the
solid-liquid-gas interfaces, which was eventually contained in an apparently
simple equation: γsg=γsl+γlgcosθ, namely the Young’s equation.[14] The Young's
equation defines the equilibrium between the surface tensions acting on the
three-phase contact point of solid, liquid and gas interfaces. The symbol γsg
represents the surface tension of the solid-gas interface, while γsl and γlg represent
the surface tension of solid-liquid and liquid-gas interfaces, respectively. Given a
small volume of droplet (gravity is negligible) sitting on an ideally flat surface
(continuous solid-liquid interface), the contact angle θ between the solid surface
and the liquid droplet is given by:
lg
cosγγγ
θ slsg −= (1)
Figure 1 Schematic illustrations of Young’s equation (a) and the hydrophobic
states (b, c). The blue meniscus represents the water droplet while the flat solid
line and solid line with pillars represent the smooth and rough surfaces,
respectively.
Chapter 2
8
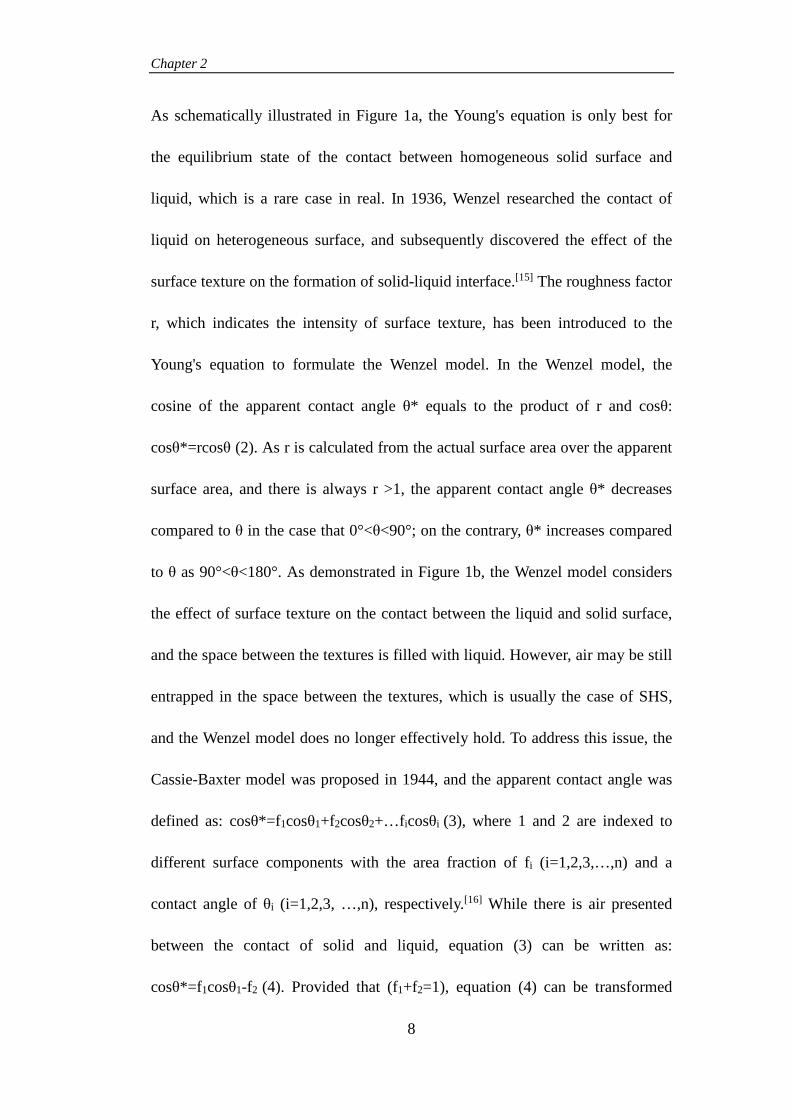
As schematically illustrated in Figure 1a, the Young's equation is only best for
the equilibrium state of the contact between homogeneous solid surface and
liquid, which is a rare case in real. In 1936, Wenzel researched the contact of
liquid on heterogeneous surface, and subsequently discovered the effect of the
surface texture on the formation of solid-liquid interface.[15] The roughness factor
r, which indicates the intensity of surface texture, has been introduced to the
Young's equation to formulate the Wenzel model. In the Wenzel model, the
cosine of the apparent contact angle θ* equals to the product of r and cosθ:
cosθ*=rcosθ (2). As r is calculated from the actual surface area over the apparent
surface area, and there is always r >1, the apparent contact angle θ* decreases
compared to θ in the case that 0°<θ<90°; on the contrary, θ* increases compared
to θ as 90°<θ<180°. As demonstrated in Figure 1b, the Wenzel model considers
the effect of surface texture on the contact between the liquid and solid surface,
and the space between the textures is filled with liquid. However, air may be still
entrapped in the space between the textures, which is usually the case of SHS,
and the Wenzel model does no longer effectively hold. To address this issue, the
Cassie-Baxter model was proposed in 1944, and the apparent contact angle was
defined as: cosθ*=f1cosθ1+f2cosθ2+…ficosθi (3), where 1 and 2 are indexed to
different surface components with the area fraction of fi (i=1,2,3,…,n) and a
contact angle of θi (i=1,2,3, …,n), respectively.[16] While there is air presented
between the contact of solid and liquid, equation (3) can be written as:
cosθ*=f1cosθ1-f2 (4). Provided that (f1+f2=1), equation (4) can be transformed

Chapter 2
9
into: cosθ*=-1+φs(1+cosθ) (5), while φs represents the solid fraction at the
solid-liquid interface.[17] As in the hydrophobic region, the ranges of equation (2)
and (5) overlap, which means both of them should be hold in the region from
moderate hydrophobicity to superhydrophobicity.[18] By equating (2) and (5), the
threshold θc for this region can be obtained as:
s
sc r φ
φθ−−
=1cos (6)
Figure 2 Diagram shows the mathematical regions of Cassie and Wenzel states.
For 90° < θ < θc, the apparent contact angle θ* is given by the Wenzel equation.
However, for θ > θc, θ* is given by the Cassie-Baxter equation. It is also noticed
that the Cassie state can still exist as θ < θc in certain circumstances. This
metastable region is represented by the dot line.[17]
Therefore the Wenzel model still holds for 90°<θ*<θc, and the Cassie-Baxter
model is also valid in the region of 90°<θ<180°, ideally from the point of
cosθ*=φs-1.[19] Figure 2 summarizes the relationship between the Wenzel and
Cassie-Baxter models and their effective regions, presumably in the hydrophobic

Chapter 2
10
state (90°<θ*<180°).
Even though their theoretical implications are different, the apparent contact
angles between the Wenzel and Cassie states differ slightly.[20] The essential
dissimilarity lies in the adhesion of liquid, as the hysteresis is significantly
smaller in the Cassie state as compared to the Wenzel state, which can reach a
factor of 20.[21] Being both hydrophobic states, a transition can be induced from
the Cassie to the Wenzel state, by using proper external pressure.[22] The process
of the transition is accomplished by replacing the air-liquid interface with the
solid-liquid interface, as the entrapped air is dissipated from the textured surface.
The work required for the process is normally done by applying an external
pressure or by the gravity of the liquid.
Through the research of the hydrophobic states, the underlying mechanisms
involved in the interfacial solid-liquid interactions can be progressively unfolded,
which can not only benefit the prediction of surface hydrophobicity by simple
parameters measured from the static solid-liquid contact, but also promote the
precise engineering control over the nature of the solid-liquid interactions, e.g.
sliding, adhesion and spreading.
2.2 Development in the forms and functions of superhydrophobic
surface

Chapter 2
11
2.2.1 “Lotus effect” and dual roughness
The developments of SHS towards real-field applications started at the
introduction of "lotus effect" in 1992. W. Barthlott et al. elaborately studied the
surface morphology of the hydrophobic plants using scanning electron
microscope (SEM), and subsequently proposed the self-cleaning "lotus effect"
derived from the superhydrophobicity.[23] Based on the SEM characterization of
the lotus surface, a distinct hierarchical structure consisting of micro-papillae and
wax tubules is revealed.[24] On the upper epidermis of lotus leaf, the
micro-papillae can be clearly observed, while a dense layer of wax tubules is
coated on the surface of and between the papillae, as shown in Figure 3. The wax
tubules are majorly composed of C29-dols in the case of lotus, which cover the
surface area of the epidermis with high porosity as a result of their nanoscale
dimensions and random orientation. At the same time, the micro-papillae provide
solid supports to the water droplet which then favors the formation of Cassie
state. This distinct structural configuration of order micro-papillae and low
surface energy nano-scale wax coating thus constitutes the "dual roughness" of
lotus leaf, resulting in outstanding water-repellent and self-cleaning properties.

Chapter 2
12
Figure 3 (a) Photograph of a lotus leaf. (b) SEM image of the lotus leaf surface
showing the hierarchical structures of micro-papillae, wax cluster coating and
wax tubules. (c) Magnified view of the wax tubules showing the
nano-dimensional feature. (d) SEM of the lotus leaf surface after wax removal,
where the stomata are clearly observed. (e) SEM of the underside leaf surface
after wax removal, which is composed of convex cells without stomata.[24]
2.2.2 Fabrication of SHS on flat solid surface: chemical etching
Foundation on the concept of "dual roughness" inspired by the "lotus effect",
various flat surfaces are engineered and transformed into high performance SHS,
including metal, plastic, ceramic, silicon, carbon, and glass.[25-30] In order to
create the desired roughness on the flat surface, the chemical etching was found
to be an effective method to render the surfaces rough with both simplicity and
processability.[31] In a typical process, flat metal surfaces, i.e. steel & copper, can

Chapter 2
13
be turned into SHS by simple dipping-drying-coating processes; the chemical
etching, as the essential step to generate surface roughness, was done by
immersing the metal pieces into the etching solution (40 wt% HF/30 wt% H2O2,
v/v=1:1), and subsequently dried the etched piece in elevated temperature.[32]
Low surface energy coating was then applied by dipping the etched metal pieces
in the hydrolyzed fluorosilane solution [CF3(CF2)7CH2CH2Si(OCH3)3], which
were eventually dried at 140°C to obtain the SHS. The resulting SHS on either
steel or copper alloy showed remarkable superhydrophobicity as water droplets
of relatively large sizes can stand still with high contact angles, as shown in
Figure 4. The high superhydrophobicity of the as-obtained SHS was attributed to
the hierarchically rough surface structures formed by the chemical etching and
silane coating processes, which can be observed as the disoriented micro-textures
with nanoscale sub-structures, as shown in Figure 5.
Figure 4 (a) Image showing water droplets with different sizes resting on the
superhydrophobic steel surface prepared by chemical etching. (b) Magnified
view of a water droplet resting on the steel surface with a contact angle of

Chapter 2
14
161°±1°. (c) Image showing water droplets with different sizes on the
superhydrophobic copper alloy prepared by chemical etching. (d) Image of a
water droplet on the copper alloy surface with a contact angle of 158°±1°.[32]
Figure 5 SEM (a) and the sequentially magnified SEM images (b, c, d) of the
chemical etched steel surface coated with fluoroalkylsilane.[32]
2.2.3 Fabrication of SHS on flat solid surface: physical etching
Besides chemical etching, "dual roughness" can also be generated on flat surface
through physical etching processes, such as plasma etching, laser ablation, and
micromachining.[33-35] By using radio frequency plasma enhanced chemical
vapor deposition (RF-PECVD), SHS can be obtained on the flat poly(methyl
methacrylate) (PMMA) surface.[36] In the first step, PMMA was etched by a glow
discharge of CF4 gas to create the surface texture of micro-roughness. After a
short hydrolysis process in water to remove the additional solid fraction, the
as-obtained PMMA was subsequently coated with the low surface energy
organosiloxane to achieve superhydrophobicity, as depicted in Figure 6. The
Chapter 2
15
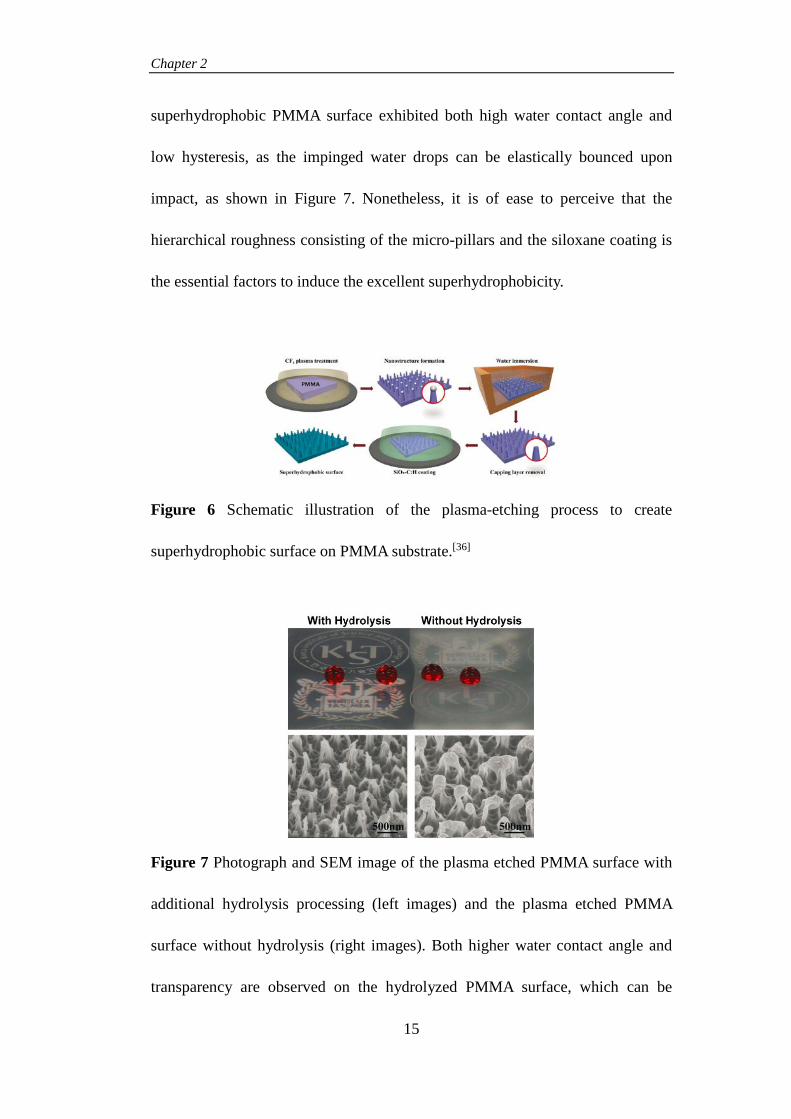
superhydrophobic PMMA surface exhibited both high water contact angle and
low hysteresis, as the impinged water drops can be elastically bounced upon
impact, as shown in Figure 7. Nonetheless, it is of ease to perceive that the
hierarchical roughness consisting of the micro-pillars and the siloxane coating is
the essential factors to induce the excellent superhydrophobicity.
Figure 6 Schematic illustration of the plasma-etching process to create
superhydrophobic surface on PMMA substrate.[36]
Figure 7 Photograph and SEM image of the plasma etched PMMA surface with
additional hydrolysis processing (left images) and the plasma etched PMMA
surface without hydrolysis (right images). Both higher water contact angle and
transparency are observed on the hydrolyzed PMMA surface, which can be

Chapter 2
16
attributed to the enhanced surface roughness after hydrolysis.[36]
2.2.4 Fabrication of ordered SHS on flat solid surface: photolithography
The creation of "dual roughness" by chemical etching is effective in obtaining
SHS on flat surface, which is also suitable for large scale processing. However,
the chemical etching method also associates with intrinsic drawbacks as only
randomly oriented surface texture can be formed, and the subtle morphology of
the texture is created without precise control. These drawbacks thus reduce the
potential of optimization for the SHS obtained by chemical etching. The SHS
with heterogeneous surface texture may also exhibit lower resistance to drop
impact, as the region with low degree of roughness cannot provide substantial air
pockets to support the Cassie state. Aiming to obtain optimized
superhydrophobic property on flat surface, the technique of photolithography has
been adopted to fabricate the SHS with ordered arrays of micropillars & posts.[37]
Step-wise processes are developed for photolithography so that fine control over
the microstructures can be achieved. During the photolithography process,
sequential steps including cleaning of the wafer, coating of the barrier layer,
coating of photoresist, soft baking, mask alignment, UV exposure, and hard
baking are involved, as shown in Figure 8.[38] On the other hand, different
post-lithography processes, such as etching, lift-off, and molding, can be applied
to the as-obtained molds to sculpture the desired patterns. Upon using different
combination of the processes, such as alternating the photoresist, changing the

Chapter 2
17
mask alignment, and applying different post-lithography techniques, multivariant
fine morphologies on the micropost array can be generated, which exhibit
intriguing superhydrophobic properties such as low hysteresis, super-repellent,
and pressure resistance.[39-41] By combining the photolithography with the
reactive ion etching (RIE) technique, high performance SHS can be created on Si
wafers.[42] The novel SHS possesses unique surface texture, which is consisting
of the microhoodoo arrays with defined geometric parameters, as shown in
Figure 9. Special reentrant structure is designed for the individual microhoodoo
which can induce substantial vertical components of surface tension to support
the Cassie drops. For this order surface texture, enhanced liquid repellent
property was clearly observed as even low surface energy hydrocarbons (e.g.
heptane, methanol) can form Cassie drops on it, as shown in Figure 10.[43]
Figure 8 Schematic illustration of a typical photolithography process.[38]

Chapter 2
18
Figure 9 (A, B) Schematics showing the formation of a composite interface on
the surface with reentrant microtextures, including the nanofiber surface (A) and
microhoodoo surface (B). The blue color indicates the wetted area while the red
color indicates the non-wetted area, corresponding to the case that the surface is
contacting with a liquid that has an equilibrium contact angle θ < 90°. (C, D)
SEM images of the microhoodoo surfaces with square (C) and circular (D) flat
caps, obtained at a tilting angle of 30°.[42]
Figure 10 (A) The advancing and receding contact angles of liquids with
different surface tensions on the silanized microhoodoo surface (reentrant
structure). Inset shows the heptane (red), methanol (green) and water (blue)
droplets resting on the microhoodoo surface. (B) Sequential frames showing the
bouncing of a hexadecane droplet on the silanized microhoodoo surface.[43]
2.2.5 Fabrication of ordered SHS on flat solid surface: replica molding &

Chapter 2
19
chemical vapor deposition
Besides photolithography, other cost-effective techniques can also be utilized to
engineer order micro-textures on flat surface and achieve superhydrophobicity,
such as replica-molding and chemical vapor deposition.[44-45] Polymer-based SHS
with order micropillar surface texture can be obtained using the replica-molding
process. Compared with photolithography, the replica-molding possesses have
the advantages such as simplified procedures and deformable surface textures.
Using a shape memory polymer (SMP) as the replicating resin, the SMP-based
SHS can be produced from the polydimethylsiloxane (PDMS) mold.[46]
Micropillar arrays with defined pillar spacing, height and pillar diameter can be
readily fabricated on the SMP surface. The fabrication process is simple and
involved only pouring the SMP precursors in the PDMS mold, curing, and then
peeling off (Figure 11). The as-obtained SMP with micropillar arrays can
effectively maintain Cassie drops with high water contact angle of 155.6° and
low sliding angle of 7.5° (for 10 μL water droplet).[47] The shape memory
property of the SMP also enables controlling of the hydrophobic state on its
surface. The original Cassie state can be transformed into Wenzel state as the
surface texture of the SMP was deformed by a shear force, and the micropillars
were bended according to the force direction. The surface can be subsequently
restored to the Cassie state by heating to release the strain, and the micropillars
also returned to their original shapes, as shown in Figure 12. This novel
reversible process, however, can realized the fine control over pinning and
Chapter 2
20
de-pinning of droplets on SHS, which is suited for the microfluidic application.
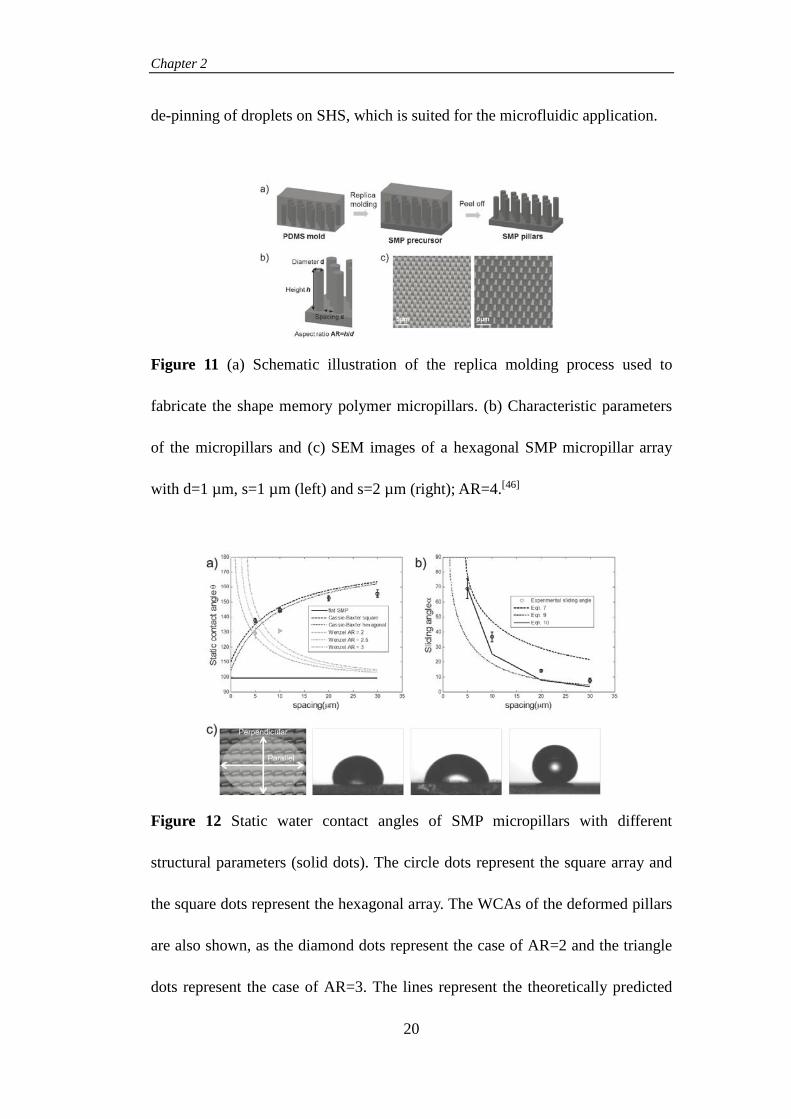
Figure 11 (a) Schematic illustration of the replica molding process used to
fabricate the shape memory polymer micropillars. (b) Characteristic parameters
of the micropillars and (c) SEM images of a hexagonal SMP micropillar array
with d=1 µm, s=1 µm (left) and s=2 µm (right); AR=4.[46]
Figure 12 Static water contact angles of SMP micropillars with different
structural parameters (solid dots). The circle dots represent the square array and
the square dots represent the hexagonal array. The WCAs of the deformed pillars
are also shown, as the diamond dots represent the case of AR=2 and the triangle
dots represent the case of AR=3. The lines represent the theoretically predicted

Chapter 2
21
values by Cassie and Wenzel model. (b) The experimental sliding angles (circles)
vs. theoretical predictions based on different equations on a SMP micropillar
surface. (c) Demonstration of the anisotropic wetting on the deformed SMP
micropillar surface. From left to right: Top-view of the deformed SMP pillar
array with the white arrows indicating the viewing direction of the droplet; the
perpendicular view of the droplet; the parallel view of the droplet; and the
droplet on the un-deformed SMP pillars, respectively.[47]
Figure 13 Schematic illustration of a plasma enhanced chemical vapor
deposition (PECVD) set-up.[64]
Order nanostructured arrays can also be produced on flat surfaces using chemical
vapor deposition (CVD). Different from photolithography, which prints the
pattern on the substrate using external device, and categorized as the "Top-down"
approach, CVD directly grows the nanostructures on the substrate surface, as the
chemical vapors of the precursors interact with the catalyst particles
pre-impregnated substrate, and continuously deposit on the surface of the

Chapter 2
22
catalysts via either vapor-liquid solid (VLS) or vapor-solid (VS)
mechanisms.[48-50] In this regard, CVD is most recognized as the "Bottom-up"
approach. Compared with photolithography and replicate-molding, CVD is more
versatile in selecting the precursor and substrate. Precursors such as metals,
oxides, sulfides, nitrides, phosphides, carbides,[51-56] and substrates such as
silicon, metal, polymer, and electrospun fiber mats,[57-60] are suitable for the CVD
processing. To produce SHS, order patterns of nanostructures are firstly grown
on the desired substrate by CVD, which are subsequently coated with low
surface energy molecules, i.e. fluoroalkylsilane, to achieve superhydrophobicity.
Morphology control over the as-obtained nanostructures can be implemented by
changing the CVD time, precursors, and catalyst crystallinity.[61-63] Due to the
high density of nanostructures grown by CVD, which can be depicted as "Forest",
robust superhydrophobicity can be readily achieved, as a result of the relatively
homogeneous air-solid interface with low solid fraction formed atop the order
nanostructured “forest”. A schematic illustration of the CVD process is shown in
Figure 13.[64] For example, hexagonally patterned zinc oxide (ZnO) nanorod
forest can be produced by the CVD of ZnO powder and graphite powder.[65]
Large area of hexagonal ZnO nanorod forest was grown on the sapphire substrate,
following the hexagonal pattern of the pre-deposited gold particles, as shown in
Figure 14. The lengths of the nanorods can be changed from hundreds of
nanometers to a few microns by controlling the CVD time. Utilizing the
versatility of CVD process, fascinating ZnO nanostructures with unique

Chapter 2
23
superhydrophobic property can be produced. Novel sea urchin-like
nanostructured ZnO was produced on a porous anodic alumina (PAA) substrate
by CVD.[66] Firstly alumina nanowire pyramids were grown on the PAA substrate
by electrodeposition, and the ZnO nanowires were then nucleated and grown
radially on top of them, as shown in Figure 15. The as-obtained sea urchin-like
ZnO nanowires exhibited both high water contact angle (151°) and high water
adhesion, as shown in Figure 16. It thus indicates water droplets can form the
so-called "partial impregnated Cassie state" on the sea urchin-like ZnO surface,
which is regarded as one of the metastable intermediate state between the Cassie
and Wenzel states.[67]
Figure 14 Order hexagonal ZnO nanorod array produced by CVD. (a, b)
Top-view and side view (tilting angle=30°) SEM images of the ZnO nanorod
array grown on the honeycomb catalyst pattern, respectively. (c, d) Magnified
top-view and side-view SEM images showing the hexagonal arrangement of the

Chapter 2
24
nanorod array. (e) The hexagonal order is maintained at the edge of the catalyst
pre-impregnated sapphire surface.[65]
Figure 15 (a, b) SEM images of the porous anodic alumina (PAA) film (a) and
the alumina nanowire pyramids (b) grown on its surface by chemical etching. (c)
SEM image showing the ZnO nuclei on top of the alumina nanowire pyramid. (d,
e) SEM and magnified SEM images of the lotus-leaf like ZnO microstructures
showing both the micro- and nano-dimension roughness. (f) TEM image of a
ZnO nanorod in the lotus-leaf like structures. Inset shows the corresponding
SAED pattern of the nanorods.[66]
Figure 16 Photographs showing a water droplet resting on the lotus-leaf like
ZnO microstructures with a tilting angle of 0°, 90° and 180°. High water

Chapter 2
25
adhesion is demonstrated by the lotus-leaf like ZnO surface.[66]
Besides ZnO, carbon nanotubes (CNTs) are also widely-used for the generation
of SHS via CVD.[68] Different from ZnO, which spontaneously obtains
superhydrophobic characteristics on the as-formed nanostructures, the CNT
forests generally reach superhydrophobicity by the additional low surface energy
coating.[69] Excellent water repellency with high water contact angle and low
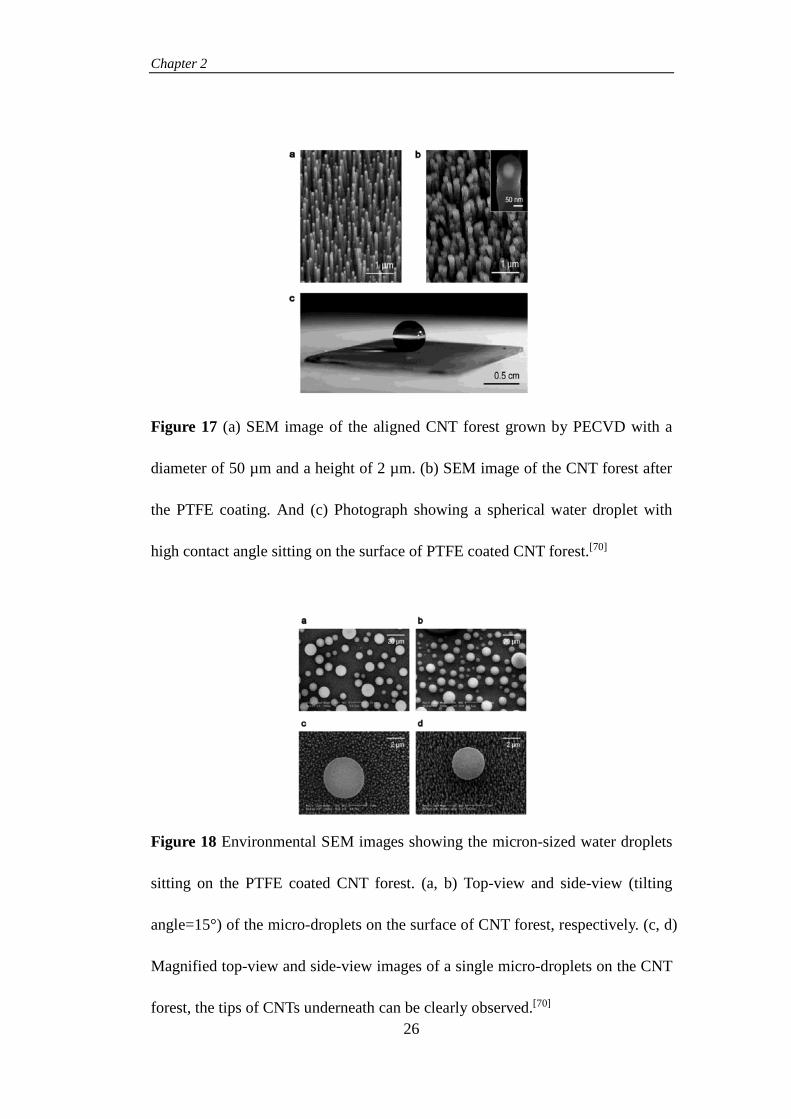
hysteresis thus can be achieved simultaneously. In a typical process, CNT forest
was produced on the silicon substrate impregnated with Ni catalyst using plasma
enhanced CVD.[70] Control over the CNT morphology can also be implemented
by changing the CVD parameters and the catalyst layer thickness. To achieve the
superhydrophobicity, a poly(tetrafluoroethylene) (PTFE) coating was
subsequently applied onto the CNT forest using hot-filament CVD. Both high
contact angle and low hysteresis were observed on the CNT forest after the
coating process, as shown in Figure 17. And it was also demonstrated that the
coating was effective in stabilizing the morphology of CNT during water
evaporation. Intriguingly, the PTFE coated CNT forest can remain
superhydrophobic even to the tiny water droplets down to micrometer size,
which demonstrated robust hydrophobic property to water condensation, as
shown in Figure 18. This novel phenomenon thus unmasks the importance of the
nanoscale size and density of order microstructures in achieving
superhydrophobicity to the molecular level.
Chapter 2
26
Figure 17 (a) SEM image of the aligned CNT forest grown by PECVD with a
diameter of 50 µm and a height of 2 µm. (b) SEM image of the CNT forest after
the PTFE coating. And (c) Photograph showing a spherical water droplet with
high contact angle sitting on the surface of PTFE coated CNT forest.[70]
Figure 18 Environmental SEM images showing the micron-sized water droplets
sitting on the PTFE coated CNT forest. (a, b) Top-view and side-view (tilting
angle=15°) of the micro-droplets on the surface of CNT forest, respectively. (c, d)
Magnified top-view and side-view images of a single micro-droplets on the CNT
forest, the tips of CNTs underneath can be clearly observed.[70]

Chapter 2
27
2.2.6 Fabrication of SHS on non-flat solid surface: low surface energy
coating
To create "dual roughness" and achieve superhydrophobicity, "Top down" or
"Bottom up" approaches are in general required to fabricate the micro-textures on
flat surfaces. In this case, artificial control can be implemented on the surface
texture based on the precise microfabrication techniques. However, for the
intrinsically non-flat surface, direct low surface energy organic coating can be
applied to reach superhydrophobicity. Generally speaking, non-flat surfaces of
engineering importance, i.e. textiles, papers, foams, are having intrinsic
microscale surface textures which are induced during the manufacturing
processes.[71-73] Taking advantages of this built-in roughness, high performance
SHS can be realized on these engineering surfaces cost-effectively. Using the
fluoroalkyl functionalized water-born siloxane (FAS) as the coating agent,
plain-weave cotton fabric can be transformed from hydrophilic to
superhydrophobic after a simple pad-dry-cure process.[74] Relatively high water
contact angle (150°) and low sliding angle (15°) were observed for the FAS
coated cotton. However, after applying the plasma pretreatment to the fabric
surface before the FAS coating, the superhydrophobicity of the fabric can be
further enhanced with a WCA of 154° and SA of 7°. Very good self-cleaning
property was observed on the FAS coated and plasma pretreated cotton fabric
[CO(PT)-FAS], as demonstrated in Figure 19. The FAS coating also showed

Chapter 2
28
good wash fastness up to ten standard washing cycles, indicating by the
preservation of high contact angles on the fabric surface (Figure 20). On the
surface of the textile fabric, the engineered networks of fibers may form the
intrinsic roughness consisting of the surface curvatures existed between the fibers
and yarns.
Figure 19 The self-cleaning property of the CO(PT)-FAS sample surface is
demonstrated by rolling a water droplet through the area contaminated by solid
particles.[74]
Figure 20 The contact angle vs. washing cycle for water and n-hexadecane on
the CO(PT)-FAS and CO(UN)-FAS (without plasma treatment) surface. The
open circle and open square represent water droplets on CO(UN)-FAS and
CO(PT)-FAS, respectively. The filled circle and filled square represent
hexadecane droplets on CO(UN)-FAS and CO(PT)-FAS.[74]

Chapter 2
29
Similarly, roughness can also be created on the paper surface during
manufacturing, as the short paper fibers entangled and stacked to form the fiber
mat. In this regard, the paper surface can also be transformed from hydrophilic to
superhydrophobic using simple low surface energy coating. By a facile
vapor-phase coating process, Whatman chromatography paper was made into
superhydrophobic in a fast fabrication process.[75] In this case, the paper reacted
with the vapors of fluoroalkyltrichlorosilane, which subsequently formed a low
surface energy coating on its surface. The vapor phase silanization generates
notable superhydrophobicity with WCA as high as 160° and hysteresis ranging
from 7° to 20° (Figure 21). As a result of the low surface energy organosilane
coating, the silanized paper also exhibits substantial oil-repellent property, which
makes it impede the wetting of both water and oil, and reaches the so-called
omniphobicity.
Figure 21 (a) Photographs showing a water droplet resting on the paper silanized

Chapter 2
30
by fluoroalkyltrichlorosilanes with different alkyl chain lengths. (b) Plots
showing the correlation of the static water contact angle and contact angle
hysteresis to different silanization reagents. Three types of paper with different
roughness and porosity are used as the substrate for silanization, including blot
paper, Whatman #1 and Whatman #50 paper. (c) SEM images showing the
different surface textures on these three types of paper.[75]
Besides fabrics and papers, SHS can also be prepared on the foam surface with
ease. Foams consisting of different materials, such as metals, polymers, and
carbons, have been successfully fabricated into high performance SHS as a result
of their porous microtextures which provide substantial air fraction to support the
Cassie state.[76-78] Upon using a simple dip-coating process, SHS can be realized
on the copper foam, and the ethanol solution of n-tetradecanoic acid was used as
the coating agent.[79] This process is also versatile as the copper foam with
different pore density can be transformed into superhydrophobicity (Figure 22).
By combining both the characteristics of SHS and foam, the superhydrophobic
Cu foam becomes "super-floatable" on water surface, which can be utilized in the
load conveyance in water (Figure 23).

Chapter 2
31
Figure 22 (a, b) Optical images of a copper foam with 40 pores per inch (PPI)
before (a) and after (b) the superhydrophobic coating by one-step solution
immersion. Insets in (b) show the as-formed dual roughness structure on the
foam surface and a water droplet resting on such a surface with high contact
angle. (c) Photograph showing that the superhydrophobic foam can float on the
surface of water with weight loading, assembling the water strider. (d-g) Optical
images of the as-prepared superhydrophobic foams with different PPI (10-80).[79]
Figure 23 (a) Analysis of the floating performance of a 40 PPI superhydrophobic
foam in a two-stage approach: Partial immersion (stage 1) and completed
immersion (stage 2). (b) A tetrakaidecahedron-like cell with eight regular
hexagons and six square faces is used to model the structural unit of the foam.[79]
2.3 New concept based advanced superhydrophobic surface with

Chapter 2
32
substantial robustness
Foundation on the "dual roughness" concept, different materials and processes
have been combined to obtain high performance SHS with low hysteresis and
high WCA. With increasing demands over material and structural functions, the
industries urgently need new SHS with enhanced hydrophobic properties,
improved cost-effectiveness, and environmental friendliness. To achieve these
goals, new concepts of SHS have been introduced, accompanied with the
innovative processing techniques to bring about the SHS of present significances.
Different from the solid low surface energy coating used in the fabrication of
SHS, a new concept of slippery liquid infused porous surfaces (SLIPS) have
been proposed.[80] In this case, the porous surfaces, i.e. silanized epoxy nanopost
arrays & Teflon nanofiber networks, were lubricated with the low surface energy
liquids, such as 3M Fluorinert FC-70 (γ=17.1 mN m-1). As the porous surfaces
were completely wetted by the lubricating liquid, a robust and defect-free
lubricant liquid surface could be formed on the porous surface. Unique
omniphobic property was observed for the SLIPS as both water and organic
solvent can be effectively prevented from wetting the underlying solid surface
(Figure 24). For SLIPS to demonstrate its full potential, a surface silanization
treatment to lower the surface energy is required. As shown in Figure 24b, the
dyed pentane droplet replaced the lubricating film on the non-silanized epoxy
within 10 s while remained stable on the silanized epoxy. More importantly, the

Chapter 2
33
SLIPS exhibited extremely high pressure stability which was equivalent to a
hydrostatic pressure around 7 kilometers. This is probably the highest reported
value for SHS since the liquid-air-solid interface of normal solid hydrophobic
surfaces cannot be stable under such a high pressure. Due to the mobility of the
lubricants at the solid-liquid interface, the SLIPS is also self-healable, while
value-added multifunctionalities, including anti-staining, anti-icing,
anti-adhesion, and optical transparency, are also demonstrated.
Figure 24 (a) Schematic illustration of the fabrication process of SLIPS. A low
surface energy liquid is imbibed into the functionalized porous or textured solid,
which forms a physically smooth and chemically homogeneous lubricating film
on the substrate surface. (b) Demonstration of the difference in the lubricating
film stability for the silanized and non-silanized textured epoxy substrates. (c)
SEM images of two representative porous/textured solid substrates, including the
epoxy-based ordered nanopost array and the Teflon-based random nanofiber
network. (d) Photographs demonstrating the sliding of a low surface energy
liquid (hexane) on the SLIPS with a tilt angle as small as 3.0°.[80]

Chapter 2
34
Figure 25 (a, b) Photographs showing the movement of a crude oil drop (a) and a
blood drop (b) on a substrate with integrated SLIPS, superhydrophobic, and
hydrophobic regions. The SLIPS surpassed the other two surfaces in terms of the
drop flow speed and anti-staining property. (c) Comparison between SLIPS and
epoxy-based superhydrophobic surface on anti-icing. The ice particle swiftly slid
off SLIPS while pinned on the epoxy-based SHS. (d) Sequential frames showing
the sliding of a carpenter ant on the SLIPS upon tilting.[80]
The concept of SLIPS is definitely innovative and unprecedented super-repellent
performance can be achieved by the formation of the highly mobile lubricant
layer on the porous solid surface. However, it may still require the solid substrate
to possess substantially low surface energy in order to maintain a stable lubricant
layer without the replacement of other impinging liquids. By precisely
manipulating the structures of surface texture, innovative super-repellent surface
can even be obtained on the intrinsically hydrophilic substrate, e.g. silicon

Chapter 2
35
dioxide (SiO2). Using a reactive ion etching (RIE) process, doubly reentrant
structure was fabricated on SiO2 surface.[81] Different from the reentrant structure,
the doubly reentrant structure consisting of microposts with vertical
nano-overhangs as side walls on the post top. The structural parameters, such as
the post-top diameter (D), centre-to-centre distance (P), the nano-overhang
thickness (t) and length (δ), are engineered precisely to obtain the minimum solid
fraction fs and the maximum liquid suspension ability (Figure 26). It was
speculated that the doubly reentrant structure can suspend liquids even with a
Young's contact angle θY≈0°, as substantial suspension force can be provided by
the vertical components of the surface tension acted on the solid-liquid interface,
which is generated by the unique nano-overhang structure. At the mean time, the
simple micropost structure and the reentrant structure can only suspend liquids
with θY≈120° and θY≈30°, respectively (Figure 27). As a result, the doubly
reentrant SiO2 micropost arrays showed excellent super-repellent property, which
can even resist the wetting of low surface energy liquids including 3M FC-72.
On the other hand, as the super-repellency is solely based on the physical
structure, and there is no need of polymer coating, the SiO2 surface with doubly
reentrant microposts also shows omniphobicity to non-volatile liquids at
temperatures larger than 320°C, and demonstrates extremely temperature
stability to even 1000°C storage.

Chapter 2
36
Figure 26 (A) 3D model simulating the doubly reentrant surface structure design.
The critical parameters are indexed in the model, including the post top diameter
(D), center-to-center distance (P), and the length (δ) and thickness (t) of the
vertical overhangs. (B, C, D) SEM images of the top-view (B), bottom-view (C),
and cross-sectional view (D) of a micropost with doubly reentrant structure. (E)
Magnified cross-sectional view of the overhang structure on the post edge.[81]
Figure 27 Schematic illustration of liquid suspended on different surface
structures, the pressure difference between the liquid and air is denoted as Δp.
The simple micropost structure (A) can only suspend liquids with θY > 90°, while
the reentrant structure can suspend liquid with 0° < θY < 90°, but it will fail if
θY≈0°. The doubly reentrant structure can suspend liquids with θY≈0° as the
substantially upward forces is provided by the surface tension acting on the
vertical overhangs.[81]

Chapter 2
37
The realization of the omniphobic surface which can remain super-repellent
under extreme conditions has unraveled the functional potential of engineering
the microscopic structures and compositions on solid substrates by
nanotechnology. However, new insights to extend the functional performance of
SHS beyond theoretical prediction have been given by manipulating the
macrotextures of SHS.[82] As the microscopic roughness often exhibits
macroscopic smoothness in the case of SHS, the creation of macroscopic surface
texture might boost the super-repellent performance to a new height. By using
the laser-ablation technique, SHS with "dual length scale textures" can be created,
which shows remarkable de-wetting performance as the contact time of the
impinging drop has been reduced significantly to below the theoretical limit.[83]
The innovative macrotexture was introduced on a microtextured silicon surface
coated with fluorosilane using laser ablation. The as-produced macrotextures
obtain the characteristic full width at half maximum of 300 μm, heights
comparable to or less than the impinging liquid film thickness, and lengths up to
several millimeters. As the liquid drops impinge on the macrotextured
superhydrophobic silicon surface, the ridge of the macrotexture can trigger the
redistribution of the droplet mass and momentum, initiating a so-called
center-assisted retraction process (Figure 28). Different from the axisymmetric
retraction on smooth SHS, the non-axisymmetric center-assisted retraction on the
macrotextured SHS results in significantly shortened retraction process, which in
turn accelerates the bouncing process of the impinging drops considerably. To

Chapter 2
38
speak further, a 27% reduction in contact time compared to the theoretical limit
on smooth SHS is obtained for the macrotextured silicone SHS. Nonetheless, this
enhanced de-wetting process against impinging drops can effectively reduce the
liquid residues remained on the SHS after dynamic contact, which is of great
application potential in anti-freezing and prevents the ice formation.
Figure 28 (a, b) Sequential high speed frames showing the bouncing of a water
droplet from a superhydrophobic silicon surface at the side-view (a) and
top-view (b). Inset (a) shows the SEM image of the microtextured silicon surface.
The axisymmetric recoil with nearly uniform retraction speed at the rim is
observed in (b) and illustrated in (c). The non-axisymmetric recoil with divided
retraction rims and additional retraction momentum in the center area is also
illustrated in (d) and experimentally realized by the macrotextures in (e).[83]
However, the surface textures, which are the key to achieve SHS, may also
become the first weakness to break it down. It is reasonable to envisage that the
tiny surface textures on SHS can be easily damaged or removed by the external

Chapter 2
39
forces, which posts a critical drawback for the real-field applications of SHS. In
order to address this issue, the concept of "robust" SHS has been proposed
recently, which highlights the durability of SHS under repeatedly mechanical
abrasion, stability under environmental contamination, and resistance to
unfriendly external factors, i.e. elevated temperature, high pressure, and high
humidity.[84-88] By using raspberry-like porous silica capsules, robust SHS with
notable mechanical stability can be formed on the glass substrate.[89] In the first
place, nano-silica was coated on the polystyrene (PS) microsphere template via
the Stober method, forming the silica@PS capsules. Afterwards the silica@PS
capsules were deposited on the amine-terminated glass plate by the electrostatic
charge interaction. The porous silica capsules were then formed on the glass plate
by the thermal degradation of the PS phase. Eventually a semi-silane coating was
applied on to the porous capsules by CVD which not only made the capsules
superhydrophobic, but also formed the silica bridges that cross-linked the
adjacent capsules and the glass substrate (Figure 29). As a result of the chemical
cross-linking provided by the silica bridges, the glass surface with the porous
silica capsule coating exhibited robust superhydrophobicity which could
withstand the peeling of the adhesive tape at a pressure of ~10 kPa, and remained
stable after sand abrasion from an impact height of 30 cm. This novel robust SHS
thus can be used in organic solar cells to expand their life cycles, which also
shows high transparency and improves the total cell efficiency (Figure 30).

Chapter 2
40
Figure 29 (a) Schematic illustration of the preparation process for the transparent
superhydrophobic surface composed of porous silica capsules on the glass
substrate. (b, c) SEM images of the silica nanospheres coated polystyrene
particles (b) and the glass slide surface covered with raspberry-like particles after
the dip-coating process (c). (d) TEM image of the porous silica capsules after
removal of the PS core.[89]
Figure 30 (a) Comparison of the transmittance and reflectance spectra of the
glass slide with and without the transparent superhydrophobic porous silica
coating. (b) Photograph showing water droplets deposited on the glass substrate
with the transparent superhydrophobic coating. (c) Comparison of the
current-voltage curves between the organic solar cells with normal glass plate

Chapter 2
41
and glass plate with the superhydrophobic porous silica capsule coating. The
inset shows the configuration of the organic solar cell. (d) Photograph showing
the water droplet resting on the organic solar cell after the efficiency test, as the
test did not affect the transparent superhydrophobic surface.[89]
Besides establishing the chemical bonding between the nanostructured coating
and the substrate, robust SHS can also be achieved through engineering the
adhesion of the coating to the substrate. Different processing techniques, such as
PDMS composite coating, thermal compression, and surface pretreatment have
been developed to create SHS with strongly adhering features.[90-92] A
representative case is the creation of highly durable SHS on the cotton fabric
surface. Using a simple dip-coating-curing process, FAS functionalized silica
nanoparticles (NPs) were immobilized on the cotton fabric surface by the
cross-linking networks of PDMS and FAS (Figure 31).[93] The novel composite
coating exhibited excellent superhydrophobicity as well as superior mechanical
durability. In fact, the coated fabric maintained high contact angles (>160°) and
low sliding angles (~5°) even after 500 washing cycles and 10000 abrasion
cycles under standard AATCC testing environment; and it also demonstrated
good stability against boiling for 5 hours (Figure 32). It was speculated that a tire
rubber-like resilient composite film was formed by the coating process, which
provided substantial mechanical strength and substrate adhesion to resist the
repeatedly mechanical deformation.

Chapter 2
42
Figure 31 (a) Schematic illustration of the fabrication process of applying the
robust superhydrophobic coating on the fabric surface. (b, c) Photographs of the
spreading (b) and stable (c) water droplets on the untreated (b) and
superhydrophobic (c) fabrics' surface. (d, e) SEM images of a bare polyester
fabric surface (d) and a silica/PDMS/FAS coated polyester fabric surface (e).[93]
Figure 32 The changes of water contact angle and sliding angle on the
silica/PDMS/FAS coated superhydrophobic fabric surface as a function of
washing cycles (a), abrasion cycles (b) and boiling time (c).[93]
Aside from improving the strength and adhesion of the microtextures to the
substrate surface by chemical and physical bonds, robust SHS with mechanical
stability can also be fabricated by using the self-healing or sacrificial surface
components.[94-96] By combining a microfabrication and injection molding
methods, robust SHS can be obtained on the polymer surface in a cost-effectively

Chapter 2
43
manner.[97] In this approach, microtextures were generated on the aluminum foil
by a micro-working robot. The foil was subsequently made into the mold for
injection molding and the microtextures were transferred onto the forming
polypropylene (PP) surface. Different from homogeneous microtextured SHS,
protective micropillars were designed and incorporated into the as-formed PP
surface as periodic, large microhumps (Figure 33). Being higher and larger than
the other microtextures, the microhumps would be more susceptible to the
external compression and abrasion, which served as the sacrificial protection for
the major microtextures. As a result of the presence of the protective micropillars,
the microtextured PP surface showed robust superhydrophobicity with high
WCA and low SA even under a compression pressure of 20 MPa and also
survived in the wearing test up to 120 kPa, demonstrating notable potential for
the real-field application.
Figure 33 (A, B) Schematic illustration of the designed superhydrophobic

Chapter 2
44
structures on polymer surface with (A) the textures consisting of hierarchically
nanostructured micropillar and protective pillar; and (B) the textures consisting
of multiscale structure and protective pillar. (C, D) Design parameters of the
hierarchical micropillar (C) and the multiscale structure (D). (E, F, G)
Schematics showing the number and positions of the sacrificial protective pillars
denoted as (E) p5, (F) p15 and (G) p25.[97]
All in all, there is no universal protocol of SHS which would fit in all the
application requirements. By learning from the extensive research ouputs on the
SHS with various hydrophobic characteristics, one should realize that the design
and fabrication of SHS are rather end-use specified. Based on the current
understanding on the relationship between SHS and microtextures, and to obtain
SHS with optimized engineering, economic, and environmental impacts, the
designer of SHS should closely link the core functions with the real-field
application requirements, and reversely engineers the structure and property of
the SHS through a function-led approach. Nonetheless, it is also essential to
discover new applications for the SHS, where new functional potential of the
artificial super-repellent surface can be unravelled.
2.4 Significance of the research
(i) Easy tunable wettability. Different from the SHS with fixed hydrophobicity,
the wettability of the as-obtained graphene-titania (GT) SHS can be tuned from

Chapter 2
45
superhydrophilicity to superhydrophobicity repeatedly in a short time, using UV
light as the stimulus. The versatility in wettability thus can serve as the basis for
new functions and applications.
(ii) Interactive mechanism study. The mechanism of the UV-triggered
superhydrophilic conversion on the anatase TiO2 surface was investigated in the
microscopic level. Observation on the conversion process was monitored from
the lattice re-configuration to the surface reconstruction. The role of graphene in
the conversion and its interaction with TiO2 were also studied, which provided
new theory for the functional optimization on the TiO2 superhydrophilic
conversion.
(iii) New applications for SHS. The potential of the as-obtained GT-SHS in the
microfluidic manipulation was unravelled, which showed promising functional
performance in droplet storage, transfer, and microfluidic sensing. Due to the
easy-tunable wettability, surface energy engineering can also be applied to the
GT-SHS to realize the unique one-way water transport process, as well as high
efficient oily water separation.

Chapter 3
46
Chapter 3. Methodology
3.1 Materials
The graphite powder (98.0%), phosphorus (V) oxide (98.0%), and hydrogen
peroxide (30%) were purchased from Uni-Chem. Potassium persulfate (99+%)
was purchased from Acros Organics. Hydrazine monohydrate (99+%) was
purchased from Alfa Aesar. And titanium tetraisopropoxide was purchased from
Tokyo Chemical Industry (product number T0133). All chemicals were used as
received without further purification. Cotton twill fabrics were used as the
substrate for coating during the experimental processes.
3.2 Synthesis of graphene oxide
The graphene oxide was synthesized using a modified Hummers' method.[98] In a
typical process, 25 g of potassium persulfate (K2S2O8) and 2.5 g of phosphorus
pentoxide (P2O5) were carefully weighted and subsequently added into the 12 mL
95% concentrated sulfuric acid (H2SO4) at 80°C under magnetic stirring. The
mixture was continued stirring for half an hour to achieve homogeneous and
afterwards 3 g of graphite powder was slowly added into the mixture. The
graphite powder reacted strongly with the oxidative mixture and a black slurry
was formed shortly. The black slurry was continued stirring at 80°C for 4.5 hours
and became viscose. The slurry was then transferred to a 1000 mL glass beaker

Chapter 3
47
and subsequently 500 mL deionized (D. I.) water was added under magnetic
stirring. After achieving homogeneous, the dispersion was filtered and washed
with copious amount of D. I. water for several times in order to remove the
unreacted impurities. The as-obtained carbon cake was dried in ambient
overnight.
The carbon cake was then exfoliated to form graphene oxide using the Hummers'
method. In a typical process, the carbon cake was dispersed in 120 mL
concentrated sulfuric acid (95%) at 0°C ice bath under magnetic stirring.
Afterwards 15 g potassium permanganate (KMnO4) was slowly added into the
dispersion and the reaction temperature was maintained below 20°C. The
dispersion was then continued stirring at 35°C for 2 hours and 250 mL D.I. water
was subsequently added to dilute the viscose dispersion. During the addition of
D.I. water, the reaction temperature was maintained below 25°C. The dispersion
was continued stirring for 2 hours and then 700 mL D. I. water was added. After
2 minutes of the water addition and as the dispersion became homogeneous, 20
mL 30% hydrogen peroxide (H2O2) was added and the dispersion abruptly turned
brilliant yellow indicating the completion of the reaction. Intensive bubbling was
also observed when H2O2 was added, in this case, the addition of H2O2 should be
slow to keep the reaction stable.
The as-obtained yellowish dispersion was filtered and washed with copious
Chapter 3
48
amount (~1L) of 10% hydrochloric acid (HCl) and D. I. water. The as-obtained
solid product was dried in ambient and re-dispersed in D. I. water to form a 0.5
wt% graphene oxide (GO) dispersion. The GO dispersion was subsequently
dialyzed for one week to remove the remained impurities.
3.3 Synthesis of titania nanosol
The titania nanosol-gel was synthesized according to the previous reported
method.[99] In a typical process, 300 mL titanium tetraisopropoxide
(Ti[OCH(CH3)2]4) was drop-wisely added into 700 mL aqueous solution
containing 0.2% HCl and 0.2% acetic acid under magnetic stirring. Afterwards,
the solution temperature was raised to 60°C and the hydrolysis reaction was
proceeded for additional 16 hours. The nanosol was formed as a result of the
generation of TiO2 nanoparticle and the evaporation of water. Subsequently the
as-obtained titania nanosol was aged at ambient for one week prior to use.
3.4 Microstructure characterization
The microstructures of the as-synthesized graphene and TiO2 nanoparticles (NPs)
were characterized by scanning electron microscope (SEM, JSM-6490, JEOL)
and transmission electron microscope (TEM, JEM-2100F, JEOL). The surface
morphologies of the as-synthesized graphene and TiO2 NPs were investigated
using SEM and their corresponding particle size, crystalline structure and lattice
information were analyzed by TEM. To prepare the TEM sample, the graphene

Chapter 3
49
or TiO2 nanosol dispersions was drop-casted onto the copper grid and dried under
ambient condition.
The surface topography of the as-prepared graphene and TiO2 thin films was
measured by atomic force microscope (AFM, Nanoscope IV, Digital Instrument).
To prepare the samples for AFM characterization, a 1×1 cm silicon wafer was
pre-cleaned by sequentially sonicating in D.I. water and ethanol, respectively.
Afterwards, the diluted dispersions of graphene or TiO2 nanosol were
drop-casted on the silicon wafer and dried in ambient, forming a relatively
homogeneous thin film on the wafer's surface.
The crystalline structure and phase information of the samples were measured
using X-ray diffractometry (XRD, Rigaku SmartLab). The sample in powder
form was placed in the center of the holder and pressed to be flat using a glass
slide.
3.5 Surface property characterization
The surface elemental composition was characterized using energy dispersive
X-ray spectroscopy (EDX). High resolution SEM image was firstly obtained and
then the EDX mapping was performed on the imaging area of the sample. The
type and abundance of the elements on the surface area of the sample were
subsequently obtained, which were shown as the colored pixels distributed on the

Chapter 3
50
imaging area.
The chemical bonding and energy state of the surface elements were further
characterized by X-ray photoelectron spectroscopy (XPS, SKL-12, Leybold
Heraeus). The sample for XPS characterization was prepared by drop-casting the
diluted sampling dispersion onto a pre-cleaned silicon wafer, which subsequently
formed a homogeneous thin film on the wafer surface.
3.6 Contact angle measurement
The water contact angle (WCA) was measured by a contact angle measurement
and contour analysis system (OCA-15 plus, Dataphysics). A droplet volume of 2
µL was used for the WCA measurement. Each reported value of WCA was the
average obtained from measuring at least five different locations on the solid
surface. In order to measure the WCA accurately, the measurements were
conducted after the as-deposited water droplet stabilized on the surface. For the
samples without ultraviolet (UV) treatment, the stabilizing time is set as 5
minutes; for the samples with UV treatment, the stabilizing time is set as 5
seconds.
The water spreading and transport measurements were conducted on the
hierarchical graphene/titania coated cotton fabric (GT-fabric). The time required
for spreading and transport was defined as the completely disappearance of a 2

Chapter 3
51
µL water droplet on the GT-fabric surface, despite the different capillary
processes that may take place on the droplet. The life time of the water droplet on
GT-fabric surface was monitored by a charge-coupled device (CCD) camera and
each reported value was the average of three parallel measurements.
3.7 UV-induced superhydrophilic conversion on GT fabric
The as-prepared GT-fabric was mounted onto the center of a pre-cleaned glass
slide and placed right beneath the UV lamp in a UV exposure box. Subsequently
the GT-fabric was radiated by the UV lamp with a UV wavelength of 365 nm and
intensity of 0.457 mW cm-2. To control the wettability on the GT-fabric, different
durations of UV radiation were applied, i.e. 1, 2 and 3 hours. After the
completion of the UV treatment, the GT-fabric was taken out of the UV box and
cooled in the ambient condition.
3.8 Fabrication of GT fabric based micro-droplet sensor arrays
for gas sensing
The GT-fabric was curled and attached to the end of a glass rod by double-sided
bonding tape. Afterwards, the droplet array with pre-defined spacing was
deposited on the fabric surface using a micro-needle. In a typical process, a 3×3
water droplet array was fabricated and the volume of individual droplet was
controlled to be 10 µL. In order to realize the sensory characteristic, different
indicators were loaded into the as-deposited water droplets, which could exhibit

Chapter 3
52
special chromatic changes upon exposing to specific gas molecules. In this case,
0.05 M CuCl2, 0.1 wt% Congo red, and 0.01 M PdCl2 were used as the indicator
solutions, which showed distinct chromatic responses to ammonia (NH3), HCl,
and ethylene diamine molecules, respectively. Quantitative sensing analysis can
also be achieved on the micro-droplet sensing arrays by exposing them to
different concentrations of gas, which may show a sequential chromatic change
from low to high gas concentrations.
3.9 Oil/water separation test on GT-fabric
The GT-fabric was mounted onto the filter head of a vacuum filtration device (Jin
Teng sand core filter with portable core) and used as the filtration membrane.
Different oil/water mixtures, i.e. chloroform/water, hexane/water, dodecane/water,
were fed into the filtration device and separated by the GT-fabric membrane
using gravity. The volume ratio between the oil and water phase in the oil/water
mixture was set as 1:1 and the time required for the completion of separation was
also recorded using an electrical chronograph. The separation efficiency (R) was
calculated using the following equation: R=(Wi/W0)×100%, while W0 and Wi are
the weight of the originally fed and finally separated oil, respectively.

Chapter 4
53
Chapter 4. Surface energy engineering on cotton fabric using
graphene
4.1 Introduction
Graphene, the recent "superstar" of materials, has drawn extensive research
interests as a result of its superior mechanical, electrical, and thermal properties.
Furthermore, graphene has also been recognized as one of the most active
materials in terms of surface chemistry. And the surface wettability of graphene
can be easily tuned at either the molecular or atomic levels by controlling the
crumble distribution on the graphene sheet and the absorption of molecules with
different polarities. The combination of the intrinsically hydrophilic cotton fabric
and hydrophobic graphene is expected to generate enormous functional
possibilities. As enhanced adhesion would be established between the
micro-meter sized cotton fibers and the extremely flexible graphene sheets with
nanodimensional thickness, the wettability of the underlying fiber matrix can be
strongly affected by the change of surface composition on the thin graphene
coating. Furthermore, functional upgrades can be achieved by the
nanoengineering of the graphene surface via nanoparticle deposition or chemical
functionalization.

Chapter 4
54
4.2 Fabrication of graphene nanocoating on cotton fabric
The as-obtained GO was dispersed in D.I. water and sonicated to make a 3 mg
mL-1 dispersion. Cotton fabric with defined dimensions (2×2 cm) was immersed
in the GO dispersion for a short duration (~30 s). Subsequently the GO coated
fabric was transferred to an aqueous solution of hydrazine and the temperature
was elevated to 80°C to trigger the reduction process. Mild stirring was applied
during the reduction in order to achieve homogeneous. As the reduction
continued, it could be clearly observed that the yellowish brown GO absorbed on
the fabric turned into deep black, indicating the formation of graphene. The
reduction was proceeded for additional 1 hour as the temperature reached 80°C,
then the as-obtained graphene coated cotton fabric (G-fabric) was taken out from
the solution and rinsed with copious amount of D.I. water. The preparation
process of G-fabric is schematically illustrated in Figure 34.
Figure 34 Schematic illustration of the G-fabric fabrication process.
To further characterize the as-obtained graphene, the black dispersion remained
in solution was taken out and re-dispersed in D.I. water. Approximately 1 mL of

Chapter 4
55
the dispersion was acquired using a syringe and re-dispersed in 4 mL D. I. water.
Afterwards, the diluted dispersion was drop-casted onto a copper grid for the
transmission electron microscope (TEM) characterization. As a result, graphene
sheets with well-defined morphology can be observed in the TEM image (Figure
35); the selected-area electron diffraction (SAED) pattern of the graphene sheets
also reveals good crystallinity of the as-obtained graphene, as typical hexagonal
diffraction rings of the sp2 carbon basal plane is preserved (Figure 35: inset).[100]
The characteristic atomically thick edges of graphene can also be observed, as
indicated by the semi-transparent contrast along the edge profile (Figure 36). The
as-obtained graphene exhibited a few-layer characteristic with a thickness below
10 nm, indicating the quantum size effect was well-preserved regardless of the
synthesis simplicity (Figure 37).
Figure 35 TEM image of the as-obtained graphene. Inset shows the correspond
SAED pattern.

Chapter 4
56
Figure 36 Magnified TEM image of the as-obtained graphene with well-defined
atomically morphology at the edge.
Figure 37 High resolution TEM (HRTEM) image of the edge region in graphene.
The edge is observed to be composed of less than ten stacked graphene layers,
indicating the extremely small thickness of the as-obtained graphene.
The surface topography of the as-obtained graphene was also characterized by
atomic force microscope (AFM). The AFM sample was prepared by drop-casting
of 0.05 mL of the graphene dispersion obtained after the reduction process. The
AFM image showed the topological structure of randomly oriented wrinkles on
smooth thin sheets, which was in good accordance with the TEM observation
(Figure 38). By re-constructing the AFM image, a 3D model on the graphene
sheet can be obtained, by which the shape of graphene was clearly visualized

Chapter 4
57
(Figure 39). The X-ray diffraction (XRD) pattern of the as-obtained graphene
showed two characteristic peaks at 11.22° and 22.6°, which can be indexed to the
oxygen-intercalated graphene with a d-spacing of 0.8 nm and graphene with a
d-spacing of 0.4 nm, respectively (Figure 40).[101] It thus indicated that the
reduction process did not fully-reduced the GO into graphene. However, this
phenomenon may not affect the wettability of the as-obtained graphene, which is
discussed in section 4.3.
Figure 38 AFM image of the as-obtained graphene, where the characteristic
crumples of graphene sheets can be observed in the nanoscale level.
Figure 39 3D model of the graphene sheet constructed from the AFM image.

Chapter 4
58
Figure 40 XRD spectrum of the as-obtained graphene, showing two
characteristic diffraction peaks at 11.22° and 22.6°.
The GO coating on the cotton fabric surface was directly observed using
scanning electron microscope (SEM). It was found that the cotton fiber surface
was covered by a single layer composed of large GO sheets which can span over
tens of microns (Figure 41). The GO layer was found strongly adhere to the fiber
surface which followed and duplicated the surface texture of the fibers (Figure
42). The surface morphology of the G-fabric was subsequently characterized by
SEM. From the SEM image of G-fabric, the graphene coating can be observed as
the rough "raincoat" layer on the cotton fiber surface (Figure 43). The as-formed
graphene coating adhered strongly to the fiber surface which also followed the
surface curvature of the fiber. The coating was found to exist on most of the
fibers, indicating the effectively wrapping of graphene on the fabric during the
reduction. From the magnified view of the coating, it was found that the

Chapter 4
59
fish-scale-like structure was consisting of nanoscale wrinkles which seemed to
orient along the longitudinal direction of the fibers (Figure 44). It was speculated
that this unique microstructure was formed during the reduction, as the oxygen
atoms were released from the carbon basal planes of GO, the plane contracted
and induced the formation of the wrinkle-like microstructure. The surface
morphology of bare cotton fabric was also shown, which was rather smooth and
flat as compared to the G-fabric (Figure 45).
Figure 41 SEM image of the graphene oxide (GO) coated cotton fabric.
Figure 42 Magnified SEM image of the GO coated cotton fabric, showing the
strong adhesion of the GO sheet to the fiber surface.

Chapter 4
60
Figure 43 SEM image of the G-fabric, showing the rough fish-scale-like surface
coating.
Figure 44 Magnified SEM image of G-fabric’s surface, where the orientation of
the fish-scale-like structure can be observed.
Figure 45 SEM image of bare cotton fabric, where the smooth fiber surface
without coating is observed. Insets shows the magnified view of the fiber surface.
4.3 Tuning the surface wettability of G-fabric

Chapter 4
61
The surface wettability of G-fabric was characterized by the contact angle
measurement. Droplets with a preset volume of 2 μL were casted on the G-fabric
surface and their contact angles were analyzed by the OCA-15 contact angle
measurement and contour analysis system. A representative image showing the 2
μL water droplet sitting on the G-fabric surface was presented in Figure 46. In
this case, a contact angle of 138.2°±5.1° was observed, indicating the substantial
hydrophobicity of the fabric surface with graphene coating. It is noted that the
WCA of graphite is in the range of 80°-90°, which is generally considered
hydrophilic.[102] However, the hydrophobicity observed for the graphene coating
can be ascribed to the heterogeneity of the as-obtained graphene. As previously
mentioned, GO was not fully reduced in the coating process, which made the
as-obtained graphene a heterogeneous state between the oxygen intercalated
carbon plane and the pure carbon plane. The replacement of the C=O group by
C-H group during the hydrazine reduction may substantially lower the surface
energy of the as-obtained graphene, while the intensive reactions on the
atomically thin graphene layer would abruptly raise the roughness even in the
molecular level.[103-104] These effects during the hydrazine reduction process thus
may generate the unexpected hydrophobicity of the graphene coating. On the
other hand, the mass loading of the graphene coating on the fabric is rather low,
with a measurable value of ~0.5 wt%, indicating the formation of a very thin
coating layer on the fabric surface, which is more susceptible to form the
nano-wrinkles. Nonetheless, the G-fabric became more and more hydrophilic

Chapter 4
62
upon repeating the reduction process. The phenomenon is predictable since the
heterogeneity of the as-obtained graphene would be gradually reduced during the
repeatedly reduction, and homogeneous atomically smooth carbon basal plane
was eventually formed, which demonstrated similar hydrophilicity to the
graphitized carbon.
Figure 46 Photograph showing a 2 µL water droplet sitting on the G-fabric
surface.
The relationship between the hydrophobicity of G-fabric and the time of
reduction was also investigated. Intriguingly, it was found that the WCA on
G-fabric quickly raised above 135° after a short reduction duration of 10 minutes,
and remained stable between 135° and 140° even the time of reduction was
increased to 5 hours (Figure 47). It thus indicated that the reaction between GO
and hydrazine quickly reached its equilibrium on the fabric surface at 80°C for
10 minutes, as further increasing the reaction time did not significantly alter the
surface wettability. The reason for this notable phenomenon can be possibly
attributed to both the excess amount of hydrazine used and the low loading of
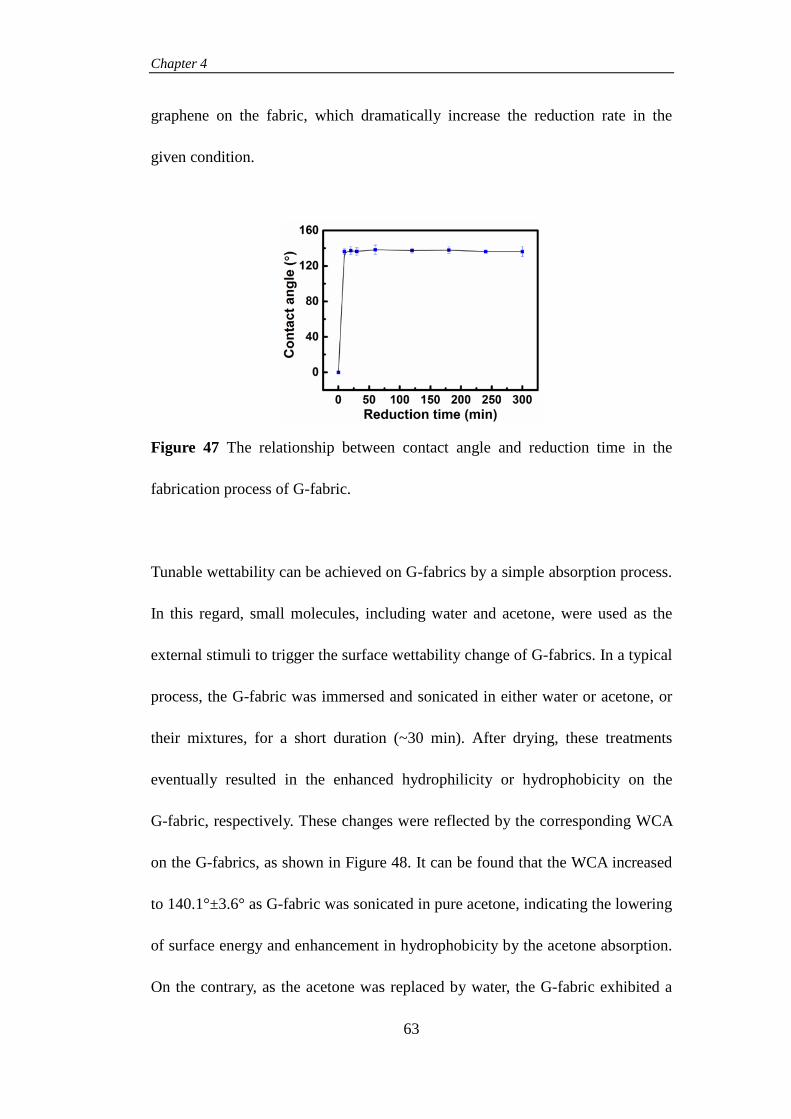
Chapter 4
63
graphene on the fabric, which dramatically increase the reduction rate in the
given condition.
Figure 47 The relationship between contact angle and reduction time in the
fabrication process of G-fabric.
Tunable wettability can be achieved on G-fabrics by a simple absorption process.
In this regard, small molecules, including water and acetone, were used as the
external stimuli to trigger the surface wettability change of G-fabrics. In a typical
process, the G-fabric was immersed and sonicated in either water or acetone, or
their mixtures, for a short duration (~30 min). After drying, these treatments
eventually resulted in the enhanced hydrophilicity or hydrophobicity on the
G-fabric, respectively. These changes were reflected by the corresponding WCA
on the G-fabrics, as shown in Figure 48. It can be found that the WCA increased
to 140.1°±3.6° as G-fabric was sonicated in pure acetone, indicating the lowering
of surface energy and enhancement in hydrophobicity by the acetone absorption.
On the contrary, as the acetone was replaced by water, the G-fabric exhibited a

Chapter 4
64
zero contact angle after sonication, indicating the conversion from hydrophobic
to hydrophilic by the water absorption. Further manipulating the volume ratio
between acetone and water may result in a series of intermediate states between
the case of pure acetone and pure water, as indicated by the changes in WCA
(Figure 48). Nonetheless, it is speculated that this novel surface wettability
change is induced by three major factors, including: (i) the evaporation-induced
surface roughness increase on graphene; (ii) different configurations of the
molecules adopted in absorption: in the case of acetone, it absorbed onto
graphene by pointing the methyl groups outwards; (iii) amplification of the
surface changes by the high surface area of graphene. Similar phenomena were
also observed on graphene coated gold, aluminum, and highly ordered pyrolitic
graphite (HOPG) surfaces.[105]
Figure 48 Changes of water contact angles on G-fabric by sonication in the
water-acetone mixture with different water/acetone volume ratios.

Chapter 5
65
Chapter 5. Surface energy engineering on G-fabric surface
using titania
5.1 Introduction
Even though tunable surface wettability can be obtained on G-fabric surface by
the absorption of different molecules, the process is still relatively sluggish
without appropriate reversibility. On the other hand, tuning the surface
wettability over the full spectrum between superhydrophobic region and
superhydrophilic region is also hard to achieve by the absorption of small
molecules. Last but not least, the small molecules are easy to desorb from the
fabric surface upon washing or mechanical abrasion, which make them rather
impractical for the fabrication of robust SHS. In order to obtain full-spectrum
tunable wettability on SHS which is of practical significance, the technique used
and process involved should be simple, while the tuning function is smart and
stimuli-responsive. To satisfy these goals, a screening over the materials was
conducted to locate the most suitable catalog. With both easy-processability and
photoactivity, the transition metal oxides (e.g. titania, tungsten oxide, vanadium
pentoxide, zinc oxide) caught the eyes as a result of their abundance and low
toxicity.[106] Among the metal oxides, titania (TiO2) is well-known for its
photoactivity under ultra-violet (UV) light, which exhibits a reversible
conversion from hydrophobic to superhydrophilic upon UV exposure. The UV

Chapter 5
66
superhydrophilic conversion of TiO2 has been widely observed on the thin films,
composites, and nanostructures of titania.[107-109] However, it is rather intriguing
to observe this phenomenon on the hydrophobic graphene surface.
5.2 Synthesis of titania sol-gel with homogeneous nanoparticle
size distribution
The concept of "dual roughness" was applied to realize the superhydrophobicity
on the TiO2 coated graphene (GT) surface. The TiO2 was made into the high
density nanoparticles (NPs) which were hierarchically deposited onto the single
graphene layer coated on the cotton fabric surface, forming the nanostructured
rough surface texture. The TiO2 NPs were synthesized using a thermal hydrolysis
method with titanium isopropoxide as the precursor. After hydrolysis and the
subsequently aging in the ambient, a transparent pale sol-gel of TiO2 NPs can be
obtained, which is also denoted as the "titania nanosol".
TEM and high-resolution TEM (HRTEM) were used to characterize the
as-obtained TiO2 sol-gel. It can be observed from the TEM image that the TiO2
sol-gel is composed of TiO2 NPs with sizes ranging from 10 to 30 nm (Figure 49).
According to the TEM image, it was observed that the TiO2 NPs were
agglomerated together and formed large particulate clusters. However, the
boundaries of the single TiO2 NP can still be clearly observed in the clusters,
indicating the good crystallinity and stability of the as-synthesized TiO2 NPs. The

Chapter 5
67
crystalline structure of the TiO2 NPs was further investigated by HRTEM. Under
the HRTEM observation (Figure 50), the lattice structures of the TiO2 NPs can be
clearly identified, and a lattice spacing of 0.35 nm was obtained, which
corresponded to the (101) reflection of anatase TiO2. Even though the lattice
boundaries were randomly distributed between the TiO2 NPs, the lattice structure
was well-preserved in each single crystal (Figure 50). The crystalline structure of
the TiO2 NPs was further confirmed by SAED, as the diffraction rings
corresponding to the (101), (211), (004), (200), (105), (204), (220) can be clearly
indexed, which can be unambiguously attributed to the lattice reflections of
anatase TiO2 (Figure 51). The XRD spectrum showed in Figure 52 was also
coincident with the TEM & HRTEM observation, as the diffraction peaks were in
good agreement with the anatase TiO2 (JCPDS 21-1272).
Figure 49 TEM images of the as-obtained TiO2 sol-gel.

Chapter 5
68
Figure 50 HRTEM image of the TiO2 sol-gel showing the lattice structure of the
TiO2 NPs.
Figure 51 SAED pattern of the TiO2 NPs shown in the TEM image.
Figure 52 XRD spectrum of the as-obtained TiO2 sol-gel.
5.3 Fabrication of titania nanofilm on G-fabric
The as-synthesized TiO2 NPs were subsequently applied onto G-fabrics using a

Chapter 5
69
simple dip-pad-dry-cure method. Briefly speaking, the G-fabric was firstly
dipped in the 1% TiO2 sol-gel solution for 5 minutes, and then passed through a
vertical padder with an applied pressure of 2 kg cm-2 in medium speed, in order
to remove the excess liquid absorbed. The TiO2 sol-gel treated fabric was then
dried at 80°C for 10 minutes and subsequently cured at 160°C for 3 minutes.
After cooling in the ambient, the hierarchical TiO2 NP/graphene coated cotton
fabric (GT-fabric) was obtained. It was speculated that the TiO2 sol-gel
condensed to form a nanofilm consisting of TiO2 NPs on the G-fabric’s surface.
A schematic illustration regarding the preparation process of GT-fabric was
shown in Figure 53. The successful formation of the TiO2 coating on G-fabric
was confirmed by EDX mapping, as the elementary distributions of Ti and O
were found over the observation window (Figure 54). The surface morphology of
the as-prepared GT fabric was characterized by SEM. According to the
as-obtained SEM image (Figure 55), the surface feature of GT-fabric was
substantially different from G-fabric, as a thin film with bright contrast can be
observed on top of the fabric surface, which was distributed continuously on the
individual fibers. This thin film is formed from the condensation of the TiO2
sol-gel during the curing process, resulting in the packing of the TiO2 NPs and
the formation of the thin solid film. The thin film composed of the TiO2 NPs was
visually smooth and continuous on the longitudinal direction of the fibers (Figure
56). The magnified SEM image revealed that the thin film was composed of
densely-packed few layers of TiO2 NPs, by which the preferential packing

Chapter 5
70
direction was following the local curvatures of the fiber, indicating the formation
of a nanoscale thin film (Figure 57). The formation of TiO2 nanofilm on the
cotton fabric’s surface in a thermal process has also been reported previously.[110]
In that case, the TiO2 NPs were directly deposited on the cotton fabric without
the intermediate graphene layer, and substantial hydrophilicity was
demonstrated.
Figure 53 Schematic illustration of the GT-fabric preparation process.
Figure 54 EDX mapping of the selected area on GT-fabric (electron image 1) for
the elements of carbon (C), oxygen (O) and titanium (Ti).

Chapter 5
71
Figure 55 SEM image of the as-prepared GT fabric, where the titania
nanocoating with brighter contrast can be clearly observed.
Figure 56 Magnified SEM image showing the morphology of the titania
nanocoating on the G-fabric surface.
Figure 57 Magnified SEM image showing the morphological detail of titania
nanofilm, which is composed of densely packed TiO2 NPs.

Chapter 5
72
5.4 Tuning the surface wettability of GT-fabric
Stimuli-responsive full-spectrum tuning of the surface wettability can be
achieved on GT-fabric as a result of the unique hierarchical graphene/TiO2
surface nanocoating. Due to the "dual roughness" feature provided by the
nanotextures formed by the packing of TiO2 NPs and the crumpling of the
graphene sheet; and the microtextures formed by duplicating the intrinsic
curvatures of the cotton fibers, the GT-fabric exhibits substantial
superhydrophobicity with high WCA and relatively low SA. Based on the sessile
drop measurement, a WCA of 151° can be observed on the GT-fabric using 2 μL
droplets, indicating the characteristic angle of Cassie state (Figure 58). On the
other hand, a SA of 45° can be observed with a droplet size of 30 μL. The
relatively large SA on GT-fabric can be attributed to the presence of TiO2, which
is intrinsically hydrophilic and can form hydrogen bonds with water via surface
oxygen groups.[111] The molecular bonding between TiO2 and water thus
generates higher adhesion which may require more energy for de-pinning.
However, the SA on GT fabric can be further improved by the addition of a low
surface energy barrier layer between TiO2 and the impinging water, which is also
worthy of investigation in the future. By utilizing the UV superhydrophilic
conversion on TiO2, the superhydrophobic GT-fabric can be tuned into
superhydrophilic by simple UV radiation, while intermediate states can also be
facilely achieved by using different radiation time. The WCAs on GT-fabrics
were measured after being UV-treated for 1, 2 and 3 hours, respectively (Figure

Chapter 5
73
58). The decreasing trend is obvious since the WCAs change from 132.4°, 99.6°,
to 0° as the UV time increases from 1, 2, to 3 hours. It thus indicates the
elevation of surface energy on GT-fabric upon UV exposure. However, according
to the relatively smooth decreasing trend represented by the curve, the reduction
in surface energy can be interpreted as a stimuli-responsive UV-dependent
process, which can be utilized as the essential tool for the surface energy
engineering. Interestingly, different wettability characteristics can be observed on
the two sides of the GT-fabric, as superhydrophilicity is obtained on the side
facing UV radiation while superhydrophobicity is maintained on the opposite
side. Furthermore, the WCAs on the UV-opposing side remain almost stable with
increasing UV radiation time, indicating the UV penetration depth is
considerably smaller than the thickness of the GT fabric. However, the observed
surface energy gradient is essential for the realization of the surface energy
engineering on GT-fabrics, which also serves as the very basis for advanced
microfluidic applications.
Figure 58 Contact angle vs. UV radiation time on the GT-fabric's surfaces. The
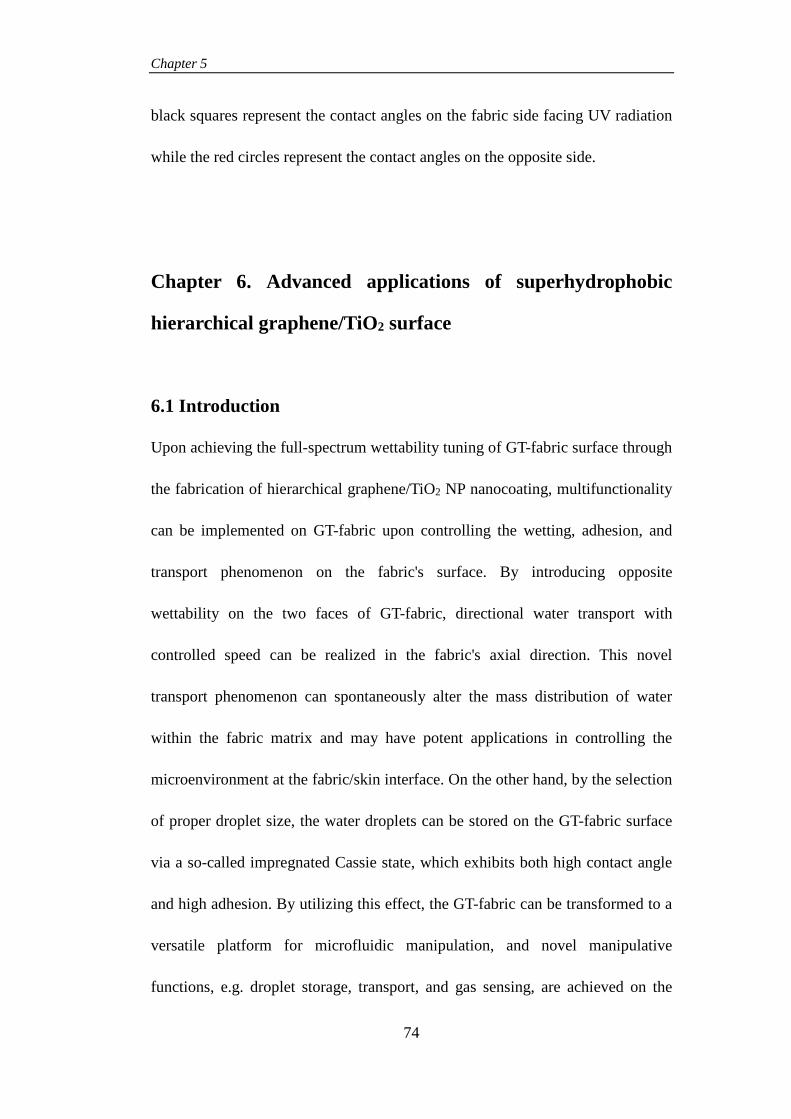
Chapter 5
74
black squares represent the contact angles on the fabric side facing UV radiation
while the red circles represent the contact angles on the opposite side.
Chapter 6. Advanced applications of superhydrophobic
hierarchical graphene/TiO2 surface
6.1 Introduction
Upon achieving the full-spectrum wettability tuning of GT-fabric surface through
the fabrication of hierarchical graphene/TiO2 NP nanocoating, multifunctionality
can be implemented on GT-fabric upon controlling the wetting, adhesion, and
transport phenomenon on the fabric's surface. By introducing opposite
wettability on the two faces of GT-fabric, directional water transport with
controlled speed can be realized in the fabric's axial direction. This novel
transport phenomenon can spontaneously alter the mass distribution of water
within the fabric matrix and may have potent applications in controlling the
microenvironment at the fabric/skin interface. On the other hand, by the selection
of proper droplet size, the water droplets can be stored on the GT-fabric surface
via a so-called impregnated Cassie state, which exhibits both high contact angle
and high adhesion. By utilizing this effect, the GT-fabric can be transformed to a
versatile platform for microfluidic manipulation, and novel manipulative
functions, e.g. droplet storage, transport, and gas sensing, are achieved on the

Chapter 6
75
GT-fabric based microfluidic device. Last but not least, owing to its
full-spectrum tunable wettability, GT-fabric also demonstrates high separation
speed to the oil/water mixture and a wide-range adaptability to oil/water mixtures
with different surface tensions.
6.2 Directional water transport
Smart directional water transport can be achieved on the GT-fabric by
engineering the surface energy gradient in the fabric axial direction. Utilizing the
stimuli-responsive property of the graphene/TiO2 nanocoating, the surface energy
gradient along the fabric axial direction can be tuned from the low to high levels
depending on the time of UV radiation. In the case of high surface energy
gradient, the deposited water droplet will be spontaneously transported from the
superhydrophobic side of the fabric to the superhydrophilic side, preferentially in
a relatively high speed fully driven by the gradient. This novel phenomenon is
significant for the micro-environmental control in high humidity condition,
which can extensively enhance the moisture drainage and creates the comfort
feeling. The directional transport is also of great usage for the controlled
collection and release of microfluids, which may have wide-spread applications
in biological fluid handling.

Chapter 6
76
Figure 59 Sequential frames showing the different wetting phenomena on two
sides of 3h-UV GT-fabric. The water droplet (10 μL) instantly spread on the face
side (UV-facing) on the fabric while it maintained the spherical shape on the
back side (UV-opposing) and gradually transported to the face side.
Figure 60 Sequential frames showing the wetting phenomena on bare cotton
fabric. Identical water spreading was observed on both sides of the fabric.
Figure 61 Sequential frames showing the difference in wetting phenomenon on
the 2h-UV GT-fabric.

Chapter 6
77
Figure 62 Sequential frames showing the difference in wetting phenomenon on
the 1h-UV GT-fabric.
The transport phenomenon was observed by directly casting of a 10 μL water
droplet on the 3h-UV treated GT-fabric. Since the substantial surface energy
gradient has been established, different water transport dynamics can be observed
on the two sides (UV-facing & UV-shading) of the fabric (Figure 59). As the
water droplet was deposited on the superhydrophilic side (UV-facing), it instantly
spread on the surface while the shape of droplet changed from spherical to an
extended liquid film, indicating a drastic change on the contact angle driven by
the capillary force. This fast spreading process thus indicated the established
superhydrophilicity on the UV-facing side, while significant different
phenomenon was observed on the other side. To speak more specifically, the
deposited water droplet was found to gradually wick from the superhydrophobic
side to the superhydrophilic side, and the droplet was observed to be remained
spherical for a lengthy duration in this process. The strongly impeded spreading
and the slowly decreasing contact angle thus indicated the superhydrophobic
characteristics of the UV-opposing side. However, as previously mentioned, a
surface energy gradient was established between the two sides of GT fabric by

Chapter 6
78
UV radiation. As a result, directional capillary force was generated by the surface
energy gradient, and the water is tended to transport from the more hydrophobic
surface to more hydrophilic surface through directional wicking, which is the
case for the droplet deposited on the UV-opposing side of GT-fabric. Different
from the normal spreading process on the untreated cotton fabric (Figure 60),
strong controls can be implemented on the speed and direction of the mass
transport on GT-fabric. By controlling the intensity of the established surface
energy gradient, the mass transport speed of water on GT-fabric can be facilely
tuned from high to low. A representative example was provided by the transport
phenomena observed on the GT-fabric treated by 1, 2 and 3 hours' UV radiation.
The sequential frames of the corresponding mass transport phenomenon on the
GT fabric treated by 2 hours' and 1 hour's UV radiation are show in Figure 61
and Figure 62, respectively. Both the fastest spreading and transport processes
are observed on the 3h-UV treated GT-fabric, and both of the spreading and
transport speeds are following the order of 3h UV treated > 2 h > 1h, which
further prove the proportional relationship between the mass transport speed and
the surface energy gradient. The mass transport phenomenon on GT-fabric was
then analyzed quantitatively by measuring the time required for the
disappearance of a 10 μL water droplet on the hydrophobic and hydrophilic sides
of the UV treated fabric, respectively. As a result, the time required for the
transport process was measured to be 39.7±7.8 s, 37.7±10.7 s, and 12.5±5.2 s for
the GT-fabrics treated by 1, 2 and 3 hours' UV radiation. On the other hand, the

Chapter 6
79
time required for the spreading process was measured to be 26.3±4.2 s, 14.9±3.1
s, and 3.3±2.0 s for the 1, 2 and 3 hours' treated GT-fabrics (Figure 63). A clear
trend of decrease can be observed for both the transport and spreading time with
increasing time of UV treatment. However, the changes in spreading time exhibit
a more linear trend which can be fitted linearly into: xy 5.118.37 −= . It thus further
confirms the underlying linearity between the surface hydrophilicity and UV
time (Figure 64). Clear time gaps can be observed between the spreading time
and transport time, which can be a useful indication of the intensity of surface
energy gradient. By interpreting the changes in time gaps of different UV time,
an inversely proportional correlation was found between the time gaps and the
UV time, indicating a lower time gap may represent a higher surface energy
gradient.
Figure 63 The relationship between the spreading and transport speeds on two
sides of GT-fabric treated by different UV radiation time, i.e. 1, 2 and 3 hours.
The points at the x-axis of 1.5 h correspond to the case of bare cotton fabric.
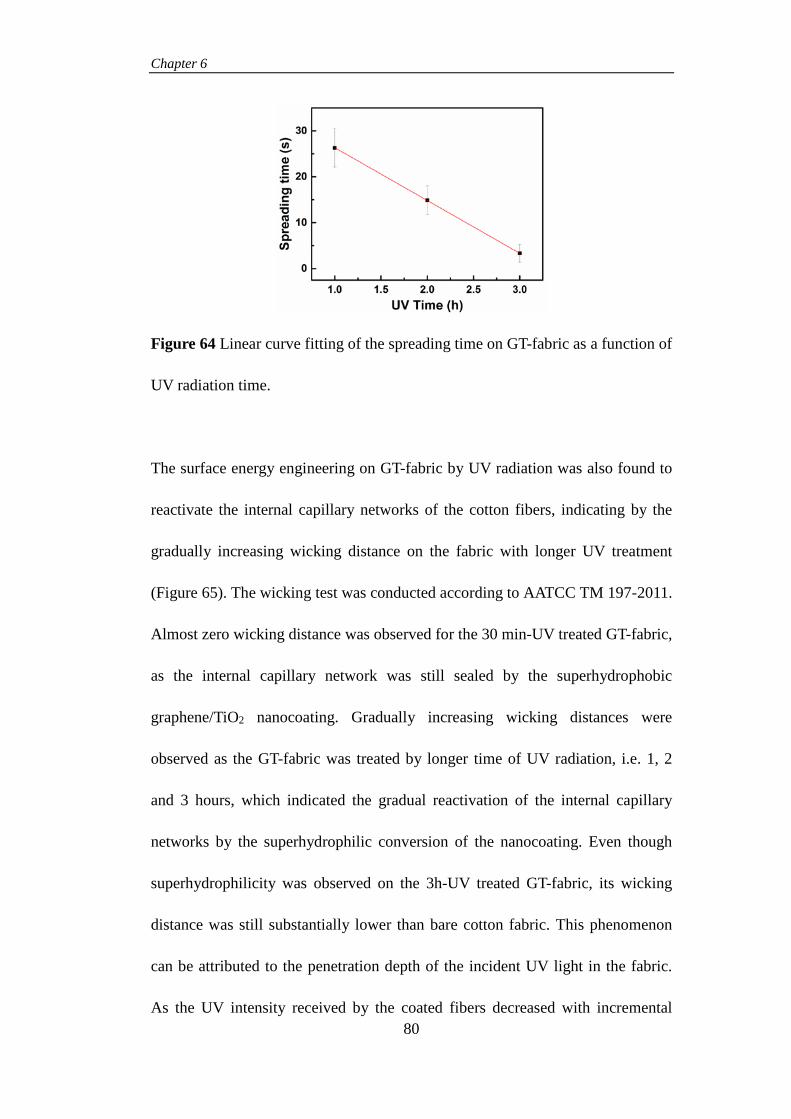
Chapter 6
80
Figure 64 Linear curve fitting of the spreading time on GT-fabric as a function of
UV radiation time.
The surface energy engineering on GT-fabric by UV radiation was also found to
reactivate the internal capillary networks of the cotton fibers, indicating by the
gradually increasing wicking distance on the fabric with longer UV treatment
(Figure 65). The wicking test was conducted according to AATCC TM 197-2011.
Almost zero wicking distance was observed for the 30 min-UV treated GT-fabric,
as the internal capillary network was still sealed by the superhydrophobic
graphene/TiO2 nanocoating. Gradually increasing wicking distances were
observed as the GT-fabric was treated by longer time of UV radiation, i.e. 1, 2
and 3 hours, which indicated the gradual reactivation of the internal capillary
networks by the superhydrophilic conversion of the nanocoating. Even though
superhydrophilicity was observed on the 3h-UV treated GT-fabric, its wicking
distance was still substantially lower than bare cotton fabric. This phenomenon
can be attributed to the penetration depth of the incident UV light in the fabric.
As the UV intensity received by the coated fibers decreased with incremental

Chapter 6
81
penetration depth, the fibers located underneath the fabric surface would receive
less radiation while the fibers on the surface would take more. This in turn would
generate a heterogeneous hydrophilic conversion within the GT-fabric matrix, as
a higher hydrophilic conversion rate can be obtained near the fabric surface and a
lower rate is expected underneath, and so a surface energy gradient is achieved.
As a result, a substantial portion of fibers below the fabric surface layer may still
be hydrophobic even the surface layer is turned superhydrophilic, and the
remained hydrophobic fibers will restrict the capillary network of the fabric to a
great extent, which significantly reduces the wicking distance. From this point of
view, the time of UV radiation should be extended beyond 3 hours in order to
fully activate the internal capillary network of the fabric; or both sides of the
fabric should be exposed to the UV radiation for the same duration.
By the creation of the unique hierarchical graphene/TiO2 nanocoating,
full-spectrum wettability tuning can be achieved on cotton fabric in a simple and
smart manner. The novel surface coating spontaneously adjusts its wettability to
the incident UV light and water transport with speed and direction control can be
readily achieved. Compared to the G-fabric substrate, both the function and
performance of GT-fabric have been promoted to a higher level, which further
demonstrate the powerful concept of "function-led design". However, the beauty
of function-led design does not only lie in the promotion of the existing functions,
but also the generation of multivariant new features and applications through the
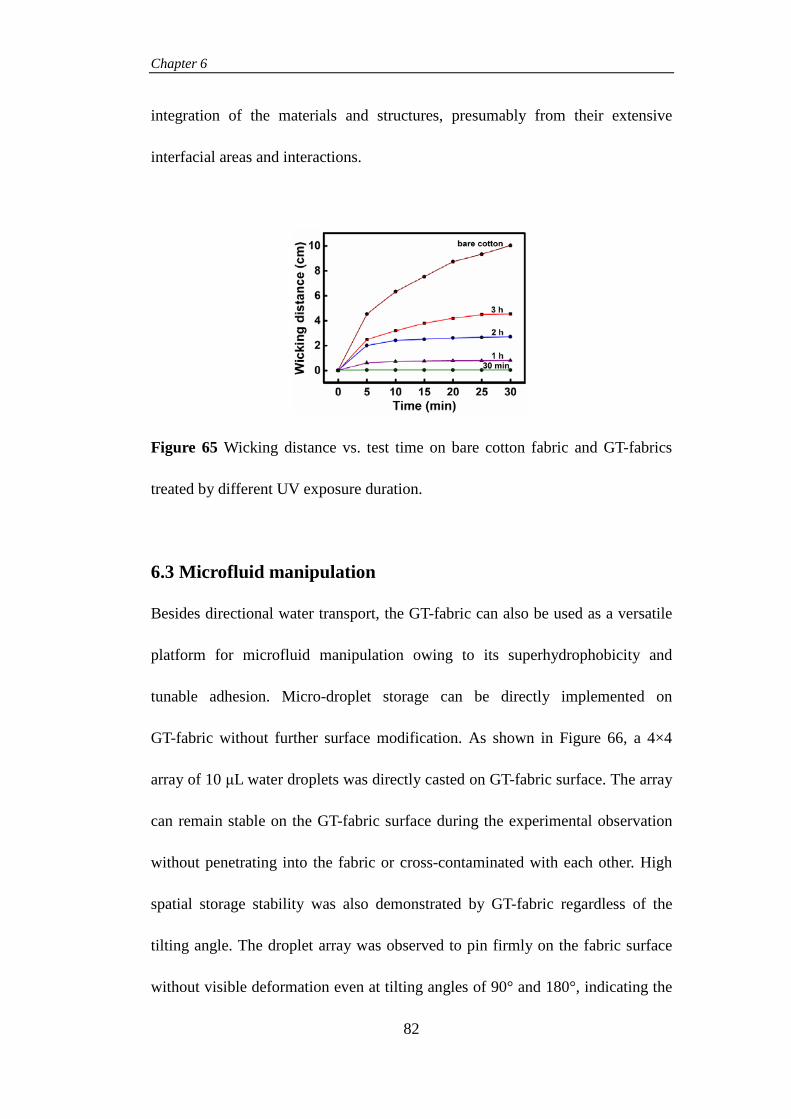
Chapter 6
82
integration of the materials and structures, presumably from their extensive
interfacial areas and interactions.
Figure 65 Wicking distance vs. test time on bare cotton fabric and GT-fabrics
treated by different UV exposure duration.
6.3 Microfluid manipulation
Besides directional water transport, the GT-fabric can also be used as a versatile
platform for microfluid manipulation owing to its superhydrophobicity and
tunable adhesion. Micro-droplet storage can be directly implemented on
GT-fabric without further surface modification. As shown in Figure 66, a 4×4
array of 10 μL water droplets was directly casted on GT-fabric surface. The array
can remain stable on the GT-fabric surface during the experimental observation
without penetrating into the fabric or cross-contaminated with each other. High
spatial storage stability was also demonstrated by GT-fabric regardless of the
tilting angle. The droplet array was observed to pin firmly on the fabric surface
without visible deformation even at tilting angles of 90° and 180°, indicating the

Chapter 6
83
high adhesion state formed between the water droplets and the fabric. This
phenomenon can be attributed to the formation of a metastable partial
impregnated Cassie state between the droplet and the fabric surface. In this case,
both high WCA and high hysteresis are obtained on the three-phase contact line,
as a portion of the air-cushion are still remained.
Figure 66 (a) Photographs of a 4×4 water droplet array casted on the surface of
GT-fabric. (b, c, d) The droplet array remained stable on GT-fabric surface at the
tilting angles of 90° (b) and 180° (c, d).
Utilizing the special hydrophobic state of GT-fabric, novel rotating droplet
transfer can be realized between the fabric and the target substrates. Figure 67
shows the transfer of a 3×3 array of 10 μL water droplets from GT-fabric to the
silicon wafers. Upon rotating the GT fabric attached to one end of a glass stick,
the droplets in the array were subsequently transferred to the silicon wafer
surface, forming a new 3×1 array of larger drops. This unique motion of droplet
manipulation is accomplished by the characteristic high WCA and high
hysteresis on the GT-fabric surface, and only trace amount of droplet residues
was found to remain on the fabric surface. The GT-fabric can also be utilized as a
multifunctional sensing platform for various gas molecules. By casting the

Chapter 6
84
micro-droplet containing specific indicators, different gas sensing arrays can be
fabricated on GT-fabric, including ammonia (NH3), hydrochloric acid (HCl), and
ethylene diamine (EDA), as shown in Figure 68. Both qualitative and
quantitative sensing can be achieved on GT-fabric. In the case of NH3, the
presence of the gas molecule is indicated by the color change of the droplets
from nearly colorless to dark blue. On the other hand, the concentration of the
NH3 gas is indicated by the depth of the blue color, and a linear increase in the
color depth can be observed with increasing NH3 concentrations (Figure 69).
Figure 67 (a) Rotating droplet transfer between the GT-fabric with a 3×3 water
droplet array and the silicon substrate. (b) A 3×1 droplet array on silicon surface
is eventually formed.
Figure 68 (a-f) Different sensing arrays prepared by water droplet loaded with

Chapter 6
85
different indicators. The color changes of the droplet arrays indicate the presence
of specific gas molecules, i.e. ammonia (a, b), HCl (c, d) and EDA (e, f).
Figure 69 (a-h) Sequential images showing the chromatic changes (from nearly
colorless to deep blue) of the gas sensing array correlate to the concentrations of
the ammonia.
Anti-staining property is also observed on the GT-fabric surface as a result of its
superhydrophobicity. Solid stains can be easily removed from GT-fabric surface
regardless of the small particle sizes. To demonstrate the anti-staining effect on
GT-fabric, a small quantity of carbon nanotubes (CNTs) was spread on the fabric
surface, which was subsequently removed by an extremely small quantity of
water (Figure 70). After the removal of the CNTs, there are no either solid or
liquid residues left on the fabric surface, indicating its excellent anti-staining
property.

Chapter 6
86
Figure 70 (a-d) Sequential images showing the removal of the CNT staining
from GT-fabric surface by a single water droplet.
6.4 Oil-water separation
As a result of the full-spectrum tunable wettability and microporosity, rapid
oil-water separation can also be achieved by using GT-fabric as the filtration
membrane. The issue of oil-water separation is widely encountered in many
different engineering fields, ranging from environmental protection, water
treatment, cooling system, to food industry.[112-115] The development of high
performance membrane for oil-water separation is highly desired in the industries.
Considering the scalability of the fabrication process and cost-effectiveness of
the membrane material, GT-fabric is well-suited for meeting the requirement of
rapid oil-water separation, owning to its extremely tunable wettability and high
porosity with nano-pore distribution.
Figure 71 SEM images showing the pore distribution on GT-fabric surface from
top-view (a, b and c), and the pore distribution in the cross-sectional area of

Chapter 6
87
GT-fabric (e, f and g) with the blue circles and red circles to indicate the
inter-yarn pores and the inter-fiber pores, respectively.
The pore structure of GT-fabric was characterized by SEM and the results were
shown in Figure 71. From the top view of GT-fabric (Figure 71a), the closely
woven structure consisting of inter-winded yarns and fibers can be clearly
observed. Magnification view of the fabric surface indicated that majorly the
inter-yarn pores (blue circle) and inter-fiber pores (red circle) were existed on the
fabric (Figure 71b and c). The inter-fiber pores on the fabric can be observed
more comprehensively from the fabric cross-sectional view (Figure 71e), as
micro-channels are found to exist among the adjacent fibers (Figure 71f and g).
By counting several tens of the pores, the size distribution was found to be
between 21-56 μm for the inter-yarn pores and between 0.2-6 μm for the
inter-fiber pores. The water-chloroform mixture was used to demonstrate the
oil-water separation performance of GT-fabric. Due to the superhydrophobicity
of the fabric, the water phase will be prevented from penetrating while the
chloroform is free to flow through. The high porosity of GT-fabric thus resulted
in a high separation speed featured by a flow rate of 3162 ± 128 L m-2 h-1.
Sequential frames showing the separation of a 300 mL water-chloroform mixture
(v/v=1:1) are presented in Figure 72. It can be observed that the separation
process is completed within 30 seconds, indicating the high effectiveness of
GT-fabric in separating the oil-water mixture. The separation efficiency was

Chapter 6
88
calculated to be 99.2% by carefully measuring the weight change of chloroform
before and after the separation process. Besides high speed and high efficiency,
the GT-fabric is also suitable for the separation of different types of oil-water
mixtures. The mixtures of water/hexane, water/dodecane, and water/hexadecane
were also successfully separated by the GT-fabric (Figure 73). For the oil-water
mixture with an oil phase density lower than water, further improvement on the
separation speed can be implemented by tuning the surface wettability of
GT-fabric from superhydrophobic to superhydrophilic. In this case, since the
water phase is heavier than the oil phase, it would penetrate through the
superhydrophilic GT fabric while the oil is impeded, resulted in a fast and
effective gravity-driven separation process.
Figure 72 (a-j) Sequential frames showing the separation process of a
water-chloroform mixture by GT-fabric.

Chapter 6
89
Figure 73 (a-c) The successful separation of different oil-water mixtures by
GT-fabric, i.e. water/hexane (a), water/dodecane (b), and water hexadecane (c).
The high performance in oil-water separation demonstrated by GT-fabric
inevitably reveals the advanced multifunctionality of GT-fabric originated from
the smart graphene/TiO2 nanocoating. It thus envisages that by using the concept
of function-led design in the engineering of smart SHS, not only the desired
functions can be achieved through careful selection of materials and structures,
but also value-added new functions can be generated and extended beyond the
existing functions. Nonetheless, the true power of function-led design may lie in
the realization of high-end integrated functions beyond the scope of design,
which is intriguing and worthy of thinking. Since the stimuli-responsive and
multivariant advanced functions of GT-fabric have been studied comprehensively,
further investigations will be focused on the reasons for the smart responsiveness
showed by the GT-fabric, which emphasize the interfacial interactions on the
TiO2 surface, and at the interface between graphene and TiO2.

Chapter 7
90
Chapter 7. Mechanism study on TiO2 superhydrophilic
conversion and graphene/titania interfacial interaction
7.1 Introduction
The superhydrophilic conversion of TiO2 surface under UV radiation is worthy of
investigation since it acts as the very basis for the full-spectrum wettability
tuning on GT-fabric. A more in-depth understanding on the conversion
mechanism can be used to create new engineering methods to manipulate the
conversion process, resulted in increased conversion speed or controllable degree
of conversion. A novel research approach is used for investigating the
superhydrophilic conversion mechanism on TiO2 surface. The physical structure
changes of the TiO2 under UV are characterized from the macroscopic level (thin
film) to the microscopic level (TiO2 nanocrystal), and a new mechanism is
proposed by interpreting the internally linked experimental evidences. On the
other hand, the role of graphene in the superhydrophilic conversion on the GT
surface is also evaluated. As a result, enhanced conversion rate is obtained in the
presence of graphene, which can be attributed to the accelerated electron-hole
pair separation on TiO2 through the interfacial charge transfer interaction
between the TiO2 and graphene.
7.2 Macroscopical surface change of titania during UV radiation

Chapter 7
91
The macroscopic surface change of titania was observed on a thin film casted
from the as-synthesized TiO2 sol-gel. The TiO2 sol-gel was diluted by D.I. water
and stirred to achieved homogeneous. Afterwards, approximately 0.05 mL of the
TiO2 sol-gel dispersion was casted onto a pre-cleaned silicon wafer. After drying
at ambient, a visually smooth pale TiO2 thin film was formed on the wafer
surface, which was used for further characterization. In order to measure the
macroscopic change on the TiO2 surface upon UV, the thin film was exposed to 3
hours' UV radiation to become superhydrophilic and its surface morphology
change was subsequently characterized by SEM. The as-obtained SEM images
are shown in Figure 74. According to the SEM images, the flat thin film surface
is divided into many fragments by the visible cracks, which then mark the
boundaries between the fragments (Figure 74a). These irregular cracks are
possibly induced by the internal stress of the thin film during the drying process.
However, larger gaps can be observed between the fragments in the pristine thin
film, according to the magnified SEM images (Figure 74b, c). After being
radiated by UV for 3 hours, the large, loosely packed fragments on the surface of
the TiO2 thin film transformed into smaller, compact fragments (Figure 74e), and
the gaps between the fragments were significantly reduced (Figure 74f, g),
indicating a curing effect induced by UV radiation. Tiny TiO2 NPs in the
fragments can be observed upon further increasing the magnification of the SEM
images. However, the TiO2 NPs showed different contrast under the electron
beam before and after the UV treatment (Figure 74d, h), indicating the possible

Chapter 7
92
micro-structural change, which should be measured in a smaller scale.
Figure 74 SEM images showing the surface morphologies of the TiO2 thin film
before (a-d) and after (e-h) UV radiation for 3 hours.
Figure 75 AFM image of the TiO2 thin film surface. The topographical structure
of the TiO2 NPs can be clearly observed at the nanoscale.
Figure 76 AFM image of the 3h-UV treated TiO2 thin film. Clear topographical
structure changes can be observed as compared to the pristine film. The TiO2

Chapter 7
93
NPs collide with each other to form larger clusters.
Atomic force microscopy (AFM) was subsequently applied to investigate the
microstructural change on the TiO2 surface during UV radiation. The sample for
AFM was prepared by firstly drop-casting 0.05 mL of the graphene dispersion
obtained from the fabric reduction process; and the subsequently drop-casting of
the 10-times-diluted titania nanosol (0.05 mL) on top of the graphene layer,
which mimicked the hierarchical GT coating on the fabric surface. For the TiO2
surface before UV radiation, it is majorly composed of TiO2 NPs with the sizes
between 12 and 39 nm. A roughness factor Rq=4.65 nm was also obtained by
calculating the surface topography of the TiO2 thin film based on the AFM image
(Figure 75). However, a significant change on the NP sizes was observed in the
AFM image of 3h-UV treated TiO2 thin film, as the sizes increased to between 24
and 31 nm (Figure 76). The Rq was also increased to 5.34 nm on TiO2 surface
after 3h-UV radiation. Nonetheless, the increase in the NP size indicates a
homogenization and secondary crystal growth processes induced by UV
treatment, by which the NP fusion and collision may occur. This homogenization
process in the microscale is also coincident with the curing of the fragment
boundaries in the macroscale. The fusion and re-growth of the NPs can be
observed more clearly in the topographical phase images, as the pristine high
density sharp phase edges collided into flattened, bigger structures after the UV
treatment (Figure 77a, b). By re-constructing the AFM images into 3D

Chapter 7
94
simulations, a clear fused and flattened surface with expanded structural unit
volume can be observed after UV (Figure 78b), as compared to the sharp and
extruded surface microtexture before the UV treatment (Figure 78a). However,
the fusion and collision of TiO2 NPs during UV radiation should induce by the
change of their crystalline structure, accompanied with the atomic rearrangement
at the angstrom level (10-10 m). To gain a comprehensive roadmap of the
superhydrophilic conversion process, it is necessary to further obtain the
information in the extremely small scale.
Figure 77 Phase images of the pristine (a) and the 3h-UV treated (b) TiO2 thin
film.
Figure 78 3D topographical model of the pristine (a) and 3h-UV treated (b) TiO2
thin film surface. Clear fusion and flattening of the surface microstructures can
be observed after UV radiation.

Chapter 7
95
7.3 Microscopical surface change of titania during UV radiation
HRTEM was used to characterize the change on TiO2 surface during UV
radiation at the atomic scale. The lattice structure of the TiO2 NPs can be clearly
observed in the as-obtained HRTEM image (Figure 79). Information regarding
the crystalline facet of the NPs was obtained by analyzing the lattice spacing of
the nanocrystals in the HRTEM image. For the pristine TiO2 NPs, a uniform
lattice spacing of 0.35 nm was measured by counting tens of the nanocrystals,
corresponding to the (101) lattice reflection of anatase TiO2 (Figure 80). It thus
indicated that the NPs were in the anatase phase with {101} facet exposed on the
surface, which was coincident with the previous characterizations (e.g. TEM &
XRD). The nanocrystals of TiO2 NPs were also found to orient along the [001]
direction, as indicated by the lattice angle of 68.3° between the [001] and [101]
direction, and the high intensity of (004) diffraction in the XRD spectrum.
However, after being exposed to UV radiation, a drastic change on the lattice
structure of TiO2 nanocrystals was observed (Figure 81). By carefully analyzing
the crystalline structure in the HRTEM image, a lattice spacing of 0.23 nm can be
observed for the nanocrystals of TiO2 NPs, corresponding to the (001) lattice
reflection of anatase TiO2 (Figure 82). It thus revealed a substantial lattice
structure transformation from {101} to {001} on TiO2 surface during UV
radiation. Nonetheless, this atomic scale rearrangement may eventually result in
the macroscopic changes as-observed, including the fusion and flattening of the
surface microtexture, and the curing of the cracks on the TiO2 thin film.

Chapter 7
96
Figure 79 HRTEM image of the TiO2 NPs in the TiO2 thin film, the lattice
structure of the individual NP can be clearly observed. The numbers indicate the
NPs used for the counting purpose.
Figure 80 Magnified HRTEM images of the TiO2 NPs with the lattice spacing
indexed. The numbers correspond to the TiO2 NPs counted in Figure 79.

Chapter 7
97
Figure 81 HRTEM images showing the TiO2 NPs in the 3h-UV treated TiO2 thin
film. The lattice structure of the NPs is also clearly observed and the NPs used
for the counting purpose are indexed by the numbers.
Figure 82 Magnified TEM images showing the lattice spacing of the TiO2 NPs.
The numbers in the image correspond to the TiO2 NP counted in Figure 81.
Based on these discoveries, the unseen process of the superhydrophilic
conversion on TiO2 can be even traced down to the sub-atomic level. As the TiO2
nanocrystal was radiated by UV, extensive electron-hole recombination happened
on {101} facet, which resulted in substantial heat release to induce the partial

Chapter 7
98
melting of the nanocrystal.[116] This particle melting may subsequently trigger the
atomic rearrangement on the nanocrystal through a solid-liquid process, which
generates more thermodynamically stable {001} facet under this circumstance. It
was speculated that a heterojunction between {101} and {001} facets was
formed on TiO2 nanocrystals during UV radiation. The presence of this
heterojunction significantly enhanced the electron-hole pair separation on the
TiO2 surface. As the electron-hole pair was separated on the heterojunction, the
electrons were moved to {101} facet and the holes were moved to {001} facet.
As a result, the {001} facet may have higher oxidation potential while higher
reduction potential is expected on {101} facet. A schematic illustration of the
transformation process is shown in Figure 83. The holes on {001} facet can
further break the covalent bonds between titanium atom and oxygen atom,
resulting in surface active sites such as Ti3+ and oxygen vacancy. The surface
active sites further react with adsorbed water molecules to generate new
hydroxyl groups on the TiO2 surface, which significantly enhance the surface
hydrophilicity. The generation of hydroxyl groups on TiO2 surface during UV
radiation was confirmed by X-ray photoelectron spectroscopy (XPS). The XPS
spectra were taken on the pristine TiO2 thin film and the thin film exposed to
3h-UV radiation (Figure 84a, b). The abundance of surface hydroxyl groups is
indicated by the deconvoluted components of the O1s peak at 530.8 eV. As can
be observed from the XPS spectra, the O1s peak is essentially deconvoluted into
three sub-components, which correspond to the binding energy of lattice oxygen

Chapter 7
99
(O-Ti-O), surface hydroxyl group (Ti-OH), and adsorbed water molecule (H2O).
It can be clearly observed that both the intensities of O-Ti-O and H2O decrease
after the UV treatment, while the intensity of Ti-OH increases. It thus indicates
the possible reaction between the lattice oxygen and adsorbed H2O, which
produces new hydroxyl groups on TiO2 surface.
Figure 83 Schematic illustration of lattice transformation on the anatase TiO2
crystal surface induced by UV radiation. The upper graph (a) illustrates the
structural change of the TiO2 crystals during UV and the bottom graph (b) depicts
the electron-hole pair separation at the {001}/{101} heterojunction.
Figure 84 O1s XPS spectra of the pristine (a) and 3h-UV treated TiO2 thin film
(b). The O1s peak is deconvoluted into three sub-components of the lattice
oxygen (Ti-O-Ti), surface hydroxyl group (Ti-OH), and adsorbed water (H2O).

Chapter 7
100
7.4 Interfacial interaction between graphene and titania
It is envisaged that extensive interfacial interactions may exist between graphene
and TiO2 NPs as a result of their extremely small size and excellent electronic
property. Extensive research effort has been devoted to the development of high
performance graphene/TiO2 composite system with various structures and forms.
Based on the results of these research work, new types of interfacial interactions
which deliver enhanced material functions have been widely observed.[117-121] In
the present study, enhanced charge transfer interactions are believed to exist at
the interface between the hierarchically nanostructured graphene and TiO2. As a
result of this enhanced charge transfer interaction, both the rate and extent of
superhydrophilic conversion on TiO2 NP surface are substantially improved,
which constitutes the very basis for the stimuli-responsive full-spectrum
wettability tuning on the GT fabric.
To evaluate the effect of graphene in superhydrophilic conversion, three different
types of thin films, including hierarchical graphene/titania (GT), sole titania, and
sole graphene, were casted on silicon wafer and their changes in water contact
angles were measured before and after 3h-UV treatment (Figure 85). The pristine
WCAs on the thin films are following the order of graphene > GT > TiO2, which
is reasonable since the CA of GT surface locates between graphene and TiO2
(Figure 85a-c). However, the order becomes graphene > TiO2 > GT as the thin

Chapter 7
101
films are exposed to UV radiation (Figure 85 d-e). In this regard, the GT surface
showed both the highest rate and extent for superhydrophilic conversion, which
were superior to the sole TiO2 surface, indicating the substantial enhancement
induced by graphene. Besides, a large increase in WCA was also observed on the
sole graphene surface. Compared to the reduction of WCA on the GT and TiO2
surface during UV, the increase of WCA on graphene surface can be possibly
attributed to the increase in surface roughness, and the hydrophobicity on the
graphene surface is further improved.[122] The recovery rate of the thin films
under dark storage was also studied (Figure 86). It is not surprised to observe that
the GT surface showed the highest recovery rate and the recovery efficiency, as it
can fully restore the original WCA in 72 hours’ dark storage, regardless of its
lowest WCA after UV treatment. However, the sole TiO2 surface showed much
slower recovery rate and efficiency, which may require more than 96 hours to
nearly restore the original state. Furthermore, the recovery curves of GT and
graphene showed similar trends during dark storage, representing both high rates
and efficiencies. It thus evidenced the essential role of graphene in accelerating
the superhydrophilic conversion process.
Figure 85 Photographs showing the contact angle of a 1 μL water droplet on the

Chapter 7
102
GT (a, d), TiO2 (b, e) and graphene (c, f) surfaces. The upper images show the
water contact angles on the pristine surfaces while the bottom images show the
water contact angles after 3 hours' UV radiation.
Figure 86 The contact angle changes on the GT (red circle), TiO2 (blue triangle)
and graphene (black square) surfaces as a function of time. The point 0 at the
x-axis represents the pristine state while point 1 represents the state after 3h-UV
radiation. Point 2, 3, 4, 5 represent the dark storage time of 24, 48, 72, and 96
hours, respectively.
It is speculated that graphene enhances the superhydrophilic conversion on TiO2
surface through interfacial charge transfer interaction. As a result of the low
reduction potential, graphene can effectively function as an electron acceptor in
the hierarchical GT system. In this case, the efficiency of electron-hole pair
separation on the TiO2 surface during UV will be considerably improved, as the
generated electron is transferred to graphene, the equilibrium of the separation
reaction will be shifted to the right-hand side, which favors a higher separation
rate. The enhanced electron-hole pair separation on TiO2 surface thus accelerates

Chapter 7
103
the superhydrophilic conversion process via faster lattice transformation and
surface structure re-configuration. The enhanced lattice transformation is also
indicated by the changes in XPS spectrum of GT surface when UV is applied
(Figure 87). As can be seen from the O1s XPS spectra of GT surface, a higher
intensity of Ti-OH can be obtained after the UV treatment (Figure 87b), as
compared to the pristine GT surface (Figure 87a). This phenomenon thus reveals
a higher rate of formation for the surface hydroxyl groups on GT surface, which
is associated with a faster lattice transformation process.
Figure 87 O1s XPS spectra of the pristine (a) and 3h-UV treated (b) GT surfaces.
The O1s peak is deconvoluted into three components of lattice oxygen (Ti-O-Ti),
surface hydroxyl group (Ti-OH) and adsorbed water (H2O).
To make a summary, the underlying processes of superhydrophilic conversion on
TiO2 surface were investigated comprehensively both in the macroscopic and
microscopic levels. A new mechanism regarding the superhydrophilic conversion
is proposed, which highlights the micro to macro structural changes on TiO2
surface during UV radiation. It is speculated that the interfacial charge transfer
interaction between graphene and TiO2 enhances the electron-hole pair

Chapter 7
104
separation on the heterojunction between {101} and {001}, which subsequently
accelerates the lattice transformation of the {101} facet into {001} facet.
Hydrophilic surface hydroxyl groups are generated during the transformation and
they also induce structural reconfiguration at the larger scale. The corresponding
fusion and flattening are observed on the surface microstructures of TiO2 thin
film, and a micro-crack healing process is also observed, resulting in a roughened,
superhydrophilic TiO2 surface with zero water contact angle.

Chapter 8
105
Chapter 8. Conclusion and future work
In conclusion, novel graphene coated cotton fabric (G-fabric) has been
synthesized using a simple dip-coating method. The hydrophilic cotton fabric
turned hydrophobic with extremely low graphene loading (less than 0.5 wt%),
and tunable wettability can be obtained by the absorption of small molecules, i.e.
water and acetone, onto the G-fabric surface. To further improve the precision
and speed of the wettability tuning on the G-fabric surface, the concept of
function-led design is utilized to direct both the material and structural
engineerings that necessary to achieve the targeted functions. The as-developed
hierarchical graphene/titania nanofilm coating with dual roughness on cotton
fabric (GT-fabric) showed unique full-spectrum tuning of wettability with precise
control over the water/substrate interactions such as transport, adhesion and
spreading. Based on the full-spectrum tuning of wettability on GT-fabric, three
innovative functional aspects can be realized, including:
(i) Spontaneous directional water transport in the axial direction of the fabric,
which can be subsequently utilized for the micro-environment control,
such as humidity and moisture management. By changing the duration
and intensity of the UV radiation, the water transport speed can be
facilely tuned from low to high on GT-fabric, which indicates its
application potential in control release and microfluidic device.
(ii) Multivariant microfluidic manipulation can be achieved on GT-fabric

Chapter 8
106
surface by tuning the water adhesion. By carefully selecting the size of
droplet, micro-droplet arrays demonstrating high adhesion on GT-fabric
can be obtained. The droplet arrays are stable regardless the configuration
of GT-fabric. Dynamic manipulative motions, such as droplet transfer and
droplet sensing can also be realized, which demonstrate the potential for
no-loss droplet transfer and high chromatic gas sensing.
(iii) Excellent oil-water separation performance with both high speed and
separation efficiency can also be achieved on GT-fabric. As a result of the
superhydrophobicity and high porosity of GT-fabric, the oil phase can
pass through it with high flow rate and low pressure requirement, which
can be purely gravity-driven. In the case that the oil phase has a lower
density than water, the GT-fabric can be switched to the superhydrophilic
state, which grants the water passage and impedes the oil penetration.
The novel function-led design concept not only realizes the full-spectrum
wettability tuning on cotton fabric but also generates multiple new functions for
various innovative applications. It thus envisages that the function-led criterion
may bring about the unprecedented functional aspects beyond the scope of
design, as a result of the extensive interfacial interactions between the integrated
materials and structures. However, new theories and mechanisms can also be
generated from the function-led design process, from which the normal
phenomenon can be viewed in a different and intriguing angle.

Chapter 8
107
The superhydrophilic conversion on titania surface is also studied by using
GT-fabric as the model system. The stable superhydrophobicity and high
conversion speed on the GT-fabric surface are found to correlate with the
interfacial charge transfer interaction between graphene and TiO2 NPs. The
charge transfer interaction thus accelerates the electron-hole pair separation on
TiO2 surface during UV radiation and subsequently triggers a unique lattice
transformation from {101} to {001} on TiO2. As being viewed from
microscopically to macroscopically, the lattice transformation is correlated to the
microstructural fusion and flattening, which subsequently induce the micro-crack
healing process on the TiO2 thin film surface, and generate a higher surface
roughness. The generation of hydrophilic hydroxyl groups on {001} facets
during lattice transformation and the enhanced surface roughness both increase
the hydrophilicity of the TiO2 NPs at the microscale, which are eventually
magnified and turned into the as-observed superhydrophilicity at the macroscale.
On the other hand, the function-led design directs the specific fabrication process
of the SHS with desired functions, from the steps of material selection, structural
configuration, to function realization. However, since the function-led design is a
typical reverse-engineering process and its ultimate target is to achieve the
desired functions, the innovative functions may serve as the initiatives for the
function-led design. In the field of SHS, the state-of-the-art developmental trends
in the functional aspects may include:

Chapter 8
108
(i) The fabrication of SHS with extremely super-repellent property, or
omniphobicity. Compared to the water-repellent SHS, the super-repellent
SHS can effectively de-wet from both water and low surface energy oil,
even fluorocarbon. It can also remain non-wetting in the extreme
application environment, such as in high pressure, high temperature, and
high humidity conditions.
(ii) The fabrication of SHS with stimuli-responsive, tunable wettability.
Tunable wettability is essential for the SHS to switch their functions
under different application conditions, which enables smart features on
SHS such as directional spreading, tunable adhesion, and no-loss
transport. The SHS with programmable wettability is also essential to
achieve specific high-end applications, which require the integration and
cooperation between the hydrophilic and hydrophobic regions, such as
mist collection.
(iii) The fabrication of robust SHS under dynamic interfacial interaction. As
the real-field applications require robust SHS which is stable and durable
in the conditions provided, new types of SHS which not only obtain the
superhydrophobicity under static water contact, but also possess the
preferred liquid-solid interactions under dynamic interactions are urgently
needed. These innovative types of SHS may possess new functions such
as accelerated droplet bouncing, droplet trampolining in reduced pressure,
droplet mobility during vaporization, self-healing and highly resistant to

Chapter 8
109
the mechanical deformation.

References
110
References
[1] L. Feng, S. Li, Y. Li, H. Li, L. Zhang, J. Zhai, Y. Song, B. Liu, L. Jiang, D.
Zhu, Adv. Mater., 2002, 14, 1857-1860.
[2] M. J. Hancock, K. Sekeroglu, M. C. Demirel, Adv. Funct. Mater., 2012, 22,
2223-2234.
[3] W. Barthlott. Die Selbstreinigungsfähigkeit pflanzlicher Oberflächen durch
Epicuticularwachse. In Klima- und Umweltforschung an der Universität
Bonn, Rheinische Friedrich-Wilhelms-Universität, Bonn, Ed., Bornemann:
Bonn, 1992, pp 117–120.
[4] B. Bhushan, Y. C. Jung, K. Koch, Phil. Trans. R. Soc. A, 2009, 367,
1631-1672.
[5] Y. H. Sung, Y. D. Kim, H. J. Choi, R. Shin, S. Kang, H. Lee, Appl. Surf. Sci.,
2015, 349, 169-173.
[6] J. P. Lee, S. Choi, S. Park, Langmuir, 2011, 27, 809-814.
[7] X. Wang, X. Cai, Q. Guo, T. Zhang, B. Kobe, J. Yang, Chem. Commun.,
2013, 49, 10064-10066.
[8] Y. Liu, L. Moevius, X. Xu, T. Qian, J. M. Yeomans, Z. Wang, Nat. Phys.,
2014, 10, 515-519.
[9] H. R. Jiang, D. C. Chan, Appl. Phys. Lett., 2016, 108, 171603.
[10] N. Miljkovic, R. Enright, Y. Nam, K. Lopez, N. Dou, J. Sack, E. N. Wang,
Nano Lett., 2013, 13, 179-187.
[11] D. Quere, Physica A, 2002, 313, 32-46.

References
111
[12] Nakajima, NPG Asia Mater., 2011, 3, 49-56.
[13] H. Park, H. Park, J. Kim, Phys. Fluids, 2013, 25, 110815.
[14] B. Lautrup, Physics of Continuous Matter, Second Edition: Exotic and
Everyday Phenomena in the Macroscopic World, CRC Press, 2011, Ch 5.
[15] R. N. Wenzel, Ind. Eng. Chem., 1936, 28, 988–994.
[16] A. B. D. Cassie, S. Baxter, Trans. Faraday Soc., 1944, 40, 546–551.
[17] A. Lafuma, D. Quere, Nat. Mater., 2003, 2, 457-462.
[18] J. Bico, U. Thiele, D. Quere, Colloids Surf. A, 2002, 206, 41–46.
[19] S. Shibuichi, T. Onda, N. Satoh, K. Tsujii, J. Phys. Chem., 1996, 100,
19512–19517.
[20] H. Y. Erbil, C. E. Cansoy, Langmuir, 2009, 25, 14135-14145.
[21] N. A. Patankar, Langmuir, 2010, 26, 7498-7503.
[22] P. Forsberg, F. Nikolajeff, M. Karlsson, Soft Matter, 2011, 7, 104-109.
[23] W. Barthlott, C. Neinhuis, Planta, 1997, 202, 1-8.
[24] H. J. Ensikat, P. Ditsche-Kuru, C. Neinhuis, W. Barthlott, Beilstein J.
Nanotechnol., 2011, 2, 152-161.
[25] J. T. Han, Y. Jang, D. Y. Lee, J. H. Park, S. H. Song, D. Y. Ban, K. Cho, J.
Mater. Chem., 2005, 15, 3089-3092.
[26] H. Y. Erbil, A. L. Demirel, Y. Avci, O. Mert, Science, 2003, 299,
1377-1380.
[27] J. Lu, Y. Yu, J. Zhou, L. Song, X. Hu, A. Larbot, Appl. Surf. Sci., 2009, 255,
9092-9099.
References
112
[28] M. F. Wang, N. Raghunathan, B. Ziaie, Langmuir, 2007, 23, 2300-2303.
[29] D. J. Babu, S. N. Varanakkottu, A. Eifert, D. Koning, G. Cherkashinin, S.
Hardt, J. J. Schneider, Adv. Mater. Inter., 2014, 1, 1300049.
[30] D. Goswami, S. K. Medda, G. De, ACS Appl. Mater. Inter., 2011, 3,
3440-3447.
[31] B. Qian, Z. Shen, Langmuir, 2005, 21, 9007-9009.
[32] M. Qu, B. Zhang, S. Song, L. Chen, J. Zhang, X. Cao, Adv. Funct. Mater.,
2007, 17, 593-596.
[33] H. C. Barshilia, N. Gupta, Vacuum, 2014, 99, 42-48.
[34] V. D. Ta, A. Dunn, T. J. Wasley, J. Li, R. W. Kay, J. Stringer, P. J. Smith, E.
Esenturk, C. Connaughton, J. D. Shephard, Appl. Surf. Sci., 2016, 365,
153-159.
[35] M. R. Cardoso, V. Tribuzi, D. T. Balogh, L. Misoguti, C. R. Mendonca,
Appl. Surf. Sci., 2011, 257, 3281-3284.
[36] E. K. Her, T. J. Ko, B. Shin, H. Roh, W. Dai, W. K. Seong, H. Y. Kim, K. R.
Lee, K. H. Oh, M. W. Moon, Plasma Process. Polym., 2013, 10, 481-488.
[37] A. Tuteja, W. Choi, G. H. Mckinley, R. E. Cohen, M. F. Rubner, MRS Bull.,
2008, 33, 752-758.
[38] Microfabricated Technologies. Retrieved July 21, 2016, from MechanoBio Info:
https://www.mechanobio.info/topics/methods/microfabricated-technologies/.
[39] H. Zhao, K. Y. Law, V. Sambhy, Langmuir, 2011, 27, 5927-5935.
[40] L. Chen, Z. Xiao, C. H. Chan, Y. K. Lee, J. Micromech. Microeng., 2010,

References
113
20, 105001.
[41] B. Bhushan, Y. C. Jung, Ultramicroscopy, 2007, 107, 1033-1041.
[42] A. Tuteja, W. Choi, M. Ma, J. M. Mabry, S. A. Mazzella, G. C. Rutledge, G.
H. McKinley, R. E. Cohen, Science, 2007, 318, 1618-1622.
[43] A. Tuteja, W. Choi, J. M. Mabry, G. H. McKinley, R. E. Cohen, Proceed.
Natl. Acad. Sci., 2008, 105, 18200-18205.
[44] Y. Rahmawan, M. W. Moon, K. S. Kim, K. R. Lee, K. Y. Suh, Langmuir,
2010, 26, 484-491.
[45] G. Saini, K. Sautter, F. E. Hild, J. Pauley, M. R. Linford, J. Vac. Sci.
Technol. A, 2008, 26, 1224-1234.
[46] C. M. Chen, C. L. Chiang, C. L. Lai, T. Xie, S. Yang, Adv. Funct. Mater.,
2013, 23, 3813-3823.
[47] C. M. Chen, S. Yang, Adv. Mater., 2014, 26, 1283-1288.
[48] O. A. Louchev, Y. Sato, H. Kanda, Appl. Phys. Lett., 2002, 80, 2752.
[49] P. J. F. Harris, Carbon, 2007, 45, 229-239.
[50] J. P. Tessonnier, D. S. Su, ChemSusChem, 2011, 4, 824-847.
[51] M. J. Hampden-Smith, T. T. Kodas, Chem. Vap. Deposition, 1995, 1, 8-23.
[52] T. Maruyama, S. Arai, Appl. Phys. Lett., 1992, 60, 322.
[53] A. N. MacInnes, M. B. Power, A. R. Barron, Chem. Mater., 1992, 4, 11-14.
[54] P. M. Smith, J. S. Custer, Appl. Phys. Lett., 1997, 70, 316.
[55] E. Papazoglou, T. W. F. Russell, J. Vac. Sci. Technol., 1987, 5, 3378.
[56] Z. Xue, K. G. Caulton, M. H. Chisholm, Chem. Mater., 1991, 3, 384-386.

References
114
[57] F. Zhang, K. Sautter, A. M. Larsen, D. A. Findley, R. C. Davis, H. Samha,
M. R. Linford, Langmuir, 2010, 26, 14648-14654.
[58] J. Benson, S. Boukhalfa, A. Magasinski, A. Kvit, G. Yushin, ACS Nano,
2012, 6, 118-125.
[59] J. Yun, T. S. Bae, J. D. Kwon, S. Lee, G. H. Lee, Nanoscale, 2012, 4,
7221-7230.
[60] M. Ma, Y. Mao, M. Gupta, K. K. Gleason, G. C. Rutledge, Macromolecules,
2005, 38, 9742-9748.
[61] G. Che, B. B. Lakshmi, C. R. Martin, E. R. Fisher, Chem. Mater., 1998, 10,
260-267.
[62] A. Colli, A. Fasoli, P. Beecher, P. Servati, S. Pisana, Y. Fu, A. J. Flewitt, W. I.
Milne, J. Robertson, C. Ducati, S. De Franceschi, S. Hofmann and A. C.
Ferrari, J. Appl. Phys., 2007, 102, 034302.
[63] D. C. Kim, B. H. Kong, H. K. Cho, J. Mater. Sci.: Mater. Electron., 2008, 19,
760-763.
[64] Plasma enhanced chemical vapor deposition. Retrieved July 21, 2016, from LNF Wiki:
http://lnf-wiki.eecs.umich.edu/wiki/Plasma_enhanced_chemical_vapor_deposition.
[65] X. Wang, C. J. Summers, Z. L. Wang, Nano Lett., 2004, 4, 423-426.
[66] Y. Li, M. Zheng, L. Ma, M. Zhong, W. Shen, Inorg. Chem., 2008, 47,
3140-3143.
[67] B. Bhushan, M. Nosonovsky, Phil. Trans. R. Soc. A, 2010, 368, 4713-4728.
[68] L. Zhang, D. E. Resasco, Langmuir, 2009, 25, 4792-4798.

References
115
[69] H. Li, X. Wang, Y. Song, Y. Liu, Q. Li, L. Jiang, D. Zhu, Angew. Chem. Int.
Ed., 2001, 40, 1743-1746.
[70] K. K. S. Lau, J. Bico, K. B. K. Teo, M. Chhowalla, G. A. J. Amaratunga, W.
I. Milne, G. H. McKinley, K. K. Gleason, Nano Lett., 2003, 3, 1701-1705.
[71] J. Zimmermann, F. A. Reifler, G. Fortunato, L. C. Gerhardt, S. Seege, Adv.
Funct. Mater., 2008, 18, 3662-3669.
[72] H. Ogihara, J. Xie, J. Okagaki, T. Saji, Langmuir, 2012, 28, 4605-4608.
[73] X. Gao, J. Zhou , R. Du , Z. Xie , S. Deng , R. Liu , Z. Liu , Ji. Zhang, Adv.
Mater., 2016, 28, 168-173.
[74] J. Vasiljevic, M. Gorjanc, B. Tomsic, B. Orel, I. Jerman, M. Mozetic, A.
Vesel, B. Simoncic, Cellulose, 2013, 20, 277-289.
[75] A. C. Glavan, R. V. Martinez, A. B. Subramaniam, H. J. Yoon, R. M. D.
Nunes, 76H. Lange, M. M. Thuo, G. M. Whitesides, Adv. Funct. Mater.,
2014, 24, 60-70.
[76] X. Jin, B. Shi, L. Zheng, X. Pei, X. Zhang, Z. Sun, Y. Du, J. H. Kim, X.
Wang, S. Dou, K. Liu, Lei Jiang, Adv. Funct. Mater., 2014, 24, 2721-2726.
[77] A. Rizvi, R. K. M. Chu, J. H. Lee, C. B. Park, ACS Appl. Mater. Inter., 2014,
6, 21131-21140.
[78] E. Singh, Z. Chen, F. Houshmand, W. Ren, Y. Peles, H. M. Cheng, N.
Koratkar, Small, 2013, 9, 75-80.
[79] K. Ji, J. Liu, J. Zhang, J. Chen, Z. Dai, J. Mater. Chem. A, 2014, 2 16589.
[80] T. S. Wong, S. H. Kang, S. K. Y. Tang, E. J. Smythe, B. D. Hatton, A.

References
116
Grinthal, J. Aizenberg, Nature, 2011, 477, 443-447.
[81] T. Liu, C. J. Kim, Science, 2014, 346, 1096-1100.
[82] A. Gauthier, S. Symon, C. Clanet, D. Quere, Nat. Commun., 2015, 6, 8001.
[83] J. C. Bird, R. Dhiman, H. M. Kwon, K. K. Varanasi, Nature, 2013, 503,
385-388.
[84] T. Verho, C. Bower, P. Andrew, S. Franssil, O. Ikkala, R. H. A. Ras, Adv.
Mater., 2011, 23, 673-678.
[85] L. Gao, Y. Lu, X. Zhan, J. Li, Q. Sun, Surf. Coat. Technol., 2015, 262,
33-39.
[86] H. Tian, F. Wang, S. Ge, J. Ou, W. Li, S. Yu, RSC Adv., 2016, 6. 28563.
[87] P. Guo, Y. Zheng, M. Wen, C. Song, Y. Lin, L. Jiang, Adv. Mater., 2012, 24,
2642-2648.
[88] P. Papadopoulos, L. Mammen, X. Deng, D. Vollmer, H. Butt, Proceed. Nat.
Acad. Sci. USA, 2013, 110, 3254-3258.
[89] X. Deng, L. Mammen , Y. Zhao , P. Lellig , K. Müllen , C. Li ,H. Butt , D.
Vollmer, Adv. Mater., 2011, 23, 2962-2965.
[90] J. Seo, S. K. Lee1, J. Lee, J. S. Lee, H. Kwon, S. W. Cho, J.-H. Ahn, T. Lee,
Sci. Rep., 2015, 5, 12326.
[91] X. Zhu, Z. Zhang, X. Men, J. Yang, K. Wang, X. Xu, X. Zhou, Q. Xue, J.
Mater. Chem., 2011, 21, 15793.
[92] N. Wang, D. Xiong, Y. Deng, Y. Shi, K. Wang, ACS Appl. Mater. Inter.,
2015, 7, 6260-6272.

References
117
[93] H. Zhou, H. Wang, H. Niu, A. Gestos, X. Wang, T. Lin, Adv. Mater., 2012,
24, 2409-2412.
[94] Y. Li, L. Li, J. Sun, Angew. Chem., 2010, 122, 6265-6269.
[95] Y. Li, S. Chen, M. Wu, J. Sun, Adv. Mater., 2014, 26, 3344-3348.
[96] K. Chen, S. Zhou, S. Yang, L. Wu, Adv. Funct. Mater., 2015, 25,
1035-1041.
[97] E. Huovinen, L. Takkunen, T. Korpela, M. Suvanto, T. T. Pakkanen, T. A.
Pakkanen, Langmuir, 2014, 30, 1435-1443.
[98] Y. Xu, H. Bai, G. Lu, C. Li, G. Shi, J. Am. Chem. Soc. 2008, 130,
5856-5857.
[99] K. Qi, X. Wang, J. H. Xin, Text. Res. J. 2011, 81, 101-110.
[100] A. W. Robertson, J. H. Warners, Nano. Lett. 2011, 11, 1182-1189.
[101] Z. Wang, J. Wang, Z. Li, P. Gong, X. Liu, L. Zhang, J. Ren, H. Wang, S.
Yang, Carbon, 2012, 50, 5403-5410.
[102] J. H. Walther, T. Werder, R. L. Jaffe, P. Gonnet, M. Bergdorf, U. Zimmerli,
P. Koumoutsakos, Phys. Chem. Chem. Phys., 2004, 6, 1988-1995.
[103] S. Wang, Y. Zhang, N. Abidi, L. Cabrales, Langmuir, 2009, 25,
11078-11081.
[104] P. Y. Chen, J. Sodhi, Y. Qiu, T. M. Valentin, R. S. Steinberg, Z. Wang, R. H.
Hurt, I. Y. Wong, Adv. Mater., 2016, 28, 3564-3571.
[105] J. Rafiee, M. A. Rafiee, Z. Z. Yu, N. Koratkar, Adv. Mater., 2010, 22,
2151-2154.

References
118
[106] H. L. karlsson, P. Cronholm, J. Gustafsson, L. Moller, Chem. Res. Toxicol.,
2008, 21, 1726-1732.
[107] N. Sakai, A. Fujishima, T. Watanabe, K. Hashimoto, J. Phys. Chem. B,
2003, 107, 1028-1035.
[108] A. Borras, A. Barranco, A. R. Gonzalez-Elipe, Langmuir, 2008, 24,
8021-8026.
[109] Y. Lai, C. Lin, H. Wang, J. Huang, H. Zhuang, L. Sun, Electrochem.
Commun., 2008, 10, 387-391.
[110] W. A. Daoud, J. H. Xin, J. Am. Ceram, Soc., 2004, 87, 953-955.
[111] K. Hashimoto, H. Irie, A. Fujishima, Japan. J. Appl. Phys., 2005, 44,
8269-8285.
[112] A. B. Nordvic, J. L. Simmons, K. R. Bitting, A. Lewis, T.
Strom-Kristiansen, Spill Sci. Technol. Bull., 1996, 3, 107-122.
[113] C. Gao, Z. Sun, K. Li, Y. Chen, Y. Cao, S. Zhang, L. Feng, Energy
Environ. Sci., 2013, 6, 1147.
[114] A. Horak, M. Raudensky, M. Pohanka, H. Bellerov, T. Reichard, Eng.
Mech., 2011, 18, 81-89.
[115] E. Ankyu, J. Dev. Sust. Agr., 2015, 10, 101-106.
[116] S. Leytner, J. T. Hupp , Chem. Phys. Lett., 2000 , 330 , 231 .
[117] Y. Zhang, Z. R. Tang, X. Fu, Y. J. Xu, Nano Lett., 2010, 4, 7303-7314.
[118] C. Xiang, M. Li, M. Zhi, A. Manivannan, N. Wu, J. Mater. Chem., 2012,
22, 19161.

References
119
[119] G. T. S. How, A. Pandikumar, H. N. Ming, L. H. Ngee, Sci. Rep., 2014, 4,
5044.
[120] W. N. Wang, Y. Jiang, J. D. Fortner, P. Biswas, Environ. Eng. Sci., 2014, 31,
428-434.
[121] A. Dey, S. Hadavale, M. A. S. Khan, P. More, P. K. Khanna, A. K. Sikder,
S. Chattopadhyay, Dalton Trans., 2015, 44, 19248.
[122] S. Herminghaus, Europhys. Lett., 2000, 52, 2.


![Biofabricating Multifunctional Soft Matter with Enzymes ... · [1–4 ] Over the last decade, several stimuli-responsive bio-logical polymers have been shown to respond to imposed](https://img.pdfslide.net/doc/110x75/605e900a0406df4d87286e27/biofabricating-multifunctional-soft-matter-with-enzymes-1a4-over-the-last.jpg)