Embed Size (px)
Citation preview
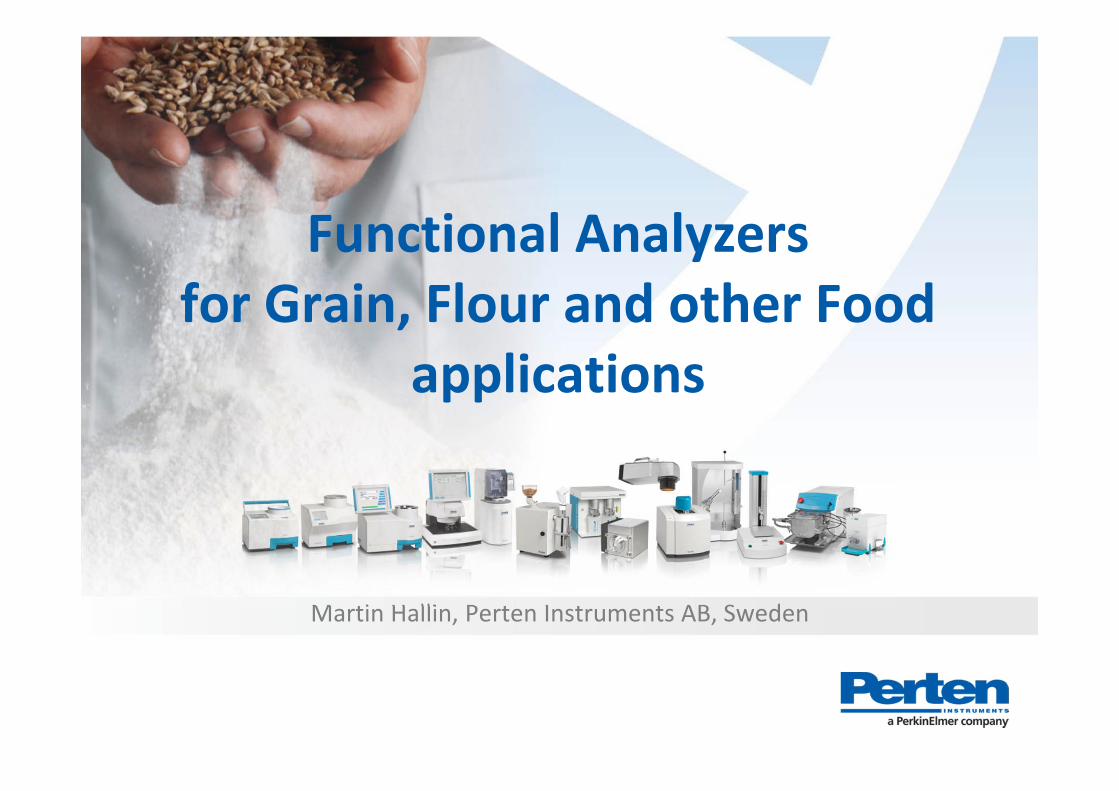
Martin Hallin, Perten Instruments AB, Sweden
Functional Analyzers for Grain, Flour and other Food
applications
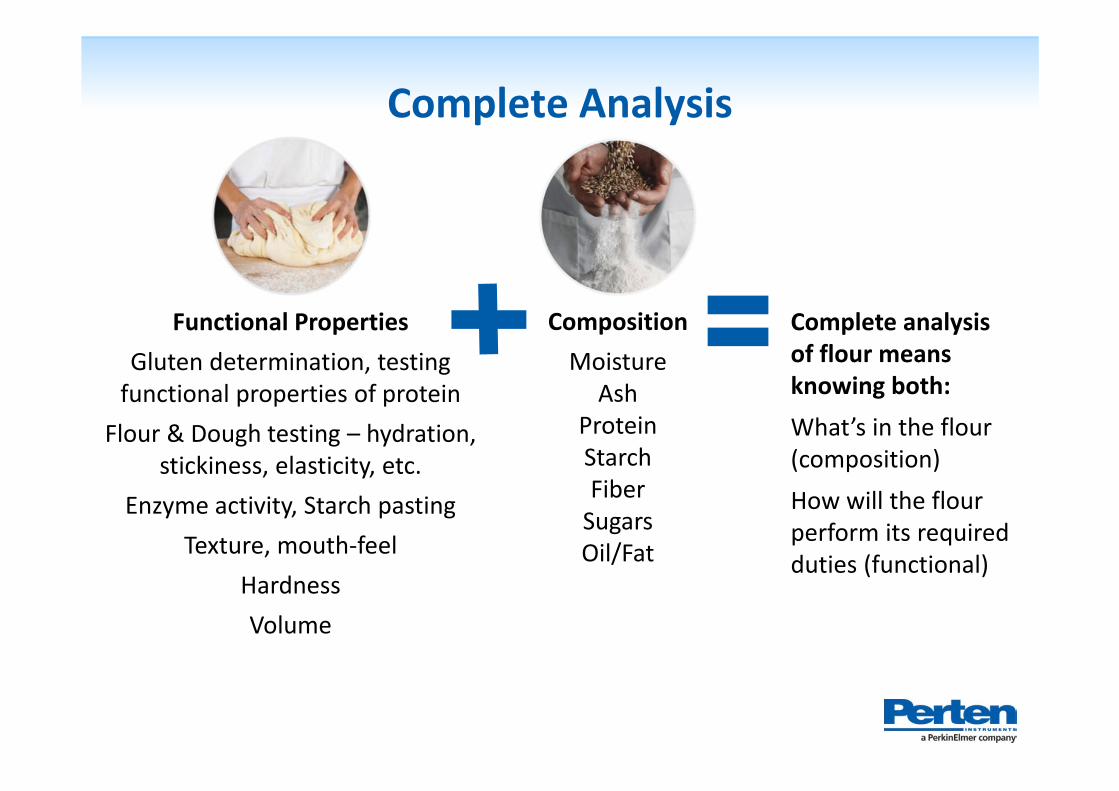
Complete Analysis
Functional PropertiesGluten determination, testing functional properties of protein
Flour & Dough testing – hydration, stickiness, elasticity, etc.
Enzyme activity, Starch pastingTexture, mouth‐feel
HardnessVolume
CompositionMoisture
AshProteinStarchFiberSugarsOil/Fat
Complete analysis of flour means knowing both:What’s in the flour (composition)How will the flour perform its required duties (functional)
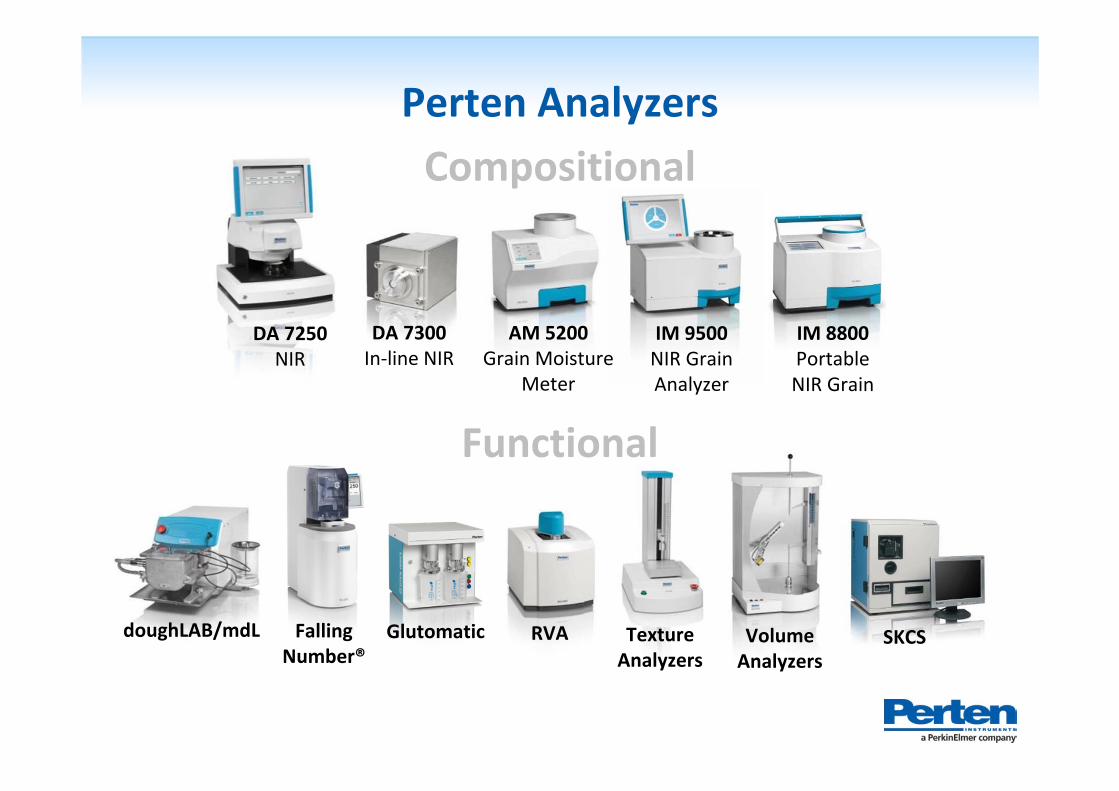
Perten Analyzers
doughLAB/mdL
DA 7250 NIR
DA 7300 In‐line NIR
AM 5200 Grain Moisture
Meter
IM 9500 NIR Grain Analyzer
IM 8800 Portable NIR Grain
Falling Number®
Glutomatic RVA SKCSTexture Analyzers
Volume Analyzers
Functional
Compositional
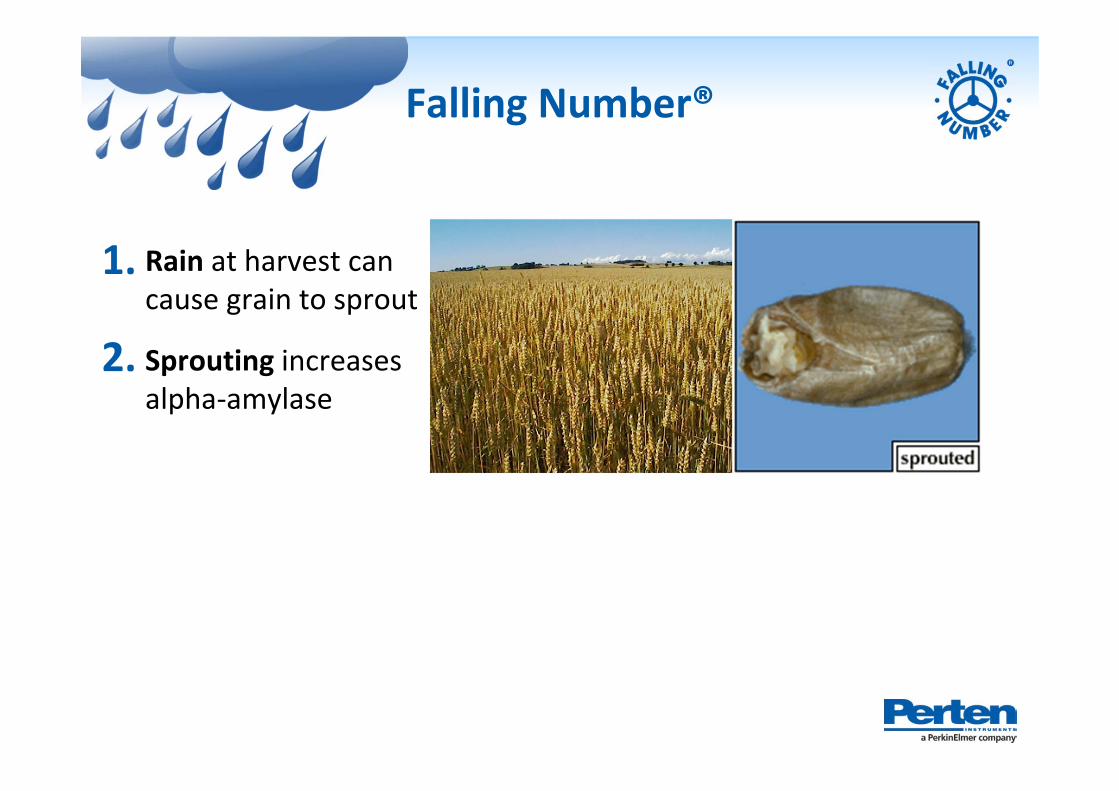
Falling Number®
Rain at harvest can cause grain to sprout
Sprouting increases alpha‐amylase
1.
2.
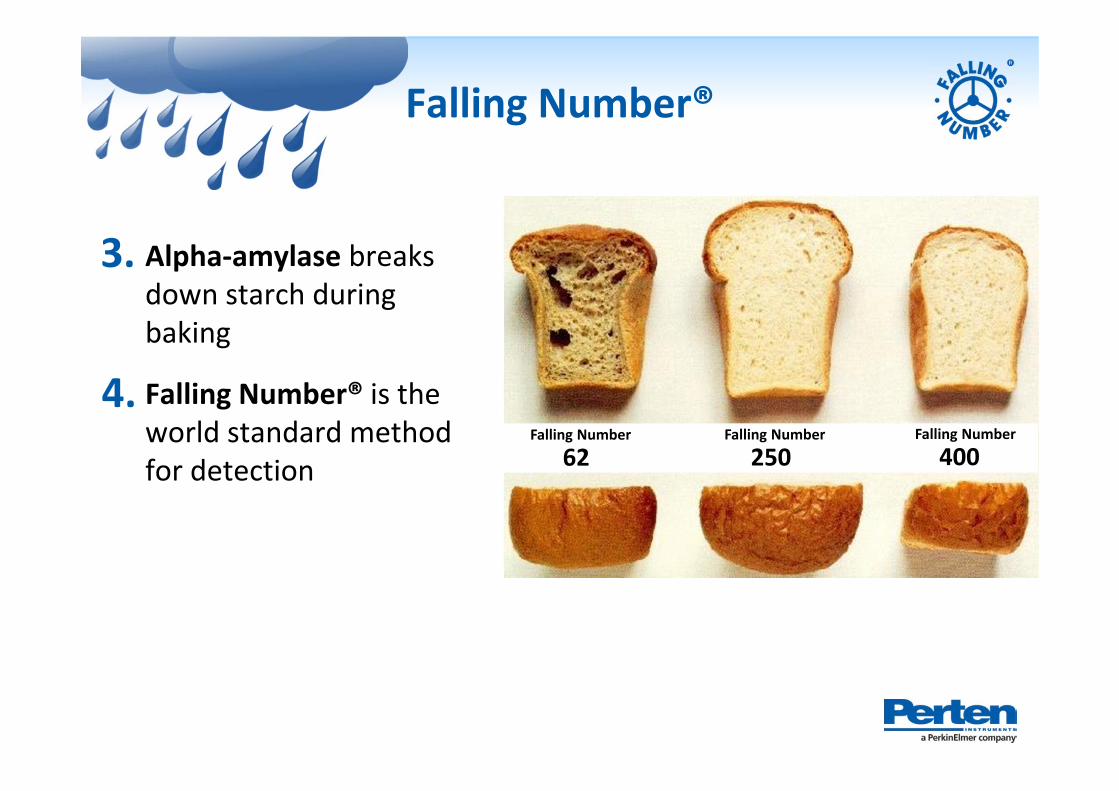
Falling Number®
Alpha‐amylase breaks down starch during baking
Falling Number® is the world standard method for detection 62
Falling Number
250Falling Number
400Falling Number
3.
4.
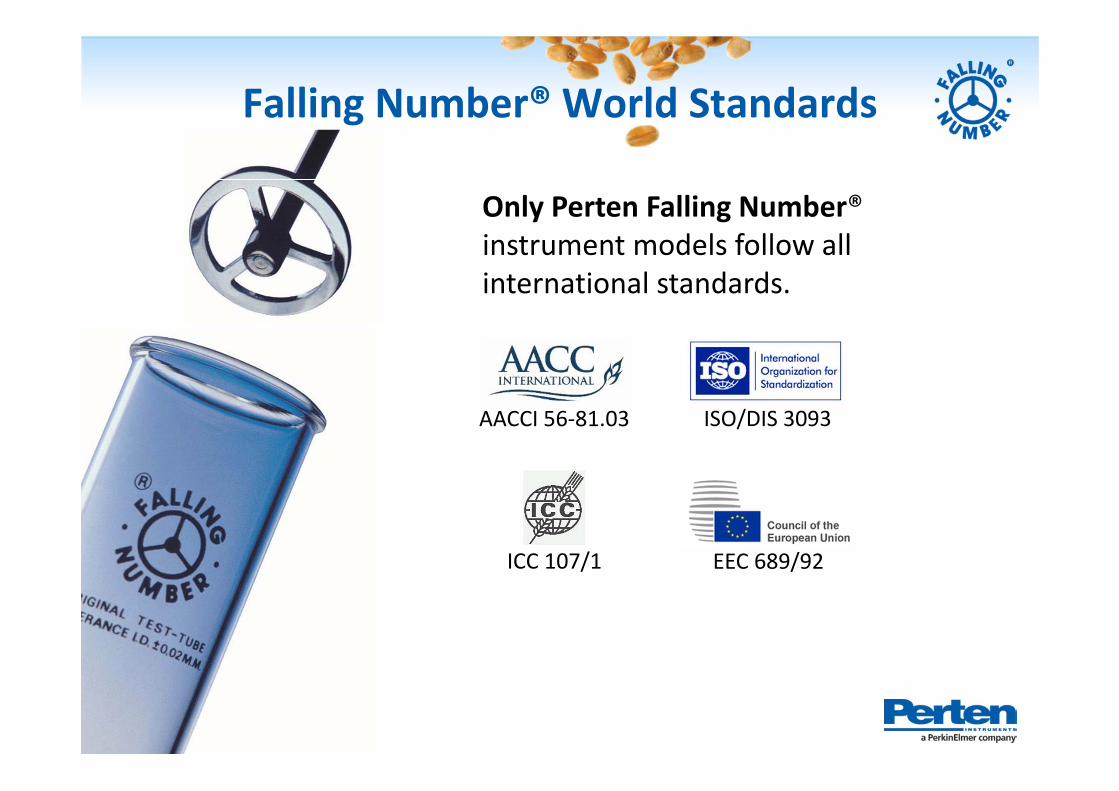
Falling Number® World Standards
ICC 107/1
Only Perten Falling Number®instrument models follow all international standards.
ISO/DIS 3093AACCI 56‐81.03
EEC 689/92
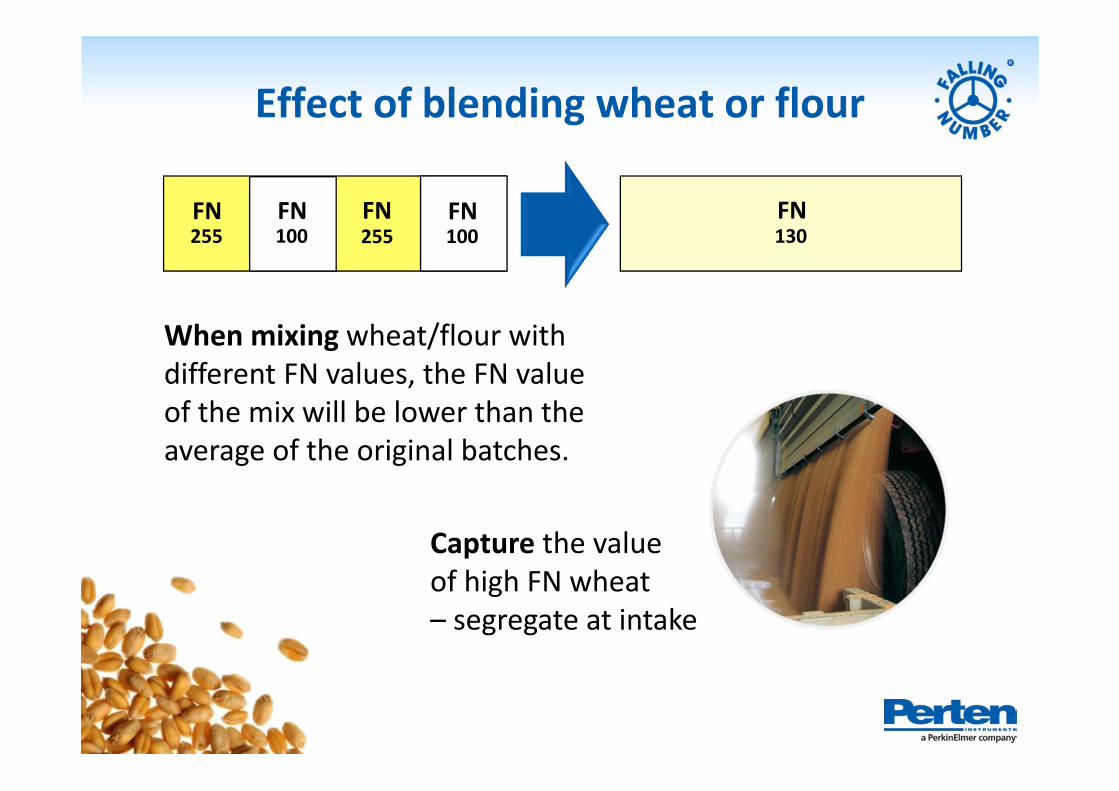
Effect of blending wheat or flour
130FN
When mixing wheat/flour with different FN values, the FN value of the mix will be lower than the average of the original batches.
Capture the value of high FN wheat – segregate at intake
100FN
100FN
255FN
255FN
100FN
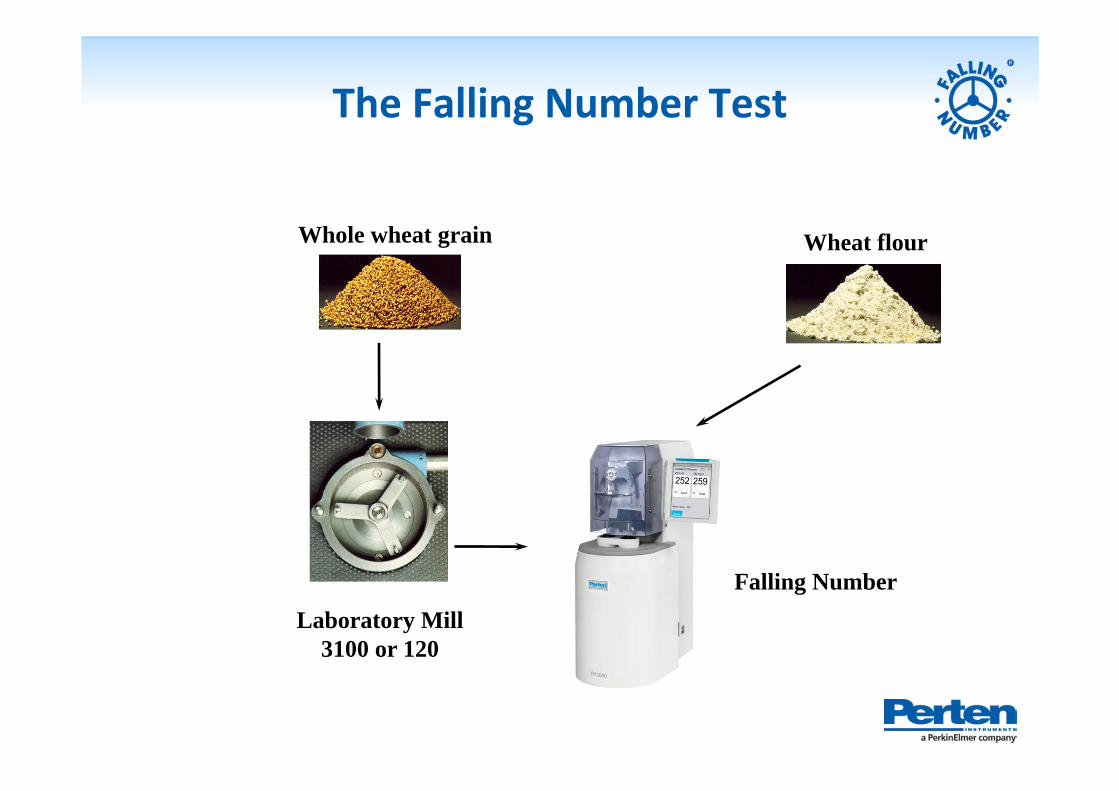
The Falling Number Test
Whole wheat grain Wheat flour
Falling NumberLaboratory Mill
3100 or 120

The Falling Number® Models
Falling Number® 1310Value priced single analysis model
Falling Number® 1000Dual analysis model with many automated features
Falling Number® 1500Automatic single analysis system
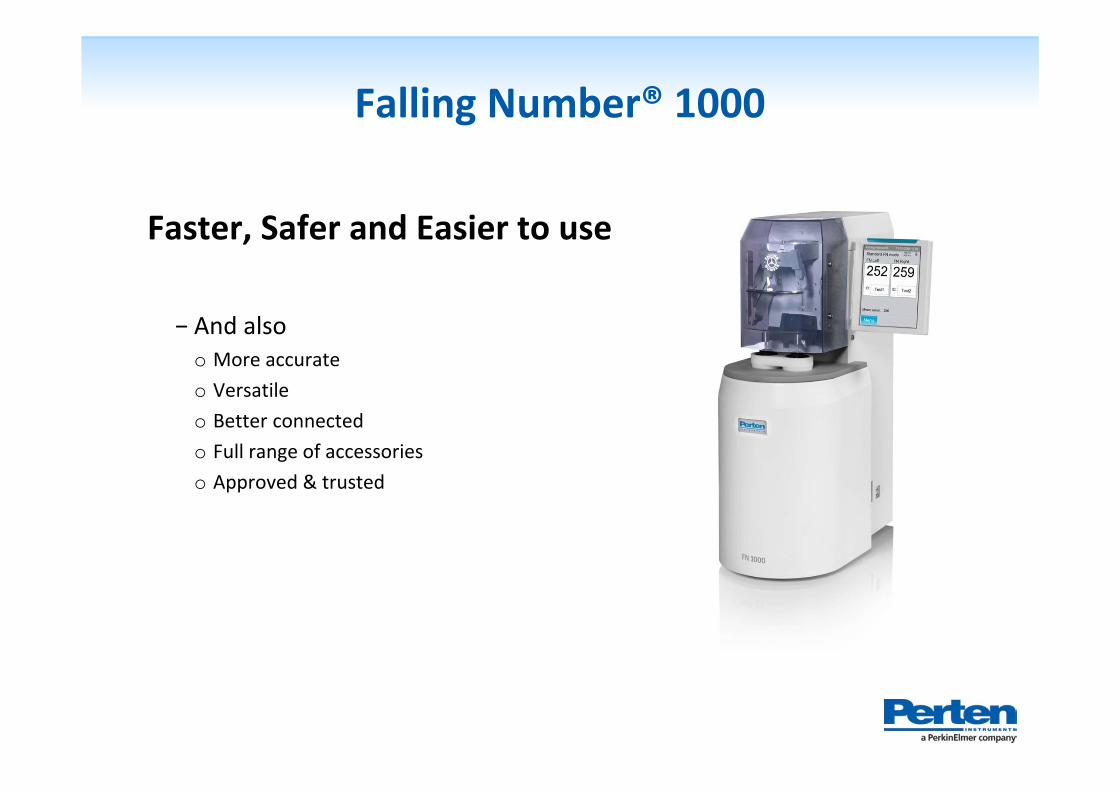
Falling Number® 1000
Faster, Safer and Easier to use
− And alsoo More accurateo Versatileo Better connectedo Full range of accessorieso Approved & trusted
Falling Number® 1000
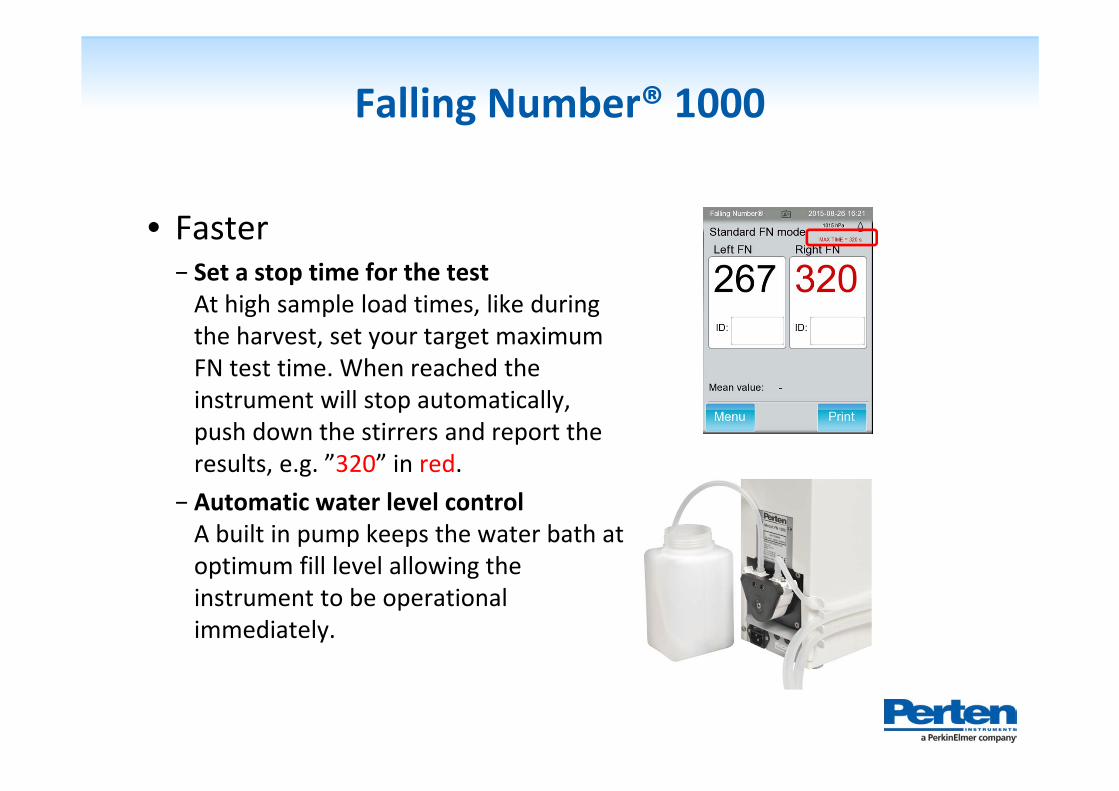
• Faster− Set a stop time for the testAt high sample load times, like during the harvest, set your target maximum FN test time. When reached the instrument will stop automatically, push down the stirrers and report the results, e.g. ”320” in red.
− Automatic water level controlA built in pump keeps the water bath at optimum fill level allowing the instrument to be operational immediately.
Falling Number® 1000
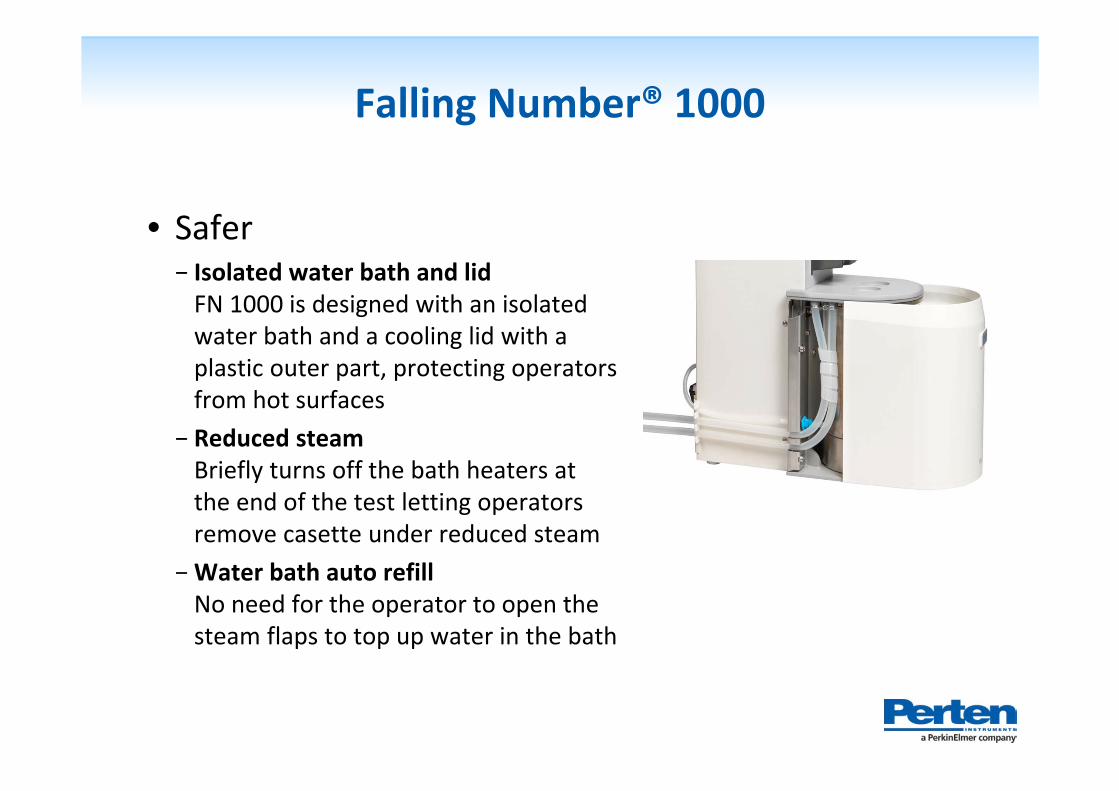
• Safer − Isolated water bath and lidFN 1000 is designed with an isolated water bath and a cooling lid with a plastic outer part, protecting operators from hot surfaces
− Reduced steamBriefly turns off the bath heaters at the end of the test letting operators remove casette under reduced steam
−Water bath auto refillNo need for the operator to open the steam flaps to top up water in the bath
Falling Number® 1000
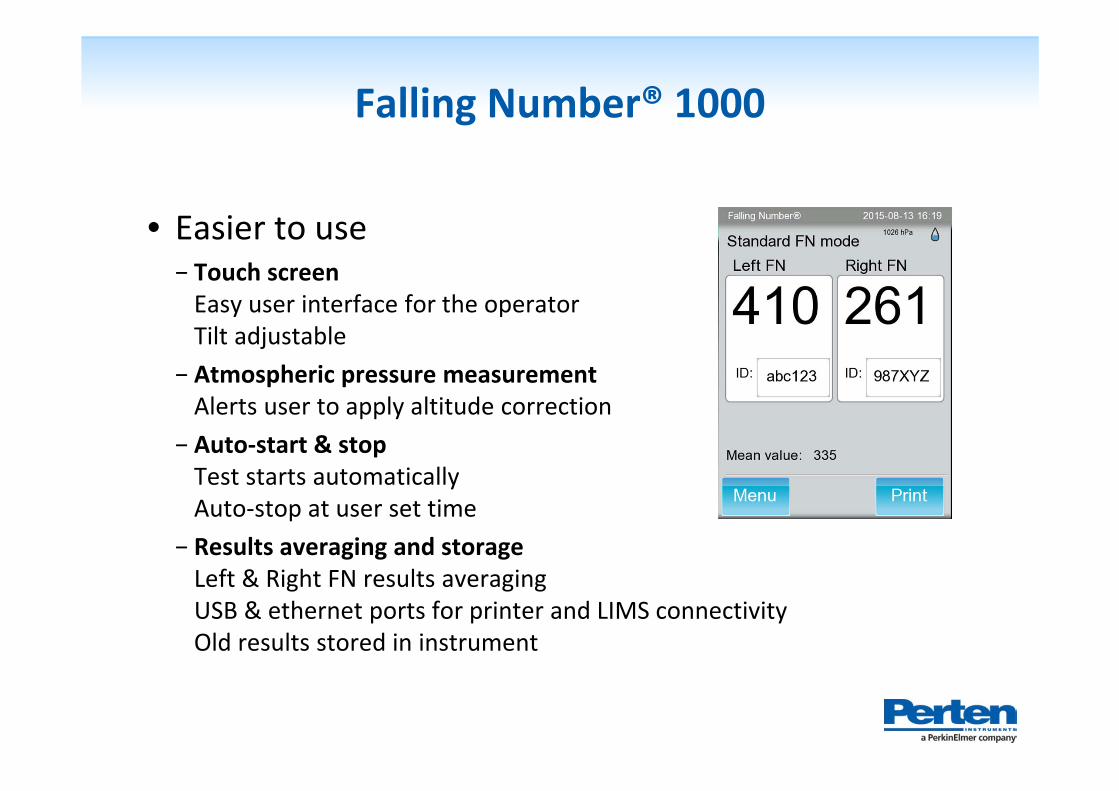
• Easier to use− Touch screenEasy user interface for the operatorTilt adjustable
− Atmospheric pressure measurementAlerts user to apply altitude correction
− Auto‐start & stopTest starts automatically Auto‐stop at user set time
− Results averaging and storageLeft & Right FN results averagingUSB & ethernet ports for printer and LIMS connectivityOld results stored in instrument
Falling Number® 1000
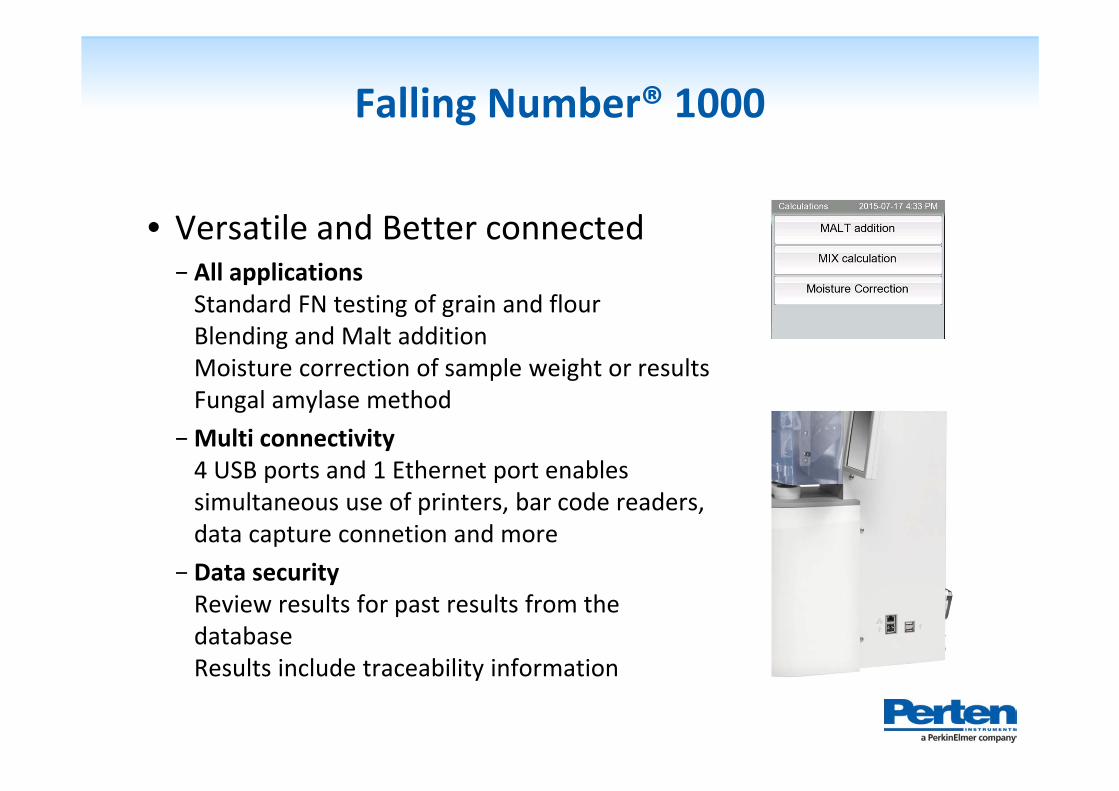
• Versatile and Better connected− All applicationsStandard FN testing of grain and flourBlending and Malt additionMoisture correction of sample weight or resultsFungal amylase method
−Multi connectivity4 USB ports and 1 Ethernet port enables simultaneous use of printers, bar code readers, data capture connetion and more
− Data securityReview results for past results from the databaseResults include traceability information
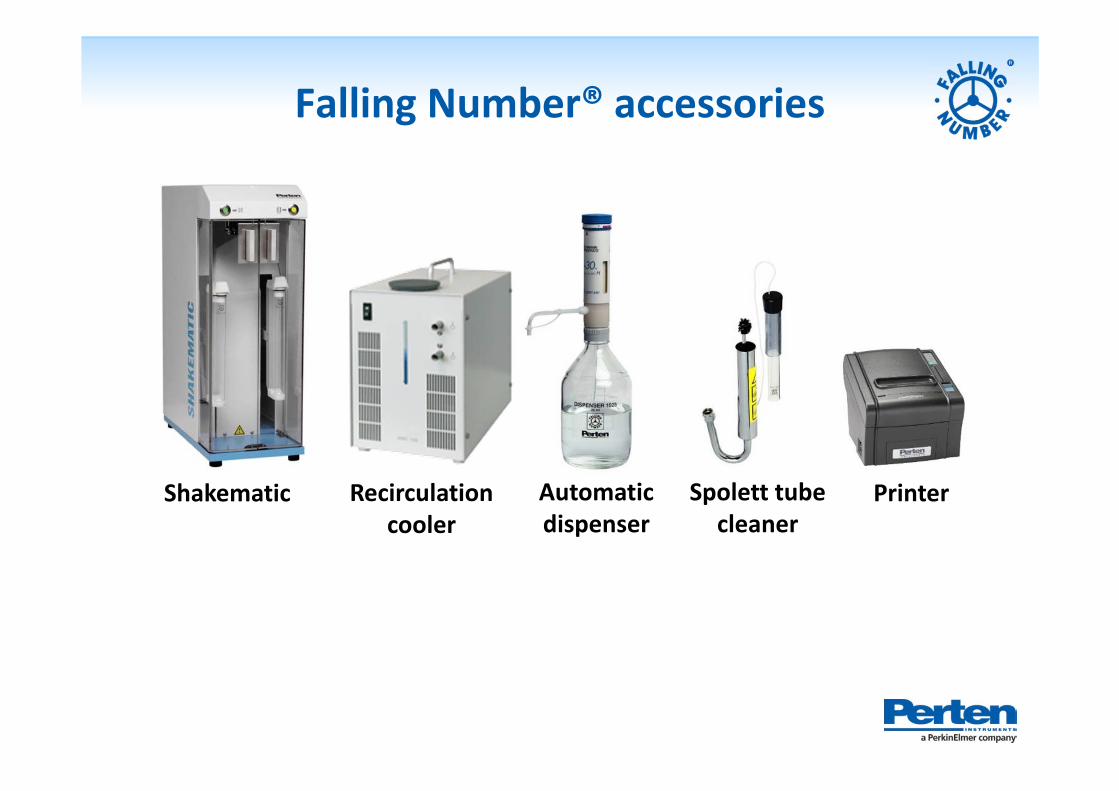
Falling Number® accessories
Shakematic Recirculation cooler
Automatic dispenser
Spolett tube cleaner
Printer
Glutomatic ‐ Protein functionality
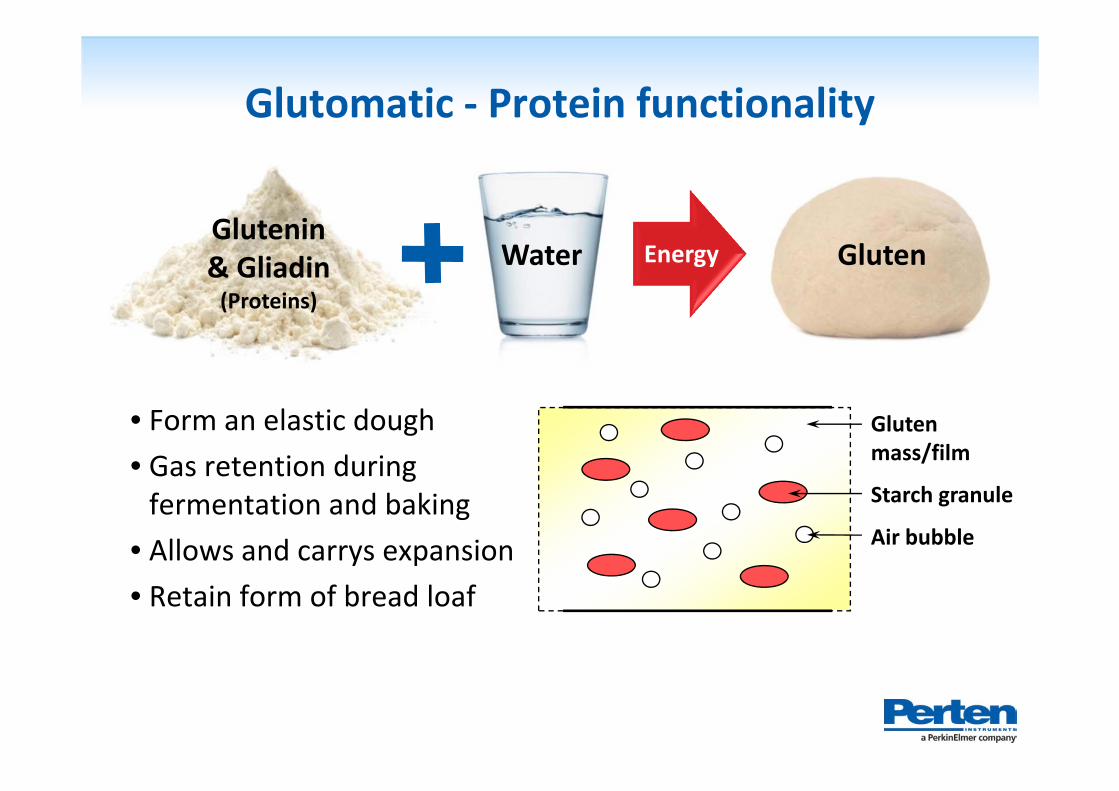
Gluten mass/film
Starch granule
Air bubble
• Form an elastic dough• Gas retention during fermentation and baking
• Allows and carrys expansion• Retain form of bread loaf
Glutenin & Gliadin(Proteins)
Water GlutenEnergy
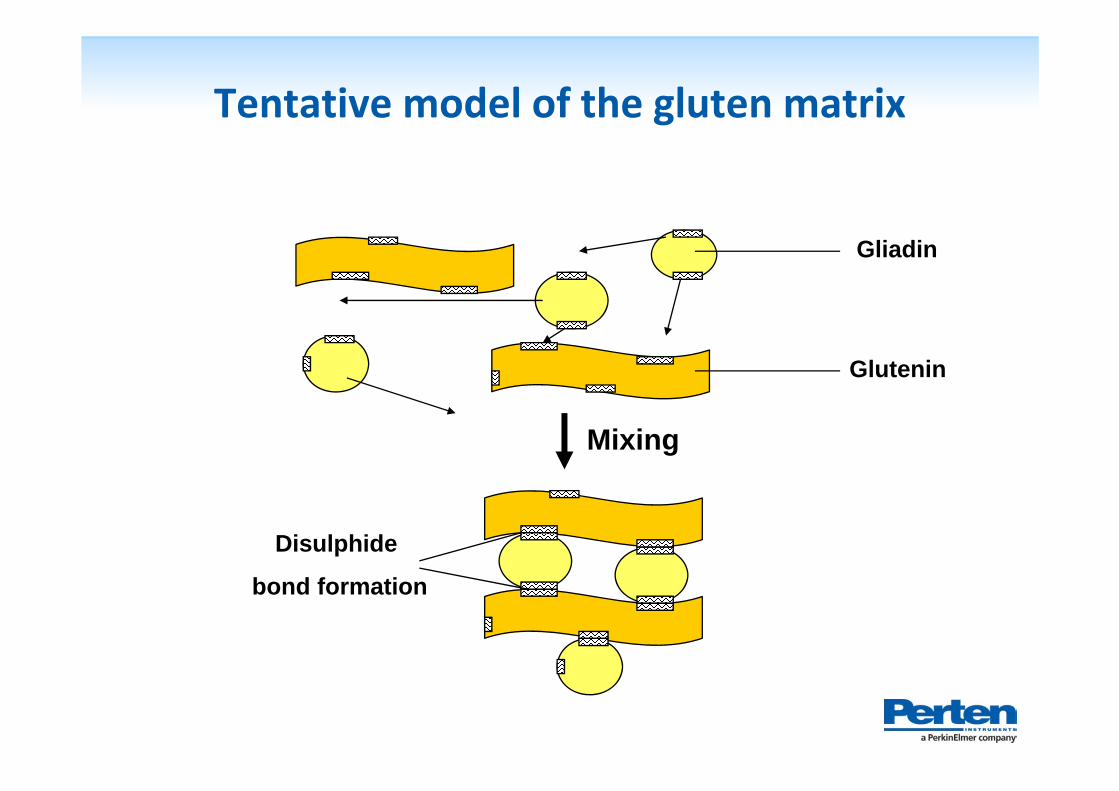
Tentative model of the gluten matrix
Disulphide
bond formation
Gliadin
Glutenin
Mixing
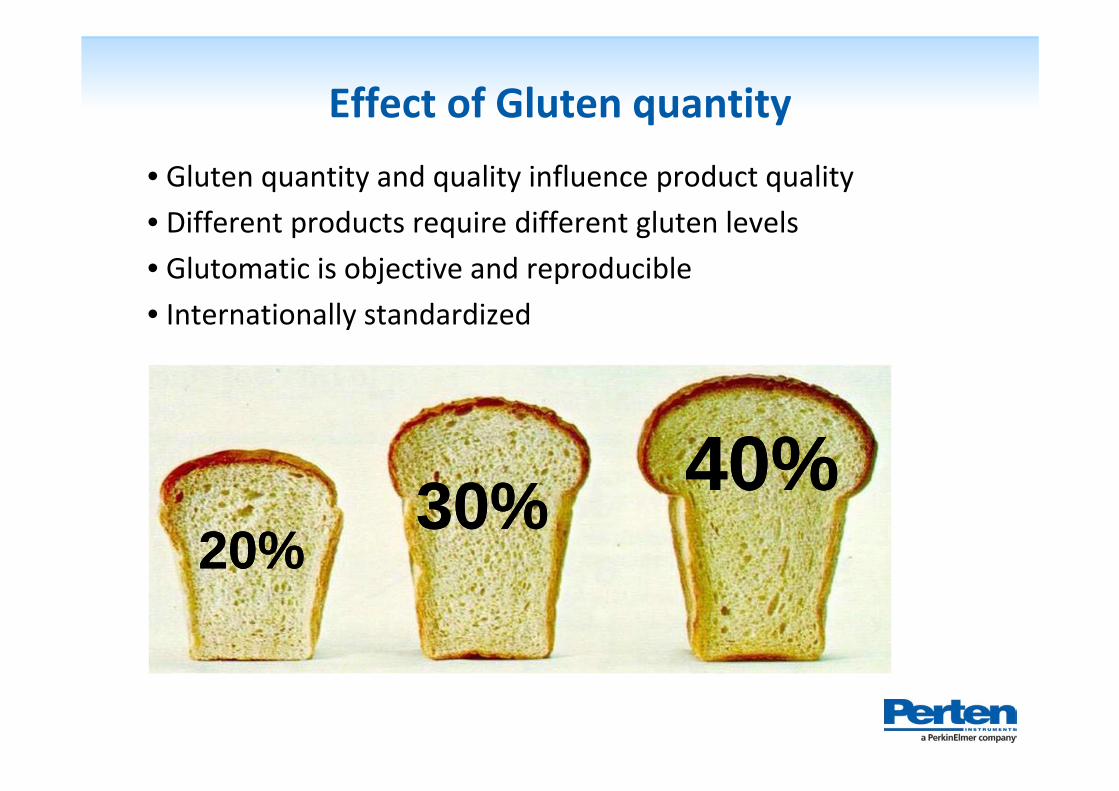
Effect of Gluten quantity• Gluten quantity and quality influence product quality• Different products require different gluten levels• Glutomatic is objective and reproducible• Internationally standardized
20%20%30%30% 40%40%
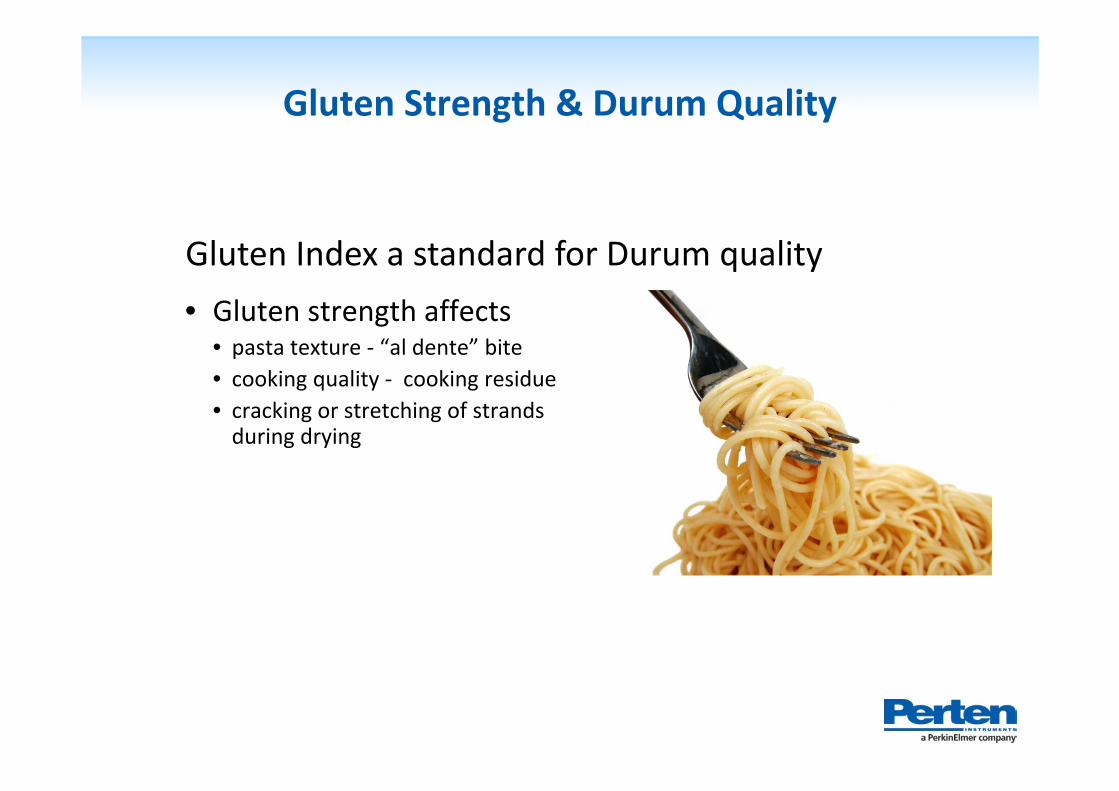
Gluten Strength & Durum Quality
• Gluten strength affects• pasta texture ‐ “al dente” bite• cooking quality ‐ cooking residue• cracking or stretching of strands during drying
Gluten Index a standard for Durum quality
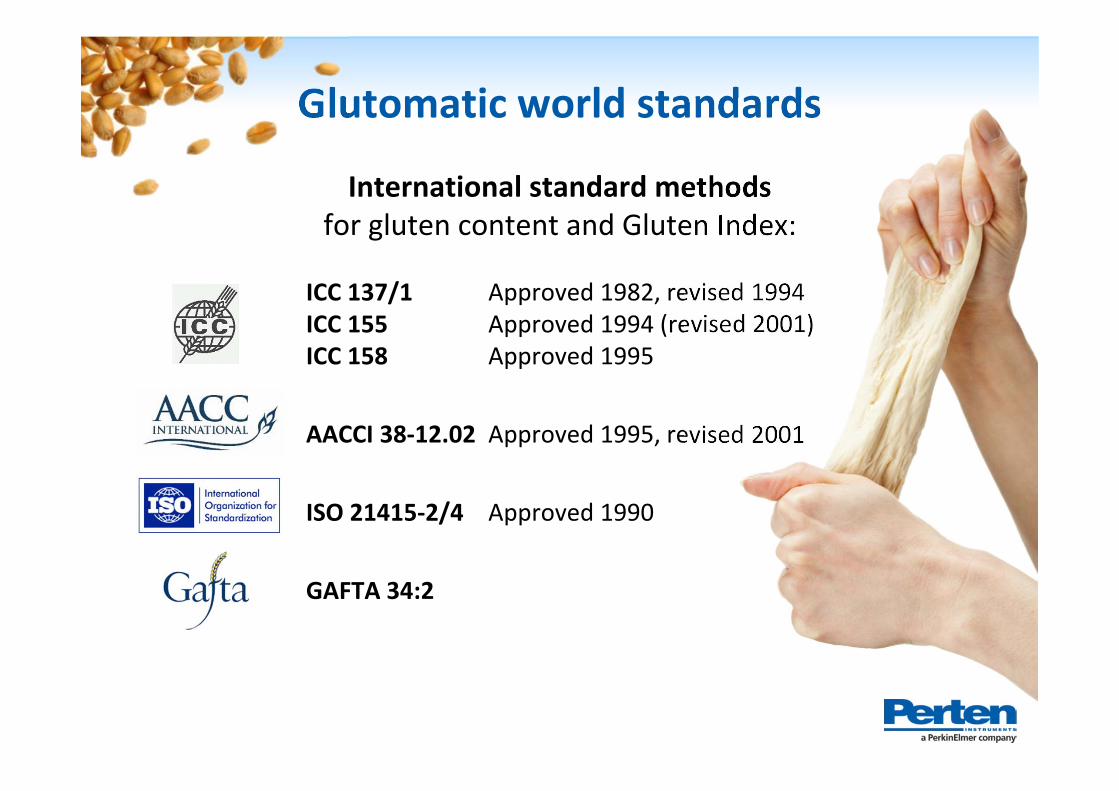
Glutomatic world standards
ICC 137/1 Approved 1982, revised 1994ICC 155 Approved 1994 (revised 2001)ICC 158 Approved 1995
AACCI 38‐12.02 Approved 1995, revised 2001
ISO 21415‐2/4 Approved 1990
GAFTA 34:2
International standard methods for gluten content and Gluten Index:
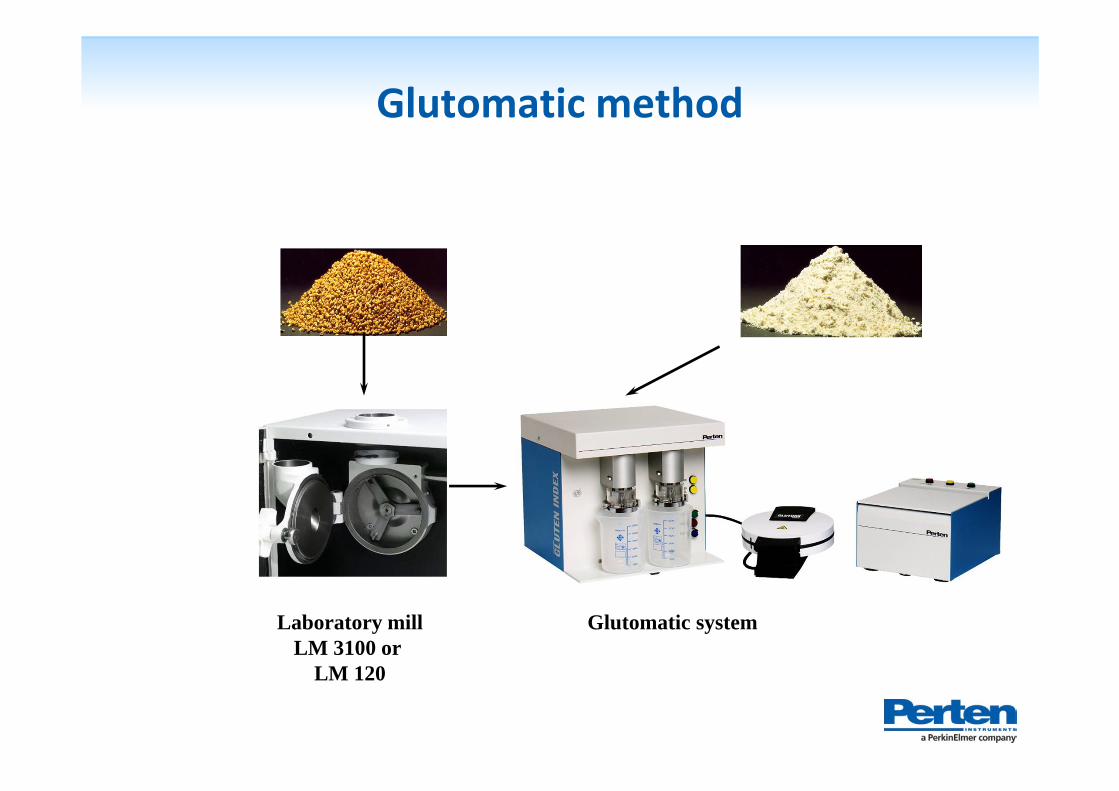
Glutomatic method
Glutomatic systemLaboratory millLM 3100 or
LM 120
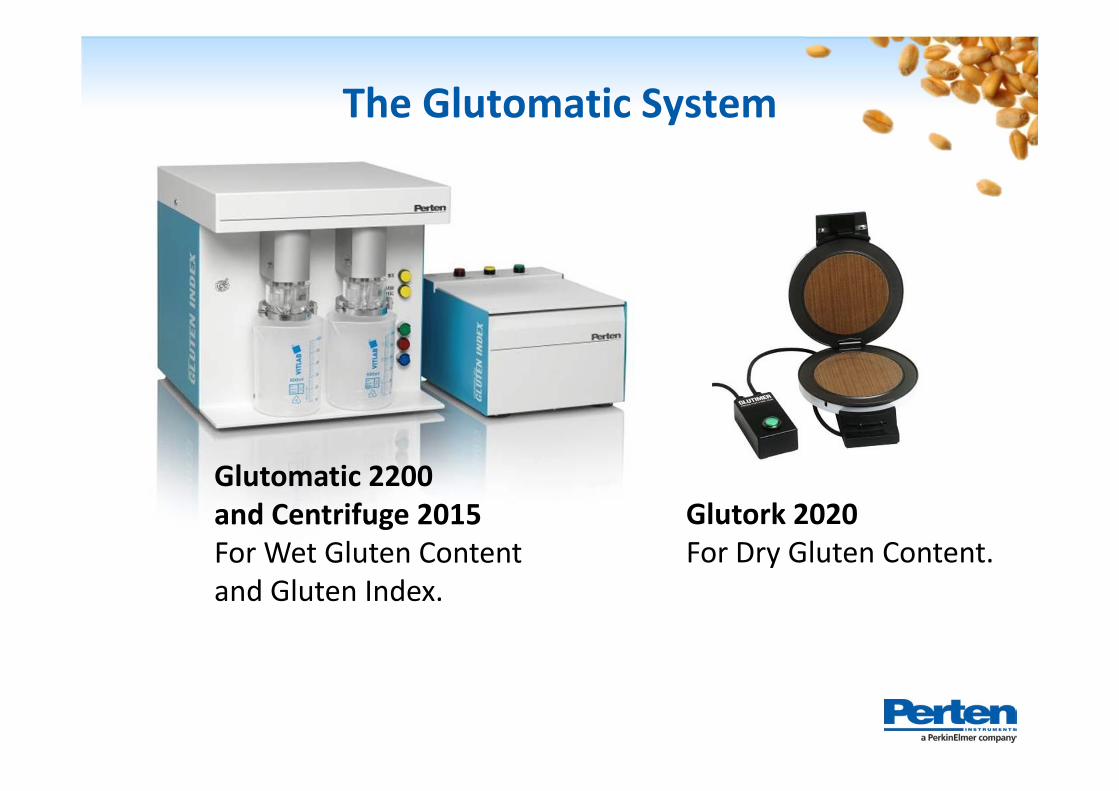
The Glutomatic System
Glutomatic 2200 and Centrifuge 2015For Wet Gluten Content and Gluten Index.
Glutork 2020For Dry Gluten Content.
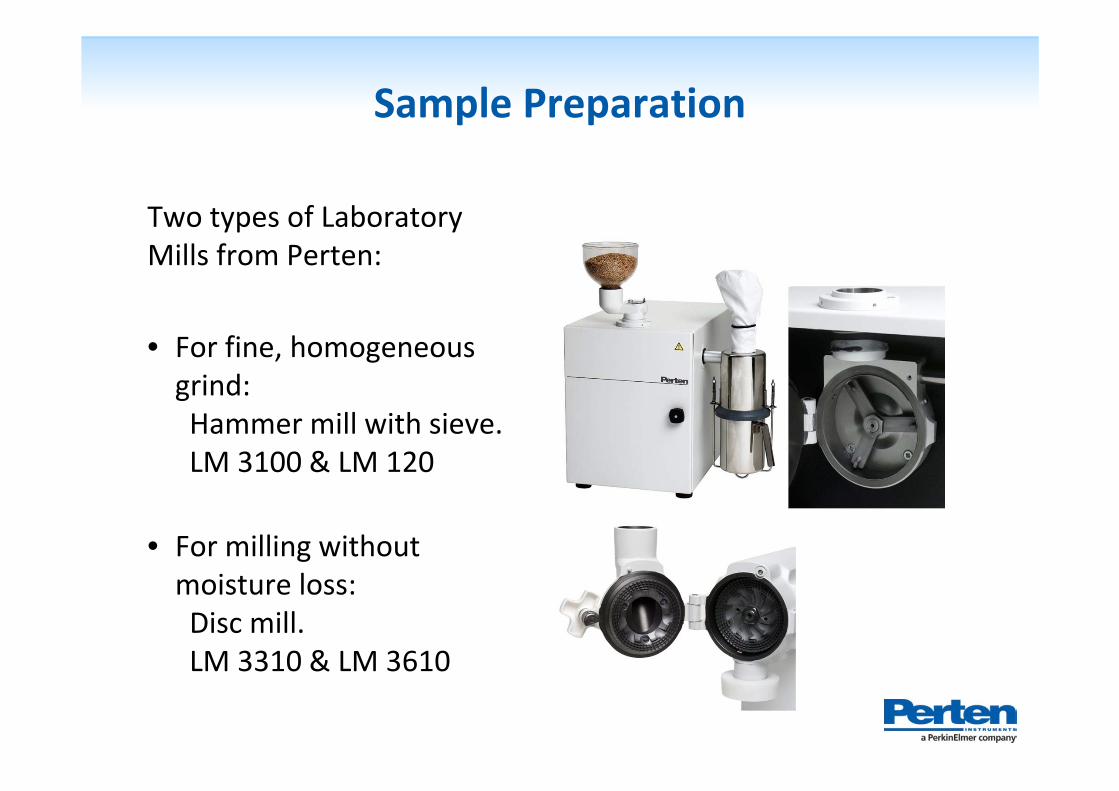
Sample Preparation
Two types of Laboratory Mills from Perten:
• For fine, homogeneous grind:Hammer mill with sieve. LM 3100 & LM 120
• For milling without moisture loss:Disc mill.LM 3310 & LM 3610
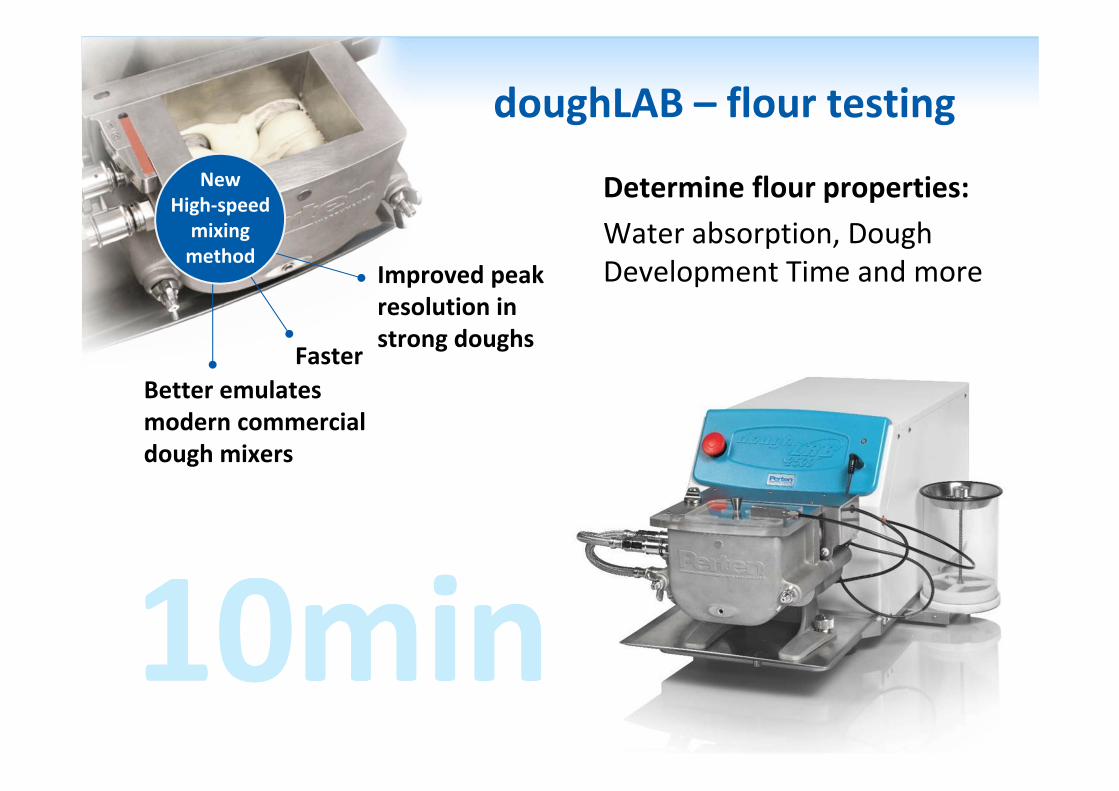
doughLAB – flour testing
Determine flour properties:Water absorption, Dough Development Time and moreImproved peak
resolution in strong doughs
FasterBetter emulates modern commercial dough mixers
New High‐speed mixing method
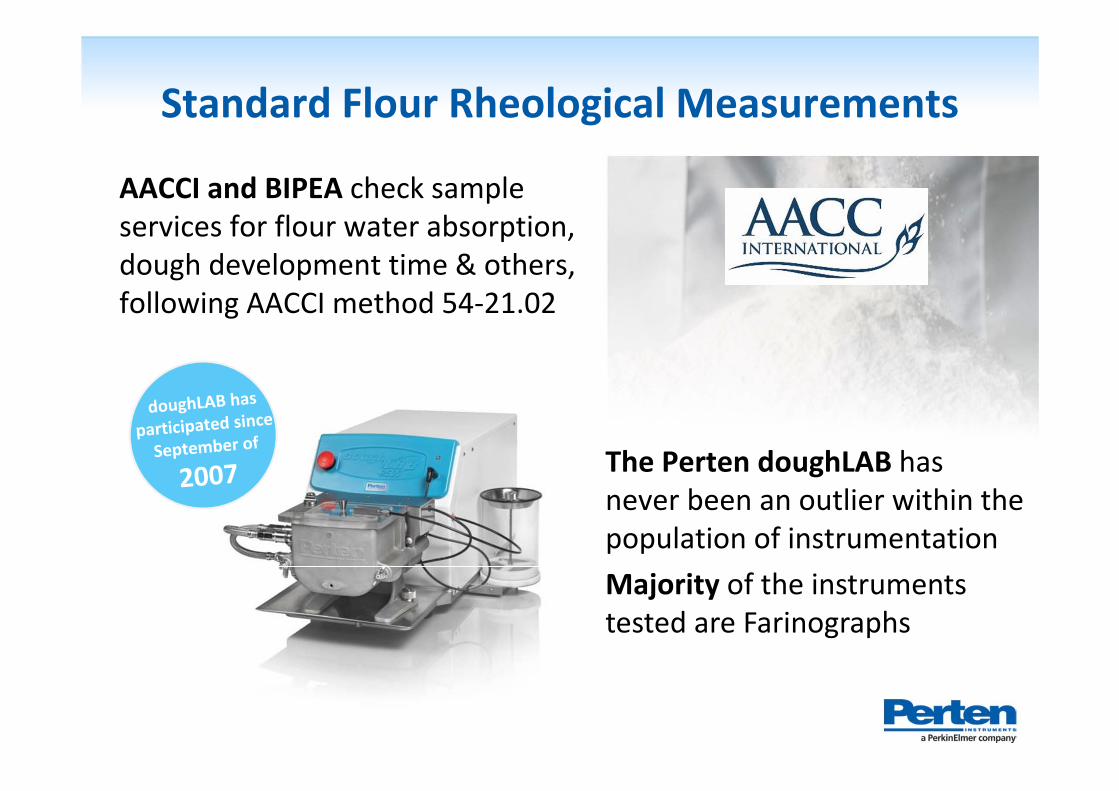
Standard Flour Rheological Measurements
AACCI and BIPEA check sample services for flour water absorption, dough development time & others, following AACCI method 54‐21.02
The Perten doughLAB has never been an outlier within the population of instrumentationMajority of the instruments tested are Farinographs
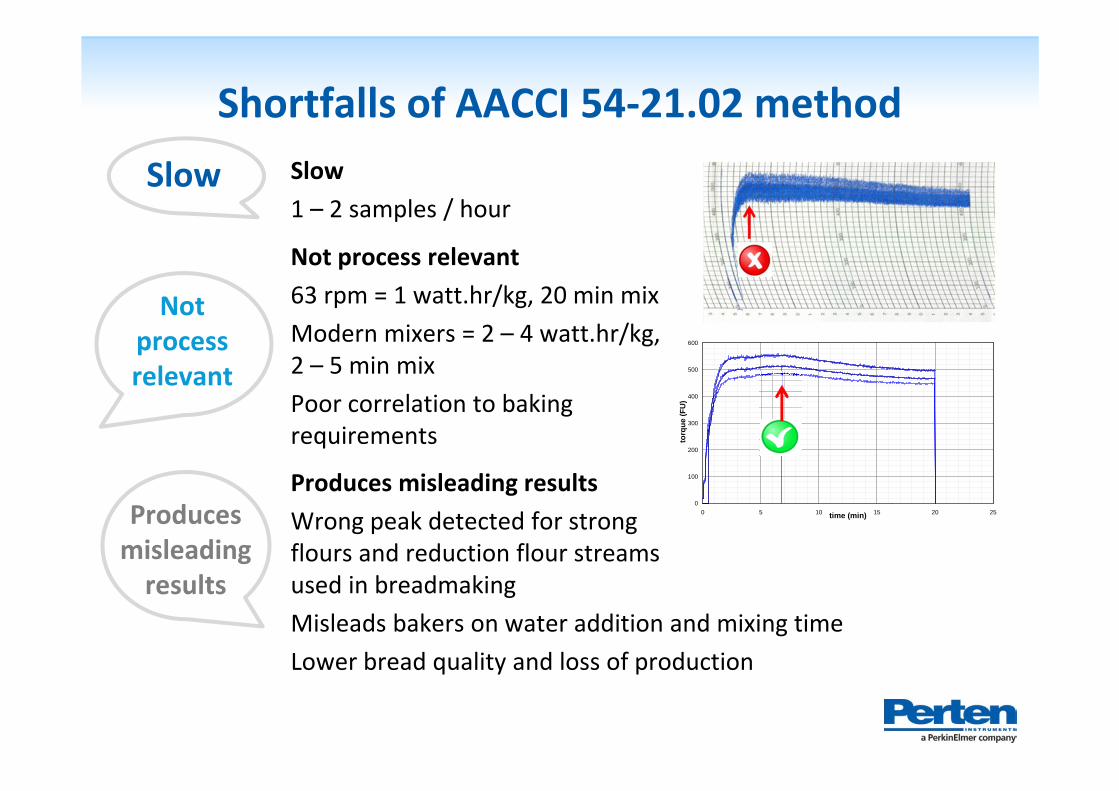
Shortfalls of AACCI 54‐21.02 methodSlow1 – 2 samples / hour
Not process relevant63 rpm = 1 watt.hr/kg, 20 min mixModern mixers = 2 – 4 watt.hr/kg, 2 – 5 min mixPoor correlation to baking requirements
Produces misleading results Wrong peak detected for strong flours and reduction flour streams used in breadmakingMisleads bakers on water addition and mixing timeLower bread quality and loss of production
0
100
200
300
400
500
600
0 5 10 15 20 25time (min)
torq
ue (F
U)
Produces misleading results
Not process relevant
Slow
0 400 800 1200Time (s)
0
250
500
750
1000
Torq
ue (g
.m/5
)
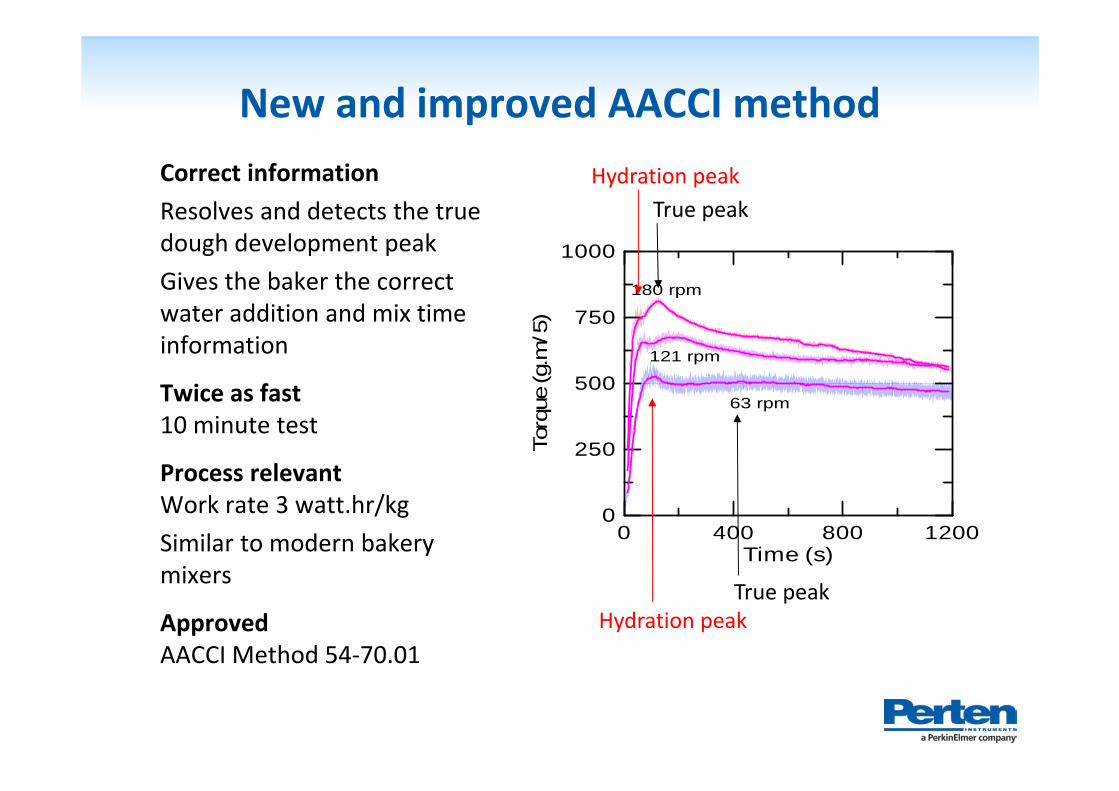
63 rpm
121 rpm
180 rpmFabulous
Hydration peak
Hydration peak
True peak
True peak
Correct informationResolves and detects the true dough development peakGives the baker the correct water addition and mix time information
Twice as fast10 minute test
Process relevantWork rate 3 watt.hr/kg Similar to modern bakery mixers
ApprovedAACCI Method 54‐70.01
New and improved AACCI method

Blending Decisions
Blend streams virtually in doughLAB software
Try out different mix ratios and instantly see results
Identify optimal mix ratio to meet end‐use requirements
Save lab time and reduce the risk of blending mistakes
Virtual blendActual blend
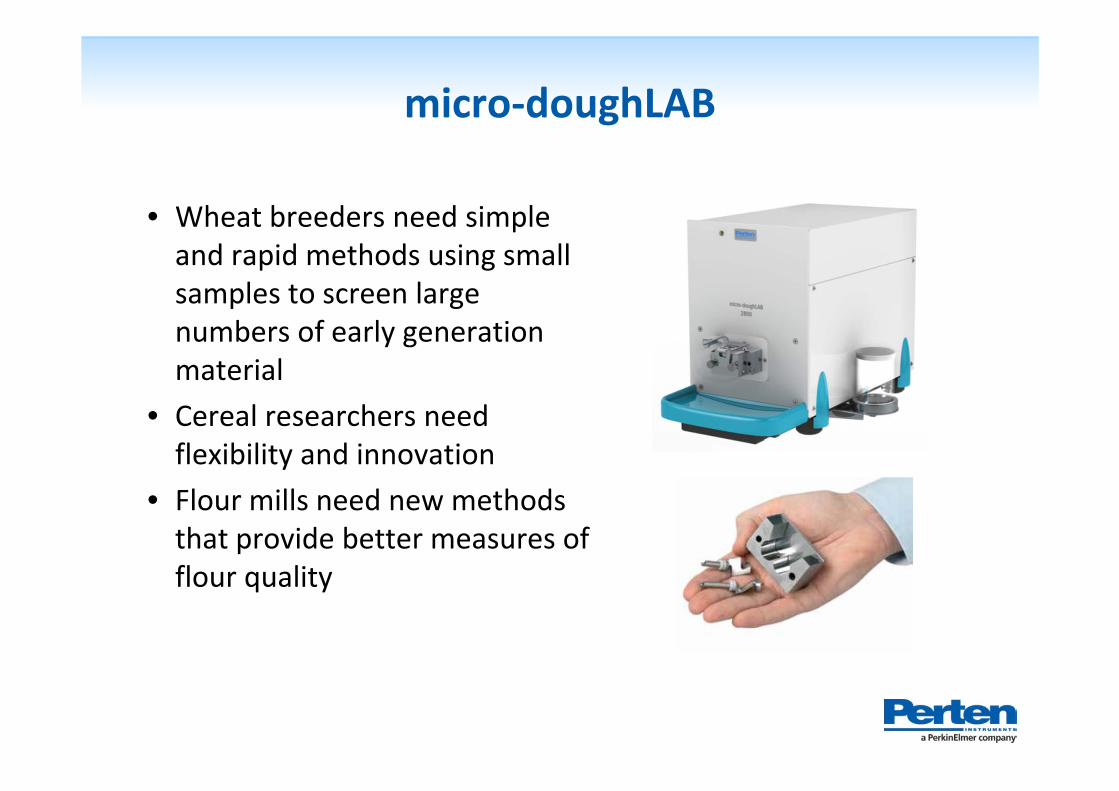
micro‐doughLAB
• Wheat breeders need simple and rapid methods using small samples to screen large numbers of early generation material
• Cereal researchers need flexibility and innovation
• Flour mills need new methods that provide better measures of flour quality
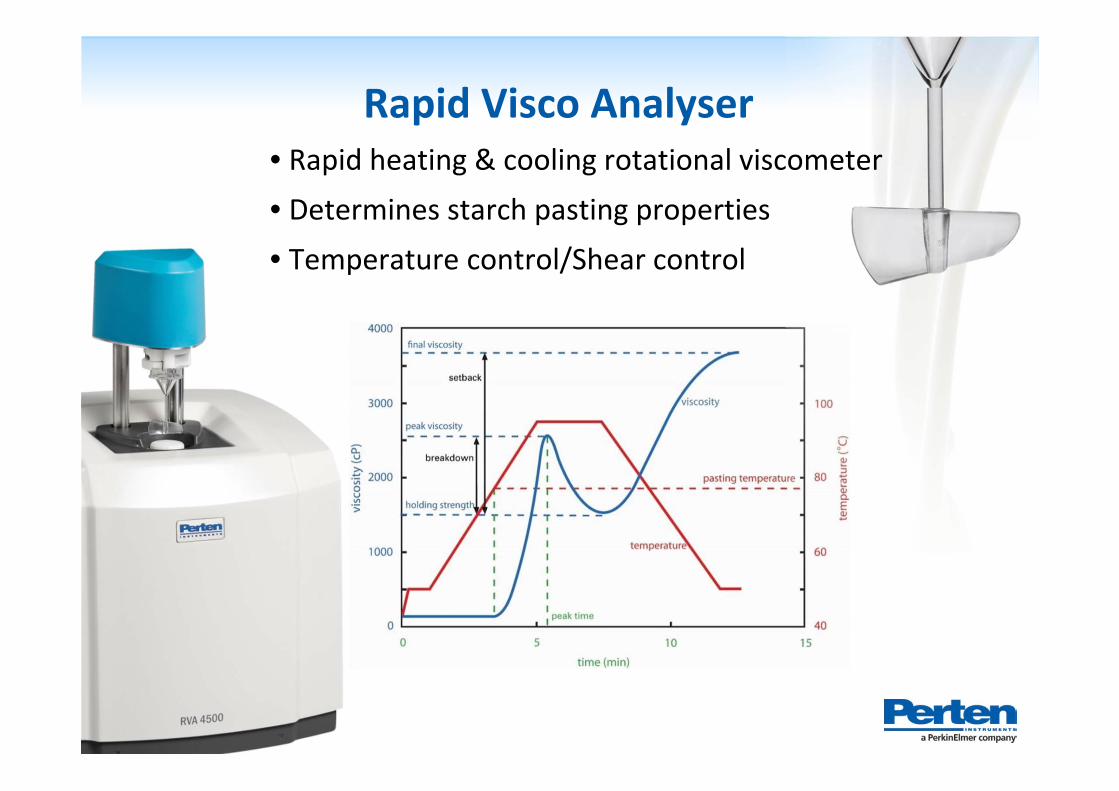
Rapid Visco Analyser• Rapid heating & cooling rotational viscometer• Determines starch pasting properties• Temperature control/Shear control
RVA ‐What it measures
• Pastes of plant polymers and associated enzymes• Starch and starchy products eg. grains, flour–Food (thickener, binder, stabilizer)– Industrial (paper, adhesives, textiles)–Alpha‐amylase (sprouting, malting, fungal)
• Protein –Dairy, soy, gluten, gelatine–Protease, TG
• Gum–Carrageenans, Xanthan, Pectin, Arabinoxylan–Xylanase
RVA ‐What it measures
• The RVA measures and characterizes ingredient performance.
• By subjecting a sample to a reproducible program of heating, cooling, and shear, the RVA provides an apples‐to‐apples comparison of different samples within each product type.
• Easily and quickly characterize ideal ingredients for a given product, and compare all future samples directly to that standard.
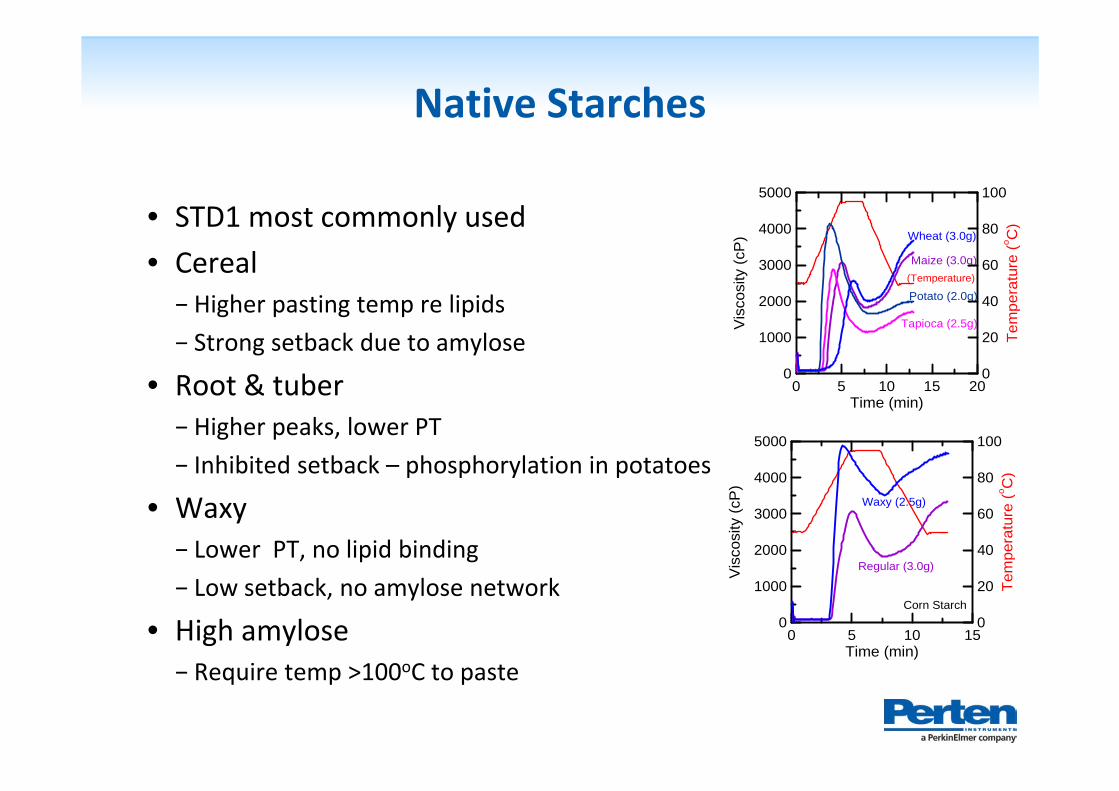
Native Starches
• STD1 most commonly used• Cereal
− Higher pasting temp re lipids− Strong setback due to amylose
• Root & tuber− Higher peaks, lower PT− Inhibited setback – phosphorylation in potatoes
• Waxy− Lower PT, no lipid binding− Low setback, no amylose network
• High amylose− Require temp >100oC to paste
0 5 10 15 20Time (min)
0
1000
2000
3000
4000
5000
Vis
cosi
ty (c
P) Wheat (3.0g)
Maize (3.0g)
Potato (2.0g)
Tapioca (2.5g)
0
20
40
60
80
100
Tem
pera
ture
(o C)
(Temperature)
0 5 10 15Time (min)
0
1000
2000
3000
4000
5000
Vis
cosi
ty (c
P)
Waxy (2.5g)
Regular (3.0g)
0
20
40
60
80
100
Tem
pera
ture
(o C)
Corn Starch
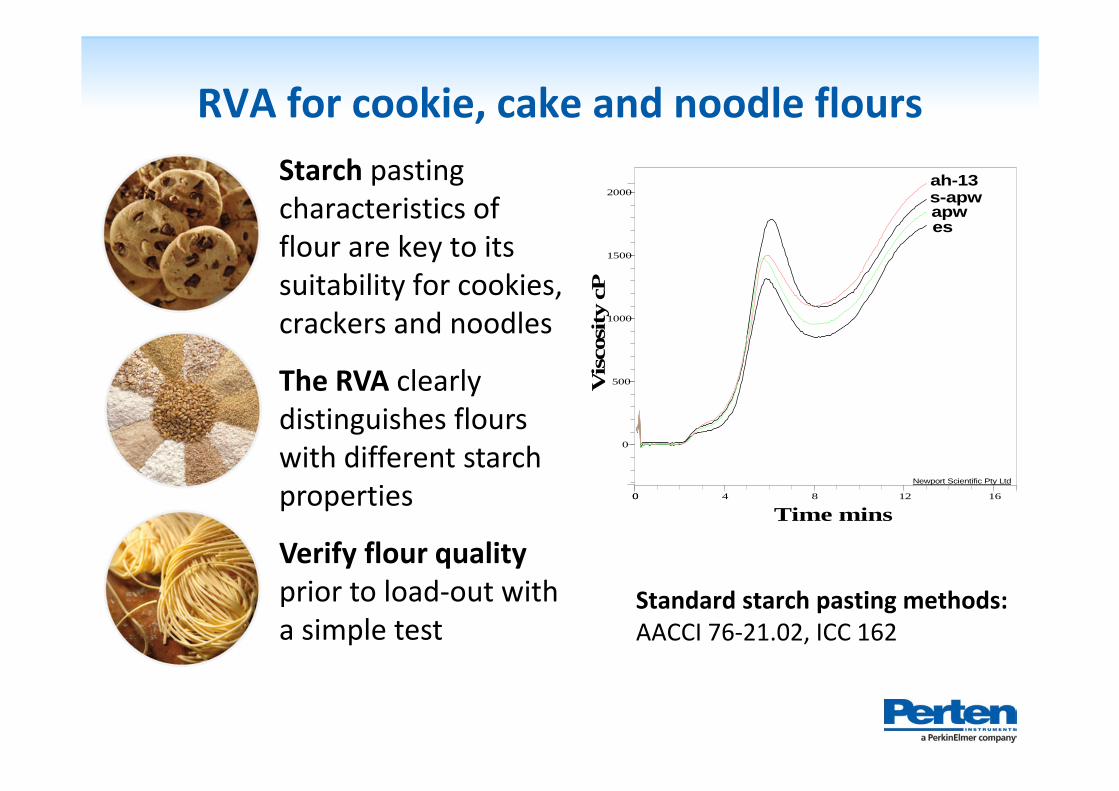
RVA for cookie, cake and noodle flours
Newport Scientific Pty Ltd
0
500
1000
1500
2000
00 4 8 12 16
Time mins
Vis
cosi
ty c
P
s-apw
esapw
ah-13Starch pasting characteristics of flour are key to its suitability for cookies, crackers and noodles
The RVA clearly distinguishes flours with different starch properties
Verify flour quality prior to load‐out with a simple test
Standard starch pasting methods: AACCI 76‐21.02, ICC 162
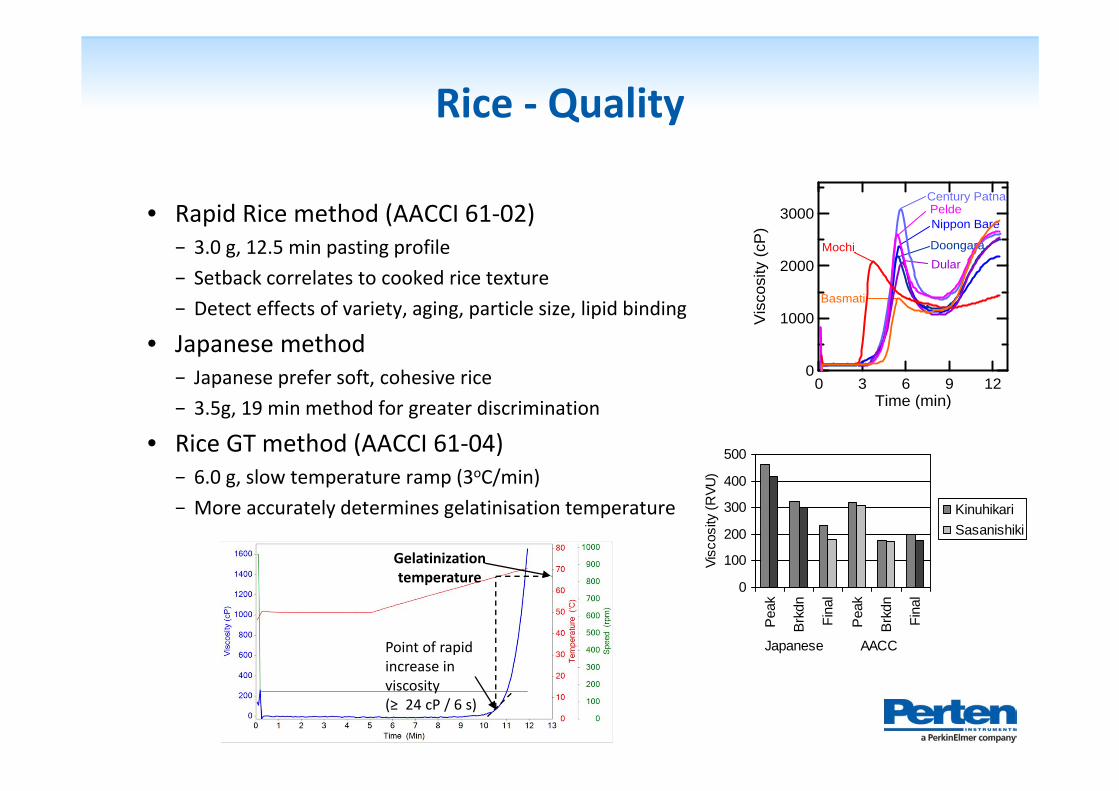
Rice ‐ Quality
• Rapid Rice method (AACCI 61‐02)− 3.0 g, 12.5 min pasting profile− Setback correlates to cooked rice texture− Detect effects of variety, aging, particle size, lipid binding
• Japanese method− Japanese prefer soft, cohesive rice− 3.5g, 19 min method for greater discrimination
• Rice GT method (AACCI 61‐04)− 6.0 g, slow temperature ramp (3oC/min)− More accurately determines gelatinisation temperature
0
100
200
300
400
500
Pea
k
Brkd
n
Fina
l
Pea
k
Brkd
n
Fina
l
Japanese AACC
Visc
osity
(RVU
)
KinuhikariSasanishiki
0 3 6 9 12Time (min)
0
1000
2000
3000
Vis
cosi
ty (c
P)
Mochi
Century PatnaPeldeNippon Bare
DoongaraDular
Basmati
Point of rapid increase in viscosity(≥ 24 cP / 6 s)
Gelatinization temperature
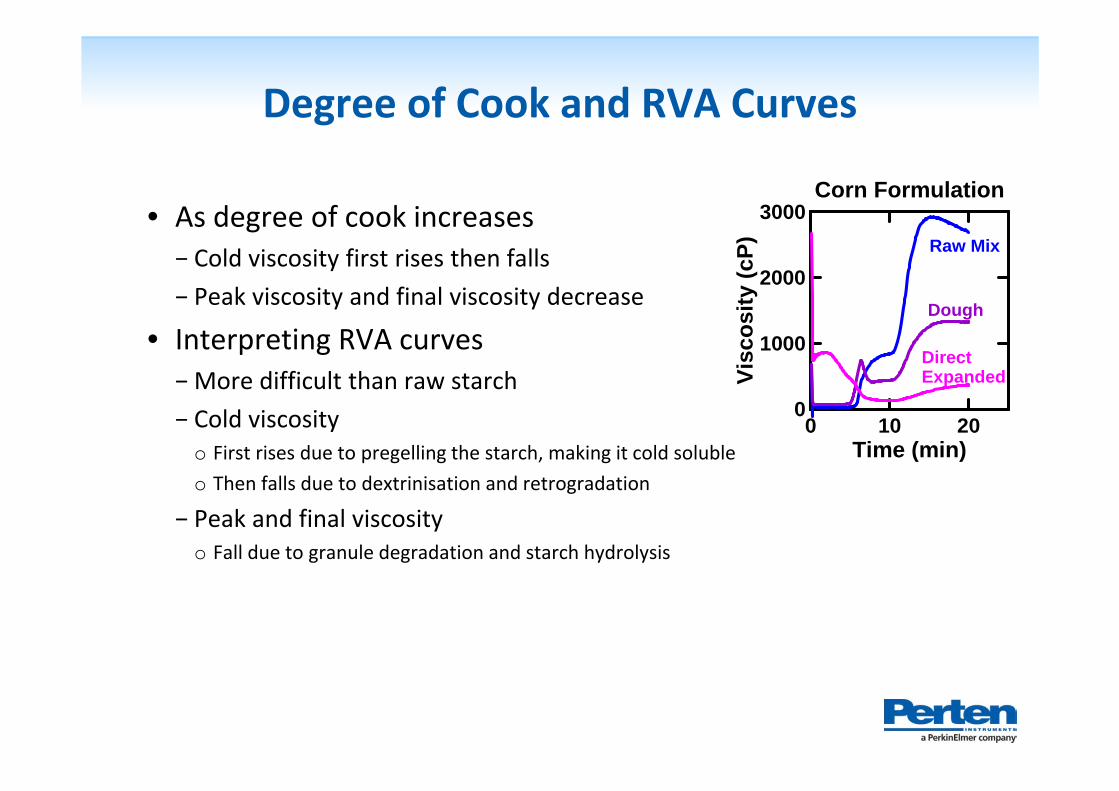
Degree of Cook and RVA Curves
• As degree of cook increases− Cold viscosity first rises then falls− Peak viscosity and final viscosity decrease
• Interpreting RVA curves−More difficult than raw starch− Cold viscosity
o First rises due to pregelling the starch, making it cold solubleo Then falls due to dextrinisation and retrogradation
− Peak and final viscosityo Fall due to granule degradation and starch hydrolysis
0 10 20Time (min)
0
1000
2000
3000
Visc
osity
(cP) Raw Mix
Dough
DirectExpanded
Corn Formulation
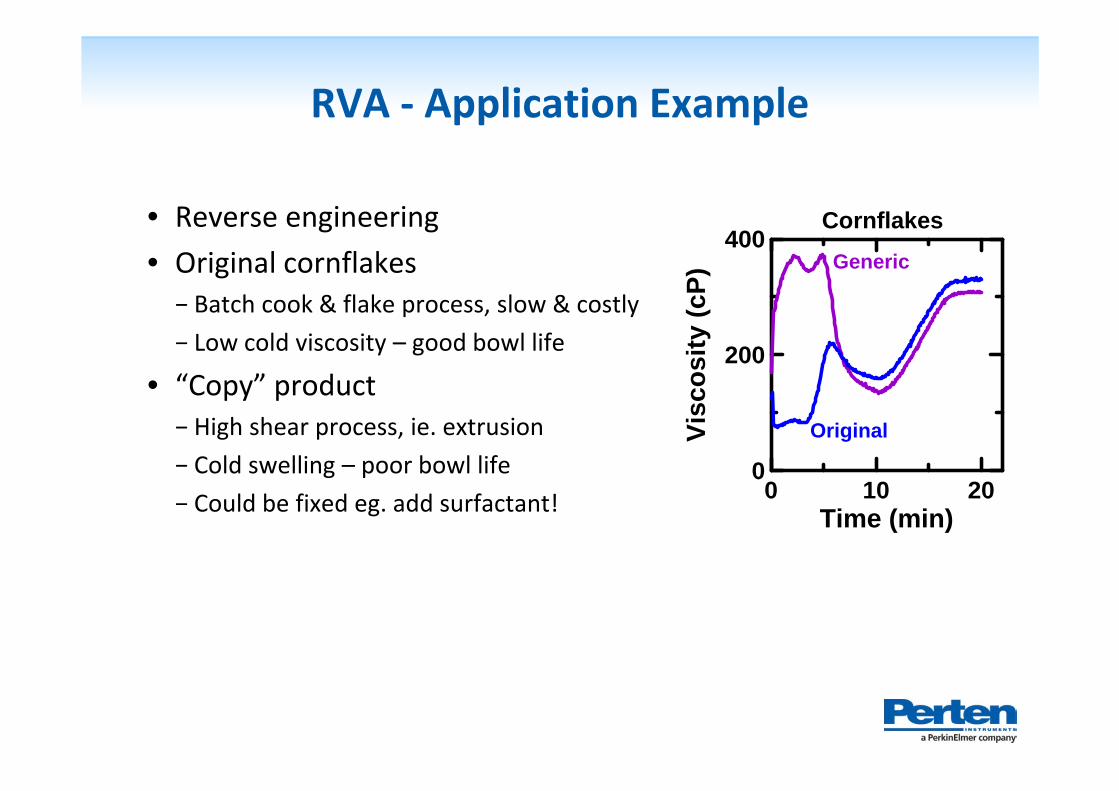
RVA ‐ Application Example
• Reverse engineering• Original cornflakes
− Batch cook & flake process, slow & costly− Low cold viscosity – good bowl life
• “Copy” product− High shear process, ie. extrusion− Cold swelling – poor bowl life− Could be fixed eg. add surfactant! 0 10 20
Time (min)
0
200
400
Visc
osity
(cP)
Generic
Original
Cornflakes
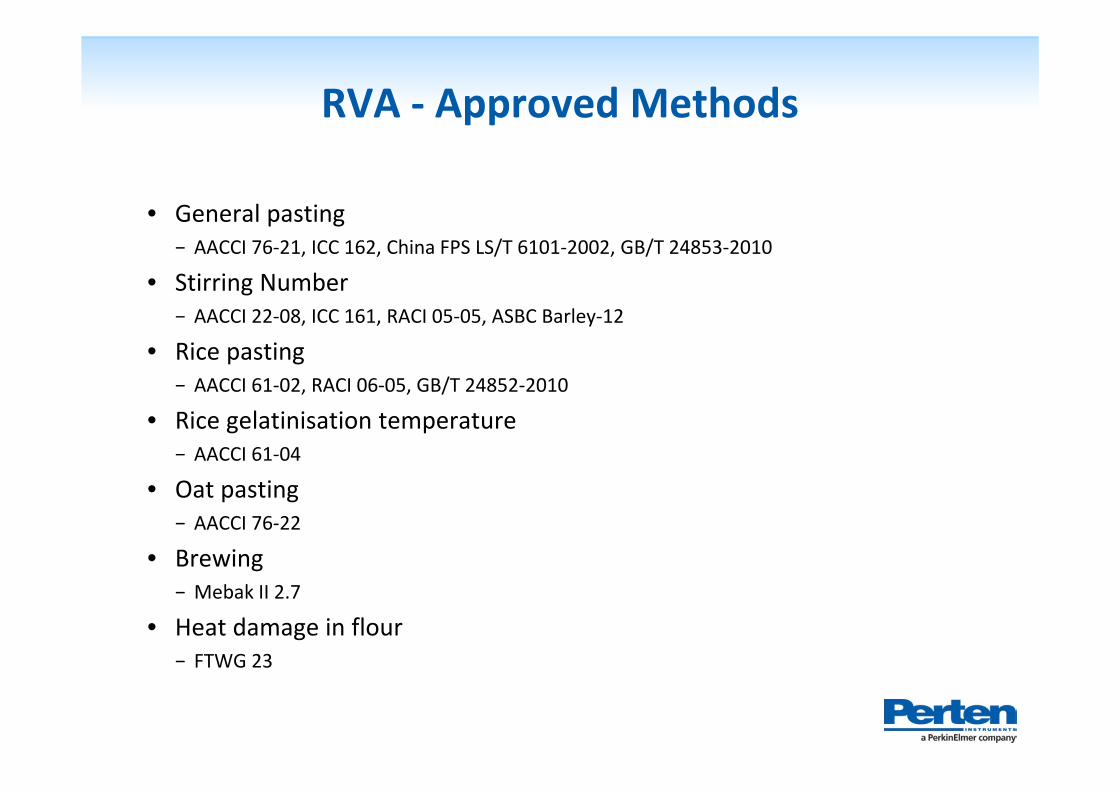
RVA ‐ Approved Methods
• General pasting− AACCI 76‐21, ICC 162, China FPS LS/T 6101‐2002, GB/T 24853‐2010
• Stirring Number− AACCI 22‐08, ICC 161, RACI 05‐05, ASBC Barley‐12
• Rice pasting− AACCI 61‐02, RACI 06‐05, GB/T 24852‐2010
• Rice gelatinisation temperature− AACCI 61‐04
• Oat pasting− AACCI 76‐22
• Brewing− Mebak II 2.7
• Heat damage in flour− FTWG 23
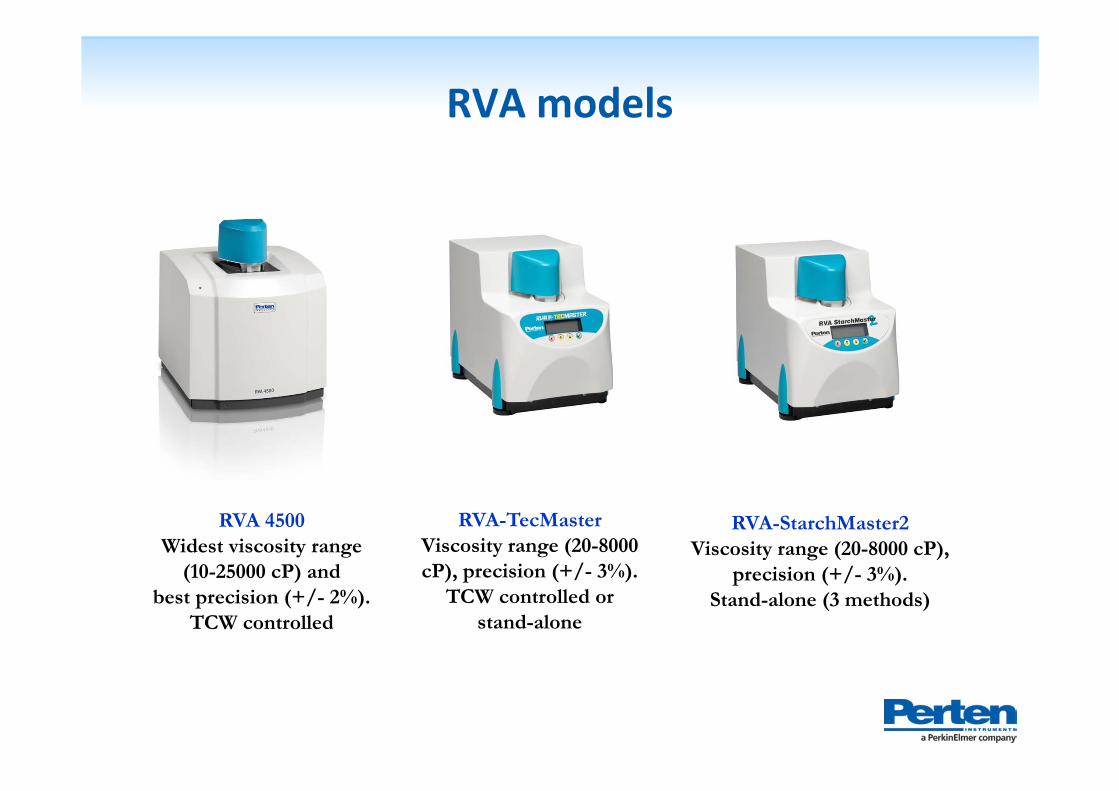
RVA-StarchMaster2 Viscosity range (20-8000 cP),
precision (+/- 3%).Stand-alone (3 methods)
RVA-TecMasterViscosity range (20-8000 cP), precision (+/- 3%).
TCW controlled or stand-alone
RVA models
RVA 4500Widest viscosity range
(10-25000 cP) and best precision (+/- 2%).
TCW controlled
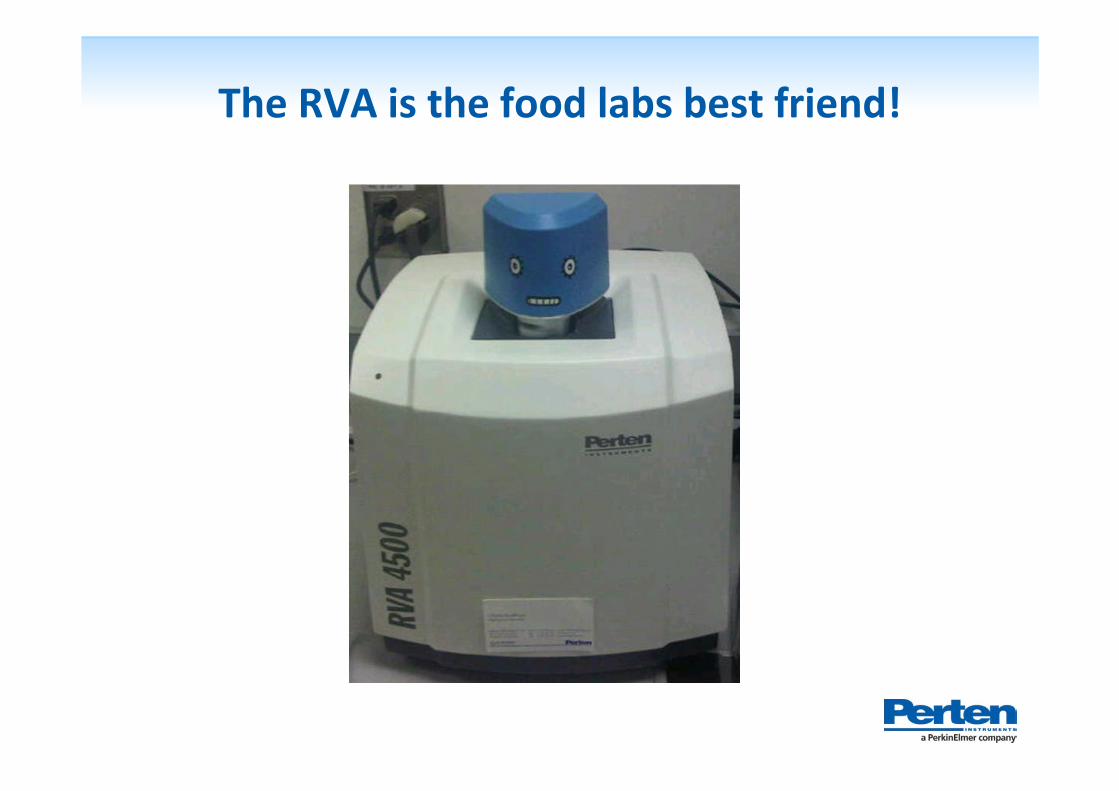
The RVA is the food labs best friend!

TVT 6700 texture analyzer
• Test Hardness, Springiness, Stickiness, Fracturability, Crispness, Tensile test and much more.
• Monitor staling process
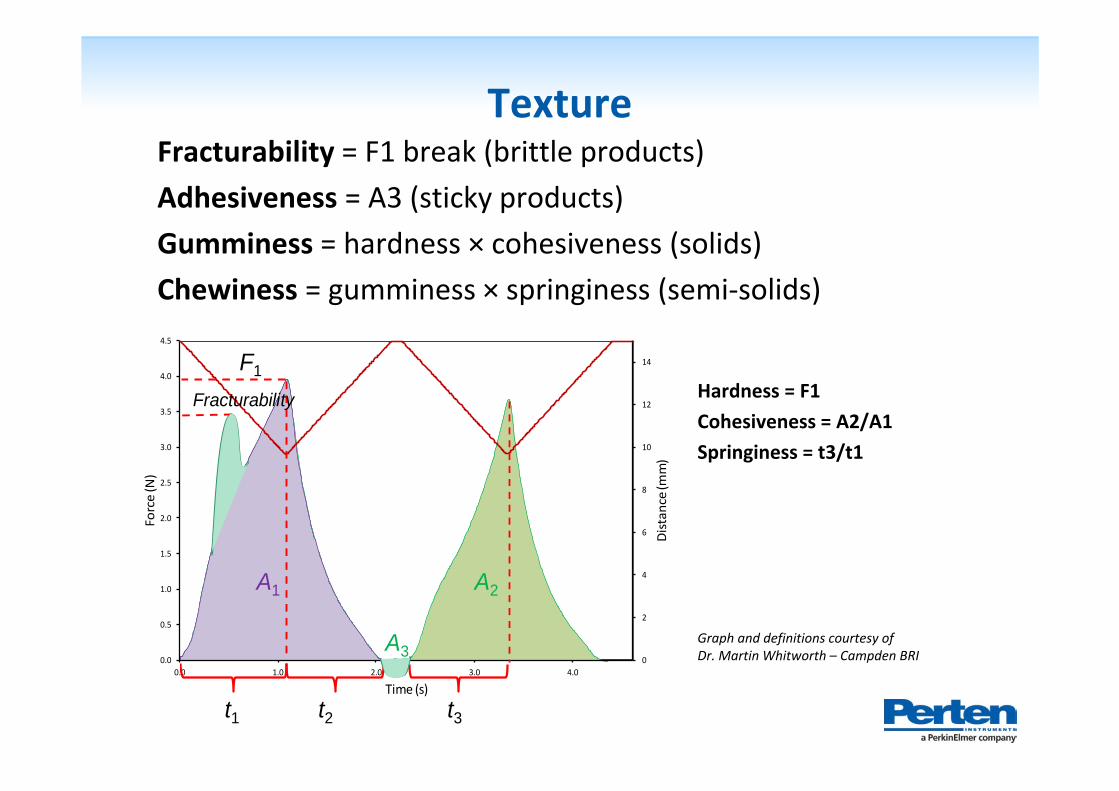
TextureFracturability = F1 break (brittle products) Adhesiveness = A3 (sticky products)Gumminess = hardness × cohesiveness (solids) Chewiness = gumminess × springiness (semi‐solids)
0.0 1.0 2.0 3.0 4.00
2
4
6
8
10
12
14
0.0
0.5
1.0
1.5
2.0
2.5
3.0
3.5
4.0
4.5
Distance(m
m)
Force(N)
Time (s)
A1 A2
F1
t1 t2 t3
A3
Fracturability
Graph and definitions courtesy of Dr. Martin Whitworth – Campden BRI
Hardness = F1 Cohesiveness = A2/A1Springiness = t3/t1
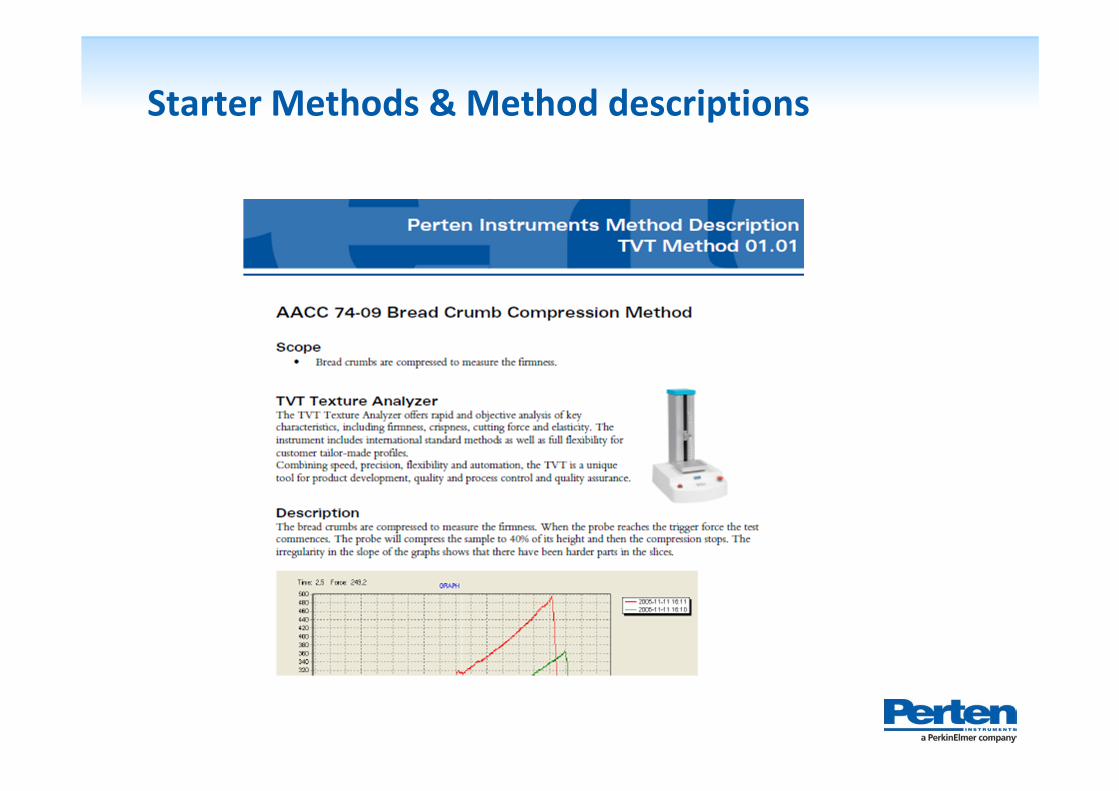
Starter Methods & Method descriptions
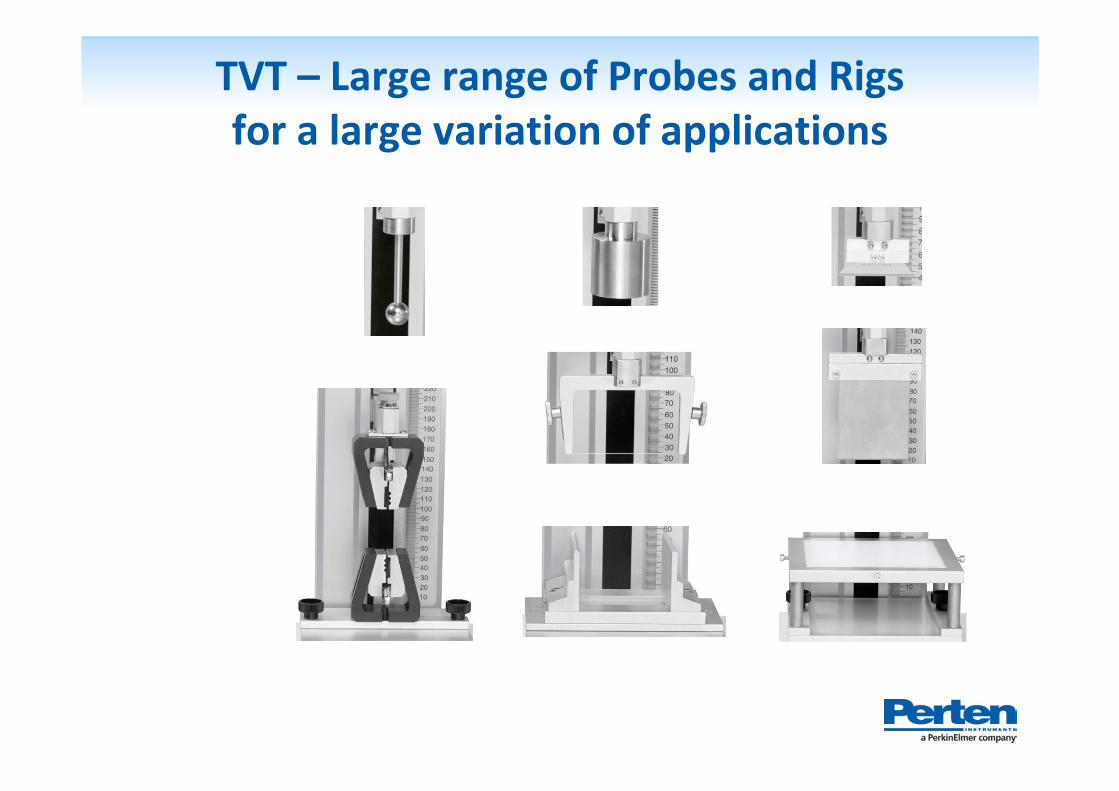
TVT – Large range of Probes and Rigs for a large variation of applications
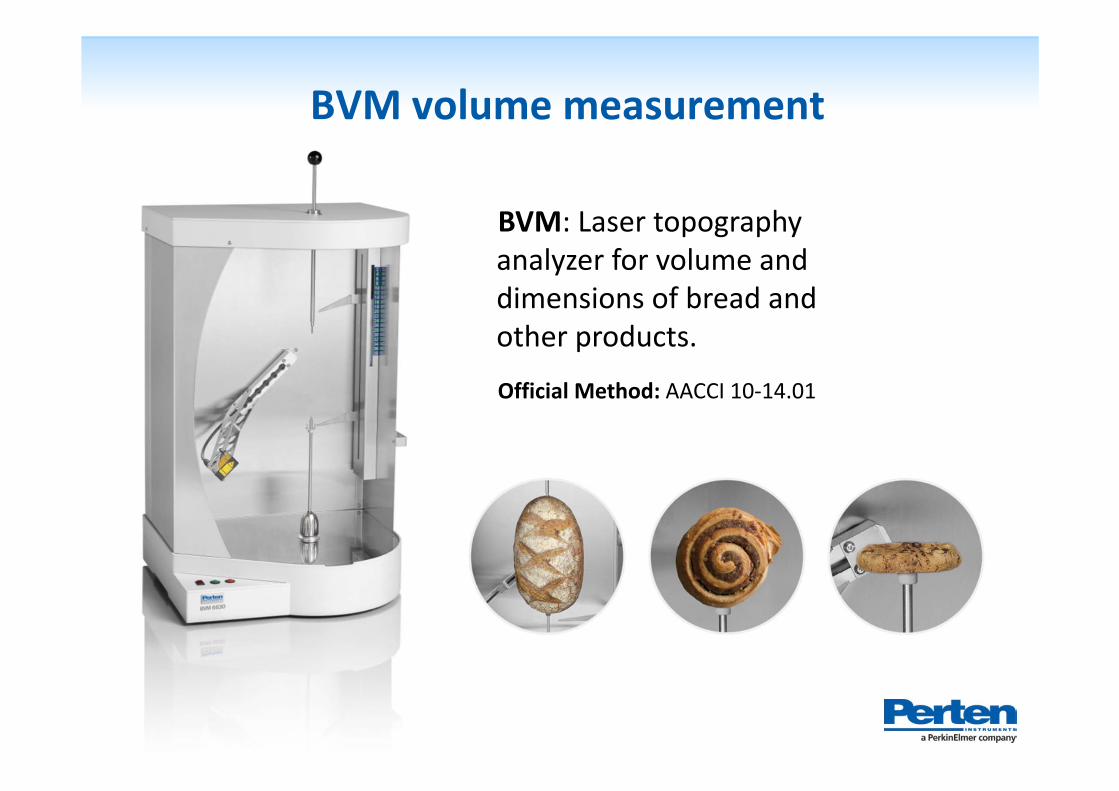
BVM: Laser topography analyzer for volume and dimensions of bread and other products.
Official Method: AACCI 10‐14.01
BVM volume measurement
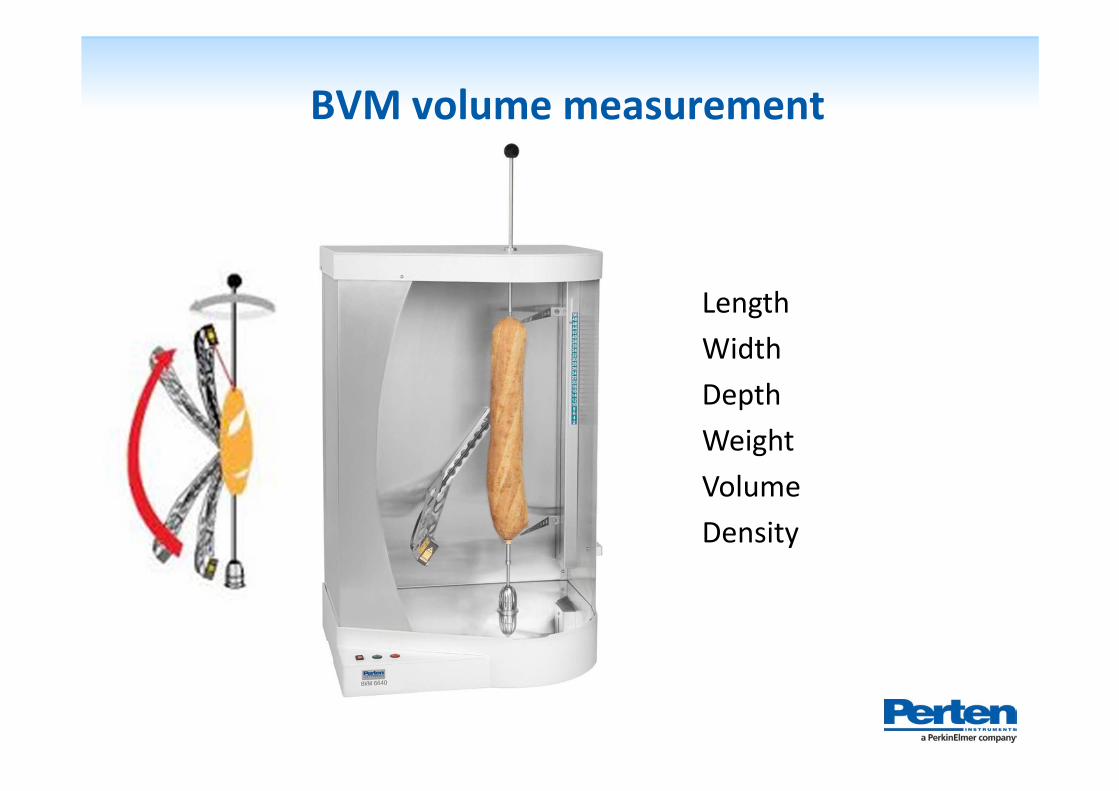
LengthWidthDepthWeightVolumeDensity
BVM volume measurement
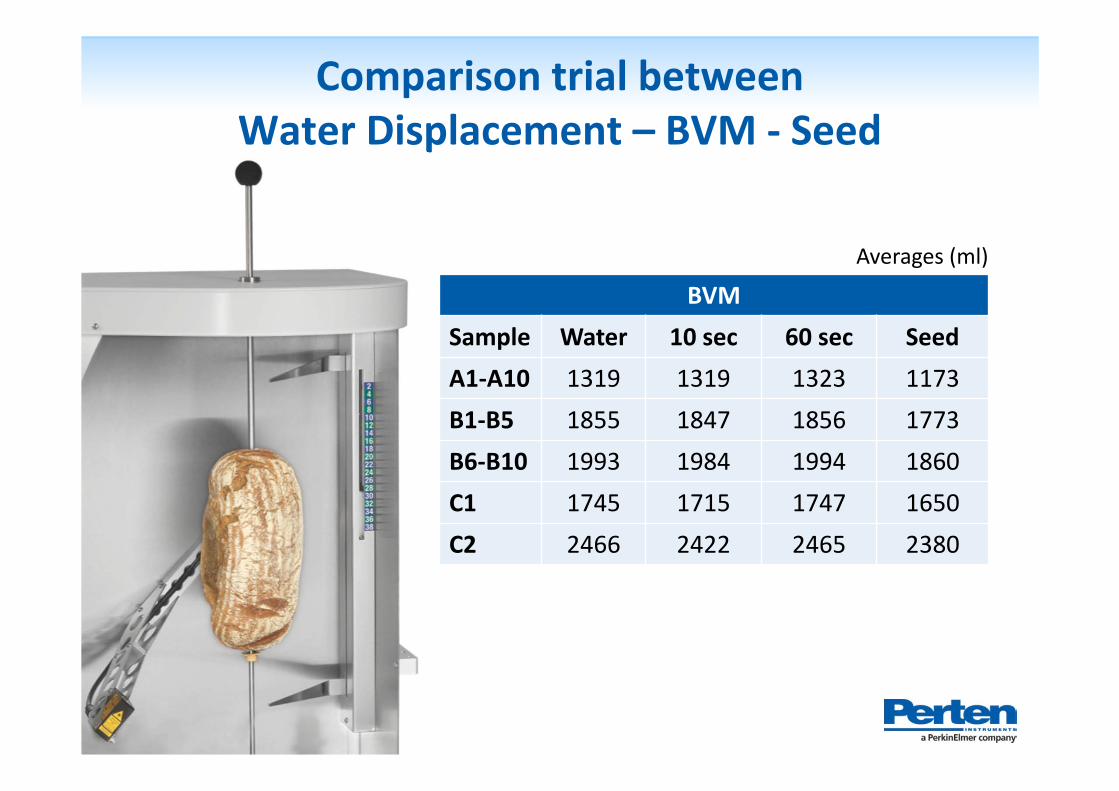
BVMSample Water 10 sec 60 sec SeedA1‐A10 1319 1319 1323 1173B1‐B5 1855 1847 1856 1773B6‐B10 1993 1984 1994 1860C1 1745 1715 1747 1650C2 2466 2422 2465 2380
Comparison trial betweenWater Displacement – BVM ‐ Seed
Averages (ml)
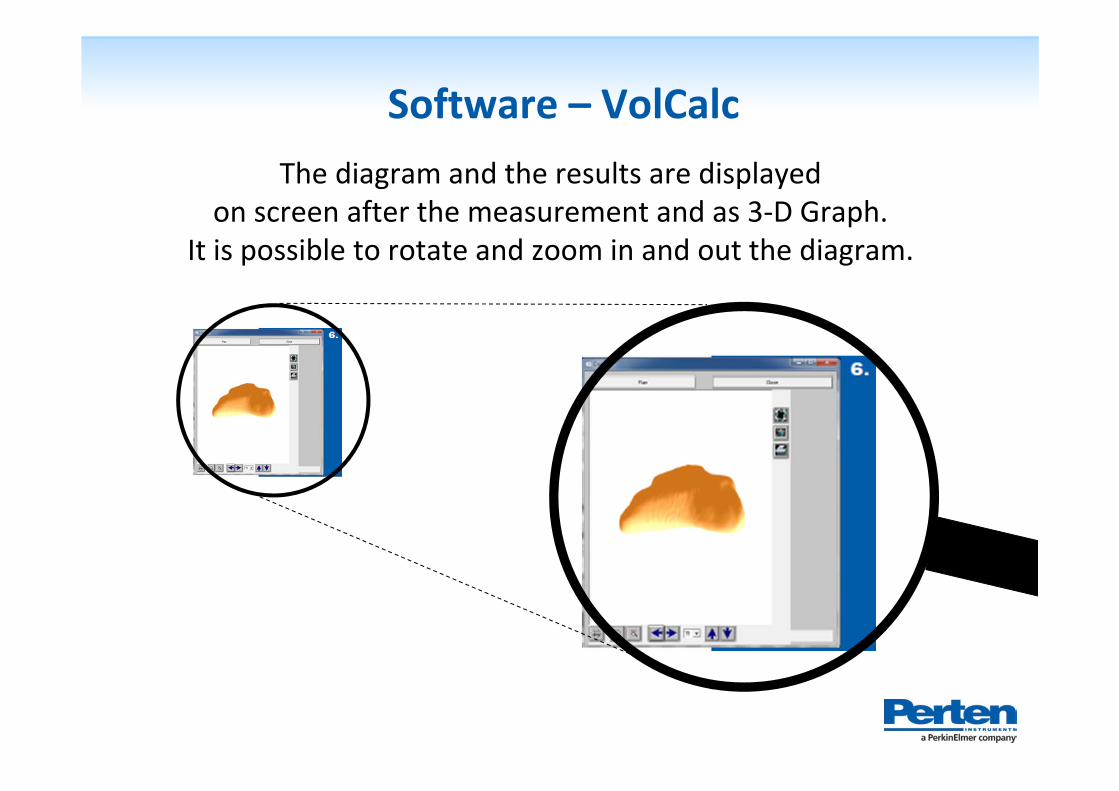
Software – VolCalcThe diagram and the results are displayed
on screen after the measurement and as 3‐D Graph. It is possible to rotate and zoom in and out the diagram.
Questions

Thank you!