Embed Size (px)
Citation preview
Functional and comparative epigenetic analysis of regulatory and conventional T-
cells
Diplomarbeit
Naturwissenschaftliche Fakultät III
Biologie und Vorklinische Medizin
Universität Regensburg
Vorgelegt von
Christian Schmidl aus Tauberfeld
2008
Table of contents
2
TTaabbllee ooff ccoonntteennttss
Deutsche Zusammenfassung ..................................... 6
1 Preface ..................................................................... 8
2 Introduction ............................................................. 9
2.1 Epigenetics and gene regulation- DNA methylation, histone modifications, chromatin structure ....................................................... 9
2.1.1 DNA Methylation .................................................................................... 9
2.1.2 Molecular consequences of CpG methylation ...................................... 11
2.1.3 DNA methylation and chromatin .......................................................... 12
2.1.3.1 Histone acetylation .................................................................................................. 12
2.1.3.2 Histone methylation ................................................................................................ 14
2.2 Epigenetic processes in development ...................................... 15
2.2.1 Imprinting and non canonical functions for CTCF ................................ 15
2.2.2 Epigenetics in the haematopoietic system ........................................... 16
2.3 Regulatory T-cells .................................................................... 17
2.3.1 Development and function ................................................................... 17
2.3.2 Treg in transplantation ......................................................................... 20
2.3.3 Epigenetic control of the Foxp3 locus .................................................. 21
3 Aims ....................................................................... 22
4 Material and equipment ........................................ 23
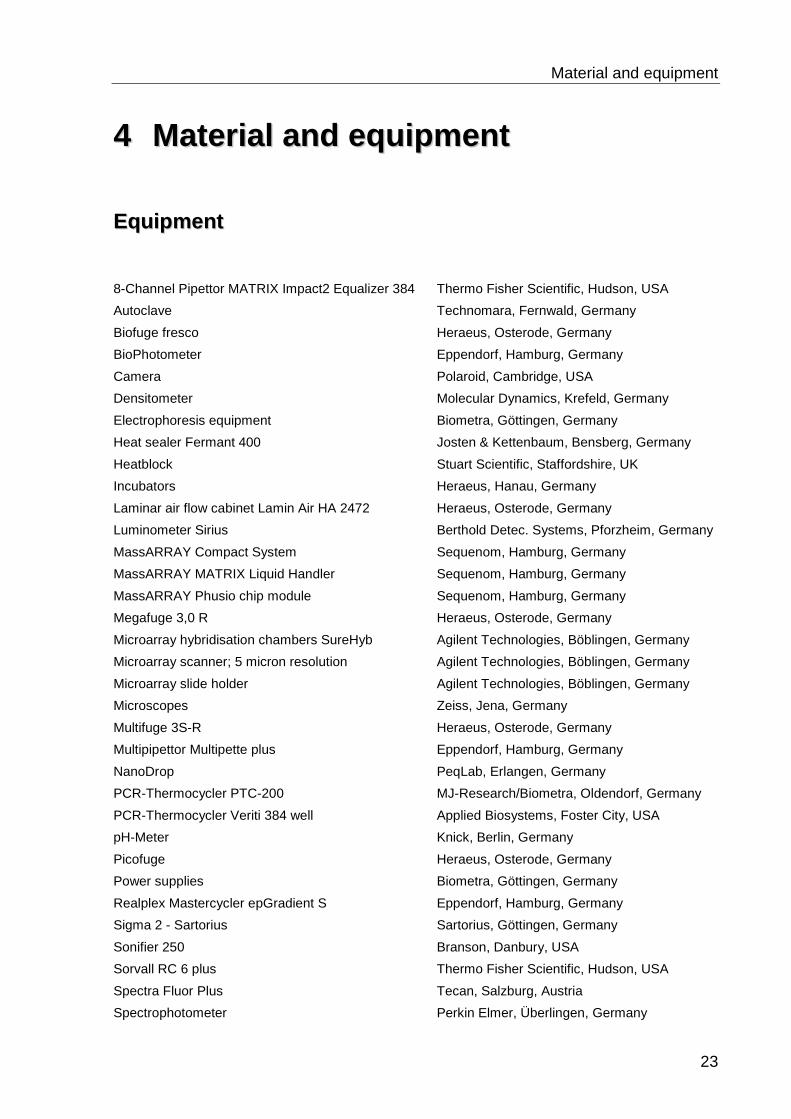
4.1 Equipment ................................................................................ 23
4.2 Consumables ........................................................................... 24
4.3 Chemicals ................................................................................ 24
4.4 Enzymes, kits and products for molecular biology .................... 25
4.5 Antibodies ................................................................................ 26
4.6 Cell lines ................................................................................... 26
4.7 E.coli strains ............................................................................. 26
4.8 Plasmids ................................................................................... 26
4.9 Software/Bioinformatics ............................................................ 26
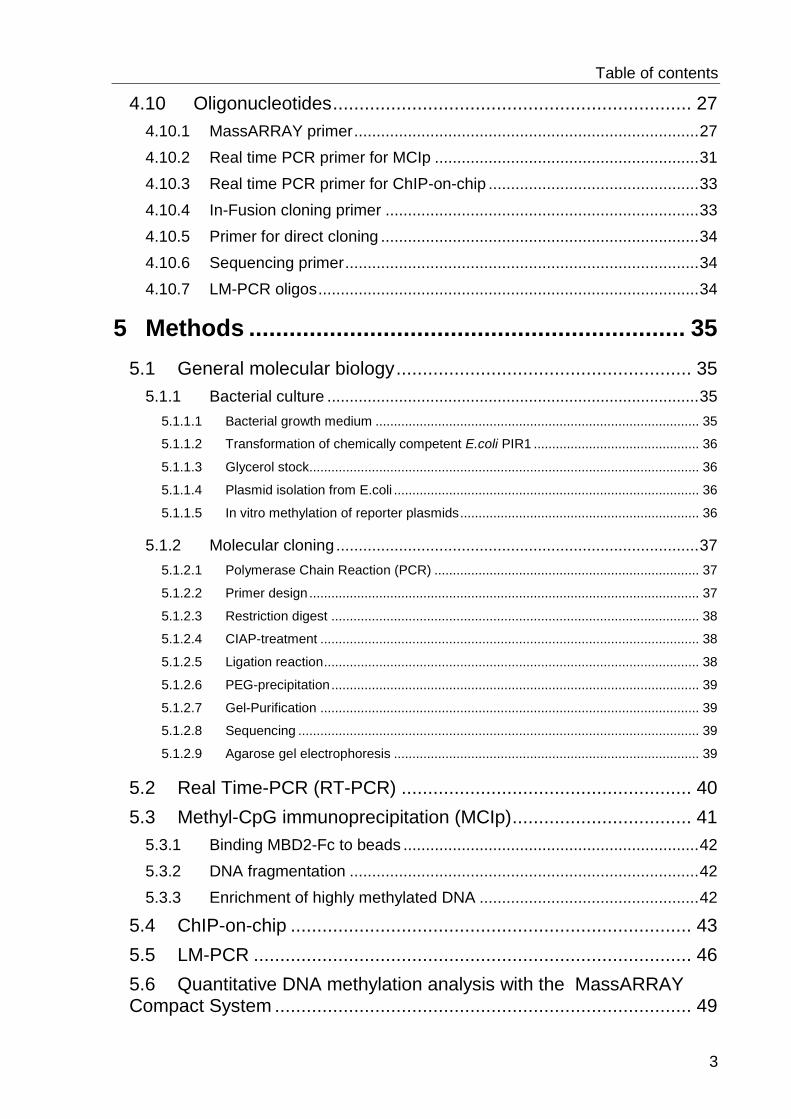
Table of contents
3
4.10 Oligonucleotides .................................................................... 27
4.10.1 MassARRAY primer ............................................................................. 27
4.10.2 Real time PCR primer for MCIp ........................................................... 31
4.10.3 Real time PCR primer for ChIP-on-chip ............................................... 33
4.10.4 In-Fusion cloning primer ...................................................................... 33
4.10.5 Primer for direct cloning ....................................................................... 34
4.10.6 Sequencing primer ............................................................................... 34
4.10.7 LM-PCR oligos ..................................................................................... 34
5 Methods ................................................................. 35
5.1 General molecular biology ........................................................ 35
5.1.1 Bacterial culture ................................................................................... 35
5.1.1.1 Bacterial growth medium ........................................................................................ 35
5.1.1.2 Transformation of chemically competent E.coli PIR1 ............................................. 36
5.1.1.3 Glycerol stock.......................................................................................................... 36
5.1.1.4 Plasmid isolation from E.coli ................................................................................... 36
5.1.1.5 In vitro methylation of reporter plasmids ................................................................. 36
5.1.2 Molecular cloning ................................................................................. 37
5.1.2.1 Polymerase Chain Reaction (PCR) ........................................................................ 37
5.1.2.2 Primer design .......................................................................................................... 37
5.1.2.3 Restriction digest .................................................................................................... 38
5.1.2.4 CIAP-treatment ....................................................................................................... 38
5.1.2.5 Ligation reaction ...................................................................................................... 38
5.1.2.6 PEG-precipitation .................................................................................................... 39
5.1.2.7 Gel-Purification ....................................................................................................... 39
5.1.2.8 Sequencing ............................................................................................................. 39
5.1.2.9 Agarose gel electrophoresis ................................................................................... 39
5.2 Real Time-PCR (RT-PCR) ....................................................... 40
5.3 Methyl-CpG immunoprecipitation (MCIp) .................................. 41
5.3.1 Binding MBD2-Fc to beads .................................................................. 42
5.3.2 DNA fragmentation .............................................................................. 42
5.3.3 Enrichment of highly methylated DNA ................................................. 42
5.4 ChIP-on-chip ............................................................................ 43
5.5 LM-PCR ................................................................................... 46
5.6 Quantitative DNA methylation analysis with the MassARRAY Compact System ............................................................................... 49
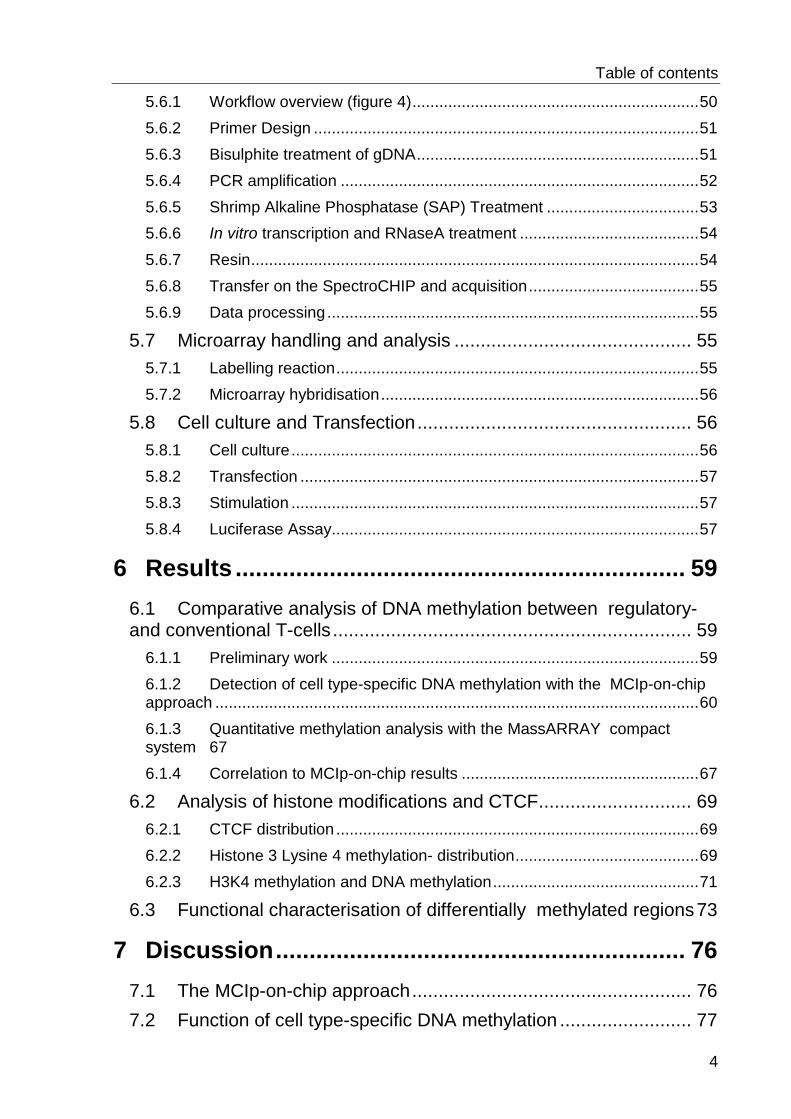
Table of contents
4
5.6.1 Workflow overview (figure 4) ................................................................ 50
5.6.2 Primer Design ...................................................................................... 51
5.6.3 Bisulphite treatment of gDNA ............................................................... 51
5.6.4 PCR amplification ................................................................................ 52
5.6.5 Shrimp Alkaline Phosphatase (SAP) Treatment .................................. 53
5.6.6 In vitro transcription and RNaseA treatment ........................................ 54
5.6.7 Resin .................................................................................................... 54
5.6.8 Transfer on the SpectroCHIP and acquisition ...................................... 55
5.6.9 Data processing ................................................................................... 55
5.7 Microarray handling and analysis ............................................. 55
5.7.1 Labelling reaction ................................................................................. 55
5.7.2 Microarray hybridisation ....................................................................... 56
5.8 Cell culture and Transfection .................................................... 56
5.8.1 Cell culture ........................................................................................... 56
5.8.2 Transfection ......................................................................................... 57
5.8.3 Stimulation ........................................................................................... 57
5.8.4 Luciferase Assay .................................................................................. 57
6 Results ................................................................... 59
6.1 Comparative analysis of DNA methylation between regulatory- and conventional T-cells .................................................................... 59
6.1.1 Preliminary work .................................................................................. 59
6.1.2 Detection of cell type-specific DNA methylation with the MCIp-on-chip approach ............................................................................................................ 60
6.1.3 Quantitative methylation analysis with the MassARRAY compact system 67
6.1.4 Correlation to MCIp-on-chip results ..................................................... 67
6.2 Analysis of histone modifications and CTCF ............................. 69
6.2.1 CTCF distribution ................................................................................. 69
6.2.2 Histone 3 Lysine 4 methylation- distribution ......................................... 69
6.2.3 H3K4 methylation and DNA methylation .............................................. 71
6.3 Functional characterisation of differentially methylated regions 73
7 Discussion ............................................................. 76
7.1 The MCIp-on-chip approach ..................................................... 76
7.2 Function of cell type-specific DNA methylation ......................... 77
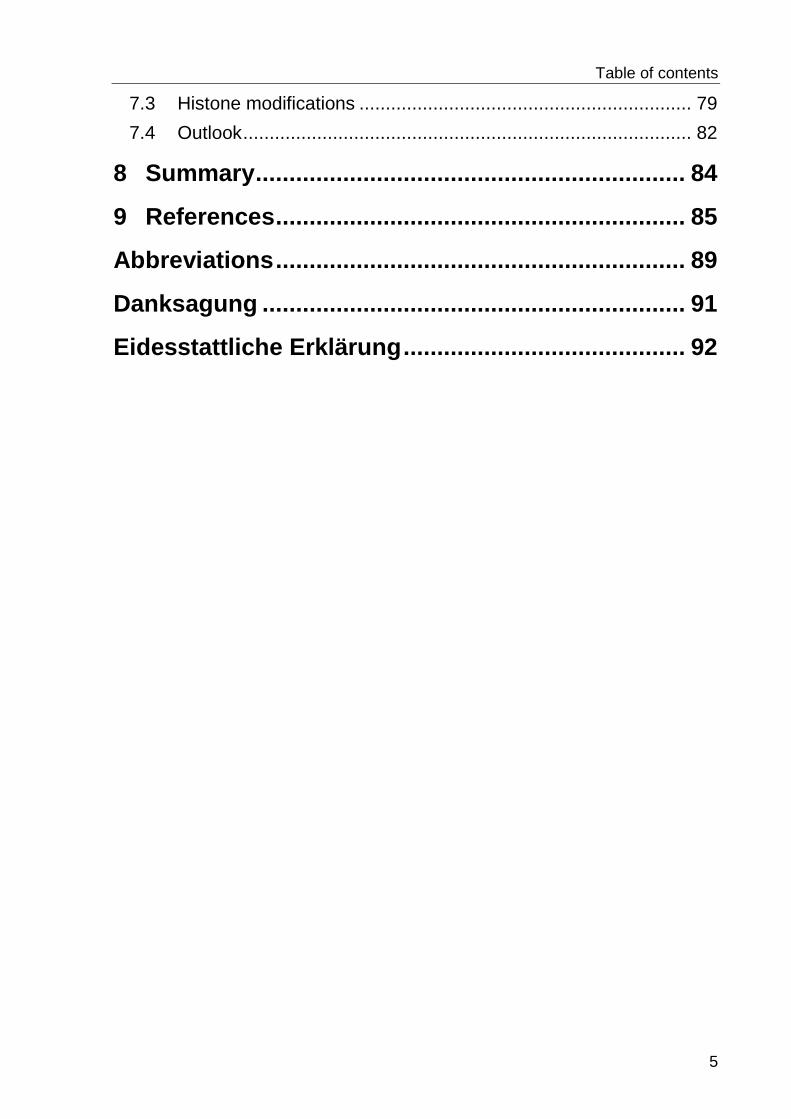
Table of contents
5
7.3 Histone modifications ............................................................... 79
7.4 Outlook ..................................................................................... 82
8 Summary ................................................................ 84
9 References ............................................................. 85
Abbreviations ............................................................. 89
Danksagung ............................................................... 91
Eidesstattliche Erklärung .......................................... 92
Deutsche Zusammenfassung
6
DDeeuuttsscchhee ZZuussaammmmeennffaassssuunngg
DNA Methylierung und Histonmodifikationen erweitern den Informationsgehalt der
darunter liegenden DNA Sequenz, um über Zellgenerationen hinweg die
Genexpression und damit das Entwicklungs- und Differenzierungspotential der Zellen
zu beeinflussen. Obwohl man DNA Methylierung schon lange studiert hat weiß man
bisher sehr wenig über ihr Vorkommen und ihre Funktion abseits der
Genpromotoren.
Mit dieser Arbeit haben wir eine Methode beschrieben, mit der es möglich ist
zelltypspezifische DNA Methylierungsmuster zu detektieren. Die Richtigkeit der
Methode wurde mit einem unabhängigen Bisulfit-basierenden Ansatz (MassARRAY
System der Firma Sequenom) bestätigt. Wir haben unterschiedlich methylierte
Regionen (DMR) in 59 von 181 zwischen regulatorischen- und konventionellen
T-Zellen (Treg und Tconv) unterschiedlich exprimierten Genen (inklusive Kontrollen)
gefunden. Interessanterweise waren nur fünf Genpromotoren betroffen, die restlichen
DMR befanden sich außerhalb der Promotoren und überlappten häufig mit
konservierten Sequenzabschnitten.
Reportergen-Konstrukte schrieben den DMR „Enhanceraktivität“ zu die durch DNA
Methylierung abgeschaltet werden konnte: fünf von acht klonierten DMR in
Luziferase-Reporterkonstrukten zeigten erhöhte Luziferaseaktivität die durch in vitro
Methylierung wieder stark verringert wurde.
Neben Enhanceraktivität zeigten DMR auch eine Wechselbeziehung zu
Histonmodifikationen. Uns war es Möglich in den zwei T-Zellpopulationen einen
positiven Zusammenhang zwischen relativer Hypomethylierung und erhöhter Histon
3 Lysin 4 (H3K4) Di- und Trimethylierung herzustellen. Darüber hinaus fanden wir in
79 % der Gene, welche in einem Zelltyp stärker als im anderen exprimiert waren,
eine Anreicherung von H3K4 Trimethylierung um den Transkriptionsstart. H3K4
Methylierung war auch an den getesteten Enhancern gegenwärtig und könnte damit
geeignet sein Voraussagen über potentielle Enhancer zu treffen.
Mit H3K4 Trimethylierung als Zeichen aktiver Transkription könnte man zusätzlich
Deutsche Zusammenfassung
7
alternative Promotoren oder Stellen bisher unbekannter transkriptionellen Aktivität
lokalisieren.
Letztendlich wurde in dieser Studie einige epigenetische Phänomene charakterisiert
und die Basis für weitere Experimente gelegt, welche die Rolle von DNA-
Methylierung und Histonmodifikationen bei der Entwicklung und Funktion von
regulatorischen T-Zellen erklären können um deren Anwendung in klinischen Studien
zu verbessern.
Preface
8
11 PPrreeffaaccee
Identity and developmental potential of a cell are not only defined by its genetic
component which includes all functions that are a direct consequence of the DNA
sequence, but also by the cell’s epigenetic state. The term “epi” means “on top of”,
and epigenetics covers additional and heritable information carried by the cell to
regulate transcription and influence differentiation. The two main mediators of
epigenetic information are DNA methylation and modifications of chromatin.
In eukaryotes only cytosine is methylated at the 5’ residue and can directly block the
binding of transcription factors as the methyl group faces into the major groove of the
DNA double helix or by recruiting methyl-CpG-binding-domain (MBD) containing
proteins with activating or repressive properties1.
Histone proteins are responsible for packing the DNA in higher order structures
called chromatin, and its organisation influences transcription: DNA is wrapped
around the histone octamer containing two copies of histone 2A, 2B, 3 and 4 and
tightened with the histone H1 “clamp”2. The histone proteins are basic and have a
long N-terminal tail whose amino-acid residues can be enzymatically modified to
recruit regulatory and modulating proteins to affect chromatin status and DNA
accessibility3, eventually influencing transcription.
Taken together, these two phenomena extend the information of the underlying
constant DNA sequence to a higher complexity and are key players in modulating
gene expression and regulating development and differentiation.
Haematopoiesis is an excellent system to explore epigenetics as phenotypic and
functional diverse blood cells emerge from the same haematopoietic progenitor.
Histone modifications and DNA methylation influencing this differentiation process
have been studied to some extend, for example in erythrocytes at the beta-globin
locus and on the IFNG and IL-4 locus in TH1 and TH2 cells4. Since Shimon
Sakaguchi and his group described a new subpopulation of immunosuppressive
lymphocytes in 1995, the scientists’ attention has turned on these regulatory T-cells
(Treg) in order to explain existing diseases and to explore approaches for possible
cures5. This work focuses on the epigenetic profiling of these Treg in comparison to
conventional T-cells (Tconv).
Introduction
9
22 IInnttrroodduuccttiioonn
EEppiiggeenneettiiccss aanndd ggeennee rreegguullaattiioonn-- DDNNAA mmeetthhyyllaattiioonn,,
hhiissttoonnee mmooddiiffiiccaattiioonnss,, cchhrroommaattiinn ssttrruuccttuurree
2.1.1 DNA Methylation
The longest known epigenetic modification is the attachment of a methyl group to the
5’ carbon atom of the base cytosine (C). In mammals, the so-called “fifth base” 5’-
methyl Cytosine (5mC) is mainly associated with guanine (G) in CG dinucleotides
(CpGs). DNA methylation is considered to mediate stable gene silencing and is
essential for embryonic development6, genomic imprinting7, X-inactivation in
mammals8 and silencing of potential harmful DNA elements like transposons or
endogenous retroviruses9. Aberrant DNA methylation has been associated with
abnormal developmental processes including cancer10. CpG dinucleotides are
distributed unequally over the genome: Most CpGs in mammals are methylated,
distributed randomly and appear rarer than statistically expected11. One possible
explanation for this distribution is the observation that 5mC hydrolytically deaminates
to thymine (T), which is also a naturally occurring base in the DNA, resulting in a C to
T transition and a decrease of CpGs over time in evolution. However, there are
regions with higher CpG density, so called CpG islands (CGIs), with a GC content of
55 % or higher and a ratio of observed versus expected CpG frequency of 0.6 in a
fragment of 500 base pairs minimum12. The CGIs are normally associated with
promoter regions (more than half of the genes in the human genome are associated
with one or more CGIs with only few intergenic CGIs of unknown function) and are
preferentially unmethylated, raising the question how the maintenance of
hypomethylation in development and differentiation is achieved11.
Although most CGIs remain unmethylated throughout development regardless of
expression state, a minority becomes methylated, and this correlates with
transcriptional silencing of the associated gene. The classic example is
Introduction
10
X-chromosome inactivation, where hundreds of CGIs on Xi (inactivated
X-chromosome) become heavily methylated, ensuring transcriptional silencing8.
Promoters with a low CpG density seem to be methylated without precluding gene
expression, suggesting DNA methylation as a function of promoter CpG content13.
Moreover methylation analysis of 15100 promoters in a model where stem cells (ES)
differentiate over an intermediate neural progenitor (NP) to terminal pyramidal
neurons (TN) gave new insights in the function of promoter methylation:
Hypermethylation mediated gene silencing occurs very rarely during differentiation to
NPs but hardly ever in the final differentiation step to TN14. This suggests that
promoter methylation is not the prevalent mechanism for transcriptional repression in
ES, at least in this model. However, a different study discovered significant
association between tissue-specific promoter methylation and gene expression, not
only in CpG rich promoters15. Taken together these findings show that promoter
methylation and occurrences of DNA methylation patterns are still incompletely
understood. Furthermore even less is known about changes in DNA methylation
patterns offside of promoter regions, where only very limited studies of localized
regions have been carried out as described in sections 2.2.2 and 2.3.3.
In mammals there are three known enzymes, DNA methyltransferase 1, 3a and 3b
(Dnmt1, 3a and 3b) that catalyze the transfer of CH3 from S-adenosylmethionine
(SAM) to cytosine. Dnmt1 has been identified as the “maintenance”
methyltransferase that adds methyl groups to the newly synthesized and therefore
hemimethylated DNA-strand after replication, and Dnmt 3a and 3b catalyze de novo
methylation6. All three enzymes are essential for development because
corresponding knock-out mice die in utero or shortly after birth16. In humans, mutation
in Dnmt3b is associated with the ICF syndrome (immunodeficiency, centromeric
instability and facial anomalities) probably due to hypomethylation in centromeric
regions and satellite repeats6. Another well-documented consequence of DNA
methylation deficiency is the activation of transposable element-derived promoters17.
Like much of the mammalian genome, transposable element-related sequences are
heavily methylated and transcriptionally silent in somatic cells, indicating a protective
function of DNA methylation for the organism. Additionally it has to be mentioned that
some organisms lack Dnmt-like genes and are devoid of DNA methylation (for
example the yeast Saccharomyces cerevisiae and the nematode worm
Introduction
11
Caenorhabditis elegans), or that DNA methylation patterns and target sequences can
be different of those already mentioned. In the plant Arabidopsis thaliana for
example, non CpG residues (CNG and CNN, for N being any nucleotide) are often
methylated, and methylation is distributed mosaic-like throughout the genome in
contrast to the global methylation pattern in mammals11.
What remains unknown is the mechanism of active DNA demethylation. Passive
demethylation is the logical consequence of DNA replication, as the newly
synthesized strand only contains unmethylated cytosines which have to be
methylated by the maintenance methyltransferase Dnmt1. In contrast to plants no
specific demethylase has been found so far in mammals but enzymes involved in
DNA repair are potential factors in DNA demethylation. Glycosylases and
endonucleases have been suggested to cleave and relieve 5mC from DNA followed
by repair of the affected site18. Moreover, base excision repair enzymes, glycosylases
and Dnmt3a/b have been found at the PS2 response element in a model of dynamic
demethylation and remethylation of CpGs inherent to transcriptional cycling, implying
a role of Dnmts in demethylation events beside DNA repair enzymes19. Still the
mechanism of active demethylation is discussed controversially, and the question
remains how active demethylation is targeted to specific sites. Unpublished work in
our group show specific demethylation events of always the same CpGs which
precludes active demethylation as a statistic event. Possibly, “the demethylase” does
not exist and active demethylation is run out through different enzymatic reactions
adapted to the functional and structural context of the DNA region.
2.1.2 Molecular consequences of CpG methylation
Theoretically 5mC can influence gene expression in two ways: Firstly, the methyl
group points into the major groove of the DNA and the space occupied can directly
block the binding of transcription factors like c-Myc/Myn, CREB/ATF, E2F and
NFkappaB1 or other regulatory proteins such as CTCF20. The second mode of
influencing gene expression is opposite to the first because it involves proteins that
are attracted rather than repelled by 5mC. One of the first discovered was MeCP1, a
protein in a multi-enzyme complex that appeared to repress transcription and was
able to discriminate between methylated and unmethylated templates21.
Introduction
12
Later, the “core” domain for 5mC -binding has been identified in the MeCP2 protein
which was named MBD (methyl CpG binding domain) and through sequence
homology search more proteins have been found, namely MBD1-4, with MBD2 being
the methyl CpG binding domain of MeCP1. The proteins have different affinities
towards 5mC, from MBD3 showing very little affinity to MBD2 that can bind a single
CpG residue21. DNA binding is connected to the tertiary structure of the proteins with
two out of four anti-parallel beta strands are proposed to interact with the major
groove of the DNA, and it has recently been shown for the MBD of MeCP2 that the
protein recognizes the hydration of methylated DNA rather than 5mC itself22. DNA
methylation and the binding of MBD proteins have striking impact on the organization
and modification of chromatin.
2.1.3 DNA methylation and chromatin
The regulation of gene expression by DNA methylation goes hand in hand with
histone modifications and chromatin structure changes. DNA is packed into
chromatin, which consists of histone proteins, DNA and non-histone proteins. The
basic subunit of chromatin is the nucleosome, comprised of ~160 bp of DNA wrapped
around an octamer consisting of two copies each of histones H2A, H2B, H3 and
H423. Transcriptional regulation by DNA methylation and histone modifications comes
along with the recruitment of regulatory proteins that can change the physical
properties of chromatin, modulate its accessibility or create platforms for the
recruitment of other factors influencing transcription and modifying chromatin. MeCP2
for example has been shown to recruit the Sin3 repressor, a histone deacetylase
(HDAC) and a histone lysine methyltransferase (HKMT), MeCP1 is associated with
HDACs and MBD3 also has been identified as a component of a deacetylase
complex with a nucleosome remodelling activity, known as the Mi-2/NuRD complex24.
A change in chromatin structure can block transcription factors and co-activators from
interacting with DNA and ultimately modulate transcription. The most important
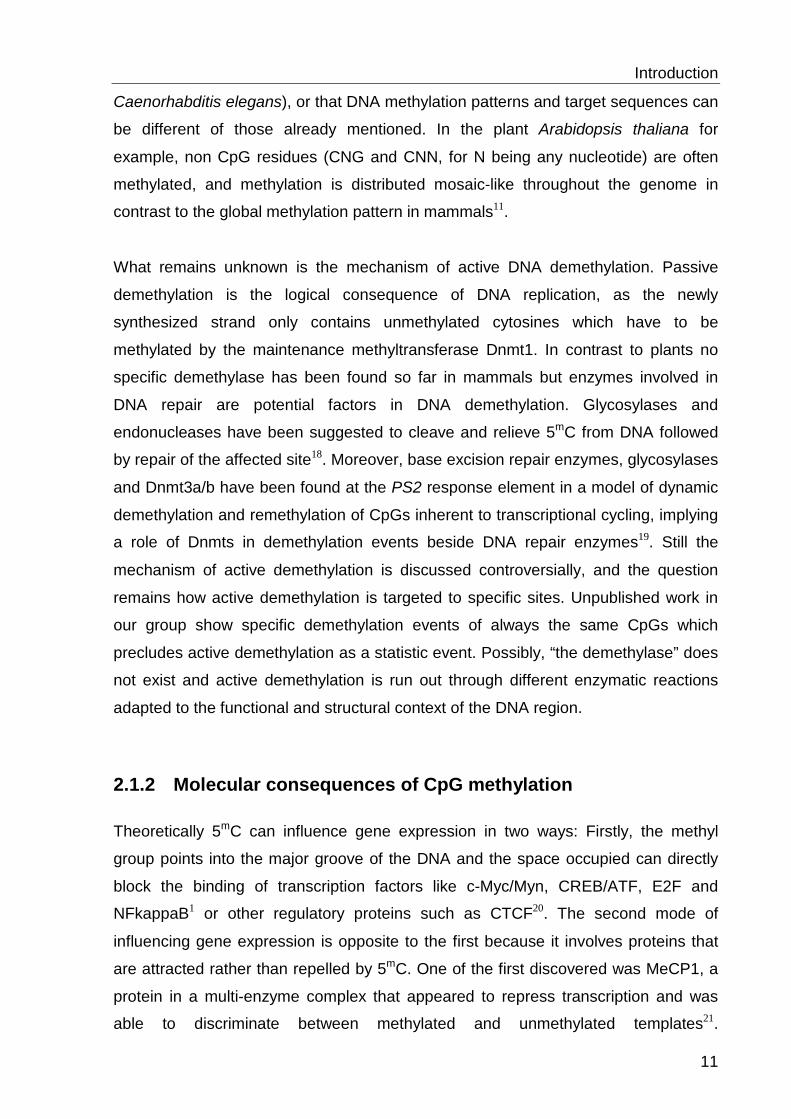
processes will be explained in detail and are summarised in figure 125.
Histone acetylation
HDACs remove acetyl groups from histone proteins, allowing their positively charged
residues to interact with the negative charges on the DNA-phosphate backbone and
Introduction
13
therefore wrapping the DNA tightly to the nucleosome and making it inaccessible for
transcription factors26. The antagonists to histone deacetylases are histone
acetylases (HATs). Three families of HATs — GNAT, MYST and CBP/p300 family
members — transfer acetyl groups to histone tails, neutralizing the positive charge on
Lysine residues to promote a “relaxed” chromatin state favouring transcription27.
Additionally, histone acetylation attracts proteins with a bromodomain, which enables
them to bind acetyl-lysine. As an example, these proteins can promote transcription
by moving away blocking nucleosomes from transcription factor binding sites as
described for SWI/SNF complexes discovered in yeast28 and the Mi-2/NuRD
complex, or by recruiting DNA-Polymerase II (Pol II) to the transcription start site (the
TFIID complex for initiation of transcription has a bromodomain29 and can be
recruited to acetylated Lysine).
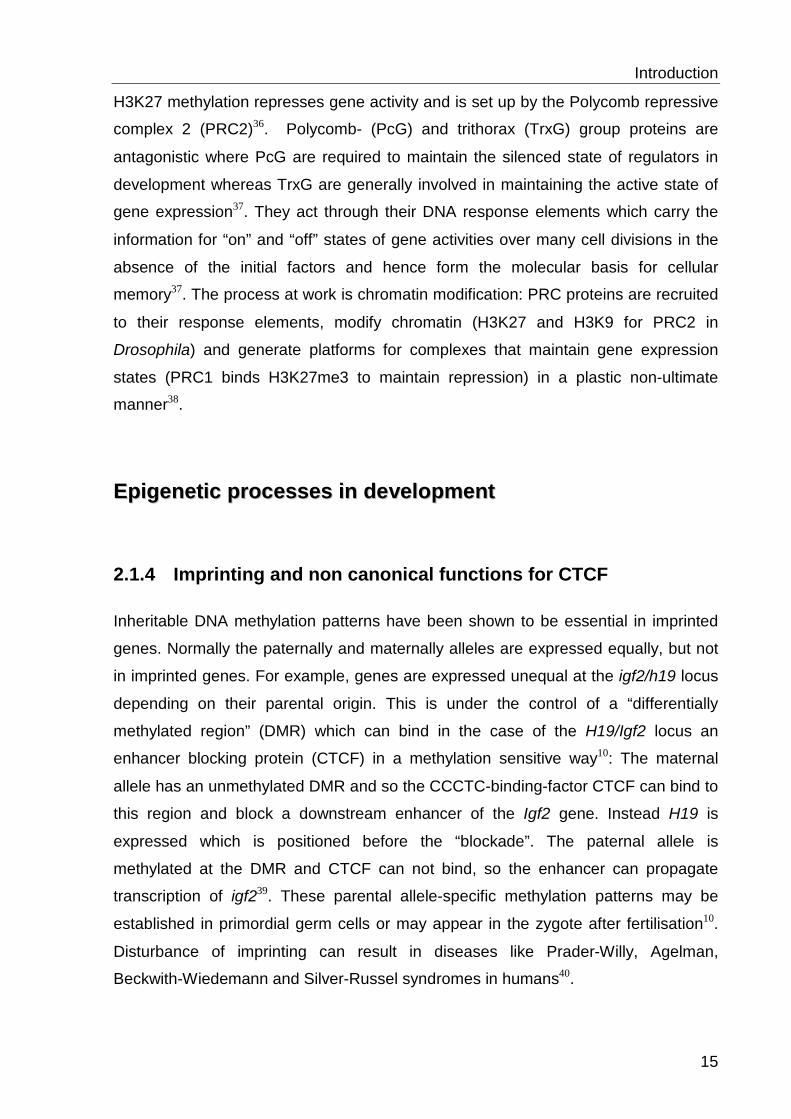
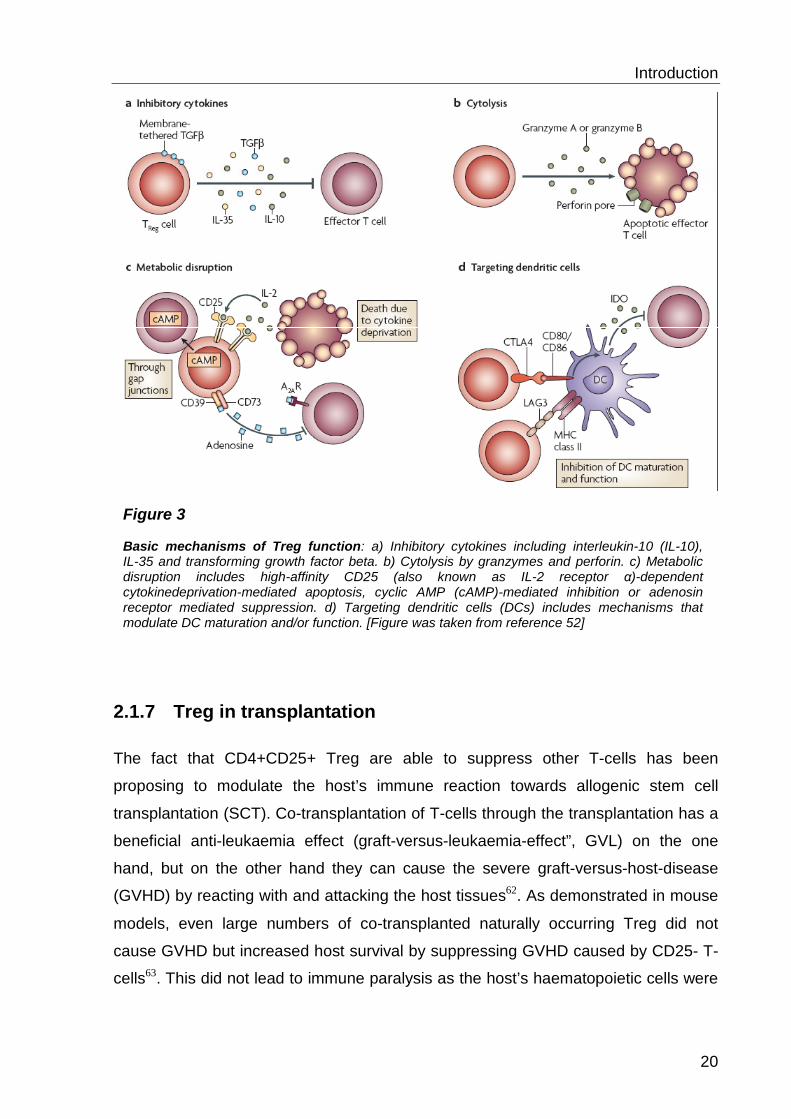
Figure 1 DNA methylation, chromatin and transcription. The open chromatin structure of a transcriptionally active gene with loosely spaced nucleosomes (blue cylinders) with DNA wrapped around it (indicated by the black line) is shown at the top and the transcriptionally silenced state with more tightly packed nucleosomes is shown at the bottom. Histone H3 acetylation is indicated by yellow triangles, histone H3 methylation is indicated by orange hexagons and CpG dinucleotides are indicated by circles strung along the DNA, with green circles denoting an unmethylated state and red circles indicating a methylated state. Proteins involved in transcriptional activation are indicated in green (TF, tanscription factor; CO-ACT, co-activator; TBP, tata-binding factor; TAF, TBP-associated factor; RNA-PII, RNA polymerase II). Histone acetyl transferases (HAT) and histone deacetylases (HDAC) are indicated in yellow. Histone H3 lysine-4 (K4 HMT) and lysine-9 (K9-HMT) are indicated in orange. Proteins involved in transcriptional silencing are indicated in red (DNMT, DNA methyltransferase; MBD, methyl-binding domain protein; CO-REP, co-repressor; HP1, heterochromatin protein 1; CAF-1, chromatin assembly factor-1) [Figure was taken from reference 25] .
Introduction
14
Histone methylation
Histone methylation is a complex epigenetic mark. Not only lysine but also arginine
can be methylated to different extents: lysine can be mono-, di- and trimethylated
(H3K4me1, -me2 and –me3) whereas arginine can only be mono- and dimethylated.
The consequence of methylation can either be positive or negative to transcriptional
expression. H3K9 methylation has been shown to correlate with silent genes through
its interaction with Heterochromatin Protein 1 (HP1), which has a chromo domain that
mediates binding (to methylated Lysine 9 on histone 3) and transcriptional
repression30 (see figure 1). H3K27 trimethylation is associated with silent genes, too,
whereas other modifications are associated with transcribed genes like H3K4 and
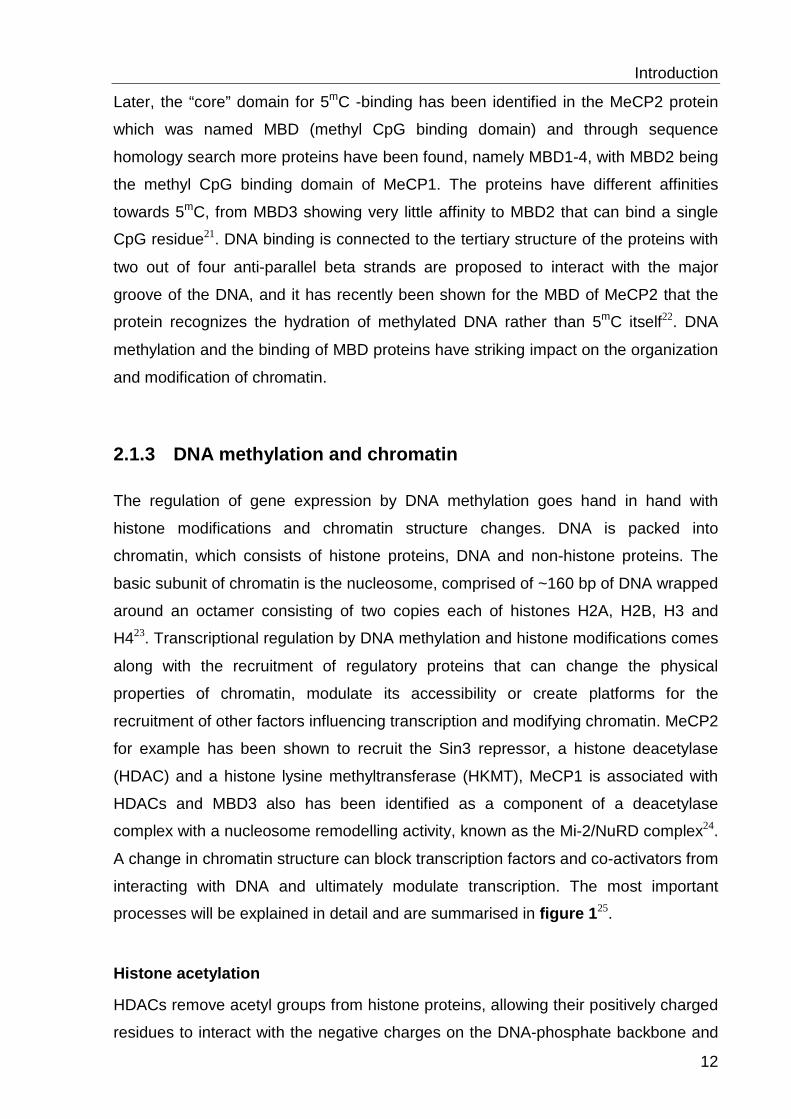
H3k36 methylations31. The former has high relevance for this work: Trimethylated
H3K4 is found more tightly around the transcription start site (TSS) as mono- and
dimethylated H3K4, but all with depletion directly at the TSS due to nucleosome
absence as expected at transcribed genes31. H3K4me1 is found over broad regions
and correlates with “open chromatin” as well as H3K4me2. H3K4me3 is described as
a mark for active transcription 2, 31. The distribution of H3K3me2/me3 additionally
seems to give information about distinct epigenetic regulation of CGI and non-CGI
genes during development and indicate an interactive relationship between DNA
sequence and differential H3K4 methylation in lineage-specific differentiation32.
Moreover H3K4 methylation has been linked to DNA demethylation33 and regulatory
elements like enhancers or insulators31, 34, 35. Distribution of histone modifications and
Pol II occupancy at active genes is illustrated in figure 2.
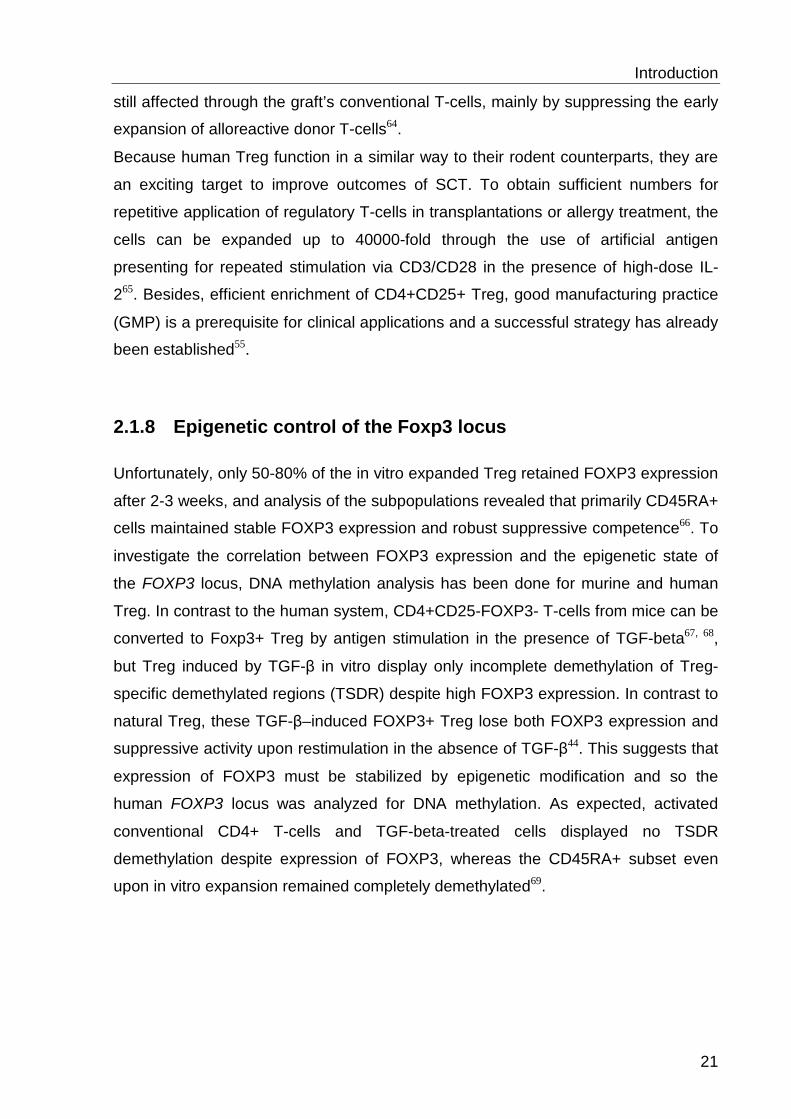
Figure 2 Nucleosomes, Pol II occupation and histone modifications around the TSS of active genes. H3K4me3 is highly enriched at the TSS whereas mono- and dimethylated H3K4 are distributed more broadly. There is also a significant enrichment of certain marks such as H3K4 methylation at distal regulatory elements. [Figure was taken from reference 31]
Introduction
15
H3K27 methylation represses gene activity and is set up by the Polycomb repressive
complex 2 (PRC2)36. Polycomb- (PcG) and trithorax (TrxG) group proteins are
antagonistic where PcG are required to maintain the silenced state of regulators in
development whereas TrxG are generally involved in maintaining the active state of
gene expression37. They act through their DNA response elements which carry the
information for “on” and “off” states of gene activities over many cell divisions in the
absence of the initial factors and hence form the molecular basis for cellular
memory37. The process at work is chromatin modification: PRC proteins are recruited
to their response elements, modify chromatin (H3K27 and H3K9 for PRC2 in
Drosophila) and generate platforms for complexes that maintain gene expression
states (PRC1 binds H3K27me3 to maintain repression) in a plastic non-ultimate
manner38.
EEppiiggeenneettiicc pprroocceesssseess iinn ddeevveellooppmmeenntt
2.1.4 Imprinting and non canonical functions for CTCF
Inheritable DNA methylation patterns have been shown to be essential in imprinted
genes. Normally the paternally and maternally alleles are expressed equally, but not
in imprinted genes. For example, genes are expressed unequal at the igf2/h19 locus
depending on their parental origin. This is under the control of a “differentially
methylated region” (DMR) which can bind in the case of the H19/Igf2 locus an
enhancer blocking protein (CTCF) in a methylation sensitive way10: The maternal
allele has an unmethylated DMR and so the CCCTC-binding-factor CTCF can bind to
this region and block a downstream enhancer of the Igf2 gene. Instead H19 is
expressed which is positioned before the “blockade”. The paternal allele is
methylated at the DMR and CTCF can not bind, so the enhancer can propagate
transcription of igf239. These parental allele-specific methylation patterns may be
established in primordial germ cells or may appear in the zygote after fertilisation10.
Disturbance of imprinting can result in diseases like Prader-Willy, Agelman,
Beckwith-Wiedemann and Silver-Russel syndromes in humans40.
Introduction
16
Besides its role in imprinting, CTCF mediated enhancer blocking such as at the 5′
end of the chicken β-globin locus seems to be a conserved function of this protein20.
It has been shown that cohesins co-localize with CTCF for its function as an
insulator39. CTCF seems to be positioned presumably at sites with high levels of
H3K4 methylation and histone variant H2A.Z31. If variations in CTCF positioning have
an impact on gene expression was an addressed problem in this study (section 6.2).
2.1.5 Epigenetics in the haematopoietic system
Haematopoietic cell differentiation is an ideal system to explore epigenetic processes
in development. Phenotypically different cell types develop through intermediated
stages from a common haematopoietic precursor cell. Hence, heritable information
has to be passed on from stage to stage to establish expression patterns and to
define cell identity.
The maturation of erythrocytes for example is associated with increased expression
of alpha- and beta-globin genes which are required for intensive haemoglobin
synthesis. The genes within the beta-globin locus are needed for different stages of
development: embryonic, foetal and adult haemoglobin genes are expressed in a
sequential fashion under the regulation of a locus control region which ultimately
silences the embryonic/foetal and activates the adult genes. This mechanism is
based on epigenetic principles: In adults the globin genes for early development are
silenced through DNA methylation and histone deacetylation to propagate a silent
chromatin status. Otherwise adult genes are activated through histone-
hyperacetylation and a change in promoter DNA-methylation41,42.
Similar to the beta-globin locus, the expression of specific transcription factors
required for differentiation and lineage commitment of other cell types are under the
control of epigenetic mechanisms. PU.1 for example is highly expressed in
haematopoietic stem cells and differentiated B-cells, but not in T-cells, correlating to
promoter hypermethylation in CD4+ and CD8+ cells43. Differential methylation of
elements controlling lineage committing transcription factors have been described for
GATA3, which displayed demethylation in CD4+ cells in comparison to CD8+,
CD34+, T- and B-cells, correlating with its role in the maturation of CD4+ single
positives. Epigenetic control of lineage determining factors has been controversially
Introduction
17
discussed for the forkhead transcription factor FOXP3 which is expressed under the
influence of an epigenetically controlled enhancer44.
DNA methylation has also been demonstrated to play an important role in cytokine
production in T-cells. The Interleukin-2 gene has an enhancer in its proximal
promoter, which is rapidly demethylated at some CpG residues upon antigen
stimulation which is sufficient for increased IL-2 expression45. Moreover the
demethylation occurs before S phase, suggesting active demethylation23. Another
described process underlying epigenetic influence is the differentiation of effector T-
cells. The T helper 1 (TH1) and T helper 2 (TH2) lineages are the best characterized
CD4 programs: TH1 effectors produce large amounts of IFNγ, while TH2 effectors
produce little IFNγ but large amounts of IL-4, IL-13 and IL-5, and multiple distal
regulatory elements directing IFNγ transcription for TH1 cells have been described34.
Here, distinct regulatory regions in TH1 cells correlated with DNase hypersensitivity
sites, cell type-specific demethylation, H3K4me2 (which was found at moderate
levels in TH2 cells, too), histone acetylation, loss of the repressive mark H3K27me3
and partially a high level of conservation.
RReegguullaattoorryy TT--cceellllss
2.1.6 Development and function
Much attention has been paid to regulatory T-cells since they were described by
Shimon Sakaguchis group in 199546 as they are now widely accepted as the primary
mediators of peripheral tolerance. This work focuses on the naturally occurring,
thymus derived CD4+ Treg cells that constitutively express the CD25 molecule (IL-2
receptor alpha chain (IL-2RA)). In addition, they express FOXP3, a transcription
factor which has been discussed controversially as a key control gene in their
development and function47, 48. However, loss of function mutations or deletion of
Foxp3 in mice leads to a fatal autoimmune-like disease49 (known as scurfy mice) and
FOXP3 mutations in humans causes IPEX, a fatal disorder characterized by immune
dysregulation, polyendocrinopathy, enteropathy and X-linked inheritance50 due to a
Introduction
18
diminished number of suppressive CD4+ CD25+ Treg. Furthermore CD4+ CD25+
Treg differ from conventional CD4+CD25- T-cells (Tconv) through constitutive
expression of cytotoxic T-lymphocyte-associated protein 4 (CTLA-4) and preferential
expression of tumour-derived soluble Glucocorticoid-induced TNFR-Related Protein
(GITR), lymphocyte activation gene 3 (LAG-3) and neutropilin, but low expression of
IL-7R (CD127)51. Though, none of these factors, including FOXP3, unambiguously
identify human Treg (as other cells express them under certain circumstances) 52,
satisfyingly Treg-cell markers still have to be found. For their survival and
development CD4+CD25+ Treg need exogenous IL-2 which they fail to produce
themselves, possibly because of their inability to remodel chromatin in the proximal Il-
2 promoter as it has been shown in the murine system53. Moreover, mouse models
demonstrated the importance of the mentioned factors for Treg development and
function as gene deficiencies in il2, il2ra, il2rb and Ctlla4 as well as monoclonal
antibody treatment with anti-IL-2, anti-CD25, anti-Ctla4 and anti-Gitr all resulted in
development of autoimmune diseases as summarised by Sakaguchi54.
Although Treg control peripheral tolerance and thereby prevent autoimmune
diseases like type-1 diabetes and limit chronic inflammatory diseases like asthma
and inflammatory bowel disease (IBD), they also block beneficial responses by
preventing antitumour immunity and sterilizing immunity to certain pathogenes52.
Their main functional characteristics are hypoproliferation to standard T-cell
stimulation and the potent suppression of CD4+CD25- and CD8+ T-cells5455. Treg
have also been reported to act directly on B-cells, natural killer cells (NK) and
different antigen presenting cells (APC)56. Although incompletely understood, the
basic mechanisms for Treg cell function are suppression by inhibitory cytokines,
cytolysis, metabolic disruption and modulation of dendritic cell (DC) maturation and -
function. Although in vitro studies indicated independence from IL-10 and TGF-ß as
blocking antibodies do not affect the suppression by Treg in vitro57, IL-10 secreted by
Treg seems to play an important role in IBD, antitumour immunity and feto-maternal
tolernace. Treg derived TGF-beta controls the host immune responses in various
diseases when secreted whereas membrane-tethered TGF-beta mediates
suppression in a cell-cell contact dependent manner52. IL-35 has recently been
identified to be required for maximal suppressor activity of mouse Treg and ectopic
Introduction
19
expression of IL-35 confers regulatory activity on naive T-cells, whereas recombinant
IL-35 suppresses T-cell proliferation58.
Another way of Treg suppression is to kill effector cells. Cytolysis can be mediated by
granzymes which are serine proteases that activate intracellular caspases, resulting
in target T-cell apoptosis59. Other ways for Treg-induced apoptosis are the
involvement of the tumour necrosis factor-related apoptosis inducing ligand
(TRAIL)/death receptor 5 (DR5) pathway60 or galectin-161.
A possible suppression through metabolic disruption has been debated in the light of
high CD25 expression that could enable Treg to “consume” IL-2 that is essential for
T-cell survival and along with new findings that adenosine released by Treg inhibits
effector T-cells and promotes the generation of regulatory T-cells52.
Cell contact dependent function of Treg is proposed to work by targeting DCs for
attenuating effector T-cell activation or by contacting T-cells directly: Treg might
directly transmit a negative signal by CTLA-4 to CD80/86 expressed by effector T-
cells after TCR triggering or induce indoleamine 2,3-dioxygenase production in DCs
by CTLA-4 signalling leading to tryptophan degradation, generation of kynurenine
and inhibition of T-cell responses52.
Treg functions are summarized in figure 3 but even though progress has been made
to understand Treg function the interplay and frequency of the different mechanisms
still has to be elucidated.
Introduction
20
2.1.7 Treg in transplantation
The fact that CD4+CD25+ Treg are able to suppress other T-cells has been
proposing to modulate the host’s immune reaction towards allogenic stem cell
transplantation (SCT). Co-transplantation of T-cells through the transplantation has a
beneficial anti-leukaemia effect (graft-versus-leukaemia-effect”, GVL) on the one
hand, but on the other hand they can cause the severe graft-versus-host-disease
(GVHD) by reacting with and attacking the host tissues62. As demonstrated in mouse
models, even large numbers of co-transplanted naturally occurring Treg did not
cause GVHD but increased host survival by suppressing GVHD caused by CD25- T-
cells63. This did not lead to immune paralysis as the host’s haematopoietic cells were
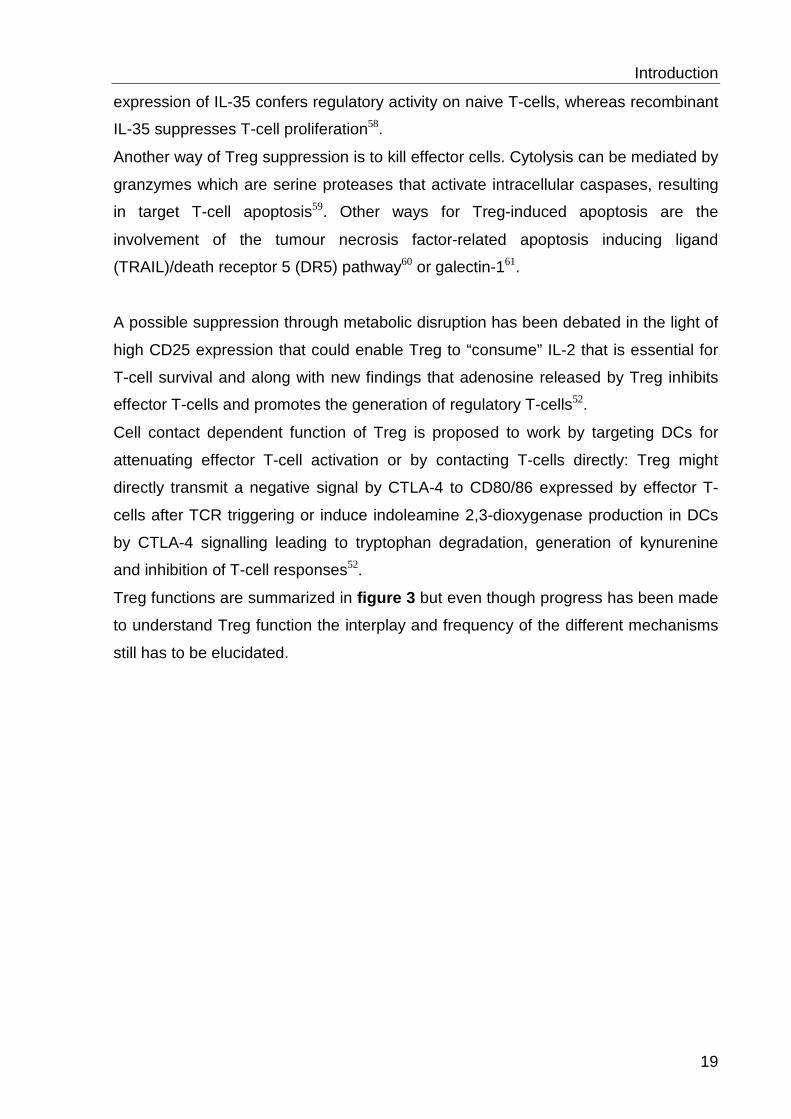
Figure 3 Basic mechanisms of Treg function: a) Inhibitory cytokines including interleukin-10 (IL-10), IL-35 and transforming growth factor beta. b) Cytolysis by granzymes and perforin. c) Metabolic disruption includes high-affinity CD25 (also known as IL-2 receptor α)-dependent cytokinedeprivation-mediated apoptosis, cyclic AMP (cAMP)-mediated inhibition or adenosin receptor mediated suppression. d) Targeting dendritic cells (DCs) includes mechanisms that modulate DC maturation and/or function. [Figure was taken from reference 52]
Introduction
21
still affected through the graft’s conventional T-cells, mainly by suppressing the early
expansion of alloreactive donor T-cells64.
Because human Treg function in a similar way to their rodent counterparts, they are
an exciting target to improve outcomes of SCT. To obtain sufficient numbers for
repetitive application of regulatory T-cells in transplantations or allergy treatment, the
cells can be expanded up to 40000-fold through the use of artificial antigen
presenting for repeated stimulation via CD3/CD28 in the presence of high-dose IL-
265. Besides, efficient enrichment of CD4+CD25+ Treg, good manufacturing practice
(GMP) is a prerequisite for clinical applications and a successful strategy has already
been established55.
2.1.8 Epigenetic control of the Foxp3 locus
Unfortunately, only 50-80% of the in vitro expanded Treg retained FOXP3 expression
after 2-3 weeks, and analysis of the subpopulations revealed that primarily CD45RA+
cells maintained stable FOXP3 expression and robust suppressive competence66. To
investigate the correlation between FOXP3 expression and the epigenetic state of
the FOXP3 locus, DNA methylation analysis has been done for murine and human
Treg. In contrast to the human system, CD4+CD25-FOXP3- T-cells from mice can be
converted to Foxp3+ Treg by antigen stimulation in the presence of TGF-beta67, 68,
but Treg induced by TGF-β in vitro display only incomplete demethylation of Treg-
specific demethylated regions (TSDR) despite high FOXP3 expression. In contrast to
natural Treg, these TGF-β–induced FOXP3+ Treg lose both FOXP3 expression and
suppressive activity upon restimulation in the absence of TGF-β44. This suggests that
expression of FOXP3 must be stabilized by epigenetic modification and so the
human FOXP3 locus was analyzed for DNA methylation. As expected, activated
conventional CD4+ T-cells and TGF-beta-treated cells displayed no TSDR
demethylation despite expression of FOXP3, whereas the CD45RA+ subset even
upon in vitro expansion remained completely demethylated69.
Aims
22
33 AAiimmss
The main focus of this work is the epigenetic characterisation of regulatory T-cells
compared to conventional T-cells. This includes the adaption and validation of a
previously used technique that enriches methylated DNA for comparative methylation
analysis. Additionally to the detection of differential methylated regions (DMR) we
attempted to describe their functionality. Furthermore histone marks were analyzed
to get insights about their distribution over the loci of variable expressed genes and
DMR. As primary human cells were used the results should give insights about the
general epigenetic mechanisms in development. The main focus of this work is the
comparative epigenetic analysis of conventional and regulatory T-cells to get new
insights about the basic epigenetic processes with their regulatory function in cell
development with the prospect to improve cell therapeutic applications of regulatory
T-cells.
Material and equipment
23
44 MMaatteerriiaall aanndd eeqquuiippmmeenntt
EEqquuiippmmeenntt
8-Channel Pipettor MATRIX Impact2 Equalizer 384 Thermo Fisher Scientific, Hudson, USA Autoclave Technomara, Fernwald, Germany Biofuge fresco Heraeus, Osterode, Germany BioPhotometer Eppendorf, Hamburg, Germany Camera Polaroid, Cambridge, USA Densitometer Molecular Dynamics, Krefeld, Germany Electrophoresis equipment Biometra, Göttingen, Germany Heat sealer Fermant 400 Josten & Kettenbaum, Bensberg, Germany Heatblock Stuart Scientific, Staffordshire, UK Incubators Heraeus, Hanau, Germany Laminar air flow cabinet Lamin Air HA 2472 Heraeus, Osterode, Germany Luminometer Sirius Berthold Detec. Systems, Pforzheim, Germany MassARRAY Compact System Sequenom, Hamburg, Germany MassARRAY MATRIX Liquid Handler Sequenom, Hamburg, Germany MassARRAY Phusio chip module Sequenom, Hamburg, Germany Megafuge 3,0 R Heraeus, Osterode, Germany Microarray hybridisation chambers SureHyb Agilent Technologies, Böblingen, Germany Microarray scanner; 5 micron resolution Agilent Technologies, Böblingen, Germany Microarray slide holder Agilent Technologies, Böblingen, Germany Microscopes Zeiss, Jena, Germany Multifuge 3S-R Heraeus, Osterode, Germany Multipipettor Multipette plus Eppendorf, Hamburg, Germany NanoDrop PeqLab, Erlangen, Germany PCR-Thermocycler PTC-200 MJ-Research/Biometra, Oldendorf, Germany PCR-Thermocycler Veriti 384 well Applied Biosystems, Foster City, USA pH-Meter Knick, Berlin, Germany Picofuge Heraeus, Osterode, Germany Power supplies Biometra, Göttingen, Germany Realplex Mastercycler epGradient S Eppendorf, Hamburg, Germany Sigma 2 - Sartorius Sartorius, Göttingen, Germany Sonifier 250 Branson, Danbury, USA Sorvall RC 6 plus Thermo Fisher Scientific, Hudson, USA Spectra Fluor Plus Tecan, Salzburg, Austria Spectrophotometer Perkin Elmer, Überlingen, Germany
Material and equipment
24
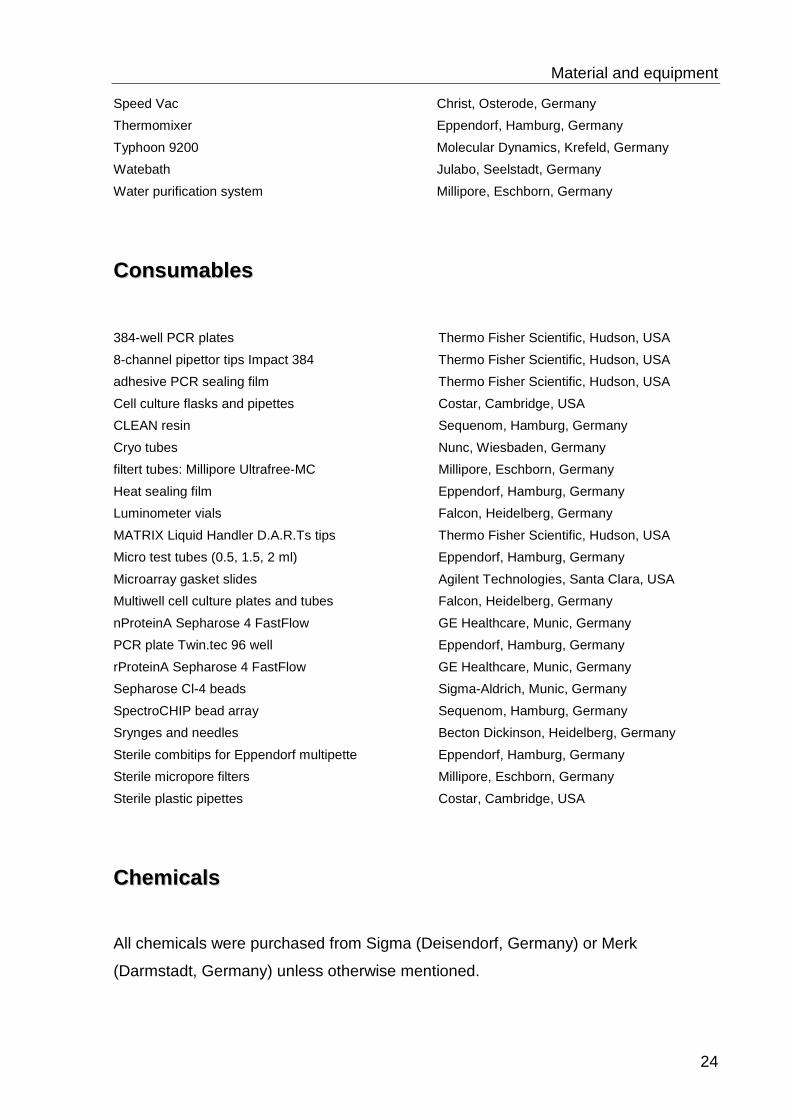
Speed Vac Christ, Osterode, Germany Thermomixer Eppendorf, Hamburg, Germany Typhoon 9200 Molecular Dynamics, Krefeld, Germany Watebath Julabo, Seelstadt, Germany Water purification system Millipore, Eschborn, Germany
CCoonnssuummaabblleess
384-well PCR plates Thermo Fisher Scientific, Hudson, USA 8-channel pipettor tips Impact 384 Thermo Fisher Scientific, Hudson, USA adhesive PCR sealing film Thermo Fisher Scientific, Hudson, USA Cell culture flasks and pipettes Costar, Cambridge, USA CLEAN resin Sequenom, Hamburg, Germany Cryo tubes Nunc, Wiesbaden, Germany filtert tubes: Millipore Ultrafree-MC Millipore, Eschborn, Germany Heat sealing film Eppendorf, Hamburg, Germany Luminometer vials Falcon, Heidelberg, Germany MATRIX Liquid Handler D.A.R.Ts tips Thermo Fisher Scientific, Hudson, USA Micro test tubes (0.5, 1.5, 2 ml) Eppendorf, Hamburg, Germany Microarray gasket slides Agilent Technologies, Santa Clara, USA Multiwell cell culture plates and tubes Falcon, Heidelberg, Germany nProteinA Sepharose 4 FastFlow GE Healthcare, Munic, Germany PCR plate Twin.tec 96 well Eppendorf, Hamburg, Germany rProteinA Sepharose 4 FastFlow GE Healthcare, Munic, Germany Sepharose Cl-4 beads Sigma-Aldrich, Munic, Germany SpectroCHIP bead array Sequenom, Hamburg, Germany Srynges and needles Becton Dickinson, Heidelberg, Germany Sterile combitips for Eppendorf multipette Eppendorf, Hamburg, Germany Sterile micropore filters Millipore, Eschborn, Germany Sterile plastic pipettes Costar, Cambridge, USA
CChheemmiiccaallss
All chemicals were purchased from Sigma (Deisendorf, Germany) or Merk
(Darmstadt, Germany) unless otherwise mentioned.
Material and equipment
25
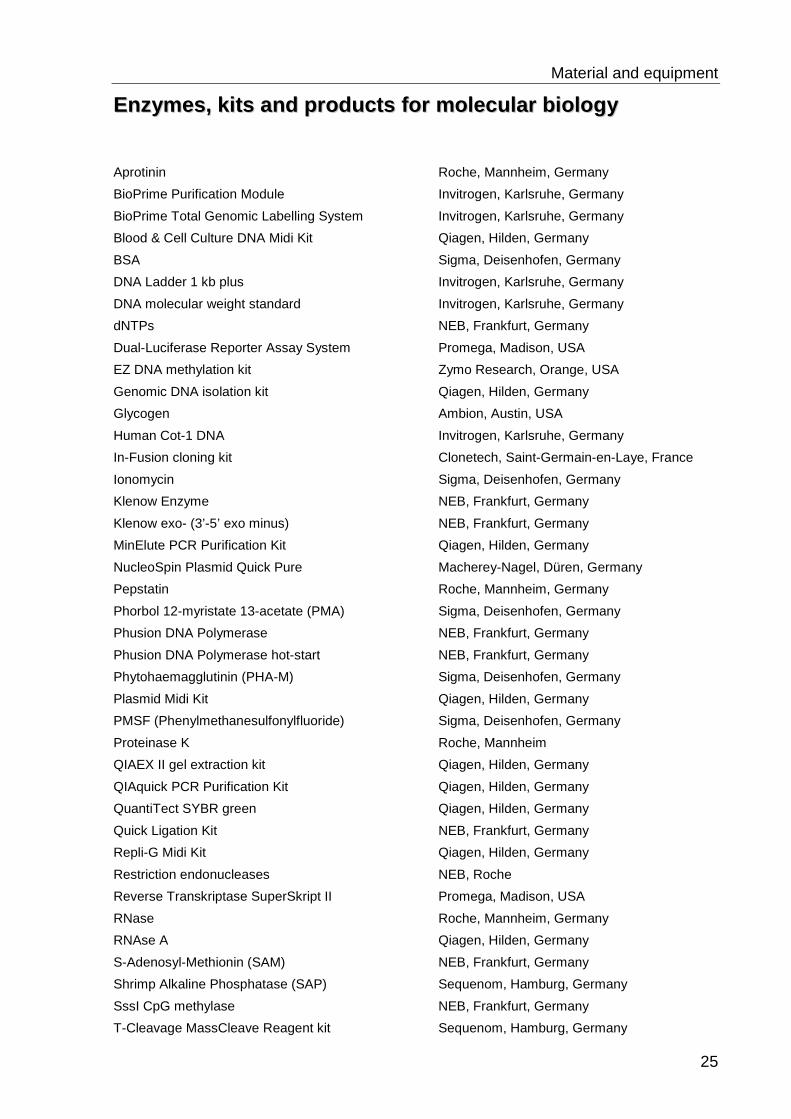
EEnnzzyymmeess,, kkiittss aanndd pprroodduuccttss ffoorr mmoolleeccuullaarr bbiioollooggyy
Aprotinin Roche, Mannheim, Germany BioPrime Purification Module Invitrogen, Karlsruhe, Germany BioPrime Total Genomic Labelling System Invitrogen, Karlsruhe, Germany Blood & Cell Culture DNA Midi Kit Qiagen, Hilden, Germany BSA Sigma, Deisenhofen, Germany DNA Ladder 1 kb plus Invitrogen, Karlsruhe, Germany DNA molecular weight standard Invitrogen, Karlsruhe, Germany dNTPs NEB, Frankfurt, Germany Dual-Luciferase Reporter Assay System Promega, Madison, USA EZ DNA methylation kit Zymo Research, Orange, USA Genomic DNA isolation kit Qiagen, Hilden, Germany Glycogen Ambion, Austin, USA Human Cot-1 DNA Invitrogen, Karlsruhe, Germany In-Fusion cloning kit Clonetech, Saint-Germain-en-Laye, France Ionomycin Sigma, Deisenhofen, Germany Klenow Enzyme NEB, Frankfurt, Germany Klenow exo- (3’-5’ exo minus) NEB, Frankfurt, Germany MinElute PCR Purification Kit Qiagen, Hilden, Germany NucleoSpin Plasmid Quick Pure Macherey-Nagel, Düren, Germany Pepstatin Roche, Mannheim, Germany Phorbol 12-myristate 13-acetate (PMA) Sigma, Deisenhofen, Germany Phusion DNA Polymerase NEB, Frankfurt, Germany Phusion DNA Polymerase hot-start NEB, Frankfurt, Germany Phytohaemagglutinin (PHA-M) Sigma, Deisenhofen, Germany Plasmid Midi Kit Qiagen, Hilden, Germany PMSF (Phenylmethanesulfonylfluoride) Sigma, Deisenhofen, Germany Proteinase K Roche, Mannheim QIAEX II gel extraction kit Qiagen, Hilden, Germany QIAquick PCR Purification Kit Qiagen, Hilden, Germany QuantiTect SYBR green Qiagen, Hilden, Germany Quick Ligation Kit NEB, Frankfurt, Germany Repli-G Midi Kit Qiagen, Hilden, Germany Restriction endonucleases NEB, Roche Reverse Transkriptase SuperSkript II Promega, Madison, USA RNase Roche, Mannheim, Germany RNAse A Qiagen, Hilden, Germany S-Adenosyl-Methionin (SAM) NEB, Frankfurt, Germany Shrimp Alkaline Phosphatase (SAP) Sequenom, Hamburg, Germany SssI CpG methylase NEB, Frankfurt, Germany T-Cleavage MassCleave Reagent kit Sequenom, Hamburg, Germany
Material and equipment
26
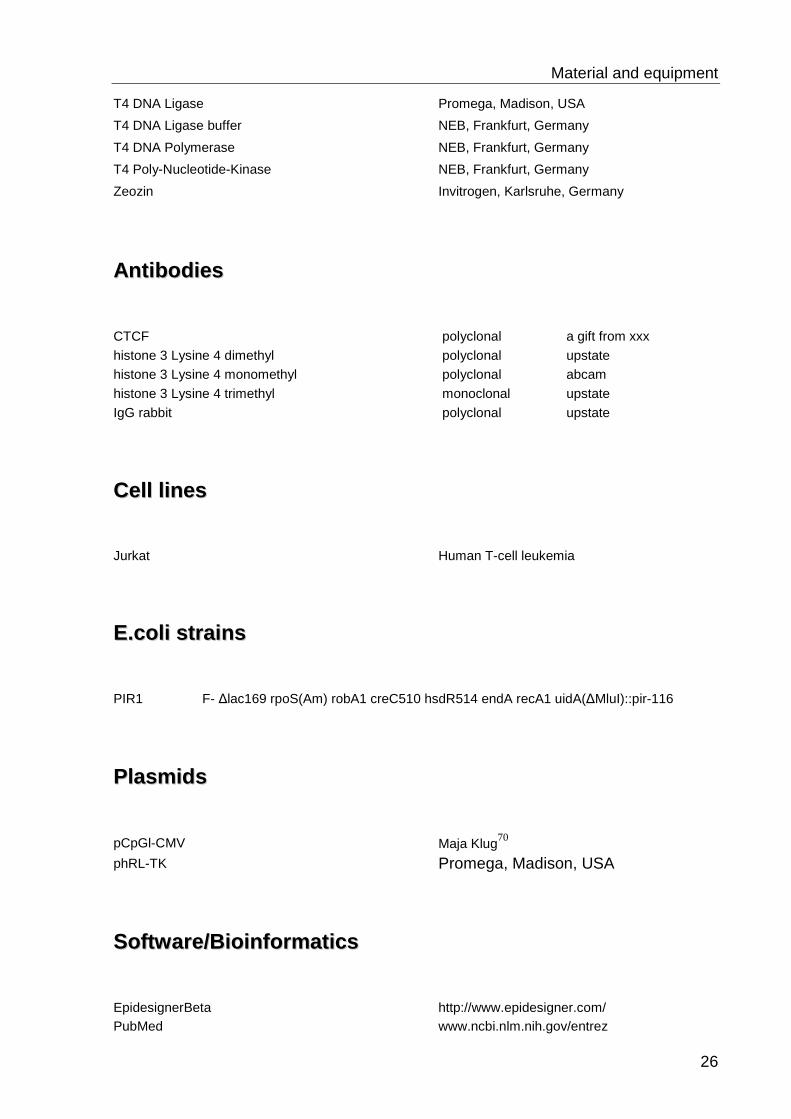
T4 DNA Ligase Promega, Madison, USA T4 DNA Ligase buffer NEB, Frankfurt, Germany T4 DNA Polymerase NEB, Frankfurt, Germany T4 Poly-Nucleotide-Kinase NEB, Frankfurt, Germany Zeozin Invitrogen, Karlsruhe, Germany
AAnnttiibbooddiieess
CTCF polyclonal a gift from xxx histone 3 Lysine 4 dimethyl polyclonal upstate histone 3 Lysine 4 monomethyl polyclonal abcam histone 3 Lysine 4 trimethyl monoclonal upstate IgG rabbit polyclonal upstate
CCeellll lliinneess
Jurkat Human T-cell leukemia
EE..ccoollii ssttrraaiinnss
PIR1 F- Δlac169 rpoS(Am) robA1 creC510 hsdR514 endA recA1 uidA(ΔMluI)::pir-116
PPllaassmmiiddss
pCpGl-CMV Maja Klug70 phRL-TK Promega, Madison, USA
SSooffttwwaarree//BBiiooiinnffoorrmmaattiiccss
EpidesignerBeta http://www.epidesigner.com/ PubMed www.ncbi.nlm.nih.gov/entrez
Material and equipment
27
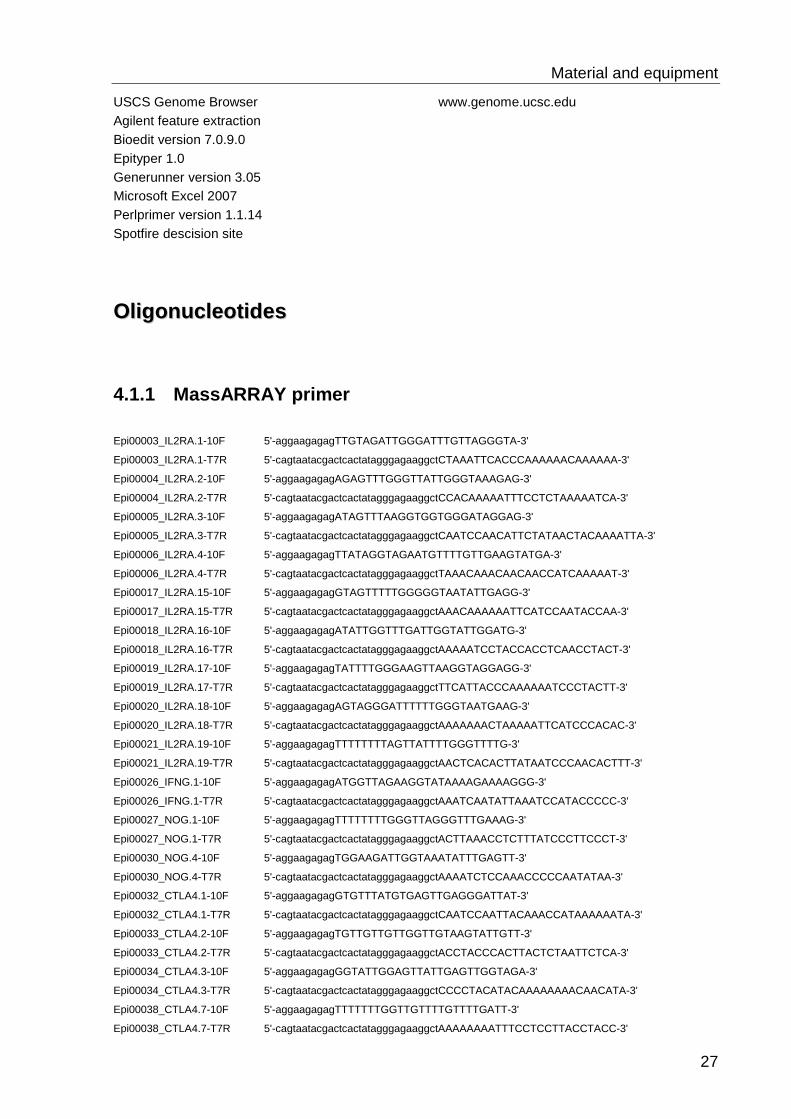
USCS Genome Browser www.genome.ucsc.edu Agilent feature extraction Bioedit version 7.0.9.0 Epityper 1.0 Generunner version 3.05 Microsoft Excel 2007 Perlprimer version 1.1.14 Spotfire descision site
OOlliiggoonnuucclleeoottiiddeess
4.1.1 MassARRAY primer
Epi00003_IL2RA.1-10F 5'-aggaagagagTTGTAGATTGGGATTTGTTAGGGTA-3'
Epi00003_IL2RA.1-T7R 5'-cagtaatacgactcactatagggagaaggctCTAAATTCACCCAAAAAACAAAAAA-3'
Epi00004_IL2RA.2-10F 5'-aggaagagagAGAGTTTGGGTTATTGGGTAAAGAG-3'
Epi00004_IL2RA.2-T7R 5'-cagtaatacgactcactatagggagaaggctCCACAAAAATTTCCTCTAAAAATCA-3'
Epi00005_IL2RA.3-10F 5'-aggaagagagATAGTTTAAGGTGGTGGGATAGGAG-3'
Epi00005_IL2RA.3-T7R 5'-cagtaatacgactcactatagggagaaggctCAATCCAACATTCTATAACTACAAAATTA-3'
Epi00006_IL2RA.4-10F 5'-aggaagagagTTATAGGTAGAATGTTTTGTTGAAGTATGA-3'
Epi00006_IL2RA.4-T7R 5'-cagtaatacgactcactatagggagaaggctTAAACAAACAACAACCATCAAAAAT-3'
Epi00017_IL2RA.15-10F 5'-aggaagagagGTAGTTTTTGGGGGTAATATTGAGG-3'
Epi00017_IL2RA.15-T7R 5'-cagtaatacgactcactatagggagaaggctAAACAAAAAATTCATCCAATACCAA-3'
Epi00018_IL2RA.16-10F 5'-aggaagagagATATTGGTTTGATTGGTATTGGATG-3'
Epi00018_IL2RA.16-T7R 5'-cagtaatacgactcactatagggagaaggctAAAAATCCTACCACCTCAACCTACT-3'
Epi00019_IL2RA.17-10F 5'-aggaagagagTATTTTGGGAAGTTAAGGTAGGAGG-3'
Epi00019_IL2RA.17-T7R 5'-cagtaatacgactcactatagggagaaggctTTCATTACCCAAAAAATCCCTACTT-3'
Epi00020_IL2RA.18-10F 5'-aggaagagagAGTAGGGATTTTTTGGGTAATGAAG-3'
Epi00020_IL2RA.18-T7R 5'-cagtaatacgactcactatagggagaaggctAAAAAAACTAAAAATTCATCCCACAC-3'
Epi00021_IL2RA.19-10F 5'-aggaagagagTTTTTTTTAGTTATTTTGGGTTTTG-3'
Epi00021_IL2RA.19-T7R 5'-cagtaatacgactcactatagggagaaggctAACTCACACTTATAATCCCAACACTTT-3'
Epi00026_IFNG.1-10F 5'-aggaagagagATGGTTAGAAGGTATAAAAGAAAAGGG-3'
Epi00026_IFNG.1-T7R 5'-cagtaatacgactcactatagggagaaggctAAATCAATATTAAATCCATACCCCC-3'
Epi00027_NOG.1-10F 5'-aggaagagagTTTTTTTTGGGTTAGGGTTTGAAAG-3'
Epi00027_NOG.1-T7R 5'-cagtaatacgactcactatagggagaaggctACTTAAACCTCTTTATCCCTTCCCT-3'
Epi00030_NOG.4-10F 5'-aggaagagagTGGAAGATTGGTAAATATTTGAGTT-3'
Epi00030_NOG.4-T7R 5'-cagtaatacgactcactatagggagaaggctAAAATCTCCAAACCCCCAATATAA-3'
Epi00032_CTLA4.1-10F 5'-aggaagagagGTGTTTATGTGAGTTGAGGGATTAT-3'
Epi00032_CTLA4.1-T7R 5'-cagtaatacgactcactatagggagaaggctCAATCCAATTACAAACCATAAAAAATA-3'
Epi00033_CTLA4.2-10F 5'-aggaagagagTGTTGTTGTTGGTTGTAAGTATTGTT-3'
Epi00033_CTLA4.2-T7R 5'-cagtaatacgactcactatagggagaaggctACCTACCCACTTACTCTAATTCTCA-3'
Epi00034_CTLA4.3-10F 5'-aggaagagagGGTATTGGAGTTATTGAGTTGGTAGA-3'
Epi00034_CTLA4.3-T7R 5'-cagtaatacgactcactatagggagaaggctCCCCTACATACAAAAAAAACAACATA-3'
Epi00038_CTLA4.7-10F 5'-aggaagagagTTTTTTTGGTTGTTTTGTTTTGATT-3'
Epi00038_CTLA4.7-T7R 5'-cagtaatacgactcactatagggagaaggctAAAAAAAATTTCCTCCTTACCTACC-3'
Material and equipment
28
Epi00040_ZNFN1A2.1-10F 5'-aggaagagagTTTTTTAATTTTTTAAAGAGGAGGTGA-3'
Epi00040_ZNFN1A2.1-T7R 5'-cagtaatacgactcactatagggagaaggctTTACCAAAAACCAAAAACAATCCTA-3'
Epi00041_ZNFN1A2.2-10F 5'-aggaagagagTTTTTAGGGATGGTTTAGTAGGAAAA-3'
Epi00041_ZNFN1A2.2-T7R 5'-cagtaatacgactcactatagggagaaggctTCCAAATAAAAAATAATATCCAAATCC-3'
Epi00045_ZNFA1N2.2-10F 5'-aggaagagagAGGGTTTTATTATGTTGGTTAGGGT-3'
Epi00045_ZNFA1N2.2-T7R 5'-cagtaatacgactcactatagggagaaggctAACTAAAAAATCTATTTCCTCCCCA-3'
Epi00046_ZNFN1A2.1-10F 5'-aggaagagagGGGAAGGTAGTATTATTTTTTGTTTTT-3'
Epi00046_ZNFN1A2.1-T7R 5'-cagtaatacgactcactatagggagaaggctAATCTCTCCTAAATTCATTAAAATTCA-3'
Epi00047_ID2.1-10F 5'-aggaagagagTGTGTTTTTTGTTAGGGATTGTAAGT-3'
Epi00047_ID2.1-T7R 5'-cagtaatacgactcactatagggagaaggctCTTTCACAAAAAATTTTCCTATATCTT-3'
Epi00048_ID2.2-10F 5'-aggaagagagATTTGGTTTTAGGGTAAGGGTTTTT-3'
Epi00048_ID2.2-T7R 5'-cagtaatacgactcactatagggagaaggctAAACCAAAAACTTCCAAATCAACTT-3'
Epi00049_ID2.3-10F 5'-aggaagagagTATTAGAAAGGGGATTGGTTTGGTT-3'
Epi00049_ID2.3-T7R 5'-cagtaatacgactcactatagggagaaggctAACTTTAATCCTAAATTCCTAAAAATACC-3'
Epi00050_ID2.4-10F 5'-aggaagagagGGAATGGATATAGTTGTGAGAATAAAA-3'
Epi00050_ID2.4-T7R 5'-cagtaatacgactcactatagggagaaggctCAACCTAACTCCAAAACTCACTCAC-3'
Epi00051_ID2.5-10F 5'-aggaagagagAGTTTTGGAATTTTTTTAGGTGTTG-3'
Epi00051_ID2.5-T7R 5'-cagtaatacgactcactatagggagaaggctAAATACTTATTACAAACCATACCCAACC-3'
Epi00052_ID2.6-10F 5'-aggaagagagGTTTTTTAAGGGTAGTGTATGTAAATG-3'
Epi00052_ID2.6-T7R 5'-cagtaatacgactcactatagggagaaggctAAAAAAACCACAATTCACTACAACC-3'
Epi00053_ID2.7-10F 5'-aggaagagagTGTTATTTTAAGTTTAAGGAGTTGGTGT-3'
Epi00053_ID2.7-T7R 5'-cagtaatacgactcactatagggagaaggctTTTTTATAATCCACAAACCAACAAA-3'
Epi00054_ID2.8-10F 5'-aggaagagagTGATAGTAAAGTATTGTGTGGTTGAA-3'
Epi00054_ID2.8-T7R 5'-cagtaatacgactcactatagggagaaggctAAAATCCCACATCACAAAATTAAAA-3'
Epi00055_ID2.9-10F 5'-aggaagagagTTGTTGTTGGAGATTTAAATAGGAGA-3'
Epi00055_ID2.9-T7R 5'-cagtaatacgactcactatagggagaaggctCAAAAAATAAAAAAAATCATAAACACCTAC-3'
Epi00067_TNF.1-10F 5'-aggaagagagTTTGGTTTTTAAAAGAAATGGAGGT-3'
Epi00067_TNF.1-T7R 5'-cagtaatacgactcactatagggagaaggctTCCTTAATAAAAAAACCCATAAACTCA-3'
Epi00068_TNF.2-10F 5'-aggaagagagGGGTATTTTTGATGTTTGTGTGTTT-3'
Epi00068_TNF.2-T7R 5'-cagtaatacgactcactatagggagaaggctAACACTCACCTCTTCCCTCTAAAAA-3'
Epi00069_TNF.3-10F 5'-aggaagagagTTTTGTTTGTTGTATTTTGGAGTGA-3'
Epi00069_TNF.3-T7R 5'-cagtaatacgactcactatagggagaaggctAAACATTCAACAACTCTTTCCCTAA-3'
Epi00070_TNF.4-10F 5'-aggaagagagTTTTGTTTGTTGTATTTTGGAGTGA-3'
Epi00070_TNF.4-T7R 5'-cagtaatacgactcactatagggagaaggctAAACACCTTCCATATACCAAACATC-3'
Epi00071_TNF.5-10F 5'-aggaagagagTTTAGGGAAAGAGTTGTTGAATGTT-3'
Epi00071_TNF.5-T7R 5'-cagtaatacgactcactatagggagaaggctAAAAAAAACTAAAACCCTTAAACTTCC-3'
Epi00074_HOXA1.1-10F 5'-aggaagagagGGTTTAGAGTTAGAATTTTTTTTGGAA-3'
Epi00074_HOXA1.1-T7R 5'-cagtaatacgactcactatagggagaaggctTTACTAACCACCCACTCAATCAAAT-3'
Epi00075_HOXA1.2-10F 5'-aggaagagagGAGATTAGGGATGTGGGTTTTATTTA-3'
Epi00075_HOXA1.2-T7R 5'-cagtaatacgactcactatagggagaaggctCTCTTCAAAAATCAAAATTCATATAATCA-3'
Epi00077_GATA4.1-10F 5'-aggaagagagTATATTGAGGAGGTGGTTTTGTTTT-3'
Epi00077_GATA4.1-T7R 5'-cagtaatacgactcactatagggagaaggctTTAACCCATAAAAAATTCCAAAAATC-3'
Epi00081_FOXP3.1-10F 5'-aggaagagagGGGTTTTTTGTTGAGTTTTAGAATTT-3'
Epi00081_FOXP3.1-T7R 5'-cagtaatacgactcactatagggagaaggctCTAACAACCACCCCCAAAAAATAAC-3'
Epi00082_FOXP3.2-10F 5'-aggaagagagATTTGTTTGGGGGTAGAGGATTTAG-3'
Epi00082_FOXP3.2-T7R 5'-cagtaatacgactcactatagggagaaggctACCCCAAAAATCCCAATATCTATAA-3'
Epi00083_FOXP3.3-10F 5'-aggaagagagAGGGTTTTTTGTTTATTAGGTTTGG-3'
Epi00083_FOXP3.3-T7R 5'-cagtaatacgactcactatagggagaaggctAAAAAAAACCTAAACTACCATTCCC-3'
Epi00084_FOXP3.4-10F 5'-aggaagagagGGTTTTTAGTTGGGGAGAGAGTTAG-3'
Epi00084_FOXP3.4-T7R 5'-cagtaatacgactcactatagggagaaggctTTTCAAACAACATCAATTAAACCAA-3'
Material and equipment
29
Epi00088_FOXP3.8-10F 5'-aggaagagagTTTTTGTGTGTGTTTTTTTGTTTTT-3'
Epi00088_FOXP3.8-T7R 5'-cagtaatacgactcactatagggagaaggctAAACCTCACCTAACCCAACTCTTAT-3'
Epi00090_FOXP3.10-10F 5'-aggaagagagAAAAATTGTGGTTTTTTATGAGTTT-3'
Epi00090_FOXP3.10-T7R 5'-cagtaatacgactcactatagggagaaggctCCTCCAATAAAACCCACATCTAATA-3'
Epi00091_FOXP3.11-10F 5'-aggaagagagAGTTGAGGTTGATATATTTGTTGGG-3'
Epi00091_FOXP3.11-T7R 5'-cagtaatacgactcactatagggagaaggctAATCACAAACTACCATTACCACCAC-3'
Epi00092_FOXP3.12-10F 5'-aggaagagagTTTAAAGTGGAGTTTTTTTGGAGTG-3'
Epi00092_FOXP3.12-T7R 5'-cagtaatacgactcactatagggagaaggctCAAAACACCCTTTCCATAACTAAAA-3'
Epi00197_TNFRSF9.1-10F 5'-aggaagagagGGGTGTAGGTGATAATTGTGATTAAA-3'
Epi00197_TNFRSF9.1-T7R 5'-cagtaatacgactcactatagggagaaggctCTTCCATTATAATAAAAACACAAAAAAACA-3'
Epi00203_IL2RA.1-10F 5'-aggaagagagTTTTTTTTATGATGGATAGGATAGATAGA-3'
Epi00203_IL2RA.1-T7R 5'-cagtaatacgactcactatagggagaaggctTTTTACACATTCTCTACCAAAATAACC-3'
Epi00205_LRRC32.1-10F 5'-aggaagagagTTTTGAGTTTTAGTTTTTTTATTTGAGG-3'
Epi00205_LRRC32.1-T7R 5'-cagtaatacgactcactatagggagaaggctAAATACCTTTTCTCCTACAACATCC-3'
Epi00206_LRRC32.2-10F 5'-aggaagagagTTTTAGGTTTTTTATAGTGGGTGTTTT-3'
Epi00206_LRRC32.2-T7R 5'-cagtaatacgactcactatagggagaaggctACTAACCAAACAAAACATACTCCCC-3'
Epi00207_LRRC32.3-10F 5'-aggaagagagGGTTTTTTAGGTTATTGGGGAGTAT-3'
Epi00207_LRRC32.3-T7R 5'-cagtaatacgactcactatagggagaaggctCAAAAAAAACAATCAAAACCCACTA-3'
Epi00208_GJB2.1-10F 5'-aggaagagagTGTTAAAAAGTATATTTTGGTTAGAAATGA-3'
Epi00208_GJB2.1-T7R 5'-cagtaatacgactcactatagggagaaggctTAAAACCACAAACTCCATATCCAAT-3'
Epi00209_GJB2.2-10F 5'-aggaagagagGATATGGAGTTTGTGGTTTTAGAATTT-3'
Epi00209_GJB2.2-T7R 5'-cagtaatacgactcactatagggagaaggctCAACACCATTTCACATAAAATAACAA-3'
Epi00210_GJB2.3-10F 5'-aggaagagagGAAAGAAGTTTTTTGTGTTTTTTGAT-3'
Epi00210_GJB2.3-T7R 5'-cagtaatacgactcactatagggagaaggctAACCCTACTATCTCTCCTCTTAATAACAA-3'
Epi00211_SEPT9.1-10F 5'-aggaagagagTTAGGGGTTTTTTTTGTTTTAAATGT-3'
Epi00211_SEPT9.1-T7R 5'-cagtaatacgactcactatagggagaaggctCACCAAAATAATCTCAATAAACCCA-3'
Epi00212_SEPT9.2-10F 5'-aggaagagagGGTTTTAATTTGTTGGTTTTTTGTG-3'
Epi00212_SEPT9.2-T7R 5'-cagtaatacgactcactatagggagaaggctTCCATACTAACTTCTCCCCTACTAACTAA-3'
Epi00213_CTLA4.1-10F 5'-aggaagagagTTTTTTGTTGTGATATTGTTTTAGG-3'
Epi00213_CTLA4.1-T7R 5'-cagtaatacgactcactatagggagaaggctATCCCTTCTAACCATTCAAATTTCT-3'
Epi00214_CTLA4.2-10F 5'-aggaagagagTGAGTGAAAGAAGTTTATATGAAAAGGT-3'
Epi00214_CTLA4.2-T7R 5'-cagtaatacgactcactatagggagaaggctTCATTTCATAACATATAACAATCAATCAA-3'
Epi00216_CTLA4.4-10F 5'-aggaagagagTTAAGTTTTAATTGGGTTAGGTTTG-3'
Epi00216_CTLA4.4-T7R 5'-cagtaatacgactcactatagggagaaggctTACCCAAACATCTAAAAAACATCAA-3'
Epi00217_CTLA4.5-10F 5'-aggaagagagTATGGAATTTTTTATGTGAGGTTTGTT-3'
Epi00217_CTLA4.5-T7R 5'-cagtaatacgactcactatagggagaaggctAACCAAAACAAAAACTCAATCCTCT-3'
Epi00219_CTLA4.7-10F 5'-aggaagagagTTATGATTAAATTTAGTGTGATTAATTGGA-3'
Epi00219_CTLA4.7-T7R 5'-cagtaatacgactcactatagggagaaggctAAATAAAACTTTCCTAAAATTCCCAA-3'
Epi00220_CTLA4.8-10F 5'-aggaagagagTTTTGTATGTGGTAAGAATTTTATGTGA-3'
Epi00220_CTLA4.8-T7R 5'-cagtaatacgactcactatagggagaaggctCCATCACCAACCAAAATCTAAAATA-3'
Epi00221_CTLA4.9-10F 5'-aggaagagagTTTAGATTTTGGTTGGTGATGG-3'
Epi00221_CTLA4.9-T7R 5'-cagtaatacgactcactatagggagaaggctAAAATAAACCAAACACAAAAAAACAC-3'
Epi00222_CTLA4.10-10F 5'-aggaagagagTTTAGGAGTTAGTGTTTGTTATAGATTGTG-3'
Epi00222_CTLA4.10-T7R 5'-cagtaatacgactcactatagggagaaggctCCCCACCTAAATAATACATTCAAAA-3'
Epi00226_CTLA4.14-10F 5'-aggaagagagAAGGAAAAGGAAAGAAAGAAAGTTATTA-3'
Epi00226_CTLA4.14-T7R 5'-cagtaatacgactcactatagggagaaggctTTATAACCCACCCAAATAAACACTC-3'
Epi00227_CTLA4.15-10F 5'-aggaagagagTGGGTGATAGAGGTTTAGGGTTAGT-3'
Epi00227_CTLA4.15-T7R 5'-cagtaatacgactcactatagggagaaggctAAAACCAAAAAAAACTCAATAAACTCA-3'
Epi00233_CTLA4.21-10F 5'-aggaagagagTTTTATAATAGGGGTTTATGTGAAAATG-3'
Epi00233_CTLA4.21-T7R 5'-cagtaatacgactcactatagggagaaggctCCTTTAACATCACTAACTAAAACATAACCA-3'
Material and equipment
30
Epi00234_CTLA4.22-10F 5'-aggaagagagTTATGTTTTAGTTAGTGATGTTAAAGGTTG-3'
Epi00234_CTLA4.22-T7R 5'-cagtaatacgactcactatagggagaaggctTCTTCTATCCATAACATTAACCACATATT-3'
Epi00236_IKZF2.2-10F 5'-aggaagagagTGAAATTGTTATTGTGTAGAAGGGG-3'
Epi00236_IKZF2.2-T7R 5'-cagtaatacgactcactatagggagaaggctCAAAAAAAATTCATTACATAACATATCCA-3'
Epi00239_IKZF2.5-10F 5'-aggaagagagAGAGAAATTATTTGGGTTTAGGTTTGTA-3'
Epi00239_IKZF2.5-T7R 5'-cagtaatacgactcactatagggagaaggctAACCAAAAACAAAAACTACATCAAC-3'
Epi00240_WNT10A.1-10F 5'-aggaagagagAGTTTTTTAAAGTGTTGGGATTATAGG-3'
Epi00240_WNT10A.1-T7R 5'-cagtaatacgactcactatagggagaaggctAAACCCAAATTAATACAAAAATCCA-3'
Epi00241_ID2.1-10F 5'-aggaagagagTGGATGGATGTTTTAAAGTTTAGTTATT-3'
Epi00241_ID2.1-T7R 5'-cagtaatacgactcactatagggagaaggctAAACCACCATCATATTTAACAACATTA-3'
Epi00246_ID2.6-10F 5'-aggaagagagGGTTGTTAATAAAGAAATGATTATTTGAA-3'
Epi00246_ID2.6-T7R 5'-cagtaatacgactcactatagggagaaggctTTAAACCAATTATCCAAAAATACCC-3'
Epi00248_IL2RB.2-10F 5'-aggaagagagTTTTTTATAGGGGATGTTTTTGGAT-3'
Epi00248_IL2RB.2-T7R 5'-cagtaatacgactcactatagggagaaggctCAAAAAAAACAAATAAAAACCTACA-3'
Epi00251_IL2RB.5-10F 5'-aggaagagagGTTTTATTGTTTTTGGTTGTTTGGT-3'
Epi00251_IL2RB.5-T7R 5'-cagtaatacgactcactatagggagaaggctAAACAAATCCTCCCACCTATACC-3'
Epi00253_PDE4D.1-10F 5'-aggaagagagGGGGTTTTGATTTTGTGATATATAATTT-3'
Epi00253_PDE4D.1-T7R 5'-cagtaatacgactcactatagggagaaggctAATAACTAAAATACAACCTTCTCCTCTTTC-3'
Epi00254_PDE4D.2-10F 5'-aggaagagagGGGTTGTTTTTTTAGTATTAGTTTATTTGA-3'
Epi00254_PDE4D.2-T7R 5'-cagtaatacgactcactatagggagaaggctATTTCAACTTTCACAAACAACTCCA-3'
Epi00259_TP53INP1.1-10F 5'-aggaagagagTAGAGGAAATTAGTTAGAGTGGATGGT-3'
Epi00259_TP53INP1.1-T7R 5'-cagtaatacgactcactatagggagaaggctTCCACAAAATAAAAAATCCTCTATCAT-3'
Epi00261_CD40LG.1-10F 5'-aggaagagagTTTTGATAATATAGAAGAAATGGTATGTAG-3'
Epi00261_CD40LG.1-T7R 5'-cagtaatacgactcactatagggagaaggctACACACACACATACACTACTTAAAACTC-3'
Epi00262_CD40LG.2-10F 5'-aggaagagagGTTTTATTTTTGAAGTGGTTTGGGT-3'
Epi00262_CD40LG.2-T7R 5'-cagtaatacgactcactatagggagaaggctTCTCTATTATTATCATCTAATCCAAAAAAA-3'
Epi00263_CD40LG.3-10F 5'-aggaagagagTTGGTGGGTATTTTGGTTTAGTTAT-3'
Epi00263_CD40LG.3-T7R 5'-cagtaatacgactcactatagggagaaggctCCATAAACTTCAATTCCTCATCTACA-3'
Epi00265_CD40LG.5-10F 5'-aggaagagagGGTAATTTTGGAAAATGGGAAATAG-3'
Epi00265_CD40LG.5-T7R 5'-cagtaatacgactcactatagggagaaggctTTCAAATACTCCTCCCAAATAAATAAA-3'
Epi00269_FOXP3.1-10F 5'-aggaagagagATTAAAGGATGTAAGAGGTTAAATGGT-3'
Epi00269_FOXP3.1-T7R 5'-cagtaatacgactcactatagggagaaggctAATAATTCCAAAAACACCTCCTTTC-3'
Epi00270_FOXP3.2-10F 5'-aggaagagagGAGAGGTTGGTGATTTAGAGGTTTA-3'
Epi00270_FOXP3.2-T7R 5'-cagtaatacgactcactatagggagaaggctCCAAAAAAATTTAAATAACTTTCCCA-3'
Epi00271_FOXP3.3-10F 5'-aggaagagagAGGTTGGAGTGTAGTGGTGTAATTT-3'
Epi00271_FOXP3.3-T7R 5'-cagtaatacgactcactatagggagaaggctATAATCCCAACATCAATAACCACAT-3'
Epi00272_FOXP3.4-10F 5'-aggaagagagGTTTGTTTTATTTTGGGTTTAGGGT-3'
Epi00272_FOXP3.4-T7R 5'-cagtaatacgactcactatagggagaaggctATCCCAACCAATACCTACTTTAACC-3'
Epi00277_FOXP3.9-10F 5'-aggaagagagTTTAGGGTTAGTTTAAGTAGAGGGAGT-3'
Epi00277_FOXP3.9-T7R 5'-cagtaatacgactcactatagggagaaggctAACCAAAATCCATATTCAAAAAACA-3'
Epi00278_FOXP3.10-10F 5'-aggaagagagTAGAGAGATAGAGAAGGATGAGAGGTATT-3'
Epi00278_FOXP3.10-T7R 5'-cagtaatacgactcactatagggagaaggctTTCTATCAATCCACTTCACCAAAAT-3'
Epi00281_FOXP3.13-10F 5'-aggaagagagAGAGATATTATTTTGTGAGTGAGAGGA-3'
Epi00281_FOXP3.13-T7R 5'-cagtaatacgactcactatagggagaaggctTAAAACAAAAAAATCAAAATCCCAA-3'
Epi00282_FOXP3.14-10F 5'-aggaagagagTTTTTTTGATAGGTTATGGTGAAGA-3'
Epi00282_FOXP3.14-T7R 5'-cagtaatacgactcactatagggagaaggctCTACAAACCTCCAAACAAAAAACCT-3'
Epi00285_FOXP3.17-10F 5'-aggaagagagTTTTTTTGTGTTTTGGGTTTTAGTT-3'
Epi00285_FOXP3.17-T7R 5'-cagtaatacgactcactatagggagaaggctTTAAACCATCAATCAAATAAAAATACC-3'
Epi00286_FOXP3.18-10F 5'-aggaagagagTATTTATAATTGAAGGGATGGGGAT-3'
Epi00286_FOXP3.18-T7R 5'-cagtaatacgactcactatagggagaaggctCCACCTATCAACTATATAACCTAAAACAA-3'
Material and equipment
31
Epi00289_FOXP3.21-10F 5'-aggaagagagTTGGTGGGATTTGTGAGTTTTAGATA-3'
Epi00289_FOXP3.21-T7R 5'-cagtaatacgactcactatagggagaaggctCCTCACAATCACCCTATAAAACAAA-3'
Epi00290_FOXP3.22-10F 5'-aggaagagagTGAGGATTGAATTAATATATGTTGTTTAGG-3'
Epi00290_FOXP3.22-T7R 5'-cagtaatacgactcactatagggagaaggctTCAAAAATTACAAATACCCACCATC-3'
il26_6531_10F 5'-aggaagagagTTTGATTAGGGTTGAGGGAGAAG-3'
il26_6531_T7R 5'-cagtaatacgactcactatagggagaaggctCCCACAAATACCAATTTAAAAAAAA-3'
lrrc32_6534_10F 5'-aggaagagagTTTATAGTTGGTTGGGATGTAGATAATG-3'
lrrc32_6534_T7R 5'-cagtaatacgactcactatagggagaaggctCACCAAAACTATCAACCTTCAAAAA-3'
4.1.2 Real time PCR primer for MCIp
anxa1_fwd 5'-TGAAGTCAGGATGCTTTGGGAGAG-3'
anxa1_rev 5'-GAAACCCTTCATTAGTTCCTCAGCAC-3'
CD40LG_fwd 5'-GCAAATACCCACAGTTCCGCC-3'
CD40LG_rev 5'-TGACAAACACCGAAGCACCTG-3'
chd7_fwd 5'-GTCTTTGCAGTGGGCGATACCT-3'
chd7_rev 5'-ACTGAGTACTCCCTCCCTTACCGA-3'
ctla4_fwd 5'-TGAGTTGACCTTCCTAGATGATTCCA-3'
ctla4_rev 5'-GCAGATGTAGAGTCCCGTGTCC-3'
ctla4(2)_fwd 5'-AACCTTTCTCAAAGTGTTCGTTGCTCC-3'
ctla4(2)_rev 5'-CACAATCAGGACTCTGCTACGATACC-3'
dhx32_fwd 5'-GAGGAGGCAACATCAAGTATGAGGG-3'
dhx32_rev 5'-AGTGAAGAAGGTGTAGCTCCAATAACAG-3'
Empty 6.2_S 5'-GAAACCCTCACCCAGGAGATACAC-3'
Empty 6.2_aS 5'-TGCAGTGGGACTTTATTCCATAGAAGAG-3'
FOXP3_MCIp_fwd 5'-CGGAGGAAGAGAAGAGGGCA-3'
FOXP3_MCIp_rev 5'-CCTACCACATCCACCAGCAC-3'
hopx_fwd 5'-AGAGAAGTCGGAGTTTAGACAGGG-3'
hopx_rev 5'-GCCAGGTAAAGAATGCAACACGG-3'
HOXa1_fwd 5'-ACTTTCCACCTGAGGTATTTGCTTCTG-3'
HOXa1_rev 5'-TCTGAGATGGCTGTTGAGTGGGA-3'
hoxa13_fwd 5'-GGAAGCAAGCACAGACCCTC-3'
hoxa13_rev 5'-AGCTCAGAAGATCAGGACCCAC-3'
hoxa2_fwd 5'-GAAGCAAGCACAGACCCTCC-3'
hoxa2_rev 5'-ACAGCTCAGAAGATCAGGACCC-3'
id2_fwd 5'-ACTTTGCTTTCTTTGAACCAAGCTG-3'
id2_rev 5'-CCAGGTAGAACTCCGTGCTAAATCC-3'
id2(2)_fwd 5'-CTCATTACCGCCCAACCCAGAG-3'
id2(2)_rev 5'-GCTCTTCGATACTGACGCATTCC-3'
id2(3)_fwd 5'-ACAAATTCCATAGTGATCCTCCTTCCCT-3'
id2(3)_rev 5'-CAATCCTCAACTAGCCCAGAGAATCC-3'
ikzf2_fwd 5'-CATCCCAGAAACAGATTACAAGGAGG-3'
ikzf2_rev 5'-TAAAGGACGCTCAGGGAATCGG-3'
ikzf2(2)_fwd 5'-GTAACCCGCTTCCGAGTGTG-3'
ikzf2(2)_rev 5'-AATGAACGTCACCTCACCGCTC-3'
ikzf2(3)_fwd 5'-AGTATCTTTCCTGACCACATTTGCGA-3'
ikzf2(3)_rev 5'-AGCCATCCAGACTACACAGTTCAC-3'
Material and equipment
32
il13_fwd 5'-GTGACCTGTGGCGAAGTACC-3'
il13_rev 5'-CGGAGAGGGCTTTGGAAAGAG-3'
il13(2) _fwd 5'-CCTATGCATCCGCTCCTCAATCC-3'
il13(2) _rev 5'-GCAAGTGAGAGCAATGACCGTG-3'
il2ra_fwd 5'-GTGGAACCCAAGATTCAACTCCC-3'
il2ra_rev 5'-TCCCAGCCACAGAACCAGAG-3'
il2ra(2)_fwd 5'-GTTAAGTTAGAACAGAGAAGCCAGCC-3'
il2ra(2)_rev 5'-CATGATTGACGAAACAGACCTTTGGA-3'
il2ra(3)_fwd 5'-TGAGTGAGTTACTTGAGAATATGGTGGG-3'
il2ra(3)_rev 5'-TTTAACACGGGAGATGAAACTGCTG-3'
il2rb_fwd 5'-TGTCATCCTTCACTCTGCATCCAG-3'
il2rb_rev 5'-ATAGGGTCTTGAGGGCAGTGGG-3'
il4_fwd 5'-AAACTTTGAACAGCCTCACAGAGCAG-3'
il4_rev 5'-GCCTAGAAATACTGAGAGCATCACCA-3'
lgals3_fwd 5'-TCTCCATAGTTTACATAAGCCAGTCCC-3'
lgals3_rev 5'-AGCACCAGGCCAAAGAATCC-3'
map3k5_fwd 5'-ACTTTCCACCTGAGGTATTTGCTTCTG-3'
map3k5_rev 5'-TCTGAGATGGCTGTTGAGTGGGA-3'
map3k5(2) _fwd 5'-ATGGCCTTCAGCTTTCAGGGA-3'
map3k5(2) _rev 5'-ATGTAGGAAGCCCTTCAAATGTGAG-3'
noggin_fwd 5'-TCCAGATTCCAATCACATTCACCAC-3'
noggin_rev 5'-GGAGATGGGTACTGAAGGGACAC-3'
noggin(2)_fwd 5'-GACTAGCTCAGCAGTAAACGTTCACAC-3'
noggin(2)_rev 5'-CTTTCAAACCCTAGCCCAGAAGGAG-3'
nt5e_fwd 5'-CCTAAGGACAGACTGGAAATGGTGG-3'
nt5e_rev 5'-CAACTTTACCTTCCACTGTTCCTCAC-3'
pdk2_fwd 5'-AAATGTTATAGTCACCCGTGGTTTCCT-3'
pdk2_rev 5'-TCCTCCCACAACTTGACATTATATGCAC-3'
PERP _fwd 5'-CATGCAGGCGATGAGACAGAC-3'
PERP _rev 5'-CATGAAGTGGCTGTGGGAAGAAGAC-3'
ppp1r3f_fwd 5'-CGCTCGCTTACTCTGTGACTGG-3'
ppp1r3f_rev 5'-AGAGGGTGAGGATTTGGAAAGAGG-3'
SNRPN_AS 5'-TACCGATCACTTCACGTACCTTCG-3'
SNRPN_S 5'-TACATCAGGGTGATTGCAGTTCC-3'
tnfrsf9_fwd 5'-AGGTCAAACACAGGAGTGCGG-3'
tnfrsf9_rev 5'-GAATGATTTCATAGGGCTGTCACAGAG-3'
tnfrsf9(2)_fwd 5'-AGGACATCGAGAGTAGCTTGGG-3'
tnfrsf9(2)_rev 5'-TCCGCATCTGTCCGCATCTC-3'
tnfrsf9(3)_fwd 5'-CGGTCATCTGAGAGTTATCTTACCTGTG-3'
tnfrsf9(3)_rev 5'-CTCTCACATTCAGCCAATTTCTGCC-3'
tp53inp1_fwd 5'-AGCTGCCACTTTGAAATACAAACACC-3'
tp53inp1_rev 5'-GGCTATCTTACACATAGGAAACCCGAG-3'
vamp3_fwd 5'-TAAAGCCTACCAGTGTAACCTACCAG-3'
vamp3_REV 5'-GGTCAGAAATGCTTCGTTTCAGTGG-3'
zeb1_fwd 5'-TGTTATAGCAAGGAGTGGAGCATAGG-3'
zeb1_rev 5'-CCGAACCAACTTACCTTTCATAAAGCC-3'
Material and equipment
33
4.1.3 Real time PCR primer for ChIP-on-chip
CTCF_+_fwd 5'-TTCCGGTAGCGTAAAGTCACTTCC-3'
CTCF_+_rev 5'-ATGGACTTCCCTGTTCCTTCTCAC-3'
CTLA4_CTCF_fwd: 5'-TTCCCTCCATCTCATTTAGTTAGTCCAC-3'
CTLA4_CTCF_rev: 5'-TCTGATCCCACATCACACTGAACC-3'
h3k4di_fwd 5'-GCCCGCTAAGTTCGCATGTC-3'
h3k4di_rev 5'-CGAAACCGCTTTGTATCACAGCC-3'
M4 up -129bp_AS 5'-AATCGCTATCTCATTACGATGTTGGG-3'
M4 up -129bp_S 5'-CAGACAAGCCTTATCGGTATCACCT-3'
tnfrsf9_fwd 5'-AGGTCAAACACAGGAGTGCGG-3'
tnfrsf9_rev 5'-GAATGATTTCATAGGGCTGTCACAGAG-3'
4.1.4 In-Fusion cloning primer
ifus_ctla4.1 fwd 5'-ATTAAAAGGAATTCCTGCAGTTTCTCAGTGCCTACAAGGTG-3'
ifus_ctla4.1 rew 5'-GCTCTTCTCCACTAGTTTGTCCAAATTCATCCCTACTCC-3'
ifus_ctla4.2 fwd 5'-ATTAAAAGGAATTCCTGCAGAACCACGGTCTAGTTTCAACC-3'
ifus_ctla4.2 rew 5'-GCTCTTCTCCACTAGTTTTGAGAATTGAGGAGAAGGC-3'
ifus_FOXP3.1 fwd 5'-ATTAAAAGGAATTCCTGCAGGCCAGAACAAACTAATACCGA-3'
ifus_FOXP3.1 rev 5'-GCTCTTCTCCACTAGTCTACACATACTGAGACTTTGGG-3'
ifus_FOXP3.2 fwd 5'-ATTAAAAGGAATTCCTGCAGGAATGAAAGCAGACCATGTCC-3'
ifus_FOXP3.2 rev 5'-GCTCTTCTCCACTAGTTTGATCCACTCGTTTCTCCTC-3'
ifus_FOXP3.3 fwd 5'-ATTAAAAGGAATTCCTGCAGTTGAGCCAATCCCAAGATCC-3'
ifus_FOXP3.3 rev 5'-GCTCTTCTCCACTAGTTTTCACAGCCACCTTCAAACC-3'
ifus_IL1R1 fwd 5'-ATTAAAAGGAATTCCTGCAGATTCCTTTGTAACTTGGCTGAC-3'
ifus_IL1R1 rev 5'-GCTCTTCTCCACTAGTGTGGATTCTGACTCTGGTGG-3'
ifus_IL2RA.1 fwd 5'-ATTAAAAGGAATTCCTGCAGTAGAAATTCATCCCACACCCAC-3'
ifus_IL2RA.1 rev 5'-GCTCTTCTCCACTAGTGCTGAGTAGGAGAGGAAGAC-3'
ifus_IL2RA.2 fwd 5'-ATTAAAAGGAATTCCTGCAGGCAGACTGGGATTTGTCAGG-3'
ifus_IL2RA.2 rev 5'-GCTCTTCTCCACTAGTGGTTGGCCTAAATGATCTTTGAG-3'
ifus_IL2RA.3 fwd 5'-ATTAAAAGGAATTCCTGCAGGCAAAGAGTGGGTATCTATGG-3'
ifus_IL2RA.3 rev 5'-GCTCTTCTCCACTAGTCAAAGATGCCATTAAGTCCTTGAG-3'
ifus_IL2RB.1 fwd 5'-ATTAAAAGGAATTCCTGCAGTAGGAGCTCTGACCCAAACAC-3'
ifus_IL2RB.1 rev 5'-GCTCTTCTCCACTAGTTTAGGCTTTGATTGCAACAGG-3'
ifus_IL2RB.2 fwd 5'-ATTAAAAGGAATTCCTGCAGGTCGCATGTTTCAGATGCAG-3'
ifus_IL2RB.2 rev 5'-GCTCTTCTCCACTAGTCTTATGCAGTATCCAGGCCTC-3'
ifus_LGALS3.1 fwd 5'-ATTAAAAGGAATTCCTGCAGGCAGTTACCAGTCATTGGAG-3'
ifus_LGALS3.1 rev 5'-GCTCTTCTCCACTAGTCTATATTAGATGTGCATTGTTTGGG-3'
ifus_LGALS3.2 fwd 5'-ATTAAAAGGAATTCCTGCAGATACACCTTCCCTAAGCAATTCC-3'
ifus_LGALS3.2 rev 5'-GCTCTTCTCCACTAGTATCTAAACCACTCATGCCCTG-3'
ifus_LRRC32.1 fwd 5'-ATTAAAAGGAATTCCTGCAGGGCATGAACTCATTCCATCC-3'
ifus_LRRC32.1 rev 5'-GCTCTTCTCCACTAGTTCTTTCAGGGAGAGCAGTCAG-3'
ifus_LRRC32.2 fwd 5'-ATTAAAAGGAATTCCTGCAGGGCTACACTATCAAGGGAAGG-3'
ifus_LRRC32.2 rev 5'-GCTCTTCTCCACTAGTTTGAACTAGACTTTGATGCTCATGG-3'
ifus_TP53INP1 fwd 5'-ATTAAAAGGAATTCCTGCAGAATCTCATGGCTGAACTTCTG-3'
ifus_TP53INP1 rev 5'-GCTCTTCTCCACTAGTTCTTTAACCACTCTGGCCTC-3'
Material and equipment
34
ifus_ZNFN1A2.1 fwd 5'-ATTAAAAGGAATTCCTGCAGGACTCTATCAGATACTTTCAGTGTGG-3'
ifus_ZNFN1A2.1 rev 5'-GCTCTTCTCCACTAGTATTCTCATTCTGTTCAGTTCACCTC-3'
4.1.5 Primer for direct cloning
CLONE_CD40LG_NsiI_S 5'-GATGAATGCATGTACAGCACTCGACAGCATCAC-3'
CLONE_CD40LG_SpeI_AS 5'-ATCCTACTAGTAGCATCTGAGCGGTAGCCAC-3'
CLONE_CHD7-1_NsiI_S 5'-GATGAATGCATCCTGTTCTCACCTGCATCTGGG-3'
CLONE_CHD7-1_SpeI_AS 5'-ATCCTACTAGTGCAAGTGTCTCTTGGTCTCTGTC-3'
CLONE_CHD7-2_NsiI_S 5'-GATGAATGCATAAATGTCTCCTACTTATCACCTAGAAAGGC-3'
CLONE_CHD7-2_SpeI_AS 5'-ATCCTACTAGTCCCTCTTCTGAACAGACAATGGAC-3'
CLONE_HOPX_NsiI_S 5'-ATCTATGCATCCTAGAAACACCTACTTTGCAGACTTCC-3'
CLONE_HOPX_SpeI_AS 5'-ATCTACTAGTAGGACAGCACTTGAGGATTCTGG-3'
CLONE_ID2_NheI_AS 5'-ATCCTGCTAGCTTTGCATTTCAGAAAGCGGAAGGG-3'
CLONE_ID2_NsiI_S 5'-GATGAATGCATTTAAGGTGATTTCATATTGGGCGTGCTG-3'
CLONE_IFNG_NsiI_S 5'-GATGAATGCATTCAATCGAAGTATTTGGCACTTGGT-3'
CLONE_IFNG_SpeI_AS 5'-ATCCTACTAGTCAGACTGGCAGTGAAACATCTGCT-3'
CLONE_IL26_NsiI_S 5'-GATGAATGCATGTGCTTCCTGACTTTGATTCTCCA-3'
CLONE_IL26_SpeI_AS 5'-ATCCTACTAGTCATCTGAACAATCCACAAGCCTCAC-3'
CLONE_NOG_NsiI_S 5'-GATGAATGCATGGGCACCTCACTAAACTTCAGCA-3'
CLONE_NOG_SpeI_AS 5'-ATCCTACTAGTGCAGTGGCCAGTCCTTTACCAG-3'
CLONE_PDE4D_NsiI_S 5'-GATGAATGCATCCCTGAGCCACATAAGCCTCTG-3'
CLONE_PDE4D_SpeI_AS 5'-ATCCTACTAGTACCCAAATTCCTGCAAGACAATTAGCC-3'
CLONE_SEPT9_NsiI_S 5'-GATGAATGCATTGTGTTCCGTTGAGCCTCCTG-3'
CLONE_SEPT9_SpeI_AS 5'-ATCCTACTAGTTCCTCTTGCAATCCAATTCCTACTCTCC-3'
4.1.6 Sequencing primer
pCGs 5'-TAAATCTCTTTGTTCAGCTCTCTG-3'
pcpg-luc_seq_as 5'-CACAGACATCTCAAAGTATTCAGC-3'
4.1.7 LM-PCR oligos
LM_JW102_sticky: 5'-GCGGTGACCCGGGAGATCTGAATTCT-3'
LM_JW103_sticky: 5'-GAATTCAGATC-3'
Methods
35
55 MMeetthhooddss
Unless otherwise mentioned, all methods were based on protocols described in
“Current protocols of Molecular Biology”71, and in the “Molecular cloning laboratory
manual”72.
GGeenneerraall mmoolleeccuullaarr bbiioollooggyy
5.1.1 Bacterial culture
Bacterial growth medium
Antibiotic used for selective growth of E.coli PIR1 cells was Zeocin (Invitrogen) at a
concentration of 25µg/ml.
E.coli PIR1 strains were streaked out on solid LB-agar with Zeocin and grown
overnight. Single colonies were then picked and grown in liquid LB broth with Zeocin
at 37° C overnight on a shaker at 200 rpm.
LB broth 10 g NaCl
10 g Bacto Tryptone (Difco)
5 g Yeast extract
Add H2O to 1 l
Adjust to pH 7.5 with NaOH, autoclave.
LB-agar plates 15 g Agar
10 g NaCl
10 g Bacto Tryptone (Difco)
5 g Yeast extract
Add H2O to 1 l,
Adjust to pH 7.5 with NaOH, autoclave, cool to 50°C and add antibiotics.
The LB-agar mix was poured in 10 cm Petri-dishes and stored inverted at 4 °C.
Methods
36
Transformation of chemically competent E.coli PIR1
Chemically competent E.coli PIR1 cells (Invitrogen, 50 μl) were thawed on ice, 1-25
ng plasmid DNA in 1-5 μl volume was added and the suspension was mixed gently
by tapping and incubated on ice for 30 min. Cells were heat-shocked in a water bath
at 42°C for 30 s, immediately transferred back on ice and 250 μl SOC medium was
added. For recovery, bacterias were incubated for 1 h at 37°C with vigorous shaking
and 50-150 μl of the transformation were plated and incubated overnight at 37°C on
LB-agar plates with Zeocin.
SOC medium: 20 g BactoTrypton (Difco)
5 g BactoYeastExtract (Difco)
0.6 g NaCl
0.2 g KCl
Add H2O to 1 l, autoclave and add to the cooled solution:
10 ml MgCl2 1 M, sterile filtered
10 ml MgSO4 1 M, sterile filtered
10 ml Glucose 2 M, sterile filtered
Glycerol stock
For long-term storage 250 µl overnight culture was added to 750 µl LB-glycerol (60 %
glycerol, 40 % LB broth), mixed and frozen at -80 °C.
Plasmid isolation from E.coli
For plasmid isolation, DNA minipreps were made with the NucleoSpin Plasmid Quick
Pure Kit following the manufacturer’s instructions. To isolate larger amounts of ultra
pure DNA (ca. 100 μg) for transfection experiments, plasmids were isolated using
QIAGEN Plasmid Midi kit for endotoxin-free midipreps.
In vitro methylation of reporter plasmids
Luciferase Reporter constructs were methylated in vitro with the CpG methylase SssI
and S-Adenosylmethionin (SAM) as the methyl donor. 15 µg plasmid DNA was
incubated with 9.3 µl SssI methylase (NEB) and 0.75 µl SAM in 150 µl H2O buffered
with NEBII for 4 hours at 37°C. After 2 hours the reaction was supplied with an
additional 0.75 µl SAM.
Methods
37
5.1.2 Molecular cloning
Polymerase Chain Reaction (PCR)
PCR allows specific enzymatic in vitro amplification of DNA with sequence specific
oligonucleotides. PCRs were generally performed in PCR tubes in 50 μl reaction
volumes on a MJ research PTC 200 thermocycler or in 5 µl reaction volumes (384-
well format) on a Veriti thermocycler for the MassARRAY application. The primer
annealing temperatures varied between 57 and 65°C. The method was used to
generate reporter constructs (section 5.1.2), for the MassARRAY application (section
5.6), ligation mediated-PCR (section 5.5) or, in variation, for real-time PCR (section
5.2).
Typical reaction setup for cloning:
DNA polymerase buffer 10x
dNTPs 10mM each
Primer forward 200 pM
Primer reverse 200 pM
DNA Template 100 ng
DNA Polymerase 2 U
ddH2O to 50 µl
Typical thermocycler programme:
Primer design
Primers for cloning were
designed according to the
utilized cloning technique.
For In-Fusion cloning, the PCR
product was inserted into the target vector by recombination. Therefore the primers
for amplification are tagged with sequences overlapping the target vector sequence
at the desired recombination site, whereas recombination of linearised vector and
Step Temperatur/ Time
Initial melting 94° C 1min
Melting
Annealing 32 cycles
Elongation
94°C 15 s
61°C 15 s
72°C 1min 30s
Final elongation 72 °C 7 min
Cooling 4 °C for ever
Methods
38
PCR product is enhanced by the dry-down reaction from the In-Fusion cloning kit.
One to two µl of the product was transformed into chemically competent PIR1 cells
(section 5.1.1.2).
For direct cloning into the vector by restriction digest and fragment combination
through ligation, PCR products were PEG-precipitated (section 5.1.2.6) and the
precipitate as well as the cloning vector were digested with the adequate restriction-
endonucleases. Restriction sites were introduced by adding the appropriate
recognition sites to the primer sequences. To prevent re-assembly of the cut vector
ends, the digested vector was CIAP treated (section 5.1.2.4). The cut fragment and
vector were gel-purified (section 5.1.2.7) and combined in a ligation reaction. 1- 5 μl
of the reaction was used to transform chemically competent E.coli cells (section
5.1.1.2).
Successful insertion of the fragment into the vector was checked by preparing
plasmid DNA from liquid cultures (section 5.1.1). To check correct insertion and
sequence integrity, plasmid constructs were sequenced (section 5.1.2.8) using the
vector-specific primers pCGs and pcpg-luc_seq_as (section 4.10.6).
Restriction digest
To verify the presence and orientation of plasmid-inserts, or to clone PCR-products
into a plasmid, DNA was digested with appropriate restriction enzymes. The
digestion of plasmid DNA or PCR products was carried out using 5 U enzyme/1 μg
DNA in 20 μl at 37°C for 2 hours.
CIAP-treatment
To prevent re-ligation of restriction digested vectors, vector-ends were treated with
CIAP (calf intestinal alkaline phosphatase, Roche) at 37°C for 30 min before gel
extraction.
Ligation reaction
Restriction enzyme treated vectors and PCR-products were ligated in a 10 μl reaction
at a 3- to 5-fold molar excess of insert to vector, using 25-50 ng of vector. Ligation
Methods
39
was carried out overnight at 16°C with 1U T4 DNA ligase and 1 µl T4 DNA ligase
buffer.
PEG-precipitation
To precipitate DNA from small volumes, e.g. PCR reactions or endonuclease
digestion, one volume of PEG-mix was added to the DNA-containing solution,
vortexed and incubated for 10 min at RT. After centrifugation (10 min, 13000 rpm,
RT), the supernatant was discarded and the precipitated DNA was washed by
carefully adding 200 μl 100% EtOH to the tube wall opposite of the pellet, followed by
a centrifugation step (10 min, 13000 rpm, RT) and careful removal of the
supernatant. The pellet was dried and resuspended in H2O at half to three-quarters of
the initial volume.
PEG-mix 26.2 % 26.2 g PEG 8000
0.67 M 20 ml NaOAc (3 M) pH 5.2
0.67 mM 660 μl MgCl2 (1 M)
Add H2O to 250 ml.
Gel-Purification
To purify DNA from analytical agarose gels, desired bands were excised under UV-
light and purified with the QIAEX II gel extraction kit (Qiagen) according to the
manufacturer’s instruction.
Sequencing
DNA sequencing was done by Geneart (Regensburg, Germany) with ABI sequencing
technology based on the Sanger didesoxy method. Sequence files were analysed
and aligned with Generunner, Bioedit or with the Blat function of the UCSC genome
browser (section 4.9).
Agarose gel electrophoresis
Agarose was prepared (see “Agarose”) to cast a gel in a mounted chamber, placed in
the electrophoresis tank and covered with TAE (1x). DNA-containing samples were
diluted 4:1 with DNA loading dye (5x), mixed and loaded into the slots of the
Methods
40
submerged gel. Depending on the fragment size and the desired resolution, gels
were run at 40-100 V for 30 min to 3 h.
Required buffers and reagents:
TAE (50x) 2 M 252.3 g Tris
250 mM 20.5 g NaOAc/HOAc, pH 7.8
50 mM 18.5 g EDTA
Add H2O to 1 l.
EDTA (0.5 M) 0.5 M 18.6 g EDTA/NaOH, pH 8.0
Add H2O to 100 ml.
DNA loading dye 50 mM 500 μl Tris/HCl, pH 7.8
1% 500 μl SDS (20%)
50 mM 1 ml EDTA (0.5 M), pH 8.0
40% 4 ml Glycerol
1% 10 mg Bromophenol blue
Add H2O to 10 ml, and store at 4°C.
Agarose Dissolve 0.5% (gDNA) or 1% (fragments between 0.5
and 6 kb) w/v Agarose in 1x TAE, and heat until agarose
dissolves completely. Cool to 50°C and add 2.5 μl
ethidiumbromide (10 mg/ml, Sigma).
RReeaall TTiimmee--PPCCRR ((RRTT--PPCCRR))
Enrichment of DNA fragments was quantified with RT-PCR on an Eppendorf
Realplex Mastercycler EpGradient S. Specific primers amplify small regions of the
fragment of interest, and the relative amount of amplified DNA is measured through
the emission of light by a dye emitting light when intercalated in double stranded
DNA. All reactions were carried out with the QuantiTect SYBR Green Kit (Qiagen) in
96 well Twin.tec plates (Eppendorf).
Reaction setup: 5 µl SYBR Green mix (2x) 2 µl ddH2O
Methods
41
0.5 µl primer forward
0.5 µl primer reverse
2 µl Sample DNA
Typical RT-PCR programme:
A standard dilution curve (1:10; 1:100; 1:500) with known amounts of DNA is
generated with each run for absolute quantification of the sample via its Ct value.
Specific amplification was controlled by melting-curve analysis and data was
imported and processed in Microsoft Excel 2007. All samples were measured in
replicates and normalised to the input, IgG control or an independent primer pair for
an unaffected region of the ChIP for ChIP-on-chip experiments.
MMeetthhyyll--CCppGG iimmmmuunnoopprreecciippiittaattiioonn ((MMCCIIpp))
MCIp allows rapid enrichment of CpG methylated DNA. DNA was bound to the
MBD2-Fc fusion protein produced and purified in our lab73 (www.ag-rehli.de). The
affinity to DNA is increased with the density of methylated CpGs and lowered with
higher salt concentrations in the buffer, allowing enrichment of methylated DNA on a
matrix-protein complex with increased NaCl concentration in the wash buffer and
collection of the flow-through recovers the lesser methylated DNA.
Buffers:
TME (10x) 200 mM Tris-HCl (1 M) pH 8.0
20 mM MgCl2 (1 M)
Step Temperature/ Time
Initial melting 94° C 1min
Melting
Annealing 32 cycles
Elongation
94°C 15 s
61°C 15 s
72°C 1min 30s
Final elongation 72 °C 7 min
Cooling 4 °C for ever
Methods
42
5 mM EDTA (500 mM)
Buffer A 1x TME (10x)
(300 mM NaCl) 300 mM NaCl (5 M)
0.1 % NP-40 (10 %)
Buffer X 1x TME (10x)
(200 mM NaCl) 200 mM NaCl (5 M)
0.1 % NP-40 (10 %)
Buffers B-H 1x TME (10x)
0.1 % NP-40 (10 %)
300 (B), 350 (C), 400 (D), 450 (E), 500 (F), 600 (G) or 1000 mM (H) NaCl
5.1.3 Binding MBD2-Fc to beads
For single-gene analysis, typically 18 μg purified MBD2–Fc protein per 40 μl Protein
A–Sepharose 4 Fast Flow beads (Amersham Biosciences) for a single assay was
rotated in 2 ml TBS overnight at 4°C to bind the Fc-part of the protein to the beads.
On the next day, the MBD2–Fc-bead complexes (40 μl/assay) were transferred and
dispersed into 0.5-ml Ultrafree-MC centrifugal filter devices (Millipore) and spin-
washed twice with buffer A.
5.1.4 DNA fragmentation
Genomic DNA was fragmented as follows: To reduce viscosity, gDNA was initially
sheared using a 20 gauge needle attached to a 2 ml syringe (BD) before
quantification using the NanoDrop ND 1000 spectrophotometer (Peqlab). Sonication
to a mean fragment size of 400–500 bp was carried out with the Branson Sonifier
250 (Danbury) using the following settings: duty cycle 30%, output 3, sonication time
1 min, and 5 μg DNA in 500 μl TE buffer. Fragment range was controlled using
agarose gel electrophoresis.
5.1.5 Enrichment of highly methylated DNA
Sonicated DNA (300 ng) was added to the washed MBD2–Fc beads in 350 μl buffer
X and rotated for 3 h at 4°C. Beads were centrifuged to recover unbound DNA
Methods
43
fragments (200 mM fraction) and subsequently washed twice with 200 μl and 150 μl
of buffers containing increasing NaCl concentrations (300-1000 mM, see buffers
B-H). The flow-through of each washing step was collected in separate tubes and
desalted using a QIAquick PCR Purification Kit (Qiagen). In parallel, 300 ng
sonicated input DNA was resuspended in 350 μl buffer X and desalted using a
QIAquick PCR Purification Kit (Qiagen) as a control.
This MCIp protocol was scaled up to generate DNA fragments for direct microarray
hybridisation. Here, for each sample, 84 μg purified MBD2–Fc protein was added to
200 μl Protein A–Sepharose beads (Amersham Biosciences) in 15 ml TBS and
rotated overnight at 4°C. For the precipitation, 2-ml Ultrafree-MC centrifugal filter
devices (Millipore) were used and 4 μg of sonicated DNA was added to the washed
MBD2–Fc bead complexes in 2000 μl buffer A. Unbound DNA fragments (350 mM
fraction) were collected and desalted using a QIAquick PCR Purification Kit (Qiagen)
Flow-throughs were analysed for successful enrichment of highly methylated DNA
with the RT-PCR (section 5.2). Based on the distribution of fragments analysed with
RT-PCR primers, a conclusion could be made about the methylation level of the
sample DNA in this region. For the “mirror image approach” (figure 5) flow-throughs
were combined to a hypomethylated and a hypermethylated fraction for subsequent
labelling and microarray analysis.
CChhIIPP--oonn--cchhiipp
Chromatin Immunoprecipitation (ChIP) is a method to detect nucleic proteins that
bind to DNA in vivo. Therefore DNA is covalently bound to proteins with
formaldehyde, fragmented by sonification and precipitated with suitable antibodies.
Hereafter the covalent cross-links are broken up to free the precipitated DNA.
Enrichment of certain fragments is validated with gene specific primers in a real-time
PCR assay. If the ChIP was successful the fragments were amplified with a ligation
mediated PCR (LM-PCR, see section 5.5), fluorescence-labelled and hybridised on a
microarray (ChIP-on-chip, microarray handling see section 5.7) against a fractional
amount of the input to correct background noise. With this approach protein binding
to DNA can be detected in all areas covered on the microarray platform.
Methods
44
Two million cells were used per immunoprecipitation. The cells were washed with
PBS, resuspended at a concentration of 1 x 10⁶ /ml in PBS with 10 % FCS. For
fixation 1 % formaldehyde was added and incubated at room temperature for 10
minutes. Glycine was added to a concentration of 0.125 M to quench the reaction
followed by two washes with ice-cold PBS with 1 mM PMSF. 10 x 106 cells were
resuspended in 250 µl L1A, lysed by the addition of 250 µl L1B, mixed briefly and
incubated on ice for 10 minutes. The lysate was centrifuged (700g, 5 minutes), the
supernatant discarded and the nuclei were resuspended in 400 µl L2. If more cells
were available, up to 20 x 106 Cells were treated with the same procedure to
concentrate the chromatin.
Afterwards DNA was fragmented with a Branson Sonifier 250 (duty cycle= constant,
output control= 2) for 3 x 10 seconds. Cooling on ice in-between prevented
overheating of the sample. The sonified lysate was cleared by centrifugation (130000
rpm, 5 minutes, 4°C) and the supernatant was transferred into a new 1.5 ml tube. If
concentrated chromatin was sonified it was diluted 1:1 with L2 after sonification to
obtain in either case 1 x 10⁶ cells in 40 µl. To monitor successful fragmentation of the
DNA an aliquot was taken for agarose-gel analysis (which was incubated over night
with 200 mM NaCl at 65 °C to reverse the formaldehyde cross-links and purified with
the Qiaquick PCR purification kit (Qiagen)) and a 5 % volume aliquot of the lysate
was kept as the input. To pre-clear the lysate 50 µl / precipitation sepharose CL-4B
beads were washed twice with TE pH 8.0, filled up with dilution buffer to the previous
volume and incubated with 25 µl 20 % BSA and 4 µl Glycogen per ml CL4Beads on a
rotator for a minimum of 2 hours at room temperature. The lysate was diluted 1:1.5
with DB and 50 µl of the CL-4B beads/ IP were added, rotating for 2 hours at 4 °C.
Following this the pre-cleared lysate was recovered by centrifugation ( 13000 rpm, 5
minutes, 4 °C) and 200 µl supernatant for each IP was transferred in a new 0.5 ml
PCR tube. Antibodies were added (2µg each) and incubated on a rotator at 4 °C over
night.
To bind the antibody complexes to beads, 40 µl Protein A sepharose beads per IP
were washed twice with TE pH 8.0, filled up to the previous volume with DB and
blocked with 0.4 µl glycogen and 2.5 µl BSA (20%) per 100 µl beads over night on a
rotator at 4 °C. Then 35 µl of the blocked beads were added to the antibody
complexes, rotated at 4 °C for 2 hours, centrifuged (4000rpm, 5 minutes, 4 °C) and
Methods
45
the supernatant discarded. The beads were transferred on Millipore Ultrafree-MC
columns and washed twice with WBI, WBII, WBIII and three times with TE pH 8.0,
shaking the beads for 5 minutes in-between. The DNA was eluted in two steps by
adding 100 µ EB each, incubating for 20 minutes and 10 minutes respectively,
shaking up the beads every 5 minutes. 200 µl EB was added to the input as well, and
all samples were incubated over night at 65 °C with added Proteinase K (0.5 µg/µl
final concentration, Roche) to reverse the cross-links. RNase (0.33 µg/µl, Qiagen)
digestion for 2 hours at 37 °C degraded RNA that could interfere with downstream
applications. Finally the samples were purified with the Qiaquick PCR-purification kit
following the manufacturer’s instructions with small variations: binding buffer PB was
incubated for 30 minutes, binding DNA to the column by centrifugation was carried
out at 10000 rpm and elution was done with 100 µl pre-warmed elution buffer EB.
Solutions: Fixation Buffer (FB) 25 ml (500 mM) HEPES / KOH (1 M), pH 7.9 1 ml (0.1M) NaCL (5 M) 100 µl (1 mM) EDTA (0.5 M, pH 8.0) 125 µl (0.5 mM) EGTA (0.2 M, pH 8.0) 15 ml (11 %) Formaldehyd (37 %) To 50 ml with ddH2O Glycine 9 .85g (2.625 M) Glycine To 50 ml with ddH2O Cell Buffer Mix ( 2ml/40 Mio cells) 20 µl (10 mM) HEPES / KOH (1 M), pH 7.9 57 µl (85 mM) KCL (3 M) 4 µl (1 mM) EDTA (0.5 M, pH 8.0) To 1.98 ml with ddH2O Add immediately before use: 20 µl (1 mM) PMSF (100 mM in Iso-prop, nostalgia) 2 µl (1 µg/ml) Pepstatin (1 µg/µl) 2 µl (2 µg/ml) Aprotinin (2 µg/µl) Nuclear Lysis Buffer (L2) 100 µl (50 mM) Tris/HCl (1 M), pH 7.4 @ 20°C 100 µl (1%) SDS (20 %) 33.3 µl (0.5%) Empigen BB (30 %) 40µl (10 mM) EDTA (0.5 M), pH 8.0 To 1.98 ml with ddH2O Add immediately before use: 20 µl (1 mM) PMSF (100 mM in Iso-prop, nostalgia) 2 µl (1 µg/ml) Pepstatin (1 µg/µl) 2 µl (2 µg/ml) Aprotinin (2 µg/µl) Dilution Buffer (DB) 50 µl (20 mM) Tris/HCl (1 M), pH 7.4 @20°C 50 µl (100 mM) NaCl (5 M) 10 µl (2 mM) EDTA (0.5 M, pH 8.0) 125 µl (0.5 %) Triton X-100 (10%)
Methods
46
To 2.47 ml with ddH2O Add immediately before use: 25 µl (1 mM) PMSF (100 mM in Iso-prop, nostalgia) 2.5 µl (1 µg/ml) Pepstatin (1 µg/µl) 2.5 µl (2 µg/ml) Aprotinin (2 µg/µl) Wash Buffer I (WB I) 200 µl (20 mM) Tris/HCl (1 M), pH 7.4 @ 20°C 300 µl (150 mM) NaCl (5 M) 50 µl (0.1 %) SDS (20%) 1ml (1 %) Triton X-100 (10%) 40 µl (2 mM) EDTA (0.5 M, pH 8.0) To 10 ml with ddH2O Wash Buffer II (WB II) 200 µl (20 mM) Tris/HCl (1 M), pH 7.4 @ 20°C 1 ml (500 mM) NaCl (5 M) 0 µl4 SDS (20 %) 1ml (1 %) Triton X-100 (10 %) 40 µl (2 mM) EDTA (0.5 M, pH 8.0) To 10 ml with ddH2O Wash Buffer III (WB III) 100 µl (10 mM) Tris/HCl (1 M), pH 7.4 @ 20°C 250 µl (250 mM) LiCl (10 M) hard to dissolve, try 2.5 M 1 ml (1 %) NP-40 (10 %) 1 ml (1 %) Deoxycholate (10 %) 20 µl (1 mM) EDTA (0.5 M, pH 8.0) To 10 ml with ddH2O Elution Buffer (EB) 450 µl (0.1 M) NaHCO3 (1M) 225 µl (1 %) SDS (10 %) To 4.5 ml with ddH2O
LLMM--PPCCRR
Ligation mediated PCR (LM-PCR) was used to amplify the chromatin immune
precipitated DNA. Adaptors are ligated to all fragments in the precipitation, and
primers specific for these adaptors are used to amplify all fragments independent of
their sequences. All reagents were purchased from New England Biolabs (NEB)
unless otherwise mentioned.
To make the 60 mM linker preparation, 10 ml Tris-HCl (1 M) pH 7.9, 15 µl oligo
JW102 and 15 µl oligo JW103 (160 µM each, Metabion) were mixed and incubated
in a thermocycler with the following programme:
Step 1 95°C 5 min
Step 2 70°C 1 min
Methods
47
Step 3 Ramp down to 4°C
(0.4°C /min)
Step 4 4°C HOLD
To start, the overhangs were converted into phosphorylated blunt ends, using T4
DNA polymerase, E.coli DNA Pol I large fragment (Klenow polymerase), and T4
polynucleotide kinase (PNK). The 3’ to 5’ exonuclease activity removes 3’ overhangs,
the polymerase activity fills in the 5’ overhangs and the PKN adds the phosphate
group to the 3’ end.
ChIP enriched DNA (about 10 ng) was brought to a volume of 40 µl with ddH2O.
Then 10 µl of the reaction mix was added:
T4 DNA Ligase buffer with 10mM ATP (5µl)
dNTP mix (2µl)
T4 DNA Polymerase (1µl)
Klenow DNA polymerase diluted with water to 1U/µl (1µl)
T4 PNK (1µl)
The mixture was incubated in a thermocycler for 30 minutes at 20 °C, then purified
with the Qiaquick PCR purification kit (Qiagen), eluting in 34 µl elution buffer (EB).
Then Adenine was added to the 3’ end of the blunted phosphorylated DNA
fragments: The eluate was incubated with 1µl of Klenow fragment (3’ to 5’ exo
minus), 5 µl NEB buffer II and 10 µl dATP (1 mM) for 30 minutes at 37 °C, followed
by clean-up with the MinElute kit (Qiagen), eluting in 10 µl EB. In this process an
Adenin overhang was added to the DNA fragments’ 3’ ends to facilitate the ligation
with the adapters, which have a single “T” base overhang at their 3’ site (see oligo
JW102_sticky). DNA Quick-Ligase buffer 2x (15µl), linker 60µM preparation (1µl) and
DNA Quick-Ligase (4µl) were mixed with the DNA sample and incubated for 15
minutes at room temperature. The reaction was cleaned up with the Qiaquick PCR
purification kit (Qiagen), eluting in 25 µl EB. For large-scale amplification of IP
samples two buffer mixes were prepared:
Mix A: Stock 1 x Mix Final Concentration
5x Phusion polymerase buffer 8.00 µl 1 x
Methods
48
dNTP mix (10mM each) 1.25 µl 250µM
Oligo JW102_sticky (160µM) 0.31 µl 1 µM
ddH2O 5.44 µl
Total 15µl
Mix B:
Stock 1 x Mix Final Concentration
5x Phusion polymerase buffer 2.00 µl 1x
Phusion Polymerase(2U/µl) 0.50 µl 1 U
ddH2O 7.50 µl
Total 10.00 µl
15 µl of Mix A was added to the sample and on a thermocycler the following
programme was started:
Step Temperature/ Time
Initial heating 55°C 4 min
Initial melting 98°C 30 s
Melting
Annealing 15 cycles
Elongation
98°C 10 s
68°C 30 s
72°C 30 s
Final elongation 72 °C 5 min
Cooling 4 °C for ever
Midway through step 1 the programme was paused and 10 µl Mix B was added to
hot start the reaction. The PCR product was diluted with 475 µl ddH2O, and 5 µl were
used for a second expansion using the following mixture:
Stock 1 x Mix Final
Concentration
5 x Phusion polymerase buffer 10.00 µl 1x
dNTP mix (10mM each) 1.25 µl 250µM
Methods
49
Oligo JW102_sticky (160µM) 0.31 µl 1 µM
ddH2O 32.94 µl
Phusion Polymerase (2U/µl)
HOT START 0.50 µl 1 U
PCR dilution (first
amplification) 5 µl
Total volume 45 µl
The PCR programme for the second expansion was:
Step Temperature/ Time
Initial melting 98°C 30 s
Melting
Annealing 25 cycles
Elongation
98°C 10 s
68°C 30 s
72°C 30 s
Final elongation 72 °C 5 min
Cooling 4 °C for ever
The product was cleaned up with the Qiaquick PCR purification kit (Qiagen), eluting
in 50 µl EB. DNA concentration was measured with the Nanodrop instrument
(Peqlab).
QQuuaannttiittaattiivvee DDNNAA mmeetthhyyllaattiioonn aannaallyyssiiss wwiitthh tthhee
MMaassssAARRRRAAYY CCoommppaacctt SSyysstteemm
All reagents were purchased from Sequenom unless otherwise mentioned.
All centrifugation steps were carried out at 3000rpm unless otherwise mentioned.
Quantitative methylation analysis of the regions of interest was performed with the
MassARRAY Compact System (Sequenom). This method is based on matrix-
assisted laser desorption/ionization time-of-flight mass spectrometry (MALDI-TOF
MS) measurement of bisulphite converted DNA. Bisulphite treatment generates
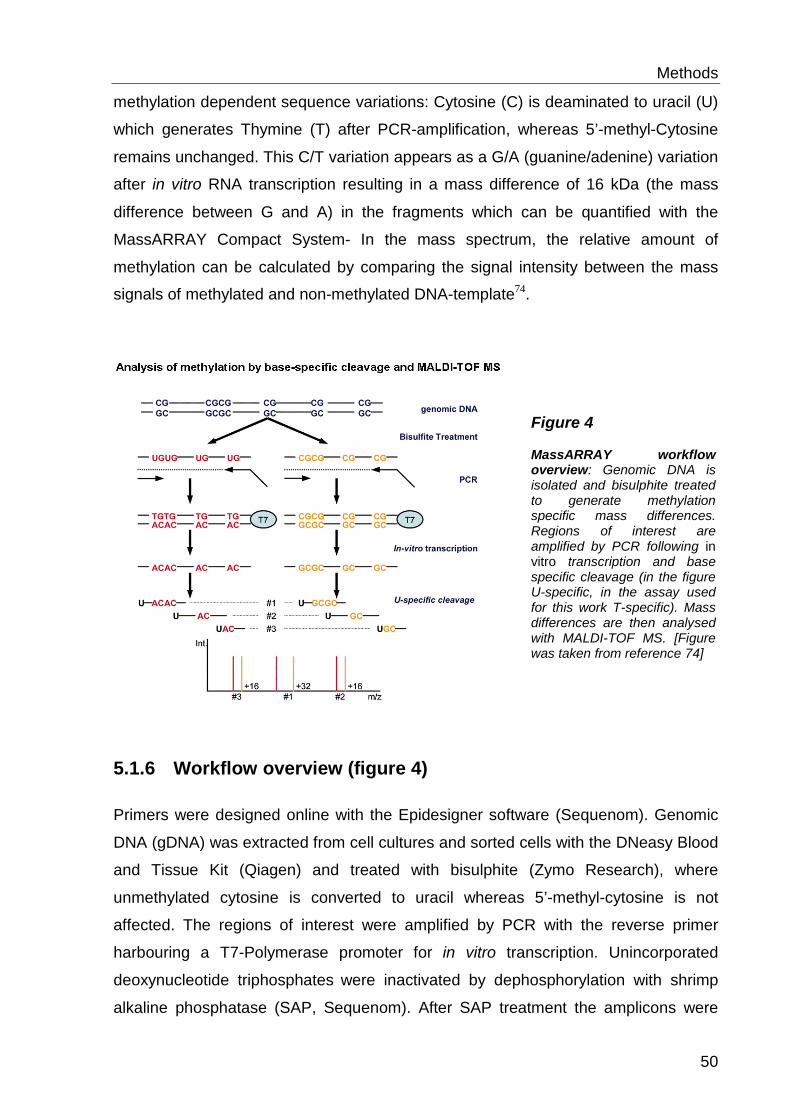
Methods
50
methylation dependent sequence variations: Cytosine (C) is deaminated to uracil (U)
which generates Thymine (T) after PCR-amplification, whereas 5’-methyl-Cytosine
remains unchanged. This C/T variation appears as a G/A (guanine/adenine) variation
after in vitro RNA transcription resulting in a mass difference of 16 kDa (the mass
difference between G and A) in the fragments which can be quantified with the
MassARRAY Compact System- In the mass spectrum, the relative amount of
methylation can be calculated by comparing the signal intensity between the mass
signals of methylated and non-methylated DNA-template74.
5.1.6 Workflow overview (figure 4)
Primers were designed online with the Epidesigner software (Sequenom). Genomic
DNA (gDNA) was extracted from cell cultures and sorted cells with the DNeasy Blood
and Tissue Kit (Qiagen) and treated with bisulphite (Zymo Research), where
unmethylated cytosine is converted to uracil whereas 5’-methyl-cytosine is not
affected. The regions of interest were amplified by PCR with the reverse primer
harbouring a T7-Polymerase promoter for in vitro transcription. Unincorporated
deoxynucleotide triphosphates were inactivated by dephosphorylation with shrimp
alkaline phosphatase (SAP, Sequenom). After SAP treatment the amplicons were
Figure 4 MassARRAY workflow overview: Genomic DNA is isolated and bisulphite treated to generate methylation specific mass differences. Regions of interest are amplified by PCR following in vitro transcription and base specific cleavage (in the figure U-specific, in the assay used for this work T-specific). Mass differences are then analysed with MALDI-TOF MS. [Figure was taken from reference 74]
Methods
51
transcribed in vitro into RNA with the T7-RNA Polymerase and “T”-specific cleavage
was achieved with RNaseA and modified cytosine triphosphate nucleotides to avoid
“C” cleavage. Water was added and reactions were desalted with 6 mg of cation
exchange resin (Sequenom). Finally reactions were spotted on a SpectroCHIP with
the Phusio Chip Module and measured with the MassARRAY Compact System (all
Sequenom).
5.1.7 Primer Design
The primers were designed to amplify fragments with the limited size of 200 to 600
base pairs, because bisulphite conversion fragments template DNA and therefore
limits PCR-amplification. Unlike methylation-specific primers these primers here bind
to both methylated and unmethylated template because the software excludes
regions with CpG dinucleotides for potential primer binding sites.
The reverse primer is tagged with a T7-promoter sequence and a short eight base
pair spacer sequence while the forward primer has a ten mere tag to balance primer
lengths.
5.1.8 Bisulphite treatment of gDNA
A common method for analyzing cytosine methylation is bisulphite conversion of
DNA followed by sequencing. Cytosine-derivates undergo reversible reactions with
bisulphite yielding a 5,6-Dihydro-6-sulfonate, which deaminates spontaneously. After
that the sulphate is eliminated under alkaline conditions, leaving Uracil.
5’-methyl Cytosine is not affected by this reaction and so unmethylated Cytosine
appears as a Uracil in the sequencing reaction whereas 5’-methyl Cytosine remains
cytosine. As already mentioned, in the following procedure this methylation specific
difference is not used for sequencing but for generating methylation depending mass
differences to be analysed by mass spectrometry.
All reagents in this section were obtained from the EZ DNA methylation kit (Zymo).
1 µg of gDNA was brought to a volume of 45 µl and was diluted with 5 µl M-Dilution
Buffer, mixed and incubated at 37°C for 15 minutes. After incubation 100 µl of CT
Methods
52
Conversion Reagent was added, lightly vortexed and incubated in the dark with the
following protocol:
Step 1: 95˚ C 30 seconds
Step 2: 50˚ C 15 minutes
Step 3: Repeat steps 1-2 for 20 cycles
Step 4: 4 ˚ C forever
Afterwards the samples were incubated on ice for 10 minutes, 400 µl of M-Binding
Buffer was added and the sample was loaded on a Zymo-Spin I Column placed in a
2 ml collection tube. DNA was bound by centrifuging at full speed for 15-30 seconds,
washed with 2µl M-Wash Buffer, centrifuged again for 15-30 seconds and then
treated with 200µl M-Desulphonation Buffer for 15 minutes at room temperature.
After incubation the column was centrifuged for 15-30 seconds, washed twice with
200 µl M-Wash Buffer centrifuging 30 seconds and 1 minute respectively at full
speed to remove wash buffer residues. To elute the DNA 100 µl water was added
directly to the centre of the column and centrifuged 30 seconds at 3000 rpm. The
procedure yields 100 µl of bisulphite converted DNA with a concentration of 7-8 ng/µl.
5.1.9 PCR amplification
Polymerase Chain Reaction (PCR) allows the specific amplification of DNA-
segments. A thermo stable DNA polymerase synthesizes the sister strand of a heat
denatured single stranded DNA-fragment when deoxynucleotide triphosphates are
added under appropriate conditions. The polymerisation reaction is “primed” with
small oligonucleotides that anneal to the template DNA strand through base pairing,
giving the reaction its specificity by defining the borders of the segment to be
amplified. The PCR-reactions were prepared with the following reagents according to
the manufacturer:
Reagent Volume for
single reaction
Final
concentration
ddH20 1.42 µl N/A 10X Hot StarBuffer 0.50 µl 1X
dNTP mix 25mM each 0.04 µl 200 µM
Methods
53
5U/µL Hot Star Taq 0.04 µl 0.2 unit/reaction DNA Template 1.00 µl 5-10 ng
To each reaction 2 µl primer mix was added with the concentration of 500 pm of the
forward and reverse primer. Then the plate was sealed with AB-0558, centrifuged
and incubated in a Veriti 384 well thermal cycler (Applied Biosystems) with the
following programme:
5.1.10 Shrimp Alkaline Phosphatase (SAP) Treatment
Unincorporated nucleotides can disturb downstream applications and are therefore
enzymatically inactivated. SAP removes under alkaline conditions phosphate groups
from several substrates including deoxynucleotide triphosphates, rendering it
unavailable for further polymerase catalyzed reactions.
The SAP solution was prepared as follows: RNAse free water 1.70 µl
SAP 0.30 µl
2 µl of the SAP solution was added to each PCR-reaction with the MassARRAY
Liquid Handler (Matrix). The plate was sealed with AB-0558, centrifuged and
incubated as follows on a Veriti 384 well thermal cycler (Applied Biosystems):
Step 1: 37˚ C 20 min
Step Temperature/ Time
Initial melting 94° C 4min
Melting
Annealing 45 cycles
Elongation
94°C 20 s
59°C 30 s
72°C 1min
Final elongation 72 °C 3 min
Cooling 4 °C for ever
Methods
54
Step 2: 85˚ C 5 min
Step 4: 4 ˚ C forever
5.1.11 In vitro transcription and RNaseA treatment
The PCR reaction is transcribed into RNA in vitro with the T7 RNA polymerase, which
is guided to the amplified PCR-products by the introduced T7 promoter tag in the
reverse primer. The transcribed RNA is enzymatically cleaved by RNaseA, cleaving
specifically after cytosine and thymine. T-specific cleavage is achieved by using
modified cytosine triphosphate nucleotides which are protect from RNaseA digestion
when incorporated in an RNA polymer. The RNase and T-cleavage mix was
prepared according to the manufacturer’s instruction:
Reagent Volume for
Single reaction
RNase free water 3.21 µl
5xT7 Polymerase Buffer 0.89 µl
Cleavage Mix (T mix) 0.22 µl
DTT (100mM) 0.22 µl
T7 R&DNA Polymerase (50U/µl) 0.40 µl
RNase A 0.06 µl
Total Volume 5.0 µ
5 µl of the mix and 2µl of the SAP treated PCR reaction were transferred into a new
386-well plate with the MassARRAY Liquid Handler (Matrix), sealed with AB-0558,
centrifuged and incubated on a Veriti 384 well thermocycler C (Applied Biosystems)
for three hours at 37°.
5.1.12 Resin
Because salt ions are co-vaporised when acquired during MALDI-TOF analysis and
therefore visible and irritating in the analysis of the mass-spectra, the reactions
needed to be desalted: 20 µl water was added to each reaction with the MassARRAY
Liquid Handler (Matrix) followed by the addition of 6 mg CLEAN resin per reaction,
rotating for 15 minutes.
Methods
55
5.1.13 Transfer on the SpectroCHIP and acquisition
The SpectroCHIP holds the matrix on which the sample probes are spotted and
consists of a crystallized acidic compound. When the analyte is spotted on the matrix
its solvent dissolves the matrix, and when the solvent evaporates the matrix re-
crystallizes with analyte-molecules spread enclosed in the crystals. The DNA
samples are transferred on a SpectroCHIP with the Phusio Chip Module and
analysed with the MassARRAY Compact System MALDI-TOF MS (all Sequenom).
The co-crystallized analyte is acquired with a laser while the matrix is predominantly
ionized, protecting the DNA from the disruptive laser beam. Eventually the charge is
transferred to the sample and charged ions are created which are accelerated in a
vacuum towards a detector that measures the particle’s time of flight.
5.1.14 Data processing
Acquired data was processed with the EpiTyper Analyzer software (version 1.0,
Sequenom). The MS is calibrated with a four point calibrant (Sequenom) with 1479,
3004, 5044.4 and 8486.6 kDa particles. Relative to this calibration the accelerated
analytes generate signal intensity (y-axis) versus mass (kDa, x-axis) plots. With the
sequence of every amplicon known, the software can virtually process the sequence
and predict the fragments from the in vitro transcription/RNase digestion and relocate
CpG units. If expected and incoming information match, the signal intensities of the
methylated and unmethylated DNA templates are compared and quantified.
MMiiccrrooaarrrraayy hhaannddlliinngg aanndd aannaallyyssiiss
5.1.15 Labelling reaction
Samples from MCIp (section 5.3) or ChIP after LM-PCR (section 5.5) were labelled
directly with Alexa Fluor 555–aha–dCTP and Alexa Fluor 647–aha–dCTP,
respectively, using the BioPrime Plus Array CGH Genomic Labeling System
Methods
56
(Invitrogen). The labelling reaction was carried out according to the manufacturer’s
manual.
5.1.16 Microarray hybridisation
The differently labelled gDNA fragments of two tissues were combined to a final
volume of 39 μl, supplemented with 25 μg Cot-1 DNA (Invitrogen), 26 μl of Agilent
blocking agent (10-fold) (Agilent Technologies, Böblingen, Germany), and 160 μl
Agilent hybridization buffer (2-fold) as supplied in the Agilent oligo aCGH
Hybridization Kit. The sample was heated to 95°C for 3 min, mixed, and
subsequently incubated at 37°C for 30 min and spun down afterward for 1 min.
Hybridization on custom ChIP-on-chip microarrays (Agilent) was then carried out at
65°C for 40 h using an Agilent SureHyb chamber and an Agilent hybridization oven.
Slides were washed in Wash I (6× SSPE, 0.005% N-lauroylsarcosine) at room
temperature for 5 min and in Wash II (0.06× SSPE) for additional 5 min. Afterward
slides were dried and incubated using acetonitrile for 30 s. Images were scanned
immediately and analyzed using a DNA microarray scanner (Agilent). Microarray
images were processed using Feature Extraction Software 8.5 (Agilent) using the
standard CGH protocol for samples from MCIp or chip-on-chip linear for ChIP
samples. Processed data was imported into Microsoft Office Excel 2007 for further
analysis. Graphical presentations of datasets were obtained using Spotfire Decision
Site Software 7.0 (Spotfire).
CCeellll ccuullttuurree aanndd TTrraannssffeeccttiioonn
5.1.17 Cell culture
Jurkat cells (humane T cell leukemia) were grown in 90 % 1640 RPMI plus 10 % fetal
bovine serum (FBS) supplied with 2.0g/l NaHCO3, 2mM L-Glutamine (Biochrome),
MEM Non-essential amino acids (Gibco), Sodium Pyruvate (Gibco), MEM Vitamines
(Gibco), 50U/ml Penicillin/Streptomycin (Gibco), 50nM 2-Mercaptoethanol (Gibco) in

Methods
57
an humified incubator at 37°C and 5 % CO2. Cells were passaged every two to three
days.
5.1.18 Transfection
All transfections and the endotoxin-free Midi preparations for one experiment were
carried out at the same day under the same conditions. Cells were passaged the day
before transfection and plated at 2.5 x 10⁵ cells/ml. With a doubling time of 25-35
hours the cells were at optimum density on the day of transfection (5 x 10⁵ cells/ml).
DEAE-Dextran (Pharmacia, Uppsala, Sweden) was dissolved with ddH2O at 10
mg/ml, sterile filtered and diluted with 1x TBS to a final concentration of 0.5 mg/ml.
Cells were harvested at 300g for 10 minutes, washed once with 1 x TBS and were
resuspended in 600 µl DEAE-Dextran dilution. 1 µg Plasmid DNA for 1 million cells
was used for each transfection, and 150 ng Renilla/transfection was co-transfected
as an internal control. The cells were rotated for 10 minutes, washed with 900 µl
RPMI/FBS at 300g for 10 minutes and the resuspended in 1 ml RPMI/FBS.
Transfections were plated in 6 well cell culture cluster (Corning) with an additional 1
ml growth media each and incubated in a humified incubator at 37 °C and 5 % CO2
for at least 24 hours.
5.1.19 Stimulation
To activate putative enhancers, cells were stimulated with 20 ng/ml PMA and 1 µM
Ionomycin 4 hours after transfection for 18-24 hours or for only 4 hours before
Luciferase Assay.
5.1.20 Luciferase Assay
Luciferase activity was tested with the Dual-Luciferase Reporter Assay System
(Promega). 24 hours after transfection cells were transferred to 14 ml polystyrene
round-bottom tubes (Falcon), centrifuged at 300g for 10 minutes, washed with 1x
PBS and centrifuged again at 300g for 10 minutes. After discarding the supernatant
100µl/1 x 106 cells was added, incubated for 10 minutes and after vortexing briefly
Methods
58
the lysate was transferred to 1.5 ml Eppendorf tubes. The lysate was cleared by
centrifugation at 13000 rpm for 30 seconds. Luciferase activity was measured on a
Sirius Photometer
Results
59
66 RReessuullttss
Summaries of MCIp-on-chip, ChIP-on-chip and MassARRAY data are presented in
figures 11, 13 and 15. All UCSC tracks will be available online in the supplementary
information upon publication of the results in a scientific journal.
CCoommppaarraattiivvee aannaallyyssiiss ooff DDNNAA mmeetthhyyllaattiioonn bbeettwweeeenn
rreegguullaattoorryy-- aanndd ccoonnvveennttiioonnaall TT--cceellllss
6.1.1 Preliminary work
As we intended to use tiling arrays for comparative methylation analysis, coverage of
the whole genome is possible but very expensive due to the amounts of arrays
needed. Hence, we tried to restrict the analysis to regions where genes showed
differences in their mRNA expression profile in Treg versus Tconv, as we thought
differences in methylation are likely to occur in such regions and might possess
regulatory functions. Gene expression analysis using microarrays of freshly sorted
cells (CD4+CD25+ and CD4+CD25-) as well as from in vitro expanded cultures
(CD4+CD25+RA+ and CD4+CD25-) identified several genes that were exclusively
expressed in Treg or Tconv, of which some had not been described so far. T-cells
from at least three different donors have been used. Array results obtained from
expanded cultures have been controlled with quantitative Reverse Transcriptase RT-
PCR for single genes. Based on the expression data a genome tiling array (Agilent
105k array) for MCIp-on-chip was designed to cover interesting loci +/- 50-100kb,
containing 69 regions with 124 genes (12 mega bases of the human genome).
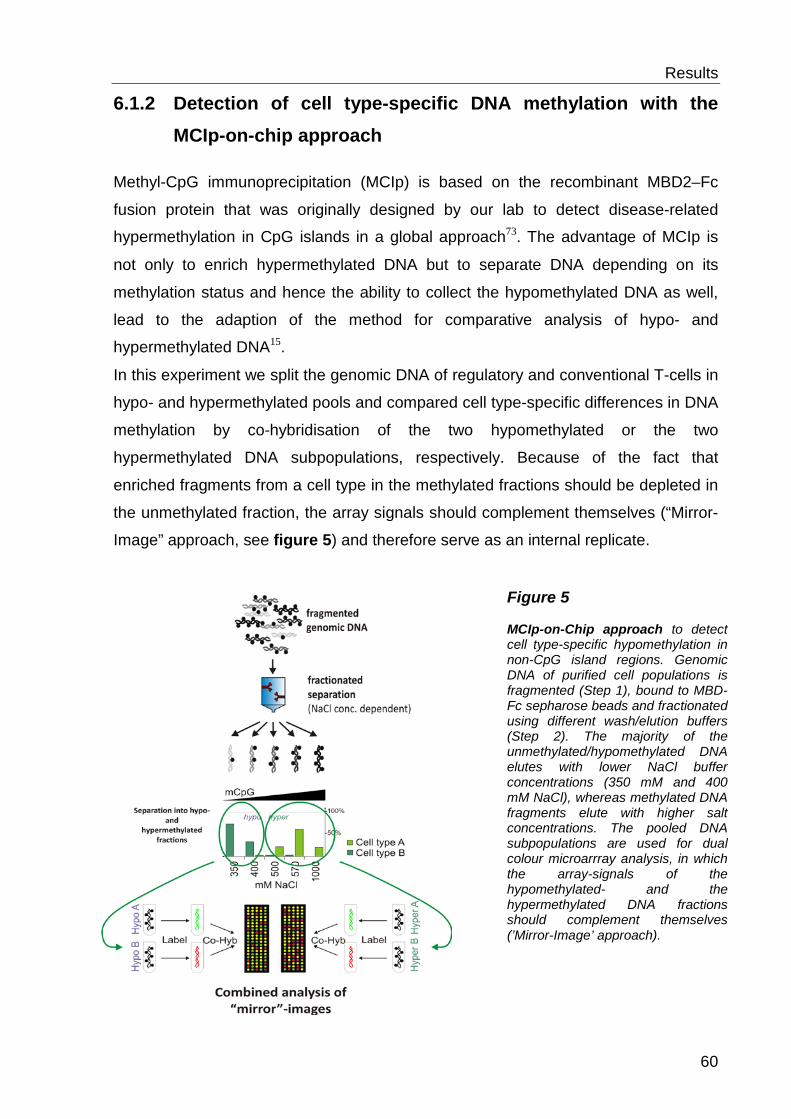
Results
60
6.1.2 Detection of cell type-specific DNA methylation with the MCIp-on-chip approach
Methyl-CpG immunoprecipitation (MCIp) is based on the recombinant MBD2–Fc
fusion protein that was originally designed by our lab to detect disease-related
hypermethylation in CpG islands in a global approach73. The advantage of MCIp is
not only to enrich hypermethylated DNA but to separate DNA depending on its
methylation status and hence the ability to collect the hypomethylated DNA as well,
lead to the adaption of the method for comparative analysis of hypo- and
hypermethylated DNA15.
In this experiment we split the genomic DNA of regulatory and conventional T-cells in
hypo- and hypermethylated pools and compared cell type-specific differences in DNA
methylation by co-hybridisation of the two hypomethylated or the two
hypermethylated DNA subpopulations, respectively. Because of the fact that
enriched fragments from a cell type in the methylated fractions should be depleted in
the unmethylated fraction, the array signals should complement themselves (“Mirror-
Image” approach, see figure 5) and therefore serve as an internal replicate.
Figure 5 MCIp-on-Chip approach to detect cell type-specific hypomethylation in non-CpG island regions. Genomic DNA of purified cell populations is fragmented (Step 1), bound to MBD-Fc sepharose beads and fractionated using different wash/elution buffers (Step 2). The majority of the unmethylated/hypomethylated DNA elutes with lower NaCl buffer concentrations (350 mM and 400 mM NaCl), whereas methylated DNA fragments elute with higher salt concentrations. The pooled DNA subpopulations are used for dual colour microarrray analysis, in which the array-signals of the hypomethylated- and the hypermethylated DNA fractions should complement themselves (’Mirror-Image’ approach).

Results
61
Treg and Tconv in vitro cultures were prepared and sorted by our cooperation
partners as previously described55, 65 (Petra Hoffmann and Matthias Edinger labs,
Department of Hematology and Oncology, University Hospital Regensburg,
Regensburg, Germany). Genomic DNA was prepared with the DNeasy blood and
tissue kit (Qiagen). Before proceeding with the MCIp-on-chip approach, Treg and
Tconv were tested with a small MCIp setup (300ng gDNA, described in section 5.3)
to verify the expected fractionation pattern of known genes to exclude methylation
abnormalities and confirm correct sorting. In addition it was important to test the
available MBD2-Fc lot for functionality. DNA precipitations in the different salt
fractions were quantified with real-time PCR with region-specific primers, and the
distribution of these fragments gave evidence about the methylation status of the
template DNA with methylated template eluting in the high salt fractions and vice
versa. The following genes were tested: The promoter of the SNRPN gene, a
maternally imprinted gene, gave rise to two elution peaks. The methylated and
unmethylated alleles of SNRPN are separated in both Treg and Tconv and elute in
the low salt fractions and high salt fractions, respectively. The region defined by the
Empty 6.2 primers (negative control) eluted in both cell types in the low salt fraction
of the precipitation due to the complete lack of any CpGs within a range of about
1000 basepairs around the region targeted by this specific primer pair. The third
region is located within the epigenetically controlled enhancer region in the first intron
of the FOXP3-locus described earlier69. The region is demethylated in Treg and
eluted in the low salt fractions; in contrary DNA from Tconv is known to be
hypermethylated at this location and therefore eluted in the high-salt fractions. Two
experiments from independent T-cell cultures (K#151 and K#152) were performed
(figure 6).
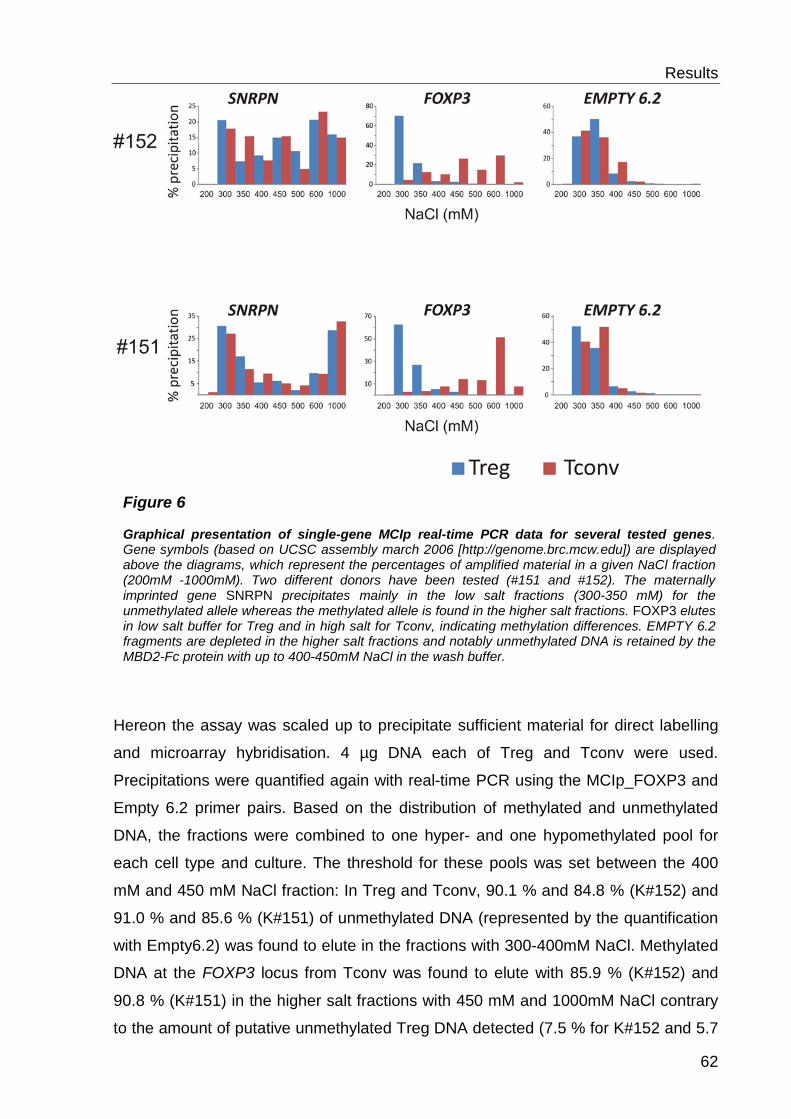
Results
62
Hereon the assay was scaled up to precipitate sufficient material for direct labelling
and microarray hybridisation. 4 µg DNA each of Treg and Tconv were used.
Precipitations were quantified again with real-time PCR using the MCIp_FOXP3 and
Empty 6.2 primer pairs. Based on the distribution of methylated and unmethylated
DNA, the fractions were combined to one hyper- and one hypomethylated pool for
each cell type and culture. The threshold for these pools was set between the 400
mM and 450 mM NaCl fraction: In Treg and Tconv, 90.1 % and 84.8 % (K#152) and
91.0 % and 85.6 % (K#151) of unmethylated DNA (represented by the quantification
with Empty6.2) was found to elute in the fractions with 300-400mM NaCl. Methylated
DNA at the FOXP3 locus from Tconv was found to elute with 85.9 % (K#152) and
90.8 % (K#151) in the higher salt fractions with 450 mM and 1000mM NaCl contrary
to the amount of putative unmethylated Treg DNA detected (7.5 % for K#152 and 5.7
Figure 6 Graphical presentation of single-gene MCIp real-time PCR data for several tested genes. Gene symbols (based on UCSC assembly march 2006 [http://genome.brc.mcw.edu]) are displayed above the diagrams, which represent the percentages of amplified material in a given NaCl fraction (200mM -1000mM). Two different donors have been tested (#151 and #152). The maternally imprinted gene SNRPN precipitates mainly in the low salt fractions (300-350 mM) for the unmethylated allele whereas the methylated allele is found in the higher salt fractions. FOXP3 elutes in low salt buffer for Treg and in high salt for Tconv, indicating methylation differences. EMPTY 6.2 fragments are depleted in the higher salt fractions and notably unmethylated DNA is retained by the MBD2-Fc protein with up to 400-450mM NaCl in the wash buffer.
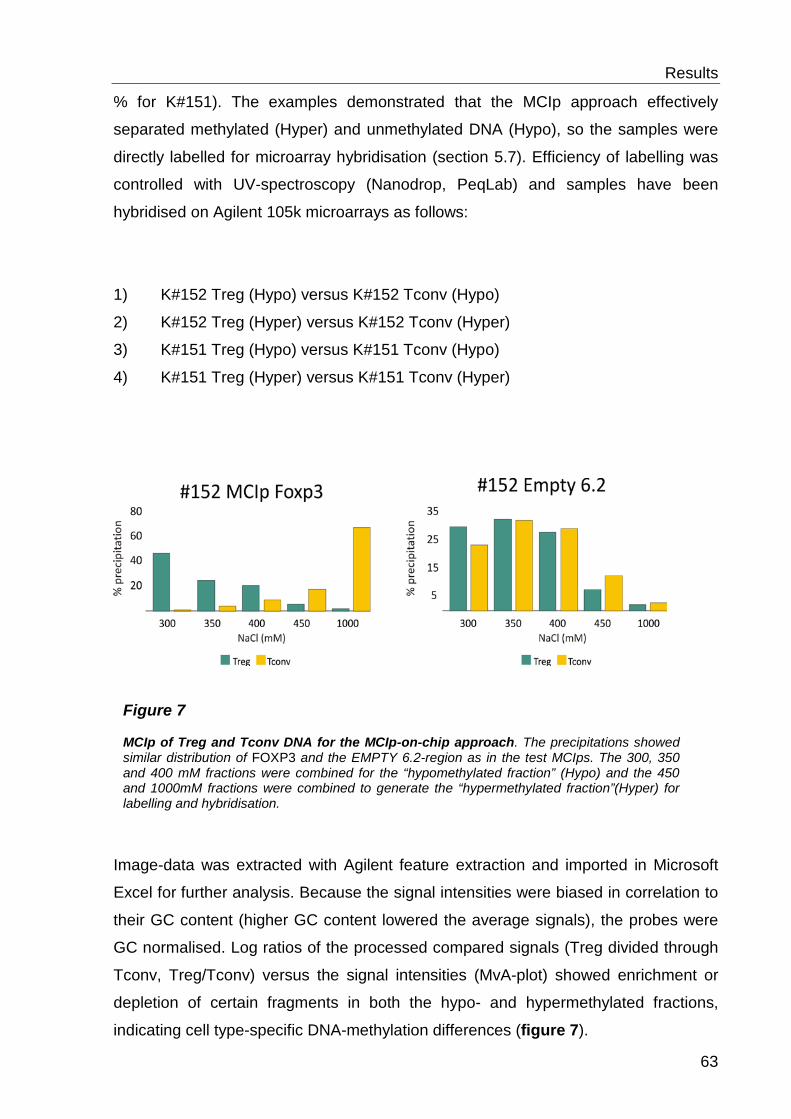
Results
63
Figure 7 MCIp of Treg and Tconv DNA for the MCIp-on-chip approach. The precipitations showed similar distribution of FOXP3 and the EMPTY 6.2-region as in the test MCIps. The 300, 350 and 400 mM fractions were combined for the “hypomethylated fraction” (Hypo) and the 450 and 1000mM fractions were combined to generate the “hypermethylated fraction”(Hyper) for labelling and hybridisation.
% for K#151). The examples demonstrated that the MCIp approach effectively
separated methylated (Hyper) and unmethylated DNA (Hypo), so the samples were
directly labelled for microarray hybridisation (section 5.7). Efficiency of labelling was
controlled with UV-spectroscopy (Nanodrop, PeqLab) and samples have been
hybridised on Agilent 105k microarrays as follows:
1) K#152 Treg (Hypo) versus K#152 Tconv (Hypo)
2) K#152 Treg (Hyper) versus K#152 Tconv (Hyper)
3) K#151 Treg (Hypo) versus K#151 Tconv (Hypo)
4) K#151 Treg (Hyper) versus K#151 Tconv (Hyper)
Image-data was extracted with Agilent feature extraction and imported in Microsoft
Excel for further analysis. Because the signal intensities were biased in correlation to
their GC content (higher GC content lowered the average signals), the probes were
GC normalised. Log ratios of the processed compared signals (Treg divided through
Tconv, Treg/Tconv) versus the signal intensities (MvA-plot) showed enrichment or
depletion of certain fragments in both the hypo- and hypermethylated fractions,
indicating cell type-specific DNA-methylation differences (figure 7).
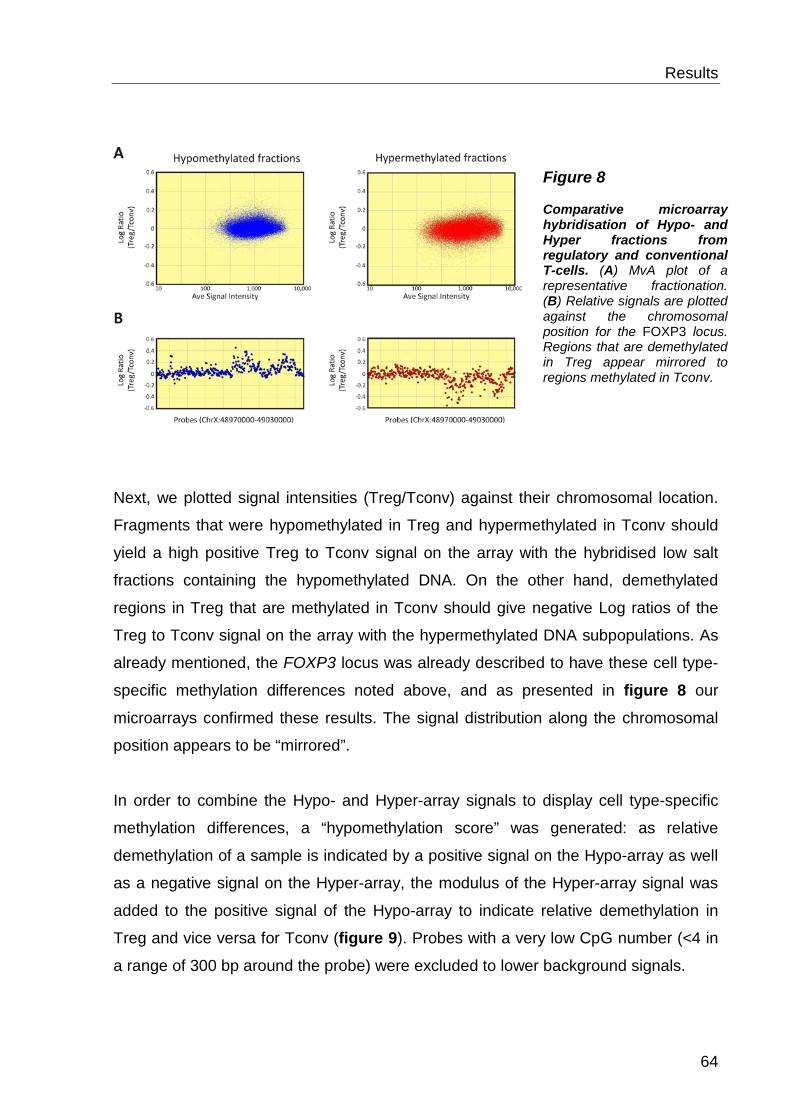
Results
64
Figure 8 Comparative microarray hybridisation of Hypo- and Hyper fractions from regulatory and conventional T-cells. (A) MvA plot of a representative fractionation. (B) Relative signals are plotted against the chromosomal position for the FOXP3 locus. Regions that are demethylated in Treg appear mirrored to regions methylated in Tconv.
Next, we plotted signal intensities (Treg/Tconv) against their chromosomal location.
Fragments that were hypomethylated in Treg and hypermethylated in Tconv should
yield a high positive Treg to Tconv signal on the array with the hybridised low salt
fractions containing the hypomethylated DNA. On the other hand, demethylated
regions in Treg that are methylated in Tconv should give negative Log ratios of the
Treg to Tconv signal on the array with the hypermethylated DNA subpopulations. As
already mentioned, the FOXP3 locus was already described to have these cell type-
specific methylation differences noted above, and as presented in figure 8 our
microarrays confirmed these results. The signal distribution along the chromosomal
position appears to be “mirrored”.
In order to combine the Hypo- and Hyper-array signals to display cell type-specific
methylation differences, a “hypomethylation score” was generated: as relative
demethylation of a sample is indicated by a positive signal on the Hypo-array as well
as a negative signal on the Hyper-array, the modulus of the Hyper-array signal was
added to the positive signal of the Hypo-array to indicate relative demethylation in
Treg and vice versa for Tconv (figure 9). Probes with a very low CpG number (<4 in
a range of 300 bp around the probe) were excluded to lower background signals.
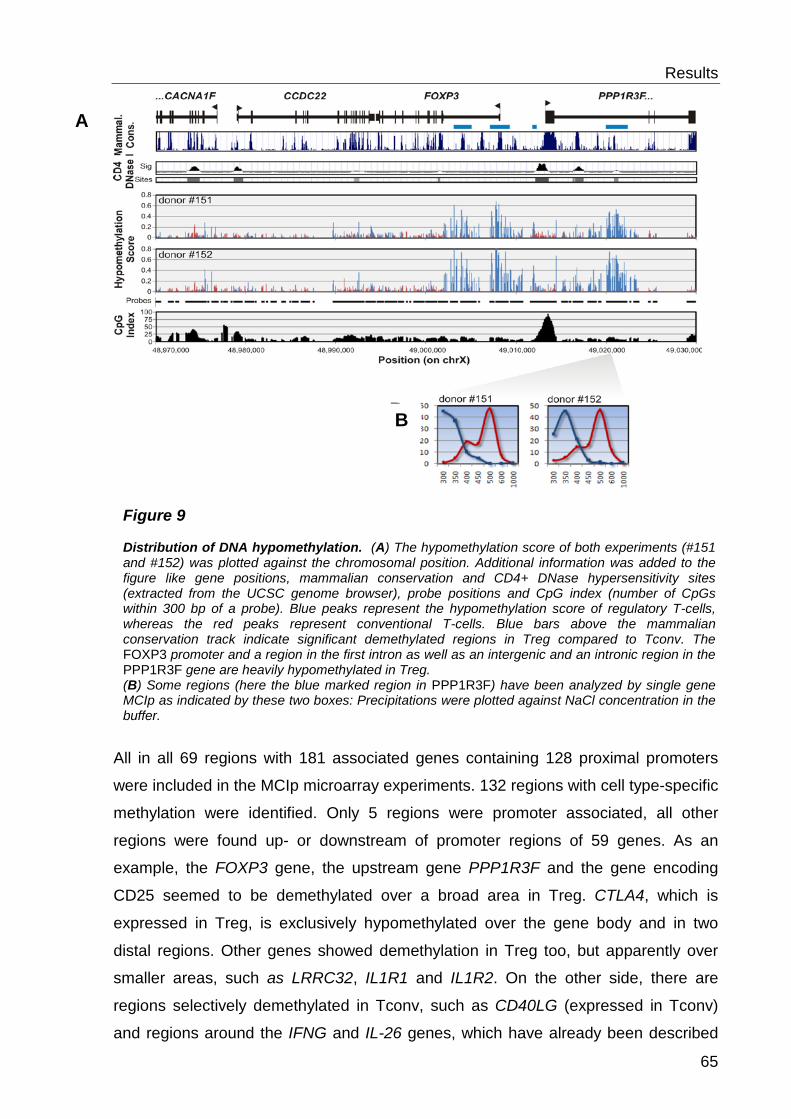
Results
65
All in all 69 regions with 181 associated genes containing 128 proximal promoters
were included in the MCIp microarray experiments. 132 regions with cell type-specific
methylation were identified. Only 5 regions were promoter associated, all other
regions were found up- or downstream of promoter regions of 59 genes. As an
example, the FOXP3 gene, the upstream gene PPP1R3F and the gene encoding
CD25 seemed to be demethylated over a broad area in Treg. CTLA4, which is
expressed in Treg, is exclusively hypomethylated over the gene body and in two
distal regions. Other genes showed demethylation in Treg too, but apparently over
smaller areas, such as LRRC32, IL1R1 and IL1R2. On the other side, there are
regions selectively demethylated in Tconv, such as CD40LG (expressed in Tconv)
and regions around the IFNG and IL-26 genes, which have already been described
Figure 9 Distribution of DNA hypomethylation. (A) The hypomethylation score of both experiments (#151 and #152) was plotted against the chromosomal position. Additional information was added to the figure like gene positions, mammalian conservation and CD4+ DNase hypersensitivity sites (extracted from the UCSC genome browser), probe positions and CpG index (number of CpGs within 300 bp of a probe). Blue peaks represent the hypomethylation score of regulatory T-cells, whereas the red peaks represent conventional T-cells. Blue bars above the mammalian conservation track indicate significant demethylated regions in Treg compared to Tconv. The FOXP3 promoter and a region in the first intron as well as an intergenic and an intronic region in the PPP1R3F gene are heavily hypomethylated in Treg. (B) Some regions (here the blue marked region in PPP1R3F) have been analyzed by single gene MCIp as indicated by these two boxes: Precipitations were plotted against NaCl concentration in the buffer.
B
A
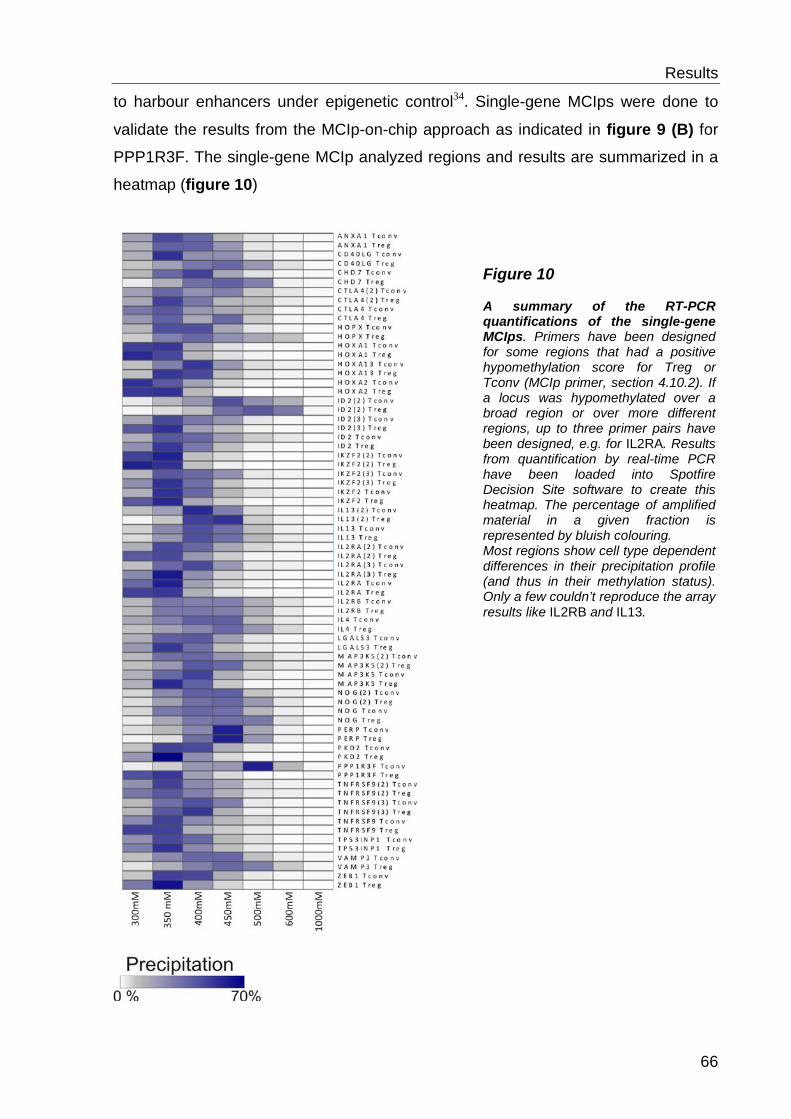
Results
66
to harbour enhancers under epigenetic control34. Single-gene MCIps were done to
validate the results from the MCIp-on-chip approach as indicated in figure 9 (B) for
PPP1R3F. The single-gene MCIp analyzed regions and results are summarized in a
heatmap (figure 10)
Figure 10 A summary of the RT-PCR quantifications of the single-gene MCIps. Primers have been designed for some regions that had a positive hypomethylation score for Treg or Tconv (MCIp primer, section 4.10.2). If a locus was hypomethylated over a broad region or over more different regions, up to three primer pairs have been designed, e.g. for IL2RA. Results from quantification by real-time PCR have been loaded into Spotfire Decision Site software to create this heatmap. The percentage of amplified material in a given fraction is represented by bluish colouring. Most regions show cell type dependent differences in their precipitation profile (and thus in their methylation status). Only a few couldn’t reproduce the array results like IL2RB and IL13.
Results
67
6.1.3 Quantitative methylation analysis with the MassARRAY compact system
Regions of interest were validated with an independent method to prove reliability of
the MCIp-on-chip experiments. MassARRAY primer sequences are listed in section
4.10.1. Once functional primers have been designed, high-throughput methylation
analysis is possible for different samples. So not only sorted and in vitro expanded
regulatory and conventional T-cells have been analyzed to validate the microarray
results, but also haematopoietic progenitors (CD34+), B cells (CD19+), monocytes
(CD14+), natural killer cells (CD56+), cytotoxic T-cells (CD8+) and Jurkat T-cells
(human T-cell leukaemia) to get more information about the flexibility and distribution
of DNA methylation around these loci in other haematopoietic cells. DNA with
different grades of methylation (0%, 33%, 66% and 100% methylation, generated by
mixing SssI-methylated DNA and unmethylated DNA produced with the RepliG
amplification kit in the appropriate ratios) was analyzed to test if the procedure yields
reliable and accurate results in the data analysis. CpGs that showed high deviation
from the expected methylation levels of the test template were excluded from
analysis.
6.1.4 Correlation to MCIp-on-chip results
94 primer pairs were designed to validate DNA methylation state of 31 regions which
were found to be cell type-specific methylated in the MCIp-on-chip experiment.
Analysis with the MassARRAY system proved that 26 out of 31 (84%) DMR from the
MCIp approach were validated to show cell type-specific methylation differences.
The MCIp-on-chip experiment yielded reliable data. Several DMRs have been found
and data is summarized with additional information in figures 11, 13 and 15 for the
FOXP3, CTLA4 and IFNG loci). Some DMR are restricted to 1-2kb, others over broad
regions. Interestingly these DMR mainly appear at intergenic regions with a high
grade of conservation, and some of these regions already have been described as
functional cell type-specific enhancer in humans or mice (IFNG/Il-2634and Foxp375).
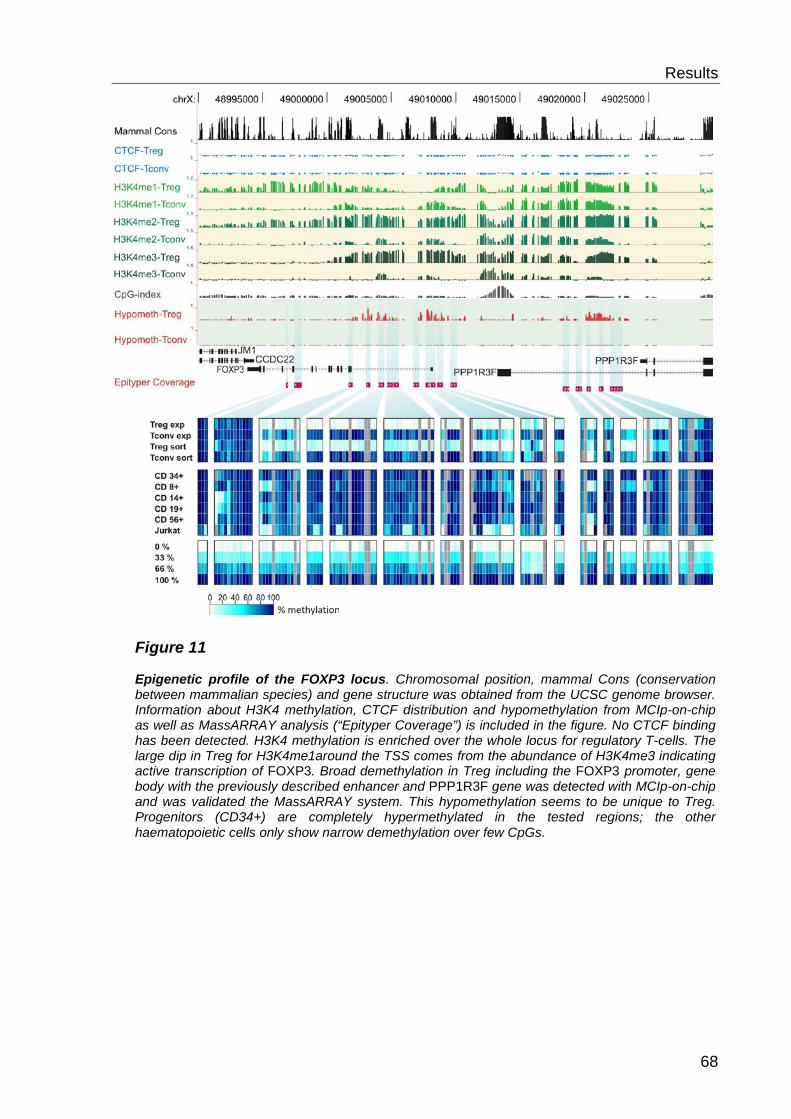
Results
68
Figure 11 Epigenetic profile of the FOXP3 locus. Chromosomal position, mammal Cons (conservation between mammalian species) and gene structure was obtained from the UCSC genome browser. Information about H3K4 methylation, CTCF distribution and hypomethylation from MCIp-on-chip as well as MassARRAY analysis (“Epityper Coverage”) is included in the figure. No CTCF binding has been detected. H3K4 methylation is enriched over the whole locus for regulatory T-cells. The large dip in Treg for H3K4me1around the TSS comes from the abundance of H3K4me3 indicating active transcription of FOXP3. Broad demethylation in Treg including the FOXP3 promoter, gene body with the previously described enhancer and PPP1R3F gene was detected with MCIp-on-chip and was validated the MassARRAY system. This hypomethylation seems to be unique to Treg. Progenitors (CD34+) are completely hypermethylated in the tested regions; the other haematopoietic cells only show narrow demethylation over few CpGs.
Results
69
AAnnaallyyssiiss ooff hhiissttoonnee mmooddiiffiiccaattiioonnss aanndd CCTTCCFF
For further characterisation of the 69 loci ChIP followed by microarray hybridisation
(ChIP-on-chip, with the previously used Treg array for MCIp-on-chip) have been
performed. Data was extracted with Agilent Feature Extraction software, imported in
Microsoft Excel for GC normalisation, mapped to the human genome assembly
(march 2006) and converted in a “wiggle” track for integration into the UCSC genome
browser (http://genome.brc.mcw.edu/, figures 11, 13 and 15).
6.1.5 CTCF distribution
The CCCTC binding factor can block enhancer promoter interaction20. It also is
known to insulate functional chromatin areas and is also called a “boundary
element/protein”31. Because CTCF binds in a methylation sensitive way, its
positioning could influence gene expression. Remarkably there were no differences
in CTCF binding sites in Treg and Tconv, as well as there were no differences in
signal intensities for positive binding in both cells. We have gathered information
about only one “active chromatin” mark (H3K4 methylation) and more information
especially about the distribution of repressive histone modifications would be
essential to characterize CTCF positioning in its chromatin environment. However,
CTCF showed no preferential positioning at the borders of H3K4 methylation.
6.1.6 Histone 3 Lysine 4 methylation- distribution
H3K4me1 was described as a mark for open chromatin and it has been shown that it
is the most abundant modification for Lysine 4. It is found at transcribed genes (with
depletion around the TSS due to nucleosome loss directly at the TSS and H3K4met3
abundance at promoters of with actively transcribed genes), often covering the whole
gene and distal and proximal regions. Our experiments confirm these findings.
H3K4me1 is found at nearly all analyzed loci and is enriched at open chromatin
regions of expressed genes found in the gene expression array, as shown for FOXP3
in Treg (figure 11). In contrast Tconv are depleted in H3K4met1 at this gene.
H3K4met1 is also found at smaller spots in intergenic regions (H3K4met1 islands).
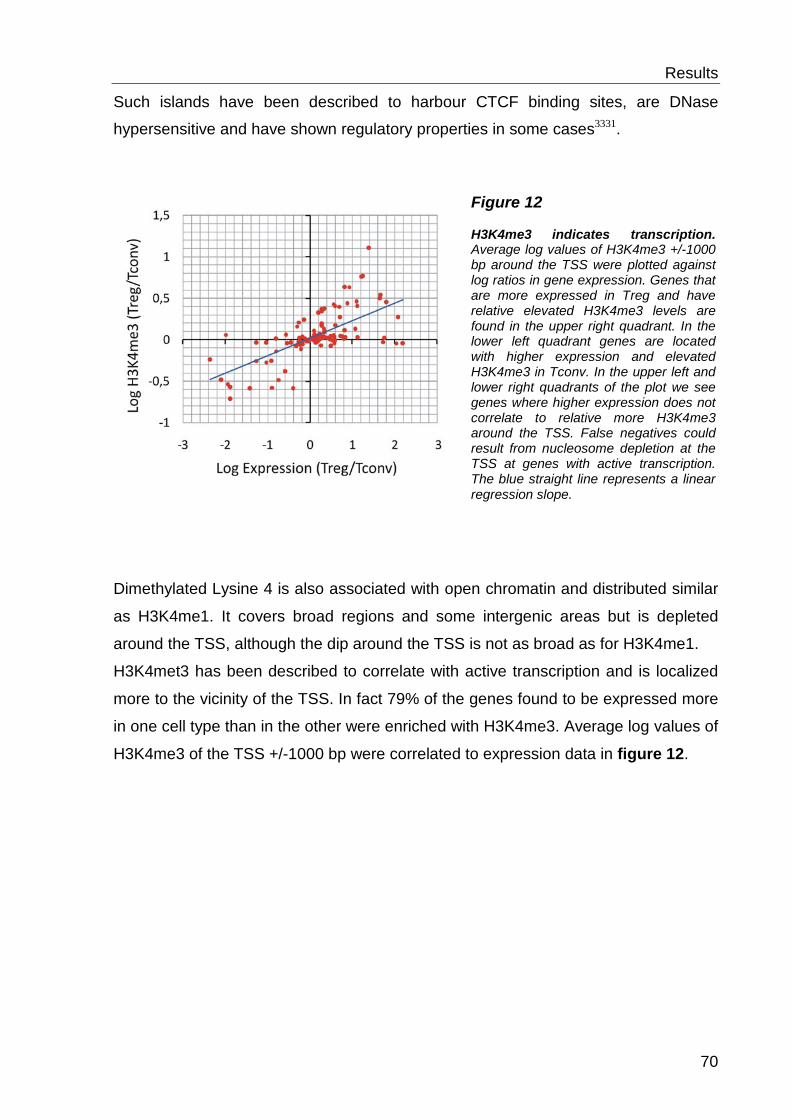
Results
70
Such islands have been described to harbour CTCF binding sites, are DNase
hypersensitive and have shown regulatory properties in some cases3331.
Dimethylated Lysine 4 is also associated with open chromatin and distributed similar
as H3K4me1. It covers broad regions and some intergenic areas but is depleted
around the TSS, although the dip around the TSS is not as broad as for H3K4me1.
H3K4met3 has been described to correlate with active transcription and is localized
more to the vicinity of the TSS. In fact 79% of the genes found to be expressed more
in one cell type than in the other were enriched with H3K4me3. Average log values of
H3K4me3 of the TSS +/-1000 bp were correlated to expression data in figure 12.
Figure 12 H3K4me3 indicates transcription. Average log values of H3K4me3 +/-1000 bp around the TSS were plotted against log ratios in gene expression. Genes that are more expressed in Treg and have relative elevated H3K4me3 levels are found in the upper right quadrant. In the lower left quadrant genes are located with higher expression and elevated H3K4me3 in Tconv. In the upper left and lower right quadrants of the plot we see genes where higher expression does not correlate to relative more H3K4me3 around the TSS. False negatives could result from nucleosome depletion at the TSS at genes with active transcription. The blue straight line represents a linear regression slope.
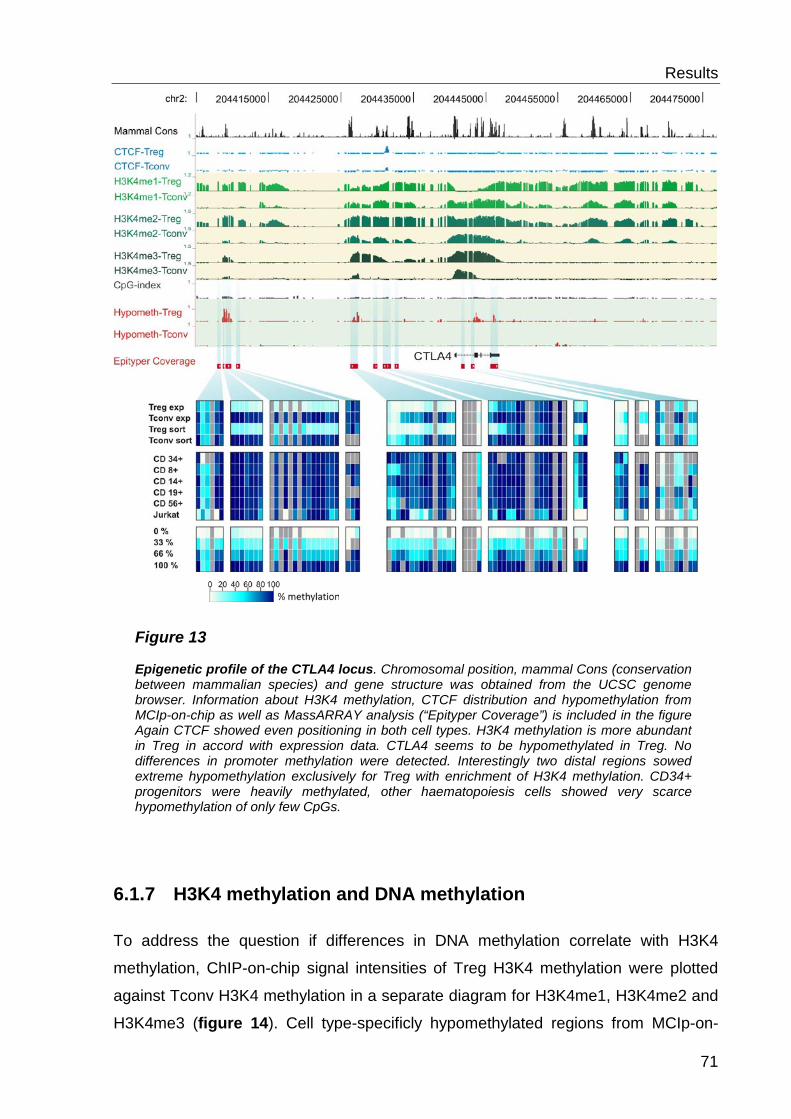
Results
71
6.1.7 H3K4 methylation and DNA methylation
To address the question if differences in DNA methylation correlate with H3K4
methylation, ChIP-on-chip signal intensities of Treg H3K4 methylation were plotted
against Tconv H3K4 methylation in a separate diagram for H3K4me1, H3K4me2 and
H3K4me3 (figure 14). Cell type-specificly hypomethylated regions from MCIp-on-
Figure 13 Epigenetic profile of the CTLA4 locus. Chromosomal position, mammal Cons (conservation between mammalian species) and gene structure was obtained from the UCSC genome browser. Information about H3K4 methylation, CTCF distribution and hypomethylation from MCIp-on-chip as well as MassARRAY analysis (“Epityper Coverage”) is included in the figure Again CTCF showed even positioning in both cell types. H3K4 methylation is more abundant in Treg in accord with expression data. CTLA4 seems to be hypomethylated in Treg. No differences in promoter methylation were detected. Interestingly two distal regions sowed extreme hypomethylation exclusively for Treg with enrichment of H3K4 methylation. CD34+ progenitors were heavily methylated, other haematopoiesis cells showed very scarce hypomethylation of only few CpGs.
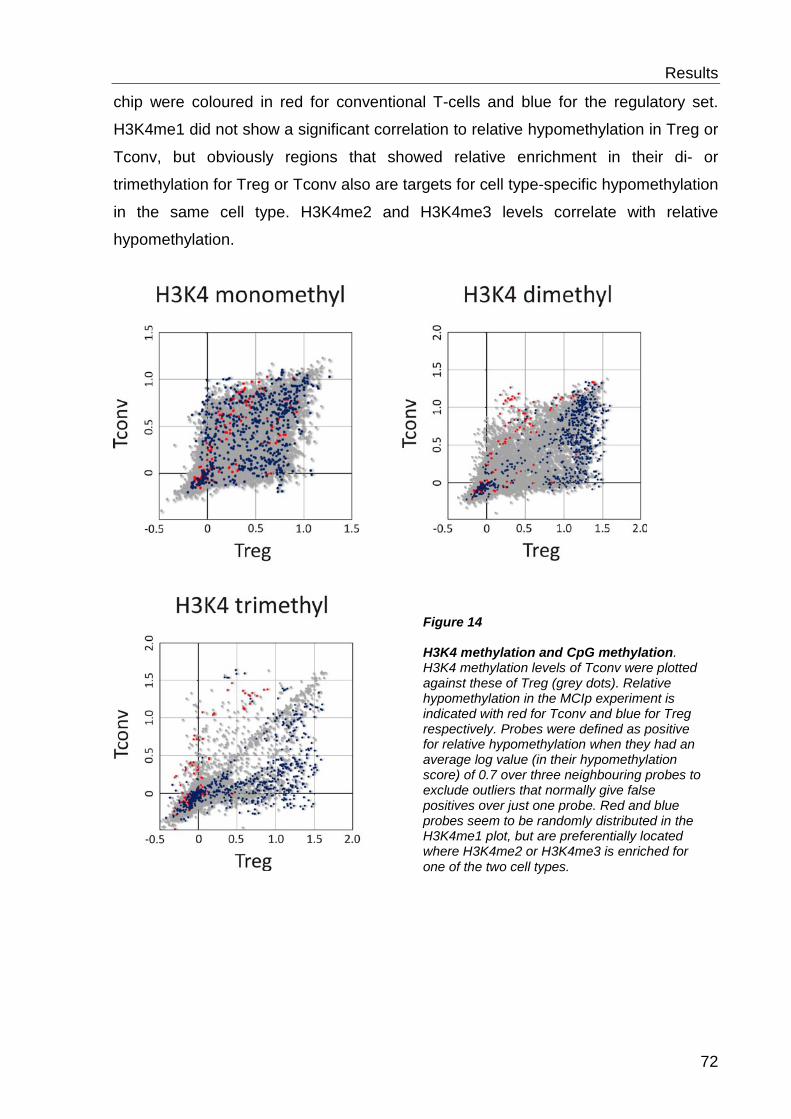
Results
72
chip were coloured in red for conventional T-cells and blue for the regulatory set.
H3K4me1 did not show a significant correlation to relative hypomethylation in Treg or
Tconv, but obviously regions that showed relative enrichment in their di- or
trimethylation for Treg or Tconv also are targets for cell type-specific hypomethylation
in the same cell type. H3K4me2 and H3K4me3 levels correlate with relative
hypomethylation.
Figure 14 H3K4 methylation and CpG methylation. H3K4 methylation levels of Tconv were plotted against these of Treg (grey dots). Relative hypomethylation in the MCIp experiment is indicated with red for Tconv and blue for Treg respectively. Probes were defined as positive for relative hypomethylation when they had an average log value (in their hypomethylation score) of 0.7 over three neighbouring probes to exclude outliers that normally give false positives over just one probe. Red and blue probes seem to be randomly distributed in the H3K4me1 plot, but are preferentially located where H3K4me2 or H3K4me3 is enriched for one of the two cell types.
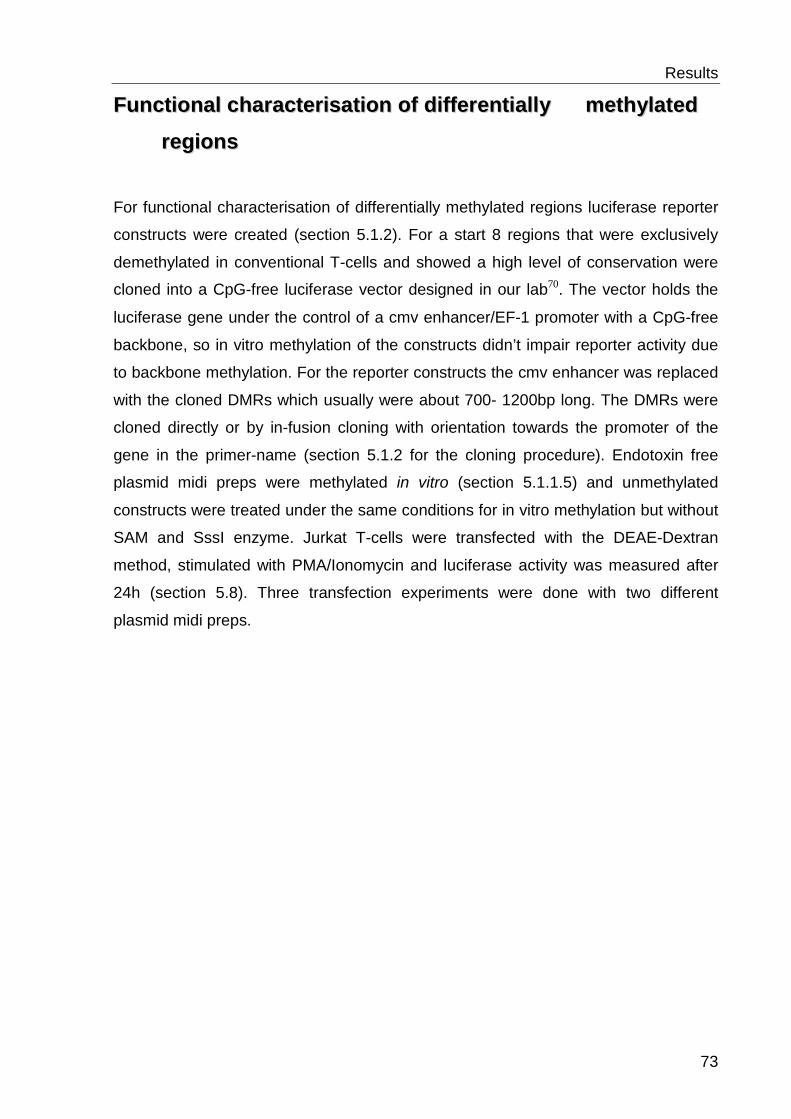
Results
73
FFuunnccttiioonnaall cchhaarraacctteerriissaattiioonn ooff ddiiffffeerreennttiiaallllyy mmeetthhyyllaatteedd
rreeggiioonnss
For functional characterisation of differentially methylated regions luciferase reporter
constructs were created (section 5.1.2). For a start 8 regions that were exclusively
demethylated in conventional T-cells and showed a high level of conservation were
cloned into a CpG-free luciferase vector designed in our lab70. The vector holds the
luciferase gene under the control of a cmv enhancer/EF-1 promoter with a CpG-free
backbone, so in vitro methylation of the constructs didn’t impair reporter activity due
to backbone methylation. For the reporter constructs the cmv enhancer was replaced
with the cloned DMRs which usually were about 700- 1200bp long. The DMRs were
cloned directly or by in-fusion cloning with orientation towards the promoter of the
gene in the primer-name (section 5.1.2 for the cloning procedure). Endotoxin free
plasmid midi preps were methylated in vitro (section 5.1.1.5) and unmethylated
constructs were treated under the same conditions for in vitro methylation but without
SAM and SssI enzyme. Jurkat T-cells were transfected with the DEAE-Dextran
method, stimulated with PMA/Ionomycin and luciferase activity was measured after
24h (section 5.8). Three transfection experiments were done with two different
plasmid midi preps.
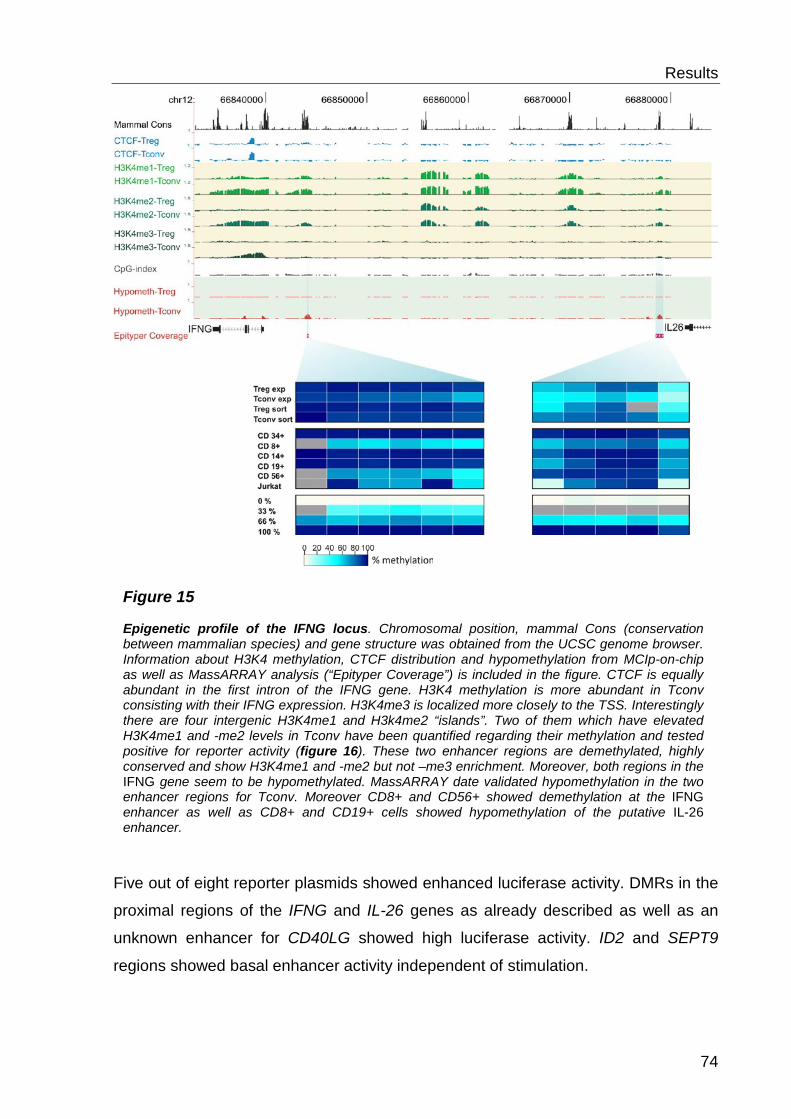
Results
74
Five out of eight reporter plasmids showed enhanced luciferase activity. DMRs in the
proximal regions of the IFNG and IL-26 genes as already described as well as an
unknown enhancer for CD40LG showed high luciferase activity. ID2 and SEPT9
regions showed basal enhancer activity independent of stimulation.
Figure 15 Epigenetic profile of the IFNG locus. Chromosomal position, mammal Cons (conservation between mammalian species) and gene structure was obtained from the UCSC genome browser. Information about H3K4 methylation, CTCF distribution and hypomethylation from MCIp-on-chip as well as MassARRAY analysis (“Epityper Coverage”) is included in the figure. CTCF is equally abundant in the first intron of the IFNG gene. H3K4 methylation is more abundant in Tconv consisting with their IFNG expression. H3K4me3 is localized more closely to the TSS. Interestingly there are four intergenic H3K4me1 and H3k4me2 “islands”. Two of them which have elevated H3K4me1 and -me2 levels in Tconv have been quantified regarding their methylation and tested positive for reporter activity (figure 16). These two enhancer regions are demethylated, highly conserved and show H3K4me1 and -me2 but not –me3 enrichment. Moreover, both regions in the IFNG gene seem to be hypomethylated. MassARRAY date validated hypomethylation in the two enhancer regions for Tconv. Moreover CD8+ and CD56+ showed demethylation at the IFNG enhancer as well as CD8+ and CD19+ cells showed hypomethylation of the putative IL-26 enhancer.
Results
75
Interestingly nearly all reporter plasmids lost their enhancer function due to in vitro
methylation and were down regulated to the basal Luciferase expression level of the
“empty” construct with only the EF-1 promoter (without the cmv enhancer). Only
SEPT9 retained some of its enhancer activity after methylation. The results of the 5
putative enhancers are summarized in figure 16.
Figure 16 Luciferase reporter assays of DMR. The diagram represents fold change of Luciferase expression of DMR constructs compared to the control plasmid with only the EF1 promoter of methylated and unmethylated plasmids (indicated with filled pins and white empty pinheads after the cloned fragment name in the figure). CD40LG, IL26 and IFNG transfected cells were stimulated with PMA/Ionomycin, SEPT9 and ID2 transfections were not stimulated as it did not enhance reporter activity. All reporter plasmid lost Luciferase activity upon methylation; most of them went down to the level of the control plasmid activity.
Discussion
76
77 DDiissccuussssiioonn
TThhee MMCCIIpp--oonn--cchhiipp aapppprrooaacchh
Notwithstanding methods for methylation analysis have improved over the last years,
they all have their deficits. The standard method — bisulphite conversion followed by
Sanger sequencing of cloned fragments — yields methylation analysis at single base
resolution, but is too expensive and too labour intensive for large scale or genome
wide studies. Sequencing by synthesis like Solexa- or 454-sequencing is relatively
fast and cheap, but still resource intensive and not suitable for focussed analysis as
sequencing can’t be restricted to distinct regions. With microarray based techniques,
one is free to choose the genomic region to be covered because custom designed
tiling arrays or pre-designed arrays for different needs are commercially available, but
receives data with only moderate resolution. Regardless of the chosen method the
crucial step for a successful experiment is the sample pre-treatment. With methylated
DNA immunoprecipitation (MeDIP, uses a monoclonal antibody for 5mC for
precipitation) and MBD affinity purification (MAP, using the MBD domain for
precipitation of methylated DNA) for enrichment of methylated DNA and CXXC
affinity purification (CAP, using the affinity of a CXXC domain to bind to unmethylated
DNA, with X being any residue) for enrichment of unmethylated DNA, these affinity
DNA purification methods all need a high CpG density and are insensitive to regions
with low CpG content11. Methylation-sensitive restriction enzyme methods enrich
fragment due to digestion of methylated or unmethylated DNA followed by size
fractionation76. Again, the restriction enzyme based enrichment methods lack
sensitivity and do not cover all CpGs due to their dependence of restriction sites11.
With the MCIp-on-chip approach we successfully fractionated DNA in methylated and
unmethylated pools without sample loss like in MAP. Moreover, our approach is
sensitive enough to precipitate not only regions with high CpG density because
virtually all detected cell type-specific methylation differences were non CGI regions
with low or sometimes intermediate CpG frequency. To overcome resolution
restrictions of a microarray-platform, we quantified methylation levels at single CpG
Discussion
77
resolution for some interesting regions with the bisulphite based MassARRAY system
to validate data gained from MCIp-on-chip on the one hand and to set up an assay to
analyze these CpGs in high-throughput manner for other templates on the other hand
(discussed in the outlook, section 7.4). As the correlation to the MassARRAY results
is good, MCIp-on-chip seems to be a reliable method for locus-wide comparative
methylation analysis. With the pre-selection of differentially expressed genes and the
downstream high-throughput analysis of selected CpGs, this work systematically
“encircled” the interesting genes and yielded new insights in function and distribution
of DNA methylation in a very economic way compared to whole genome analysis.
FFuunnccttiioonn ooff cceellll ttyyppee--ssppeecciiffiicc DDNNAA mmeetthhyyllaattiioonn
So far, nearly all studies on functional methylation analysis concentrated on
promoters or on very limited distal regions. Although it has been shown, that
hypermethylation at promoters which results in silencing of tumour suppressor genes
seems to be a common, nonrandom, and tumour type-specific event10, most of
aberrantly methylated genes in cancer cells showed no differences in expression
towards their healthy counterparts73. Recently it has been demonstrated, that CpG
island promoters are preferentially unmethylated independent of their expression
state and that low density CpG promoters (LCP) are mainly methylated without
precluding gene expression7713. Analysis of embryonic-stem-cell-derived and primary
cells reveals that 'weak' CpG islands associated with a specific set of
developmentally regulated genes undergo aberrant hypermethylation during
extended proliferation in vitro33. Contrary to the suggestion that especially LCP
associated genes are not influenced in their expression by DNA methylation a study
showed that tissue-specific DNA hypomethylation correlates significantly with tissue-
specific transcription, not only at CGI genes15. Work on differentiation of neuronal
cells observed that several hundred promoters, including pluripotency and germline-
specific genes, become DNA methylated in lineage-committed progenitor cells, but
only minimal DNA methylation changes occur during terminal differentiation14. That
suggests a role for DNA methylation in gene regulation of only a few genes or
specific events like loss of pluripotency or germ-line specific gene silencing. Work on
ES cells demonstrated that expression of genes with associated CGIs is better
Discussion
78
described by histone marks, as housekeeping genes are enriched with the
transcription initiation mark H3K4me3 ('univalent') and are generally highly
expressed, whereas those at developmental genes are enriched with both H3K4me3
and the repressive mark H3K27me3 ('bivalent') and are generally silent33. A study on
the human Major Histocompatibility Complex (MHC) region also proposed a model in
which the DNA methylation profile of the upstream region of the gene is an
informative indicator of the expression of the cognate gene, specifically, in which
hypermethylation within the upstream region is associated with transcriptional
silencing78. Taken together it seems that the role of DNA methylation at promoters is
dependent of the promoter architecture (sequence, CpG density, associated histone
marks) and its associated gene (germ-line, tissue-specific, etc.). It seems also clear
that promoter methylation in differentiation only influences a small fraction of genes
and the bulk of methylation changes occur in distal regulatory regions33.
In line with these observations we detected cell type-specific methylation differences
in conserved mainly non-promoter regions. 132 DMR were detected in association
with 59 genes, but only five promoter regions were affected. Further on, reporter
assays credited five out of eight so far analyzed regions with inducible and basal
enhancer function (figure 16). Two of these discovered DMR-enhancers have
already been described (IFNG and IL2634) which approves our evaluation, and three
more enhancers have been found so far (CD40LG, SEPT9 and ID2). All the tested
regions were selectively demethylated in conventional T-cells, and many more
promising regions have been discovered in both cell types. Especially DMRs in Treg
cells are of interest to get deeper insights about the development and gene
regulation in these cells, and a downstream enhancer has already been described
that is demethylated in Treg and binds Smad3 and NFAT factors which are essential
for FOXP3 induction75. This region has been verified as demethylated in our
experiments, as have many more up and downstream of genes such as IL2RA,
LRRC32, PPP1R3F and CTLA4. So far these observations indicate that we
discovered many new putative enhancers that might be essential for gene regulation
of important factors like FOXP3 or CTLA4. Most interesting concerning the five
characterized enhancers was the fact that in vitro DNA methylation impaired their
enhancer activity. All but SEPT9 even cut down their enhancing activity to zero when
compared to the “empty” construct. Further work has to be done to test more DMR

Discussion
79
for functionality, but so far our results suggest that at least gene expression in these
closely related cells is under the control of epigenetic regulatory elements.
Further methylation differences in regulatory and conventional T-cells have been
observed over the gene-bodies which are a well known phenomenon11. In
arabidopsis methylation over gene bodies correlates inversely with gene expression,
but in globally methylated mammals the function of gene body methylation is
incompletely understood79. We discovered in some genes that were specifically
expressed in one cell type relative DNA hypomethylation when compared with the
silent locus in the other cell. Prominent examples are again FOXP3 (figure 11),
CTLA4 (figure 13) and IL2RA (CD25) which are hypomethylated over the gene body
in Treg or CD40LG which is hypomethylated in Tconv. Here at least, hypomethylation
comes along with gene expression. A problem for calculating correlations of distal
elements to gene expression is the fact that it is not sure if the hypomethylated
region in one cell type harbours an enhancer for the adjacent gene, or for a more
dislodged gene which could be expressed in the other cell type.
HHiissttoonnee mmooddiiffiiccaattiioonnss
We discovered a very interesting connection between differences in DNA methylation
and histone modifications. Our analysis revealed that H3K4me2 and H3K4me3
positively correlate with relative hypomethylation (figure14). It has been shown that
CpG-rich promoters protected from DNA methylation are associated with elevated
levels of dimethylated H3K4 in the absence of transcription. This shows that a
chromatin state can predict the DNA methylation state of inactive CpG-rich promoters
and opens the possibility that chromatin structure is functionally involved in protecting
CpG-rich promoters from DNA methylation13. The work on ES cells also conclude that
in ES cells the presence of H3K4 methylation and the absence of H3K9 methylation
are better predictors of unmethylated CpGs than sequence context alone33. A
possible mechanism could be that de novo methyl-transferases either specifically
recognize sites with unmethylated H3K4 or are excluded by H3K4 methylation or
associated factors80. Similarly, H3K9me3 or associated factors may recruit
Discussion
80
methyltransferase at ICRs and repetitive elements as it has been shown for DNMT1
and G9a which coordinate DNA and histone methylation during replication81.
Although our study only includes about 128 proximal promoters we have seen
relative H3K4me3 enrichment at genes higher expressed in one cell type than the
other (79% correlation). That substantiates the thesis that H3K4me3 is a mark for
active transcription31. Once again it would be interesting to analyse the repressive
PcG mark H3K27, as it is also present at “bivalent” promoters that are not actively
transcribed. The switch from H3K27 abundance to depletion is suspected to play an
important role in final differentiation14. This would not only identify genes which have
undergone chromatin activation but identify potential genes involved in Treg
differentiation.
Besides information about putative transcription/chromatin state and presumptive
methylation of the underlying DNA, H3K4 methylation can give additional hints on
two more aspects:
The first is the prediction of potential regulatory elements. It was demonstrated that
H3K4me1 but not H3K4me3 is present at enhancers82 which is in accord with the
observation that H3K4me3 better describes transcriptionally active promoters.
H3K4me1 has ever been mentioned as a mark for open chromatin state which would
be a necessity for the binding of factors with enhancing properties. Also H3K4me2
has been found at enhancers in another study along with H3K4me1 and H3K4me331.
These H3K4methylation-enhancer correlations were generated by comparing histone
methylation with all known DNase hypersensitivity (HS) sites from which promoters
and insulator elements have been subtracted. However elevated levels of H3K4me3
at these predicted enhancers could appear due to undiscovered transcripts,
alternative promoters or still unknown processes at HS sites. Histone acetylations
which also propagate open chromatin state have also been used successfully to
predict enhancer sites3534 and together with hypomethylation it seems that epigenetic
modifications are a general feature of regulatory elements.
Our reporter constructs were designed before the ChIP-on-chip experiments on
histone marks solely based on DMRs. Still this approach has been very fruitful. But
with the additional information about histone methylation and acetylation patterns it
will be easier to reliably predict cell type-specific enhancers. In any case we found
Discussion
81
enrichment of H3K4me1 and H3K4me2 at enhancer sites at all of the five
characterized enhancers, and SEPT9 showed elevated levels of H3K4me3. This
could be ascribed to the possibility that this region represents an alternative promoter
which is activated in Treg cells and on that account is epigenetically modified.
The second aspect that is enlightened by H3K4 methylation is the discovery of new
transcripts or alternative promoters. Genes in the UCSC genome browser are based
on protein data from Swiss-Prot/TrEMBL (UniProt) and the associated mRNA data
from Genbank with cross references to many other databases. Although UCSC
Known Genes offers the highest genomic and CDS coverage among major human
and mouse gene sets, more detailed analysis suggests all of them could be further
improved83. Naturally not all transcripts of the human genome have been discovered
or mapped due to methodical difficulties (obtaining all possible mRNAs from all
tissues and sequence them correctly) or computational biases. The transcribed
portions of the human genome are predominantly composed of interlaced networks
of both poly A+ and poly A– annotated transcripts and unannotated transcripts of
unknown function84 of which some of the latter could be localized by histone
methylation patterns. It has been shown that H3K4me3 and H3K4me36 predicted
some novel transcripts which have been confirmed by RT-PCR31.
Further on, the same study proposed that tissue-specific alternative promoter usage
could also be detected by histone modifications. As an example it has been shown
that the TSS of GNAS is associated with high levels of H3K27me3, suggesting that
transcription from this TSS is inhibited and instead, the downstream TSS is
associated with high levels of H3K4me3, Pol II binding and other marks for active
genes in the transcribed region, which suggests that it is the active site of
transcriptional initiation31.
Interestingly such potential TSS or alternative promoters have been discovered by
our ChIP-on-chip experiments: At the IL1R1 gene there are two annotated transcripts
with different promoters and the H3K4me3 mark is found only at the shorter
transcript’s TSS. We observed similar H3K4me3 distribution at the TARP, ZNFN1A2
and SEPT9 genes where H3K4me3 was found only on some but not all the possible
TSS sites. Moreover we found elevated H3K4met3 at sites where no transcripts have
Discussion
82
been mapped so far at the CTLA4 (figure 13) and ZNFN1A2 loci exclusively in Treg.
These sites could harbour cell type-specific transcripts and will be characterized.
OOuuttllooookk
This pilot study demonstrated the successful detection of cell type-specific DNA
methylation with the MCIp technique developed in our lab. As little is known about
especially DNA methylation offside of promoter regions, these DMRs have to be
further characterized. First of all, concerning the two T-cell populations here, it is
interesting if the DRM specific for regulatory Treg also have enhancer activity under
the control of DNA methylation as only DRM for Tconv were analyzed so far.
Secondly there are further possibilities for their function: The most obvious one would
be the binding of proteins, like transcription factors which are necessary for lineage
commitment or survival of regulatory T-cells, and further ChIP followed by EMSA
experiments could detect and validate protein binding.
The advantage of an established panel of MassARRAY primers is the possibility to
quickly process future samples. The artificial induction of human regulatory T-cells for
transplantation or in vivo expansion is difficult in contrast to the murine system and
had not really been successful so far. It has been proposed that stable Treg require
stable demethylation of the FOXP3 gene for proper function. Future experiments may
include the treatment of T-cells with promising agents for Treg induction followed by
quantitative methylation analysis with the MassARRAY system to monitor changes in
DNA methylation. Moreover the time course of FOXP3 demethylation in development
would be worth exploring to get deeper insight in Treg maturation. One possibility
would be to survey DNA methylation in thymocytes of variable age obtained from
mice or clinical human tissue samples.
Besides, comparative DNA methylation profiling is interesting for any other cell
system which could be easily be achieved with our approach. In principal, all cell-
development processes could be scrutinized regarding their DNA methylation
differences. Also environmental causes for changes in DNA methylation, its impact
on psychological and behavioural issues or its individual plasticity for example
between twins could be possible problems to be addressed with our method.
Discussion
83
Even though the analysis of H3K4 methylation gave some interesting insights into its
relationship to functional elements like enhancers and could even be linked to
differential DNA methylation, it will be interesting to characterise more histone marks.
Especially the repressing ones like H3K27, which is known to play a role in
development and final differentiation (where H3K27 methylation seems to play a
bigger role as DNA methylation, at least in promoters). Moreover Histone
modifications around the DMR would be of interest: Are there local changes in
histone modifications beside H3K4? What is the mechanism of demethylation of the
underlying DNA? If the often discussed DNA repair machinery is involved one could
look for connected histone modifications or the repair-connected variant H2A.Z to
enumerate some possibilities for further experiments.
Summary
84
88 SSuummmmaarryy
DNA methylation and histone modifications extend the information of the underlying
DNA sequence to a higher complexity and are key players in modulating gene
expression in a heritable way to regulate cell development and differentiation.
Although studied for a long time only little is known about DNA methylation in regions
offside promoters.
With the MCIp-on-chip approach, this study presents a powerful method to detect
locus wide cell type-specific DNA methylation patterns which has been approved by
an independent bisulphite based method (MassARRAY system, Sequenom). With
this approach we detected 132 differential methylated regions (DMR) at 59 out of 181
differential expressed genes (including controls) in human immune suppressive
regulatory T-cells and conventional T-cells. Interestingly only 5 promoter regions
were affected, the other DMR were found offside of promoters and often overlapped
with highly conserved sequences.
Reporter assays suggest that many of these DMR have enhancer activity which can
be switched off by DNA methylation as 5 out of 8 DMR cloned in reporter plasmids so
far showed enhanced reporter activity which was repressed by in vitro methylation.
Moreover DMR also correlate to histone modifications. We were able to connect
H3K4 di- and trimethylation to relative hypomethylation in the two T-cell subsets.
Additionally H3K4 trimethylation was linked to transcription and we found elevated
H3K4me3 at 79% of genes with relative over-expression. Moreover H3K4
methylation was abundant at regulatory regions, too, providing the possibility to
forecast putative enhancers and, regarding H3K4me3, the prediction of alternative
promoters and presently undiscovered sites of transcription.
Taken together, a profile for Treg and Tconv was generated that gave new insights in
basic epigenetic mechanisms and opens the door for further experiments to
characterise the role of DNA methylation and histone modifications in the function
and development of regulatory T-cells with the ultimate goal to improve their
application in clinical trials.
References
85
99 RReeffeerreenncceess
1. Singal, R. & Ginder, G.D. DNA Methylation. Blood 93, 4059-4070(1999).
2. Shilatifard, A. Molecular implementation and physiological roles for histone H3 lysine 4 (H3K4) methylation. Curr Opin Cell Biol 20, 341-8(2008).
3. Razin, A. CpG methylation, chromatin structure and gene silencing-a three-way connection. EMBO J. 17, 4905–4908(1998).
4. Ansel, K.M., Lee, D.U. & Rao, A. An epigenetic view of helper T cell differentiation. Nat Immunol 4, 616-23(2003).
5. Hoffmann, P. & Edinger, M. CD4+CD25+ regulatory T cells and graft-versus-host disease. Semin Hematol 43, 62-9(2006).
6. Okano, M. u. a. DNA Methyltransferases Dnmt3a and Dnmt3b Are Essential for De Novo Methylation and Mammalian Development. Cell 99, 247-257(1999).
7. Li, E., Beard, C. & Jaenisch, R. Role for DNA methylation in genomic imprinting. Nature 366, 362-365(1993).
8. Goto, T. & Monk, M. Regulation of X-Chromosome Inactivation in Development in Mice and Humans. Microbiol Mol Biol Rev. 62, 362–378(1998).
9. Goll, M.G. & Bestor, T.H. Eukaryotic cytosine methyltransferases. Annu Rev Biochem 74, 481-514(2005).
10. Plass, C. & Soloway, P.D. DNA methylation, imprinting and cancer. Eur J Hum Genet 10, 6-16(2002).
11. Suzuki, M.M. & Bird, A. DNA methylation landscapes: provocative insights from epigenomics. Nat Rev Genet 9, 465-76(2008).
12. Rollins, R.A. u. a. Large-scale structure of genomic methylation patterns. Genome Res. 16, 157–163(2006).
13. Weber, M. u. a. Distribution, silencing potential and evolutionary impact of promoter DNA methylation in the human genome. Nat Genet 39, 457-466(2007).
14. Mohn, F. u. a. Lineage-specific polycomb targets and de novo DNA methylation define restriction and potential of neuronal progenitors. Mol Cell 30, 755-66(2008).
15. Schilling, E. & Rehli, M. Global, comparative analysis of tissue-specific promoter CpG methylation. Genomics 90, 314-323(2007).
16. Li, E., Bestor, T.H. & Jaenisch, R. Targeted mutation of the DNA methyltransferase gene results in embryonic lethality. Cell 69, 915-26(1992).
17. Bird, A. DNA methylation patterns and epigenetic memory. Genes Dev 16, 6-21(2002).
18. Jost, J.P. u. a. Mechanisms of DNA demethylation in chicken embryos. Purification and properties of a 5-methylcytosine-DNA glycosylase. J Biol Chem 270, 9734-9(1995).
19. Métivier, R. u. a. Cyclical DNA methylation of a transcriptionally active promoter. Nature 452, 45-50(2008).
20. Bell, A.C., West, A.G. & Felsenfeld, G. The Protein CTCF Is Required for the Enhancer Blocking Activity of Vertebrate Insulators. Cell 98, 387-396(1999).
21. Ballestar, E. & Wolffe, A.P. Methyl-CpG-binding proteins. Targeting specific gene repression. Eur J Biochem 268, 1-6(2001).
References
86
22. Ho, K.L. u. a. MeCP2 binding to DNA depends upon hydration at methyl-CpG. Mol Cell 29, 525-31(2008).
23. Wilson, C.B. & Merkenschlager, M. Chromatin structure and gene regulation in T cell development and function. Curr Opin Immunol. 18, 143–151(2006).
24. Zhang, Y. u. a. Analysis of the NuRD subunits reveals a histone deacetylase core complex and a connection with DNA methylation. Genes Dev. 13, 1924–1935(1999).
25. Laird, P.W. Cancer epigenetics. Hum. Mol. Genet. 14, R65-76(2005).
26. Gao, L. u. a. Cloning and Functional Characterization of HDAC11, a Novel Member of the Human Histone Deacetylase Family. J. Biol. Chem. 277, 25748-25755(2002).
27. Sterner, D.E. & Berger, S.L. Acetylation of histones and transcription-related factors. Microbiol Mol Biol Rev 64, 435-59(2000).
28. Hassan, A.H. u. a. Function and selectivity of bromodomains in anchoring chromatin-modifying complexes to promoter nucleosomes. Cell 111, 369-79(2002).
29. Jacobson, R.H. u. a. Structure and function of a human TAFII250 double bromodomain module. Science 288, 1422-5(2000).
30. Bannister, A.J. u. a. Selective recognition of methylated lysine 9 on histone H3 by the HP1 chromo domain. Nature 410, 120-124(2001).
31. Barski, A. u. a. High-resolution profiling of histone methylations in the human genome. Cell 129, 823-37(2007).
32. Orford, K. u. a. Differential H3K4 methylation identifies developmentally poised hematopoietic genes. Dev Cell 14, 798-809(2008).
33. Meissner, A. u. a. Genome-scale DNA methylation maps of pluripotent and differentiated cells. Nature 454, 766-70(2008).
34. Schoenborn, J.R. u. a. Comprehensive epigenetic profiling identifies multiple distal regulatory elements directing Ifng transcription. Nat Immunol. 8, 732–742(2007).
35. Roh, T. u. a. Genome-wide prediction of conserved and nonconserved enhancers by histone acetylation patterns. Genome Res 17, 74-81(2007).
36. Müller, J. u. a. Histone methyltransferase activity of a Drosophila Polycomb group repressor complex. Cell 111, 197-208(2002).
37. Ringrose, L. & Paro, R. Polycomb/Trithorax response elements and epigenetic memory of cell identity. Development 134, 223-32(2007).
38. Ringrose, L., Ehret, H. & Paro, R. Distinct contributions of histone H3 lysine 9 and 27 methylation to locus-specific stability of polycomb complexes. Mol Cell 16, 641-53(2004).
39. Wendt, K.S. u. a. Cohesin mediates transcriptional insulation by CCCTC-binding factor. Nature 451, 796-801(2008).
40. Temple, I.K. Imprinting in human disease with special reference to transient neonatal diabetes and Beckwith-Wiedemann syndrome. Endocr Dev 12, 113-23(2007).
41. Mabaera, R. u. a. Developmental- and differentiation-specific patterns of human {gamma}- and {beta}-globin promoter DNA methylation. Blood 110, 1343-1352(2007).
42. Bottardi, S. u. a. Developmental stage-specific epigenetic control of human {beta}-globin gene expression is potentiated in hematopoietic progenitor cells prior to their transcriptional activation. Blood 102, 3989-3997(2003).
43. Rice, K.L., Hormaeche, I. & Licht, J.D. Epigenetic regulation of normal and malignant hematopoiesis. Oncogene 26, 6697-714(2007).
44. Floess, S. u. a. Epigenetic Control of the foxp3 Locus in Regulatory T Cells . PLoS Biol. 5, e38(2007).
References
87
45. Bruniquel, D. & Schwartz, R.H. Selective, stable demethylation of the interleukin-2 gene enhances transcription by an active process. Nat Immunol 4, 235-40(2003).
46. Sakaguchi, S. u. a. Immunologic self-tolerance maintained by activated T cells expressing IL-2 receptor alpha-chains (CD25). Breakdown of a single mechanism of self-tolerance causes various autoimmune diseases. J Immunol 155, 1151-64(1995).
47. Zheng, Y. & Rudensky, A.Y. Foxp3 in control of the regulatory T cell lineage. Nat Immunol 8, 457-62(2007).
48. Hill, J.A. u. a. Foxp3 transcription-factor-dependent and -independent regulation of the regulatory T cell transcriptional signature. Immunity 27, 786-800(2007).
49. Brunkow, M.E. u. a. Disruption of a new forkhead/winged-helix protein, scurfin, results in the fatal lymphoproliferative disorder of the scurfy mouse. Nat Genet 27, 68-73(2001).
50. Bennett, C.L. u. a. The immune dysregulation, polyendocrinopathy, enteropathy, X-linked syndrome (IPEX) is caused by mutations of FOXP3. Nat Genet 27, 20-1(2001).
51. Liu, W. u. a. CD127 expression inversely correlates with FoxP3 and suppressive function of human CD4+ T reg cells. J. Exp. Med. 203, 1701-1711(2006).
52. Vignali, D.A.A., Collison, L.W. & Workman, C.J. How regulatory T cells work. Nat Rev Immunol 8, 523-32(2008).
53. Su, L. u. a. Murine CD4+CD25+ regulatory T cells fail to undergo chromatin remodeling across the proximal promoter region of the IL-2 gene. J Immunol 173, 4994-5001(2004).
54. Sakaguchi, S. Naturally arising Foxp3-expressing CD25+CD4+ regulatory T cells in immunological tolerance to self and non-self. Nat Immunol 6, 345-52(2005).
55. Hoffmann, P. u. a. Isolation of CD4+CD25+ regulatory T cells for clinical trials. Biol Blood Marrow Transplant 12, 267-74(2006).
56. Wing, K., Fehervari, Z. & Sakaguchi, S. Emerging possibilities in the development and function of regulatory T cells. Int. Immunol. 18, 991-1000(2006).
57. Dieckmann, D. u. a. Ex Vivo Isolation and Characterization of CD4+CD25+ T Cells with Regulatory Properties from Human Blood. J. Exp. Med. 193, 1303-1310(2001).
58. Collison, L.W. u. a. The inhibitory cytokine IL-35 contributes to regulatory T-cell function. Nature 450, 566-9(2007).
59. Gondek, D.C. u. a. Cutting Edge: Contact-Mediated Suppression by CD4+CD25+ Regulatory Cells Involves a Granzyme B-Dependent, Perforin-Independent Mechanism. J Immunol 174, 1783-1786(2005).
60. Ren, X. u. a. Involvement of cellular death in TRAIL/DR5-dependent suppression induced by CD4(+)CD25(+) regulatory T cells. Cell Death Differ 14, 2076-84(2007).
61. Garín, M.I. u. a. Galectin-1: a key effector of regulation mediated by CD4+CD25+ T cells. Blood 109, 2058-65(2007).
62. Ball, L.M. & Egeler, R.M. Acute GvHD: pathogenesis and classification. Bone Marrow Transplant 41 Suppl 2, S58-64(2008).
63. Hoffmann, P. u. a. Donor-type CD4(+)CD25(+) regulatory T cells suppress lethal acute graft-versus-host disease after allogeneic bone marrow transplantation. J Exp Med 196, 389-99(2002).
64. Edinger, M. u. a. CD4+CD25+ regulatory T cells preserve graft-versus-tumor activity while inhibiting graft-versus-host disease after bone marrow transplantation. Nat Med 9, 1144-50(2003).
65. Hoffmann, P. u. a. Large-scale in vitro expansion of polyclonal human CD4(+)CD25high regulatory T cells. Blood 104, 895-903(2004).
References
88
66. Hoffmann, P. u. a. Only the CD45RA+ subpopulation of CD4+CD25high T cells gives rise to homogeneous regulatory T-cell lines upon in vitro expansion. Blood 108, 4260-7(2006).
67. Chen, W. u. a. Conversion of peripheral CD4+CD25- naive T cells to CD4+CD25+ regulatory T cells by TGF-beta induction of transcription factor Foxp3. J Exp Med 198, 1875-86(2003).
68. Tran, D.Q., Ramsey, H. & Shevach, E.M. Induction of FOXP3 expression in naive human CD4+FOXP3 T cells by T-cell receptor stimulation is transforming growth factor-beta dependent but does not confer a regulatory phenotype. Blood 110, 2983-90(2007).
69. Baron, U. u. a. DNA demethylation in the human FOXP3 locus discriminates regulatory T cells from activated FOXP3(+) conventional T cells. Eur J Immunol 37, 2378-89(2007).
70. Klug, M. & Rehli, M. Functional analysis of promoter CpG methylation using a CpG-free luciferase reporter vector. Epigenetics 1, 127-30
71. Ausubel, F.M. Current Protocols in Molecular Biology. 1(Greene Pub. Associates: 1988).
72. Sambrook, J. Molecular Cloning: A Laboratory Manual. 999(Cold Spring Harbor Laboratory Press: 2001).
73. Gebhard, C. u. a. Genome-Wide Profiling of CpG Methylation Identifies Novel Targets of Aberrant Hypermethylation in Myeloid Leukemia. Cancer Res 66, 6118-6128(2006).
74. Ehrich, M. u. a. Quantitative high-throughput analysis of DNA methylation patterns by base-specific cleavage and mass spectrometry. Proc Natl Acad Sci U S A 102, 15785-90(2005).
75. Tone, Y. u. a. Smad3 and NFAT cooperate to induce Foxp3 expression through its enhancer. Nat Immunol 9, 194-202(2008).
76. Irizarry, R.A. u. a. Comprehensive high-throughput arrays for relative methylation (CHARM). Genome Res 18, 780-90(2008).
77. Bernstein, B.E. u. a. A bivalent chromatin structure marks key developmental genes in embryonic stem cells. Cell 125, 315-26(2006).
78. Rakyan, V.K. u. a. DNA methylation profiling of the human major histocompatibility complex: a pilot study for the human epigenome project. PLoS Biol 2, e405(2004).
79. Zilberman, D. u. a. Genome-wide analysis of Arabidopsis thaliana DNA methylation uncovers an interdependence between methylation and transcription. Nat Genet 39, 61-69(2007).
80. Ooi, S.K.T. u. a. DNMT3L connects unmethylated lysine 4 of histone H3 to de novo methylation of DNA. Nature 448, 714-7(2007).
81. Estève, P. u. a. Direct interaction between DNMT1 and G9a coordinates DNA and histone methylation during replication. Genes Dev 20, 3089-103(2006).
82. Heintzman, N.D. u. a. Distinct and predictive chromatin signatures of transcriptional promoters and enhancers in the human genome. Nat Genet 39, 311-8(2007).
83. Hsu, F. u. a. The UCSC Known Genes. Bioinformatics 22, 1036-46(2006).
84. Cheng, J. u. a. Transcriptional Maps of 10 Human Chromosomes at 5-Nucleotide Resolution. Science 308, 1149-1154(2005).
Abbreviations
89
AAbbbbrreevviiaattiioonnss
5mC 5’-methyl cytosine APC antigen presenting cells CD cluster of differentiation CGI CpG island ChIP chromatin immunoprecipitation CIAP calf intestinal alkaline phosphatase CpG CG dinucleotides DC dendritic cell DMR differentially methylated region EMSA electrophoretic mobility shift assay ES embryonal stem cells GMP good manufacturing practice GVHD graft-versus-host-disease H x K x histone x lysine x H3K4me1 histone 3 lysine 4 monomethylation H3K4me2 histone 3 lysine 4 dimethylation H3K4me3 histone 3 lysine 4 trimethylation HAT histone acetylases HDAC histone deacetylase HKMT histone lysine methyltransferase HS DNase hypersensitivity IBD inflammatory bowel disease LCP low density CpG promoters LM-PCR ligation mediated PCR MALDI-TOF MS matrix-assisted laser desorption/ionization time-of-flight mass
spectrometry MBD methyl-CpG-binding-domain MCIp methyl-CpG immunoprecipitation MHC human major histocompatibility complex MvA signal log ratio vs. average log intensity N any nucleotide NK natural killer cells NP neural progenitor PcG polycomb group PCR polymerase chain reaction PRC polycomb repressive complex RT-PCR real time-PCR SCT allogenic stem cell transplantation Tconv conventional T-cells TH1 T helper 1 cell TH2 T helper 2 cell TN terminal pyramidal neurons Treg regulatory T-cells
Abbreviations
90
TrxG trithorax group TSDR Treg-specific demethylated regions TSS transcription start site UCSC university of California, Santa Cruz Xi inactivated X-chromosome
Danksagung
91
DDaannkkssaagguunngg
Für seine großzügige Unterstützung und die Ermöglichung dieser Diplomarbeit
möchte ich Herrn Prof. Dr. Reinhard Andreesen herzlich danken.
Bei Prof. Herbert Tschochner bedanke ich mich, da er sich bereit erklärt hat die
Erstbetreuung und Begutachtung dieser Arbeit zu übernehmen.
Ganz besonders bedanke ich mich bei Michael Rehli für die unbeschreiblich gute
Betreuung, seiner mitreißenden Begeisterung für die Arbeit und überhaupt die
Möglichkeit an so einem interessanten und aktuellen Thema zu forschen. Seine Tür
stand immer offen für Diskussionen, Anregungen und Antworten auf abertausend
Fragen, Fragen, Fragen.
Meinen Laborkollegen Carol, Claudia, Maja, Monika W., Monika L., Lucia, Sabine,
Hang, Eddy, Tobi, der gesamten AG-Kreuz mit Marina, Eva, Alex, Katrin, Alice, Gabi
und Kaste danke ich aufs herzlichste für die angenehme Atmosphäre, für Hilfe und
Unterstützung, Scherze und guten Zuspruch, gemeinsames Jammern falls mal
wieder nichts funktionieren will, für den einen oder anderen Kaffee und dass man
sich auch außerhalb des Labors so gut versteht. Ganz besonders bedanken möchte
ich mich hier bei Lucia, Eddy und Maja, die mir alle Methoden beigebracht haben und
immer mit Rat und Tat zur Stelle waren.
Petra Hoffman mit ihrer Arbeitsgruppe und Matthias Edinger danke ich für die super
Kooperation. Danke an Jasmin, Monika, Tina, Rüdiger und Leo für eure Arbeit.
Für ihre Geduld mit mir, ihr Verständnis für meine Arbeit und besonders für ihre Liebe
danke ich meiner Freundin.
Abschließend möchte ich mich bei meiner Familie bedanken, die mich schon immer
bedingungslos unterstützt hat und immer für mich da ist.
Eidesstattliche Erklärung
92
EEiiddeessssttaattttlliicchhee EErrkklläärruunngg
Hiermit erkläre ich, dass ich die vorliegende Arbeit selbständig verfasst und keine
anderen als die angegebenen Quellen und Hilfsmittel verwendet habe.
Regensburg, 29. Oktober 2008 …………………………………………. Christian Schmidl