Embed Size (px)
Citation preview
Functional Characterization of Friedreich Ataxia iPS-Derived Neuronal Progenitors and Their Integration inthe Adult BrainMatthew J. Bird1,2,3, Karina Needham4, Ann E. Frazier1,2, Jorien van Rooijen5, Jessie Leung5,
Shelley Hough5, Mark Denham5, Matthew E. Thornton6, Clare L. Parish7, Bryony A. Nayagam8,
Martin Pera5,7,9, David R. Thorburn1,2,10, Lachlan H. Thompson7, Mirella Dottori3,5*
1 Murdoch Childrens Research Institute, Royal Children’s Hospital, Melbourne, Victoria, Australia, 2 Department of Paediatrics, The University of Melbourne, Melbourne,
Victoria, Australia, 3 Centre for Neural Engineering, Department of Electrical and Electronic Engineering, The University of Melbourne, Melbourne, Victoria, Australia,
4 Department of Otolaryngology, The University of Melbourne, Melbourne, Victoria, Australia, 5 Department of Anatomy and Neuroscience, The University of Melbourne,
Melbourne, Victoria, Australia, 6 Division of Maternal Fetal Medicine, Saban Research Institute of Children’s Hospital of Los Angeles, Los Angeles, California, United States
of America, 7 Florey Institute of Neuroscience and Mental Health, The University of Melbourne, Melbourne, Victoria, Australia, 8 Department of Audiology and Speech
Pathology, The University of Melbourne, Melbourne, Victoria, Australia, 9 Walter and Eliza Hall Institute, Melbourne, Victoria, Australia, 10 Victorian Clinical Genetics
Services, Royal Children’s Hospital, Melbourne, Victoria, Australia
Abstract
Friedreich ataxia (FRDA) is an autosomal recessive disease characterised by neurodegeneration and cardiomyopathy that iscaused by an insufficiency of the mitochondrial protein, frataxin. Our previous studies described the generation of FRDAinduced pluripotent stem cell lines (FA3 and FA4 iPS) that retained genetic characteristics of this disease. Here we extendthese studies, showing that neural derivatives of FA iPS cells are able to differentiate into functional neurons, which don’tshow altered susceptibility to cell death, and have normal mitochondrial function. Furthermore, FA iPS-derived neuralprogenitors are able to differentiate into functional neurons and integrate in the nervous system when transplanted into thecerebellar regions of host adult rodent brain. These are the first studies to describe both in vitro and in vivo characterizationof FA iPS-derived neurons and demonstrate their capacity to survive long term. These findings are highly significant fordeveloping FRDA therapies using patient-derived stem cells.
Citation: Bird MJ, Needham K, Frazier AE, van Rooijen J, Leung J, et al. (2014) Functional Characterization of Friedreich Ataxia iPS-Derived Neuronal Progenitorsand Their Integration in the Adult Brain. PLoS ONE 9(7): e101718. doi:10.1371/journal.pone.0101718
Editor: Jialin Charles Zheng, University of Nebraska Medical Center, United States of America
Received January 22, 2014; Accepted June 11, 2014; Published July 7, 2014
Copyright: � 2014 Bird et al. This is an open-access article distributed under the terms of the Creative Commons Attribution License, which permits unrestricteduse, distribution, and reproduction in any medium, provided the original author and source are credited.
Funding: These studies were supported by the Friedreich’s Ataxia Research Association USA (www.curefa.org) and Australasia (www.fara.org.au/) (MD), theAustralian Mitochondrial Disease Foundation (www.amdf.org.au/) (MJB), an Australian Postgraduate Award (http://services.unimelb.edu.au/scholarships/research/local/available/apa) (MJB), a Principal Research Fellowship (DRT), Career Development Awards (AEF, LHT) and a Medical Research Council Peter DohertyFellowship (BAN) all from the Australian National Health and Medical Research Council (www.nhmrc.gov.au/), a Victorian Government’s Operational InfrastructureSupport Program (http://www.business.vic.gov.au/industries/science-technology-and-innovation/programs/medical-research-operational-infrastructure-program), a senior medical research fellowship (CLP) provided by the Viertel charitable foundation (www.anz.com.au/personal/private-bank…/scholarships-fellowships/), and a Brain Foundation Award (brainfoundation.org.au). The authors would also like to thank Brian Mendenhall from the USC High PerformanceComputing Cluster for installing and testing high content analysis software. The authors declare no conflict of interest relating to this work. The funders had norole in study design, data collection and analysis, decision to publish, or preparation of the manuscript.
Competing Interests: The authors have declared that no competing interests exist.
* Email: [email protected]
Introduction
Friedreich ataxia (FRDA) is the most common form of all
inherited ataxias known to date, despite it being an autosomal
recessive disorder [1]. The onset of symptoms is usually observed
during childhood with progressive neurodegeneration over time,
resulting in severe motor dysfunction such that they can no longer
walk or perform upper limb movement. Speech, vision and
hearing abilities are also affected. The neurodegeneration is often
accompanied by cardiomyopathy and diabetes. FRDA is caused
by the presence of a trinucleotide GAA repeat expansion in the
first intron of the FXN gene [2]. This effect is an insufficiency of
the mitochondrial protein frataxin, which appears to play an
important role in iron homeostasis [1,2]. Reduced levels of
frataxin protein is associated with mitochondrial dysfunction, and
leads to cell toxicity and cell death [3].
Despite ongoing efforts over many years, there is still need to
establish appropriate in vivo and in vitro models of FRDA to study
disease pathogenesis and develop therapies. FRDA cell lines have
been established from various sources, including transgenic yeast,
transgenic human cell lines, patient-derived skin fibroblast lines,
lymphoblastoid cell lines and primary lymphocytes [4–8]. These
cell lines however are not representative of the cell types normally
affected in the disease and are therefore somewhat limited in their
use for understanding the pathological mechanisms. Cellular
defects have been reported for some cell types, such as a reduction
in the activity of mitochondrial protein complexes containing iron-
sulfur (Fe-S) clusters in heart and skeletal muscle, and a deficit in
ATP production in skeletal muscle and lymphoblasts [9–12].
However, these findings are not consistent across all cells, and
PLOS ONE | www.plosone.org 1 July 2014 | Volume 9 | Issue 7 | e101718
thus, FRDA pathology appears to be contextual to different cell
types [9,13].
To address this need for cellular models of FRDA, we generated
induced-pluripotent stem (iPS) cells from FRDA patient fibro-
blasts, referred to as FA iPS cells [14]. The FA iPS cells and their
derivatives maintain the defining FRDA molecular properties of
FRDA, having GAA repeat expansions on both FXN alleles with
corresponding low expression levels of frataxin transcripts [14].
Our previous studies also demonstrated that FA iPS cells can
differentiate to neurons, glia and neural crest lineages [14]. We
now extend these analyses to functionally characterize neurons
derived from FA iPS cells, including their electrophysiological
properties, as well as mitochondrial and metabolic activities. We
also assess their capacity to survive long term in vitro and integrate
within the adult nervous system in vivo. These studies are
fundamental for using FA iPS cell lines to establish a neuronal
cellular model of FRDA, and demonstrate the potential of an iPS
cell line derived from a genetically inherited neurodegenerative
disease to differentiate and function in vivo.
Materials and Methods
Ethics statementThis study conformed to the Australian National Health and
Medical Research Council’s published Code of Practice for the
Use of Animals in Research, and experiments were approved by
the Florey Neuroscience Institutes animal ethics committee. All
animals were housed on a 12 h light/dark cycle with ad libitum
access to food and water.
All experiments for iPS and human embryonic stem cell lines
were performed in accordance with approvals obtained from the
University of Melbourne Human Ethics Committee (#0605017,
#0830010 and #0829937).
Cell culture and differentiationIPS cells derived from FRDA patient fibroblasts (FA3 iPS and
FA4 iPS) [14], control iPS cells (iPS1, WiCell USA), and the
human embryonic stem cell line H9 (WA-09, WiCell USA) cell
lines were cultured as previously described [15]. Briefly, mitomy-
cin-C treated human foreskin fibroblasts in KSR media consisting
of DMEM/nutrient mixture F-12, supplemented with 0.1 mM b-
mercaptoethanol, 1% nonessential amino acids, 2 mM glutamine,
25 U/ml penicillin, 25 mg/ml streptomycin and 20% knockout
serum replacement (all from Invitrogen). All cells were cultured at
37uC, 5% CO2. Colonies were mechanically dissected every 7
days and transferred to freshly prepared human embryonic
fibroblasts. The FA3-GFP cells were generated by transfecting
FA3 iPS cells with the piggyBac transposon vector (Wellcome Trust
Sanger Institute) modified to contain a GFP expression cassette,
driven by the human elongation factor 1 alpha promoter. Positive
GFP-expressing cells were enriched by mechanical dissection of
transfected FA3 iPS cells, using a Leica MZFIII Fluorescence
Stereomicroscope. For neural induction, colonies were treated
with 500 ng/ml human recombinant noggin (PeproTech) and
4 ng/ml bFGF in neural basal media (NBM) [16]. After 14 days,
colony pieces were mechanically harvested and cultured in
suspension in NBM supplemented with 20 ng/ml bFGF and
20 ng/ml EGF to promote neurosphere formation. Neuronal
differentiation was performed by plating neurospheres on poly-D-
lysine/laminin substrates in NBM for at least 1 week, as previously
described [16].
ElectrophysiologyNeurons cultured on individual coverslips were transferred to
the recording chamber mounted on the stage of an upright
microscope (AxioExaminer D1, Zeiss) fitted with a 40X water-
immersion objective lens. Cells were visualised with phase contrast
or Dodt optics, and a monochrome CCD camera (Spot RT SE18,
Diagnostic Instruments). Electrophysiological recordings in whole
cell patch-clamp were performed at room temperature (22–25uC).
Micropipette electrodes were fabricated from borosilicate tubing
(1.0 mm O.D., 0.58 mm I.D.) using a Sutter P-2000 puller (Sutter
Instrument Company) and had a tip resistance of 2–6 MW.
During recordings, cells were superfused at 1–3 ml/min with
extracellular buffer (137 mM NaCl, 5 mM KCl, 10 mM HEPES,
1 mM MgCl2, 2 mM CaCl2, 10 mM glucose, pH 7.35, 300–
305 mosmol/kg), and micropipettes contained internal solution
(115 mM K-gluconate, 10 mM HEPES, 7 mM KCl, 0.05 mM
EGTA, 2 mM Na2ATP, 2 mM MgATP, 0.5 mM Na2GTP,
pH 7.3, 294 mosmol/kg). Tetrodotoxin (TTX), tetraethylammo-
nium chloride (TEA) and 4-aminopyridine (4-AP) were diluted
daily to final concentrations in the bath perfusate, and adminis-
tered by superfusion via a gravity-fed system. Signals were
recorded with a MultiClamp 700B amplifier (Molecular Devices),
and data acquisition system (Digidata 1440A, Molecular Devices),
and AxoGraph X analysis software (AxoGraph Scientific).
Records were digitized at 50 kHz and filtered at 10 kHz. Series
resistance (RS) was monitored in response to a 10 mV voltage step
(mean 18.060.8 MW; cells with RS greater than 30 MW were
excluded). In current clamp, pipette capacitance neutralization
was applied and bridge balance utilized to compensate errors due
to RS. All recordings were made from a holding potential of 2
73 mV, and corrections for liquid junction potential (12.8 mV;
JPCalcW, courtesy of Prof. P H Barry, Sydney) were made offline.
Results are presented as mean 6 SEM.
Dipstick assays for complex I activity, complex IV activityand frataxin protein
Dipstick assay for frataxin, mitochondrial complexes I (CI) and
IV (CIV) were obtained from Mitosciences, and performed as per
the manufactures instructions in dissociated neurospheres (day 17–
19 post neuronal induction).
TUNEL assayNeurosphere frozen sections for TUNEL analysis were
permeabilised in 0.1% Triton X-100 for 2 min on ice, followed
by TUNEL labeling according to the manufacturer’s protocol
(Roche, In situ Cell Death Detection Kit, Fluorescein). Sections
were photographed using an Olympus BX51 microscope and
ULH100HG reflected fluorescence system with DP70 camera.
Post-image acquisition, images were rescaled from 1376 by
1038 pixels to 5504 by 4152 pixels (ImageJ, plugin TransformJ
using quintic b-splines interpolation) [17]. Illumination correction
was performed (CellProfiler software) [18], and contrast enhanced
for each image uniformly (ImageJ, plugin CLAHE) [19]. A pixel
classifier for use with CellProfiler was generated using the open
source software Ilastik version 0.5 (www.ilastik.org) [20]. A
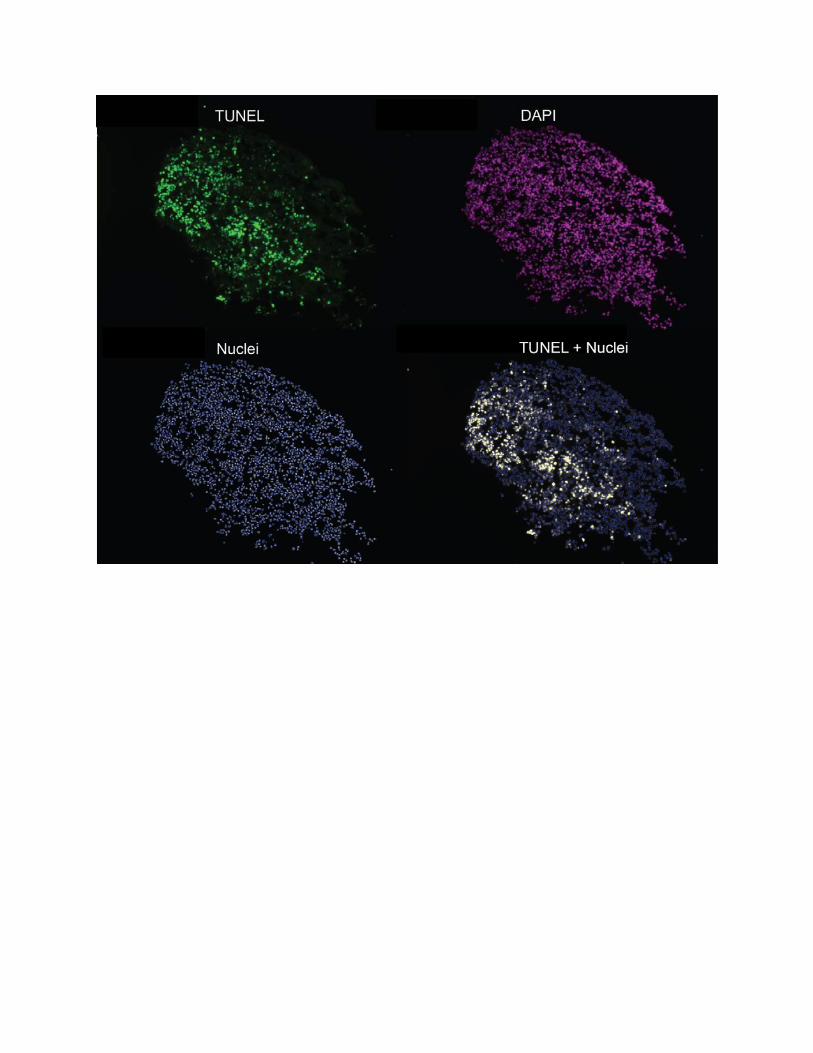
CellProfiler pipeline was designed to collect intensity data from
the TUNEL channel, using the areas of nuclei identified in the
DAPI channel as a mask (Figure S2). For each nuclei identified in
the DAPI channel, nuclei area, nuclei centroid location in
Cartesian coordinates, integrated intensity of TUNEL, median
intensity of TUNEL, and an image of the mask was collected.
Data was then transformed with an arcsine transformation to
Characterization of Friedreich Ataxia iPS Neural Derivatives
PLOS ONE | www.plosone.org 2 July 2014 | Volume 9 | Issue 7 | e101718
approximate a normal distribution, and an ANOVA test
performed.
ATP synthesis assayATP synthesis rates were measured in dissociated neurospheres
(day 17–19 post neuronal induction) as previously described [21],
with cells permeabilised in buffer containing 0.005% digitonin
with substrate/inhibitors as described (mitochondrial complex II
(CII)-dependent substrate succinate (10 mM), CII inhibitor
malonate (1 mM), CI-dependent substrates glutamate (10 mM),
pyruvate (10 mM) and malate (10 mM), and CI inhibitor rotenone
(2.5 mM)).
Enzyme activity assays by spectrophotometryCitrate synthase activity of dissociated neurospheres (day 19–24
post neuronal induction) was determined relative to total protein at
30uC as previously described [22].
The activity of CI was also detected spectrophotometrically in
whole cell homogenates, as previously described [22]. However,
due to the very large amount of error, the measurements were
deemed unreliable (data not shown). This was likely due to the
small amount of biological material available for analysis, and the
high rotenone-insensitive rate of NADH oxidation in these
samples (61%66.3 (SEM)).
Mitochondrial membrane potential (DYm)Dissociated adherent neurospheres (day 25–33 post neuronal
induction) grown in a black 96 well plate were stained in media
containing 75 nM tetramethyl rhodamine methyl ester (TMRM)
(Ex 544 nm, Em 590 nm) and 2 mg/ml Hoechst-33258 (Ex
346 nm, Em 460 nm) for 40 min at 37uC, 5% CO2. Cells were
washed in warm phosphate-buffered saline (PBS), then the
mitochondrial membrane potential (DYm) was determined as the
ratio of TMRM to Hoechst fluorescence (FLUOstar OPTIMA).
Control wells were treated with 20 mM carbonylcyanide-r-
trifluoromethoxyphenyl hydrazone (FCCP) to dissipate the DYm.
The DYm was also determined by microscopy in dissociated
adherent neurospheres (day 21 post neuronal induction) grown in
35 mm glass bottom dishes (World Precision instruments). Cells
were stained in Hanks Buffered Salt Solution with magnesium and
calcium (Gibco) containing 75 nM TMRM for 30 min at 37uC,
5% CO2. Cells were visualised at 37uC, 5% CO2 on a Delta
Vision OMX V3 Imaging System (Applied Precision) using the
TRITC filter set with oil-immersion objective (Olympus, IX71),
fitted with a CoolSNAP HQ2 camera (Photometrics). After initial
imaging, 20 mM FCCP was applied to dishes to dissipate the DYm,
and regions of interest were visualized again. Images were de-
convoluted, cropped and projected with maximum intensity
(Applied Precision, SoftWoRx v5.5). Mitochondrial rich perinu-
clear regions were selected in greater than 80 cells per cell line and
average TMRM fluorescence determined pre- and post-FCCP
application.
Western blot analysisDissociated neurospheres (day 17–19 post neuronal induction)
were analysed by western blot analysis as previously described
[23], using the human OXHOS complex antibody cocktail
(Abcam, MS601).
Animals and transplantation surgeryDissociated neurospheres derived from the FA3 GFP iPS cells
were grafted into 4 adult (250 g), female athymic (nude; CBH-rnu)
rats. The animals were deeply anaesthetised using 2% isoflurane as
an inhalant and placed in a stereotaxic frame (Kopf) in a flat skull
position. Donor neural progenitors were injected into the right
cerebellar hemisphere using a 5 ml microsyringe (SGE Analytical
Science) fitted with a pulled glass capillary as previously described
[24]. A total of 1 ml of the cell suspension (0.56105 cells/ml) was
injected over 2 min; 10.8 mm caudal to bregma; 3.6 mm lateral to
the midline; and 4.0 mm below the dural surface. The cannula
was left in place a further 5 min after the contents had been
delivered to prevent backflow up the needle track. The animals
were killed (lethal dose of pentobarbitone; intravenous perfusion)
12 weeks later for histological analysis. Animals were transcardially
perfused with saline (0.9%) followed by paraformaldehyde (4% in
0.1 M PBS). The brains were removed and post-fixed for a further
2 h in 4% paraformaldehyde and cryoprotected overnight in
sucrose (25% in 0.1 M PBS) before being sectioned on a freezing
microtome (Leica). Parasagittal sections were collected in 12 series
at a thickness of 30 mm.
Immunohistochemistry and imagingImmunohistochemical procedures for transplantation studies
were performed as previously described in [25]. Detection of the
antibody conjugates was achieved using either a peroxidase-based
reaction followed by precipitation of diaminobenzidine (DAB;
Sigma) or conjugation of a fluorophore. The primary antibodies
and dilutions used were as follows: mouse anti-APC (1:500;
Calbiochem); rabbit anti-GABA (1:5000; Sigma); rabbit anti-
GFAP (1:200; DAKO); chicken anti-GFP (1:1000; AbCam);
mouse anti-NeuN (1:200; Millipore); rabbit anti-Olig2 (1:500;
Millipore); mouse anti-PSA-NCAM (1:100; Santa Cruz); rabbit
anti-Tbr1 (1:1000; Millipore). For fluorescent labeling, secondary
antibodies raised in donkey were conjugated with Alexa-488; -549
or -633 (Molecular Probes). For DAB labeling, biotin-conjugated
goat anti-rabbit was used (Jackson ImmunoResearch) followed by
incubation with peroxidase-conjugated streptavidin (Vectastain
ABC kit, Vector Laboratories). No significant non-specific signal
was generated from the secondary antibodies, as determined by
control experiments where the primary antibody was omitted from
the immunohistochemical procedure.
The overview of DAB-labeled GFP images were generated as a
montage of single dark-field images captured using a 10X
objective on a Leica DM6000 upright light microscope with the
Leica X-Y tiling software module (v3.8). Fluorescent images of the
grafted cells were captured using a Zeiss upright laser-scanning
confocal microscope and ZEN software.
StatisticsUnless otherwise described, error bars represent SEM, and p
values are generated from student t-tests (GraphPad, PRISM
V6.0b) and reported when #0.05.
Results
1. FA iPS cells differentiate in vitro to functionally activeneurons
We have previously described the generation and characteriza-
tion of two FRDA iPS cell lines, known as ‘FA3’ and ‘FA4’,
derived from adult FRDA human skin biopsies, and demonstrated
their capacity to differentiate to neurons in vitro [14]. Here we
extend these studies to determine the functionality of FA-derived
neurons using whole cell patch clamp recordings. We find then
that FA-derived neurons are electrically active and display core
electrophysiological characteristics typical of neurons derived from
human stem cells, namely INa and IK [26–28].
Characterization of Friedreich Ataxia iPS Neural Derivatives
PLOS ONE | www.plosone.org 3 July 2014 | Volume 9 | Issue 7 | e101718
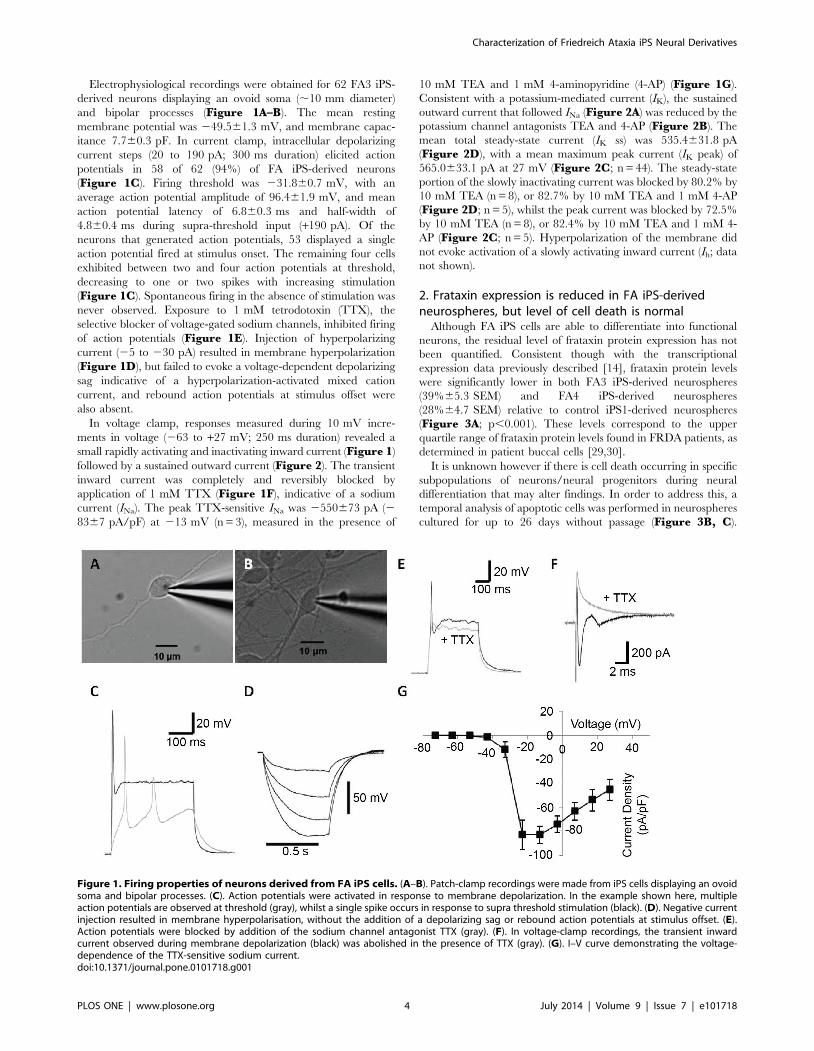
Electrophysiological recordings were obtained for 62 FA3 iPS-
derived neurons displaying an ovoid soma (,10 mm diameter)
and bipolar processes (Figure 1A–B). The mean resting
membrane potential was 249.561.3 mV, and membrane capac-
itance 7.760.3 pF. In current clamp, intracellular depolarizing
current steps (20 to 190 pA; 300 ms duration) elicited action
potentials in 58 of 62 (94%) of FA iPS-derived neurons
(Figure 1C). Firing threshold was 231.860.7 mV, with an
average action potential amplitude of 96.461.9 mV, and mean
action potential latency of 6.860.3 ms and half-width of
4.860.4 ms during supra-threshold input (+190 pA). Of the
neurons that generated action potentials, 53 displayed a single
action potential fired at stimulus onset. The remaining four cells
exhibited between two and four action potentials at threshold,
decreasing to one or two spikes with increasing stimulation
(Figure 1C). Spontaneous firing in the absence of stimulation was
never observed. Exposure to 1 mM tetrodotoxin (TTX), the
selective blocker of voltage-gated sodium channels, inhibited firing
of action potentials (Figure 1E). Injection of hyperpolarizing
current (25 to 230 pA) resulted in membrane hyperpolarization
(Figure 1D), but failed to evoke a voltage-dependent depolarizing
sag indicative of a hyperpolarization-activated mixed cation
current, and rebound action potentials at stimulus offset were
also absent.
In voltage clamp, responses measured during 10 mV incre-
ments in voltage (263 to +27 mV; 250 ms duration) revealed a
small rapidly activating and inactivating inward current (Figure 1)
followed by a sustained outward current (Figure 2). The transient
inward current was completely and reversibly blocked by
application of 1 mM TTX (Figure 1F), indicative of a sodium
current (INa). The peak TTX-sensitive INa was 2550673 pA (2
8367 pA/pF) at 213 mV (n = 3), measured in the presence of
10 mM TEA and 1 mM 4-aminopyridine (4-AP) (Figure 1G).
Consistent with a potassium-mediated current (IK), the sustained
outward current that followed INa (Figure 2A) was reduced by the
potassium channel antagonists TEA and 4-AP (Figure 2B). The
mean total steady-state current (IK ss) was 535.4631.8 pA
(Figure 2D), with a mean maximum peak current (IK peak) of
565.0633.1 pA at 27 mV (Figure 2C; n = 44). The steady-state
portion of the slowly inactivating current was blocked by 80.2% by
10 mM TEA (n = 8), or 82.7% by 10 mM TEA and 1 mM 4-AP
(Figure 2D; n = 5), whilst the peak current was blocked by 72.5%
by 10 mM TEA (n = 8), or 82.4% by 10 mM TEA and 1 mM 4-
AP (Figure 2C; n = 5). Hyperpolarization of the membrane did
not evoke activation of a slowly activating inward current (Ih; data
not shown).
2. Frataxin expression is reduced in FA iPS-derivedneurospheres, but level of cell death is normal
Although FA iPS cells are able to differentiate into functional
neurons, the residual level of frataxin protein expression has not
been quantified. Consistent though with the transcriptional
expression data previously described [14], frataxin protein levels
were significantly lower in both FA3 iPS-derived neurospheres
(39%65.3 SEM) and FA4 iPS-derived neurospheres
(28%64.7 SEM) relative to control iPS1-derived neurospheres
(Figure 3A; p,0.001). These levels correspond to the upper
quartile range of frataxin protein levels found in FRDA patients, as
determined in patient buccal cells [29,30].
It is unknown however if there is cell death occurring in specific
subpopulations of neurons/neural progenitors during neural
differentiation that may alter findings. In order to address this, a
temporal analysis of apoptotic cells was performed in neurospheres
cultured for up to 26 days without passage (Figure 3B, C).
Figure 1. Firing properties of neurons derived from FA iPS cells. (A–B). Patch-clamp recordings were made from iPS cells displaying an ovoidsoma and bipolar processes. (C). Action potentials were activated in response to membrane depolarization. In the example shown here, multipleaction potentials are observed at threshold (gray), whilst a single spike occurs in response to supra threshold stimulation (black). (D). Negative currentinjection resulted in membrane hyperpolarisation, without the addition of a depolarizing sag or rebound action potentials at stimulus offset. (E).Action potentials were blocked by addition of the sodium channel antagonist TTX (gray). (F). In voltage-clamp recordings, the transient inwardcurrent observed during membrane depolarization (black) was abolished in the presence of TTX (gray). (G). I–V curve demonstrating the voltage-dependence of the TTX-sensitive sodium current.doi:10.1371/journal.pone.0101718.g001
Characterization of Friedreich Ataxia iPS Neural Derivatives
PLOS ONE | www.plosone.org 4 July 2014 | Volume 9 | Issue 7 | e101718
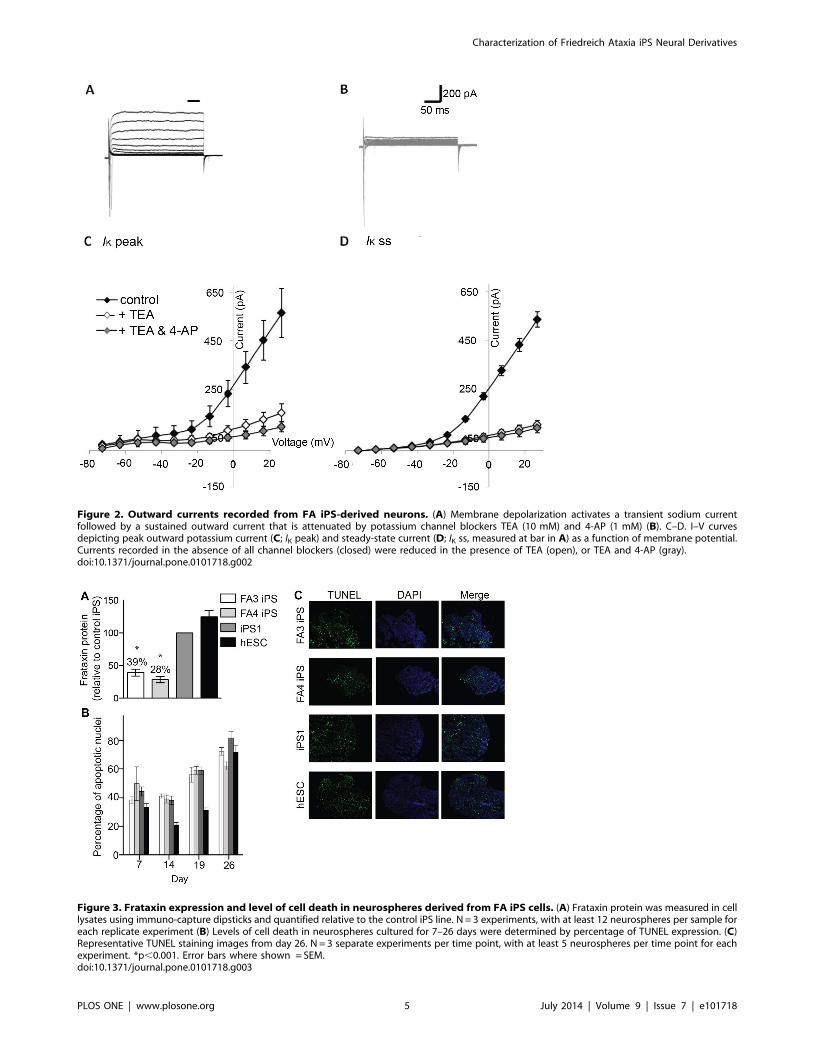
Figure 2. Outward currents recorded from FA iPS-derived neurons. (A) Membrane depolarization activates a transient sodium currentfollowed by a sustained outward current that is attenuated by potassium channel blockers TEA (10 mM) and 4-AP (1 mM) (B). C–D. I–V curvesdepicting peak outward potassium current (C; IK peak) and steady-state current (D; IK ss, measured at bar in A) as a function of membrane potential.Currents recorded in the absence of all channel blockers (closed) were reduced in the presence of TEA (open), or TEA and 4-AP (gray).doi:10.1371/journal.pone.0101718.g002
Figure 3. Frataxin expression and level of cell death in neurospheres derived from FA iPS cells. (A) Frataxin protein was measured in celllysates using immuno-capture dipsticks and quantified relative to the control iPS line. N = 3 experiments, with at least 12 neurospheres per sample foreach replicate experiment (B) Levels of cell death in neurospheres cultured for 7–26 days were determined by percentage of TUNEL expression. (C)Representative TUNEL staining images from day 26. N = 3 separate experiments per time point, with at least 5 neurospheres per time point for eachexperiment. *p,0.001. Error bars where shown = SEM.doi:10.1371/journal.pone.0101718.g003
Characterization of Friedreich Ataxia iPS Neural Derivatives
PLOS ONE | www.plosone.org 5 July 2014 | Volume 9 | Issue 7 | e101718
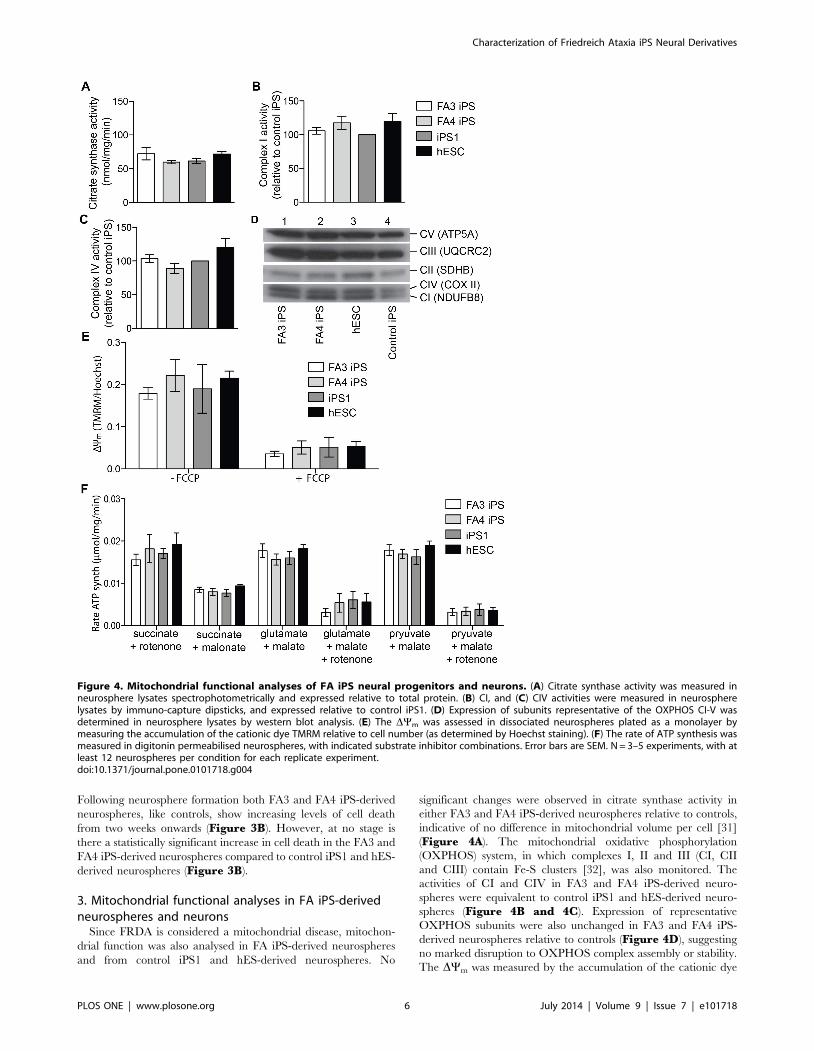
Following neurosphere formation both FA3 and FA4 iPS-derived
neurospheres, like controls, show increasing levels of cell death
from two weeks onwards (Figure 3B). However, at no stage is
there a statistically significant increase in cell death in the FA3 and
FA4 iPS-derived neurospheres compared to control iPS1 and hES-
derived neurospheres (Figure 3B).
3. Mitochondrial functional analyses in FA iPS-derivedneurospheres and neurons
Since FRDA is considered a mitochondrial disease, mitochon-
drial function was also analysed in FA iPS-derived neurospheres
and from control iPS1 and hES-derived neurospheres. No
significant changes were observed in citrate synthase activity in
either FA3 and FA4 iPS-derived neurospheres relative to controls,
indicative of no difference in mitochondrial volume per cell [31]
(Figure 4A). The mitochondrial oxidative phosphorylation
(OXPHOS) system, in which complexes I, II and III (CI, CII
and CIII) contain Fe-S clusters [32], was also monitored. The
activities of CI and CIV in FA3 and FA4 iPS-derived neuro-
spheres were equivalent to control iPS1 and hES-derived neuro-
spheres (Figure 4B and 4C). Expression of representative
OXPHOS subunits were also unchanged in FA3 and FA4 iPS-
derived neurospheres relative to controls (Figure 4D), suggesting
no marked disruption to OXPHOS complex assembly or stability.
The DYm was measured by the accumulation of the cationic dye
Figure 4. Mitochondrial functional analyses of FA iPS neural progenitors and neurons. (A) Citrate synthase activity was measured inneurosphere lysates spectrophotometrically and expressed relative to total protein. (B) CI, and (C) CIV activities were measured in neurospherelysates by immuno-capture dipsticks, and expressed relative to control iPS1. (D) Expression of subunits representative of the OXPHOS CI-V wasdetermined in neurosphere lysates by western blot analysis. (E) The DYm was assessed in dissociated neurospheres plated as a monolayer bymeasuring the accumulation of the cationic dye TMRM relative to cell number (as determined by Hoechst staining). (F) The rate of ATP synthesis wasmeasured in digitonin permeabilised neurospheres, with indicated substrate inhibitor combinations. Error bars are SEM. N = 3–5 experiments, with atleast 12 neurospheres per condition for each replicate experiment.doi:10.1371/journal.pone.0101718.g004
Characterization of Friedreich Ataxia iPS Neural Derivatives
PLOS ONE | www.plosone.org 6 July 2014 | Volume 9 | Issue 7 | e101718
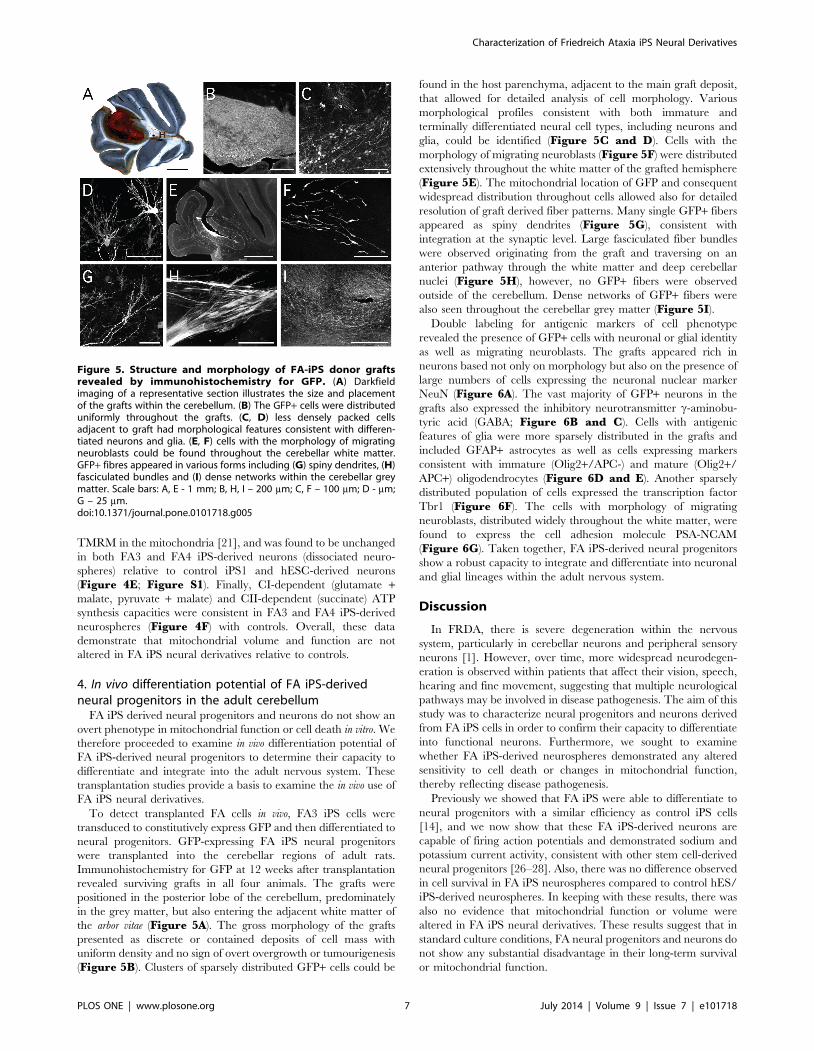
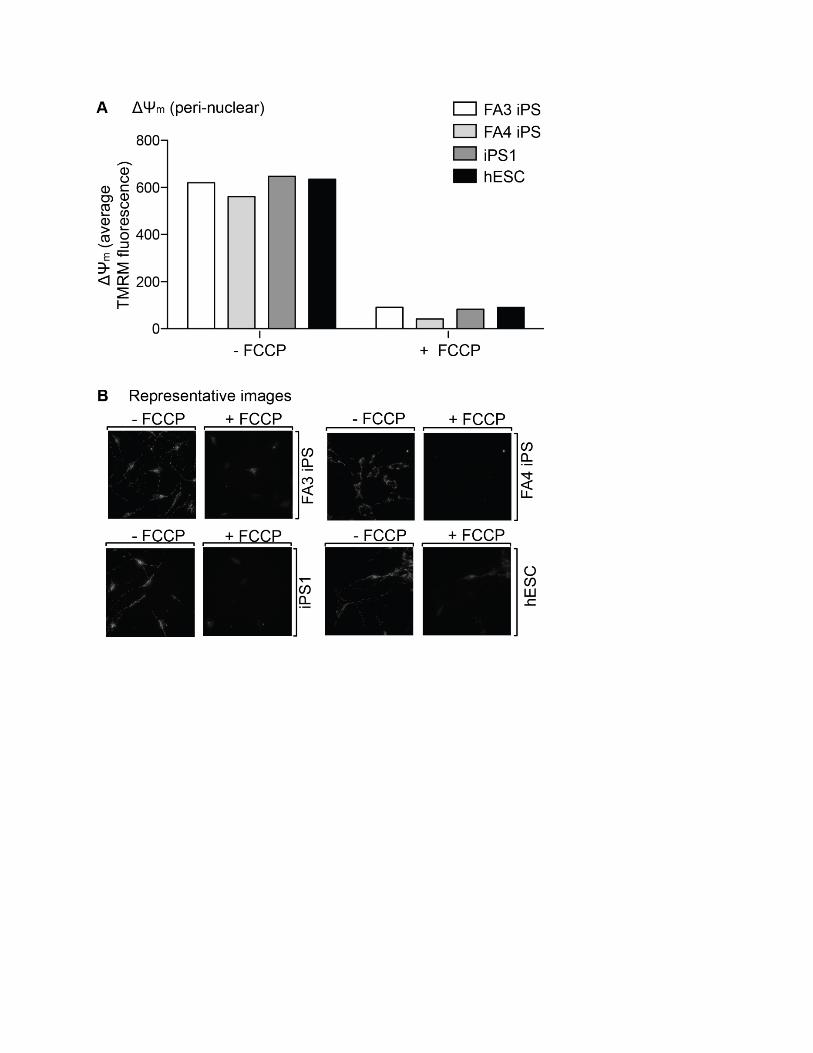
TMRM in the mitochondria [21], and was found to be unchanged
in both FA3 and FA4 iPS-derived neurons (dissociated neuro-
spheres) relative to control iPS1 and hESC-derived neurons
(Figure 4E; Figure S1). Finally, CI-dependent (glutamate +malate, pyruvate + malate) and CII-dependent (succinate) ATP
synthesis capacities were consistent in FA3 and FA4 iPS-derived
neurospheres (Figure 4F) with controls. Overall, these data
demonstrate that mitochondrial volume and function are not
altered in FA iPS neural derivatives relative to controls.
4. In vivo differentiation potential of FA iPS-derivedneural progenitors in the adult cerebellum
FA iPS derived neural progenitors and neurons do not show an
overt phenotype in mitochondrial function or cell death in vitro. We
therefore proceeded to examine in vivo differentiation potential of
FA iPS-derived neural progenitors to determine their capacity to
differentiate and integrate into the adult nervous system. These
transplantation studies provide a basis to examine the in vivo use of
FA iPS neural derivatives.
To detect transplanted FA cells in vivo, FA3 iPS cells were
transduced to constitutively express GFP and then differentiated to
neural progenitors. GFP-expressing FA iPS neural progenitors
were transplanted into the cerebellar regions of adult rats.
Immunohistochemistry for GFP at 12 weeks after transplantation
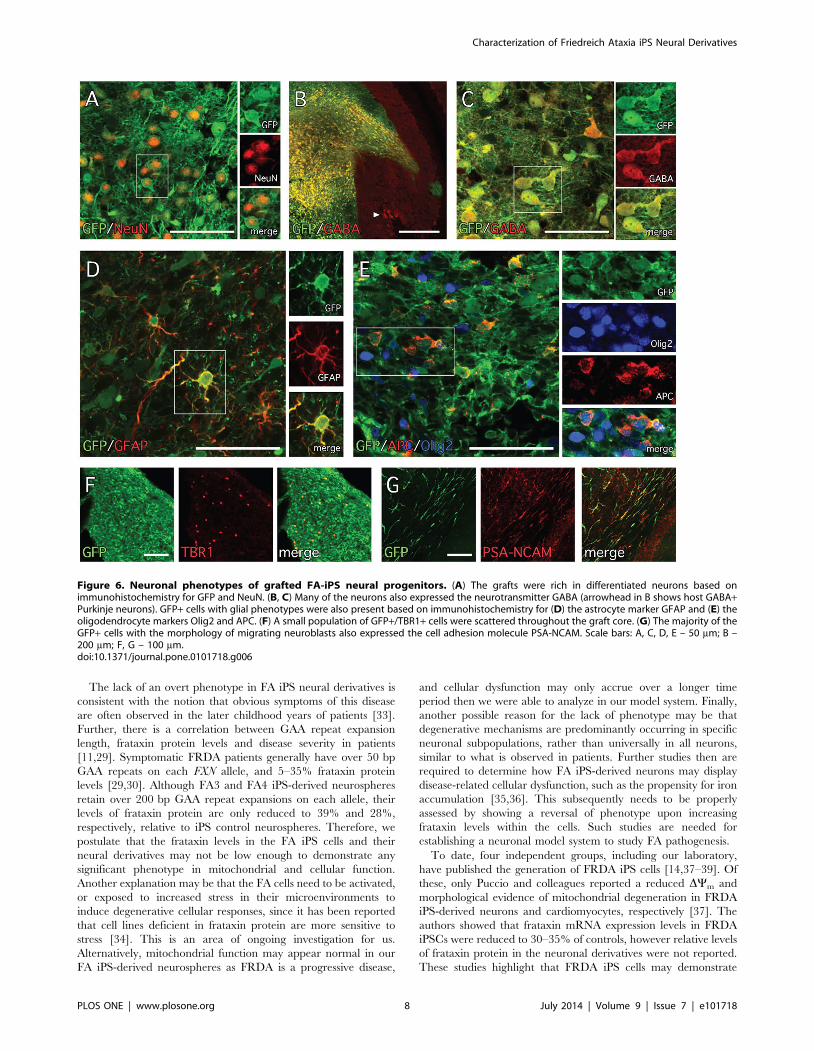
revealed surviving grafts in all four animals. The grafts were
positioned in the posterior lobe of the cerebellum, predominately
in the grey matter, but also entering the adjacent white matter of
the arbor vitae (Figure 5A). The gross morphology of the grafts
presented as discrete or contained deposits of cell mass with
uniform density and no sign of overt overgrowth or tumourigenesis
(Figure 5B). Clusters of sparsely distributed GFP+ cells could be
found in the host parenchyma, adjacent to the main graft deposit,
that allowed for detailed analysis of cell morphology. Various
morphological profiles consistent with both immature and
terminally differentiated neural cell types, including neurons and
glia, could be identified (Figure 5C and D). Cells with the
morphology of migrating neuroblasts (Figure 5F) were distributed
extensively throughout the white matter of the grafted hemisphere
(Figure 5E). The mitochondrial location of GFP and consequent
widespread distribution throughout cells allowed also for detailed
resolution of graft derived fiber patterns. Many single GFP+ fibers
appeared as spiny dendrites (Figure 5G), consistent with
integration at the synaptic level. Large fasciculated fiber bundles
were observed originating from the graft and traversing on an
anterior pathway through the white matter and deep cerebellar
nuclei (Figure 5H), however, no GFP+ fibers were observed
outside of the cerebellum. Dense networks of GFP+ fibers were
also seen throughout the cerebellar grey matter (Figure 5I).
Double labeling for antigenic markers of cell phenotype
revealed the presence of GFP+ cells with neuronal or glial identity
as well as migrating neuroblasts. The grafts appeared rich in
neurons based not only on morphology but also on the presence of
large numbers of cells expressing the neuronal nuclear marker
NeuN (Figure 6A). The vast majority of GFP+ neurons in the
grafts also expressed the inhibitory neurotransmitter c-aminobu-
tyric acid (GABA; Figure 6B and C). Cells with antigenic
features of glia were more sparsely distributed in the grafts and
included GFAP+ astrocytes as well as cells expressing markers
consistent with immature (Olig2+/APC-) and mature (Olig2+/
APC+) oligodendrocytes (Figure 6D and E). Another sparsely
distributed population of cells expressed the transcription factor
Tbr1 (Figure 6F). The cells with morphology of migrating
neuroblasts, distributed widely throughout the white matter, were
found to express the cell adhesion molecule PSA-NCAM
(Figure 6G). Taken together, FA iPS-derived neural progenitors
show a robust capacity to integrate and differentiate into neuronal
and glial lineages within the adult nervous system.
Discussion
In FRDA, there is severe degeneration within the nervous
system, particularly in cerebellar neurons and peripheral sensory
neurons [1]. However, over time, more widespread neurodegen-
eration is observed within patients that affect their vision, speech,
hearing and fine movement, suggesting that multiple neurological
pathways may be involved in disease pathogenesis. The aim of this
study was to characterize neural progenitors and neurons derived
from FA iPS cells in order to confirm their capacity to differentiate
into functional neurons. Furthermore, we sought to examine
whether FA iPS-derived neurospheres demonstrated any altered
sensitivity to cell death or changes in mitochondrial function,
thereby reflecting disease pathogenesis.
Previously we showed that FA iPS were able to differentiate to
neural progenitors with a similar efficiency as control iPS cells
[14], and we now show that these FA iPS-derived neurons are
capable of firing action potentials and demonstrated sodium and
potassium current activity, consistent with other stem cell-derived
neural progenitors [26–28]. Also, there was no difference observed
in cell survival in FA iPS neurospheres compared to control hES/
iPS-derived neurospheres. In keeping with these results, there was
also no evidence that mitochondrial function or volume were
altered in FA iPS neural derivatives. These results suggest that in
standard culture conditions, FA neural progenitors and neurons do
not show any substantial disadvantage in their long-term survival
or mitochondrial function.
Figure 5. Structure and morphology of FA-iPS donor graftsrevealed by immunohistochemistry for GFP. (A) Darkfieldimaging of a representative section illustrates the size and placementof the grafts within the cerebellum. (B) The GFP+ cells were distributeduniformly throughout the grafts. (C, D) less densely packed cellsadjacent to graft had morphological features consistent with differen-tiated neurons and glia. (E, F) cells with the morphology of migratingneuroblasts could be found throughout the cerebellar white matter.GFP+ fibres appeared in various forms including (G) spiny dendrites, (H)fasciculated bundles and (I) dense networks within the cerebellar greymatter. Scale bars: A, E - 1 mm; B, H, I – 200 mm; C, F – 100 mm; D - mm;G – 25 mm.doi:10.1371/journal.pone.0101718.g005
Characterization of Friedreich Ataxia iPS Neural Derivatives
PLOS ONE | www.plosone.org 7 July 2014 | Volume 9 | Issue 7 | e101718
The lack of an overt phenotype in FA iPS neural derivatives is
consistent with the notion that obvious symptoms of this disease
are often observed in the later childhood years of patients [33].
Further, there is a correlation between GAA repeat expansion
length, frataxin protein levels and disease severity in patients
[11,29]. Symptomatic FRDA patients generally have over 50 bp
GAA repeats on each FXN allele, and 5–35% frataxin protein
levels [29,30]. Although FA3 and FA4 iPS-derived neurospheres
retain over 200 bp GAA repeat expansions on each allele, their
levels of frataxin protein are only reduced to 39% and 28%,
respectively, relative to iPS control neurospheres. Therefore, we
postulate that the frataxin levels in the FA iPS cells and their
neural derivatives may not be low enough to demonstrate any
significant phenotype in mitochondrial and cellular function.
Another explanation may be that the FA cells need to be activated,
or exposed to increased stress in their microenvironments to
induce degenerative cellular responses, since it has been reported
that cell lines deficient in frataxin protein are more sensitive to
stress [34]. This is an area of ongoing investigation for us.
Alternatively, mitochondrial function may appear normal in our
FA iPS-derived neurospheres as FRDA is a progressive disease,
and cellular dysfunction may only accrue over a longer time
period then we were able to analyze in our model system. Finally,
another possible reason for the lack of phenotype may be that
degenerative mechanisms are predominantly occurring in specific
neuronal subpopulations, rather than universally in all neurons,
similar to what is observed in patients. Further studies then are
required to determine how FA iPS-derived neurons may display
disease-related cellular dysfunction, such as the propensity for iron
accumulation [35,36]. This subsequently needs to be properly
assessed by showing a reversal of phenotype upon increasing
frataxin levels within the cells. Such studies are needed for
establishing a neuronal model system to study FA pathogenesis.
To date, four independent groups, including our laboratory,
have published the generation of FRDA iPS cells [14,37–39]. Of
these, only Puccio and colleagues reported a reduced DYm and
morphological evidence of mitochondrial degeneration in FRDA
iPS-derived neurons and cardiomyocytes, respectively [37]. The
authors showed that frataxin mRNA expression levels in FRDA
iPSCs were reduced to 30–35% of controls, however relative levels
of frataxin protein in the neuronal derivatives were not reported.
These studies highlight that FRDA iPS cells may demonstrate
Figure 6. Neuronal phenotypes of grafted FA-iPS neural progenitors. (A) The grafts were rich in differentiated neurons based onimmunohistochemistry for GFP and NeuN. (B, C) Many of the neurons also expressed the neurotransmitter GABA (arrowhead in B shows host GABA+Purkinje neurons). GFP+ cells with glial phenotypes were also present based on immunohistochemistry for (D) the astrocyte marker GFAP and (E) theoligodendrocyte markers Olig2 and APC. (F) A small population of GFP+/TBR1+ cells were scattered throughout the graft core. (G) The majority of theGFP+ cells with the morphology of migrating neuroblasts also expressed the cell adhesion molecule PSA-NCAM. Scale bars: A, C, D, E – 50 mm; B –200 mm; F, G – 100 mm.doi:10.1371/journal.pone.0101718.g006
Characterization of Friedreich Ataxia iPS Neural Derivatives
PLOS ONE | www.plosone.org 8 July 2014 | Volume 9 | Issue 7 | e101718
aspects of FRDA degeneration, however the severity may be
variable between different iPS lines given the different genetic
backgrounds, GAA-repeat expansions, frataxin protein levels, and
culture conditions.
This is the first study though to show transplantation of FA iPS-
derived neural progenitors into the adult nervous system. Of
significance, the site of transplantation was in the cerebellum, a
predominant site of degeneration in FRDA. FA iPS donor cells
showed robust differentiation to both neuronal and glial lineages,
and interestingly, FA iPS-derived neurons extended their fascic-
ulated neurites along endogenous white matter tracts. These
results demonstrate the capacity of FA iPS neural derivatives to
survive, differentiate, and structurally integrate into the adult
nervous system. Future studies will be required to analyze their
potential to establish appropriate synaptic connectivity with host
neurons and form functional circuits within existing networks.
These studies support feasibility for the use of patient-derived stem
cells for transplantation into the nervous system as a therapeutic
strategy to treat FRDA, whether it is for cell replacement and/or
as vehicles to secrete factors that may promote regeneration.
Conclusions
Despite not showing an obvious phenotype, neurons derived
from FA iPS cells are still highly useful for screening candidate
compounds that may increase frataxin protein levels and not
induce neurotoxicity. Our studies also demonstrate that neurons
may not require relatively high levels of frataxin protein for their
normal functionality, which is a promising result in terms of
designing therapeutic strategies needed to increase frataxin levels
in FRDA patients. In summary, FA iPS cells are highly valuable
for establishing a human cellular model system of FRDA that can
be further utilised to accelerate development of FRDA treatments.
Supporting Information
Figure S1 Mitochondrial membrane potential in FA iPS-derived neurons. (A) The DYm was assessed by microscopy in
dissociated neurospheres plated as a monolayer by measuring the
accumulation of the cationic dye TMRM in the mitochondrial
rich peri-nuclear region. Greater then 80 cells from a single dish
pre-incubation and post-incubation with the protonophore FCCP
were analysed with representative images in (B).
(TIF)
Figure S2 Indicative images for TUNEL staining, andpost image acquisition analysis in FA iPS-derivedneurons. Indicative images are shown for the TUNEL assay
depicting: the TUNEL stain; DAPI stain; the ‘nuclei’ mask that is
generated from the DAPI stained image; and the merged ‘nuclei’
and TUNEL montage.
(TIF)
Acknowledgments
The authors would like to thank Brian Mendenhall from the USC High
Performance Computing Cluster for installing and testing high content
analysis software.
Author Contributions
Conceived and designed the experiments: MJB KN AEF M. Denham
DRT LHT M. Dottori. Performed the experiments: MJB KN AEF JR JL
SH M. Denham CLP BAN LHT M. Dottori. Analyzed the data: MJB KN
AEF JR JL SH M. Denham MET CLP BAN MP DRT LHT M. Dottori.
Contributed reagents/materials/analysis tools: KN AEF MET CLP MP
LHT DRT M. Dottori. Wrote the paper: MJB KN AEF LHT M. Dottori.
References
1. Pandolfo M (2008) Friedreich ataxia. Archives of Neurology 65: 1296–1303.
doi:10.1001/archneur.65.10.1296.
2. Campuzano V, Montermini L, Molto MD, Pianese L, Cossee M, et al. (1996)
Friedreich’s ataxia: autosomal recessive disease caused by an intronic GAA
triplet repeat expansion. Science 271: 1423–1427.
3. Pandolfo M (2009) Friedreich ataxia: the clinical picture. Journal of Neurology
256 Suppl 1: 3–8. doi:10.1007/s00415-009-1002-3.
4. Herman D, Jenssen K, Burnett R, Soragni E, Perlman SL, et al. (2006) Histone
deacetylase inhibitors reverse gene silencing in Friedreich’s ataxia. Nature
Chemical Biology 2: 551–558. doi:10.1038/nchembio815.
5. Greene E, Mahishi L, Entezam A, Kumari D, Usdin K (2007) Repeat-induced
epigenetic changes in intron 1 of the frataxin gene and its consequences in
Friedreich ataxia. Nucleic Acids Research 35: 3383–3390. doi:10.1093/nar/
gkm271.
6. Seguin A, Bayot A, Dancis A, Rogowska-Wrzesinska A, Auchere F, et al. (2009)
Overexpression of the yeast frataxin homolog (Yfh1): contrasting effects on iron-
sulfur cluster assembly, heme synthesis and resistance to oxidative stress.
Mitochondrion 9: 130–138. doi:10.1016/j.mito.2009.01.007.
7. Sturm B, Bistrich U, Schranzhofer M, Sarsero JP, Rauen U, et al. (2005)
Friedreich’s ataxia, no changes in mitochondrial labile iron in human
lymphoblasts and fibroblasts: a decrease in antioxidative capacity? The Journal
of Biological Chemistry 280: 6701–6708. doi:10.1074/jbc.M408717200.
8. Kakhlon O, Manning H, Breuer W, Melamed-Book N, Lu C, et al. (2008) Cell
functions impaired by frataxin deficiency are restored by drug-mediated iron
relocation. Blood 112: 5219–5227. doi:10.1182/blood-2008-06-161919.
9. Rotig A, de Lonlay P, Chretien D, Foury F, Koenig M, et al. (1997) Aconitase
and mitochondrial iron-sulphur protein deficiency in Friedreich ataxia. Nature
Genetics 17: 215–217. doi:10.1038/ng1097-215.
10. Lodi R, Cooper JM, Bradley JL, Manners D, Styles P, et al. (1999) Deficit of in
vivo mitochondrial ATP production in patients with Friedreich ataxia.
Proceedings of the National Academy of Sciences 96: 11492–11495.
11. Bradley JL, Blake JC, Chamberlain S, Thomas PK, Cooper JM, et al. (2000)
Clinical, biochemical and molecular genetic correlations in Friedreich’s ataxia.
Human Molecular Genetics 9: 275–282.
12. Heidari MM, Houshmand M, Hosseinkhani S, Nafissi S, Khatami M (2009)
Complex I and ATP content deficiency in lymphocytes from Friedreich’s ataxia.
The Canadian Journal of Neurological Sciences 36: 26–31.
13. Selak MA, Lyver E, Micklow E, Deutsch EC, Onder O, et al. (2011) Blood cells
from Friedreich ataxia patients harbor frataxin deficiency without a loss ofmitochondrial function. Mitochondrion 11: 342–350. doi:10.1016/
j.mito.2010.12.003.
14. Liu J, Verma PJ, Evans-Galea MV, Delatycki MB, Michalska A, et al. (2011)
Generation of induced pluripotent stem cell lines from Friedreich ataxia patients.Stem Cell Reviews 7: 703–713. doi:10.1007/s12015-010-9210-x.
15. Denham M, Bye C, Leung J, Conley BJ, Thompson LH, et al. (2012) Glycogen
synthase kinase 3b and activin/nodal inhibition in human embryonic stem cellsinduces a pre-neuroepithelial state that is required for specification to a floor
plate cell lineage. Stem Cells 30: 2400–2411. doi:10.1002/stem.1204.
16. Denham M, Dottori M (2011) Neural differentiation of induced pluripotent stem
cells. Methods in Molecular Biology 793: 99–110. doi:10.1007/978-1-61779-328-8_7.
17. Meijering EH, Niessen WJ, Viergever MA (2001) Quantitative evaluation of
convolution-based methods for medical image interpolation. Medical Image
Analysis 5: 111–126.
18. Carpenter AE, Jones TR, Lamprecht MR, Clarke C, Kang IH, et al. (2006)CellProfiler: image analysis software for identifying and quantifying cell
phenotypes. Genome Biology 7: R100. doi:10.1186/gb-2006-7-10-r100.
19. Vonesch C, Unser M (2008) A fast thresholded landweber algorithm for wavelet-
regularized multidimensional deconvolution. IEEE Transactions on ImageProcessing 17: 539–549. doi:10.1109/TIP.2008.917103.
20. Sommer C, Straehle C, Kothe U, Hamprecht FA (2011) In Biomedical Imaging:
From Nano to Macro - Ilastik. IEEE International Symposium on 23/3/2011.
21. Wanders RJ, Ruiter JP, Wijburg FA (1993) Studies on mitochondrial oxidativephosphorylation in permeabilized human skin fibroblasts: application to
mitochondrial encephalomyopathies. Biochimica et Biophysica Acta (BBA) -
Molecular Basis of Disease 1181: 219–222.
22. Frazier AE, Thorburn DR (2012) Biochemical analyses of the electron transportchain complexes by spectrophotometry. Methods in Molecular Biology 837: 49–
62. doi:10.1007/978-1-61779-504-6_4.
23. Calvo SE, Tucker EJ, Compton AG, Kirby DM, Crawford G, et al. (2010)
High-throughput, pooled sequencing identifies mutations in NUBPL andFOXRED1 in human complex I deficiency. Nature Genetics 42: 851–858.
doi:10.1038/ng.659.
24. Nikkhah G, Winkler C, Rodter A, Samii M (2000) Microtransplantation ofNigral Dopamine Neurons. Neuromethods 36: 207–231.
Characterization of Friedreich Ataxia iPS Neural Derivatives
PLOS ONE | www.plosone.org 9 July 2014 | Volume 9 | Issue 7 | e101718
25. Thompson L, Barraud P, Andersson E, Kirik D, Bjorklund A (2005)
Identification of dopaminergic neurons of nigral and ventral tegmental areasubtypes in grafts of fetal ventral mesencephalon based on cell morphology,
protein expression, and efferent projections. The Journal of Neuroscience 25:
6467–6477. doi:10.1523/JNEUROSCI.1676-05.2005.26. Coyne L, Shan M, Przyborski SA, Hirakawa R, Halliwell RF (2011)
Neuropharmacological properties of neurons derived from human stem cells.Neurochemistry International 59: 404–412. doi:10.1016/j.neuint.2011.01.022.
27. Needham K, Hyakumura T, Gunewardene N, Dottori M, Nayagam BA (2014)
Electrophysiological properties of neurosensory progenitors derived from humanembryonic stem cells. Stem Cell Reseearch 12: 241–249. doi:10.1016/
j.scr.2013.10.011.28. Hick A, Wattenhofer-Donze M, Chintawar S, Tropel P, Simard JP, et al. (2013)
Neurons and cardiomyocytes derived from induced pluripotent stem cells as amodel for mitochondrial defects in Friedreich’s ataxia. Disease Models &
Mechanisms 6: 608–621. doi:10.1242/dmm.010900.
29. Deutsch EC, Santani AB, Perlman SL, Farmer JM, Stolle CA, et al. (2010) Arapid, noninvasive immunoassay for frataxin: utility in assessment of Friedreich
ataxia. Molecular Genetics & Metabolism 101: 238–245. doi:10.1016/j.ymgme.2010.07.001.
30. Campuzano V, Montermini L, Lutz Y, Cova L, Hindelang C, et al. (1997)
Frataxin is reduced in Friedreich ataxia patients and is associated withmitochondrial membranes. Human Molecular Genetics 6: 1771–1780.
31. Bernier FP, Boneh A, Dennett X, Chow CW, Cleary MA, et al. (2002)Diagnostic criteria for respiratory chain disorders in adults and children.
Neurology 59: 1406–1411.
32. Rouault TA, Tong W-H (2008) Iron–sulfur cluster biogenesis and human
disease. Trends in Genetics 24: 398–407. doi:10.1016/j.tig.2008.05.008.33. Delatycki MB, Corben LA (2012) Clinical features of Friedreich ataxia. Journal
of Child Neurology 27: 1133–1137. doi:10.1177/0883073812448230.
34. Calabrese V, Lodi R, Tonon C, D’Agata V, Sapienza M, et al. (2005) Oxidativestress, mitochondrial dysfunction and cellular stress response in Friedreich’s
ataxia. Journal of the Neurological Sciences 233: 145–162. doi:10.1016/j.jns.2005.03.012.
35. Cossee M, Puccio H, Gansmuller A, Koutnikova H, Dierich A, et al. (2000)
Inactivation of the Friedreich ataxia mouse gene leads to early embryoniclethality without iron accumulation. Human Molecular Genetics 9: 1219–1226.
36. Puccio H, Simon D, Cossee M, Criqui-Filipe P, Tiziano F, et al. (2001) Mousemodels for Friedreich ataxia exhibit cardiomyopathy, sensory nerve defect and
Fe-S enzyme deficiency followed by intramitochondrial iron deposits. NatureGenetics 27: 181–186. doi:10.1038/84818.
37. Hick A, Wattenhofer-Donze M, Chintawar S, Tropel P, Simard JP, et al. (2013)
Neurons and cardiomyocytes derived from induced pluripotent stem cells as amodel for mitochondrial defects in Friedreich’s ataxia. Disease Models &
Mechanisms 6: 608–621.38. Ku S, Soragni E, Campau E, Thomas EA, Altun G, et al. (2010) Friedreich’s
ataxia induced pluripotent stem cells model intergenerational GAA?TTC triplet
repeat instability. Cell Stem Cell 7: 631–637. doi:10.1016/j.stem.2010.09.014.39. Eigentler A, Boesch S, Schneider R, Dechant G, Nat R (2013) Induced
pluripotent stem cells from friedreich ataxia patients fail to upregulate frataxinduring in vitro differentiation to peripheral sensory neurons. Stem Cells and
Development 22: 3271–3282. doi:10.1089/scd.2013.0126.
Characterization of Friedreich Ataxia iPS Neural Derivatives
PLOS ONE | www.plosone.org 10 July 2014 | Volume 9 | Issue 7 | e101718


![Antioxidants and other pharmacological treatments for ... · [Intervention Review] Antioxidants and other pharmacological treatments for Friedreich ataxia Mary Kearney1, Richard W](https://img.pdfslide.net/doc/110x75/5b03caf57f8b9a2d518caa5e/antioxidants-and-other-pharmacological-treatments-for-intervention-review-antioxidants.jpg)