Embed Size (px)
Citation preview
Functional ecology of secondary forests
in Chiapas, Mexico
Madelon Lohbeck
AV2010-19

2
MWM Lohbeck
Functional Ecology of Secondary forests in Chiapas, Mexico
Master thesis Forest Ecology and Forest Management Group
FEM 80439 and FEM 80436
April 2010, AV2010-19
Supervisors:
Prof. Dr. Frans Bongers (Forest Ecology and Forest Management group, Centre for Ecosystem
Studies, Wageningen University and Research centre, the Netherlands)
Dr. Horacio Paz (Centro de Investigaciones en Ecosistemas, Universidad Nacional Autonóma
de México, Mexico)
All rights reserved. This work may not be copied in whole or in parts without the written
permission of the supervisor.
3
Table of contents
General introduction 5
Acknowledgements 8
Chapter 1: Environmental filtering of functional traits as a driver of 9
community assembly during secondary succession in tropical wet forest of Mexico
Chapter 2. Functional traits related to changing environmental conditions during 27
secondary succession: Environmental filtering and the slow-fast continuum
Chapter 3. Functional and species diversity in tropical wet forest succession 48
Chapter 4. Functional diversity as a tool in predicting community assembly 65
processes
4
List of tables and figures
General introduction
Figure 1: General overview of the study area in Chiapas, Mexico 6
Chapter 1
Table 1: Leaf trait abbreviations and descriptions 13
Figure 1: Pathmodel showing the causal relations between age, stand 15
structure, environment and functional traits
Figure 2: Stand structure in time since abandonment 15
Figure 3: The secondary forest sites separated based on subcanopy 16
environmental conditions
Figure 4: Variation in environmental conditions explained by age 16
Figure 5: Stand structure variables explaining environmental conditions 17
Figure 6: The secondary forest sites separated based on traits values 18
Figure 7: Light availability explains variation in non-weighted trait values 18
Figure 8: Temperature and soil water contents explain variation in 19
weighted trait values
Chapter 2
Table 1: Leaf trait abbreviations and descriptions 29
Figure 1: PCA ordination of Chajul’s 82 species included in the study 33
Figure 2: The secondary forest sites separated based on subcanopy 35
environmental conditions
Figure 3: Variation in environmental conditions explained by age 35
Figure 4: Trait-environment relations 36
Chapter 3
Table 1: Leaf trait abbreviations and descriptions 52
Table 2: Overview of the diversity indices used 54
Table 3: Pearson correlations of diversity changes with time after 55
abandonment
Figure 1: Species and functional diversity changes during secondary 56
succession
Figure 2: Functional diversity as a function of species diversity indices 57
Chapter 4
Figure 1: Illustration of the different steps of assembly processes 67
Figure 2: weighted and non weighted functional diversity to indicate 67
assembly processes
Figure 3: The relative dissimilarity of dominant species against 70
successional time for all traits
Figure 4: The relative dissimilarity of dominant species against 71
successional time for the traits separate
5
General introduction
Secondary and degraded forests are increasing in surface and importance in wet tropical
regions (Guariguata & Ostertag 2001) and should be included in conservation strategies
when taking a more integrated view on tropical landscapes (Letcher & Chazdon 2009).
Secondary forests are forests that have naturally regenerated after complete clearance of
the vegetation through anthropogenic disturbance. What processes are underlying natural
regeneration on abandoned agricultural land has been a key challenge in ecology and their
study has become increasingly relevant in times of global change in climate and land-use
(Naeem & Wright 2003).
In our study location in Chiapas, Mexico (Figure 1) secondary forests are largely part of
swidden fallow or shifting cultivation systems, which are common throughout the tropics
and one of the major factors causing deforestation (e.g. Fox et al. 2000). Shifting cultivation
is the dominant cause of deforestation in tropical Mexico (Turner et al. 2001) and 48% of
deforestation cases are associated with this type of land use worldwide (Geist & Lambin
2002). Although shifting cultivation of maize in Mexico (the ‘milpa’) is appreciated for the
multiple use of tropical forest where crops and non-food crops from secondary forests are
sequentially harvested (Alcorn and Toledo 1998), the sustainability of this land-use type
depends on underlying economic, institutional, political, social and demographic forces
which vary across regions. Though shifting cultivation has been practiced for over centuries,
it has become increasingly unsustainable due to rapid expansion by clearance of old-growth
forest and intensification by reducing the fallow period (e.g. Geist & Lambin 2002; Toledo et
al. 2003).
Studying secondary succession after abandonment of the cultivated fields deals with forest
recovery after clearance. During secondary succession the structure of the vegetation, the
local environmental conditions and the vegetation composition change. Predictable shifts in
selected functional types occur where some functional traits replace others during this
process (e.g. McKinney & Lockwood 1999; Grime et al. 2000; Díaz et al. 2007). Functional
traits are physical attributes caused by genetic expression which serve as indicators or
estimators of plant responses to environmental factors (Lavorel & Garnier 2002; Cornelissen
et al. 2003) and their value and range are thought to be important contributors to
ecosystem processes (Tilman 2001). Because secondary succession can be described as
ongoing community assembly, it provides a suitable background against which functional
composition of communities can be analyzed to attain information on drivers of community
assembly and trade-offs in species’ functional strategies. Understanding the functional
ecology of secondary succession is relevant to be able to conclude on the effect of global
change drivers (agricultural expansion, intensified shifting cultivation) on ecosystem
functioning and ecosystem services or when management priorities seek to manipulate
species composition (Loreau et al. 2001). Current master thesis focuses only on part of this
issue by deepening our insights into forest recovery after shifting cultivation and driving
forces behind natural regeneration. This is done through studying patterns of changing
functional composition during secondary succession after deforestation for maize cultivation
by unraveling stand characteristics, environmental gradients, species composition,
functional traits and functional diversity. Present study contains in depth studies on the
following four aspects (chapter 1 - 4) which are written as independent articles.
6
1. Environmental filtering of functional traits as a driver of community assembly during
secondary succession in tropical wet forest of Mexico
We analyzed major changes in community composition during secondary succession with a
stepwise approach; fallow age influencing stand basal area, which influences understory
environmental conditions which in turn explain community functional trait composition.
2. Functional traits related to changing environmental conditions during secondary
succession: Environmental filtering and the slow-fast continuum
We tested the slow- fast (growth- survival) trade off in secondary forest species’ functional
strategies and the environmental filtering hypothesis by testing for consistent trait-
environment linkages along a successional gradient.
3. Functional and species diversity in tropical wet forest succession
We studied functional diversity changes along secondary succession and how functional
diversity relates to species diversity.
4. Functional diversity as a tool in predicting community assembly processes
We used functional diversity as a tool to analyze whether environmental filtering or
competition selects few of the species present to become dominant and how this changes
with succession.
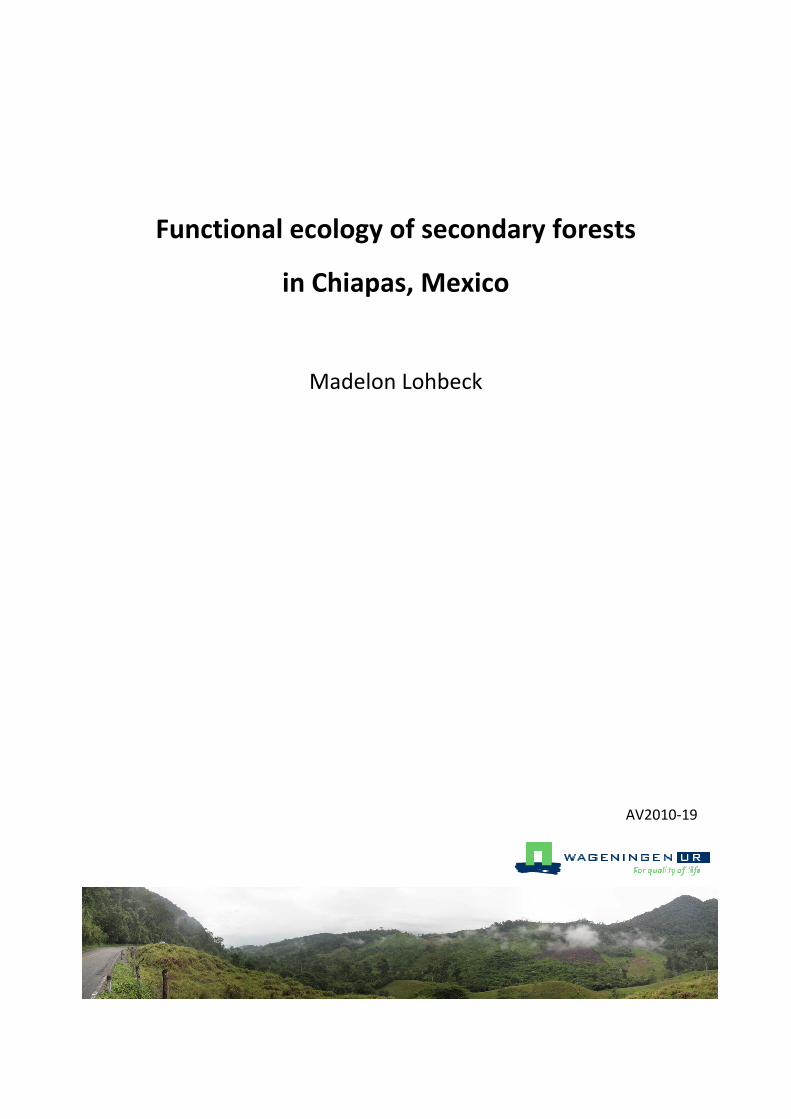
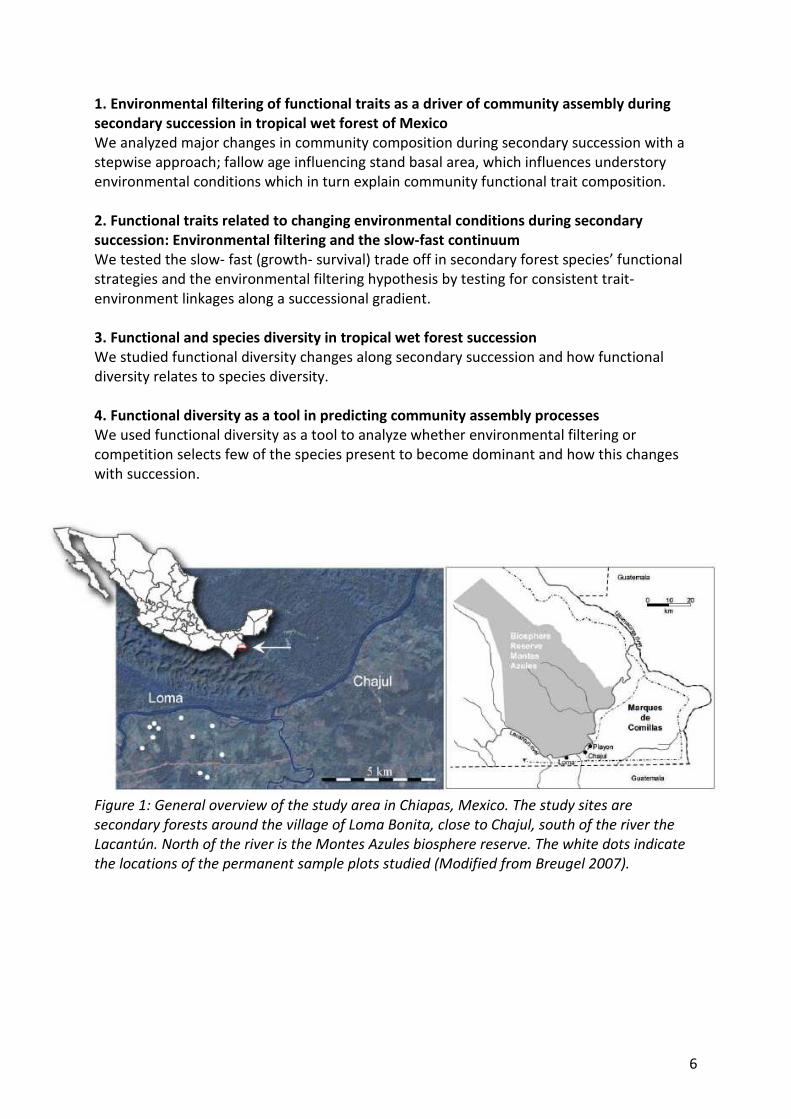
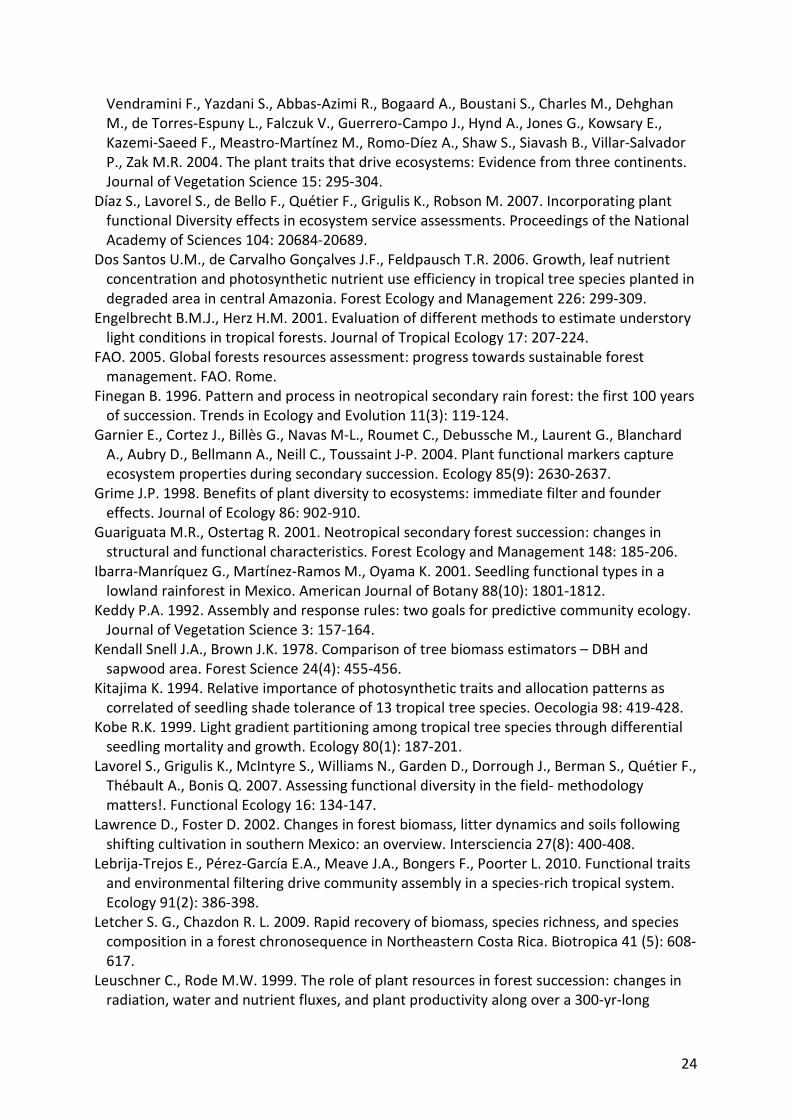
Figure 1: General overview of the study area in Chiapas, Mexico. The study sites are
secondary forests around the village of Loma Bonita, close to Chajul, south of the river the
Lacantún. North of the river is the Montes Azules biosphere reserve. The white dots indicate
the locations of the permanent sample plots studied (Modified from Breugel 2007).
7
References
Alcorn J.B., Toledo V.M. 1998. Resilient resource management in Mexico’s forest
ecosystems: the contribution of property rights. Pages 216-249 in F. Berkes and C. Folke
(eds.) Linking social and ecological systems: management practices and social
mechanisms for building resilience. Cambridge University Press, Cambridge, UK.
Breugel van M. 2007. Dynamics of secondary forests. PhD thesis, Wageningen University,
Wageningen, The Netherlands.
Cornelissen J.H.C., Lavorel S., Garnier E., Díaz S., Buchmann N., Gurvich D.E., Reich P.B., ter
Steege H., Morgan H.D., van der Heijden M.G.A., Pausas J.G. , Poorter H. 2003. A
handbook of protocols for standardized and easy measurement of plant functional traits
worldwide, Australian Journal of Botany 51: 335–380.
Díaz S., Lavorel S., Chapin III F.S., Tecco P.A., Gurvich D.E., Grigulis K. 2007. Functional
diversity – at the crossroads between ecosystem functioning and environmental filters.
Chapter 7. Terrestrial Ecosystems in s Changing World. Springer Berlin Heidelberg.
Fox J., Truong D.M., Rambo A.T. Tuyen N.P., Cuc L.T., Leisz S. 2000. Shifting cultivation: A
new old paradigm for managing tropical forests. Bioscience 50(6): 521-528.
Geist H.J., Lambin E.F. 2002. Proximate causes and underlying driving forces of tropical
deforestation. Bioscience 52(2): 143-150.
Grime J.P., Brown V.K., Thompson K., Masters G.J., Hillier S.H., Clarke I.P., Askew Q.P., Corker
D., Kielty J.P. 2000. The response of two contrasting limestone grasslands to simulated
climate change. Science 289: 762-765.
Guariguata M.R., Ostertag R. 2001. Neotropical secondary forest succession: changes in
structural and functional characteristics. Forest Ecology and Management 148: 185-206.
Lavorel S., Garnier E. 2002. Predicting changes in community composition and ecosystem
functioning from plant traits: revisiting the holy grail. Functional Ecology 16(5): 545-556.
Letcher S. G., Chazdon R. L. 2009. Rapid recovery of biomass, species richness, and species
composition in a forest chronosequence in Northeastern Costa Rica. Biotropica 41(5):
608-617.
Loraeu M., Naeem S., Inchausti P., Brengtsson J., Grime J.P., Hector A., Hooper D.U., Huston
M.A., Rafaelli D., Schmid B., Tilman D. Wardle D.A. 2001. Biodiversity and ecosystem
functioning: current knowledge and future challenges. Science 294: 804-808.
Naeem S., Wright J.P. 2003. Disentangling biodiversity effects on ecosystem functioning:
deriving solutions to a seemingly insurmountable problem. Ecology Letters 6: 567-579.
McKinney M.L., Lockwood J.L. 1999. Biotic homogenization: a few winners replacing many
losers in the next mass extinction. Trends in Ecology and Evolution. Volume 14.
Tilman D. 2001. Functional diversity. Encyclopaedia of Biodiversity Volume 3. Academia
Press.
Toledo V.M., Ortiz-espejel B., Cortés L., Moguel P., Ordoñez M.J. 2003. The multiple use of
tropical forests by indigenous peoples in Mexico: a case of adaptive management.
Conservation Ecology 7(3): http://www.ecologyandsociety.org/vol7/iss3/art9/print.pdf
Turner II B.L., Cortina Villar S., Foster D., Geoghegan J., Keys E., Klepeis P., Lawrence D.,
Macario Mendoza P., Ogneva-Himmelberger Y., Plotkin A.B., Pérez Salicrup D.,
Chowdhury R.R., Savitsky B., Schneider L., Schmook B., Vance C. 2001. Deforestation in
the southern Yucatán peninsular region: an integrative approach. Forest Ecology and
Management 154: 353-370.

8
Acknowledgements
I thank my supervisors Frans Bongers (WUR) and Horacio Paz (CIEco, UNAM) for their
support during my thesis proposal and with the analysis and report writing. Gilberto
Jamangapee has been of invaluable assistance with species identification, also Bas
Verschuuren has provided great support especially during the period of fieldwork. Further I
am indebted to Lourens Poorter and Michiel van Breugel for their valuable comments which
have significantly improved my work. Also I am grateful to Robin Chazdon and the NeoSelvas
network for allowing me to participate in their workshop where I gained helpful insights in
secondary forests. Lastly I would like to thank Laura Pla for sharing her expertise on the use
and application of functional diversity indices.
9
Chapter 1: Environmental filtering of functional traits as a driver of community
assembly during secondary succession in tropical wet forest of Mexico
Abstract
Environmental filtering is seen as one of the major selective forces shaping community
assembly, implying that community membership is restricted to those species that can reach
the site and establish under the specific environmental conditions.
In this study we tested the environmental filtering hypothesis, analyzing forest development
in terms of stand structure, subcanopy environmental conditions and functional traits for a
large set of species along a chronosequence in tropical wet forest of Mexico.
As hypothesized, we found that with fallow age the stand structure and environmental
conditions change directionally and that variation in plant functional traits is related to these
environmental changes. This strongly indicates that environmental filtering shapes plant
communities. Furthermore this study shows that habitat filtering takes place at different
levels of community assembly, one level determining species presence and another shaping
species dominance, and distinct environmental conditions are found to explain these
aspects. Light availability influences presence of species with certain traits whereas air
temperature and soil water contents determine successfulness (abundance) of traits. If
indeed ecosystem functioning is largely determined by the dominant species, as predicted
by Grime’s biomass ratio hypothesis, these findings suggest major effects of climate change
on functioning of tropical forests.
Keywords: Secondary succession; Stand structure; Environmental conditions; Functional
traits; Community assembly; Environmental filtering; Chronosequence; Mexico; Wet tropical
forest
Introduction
Over 50% of the world’s forests are modified natural forests; forests of naturally
regenerated native species with clearly visible indications of human activity (FAO 2005).
Secondary and degraded forests are increasing in surface and importance in wet tropical
regions throughout the world and should be included in conservation strategies when taking
a more integral view of tropical landscapes (Letcher & Chazdon 2009). What processes are
underlying natural regeneration on abandoned agricultural land has been a key challenge in
ecology and their study has become increasingly relevant in times of global change in climate
and land-use (Naeem & Wright 2003).
A mechanistic explanation of community assembly states that community membership is
restricted to those species that are able to reach the site and establish under the specific
environmental conditions (Belyea & Lancaster 1999). This theory predicts that functional
profiles (certain sets of functional traits) along gradients are shaped by the process of
environmental filtering; a hierarchical set of filters removing species which lack traits
(morphological, physiological and ecological) for persistence under particular circumstances.
Examples of major environmental filters that determine which traits and functions can
persist at a given site are climate, disturbance regime, soil and atmospheric conditions
(Keddy 1992; Díaz et al. 1998, 2007).
10
The environmental filtering theory has been tested on a gradient of forest development. As
the forest develops community structure, environment and species composition change
over time (Lebrija-Trejos et al. 2010). Secondary succession is studied using age as an
independent factor influencing stand structure, which in turn alters the environmental
conditions that filter for functional traits persisting at a site. This stepwise approach is based
on previous findings that community structure drives succession, as opposed to fallow age
per se which is more a compound variable reflecting community organization at a certain
point during succession (Breugel et al. 2006).
Chronosequence studies on tropical forest succession invariably show that basal area
increases with fallow age (e.g. Saldarriaga et al. 1988; Brown & Lugo 1990; Peña-Claros
2003; Chazdon et al. 2007), albeit at very different rates (Guariguata & Ostertag 2001). A
study in the same region also showed basal area to increase in early stages of succession due
to growth effects overriding effects of recruitment and mortality (Breugel et al. 2006). Stand
density is expected to decrease with time as biomass will be accumulated in fewer but
bigger individuals (e.g. Brown & Lugo 1990), however density may show unclear patterns
due to highly variable patterns of mortality and recruitment between sites in
chronosequence studies (Chazdon et al. 2007).
Stand structure influences light availability, something that is extensively studied, especially
in the light of tree seedling regeneration (e.g. Denslow et al. 1990; Palik et al. 1997; Nicotra
et al. 1999). Lebrija-Trejos et al. (2010) showed that as the structure of the woody
vegetation changes the understory environmental conditions change in Mexican dry forest,
where Photosynthetic Photon Flux Density, air temperature, soil temperature and soil water
potential were assessed. In the present study we assessed the variables light availability, air
temperature, air relative humidity, soil water contents and soil temperature in their relation
to stand basal area and stand density. The relation between stand structure and understory
environmental conditions is best described by changes in basal area. Tree basal area is an
accepted predictor of foliar biomass and with that of leaf area index (e.g. Kendal Snell &
Brown 1978; Burton et al. 1991). Because increased leaf area index is directly related to the
light available in the understory (Beer-Lambert law), increased leaf area index reduces
understory temperatures and is expected to reduce evaporation causing increases in the
relative humidity and soil water content. This in line with previous study results in the same
area where air and soil temperature, canopy openness and Photosynthetic Active Radiation
decreased during secondary succession whereas soil water contents increased (Ricaño-
Rocha 2007).
Plants are functionally adapted to grow under specific environmental conditions. Through
the process of habitat filtering specific functional types are selected from the regional
species pool (e.g. Diamond 1975; Keddy 1992). Even though correlation does not prove
causation, broad patterns of trait-environment relations have been described and used as an
indication of the effect of environmental filtering. Functional traits adaptations related to
successional status are based on a trade-off in plant design that allows fast growing types
with a rapid acquisition of resources in the high light early stages of succession, and slow
functional types that permit conservation of resources in late successional stages where light
has become limiting. For example, early successional species have a high leaf area and low
wood density to attain high resource capture and rapid growth, whereas late successional
species conserve internal resources and grow more slowly, characterized by high wood
density and tougher leaves (Bazzaz & Picket 1980; Reich et al. 2003; Poorter et al. 2008). This
slow-fast continuum is shown to be maintained across different geographic regions and

11
consistent across floras and phylogenetic groups (Díaz et al. 2004), and is also referred to as
the growth-survival trade-off (e.g. Kitajima 1994; Sterck et al. 2006; Poorter & Bongers
2006).
The stepwise approach (age- stand structure- environment- traits) allows studying functional
traits in the context of abiotic gradients which have been indicated a priority in previous
studies (e.g. Niinemets 2001; Wright et al. 2005; McGill et al. 2006). Furthermore, analyzing
the importance of environmental conditions in explaining variation in functional traits
addresses the role of environmental filters in community assembly in secondary forests in
the study region.
This study aims at determining the major changes in community structure during secondary
succession. It specifically addresses the questions:
1. How does stand structure of secondary forests change after time since
abandonment?
2. How do environmental conditions change with changes in stand structure?
3. Is the change in community level functional trait composition of the sapling stage
related to changes in environmental conditions?
We hypothesized that:
1. After the agricultural field has been abandoned stand density will decrease in our
chronosequence of sites and stand basal area will increase in early secondary
succession.
2. With increased aboveground biomass, less light is available in the understory and the
air and soil temperatures will drop, resulting in decreased evaporation and increased
humidity of the air and soil water contents.
3. Understory environmental conditions explain variation in trait composition of
saplings observed between secondary forest sites indicated by strong relationships
between trait abundances and environmental conditions.
Methods
Research site
The research location for this study is near the Chajul tropical field station, south of the
Montes Azules Integral Biosphere Reserve, at the border of the Marques de Comillas region,
within the Lacandon region in southeast Mexico (16°01’N, 90°55’W). The climate is warm-
humid with an average annual temperature of 25-27°C and an annual rainfall of 3.000 mm,
with less than 100 mm per month falling in the dry season (February-April) (Ibarra-
Manríquez & Martínez-Ramos 2002; Breugel et al. 2006). The study takes place around the
village of Loma Bonita, an area characterized by small hills and valleys with sandy or
limestone soils of low pH (<5.5). Currently 65% of the land area around Loma Bonita is
dedicated to agricultural practices (mostly livestock pasture), 14% is mature forest and 21%
consist of secondary forests, of different ages. The old growth forests around Loma Bonita
have suffered extensive pressure for changing land-uses, even more so than surrounding
villages, possibly due to colonization of refugees from Guatemala since ’82, giving rise to the
current large area of secondary forests (Zermeño-Hernández 2008).
12
The chronosequence consists of 11 secondary forest sites (10 x 50 m) with fallow ages
between 3.5 and 22.5 years (plot 1-11 reflect increasing fallow age). All sites are established
on abandoned corn fields, the main form of agriculture, and plots were in use within one
year before abandonment.
Species selection
This study focuses on saplings (woody plants with a DBH > 1cm and between 1.30 and 3 m
high). Saplings are chosen because of the relative ease of measuring functional traits and
saplings are expected to be strongly affected by filtering forces while trying to reach the
upper canopy, as opposed to canopy trees which are largely a product of past filtering
processes.
For each species the relative importance value is calculated based on the relative number of
stems and the relative basal area. It is calculated as: (BAi/BAtotal + Di/Dtotal)/ 2.
Where BAi is the basal area of the ith species, Di is the density of the ith species and total
reflects the total of individuals in the selected sapling category.
The summed importance value of selected species makes up for at least 80%, where
dominant as well as rare species have been included. In total 82 species are selected; an
average of 20 species per site, ranging from 7 to 32 with an average importance value of
0.05 (5%), ranging from 0.002 (0.2%) to 0.89 (89%).
Forest development
Different aspects of forest development after abandonment of agricultural fields have been
studied; age, stand structure and environmental characteristics.
The fallow age of the secondary sites is determined based on information of landowners and
other local residents (Breugel et al. 2007). Stand basal area (m2/ha) and stand density (#/ha)
are calculated based on recorded data on al individuals (DBH > 1cm).
Sub-canopy environmental variables were measured during the dry season (March and
April). Air temperature and relative humidity were measured in the vegetation (height of
1.5m) by using HOBO temperature / relative humidity data loggers (HOBO Pro v2 Temp/RH
logger, Onset Computer Corporation, UK). For each of the 10 HOBO dataloggers a
measurement was taken every minute for 15 minutes. The percentage of canopy openness
(here measured as an indicator of light availability) is measured with a spherical densiometer
(Spherical Densiometer Concave). A densiometer is sometimes criticized for not being a very
accurate measure of light conditions (e.g. Engelbrecht & Herz 2001), but sites showed very
distinct levels of light availability (ranging between 15% to 70% of openness or light
availability) and the relative simplicity of the canopy in secondary sites compared to old
growth forest (e.g. Brown & Lugo 1990) legitimizes the use of this method. Also two
independent days of sampling have been used to compromise for accuracy, all
measurements taken by the same person. Soil temperature (°C) and water content (%
volume) were assessed with a W.E.T. Sensor (type WET-2, Delta-T Devices Ltd) at a depth of
about 10 cm.
The environmental variables have been measured for 3 days (2 days in case of densiometer
measurements) during the dry season, at least 3 days after the last rain, on days without
overcast. Dates measuring subcanopy environmental conditions are randomly spread over
the sampling period. Measurements were carried out at the hottest and driest part of the
day, between 13.00 and 16.00. This is expected to capture the most extreme conditions to
which plants need to be adapted and considered a good way to illustrate differences
13
between the sites. Per plot 10 replicates were taken at even distances in a transect of 50
meters at the center of the plot. (Site 3 only allowed 4 replicate measures instead of 10
because it had partly been cleared.)
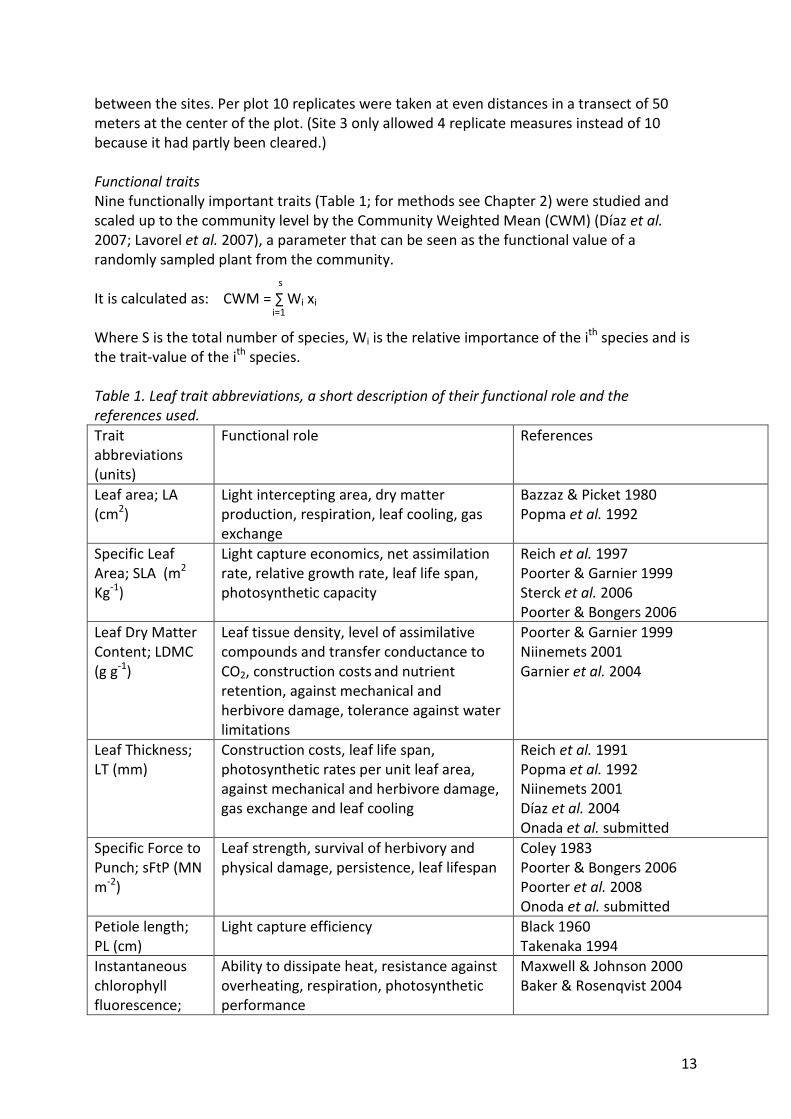
Functional traits
Nine functionally important traits (Table 1; for methods see Chapter 2) were studied and
scaled up to the community level by the Community Weighted Mean (CWM) (Díaz et al.
2007; Lavorel et al. 2007), a parameter that can be seen as the functional value of a
randomly sampled plant from the community.
s
It is calculated as: CWM = ∑ Wi xi
i=1
Where S is the total number of species, Wi is the relative importance of the ith species and is
the trait-value of the ith species.
Table 1. Leaf trait abbreviations, a short description of their functional role and the
references used.
Trait
abbreviations
(units)
Functional role References
Leaf area; LA
(cm2)
Light intercepting area, dry matter
production, respiration, leaf cooling, gas
exchange
Bazzaz & Picket 1980
Popma et al. 1992
Specific Leaf
Area; SLA (m2
Kg-1)
Light capture economics, net assimilation
rate, relative growth rate, leaf life span,
photosynthetic capacity
Reich et al. 1997
Poorter & Garnier 1999
Sterck et al. 2006
Poorter & Bongers 2006
Leaf Dry Matter
Content; LDMC
(g g-1)
Leaf tissue density, level of assimilative
compounds and transfer conductance to
CO2, construction costs and nutrient
retention, against mechanical and
herbivore damage, tolerance against water
limitations
Poorter & Garnier 1999
Niinemets 2001
Garnier et al. 2004
Leaf Thickness;
LT (mm)
Construction costs, leaf life span,
photosynthetic rates per unit leaf area,
against mechanical and herbivore damage,
gas exchange and leaf cooling
Reich et al. 1991
Popma et al. 1992
Niinemets 2001
Díaz et al. 2004
Onada et al. submitted
Specific Force to
Punch; sFtP (MN
m-2)
Leaf strength, survival of herbivory and
physical damage, persistence, leaf lifespan
Coley 1983
Poorter & Bongers 2006
Poorter et al. 2008
Onoda et al. submitted
Petiole length;
PL (cm)
Light capture efficiency Black 1960
Takenaka 1994
Instantaneous
chlorophyll
fluorescence;
Ability to dissipate heat, resistance against
overheating, respiration, photosynthetic
performance
Maxwell & Johnson 2000
Baker & Rosenqvist 2004
14
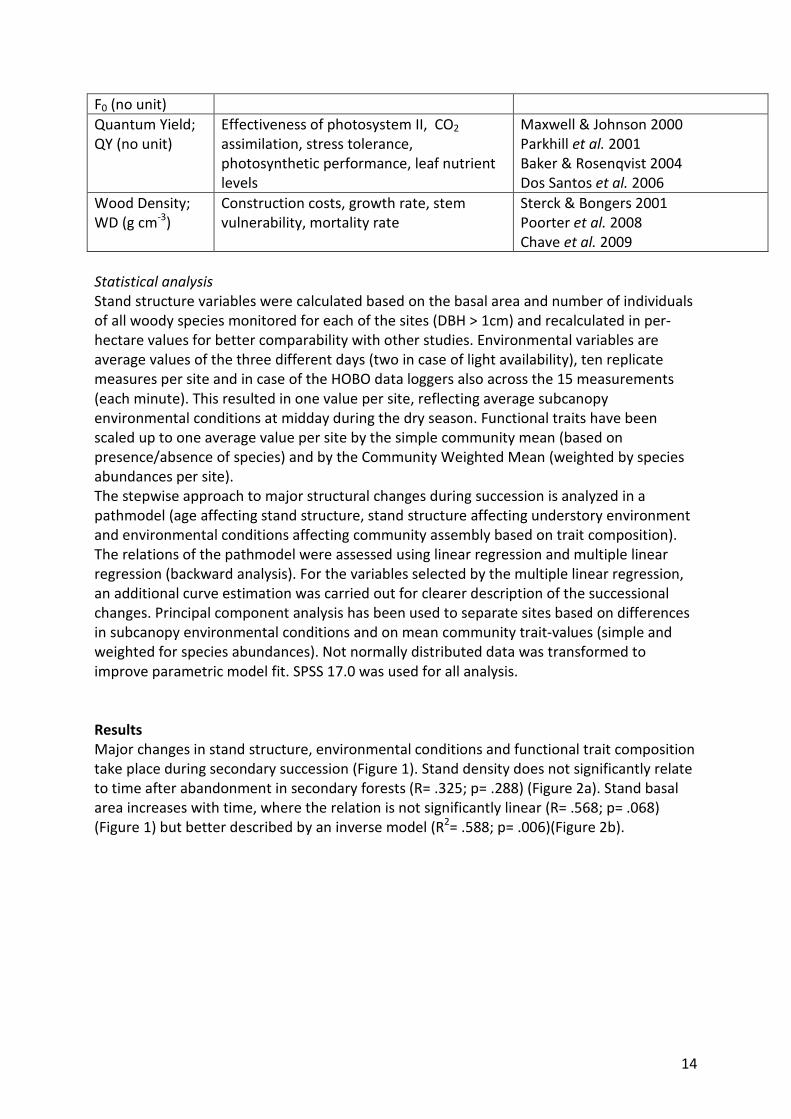
F0 (no unit)
Quantum Yield;
QY (no unit)
Effectiveness of photosystem II, CO2
assimilation, stress tolerance,
photosynthetic performance, leaf nutrient
levels
Maxwell & Johnson 2000
Parkhill et al. 2001
Baker & Rosenqvist 2004
Dos Santos et al. 2006
Wood Density;
WD (g cm-3)
Construction costs, growth rate, stem
vulnerability, mortality rate
Sterck & Bongers 2001
Poorter et al. 2008
Chave et al. 2009
Statistical analysis
Stand structure variables were calculated based on the basal area and number of individuals
of all woody species monitored for each of the sites (DBH > 1cm) and recalculated in per-
hectare values for better comparability with other studies. Environmental variables are
average values of the three different days (two in case of light availability), ten replicate
measures per site and in case of the HOBO data loggers also across the 15 measurements
(each minute). This resulted in one value per site, reflecting average subcanopy
environmental conditions at midday during the dry season. Functional traits have been
scaled up to one average value per site by the simple community mean (based on
presence/absence of species) and by the Community Weighted Mean (weighted by species
abundances per site).
The stepwise approach to major structural changes during succession is analyzed in a
pathmodel (age affecting stand structure, stand structure affecting understory environment
and environmental conditions affecting community assembly based on trait composition).
The relations of the pathmodel were assessed using linear regression and multiple linear
regression (backward analysis). For the variables selected by the multiple linear regression,
an additional curve estimation was carried out for clearer description of the successional
changes. Principal component analysis has been used to separate sites based on differences
in subcanopy environmental conditions and on mean community trait-values (simple and
weighted for species abundances). Not normally distributed data was transformed to
improve parametric model fit. SPSS 17.0 was used for all analysis.
Results
Major changes in stand structure, environmental conditions and functional trait composition
take place during secondary succession (Figure 1). Stand density does not significantly relate
to time after abandonment in secondary forests (R= .325; p= .288) (Figure 2a). Stand basal
area increases with time, where the relation is not significantly linear (R= .568; p= .068)
(Figure 1) but better described by an inverse model (R2= .588; p= .006)(Figure 2b).

15
Figure 1: Pathmodel showing the causal relations between fallow time, stand structure
variables (density and basal area), subcanopy environmental conditions (air temperature, air
relative humidity, light availability, soil temperature and soil water content) and the
community-level trait variation among the sapling communities (simple average trait
variation PCA component 1 and 2 and community weighted mean trait variation PCA
component 1 and 2) in the secondary forest plots. Arrows signify relations selected by a
backward multiple linear regression (* p < .05, ** p < .001).
a. b.
Figure 2. Structural characteristics of the eleven secondary forest sites (age 3.5-22.5 years)
against time after abandonment. a. stand density (#/ ha) shows no significant relationship, b.
stand basal area (m2/ ha) fitted the inverse model (R
2= .588; p= .006).
The sites studied vary in sub-canopy abiotic conditions, 82% of the variation among plots is
explained by the first two principal components axes based on site differences in air
temperature, air relative humidity, light availability, soil temperature and soil water content
(Figure 3). The main component of this variation is strongly correlated to the age of the sites,
reflecting the inverse model (R2= .653; p= .003) (Figure 4).
16
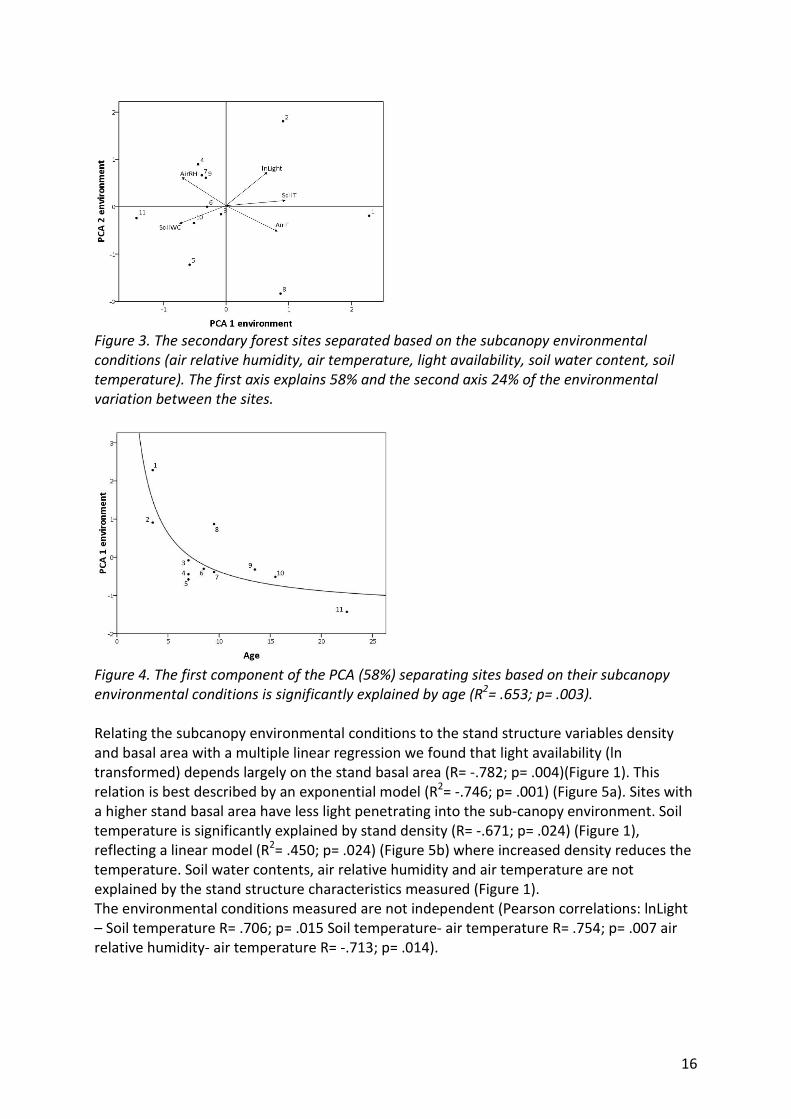
Figure 3. The secondary forest sites separated based on the subcanopy environmental
conditions (air relative humidity, air temperature, light availability, soil water content, soil
temperature). The first axis explains 58% and the second axis 24% of the environmental
variation between the sites.
Figure 4. The first component of the PCA (58%) separating sites based on their subcanopy
environmental conditions is significantly explained by age (R2= .653; p= .003).
Relating the subcanopy environmental conditions to the stand structure variables density
and basal area with a multiple linear regression we found that light availability (ln
transformed) depends largely on the stand basal area (R= -.782; p= .004)(Figure 1). This
relation is best described by an exponential model (R2= -.746; p= .001) (Figure 5a). Sites with
a higher stand basal area have less light penetrating into the sub-canopy environment. Soil
temperature is significantly explained by stand density (R= -.671; p= .024) (Figure 1),
reflecting a linear model (R2= .450; p= .024) (Figure 5b) where increased density reduces the
temperature. Soil water contents, air relative humidity and air temperature are not
explained by the stand structure characteristics measured (Figure 1).
The environmental conditions measured are not independent (Pearson correlations: lnLight
– Soil temperature R= .706; p= .015 Soil temperature- air temperature R= .754; p= .007 air
relative humidity- air temperature R= -.713; p= .014).
17
a. b.
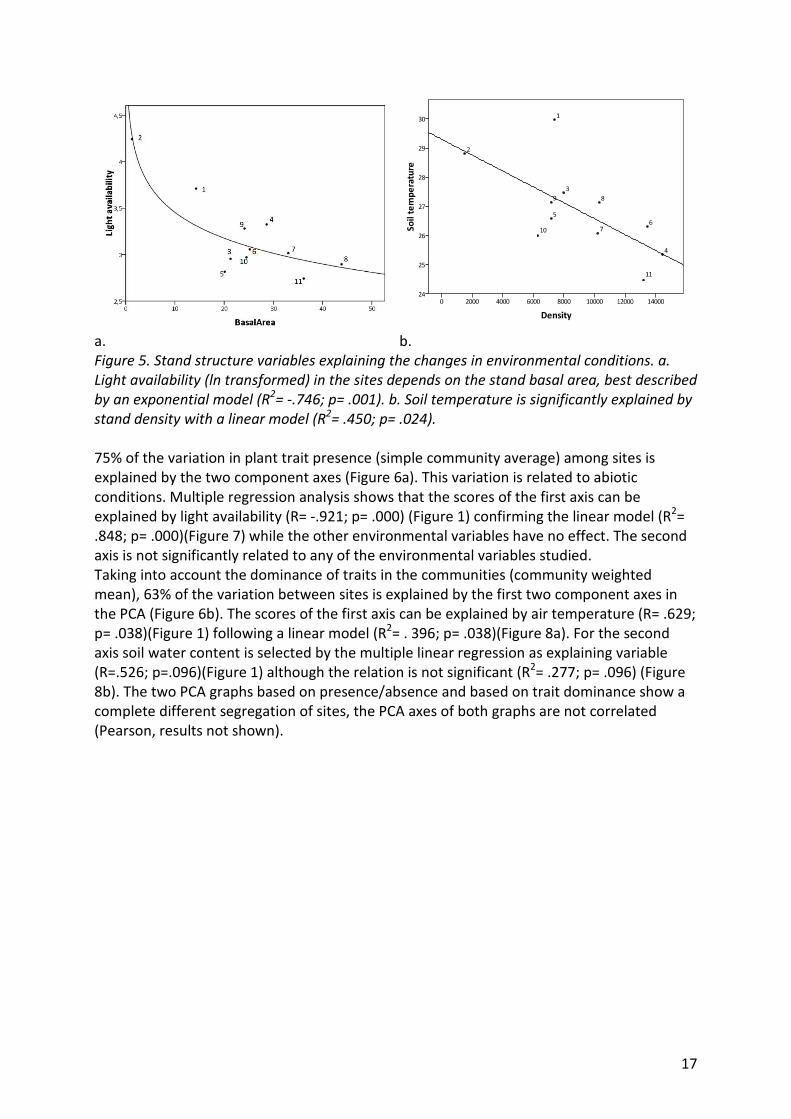
Figure 5. Stand structure variables explaining the changes in environmental conditions. a.
Light availability (ln transformed) in the sites depends on the stand basal area, best described
by an exponential model (R2= -.746; p= .001). b. Soil temperature is significantly explained by
stand density with a linear model (R2= .450; p= .024).
75% of the variation in plant trait presence (simple community average) among sites is
explained by the two component axes (Figure 6a). This variation is related to abiotic
conditions. Multiple regression analysis shows that the scores of the first axis can be
explained by light availability (R= -.921; p= .000) (Figure 1) confirming the linear model (R2=
.848; p= .000)(Figure 7) while the other environmental variables have no effect. The second
axis is not significantly related to any of the environmental variables studied.
Taking into account the dominance of traits in the communities (community weighted
mean), 63% of the variation between sites is explained by the first two component axes in
the PCA (Figure 6b). The scores of the first axis can be explained by air temperature (R= .629;
p= .038)(Figure 1) following a linear model (R2= . 396; p= .038)(Figure 8a). For the second
axis soil water content is selected by the multiple linear regression as explaining variable
(R=.526; p=.096)(Figure 1) although the relation is not significant (R2= .277; p= .096) (Figure
8b). The two PCA graphs based on presence/absence and based on trait dominance show a
complete different segregation of sites, the PCA axes of both graphs are not correlated
(Pearson, results not shown).
18
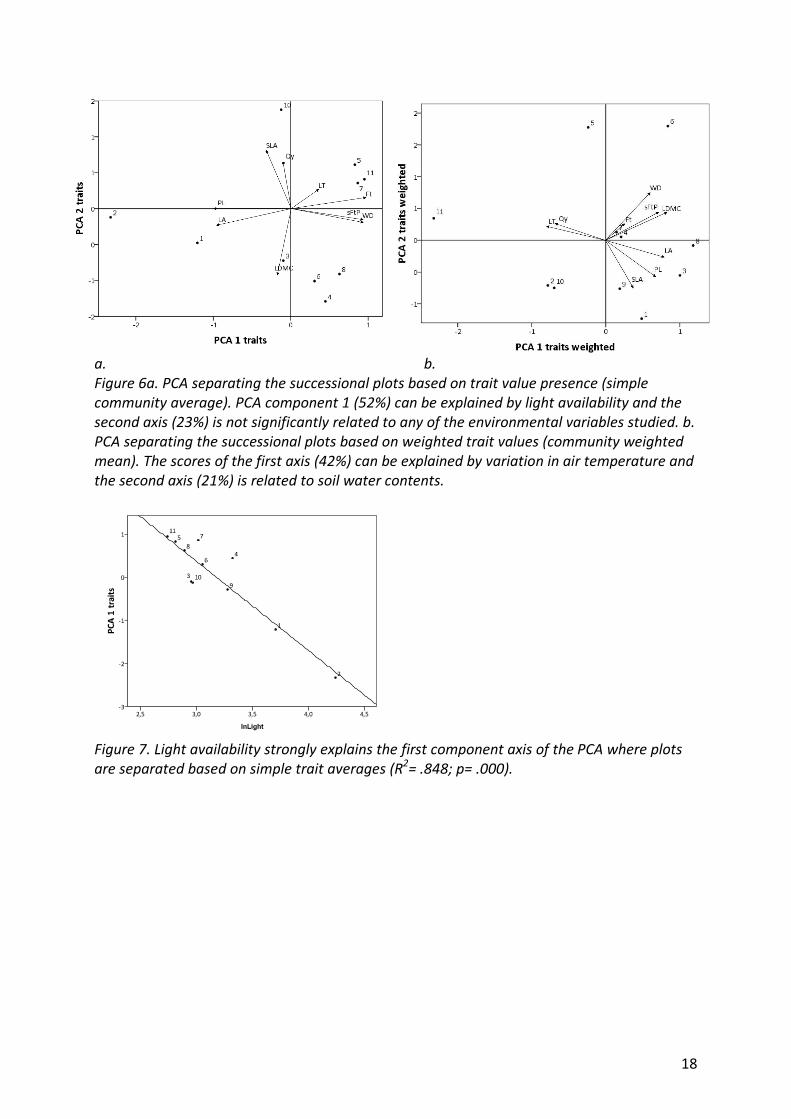
a. b.
Figure 6a. PCA separating the successional plots based on trait value presence (simple
community average). PCA component 1 (52%) can be explained by light availability and the
second axis (23%) is not significantly related to any of the environmental variables studied. b.
PCA separating the successional plots based on weighted trait values (community weighted
mean). The scores of the first axis (42%) can be explained by variation in air temperature and
the second axis (21%) is related to soil water contents.
Figure 7. Light availability strongly explains the first component axis of the PCA where plots
are separated based on simple trait averages (R2= .848; p= .000).
19
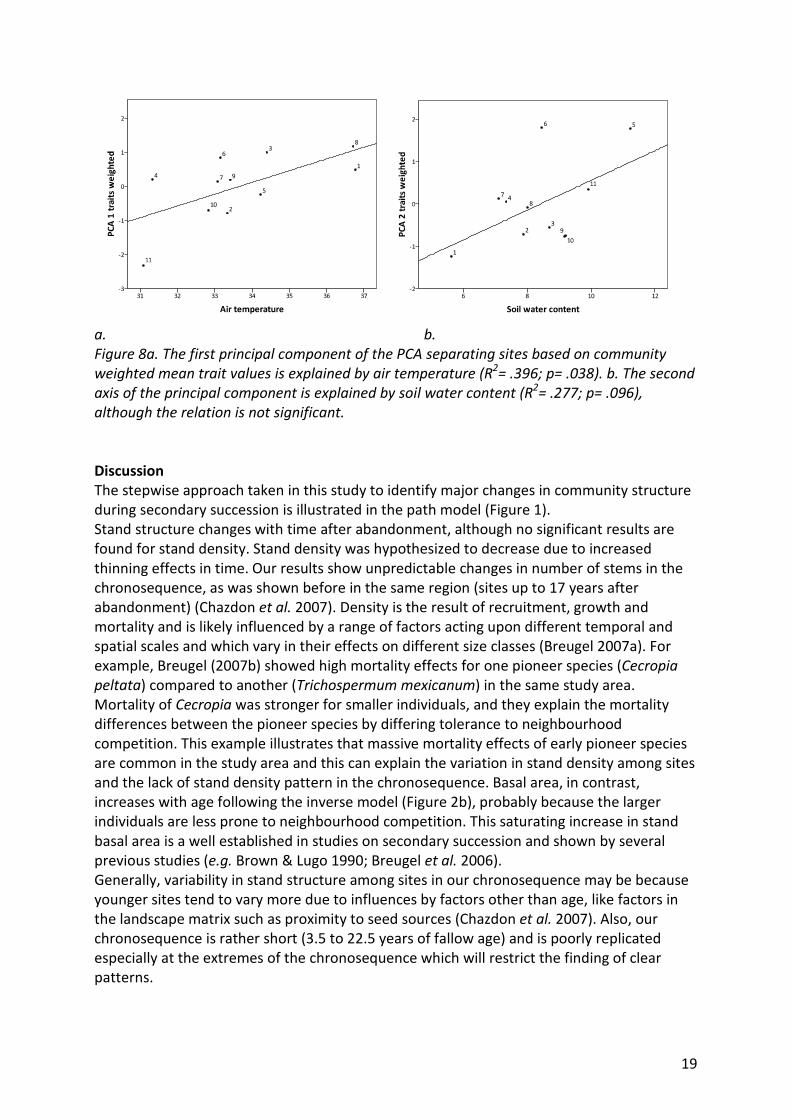
a. b.
Figure 8a. The first principal component of the PCA separating sites based on community
weighted mean trait values is explained by air temperature (R2= .396; p= .038). b. The second
axis of the principal component is explained by soil water content (R2= .277; p= .096),
although the relation is not significant.
Discussion
The stepwise approach taken in this study to identify major changes in community structure
during secondary succession is illustrated in the path model (Figure 1).
Stand structure changes with time after abandonment, although no significant results are
found for stand density. Stand density was hypothesized to decrease due to increased
thinning effects in time. Our results show unpredictable changes in number of stems in the
chronosequence, as was shown before in the same region (sites up to 17 years after
abandonment) (Chazdon et al. 2007). Density is the result of recruitment, growth and
mortality and is likely influenced by a range of factors acting upon different temporal and
spatial scales and which vary in their effects on different size classes (Breugel 2007a). For
example, Breugel (2007b) showed high mortality effects for one pioneer species (Cecropia
peltata) compared to another (Trichospermum mexicanum) in the same study area.
Mortality of Cecropia was stronger for smaller individuals, and they explain the mortality
differences between the pioneer species by differing tolerance to neighbourhood
competition. This example illustrates that massive mortality effects of early pioneer species
are common in the study area and this can explain the variation in stand density among sites
and the lack of stand density pattern in the chronosequence. Basal area, in contrast,
increases with age following the inverse model (Figure 2b), probably because the larger
individuals are less prone to neighbourhood competition. This saturating increase in stand
basal area is a well established in studies on secondary succession and shown by several
previous studies (e.g. Brown & Lugo 1990; Breugel et al. 2006).
Generally, variability in stand structure among sites in our chronosequence may be because
younger sites tend to vary more due to influences by factors other than age, like factors in
the landscape matrix such as proximity to seed sources (Chazdon et al. 2007). Also, our
chronosequence is rather short (3.5 to 22.5 years of fallow age) and is poorly replicated
especially at the extremes of the chronosequence which will restrict the finding of clear
patterns.
20
Environmental conditions show directional changes with variation in stand structure, as
hypothesized. With increasing stand basal area during forest development, light availability
decreased exponentially (Figure 5a), as has been shown earlier (e.g. Palik et al. 1997). At the
same time, with increasing stand density the soil temperature dropped (Figure 5b). This is
against expectations, as we expected density and soil temperature both to decrease with
age. This result is hard to explain in terms of succession because of the idiosyncratic patterns
of density with fallow age, suggesting that density is important determining environmental
conditions though largely independent of the gradient of succession. Results of a study in
Mexican dry forest also showed that environmental conditions were explained by stand
structure characteristics. Here stand density explained soil water potential and basal area
explained air temperature and soil temperature (Lebrija-Trejos et al. 2010).
Air temperature, air relative humidity and soil water contents are not related to any of the
stand structure variables studied. One of the factors responsible for soil water content is the
accumulation of organic material on the forest floor (Leuschner & Rode 1999), suggesting
that the chemical and structural characteristics of the leaves in the canopy play an important
role; not only the quantity (related to biomass / stand structure) but also the quality
(chemical and structural characteristics) of the litter. As litter production during tropical
forest succession increases due to accumulated standing biomass, litter decomposition rates
decrease due to the ‘fast’ high quality leaves (high nutrient contents, high SLA) being
replaced by ‘slow’ species with a lower decomposability (high LDMC, high leaf toughness)
(Garnier et al. 2004; see also Chapter 2). This predicts an increase of soil organic matter with
fallow age (e.g. Brown & Lugo 1990, Lawrence & Foster 2002) which is likely to cause an
increase in soil water content. This illustrates that leaf traits (quality) are as likely to
influence subcanopy environmental conditions as stand structure characteristics (quantity).
Our sites differed in the community aggregated trait-values, both when aggregation was
based on trait presence and on trait abundance (Figure 6). The fact that the two PCA-graphs
show completely different segregation of sites indicates that trait presence and trait
abundance are different aspects of functional ecology. Ecological filters shaping the
community, could be described as different (hierarchical) layers of assembly rules (Keddy
1992); first determining presence/ absence and secondly shaping abundance of species with
certain traits. Results of this study show that indeed for a given community the functional
characteristics of the species that are present (simple community average) are different
from the functional characteristics of species that are abundant (community weighted
mean), suggesting the presence of distinct multilayered filtering processes. This is
substantiated by the finding that the distinct filtering processes are found to be related to
different environmental conditions; trait presence is determined by light availability whereas
trait dominance is shaped by air temperature and soil water content. This is in line with
Cingolani et al. (2007) where filters determining the probability of species presence are not
necessarily the same as filters determining which species become abundant. They found that
functional traits of abundant species (community weighted mean) are explained by moisture
and grazing management of grasslands in Argentina whereas simple averages did not always
respond to disturbance or abiotic conditions.
The distinct PCA scatterplots when species are weighted for abundances compared to based
on presence/absence suggest that dominant species are functionally distinct from the
overall range of traits present in sites. In the study design we have particularly tried to
21
include species with a large range in abundances (dominant as well as minor species).
However not all species could be sampled and the missing species (and traits) are biased
towards rare species. Therefore, traits represented in the species presence/ absence PCA is
not an exhaustive representation of the trait values that are really present, but are
somewhat biased towards the species that are dominating the sites. This consideration
makes the distinctness of the segregation of sites between the two methods (simple versus
weighted) even more apparent.
Thus, in our system, species become dominant when they are functionally adapted to air
temperature and soil water availability (Figure 8). This suggests that the risk of overheating
of the leaves and desiccation due to scarce water availability may be important filters
determining plant successfulness in young secondary forests.
For trait-presence, the proportion of light penetrating the canopy plays a major role. This
can be explained by the shade-tolerant species entering the secondary forest in the first few
years of succession, adapted to persist under different levels of shade, and not becoming
dominant until the dominant pioneer species will disappear (Finegan 1996). Indeed, light is a
limiting factor for species composition in wet tropical forests (e.g. Poorter 1999). Especially
the relation between seedling performance and light availability is extensively studied (e.g.
Kobe 1999; Montgomery & Chazdon 2002). Earlier results of Nicotra et al. (1999), show
similarities in patterns of light and seedling distribution in Costa Rica, but relations were not
strong which they explain by a time-lag between measuring light and seedling appearance.
Even though our results show that light is highly significant factor explaining species
presence, the time-lag is also important in this study, especially since here we looked at
saplings which may have appeared in the selected category (DBH>1cm) years ago.
Caution should be taken when attributing specific environmental conditions to different
filters in community assembly. Although the results clearly find specific environmental
conditions related to different aspects of trait composition, environmental conditions are
not independent. Furthermore, the explanatory conditions discussed above are based on
environmental measurements during the dry season, on the hottest and driest time of the
day, whether results are the same when environmental conditions are tested outside the dry
season remains to be tested although some conditions (especially soil water content) will
probably not differ much between sites in the wet season. In Mexican dry forest air
temperature was also shown to have the most important filtering effect on (weighted) trait
variation among sites (Lebrija-Trejos et al. 2010), suggesting that air temperature may
deserve more attention in studies on community assembly across different forest types.
During secondary succession wet tropical forests show directional changes in stand
structure, altering the understory environment which in turn drives community assembly
through the process of filtering of functional traits.
In this study we show that early successional communities (3.5-22.5 years of fallow age) in
wet tropical forests are shaped by habitat filtering that selects species traits at different
levels. Trait presence is predominantly explained by the amount of light penetrating to the
understory. Important filters determining trait successfulness are air temperature and soil
water content, suggesting the risk of overheating of the leaves and desiccation due to
limited soil water availability to be prominent limitations during the dry season in wet
tropical forests.

22
Grime’s mass ratio hypothesis (Grime 1998) states that ecosystem functioning is essentially
determined by the trait values of the dominant contributing species. Recognizing the
environment (mainly air temperature) as an important factor determining the dominance of
species with certain traits, suggests that changes in climate can have serious implications for
ecosystem functioning, as previously indicated by Wright & Muller-Landau (unpublished
results). This finding underlines the potential danger of climate change for the worlds
tropical forests and elaborates the need for more research on the effects of climate change
on ecosystem functioning.

23
References
Baker N.R., Rosenqvist E. 2004. Applications of chlorophyll fluorescence can improve crop
production strategies: an examination of future possibilities. Journal of Experimental
Botany 55(403): 1607-1621.
Bazzaz F.A., Pickett S.T.A. 1980. Physiological ecology of tropical succession: a comparative
review. Annual Review of Ecology and Systematics 11: 287-310.
Belyea L.R., Lancaster J. 1999. Assembly rules within a contingent ecology. Oikos 81: 402-
416.
Black J.N. 1960. The significance of petiole length, leaf area, and light interception in
competition between strains of subterranean clover grown in swards. Australian Journal of
Agricultural Research 11(3): 277-291.
Breugel van M., Martínez-Ramos M., Bongers F. 2006. Community dynamics during early
secondary succession in Mexican tropical rain forests. Journal of Tropical Ecology 22: 663-
674.
Breugel van M. 2007a. General introduction. Dynamics of Secondary Forest. PhD thesis,
Wageningen University, Wageningen, The Netherlands.
Breugel van M. 2007b. Chapter 6: Neighborhood effects on sapling growth and survival of
two pioneer tree species in secondary tropical moist forest. Dynamics of Secondary Forest.
PhD thesis, Wageningen University, Wageningen, The Netherlands.
Breugel van M., Bongers F., Martínez-Ramos M. 2007. Species dynamics during early
secondary forest succession: recruitment, mortality and species turnover. Biotropica 35(5):
610-619.
Brown S. Lugo A.E. 1990. Tropical secondary forests. Journal of Tropical Ecology 6(1): 1-32.
Burton A.J., Pregitzer K.S., Reed D.D. 1991. Leaf area and foliar biomass relationships in
northern hardwood forest located along an 800 km acid deposition gradient. Forest
Science 37(4): 1041-1059.
Chave J., Coomes D., Jansen S., Lewis S.L., Swenson N.G., Zanne A.E. 2009. Towards a
worldwide wood economics spectrum. Ecology Letters 12: 351-366.
Chazdon L.R., Letcher S.G., van Breugel M., Martínez-Ramos M., Bongers F., Finegan B. 2007.
Rates of change in tree communities of secondary Neotropical forests following major
disturbances. Philosophical Transactions of the Royal British Society 362: 273-289.
Cingolani A.M., Cabido M., Gurvich D.E., Renison D., Díaz S. 2007. Filtering processes in the
assembly of plant communities: Are species presence and abundance driven by the same
traits? Journal of Vegetation Science 18: 911-920.
Coley P.D. 1983. Herbivory and defensive characteristics of tree species in a lowland tropical
forest. Ecological Monographs 53(2): 209-233.
Denslow J.S., Schultz J.C., Vitousek P.M., Strain B.R. 1990. Growth responses of tropical
shrubs to treefall gap environments. Ecology 71(1): 165-179.
Diamond J.M. 1975. Assembly of species communities. In: ML Cody & J.M. Diamond (eds),
Ecology and Evolution of Communities. Harvard University Press, Cambridge, Mass pp.
342-444.
Díaz S., Cabido M., Casanoves F. 1998. Plant functional traits and environmental filters at a
regional scale. Journal of Vegetation Science 9: 113-122.
Díaz S., Hodgson J.G., Thompson K., Cabido M., Cornelissen J.H.C, Jalili A., Monserrat-Martí
G., Grime J.P., Zarrinkamar F., Asri Y., Band S.R., Basconcelo S., Castro-Díez P., Funes G.,
Hamzehee B., Khoshnevi M., Pérez-Harguindeguy N., Pérez-Rontomé M.C., Shirvany F.A.,
24
Vendramini F., Yazdani S., Abbas-Azimi R., Bogaard A., Boustani S., Charles M., Dehghan
M., de Torres-Espuny L., Falczuk V., Guerrero-Campo J., Hynd A., Jones G., Kowsary E.,
Kazemi-Saeed F., Meastro-Martínez M., Romo-Díez A., Shaw S., Siavash B., Villar-Salvador
P., Zak M.R. 2004. The plant traits that drive ecosystems: Evidence from three continents.
Journal of Vegetation Science 15: 295-304.
Díaz S., Lavorel S., de Bello F., Quétier F., Grigulis K., Robson M. 2007. Incorporating plant
functional Diversity effects in ecosystem service assessments. Proceedings of the National
Academy of Sciences 104: 20684-20689.
Dos Santos U.M., de Carvalho Gonçalves J.F., Feldpausch T.R. 2006. Growth, leaf nutrient
concentration and photosynthetic nutrient use efficiency in tropical tree species planted in
degraded area in central Amazonia. Forest Ecology and Management 226: 299-309.
Engelbrecht B.M.J., Herz H.M. 2001. Evaluation of different methods to estimate understory
light conditions in tropical forests. Journal of Tropical Ecology 17: 207-224.
FAO. 2005. Global forests resources assessment: progress towards sustainable forest
management. FAO. Rome.
Finegan B. 1996. Pattern and process in neotropical secondary rain forest: the first 100 years
of succession. Trends in Ecology and Evolution 11(3): 119-124.
Garnier E., Cortez J., Billès G., Navas M-L., Roumet C., Debussche M., Laurent G., Blanchard
A., Aubry D., Bellmann A., Neill C., Toussaint J-P. 2004. Plant functional markers capture
ecosystem properties during secondary succession. Ecology 85(9): 2630-2637.
Grime J.P. 1998. Benefits of plant diversity to ecosystems: immediate filter and founder
effects. Journal of Ecology 86: 902-910.
Guariguata M.R., Ostertag R. 2001. Neotropical secondary forest succession: changes in
structural and functional characteristics. Forest Ecology and Management 148: 185-206.
Ibarra-Manríquez G., Martínez-Ramos M., Oyama K. 2001. Seedling functional types in a
lowland rainforest in Mexico. American Journal of Botany 88(10): 1801-1812.
Keddy P.A. 1992. Assembly and response rules: two goals for predictive community ecology.
Journal of Vegetation Science 3: 157-164.
Kendall Snell J.A., Brown J.K. 1978. Comparison of tree biomass estimators – DBH and
sapwood area. Forest Science 24(4): 455-456.
Kitajima K. 1994. Relative importance of photosynthetic traits and allocation patterns as
correlated of seedling shade tolerance of 13 tropical tree species. Oecologia 98: 419-428.
Kobe R.K. 1999. Light gradient partitioning among tropical tree species through differential
seedling mortality and growth. Ecology 80(1): 187-201.
Lavorel S., Grigulis K., McIntyre S., Williams N., Garden D., Dorrough J., Berman S., Quétier F.,
Thébault A., Bonis Q. 2007. Assessing functional diversity in the field- methodology
matters!. Functional Ecology 16: 134-147.
Lawrence D., Foster D. 2002. Changes in forest biomass, litter dynamics and soils following
shifting cultivation in southern Mexico: an overview. Intersciencia 27(8): 400-408.
Lebrija-Trejos E., Pérez-García E.A., Meave J.A., Bongers F., Poorter L. 2010. Functional traits
and environmental filtering drive community assembly in a species-rich tropical system.
Ecology 91(2): 386-398.
Letcher S. G., Chazdon R. L. 2009. Rapid recovery of biomass, species richness, and species
composition in a forest chronosequence in Northeastern Costa Rica. Biotropica 41 (5): 608-
617.
Leuschner C., Rode M.W. 1999. The role of plant resources in forest succession: changes in
radiation, water and nutrient fluxes, and plant productivity along over a 300-yr-long
25
chronosequence in NW Germany. Perspectives in Plant Ecology, Evolution, and Systematics
2/1: 103-147.
Maxwell K., Johnson G.N. 2000. Chlorophyll fluorescence- A practical guide. Journal of
Experimental Botany 51: 659-668.
McGill B.J., Enquist B.J., Weiher E., Westoby M. 2006. Rebuilding community ecology from
functional traits. Trends in Ecology and Evolution 21(4): 178-185.
Montgomery R.A., Chazdon R.L. 2002. Light gradient partitioning by tropical tree seedlings in
the absence of canopy gaps. Oecologia 131: 165-174.
Naeem S., Wright J.P. 2003. Disentangling biodiversity effects on ecosystem functioning:
deriving solutions to a seemingly insurmountable problem. Ecology Letters 6: 567-579.
Nicotra A.B., Chazdon R.L., Iriarte S.V.B. 1999. Spatial heterogeneity of light and woody
seedling regeneration in tropical wet forest. Ecology 80(6): 1908-1926.
Niinemets Ü. 2001. Global scale climatic controls of leaf dry mass per area, density, and
thickness in trees and shrubs. Ecology 82: 453-469.
Onoda Y. Westoby M., Adler P., Choong A., Clissold F., Cornelissen J., Díaz S., Dominy N.,
Elgart A., Enrico L., Fine P., Howard J., Jalili A., Kitajima K., Kurokawa H., Lucan P.,
Markesteijn L., McArthur C., Perez-Harguindeguy N., Poorter L., Richards L., Santiago L.,
Sosinski Jr E., Van Bael S., Warton D., Wright I., Wright S., Yamashita N. submitted. Global
patterns of leaf mechanical properties.
Palik B.J., Mitchell R.J., Houseal G., Pederson N. 1997. Effects of canopy structure on
resource availability and seedling responses in a longleaf pine ecosystem. Canadian Journal
of Forest Research 27: 1458-1464.
Parkhill J-P., Maillet G., Cullen J.J. 2001. Fluorescence-based maximal quantum yield for PSII
as a diagnostic of nutrient stress. Journal of Phycology 37: 517-529.
Peña-Claros M. 2003. Changes in forest structure and species composition during secondary
forest succession in the Bolivian Amazon. Biotropica 35(4): 450-461.
Poorter L. 1999. Growth responses of 15 rain-forest tree species to a light gradient: the
relative importance of morphological and physiological traits. Functional Ecology 13: 396-
410.
Poorter H., Garnier E. 1999. Ecological significance of relative growth rate and its
components. In: Handbook of functional plant ecology. F.I. Pugnaire, F. Valladares (Eds).
Marcel Dekker, New York.
Poorter L., Bongers F. 2006. Leaf traits are good predictors of plant performance across 53
rain forest species. Ecology 87(7): 1733-1743.
Poorter L., Wright S.J., Paz H., Ackerly D.D., Condit R., Ibarra-Manriquez G., Harms K.E.,
Licona J.C., Martínez-Ramos M., Mazer S.J., Muller-Landau H.C., Peña-Claros M., Webb
C.O., Wright I.J. 2008. Are functional traits good predictors of demographic rates? Evidence
from five Neotropical forests. Ecology 89 (7): 1908-1920.
Popma J., Bongers F., Werger M.J.A. 1992. Gap-dependence and leaf characteristics of trees
in a tropical lowland rain forest in Mexico. Oikos 63: 207-214.
Reich P.B., Uhl C., Walters M.B., Ellsworth D.S. 1991. Leaf lifespan as a function of leaf
structure and function among 23 Amazonian tree species. Oecologia 86: 16-24.
Reich P.B., Walters M.B., Ellsworth D.S. 1997. From tropics to tundra: Global convergence in
plant functioning. Proceedings of the National Academy of Science USA 94: 13730-13734.
Reich P.B., Wright I.J., Cavender-Bares J., Craine J.M., Oleksyn J., Westoby M., Walters M.B.
2003. The evolution of plant functional variation: traits, spectra, and strategies.
International Journal of Plant Sciences 164(3): 143-164.
26
Ricaño-Rocha A. 2007. Morfología aeréa y subterránea de plántulas tropicales: variación a lo
largo del gradiente sucesional en campos abandonados en una selva alta. Tesis maestra en
ciencias biológicas. Universidad Nacional Autónoma de México.
Saldarriaga J.G., West D.C., Tharp M.L., Uhl C. 1988. Long-term chronosequence of forest
succession in the upper Rio Negro of Colombia and Venezuela. The Journal of Ecology
76(4): 938-958.
Sterck F.J., Bongers F. 2001. Crown development in tropical rain forest trees: patterns with
tree height and light availability. Journal of Ecology 89: 1-13.
Sterck F.J., Poorter L., Schieving F. 2006. Leaf traits determine the growth-survival trade-off
across rain forest tree species. The American Naturalist 167(5): 758-765.
Takenaka A. 1994. Effects of leaf blade narrowness and petiole length on the light capture
efficiency of a shoot. Ecological research 9: 109-114.
Wright I.J., Reich P.B., Cornelissen J.H.C., Falster D.S., Groom P.K., Hikosaka K., Lee W., Lusk
C. H., Niinemets Ü., Oleksyn J., Poorter H., Warton D.I., Westoby M. 2005. Modulation of
leaf economic traits and trait relationships by climate. Global Ecology and Biogeography
14: 411-421.
Wright & Muller-Landau (unpublished results)
Zermeño-Hernández I.E. 2008. Evaluación del disturbio ecológico provocado por diferentes
tipos de uso agrícola del suelo en una región tropical húmeda. Tesis maestra en ciencias
biológicas. Universidad Nacional Autónoma de México.
27
Chapter 2: Functional traits related to changing environmental conditions during
secondary succession: Environmental filtering and the slow-fast continuum
Abstract
Secondary succession is ongoing community assembly. Successional theory predicts that
during succession the dominating species change from fast species (rapid acquisition of
resources and fast growth) to slow species (conservation of internal resources and long life
but slow growth). This change is predicted to be the result of environmental filtering, one of
the major community assembly processes. Here we test these predictions. We analyzed
understory environmental conditions in a wet forest successional chronosequence (3.5-22.5
years of fallow age), and analyzed selected functional characteristics of their tree
communities. We found that the main component separating the 82 species based on the
functional traits measured reflected predictions on the slow-fast continuum. As expected,
acquisitive/ fast species are characterized by large leaf area, high SLA, large petioles and high
quantum yield values. Likewise, conservative/ slow species are characterized by high LDMD,
strong leaves, high instantaneous chlorophyll fluorescence and high wood density.
During secondary succession the understory environmental conditions changed from high
temperatures, high light availability and low relative humidity and soil water contents in
young stages to reversed values in older ones. Most community weighted functional traits (5
out of 9) were significantly explained by environmental conditions, substantiating the
environmental filtering hypothesis. However, changes in community weighted mean trait
values did not always reflect an increased importance of ‘slow’ traits with environmental
conditions typical for older sites. Maybe other not-explicitly-tested functional traits like
drought resistance or defense against herbivory are more important community traits.
Keywords: Environmental filtering; Functional traits; Slow-fast continuum; Chronosequence,
Wet tropical forest; Secondary succession; Secondary forests, Chiapas, Mexico.
Introduction
Secondary succession is ongoing community assembly. If environmental filters shape
community assembly, particular combinations of traits and environment should be found, in
spite of heterogenizing effects of random dispersal or competition that also influence
assembly (Hubbell 2001). Studies on changing species composition during secondary
succession in tropical rain forests often focus on a gradient of decreasing understory light
availability (e.g. Bazzaz & Picket 1980) where a trade-off in plant design allows fast growing
types with a rapid acquisition of resources under higher light conditions and slow growing
types that permit conservation of resources within the plant dominating late successional
stages where light becomes an increasingly limited (e.g. Poorter 1999; Reich et al. 2003).
This ‘slow-fast continuum’, also referred to as the growth-survival trade-off (e.g. Kitajima
1994; Sterck et al. 2006; Kitajima & Poorter 2008), is shown to be maintained across
different geographic regions and is consistent across floras and phylogenetic groups (Díaz et
al. 2004).
Several species traits may be used to indicate the slow-fast continuum. In this study we use
nine traits, covering both morphological and physiological traits reflecting a range of
28
functional roles in the ecosystem such as light acquisition, relative growth rate, construction
costs, photosynthetic performance, conservation of internal resources and vulnerability to
damage (Table 1).
Acquisitive or ‘fast’ species gamble for a quick return of leaf investment by investing in
cheap short-lived leaves with high assimilation rates which enable them to grow quickly and
outcompete neighbours, thereby remaining at the top of the growing vegetation (Poorter &
Bongers 2006). These ‘cheap’ leaves are characterized by large areas (high leaf area) to
increase light interception (Bazzaz & Picket 1980) and a high SLA for increased
photosynthetic rates under limited investment (Reich et al. 1994; Poorter et al. 2009). Fast
species will invest in long petioles in order to maximize lightcapture by reducing leaf
aggregation around the stem (Takenaka 1994).
Conservative species on the other hand will conserve their resources by investing in
persistent leaves: leaves are stronger to better resist herbivory and endure physical
damage, with high leaf dry matter content (LDMC) ensuring a long leaf life span and
increased persistence (Poorter & Bongers 2006). Also higher thickness of the lamina of the
leaves is suggested to reflect increased leaf persistence and lifespan (Reich et al. 1991).
Wood density is another trait reflecting the trade-off between fast growth and a more
conservative strategy. Low wood density species are enabled to grow faster because the soft
wood (large vessel diameters) does not cause as much hydraulic resistance, and hence
stimulate photosynthetic rates. However, ultimate tree height is limited due to increased
risk of xylem cavitation. Late successional species have a higher wood density and are less
vulnerable to stem rot and pathogens (Augspurger & Kelly 1984) and eventually a higher
maximum height can be reached (Sterck & Bongers 2001). Overall, higher wood density is
shown to be correlated to lower growth and mortality rates (Poorter et al. 2008; Chave et al.
2009) and is in line with species’ conservative or slow strategy.
Finally, two physiological traits related to primary productivity are included in the study;
instantaneous chlorophyll fluorescence and quantum yield. Fluorescence measurements are
based on the knowledge that when chlorophyll takes up a photon to reach the excited state,
the available energy will be disposed in one out of three ways: energy is used in
photochemistry, it is converted into heat, or emitted in the form of fluorescence (Lambers et
al. 2008). Quantum yield is the proportion of the light that is not emitted in the form of
fluorescence but instead used in photochemistry or emitted in the form of heat. We
predicted that early successional species have a higher quantum yield, reflecting higher
photosynthetic capacity (allocation to photochemistry), as well as a better tolerance against
photoinhibition (emission of excess energy in the form of heat is more efficient than in the
form of fluorescence (Maxwell & Johnson 2000)). Instantaneous chlorophyll fluorescence is
the maximum fluorescence dissipated after a pulse of saturating light and not used in
photochemistry or emitted as heat, this is expected to reflect late successional strategies as
the importance of releasing excess energy most efficiently reduces as light will become
limited and the need for high photosynthetic capacity is lower for slow growing species.
The trade-off in functional traits is tested by exploring multivariate trait associations in a
principal component analysis.
The current study includes a range of understory environmental conditions (air temperature,
air relative humidity, light availability, soil temperature and soil water content) that are
expected to reflect changing environmental conditions along a secondary succession
gradient. As basal area increases with fallow age, the leaf area index will also increase (e.g.
Kendal Snell & Brown 1978; Burton et al. 1991) which reduces light available in the
29
understory (Beer-Lambert law). With less light penetrating the canopy, the understory
conditions are increasingly characterized by lower temperatures in the air and soil and
reduced evaporation causing an increase in the relative humidity and soil water contents.
The environmental conditions for each of the secondary forest sites are tested for
correlations with the community weighted trait mean trait values per site to test the
environmental filtering hypothesis.
This study has the objective to analyze the slow-fast trade-off based on functional traits of
species as well as the environmental filtering hypothesis in secondary forests of Chiapas in
Mexico. For this first the trade-off in functional traits is tested by separating species in a
principal component analysis based on species trait averages and analyzing the multivariate
trait associations. Secondly we tested the environmental filtering hypothesis by checking for
correlation between traits at the plot level (Community Weighted Mean) and environmental
conditions along a gradient of succession. We hypothesize that in time since abandonment
the community weighted mean (CWM) in leaf area (LA) will decrease, specific leaf area (SLA)
will decrease, leaf dry matter content (LDMC) will increase, leaf thickness (LT) will increase,
leaf strength (sFtP) will increase, petiole length (PL) will decrease, instantaneous chlorophyll
fluorescence (Fo) will increase, quantum yield (QY) will decrease and wood density (WD) will
increase. Secondary succession will reflect a gradient in environmental conditions from high
temperature, low relative humidity, low soil water content and high light availability in
young secondary forests to reversed values in older sites. The changes in community
weighted mean will reflect the changes in species composition from species with acquisitive
‘fast’ characteristics to species with conservative ‘slow’ characteristics.
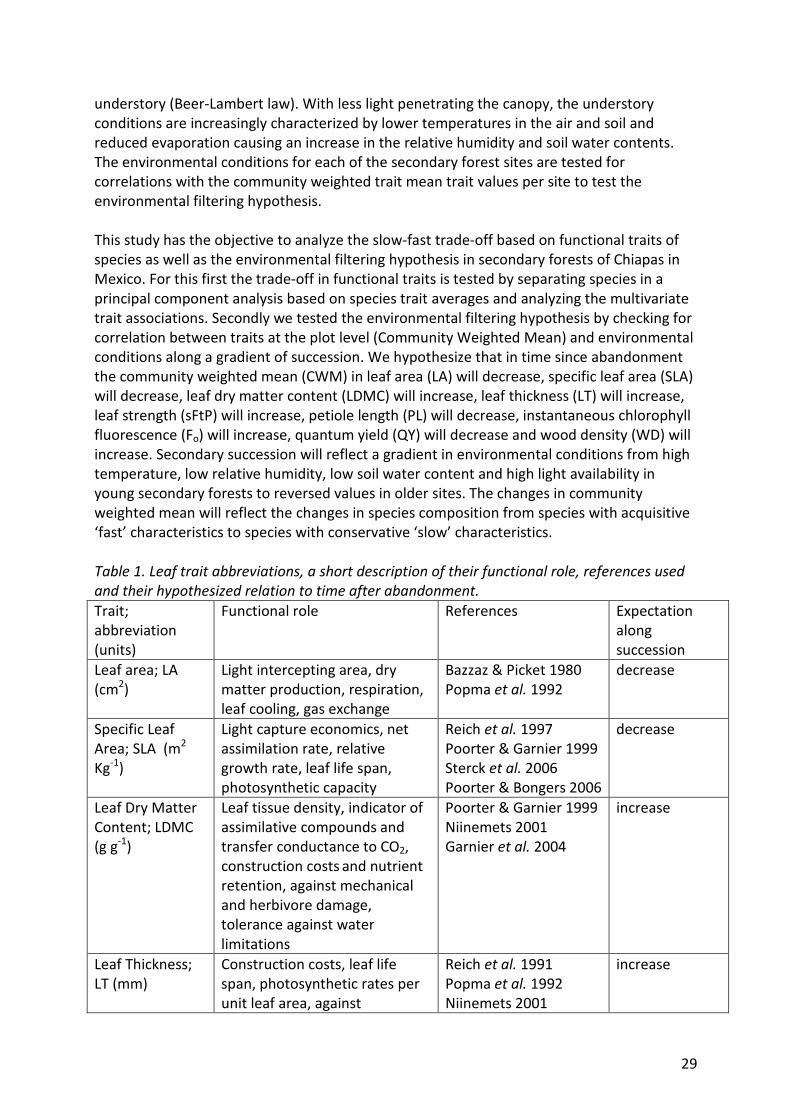
Table 1. Leaf trait abbreviations, a short description of their functional role, references used
and their hypothesized relation to time after abandonment.
Trait;
abbreviation
(units)
Functional role References Expectation
along
succession
Leaf area; LA
(cm2)
Light intercepting area, dry
matter production, respiration,
leaf cooling, gas exchange
Bazzaz & Picket 1980
Popma et al. 1992
decrease
Specific Leaf
Area; SLA (m2
Kg-1)
Light capture economics, net
assimilation rate, relative
growth rate, leaf life span,
photosynthetic capacity
Reich et al. 1997
Poorter & Garnier 1999
Sterck et al. 2006
Poorter & Bongers 2006
decrease
Leaf Dry Matter
Content; LDMC
(g g-1)
Leaf tissue density, indicator of
assimilative compounds and
transfer conductance to CO2,
construction costs and nutrient
retention, against mechanical
and herbivore damage,
tolerance against water
limitations
Poorter & Garnier 1999
Niinemets 2001
Garnier et al. 2004
increase
Leaf Thickness;
LT (mm)
Construction costs, leaf life
span, photosynthetic rates per
unit leaf area, against
Reich et al. 1991
Popma et al. 1992
Niinemets 2001
increase
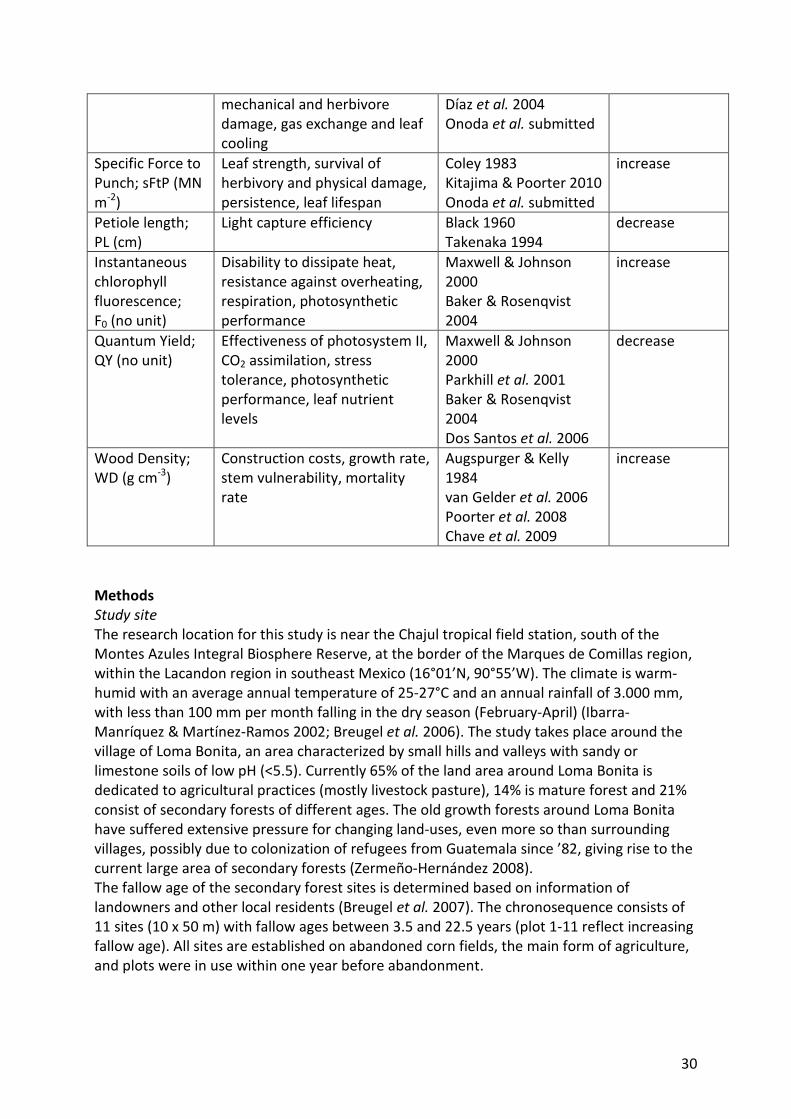
30
mechanical and herbivore
damage, gas exchange and leaf
cooling
Díaz et al. 2004
Onoda et al. submitted
Specific Force to
Punch; sFtP (MN
m-2)
Leaf strength, survival of
herbivory and physical damage,
persistence, leaf lifespan
Coley 1983
Kitajima & Poorter 2010
Onoda et al. submitted
increase
Petiole length;
PL (cm)
Light capture efficiency Black 1960
Takenaka 1994
decrease
Instantaneous
chlorophyll
fluorescence;
F0 (no unit)
Disability to dissipate heat,
resistance against overheating,
respiration, photosynthetic
performance
Maxwell & Johnson
2000
Baker & Rosenqvist
2004
increase
Quantum Yield;
QY (no unit)
Effectiveness of photosystem II,
CO2 assimilation, stress
tolerance, photosynthetic
performance, leaf nutrient
levels
Maxwell & Johnson
2000
Parkhill et al. 2001
Baker & Rosenqvist
2004
Dos Santos et al. 2006
decrease
Wood Density;
WD (g cm-3)
Construction costs, growth rate,
stem vulnerability, mortality
rate
Augspurger & Kelly
1984
van Gelder et al. 2006
Poorter et al. 2008
Chave et al. 2009
increase
Methods
Study site
The research location for this study is near the Chajul tropical field station, south of the
Montes Azules Integral Biosphere Reserve, at the border of the Marques de Comillas region,
within the Lacandon region in southeast Mexico (16°01’N, 90°55’W). The climate is warm-
humid with an average annual temperature of 25-27°C and an annual rainfall of 3.000 mm,
with less than 100 mm per month falling in the dry season (February-April) (Ibarra-
Manríquez & Martínez-Ramos 2002; Breugel et al. 2006). The study takes place around the
village of Loma Bonita, an area characterized by small hills and valleys with sandy or
limestone soils of low pH (<5.5). Currently 65% of the land area around Loma Bonita is
dedicated to agricultural practices (mostly livestock pasture), 14% is mature forest and 21%
consist of secondary forests of different ages. The old growth forests around Loma Bonita
have suffered extensive pressure for changing land-uses, even more so than surrounding
villages, possibly due to colonization of refugees from Guatemala since ’82, giving rise to the
current large area of secondary forests (Zermeño-Hernández 2008).
The fallow age of the secondary forest sites is determined based on information of
landowners and other local residents (Breugel et al. 2007). The chronosequence consists of
11 sites (10 x 50 m) with fallow ages between 3.5 and 22.5 years (plot 1-11 reflect increasing
fallow age). All sites are established on abandoned corn fields, the main form of agriculture,
and plots were in use within one year before abandonment.
31
Environmental variables
To test for consistent trait-environment relations across the secondary forest sites, five
environmental variables have been measured: air temperature, air relative humidity, light
availability, soil temperature and soil water content.
The sub-canopy environmental variables were measured during the dry season (March and
April). We measured air temperature and relative humidity in the vegetation (height of
1.5m) by using HOBO temperature / relative humidity data loggers (HOBO Pro v2 Temp/RH
logger, Onset Computer Corporation, UK). For each of the 10 HOBO dataloggers a
measurement was taken every minute for 15 minutes. The percentage of canopy openness
(here measured as an indicator of light availability) is measured with a spherical densiometer
(Spherical Densiometer Concave). A densiometer is sometimes criticized for not being very
accurate in measuring light conditions (e.g. Engelbrecht & Herz 2001), but sites showed very
distinct levels of light availability (ranging between 15% to 70% of openness or light
availability) and the relative simplicity of the canopy in secondary sites compared to old
growth forest (e.g. Brown & Lugo 1990) legitimizes the use of this method. Also two
independent days of sampling have been used to compromise for accuracy, all
measurements taken by the same person. Soil temperature (°C) and water content (%
volume) were assessed with a W.E.T. Sensor (type WET-2, Delta-T Devices Ltd) at a depth of
about 10 cm.
The environmental variables have been measured for 3 days (2 days in case of densiometer
measurements) during the dry season, at least 3 days after the last rain, on days without
overcast. Dates measuring subcanopy environmental conditions are randomly spread over
the sampling period. Measurements were carried out at the hottest and driest part of the
day, between 13.00 and 16.00. This is expected to capture the most extreme conditions to
which plants need to be adapted and considered a good way to illustrate differences
between the sites. Per plot 10 replicates were taken at even distances in a transect of 50
meters at the center of the plot. (Site 3 only allowed 4 replicate measures instead of 10
because it had partly been cleared.)
Functional traits
Nine functionally important traits were studied on saplings up to 5 meters high. Leaf traits
have been measured on 2 (sun-lit) leaves per individual and 10 replicate individuals per
species, except for specific force to punch where 5 individuals per species were assessed.
Wood traits are based on five adult individuals per species.
Standardized measurement protocols have been carried out as suggested by Cornelissen et
al. (2003).
Leaf Area (cm2). Leaf area was calculated by photographing the fresh area excluding the
petiole on a lightbox after which the area was calculated with pixel counting software ImageJ
(Rasband 2008).
Specific Leaf Area (m2 Kg-1). SLA was calculated as the fresh leaf area divided by the oven
dried mass (dried for 48 hours at 70°C), excluding the petiole. In the case of composite
leaves the smallest photosynthetic unit was taken.
Leaf Dry Matter Content (g g-1). After collection the leaves were placed in water to rehydrate
for at least 5 hours after which the fresh weight has been determined. The oven dry weight
is divided over the fresh weight for acquiring the leaf dry matter content.
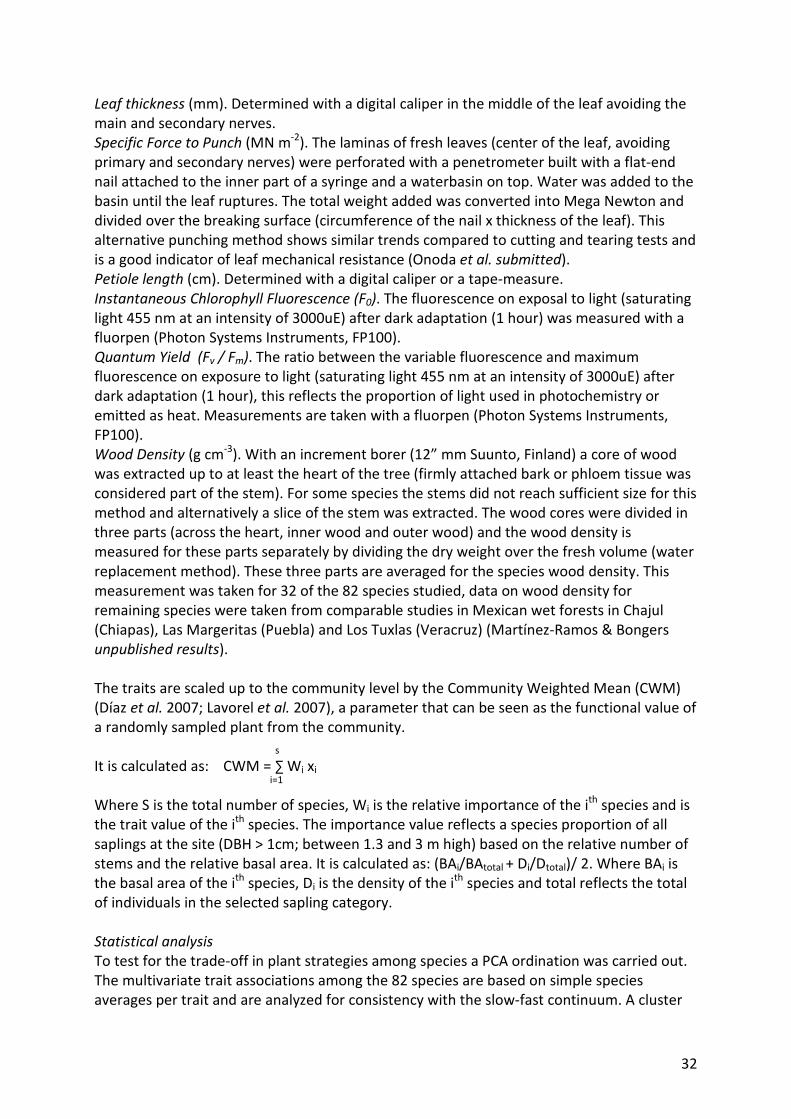
32
Leaf thickness (mm). Determined with a digital caliper in the middle of the leaf avoiding the
main and secondary nerves.
Specific Force to Punch (MN m-2). The laminas of fresh leaves (center of the leaf, avoiding
primary and secondary nerves) were perforated with a penetrometer built with a flat-end
nail attached to the inner part of a syringe and a waterbasin on top. Water was added to the
basin until the leaf ruptures. The total weight added was converted into Mega Newton and
divided over the breaking surface (circumference of the nail x thickness of the leaf). This
alternative punching method shows similar trends compared to cutting and tearing tests and
is a good indicator of leaf mechanical resistance (Onoda et al. submitted).
Petiole length (cm). Determined with a digital caliper or a tape-measure.
Instantaneous Chlorophyll Fluorescence (F0). The fluorescence on exposal to light (saturating
light 455 nm at an intensity of 3000uE) after dark adaptation (1 hour) was measured with a
fluorpen (Photon Systems Instruments, FP100).
Quantum Yield (Fv / Fm). The ratio between the variable fluorescence and maximum
fluorescence on exposure to light (saturating light 455 nm at an intensity of 3000uE) after
dark adaptation (1 hour), this reflects the proportion of light used in photochemistry or
emitted as heat. Measurements are taken with a fluorpen (Photon Systems Instruments,
FP100).
Wood Density (g cm-3). With an increment borer (12” mm Suunto, Finland) a core of wood
was extracted up to at least the heart of the tree (firmly attached bark or phloem tissue was
considered part of the stem). For some species the stems did not reach sufficient size for this
method and alternatively a slice of the stem was extracted. The wood cores were divided in
three parts (across the heart, inner wood and outer wood) and the wood density is
measured for these parts separately by dividing the dry weight over the fresh volume (water
replacement method). These three parts are averaged for the species wood density. This
measurement was taken for 32 of the 82 species studied, data on wood density for
remaining species were taken from comparable studies in Mexican wet forests in Chajul
(Chiapas), Las Margeritas (Puebla) and Los Tuxlas (Veracruz) (Martínez-Ramos & Bongers
unpublished results).
The traits are scaled up to the community level by the Community Weighted Mean (CWM)
(Díaz et al. 2007; Lavorel et al. 2007), a parameter that can be seen as the functional value of
a randomly sampled plant from the community.
s
It is calculated as: CWM = ∑ Wi xi
i=1
Where S is the total number of species, Wi is the relative importance of the ith species and is
the trait value of the ith species. The importance value reflects a species proportion of all
saplings at the site (DBH > 1cm; between 1.3 and 3 m high) based on the relative number of
stems and the relative basal area. It is calculated as: (BAi/BAtotal + Di/Dtotal)/ 2. Where BAi is
the basal area of the ith species, Di is the density of the ith species and total reflects the total
of individuals in the selected sapling category.
Statistical analysis
To test for the trade-off in plant strategies among species a PCA ordination was carried out.
The multivariate trait associations among the 82 species are based on simple species
averages per trait and are analyzed for consistency with the slow-fast continuum. A cluster
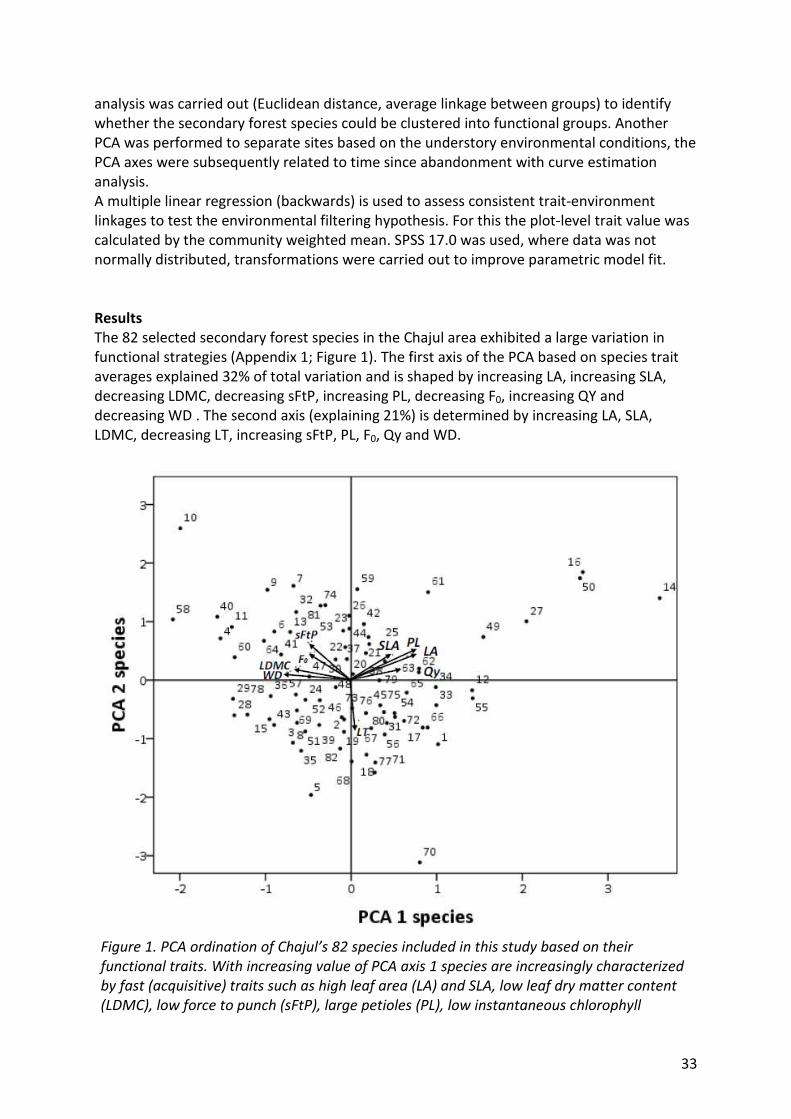
33
analysis was carried out (Euclidean distance, average linkage between groups) to identify
whether the secondary forest species could be clustered into functional groups. Another
PCA was performed to separate sites based on the understory environmental conditions, the
PCA axes were subsequently related to time since abandonment with curve estimation
analysis.
A multiple linear regression (backwards) is used to assess consistent trait-environment
linkages to test the environmental filtering hypothesis. For this the plot-level trait value was
calculated by the community weighted mean. SPSS 17.0 was used, where data was not
normally distributed, transformations were carried out to improve parametric model fit.
Results
The 82 selected secondary forest species in the Chajul area exhibited a large variation in
functional strategies (Appendix 1; Figure 1). The first axis of the PCA based on species trait
averages explained 32% of total variation and is shaped by increasing LA, increasing SLA,
decreasing LDMC, decreasing sFtP, increasing PL, decreasing F0, increasing QY and
decreasing WD . The second axis (explaining 21%) is determined by increasing LA, SLA,
LDMC, decreasing LT, increasing sFtP, PL, F0, Qy and WD.
Figure 1. PCA ordination of Chajul’s 82 species included in this study based on their
functional traits. With increasing value of PCA axis 1 species are increasingly characterized
by fast (acquisitive) traits such as high leaf area (LA) and SLA, low leaf dry matter content
(LDMC), low force to punch (sFtP), large petioles (PL), low instantaneous chlorophyll
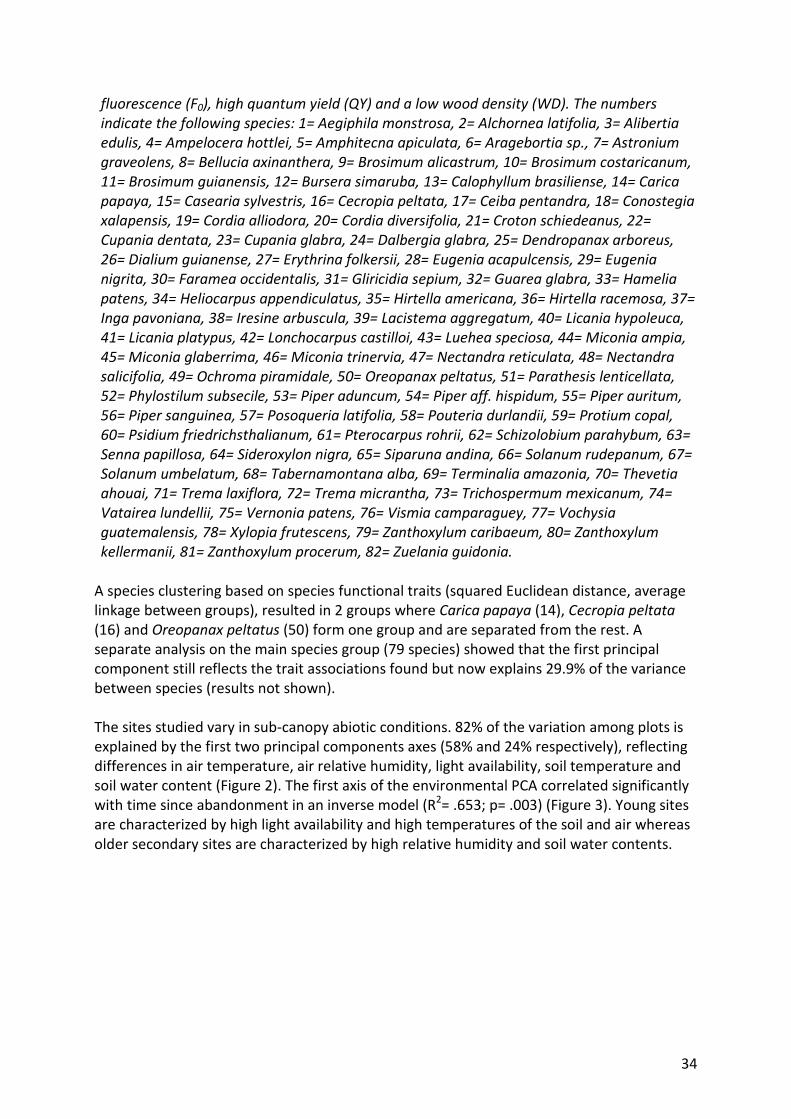
34
fluorescence (F0), high quantum yield (QY) and a low wood density (WD). The numbers
indicate the following species: 1= Aegiphila monstrosa, 2= Alchornea latifolia, 3= Alibertia
edulis, 4= Ampelocera hottlei, 5= Amphitecna apiculata, 6= Aragebortia sp., 7= Astronium
graveolens, 8= Bellucia axinanthera, 9= Brosimum alicastrum, 10= Brosimum costaricanum,
11= Brosimum guianensis, 12= Bursera simaruba, 13= Calophyllum brasiliense, 14= Carica
papaya, 15= Casearia sylvestris, 16= Cecropia peltata, 17= Ceiba pentandra, 18= Conostegia
xalapensis, 19= Cordia alliodora, 20= Cordia diversifolia, 21= Croton schiedeanus, 22=
Cupania dentata, 23= Cupania glabra, 24= Dalbergia glabra, 25= Dendropanax arboreus,
26= Dialium guianense, 27= Erythrina folkersii, 28= Eugenia acapulcensis, 29= Eugenia
nigrita, 30= Faramea occidentalis, 31= Gliricidia sepium, 32= Guarea glabra, 33= Hamelia
patens, 34= Heliocarpus appendiculatus, 35= Hirtella americana, 36= Hirtella racemosa, 37=
Inga pavoniana, 38= Iresine arbuscula, 39= Lacistema aggregatum, 40= Licania hypoleuca,
41= Licania platypus, 42= Lonchocarpus castilloi, 43= Luehea speciosa, 44= Miconia ampia,
45= Miconia glaberrima, 46= Miconia trinervia, 47= Nectandra reticulata, 48= Nectandra
salicifolia, 49= Ochroma piramidale, 50= Oreopanax peltatus, 51= Parathesis lenticellata,
52= Phylostilum subsecile, 53= Piper aduncum, 54= Piper aff. hispidum, 55= Piper auritum,
56= Piper sanguinea, 57= Posoqueria latifolia, 58= Pouteria durlandii, 59= Protium copal,
60= Psidium friedrichsthalianum, 61= Pterocarpus rohrii, 62= Schizolobium parahybum, 63=
Senna papillosa, 64= Sideroxylon nigra, 65= Siparuna andina, 66= Solanum rudepanum, 67=
Solanum umbelatum, 68= Tabernamontana alba, 69= Terminalia amazonia, 70= Thevetia
ahouai, 71= Trema laxiflora, 72= Trema micrantha, 73= Trichospermum mexicanum, 74=
Vatairea lundellii, 75= Vernonia patens, 76= Vismia camparaguey, 77= Vochysia
guatemalensis, 78= Xylopia frutescens, 79= Zanthoxylum caribaeum, 80= Zanthoxylum
kellermanii, 81= Zanthoxylum procerum, 82= Zuelania guidonia.
A species clustering based on species functional traits (squared Euclidean distance, average
linkage between groups), resulted in 2 groups where Carica papaya (14), Cecropia peltata
(16) and Oreopanax peltatus (50) form one group and are separated from the rest. A
separate analysis on the main species group (79 species) showed that the first principal
component still reflects the trait associations found but now explains 29.9% of the variance
between species (results not shown).
The sites studied vary in sub-canopy abiotic conditions. 82% of the variation among plots is
explained by the first two principal components axes (58% and 24% respectively), reflecting
differences in air temperature, air relative humidity, light availability, soil temperature and
soil water content (Figure 2). The first axis of the environmental PCA correlated significantly
with time since abandonment in an inverse model (R2= .653; p= .003) (Figure 3). Young sites
are characterized by high light availability and high temperatures of the soil and air whereas
older secondary sites are characterized by high relative humidity and soil water contents.
35
Figure 2. The secondary forest sites separated based on the subcanopy environmental
conditions (air relative humidity, air temperature, light availability, soil water content, soil
temperature). The first axis explains 58% and the second axis 24% of the environmental
variation between the sites.
Figure 3. The first component of the PCA (58%) separating sites based on their subcanopy
environmental conditions is significantly explained by age of the secondary forest (R2= .653;
p= .003).
Community weighted mean trait values (CWM) per plot are well explained by the
environmental variables. Leaf area is explained by variation in air temperature (R= .614; p=
.044), leaf thickness is related to light availability (R= -.578; p= .063), leaf strength is related
to a combination of soil temperature (R= -.797; p= .065), air relative humidity (R= .825; p=
.046) and air temperature (R= 1.556; p= .012). Petiole length is explained by air temperature
(R= .600; p= .051) and quantum yield is related to light availability (R= .652; p= .019) and soil
water contents (R= 1.020; p= .002) (Figure 4). Surprisingly, several CWM trait values (SLA,
LDMC, Fo and WD) are independent of the environmental variables measured.
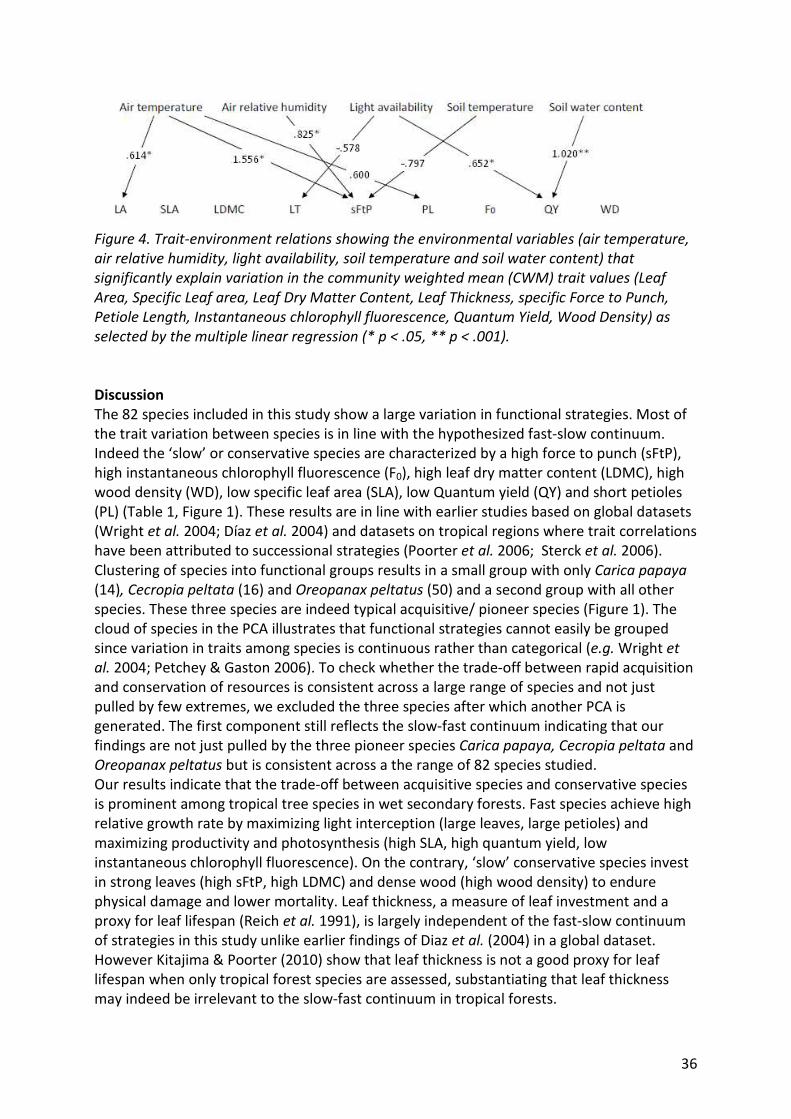
36
Figure 4. Trait-environment relations showing the environmental variables (air temperature,
air relative humidity, light availability, soil temperature and soil water content) that
significantly explain variation in the community weighted mean (CWM) trait values (Leaf
Area, Specific Leaf area, Leaf Dry Matter Content, Leaf Thickness, specific Force to Punch,
Petiole Length, Instantaneous chlorophyll fluorescence, Quantum Yield, Wood Density) as
selected by the multiple linear regression (* p < .05, ** p < .001).
Discussion
The 82 species included in this study show a large variation in functional strategies. Most of
the trait variation between species is in line with the hypothesized fast-slow continuum.
Indeed the ‘slow’ or conservative species are characterized by a high force to punch (sFtP),
high instantaneous chlorophyll fluorescence (F0), high leaf dry matter content (LDMC), high
wood density (WD), low specific leaf area (SLA), low Quantum yield (QY) and short petioles
(PL) (Table 1, Figure 1). These results are in line with earlier studies based on global datasets
(Wright et al. 2004; Díaz et al. 2004) and datasets on tropical regions where trait correlations
have been attributed to successional strategies (Poorter et al. 2006; Sterck et al. 2006).
Clustering of species into functional groups results in a small group with only Carica papaya
(14), Cecropia peltata (16) and Oreopanax peltatus (50) and a second group with all other
species. These three species are indeed typical acquisitive/ pioneer species (Figure 1). The
cloud of species in the PCA illustrates that functional strategies cannot easily be grouped
since variation in traits among species is continuous rather than categorical (e.g. Wright et
al. 2004; Petchey & Gaston 2006). To check whether the trade-off between rapid acquisition
and conservation of resources is consistent across a large range of species and not just
pulled by few extremes, we excluded the three species after which another PCA is
generated. The first component still reflects the slow-fast continuum indicating that our
findings are not just pulled by the three pioneer species Carica papaya, Cecropia peltata and
Oreopanax peltatus but is consistent across a the range of 82 species studied.
Our results indicate that the trade-off between acquisitive species and conservative species
is prominent among tropical tree species in wet secondary forests. Fast species achieve high
relative growth rate by maximizing light interception (large leaves, large petioles) and
maximizing productivity and photosynthesis (high SLA, high quantum yield, low
instantaneous chlorophyll fluorescence). On the contrary, ‘slow’ conservative species invest
in strong leaves (high sFtP, high LDMC) and dense wood (high wood density) to endure
physical damage and lower mortality. Leaf thickness, a measure of leaf investment and a
proxy for leaf lifespan (Reich et al. 1991), is largely independent of the fast-slow continuum
of strategies in this study unlike earlier findings of Diaz et al. (2004) in a global dataset.
However Kitajima & Poorter (2010) show that leaf thickness is not a good proxy for leaf
lifespan when only tropical forest species are assessed, substantiating that leaf thickness
may indeed be irrelevant to the slow-fast continuum in tropical forests.
37
It should be noted that this PCA is based on traits that are selected for their known relation
to the trade-off in resource acquisition strategies, when traits like seed size and maximum
height (more related to the colonization- competition trade-off) would have been included
the spectrum may have been different.
The 11 secondary forest sites show a gradient of understory environmental conditions that is
significantly related to the age of the site. Young secondary sites are characterized by high
temperatures of air and soil, high light environment and low relative humidity and soil water
contents (Figure 3). The inverse model illustrates that mainly the very young sites (<5 years)
exhibit the extreme hot and dry conditions. Already at about 10 years of fallow age the
environmental conditions seem to have reached a relatively constant environment
considering the variables studied. Site 8 (9.5 years of fallow age) is characterized by an
environment more typical for the very young successional sites and appears as an outlier in
the graph. This may be due to it’s location which is somewhat higher in elevation than the
other sites, possibly causing it to be drier.
The community weighted mean for five out of nine functional traits are significantly related
to the abiotic conditions (Figure 4). This is a strong indicator that environmental filtering is
an important driver of community assembly in the study area.
Leaf area is significantly larger in sites with higher temperatures, confirming the hypothesis
that early successional species maximize light capture for fast growth (Bazzaz & Picket 1980).
Leaves are thicker in sites with less light available in the understory, also in line with
expectations. Older plots with complex multilayered canopies allow less light to penetrate,
and species adapted to the low light conditions of older secondary forests will be
characterized by conservation of internal resources like thick and durable leaves (Onoda et
al. submitted).
Leaf strength is explained by a combination of the variables air temperature, air relative
humidity and soil temperature, in which air temperature explains the main variation. Results
indicate that leaves are physically stronger in the young sites with higher temperatures,
rejecting our hypotheses. Accordingly, leaves in older sites appear thicker, but not stronger
as leading from the trait-environment relations. In this study leaf thickness and specific force
to punch are not related (Appendix 2) unlike previous studies demonstrated (Santiago 2003;
Onoda et al. submitted). This can be explained by our measure of leaf strength which is
normalized for breaking surface, and thus also for lamina thickness, ignoring the
contribution of thickness to leaf strength (Read & Sanson 2003). Therefore this suggests that
the importance of absolute leaf strength may increase during successional changes, like
hypothesized, whereas the specific force to punch (leaf strength per unit breaking surface)
does not. An earlier study on leaf toughness in secondary forests on highly degraded versus
fertile soils showed that leaf toughness was higher on degraded soils (Choong et al. 1992),
probably because plants on fertile soils do not need to defend their leaves, as they can
easily replace leaf loss by herbivores (resource availability hypothesis). This provides another
explanation for stronger leaves in younger sites: these sites are more degraded. A second
alternative hypothesis for increased leaf strength in high temperature sites may be found in
the leaf hydraulic capacity, defined as a plant’s capacity for water use and is negatively
correlated to gas exchange (Sack & Frole 2006). We expect a lower hydraulic resistance in
leaves of pioneer species because of increased need for gas exchange to attain high levels of
photosynthesis. This may be achieved by more venation which is likely to increase leaf
38
strength since toughness outside the primary and secondary nerves is mainly determined by
the tertiary and higher order veins of the leaf (Choong et al. 1992).
The length of the petiole shows directional changes and is positively correlated to air
temperature, as hypothesized. Early successional species in the high light environments
maximize light capture by selection for large petioles that reduce leaf aggregation around
the stem (Takenaka 1994). This result strengthens the positive relation between leaf area
and air temperature because leaf size and petiole length are allometrically related
(Niinemets & Kull 1999), as also shown in this study (Appendix 2).
Quantum yield is explained by a combination of the light availability and soil water contents
where soil water contents explains the main variation. Against hypothesized, the positive
relation between quantum yield and water contents of the soil indicates that plants in late
successional plots have a more efficient strategy to use excess light in photosynthesis (Dos
Santos 2006) and more resistance against stress which can cause damage to the
photosystem II (Maxwell & Johnson 2000; Parkhill et al. 2001). However, quantum yield is an
indication of the energy used in photochemistry or emitted as heat without knowing the
proportion attributed to both processes. One could reason that the photosystem II efficiency
needs to be higher for late successional species, as less sunlight is available which would
increase the need for efficient use of energy in photochemistry. A higher resistance against
photoinhibition by the ability to emit energy in the form of heat (instead of in the form of
fluorescence) does appear relevant for late successional species and maybe in this case the
higher quantum yield should only be attributed to the efficiency of energy use in
photochemistry.
Specific leaf area, leaf dry matter content, instantaneous chlorophyll fluorescence and wood
density show no pattern with any of the environmental variables measured. Lack of pattern
of instantaneous chlorophyll fluorescence is possibly due to high plasticity hampering the
comparison between species (Maxwell & Johnson 2000) which could also be the case for SLA
and LDMC. Another reason for the lack of response of sapling traits to subcanopy
environmental conditions is that traits can be subjected to opposing gradients. Besides the
fast-to-slow gradient along succession there may be selection for extreme stress tolerant
species in the very early hot, dry and open sites. For example for leaf dry matter content
alternative predictions have been formulated such as decreasing LDMC during succession as
a reflection of tolerance against water limitations (Niinemets 2001). Plant adaptations to do
with defense against herbivory or pathogens were also proposed to explain results that were
contrary to hypothesized from the slow-fast trade-off in Ricaño-Rocha (2007) based on the
lack of pattern in the root-shoot ratio of tropical forest seedlings in the same study area.
Chave et al. (2009) state that wood properties are not inherently related with ‘slow’ and ‘
fast’ strategies as found in leaves, concluded from mixed findings correlating wood traits
with leaf traits.
Environmental filtering as a driver of community assembly assumes that plants present have
survived certain abiotic conditions based on the suitability of their functional traits.
However, as environmental conditions are changing during secondary succession, at the
actual time of filtering the conditions may have been different from what has been
measured at the sites, making the causal relation between traits and their environment
arbitrary. A time lag may well be a reason why some traits did not respond, like wood
density which is a ‘whole plant trait’ and thus slower in responses to local abiotic conditions
than leaf traits which more easily react to changing abiotic conditions.
39
Conclusion
Data show that the trade-off between species functional strategies for either acquisitive use
of resources or conservative use of resources, the slow-fast continuum, explains most of the
trait variation in tree species in tropical secondary forest in Chiapas, Mexico. Linking plant
functional strategies to changing environmental conditions along a gradient of succession
resulted in some strong trait-environment relations, supporting the environmental filtering
hypothesis. However not all relations can be explained by the slow-fast continuum and plant
adaptations to opposing gradients should be thought of. Besides the growth-survival trade-
off, fast versus slow species, adaptation to opposing gradients like exposure to herbivory
and pathogens or stress-tolerance may increase our understanding of the wide range of
functional strategies present in tropical wet forest.
40
References
Augspurger C.K., Kelly C.K. 1984. Pathogen mortality of tropical tree seedlings: experimental
studies of the effects of dispersal distance, seedling density, and light conditions.
Oecologia 61: 211-217.
Baker N.R., Rosenqvist E. 2004. Applications of chlorophyll fluorescence can improve crop
production strategies: an examination of future possibilities. Journal of Experimental
Botany 55(403): 1607-1621.
Bazzaz F.A., Pickett S.T.A. 1980. Physiological ecology of tropical succession: a comparative
review. Annual Review of Ecology and Systematics 11: 287-310.
Black J.N. 1960. The significance of petiole length, leaf area, and light interception in
competition between strains of subterranean clover grown in swards. Australian Journal of
Agricultural Research 11(3): 277-291.
Breugel van M., Martínez-Ramos M., Bongers F. 2006. Community dynamics during early
secondary succession in Mexican tropical rain forests. Journal of Tropical Ecology 22: 663-
674.
Breugel van M., Bongers F., Martínez-Ramos M. 2007. Species dynamics during early
secondary forest succession: recruitment, mortality and species turnover. Biotropica 35(5):
610-619.
Brown S., Lugo A.E. 1990. Tropical secondary forests. Journal of Tropical Ecology 6(1): 1-32.
Burton A.J., Pregitzer K.S., Reed D.D. 1991. Leaf area and foliar biomass relationships in
northern hardwood forest located along an 800 km acid deposition gradient. Forest
Science 37(4): 1041-1059.
Chave J., Coomes D., Jansen S., Lewis S.L., Swenson N.G., Zanne A.E. 2009. Towards a
worldwide wood economics spectrum. Ecology Letters 12: 351-366.
Choong M.F., Lucan P.W., Ong J.S.Y., Pereira B., Tan H.T.W., Turner I.M. 1992. Leaf fracture
toughness and sclerophylly: their correlations and ecological implications. New Phytologist
121(4): 597-610.
Coley P.D. 1983. Herbivory and defensive characteristics of tree species in a lowland tropical
forest. Ecological Monographs 53(2): 209-233.
Cornelissen J.H.C., Lavorel S., Garnier E., Díaz S., Buchmann N., Gurvich D.E., Reich P.B., ter
Steege H., Morgan H.D., van der Heijden M.G.A., Pausas J.G. , Poorter H. 2003. A handbook
of protocols for standardised and easy measurement of plant functional traits worldwide.
Australian Journal of Botany 51: 335–380.
Díaz S., Hodgson J.G., Thompson K., Cabido M., Cornelissen J.H.C, Jalili A., Monserrat-Martí
G., Grime J.P., Zarrinkamar F., Asri Y., Band S.R., Basconcelo S., Castro-Díez P., Funes G.,
Hamzehee B., Khoshnevi M., Pérez-Harguindeguy N., Pérez-Rontomé M.C., Shirvany F.A.,
Vendramini F., Yazdani S., Abbas-Azimi R., Bogaard A., Boustani S., Charles M., Dehghan
M., de Torres-Espuny L., Falczuk V., Guerrero-Campo J., Hynd A., Jones G., Kowsary E.,
Kazemi-Saeed F., Meastro-Martínez M., Romo-Díez A., Shaw S., Siavash B., Villar-Salvador
P., Zak M.R. 2004. The plant traits that drive ecosystems: Evidence from three continents.
Journal of Vegetation Science 15: 295-304.
Díaz S., Lavorel S., de Bello F., Quétier F., Grigulis K., Robson M. 2007. Incorporating plant
functional Diversity effects in ecosystem service assessments. Proceedings of the National
Academy of Sciences 104: 20684-20689.
41
Dos Santos U.M., de Carvalho Gonçalves J.F., Feldpausch T.R. 2006. Growth, leaf nutrient
concentration and photosynthetic nutrient use efficiency in tropical tree species planted in
degraded area in central Amazonia. Forest Ecology and Management 226: 299-309.
Engelbrecht B.M.J., Herz H.M. 2001. Evaluation of different methods to estimate understory
light conditions in tropical forests. Journal of Tropical Ecology 17: 207-224.
Garnier E., Cortez J., Billès G., Navas M-L., Roumet C., Debussche M., Laurent G., Blanchard
A., Aubry D., Bellmann A., Neill C., Toussaint J-P. 2004. Plant functional markers capture
ecosystem properties during secondary succession. Ecology 85(9): 2630-2637.
Gelder van H.A., Poorter L., Sterck F. 2006. Wood mechanics, allometry, and life-history
variation in a tropical rain forest tree community. New Phytologist 171(2): 367-378.
Hubbell S.P. 2001. The unified neutral theory of biodiversity and biogeography. Princeton
University Press, Princeton.
Ibarra-Manríquez G., Martínez-Ramos M., Oyama K. 2001. Seedling functional types in a
lowland rainforest in Mexico. American Journal of Botany 88(10): 1801-1812.
Kendall Snell J.A., Brown J.K. 1978. Comparison of tree biomass estimators – DBH and
sapwood area. Forest Science 24(4): 455-456.
Kitajima K. 1994. Relative importance of photosynthetic traits and allocation patterns as
correlated of seedling shade tolerance of 13 tropical tree species. Oecologia 98: 419-428.
Kitajima K., Poorter L. 2008. Functional basis for resource niche partitioning by tropical trees.
Tropical Forest Community Ecology. W.P. Carson, S.A. Schnitzer (Eds). Blackwell Publishing.
Kitajima K., Poorter L. 2010. Tissue-level leaf toughness, but not lamina thickness, predicts
sapling leaf lifespan and shade tolerance of tropical tree species. New Phytologist.
Lambers H., Stuart Chapin III F., Pons T. 2008. Plant physiological ecology. Second Edition.
Springer Science + Business Media, LLC.
Lavorel S., Grigulis K., McIntyre S., Williams N., Garden D., Dorrough J., Berman S., Quétier F.,
Thébault A., Bonis Q. 2007. Assessing functional diversity in the field- methodology
matters!. Functional Ecology 16: 134-147.
Martínez-Ramos M., Bongers F. unpublished results. Centro de Investigaciones en
ecosystemas (CIEco), Universidad Autonoma de México (UNAM). Wageningen University
and Research center (WUR).
Maxwell K., Johnson G.N. 2000. Chlorophyll fluorescence- A practical guide. Journal of
Experimental Botany 51: 659-668.
Niinemets Ü., Kull O. 1999. Biomass investment in leaf lamina versus lamina support in
relation to growth irradiance and leaf size in temperature deciduous trees. Tree Physiology
19: 349-358.
Niinemets Ü. 2001. Global scale climatic controls of leaf dry mass per area, density, and
thickness in trees and shrubs. Ecology 82: 453-469.
Onoda Y., Westoby M., Adler P., Choong A., Clissold F., Cornelissen J., Díaz S., Dominy N.,
Elgart A., Enrico L., Fine P., Howard J., Jalili A., Kitajima K., Kurokawa H., Lucan P.,
Markesteijn L., McArthur C., Perez-Harguindeguy N., Poorter L., Richards L., Santiago L.,
Sosinski Jr E., Van Bael S., Warton D., Wright I., Wright S., Yamashita N. submitted. Global
patterns of leaf mechanical properties.
Parkhill J-P., Maillet G., Cullen J.J. 2001. Fluorescence-based maximal quantum yield for PSII
as a diagnostic of nutrient stress. Journal of Phycology 37: 517-529.
Petchey O.L., Gaston K.J. 2006. Functional diversity: back to the basics and looking forward.
Ecology Letters 9: 741-758.
42
Ricaño-Rocha A. 2007. Morfología aeréa y subterránea de plántulas tropicales: variación a lo
largo del gradiente sucesional en campos abandonados en una selva alta. Tesis maestra en
ciencias biológicas. Universidad Nacional Autónoma de México.
Poorter L. 1999. Growth responses of 15 rain-forest tree species to a light gradient: the
relative importance of morphological and physiological traits. Functional Ecology 13: 396-
410.
Poorter H., Garnier E. 1999. Ecological significance of relative growth rate and its
components. In: Handbook of functional plant ecology. F.I. Pugnaire, F. Valladares (Eds).
Marcel Dekker, New York.
Poorter L., Bongers F. 2006. Leaf traits are good predictors of plant performance across 53
rain forest species. Ecology 87(7): 1733-1743.
Poorter L., Bongers L., Bongers F. 2006. Architecture of 54 moist-forest tree species: traits
trade-offs, and functional groups. Ecology 87(5): 1289-1301.
Poorter L., Wright S.J., Paz H., Ackerly D.D., Condit R., Ibarra-Manriquez G., Harms K.E.,
Licona J.C., Martínez-Ramos M., Mazer S.J., Muller-Landau H.C., Peña-Claros M., Webb
C.O., Wright I.J. 2008. Are functional traits good predictors of demographic rates? Evidence
from five Neotropical forests. Ecology 89(7): 1908-1920.
Poorter H., Niinemets Ü., Poorter L., Wright I., Villar R. 2009. Causes and consequences of
variation in leaf mass par area (LMA): a meta analysis. New Phytologist 182: 565-588.
Popma J., Bongers F., Werger M.J.A. 1992. Gap-dependence and leaf characteristics of trees
in a tropical lowland rain forest in Mexico. Oikos 63: 207-214.
Rasband W.S. 2008. Image J. US National Institutes of Health, Bethesda, Maryland, USA.
Available online http://rsbweb.nih.gov/ij/index.html.
Read J., Sanson G.D. 2003. Characterizing sclerophylly: the mechanical properties of a
diverse range of leaf types. New Phytologist 160(1): 81-99.
Reich P.B., Uhl C., Walters M.B., Ellsworth D.S. 1991. Leaf lifespan as a function of leaf
structure and function among 23 Amazonian tree species. Oecologia 86: 16-24.
Reich P.B., Walters M.B., Ellsworth D.S., Uhl C. 1994. Photosynthesis-nitrogen relations in
Amazonian tree species. Oecologia 97: 62-72.
Reich P.B., Walters M.B., Ellsworth D.S. 1997. From tropics to tundra: Global convergence in
plant functioning. Proceedings of the National Academy of Science USA 94: 13730-13734.
Reich P.B., Wright I.J., Cavender-Bares J., Craine J.M., Oleksyn J., Westoby M., Walters M.B.
2003. The evolution of plant functional variation: traits, spectra, and strategies.
International Journal of Plant Sciences 164(3): 143-164.
Sack L., Frole K. 2006. Leaf structural diversity is related to hydraulic capacity in tropical
rainforest trees. Ecology 87(2): 483-491.
Santiago L.S. 2003. Leaf traits of canopy trees on a precipitation gradient in Panama:
integrating plant physiological ecology and ecosystem science. PhD dissertation. University
of Florida. USA.
Sterck F.J., Bongers F. 2001. Crown development in tropical rain forest trees: patterns with
tree height and light availability. Journal of Ecology 89: 1-13.
Sterck F.J., Poorter L., Schieving F. 2006. Leaf traits determine the growth-survival trade-off
across rain forest tree species. The American Naturalist 167(5): 758-765.
Takenaka A. 1994. Effects of leaf blade narrowness and petiole length on the light capture
efficiency of a shoot. Ecological research 9: 109-114.
Wright I.J., Reich P.B., Westoby M., Ackerly D.D., Baruch Z., Bongers F., Cavender-Bares J.,
Chapin T., Cornelissen J.H.C., Diemer M., Flexas J., Garnier E., Groom P.K., Gulias J.,

43
Hikosaka K., Lamont B.B., Lee T., Lee W., Lusk C., Midgley J.J., Navas M., Niinemets Ü.,
Oleksyn J., Osada N., Poorter N., Poot P., Prior L., Pyankov V.I., Roumet C., Thomas S.C.,
Tjoelker M.G., Veneklaas E.J., Villar R. 2004. The worldwide leaf economics spectrum.
Nature 428: 821-827.
Zermeño-Hernández I.E. 2008. Evaluación del disturbio ecológico provocado por diferentes
tipos de uso agrícola del suelo en una región tropical húmeda. Tesis maestra en ciencias
biológicas. Universidad Nacional Autónoma de México.
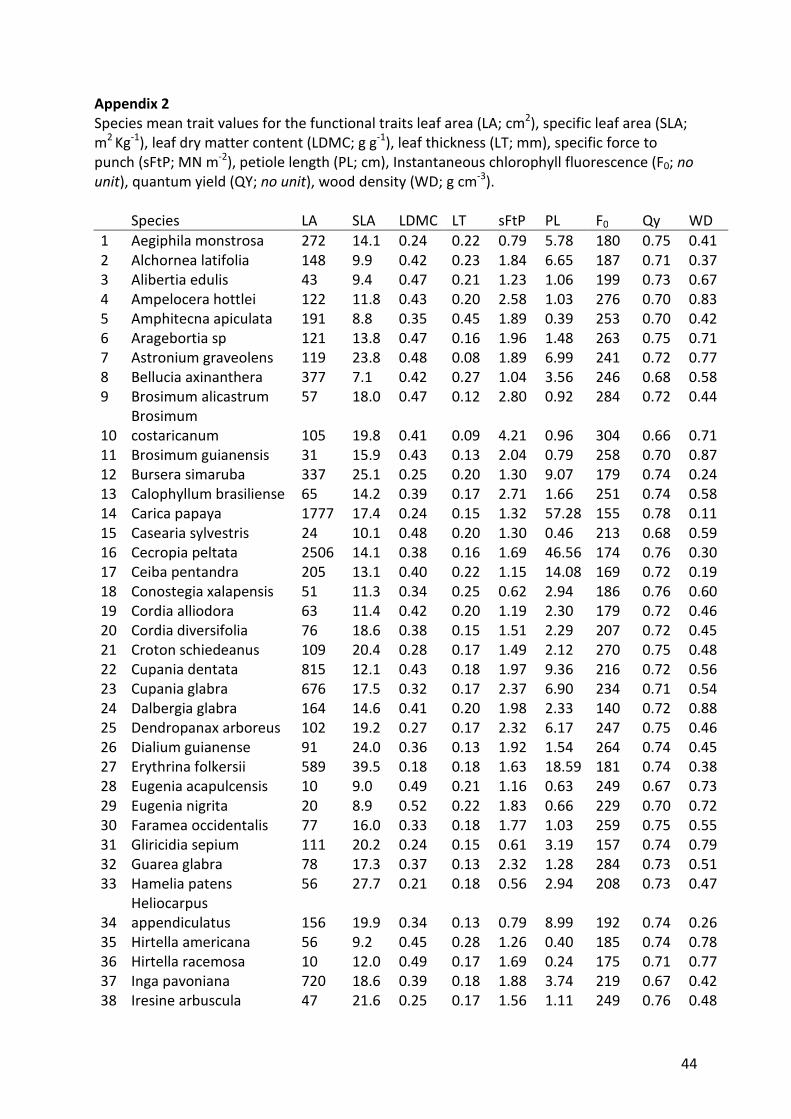
44
Appendix 2
Species mean trait values for the functional traits leaf area (LA; cm2), specific leaf area (SLA;
m2 Kg-1), leaf dry matter content (LDMC; g g-1), leaf thickness (LT; mm), specific force to
punch (sFtP; MN m-2), petiole length (PL; cm), Instantaneous chlorophyll fluorescence (F0; no
unit), quantum yield (QY; no unit), wood density (WD; g cm-3).
Species LA SLA LDMC LT sFtP PL F0 Qy WD
1 Aegiphila monstrosa 272 14.1 0.24 0.22 0.79 5.78 180 0.75 0.41
2 Alchornea latifolia 148 9.9 0.42 0.23 1.84 6.65 187 0.71 0.37
3 Alibertia edulis 43 9.4 0.47 0.21 1.23 1.06 199 0.73 0.67
4 Ampelocera hottlei 122 11.8 0.43 0.20 2.58 1.03 276 0.70 0.83
5 Amphitecna apiculata 191 8.8 0.35 0.45 1.89 0.39 253 0.70 0.42
6 Aragebortia sp 121 13.8 0.47 0.16 1.96 1.48 263 0.75 0.71
7 Astronium graveolens 119 23.8 0.48 0.08 1.89 6.99 241 0.72 0.77
8 Bellucia axinanthera 377 7.1 0.42 0.27 1.04 3.56 246 0.68 0.58
9 Brosimum alicastrum 57 18.0 0.47 0.12 2.80 0.92 284 0.72 0.44
10
Brosimum
costaricanum 105 19.8 0.41 0.09 4.21 0.96 304 0.66 0.71
11 Brosimum guianensis 31 15.9 0.43 0.13 2.04 0.79 258 0.70 0.87
12 Bursera simaruba 337 25.1 0.25 0.20 1.30 9.07 179 0.74 0.24
13 Calophyllum brasiliense 65 14.2 0.39 0.17 2.71 1.66 251 0.74 0.58
14 Carica papaya 1777 17.4 0.24 0.15 1.32 57.28 155 0.78 0.11
15 Casearia sylvestris 24 10.1 0.48 0.20 1.30 0.46 213 0.68 0.59
16 Cecropia peltata 2506 14.1 0.38 0.16 1.69 46.56 174 0.76 0.30
17 Ceiba pentandra 205 13.1 0.40 0.22 1.15 14.08 169 0.72 0.19
18 Conostegia xalapensis 51 11.3 0.34 0.25 0.62 2.94 186 0.76 0.60
19 Cordia alliodora 63 11.4 0.42 0.20 1.19 2.30 179 0.72 0.46
20 Cordia diversifolia 76 18.6 0.38 0.15 1.51 2.29 207 0.72 0.45
21 Croton schiedeanus 109 20.4 0.28 0.17 1.49 2.12 270 0.75 0.48
22 Cupania dentata 815 12.1 0.43 0.18 1.97 9.36 216 0.72 0.56
23 Cupania glabra 676 17.5 0.32 0.17 2.37 6.90 234 0.71 0.54
24 Dalbergia glabra 164 14.6 0.41 0.20 1.98 2.33 140 0.72 0.88
25 Dendropanax arboreus 102 19.2 0.27 0.17 2.32 6.17 247 0.75 0.46
26 Dialium guianense 91 24.0 0.36 0.13 1.92 1.54 264 0.74 0.45
27 Erythrina folkersii 589 39.5 0.18 0.18 1.63 18.59 181 0.74 0.38
28 Eugenia acapulcensis 10 9.0 0.49 0.21 1.16 0.63 249 0.67 0.73
29 Eugenia nigrita 20 8.9 0.52 0.22 1.83 0.66 229 0.70 0.72
30 Faramea occidentalis 77 16.0 0.33 0.18 1.77 1.03 259 0.75 0.55
31 Gliricidia sepium 111 20.2 0.24 0.15 0.61 3.19 157 0.74 0.79
32 Guarea glabra 78 17.3 0.37 0.13 2.32 1.28 284 0.73 0.51
33 Hamelia patens 56 27.7 0.21 0.18 0.56 2.94 208 0.73 0.47
34
Heliocarpus
appendiculatus 156 19.9 0.34 0.13 0.79 8.99 192 0.74 0.26
35 Hirtella americana 56 9.2 0.45 0.28 1.26 0.40 185 0.74 0.78
36 Hirtella racemosa 10 12.0 0.49 0.17 1.69 0.24 175 0.71 0.77
37 Inga pavoniana 720 18.6 0.39 0.18 1.88 3.74 219 0.67 0.42
38 Iresine arbuscula 47 21.6 0.25 0.17 1.56 1.11 249 0.76 0.48
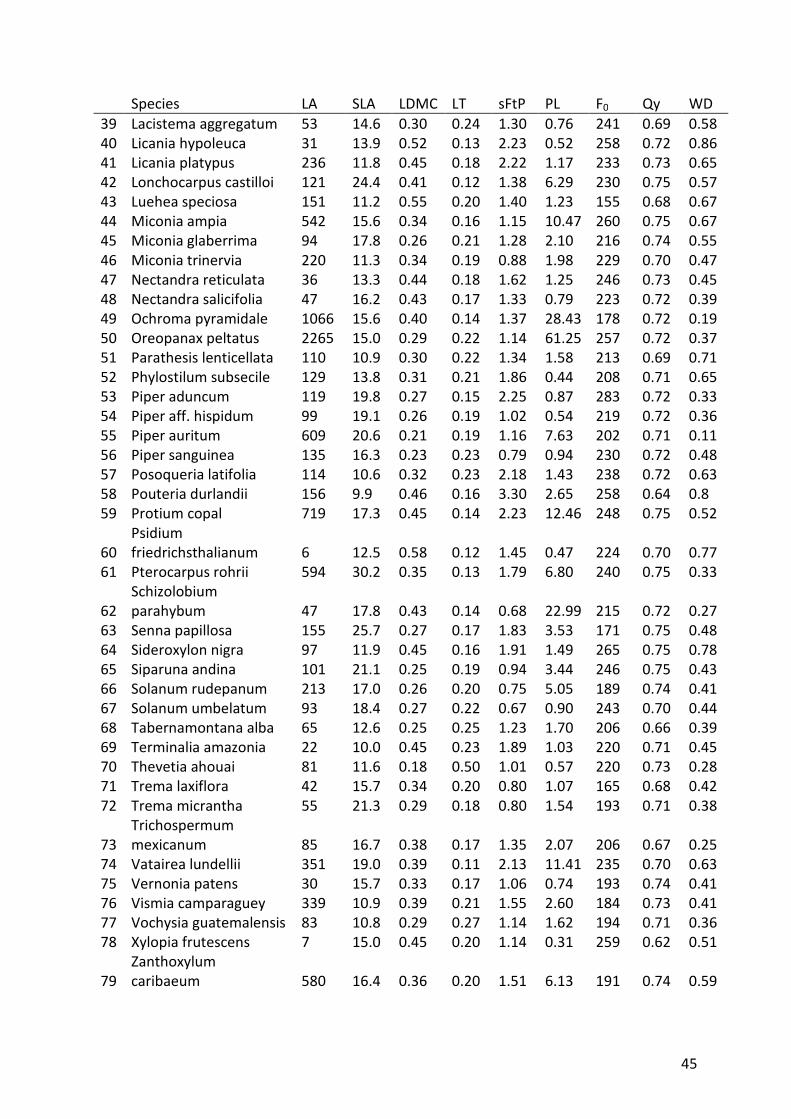
45
Species LA SLA LDMC LT sFtP PL F0 Qy WD
39 Lacistema aggregatum 53 14.6 0.30 0.24 1.30 0.76 241 0.69 0.58
40 Licania hypoleuca 31 13.9 0.52 0.13 2.23 0.52 258 0.72 0.86
41 Licania platypus 236 11.8 0.45 0.18 2.22 1.17 233 0.73 0.65
42 Lonchocarpus castilloi 121 24.4 0.41 0.12 1.38 6.29 230 0.75 0.57
43 Luehea speciosa 151 11.2 0.55 0.20 1.40 1.23 155 0.68 0.67
44 Miconia ampia 542 15.6 0.34 0.16 1.15 10.47 260 0.75 0.67
45 Miconia glaberrima 94 17.8 0.26 0.21 1.28 2.10 216 0.74 0.55
46 Miconia trinervia 220 11.3 0.34 0.19 0.88 1.98 229 0.70 0.47
47 Nectandra reticulata 36 13.3 0.44 0.18 1.62 1.25 246 0.73 0.45
48 Nectandra salicifolia 47 16.2 0.43 0.17 1.33 0.79 223 0.72 0.39
49 Ochroma pyramidale 1066 15.6 0.40 0.14 1.37 28.43 178 0.72 0.19
50 Oreopanax peltatus 2265 15.0 0.29 0.22 1.14 61.25 257 0.72 0.37
51 Parathesis lenticellata 110 10.9 0.30 0.22 1.34 1.58 213 0.69 0.71
52 Phylostilum subsecile 129 13.8 0.31 0.21 1.86 0.44 208 0.71 0.65
53 Piper aduncum 119 19.8 0.27 0.15 2.25 0.87 283 0.72 0.33
54 Piper aff. hispidum 99 19.1 0.26 0.19 1.02 0.54 219 0.72 0.36
55 Piper auritum 609 20.6 0.21 0.19 1.16 7.63 202 0.71 0.11
56 Piper sanguinea 135 16.3 0.23 0.23 0.79 0.94 230 0.72 0.48
57 Posoqueria latifolia 114 10.6 0.32 0.23 2.18 1.43 238 0.72 0.63
58 Pouteria durlandii 156 9.9 0.46 0.16 3.30 2.65 258 0.64 0.8
59 Protium copal 719 17.3 0.45 0.14 2.23 12.46 248 0.75 0.52
60
Psidium
friedrichsthalianum 6 12.5 0.58 0.12 1.45 0.47 224 0.70 0.77
61 Pterocarpus rohrii 594 30.2 0.35 0.13 1.79 6.80 240 0.75 0.33
62
Schizolobium
parahybum 47 17.8 0.43 0.14 0.68 22.99 215 0.72 0.27
63 Senna papillosa 155 25.7 0.27 0.17 1.83 3.53 171 0.75 0.48
64 Sideroxylon nigra 97 11.9 0.45 0.16 1.91 1.49 265 0.75 0.78
65 Siparuna andina 101 21.1 0.25 0.19 0.94 3.44 246 0.75 0.43
66 Solanum rudepanum 213 17.0 0.26 0.20 0.75 5.05 189 0.74 0.41
67 Solanum umbelatum 93 18.4 0.27 0.22 0.67 0.90 243 0.70 0.44
68 Tabernamontana alba 65 12.6 0.25 0.25 1.23 1.70 206 0.66 0.39
69 Terminalia amazonia 22 10.0 0.45 0.23 1.89 1.03 220 0.71 0.45
70 Thevetia ahouai 81 11.6 0.18 0.50 1.01 0.57 220 0.73 0.28
71 Trema laxiflora 42 15.7 0.34 0.20 0.80 1.07 165 0.68 0.42
72 Trema micrantha 55 21.3 0.29 0.18 0.80 1.54 193 0.71 0.38
73
Trichospermum
mexicanum 85 16.7 0.38 0.17 1.35 2.07 206 0.67 0.25
74 Vatairea lundellii 351 19.0 0.39 0.11 2.13 11.41 235 0.70 0.63
75 Vernonia patens 30 15.7 0.33 0.17 1.06 0.74 193 0.74 0.41
76 Vismia camparaguey 339 10.9 0.39 0.21 1.55 2.60 184 0.73 0.41
77 Vochysia guatemalensis 83 10.8 0.29 0.27 1.14 1.62 194 0.71 0.36
78 Xylopia frutescens 7 15.0 0.45 0.20 1.14 0.31 259 0.62 0.51
79
Zanthoxylum
caribaeum 580 16.4 0.36 0.20 1.51 6.13 191 0.74 0.59
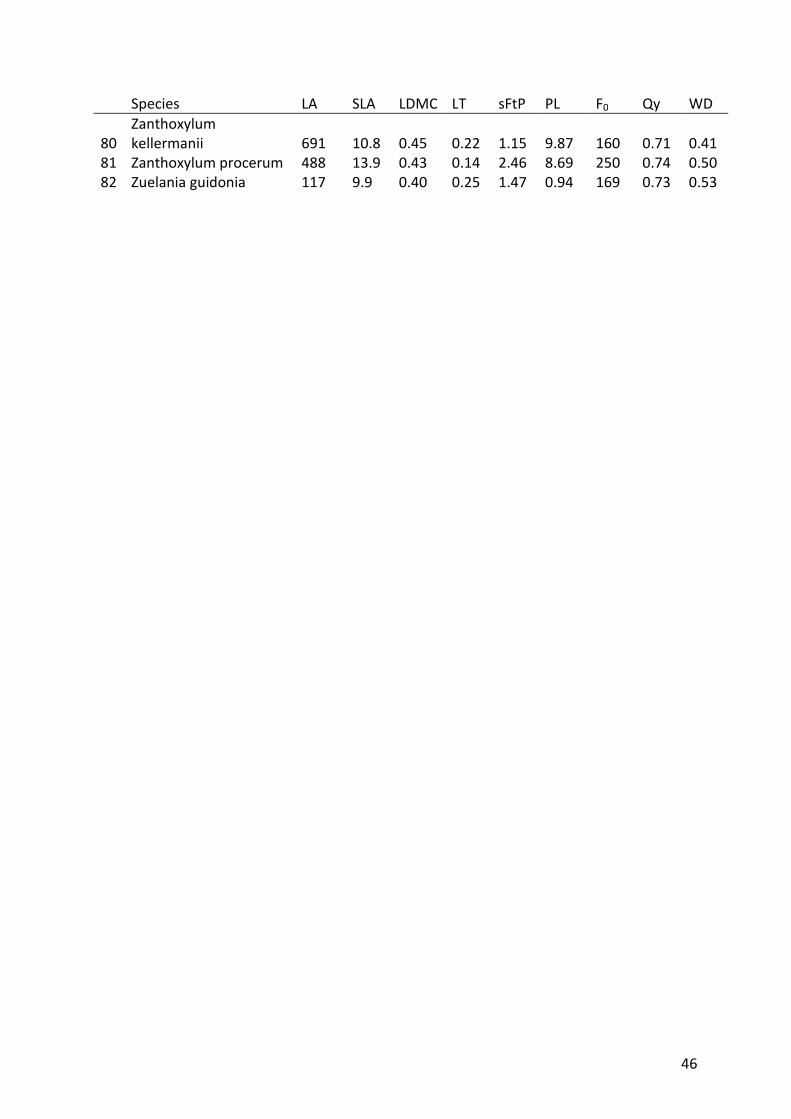
46
Species LA SLA LDMC LT sFtP PL F0 Qy WD
80
Zanthoxylum
kellermanii 691 10.8 0.45 0.22 1.15 9.87 160 0.71 0.41
81 Zanthoxylum procerum 488 13.9 0.43 0.14 2.46 8.69 250 0.74 0.50
82 Zuelania guidonia 117 9.9 0.40 0.25 1.47 0.94 169 0.73 0.53
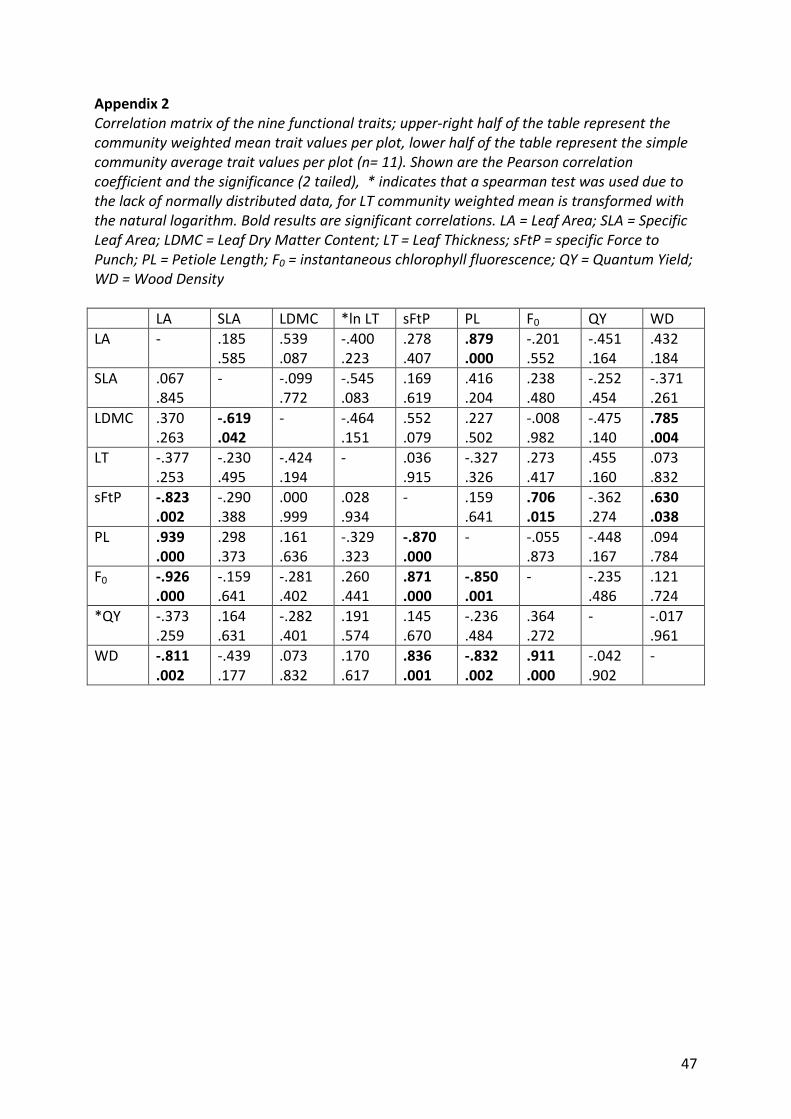
47
Appendix 2
Correlation matrix of the nine functional traits; upper-right half of the table represent the
community weighted mean trait values per plot, lower half of the table represent the simple
community average trait values per plot (n= 11). Shown are the Pearson correlation
coefficient and the significance (2 tailed), * indicates that a spearman test was used due to
the lack of normally distributed data, for LT community weighted mean is transformed with
the natural logarithm. Bold results are significant correlations. LA = Leaf Area; SLA = Specific
Leaf Area; LDMC = Leaf Dry Matter Content; LT = Leaf Thickness; sFtP = specific Force to
Punch; PL = Petiole Length; F0 = instantaneous chlorophyll fluorescence; QY = Quantum Yield;
WD = Wood Density
LA SLA LDMC *ln LT sFtP PL F0 QY WD
LA - .185
.585
.539
.087
-.400
.223
.278
.407
.879
.000
-.201
.552
-.451
.164
.432
.184
SLA .067
.845
- -.099
.772
-.545
.083
.169
.619
.416
.204
.238
.480
-.252
.454
-.371
.261
LDMC .370
.263
-.619
.042
- -.464
.151
.552
.079
.227
.502
-.008
.982
-.475
.140
.785
.004
LT -.377
.253
-.230
.495
-.424
.194
- .036
.915
-.327
.326
.273
.417
.455
.160
.073
.832
sFtP -.823
.002
-.290
.388
.000
.999
.028
.934
- .159
.641
.706
.015
-.362
.274
.630
.038
PL .939
.000
.298
.373
.161
.636
-.329
.323
-.870
.000
- -.055
.873
-.448
.167
.094
.784
F0 -.926
.000
-.159
.641
-.281
.402
.260
.441
.871
.000
-.850
.001
- -.235
.486
.121
.724
*QY -.373
.259
.164
.631
-.282
.401
.191
.574
.145
.670
-.236
.484
.364
.272
- -.017
.961
WD -.811
.002
-.439
.177
.073
.832
.170
.617
.836
.001
-.832
.002
.911
.000
-.042
.902
-
48
Chapter 3: Functional and species diversity in tropical wet forest succession
Abstract
Although functional diversity, ‘those components of biodiversity that influence how an
ecosystem operates or functions’, receives ample theoretical attention, published empirical
data are scarce. We analyse functional diversity changes in tropical secondary forest
succession in Chiapas, Mexico. Additionally we test the ability to detect differences in
functional diversity among sites when only species diversity data are available. Functional
diversity is used as the combined effect of all traits measured, but since ecosystem functions
are linked to (few) specific traits, we also analyze the functional diversity two individual
traits (SLA and WD) that are important for primary production and carbon sequestration.
Time after abandonment did not directionally change any of the diversity measures, forest
structure proved a better predictor of diversity changes. Non-weighted measures of diversity
(based on presence/absence) increased logarithmically with stand basal area whereas
indices weighted for species abundances lacked pattern with succession in our secondary
forest sites. Functional diversity (non-weighted; all traits) increases linearly with species
richness, indicating that functional redundancy may not occur in our secondary forest sites.
Abundance weighted functional diversity (all traits), crucial for studying ecosystem processes
(mass ratio hypothesis), increases exponentially with species richness.
Our results provide empirical evidence that species richness and species diversity are likely
to underestimate the (weighted) functional diversity in a site when a range of traits (9 in this
study) is considered. Instead when a single trait is included in the functional diversity
measure, species diversity may underestimate (in case of SLA) or overestimate (in case of
wood density) the functional diversity. This study substantiates the need for careful
consideration of the functional trait(s) to be included in studies targeting the relation
between functional diversity and ecosystem processes because the choice of traits will
influence results when comparing sites.
Keywords: Functional diversity; Species diversity; Ecosystem functioning; Ecosystem
processes; Secondary forests; Chronosequence; Chiapas; Mexico.
Introduction
Functional diversity has been defined as the value, range, and distribution of functional traits
in a given ecosystem (Lavorel et al. 2007; Diaz et al. 2007a) or as those components of
biodiversity that influence how an ecosystem operates or functions (Tilman 2001). Many
researchers recognize that functional diversity is more important to local scale ecosystem
functioning than taxonomic diversity (Grime 1998; Tilman 2001; Naeem & Wright 2003;
Petchey 2004; Petchey et al. 2004; Hooper et al. 2005) and may be the most important
biodiversity measure (Diaz & Cabido 2001). Functional diversity may be a better indicator of
ecosystem stability and productivity than species diversity is (Tilman 2000; Díaz et al. 2007b).
Indeed, a higher functional diversity is, for example, related to resistance against invasive
species (Dukes 2001; Funk et al. 2008), and to increased efficiency in nutrient and light
capture (Tilman et al. 1997) and thus to increased productivity (Nyström & Folke 2001).
Functional diversity may affect short-term ecosystem resource dynamics and long-term
ecosystem stability (Díaz & Cabido 2001; Walker et al. 1999; Nyström & Folke 2001). Theory
49
predicts that higher functional diversity increases primary production and nutrient cycling
through the effect of resource use complementarity among species in the community
(Hooper 1998; Petchey 2003).
Several indices have been proposed for calculating functional diversity (Mason et al. 2003;
Mouillot et al. 2005; Pavoine et al. 2005; Petchey & Gaston 2006). In current study we used
functional diversity as the range of traits based on presence/absence as well as based on
species abundances in the community. Functional diversity indices based on
presence/absence of species are comparable to functional richness measures (e.g.
Functional Attribute Diversity of Walker et al. 1999; Functional Diversity of Petchey & Gaston
2002). Such indices emphasize the full range of functional strategies present, as dominant
and rare species equally contribute to functional diversity. The philosophy behind this
approach is that each individual species may strongly influence ecosystem functioning and
rare species are thought to be important contributors to long-term resilience (Walker et al.
1999; Hooper et al. 2005). In contrast, when species abundances are used as weightings, the
role of dominant species is emphasized (e.g. FDvar of Mason et al. 2003; Functional
regularity of Mouillot et al. 2005). Such indices are in line with the biomass-ratio hypothesis
(Grime 1998; Diaz & Cabido 2001) stating that the dominant species have a greater effect on
ecosystem functioning.
Also the number and type of traits included in diversity indices plays a role. Studying
ecosystem functioning, the need to include only the trait(s) relevant for the function of
interest is stressed (Diaz et al. 2007b), therefore we test the effect of single trait functional
diversity and functional diversity based on a range of traits. Single trait functional diversity is
calculated based on a leaf trait (specific leaf area) and a stem trait (wood density). These
traits are chosen because they are some of the most important and commonly studied traits
and are of paramount importance for different ecosystem processes (Lavorel & Garnier
2002). SLA has an effect on the processes primary production, carbon and nutrient cycling
and litter decomposition (e.g. Lavorel & Garnier 2002; Diaz et al. 2004; Poorter et al. 2009)
whereas wood density is a key trait in predictions on biogeochemical ecosystem processes
such as carbon sequestration and cycling (e.g. Chave et al. 2009).
Although functional diversity receives ample theoretical attention, empirical data on how
functional diversity varies across environmental and successional gradients is lacking. The
current study applies the concept of functional diversity to secondary tropical forest
succession and this is, as far as we know, the first study to do so. Because succession reflects
community assembly in action, it provides a good opportunity to test how functional
diversity varies from very simple, species poor, early successional communities towards
more complex, species rich, late successional communities. Functional diversity is expected
to increase during early stages of succession after which it may decrease again, due to a
peak in diversity, caused by coexistence of pioneer and shade tolerant species at
intermediate time after disturbance (the Intermediate Disturbance Hypothesis - Connell
1978, Bongers et al. 2009). As our chronosequence includes only relatively early stages of
succession, we expect that functional diversity will increase over time.
Also we explored the relation between functional diversity and species diversity.
Discussing the relation between functional diversity and species diversity essentially deals
with the extent of trait complementarity among species (or oppositely, the extent of

50
functional redundancy among species) (Petchey & Gaston 2002) and accordingly with the
extent in which species diversity can be used as a proxy for functional diversity. Functional
diversity is expected to be positively related to species diversity; when one species is added
to the ecosystem, it is likely that this species will not only contribute to species diversity but
also to functional diversity meaning that the set of functional traits encompassed by this
species was not present before. However it has been suggested that species diversity is
limited by the regional species pool whereas functional diversity is limited by the local
availability of niches (Schmid et al. 2002) indicating that both may be non-related. In case of
a linear relationship, species richness is a good proxy for functional diversity, which makes
detailed and time consuming measurements of functional traits unnecessary. However this
linear relation is not commonly found in nature (Díaz & Cabido 2001) and rather partial
complementarity (logarithmic) or non-complementarity (no relation) could be found (Schmid
et al. 2002). A logarithmic relationship between species diversity and functional diversity
indicates that species added have functional strategies already represented by other species;
functional redundancy. When functional diversity is unrelated to species diversity the role
individual species with extreme trait values may be underlying irrespective of the diversity of
species (Petchey & Gaston 2002) and, in this case, species diversity is not a good surrogate
for functional diversity to reflect on ecosystem functioning.
The distribution of trait complementarity is influenced by the ‘effective dimensionality of
trait space’ where a higher dimensionality allows all species to be functionally equally similar
(or dissimilar). A higher dimensionality results in a linear relationship between functional and
species diversity where the addition of traits of any species increases functional diversity in
the same way as adding any other species to the community. The effective dimensionality of
trait space is in turn independently affected by the number of traits included in the matrix
where an increasing number of traits increases the effective dimensionality of trait space,
and by including species abundances (weighting species differently) which will reduce the
effective dimensionality of trait space because it essentially deals with only dominant
species (Petchey & Gaston 2002).
We analyze functional and species diversity in a chronosequence (3,5 to 22,5 years of fallow
age) based on several functional traits relevant for primary productivity, decomposition,
consumption by herbivores, heat exchange and biomass accumulation.
This study evaluates (1) how functional and species diversity changes along a gradient of
secondary succession in wet tropical forest in southern Mexico, and (2) to what level species
diversity reflects functional diversity. Functional diversity is calculated for all nine traits
combined, as well as for SLA and wood density separately. We hypothesize that species and
functional diversity increase during early secondary succession, and that functional diversity
is positively related to species diversity. Functional diversity for all traits combined may show
a different pattern with increasing species diversity than the functional diversity of separate
traits because of the effect of statistical averaging.
Methods
Research site and species selection
Research was carried out within the Lacandon region in southeast Mexico (16°01’N,
90°55’W). The climate is warm-humid with an average annual temperature of 25-27°C and
an annual rainfall of 3.000 mm, with less than 100 mm per month falling from February
51
through April (Ibarra-Manríquez & Martínez-Ramos 2002; Breugel et al. 2006). The study
sites are located around the village of Loma Bonita, an area characterized by small hills and
valleys with sandy or limestone soils of low pH (<5.5). Currently 65% of the land area around
Loma Bonita is used for agricultural practices (mostly livestock pasture), 14% is mature forest
and 21% consist of secondary forests of different ages (Zermeño-Hernández 2008).
The successional chronosequence consists of 11 secondary forest plots (10 x 50 m) with
fallow ages between 3.5 and 22.5 years. Plots were established on abandoned corn fields,
the main form of agriculture, and plots were in use within one year before abandonment. In
each plot all trees with a diameter at breast height (DBH) > 1cm were identified and their
diameter was measured.
For each plot those species were selected that make up at least 80% of the importance value
(calculated by the relative abundance and the relative density, further explained below) of
that plot, as it is suggested that those species determine most of the key ecosystem
processes (Garnier et al. 2004; Pakeman & Quested 2007). On average 32 species per site
were selected, ranging from 9 to 47 species, being 82 species in total. Both dominant and
rare species have been selected with an average importance value of 0.036 (3.6%) ranging
from 0.0007 (0.07%) to 0.63 (63%).
Functional traits
Nine functionally important traits were studied, important for the carbon-, water- and
nutrient-balance of plants (Table 1). Leaf traits were measured on 2 sun-lit leaves per
individual and 10 replicate individuals per species, except for specific force to punch where
only 5 individuals per species were measured. Wood traits are also determined for five
individuals per species. Standardized measurement protocols have been followed as
suggested by Cornelissen et al. (2003).
Leaf Area (cm2). Leaf area was calculated by photographing the fresh area excluding the
petiole on a light box after which the area was calculated with pixel counting software
ImageJ (Rasband 2009).
Specific Leaf Area (m2 kg-1). SLA was calculated as the fresh leaf area divided by the oven
dried mass (dried for 48 h at 70°C), excluding the petiole. In the case of composite leaves the
smallest photosynthetic unit was taken.
Leaf Dry Matter Content (g g-1). After collection the leaves were placed in water to rehydrate
for at least 5 hours after which the fresh weight was determined. Oven-dry weight was
divided by the fresh weight to determine the leaf dry matter content.
Leaf thickness (mm). Leaf thickness was determined with a digital caliper in the middle of the
leaf avoiding the main and secondary nerves.
Specific Force to Punch (MN m-2). The laminas of fresh leaves were punched with a
penetrometer built with a flat-end nail attached to the inner part of a syringe and a
waterbasin on top. Water was added to the basin until the leaf ruptured. The total weight
added was converted into Mega Newton and divided over the breaking surface of the hole
(circumference of the nail x thickness of the leaf). This alternative punching method is
comparable to cutting and tearing tests and is a good indicator of leaf mechanical resistance
(Onoda et al. submitted).
Petiole length (cm). Determined with a digital caliper or a tape-measure.
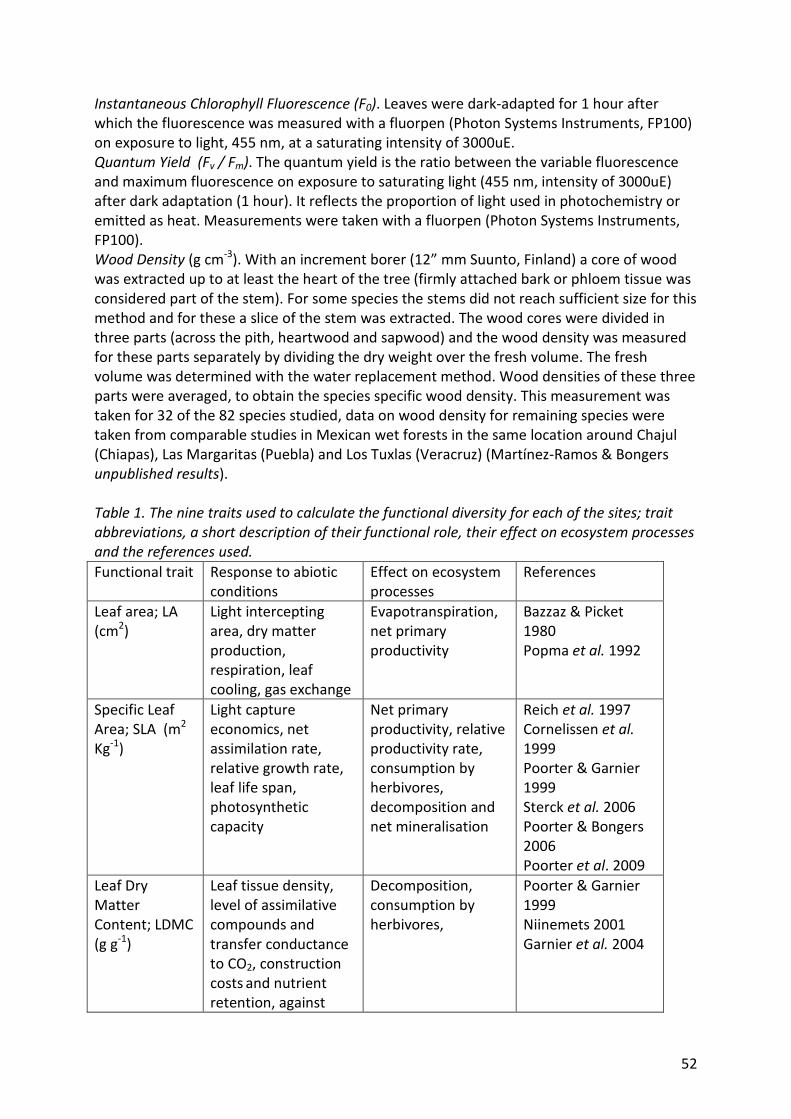
52
Instantaneous Chlorophyll Fluorescence (F0). Leaves were dark-adapted for 1 hour after
which the fluorescence was measured with a fluorpen (Photon Systems Instruments, FP100)
on exposure to light, 455 nm, at a saturating intensity of 3000uE.
Quantum Yield (Fv / Fm). The quantum yield is the ratio between the variable fluorescence
and maximum fluorescence on exposure to saturating light (455 nm, intensity of 3000uE)
after dark adaptation (1 hour). It reflects the proportion of light used in photochemistry or
emitted as heat. Measurements were taken with a fluorpen (Photon Systems Instruments,
FP100).
Wood Density (g cm-3). With an increment borer (12” mm Suunto, Finland) a core of wood
was extracted up to at least the heart of the tree (firmly attached bark or phloem tissue was
considered part of the stem). For some species the stems did not reach sufficient size for this
method and for these a slice of the stem was extracted. The wood cores were divided in
three parts (across the pith, heartwood and sapwood) and the wood density was measured
for these parts separately by dividing the dry weight over the fresh volume. The fresh
volume was determined with the water replacement method. Wood densities of these three
parts were averaged, to obtain the species specific wood density. This measurement was
taken for 32 of the 82 species studied, data on wood density for remaining species were
taken from comparable studies in Mexican wet forests in the same location around Chajul
(Chiapas), Las Margaritas (Puebla) and Los Tuxlas (Veracruz) (Martínez-Ramos & Bongers
unpublished results).
Table 1. The nine traits used to calculate the functional diversity for each of the sites; trait
abbreviations, a short description of their functional role, their effect on ecosystem processes
and the references used.
Functional trait Response to abiotic
conditions
Effect on ecosystem
processes
References
Leaf area; LA
(cm2)
Light intercepting
area, dry matter
production,
respiration, leaf
cooling, gas exchange
Evapotranspiration,
net primary
productivity
Bazzaz & Picket
1980
Popma et al. 1992
Specific Leaf
Area; SLA (m2
Kg-1)
Light capture
economics, net
assimilation rate,
relative growth rate,
leaf life span,
photosynthetic
capacity
Net primary
productivity, relative
productivity rate,
consumption by
herbivores,
decomposition and
net mineralisation
Reich et al. 1997
Cornelissen et al.
1999
Poorter & Garnier
1999
Sterck et al. 2006
Poorter & Bongers
2006
Poorter et al. 2009
Leaf Dry
Matter
Content; LDMC
(g g-1)
Leaf tissue density,
level of assimilative
compounds and
transfer conductance
to CO2, construction
costs and nutrient
retention, against
Decomposition,
consumption by
herbivores,
Poorter & Garnier
1999
Niinemets 2001
Garnier et al. 2004
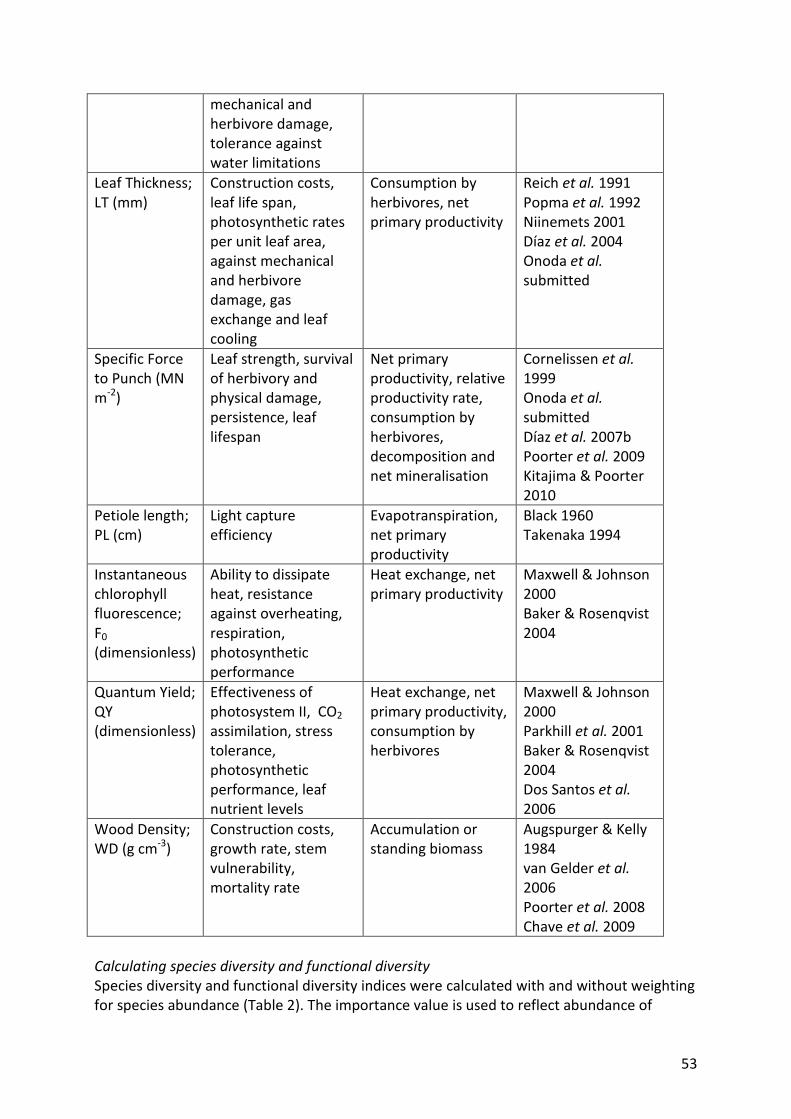
53
mechanical and
herbivore damage,
tolerance against
water limitations
Leaf Thickness;
LT (mm)
Construction costs,
leaf life span,
photosynthetic rates
per unit leaf area,
against mechanical
and herbivore
damage, gas
exchange and leaf
cooling
Consumption by
herbivores, net
primary productivity
Reich et al. 1991
Popma et al. 1992
Niinemets 2001
Díaz et al. 2004
Onoda et al.
submitted
Specific Force
to Punch (MN
m-2)
Leaf strength, survival
of herbivory and
physical damage,
persistence, leaf
lifespan
Net primary
productivity, relative
productivity rate,
consumption by
herbivores,
decomposition and
net mineralisation
Cornelissen et al.
1999
Onoda et al.
submitted
Díaz et al. 2007b
Poorter et al. 2009
Kitajima & Poorter
2010
Petiole length;
PL (cm)
Light capture
efficiency
Evapotranspiration,
net primary
productivity
Black 1960
Takenaka 1994
Instantaneous
chlorophyll
fluorescence;
F0
(dimensionless)
Ability to dissipate
heat, resistance
against overheating,
respiration,
photosynthetic
performance
Heat exchange, net
primary productivity
Maxwell & Johnson
2000
Baker & Rosenqvist
2004
Quantum Yield;
QY
(dimensionless)
Effectiveness of
photosystem II, CO2
assimilation, stress
tolerance,
photosynthetic
performance, leaf
nutrient levels
Heat exchange, net
primary productivity,
consumption by
herbivores
Maxwell & Johnson
2000
Parkhill et al. 2001
Baker & Rosenqvist
2004
Dos Santos et al.
2006
Wood Density;
WD (g cm-3)
Construction costs,
growth rate, stem
vulnerability,
mortality rate
Accumulation or
standing biomass
Augspurger & Kelly
1984
van Gelder et al.
2006
Poorter et al. 2008
Chave et al. 2009
Calculating species diversity and functional diversity
Species diversity and functional diversity indices were calculated with and without weighting
for species abundance (Table 2). The importance value is used to reflect abundance of
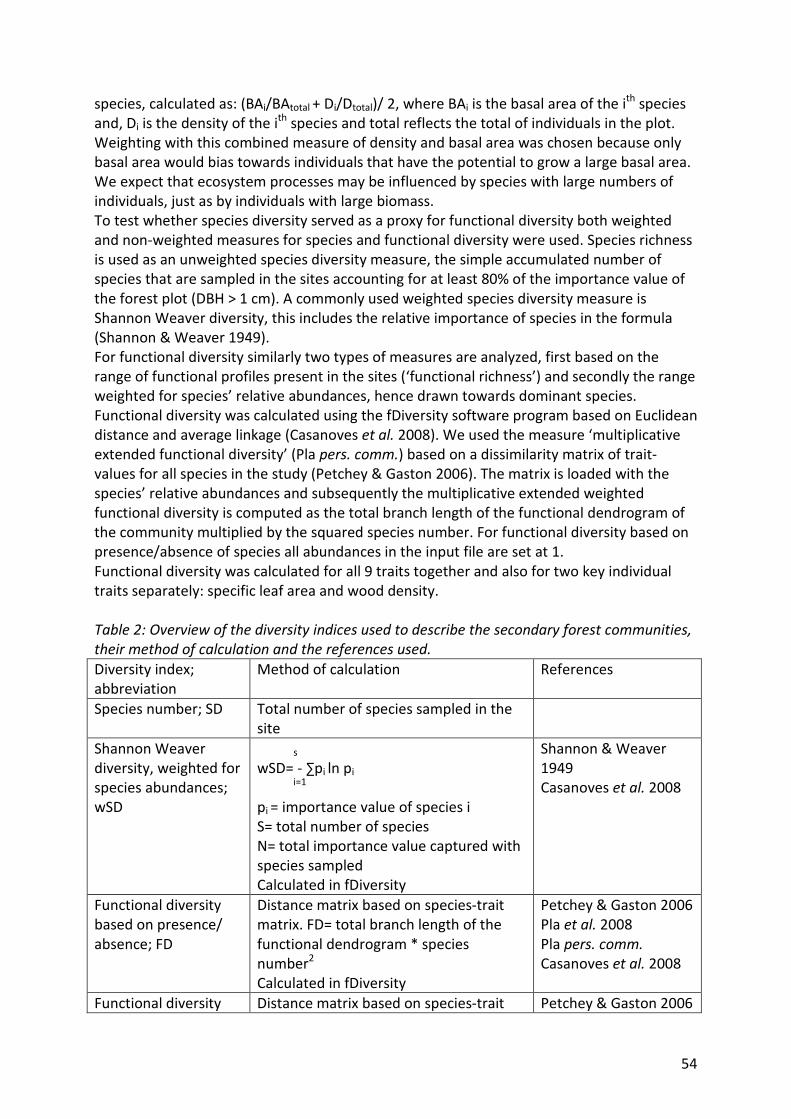
54
species, calculated as: (BAi/BAtotal + Di/Dtotal)/ 2, where BAi is the basal area of the ith species
and, Di is the density of the ith species and total reflects the total of individuals in the plot.
Weighting with this combined measure of density and basal area was chosen because only
basal area would bias towards individuals that have the potential to grow a large basal area.
We expect that ecosystem processes may be influenced by species with large numbers of
individuals, just as by individuals with large biomass.
To test whether species diversity served as a proxy for functional diversity both weighted
and non-weighted measures for species and functional diversity were used. Species richness
is used as an unweighted species diversity measure, the simple accumulated number of
species that are sampled in the sites accounting for at least 80% of the importance value of
the forest plot (DBH > 1 cm). A commonly used weighted species diversity measure is
Shannon Weaver diversity, this includes the relative importance of species in the formula
(Shannon & Weaver 1949).
For functional diversity similarly two types of measures are analyzed, first based on the
range of functional profiles present in the sites (‘functional richness’) and secondly the range
weighted for species’ relative abundances, hence drawn towards dominant species.
Functional diversity was calculated using the fDiversity software program based on Euclidean
distance and average linkage (Casanoves et al. 2008). We used the measure ‘multiplicative
extended functional diversity’ (Pla pers. comm.) based on a dissimilarity matrix of trait-
values for all species in the study (Petchey & Gaston 2006). The matrix is loaded with the
species’ relative abundances and subsequently the multiplicative extended weighted
functional diversity is computed as the total branch length of the functional dendrogram of
the community multiplied by the squared species number. For functional diversity based on
presence/absence of species all abundances in the input file are set at 1.
Functional diversity was calculated for all 9 traits together and also for two key individual
traits separately: specific leaf area and wood density.
Table 2: Overview of the diversity indices used to describe the secondary forest communities,
their method of calculation and the references used.
Diversity index;
abbreviation
Method of calculation References
Species number; SD Total number of species sampled in the
site
Shannon Weaver
diversity, weighted for
species abundances;
wSD
s
wSD= - ∑pi ln pi
i=1
pi = importance value of species i
S= total number of species
N= total importance value captured with
species sampled
Calculated in fDiversity
Shannon & Weaver
1949
Casanoves et al. 2008
Functional diversity
based on presence/
absence; FD
Distance matrix based on species-trait
matrix. FD= total branch length of the
functional dendrogram * species
number2
Calculated in fDiversity
Petchey & Gaston 2006
Pla et al. 2008
Pla pers. comm.
Casanoves et al. 2008
Functional diversity Distance matrix based on species-trait Petchey & Gaston 2006
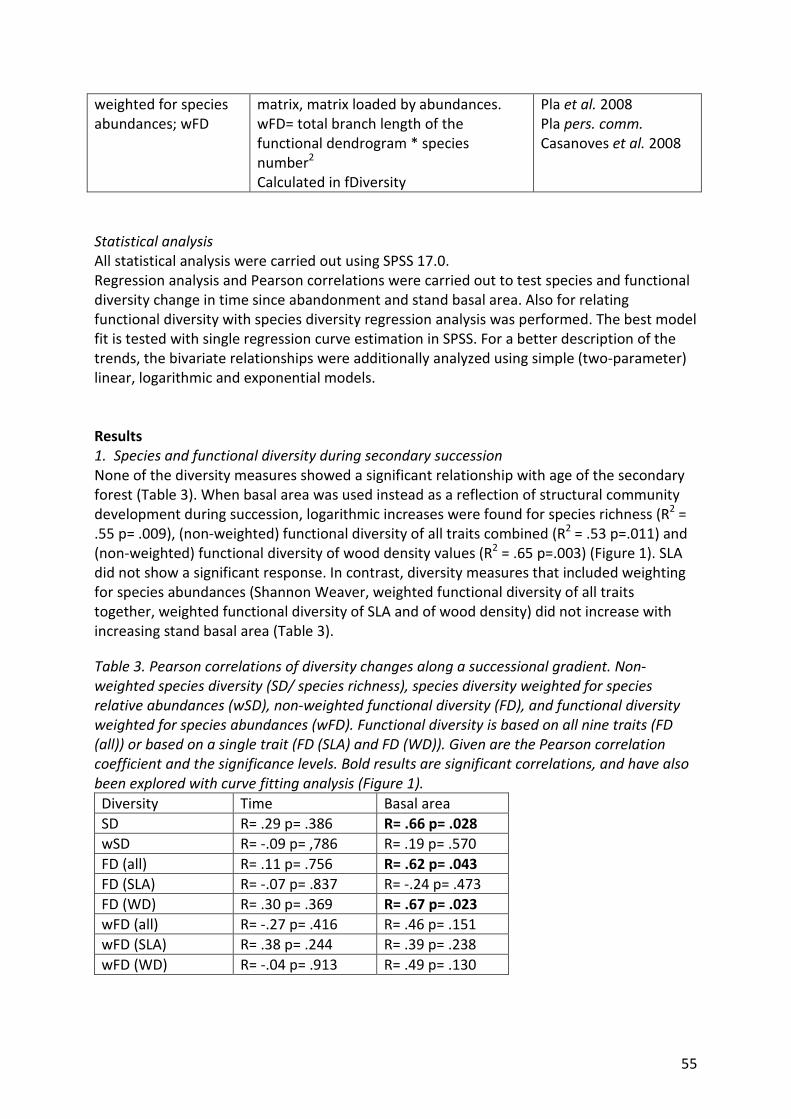
55
weighted for species
abundances; wFD
matrix, matrix loaded by abundances.
wFD= total branch length of the
functional dendrogram * species
number2
Calculated in fDiversity
Pla et al. 2008
Pla pers. comm.
Casanoves et al. 2008
Statistical analysis
All statistical analysis were carried out using SPSS 17.0.
Regression analysis and Pearson correlations were carried out to test species and functional
diversity change in time since abandonment and stand basal area. Also for relating
functional diversity with species diversity regression analysis was performed. The best model
fit is tested with single regression curve estimation in SPSS. For a better description of the
trends, the bivariate relationships were additionally analyzed using simple (two-parameter)
linear, logarithmic and exponential models.
Results
1. Species and functional diversity during secondary succession
None of the diversity measures showed a significant relationship with age of the secondary
forest (Table 3). When basal area was used instead as a reflection of structural community
development during succession, logarithmic increases were found for species richness (R2 =
.55 p= .009), (non-weighted) functional diversity of all traits combined (R2 = .53 p=.011) and
(non-weighted) functional diversity of wood density values (R2 = .65 p=.003) (Figure 1). SLA
did not show a significant response. In contrast, diversity measures that included weighting
for species abundances (Shannon Weaver, weighted functional diversity of all traits
together, weighted functional diversity of SLA and of wood density) did not increase with
increasing stand basal area (Table 3).
Table 3. Pearson correlations of diversity changes along a successional gradient. Non-
weighted species diversity (SD/ species richness), species diversity weighted for species
relative abundances (wSD), non-weighted functional diversity (FD), and functional diversity
weighted for species abundances (wFD). Functional diversity is based on all nine traits (FD
(all)) or based on a single trait (FD (SLA) and FD (WD)). Given are the Pearson correlation
coefficient and the significance levels. Bold results are significant correlations, and have also
been explored with curve fitting analysis (Figure 1).
Diversity Time Basal area
SD R= .29 p= .386 R= .66 p= .028
wSD R= -.09 p= ,786 R= .19 p= .570
FD (all) R= .11 p= .756 R= .62 p= .043
FD (SLA) R= -.07 p= .837 R= -.24 p= .473
FD (WD) R= .30 p= .369 R= .67 p= .023
wFD (all) R= -.27 p= .416 R= .46 p= .151
wFD (SLA) R= .38 p= .244 R= .39 p= .238
wFD (WD) R= -.04 p= .913 R= .49 p= .130
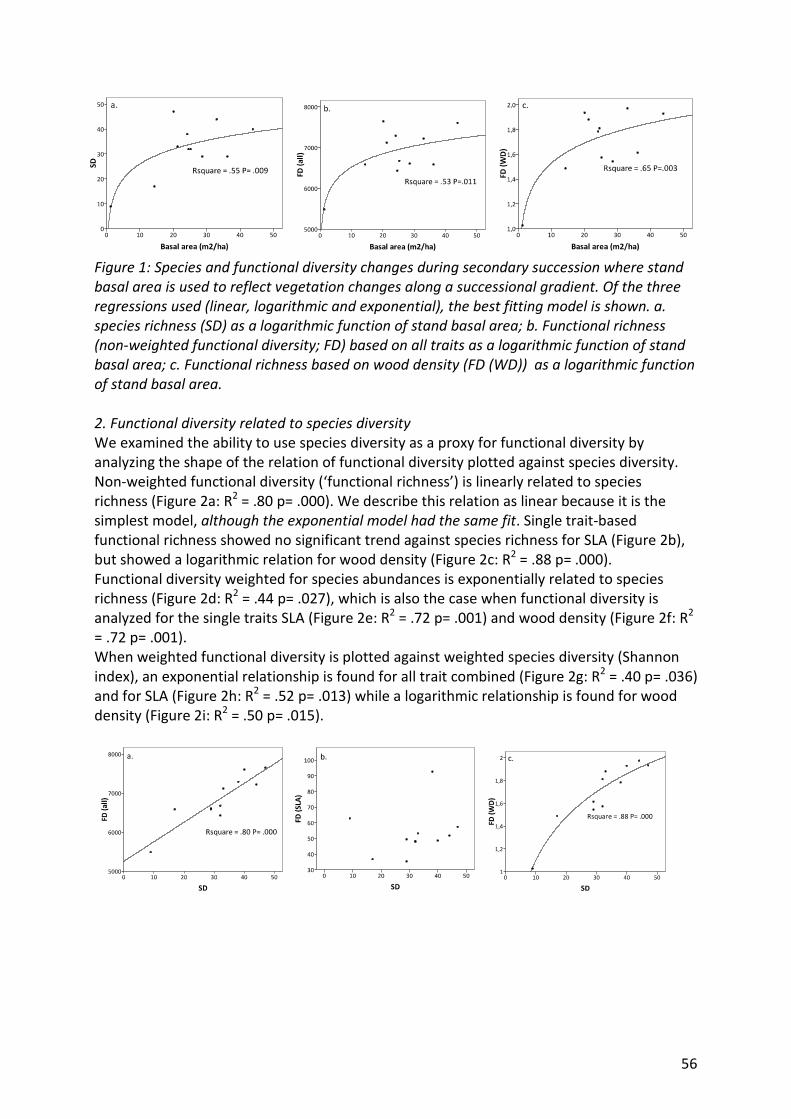
56
Figure 1: Species and functional diversity changes during secondary succession where stand
basal area is used to reflect vegetation changes along a successional gradient. Of the three
regressions used (linear, logarithmic and exponential), the best fitting model is shown. a.
species richness (SD) as a logarithmic function of stand basal area; b. Functional richness
(non-weighted functional diversity; FD) based on all traits as a logarithmic function of stand
basal area; c. Functional richness based on wood density (FD (WD)) as a logarithmic function
of stand basal area.
2. Functional diversity related to species diversity
We examined the ability to use species diversity as a proxy for functional diversity by
analyzing the shape of the relation of functional diversity plotted against species diversity.
Non-weighted functional diversity (‘functional richness’) is linearly related to species
richness (Figure 2a: R2 = .80 p= .000). We describe this relation as linear because it is the
simplest model, although the exponential model had the same fit. Single trait-based
functional richness showed no significant trend against species richness for SLA (Figure 2b),
but showed a logarithmic relation for wood density (Figure 2c: R2 = .88 p= .000).
Functional diversity weighted for species abundances is exponentially related to species
richness (Figure 2d: R2 = .44 p= .027), which is also the case when functional diversity is
analyzed for the single traits SLA (Figure 2e: R2 = .72 p= .001) and wood density (Figure 2f: R2
= .72 p= .001).
When weighted functional diversity is plotted against weighted species diversity (Shannon
index), an exponential relationship is found for all trait combined (Figure 2g: R2 = .40 p= .036)
and for SLA (Figure 2h: R2 = .52 p= .013) while a logarithmic relationship is found for wood
density (Figure 2i: R2 = .50 p= .015).
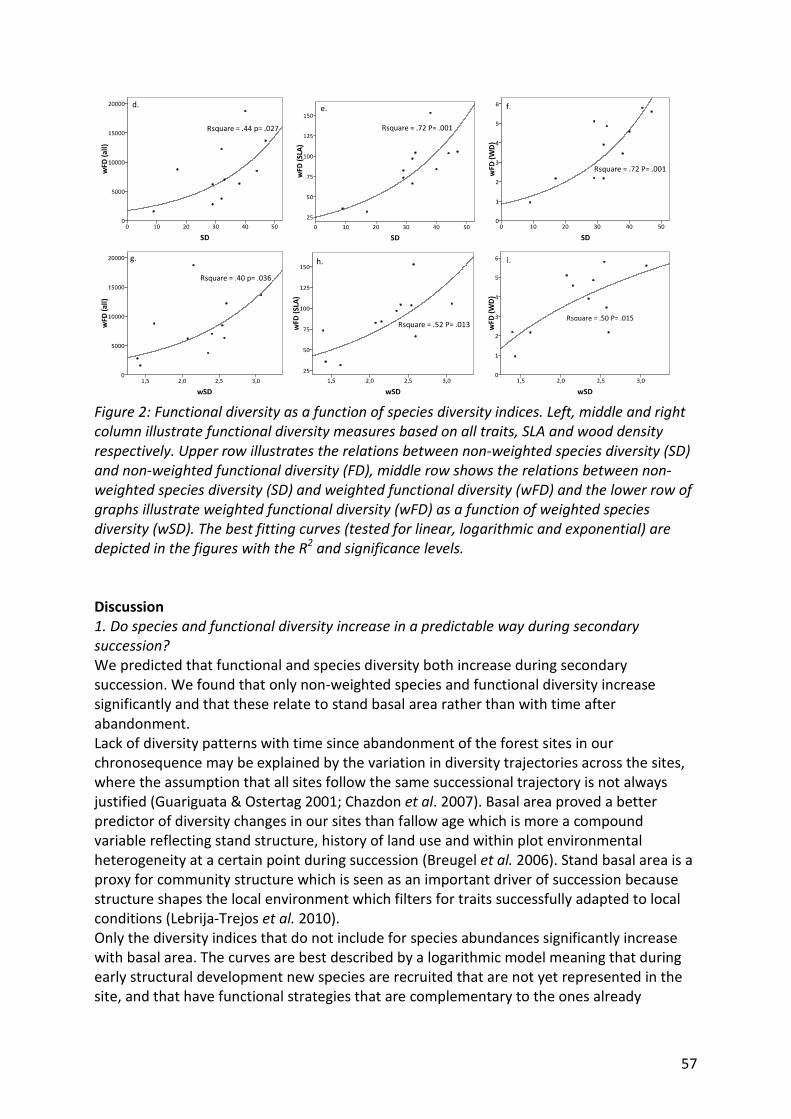
57
Figure 2: Functional diversity as a function of species diversity indices. Left, middle and right
column illustrate functional diversity measures based on all traits, SLA and wood density
respectively. Upper row illustrates the relations between non-weighted species diversity (SD)
and non-weighted functional diversity (FD), middle row shows the relations between non-
weighted species diversity (SD) and weighted functional diversity (wFD) and the lower row of
graphs illustrate weighted functional diversity (wFD) as a function of weighted species
diversity (wSD). The best fitting curves (tested for linear, logarithmic and exponential) are
depicted in the figures with the R2 and significance levels.
Discussion
1. Do species and functional diversity increase in a predictable way during secondary
succession?
We predicted that functional and species diversity both increase during secondary
succession. We found that only non-weighted species and functional diversity increase
significantly and that these relate to stand basal area rather than with time after
abandonment.
Lack of diversity patterns with time since abandonment of the forest sites in our
chronosequence may be explained by the variation in diversity trajectories across the sites,
where the assumption that all sites follow the same successional trajectory is not always
justified (Guariguata & Ostertag 2001; Chazdon et al. 2007). Basal area proved a better
predictor of diversity changes in our sites than fallow age which is more a compound
variable reflecting stand structure, history of land use and within plot environmental
heterogeneity at a certain point during succession (Breugel et al. 2006). Stand basal area is a
proxy for community structure which is seen as an important driver of succession because
structure shapes the local environment which filters for traits successfully adapted to local
conditions (Lebrija-Trejos et al. 2010).
Only the diversity indices that do not include for species abundances significantly increase
with basal area. The curves are best described by a logarithmic model meaning that during
early structural development new species are recruited that are not yet represented in the
site, and that have functional strategies that are complementary to the ones already
58
present. At later stages of structural development the increases in species richness and
functional richness slows so increases in basal area are now mainly driven by either addition
of individuals that are already represented in the site (functionally and from a species
perspective) and/or by existing individuals increasing in size. It is likely that the saturating
relationship can be attributed to both processes. The first mechanism can be understood by
the chance that a ‘new’ species or functional type dispersing into the site decreases as the
number of species is higher (Schmid et al. 2002). The second mechanism is supported by the
notion that during secondary succession biomass shows a saturating increase due to
biomass being accumulated in fewer but bigger individuals (Brown & Lugo 1990).
No increases take place in any of the weighted diversity variables. This can be explained by
the fact that some stands are dominated by few species that show highly erratic abundance
patterns over time. For example Breugel et al. (2007) in the same area show mass mortality
of the pioneer Ochroma pyramidale in some sites. Also the oldest plot with an age of 22.5
years after abandonment is strongly dominated by Vochysia guatemalensis, making up for
63% of the site’s importance value. Such site-specific observations of demographic rates may
explain the loss of signal when weighted diversity is analyzed over a chronosequence.
2. Is species diversity a good predictor of functional diversity?
As expected functional diversity generally increases with species diversity, and we also found
that the shape of this relationship depends on the functional diversity index used (non-
weighted or weighted), and on whether all traits or single trait values are used.
When non-weighted functional diversity is plotted against non-weighted species diversity we
find a strong linear relation (Figure 2a). Díaz and Cabido (2001) state that a linear
relationship between functional richness and species richness can theoretically only occur in
two scenarios characterized by a high intraspecific homogeneity of niche space. Firstly, when
there is a random occupation of niche space and where species have limited functional
overlap. Secondly, when there is a uniform occupation of niche space and where no
functional overlap of species occurs. Although they argue that neither of these cases is likely
to occur in nature, where rather some ‘lumpiness’ of species in functional trait space is
found, our linear relationship suggests that all species are equally functionally
complementary. This means that each species added to the system also represents a
functional profile that was not present before, i.e. the addition of any species to the
community causes a similar increase in FD (all) to that caused by any other species and
replacing any species with another one does not change the relationship found. Putting this
in terms of Petchey and Gaston (2002), the linear relationship is an effect of high effective
dimensionality of trait space allowing species to differ similarly. From this linear relation we
can also conclude that in our wet tropical secondary forests functional redundancy was not
identified. Functional redundancy is implied when increased species diversity causes little
change in functional diversity, and means that new species overlap in functional traits with
resident species. Although functional redundancy may be criticized as being incompatible
with coexistence (Loreau 2004), others emphasize its importance: functional redundancy
rather than functional diversity is what maintains or restores ecosystem functioning under
changing environmental conditions (resilience) or disturbance events (Walker et al. 1999;
Díaz & Cabido 2001).
Analyzing the functional diversity of a single trait reduces the effective dimensionality of the
functional diversity so that the identity of species is emphasized and an increase in
functional diversity depends much on the trait value of the particular species added (Petchey
59
& Gaston 2002). We found that the (non-weighted) functional diversity of SLA was not
related to species richness (Figure 2b) whereas wood density showed a logarithmic relation
(Figure 2c). The lack of pattern in the case of SLA indicates that coexisting species differ in
their extent of functional complementarity of SLA values, regardless of the number of
species actually present. Functional diversity of wood density increases logarithmically with
species richness indicating that the relative similarity in wood density increases with higher
species richness. The saturating increase of single-trait functional diversity when plotted
against the number of species is typical when few traits separate species. It signifies that
some pairs of species complement each other in wood density values whereas others do not
(partial complementarity) and with increasing species number the chances increase that the
wood density value added is already present in the community. This influence of
compositional difference between sites is caused by the reduction in effective
dimensionality of trait space by reducing the number of traits to a single-trait diversity
(Petchey & Gaston 2002). The saturating increase indicates that there is redundancy in
species’ contribution to the functional diversity based on wood density (FD (WD)). This does
not unambiguously allow us to conclude that functional redundancy occurs in the secondary
forest sites studied because the functional analogues based on wood density may still
encompass a large variety of other traits ensuring long-term stability of community
structure. This was also argued to explain the similar growth forms in South African fynbos
where within the functional type of growth form still large variation in regeneration traits
existed (Cowling et al. 1994).
According to the biomass ratio hypothesis (Grime 1998) the functional characteristics of the
abundant species largely determine the effect on ecosystem processes, stressing the need to
use a weighted measure of functional diversity in case ecosystem processes are the main
interest of study. Plotting species richness against weighted functional diversity is relevant to
assess whether the easily obtainable measure of species number could serve as a proxy for
such weighted measure of functional diversity. However we found that weighted functional
diversity (for all traits) is exponentially related to species richness (non-weighted), indicating
that species richness is likely to underestimate functional diversity. This is the case for
weighted functional diversity based on all traits, as well as for weighted functional diversity
based on SLA and wood density separate. Because species abundances are incorporated the
effective dimensionality of trait space is reduced, and even further when SLA and WD are
analyzed separately because of the reduction in number of traits included. This reduction of
trait dimensionality brings community composition to the foreground, and highlights the
functional identity of the dominant species (like strong functional types), allowing functional
diversity to further differentiate between communities when species richness no longer
differentiates. The exponential increase in functional diversity with increasing species
richness illustrates that functional diversity continues to increase while species number
stagnates. Because the functional diversity is weighted for species abundances this can
mean two things: either the species abundances in the site are becoming more evenly
distributed, or the co-occurring species become more functionally distant from each other
due to increased niche differentiation.
When weighted functional diversity is plotted against weighted species diversity both axes
have a reduced effective dimensionality caused by the unequal weighting of species. The
exponential relation for functional diversity based on all traits indicates that species
diversity, like species richness, will probably underestimate functional diversity and
ecosystem functioning. Higher effective dimensionality of functional diversity compared to
60
species diversity is caused by the maximum of 9 ways in which functional diversity can
differentiate in community structure (the number of traits when all traits are independent),
instead of just one, species abundances, regardless of their functional characteristics.
Interestingly, when the effective dimensionality of functional diversity is further reduced to
one single trait, we find that SLA and wood density respond differently. For diversity in SLA
values the effect of species composition and species identity is high (exponential curve) so
that species diversity is likely to underestimate the functional diversity of SLA values.
Therefore, when species diversity is used to conclude on the diversity of litter decomposition
rates, for studies on forest soil fertility for example, species richness is likely to
underestimate forest functioning. On the contrary, wood density shows a logarithmic curve
with species diversity. This suggests that species differences in wood density are so limited
(partial complementarity) that species diversity is likely to overestimate the functional
diversity of wood density. So for example studies interested in carbon cycling will not be
served with species diversity as an indicator of forest functioning in the carbon cycle. The
exponential curve for weighted functional diversity of SLA and the logarithmic curve of wood
density against species diversity indicates that functional complementarity for SLA is much
higher than for wood density in the secondary forests studied. Therefore the choice of traits
may significantly influence the outcome when comparing functional diversity among sites.
Conclusions
Species and functional richness increase logarithmically with structural development of
succession. Results indicate that richness already starts leveling off at early stages of
succession (under 24 years of abandonment).
Species richness is a good predictor of functional richness (non-weighted) in our secondary
forest sites. However, as stressed by the biomass ratio hypothesis (Grime 1998) functional
diversity needs to be weighted by species abundances when ecosystem processes is of
interest since this is mainly determined by the functional characteristics of the dominant
species.
Our results provide empirical evidence that species richness and species diversity are likely
to underestimate the weighted functional diversity in a site when a large range of traits is
considered. Instead when a single trait is included in the functional diversity measure,
species diversity may underestimate (in case of SLA) or overestimate (in case of wood
density) the weighted functional diversity. Therefore careful consideration of the traits
required to capture the ecosystem process of interest is essential (Díaz & Cabido 2001;
Petchey & Gaston 2002) because the number and nature of traits significantly determine the
outcome of studies that compare functional diversity across sites.

61
References
Augspurger C.K., Kelly C.K. 1984. Pathogen mortality of tropical tree seedlings: experimental
studies of the effects of dispersal distance, seedling density, and light conditions.
Oecologia 61: 211-217.
Baker N.R., Rosenqvist E. 2004. Applications of chlorophyll fluorescence can improve crop
production strategies: an examination of future possibilities. Journal of Experimental
Botany 55(403): 1607-1621.
Bazzaz F.A., Pickett S.T.A. 1980. Physiological ecology of tropical succession: a comparative
review. Annual Review of Ecology and Systematics 11: 287-310.
Black J.N. 1960. The significance of petiole length, leaf area, and light interception in
competition between strains of subterranean clover grown in swards. Australian Journal of
Agricultural Research 11(3): 277-291.
Bongers F., Poorter L., Hawthorne W.D., Sheil D. 2009. The intermediate disturbance
hypothesis applies to tropical forests, but disturbance contributes little to tree diversity.
Ecology Letters 12: 1-8.
Breugel van M., Martínez-Ramos M., Bongers F. 2006. Community dynamics during early
secondary succession in Mexican tropical rain forests. Journal of Tropical Ecology 22: 663-
674.
Breugel van M., Breugel van P., Mendez-Bahena A., Sandker M., Bongers F., Martínez-Ramos
M. 2007. Diversity patterns across young secondary forests. Dynamics of secondary
forests. PhD thesis, Wageningen University, Wageningen, The Netherlands.
Brown S., Lugo A.E. 1990. Tropical secondary forests. Journal of Tropical Ecology 6(1): 1.32.
Casanoves F., Di Rienzo J.A., Pla L. 2008. User Manual f-Diversity: Statistical software for the
analysis of functional diversity. First Edition, Argentina.
Chave J. Coomes D., Jansen S., Lewis S.L., Swenson N.G., Zanne A.E. 2009. Towards a
worldwide wood economics spectrum. Ecology Letters 12: 351-366.
Chazdon L.R., Letcher S.G., Breugel van M., Martínez-Ramos M., Bongers F., Finegan B. 2007.
Rates of change in tree communities of secondary Neotropical forests following major
disturbances. Philosophical Transactions of the Royal British Society 362: 273-289.
Connell J.H. 1978. Diversity in tropical rainforest and coral reefs. Science 199(4335): 1302-
1310.
Cornelissen J.H.C., Pérez-Hanguindeguy N., Díaz S., Grime J.P., Marzano B., Cabido M.,
Vendramini F., Cerabolini B. 1999. Leaf structure and defence control litter decomposition
rate accross species and life forms in regional floras on two continents. New Phytologist
143(1): 191-200.
Cornelissen J.H.C., Lavorel S., Garnier E., Díaz S., Buchmann N., Gurvich D.E., Reich P.B., ter
Steege H., Morgan H.D., van der Heijden M.G.A., Pausas J.G. , Poorter H. 2003. A handbook
of protocols for standardised and easy measurement of plant functional traits worldwide,
Australian Journal of Botany 51: 335–380.
Cowling R.M., Mustart P.J., Laurie H., Richards M.B. 1994. Species diversity; functional
diversity and functional redundancy in fynbos communities. South African Journal of
Science 90(6): 333-337.
Díaz S., Cabido M. 2001. Vive la difference: plant functional diversity matters for ecosystem
processes. Trends in Ecology and Evolution 16: 646-655.
Díaz S., Hodgson J.G., Thompson K., Cabido M., Cornelissen J.H.C, Jalili A., Monserrat-Martí
G., Grime J.P., Zarrinkamar F., Asri Y., Band S.R., Basconcelo S., Castro-Díez P., Funes G.,
Hamzehee B., Khoshnevi M., Pérez-Harguindeguy N., Pérez-Rontomé M.C., Shirvany F.A.,
62
Vendramini F., Yazdani S., Abbas-Azimi R., Bogaard A., Boustani S., Charles M., Dehghan
M., de Torres-Espuny L., Falczuk V., Guerrero-Campo J., Hynd A., Jones G., Kowsary E.,
Kazemi-Saeed F., Meastro-Martínez M., Romo-Díez A., Shaw S., Siavash B., Villar-Salvador
P., Zak M.R. 2004. The plant traits that drive ecosystems: Evidence from three continents.
Journal of Vegetation Science 15: 295-304.
Díaz S., Lavorel S., Chapin III F.S., Tecco P.A., Gurvich D.E., Grigulis K. 2007a. Functional
diversity – at the crossroads between ecosystem functioning and environmental filters.
Chapter 7. Terrestrial Ecosystems in a Changing World. Springer Berlin Heidelberg.
Díaz S., Lavorel S., de Bello F., Quétier F., Grigulis K., Robson T.M. 2007b. Incorporating plant
functional diversity effects in ecosystem service assessment. Proceedings of the National
Academy of Sciences 104: 20684-20689.
Dos Santos U.M., de Carvalho Gonçalves J.F., Feldpausch T.R. 2006. Growth, leaf nutrient
concentration and photosynthetic nutrient use efficiency in tropical tree species planted in
degraded area in central Amazonia. Forest Ecology and Management 226: 299-309.
Dukes J.S. 2001. Biodiversity and invasibility in grassland microcosms. Oecologia 126: 563-
568.
Eggeling W.J. 1947. Observations on the ecology of the Budongo rain forest, Uganda. Journal
of Ecology 34: 20-87.
Funk J.L., Cleland E.E., Suding K.N., Zavaleta E.S. 2008. Restoration through reassembly: plant
traits and invasion resistance. Trends in Ecology and Evolution 23(12): 695-703.
Garnier E., Cortez J., Billès G., Navas M-L., Roumet C., Debussche M., Laurent G., Blanchard
A., Aubry D., Bellmann A., Neill C., Toussaint J-P. 2004. Plant functional markers capture
ecosystem properties during secondary succession. Ecology 85(9): 2630-2637.
Gelder van H.A., Poorter L., Sterck F. 2006. Wood mechanics, allometry, and life-history
variation in a tropical rain forest tree community. New Phytologist 171(2): 367-378.
Grime J.P. 1998. Benefits of plant diversity to ecosystems: immediate filter and founder
effects. Journal of Ecology 86: 902-910.
Guariguata M.R., Ostertag R. 2001. Neotropical secondary forest succession: changes in
structural and functional characteristics. Forest Ecology and Management 148: 185-206.
Hooper D.U. 1998. The role of complementarity and competition in ecosystem responses to
variation in plant diversity. Ecology 79: 704-719.
Hooper D.U., Chapin III F.S., Ewel J.J., Hector A., Inchausti P., Lavorel S., Lawton J.H., Lodge
D.M., Loreau M., Naeem S., Schmid B., Setala H., Symstad A.J., Vandermeer J., Wardle D.A.
2005. Effects of biodiversity on ecosystem functioning: a consensus of current knowledge.
Ecological Monographs 75(1): 3-35.
Ibarra-Manríquez G., Martínez-Ramos M., Oyama K. 2001. Seedling functional types in a
lowland rainforest in Mexico. American Journal of Botany 88(10): 1801-1812.
Kitajima K., Poorter L. 2010. Tissue-level leaf toughness, but not lamina thickness, predicts
sapling leaf lifespan and shade tolerance of tropical tree species. New Phytologist.
Lavorel S., Garnier E. 2002. Predicting changes in community composition and ecosystem
functioning from plant traits: revisiting the holy grail. Functional Ecology 16(5): 545-556.
Lavorel S., Díaz S., Cornelissen J.H.C., Garnier E., Harrison S.P., McIntyre S., Pausas J.G.,
Pérez-Harguindeguy N., Roumet C., Urcelay C. 2007. Plant functional types: Are we getting
any closer to the holy grail? Chapter 13. Terrestrial Ecosystems in a Changing World.
Springer Berlin Heidelberg.
63
Lebrija-Trejos E., Pérez-García E.A., Meave J.A., Bongers F., Poorter L. 2010. Functional traits
and environmental filtering drive community assembly in a species-rich tropical system.
Ecology 91(2): 386-398.
Loreau M. 2004. Does functional redundancy exist? Oikos 104(3): 606-611.
Martínez-Ramos M., Bongers F. unpublished results. Centro de Investigaciones en
ecosystemas (CIEco), Universidad Autonoma de México (UNAM). Wageningen University
and Research center (WUR).
Mason N.W.H., MacGillivray K., Steel J.B., Wilson J.B. 2003. An index of functional diversity.
Journal of Vegetation Science 14: 571-578.
Maxwell K., Johnson G.N. 2000. Chlorophyll fluorescence- A practical guide. Journal of
Experimental Botany 51: 659-668.
Mouillot D., Mason N.W.H., Dumay O., Wilson B.J. 2005. Functional regularity: a neglected
aspect of functional diversity. Oecologia 142: 353-359.
Naeem S., Wright J.P. 2003. Disentangling biodiversity effects on ecosystem functioning:
deriving solutions to a seemingly insurmountable problem. Ecology Letters 6: 567-579.
Niinemets Ü. 2001. Global scale climatic controls of leaf dry mass per area, density, and
thickness in trees and shrubs. Ecology 82: 453-469.
Nyström M. Folke C. 2001. Spatial resilience of coral reefs. Ecosystems 4: 406-417.
Onoda Y. Westoby M., Adler P., Choong A., Clissold F., Cornelissen J., Díaz S., Dominy N.,
Elgart A., Enrico L., Fine P., Howard J., Jalili A., Kitajima K., Kurokawa H., Lucan P.,
Markesteijn L., McArthur C., Perez-Harguindeguy N., Poorter L., Richards L., Santiago L.,
Sosinski Jr E., Van Bael S., Warton D., Wright I., Wright S., Yamashita N. submitted. Global
patterns of leaf mechanical properties.
Pakeman R.J., Quested H.M. 2007. Sampling plant functional traits: what proportion of the
species need to be sampled? Applied Vegetation Science 10: 91-96.
Parkhill J-P., Maillet G., Cullen J.J. 2001. Fluorescence-based maximal quantum yield for PSII
as a diagnostic of nutrient stress. Journal of Phycology 37: 517-529.
Pavoine S., Ollier S., Pontier D. 2005. Measuring diversity from dissimilarities with Rao’s
quadratic entropy: Are any dissimilarities suitable? Theoretical Population Biology 67: 231-
239.
Petchey O.L., Gaston K.J. 2002. Functional diversity (FD), species richness and community
composition. Ecology Letters 5: 402-411.
Petchey O.L. 2003. Integrating methods that investigate how complementarity influences
ecosystem functioning. Oikos 101: 323-330.
Petchey O.L. 2004. On the statistical significance of functional diversity effects. Functional
Ecology 18: 297-303.
Petchey O.L., Hector A., Gaston K.J. 2004. How do different measures of functional diversity
perform? Ecology 85: 847-857.
Petchey O.L, Gaston K.J. 2006. Functional diversity: Back to the basics and looking forward.
Ecology Letters 9: 741-758.
Pla L., Casanoves F., Di Rienzo J., Fernandez F., Finegan B. 2008. Confidence intervals for
functional Diversity indices considering species abundances. International Biometric
Society. International Biometric Conference, Dublin, 13-18 July 2008.
Pla L. 2009. Personal communication.
Poorter H., Garnier E. 1999. Ecological significance of relative growth rate and its
components. In: Handbook of functional plant ecology. F.I. Pugnaire, F. Valladares (Eds).
Marcel Dekker, New York.
64
Poorter L., Bongers F. 2006. Leaf traits are good predictors of plant performance across 53
rain forest species. Ecology 87(7): 1733-1743.
Poorter L., Wright S.J., Paz H., Ackerly D.D., Condit R., Ibarra-Manriquez G., Harms K.E.,
Licona J.C., Martínez-Ramos M., Mazer S.J., Muller-Landau H.C., Peña-Claros M., Webb
C.O., Wright I.J. 2008. Are functional traits good predictors of demographic rates? Evidence
from five Neotropical forests. Ecology 89(7): 1908-1920.
Poorter H., Niinemets Ü., Poorter L., Wright I., Villar R. 2009. Causes and consequences of
variation in leaf mass par area (LMA): a meta analysis. New Phytologist 182: 565-588.
Popma J., Bongers F., Werger M.J.A. 1992. Gap-dependence and leaf characteristics of trees
in a tropical lowland rain forest in Mexico. Oikos 63: 207-214.
Rasband W.S. 2008. Image J. US National Institutes of Health, Bethesda, Maryland, USA.
Available online http://rsbweb.nih.gov/ij/index.html.
Reich P.B., Uhl C., Walters M.B., Ellsworth D.S. 1991. Leaf lifespan as a function of leaf
structure and function among 23 Amazonian tree species. Oecologia 86: 16-24.
Reich P.B., Walters M.B., Ellsworth D.S. 1997. From tropics to tundra: Global convergence in
plant functioning. Proceedings of the National Academy of Science USA 94: 13730-13734.
Schmid B., Joshi J., Schläpfer F. 2002. Empirical evidence for biodiversity – ecosystem
functioning relationship. In: The functional Consequences of Biodiversity; Empirical
Progress and theoretical extensions. A.P. Kinzig, S.W. Pacala, D. Tilman (Eds.). Princeton
University Press, Princeton, New Jersey.
Shannon C., Weaver W. 1949. The mathematical theory of communication. University of
Illinois Press, Urbana USA.
Sterck F.J., Poorter L., Schieving F. 2006. Leaf traits determine the growth-survival trade-off
across rain forest tree species. The American Naturalist 167(5): 758-765.
Takenaka A. 1994. Effects of leaf blade narrowness and petiole length on the light capture
efficiency of a shoot. Ecological research 9: 109-114.
Tilman D., Knops J., Wedin D., Reich P., Ritchie M., Siemann E. 1997. The influence of
functional diversity and composition on ecosystem processes. Science 277: 1300-1302.
Tilman D. 2000. Causes, consequences and ethics of biodiversity. Nature 405: 208-211.
Tilman D. 2001. Functional diversity. Encyclopaedia of Biodiversity Volume 3. Academia
Press.
Walker B., Kinzig A., Langridge J. 1999. Plant attribute diversity, resilience and ecosystem
function: The nature and significance of dominant and minor species. Ecosystems 2: 95-
113.
Webb C.O., Ackerly D.D., McPeek M.A., Donoghue M.J. 2002. Phylogenies and community
ecology. Annual Review of Ecology and Systematics 33: 475-505.
Zermeño-Hernández I.E. 2008. Evaluación del disturbio ecológico provocado por diferentes
tipos de uso agrícola del suelo en una región tropical húmeda. Tesis maestra en ciencias
biológicas. Universidad Nacional Autónoma de México.
65
Chapter 4: Functional diversity as a tool in predicting community assembly
processes
Abstract
Deterministic theories on community assembly predict that species presence is largely
determined by niche differences, thus by plant functional adaptations. This implies that
habitat filtering as an assembly force selects for species in a community to be functionally
similar whereas competition favours co-occurring species to be functionally dissimilar to
allow them to coexist on the same resource. We predicted that along a gradient of
secondary succession, there is a shift in assembly processes where in early stages successful
species are characterized by functional similarity (through habitat filtering) and later stages
successful species are instead functional dissimilar (through competitive exclusion). We used
functional diversity based on presence/absence for the overall community to compare to
functional diversity weighted for abundances reflecting the diversity in functional traits of
dominant or successful species. Using functional diversity for implying assembly processes
has not been done before and our results indicate that the hypothesized shift does indeed
occur in secondary forests in the study region. When we analyze all traits combined the
dominant species become relatively more functionally dissimilar compared to all species
present as the number of species in the plot increases. When the traits are analyzed
separately we find that most traits (6 out of 9) show strong significant increases in functional
dissimilarity of dominant species indicating that during succession these traits are central to
adaptation strategies in an environment characterized by increasing competitive pressure on
resources during succession. Our findings show that as more species enter the forests, there
is a shift in assembly force from habitat filtering to competitive exclusion determining which
species become abundant.
Keywords: Functional diversity; Secondary forests, Chronosequence, Community assembly
processes; Habitat filtering; Competition; Tropical forests, Chiapas, Mexico
Introduction
Community assembly processes are at the heart of community ecology. The debate on how
communities are assembled is controversial, however (e.g. Hubbel 2001; Chase 2003).
Likewise, there is much controversy on species coexistence and maintenance of biodiversity
(e.g. Wright 2002). Deterministic theories predict that species niche differences create
differential responses to environmental conditions and interspecific interactions. Part of this
is the environmental filtering hypothesis (Weiher & Keddy 1995) predicting that species are
functionally adapted to grow and survive under specific environments and as a result of this
species with similar niche requirements are found in similar habitats. The competitive
exclusion hypothesis is another example, with it’s roots in already in early work on the
evolution theory. When resource are limited, competition shapes coexistence via the
process of niche differentiation or competitive exclusion and this would lead to co-occurring
species adapted to differing niche requirements (e.g. Hardin 1960; Grime 1973). Hubbell
(2001) instead criticizes the concept of niches and suggests that biodiversity is controlled by
neutral drift of species abundances where all species have equal chances of becoming
abundant, despite being functionally non equivalent.
66
This study analyzes community assembly processes in wet tropical forests along a gradient of
secondary succession. Secondary succession is ongoing community assembly and therefore
provides a perfect setting to test species coexistence from a functional perspective. If indeed
species successfulness is shaped by their functional characteristics (as predicted by
deterministic theories) functional information on plant species enhances understanding on
community assembly. We compared the relative contribution of dominant species
(functional diversity weighted for abundances) to the overall functional diversity of a site
(functional diversity where all species are equally weighted) to get an idea of what ecological
drivers have shaped the community observed. Comparing functional diversity with and
without weighting for abundances, gives insights into the functional similarity or dissimilarity
of dominant species. This method allows answering the question: ‘what ecological force
(competitive exclusion or habitat filtering) has selected some of the species present to
become dominant?’ by addressing whether dominant species are more similar or more
dissimilar compared to all species present. This is different from studies where the species in
the community are compared to the species pool, testing assembly processes that select
species from the pool to be present or not (Figure 1) (e.g. Cornwell et al. 2006).
When weighted functional diversity (wFD; weighted for species abundances) is lower than
non-weighted functional diversity (FD; based on species presence/absence), it indicates that
dominant species are functionally similar compared to the overall diversity present. This is a
sign that habitat filtering may be the most important driver of community assembly resulting
in the selection of specific plant traits that are well adapted to the environment, also
referred to as functional (or phenotypic) attraction (Webb et al. 2002; Kraft et al.
2008)(Figure 2a). Instead, when wFD (weighted for species abundances) is higher than FD
(based on presence/absence), it indicates that there is selection for dominant species to be
less functionally similar. This can be explained by competition (niche differentiation) as a
driver of community assembly, resulting in functional repulsion to allow coexistence of
species in a competitive environment (Webb et al. 2002; Kraft et al. 2008) (Figure 2b).
The wFD/FD ratio, as a measure of functional dissimilarity of dominant species, is tested
against different gradients that are assumed to reflect different aspects of succession; age,
stand basal area and species number.
In time since abandonment the relative importance of competition is expected to increase,
in line with the colonization-competition hypothesis (or spatial competition hypothesis).
After disturbance, the chance strong competitors have colonized the sites increases in time
because of the trade-off between either being a good colonizer or being a good competitor
(Levins & Culver 1971; Tilman 1994; Yu & Wilson 2001; Clark et al. 2004). The shift in
assembly processes predicted reflects an underlying hypothesis on resource limitation;
where in early succession a certain resource is abundant, species successfulness will depend
on how successfully it can use the resource for growth and reproduction. As more species
enter the system that particular resource may become limited reflecting the need for
differentiated strategies to obtain this resource, indicated by functional repulsion
(dissimilarity) of co-occurring species through competition. By testing the trend in the ratio
between weighted and unweighted functional diversity against succession, we may find that
some traits clearly reflect increasing competition for resources whereas other do not. This
could enhance our understanding on what traits play an important role in adaptation to
changing conditions during secondary succession.
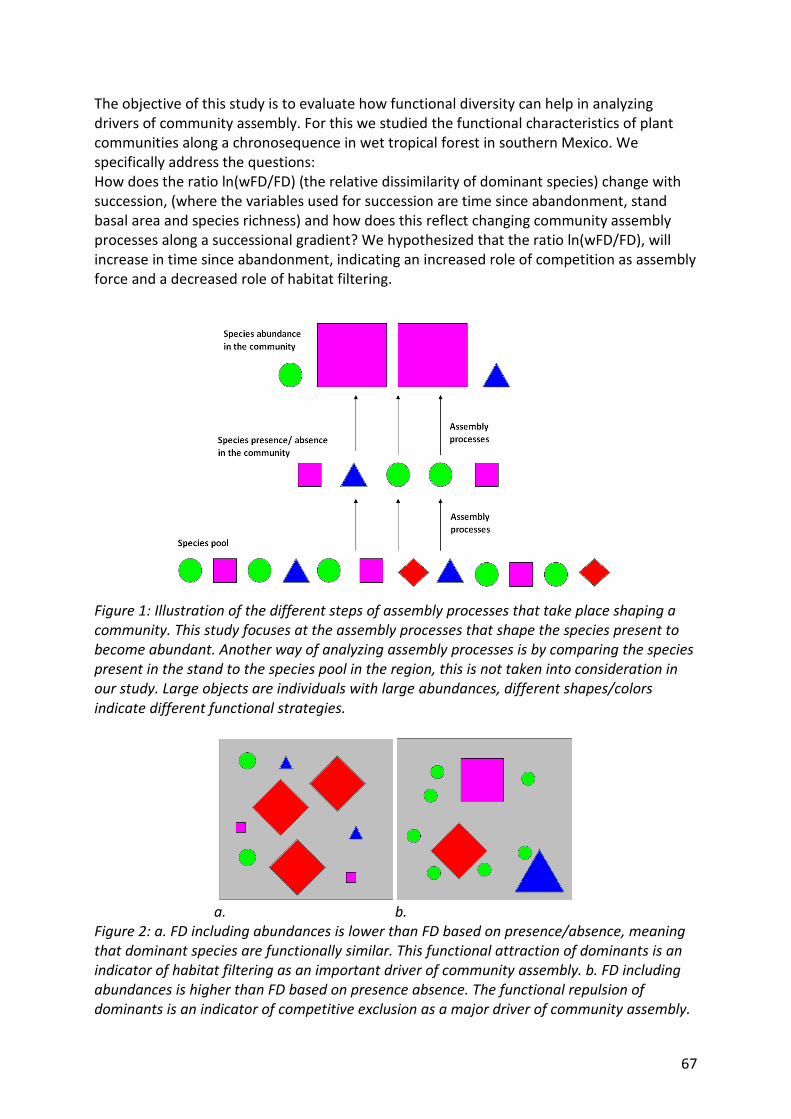
67
The objective of this study is to evaluate how functional diversity can help in analyzing
drivers of community assembly. For this we studied the functional characteristics of plant
communities along a chronosequence in wet tropical forest in southern Mexico. We
specifically address the questions:
How does the ratio ln(wFD/FD) (the relative dissimilarity of dominant species) change with
succession, (where the variables used for succession are time since abandonment, stand
basal area and species richness) and how does this reflect changing community assembly
processes along a successional gradient? We hypothesized that the ratio ln(wFD/FD), will
increase in time since abandonment, indicating an increased role of competition as assembly
force and a decreased role of habitat filtering.
Figure 1: Illustration of the different steps of assembly processes that take place shaping a
community. This study focuses at the assembly processes that shape the species present to
become abundant. Another way of analyzing assembly processes is by comparing the species
present in the stand to the species pool in the region, this is not taken into consideration in
our study. Large objects are individuals with large abundances, different shapes/colors
indicate different functional strategies.
a. b.
Figure 2: a. FD including abundances is lower than FD based on presence/absence, meaning
that dominant species are functionally similar. This functional attraction of dominants is an
indicator of habitat filtering as an important driver of community assembly. b. FD including
abundances is higher than FD based on presence absence. The functional repulsion of
dominants is an indicator of competitive exclusion as a major driver of community assembly.

68
Large objects are individuals with large abundances, different shapes/colors indicate
different functional strategies.
Methods
Research site and species selection
Research was carried out within the Lacandon region in southeast Mexico (16°01’N,
90°55’W). The climate is warm-humid with an average annual temperature of 25-27°C and
an annual rainfall of 3.000 mm, with less than 100 mm per month falling from February
through April (Ibarra-Manríquez & Martínez-Ramos 2002; Breugel et al. 2006). The study
sites are located around the village of Loma Bonita, an area characterized by small hills and
valleys with sandy or limestone soils of low pH (<5.5). Currently 65% of the land area around
Loma Bonita is used for agricultural practices (mostly livestock pasture), 14% is mature forest
and 21% consist of secondary forests of different ages (Zermeño-Hernández 2008).
The successional chronosequence consists of 11 secondary forest plots (10 x 50 m) with
fallow ages between 3.5 and 22.5 years. Plots were established on abandoned corn fields,
the main form of agriculture, and plots were in use within one year before abandonment. In
each plot all trees with a diameter at breast height (DBH) > 1cm were identified and their
diameter was measured.
For each plot those species were selected that make up at least 80% of the importance value
(calculated by the relative abundance and the relative density, further explained below) of
that plot, as it is suggested that those species determine most of the key ecosystem
processes (Garnier et al. 2004; Pakeman & Quested 2007). On average 32 species per site
were selected, ranging from 9 to 47 species, being 82 species in total. Both dominant and
rare species have been selected with an average importance value of 0.036 (3.6%) ranging
from 0.0007 (0.07%) to 0.63 (63%).
Functional traits
Nine functionally important traits were studied. Leaf traits have been measured on 2 (sun-lit)
leaves per individual and 10 replicate individuals per species, except for specific force to
punch where only 5 individuals per species were assessed. Wood traits are also based on five
individuals per species. Standardized measurement protocols have been carried out as
suggested by Cornelissen et al. (2003).
Leaf Area (cm2). Leaf area was calculated by photographing the fresh area excluding the
petiole on a lightbox after which the area was calculated with pixel counting software ImageJ
(Rasband 2009).
Specific Leaf Area (m2 Kg-1). SLA was calculated as the fresh leaf area divided over the oven
dried mass (dried for 48 h at 70°C), excluding the petiole. In the case of composite leaves the
smallest photosynthetic unit was taken.
Leaf Dry Matter Content (g g-1). After collection the leaves were placed in water to rehydrate
for at least 5 hours after which the fresh weight has been determined. The oven dry weight
is divided over the fresh weight for acquiring the leaf dry matter content.
Leaf thickness (mm). Determined with a digital caliper in the middle of the leaf avoiding the
main and secondary nerves.
Specific Force to Punch (MN m-2). The laminas of fresh leaves where perforated with a
penetrometer built with a flat-end nail attached to the inner part of a syringe and a
waterbasin on top. Water was added to the basin until the leaf ruptures. The total weight

69
added was converted into Mega Newton and divided over the breaking surface of the hole
(circumference of the nail x thickness of the leaf). This alternative punching method shows
similar trends compared to cutting and tearing tests and is a good indicator of leaf
mechanical resistance (Onoda et al. submitted).
Petiole length (cm). Determined with a digital caliper or a tape-measure.
Instantaneous Chlorophyll Fluorescence / F0. Leaves were dark-adapted for 1 hour after
which the fluorescence was measured with a fluorpen (Photon Systems Instruments, FP100)
on exposure to light, 455 nm, at a saturating intensity of 3000uE.
Quantum Yield (Fv / Fm). The quantum yield is the ratio between the variable fluorescence
and maximum fluorescence on exposure to saturating light (455 nm, intensity of 3000uE)
after dark adaptation (1 hour). It reflects the proportion of light used in photochemistry or
emitted as heat. Measurements were taken with a fluorpen (Photon Systems Instruments,
FP100).
Wood Density (g cm-3
). With an increment borer (12” mm Suunto, Finland) a core of wood
was extracted up to at least the heart of the tree (firmly attached bark or phloem tissue was
considered part of the stem). For some species the stems did not reach sufficient size for this
method and alternatively a slice of the stem was extracted. The wood cores were divided in
three parts (heart, inner wood and outer wood) and the wood density is measured for these
parts separately by dividing the dry weight over the fresh volume (where the volume was
determined with the water replacement method). These three parts are averaged for the
species wood density. This measurement was taken for 32 of the 82 species studied, data on
wood density for remaining species were taken from comparable studies in Mexican wet
forests in Chajul (Chiapas), Las Margeritas (Puebla) and Los Tuxlas (Veracruz) (Martínez-
Ramos & Bongers unpublished results).
Functional diversity
Functional traits are averaged per species. The abundance of each species in each of the
sites is calculated based on the relative number of stems and the relative basal area (DBH >
1cm).
It is calculated as: (BAi/BAtotal + Di/Dtotal)/ 2. Where BAi is the basal area of the ith species, Di is
the density of the ith species and total reflects the total of individuals in the plot. Functional
diversity based on presence/absence of species has all abundances equalized at 1. Weighting
with this combined measure of density and basal area was chosen because only basal area
would bias towards individuals that have the potential to grow a large basal area and we
also consider species successful when many individuals are present.
Functional diversity of each of the sites is calculated using the fDiversity software program
based on Euclidean distance and average linkage (Casanoves et al. 2008). We used the
measure of multiplicative extended functional diversity is used (Pla pers. comm.). This
diversity measure is based on a dissimilarity matrix of trait-values for all species in the study
(Petchey & Gaston 2006) and the matrix is loaded by the relative abundances for each
species in that community. Subsequently, the multiplicative extended weighted functional
diversity is computed as the total branch length of the functional dendrogram of all species
in the community and multiplied by the squared species number. This measure is chosen
because it allows including species abundances as (wFD) well as presence/absence of
functional traits, when all abundances are set at 1 (FD).
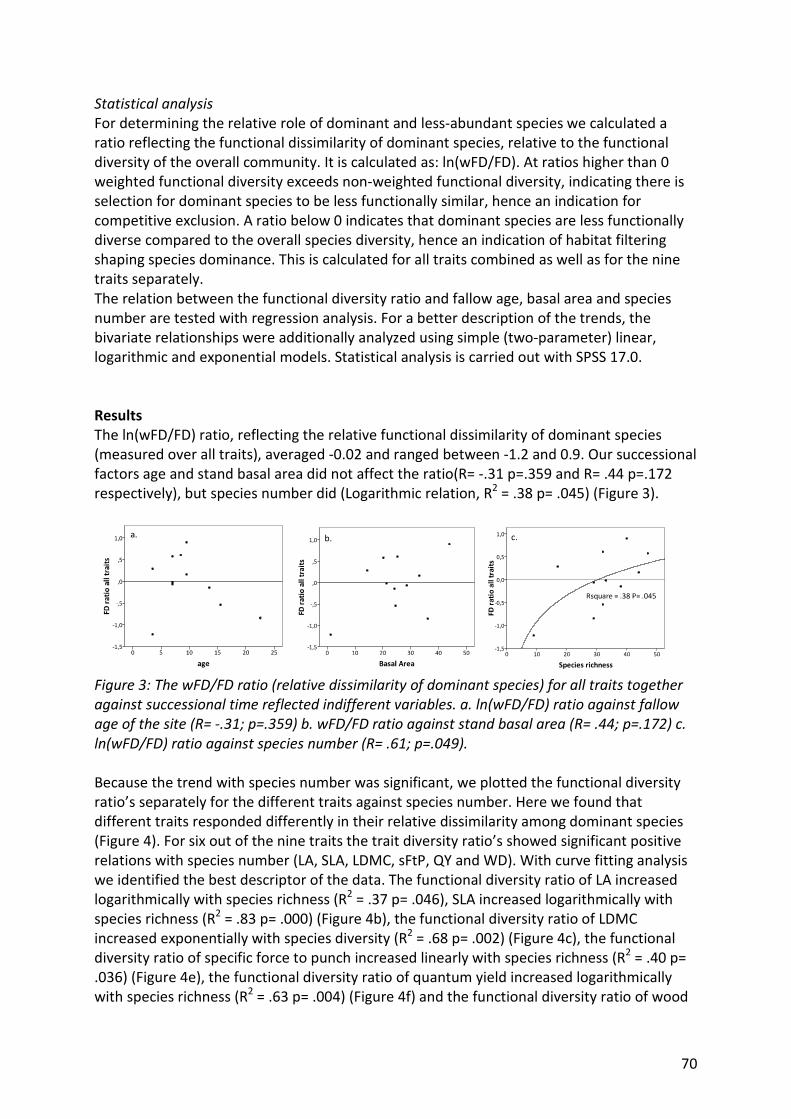
70
Statistical analysis
For determining the relative role of dominant and less-abundant species we calculated a
ratio reflecting the functional dissimilarity of dominant species, relative to the functional
diversity of the overall community. It is calculated as: ln(wFD/FD). At ratios higher than 0
weighted functional diversity exceeds non-weighted functional diversity, indicating there is
selection for dominant species to be less functionally similar, hence an indication for
competitive exclusion. A ratio below 0 indicates that dominant species are less functionally
diverse compared to the overall species diversity, hence an indication of habitat filtering
shaping species dominance. This is calculated for all traits combined as well as for the nine
traits separately.
The relation between the functional diversity ratio and fallow age, basal area and species
number are tested with regression analysis. For a better description of the trends, the
bivariate relationships were additionally analyzed using simple (two-parameter) linear,
logarithmic and exponential models. Statistical analysis is carried out with SPSS 17.0.
Results
The ln(wFD/FD) ratio, reflecting the relative functional dissimilarity of dominant species
(measured over all traits), averaged -0.02 and ranged between -1.2 and 0.9. Our successional
factors age and stand basal area did not affect the ratio(R= -.31 p=.359 and R= .44 p=.172
respectively), but species number did (Logarithmic relation, R2 = .38 p= .045) (Figure 3).
Figure 3: The wFD/FD ratio (relative dissimilarity of dominant species) for all traits together
against successional time reflected indifferent variables. a. ln(wFD/FD) ratio against fallow
age of the site (R= -.31; p=.359) b. wFD/FD ratio against stand basal area (R= .44; p=.172) c.
ln(wFD/FD) ratio against species number (R= .61; p=.049).
Because the trend with species number was significant, we plotted the functional diversity
ratio’s separately for the different traits against species number. Here we found that
different traits responded differently in their relative dissimilarity among dominant species
(Figure 4). For six out of the nine traits the trait diversity ratio’s showed significant positive
relations with species number (LA, SLA, LDMC, sFtP, QY and WD). With curve fitting analysis
we identified the best descriptor of the data. The functional diversity ratio of LA increased
logarithmically with species richness (R2 = .37 p= .046), SLA increased logarithmically with
species richness (R2 = .83 p= .000) (Figure 4b), the functional diversity ratio of LDMC
increased exponentially with species diversity (R2 = .68 p= .002) (Figure 4c), the functional
diversity ratio of specific force to punch increased linearly with species richness (R2 = .40 p=
.036) (Figure 4e), the functional diversity ratio of quantum yield increased logarithmically
with species richness (R2 = .63 p= .004) (Figure 4f) and the functional diversity ratio of wood
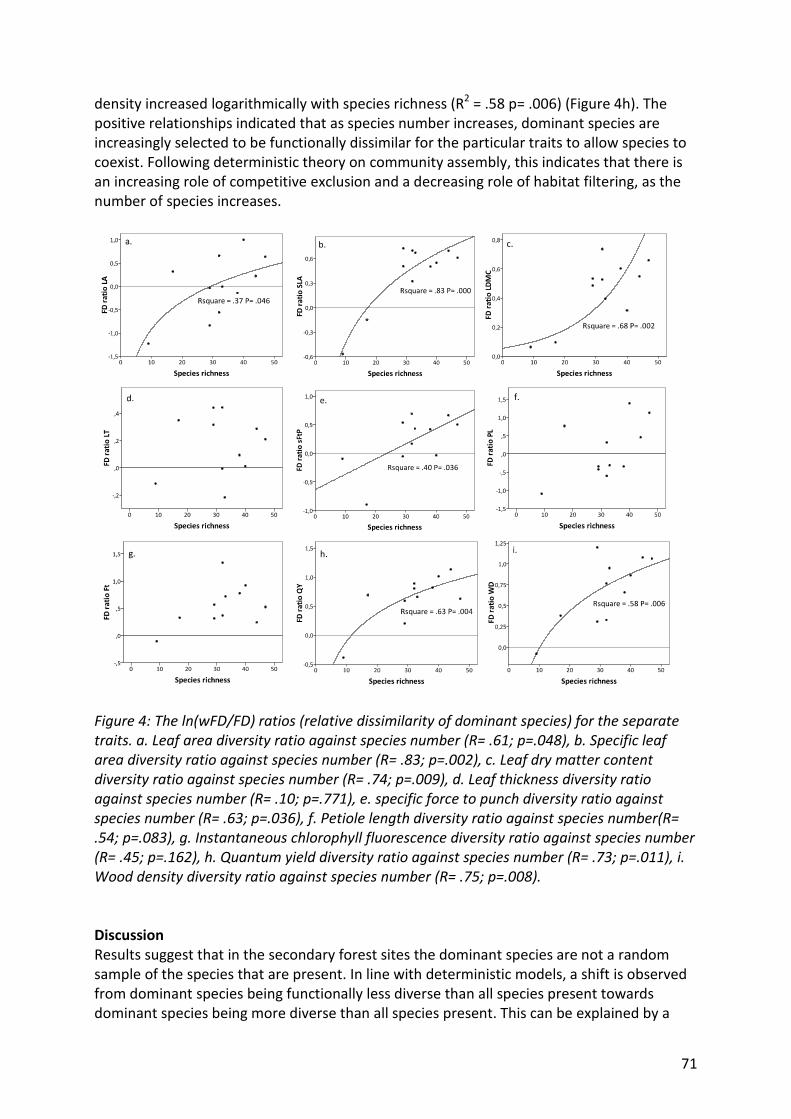
71
density increased logarithmically with species richness (R2 = .58 p= .006) (Figure 4h). The
positive relationships indicated that as species number increases, dominant species are
increasingly selected to be functionally dissimilar for the particular traits to allow species to
coexist. Following deterministic theory on community assembly, this indicates that there is
an increasing role of competitive exclusion and a decreasing role of habitat filtering, as the
number of species increases.
Figure 4: The ln(wFD/FD) ratios (relative dissimilarity of dominant species) for the separate
traits. a. Leaf area diversity ratio against species number (R= .61; p=.048), b. Specific leaf
area diversity ratio against species number (R= .83; p=.002), c. Leaf dry matter content
diversity ratio against species number (R= .74; p=.009), d. Leaf thickness diversity ratio
against species number (R= .10; p=.771), e. specific force to punch diversity ratio against
species number (R= .63; p=.036), f. Petiole length diversity ratio against species number(R=
.54; p=.083), g. Instantaneous chlorophyll fluorescence diversity ratio against species number
(R= .45; p=.162), h. Quantum yield diversity ratio against species number (R= .73; p=.011), i.
Wood density diversity ratio against species number (R= .75; p=.008).
Discussion
Results suggest that in the secondary forest sites the dominant species are not a random
sample of the species that are present. In line with deterministic models, a shift is observed
from dominant species being functionally less diverse than all species present towards
dominant species being more diverse than all species present. This can be explained by a
72
shift from habitat filtering to competitive exclusion since habitat filtering selects for certain
functional characteristics that are well adapted to the specific conditions of the site whereas
competitive exclusion causes dominant species to complement in functional traits to allow
coexistence (e.g. Webb et al. 2002).
No relation was found between functional diversity ratio of all traits together and fallow
time or basal area (Figure 3). A significant logarithmic increase was found with species
number (Figure 3c). The fact that species number did explain the trend in functional diversity
ratio’s whereas stand basal area did not, may indicate that presence of different species is a
more important factor promoting competition than simply the presence of biomass,
regardless of the species it embodies. This suggests that interspecific competition is more
likely to generate the functional divergence among co-occurring species than intraspecific
competition is.
The positive relationship with species number is in line with the hypothesis and is explained
by an increasing pressure on dominant species to be more functionally dissimilar as the
secondary forests host more species. Our results suggests that with species richness a shift
takes place in the assembly process where competitive exclusion replaces habitat filtering of
functional traits. At early stages of succession with low species richness, few functional
profiles dominate (ln(wFD/FD) < 0), signifying functional attraction among dominant species
and indicates that habitat filtering is a major force shaping community assembly (Webb et al.
2002; Stubbs & Wilson 2004; Cornwell et al. 2006; Cornwell & Ackerly 2009). At later
successional stages where species richness has increased, the dominating functional traits
are increasingly complementary and indicate selection through functional repulsion
(ln(wFD/FD) > 0), illustrating that competitive exclusion determines which of the species
present are functionally suitable to become dominant (e.g. Webb et al. 2002; Kraft et al.
2008).
The functional diversity ratio shows directional change along a gradient of species number
which is consistent with the deterministic models of community assembly. This does
however not mean that we reject the existence of neutral theory for the study sites. Neutral
theory also predicts a decay in community similarity over time, though not resulting from
niche adaptation but explained by the chance effect of immigration from the
metacommunity and extinction (Hubbell 2008). Since we did not analyse dispersal limitation
and species pool, we can not evaluate whether or not neutral theory applies to our findings.
However, due to the directional changes in functional dissimilarity of dominant species
compared to the overall community along a gradient of species number, we consider the
neutral drift prediction less likely. Instead we explain these changes as representing
deterministic community assembly theory.
Kraft et al. (2008) also found evidence for occurrence of the two contrasting assembly
processes based on a study in tropical forest dynamics plots in Ecuador. First they found that
mean trait values (presence/absence) show more variation among quadrants (20 x 20) than
within quadrants, which is taken as an indicator of habitat filtering. Then they illustrate that
the traits measured are more evenly distributed than predicted from a randomly generated
community (based on species abundances) from which niche differentiation (competitive
exclusion) can be concluded. Although the methodology differs from what is done in the
present study, both studies find results indicating the existence of both contrasting forces in
the communities studied.
Previous work in the same region (Chapter 1) showed that environmental filtering is the
major assembly force shaping sapling communities, as concluded from the explicatory power
73
of environmental conditions in differing trait composition among sites. The present study
however evaluated all individuals (DBH > 1cm) instead of just the sapling stage. The
ontogenetic stage of the individuals studied may provide an explanation for the differences
in assembly processes found. Phylogenetic overdispersion increases with age (stem size)
(Swenson et al. 2007); with tree growth biotic interactions (competitive exclusion) play an
increasingly important role.
Cornwell et al. (2006) found that Mediterranean-type forests are functionally more similar
than expected from a random community and they concluded that habitat filtering shaped
these communities. Besides the difference in biome, an important difference between
Cornwell’s and our study is the difference in selection level (Figure 1). Their research focused
on the assembly processes between the species pool and the species found in the
community (presence/ absence) by comparing the convex hull trait-space (Preparata &
Shamos 1985) of randomly generated communities with the observed communities. Our
study, in contrast, emphasized the selection of functional traits of species that become
dominant compared to the species that are present. These different levels of assembly
processes, shaping species presence and shaping species dominance may be distinct
processes with different characteristics (Cingolani et al. 2007), as also shown in Chapter 1.
Analyzing the same functional diversity ratio (ln(wFD/FD)) for the different traits separately
we find that traits differ in how the relative functional dissimilarity of dominant species
develops with species richness (Figure 4). Most traits (6 out of 9) illustrate a directional
increase in the relative dissimilarity of dominant species. Few traits (LT, PL, F0) appear not to
play a role in determining species dominance along a gradient of secondary succession:
where dominant species have similar diversity of trait values compared to the overall
community, or at least show no pattern with changing species number. The traits LA, SLA,
LDMC, sFtP, QY, and WD clearly increase in functional dissimilarity of dominants along a
gradient of increasing species number in the secondary forests where all except LDMC also
indicate a shift from dominant species being functionally more similar ((ln(wFD/FD) < 0) to
dominants being functionally more dissimilar (ln(wFD/FD) > 0). This indicates that the
ecological force shaping the observed community changed from habitat filtering to
competitive exclusion. The threshold where the competitive exclusion replaces habitat
filtering depends on the trait of interest and lies somewhere between 10-30 species in the
0.05 ha plot, but for LDMC dominant species are more functionally diverse than all species
present at all stages of species richness (Figure 4c). Also the shape of the functional diversity
ratio trend depends on the trait where functional diversity ratios of LA (Figure 4a) and SLA
(Figure 4b) show a logarithmic increase, leaf dry matter content increases exponentially
(Figure 4c), specific force to punch increases linearly (Figure 4e) and quantum yield (Figure
4h) and wood density (Figure 4i) show a logarithmic increases.
Our hypothesis of shifting importance of assembly processes is based on a model of limited
resources. When all niches are occupied, competition limits further colonization of
functionally similar species and instead starts favoring functionally dissimilar species through
competitive exclusion. The distinct trends shown by different traits suggests that traits are
selected by different abiotic conditions which can become limited at different stages of
succession. For example, the leaf traits LA and SLA may be limited by light availability, and
light may become limited at 20-30 species per 0.5 ha plot (Figure 4a and b). On the contrary,
quantum yield and wood density seem to shift at a lower species richness of about 10
species. These traits may be limited by competition for a resource other than light that

74
apparently reaches a limiting state somewhat earlier in succession. Addressing the wFD/FD
ratio of LDMC is especially interesting because at all times this ratio is positive indicating that
dominant species are more functionally diverse compared to all species present, and the
relationship increases exponentially. This may indicate that the resource selecting LDMC is at
all times limited and becomes (exponentially-) increasingly limited as more species enter the
site.
The shift along a gradient of species number does not necessarily translate to a shift that
occurs with time since abandonment but since all sites were completely cleared of original
vegetation at the start of succession it is likely that sooner or later each site will be
characterized by a change in assembly process as the number of species in a site
accumulates.
Conclusion
Comparing functional diversity including species abundances with functional diversity based
on presence/absence, conclusions can be drawn on what ecological forces have selected
some of the species to become dominant based on their functional characteristics.
We found that indeed dominant species are selected from the species present based on
their functional traits through contrasting assembly processes. Our results indicate that
already in early stages of succession assembly processes shift from habitat filtering
(functional attraction of dominants) to competitive exclusion (functional repulsion of
dominants) along a gradient of species number. Moreover, traits show distinct patterns in
their relative dissimilarity of dominant species suggesting that traits are selected by specific
conditions that reach a limited state at different stages of succession.
75
References
Breugel van M., Martínez-Ramos M., Bongers F. 2006. Community dynamics during early
secondary succession in Mexican tropical rain forests. Journal of Tropical Ecology 22: 663-
674.
Casanoves F., Di Rienzo J.A., Pla L. 2008. User Manual f-Diversity: Statistical software for the
analysis of functional diversity. First Edition, Argentina.
Cingolani A.M., Cabido M., Gurvich D.E., Renison D., Díaz S. 2007. Filtering processes in the
assembly of plant communities: Are species presence and abundance driven by the same
traits? Journal of Vegetation Science 18: 911-920.
Chase J.M. 2003. Community assembly: when should history matter? Oecologia 136: 489-
498.
Clark J.S., LaDeau S., Ibanez I. 2004. Fecundity of trees and the colonization-competition
hypothesis. Ecological Monographs 74(3): 415-446.
Cornelissen J.H.C., Lavorel S., Garnier E., Díaz S., Buchmann N., Gurvich D.E., Reich P.B., ter
Steege H., Morgan H.D., van der Heijden M.G.A., Pausas J.G. , Poorter H. 2003. A handbook
of protocols for standardized and easy measurement of plant functional traits worldwide.
Australian Journal of Botany 51: 335–380.
Cornwell W.K., Schwilk D.W., Ackerly D.D. 2006. A trait-based test for habitat filtering:
convex hull volume. Ecology 87(6): 1465-1471.
Cornwell W.K., Ackerly D.D. 2009. Community assembly and shifts in plant trait distributions
across an environmental gradient in coastal California. Ecological Monographs 79(1): 109-
126.
Garnier E., Cortez J., Billès G., Navas M-L., Roumet C., Debussche M., Laurent G., Blanchard
A., Aubry D., Bellmann A., Neill C., Toussaint J-P. 2004. Plant functional markers capture
ecosystem properties during secondary succession. Ecology 85(9): 2630-2637.
Grime J.P. 1973. Competitive exclusion in herbaceous vegetation. Nature 242: 344-347.
Hardin G. 1960. The competitive exclusion principle. Science 131(3409): 1292-1297.
Hubbell S.P. 2001. The unified neutral theory of biodiversity and biogeography. Princeton
University Press, Princeton, NJ.
Hubbell S.P. 2008. Approaching ecological complexity from the perspective of symmetric
neutral theory. Tropical Forest Community Ecology. Carson W.P.& Schnitzer S.A. (Eds.)
Blackwell Publishing Ltd, UK.
Ibarra-Manríquez G., Martínez-Ramos M., Oyama K. 2001. Seedling functional types in a
lowland rainforest in Mexico. American Journal of Botany 88(10): 1801-1812.
Kraft N.J.B., Valencia R., Ackerly D. 2008. Functional traits and niche-based tree community
assembly in an Amazonian forest. Science 322: 580-582.
Levins R., Culver D. 1971. Regional coexistence of species and competition between rare
species. Proceedings of the National Academy of Science USA 68(6): 1246-1248.
Martínez-Ramos M., Bongers F. unpublished results. Centro de Investigaciones en
Ecosistemas. Wageningen University and Research center.
Onoda Y., Westoby M., Adler P., Choong A., Clissold F., Cornelissen J., Díaz S., Dominy N.,
Elgart A., Enrico L., Fine P., Howard J., Jalili A., Kitajima K., Kurokawa H., Lucan P.,
Markesteijn L., McArthur C., Perez-Harguindeguy N., Poorter L., Richards L., Santiago L.,
Sosinski Jr E., Van Bael S., Warton D., Wright I., Wright S., Yamashita N. submitted. Global
patterns of leaf mechanical properties.
Pakeman R.J., Quested H.M. 2007. Sampling plant functional traits: what proportion of the
species need to be sampled? Applied Vegetation Science 10: 91-96.
76
Petchey O.L, Gaston K.J. 2006. Functional diversity: Back to the basics and looking forward.
Ecology Letters 9: 741-758.
Pla L. 2009. Personal communication.
Preparata F.P., Shamos M.I. 1985. Computational geometry: an introduction. Springer-
Verlag, New York, New York, USA.
Rasband W.S. 2008. Image J. US National Institutes of Health, Bethesda, Maryland, USA.
Available online http://rsbweb.nih.gov/ij/index.html.
Stubbs W.J., Wilson J.B. 2004. Evidence for limiting similarity in a sand dune community.
Journal of Ecology 92: 557-567.
Swenson N.G., Enquist B.J., Thompson J., Zimmerman J.K. 2007. The influence of spatial and
size scale on phylogenetic relatedness in tropical forest communities. Ecology 88(7): 1770-
1780.
Tilman D. 1994. Competition and biodiversity in spatially structured habitats. Ecology 75(1):
2-16.
Webb C.O., Ackerly D.D., McPeek M.A., Donoghue M.J. 2002. Phylogenies and community
ecology. Annual Review of Ecology and Systematics 33: 475-505.
Weiher E., Keddy P. 1995. The assembly of experimental wetland plant communities. Oikos
73: 323-335.
Wright J.S. 2002. Plant diversity in tropical forests: a review of mechanisms of coexistence.
Oecologia 130: 1-14.
Yu D.W., Wilson H.B. 2001. The competition-colonization trade-off is dead; Long live the
competition-colonization trade-off. The American Naturalist 158(1): 49-63.
Zermeño-Hernández I.E. 2008. Evaluación del disturbio ecológico provocado por diferentes
tipos de uso agrícola del suelo en una región tropical húmeda. Tesis maestra en ciencias
biológicas. Universidad Nacional Autónoma de México.