Embed Size (px)
Citation preview

AMC Rating : AM2 by JCR-VIS
FUND MANAGER’S REPORTMay 2017
Risk Disclaimer: This publication is for informational purposes only and nothing herein should be construed as asolicitation, recommendation or an offer to buy or sell any fund. All investments in mutual funds are subject to marketrisks. Past performance is not necessarily indicative of future results. Please read the Offering document to understandthe investment policies and risk involved.

EQUITY MARKET REIVEWMay 2017 marked a historic event as Pakistan was formally reclassified as anEmerging Market. The KSE100 index posted an increase of 2.6% M/M (thoughthe market gained 6.3% in the first 2wks before profit taking and higherunexpected outflows led to the market shedding 3.4% in the last 2wks). In USDterms KSE100 Index returned 2.5%; underperforming both MSCI EmergingMarket (2.6% M/M) and Frontier Market (3.6% M/M) indices. Market participationhowever, was on the higher side with average volumes increasing by 22% M/Mas the FY18 federal budget announcment, and rebalancing of MSCI EM Indexkept investor interest at a high. During the month the E&P (increased flowsdespite flattish oil prices) and Steel (anti-dumping duty) sectors were the primeoutperformers, whereas the Cement sector underperformed amid rumours of arift between the Cement manufacturers. Net FIPI outflow clocked in at USD141mn during the month and net selling was witnessed in cements USD 49 mn,Banks USD 34 mn, and Fertilizer with USD 25mn. On the local front, Individualsand mutual funds were major buyers with net buying of USD 73 mn and USD47mn respectively. Going forward, in the near term we believe foreign flows anduncertainty over the outcome of the JIT would continue to direct the markettrajectory. However, in the LT the combination of cheaper valuations and agrowing economy should continue to attract investors.
Risk Disclaimer: This publication is for informational purposes only and nothing herein should be construed as a solicitation, recommendation or an offer to buy or sell any fund. All investments inmutual funds are subject to market risks. Past performance is not necessarily indicative of future results. Please read the Offering Document to understand the investment policies and risksinvolved including risk disclosure for special feature.
Capital Markets Review May 2017
ECONOMIC REVIEW
CPI inflation during May’17 clocked in at 5.02% YoY compared to April’17number of 4.8% YoY. This is the first time in two and a half years that CPI hascrossed 5% mark. Current account deficit is worsening where it reached USD7.2bn (2.7% of GDP) compared to USD 2.4bn (1.0% of GDP) during 10MFY17,up by 2x YoY. On export front, government has announced PKR 180bn exportpackage in the form of rebates and import duties on raw material and machineimports mainly for textiles. However, despite all measures, exports failed toshow any spark due to slowdown in European demand and overvaluedcurrency, we believe. Recent SBP’s reserve numbers show MTD increase ofUSD 860mn to reach USD 16.9bn (USD 21.7bn total reserves) which as pernews sources financed through international creditors. Worker’s remittancesremained lackluster as it declined 2.8% YoY to reach USD 15.6bn during FYTD.FDI increased, but at slower pace to USD 1.6bn, up by 8% YoY during10MFY17. On fiscal side, budget deficit during 9MFY17 recorded at 3.9% ofGDP owning to dull revenue collection and heavy expenditure which is expectedto reach 4.2% of GDP for FY17. Due the multi-year low policy rate (5.75%), LSMgrowth managed to grew by 5.1% in 9MFY17, while the government is targeting6% growth next year. Keeping in view of the aforementioned factors, SBP in itsrecent MPS, decided to keep the policy rate unchanged. Given thecommencement of an election year, the government is expected to expeditevarious PSDP projects thus propelling GDP growth higher in the year ahead.
MONEY MARKET REVIEWDuring the month of May’17, SBP conducted T-bill auctions twice with acumulative target of PKR 750.00bn against maturity of PKR 718.13bn.Cumulative participation in the auctions was PKR 816.48bn (face value) withmajor amount accepted in the 3M tenor. Total amount accepted was PKR709.97bn (excluding non-competitive bids). The cut-off yields in the last auctionwere 5.9910%, 6.0109% and 6.0499% for 3, 6 and 12Months T-Billsrespectively. SBP conducted a PIB auction on May 17, 2017 with a target ofPKR 50bn against the maturity of PKR 1.96bn. Cumulative participation of PKR81.68bn was received in 3Y, 5Y and 10Y tenors. Participation in the 3Y PIBsattracted 67% of the participation followed by 5Y and 10Y which attracted 22%and 11% respectively of the entire participation. No bids were received in the20Y tenor. Out of the received bids, total accepted amount was PKR 38.93bn. Inthe next two months, total maturing amount of PIBs (principal + coupon) is PKR696.38bn (with PKR 689.55bn due alone in July’17).
The short-term secondary market yields (3M, 6M) increased by 1bps each whilefor longer tenor bonds (5Y, 10Y) PKRV increased by 1bps and decreased by3bps respectively. Going forward, inflation is likely to increase albeit at a modestpace while mounting concerns on the external account are likely to be mitigatedvia stopgap measures. Thus, we do not foresee any major shift in the monetarypolicy stance till the end of current calendar year.
0.94
0.96
0.98
1
1.02
1.04
1.06
1.08
Relative Performance
KSE100 Index MSCI EM Index MSCI FM Index
-8.20%
-5.50%
-2.20%
0.10%
-2.10%
-1.10% -1.30%-1.00%-1.20%
-1.00%
-2.70%
-9%
-8%
-7%
-6%
-5%
-4%
-3%
-2%
-1%
0%
1%
FY08
FY09
FY10
FY11
FY12
FY13
FY14
FY15
FY16
10M
FY16
10M
FY17
Current Account Deficit as a % of GDP
5.80
6.30
6.80
7.30
7.80
8.30
8.80
1M 2M 3M 4M 6M 9M 1Y 2Y 3Y 4Y 5Y 6Y 7Y 8Y 9Y 10Y
Yield Curve
May-17 Apr-17 Dec-16

Conventional Funds

MAY 2017
Net Assets PKR 4,367 mn May-17 Apr-17NAV PKR 107.3184 Cash 33.70% 67.69%Launch Date 12-Jul-10 Placements with Banks & DFIs 16.38% 5.28%Management Fee 1.00% p.a T-Bills 47.52% 8.69%
Expense Ratio without Levies 1.11% Commercial Paper 2.18% 0.00%Expense Ratio with Levies 1.35% PIBs 0.00% 17.80%Listing Pakistan Stock Exchange Others Including receivables 0.21% 0.54%Trustee Central Depository Co. of PakistanAuditor Deloitte Yousuf Adil Pakistan FUND RETURNS (%)* HBL MMF* BENCHMARKBenchmark 70% 3M PKRV & 30% 3M Deposits Annualized Return Since Inception 11.28% 7.83%
Rate of 3 AA and above rated Banks Year to Date Annualized Return 6.19% 5.26%Type Open End Calendar Year to Date Annualized Return 7.75% 5.27%Category Money Market Scheme 1 Month Annualized Return 4.91% 5.23%Front end Load Nil 3 Month Annualized Return 4.84% 5.27%Back end Load Nil 6 Month Annualized Return 7.30% 5.27%AMC Rating AM2 ( JCR VIS) 30-Dec-16 1 Year Annualized Return 6.11% 5.28%Dealing Days Monday-FridayCut off time 9:00 AM-3:00 PMPrice Mechanism Forward PricingFund Stability Rating AA(f) (JCR VIS) 5-Jan-17Leverage Nil
Risk Low
Weighted Average Maturity (Days) 51
Farid Ahmed Khan, CFA Chief Executive OfficerMuhammad Imran Chief Investment OfficerColin Miranda CFA, FRM Acting Head of ResearchTauqir Shamshad Head of Fixed IncomeFaizan Saleem Sr. Fund Manager Fixed Income Noman Ameer Manager Risk
NIL
**Calculated on 12Month trailing data
INVESTMENT OBJECTIVEThe objective of the Fund is to seek high liquidity and comparative return for investors by investing in low risk securities of shorter duration and maturity.
FUND MANAGER'S COMMENTSDuring the month, the fund size decreased to PKR 4,367mn from PKR 4,559mn in April'17. The fund earned an annualized return of 4.91% for the month againstthe benchmark return of 5.23%. The overall weighted average time to maturity stood at 51 days compared to 27 days in April. During the month the fund tookexposure in short maturity T-Bills and placements with Banks & DFIs against bank rate maturities. Going ahead, we intend to place TDRs with banks in order toboost portfolio returns.
FUND INFORMATION ASSET ALLOCATION (% of Total Assets)
Mutual Fund Association of Pakistan (MUFAP) Recommended Format*Funds returns computed on NAV to NAV with the dividend reinvestment (excluding sales load)
Risk Disclaimer: This publication is for informational purposes only and nothing herein should be construed as a solicitation, recommendation or an offer to buy or sell any fund. All investments in mutual funds are subject to market risks. Past performance is not necessarily indicative of future results. Please read the Offering Document to understand the investment policies and risks involved risk disclosure for special feature.
The scheme has maintained provisions against Sindh Worker Welfare Fund'sliability to the tune of PKR 8.112 mn if the same were not made, the NAV perunit would be higher by PKR.0.20/0.19%. For details, investors are advised toread the Note 5.3 of the latest financial statements of the scheme.
ASSET QUALITY (% Total Assets)
INVESTMENT COMMITTEE
HBL MONEY MARKET FUND vs BENCHMARK (MoM Returns) WEIGHTED AVERAGE MATURITY (DAYS)
NON-COMPLIANT INVESTMENTS PROVISION AGAINST WWF
AA, 2.19%
AA+, 8.34%
AAA, 41.74%
Others, 0.21%
Government Securities,
47.52%
Non Rated, 0.00%
1
63
99
160
Cash
T-Bill
Placements with Banks & DFIs
Commercial Paper
0.0%
2.0%
4.0%
6.0%
8.0%
10.0%
12.0%
14.0%
16.0%
18.0%
20.0%
Jun-
16
Jul-1
6
Aug
-16
Sep
-16
Oct
-16
Nov
-16
Dec
-16
Jan-
17
Feb
-17
Mar
-17
Apr
-17
May
-17
HBL MMF Benchmark

MAY 2017
Net Assets PKR 6,131 million May-17 Apr-17NAV PKR 105.7332 Cash 32.41% 82.53%Launch Date 14-Dec-10 T-Bills 49.67% 9.25%Management Fee 0.5%p.a. Commercial Paper 1.57% 0.00%Expense Ratio without Levies 0.66% Placements with Banks & DFIs 16.07% 7.49%Expense Ratio with Levies 0.94% Others Including receivables 0.29% 0.73%Listing Pakistan Stock ExchangeTrustee Central Depository Co. of PakistanAuditor Delloite Yousuf Adil Pakistan FUND RETURNS * HBL CF BENCHMARKBenchmark 70% 3M PKRV+30% 3M Avg. Deposit Annualized Return Since Inception 11.25% 7.08%
Rate of 3 AA rated Banks as per Mufap Year to Date Annualized Return 5.60% 4.98%Type Open End Calendar Year to Date Annualized Return 5.82% 5.27%Category Money Market Scheme 1 Month Annualized Return 4.87% 5.23%Front end Load Up to 1% 3 Month Annualized Return 5.31% 5.27%Back end Load Nil 6 Month Annualized Return 5.81% 5.27%AMC Rating AM2 (JCR VIS) 30-Dec-16 1 Year Annualized Return 5.76% 4.95%Dealing Days Monday-FridayCut off time 9:00 AM-4:00 PMPrice Mechanism Backward PricingFund Stability Rating AA(f) (JCR VIS) 05-Jan-17Leverage NilRisk LowWeighted Average Maturity (Days) 51
Farid Ahmed Khan, CFA Chief Executive OfficerMuhammad Imran Chief Investment OfficerTauqir Shamshad Head of Fixed IncomeFaizan Saleem Sr. Fund Manager Fixed IncomeColin Miranda, CFA, FRM Acting Head of ResearchNoman Ameer Manager Risk
NIL
INVESTMENT OBJECTIVEThe investment objective of the Fund is to provide competitive returns to its investors through active investments in low risk portfolio of short duration, whilemaintaining high liquidity. The Fund will aim to maximize returns through efficient utilization of investment and liquidity management tools.
FUND MANAGER'S COMMENTSDuring the month of May, the Fund size increased to PKR 6,131mn from PKR 5,314mn in Apr'17. The Fund earned an annualized return of 4.87% for themonth against the benchmark of 5.23%. The overall weighted average time to maturity stood at 51 days against 9 days in the previous month. Cash placedwith banks reduced during the period and the amount was deployed in T-bills and Placements.
FUND INFORMATION ASSET ALLOCATION (% of Total Assets)
The scheme has maintained provisions against SINDH WWF liability to thetune of Rs 7,121,417 if the same were not made the NAV per unit/return ofthe scheme would be higher by Re 0.1228/0.13% (YTD). For details,investors are advised to read the Note 7.2 of the latest financial statementsof the scheme.
**Calculated on 12Month trailing data
Risk Disclaimer: This publication is for informational purposes only and nothing herein should be construed as a solicitation, recommendation or an offer to buy or sell any fund. All investments in mutualfunds are subject to market risks. Past performance is not necessarily indicative of future results. Please read the Offering Document to understand the investment policies and risks involved including riskdisclosure for special feature.
ASSET QUALITY (% Total Assets)
INVESTMENT COMMITTEE
HBL CASH FUND vs BENCHMARK (MoM Returns) WEIGHTED AVERAGE MATURITY
NON-COMPLIANT INVESTMENTS PROVISION AGAINST WWF
Mutual Fund Association of Pakistan (MUFAP) Recommended Format*Funds returns computed on NAV to NAV with the dividend reinvestment (excluding sales load)
1
64
102
160
Cash
T-bills
Placements with Banks & DFIs
Commercial Paper
0.0%
1.0%
2.0%
3.0%
4.0%
5.0%
6.0%
7.0%
8.0%
9.0%
Jun-
16
Jul-1
6
Aug
-16
Sep
-16
Oct
-16
No
v-1
6
De
c-1
6
Jan-
17
Fe
b-17
Ma
r-17
Apr
-17
Ma
y-1
7
HBL CF Benchmark
Government Securities49.67%
AAA40.74%
AA+7.64%
AA1.61%
Others / Non Rated0.34%

MAY 2017
Net Assets PKR 6,198 mn May-17 Apr-17NAV PKR 110.5713 Cash 43.16% 52.74%Launch Date 15-Mar-07 Placement with Banks & DFI 8.37% 10.83%Management Fee 1.5% p.a TFCs 23.59% 23.44%Expense Ratio without Levies 1.57% PIBs 0.00% 0.00%Expense Ratio with Levies 1.87% T-Bills 0.00% 0.00%Listing Pakistan Stock Exchange Spread Transaction 22.03% 8.01%Trustee Central Depository Co. of Pakistan Commercial Paper 2.14% 0.58%Auditor Deloitte Yousuf Adil Pakistan Others Including receivables 0.70% 4.41%Benchmark 6 Month KIBORType Open End FUND RETURNS * HBL IF* BENCHMARKCategory Income Scheme Annualized Return Since Inception 14.65% 10.45%Front end Load 1.50% Year to Date Annualized Return 4.60% 6.10%Back end Load Nil Calendar Year to Date Annualized Return 5.37% 6.14%AMC Rating AM2 ( JCRVIS) 12/30/2016 1 Month Annualized Return 5.60% 6.15%Dealing Days Monday-Friday 3 Month Annualized Return 4.70% 6.15%Cut off time 9:00 AM-3:00 PM 6 Month Annualized Return 5.21% 6.14%Price Mechanism Forward Pricing 1 Year Annualized Return 4.62% 6.10%Fund Stability Rating A(f) (JCR VIS) 1/11/2017Leverage NilWeighted Average Maturity (Days) 607Risk Moderate
Farid Ahmed Khan, CFA Chief Executive OfficerMuhammad Imran Chief Investment OfficerColin Miranda, CFA, FRM Acting Head of ResearchTauqir Shamshad Head of Fixed IncomeFaizan Saleem Sr.Fund Manager Fixed Income Noman Ameer Manager Risk
**Calculated on 12Month trailing data
PROVISION AGAINST WWF
*Funds returns computed on NAV to NAV with the dividend reinvestment (excluding sales load)
Risk Disclaimer: This publication is for informational purposes only and nothing herein should be construed as a solicitation, recommendation or an offer to buy or sell any fund. All investments in mutual funds are subject to market risks. Past performance is not necessarily indicative of future results. Please read the Offering Document to understand the investment policies and risks involved risk disclosure for special feature.
The scheme has maintained provisions against Sindh WWF liability to thetune of PKR 18.25 mn if the same were not made, the NAV per unit wouldbe higher by PKR 0.33/0.29%. For details, investors are advised to readthe Note 8.2of the latest financial statements of the scheme.
The scheme holds certain non-compliant investments. Before making any investment decision, investors should review this document and latest financial statements.
INVESTMENT OBJECTIVEThe objective of the Fund is to provide a stable stream of income with moderate level of risk by investing in fixed income securities.
FUND MANAGER'S COMMENTSDuring the month of May, the fund size decreased to PKR 6,198mn from PKR 6,405mn in Apr'17.The fund earned an annualized return of 5.60% against thebenchmark return of 6.15%. During the month the excess liquidity were deployed in spread transactions which were offering better yields. The overallweighted average time to maturity stood at 607 days against 535 days in Apr'17.
FUND INFORMATION ASSET ALLOCATION (% of Total Assets)
ASSET QUALITY (% Total Assets)
INVESTMENT COMMITTEE
HBL INCOME FUND vs BENCHMARK (MoM Returns) TOP TEN HOLDINGS TFCs (% of Total Assets)
Mutual Fund Association of Pakistan (MUFAP) Recommended Format
NON-COMPLIANT INVESTMENTS
1.45%
1.80%
1.85%
3.11%
3.49%
3.69%
3.87%
4.33%
Fatima Fertilizer Co. Ltd.
Bank Al Habib
Ghani Gases Limited
WAPDA
NIB Bank Ltd.
JS Bank Ltd.
The Bank of Punjab
Habib Bank Ltd.
others , 0.70% AA+, 0.0020%AA, 3.25%
AAA, 14.29%
AA-, 50.10%
A+, 9.63%
Non Rated , 22.03%
0.0%
1.0%
2.0%
3.0%
4.0%
5.0%
6.0%
7.0%
8.0%
Jun-
16
Jul-1
6
Aug
-16
Sep
-16
Oct
-16
No
v-1
6
De
c-1
6
Jan-
17
Fe
b-17
Ma
r-17
Apr
-17
Ma
y-1
7
HBL IF BENCHMARK
MAY 2017
Net Assets PKR 1,573 million May-17 Apr-17NAV PKR 110.5109 Cash 7.61% 5.70%Launch Date 24-Jul-10 Placement with Banks & DFI 14.98% 19.03%Management Fee 1.25%p.a. TFCs 0.00% 0.00%Expense Ratio without Levies 1.83% PIBs 38.00% 5.94%Expense Ratio with Levies 1.53% T-Bills 30.78% 68.32%Listing Pakistan Stock Exchange MTS / Spread Transactions 7.26% 0.33%Trustee Central Depository Co. of Pakistan Others Including receivables 1.37% 0.68%Auditor Deloitte Yousuf Adil PakistanBenchmark 6 Month PKRV RatesType Open End FUND RETURNS * HBL GSF BENCHMARKCategory Sovereign Income Scheme Annualized Return Since Inception 12.71% 9.36%Front end Load Up to 2% Year to Date Annualized Return 5.49% 5.86%Back end Load Nil Calendar Year to Date Annualized Return 6.31% 5.93%AMC Rating AM2 (JCR VIS) 30-Dec-16 1 Month Annualized Return 4.95% 6.00%Dealing Days Monday-Friday 3 Month Annualized Return 5.34% 5.96%Cut off time 9:00 AM-4:00 PM 6 Month Annualized Return 6.13% 5.92%Price Mechanism Forward Pricing 1 Year Annualized Return 5.76% 5.86%Fund Stability Rating A(f) (JCR VIS) 05-Jan-17Leverage NilRisk ModerateWeighted Average Maturity (Days) 399
Farid Ahmed Khan, CFA Chief Executive OfficerMuhammad Imran Chief Investment OfficerTauqir Shamshad Head of Fixed IncomeFaizan Saleem Sr. Fund Manager Fixed IncomeColin Miranda, CFA, FRM Acting Head of ResearchNoman Ameer Manager Risk
**Calculated on 12Month trailing data
Risk Disclaimer: This publication is for informational purposes only and nothing herein should be construed as a solicitation, recommendation or an offer to buy or sell any fund. All investments in mutualfunds are subject to market risks. Past performance is not necessarily indicative of future results. Please read the Offering Document to understand the investment policies and risks involved including riskdisclosure for special feature.
ASSET QUALITY (% Total Assets)
INVESTMENT COMMITTEE
HBL GOVT. SECURITIES FUND vs. BENCHMARK (MoM Returns) WEIGHTED AVERAGE MATURITY (DAYS)
NON-COMPLIANT INVESTMENTS
Mutual Fund Association of Pakistan (MUFAP) Recommended Format*Funds returns computed on NAV to NAV with the dividend reinvestment (excluding sales load)
PROVISION AGAINST WWF
The scheme has maintained provisions against SINDH WWF liability to thetune of Rs 5,678,763 if the same were not made the NAV per unit/return ofthe scheme would be higher by Re 0.3989 /0.41% (YTD). For details,investors are advised to read the Note 7.2 of the latest financial statementsof the scheme.
The scheme holds certain non-compliant investments. Before making any investment decision, investors should review this document and latest financial statements.
INVESTMENT OBJECTIVEThe investment objective of the Fund is to provide consistent returns to its investors through active investments in a blend of short, medium and long termsecurities issued and / or guaranteed by Government of Pakistan. The Fund will aim to provide superior risk adjusted returns through active duration andliquidity management tools.FUND MANAGER'S COMMENTSDuring the month of May, the Fund size decreased to PKR 1,573mn from PKR 1,682mn in Apr'17. The Fund earned an annualized return of 4.95% for themonth against the benchmark of 6.00%. The Fund Manager increased exposure in medium duration Government Bonds and the exposure was trimmed fromshorter duration T-bills to keep a check on the overall duration of the Fund. The overall weighted average time to maturity stood at 399 days against 121 daysin Apr'17.
FUND INFORMATION ASSET ALLOCATION (% of Total Assets)
1
30
48
115
942
Cash
MTS / Spread Transactions
T-bills
Placement with Banks & DFI
PIBs
Government Securities, 68.78%
AAA, 7.26%
AA+, 0.03%
AA‐, 15.30%
Others / Non Rated, 8.63%
0.0%
1.0%
2.0%
3.0%
4.0%
5.0%
6.0%
7.0%
8.0%
9.0%
10.0%
Jun-
16
Jul-1
6
Aug
-16
Sep
-16
Oct
-16
No
v-1
6
De
c-1
6
Jan-
17
Fe
b-17
Ma
r-17
Apr
-17
Ma
y-1
7
HBLGSF Benchmark

MAY 2017
Net Assets (mln) PKR 1,001.59 May-17 Apr-17NAV PKR 123.4376 Cash 18.38% 20.28%Launch Date 14-Dec-07 Placement with Banks & DFIs 4.92% 5.05%Management Fee 2.0% p.a. TFCs 6.74% 6.92%Expense Ratio without Levies 2.18% PIBs 0.00% 0.00%Expense Ratio with Levies 2.71% T-Bills 0.00% 0.00%Listing Pakistan Stock Exchange Stock/Equities 67.11% 66.10%Trustee Central Depository Co. of Pakistan Others Including Receivables 2.85% 1.66%Auditor Deloitte Yousuf Adil PakistanBenchmark Weighted average daily return of FUND RETURNS * HBL MAF* BENCHMARK
KSE100 and 6M average PKRV rates based on Cumulative Return Since Inception 234.42% 176.85%the actual proportion of investment in Equity and Calendar Year to Date Return (Cumulative) 8.95% 4.75%
Fixed Income/Money Market component Year to Date Return (Cumulative) 25.90% 22.55%Type Open End 1 Month Cumulative Return 2.94% 1.98%Category Balanced Scheme 3 Month Cumulative Return 6.11% 3.35%Front end Load 2.00% 6 Month Cumulative Return 17.30% 13.49%Back end Load Nil 1 Year Cumulative Return 30.77% 25.72%AMC Rating AM2 (JCR VIS) 30-Dec-16 3 Year Cumulative Return 37.42% 46.63%Dealing Days Monday-Friday 5 Year Cumulative Return 138.64% 131.07%Cut-off time 9:00 AM-3:00 PM Standard Deviation** 10.56% 8.73%Price Mechanism Forward PricingLeverage NilRisk Moderate to High
Farid Ahmed Khan, CFA Chief Executive OfficerMuhammad Imran Chief Investment OfficerColin Miranda, CFA, FRM Acting Head of Research Tauqir Shamshad Head of Fixed IncomeJawad Naeem Fund Manager - EquityAdeel Abdul Wahab Fund Manager - EquityFaizan Saleem Sr.Fund Manager Fixed Income May-17 Apr-17Noman Ameer Manager Risk Commercial Banks 8.98% 10.15%
Cement 8.39% 9.73%Oil & Gas Exploration Companies 8.16% 6.78%Oil & Gas Marketing Companies 6.03% 6.22%Automobile Assemblers 5.69% 5.78%Others 29.86% 27.44%
**Calculated on 12Month trailing data.
NON-COMPLIANT INVESTMENTS PROVISION AGAINST WWF
INVESTMENT OBJECTIVEThe objective of the Fund is to provide long-term capital growth and income by investing in multiple asset classes such as equity, equity-relatedinstruments, fixed-income securities, continuous funding system, derivatives, money market instruments, etc.
FUND MANAGER'S COMMENTSIn the month of May’17 the fund posted a return of 2.94% vs. benchmark return of 1.98%, an outperformance of 96bps. During the month, the focuswas mainly towards profit taking in MSCI related stocks. Major contribution to performance came from holdings in MSCI centric scripts i.e. HBL, UBL,MCB, OGDC, LUCK & ENGRO. At the end of the month, the fund was invested in equities up to 67.11%.
FUND INFORMATION ASSET ALLOCATION (% of Total Assets)
ASSET QUALITY (% Total Assets)
INVESTMENT COMMITTEE
HBL MULTI ASSET FUND vs. BENCHMARK (12M Rolling Returns) TOP TEN HOLDINGS (Equities)
SECTOR ALLOCATION (% of Total Assets)
TOP TEN HOLDINGS (TFCs/Sukuks)
The scheme has maintained provision against Sindh WWF liability tothe tune of PKR 4.527mn, if the same were not made the NAV per unitwould be higher by Rs. 0.56/0.45%. For details, investors are advisedto read the Note 8.2 of the latest financial statements of the scheme.
The scheme holds certain non-compliant investments. Before making any investment decision, investors should review this document and latest financial statements.
*Funds returns computed on NAV to NAV with the dividend reinvestment (excluding sales load)
Risk Disclaimer: This publication is for informational purposes only and nothing herein should be construed as a solicitation, recommendation or an offer to buy or sell any fund. All investments inmutual funds are subject to market risks. Past performance is not necessarily indicative of future results. Please read the Offering Document to understand the investment policies and risks involvedincluding risk disclosure for special feature.
Mutual Fund Association of Pakistan (MUFAP) Recommended Format
2.38%
2.39%
2.45%
2.55%
2.82%
2.84%
2.92%
3.31%
3.37%
3.66%
MCB Bank Ltd
D G Khan Cement Co.Ltd.
Sui Northern Gas Pipeline Ltd
United Bank Limited
Habib Bank Ltd
Lucky Cement Ltd
Mari Petroleum Company Ltd
Engro Corporation Ltd
Oil & Gas Development Co Ltd
Hub Power Company Ltd
Non‐Rated 67.89%
AAA 8.34%
AA 1.74%
AA‐ 17.23%
A+ 4.80%
1.79%
4.95%
Bank Of Punjab TFC (23-Dec-2016)
JS Bank TFC (14-Dec-2016)
Dewan Cement Ltd. TFC 25.00 25.00 - 0.00% 0.00%
Saudi Pak Leasing Company Ltd. TFC 15.20 15.20 - 0.00% 0.00%
% of Gross Assets
Name of Non-Compliant Investment (mn)
Type of Investment
Value before Provision (PKR mn)
Provision Held
(PKR mn)
Value of Investment after Provision
(PKR mn)
% of Net Assets

May 2017
Net Assets (mln) PKR 6,573.63 May-17 Apr-17NAV PKR 139.7387 Cash 8.41% 8.40%Launch Date 29-Aug-07 Stock / Equities 88.99% 90.32%Management Fee 2.0% p.a. T-Bills 0.00% 0.00%Expense Ratio with Levies 2.70% Others Including Receivables 2.60% 1.28%Expense Ratio without Levies 2.16%Selling & Marketing expense 0.12%Listing Pakistan Stock ExchangeTrustee Central Depository Co. of Pakistan May-17 Apr-17Auditor Deloitte Yousuf Adil Pakistan Commercial Banks 14.87% 17.24%Benchmark KSE30 (Total Return) Index Cement 13.31% 14.33%Type Open End Oil & Gas Exploration Companies 12.75% 12.67%Category Equity Scheme Oil & Gas Marketing Companies 9.02% 7.74%Front end Load 2.50% Power Generation & Distribution 6.79% 6.40%Back end Load Nil Others 32.25% 31.94%AMC Rating AM2 (JCR VIS) 30-Dec-16Dealing Days Monday-FridayCut-off time 9:00 AM-3:00 PMPrice Mechanism Forward Pricing FUND RETURNS * HBL SF BENCHMARKLeverage Nil Cumulative Return Since Inception 279.76% 318.14%Risk High Calendar Year to Date Return (Cumulative) 9.52% 5.19%
Year to Date Return (Cumulative) 34.78% 32.34%INVESTMENT COMMITTEE 1 Month Cumulative Return 3.94% 3.04%Farid Ahmed Khan, CFA Chief Executive Officer 3 Month Cumulative Return 6.60% 3.11%Muhammad Imran Chief Investment Officer 6 Month Cumulative Return 21.72% 19.90%Colin Miranda, CFA, FRM Acting Head of Research 1 Year Cumulative Return 38.38% 38.66%Jawad Naeem Fund Manager - Equity 3 Year Cumulative Return 45.06% 68.14%Adeel Abdul Wahab Fund Manager - Equity 5 Year Cumulative Return 174.80% 262.68%Noman Ameer Manager Risk Standard Deviation** 13.39% 14.55%
Name of Non-Compliant Investment Dewan Cement LimitedType of Investment TFCValue before provision 25.00Provision Held 25.00
% of Net Assets 0.00
**Calculated on 12Month trailing data
The scheme has maintained provision against Sindh WWF liability to thetune of PKR 33.285mn, if the same were not made the NAV per unit wouldbe higher by Rs. 0.71/0.51%. For details, investors are advised to read theNote 9 of the latest financial statements of the scheme.
The equity scheme holds certain non-compliant investments. Before making any investment decision, investors should review this document and latest financial statements.
Risk Disclaimer: This publication is for informational purposes only and nothing herein should be construed as a solicitation, recommendation or an offer to buy or sell any fund. All investments in mutualfunds are subject to market risks. Past performance is not necessarily indicative of future results. Please read the Offering Document to understand the investment policies and risks involved including riskdisclosure for special feature.
*Funds returns computed on NAV to NAV with the dividend reinvestment (excluding sales load) Mutual Fund Association of Pakistan (MUFAP) Recommended Format
SECTOR ALLOCATION (% of Total Assets)
HBL STOCK FUND vs. BENCHMARK (12M Rolling Returns) TOP TEN HOLDINGS (% of Total Assets)
NON-COMPLIANT INVESTMENTS PROVISION AGAINST WWF
INVESTMENT OBJECTIVEThe objective of the Fund is to provide long-term capital growth by investing primarily in a diversified pool of equities and equity-related instruments.
FUND MANAGER'S COMMENTSIn the month of May’17 the fund posted a return of 3.94% vs. benchmark return of 3.04%, an outperformance of 90bps. During the month, the focus wasmainly towards profit taking in MSCI related stocks therefore allocation was primarily shifted from Commercial Banks and Cements sector into Oil & GasMarketing companies. Major contribution to performance came from holdings in MSCI centric scripts i.e. HBL, UBL, MCB, OGDC, LUCK & ENGRO. At theend of the month, the fund was invested in equities up to 88.99%.
FUND INFORMATION ASSET ALLOCATION (% of Total Assets)
3.62%
3.90%
3.97%
4.20%
4.46%
4.53%
4.63%
4.66%
4.93%
5.07%
Sui Northern Gas Pipeline Ltd
D G Khan Cement Co.Ltd.
MCB Bank Ltd
Mari Petroleum Company Ltd
Habib Bank Ltd
Oil & Gas Development Co Ltd
Engro Corporation Ltd
United Bank Limited
Lucky Cement Ltd
Hub Power Company Ltd
0.00%
10.00%
20.00%
30.00%
40.00%
50.00%
60.00%
Jun-
16
Jul-1
6
Aug
-16
Sep
-16
Oct
-16
Nov
-16
Dec
-16
Jan-
17
Feb
-17
Mar
-17
Apr
-17
May
-17
Benchmark HBL SF

MAY 2017
Net Assets (mln) PKR 978.23 May-17 Apr-17NAV PKR 17.7143 Cash 8.66% 8.66%Launch Date *** 25-Jun-13 Stock / Equities 90.47% 90.26%Management Fee 2% p.a Others Including Receivables 0.87% 1.08%Expense Ratio with Levies 3.66%Expense Ratio without Levies 2.58%Selling & Marketing expense 0.11%Listing Pakistan Stock Exchange Trustee Central Depository Co. of Pakistan May-17 Apr-17Auditor Deloitte Yousuf Adil Pakistan Oil & Gas Marketing Companies 36.62% 33.82%Benchmark KSE 30 (Total Return) Oil & Gas Exploration Companies 31.40% 29.52%Type Open End Power Generation & Distribution 15.85% 20.03%Category Equity Scheme Refinery 6.61% 6.90%Front end Load Up to 2.00%Back end Load NilAMC Rating AM2 (JCRVIS) 30/12/2016Dealing Days Monday-FridayCut off time 9:00 AM-4:00 PMPrice Mechanism Forward Pricing FUND RETURNS * HBL EF BENCHMARKLeverage Nil Cumulative Return Since Inception 93.11% 136.86%Risk High Calendar Year to Date Return (Cumulative) 13.07% 5.19%
Year to Date Return (Cumulative) 47.47% 32.34%INVESTMENT COMMITTEE 1 Month Cumulative Return 6.40% 3.04%Farid Ahmed Khan, CFA Chief Executive Officer 3 Month Cumulative Return 9.46% 3.11%Muhammad Imran Chief Investment Officer 6 Month Cumulative Return 26.18% 19.90%Colin Miranda, CFA, FRM Acting Head of Research 1 Year Cumulative Return 50.37% 38.66%Jawad Naeem Fund Manager- Equity 3 Year Cumulative Return 53.71% 68.14%Adeel Abdul Wahab Fund Manager- Equity Standard Deviation** 11.86% 14.55%Noman Ameer Manager Risk
NIL
*Funds returns computed on NAV to NAV with the dividend reinvestment (excluding sales load)
**Calculated on 12Month trailing data
***Conversion from Closed-end to open end fund
INVESTMENT OBJECTIVEThe objective is to invest in securities defined in the energy sector to provide investors access to high quality blue chip stocks in the Energy sector.
FUND MANAGER'S COMMENTSThe fund posted a return of 6.40% during the month outperforming the benchmark by 3.36%. The benchmark KSE-30 (Total Return) Index increased by3.04% M/M during May’17 (vs. an increase of 2.04% M/M in Apr’17) as enthusiasm related to the MSCI EM upgrade and Federal Budget drove themarket to an all time high during the month. During the month, we booked gains in the Power Generation & Distribution sector while increasing exposureto the Oil and Gas Marketing Companies and Oil and Gas Exploration Companies. We expect volumes in the energy chain to improve on the back ofincreased volatility in International Crude prices. At the end of the month your fund was 90.47% invested in equities.
FUND INFORMATION ASSET ALLOCATION (% of Total Assets)
Mutual Fund Association of Pakistan (MUFAP) Recommended Format
Risk Disclaimer: This publication is for informational purposes only and nothing herein should be construed as a solicitation, recommendation or an offer to buy or sell any fund. All investments inmutual funds are subject to market risks. Past performance is not necessarily indicative of future results. Please read the Offering Document to understand the investment policies and risks involvedincluding risk disclosure for special feature.
SECTOR ALLOCATION (% of Total Assets)
HBL ENERGY FUND vs BENCHMARK (12M Rolling Returns) TOP TEN HOLDINGS
NON-COMPLIANT INVESTMENTS PROVISION AGAINST WWFThe scheme has maintained provisions against SINDH WWF liability to thetune of Re 7,522,266 if the same were not made the NAV per unit/return ofthe scheme would be higher by Re 0.1362 /1.13% (YTD). For details,investors are advised to read the Note 7.2 of the latest financial statementsof the scheme.
4.97%
5.25%
5.26%
7.07%
7.62%
7.95%
8.37%
8.77%
9.00%
12.05%
Kot Addu Power Company Limited
Attock Petroleum Limited
Pakistan Petroleum Limited
Shell Pakistan Limited
Pakistan State Oil Company Limited
Hub Power Company Limited
Pakistan Oilfields Limited
Oil and Gas Development Company Ltd
Mari Petroleum Company Limited
Sui Northern Gas Pipelines Limited
0.00%
10.00%
20.00%
30.00%
40.00%
50.00%
60.00%
Jun-
16
Jul-1
6
Aug
-16
Sep
-16
Oct
-16
Nov
-16
Dec
-16
Jan-
17
Feb
-17
Mar
-17
Apr
-17
May
-17
Benchmark HBL EF

May 2017
Net Assets (mln) PKR 558.35 May-17 Apr-17NAV PKR 147.63 Cash 7.67% 13.74%Launch Date 27-Sep-11 Stock / Equities 84.75% 83.22%Management Fee 2% p.a Others Including Receivables 7.58% 3.04%Expense Ratio with Levies 4.51%Expense Ratio without Levies 3.29%Selling & Marketing expense 0.12%Listing Pakistan Stock ExchangeTrustee Central Depository Co. of Pakistan May-17 Apr-17Auditor Deloitte Yousuf Adil Pakistan Commercial Banks 13.23% 15.70%Benchmark KSE 100 Index Cement 12.49% 14.99%Type Open End Oil & Gas Exploration Companies 12.10% 10.33%Category Equity Scheme Oil & Gas Marketing Companies 9.05% 6.34%Front end Load Up to 2.00% Engineering 6.26% 4.83%Back end Load Nil Others 31.63% 31.02%AMC Rating AM2 (JCRVIS) 30/12/2016Dealing Days Monday-FridayCut off time 9:00 AM-4:00 PMPrice Mechanism Forward Pricing FUND RETURNS * HBL EF BENCHMARKLeverage Nil Cumulative Return Since Inception 288.16% 338.73%Risk High Calendar Year to Date Return (Cumulative) 10.74% 5.82%
Year to Date Return (Cumulative) 37.68% 33.90%INVESTMENT COMMITTEE 1 Month Cumulative Return 4.28% 2.62%Farid Ahmed Khan, CFA Chief Executive Officer 3 Month Cumulative Return 6.25% 4.24%Muhammad Imran Chief Investment Officer 6 Month Cumulative Return 22.75% 18.70%Colin Miranda, CFA, FRM Acting Head of Research 1 Year Cumulative Return 37.07% 40.29%Jawad Naeem Fund Manager- Equity 3 Year Cumulative Return 61.45% 70.13%Adeel Abdul Wahab Fund Manager- Equity 5 Year Cumulative Return 240.53% 266.96%Noman Ameer Manager Risk Standard Deviation** 13.54% 13.21%
NIL
*Funds returns computed on NAV to NAV with the dividend reinvestment (excluding sales load)
**Calculated on 12Month trailing data Mutual Fund Association of Pakistan (MUFAP) Recommended Format
Risk Disclaimer: This publication is for informational purposes only and nothing herein should be construed as a solicitation, recommendation or an offer to buy or sell any fund. All investments inmutual funds are subject to market risks. Past performance is not necessarily indicative of future results. Please read the Offering Document to understand the investment policies and risks involvedincluding risk disclosure for special feature.
SECTOR ALLOCATION (% of Total Assets)
HBL EQUITY FUND vs BENCHMARK (12M Rolling Returns) TOP TEN HOLDINGS
NON-COMPLIANT INVESTMENTS PROVISION AGAINST WWFThe scheme has maintained provisions against SINDH WWF liability to thetune of Rs 3,701,480 if the same were not made the NAV per unit/return ofthe scheme would be higher by Re 0.9787/0.91% (YTD). For details,investors are advised to read the Note 7.2 of the latest financial statementsof the scheme.
INVESTMENT OBJECTIVEThe fund objective is to provide its investors maximum risk adjusted returns over longer investment horizon by investing in a diversified equity portfoliothat offers both capital gains and dividend income.
FUND MANAGER'S COMMENTSIn the month of May’17 the fund posted a return of 4.28% vs. benchmark return of 2.62%, an outperformance of 166bps. During the month, the focus wasmainly towards profit taking in MSCI related stocks therefore allocation was primarily shifted from Commercial Banks and Cements sector intoEngineering, Oil & Gas Exploration and Oil & Gas Marketing companies. Major contribution to performance came from holdings in MSCI centric scriptsi.e. HBL, UBL, MCB, OGDC, LUCK & ENGRO. At the end of the month, the fund was invested in equities up to 84.75%.
FUND INFORMATION ASSET ALLOCATION (% of Total Assets)
2.82%
3.07%
3.61%
3.65%
3.81%
4.11%
4.12%
4.67%
4.68%
5.06%
Pakistan State Oil Company Ltd
The Searle Company Ltd
Habib Bank Ltd
MCB Bank Ltd
Mari Petroleum Company Ltd
United Bank Limited
Oil & Gas Development Co Ltd
Hub Power Company Ltd
Engro Corporation Ltd
Lucky Cement Ltd
0.00%
10.00%
20.00%
30.00%
40.00%
50.00%
60.00%
Jun-
16
Jul-1
6
Jul-1
6
Aug
-16
Sep
-16
Oct
-16
Nov
-16
Dec
-16
Jan-
17
Feb
-17
Mar
-17
Apr
-17
May
-17
Benchmark HBL EF

MAY 2017
Net Assets (mn) PKR 16548.1 May-17 Apr-17NAV PKR 58.37 Cash 2.63% 2.66%Launch Date 01-Jul-04 Stock / Equities 96.79% 97.04%Management Fee 2% per annum Others Including Receivables 0.58% 0.29%Expense Ratio with Levies 2.69%Expense Ratio without Levies 2.07%Listing Pakistan Stock ExchangeTrustee Central Depository Co. of PakistanAuditor Deloitte Yousuf Adil Pakistan May-17 Apr-17Benchmark KSE 100 Index Oil & Gas Marketing Companies 54.69% 52.92%Type Closed-end Commercial Banks 8.89% 9.98%Category Equity Scheme Cement 8.88% 10.47%AMC Rating AM2 (JCRVIS) 30/12/2016 Oil & Gas Exploration Companies 4.54% 4.26%Dealing Days Monday-Friday Engineering 3.45% 2.67%Leverage Nil Others 16.34% 16.73%Risk High
FUND RETURNS *PGF Total
PGF Frozen
PGF Ex Frozen
Benchmark
Farid Ahmed Khan, CFA Chief Executive Officer Calendar Year to Date Return (Cumulative) 13.83% 19.31% 7.67% 5.82%Muhammad Imran Chief Investment Officer Year to Date Return (Cumulative) 42.25% 45.41% 38.61% 33.90%Colin Miranda, CFA, FRM Acting Head of Research 1 Month Cumulative Return 5.97% 8.66% 2.81% 2.62%Jawad Naeem Fund Manager- Equity 3 Month Cumulative Return 9.08% 12.42% 5.21% 4.24%Adeel Abdul Wahab Fund Manager- Equity 6 Month Cumulative Return 25.96% 31.73% 19.45% 18.70%Noman Ameer Manager Risk 1 Year Cumulative Return 44.05% 45.88% 41.88% 40.29%
3 Year Cumulative Return 41.46% 32.78% 51.08% 70.13%5 Year Cumulative Return 206.48% 248.13% 177.24% 266.96%Standard Deviation** 13.29% 16.48% 13.73% 13.21%
TOP TEN HOLDINGSUnited Bank LimitedSui Northern Gas Pipelines LimitedPioneer Cement LimitedPakistan State Oil Company LimitedOil and Gas Development Company LimitedLucky Cement LimitedHabib Bank LimitedEngro Corporation LimitedCherat Cement Company LimitedBank Al-Falah Limited
NIL
INVESTMENT OBJECTIVETo maximize the wealth of the certificate holders for which investments would be made in the best available opportunities, while considering acceptable riskparameters and applicable rules and regulations.
FUND MANAGER'S COMMENTSThe fund posted a return of 5.97% during the month outperforming the benchmark by 3.36%. The benchmark KSE-100 Index increased by 2.62% M/M duringMay’17 (vs. an increase of 2.38% M/M in Apr’17) as enthusiasm related to the MSCI EM upgrade and Federal Budget drove the market to an all time highduring the month. During the month, exposure was reduced in Commercial Banks and Cements sectors, while increasing exposure to the Engineering sector.We expect market activity to improve with volumes to increase going forward on the back of expected development on some sort of financing product along witha positive outlook in blue chip and growth stocks. At the end of the month your fund was 96.82% invested in equities.
FUND INFORMATION ASSET ALLOCATION (% of Total Assets)
*Funds returns computed on NAV to NAV with the dividend reinvestment (excluding sales load)
**Calculated on 12Month trailing data Mutual Fund Association of Pakistan (MUFAP) Recommended Format
Risk Disclaimer: This publication is for informational purposes only and nothing herein should be construed as a solicitation, recommendation or an offer to buy or sell any fund. All investments in mutual fundsare subject to market risks. Past performance is not necessarily indicative of future results. Please read the Offering Document to understand the investment policies and risks involved including risk disclosurefor special feature.
SECTOR ALLOCATION (% of Total Assets)
INVESTMENT COMMITTEE
PGF vs BENCHMARK (12M Rolling Returns)
NON-COMPLIANT INVESTMENTS PROVISION AGAINST WWFThe scheme has maintained provisions against SINDH WWF liability to the tune of Rs.49,073,559 if the same were not made the NAV per certificate/return of the schemewould be higher by Re.0.17/0.41% (YTD). For details, investors are advised to read theNote 7.1 of the latest financial statements of the scheme.
0.00%
10.00%
20.00%
30.00%
40.00%
50.00%
60.00%
Jun-
16
Jul-1
6
Aug
-16
Sep
-16
Oct
-16
Nov
-16
Dec
-16
Jan-
17
Feb
-17
Mar
-17
Apr
-17
May
-17
Benchmark PGF

MAY 2017
Net Assets (mn) PKR 7108.65 May-17 Apr-17NAV PKR 25.02 Cash 4.24% 4.10%Launch Date 01-Apr-04 Stock / Equities 95.29% 95.50%Management Fee 2% per annum Others Including Receivables 0.47% 0.40%Expense Ratio with Levies 2.79%Expense Ratio without Levies 2.11%Listing Pakistan Stock ExchangeTrustee Central Depository Co. of PakistanAuditor Deloitte Yousuf Adil Pakistan May-17 Apr-17Benchmark KSE 100 Index Oil & Gas Marketing Companies 44.46% 42.63%Type Closed-end Cement 10.68% 12.46%Category Equity Scheme Commercial Banks 10.27% 11.49%AMC Rating AM2 (JCRVIS) 30/12/2016 Oil & Gas Exploration Companies 5.18% 4.81%Dealing Days Monday-Friday Engineering 4.46% 3.47%Leverage Nil Others 20.24% 20.64%Risk High
FUND RETURNS * PIF TotalPIF
FrozenPIF Ex Frozen
Benchmark
Farid Ahmed Khan, CFA Chief Executive Officer Calendar Year to Date Return (Cumulative) 10.95% 15.63% 7.38% 5.82%Muhammad Imran Chief Investment Officer Year to Date Return (Cumulative) 38.33% 38.65% 38.15% 33.90%Colin Miranda, CFA, FRM Acting Head of Research 1 Month Cumulative Return 5.13% 8.20% 2.73% 2.62%Jawad Naeem Fund Manager- Equity 3 Month Cumulative Return 7.43% 10.46% 5.06% 4.24%Adeel Abdul Wahab Fund Manager- Equity 6 Month Cumulative Return 22.77% 27.13% 19.40% 18.70%Noman Ameer Manager Risk 1 Year Cumulative Return 40.23% 39.02% 41.28% 40.29%
3 Year Cumulative Return 38.97% 25.61% 50.08% 70.13%5 Year Cumulative Return 192.87% 232.85% 174.87% 266.96%Standard Deviation** 13.20% 16.60% 14.01% 13.21%
TOP TEN HOLDINGSUnited Bank LimitedSui Northern Gas Pipelines LimitedPioneer Cement LimitedPakistan State Oil Company LimitedOil and Gas Development Company LimitedMCB Bank LimitedLucky Cement LimitedHabib Bank LimitedEngro Corporation LimitedCherat Cement Company Limited
NIL
*Funds returns computed on NAV to NAV with the dividend reinvestment (excluding sales load)
FUND INFORMATION ASSET ALLOCATION (% of Total Assets)
INVESTMENT OBJECTIVETo maximize the wealth of the certificate holders for which investments would be made in the best available opportunities, while considering acceptable riskparameters and applicable rules and regulations.
FUND MANAGER'S COMMENTSThe fund posted a return of 5.13% during the month outperforming the benchmark by 2.51%. The benchmark KSE-100 Index increased by 2.62% M/M duringMay’17 (vs. an increase of 2.38% M/M in Apr’17) as enthusiasm related to the MSCI EM upgrade and Federal Budget drove the market to an all time high duringthe month. During the month, exposure was reduced in Commercial Banks and Cements sectors, while increasing exposure to the Engineering sector. We expectmarket activity to improve with volumes to increase going forward on the back of expected development on some sort of financing product along with a positiveoutlook in blue chip and growth stocks. At the end of the month your fund was 95.33% invested in equities.
**Calculated on 12Month trailing data Mutual Fund Association of Pakistan (MUFAP) Recommended Format
Risk Disclaimer: This publication is for informational purposes only and nothing herein should be construed as a solicitation, recommendation or an offer to buy or sell any fund. All investments in mutual funds aresubject to market risks. Past performance is not necessarily indicative of future results. Please read the Offering Document to understand the investment policies and risks involved including risk disclosure for specialfeature.
SECTOR ALLOCATION (% of Total Assets)
INVESTMENT COMMITTEE
PIF vs BENCHMARK (12M Rolling Returns)
NON-COMPLIANT INVESTMENTS PROVISION AGAINST WWFThe scheme has maintained provisions against SINDH WWF liability to the tune of Rs.25,848,983 if the same were not made the NAV per certificate/return of the scheme wouldbe higher by Re. 0.09/0.49% (YTD). For details, investors are advised to read the Note7.1 of the latest financial statements of the scheme.
0.00%
10.00%
20.00%
30.00%
40.00%
50.00%
60.00%
Jun-
16
Jul-1
6
Aug
-16
Sep
-16
Oct
-16
Nov
-16
Dec
-16
Jan-
17
Feb
-17
Ma
r-1
7
Apr
-17
Ma
y-1
7
Benchmark PIF
FUND INFORMATION ASSET ALLOCATION (% of Total Assets)Launch Date Money Market Sub Fund May-17 Apr-17Management Fee 1.5% p.a Tbill 58.28% 40.63%Trustee Central Depository Co. of Pakistan Cash 7.07% 28.70%Auditor Deloitte Yousuf Adil Pakistan Placement With Banks and DFI 33.97% 28.91%Type Open End Sukuk 0.00% 0.00%Category Pensions Scheme Others & receivables 0.68% 1.76%Front end Load Max 3%Back end Load Nil Debt Sub Fund May-17 Apr-17AMC Rating AM2 (JCRVIS) 30/12/2016 Placement With Banks and DFI 17.94% 10.94%Dealing Days Monday-Friday Tbill 0.00% 0.00%Cut off time 9:00 AM-3:00 PM PIB 56.89% 55.52%Price Mechanism Forward Pricing TFCs 21.57% 21.04%Risk Profile Cash 1.46% 10.52%
Others & receivables 2.14% 1.98%MMSF DSF ESF
AUM Million 151.64 177.09 261.54 Equity Sub Fund May-17 Apr-17NAV(PKR) 140.6126 152.8384 444.4405 Stock / Equities 89.85% 82.58%WAM (Days) 74 1170 Cash 9.19% 12.72%Leverage Others & receivables 0.96% 4.70%
INVESTMENT COMMITTEE SECTOR ALLOCATION EQUITY May-17 Apr-17Farid Ahmed Khan, CFA Chief Executive Officer Cement 16.81% 17.47%Muhammad Imran Chief Investment Officer Oil & Gas Exploration Companies 11.58% 9.17%Colin Miranda, CFA, FRM Acting Head of Research Commercial Banks 10.27% 12.20%Tauqir Shamshad Head of Fixed Income Oil & Gas Marketing Companies 10.24% 7.45%Jawad Naeem Fund Manager- Equity Engineering 7.35% 5.69%Adeel Abdul Wahab Fund Manager- Equity Others 33.60% 30.61%Faizan Saleem Sr. Fund Manager Fixed Income Noman Ameer Manager Risk
FUND RETURNS* MMSF DSF ESF TOP TEN EQUITIES May-17Return Since Inception 7.44% 9.68% 344.44%Calendar Year to Date Return (Cumulative) 4.54% 5.14% 10.05%Year to Date Return (Cumulative) 4.52% 4.33% 38.66%1 Month Cumulative Return 4.23% 4.44% 4.22%3 Month Cumulative Return 4.08% 4.85% 8.66%6 Month Cumulative Return 4.67% 4.89% 20.41%1 Year Cumulative Return 4.43% 4.84% 41.36%3 Year Cumulative Return 5.55% 8.51% 97.21%5 Year Cumulative Return 7.02% 9.43% 259.86%Standard Deviation*** 0.78% 2.33% 12.94%
CREDIT QUALITY - HBL MONEY MARKET SUB FUND CREDIT QUALITY -HBL DEBT SUB FUND
PROVISION AGAINST WWF
**Calculated on 12Month trailing data
MAY 2017
To provide a secure source of savings and regular income after retirement to the Participants
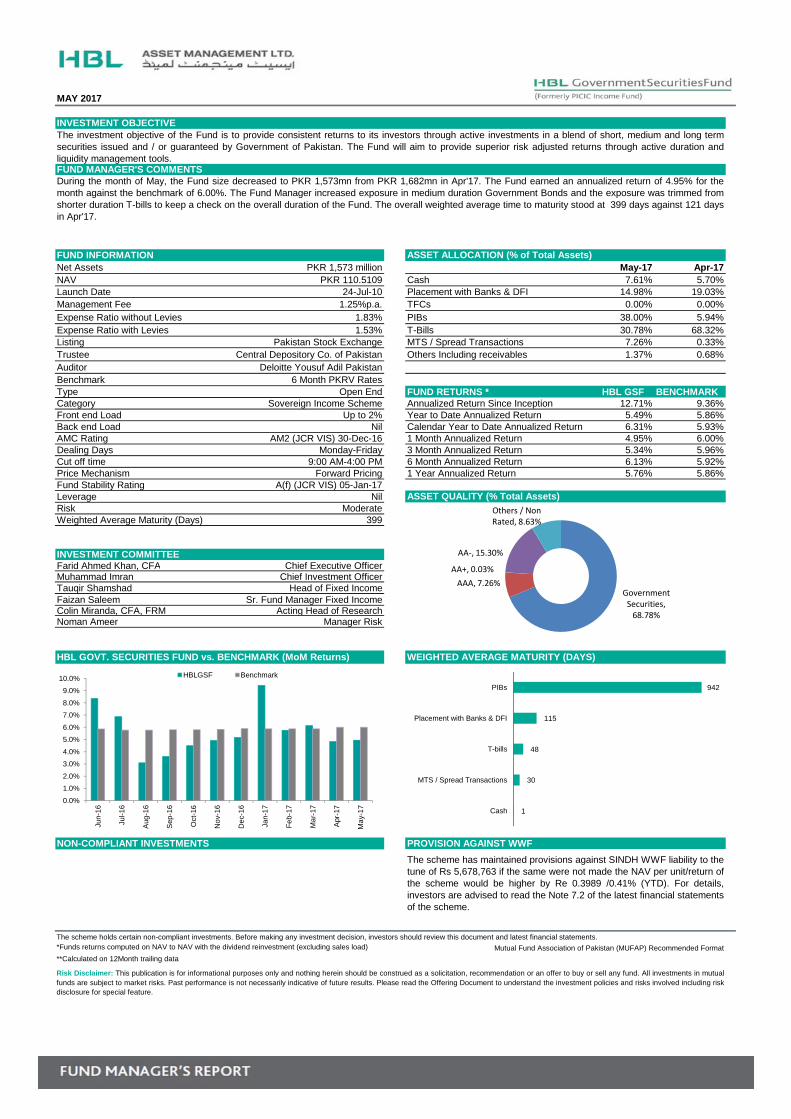
DEBT SUB FUND : The Fund’s return for the month of May'17 stood at 4.44% p.a. , fund maintained its exposure in TFCs and PIBs while increasing the expsoure inplacements. Weighted average maturity of the fund stood at 1,170 days.
MONEY MARKETSUB FUND : The Fund’s Monthly return stood at 4.23% p.a. during the month the Fund increase the exposure in T.Bills and decreased theexposure in bank deposit. Weighted average maturity of the fund stood at 74 days
EQUITY SUB FUND : The Fund posted a return of 4.22% during the month vs KSE-100 Index return of 2.62% M/M during May’17. The equity exposure at the endof month stood at 89.85%.
INVESTMENT OBJECTIVE
FUND MANAGER'S COMMENTS
16-Dec-11
Investor Dependent
Nil
Provision against WWF: The ESF, DSF and MMF of scheme has maintained provisions against Sindh WWF liability to the tune of PKR 1,630mn, PKR 0.627 mn,and PKR 0.401 mn respectively. If the same were not made, the NAV per unit/return of ESF, DSF, and MSF would be higher by Rs. 2.77/0.62%, Rs. 0.54/0.35% andRs. 0.37/0.26%. For details investors are advised to read Note 11 of the latest Financial Statements of the Scheme.
Risk Disclaimer: This publication is for informational purposes only and nothing herein should be construed as a solicitation, recommendation or an offer to buy or sell any fund. All investments in mutual funds aresubject to market risks. Past performance is not necessarily indicative of future results. Please read the Offering Document to understand the investment policies and risks involved risk disclosure for special feature.
HBL PENSION FUND (MoM Returns)
Mutual Fund Association of Pakistan (MUFAP) Recommended Format*Funds returns computed on NAV to NAV with the dividend reinvestment (excluding sales load)
AAA, 19.74%
OTHERS , 0.68%
Government Securities, 58.28%
AA, 18.97%
AA+, 2.33%
Government Securities,
56.89%TFCs, 21.57%
AAA, 18.80%
OTHERS , 2.14%AA+, 0.60%
-4.0%
-2.0%
0.0%
2.0%
4.0%
6.0%
8.0%
10.0%
12.0%
Jun-
16
Jul-1
6
Aug
-16
Sep
-16
Oct
-16
Nov
-16
Dec
-16
Jan-
17
Feb
-17
Mar
-17
Apr
-17
May
-17
HBL-PF Money Market Sub Fund* HBL-PF Debt Sub Fund* HBL-PF Equity Sub Fund**
3.69%
3.70%
3.84%
4.05%
4.13%
4.30%
4.86%
4.88%
5.67%
6.22%
Mari Petroleum Company Limited
Pak Elektron Limited
Oil and Gas Development Company Limited
MCB Bank Limited
D.G. Khan Cement Company Ltd
Engro Corporation Limited
Hub Power Company Limited
Sui Northern Gas Pipelines Limited
Lucky Cement Limited
United Bank Limited

Islamic Funds

MAY 2017
Net Assets PKR. 721 million May-17 Apr-17NAV PKR. 104.4997 Cash 99.57% 99.50%Launch Date 10-May-11 Placement With Banks and DFIs 0.00% 0.00%Management Fee 1% p.a GoP Ijara Sukuks 0.00% 0.00%Expense Ratio without Levies 1.25% Others Including receivables 0.43% 0.50%Expense Ratio with Levies 1.49%Listing Pakistan Stock ExchangeTrustee Central Depository Co. of PakistanAuditor Deloitte Yousuf Adil Pakistan FUND RETURNS (%)* HBL IMMF* BenchmarkBenchmark Three months average deposit rates Annualized Return Since Inception 8.24% 6.16%
of three (3) AA rated Islamic Banks Year to Date Annualized Return 4.21% 3.28%or Islamic windows of Conventional Calendar YTD Annualized Return 4.15% 2.58%
Banks as selected by MUFAP. 1 Month Annualized Return 3.28% 2.54%Type Open End 3 Month Annualized Return 3.63% 2.52%Category Islamic Money Market Scheme 6 Month Annualized Return 4.06% 2.61%Front end Load Nil 12 Month Annualized Return 4.21% 3.43%Back end Load NilAMC Rating AM2 ( JCR VIS) 30/12/2016Dealing Days Monday-FridayCut off time 9:00 AM-3:00 PMPrice Mechanism Forward PricingFund Stability Rating AA(f) (JCR VIS) 01/05/2017Leverage NilRisk LowWeighted Average Maturity (Days) 1
Farid Ahmed Khan, CFA Chief Executive OfficerMuhammad Imran Chief Investment OfficerColin Miranda, CFA, FRM Acting Head of ResearchTauqir Shamshad Head of Fixed IncomeFaizan Saleem Sr. Fund Manager Fixed Income Noman Ameer Manager Risk
NIL
**Calculated on 12Month trailing data
Mutual Fund Association of Pakistan (MUFAP) Recommended Format*Funds returns computed on NAV to NAV with the dividend reinvestment (excluding sales load)
Risk Disclaimer: This publication is for informational purposes only and nothing herein should be construed as a solicitation, recommendation or an offer to buy or sell any fund. All investments in mutual funds are subject to market risks. Past performance is not necessarily indicative of future results. Please read the Offering Document to understand the investment policies and risks involved risk disclosure for special feature.
The scheme has maintained provisions against Sindh WWF liability to thetune of PKR 1.430 mn - if the same were not made the NAV per unit/return ofthe scheme would be higher by PKR 0.21 /0.20% (YTD). For details, investorsare advised to read the Note 6.2 of the latest financial statements of thescheme.”
ASSET QUALITY (% Total Assets)
INVESTMENT COMMITTEE
HBL ISLAMIC MMF vs BENCHMARK (MoM Returns) WEIGHTED AVERAGE MATURITY (DAYS)
NON-COMPLIANT INVESTMENTS PROVISION AGAINST WWF
INVESTMENT OBJECTIVEThe objective of HBL Islamic Money Market Fund is to seek high liquidity, competitive return and maximum possible preservation of capital for investors byinvestment in low risk Shariah Compliant securities
FUND MANAGER'S COMMENTSDuring the month, fund size of HBL Islamic Money Market increased by 4.94% to PKR 721 mn form PKR 687 mn. HBL IMMF posted a return of 3.28% againstthe benchmark return of 2.54%, thus showing an outperformance of 74 bps. The fund maintained heavy exposure of 99.57% as cash with Islamic Banks withthe intention to place June crossing placements at higher rate.
FUND INFORMATION ASSET ALLOCATION (% of Total Assets)
-
-
1
Term Deposits with Banks
GoP Ijara Sukuks
Cash
0.0%
1.0%
2.0%
3.0%
4.0%
5.0%
6.0%
7.0%
Jun-
16
Jul-1
6
Aug
-16
Sep
-16
Oct
-16
Nov
-16
Dec
-16
Jan-
17
Feb
-17
Ma
r-1
7
Apr
-17
Ma
y-1
7
IMMF Benchmark
AAA, 0.47%
AA+, 99.07%
AA, 0.03%others , 0.43%
MAY 2017
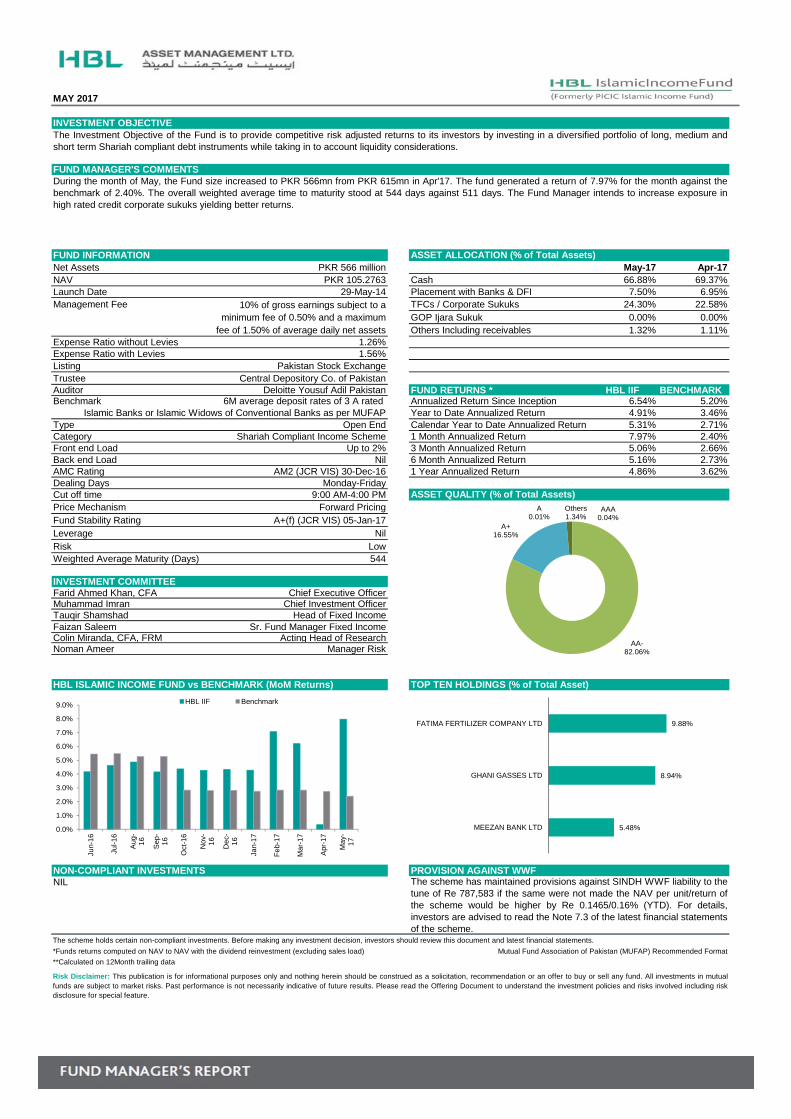
Net Assets PKR 566 million May-17 Apr-17NAV PKR 105.2763 Cash 66.88% 69.37%Launch Date 29-May-14 Placement with Banks & DFI 7.50% 6.95%Management Fee 10% of gross earnings subject to a TFCs / Corporate Sukuks 24.30% 22.58%
minimum fee of 0.50% and a maximum GOP Ijara Sukuk 0.00% 0.00% fee of 1.50% of average daily net assets Others Including receivables 1.32% 1.11%
Expense Ratio without Levies 1.26%Expense Ratio with Levies 1.56%Listing Pakistan Stock ExchangeTrustee Central Depository Co. of PakistanAuditor Deloitte Yousuf Adil Pakistan FUND RETURNS * HBL IIF BENCHMARKBenchmark 6M average deposit rates of 3 A rated Annualized Return Since Inception 6.54% 5.20%
Islamic Banks or Islamic Widows of Conventional Banks as per MUFAP Year to Date Annualized Return 4.91% 3.46%Type Open End Calendar Year to Date Annualized Return 5.31% 2.71%Category Shariah Compliant Income Scheme 1 Month Annualized Return 7.97% 2.40%Front end Load Up to 2% 3 Month Annualized Return 5.06% 2.66%Back end Load Nil 6 Month Annualized Return 5.16% 2.73%AMC Rating AM2 (JCR VIS) 30-Dec-16 1 Year Annualized Return 4.86% 3.62%Dealing Days Monday-FridayCut off time 9:00 AM-4:00 PMPrice Mechanism Forward PricingFund Stability Rating A+(f) (JCR VIS) 05-Jan-17Leverage NilRisk LowWeighted Average Maturity (Days) 544
Farid Ahmed Khan, CFA Chief Executive OfficerMuhammad Imran Chief Investment OfficerTauqir Shamshad Head of Fixed IncomeFaizan Saleem Sr. Fund Manager Fixed IncomeColin Miranda, CFA, FRM Acting Head of ResearchNoman Ameer Manager Risk
NIL
**Calculated on 12Month trailing data
Risk Disclaimer: This publication is for informational purposes only and nothing herein should be construed as a solicitation, recommendation or an offer to buy or sell any fund. All investments in mutualfunds are subject to market risks. Past performance is not necessarily indicative of future results. Please read the Offering Document to understand the investment policies and risks involved including riskdisclosure for special feature.
ASSET QUALITY (% of Total Assets)
INVESTMENT COMMITTEE
HBL ISLAMIC INCOME FUND vs BENCHMARK (MoM Returns) TOP TEN HOLDINGS (% of Total Asset)
NON-COMPLIANT INVESTMENTS PROVISION AGAINST WWF
*Funds returns computed on NAV to NAV with the dividend reinvestment (excluding sales load)
INVESTMENT OBJECTIVEThe Investment Objective of the Fund is to provide competitive risk adjusted returns to its investors by investing in a diversified portfolio of long, medium andshort term Shariah compliant debt instruments while taking in to account liquidity considerations.
The scheme has maintained provisions against SINDH WWF liability to thetune of Re 787,583 if the same were not made the NAV per unit/return ofthe scheme would be higher by Re 0.1465/0.16% (YTD). For details,investors are advised to read the Note 7.3 of the latest financial statementsof the scheme.
Mutual Fund Association of Pakistan (MUFAP) Recommended Format
The scheme holds certain non-compliant investments. Before making any investment decision, investors should review this document and latest financial statements.
FUND MANAGER'S COMMENTSDuring the month of May, the Fund size increased to PKR 566mn from PKR 615mn in Apr'17. The fund generated a return of 7.97% for the month against thebenchmark of 2.40%. The overall weighted average time to maturity stood at 544 days against 511 days. The Fund Manager intends to increase exposure inhigh rated credit corporate sukuks yielding better returns.
FUND INFORMATION ASSET ALLOCATION (% of Total Assets)
5.48%
8.94%
9.88%
MEEZAN BANK LTD
GHANI GASSES LTD
FATIMA FERTILIZER COMPANY LTD
AAA0.04%
AA-82.06%
A+16.55%
A0.01%
Others1.34%
0.0%
1.0%
2.0%
3.0%
4.0%
5.0%
6.0%
7.0%
8.0%
9.0%
Jun-
16
Jul-1
6
Aug
-1
6
Sep
-1
6
Oct
-16
No
v-1
6
De
c-1
6
Jan-
17
Fe
b-17
Ma
r-17
Apr
-17
Ma
y-1
7
HBL IIF Benchmark
MAY 2017
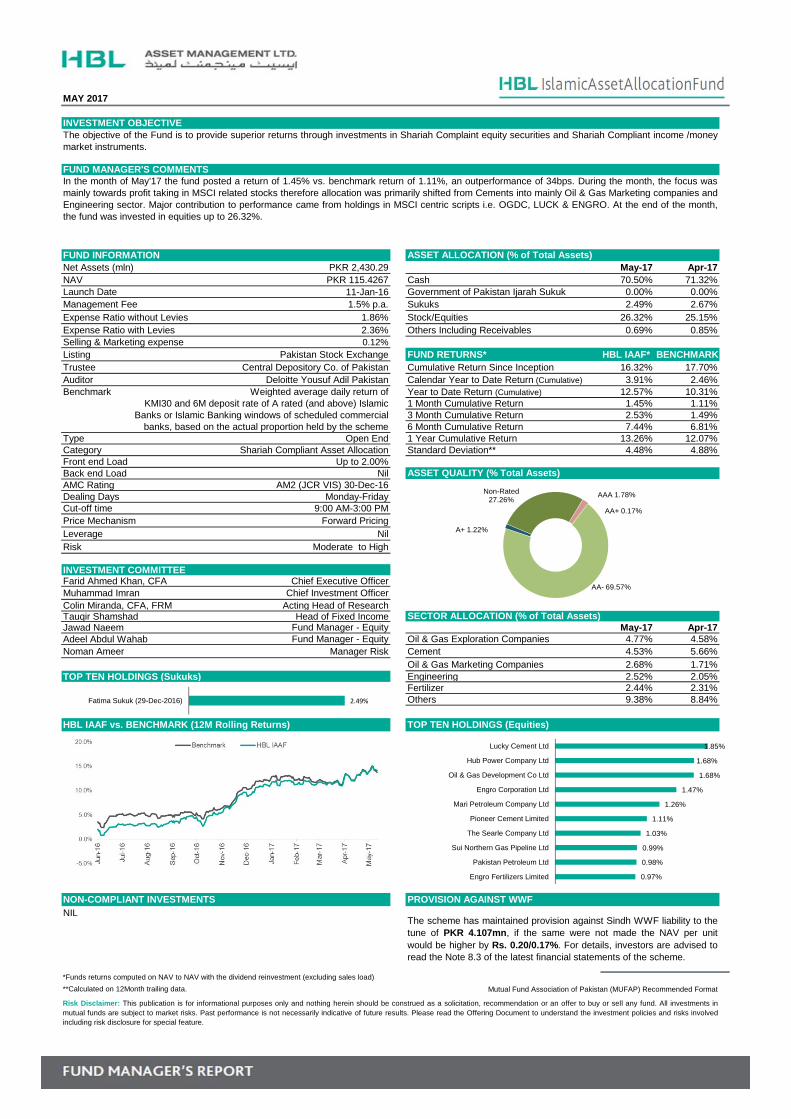
Net Assets (mln) PKR 2,430.29 May-17 Apr-17NAV PKR 115.4267 Cash 70.50% 71.32%Launch Date 11-Jan-16 Government of Pakistan Ijarah Sukuk 0.00% 0.00%Management Fee 1.5% p.a. Sukuks 2.49% 2.67%Expense Ratio without Levies 1.86% Stock/Equities 26.32% 25.15%Expense Ratio with Levies 2.36% Others Including Receivables 0.69% 0.85%Selling & Marketing expense 0.12%Listing Pakistan Stock Exchange FUND RETURNS* HBL IAAF* BENCHMARKTrustee Central Depository Co. of Pakistan Cumulative Return Since Inception 16.32% 17.70%Auditor Deloitte Yousuf Adil Pakistan Calendar Year to Date Return (Cumulative) 3.91% 2.46%Benchmark Weighted average daily return of Year to Date Return (Cumulative) 12.57% 10.31%
KMI30 and 6M deposit rate of A rated (and above) Islamic 1 Month Cumulative Return 1.45% 1.11%Banks or Islamic Banking windows of scheduled commercial 3 Month Cumulative Return 2.53% 1.49%
banks, based on the actual proportion held by the scheme 6 Month Cumulative Return 7.44% 6.81%Type Open End 1 Year Cumulative Return 13.26% 12.07%Category Shariah Compliant Asset Allocation Standard Deviation** 4.48% 4.88%Front end Load Up to 2.00%Back end Load NilAMC Rating AM2 (JCR VIS) 30-Dec-16Dealing Days Monday-FridayCut-off time 9:00 AM-3:00 PMPrice Mechanism Forward PricingLeverage NilRisk Moderate to High
INVESTMENT COMMITTEEFarid Ahmed Khan, CFA Chief Executive OfficerMuhammad Imran Chief Investment OfficerColin Miranda, CFA, FRM Acting Head of ResearchTauqir Shamshad Head of Fixed IncomeJawad Naeem Fund Manager - Equity May-17 Apr-17Adeel Abdul Wahab Fund Manager - Equity Oil & Gas Exploration Companies 4.77% 4.58%Noman Ameer Manager Risk Cement 4.53% 5.66%
Oil & Gas Marketing Companies 2.68% 1.71%TOP TEN HOLDINGS (Sukuks) Engineering 2.52% 2.05%
Fertilizer 2.44% 2.31%Others 9.38% 8.84%
NIL
**Calculated on 12Month trailing data.
ASSET QUALITY (% Total Assets)
SECTOR ALLOCATION (% of Total Assets)
HBL IAAF vs. BENCHMARK (12M Rolling Returns) TOP TEN HOLDINGS (Equities)
NON-COMPLIANT INVESTMENTS PROVISION AGAINST WWF
The scheme has maintained provision against Sindh WWF liability to thetune of PKR 4.107mn, if the same were not made the NAV per unitwould be higher by Rs. 0.20/0.17%. For details, investors are advised toread the Note 8.3 of the latest financial statements of the scheme.
Mutual Fund Association of Pakistan (MUFAP) Recommended Format
Risk Disclaimer: This publication is for informational purposes only and nothing herein should be construed as a solicitation, recommendation or an offer to buy or sell any fund. All investments inmutual funds are subject to market risks. Past performance is not necessarily indicative of future results. Please read the Offering Document to understand the investment policies and risks involvedincluding risk disclosure for special feature.
*Funds returns computed on NAV to NAV with the dividend reinvestment (excluding sales load)
INVESTMENT OBJECTIVEThe objective of the Fund is to provide superior returns through investments in Shariah Complaint equity securities and Shariah Compliant income /moneymarket instruments.
FUND MANAGER'S COMMENTSIn the month of May’17 the fund posted a return of 1.45% vs. benchmark return of 1.11%, an outperformance of 34bps. During the month, the focus wasmainly towards profit taking in MSCI related stocks therefore allocation was primarily shifted from Cements into mainly Oil & Gas Marketing companies andEngineering sector. Major contribution to performance came from holdings in MSCI centric scripts i.e. OGDC, LUCK & ENGRO. At the end of the month,the fund was invested in equities up to 26.32%.
FUND INFORMATION ASSET ALLOCATION (% of Total Assets)
0.97%
0.98%
0.99%
1.03%
1.11%
1.26%
1.47%
1.68%
1.68%
1.85%
Engro Fertilizers Limited
Pakistan Petroleum Ltd
Sui Northern Gas Pipeline Ltd
The Searle Company Ltd
Pioneer Cement Limited
Mari Petroleum Company Ltd
Engro Corporation Ltd
Oil & Gas Development Co Ltd
Hub Power Company Ltd
Lucky Cement Ltd
Non-Rated 27.26%
AAA 1.78%
AA+ 0.17%
AA- 69.57%
A+ 1.22%
2.49%Fatima Sukuk (29-Dec-2016)

May 2017
Net Assets (mln) PKR 1,136.70 May-17 Apr-17NAV PKR 176.1551 Cash 10.29% 6.19%Launch Date 10-May-11 Stock / Equities 86.37% 90.77%Management Fee 2.0% p.a. Others Including Receivables 3.34% 3.04%Expense Ratio with Levies 2.96%Expense Ratio without Levies 2.31%Selling & Marketing expense 0.12%Listing Pakistan Stock ExchangeTrustee Central Depository Co. of Pakistan May-17 Apr-17Auditor Deloitte Yousuf Adil Pakistan Cement 16.84% 18.82%Benchmark KMI30 Index Oil & Gas Exploration Companies 12.98% 14.49%Type Open End Oil & Gas Marketing Companies 9.29% 5.51%Category Islamic Equity Scheme Power Generation & Distribution 7.93% 8.61%Front end Load 2.00% Fertilizers 7.93% 9.16%Back end Load Nil Others Including Receivables 31.39% 29.35%AMC Rating AM2 (JCR VIS) 30-Dec-16Dealing Days Monday-FridayCut-off time 9:00 AM-3:00 PMPrice Mechanism Forward Pricing FUND RETURNS * HBL ISF BENCHMARKLeverage Nil Cumulative Return Since Inception 251.34% 331.51%Risk High Calendar Year to Date Return (Cumulative) 9.85% 6.91%
Year to Date Return (Cumulative) 37.61% 32.17%INVESTMENT COMMITTEE 1 Month Cumulative Return 4.53% 3.53%Farid Ahmed Khan, CFA Chief Executive Officer 3 Month Cumulative Return 7.20% 4.64%Muhammad Imran Chief Investment Officer 6 Month Cumulative Return 22.84% 22.42%Colin Miranda, CFA, FRM Acting Head of Research 1 Year Cumulative Return 41.18% 38.23%Jawad Naeem Fund Manager - Equity 3 Year Cumulative Return 54.83% 86.11%Adeel Abdul Wahab Fund Manager - Equity 5 Year Cumulative Return 193.40% 264.72%Noman Ameer Manager Risk Standard Deviation** 15.01% 17.09%
NIL
**Calculated on 12Month trailing data
The scheme has maintained provision against Sindh WWF liability to thetune of PKR 6.232mn, if the same were not made the NAV per unit wouldbe higher by Rs. 0.97/0.55%. For details, investors are advised to read theNote 7.2 of the latest financial statements of the scheme.
Risk Disclaimer: This publication is for informational purposes only and nothing herein should be construed as a solicitation, recommendation or an offer to buy or sell any fund. All investments in mutualfunds are subject to market risks. Past performance is not necessarily indicative of future results. Please read the Offering Document to understand the investment policies and risks involved including riskdisclosure for special feature.
(MUFAP) Recommended Format*Funds returns computed on NAV to NAV with the dividend reinvestment (excluding sales load)
SECTOR ALLOCATION (% of Total Assets)
HBL ISLAMIC STOCK FUND vs. BENCHMARK (12M Rolling Returns) TOP TEN HOLDINGS (% of Total Assets)
NON-COMPLIANT INVESTMENTS PROVISION AGAINST WWF
INVESTMENT OBJECTIVEThe objective of the Fund is to achieve long-term capital growth by investing mainly in Shariah Compliant equity securities.
FUND MANAGER'S COMMENTSIn the month of May’17 the fund posted a return of 4.53% vs. benchmark return of 3.53%, an outperformance of 100bps. During the month, the focus wasmainly towards profit taking in MSCI related stocks therefore allocation was primarily shifted from Cements, Oil & Gas Exploration and Fertilizer sector intomainly Oil & Gas Marketing companies. Major contribution to performance came from holdings in MSCI centric scripts i.e. OGDC, LUCK & ENGRO. At the endof the month, the fund was invested in equities up to 86.37%.
FUND INFORMATION ASSET ALLOCATION (% of Total Assets)
2.91%
3.31%
3.42%
3.68%
3.75%
3.76%
5.07%
5.46%
5.90%
6.90%
Pakistan State Oil Company Ltd
Mari Petroleum Company Ltd
The Searle Company Ltd
Pioneer Cement Limited
D G Khan Cement Co.Ltd.
Sui Northern Gas Pipeline Ltd
Oil & Gas Development Co Ltd
Engro Corporation Ltd
Hub Power Company Ltd
Lucky Cement Ltd
May 2017
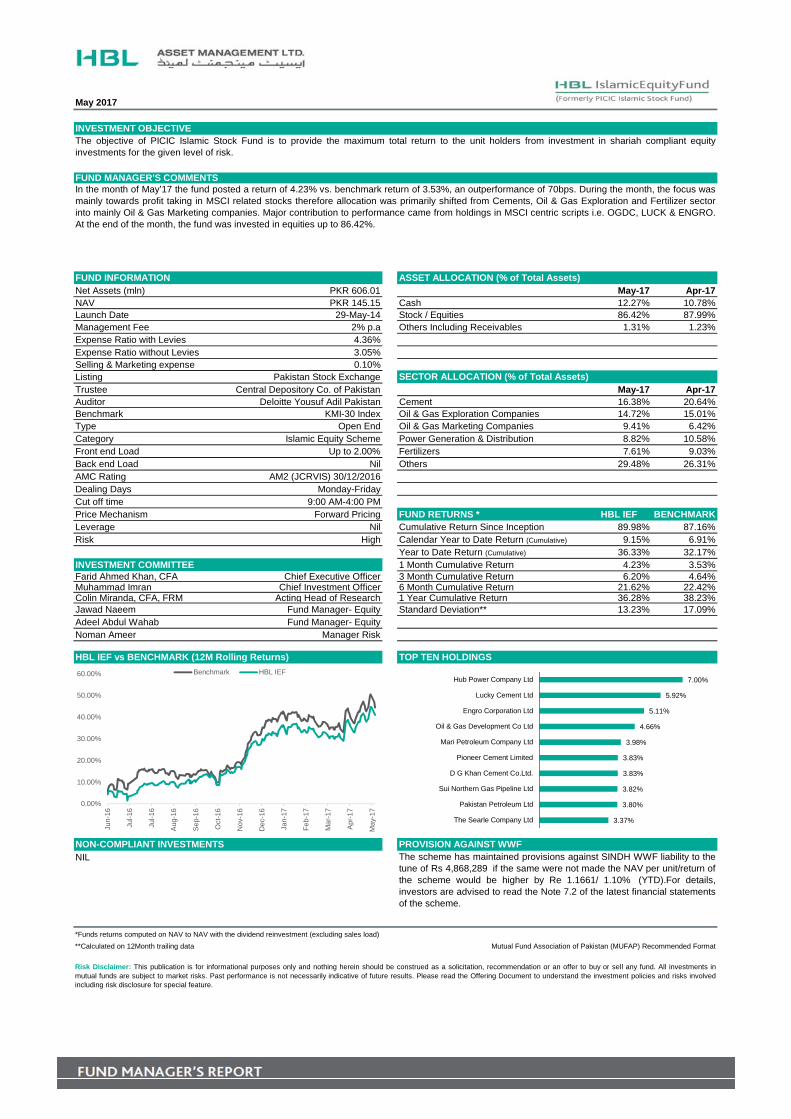
Net Assets (mln) PKR 606.01 May-17 Apr-17NAV PKR 145.15 Cash 12.27% 10.78%Launch Date 29-May-14 Stock / Equities 86.42% 87.99%Management Fee 2% p.a Others Including Receivables 1.31% 1.23%Expense Ratio with Levies 4.36%Expense Ratio without Levies 3.05%Selling & Marketing expense 0.10%Listing Pakistan Stock ExchangeTrustee Central Depository Co. of Pakistan May-17 Apr-17Auditor Deloitte Yousuf Adil Pakistan Cement 16.38% 20.64%Benchmark KMI-30 Index Oil & Gas Exploration Companies 14.72% 15.01%Type Open End Oil & Gas Marketing Companies 9.41% 6.42%Category Islamic Equity Scheme Power Generation & Distribution 8.82% 10.58%Front end Load Up to 2.00% Fertilizers 7.61% 9.03%Back end Load Nil Others 29.48% 26.31%AMC Rating AM2 (JCRVIS) 30/12/2016Dealing Days Monday-FridayCut off time 9:00 AM-4:00 PMPrice Mechanism Forward Pricing FUND RETURNS * HBL IEF BENCHMARKLeverage Nil Cumulative Return Since Inception 89.98% 87.16%Risk High Calendar Year to Date Return (Cumulative) 9.15% 6.91%
Year to Date Return (Cumulative) 36.33% 32.17%INVESTMENT COMMITTEE 1 Month Cumulative Return 4.23% 3.53%Farid Ahmed Khan, CFA Chief Executive Officer 3 Month Cumulative Return 6.20% 4.64%Muhammad Imran Chief Investment Officer 6 Month Cumulative Return 21.62% 22.42%Colin Miranda, CFA, FRM Acting Head of Research 1 Year Cumulative Return 36.28% 38.23%Jawad Naeem Fund Manager- Equity Standard Deviation** 13.23% 17.09%Adeel Abdul Wahab Fund Manager- EquityNoman Ameer Manager Risk
NIL
**Calculated on 12Month trailing data
INVESTMENT OBJECTIVEThe objective of PICIC Islamic Stock Fund is to provide the maximum total return to the unit holders from investment in shariah compliant equityinvestments for the given level of risk.
FUND MANAGER'S COMMENTSIn the month of May’17 the fund posted a return of 4.23% vs. benchmark return of 3.53%, an outperformance of 70bps. During the month, the focus wasmainly towards profit taking in MSCI related stocks therefore allocation was primarily shifted from Cements, Oil & Gas Exploration and Fertilizer sectorinto mainly Oil & Gas Marketing companies. Major contribution to performance came from holdings in MSCI centric scripts i.e. OGDC, LUCK & ENGRO.At the end of the month, the fund was invested in equities up to 86.42%.
FUND INFORMATION ASSET ALLOCATION (% of Total Assets)
*Funds returns computed on NAV to NAV with the dividend reinvestment (excluding sales load)
Mutual Fund Association of Pakistan (MUFAP) Recommended Format
Risk Disclaimer: This publication is for informational purposes only and nothing herein should be construed as a solicitation, recommendation or an offer to buy or sell any fund. All investments inmutual funds are subject to market risks. Past performance is not necessarily indicative of future results. Please read the Offering Document to understand the investment policies and risks involvedincluding risk disclosure for special feature.
SECTOR ALLOCATION (% of Total Assets)
HBL IEF vs BENCHMARK (12M Rolling Returns) TOP TEN HOLDINGS
NON-COMPLIANT INVESTMENTS PROVISION AGAINST WWFThe scheme has maintained provisions against SINDH WWF liability to thetune of Rs 4,868,289 if the same were not made the NAV per unit/return ofthe scheme would be higher by Re 1.1661/ 1.10% (YTD).For details,investors are advised to read the Note 7.2 of the latest financial statementsof the scheme.
3.37%
3.80%
3.82%
3.83%
3.83%
3.98%
4.66%
5.11%
5.92%
7.00%
The Searle Company Ltd
Pakistan Petroleum Ltd
Sui Northern Gas Pipeline Ltd
D G Khan Cement Co.Ltd.
Pioneer Cement Limited
Mari Petroleum Company Ltd
Oil & Gas Development Co Ltd
Engro Corporation Ltd
Lucky Cement Ltd
Hub Power Company Ltd
0.00%
10.00%
20.00%
30.00%
40.00%
50.00%
60.00%
Jun-
16
Jul-1
6
Jul-1
6
Aug
-16
Sep
-16
Oct
-16
Nov
-16
Dec
-16
Jan-
17
Feb
-17
Mar
-17
Apr
-17
May
-17
Benchmark HBL IEF

FUND INFORMATION ASSET ALLOCATION (% of Total Assets)Launch Date 16-Dec-11 Money Market Sub Fund (MMSF) May-17 Apr-17Management Fee 1.5% p.a GoP Ijarah Sukuk 0.00% 0.00%Trustee Central Depository Co. of Pakistan Cash 79.27% 79.10%Auditor Deloitte Yousuf Adil Pakistan Placement With Banks and DFI 17.55% 17.63%Type Open End Corporate Sukuk 0.00% 0.00%Category Shariah Compliant Pension scheme Others including receivables 3.18% 3.27%Front end Load Max 3%Back end Load Nil Debt Sub Fund (DSF) May-17 Apr-17AMC Rating AM2 (JCRVIS) 30/12/2016 GoP Ijarah Sukuk 25.58% 25.67%Dealing Days Monday-Friday Cash 46.01% 45.92%Cut off time 9:00 AM-3:00 PM Placement With Banks and DFI 18.79% 18.83%Price Mechanism Forward Pricing Corporate Sukuk 6.33% 6.34%Risk Others including receivables 3.30% 3.25%
FUND SIZE MMSF DSF ESFAUM Million 78.7010 94.4301 226.45 Equity Sub Fund (ESF) May-17 Apr-17NAV(PKR) 134.4576 137.1085 487.6498 Stock / Equities 92.24% 84.92%WAM (Days) 6 272 Cash 7.40% 8.55%Leverage Others including receivables 0.36% 6.53%
INVESTMENT COMMITTEE SECTOR ALLOCATION EQUITY May-17 Apr-17Farid Ahmed Khan, CFA Chief Executive Officer Cement 17.59% 19.46%Muhammad Imran Chief Investment Officer Oil & Gas Exploration Companies 16.91% 14.76%Colin Miranda, CFA, FRM Acting Head of Research Oil & Gas Marketing Companies 11.96% 7.89%Tauqir Shamshad Head of Fixed Income Fertilizer 6.33% 5.58%Faizan Saleem Sr. Fund Manager- Fixed Income Automobile Assembler 6.26% 7.10%Jawad Naeem Fund Manager- Equity Others 33.19% 30.14%Adeel Abdul Wahab Fund Manager- EquityNoman Ameer Manager Risk
FUND RETURNS * MMSF DSF ESF TOP TEN EQUITES May-17Return Since Inception 6.31% 6.80% 387.65%Calendar Year to Date Return (Cumulative) 3.43% 2.95% 9.60%Year to Date Return (Cumulative) 4.26% 4.92% 40.95%1 Month Cumulative Return 2.75% 2.78% 3.41%3 Month Cumulative Return 2.76% 2.44% 7.47%6 Month Cumulative Return 3.53% 2.56% 22.35%1 Year Cumulative Return 4.64% 5.05% 43.07%3 Year Cumulative Return 4.21% 4.54% 94.66%5 Year Cumulative Return 5.81% 6.35% 303.13%Standard Deviation*** 1.82% 3.07% 14.77%
CREDITY QUALITY - HBL MONEY MARKET SUB FUND CREDIT QUALITY -HBL DEBT SUB FUND
PROVISION AGAINST WWF
**Calculated on 12Month trailing data
The scheme MMSF, DSF and ESF has maintained provisions against Sindh WWF liability to the tune of PKR 0.138mn, PKR 0.195mn and PKR 1.908mn. If thesame were not made, the NAV per unit would be higher by PKR 0.24/0.18%, PKR 0.28%/0.21% and PKR 4.11/ 0.84%. For details, investors are advised to read theNote 11 of the latest financial statements of the scheme.
Risk Disclaimer: This publication is for informational purposes only and nothing herein should be construed as a solicitation, recommendation or an offer to buy or sell any fund. All investments in mutual funds aresubject to market risks. Past performance is not necessarily indicative of future results. Please read the Offering Document to understand the investment policies and risks involved risk disclosure for special feature.
HBL PENSION FUND (MoM Returns)
Mutual Fund Association of Pakistan (MUFAP) Recommended Format*Funds returns computed on NAV to NAV with the dividend reinvestment (excluding sales load)
Nil
Investor Dependent
MAY 2017
To provide a secure and Shariah compliant source of savings and regular income after retirement to the Participants
MONEY MARKET SUB FUND: The Fund Manager maintained exposure in banks deposits as banks were offering better deposit rates. Weighted average maturitystoo d at 6 days
DEBT SUB FUND: Investment in GOP Ijarah Sukuk was kept static and the fund maintained the existing exposure in other asset classes as they providedcompetitive returns. Weighted average maturity stood at 272 days
EQUITY SUB FUND: The fund posted a return of 3.41% vs KMI-30 Index return of 3.53% M/M during May'17. The equity exposure at the end of month stood at92.24%.
INVESTMENT OBJECTIVE
FUND MANAGER'S COMMENTS
AAA19.11%
AA+20.50%
AA-18.83%
A+38.38%
Others3.18%
-5.0%
0.0%
5.0%
10.0%
15.0%
Jun-
16
Jul-1
6
Aug
-16
Sep
-16
Oct
-16
Nov
-16
Dec
-16
Jan-
17
Feb
-17
Mar
-17
Apr
-17
May
-17
HBL-IPF Money Market Sub Fund* HBL-IPF Debt Sub Fund* HBL-IPF Equity Sub Fund**
3.83%
3.87%
4.03%
4.30%
4.41%
4.94%
5.22%
5.63%
6.33%
6.63%
The Searle Company Limited
Pakistan Oilfields Limited
Mari Petroleum Company Limited
Pak Elektron Limited
Cherat Cement Company Limited
Sui Northern Gas Pipelines Limited
Oil and Gas Development Company Ltd
Hub Power Company Limited
Engro Corporation Limited
Lucky Cement Limited
Government Securities25.58%
AAA8.60%
AA+21.56%
AA-2.47%
A+38.49%
Others3.30%
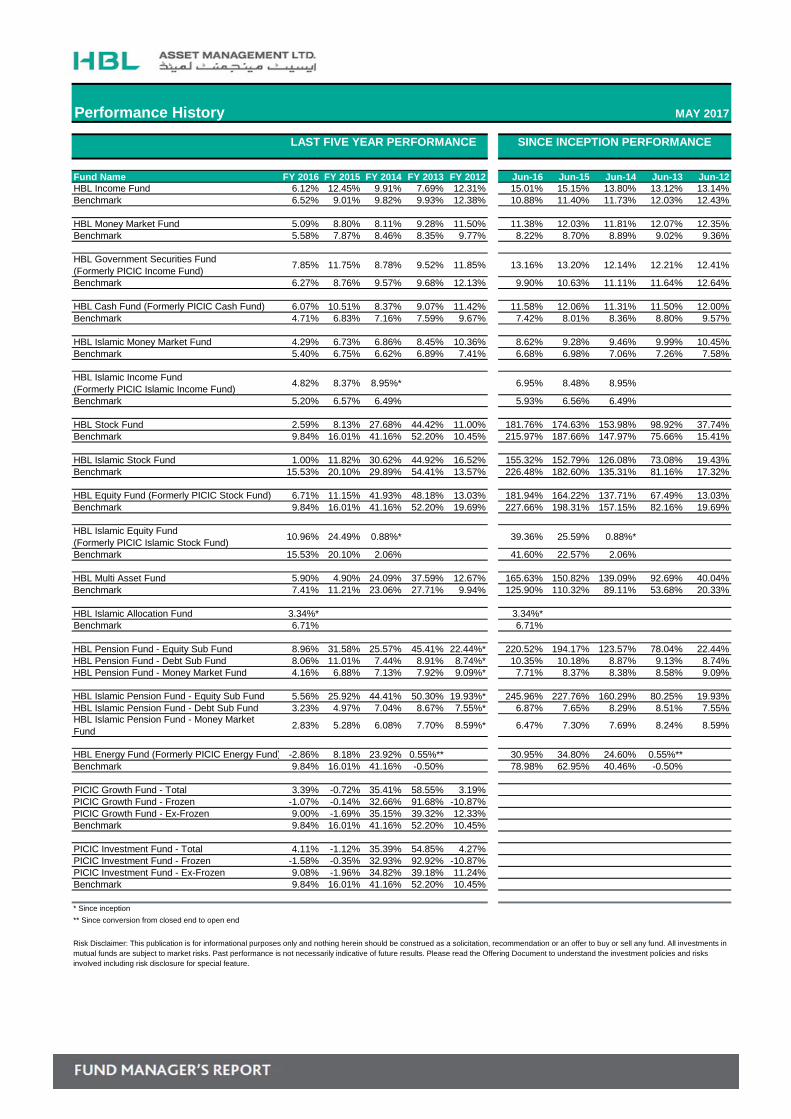
Fund Name FY 2016 FY 2015 FY 2014 FY 2013 FY 2012 Jun-16 Jun-15 Jun-14 Jun-13 Jun-12HBL Income Fund 6.12% 12.45% 9.91% 7.69% 12.31% 15.01% 15.15% 13.80% 13.12% 13.14%Benchmark 6.52% 9.01% 9.82% 9.93% 12.38% 10.88% 11.40% 11.73% 12.03% 12.43%
HBL Money Market Fund 5.09% 8.80% 8.11% 9.28% 11.50% 11.38% 12.03% 11.81% 12.07% 12.35%Benchmark 5.58% 7.87% 8.46% 8.35% 9.77% 8.22% 8.70% 8.89% 9.02% 9.36%
HBL Government Securities Fund (Formerly PICIC Income Fund)
7.85% 11.75% 8.78% 9.52% 11.85% 13.16% 13.20% 12.14% 12.21% 12.41%
Benchmark 6.27% 8.76% 9.57% 9.68% 12.13% 9.90% 10.63% 11.11% 11.64% 12.64%
HBL Cash Fund (Formerly PICIC Cash Fund) 6.07% 10.51% 8.37% 9.07% 11.42% 11.58% 12.06% 11.31% 11.50% 12.00%Benchmark 4.71% 6.83% 7.16% 7.59% 9.67% 7.42% 8.01% 8.36% 8.80% 9.57%
HBL Islamic Money Market Fund 4.29% 6.73% 6.86% 8.45% 10.36% 8.62% 9.28% 9.46% 9.99% 10.45%Benchmark 5.40% 6.75% 6.62% 6.89% 7.41% 6.68% 6.98% 7.06% 7.26% 7.58%
HBL Islamic Income Fund (Formerly PICIC Islamic Income Fund)
4.82% 8.37% 8.95%* 6.95% 8.48% 8.95%
Benchmark 5.20% 6.57% 6.49% 5.93% 6.56% 6.49%
HBL Stock Fund 2.59% 8.13% 27.68% 44.42% 11.00% 181.76% 174.63% 153.98% 98.92% 37.74%Benchmark 9.84% 16.01% 41.16% 52.20% 10.45% 215.97% 187.66% 147.97% 75.66% 15.41%
HBL Islamic Stock Fund 1.00% 11.82% 30.62% 44.92% 16.52% 155.32% 152.79% 126.08% 73.08% 19.43%Benchmark 15.53% 20.10% 29.89% 54.41% 13.57% 226.48% 182.60% 135.31% 81.16% 17.32%
HBL Equity Fund (Formerly PICIC Stock Fund) 6.71% 11.15% 41.93% 48.18% 13.03% 181.94% 164.22% 137.71% 67.49% 13.03%Benchmark 9.84% 16.01% 41.16% 52.20% 19.69% 227.66% 198.31% 157.15% 82.16% 19.69%
HBL Islamic Equity Fund (Formerly PICIC Islamic Stock Fund)
10.96% 24.49% 0.88%* 39.36% 25.59% 0.88%*
Benchmark 15.53% 20.10% 2.06% 41.60% 22.57% 2.06%
HBL Multi Asset Fund 5.90% 4.90% 24.09% 37.59% 12.67% 165.63% 150.82% 139.09% 92.69% 40.04%Benchmark 7.41% 11.21% 23.06% 27.71% 9.94% 125.90% 110.32% 89.11% 53.68% 20.33%
HBL Islamic Allocation Fund 3.34%* 3.34%*Benchmark 6.71% 6.71%
HBL Pension Fund - Equity Sub Fund 8.96% 31.58% 25.57% 45.41% 22.44%* 220.52% 194.17% 123.57% 78.04% 22.44%HBL Pension Fund - Debt Sub Fund 8.06% 11.01% 7.44% 8.91% 8.74%* 10.35% 10.18% 8.87% 9.13% 8.74%HBL Pension Fund - Money Market Fund 4.16% 6.88% 7.13% 7.92% 9.09%* 7.71% 8.37% 8.38% 8.58% 9.09%
HBL Islamic Pension Fund - Equity Sub Fund 5.56% 25.92% 44.41% 50.30% 19.93%* 245.96% 227.76% 160.29% 80.25% 19.93%HBL Islamic Pension Fund - Debt Sub Fund 3.23% 4.97% 7.04% 8.67% 7.55%* 6.87% 7.65% 8.29% 8.51% 7.55%HBL Islamic Pension Fund - Money Market Fund
2.83% 5.28% 6.08% 7.70% 8.59%* 6.47% 7.30% 7.69% 8.24% 8.59%
HBL Energy Fund (Formerly PICIC Energy Fund) -2.86% 8.18% 23.92% 0.55%** 30.95% 34.80% 24.60% 0.55%**Benchmark 9.84% 16.01% 41.16% -0.50% 78.98% 62.95% 40.46% -0.50%
PICIC Growth Fund - Total 3.39% -0.72% 35.41% 58.55% 3.19%PICIC Growth Fund - Frozen -1.07% -0.14% 32.66% 91.68% -10.87%PICIC Growth Fund - Ex-Frozen 9.00% -1.69% 35.15% 39.32% 12.33%Benchmark 9.84% 16.01% 41.16% 52.20% 10.45%
PICIC Investment Fund - Total 4.11% -1.12% 35.39% 54.85% 4.27%PICIC Investment Fund - Frozen -1.58% -0.35% 32.93% 92.92% -10.87%PICIC Investment Fund - Ex-Frozen 9.08% -1.96% 34.82% 39.18% 11.24%Benchmark 9.84% 16.01% 41.16% 52.20% 10.45%
* Since inception
** Since conversion from closed end to open end
SINCE INCEPTION PERFORMANCE
Risk Disclaimer: This publication is for informational purposes only and nothing herein should be construed as a solicitation, recommendation or an offer to buy or sell any fund. All investments in mutual funds are subject to market risks. Past performance is not necessarily indicative of future results. Please read the Offering Document to understand the investment policies and risks involved including risk disclosure for special feature.
Performance History MAY 2017
LAST FIVE YEAR PERFORMANCE

Disclaimer : This publication is for informational purposes only and nothing herein should be construed as a solicitation, recommendation or an offer to buy or sell any fund. All investments in mutual funds are subject to market risks. The NAV based prices of units and any dividends/returns thereon are dependent on forces and factors affecting the capital markets. These may go up or down based on market conditions. Past performance is not necessarily indicative of future results.down based on market conditions. Past performance is not necessarily indicative of future results.
Three Simple Steps to Invest:
1. Make payment through cheque / demand draft in favor of “CDC-Trustee HBL (Name of fund) ”
E.g: CDC-Trustee HBL Islamic Money Market Fund
2. Attach the documents as specified in the Account Opening Form
3. Submit the required documents along with payment at our Karachi office, Lahore Office or
Islamabad Office
HOW TO INVEST?
Karachi Head Office Address24-C, Khayaban-e-Hafiz, Phase VI,D.H.A, Karachi
Tel: (92-21) 111-425-262Fax: (92-21) 35240634
Lahore Office Address102-103, Upper Mall, Lahore
Tel: (92-42) 36281610 Fax: (92-42) 36281686
Islamabad Office AddressHBL Corporate Center, HBL Building, Jinnah Avenue, Islamabad
Tel: (92-51) 2821183Fax: (92-51) 2822206

![Received: 2016.02.21 The Specific Protein Kinase R (PKR ...shown that PKR participates in neurodegenerative processes with neurotoxicity [12,13]. Peel and Couturier considered PKR](https://img.pdfslide.net/doc/110x75/5e45e3e2e3e94073247c9161/received-20160221-the-specific-protein-kinase-r-pkr-shown-that-pkr-participates.jpg)