Embed Size (px)
Citation preview
Fundamentals of Reform/HFMA Update
Melinda HancockNational Chair Elect
West Virginia ChapterJanuary 15, 2015
2
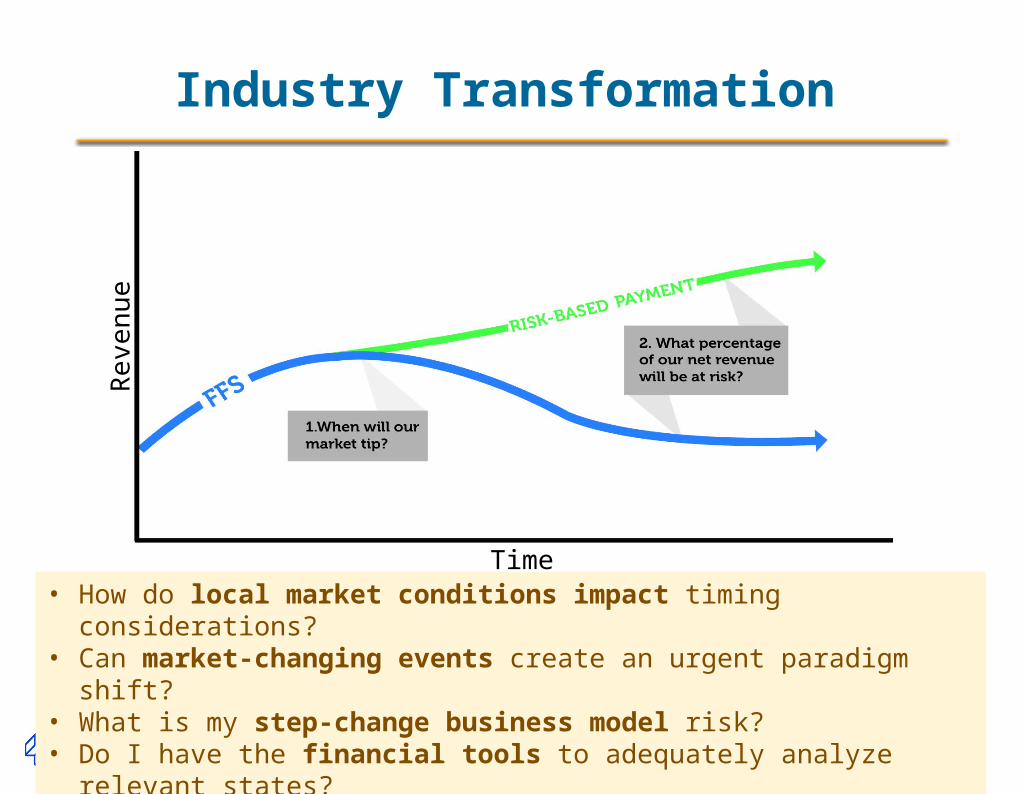
Our Transformational Point of View
3
Re
ven
ue
Time• How do local market conditions impact timing considerations?• Can market-changing events create an urgent paradigm shift?• What is my step-change business model risk?• Do I have the financial tools to adequately analyze relevant states?
Industry Transformation
Growth in Risk Based Contracts
The Advisory Board reported last summer that risk-based, total-cost-of-care contracts with large multi-hospital systems had more than doubled since 2011 from 14 to 35 percent. Similar results for bundled payments have occurred with commercial payers around the country.
United Healthcare, the nation’s largest health insurer, announced they will double their accountable care contracts by 2017 ($20 billion of United Healthcare’s 2013 payments were tied to quality and cost efficiency measures.)
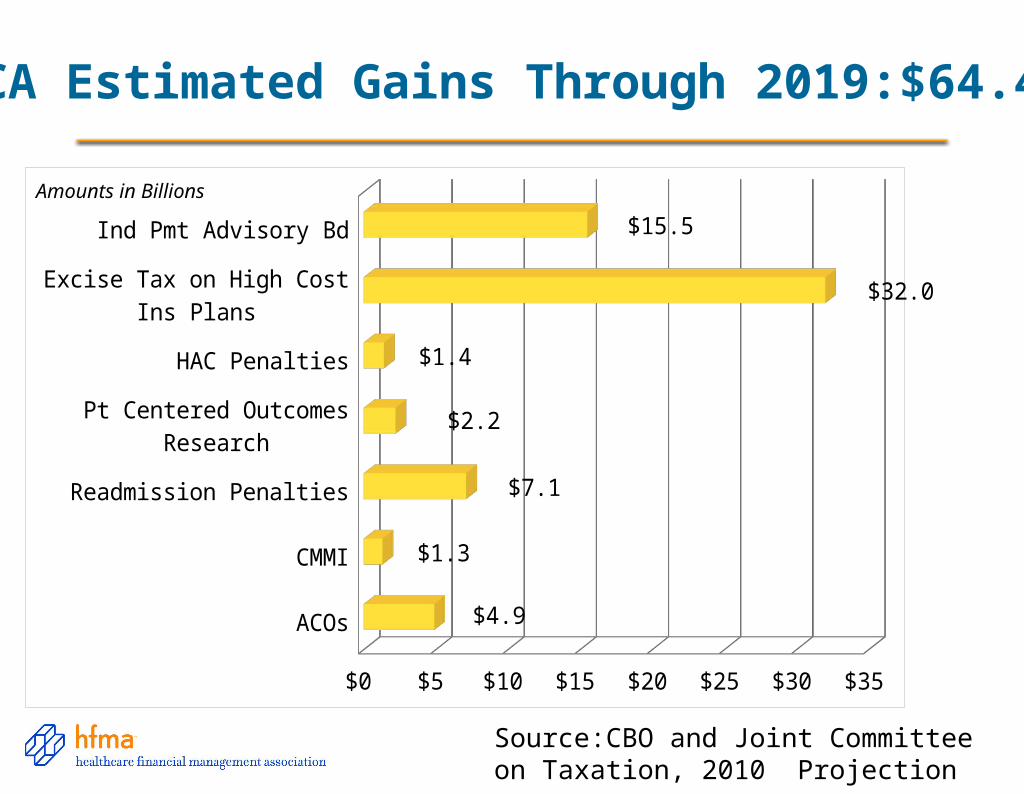
Source:CBO and Joint Committee on Taxation, 2010 Projection
ACA Estimated Gains Through 2019:$64.4B
ACOs
CMMI
Readmission Penalties
Pt Centered Outcomes Research
HAC Penalties
Excise Tax on High Cost Ins Plans
Ind Pmt Advisory Bd
$0 $5 $10 $15 $20 $25 $30 $35
$4.9
$1.3
$7.1
$2.2
$1.4
$32.0
$15.5
Amounts in Billions
6
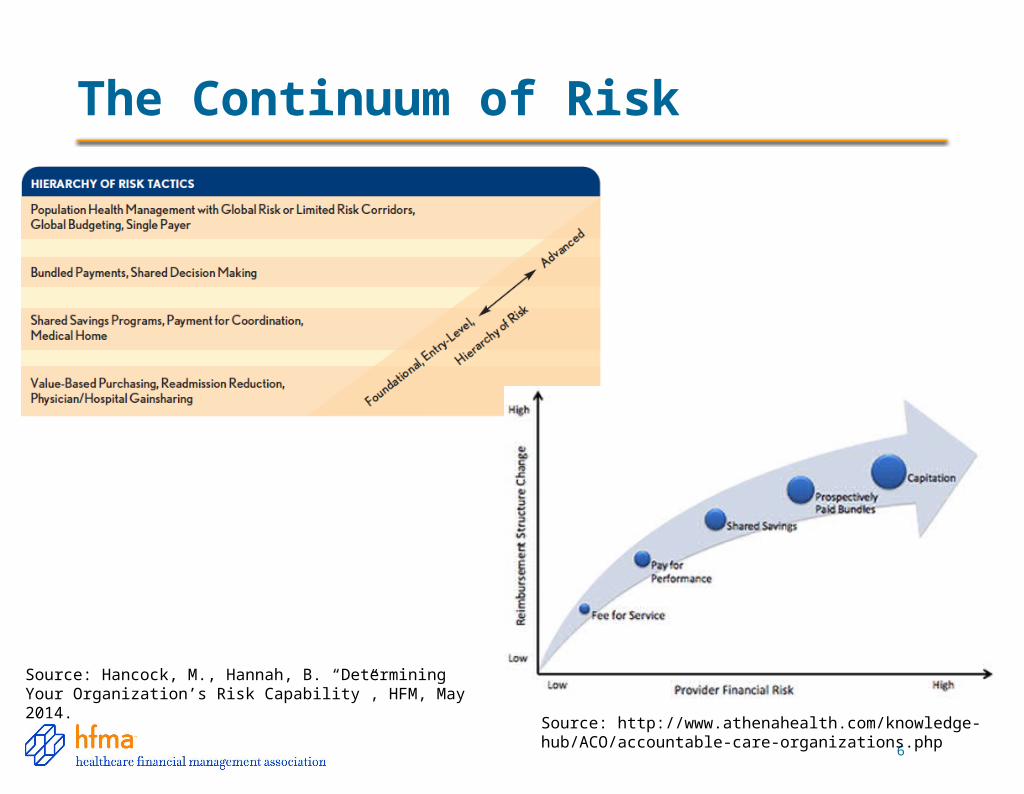
The Continuum of Risk
Source: http://www.athenahealth.com/knowledge-hub/ACO/accountable-care-organizations.php
Source: Hancock, M., Hannah, B. “Determining Your Organization’s Risk Capability”, HFM, May 2014.
Alignment of Strategy and Metrics
Questions to Ask
• How many metrics am I tracking?
• How many metrics are duplicated? Do they have the same numerator and denominator? Source?
• Are they aligned with our results and strategic goals?
• What contracts are coming up for renewal that should have new metrics or should be at risk (mgd care, medical directorships, PMAs, etc.)
• What are we focused on?
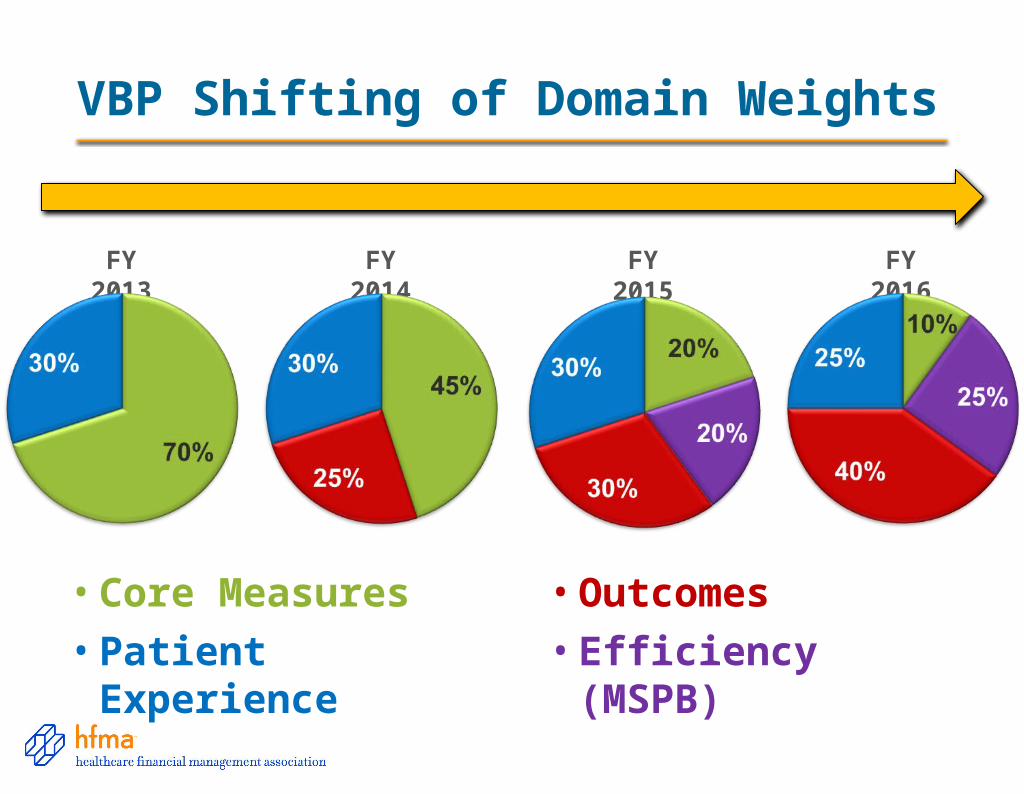
VBP Shifting of Domain Weights
FY 2013 FY 2014 FY 2015 FY 2016
• Core Measures
• Patient Experience • Efficiency (MSPB)
• Outcomes
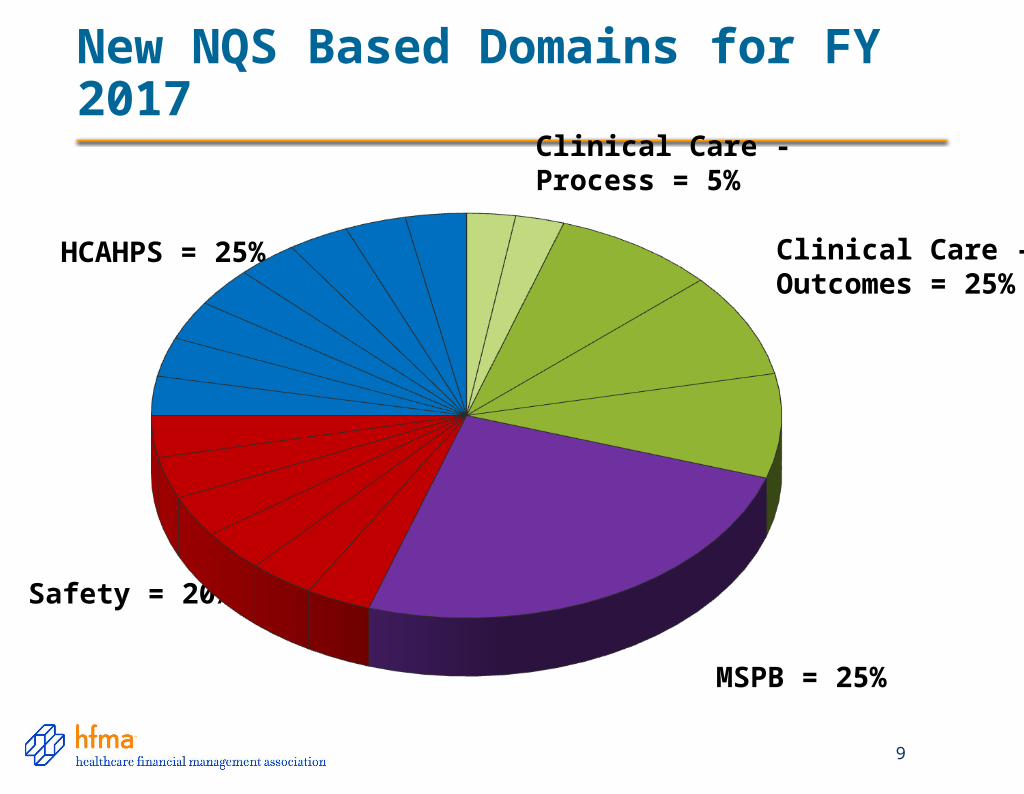
New NQS Based Domains for FY 2017
9
HCAHPS = 25%
Safety = 20%
MSPB = 25%
Clinical Care - Process = 5%
Clinical Care - Outcomes = 25%
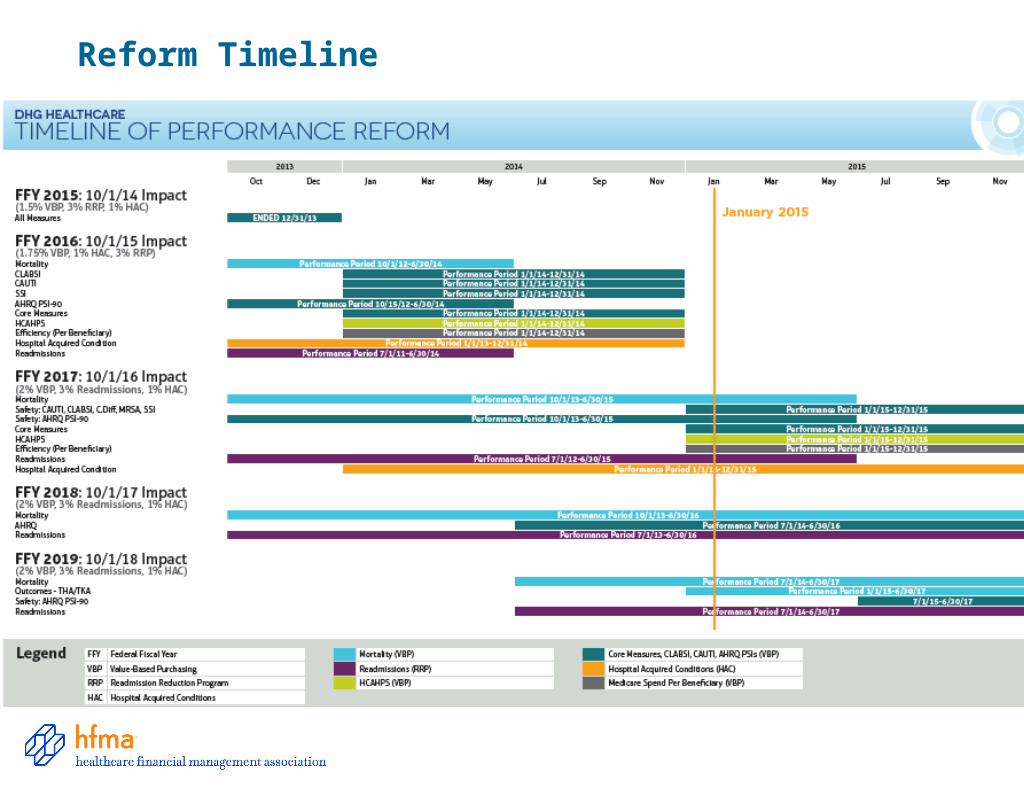
Reform Timeline
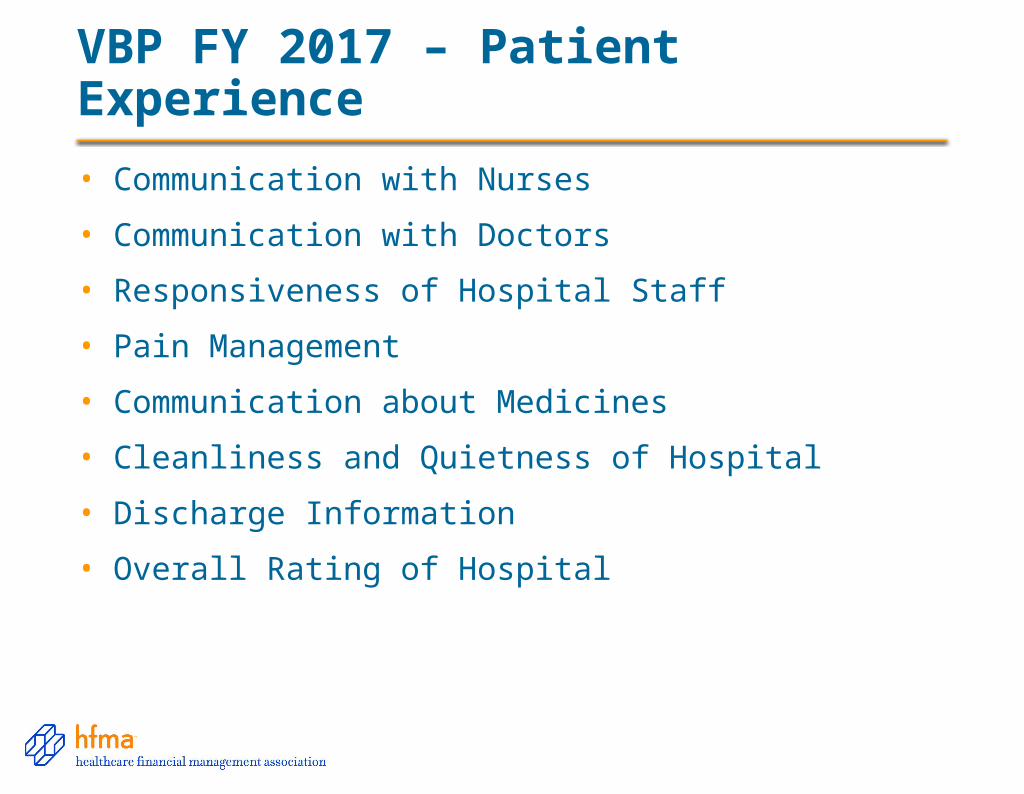
VBP FY 2017 – Patient Experience
• Communication with Nurses
• Communication with Doctors
• Responsiveness of Hospital Staff
• Pain Management
• Communication about Medicines
• Cleanliness and Quietness of Hospital
• Discharge Information
• Overall Rating of Hospital
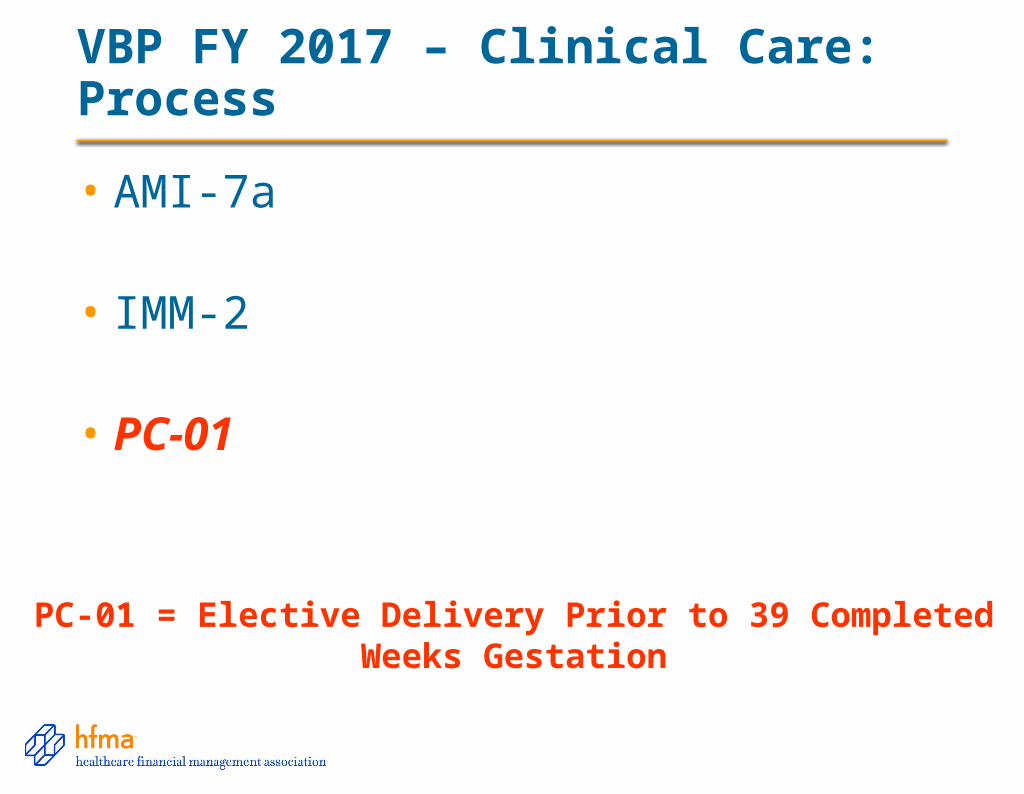
VBP FY 2017 – Clinical Care: Process
• AMI-7a
• IMM-2
• PC-01
PC-01 = Elective Delivery Prior to 39 Completed Weeks Gestation
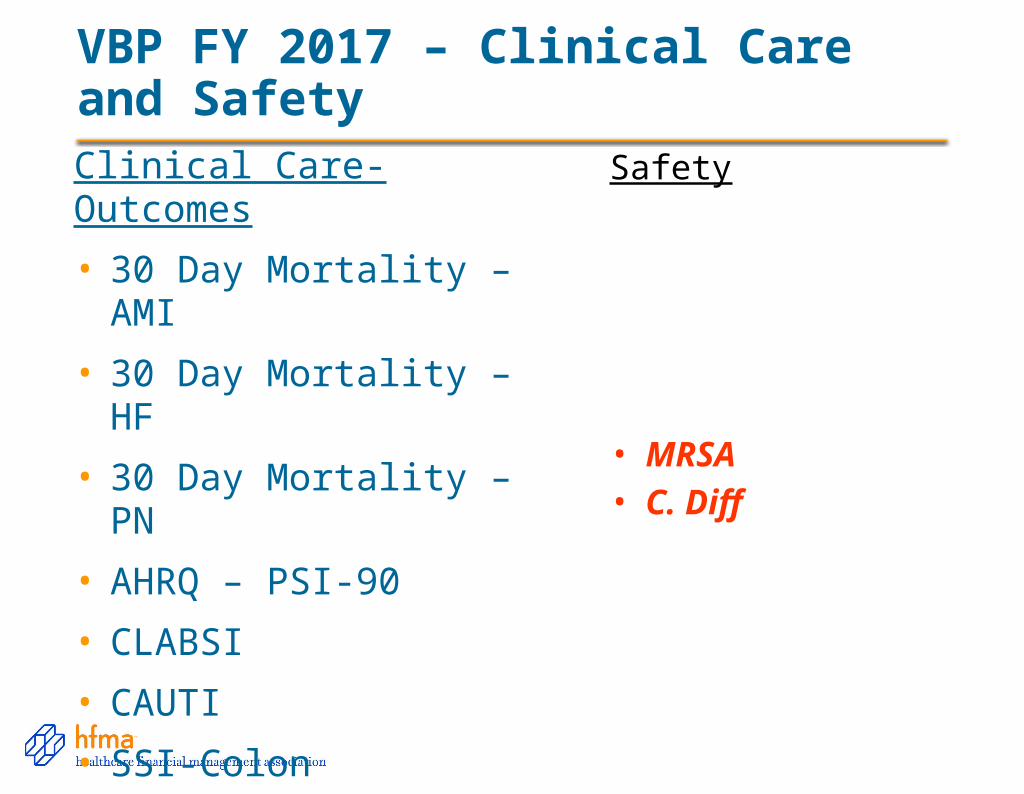
VBP FY 2017 – Clinical Care and SafetyClinical Care- Outcomes
• 30 Day Mortality – AMI
• 30 Day Mortality – HF
• 30 Day Mortality – PN
• AHRQ – PSI-90
• CLABSI
• CAUTI
• SSI-Colon
• SSI-Abdominal Hyster.
Safety
• MRSA• C. Diff
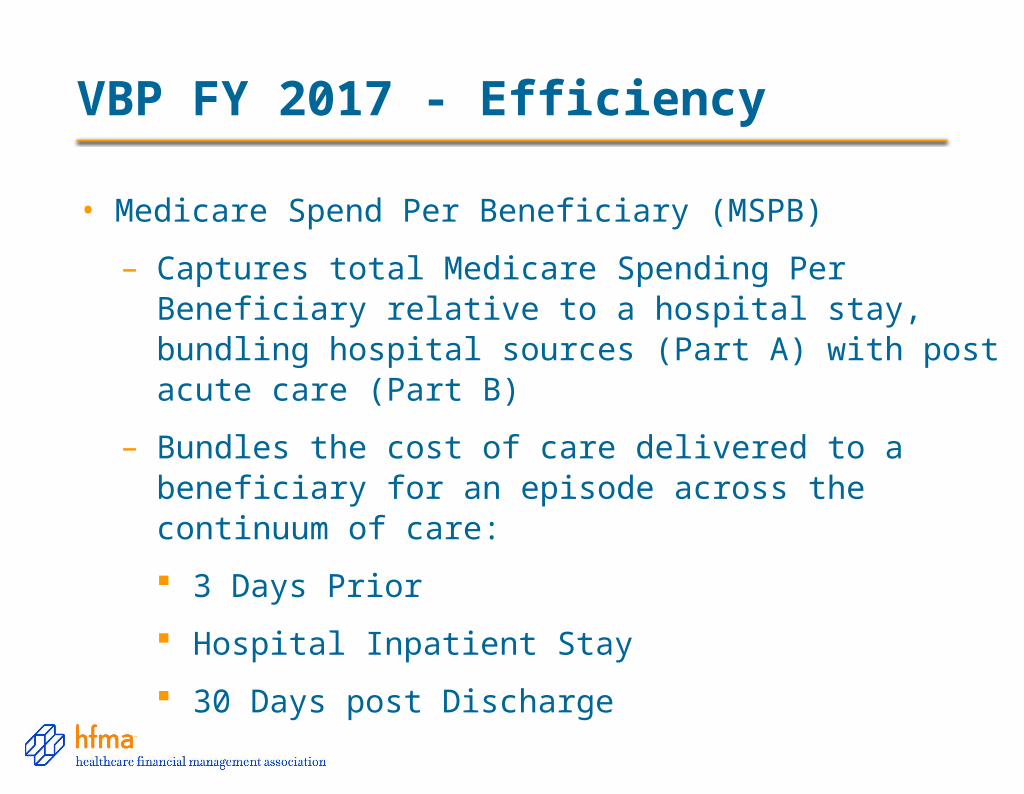
VBP FY 2017 - Efficiency
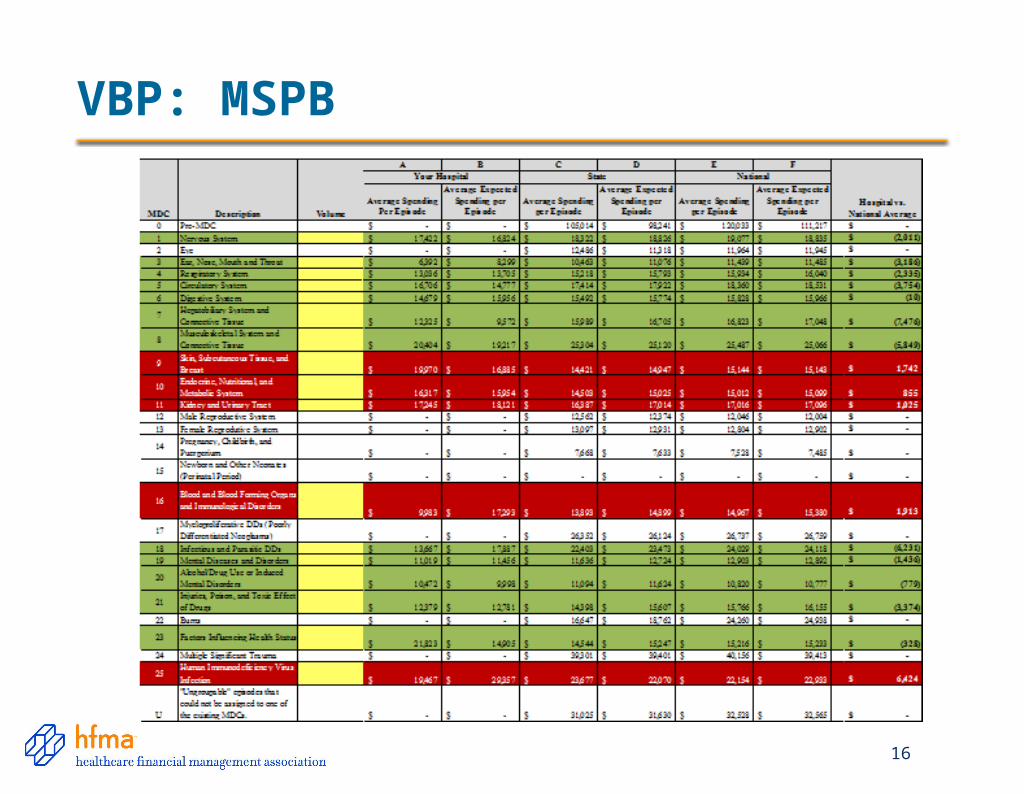
• Medicare Spend Per Beneficiary (MSPB)
– Captures total Medicare Spending Per Beneficiary relative to a hospital stay, bundling hospital sources (Part A) with post acute care (Part B)
– Bundles the cost of care delivered to a beneficiary for an episode across the continuum of care:
3 Days Prior
Hospital Inpatient Stay
30 Days post Discharge
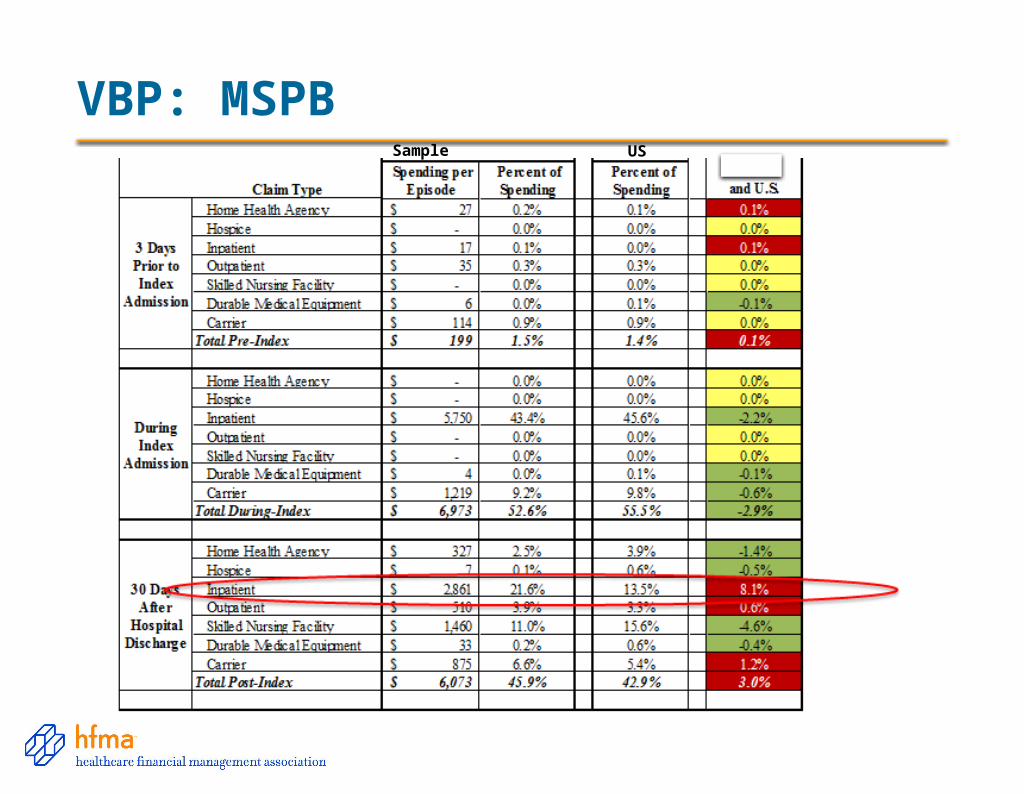
VBP: MSPBSample US
VBP: MSPB
16
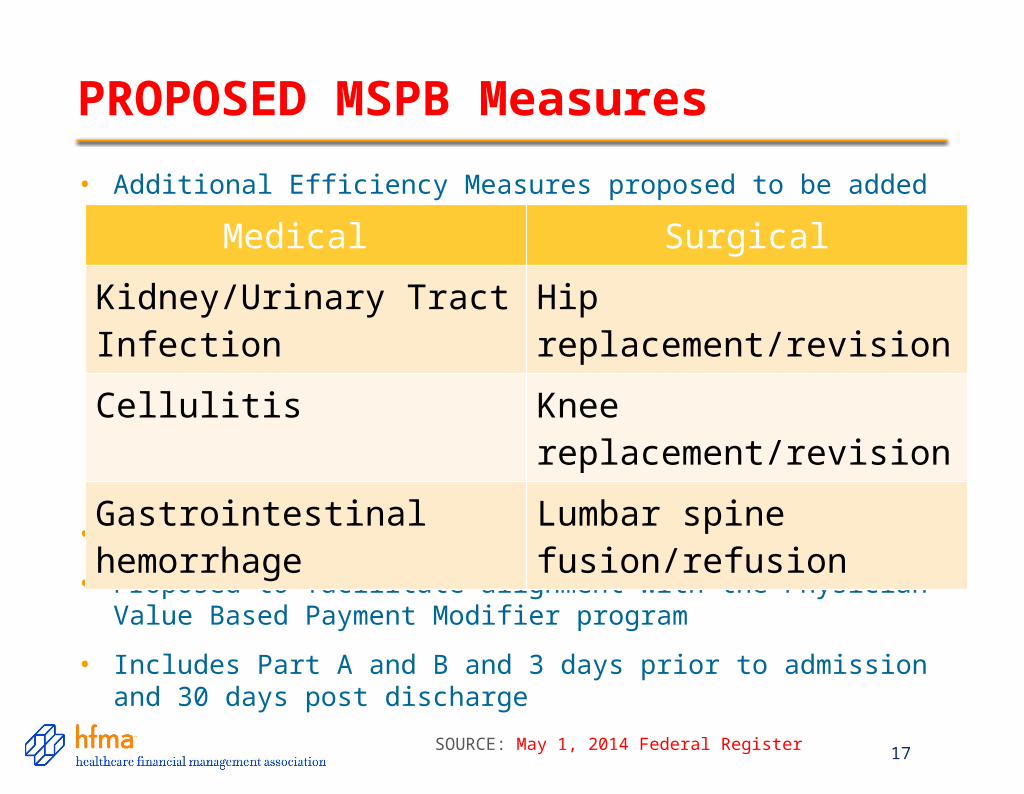
PROPOSED MSPB Measures
17
• Additional Efficiency Measures proposed to be added
• Risk Adjusted similarly to MSPB
• Proposed to facilitate alignment with the Physician Value Based Payment Modifier program
• Includes Part A and B and 3 days prior to admission and 30 days post discharge
Medical Surgical
Kidney/Urinary Tract Infection
Hip replacement/revision
Cellulitis Knee replacement/revision
Gastrointestinal hemorrhage
Lumbar spine fusion/refusion
SOURCE: May 1, 2014 Federal Register
Earned Back Unearned Available $$ % Earned
CGH $288,853 $540,406 $829,259 34.83%
$288,853
$0 $829,259 Chesapeake General Performance
VBP FY'13 TOTAL PERFORMANCE
Breakeven Point: $451,333
Earned Back Unearned Available $$ % Earned
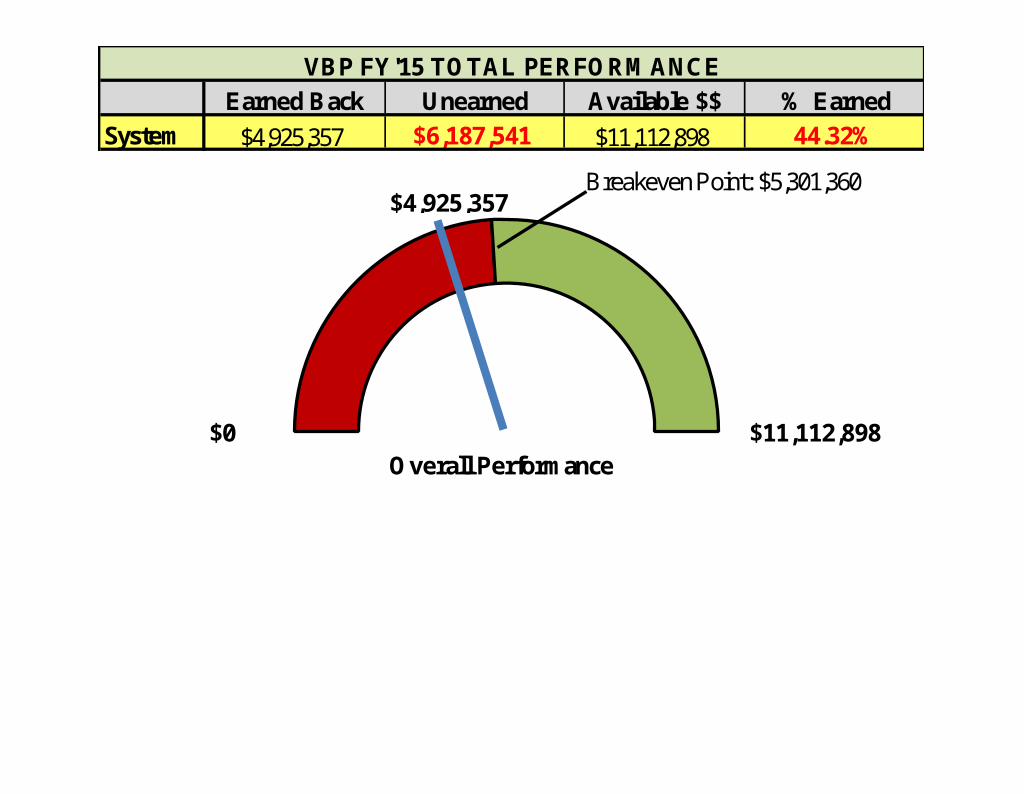
System $4,925,357 $6,187,541 $11,112,898 44.32%
$0 $11,112,898Overall Performance
VBP FY'15 TOTAL PERFORMANCE
$4,925,357Breakeven Point: $5,301,360
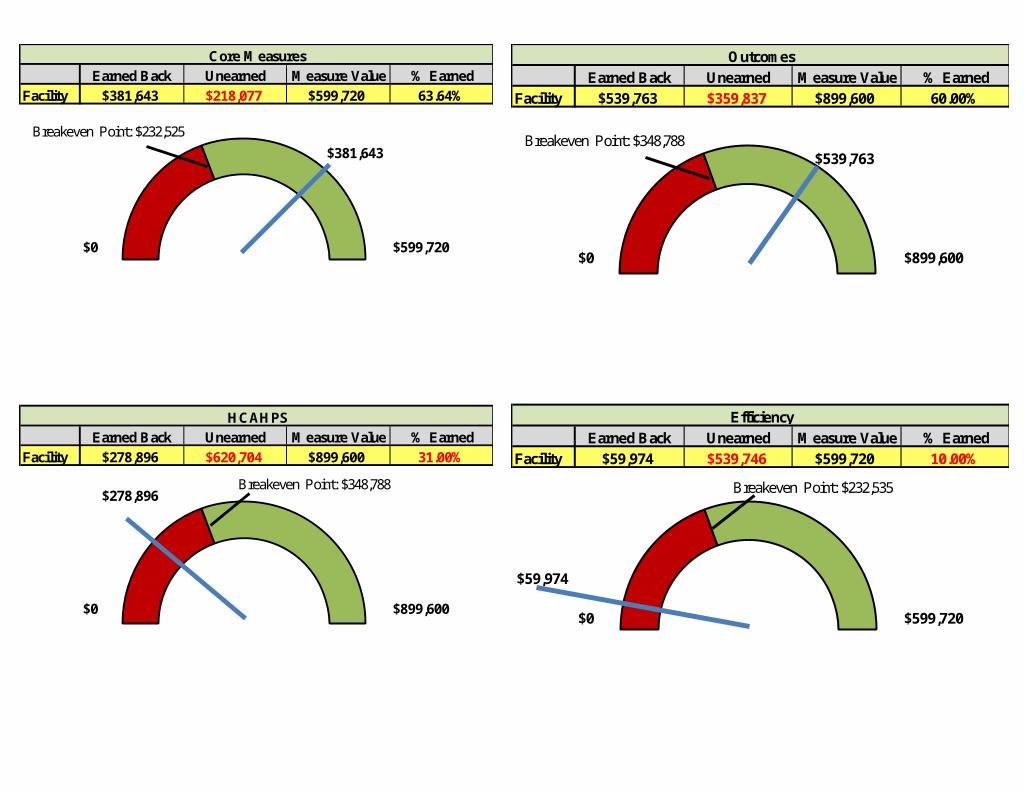
Earned Back Unearned Measure Value % Earned
Facility $381,643 $218,077 $599,720 63.64%
$381,643
$0 $599,720
Earned Back Unearned Measure Value % Earned
Facility $278,896 $620,704 $899,600 31.00%
$278,896
$0 $899,600
Core Measures
HCAHPS
Breakeven Point: $232,525
Breakeven Point: $348,788
Earned Back Unearned Measure Value % Earned
Facility $539,763 $359,837 $899,600 60.00%
$539,763
$0 $899,600
Earned Back Unearned Measure Value % Earned
Facility $59,974 $539,746 $599,720 10.00%
$59,974
$0 $599,720
Outcomes
Efficiency
Breakeven Point: $348,788
Breakeven Point: $232,535
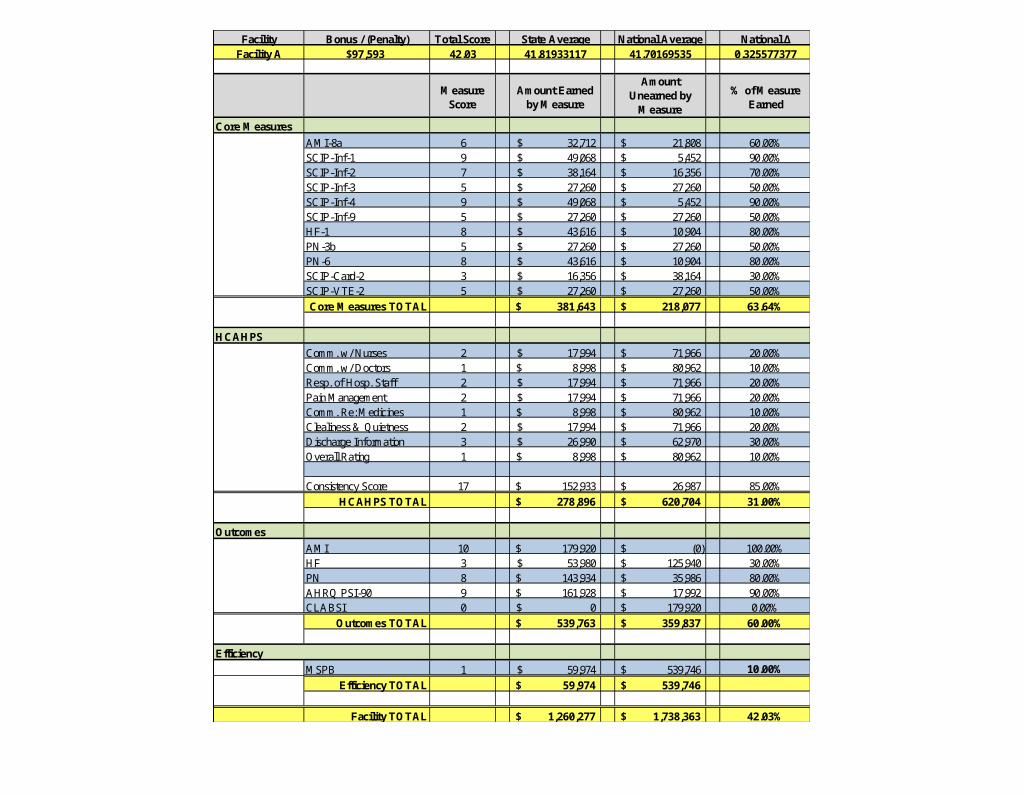
Facility Bonus / (Penalty) Total Score State Average National Average National ΔFacility A $97,593 42.03 41.81933117 41.70169535 0.325577377
Measure Score
Amount Earned by Measure
Amount Unearned by
Measure
% of Measure Earned
Core Measures
AMI-8a 6 32,712$ 21,808$ 60.00%SCIP-Inf-1 9 49,068$ 5,452$ 90.00%SCIP-Inf-2 7 38,164$ 16,356$ 70.00%SCIP-Inf-3 5 27,260$ 27,260$ 50.00%SCIP-Inf-4 9 49,068$ 5,452$ 90.00%SCIP-Inf-9 5 27,260$ 27,260$ 50.00%HF-1 8 43,616$ 10,904$ 80.00%PN-3b 5 27,260$ 27,260$ 50.00%PN-6 8 43,616$ 10,904$ 80.00%SCIP-Card-2 3 16,356$ 38,164$ 30.00%SCIP-VTE-2 5 27,260$ 27,260$ 50.00%
Core Measures TOTAL 381,643$ 218,077$ 63.64%
HCAHPS
Comm. w/ Nurses 2 17,994$ 71,966$ 20.00%Comm. w/ Doctors 1 8,998$ 80,962$ 10.00%Resp. of Hosp. Staff 2 17,994$ 71,966$ 20.00%Pain Management 2 17,994$ 71,966$ 20.00%Comm. Re: Medicines 1 8,998$ 80,962$ 10.00%Clealiness & Quietness 2 17,994$ 71,966$ 20.00%Discharge Information 3 26,990$ 62,970$ 30.00%Overall Rating 1 8,998$ 80,962$ 10.00%
Consistency Score 17 152,933$ 26,987$ 85.00%
HCAHPS TOTAL 278,896$ 620,704$ 31.00%
Outcomes
AMI 10 179,920$ (0)$ 100.00%HF 3 53,980$ 125,940$ 30.00%PN 8 143,934$ 35,986$ 80.00%AHRQ PSI-90 9 161,928$ 17,992$ 90.00%CLABSI 0 0$ 179,920$ 0.00%
Outcomes TOTAL 539,763$ 359,837$ 60.00%
Efficiency
MSPB 1 59,974$ 539,746$ 10.00%
Efficiency TOTAL 59,974$ 539,746$
Facility TOTAL 1,260,277$ 1,738,363$ 42.03%
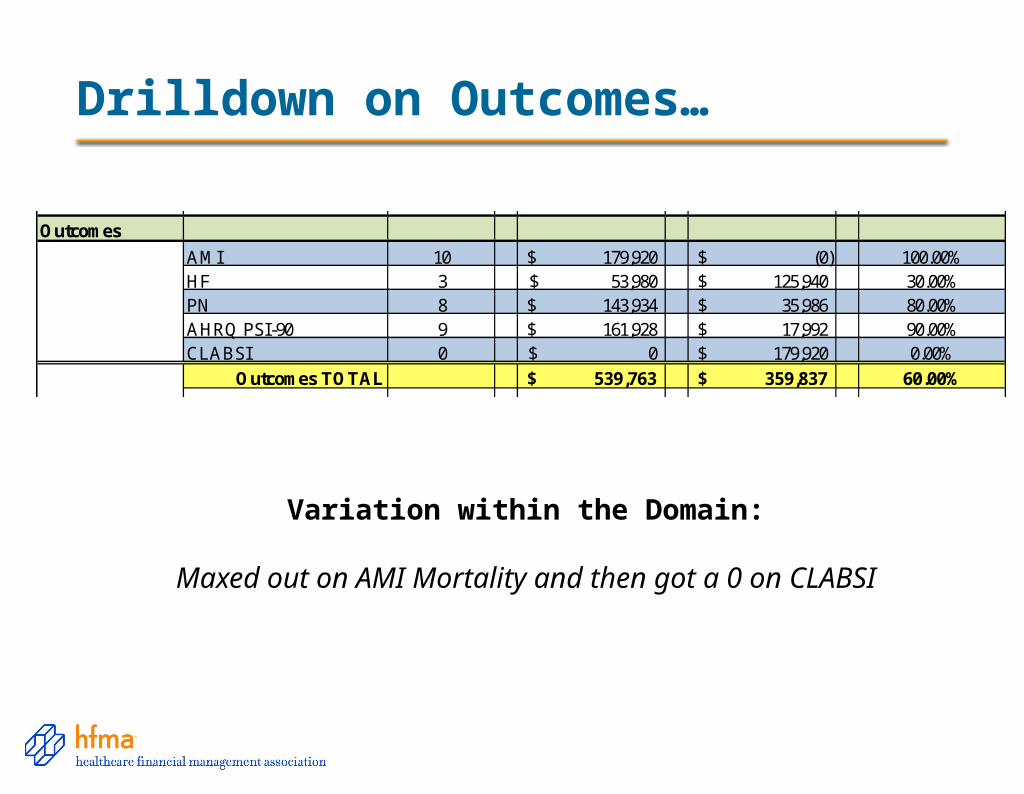
Drilldown on Outcomes…
Facility Bonus / (Penalty)Facility A $97,593 42.03 41.81933117 41.70169535 0.325577377
Core Measures
AMI-8a 6 32,712$ 21,808$ 60.00%SCIP-Inf-1 9 49,068$ 5,452$ 90.00%SCIP-Inf-2 7 38,164$ 16,356$ 70.00%SCIP-Inf-3 5 27,260$ 27,260$ 50.00%SCIP-Inf-4 9 49,068$ 5,452$ 90.00%SCIP-Inf-9 5 27,260$ 27,260$ 50.00%HF-1 8 43,616$ 10,904$ 80.00%PN-3b 5 27,260$ 27,260$ 50.00%PN-6 8 43,616$ 10,904$ 80.00%SCIP-Card-2 3 16,356$ 38,164$ 30.00%SCIP-VTE-2 5 27,260$ 27,260$ 50.00%
Core Measures TOTAL 381,643$ 218,077$ 63.64%
HCAHPS
Comm. w/ Nurses 2 17,994$ 71,966$ 20.00%Comm. w/ Doctors 1 8,998$ 80,962$ 10.00%Resp. of Hosp. Staff 2 17,994$ 71,966$ 20.00%Pain Management 2 17,994$ 71,966$ 20.00%Comm. Re: Medicines 1 8,998$ 80,962$ 10.00%Clealiness & Quietness 2 17,994$ 71,966$ 20.00%Discharge Information 3 26,990$ 62,970$ 30.00%Overall Rating 1 8,998$ 80,962$ 10.00%
Consistency Score 17 152,933$ 26,987$ 85.00%
HCAHPS TOTAL 278,896$ 620,704$ 31.00%
Outcomes
AMI 10 179,920$ (0)$ 100.00%HF 3 53,980$ 125,940$ 30.00%PN 8 143,934$ 35,986$ 80.00%AHRQ PSI-90 9 161,928$ 17,992$ 90.00%CLABSI 0 0$ 179,920$ 0.00%
Outcomes TOTAL 539,763$ 359,837$ 60.00%
Efficiency
MSPB 1 59,974$ 539,746$ 10.00%
Efficiency TOTAL 59,974$ 539,746$
Facility TOTAL 1,260,277$ 1,738,363$ 42.03%Variation within the Domain:
Maxed out on AMI Mortality and then got a 0 on CLABSI
22
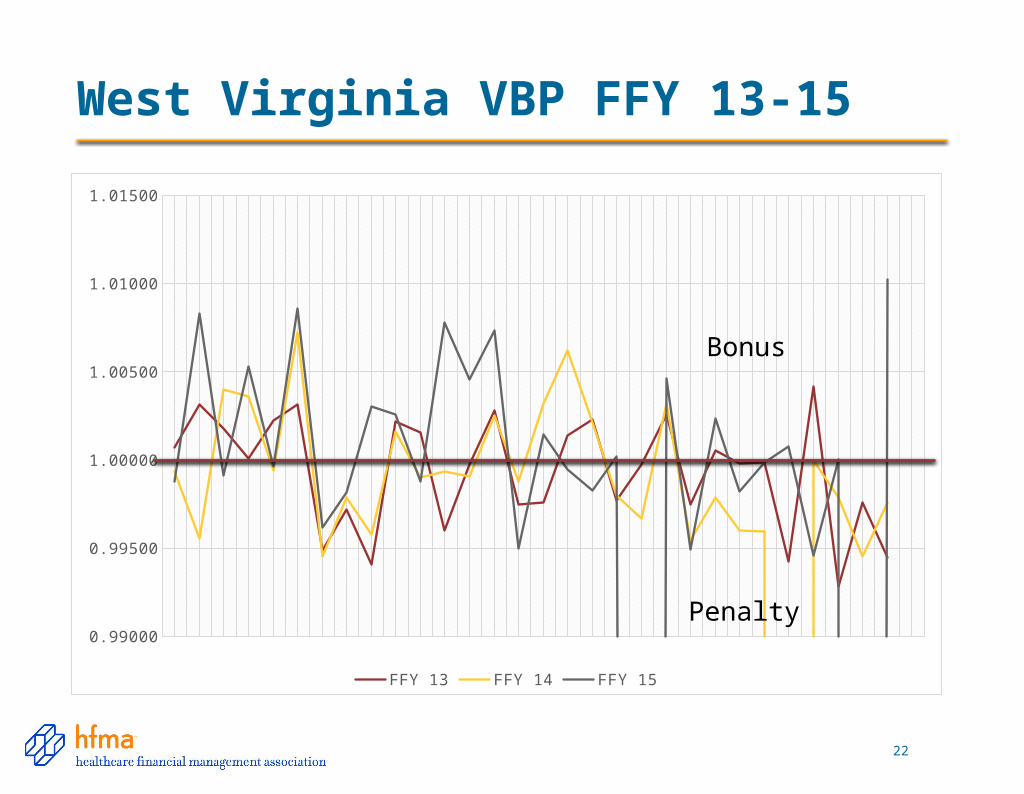
West Virginia VBP FFY 13-15
0.99000
0.99500
1.00000
1.00500
1.01000
1.01500
FFY 13 FFY 14 FFY 15
Penalty
Bonus
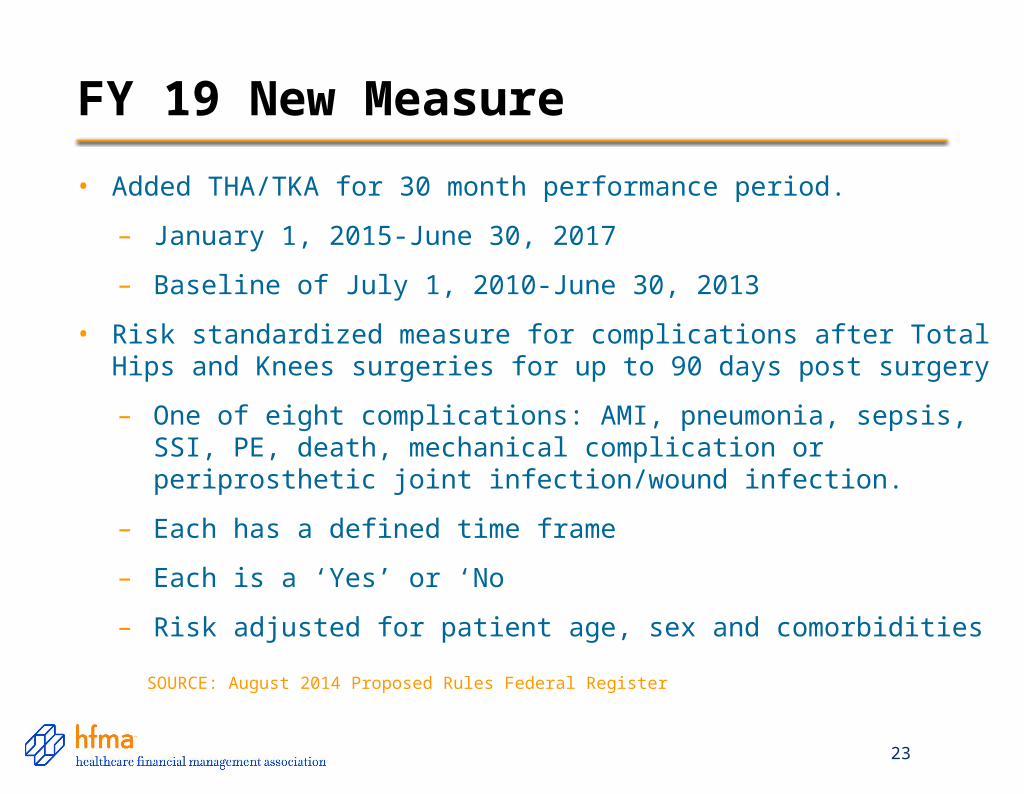
FY 19 New Measure
23
• Added THA/TKA for 30 month performance period.
– January 1, 2015-June 30, 2017
– Baseline of July 1, 2010-June 30, 2013
• Risk standardized measure for complications after Total Hips and Knees surgeries for up to 90 days post surgery
– One of eight complications: AMI, pneumonia, sepsis, SSI, PE, death, mechanical complication or periprosthetic joint infection/wound infection.
– Each has a defined time frame
– Each is a ‘Yes’ or ‘No
– Risk adjusted for patient age, sex and comorbidities
SOURCE: August 2014 Proposed Rules Federal Register

Reform Timeline
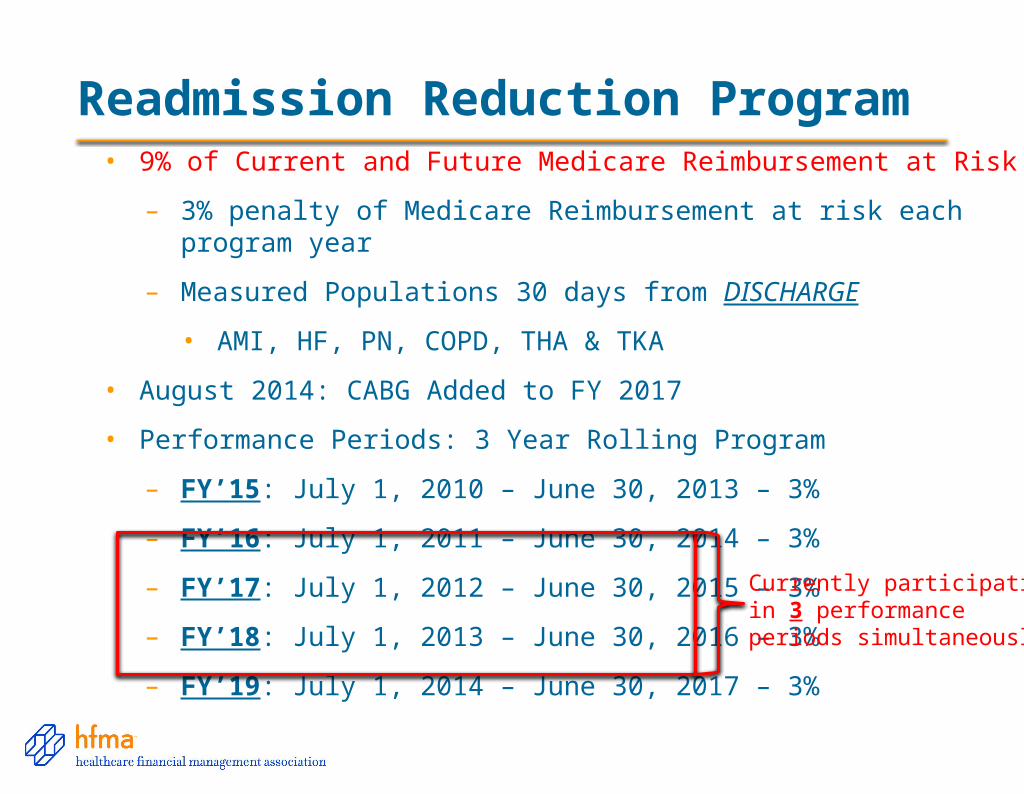
Readmission Reduction Program• 9% of Current and Future Medicare Reimbursement at Risk
– 3% penalty of Medicare Reimbursement at risk each program year
– Measured Populations 30 days from DISCHARGE
• AMI, HF, PN, COPD, THA & TKA
• August 2014: CABG Added to FY 2017
• Performance Periods: 3 Year Rolling Program
– FY’15: July 1, 2010 – June 30, 2013 – 3%
– FY’16: July 1, 2011 – June 30, 2014 – 3%
– FY’17: July 1, 2012 – June 30, 2015 – 3%
– FY’18: July 1, 2013 – June 30, 2016 – 3%
– FY’19: July 1, 2014 – June 30, 2017 – 3%
Currently participating in 3 performance periods simultaneously
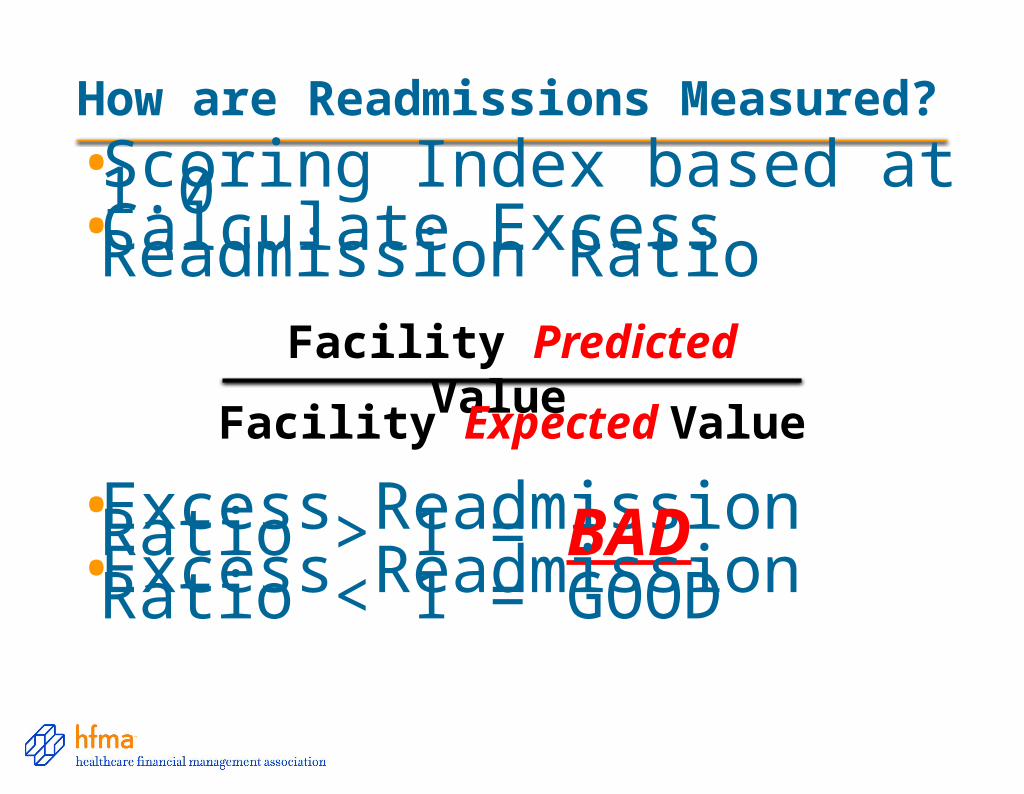
How are Readmissions Measured?
• Scoring Index based at 1.0• Calculate Excess Readmission Ratio
• Excess Readmission Ratio > 1 = BAD• Excess Readmission Ratio < 1 = GOOD
Facility Predicted Value
Facility Expected Value
27
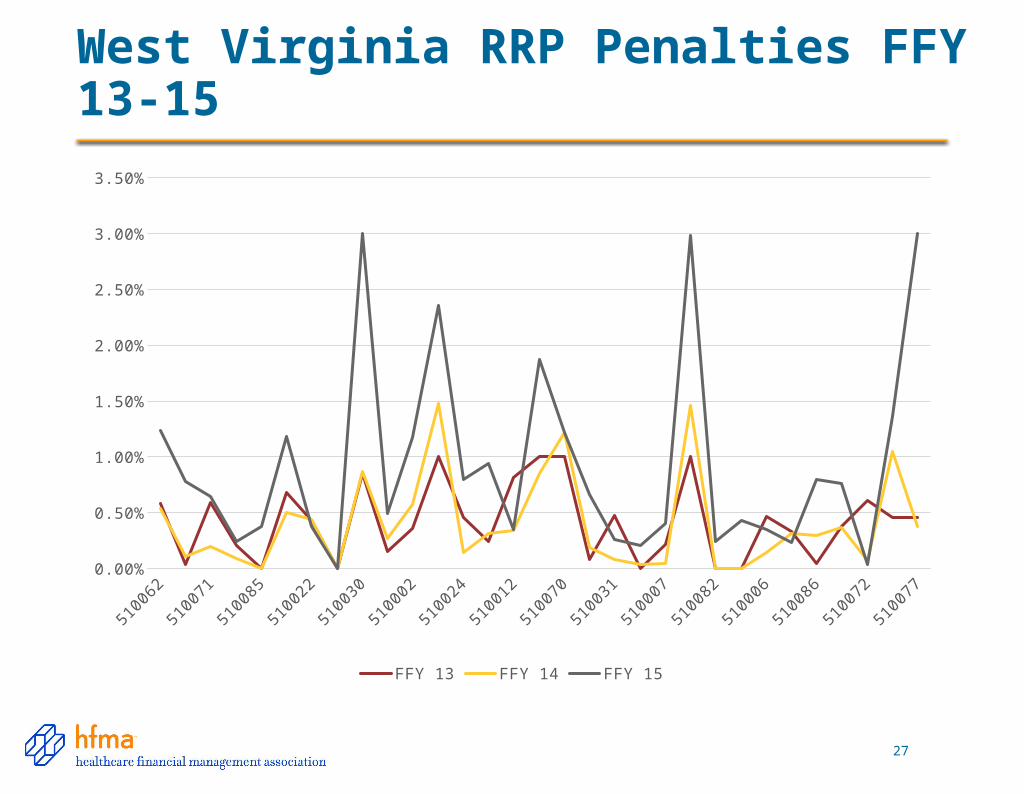
West Virginia RRP Penalties FFY 13-15
5100
62
5100
08
5100
71
5100
55
5100
85
5100
58
5100
22
5100
59
5100
30
5100
47
5100
02
5100
48
5100
24
5100
39
5100
12
5100
46
5100
70
5100
13
5100
31
5100
53
5100
07
5100
38
5100
82
5100
29
5100
06
5100
23
5100
86
5100
01
5100
72
5100
50
5100
770.00%
0.50%
1.00%
1.50%
2.00%
2.50%
3.00%
3.50%
FFY 13 FFY 14 FFY 15
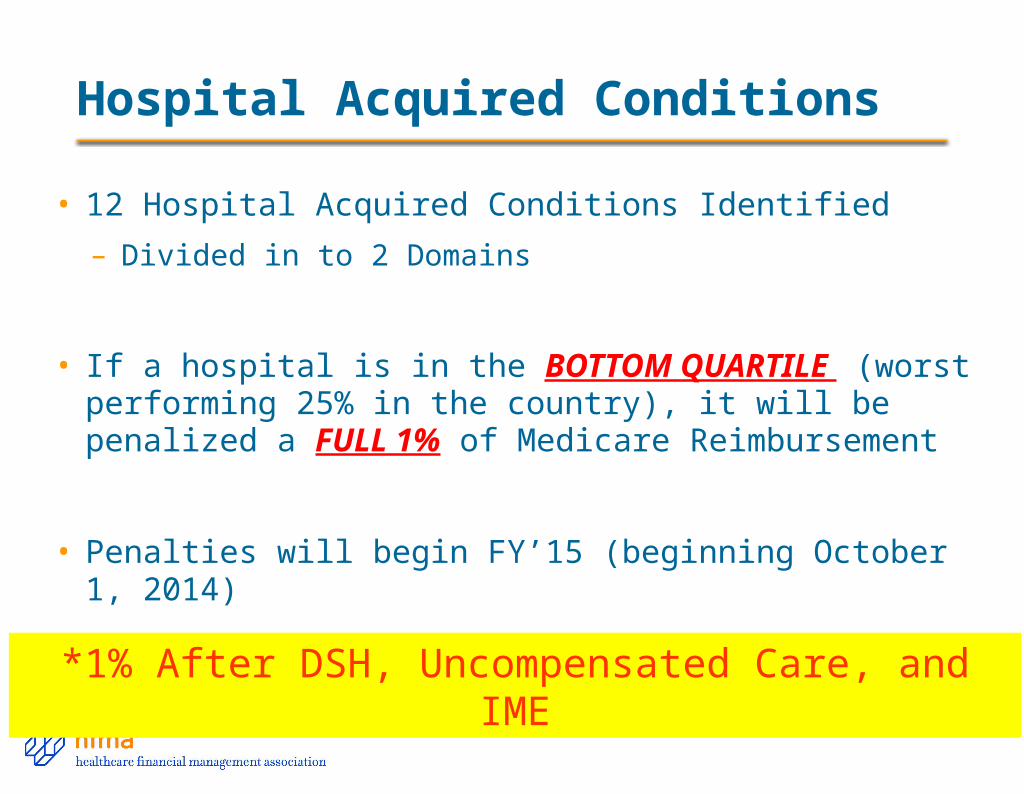
Hospital Acquired Conditions
• 12 Hospital Acquired Conditions Identified
– Divided in to 2 Domains
• If a hospital is in the BOTTOM QUARTILE (worst performing 25% in the country), it will be penalized a FULL 1% of Medicare Reimbursement
• Penalties will begin FY’15 (beginning October 1, 2014)*1% After DSH, Uncompensated Care, and IME
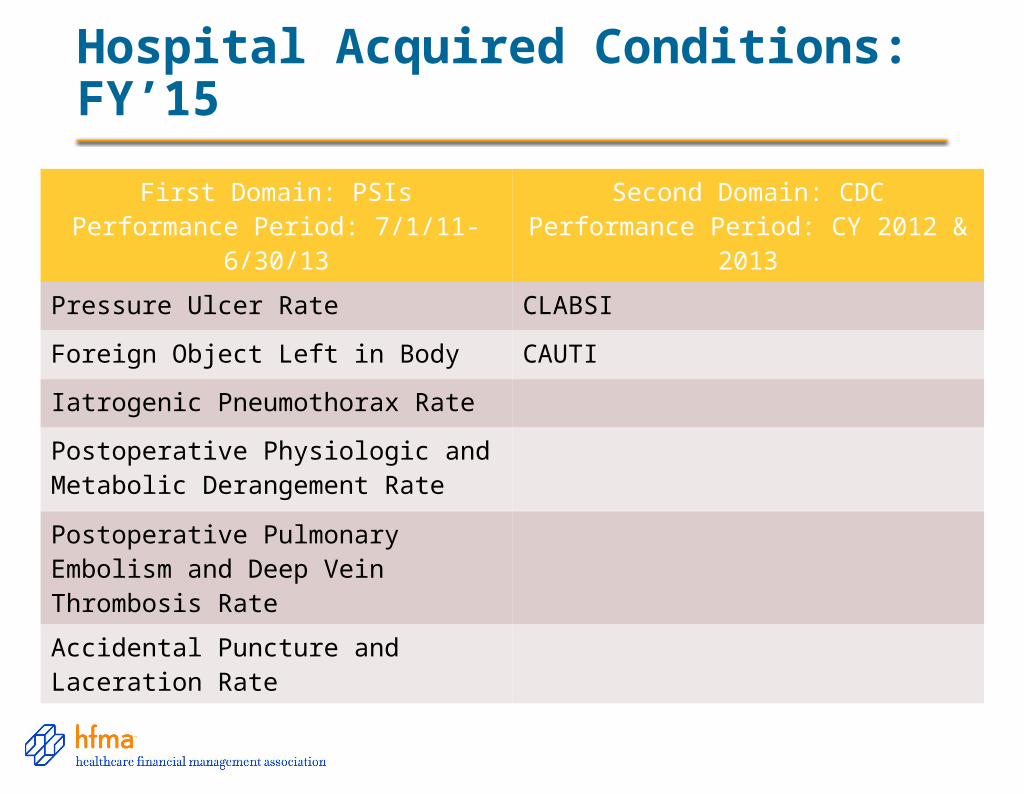
Hospital Acquired Conditions: FY’15
First Domain: PSIsPerformance Period: 7/1/11-6/30/13
Second Domain: CDCPerformance Period: CY 2012 & 2013
Pressure Ulcer Rate CLABSI
Foreign Object Left in Body CAUTI
Iatrogenic Pneumothorax Rate
Postoperative Physiologic and Metabolic Derangement Rate
Postoperative Pulmonary Embolism and Deep Vein Thrombosis Rate
Accidental Puncture and Laceration Rate
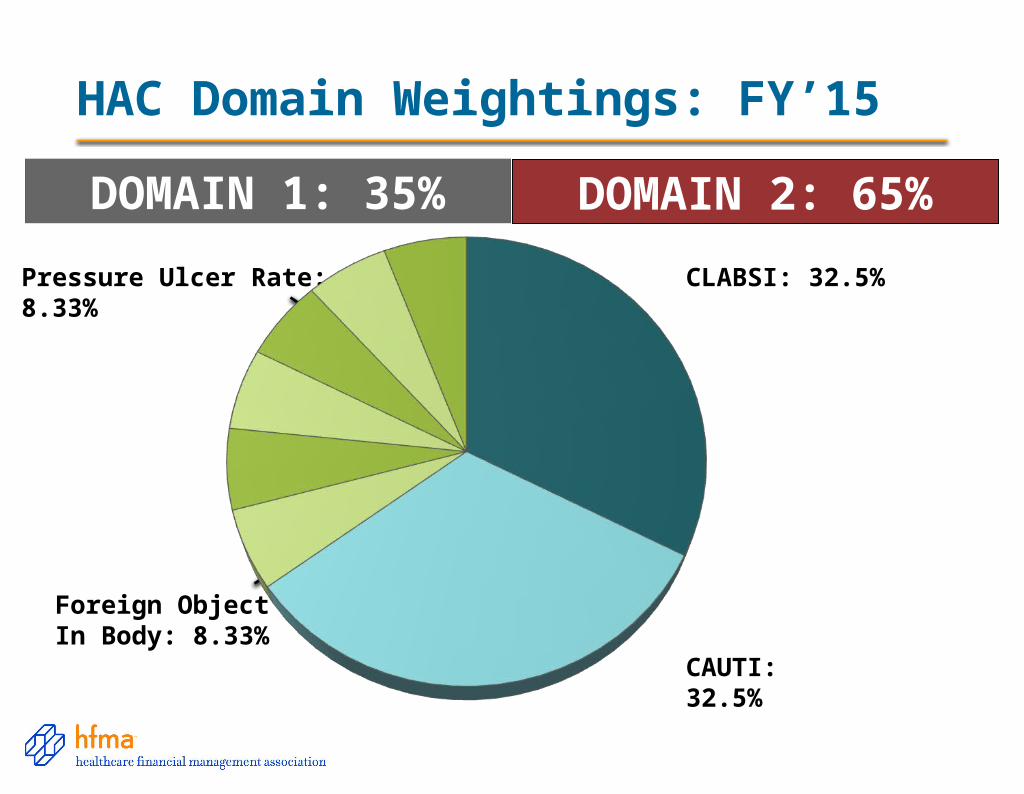
HAC Domain Weightings: FY’15
CLABSI: 32.5%
CAUTI: 32.5%
Pressure Ulcer Rate: 8.33%
Foreign Object LeftIn Body: 8.33%
DOMAIN 1: 35% DOMAIN 2: 65%
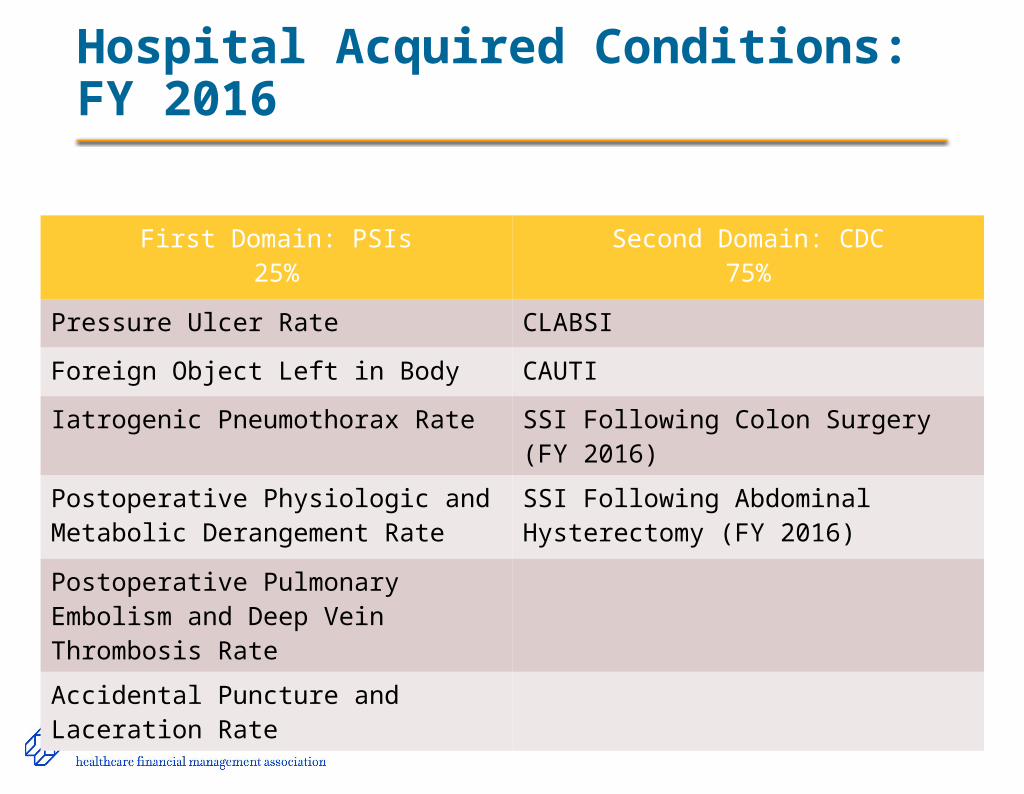
Hospital Acquired Conditions: FY 2016
First Domain: PSIs25%
Second Domain: CDC75%
Pressure Ulcer Rate CLABSI
Foreign Object Left in Body CAUTI
Iatrogenic Pneumothorax Rate SSI Following Colon Surgery (FY 2016)
Postoperative Physiologic and Metabolic Derangement Rate
SSI Following Abdominal Hysterectomy (FY 2016)
Postoperative Pulmonary Embolism and Deep Vein Thrombosis Rate
Accidental Puncture and Laceration Rate
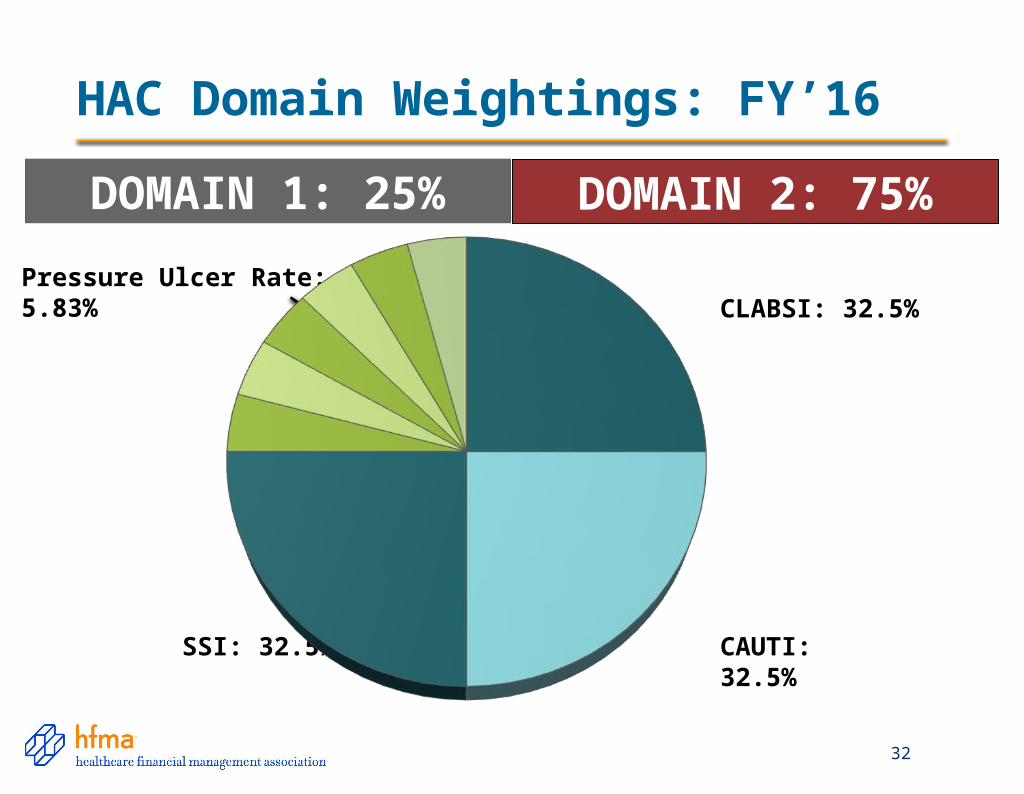
HAC Domain Weightings: FY’16
32
CLABSI: 32.5%
CAUTI: 32.5%
Pressure Ulcer Rate: 5.83%
SSI: 32.5%
DOMAIN 1: 25% DOMAIN 2: 75%
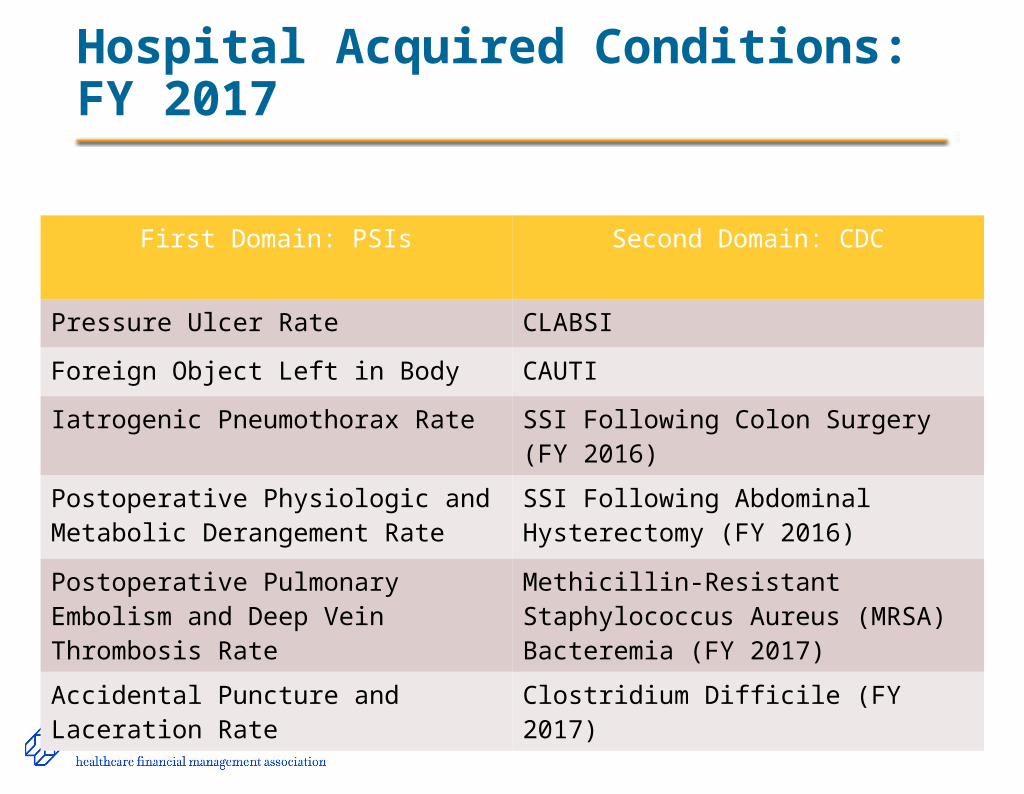
Hospital Acquired Conditions: FY 2017
First Domain: PSIs Second Domain: CDC
Pressure Ulcer Rate CLABSI
Foreign Object Left in Body CAUTI
Iatrogenic Pneumothorax Rate SSI Following Colon Surgery (FY 2016)
Postoperative Physiologic and Metabolic Derangement Rate
SSI Following Abdominal Hysterectomy (FY 2016)
Postoperative Pulmonary Embolism and Deep Vein Thrombosis Rate
Methicillin-Resistant Staphylococcus Aureus (MRSA) Bacteremia (FY 2017)
Accidental Puncture and Laceration Rate
Clostridium Difficile (FY 2017)

Reform Timeline
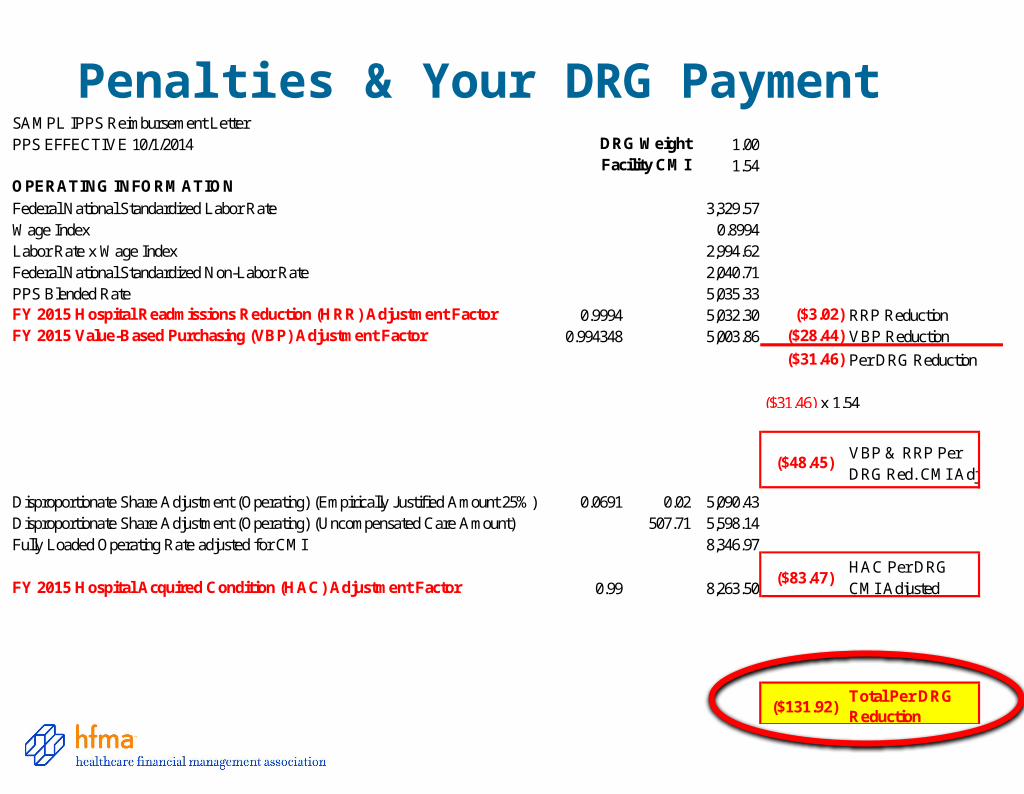
SAMPL IPPS Reimbursement LetterPPS EFFECTIVE 10/1/2014 DRG Weight 1.00
Facility CMI 1.54OPERATING INFORMATION
Federal National Standardized Labor Rate 3,329.57Wage Index 0.8994Labor Rate x Wage Index 2,994.62Federal National Standardized Non-Labor Rate 2,040.71PPS Blended Rate 5,035.33FY 2015 Hospital Readmissions Reduction (HRR) Adjustment Factor 0.9994 5,032.30 ($3.02) RRP ReductionFY 2015 Value-Based Purchasing (VBP) Adjustment Factor 0.994348 5,003.86 ($28.44) VBP Reduction
($31.46) Per DRG Reduction
($31.46) x 1.54
($48.45)VBP & RRP Per DRG Red. CMI Adj
Disproportionate Share Adjustment (Operating) (Empirically Justified Amount 25%) 0.0691 0.02 5,090.43Disproportionate Share Adjustment (Operating) (Uncompensated Care Amount) 507.71 5,598.14Fully Loaded Operating Rate adjusted for CMI 8,346.97
FY 2015 Hospital Acquired Condition (HAC) Adjustment Factor 0.99 8,263.50($83.47)
HAC Per DRG CMI Adjusted
($131.92)Total Per DRG Reduction
Penalties & Your DRG Payment
36
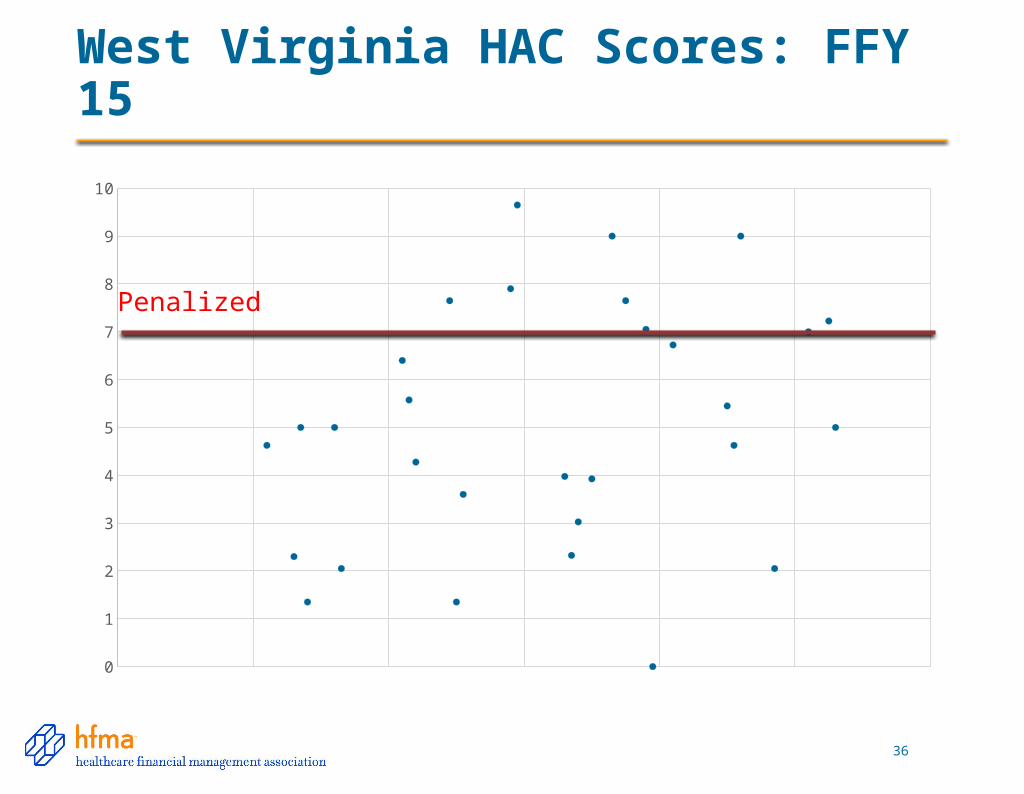
West Virginia HAC Scores: FFY 15
0
1
2
3
4
5
6
7
8
9
10
Penalized
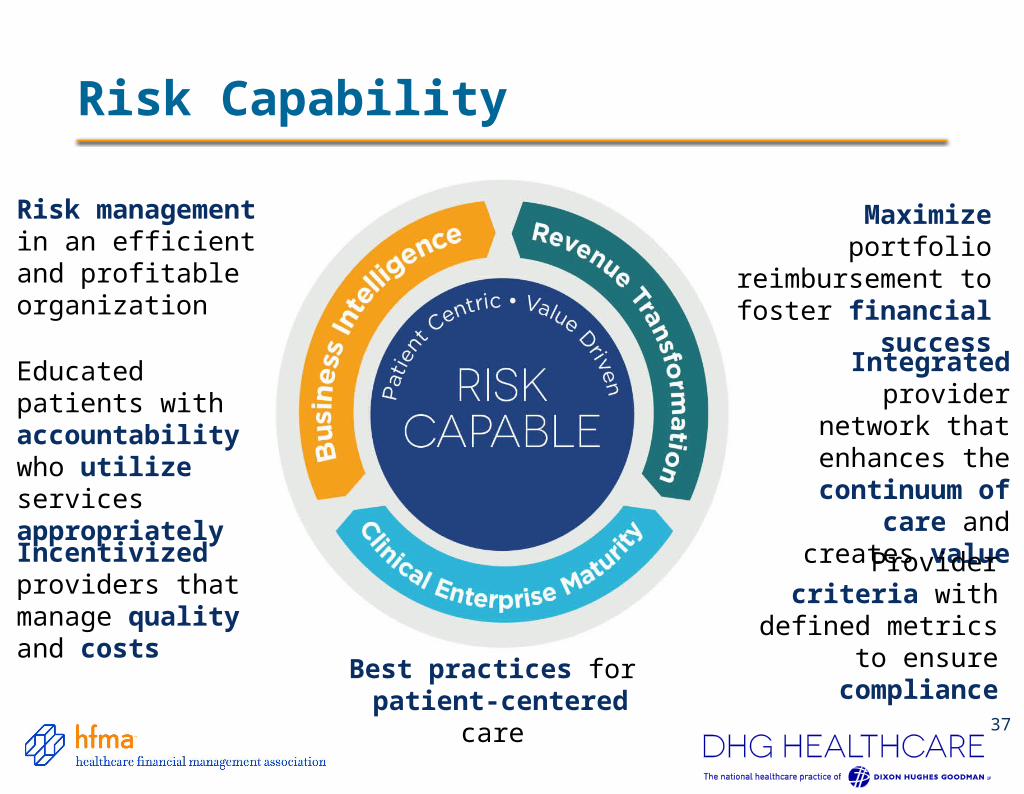
Maximize portfolio reimbursement to
foster financial success
Risk management in an efficient and profitable organization
Integrated provider network
that enhances the continuum of care
and creates value
Best practices for patient-centered care
Educated patients with accountability who utilize services appropriately
Provider criteria with defined metrics to
ensure compliance
Incentivized providers that manage quality and costs
The Risk Capable Health Organization
37
Risk Capability
Thoughts from John Glaser, CEO
“Under payment models that reward efficiency and high-quality care, if a hospital or health system is losing money due to inadequate
clinical performance, it cannot afford to wait one or more months to find out the problem. Healthcare
leaders should understand how their organizations are performing today so they can take corrective
action before revenue loss becomes a hemorrhage. “
-May 2014 HFM Magazine
39
Policy and PerspectivesHFMA Resources
40
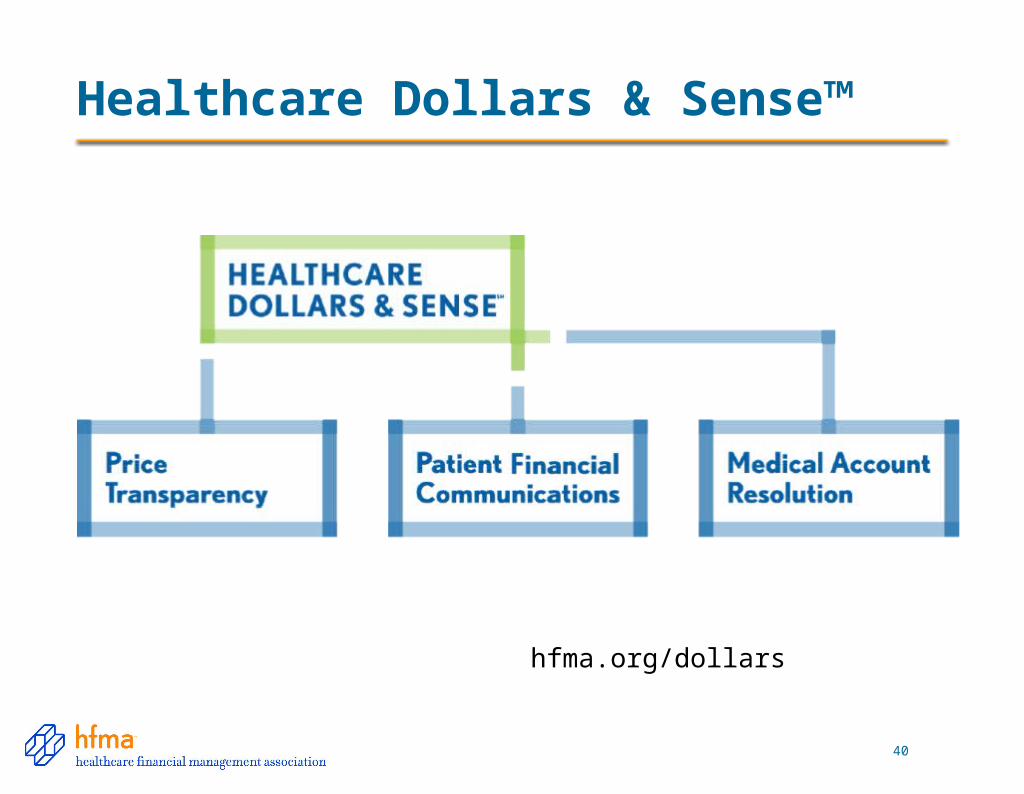
Healthcare Dollars & Sense™
hfma.org/dollars
Price Transparency Task Force Convened by HFMA
41
42
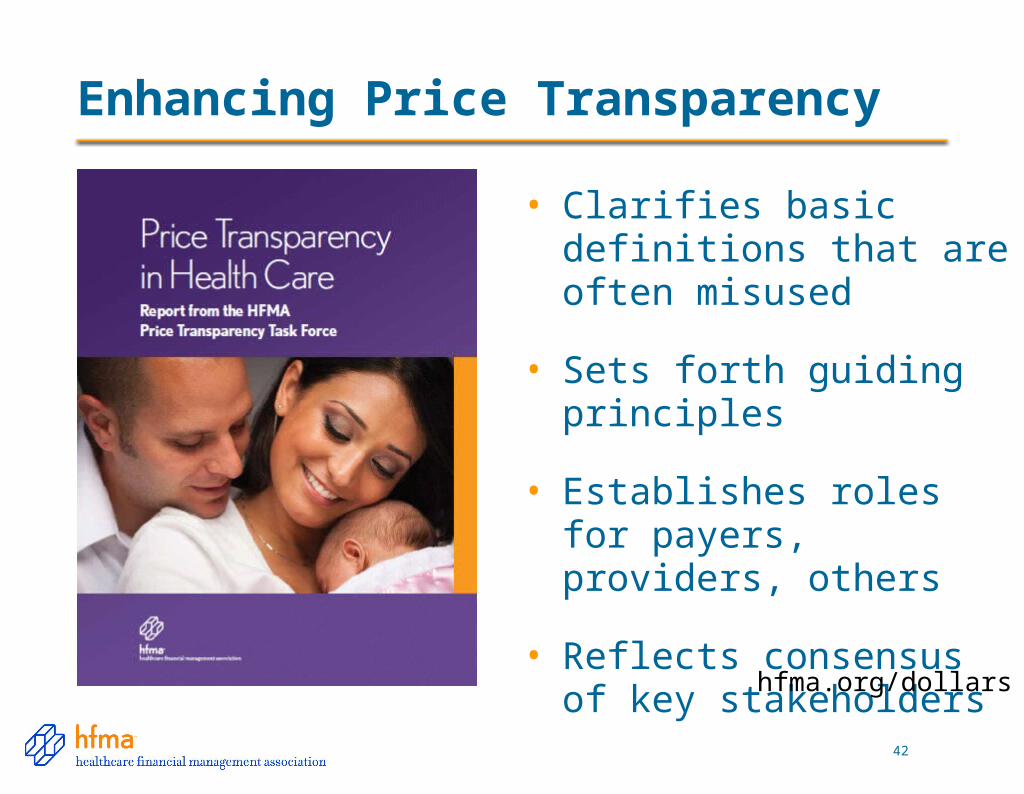
Enhancing Price Transparency
• Clarifies basic definitions that are often misused
• Sets forth guiding principles
• Establishes roles for payers, providers, others
• Reflects consensus of key stakeholders
hfma.org/dollars
43
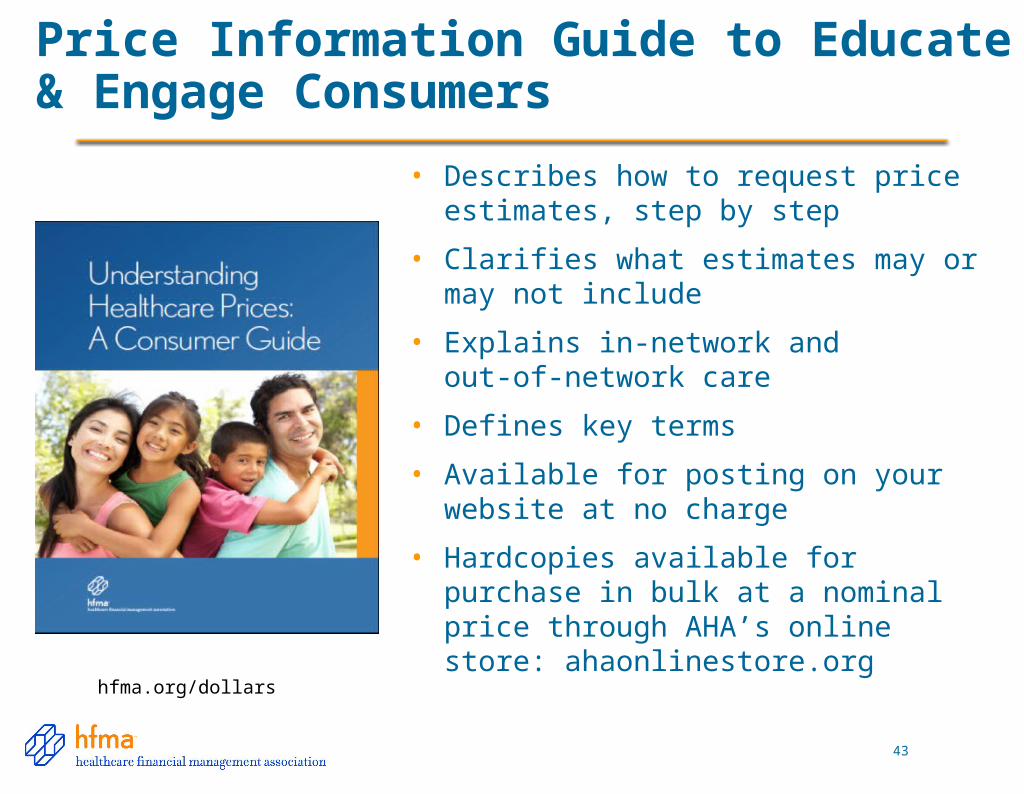
Price Information Guide to Educate& Engage Consumers
• Describes how to request price estimates, step by step
• Clarifies what estimates may or may not include
• Explains in-network and out-of-network care
• Defines key terms
• Available for posting on your website at no charge
• Hardcopies available for purchase in bulk at a nominal price through AHA’s online store: ahaonlinestore.orghfma.org/dollars
44
Every day, healthcare professionals conduct sensitive financial discussions with patients. But there have been no accepted, consistent best practices to guide them in these discussions—until now
hfma.org/dollars
Communication Is Critical Throughout the Process
45
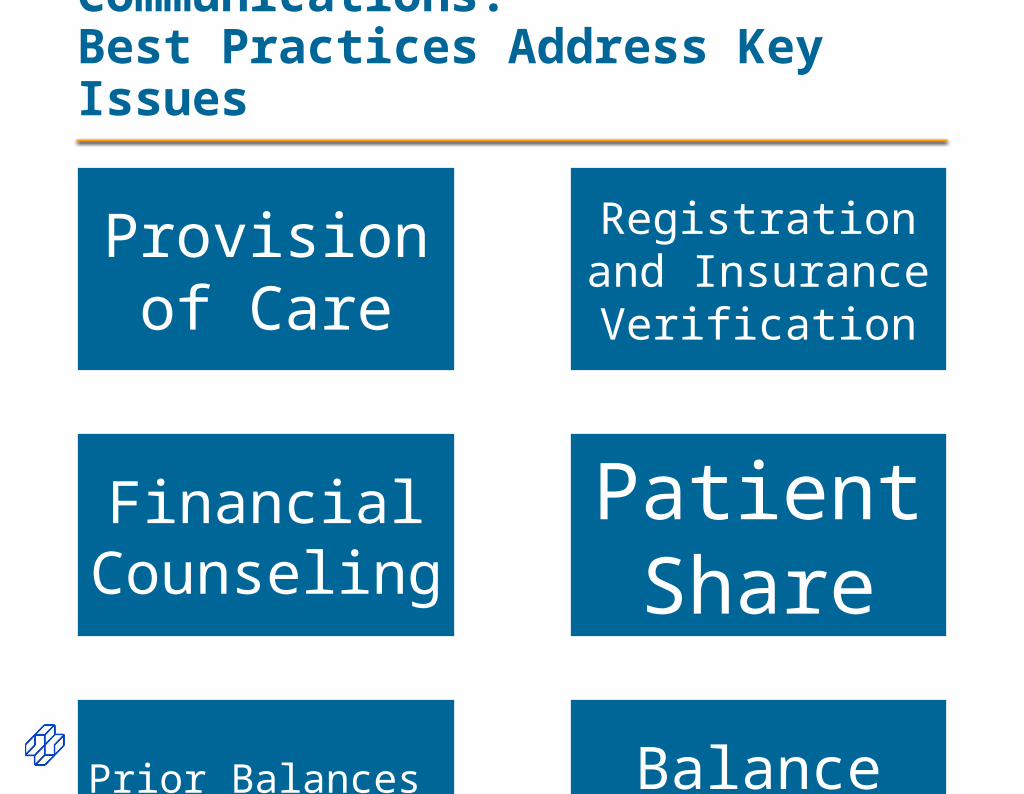
Patient Financial Communications:Best Practices Address Key Issues
Provision of Care
Registration and Insurance
Verification
Financial Counseling
Patient Share
Prior Balances (if applicable)
Balance Resolution
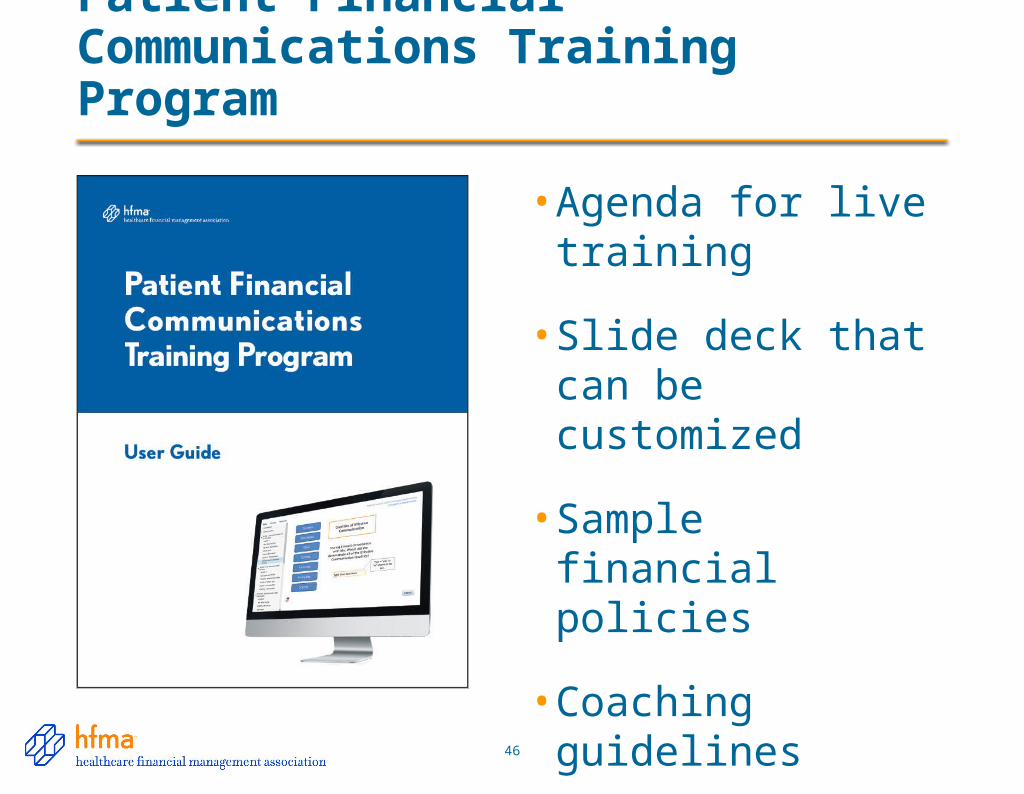
Patient Financial Communications Training Program
• Agenda for live training
• Slide deck that can be customized
• Sample financial policies
• Coaching guidelines
46
47
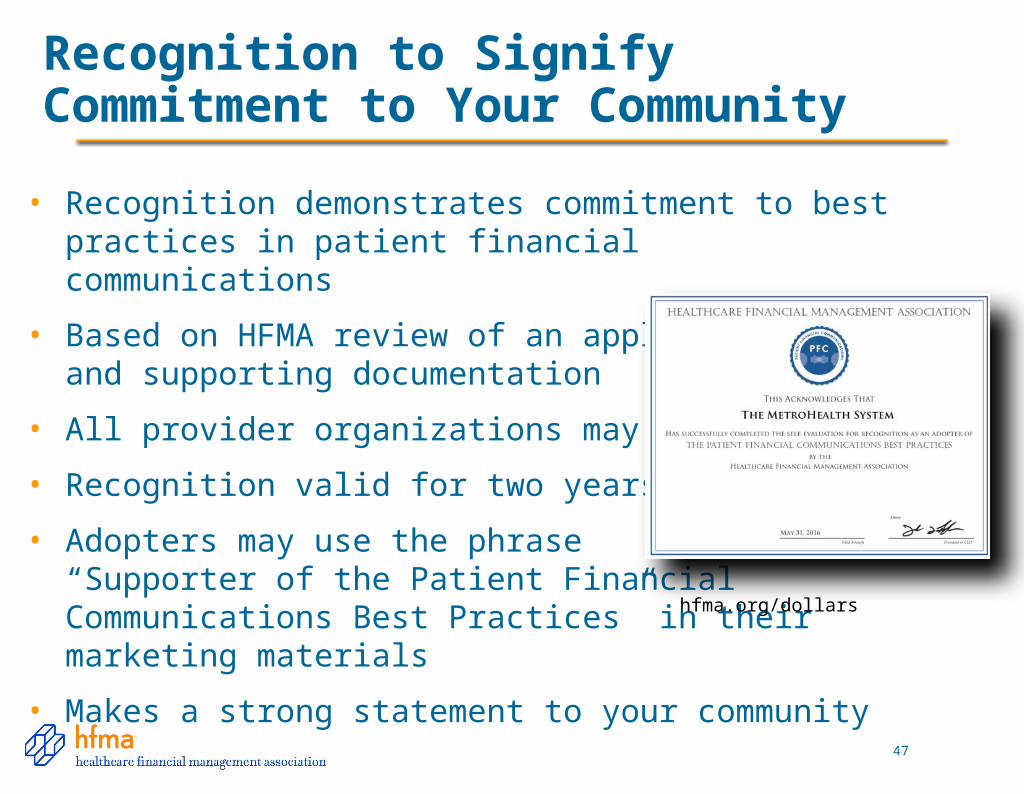
Recognition to Signify Commitment to Your Community
• Recognition demonstrates commitment to best practices in patient financial communications
• Based on HFMA review of an application and supporting documentation
• All provider organizations may apply
• Recognition valid for two years
• Adopters may use the phrase “Supporter of the Patient Financial Communications Best Practices” in their marketing materials
• Makes a strong statement to your community
hfma.org/dollars
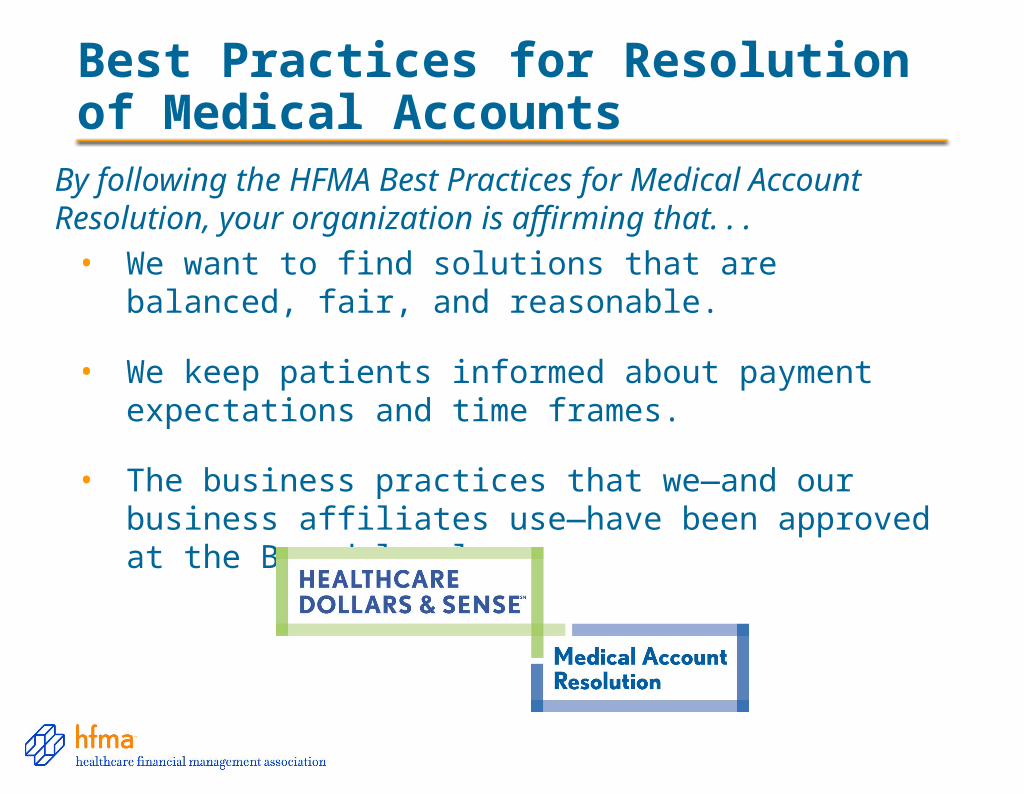
Best Practices for Resolution of Medical Accounts
• We want to find solutions that are balanced, fair, and reasonable.
• We keep patients informed about payment expectations and time frames.
• The business practices that we—and our business affiliates use—have been approved at the Board level.
By following the HFMA Best Practices for Medical Account Resolution, your organization is affirming that. . .
49
Best Practices for Resolutionof Medical Accounts
hfma.org/dollars
Leading the Change from Volume to Value
50
• Defining and delivering value
• Key organizational capabilities for building value
• Organizational road maps
hfma.org/valueproject
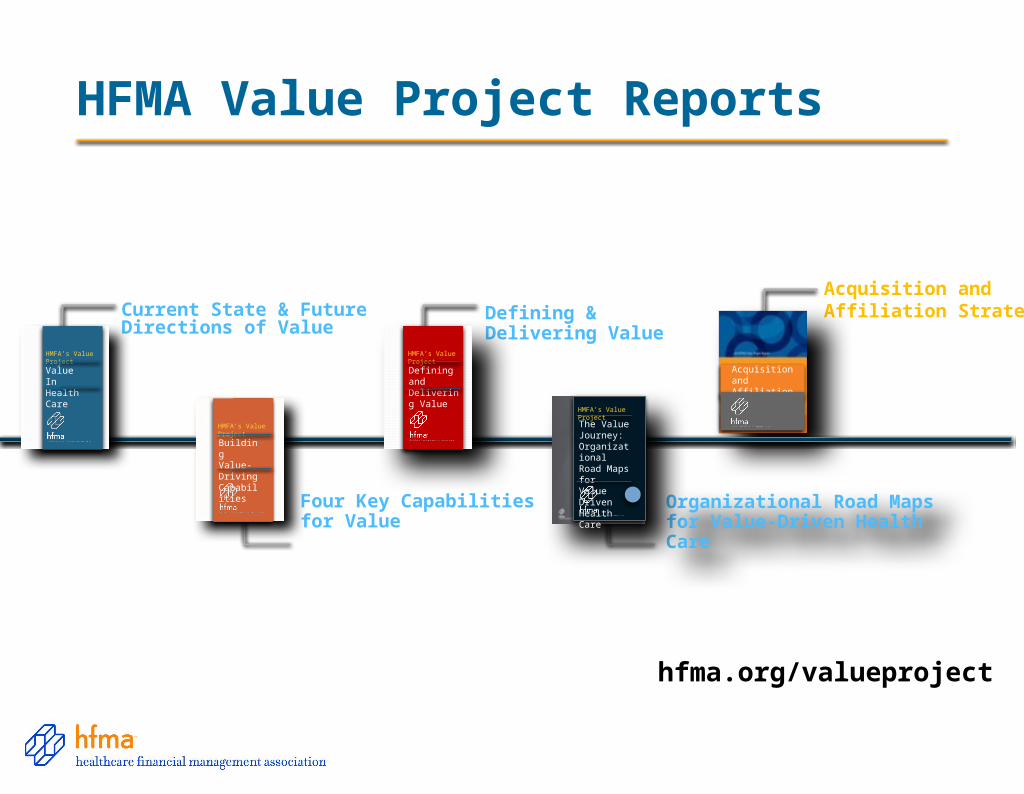
HFMA Value Project Reports
Acquisition and Affiliation Strategies
Acquisition andAffiliation Strategies
Current State & Future Directions of Value
Value InHealth Care
HMFA’s Value Project
Four Key Capabilities for Value
Building Value-DrivingCapabilities
HMFA’s Value Project
Defining &Delivering Value
Defining andDelivering Value
HMFA’s Value Project
Organizational Road Maps for Value-Driven Health Care
The Value Journey:Organizational Road Maps forValue DrivenHealth Care
HMFA’s Value Project
hfma.org/valueproject
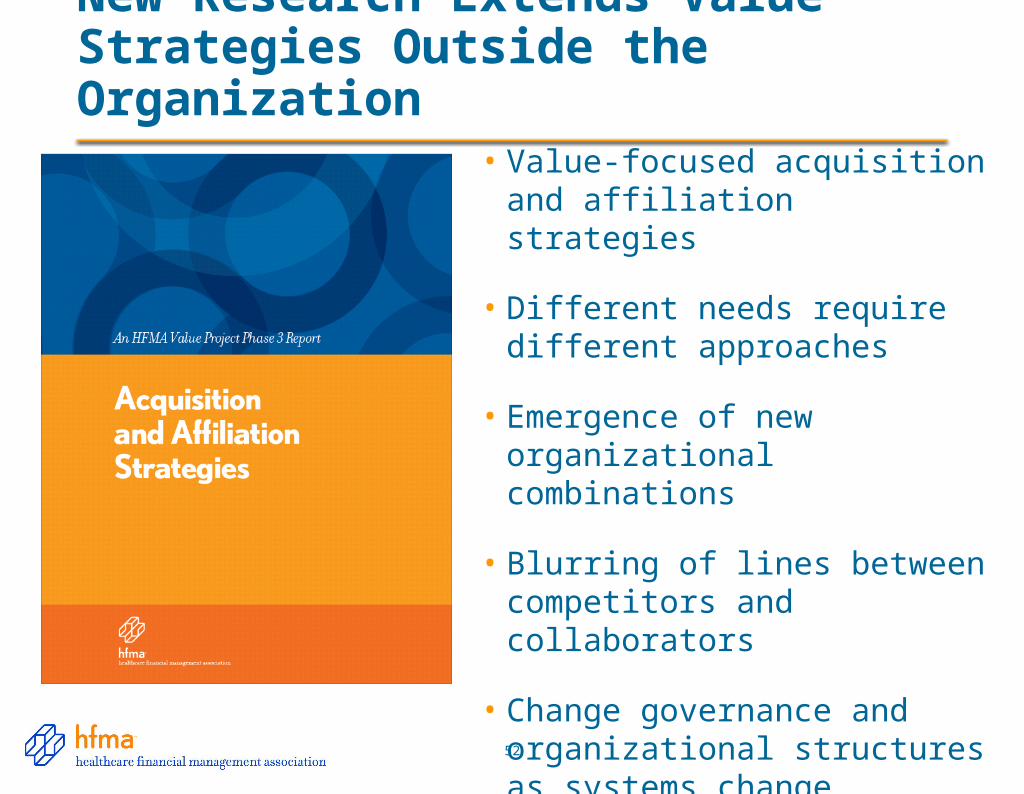
New Research Extends Value Strategies Outside the Organization
• Value-focused acquisition and affiliation strategies
• Different needs require different approaches
• Emergence of new organizational combinations
• Blurring of lines between competitors and collaborators
• Change governance and organizational structures as systems change
52
New HFMA Value Report Focus: Critical Role of Physicians
• Alignment and employment options
• Compensation and incentives
• Financial support and sustainability of the physician enterprise
• Physician leadership and governance structures
• Population management capabilities

54