Embed Size (px)
Citation preview


FUNDAMENTALS OF STEELMAKING


Fundamentalsof Steelmaking
E.T. TURKDOGAN
THE INSTITUTE OF MATERIALS

Book 656First published in 1996 byThe Institute of Materials1 Carlton House Terrace
London SW1Y 5DB
© The Institute of Materials 1996All Rights Reserved
ISBN 978 1 906540 97 5
This paperback edition first published in 2010 byManey Publishing
Suite l C, Joseph's WellHanover Walk
Leeds LS3 lAB, UK
All rights reserved. No part of this publication may be reproduced, stored in aretrieval system, or transmitted in any form or by any means, electronic, mechanical,
photocopying or otherwise, without the written consent of the copyright holder.Requests for such permission should be addressed to Maney Publishing,
Statements in this book reflect those of the authors and not those of theInstitute or publisher.
Typeset in the UK byDorwyn Ltd., Rowlands Castle, Rants
Printed and bound in the UK bythe Charlesworth Group, Wakefield

Contents
Acknowledgements xi
Chapter 1 Thermochemistry and Thermodynamics 11.1 Ideal gas laws 1
1.1.1 The gas constant 21.1.2 Gas partial pressure 21.1.3 Nonideal gases 3
1.2 The first law of thermodynamics 31.2.1 Energy 31.2.2 Enthalpy 31.2.3 Heat capacity 41.2.4 Standard state 51.2.5 Enthalpy of reaction 51.2.6 Hess's law 61.2.7 Special terms of heat of reaction 61.2.8 Adiabatic reactions 6
1.3 The second law of thermodynamics 71.3.1 Entropy 7
1.4 The third law of thermodynamics 71.5 Gibbs free energy 8
1.5.1 Generalisation of entropy of reaction 81.5.2 The standard free energies of formation of compounds 9
1.6 Empirical correlations 91.6.1 Heat capacities of solid elements and simple compounds 91.6.2 Heat capacities of polymeric substances 101.6.3 Heat contents at melting points 111.6.4 Heat of melting 13
1.7 Thermodynamic activity 131.7.1 Temperature effect on activity 141.7.2 Solutions 151.7.3 Molar quantities of solutions 151.7.4 Ideal solutions - Raoult's law 161.7.5 Nonideal solutions 161.7.6 Activity coefficient 16
1.7.6a Henry's law for dilute solutions 171.7..6b Interaction coefficients 17
1.7.7 Conversion from one standard state to another 181.8 Reaction equilibrium constant 19
1.8.1 Effect of temperature 191.9 Phase rule 201.10 Phase equilibrium diagrams 20

·vi Fundamentals of Steelmaking
1.10.1 Binary systems 211.10.2 Ternary systems 23
}.-11 Surface tension 251.11.1 Chemisorbed layer 271.11.2 Langmuir adsorption isotherm 271.11.3 Effect of surface curvature on surface tension 29
1.12 Interfacial tension 291.12.1 Contact angle 291.12.2 Work of cohesion, work of adhesion and spreading coefficient 30
1.13 Computer-based packages 31
Chapter 2 Rate phenomena 342.1 Kinetics of interfacial reactions 34
2.1.1 Examples of experiments on rates of interfacial reactions 382.1.1a Nitrogen transfer across iron surface 382.1.1b Rate of decarburisation of liquid Fe-C alloys by CO2 39
2.2 Fick's diffusion laws 412.2.1 First law-steady state diffusion 412.2.2 Second law-nonsteady state diffusion 412.2.3 Interdiffusion in binary metallic solutions 432.2.4 Diffusion in ionic media (slags) 44
2.3 Mass and heat transfer through reaction product layer 442.3.1 Parabolic rate of exidation of iron 442.3.2 Heat-transfer controlled calcination of limestone 46
2.4 Reaction of gases with porous materials 482.4.1 Mathematical analysis of Thiele 482.4.2 Oxidation of carbon in CO2-CO mixtures 512.4.2a Electrode consumption in EAF steelmaking 562.4.3 Reduction of iron oxides 572.4.4 Effect of reaction temperature on pore structure of reacted
material 632.5 Vaporisation in reactive gases 672.6 Kinetics of gas bubbles in oxygen steelmaking 70
2.6.1 Bubble nucleation and growth 702.6.2 Gas holdup in steel bath 712.6.3 Estimation of bubble size for uniformly dispersed bubbles in the
steel bath 742.6.4 Rate equation for transport controlled gas bubble reactions in
liquid steel 762.6.5 An example of calculated rate of nitrogen removal 77
2.7 Maximum rate of degassing of liquid steel with argon purging 782.8 Computer-based packages 80
Chapter 3 Thermochemical and transport properties of gases 823.1 Thermochemical properties 82
3.1.1 Molar heat capacity 823.1.2 Heat content 83

Contents vii
3.1.3 Equilibrium states in gas mixtures 833.2 Transport properties 86
3.2.1 Interrelations between transport properties 883.2.1a Viscosity/thermal conductivity 883.2.1b Thermal diffusivity I thermal conductivity 883.2.1c Temperature and pressure effects 883.2.1d Molecular mass effect 89
3.3 Pore diffusion 89
Chapter 4 Physicochemical properties of steel 914.1 Selected thermodynamic activities 91
4.1.1 Activity coefficients in Fe-X binary melts 914.1.2 Activity coefficients in multicomponent melts 944.1.3 Free energies of solution in liquid iron 94
4.2 Gas solubilities in solid and liquid iron 954.2.1 Sievert's law 954.2.2 Solubility of hydrogen 964.2.3 Solubility of nitrogen 974.2.4 Solubility of carbon monoxide 984.2.5 Solubility of water vapour 984.2.6 Solubility of sulphur dioxide 994.2.7 Solubility of hydrogen sulphide 99
4.3 Selected iron-base phase diagrams 1004.3.1 Crystallographic forms of iron 1004.3.2 Iron-carbon system 101
4.3.2a Peritectic reaction 1044.3.2b Effect of alloying elements on peritectic invariant 1054.3.2c Liquidus temperatures of low alloy steels 109
4.3.3 Iron-oxygen system 1104.3.4 Iron-sulphur system 1144.3.5 Iron oxysulphide 1154.3.6 Iron-manganese oxysulphide 1174.3.7 Elements of low solubility in liquid iron 119
4.4 Solubilities of CaO, CaS,MgO and MgS in liquid iron 1234.5 Solubilities of nitrides and carbides in solid and liquid iron 1254.6 Surface tension of liquid iron alloys 1264.7 Density of liquid steel 1294.8 Viscosity 1304.9 Mass diffusivies in solid and liquid iron 1324.10 Electrical conductivity 1334.11 Thermal conductivity 1344.12 Thermal diffusivity 136
Chapter 5 Physicochemical properties of molten slags 1385.1 Structural aspects 1385.2 Slagbasicity 1405.3 Selected phase diagrams of binary and ternary oxide systems 142

viii Fundamentals of Steelmaking
5.3.1 Binary oxide systems 1425.3.2 Ternary and quaternary oxide systems 145
,.5:4 Thermodynamic activities of oxides in simple and complex slags 1505.4.1 Activities in CaO-FeO-Si02 system 1505.4.2 Activities in CaO-AI203-Si02 system 1525.4.3 Activities in MnO-AI203-Si02 system 1535.4.4 Activity coefficient of FeO in slags 1535.4.5 Activity coefficient of MnO in slags 156
5.5 Oxygen potential diagram 1585.6 Gas solubilities in slags 160
5.6.1 Solubility of H20 1605.6.2 Solubility of N2 160
5.6.2a .Slag/ metal distribution ratio (N) / [N] 1615.6.3 Solubility of S2 1635.6.4 Solubility of O2 165
5.7 Surface tension 1665.7.1 Slag-metal interfacial tension 1665.7.2 Solute-induced interfacial turbulence 167
5.8 Density 1705.9 Viscosity 1725.10 Mass diffusivity 1765.11 Electrical conductivity 1775.12 Thermal conductivity 178
Chapter 6 Equilibrium data on liquid steel-slag reactions 1806.1 Oxidation of iron 1806.2 Oxidation of manganese 1816.3 Oxidation of carbon 1826.4 Oxidation of silicon 1836.5 Oxidation of chromium 1846.6 Oxidation of phosphorus 1866.7 Reduction of sulphur 1896.8 Deoxidation reaction equilibrium 193
6.8.1 Deoxidation with Fe/Mn 1936.8.2 Deoxidation with Si/Mn 1936.8.3 Deoxidation with Si/Mn/ Al 1976.8.4 Deoxidation with Al 197
Chapter 7 Pretreatment of blast furnace iron 2007.1 Desiliconisation 2007.2 Dephosphorisation and desulphurisation 2027.3 Desulphurisation 2057.4 Benefits of hot metal refining 208
Chapter 8 Oxygen steelmaking 2098.1 Introduction 2098.2 Furnace charge 209
8.2.1 Static charge control 211

Contents ix
8.2.1a Material balance 2118.2.1b Heat balance 2138.2.1c Reliability of static charge-control system 214
8.3 Dynamic control of oxygen blowing 2148.3.1 Automated control of oxygen blowing 215
8.4 Steelmaking slags 2178.~.1 Slag formation in BOF steelmaking 2178.4.2 Slag formation in Q-BOP steelmaking 2198.4.3 Slag composition at turndown 219
8.5 Decarburisation 2208.6 Combined-blowing in BOF steelmaking 2228.7 Metal emulsion in foaming slags 2268.8 Control of slag foaming 2278.9 States of steelmaking reactions at the end of oxygen blowing 230
8.9.1 Oxygen-carbon relation 2318.9.2 Iron oxide-carbon relation 2328.9.3 Manganese oxide-carbon relation 2348.9.4 FeO-MnO-Mn-O relations 2348.9.5 State of phosphorus reaction 2368.9.6 State of sulphur reaction 2378.9.7 Hydrogen and nitrogen contents in BOFand Q-BOP
steelmaking 2388.9.8 General comments 239
8.10 States of slag-metal reactions in EAF steelmaking 2408.10.1 Slag composition 2408.10.2 Iron oxide-carbon relation 2418.10.3 FeO-MnO-Mn relation 2428.10.4 State of chromium oxidation 2428.10.5 State of phosphorus reaction 2428.10.6 State of sulphur reaction 2428.10.7 Summary 243
Chapter 9 Steel refining in the ladle 2459.1 Tap ladle 245
9.1.1 Ladle refractory lining 2459.1.2 Ladle preheating 2469.1.3 Porous plug on the ladle bottom 249
9.2 Steel homogenisation with gas stirring 2499.2.1 Mixing time 2519.2.2 Rate of slag-metal reaction in gas stirred melts 252
9.3 Ladle slags 2539.4 Chill factors for ladle additions 2549.5 Reactions occurring during furnace tapping 255
9.5.1 Nitrogen pickup 2559.5.2 Hydrogen pickup 2579.5.3 Furnace slag carryover 257
9.6 Ladle furnace 259

x Fundamentals of Steelmaking
9.6.1 Arc reheating in the ladle furnace 2599.6.2 Reheating with oxygen injection 262
9~.7 Steel deoxidation 2629;7.1 Open heat tapping 2639.7.2 Slag aided deoxidation 263
9.7.2a Partial deoxidation with Fe/Mn 2639.7.2b Deoxidation with Si/Mn 2669.7.2c Deoxidation with Al 266
9.7.3 Deoxidation with Ca-Si 2689.7.4 Argon rinsing for inclusion floatation 268
9.8 Desulphurisation 2699.8.1 Desulphurisation methods 2709.8.2 Rate of desulphurisation 274
9.9 Vacuum degassing 2779.9.1 Vacuum degasser with arc reheating 2779.9.2 Vacuum ladle degassing 2779.9.3 Recirculation degassing 2789.9.4 Carbon deoxidation 2799.9.5 Decarburisation 2809.9.6 Rate of decarburisation 2819.9.7 Dehydrogenation 2839.9.8 Denitrogenisation 284
9.10 Calcium treatment 2859.10.1 Objectives of inclusion morphology control 2859.10.2 Reaction of calcium in liquid steel 2869.10.3 Efficiencyof calcium usage and retention in steel 2889.10.4 Sulphide morphology (shape) control 289
9.11 Inclusion control in bearing steels 2909.12 Other references on inclusions in steel 292
Chapter 10 Reactions during steel solidification 29710.1 Solute enrichment in inter dendritic liquid 297
10.1.1 Schell equation 29710.1.2 Reactions in interdendritic liquid 29810.1.3 Liquidus temperature and solute activity coefficients in the inter-
dendritic liquid 30210.2 Subsurface blowhole formation 30210.3 Castability of resulphurised steel 30510.4 Critical ratio (Mn/ S)cto suppress hot shortness of steel 30710.5 CaS formation during solidification 30710.6 Causes and effects of nitride precipitation in continuous casting 310
10.6.1 Hot ductility 31010.6.2 Modes of nitride and carbonitride precipitation 31510.6.3 Interdendritic precipitation of TiN 31610.6.4 Critical microalloying elements in HSLA steel 318
Index 321·

Acknowledgements
The author is indebted to his wife Myra Andree Marcelle for editing,typing and proof reading the manuscript with patience and diligence.
I wish to express my appreciation to the research personnel at the U.S.Steel Technical Centre (i) for their collaboration in acquiring for me largevolumes of heat logs on steelmaking from USSplants, (ii) for the frequentuse of their library facilities and (iii) to the librarian Joy Richardson forbeing so helpful in my search for information on technical literature.


Preface
During the past two decades many advances have been made in theimplementation of new technologies in the steel industry. These technicaladvances have been reflected also on the courses given on process metal-lurgy at universities and technical colleges. This text book therefore isintended for the university graduate students, research scientists and en-gineers specialising in ferrous pyrometallurgy and for use as a source ofreference in the technical training courses given to the steel plant engin-eers and plant operators.
During the past three score years the manner of applying the principlesof thermodynamics and physical chemistry has gone through manyphases of development, in the search for a better understanding of theoperation and control of the pyrometallurgical processes. Although essen-tially nothing was known about the thermodynamic properties of slags inthe early 1930s, it was nevertheless recognised that, because of the com-plex ionic nature of molten slags, the classical mass action law could not beused in representing the equilibrium constants of slag-metal reactions.This problem was somewhat circumvented by adopting an empirical ap-proach to the representation of the slag composition as though the slagswere made up of a mixture of stoichiometric compounds of various as-sumed silicates, phosphates and free oxides. This empirical concept isattributed to the early pioneering work of Schenck in his studies of theBessemer and open-hearth steelmaking reactions.
Numerous attempts had been made in the past, following the work ofHerasymenko in the late 1930s, to represent the equilibrium constants ofslag-metal reactions in terms of the concentrations of assumed ionic spe-cies. Although the derivation of reaction equilibria relations from ionicstructural models are of some theoretical interest, their applications topyrometallurgical reactions in multicomponent systems have not beenparticularly rewarding.
Studies of thermodynamic properties of metals and slags, initiated pri-marily by Chipman, Richardson and their co-workers in the late 1940sand1950s, are still an ongoing subject of research projects. Complementary tothese experimental studies, there have been several compilations of ther-mochemical data made notably by Kelly, Kubaschewski and Hultgren. Weare also greatly indebted to Wagner and Darken for their valuable the-oretical contributions to the application of the principles of ther-modynamics in the study of systems pertinent to various aspects of hightemperature technology.
xrii

xiv Fundamentals of Steelmaking
Reflecting upon the many facets of these previous endeavours, I havenow reached the conclusion that the equilibrium states of slag-metal reac-tions, pertinent to the steelmaking conditions, can be quantified in muchSImpler forms in terms of the mass concentrations of elements dissolved inthe steel and of oxides in the slag. In the first two chapters of the book, theprinciples of thermochemistry and rate phenomena are given in a con-densed form (mostly definition of terms and basic equations) that is quiteadequate for a comprehensive description of the fundamentals of steel-making processes and related subjects. Critically reviewed numerical dataon the physicochemical properties of gases, iron alloys and slags are com-piled in Chapters 3, 4 and 5 which are needed in the formulation of steel-making reactions. The second half of the book is devoted to (i) the com-pilation of reassessed equilibrium data on gas-slag-metal reactions, (ii)the discussion of oxygen steelmaking processes and evaluation of the stateof reactions in the furnace at tap, (iii) the primary aspects of steel refiningin the ladle and (iv) some aspects of reactions occurring during solidifica-tion of steel in continuous casting.
May, 1995 E.T. Turkdogan

CHAPTER 1
Thermochemistry andThermodynamics
Selected thermochemical and thermodynamic functions are presented inthis chapter in a condensed form without dwelling on their derivationswhich are well documented in many textbooks. For an in-depth study ofthermodynamics, references may be made to the original teachings ofGibbs," the classic texts of Lewis and Randall.s later rewritten by Pitzerand Brewer.> and of Cuggenheim.s a textbook on the physical chemistryof metals by Darken and Gurry,S an introduction to metallurgical ther-modynamics by Gaskell,» and many others.
1.1 IDEAL GAS LAWS
Definitions of the ideal gas laws are given below as a preamble to state-ments on the concepts of thermochemistry and thermodynamics.
A relation between temperature, pressure and composition of the sys-tem is an equation of state. It was through experimental observations thatthe equations of state for gases were formulated in the early days ofscientific discoveries.
Boyle's law (1662): For a given mass of gas at constant temperature, thegas pressure is inversely proportional to its volume, or
pressure x volume = PV = constant (1.1)
Charles's law (1787): At constant volume the pressure exerted on agiven mass of gas is a linear function of temperature.
Gay-Lussac's law (1802):This is analogous to Charles' law, but stated ina different form, thus for a given mass of gas at constant pressure, thevolume is a linear function of temperature.
(1.2)
where Vo is the volume at t = O°Cand a the coefficient of volume expan-sion. At relatively high temperatures and low pressures, for ideal gases a= 1/273.16(OC)._ Therefore for an ideal gas,
t 273.16 + tv, = Vo (1 + 273.16) = v: ( 273.16 ) (1:~)
The sum 273.16 + t(OC) = T is the absolute temperature scale K (Kelvin),which is abbreviated to T(K) = 273 + t(OC) for elevated temperatures.
1

2 Fundamentals of Steelmaking
Avogadro's law (1811): At constant temperature and pressure, equalvolumes of all gases contain the same number of molecules. Oneg-molecule (abbreviated mol) of an ideal gas, containing 6.025 x 10²³ mole-cules, occupies a volume of 22.414 litre at 1 atmosphere and O°C.
1.1.1 THE GAS CONSTANT
A gas which obeys the simple gas laws is called an ideal gas satisfying thefollowing relation derived from equations (1.1) and (1.3).
PV=nRT (1.4)
where n is the number of mols and R the universal molar gas constant.For one mol of an ideal gas at 273.16 K and I atm pressure, the value of
the molar gas constant is
(1.5)
For pressure in Pa (= J m-3) and volume in m-',
R = 1.01325 X 105 x 22.414 X 10-3 = 8.314 J mol-1K-I273.16 (1.6)
1.1.2 GAS PARTIAL PRESSURE, DALTON'S LAW (1801)
In a gas mixture containing nl, n21 n3 ... number of mols of gases occupy-ing a volume V at a total pressure P, the partial pressures of the constitu-ent gaseous species are as given below.
xP
n2P2 = nl + n2 + n3 + .. ·P = PI + P2 + P3 + . . .
Equations for constant pressure, volume and temperature:The following equations are for a given mass of gas.
xP
(1.7)
Constant pressure (isobaric) VI = V2 = V3 (1.8)TI T2 T3
Constant volume (isochoric) PI P2 =P3 (1.9)
TI T2 T3Constant temperature (isothermal) P1VI = P2V2 = P3V3 ... (1.10)
Thermochemistry and Thermodynamics 3
1.1.3NONIDEAL GASES
The behaviour of gases becomes nonideal at low temperatures and highpressures. Since the metallurgical processes are at elevated temperaturesand ordinary pressures, the equation of state for nonideal gases will not bediscussed here.
1.2 THE FIRST LAW OF THERMODYNAMICS
The first law of thermodynamics is based on the concept of conservation ofenergy. When there is interaction between systems, the gain of energy ofone of the systems is equal to the loss of the other system. For example, thequantity of heat required to decompose a compound into its elements isequal to the heat generated when that compound is formed from itselements.
1.2.1ENERGY
In 1851Lord Kelvin defined the term Ienergy' as follows:
The energy of a material system is the sum, expressed in mechanical units of work, of allthe effects which are produced outside the system when the system is made to pass inany manner from the state in which it happens to be to a certain arbitrarily fixed initialstate.
That is, there is no such thing as absolute energy but only relative energy;only change in energy with change of state can be measured, with refer-ence to a standard state.
1.2.2 ENTHALPY (HEAT CONTENT)
The internal energy of a system includes all forms of energy other than thekinetic energy. Any exchange of energy between a system and its sur-roundings, resulting from a change of state, is manifested as heat andwork.
When a system expands against a constant external pressure P, resultingin an increase of volume fl.V, the work done by the system is
(1.11).~
Since this work is done by the system against the surroundings, the sys-tem absorbs a quantity of heat q and the energy E of the system increasesin passing from state A to state B.

4 Fundamentals of Steelmaking
8E = EB - EA = q - P8V = q - P(VB - VA)
Upon re-arranging this equation, we have,..
(1.12)
(EB + PVB) - (EA + PYA) = q
The quantity E + PV is represented by a single symbol H, thus
ill = q = (EB + PVB) - (EA + PYA)
The function H is known as enthalpy or heat content.
(1.13)
(1.14)
1.2.3 HEAT CAPACITY
The heat capacity of a substance is defined as the quantity of heat requiredto raise the temperature by one degree. The heat capacity of 1 g of asubstance is called the specific heat. The heat capacity of 1 g-molecule(abbreviated as mol) is called the molar heat capacity.
For an ideal gas the difference between the molar heat capacities atconstant pressure, Cp, and constant volume, Cv, is equal to the molar gasconstant.
(1.15)
Because of experimental convenience, the heat capacity is determined un-der conditions of constant pressure (usually atmospheric).
The change in enthalpy of a system with temperature at constant press-ure is by definition the heat capacity of the system.
(1.16)
Integration gives the change in enthalpy with change in temperature atconstant pressure.
(1.17)
Above 298 K, the temperature dependence of Cp may be represented by
C = a + bT - CT-2P. (1.18)
where the coefficients, a, band c are derived from Cp calorimetric measure-ments at different temperatures.
T
ill = r (a + bT-cT-2) dT)298
(1.19)

Thermochemistry and Thermodynamics 5
In recent compilations of thermochemical data, the IlH values are tabu-lated at 100 K intervals for the convenience of users.
1.2.4 STANDARD STATE
The enthalpy is an extensive property of the system, and only the changein heat content with change of state can be measured. A standard refer-ence state is chosen for each element so that any change in the heat contentof the element is referred to its standard state, and this change is denotedby AHO.
The natural state of elements at 25°C and 1 atm pressure is by conven-tion taken to be the reference state. On this definition, the elements in theirstandard states have zero heat contents.
The heat of formation of a compound is the heat absorbed or evolved inthe formation of 1 g-mol of the compound from its constituent elements intheir standard states, denoted by Mi~98'
1.2.5 ENTHALPY OF REACTION
The change of enthalpy accompanying a reaction is given by the differencebetween the enthalpies of the products and those of the reactants.
For an isobaric and isothermal reaction,
(1.20)
the enthalpy change is given by
(1.21)
By convention, Mi is positive (+) for endothermic reactions, i.e. heatabsorption, and AH is negative (-) for exothermic reactions, i.e. heatevolution.
Temperature effect:
AHy = LMi~98 (products) - IAH~98 (reactants)
T
_+ r [l:Cp (products) - sc, (reactants)]dTJ298
(1.22)
.'.I
(1.23)
6 Fundamentals of Steelmaking
1.2.6 HESS'S LAW
In 1840 Hess defined the law of constant heat summation as 'the heatchange in a chemical reaction is the same whether it takes place in one orseveral stages.' This law of Hess is in fact a direct consequence of the lawof conservation of energy.
1.2.7 SPECIAL TERMS OF HEAT OF REACTION
Enthalpy or heat of formation Fe + 112°2 ~ FeOHeat of combustion C+02 ~ CO2Heat of decomposition 2CO ~ C+C02Heat of calcination CaC03 ~ CaO + CO2Heat of fusion (melting) Solid ~ LiquidHeat of sublimation Solid ~ VapourHeat of vaporisation Liquid ~ VapourHeat of solution SiCl) ~ [Si] (diss.in Fe)
1.2.8 ADIABATIC REACTIONS
When a reaction occurs in a thermally insulated system, i.e. no heat ex-change between the system and its surroundings, the temperature of thesystem will change in accordance with the heat of reaction.
As an example, let us consider the internal oxidation of unpassivateddirect reduced iron (DRI) in a stockpile, initially at 25°C. The enthalpy ofreaction at 298 K is
Fe + 11202 ~ FeD, Mi~98 = - 267 kJ mol-1 (1.24)
The heat balance calculation is made for 1000 kg Fe in the stockpile with150 kg FeO formed in oxidation. The heat absorbed by the stockpile is (150x 103/72) x 267 k] and the temperature rise is calculated as follows:
Q = [nFe (CP)Fe + nFeO (CP)FeO](T - 298)nFe = 17,905 g-mol for 1000 kg FenFeO = 2087.7 g-mol for 150 kg FeOCp (Fe) = 0.042 kJ mol-1K-lCp (FeO) = 0.059 kJ mol-1K-l
:. Q = 557,416 = (752 + 123) (T - 298)
With this adiabatic reaction, the stockpile temperature increases to T = 935K (662°C).
The moisture in the stockpile will react with iron and generate H2 which willignite at the elevated stockpile temperature. This has been known to happenwhen DRI briquettes were had not adequately passivated against oxidation.

Thermochemistry and Thermodynamics 7
1.3 THE SECOND LAW OF THERMODYNAMICS
The law of dissipation of energy states that all natural processes occurringwithout external interference are spontaneous (irreversible processes). Forexample, heat conduction from a hot to a cold part of the system. Thespontaneous processes cannot be reversed without some change in thesystem brought about by external interference.
1.3.1 ENTROPY
The degree of degradation of energy accompanying spontaneous, henceirreversible, processes depends on the magnitude of heat generation attemperature T and temperatures between which there is heat flow.The quantity q / T is a measure of degree of irreversibility of the process,the higher the quantity q / T, the greater the irreversibility of the process.The quantity q / T is called the increase in entropy. In a complete cycle of allreversible processes the sum of the quantities ~q / T is zero.
The thermodynamic quantity, entropy 5, is defined such that for anyreversible process taking place isothermally at constant pressure, thechange in entropy is given by
dS = '¥! = ~P dT =Cpd (In T) (1.25)
1.4 THE THIRD LAW OF THERMODYNAMICS
The heat theorem put forward by Nernst (1906) constitutes the third law ofthermodynamics: 'the entropy of any homogeneous and ordered crystal-line substance, which is in complete internal equilibrium, is zero at theabsolute zero temperature.' Therefore, the integral of equation (1.25) givenabove has a finite value at temperature T as shown below.
(1.26)
The entropy of reaction is
AS = ~S(products) - ~S(reactants)
and entropy of fusion at the melting point Tm
ll.Sm = MlmTm
(1.27)
(1.28)
8 Fundamentals of Steelmaking
1.5 GIBBS FREE ENERGY
From a combined form of the first and second laws of thermodynamics,Gibbs derived the free energy equation for a reversible process at constantpressure and temperature.
G=H - TS (1.29)
The Gibbs free energy is also known as the chemical potential.When a system changes isobarically and isothermally from state A to
state B, the change in the free energy is
. GB - GA = /).G = m- T/).S (1.30)
During any process which proceeds spontaneously at constant pressureand temperature, the free energy of the system decreases. That is, thereaction is thermodynamically possible when dG < O. However, the reac-tion may not proceed at a perceptible rate at lower temperatures, if theactivation energy required to overcome the resistance to reaction is toohigh. If AG > 0, the reaction will not take place spontaneously.
As in the case of enthalpy, the free energy is a relative thermodynamicproperty with respect to the standard state, denoted by L\Go.
The variation of the standard free energy change with temperature isgiven by
1.5.1 GENERALISATION OF ENTROPY OF REACTION
1. When there is volume expansion accompanying a reaction, i.e. gasevolution, at constant pressure and temperature the entropy change ispositive, hence AG decreases with an increasing temperature.
C + CO2 = 2CO
AGO = 166,560 - 171.0T J2. When there is volume contraction, i.e. gas consumed in the reaction,
at constant pressure and temperature the entropy change is negative,hence AG increases with an increasing temperature.
H2 + IhS2 = H2S
/).GO = -91,600 + 50.6T J

Thermochemistry and Thermodynamics 9
3. When there is little or no volume change the entropy change is closeto zero, hence temperature has little effect on AG.
e + O2 = CO2
L\Go = -395,300 - O.5T J
1.5.2 THE STANDARD FREE ENERGIES OF FORMATION OF COMPOUNDS
For many reactions, the temperature dependence of ABO and ASo aresimilar and tend to cancel each other, thus the nonlinearity of the variationof AGO with temperature is minimised. Using the average values of AHoand ASo, the free energy equation is simplified to
L\Go = AHo - L\soT (1.32)
The standard free energies of reactions encountered in ferrous metallurgi-cal processes can be computed using the free energy data listed in Table 1.1.
1.6 EMPIRICAL CORRELATIONS
1.6.1 HEAT CAPACITIES OF SOLID ELEMENTS AND SIMPLE COMPOUNDS
Over the years attempts have been made in pursuit of rationales for com-position dependence of the thermochemical properties of substances. Aclassical example is that of Dulong and Petit (1819) who noted that formost solid elements, the atomic heat capacity at room temperature andatmospheric pressure is essentially constant within the range 25.5 ± 1.7 Jatom +Kr", which is very close to 3R = 24.94 J atorrr+Kr", There are a fewexceptions: the elements beryllium, boron, carbon and silicon have loweratomic heat capacities, and elements cerium, gadolinium, potassium andrubidium higher atomic heat capacities. .
Dulong & Petit's rule was subsequently extended to simple compoundsby various investigators, ultimately leading to what is known as Kopp'srule (1865): 'the molar heat capacity of a solid compound is approximatelyequal to the sum of the atomic heat capacities of its constituent elements.'
The combination of the two rules leads to the following approximationin terms of the molar gas constant R.
molar Cp -= Cp ~ 3Rnumber of atoms (1.33)
It should be emphasised that this approximation applies only to simplecompounds, e.g. oxides, sulphides, nitrides, carbides, halides and inter-metallic compounds containing less than 4 or 5 atoms per mol formula.

10 Fundamentals of Steelmaking
Table 1.1 The standard free energies of formation of selected compounds fromcompiled thermochemical data.7,8
/N'otations: (g) gas, (1) liquid, (s) solid, (d) decomposition, (m) melting, (v) vaporisation
~Go = MIo - ss-t-MIo -IlSo Temp.Range
kJ mol-1 J mol=Kr! ±kJ °C
2Al(I)+3/2 02(g) = A1203(s) 1683.2 325.6 8 659-1700Al(I)+1/2 N2(g) = AIN(s) 328.3 115.5 4 659-17004Al(I)+3C(s) = A14C3(s) 266.5 96.2 8 659-17002B(s)+3/2 02(g) = B203(1) 1228.8 210.0 4 450-1700B(s)+1/2 N2(g) = BN(s) 253.6 89.5 2 25-9004B(s)+C(s) = B4C(s) 79.5 9.2 4 25-900C(s)+2H2(g) = CH4(g) 91.0 110.7 2 25-2000C(s)+1/202(g) = CO(g) 114.4 -85.8 2 25-2000C(S)+02(g) = cO2 (g) . 395.3 -0.5 2 25-2000Ca(I)+1/2 02(g) = CaO(s) 900.3 275.1 6 850-1487vCa(I)+1/2 S2(g)= CaS(s) 548.1 103.8 4 850-1487v3CaO(s)+A1203(s) = Ca3A1206(s) 16.3 -26.4 8 25-1535d12CaO(s)+7A1203(s) = Ca12A114033(S) 73.1 -207.5 8 25-1455mCaO(s)+A1203(s) = CaAI204(s) 19.1 -17.2 8 25-1605mCaO(s)+C02(g) = CaC03 (s) 161.3 137.2 4 25-880d2CaO(s)+Si02(s) = Ca2Si04(S) 118.8 -11.3 10 25-1700CaO(s)+Si02(s) = CaSi03(s) 92.5 2.5 12 25-1540m0.947Fe(s)+1/2 02(g) = FeO.9470 (s) 263.7 64.3 4 25-1371mFe(I)+1/2 02(g) = FeO (I) 225.5 41.3 4 1537-17003Pe(s)+2 02(g) = Fe304(s) 1102.2 307.4 4 25-1597m2Fe(s)+3/2 02(g) = Fe203(s) 814.1 250.7 4 25-1500Fe(s)+1/2 S2(g)= FeS(s) 154.9 56.9 4 25-988mH2(g)+1/2 02(g) = H20(g) 247.3 55.9 1 25-2000H2(g)+1/2 S2(g) = H2S(g) 91.6 50.6 1 25-20003/2 H2(g)+1/2 N2(g) = NH3(g) 53.7 32.8 0.5 25-2000Mg(g)+1/2 02(g) = MgO(s) 759.4 202.6 10 1090-2000Mg(g)+1/2 S2(g) = MgS(s) 539.7 193.0 8 1090-17002MgO(s)+Si02(s) = Mg2Si04(s) 67.2 4.3 8 25-1898mMgO(s)+Si02(s) = MgSi03(S) 41.1 6.1 8 25-1577mMgO(s)+C02(g) = MgC03(s) 116.3 173.4 8 25-402dMn(s)+1/2 02(g) = MnO(s) 384.8 73.1 4 25-1244Mn(I)+1/2 02(g) = MnO(s) 397.0 81.1 4 1244-1700Mn(s)+1.2 S2(g)= MnS(s) 277.9 64.0 4 25-1244Mn(I)+1/2 S2(g)= MnS(s) 290.1 71.9 4 1244-1530mMn(I)+1/2 Sz(g) = MnS(I) 262.6 64.4 4 1530-1700MnO(s)+Si02(s) = MnSi03(s) 28.0 2.8 12 25-1291m1/2S2(g)+02(g) = S02(g) 361.7 72.7 0.5 25-1700Si(I)+1/2 02 (g) = SiO(g) 154.7 -52.5 12 1410-1700Si(S)+02(g)= Si02(s) 907.1 175.7 12 400-1410Si(I)+02(g) = Si02(s) 952.7 203.8 12 1410-1723m
1.6.2 HEAT CAPACITIES OF POLYMERIC SUBSTANCES
From a detailed study of the heat capacity data for complex polymericcompounds, the Author? noted that there was indeed a rationale for

Thermochemistry and Thermodynamics 11
26
14~ ~ ~ ~~ ~300 500 700 900 1100
TEMPERATURE, K
Fig.1.1 Heat capactities of crystalline minerals and aluminosilicate glasses in termsof J g-atom-lK-l, using the experimental data of Krupka et al.lO From Ref. 9.
composition dependence of the heat capacity. Based on the heat capacitydata of Krupka et al.10 for several aluminosilicates,* it was found that theheat capacity per atom is a single function of temperature as shown in Fig.1.1. At temperatures of 300 to 400 K, Cp values are much below 3R, indicat-ing that Kopp's rule does not hold for complex compounds. The mythical3R value happens to be at temperatures of 950 to 1050 K for which noparticular significance can be attached. The curve in Fig. 1.1 may be rep-resented by the following equation.
Cp (J atom-1K-l) =
49.75 - 0.0127T + 180 x 103T-2 - 555T-l/2 + 5 x 10-612 (1.34)
The molar heat capacities of polymeric substances at 1000 K, includingmolybdates, titanates, tungstates and so on, are seen from the plot in Fig.1.2 to be proportional to the number of atoms per mol formula of thecompounds, with a slope of 3R as anticipated from the data in Fig. 1.1.
*Albite:Orthoclase:Anorthite:
NaAlSi30sKAISi30sCaA12Si20s
Muscovite:Pyrophillite:Grossular:
1.6.3 HEAT CONTENTS AT MELTING POINTS
When there is no allotropic phase transformation, the integration of equa-tion (1.34) gives the following expression for the heat content relative to298K.
12 Fundamentals of Steelmaking
~400~E
I I-
-
10 20g-atom rnof"
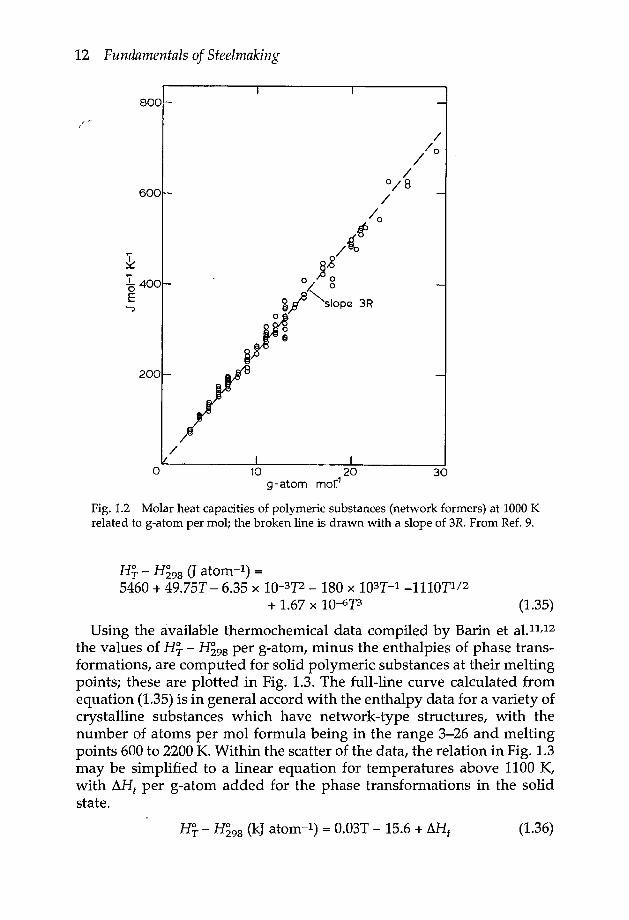
Fig.1.2 Molar heat capacities of polymeric substances (network formers) at 1000 Krelated to g-atom per mol; the broken line is drawn with a slope of 3R. From Ref. 9.
8001-
600-
I 1o 30
HT - H~98 (J atorrr ")=5460 + 49.75T - 6.35 x 10-312 - 180 x 103T-I -1110Tl/2
+ 1.67 X 10-613 (1.35)
Using the available thermochemical data compiled by Barin et al.II,12
the values of H~ - H~98 per g-atom, minus the enthalpies of phase trans-formations, are computed for solid polymeric substances at their meltingpoints; these are plotted in Fig. 1.3. The full-line curve calculated fromequation (1.35) is in general accord with the enthalpy data for a variety ofcrystalline substances which have network-type structures, with thenumber of atoms per mol formula being in the range 3-26 and meltingpoints 600 to 2200 K.Within the scatter of the data, the relation in Fig. 1.3may be simplified to a linear equation for temperatures above 1100 K,with ~Ht per g-atom added for the phase transformations in the solidstate.
H~ - H~98 (kJ atorrr ")= 0.03T - 15.6 + tilit (1.36)

Thermochemistry and Thermodynamics 13
60
IE.B 40enIOlJ.~
//
//
//
./,/
/'/'
,/' 0/'
//
/0
o
o
1100 1500MELTING POINT, K
Fig. 1.3 Heat contents of polymeric substances (network formers) at their meltingpoints; the upper curve - - - is approximate for the liquid phase. From Ref. 9.
700 1900 2300
1.6.4 HEAT OF MELTING
Since thermodynamic quantities are functions of similar state properties,one thermodynamic quantity may be related to another. With this thoughtin mind, in Fig. 1.4, ARm is plotted against Hy - H~98 at the melting pointsof polymeric substances. With the exception of the datum point for silica(ARm = 3.19 k] atom-I), there is a fair correlation which may be repres-ented by the following approximation.
AHm (k] atorrr-t) ~ 0.35(HYm - H~98) - 2.5 (1.37)
1.7 THERMODYNAMIC ACTIVITY
The combined statement of the first and second laws for a system doingwork only against pressure gives the following thermodynamic relation.
dG = VdP - SdT (1.38)
At constant temperature AG = VdP and for 1 mol of an ideal gas V = RT / P;with these substituted in equation (1.38) we obtain
dPdG = RT P = RT d In P (1.39~
Similarly, for a gas mixture
(1.40)

14 Fundamentals of Steelmaking
30
IE 20~o+oJ
roIOl
o
I I I
-
-
20 40 60H~-H;9B AT Tm,kJg-atom-1
80
Fig.1.4 Enthalpy of fusion related to heat contents of polymeric substances at theirmelting points. From Ref. 9.
where Pi is the partial pressure of the ith species in the gas mixture, and c,partial molar free energy.
In a homogeneous liquid or solid solution, the thermodynamic activityof the dissolved element is defined by the ratio
a. = ( vapour pressure of component (i) in SOlution) (1.41)t vapour pressure of pure component T
In terms of solute activity, the partial molar free energy equation is
dGi = RT d In a, (1.42)
Integration at constant temperature gives the relative partial molar freeenergy in solution
G· = RT In a.I Z(1.43)
1.7.1 TEMPERATURE EFFECT ON ACTIVITY
In terms of the relative partial molar enthalpy and entropy of solution
which gives
or
G·=H.-S·T1 1 l(1.44)
(1.45)
(1.46)

Thermochemistry and Thermodynamics 15
1.7.2 SOLUTIONS
A solution is a homogeneous gas, liquid or solid mixture, any portion ofwhich has the same state properties. The composition of gas solution isusually given in terms of partial pressures of species in equilibrium withone another under given conditions. For liquid solutions, as liquid metaland slag, the composition is given in terms of the molar concentrations ofcomponents of the solution.
The atom or mol fraction of the component i in solution is given by the ration·N·=_l
l ~n
where ni is the number of g-atoms or mols of component i per unit mass ofsolution, and Ln the total number of g-atoms or mols. Since the metal andslag compositions are reported in mass percent, n, per 100 g of the sub-stance is given by the ratio
where Mi is the atomic or molecular mass of the component i.Noting that the atomic mass of iron is 55.8Sg,the atom fraction of solute
i in low alloy steels is given by a simplified equation
Nj = r;: x 0.5585 (1.47)l
In low alloy steelmaking, the composition of slag varies within a rela-tively narrow range, and the total number of g-mol of oxides per 100 g ofslag is within the range l:n = 1.6 ± 0.1. With this simplification, the molfraction of the oxide in the slag is given by
%iN, = 1.6M
j(1.48)
1.7.3 MOLAR QUANTITIES OF SOLUTIONS
The molar free energy of mixing (solution), GM, enthalpy of mixing HM,and entropy of mixing, SM, are given by the following summations:
GM = NlGl + N2G2 + N3G3 + . . . (1.49a)
HM = NlHl + N2H2 + N3H3 + . . . (1.49b)
(1.49c)-
For binary systems, a graphical method is used to evaluate the partialmolar quantities from the molar quantity of solution by drawing tangentsto the curve for the molar quantity G as demonstrated in Fig. 1.5.

16 Fundamentals of Steelmaking
N1-----+
Fig.1.S Graphical method of evaluating the partial molar quantities from the molarquantity of a binary system.
1.7.4 IDEAL SOLUTIONS - RAOULT'S LAW (1887)
The solutions are said to be ideal, if the activity is equal to the mol or atomfraction of the component i in solution,
(1.50)
A thermodynamic consequence of Raoult's law is that the enthalpy ofmixing for an ideal solution, HM,id, is zero. Substituting a, = N, and HM,id =
o in the free energy equation gives for the entropy of formation of an idealsolution.
(1.51)
1.7.5 NONIDEAL SOLUTIONS
Almost all metallic solutions and slags exhibit nonideal behaviour. Depend-ing on the chemical nature of the elements constituting a solution, the activityvs composition relation deviates from Raoult's law to varying degrees, asdemonstrated in Fig. 1.6 for liquid Fe-Si and Fe-eu systems at 1600°C.
1.7.6 ACTIVITY COEFFICIENT
The activity coefficient of solute i is defined by the ratio
a·t. = Nl
i(1.52)

Thermochemistry and Thermodynamics 17
0.8
,.. ..
,,,,.. ,,,..
..,
.. .. .... .. ,.., ~
~ .., ,, ,~ ,, .•~ ..~ .., .., .•, ,",',r# "",, ~~ ..", :§:- -,
, 9>0 ,,,' ~ -., ,, ", "
~O.6os:~
0.4
0.2
0.2 0.4 0.6 0.8Silicon (atom fraction)
1.0 0 0.2 0.4 0.6 0.8Copper (atom fraction)
1.0
Fig.1.6 Activities in liquid Fe-Si and Fe-Cu alloys at 1600°Cshowing strong nega-tive and positive departures from Raoult's law.
If the activity is relative to the pure component i, it follows from Raoult'slaw that as N, ~ I, Yi ~ 1.
1.7.6a Henry's law for dilute solutionsIn infinitely dilute solutions, the activity is proportional to theconcentration
a, = yfNi (1.53)
The approach to Henry's law at dilute solutions is demonstrated in Fig. 1.7for the activity of carbon (relative to graphite) in austenite at lOOO°C. Theaustenite containing 1.65%C (Nc = 0.072) is saturated with graphite atlOOO°C for which the carbon activity is one relative to graphite.
Since Henry's law is valid at infinite dilution only, the ratio Yi/yOi is usedas a measure of departure from Henry's law for finite solute' contentsin dilute solutions. For solute concentration in terms of mass percent,Henry's activity coefficient is defined by the ratio
(1.54)
such that t.~ 1 when %i ~ o.1.7.6b Interaction coefficientsOver several mass percentages of the solute, the composition dependenceof activity coefficient fi of solute i in binary systems is represented by thefollowing relation in terms of mass %i.
(1.55)

18 Fundamentals of Steelmaking
0.4
0.8
0.6
0.02 0.04Nc
0.06 0.08 -
Fig.1.7 Activity of carbon in austenite (relative to graphite) at lOOO°C, demonstrat-ing deviation from Henry's law.
where e is called the solute interaction coefficient. For multi-componentsolutions, the following summation is used
log j, = e, [%i] + ~eii [%j] (1.56)
where eii is the effect of the alloying element j on the activity coefficient ofsolute i.
1.7.7 CONVERSION FROM ONE STANDARD STATE TO ANOTHER
In steelmaking processes we are concerned with reactions involving dissolvedelements at low concentrations in liquid steel. Therefore, it is convenient toexpress the solute activity relative to Henry's law. The free energy changeaccompanying the isothermal transfer of solute from state A to state B is
8G = RTln aBaA
Taking a pure component for state A, i.e. aA = 1 and Henry's law for stateB, i.e. aB = yj N,
For one mass percent solute in iron,
N.~ 0.5585l Mi

Thermochemistry and Thermodynamics 19
where Mi is the atomic mass (g) of the solute. Assuming that Henry's lawholds at 1mass %, the standard free energy of solution of pure componenti in iron at Imass % is
~G = RT In (0.5585 '!)S M. Yl
I
(1.57)
Since Henry's law is valid at infinite dilution only, appropriate correctionmust be made for nonideal behaviour when using the above equation.
1.8 REACTION EQUILIBRIUM CONSTANT
A reaction at constant temperature and pressure,
mM + nN = uU + vV
is accompanied by a change in the free energy of the system thus,
AG = (uGu + vGv) - (mGM + nGN)
As shown earlier, the relative partial molar free energy of solution is
Gi = G~+ RT In a,
Inserting this equality in the above equation gives
IlG = [u(Gu + RT In au) + v(G~ + RT In av)]
- [m(GM: + RT In aM) + n(G~ + RT aN)]
At equilibrium AG = 0, therefore, in terms of the activities of reactants andproducts, the standard free energy change accompanying the reaction is
AGO = (uGo + vGo - mCo - nCO) = - RT In (au)u(av)v (1.58)U v M N (aM)m(aN)n
The equilibrium constant is
K = (au)u(av)v(aM)m(aN)n
which inserted in equation (1.58) gives
AGO = - RTIn K
(1.59)
(1.60)
1.8.1 EFFECT OF TEMPERATURE
Since AGO is a function of temperature only, the equilibrium constant isalso a function of temperature only.
20 Fundamentals of Steelmaking
In terms of enthalpy and entropy changes
sn ASInK=- --+--RT R (1.61)
In exothermic reactions Llli is negative, therefore the equilibrium constantI( decreases with an increasing temperature. The temperature effect on Kis the opposite in endothermic reactions.
1.9 PHASE RULE
For the state of equilibrium in the system influenced by temperature,pressure and composition only, from thermodynamic considerationsGibbs derived the following relation, known as the phase rule
f=n-p+2 (1.62)
where f is the degrees of freedom (i.e. number of variables which definethe system), n the number of components and p the number of phases.
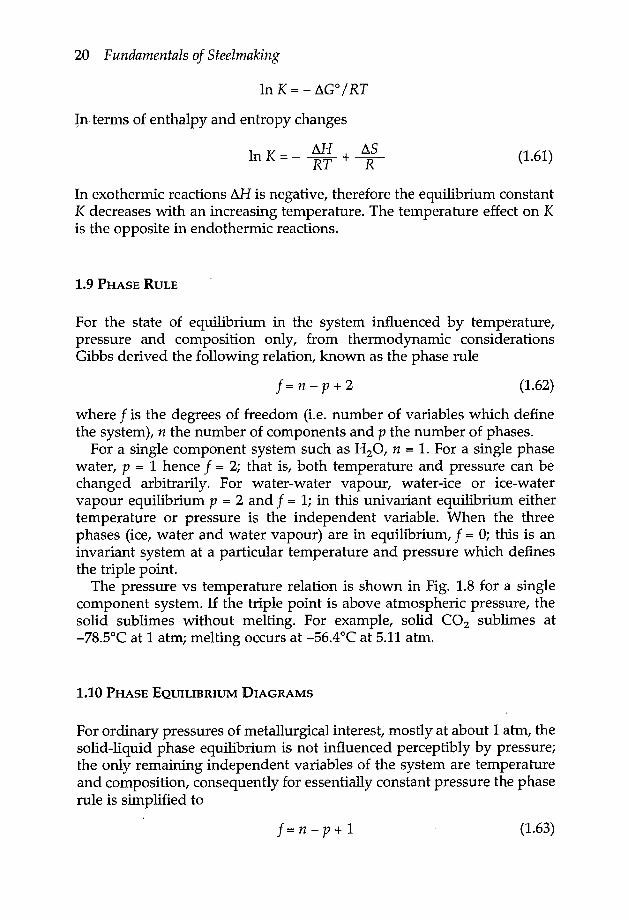
For a single component system such as H20, n = 1.For a single phasewater, p = 1 hence f = 2; that is, both temperature and pressure can bechanged arbitrarily. For water-water vapour, water-ice or ice-watervapour equilibrium p = 2 and f = 1; in this univariant equilibrium eithertemperature or pressure is the independent variable. When the threephases (ice, water and water vapour) are in equilibrium, f = 0; this is aninvariant system at a particular temperature and pressure which definesthe triple point.
The pressure vs temperature relation is shown in Fig. 1.8 for a singlecomponent system. If the triple point is above atmospheric pressure, thesolid sublimes without melting. For example, solid CO2 sublimes at-78.5°C at 1 atm; melting occurs at -56.4°C at 5.11 atm.
1.10 PHASE EQUILIBRIUM DIAGRAMS
For ordinary pressures of metallurgical interest, mostly at about 1atm, thesolid-liquid phase equilibrium is not influenced perceptibly by pressure;the only remaining independent variables of the system are temperatureand composition, consequently for essentially constant pressure the phaserule is simplified to
f=n-p+1 (1.63)

i SolidLiquid
1atm.---------- -----------------------
Vapour
Temperature ~
Thermochemistry and Thermodynamics 21
Solid
Liquid
i~:Jen~ 1 atm.a.
Vapour
Fig.l.8 Phase relations for single component systems.
Temperature ~
1.10.1BINARY SYSTEMS
When the components A and B of a binary system are mutually soluble inthe liquid and solid state, the phase equilibrium diagram has the simplestform as shown in Fig. 1.9. In this system, the solidification of a melt ofcomposition X occurs within the temperature range T1 and T2 and thecompositions of liquid and solid solutions change along the L1L2liquidusand 5182 solidus curves respectively. At an intermediate temperature T',the ratio L'X'IX'S' gives the amount of solid solution 5' relative to theresidual liquid of composition L'.
Solid olution
A 8XB (0/0)
Fig.1.9 Simple binary phase diagram with complete liquid and solid solutions.

22 Fundamentals of Steelmaking
When there is a greater positive departure from ideal behaviour in thesolid solution than for the liquid, the phase diagrams are of the formsshown in Figs. 1.10 and 1.11 for the eutectic and peritectic systems withpartial solid solutions.
In the binary eutectic system within the composition range A' and B',both a and ~ phases are formed at the last stage of solidification. Withthree phases present the degree of freedom is zero, hence the eutecticcomposition and temperature are constant and the solidus line between A'and B' is drawn parallel to the composition abscissa.
In the system shown in Fig. 1.11, there is a peritectic reaction betweenthe solid solution a of composition C and liquid P forming the solid
A B (0/0) B
Fig.1.10 Binary eutectic systems with partial solid solubilities.
Fig. 1.11 Peritectic reaction in a binary system with partial solubilities.

Thermochemistry and Thermodynamics 23
Solid P+liquid (1) Solid P+)--.....x..-----------II liquid (2)
Solid a+liquid (1) Solid a+solid P
A B(O/o)~ B
Fig.1.12 Liquid miscibility gap in a binary system.
solution 13 of composition D. Within the field CDC'D' there are two solidphases a and 13, the compositions of which change with temperature alongthe solubility curves CC' and DD' respectively.
When there is a strong positive departure from ideal behaviour in theliquid solution, a miscibility gap occurs over some composition and tem-perature range as drawn in Fig. 1.12. The horizontal line depicting thethree-phase equilibrium between solid 13, liquid (1) and liquid (2) is calledthe monotectic invariant. With increasing temperature the mutual sol-ubilities of liquid (1), rich in A, and liquid (2), rich in B, increase and abovea particular critical temperature the two liquids become completely misc-ible. The activity vs composition relation for a system with a miscibilitygap is shown in Fig. 1.13.Since the liquids L, and L2 are in equilibrium, theactivity of A will be the same in both phases as indicated by the horizontalline L1L2.
1.10.2TERNARY SYSTEMS
In a ternary system there are two degrees of freedom for the two-phaseregion: two solids or one solid and liquid. The alternative arbitrarychanges that can be made are (i) the concentrations of two of the compo-nents or (ii) temperature and concentration of one of the components. Thatis, in a ternary ..system the two-phase region is depicted by a curvedsurface in the three dimensional temperature-composition diagram as il-lustrated in Fig. 1.14.This simple ternary eutectic system is made up from.three binary eutectic systems A-B, A-C and B-C. The liquidus surfaces areDFGE for component A, DHJE for component Band ]KGE for componentC.These three liquidus surfaces merge at the eutectic invariant point E; the

24 Fundamentals of Steelmaking
1
..•...
......
...... ,
,,
"''''~ ,vo"',r'/q,
"',U'~
,,~~, """""""
1 2 liquids 1 Liquid:- L1+L2 -: (2)"
Liquid(1)
A Atom fraction of B B
Fig.1.13 Activity of component A at temperature Tl of the system given in Fig. 1.12;pure liquid A is the standard state.
H
F
1Q)
~ca~A' 81
E~
cFig.1.14 Three dimensional sketch of a ternary eutectic system.
solidus invariant is the surface A'B'C' that is parallel to the base composi-tion triangle ABC.
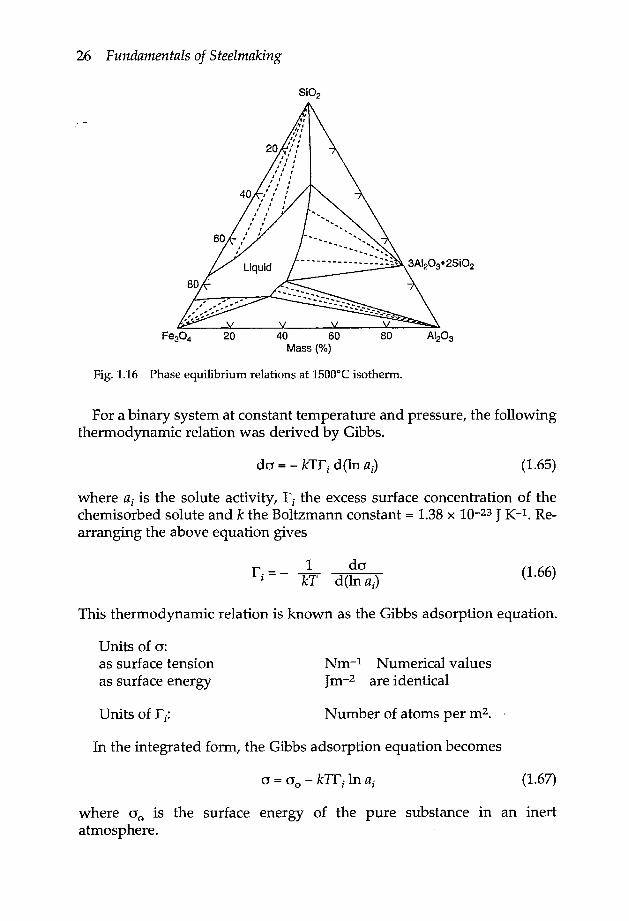
The liquidus surfaces of ternary phase diagrams are depicted in a two-dimensional drawing by projecting the liquidus isotherms onto the com-position triangle as shown in Fig. 1.15 for the system Fe304-Si02-AI203 at1 atm air.13 The phase equilibrium relations in ternary systems are de-scribed more easily by drawing isothermal sections as in Fig. 1.16 for1500°C. The dotted lines in two-phase regions' delineate liquid

Thermochemistry and Thermodynamics 25
WEIGHT %
Fig.1.15 Phase relations at liquidus temperatures in the system Fe304-Si02-AI203in air, based mainly on the data of Muan.P
compositions in equilibrium with the solid phase. In the triangular regionsthere are three phases: two solid phases in equilibrium with liquid of fixedcomposition for a given isotherm.
1.11 SURFACE TENSION (SURFACE ENERGY)
The plane of separation of two phases is known as a surface or interface.For a given system at constant temperature and pressure, the increase infree energy per unit increase in the surface area, is the surface tension(surface energy) or interfacial tension a
aG(J = ( aA )TP n.
, , 1
where G is energy, A the surface area and ni the number of mols of the ithcomponent.
26 Fundamentals of Steelmaking
20 40 60Mass (%)
80
Fig. 1.16 Phase equilibrium relations at 1500°C isotherm.
For a binary system at constant temperature and pressure, the followingthermodynamic relation was derived by Gibbs.
(1.65)
where a, is the solute activity, I', the excess surface concentration of thechemisorbed solute and k the Boltzmann constant = 1.38 x 10⁻²³ J K-l. Re-arranging the above equation gives
1 dar·=- -1 kT d(ln ai)
(1.66)
This thermodynamic relation is known as the Gibbs adsorption equation.
Units of a:as surface tensionas surface energy
Nm-1 Numerical valuesJm-2 are identical
Number of atoms per m2. .
In the integrated form, the Gibbs adsorption equation becomes
(1.67)
where 00 is the surface energy of the pure substance in an inertatmosphere.

2200
2000
~ 1800g.§ 1600enc:Q)
~ 1400('CJ't:
~ 1200
1000
800-9 -8
Thermochemistry and Thermodynamics 27
• Jimbo and Crarno!"
o Kasama et al15
-7 -6 -5 -4In ao
-3 -2
Fig. 1.17 Effect of oxygen on surface tension of liquid iron at 1550°C.
1.11.1 CHEMISORBED LAYER
-1
The surface concentration of solute in the chemisorbed layer is determinedby drawing tangents to the curve in the plot of a against In ai' as shown inFig. 1.17 for the liquid Fe-O melts at 1550°C. At high solute activities, thecurve approaches linearity asymptotically; this limiting slope gives thesurface concentration at saturation designated by rio The fraction of sitescovered by adsorbed species at constant temperature and solute activity isgiven by the ratio
1.11.2 LANGMUIR ADSORPTION ISOTHERM
(1.68)
Based on the kinetic theory of gases and the reaction kinetics of adsorptionand desorption, Langmuir= derived the following relation for the mono-layer chemisorption in a binary system.
(1.69)
--If there is no interaction between the chemisorbed species, the monolayeris said to be ideal for which the coefficient CPi is independent of coverage ofthe surface sites.
28 Fundamentals of Steelmaking
The heat of adsorption ~Ha for a given coverage C{)i is obtained from thetemperature dependence of CPi.
d In CPid(l/T) (1.70)
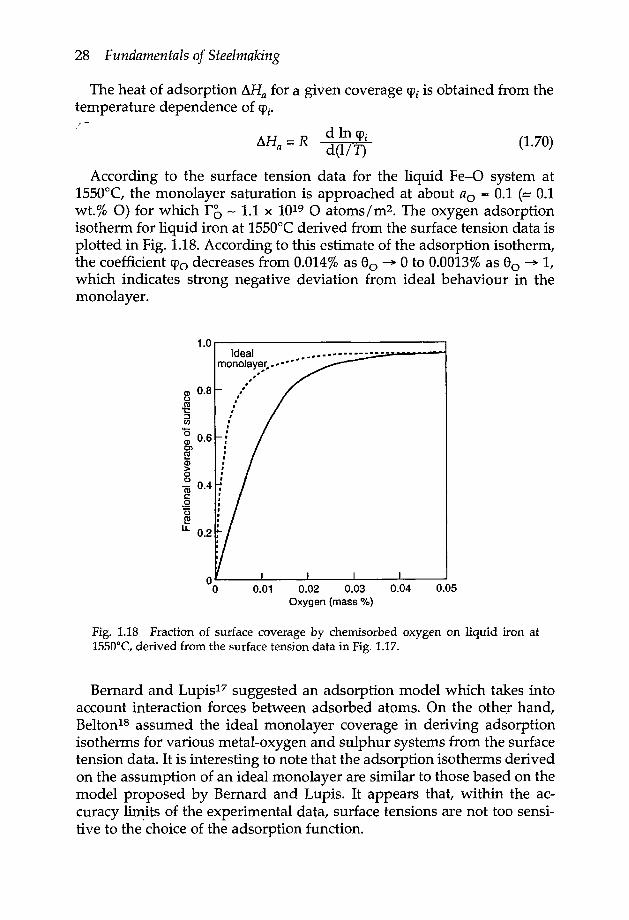
According to the surface tension data for the liquid Fe-O system at1550°C, the monolayer saturation is approached at about ao = 0.1 (:- 0.1wt.% 0) for which ro - 1.1 x 10¹⁹ 0 atoms 1m2• The oxygen adsorptionisotherm for liquid iron at 1550°C derived from the surface tension data isplotted in Fig. 1.1B. According to this estimate of the adsorption isotherm,the coefficient CPo decreases from 0.014% as 80 --+ 0 to 0.0013% as 80 --+ 1,which indicates strong negative deviation from ideal behaviour in themonolayer.
o~--~----~----~----~--~o 0.01 0.02 0.03 0.04 0.05Oxygen (mass %)
Fig. 1.18 Fraction of surface coverage by chemisorbed oxygen on liquid iron at1550°C, derived from the surface tension data in Fig. 1.17.
Bernard and Lupis-? suggested an adsorption model which takes intoaccount interaction forces between adsorbed atoms. On the other hand,Belton-'' assumed the ideal monolayer coverage in deriving adsorptionisotherms for various metal-oxygen and sulphur systems from the surfacetension data. It is interesting to note that the adsorption isotherms derivedon the assumption of an ideal monolayer are similar to those based on themodel proposed by Bernard and Lupis. It appears that, within the ac-curacy limits of the experimental data, surface tensions are not too sensi-tive to the choice of the adsorption function.

Thermochemistry and Thermodynamics 29
For the limiting case of 8i approaching I, the fraction of sites not oc-cupied, 1-8i, is inversely proportional to the solute activity
(1.71)
With liquid iron this limiting case is approached at - 0.1 % 0 or -0.01 % s.
1.11.3 EFFECT OF SURFACE CURVATURE ON SURFACE TENSION
From thermodynamic considerations, Kelvin derived the following rela-tion for a curved surface, here given in terms of the vapour pressure ofspecies i,
I J:L _ ( 20 ) ( Vi )n P*. - r RT
l
(1.72)
where Pi is the vapour pressure over a curved surface and P", for a planesurface, r the radius of curvature and i\ the relative partial molar volumeof the ith component in solution.
For bubbles in a liquid, the excess pressure in the bubble is given by
AP = P_P* = 20r (1.73)
1.12 INTERFACIAL TENSION
Interfacial tension between two solids, two dis-similar liquids, or solid andliquid, plays a role to a varying degree of importance in the processing ofmaterials, e.g. ore beneficiation by flotation, sintering, inclusion coales-cence in liquid metals, emergence of inclusions from liquid steel to overlaying slag and so on.
1.12.1 CONTACT ANGLE
Examples of contact angles are illustrated in Fig. 1.19 for solid-liquid andliquid-liquid systems.
The contact angle e is defined as the angle included within the liquidphase. When 8 > 90°, the system is non-wetting. Wetting of the solid by theliquid occurs when e < 90°, complete wetting being achieved when e = 0°/Under equilibrium conditions at the triple point A, the surface tension Osgis balanced by the horizontal resolution of tensions 0sl and (JIg in theopposite direction, thus

30 Fundamentals of Steelmaking
Gas (G) O'lG Gas (G)
~A
Solid (S) .O'LS O'SG
Solid (S)O'LS O'SG
Gas (G)
Fig.1.19 Contact angles at solid-liquid and liquid-liquid interfaces.
solid-liquid:
liquid-liquid:Osg = 0sl + 0lg Cos 8
01_(7 COS cP = 0Zg COS a + all Cos f3g::, 1 ] 2
(1.74a)
(1.74b)
1.12.2 WORK OF COHESION, WORK OF ADHESION AND SPREADINGCOEFFICIENT
The work required to split a column of liquid or solid into two surfaces ofunit area is called the work of cohesion, We.
We = 2011g (1.75)
Consider a column of liquid III interfacing with another liquid 12 or solids. Upon separation at this interface, two new surfaces of unit area arecreated (ZIg and l~ or sg) and one interface of unit area is lost (1112 or lIS).The accompanying change of interfacial energy is called the work of adhe-sion, Wa.
Wa = 01 g + 01_(7 - all (1.76)1 g::, ) 2
The spreading coefficient Sp of liquid (1)on liquid (2) or on a ·solid isgiven by the difference between the work of adhesion and work ofcohesion
= al2Z - aZ)g - a 1)12
= 0sg - 0Z)g - 01)s
(1.77a)
(1.77b)

Thermochemistry and Thermodynamics 31
The spreading or wetting occurs when Sp is positive. That is, spreading ofliquid (1) on particles of liquid (2) or on a solid particle, will occur when
(1.78a)
(1.78b)or
1.13 COMPUTER-BASED PACKAGES
The computer-based packages are routinely used in the chemical, metal-lurgical and many other industries to calculate the reaction equilibria inmultiphase systems. This subject is outside the scope of this book;however, a few references are given below on computer-based pro-grammes in relation to metallurgical processes.
a. MTDATA:The National Physical Laboratory (UK) computer package MTDATA is athermodynamic database which can be used to determine the equilibriumcompositions of multi-component mixtures of gases, liquids and solids.Application of MTDATA to modelling of slag, matte, metal and gas phaseequilibria is illustrated in a publication by Dinsdale et al.19
b. F*A*C*T:The Facility for the Analysis of Chemical Thermodynamics (F*A*C*T),developed by Thompson et al.20, is an online database computing system.The system performs a wide range of computations from simple gas reac-tions to heterogeneous equilibria involving up to 12 components and 500species. Graphical output is provided with programmes which generatePourbaix diagrams, isothermal predominance diagrams and binary andternary potential-composition phase diagrams.
c. SOLGASMIX:This computer package is based on the concept of the Gibbs free energyminimisation which determines reaction equilibria in multiphase metal-lurgical systems.21,22.
d. ChemSage:The computer programme called ChernSage, based on SOLGASMIXGibbs energy minimiser, is designed to perform three types of thermo-chemical calculations in complex systems which involves phases exhibit-ing nonideal mixing properties: (i) calculations of thermodynamic func-tions, (ii) heterogeneous phase equilibria and (iii) steady-state conditionsfor the simulation of simple multistage reactors. The module for ther-
32 Fundamentals of Steelmaking
modynamic functions calculates specific heat, enthalpy, entropy and freeenergy with respect to a chosen reference state for a given phase; whenthe phase is a mixture, the partial quantities of its components are evalu-ated. Chemical equilibrium calculations can be made for a system whichhas been uniquely defined with respect to temperature, pressure (orvolume) and composition. One of these quantities may be replaced by anextensive property or phase target, as for example the calculation ofadiabatic and liquidus temperatures, respectively. The use of this Chem-Sage programme is demonstrated in a paper by Eriksson and Hack.P,
REFERENCES
1. The Collected Works of J. Willard Gibbs, vols I and Il, Longmans, Green, NewYork, 1928.
2. G.N. LEWIS and M. RANDALL, Thermodynamics and the free energy of chemicalsubstances, McGraw-Hill, New York, 1923.
3. K.S. PITZER and L. BREWER,Thermodynamics - Lewis & Randall, McGraw-Hill,New York, 1961.
4. E.A. GUGGENHEIM,Thermodynamics, Wiley Interscience, New York, 1949.5. L.S. DARKEN and R.W. GURRY,Physical chemistry of metals, McGraw-Hill, New
York, 1953.6. D. GASKELL, Introduction to metallurgical thermodynamics, McGraw-Hill, New
York, 1973.7. E.T. TURKDOGAN,Physical chemistry of high temperature technology, Academic
Press, New York, 1980.8. E.T. TURKDOGAN,Ironmaking and Steelmaking, 1993, 20, 469.9. E.T. TURKDOGAN, Physicochemical properties of molten slags and glasses, The
Metals Society, London, 1983.10. K.M. KRuPKA, R.A. ROBIEand B.S. HEMINGWAY,Am. Minerolog., 1979, 64, 86.11. 1. BARIN and O. KNACKE, Thermochemical properties of inorganic substances,
Springer-Verlag, Berlin, 1973.12. 1.BARIN, 0, KNACKE and o. KUBASCHEWSKI,Thermochemical properties of in-
organic substances - Supplement, Springer-Verlag, Berlin, 1977.13. A. MUAN, J. Am. Ceram. Soc., 1957, 40, 121.14. 1. JIMBOand A.W. CRAMB, Iron Steel Inst. Japan, International, 1992, 32, 26.15. A. KASAMA, A. McLEAN, W.A. MILLER,Z. MORITA and M.J. WARD, Can. Met.
Quart., 1983, 22, 9.16. I. LANGMUIR,J. Am. Chern. Soc., 1916, 38, 2221; 1918, 40, 1361.17. G. BERNARDand C.H.P. LUPIS, Surf. Sci., 1974, 42, 61.18. G.R. BELTON,Metall. Trans. B, 1976, B7, 35.19. A.T. DINSDALE, S.M. HODSON and J.R. TAYLOR, in '3rd International Con-
ference on molten slags and fluxes', p. 246. The Institute of Metals, London,1989. .

Thermochemistry and Thermodynamics 33
20 W.T. THOMPSON,G. ERIKSSON,C.W. BALEand A.D. PELTON,in 'Computerizedmetallurgical databases symposium', p. 53, eds. J.R. Cuthill, N.A. Gokcen andJ.E. Morral. Metall. Soc. of AI ME, Warrendale, Pa, USA, 1988.
21 G. ERIKSSONand E. ROSEN, Chern. Scr., 1973, 4, 193.22 G. ERIKSSON,Chern. Scr., 1975, 8, 100.23 G. ERIKSSONand K. HACK, Metall. Trans. B., 1990, 21B, 1013.

CHAPTER 2
Rate Phenomena
There are many different facets of rate phenomena involving homoge-neous or heterogeneous chemical reactions, mass transfer via atomic ormolecular diffusional processes, viscous flow, thermal and electrical con-duction and so on.
In high temperature processes as in pyrometallurgy, the rates of interfa-cial chemical reactions are in general much faster than the rates of transferof the reactants and reaction products to and from the reaction site. Theformulations of rate equations for transport controlled reactions vary con-siderably with the physical properties and type of fluid flow over thesurface of the reacting condensed phase. Then, there are formulations ofrate equations for different regimes of gas bubbles in liquid metal andslag. For a comprehensive discussion of the transport controlled ratephenomena in metallurgical processes, reference may be made to text-books by Szekely and Themelis.! and by Ceiger.> In section 2.8 referencesare given to a few publications on the use of computer software in themathematical and physical modelling of various aspects of the ratephenomena which are encountered in metallurgical processes.
The rate phenomena discussed in this chapter are on chosen subjectswhich are pertinent to various aspects of ferrous-pyrometallurgical pro-cesses, in addition to oxygen steelmaking, ladle refining and degassing.
Selected examples are given of laboratory experiments on the study ofreaction rates in simple systems to demonstrate how the rate controllingreaction mechanisms are identified and the rate constants determined.
2.1 KINETICS OF INTERFACIAL REACTIONS
In steelmaking and related processes we are concerned with heterogenousreactions involving an interface between two reacting phases, e.g. solid-liquid, solid-gas, liquid-gas and two immiscible liquids (slag-liquid steel).
For the case of a fast rate of transport of reactants and products to andfrom the reaction site, the rate is controlled by a chemical reaction occur-ring in the adsorbed layer at the interface. The reaction between adsorbedspecies Land M on the surface producing product Q occurs via the forma-tion of an activated complex (LM).*
= (LM) * ~ Q
{activated} { stage II }complex products
(2.1)
{stage I }
. reactants
34

Rate Phenomena 35
i~E>Cl)c:W
AGO
----!----------------------------------
Activated complex
Reaction path
Fig.2.1 Change in energy profile during the formation and decomposition of theactivated complex involved in the reaction.
The theory of the absolute reaction rates is based on the concept of theformation of an activated complex as an intermediate transition state, whichhas an infinitesimally short life time of the order of 10-15 second. For an in-depth study of the theory of reaction kinetics, to which outstanding contri-butions were made by Eyring and co-workers, reference may be made tothe classical text books by Glasstone et al.3 and by Hinshelwood.s
As illustrated in Fig. 2.1, there is a change in energy profile accompany-ing the reaction that involves the formation and decomposition of anactivated complex. While the change in free energy accompanying reac-tion (2.1) is AGo<O, the activation energy L\G*>O.
The theory of the absolute rates states that the activated complex is inequilibrium with the reactants for which the equilibrium constant K* forconstant temperature is
*K* = _a_aLaM
(2.2)
where as are the thermodynamic activities. .Next to be considered is the specific rate of decomposition of the acti-
vated complex to the overall reaction product Q, represented by
dn _ (kT)dt - 11
where ~~ = the reaction rate, mol cm-2s-1
k = the Boltzmann constant, 1.380 x 10⁻²³ J K-lh = the Planck constant, 6.626 x 10⁻³⁴ J sT = temperature, K
ro = total number of adsorption sites on the surface, =1015 mole cm-26* = fractional coverage by the activated complex.
(2.3)

36 Fundamentals of Steelmaking
For single site occupancy by the activated complex in the adsorbedlayer, the activity of the complex is represented by
e*a* = cp* --1-8 (2.4)
where 8 is the total fractional occupancy of the sites by the adsorbedspecies and cp* is the activity coefficient of the complex in the chemisorbedlayer. Combining equations (2.2), (2.3) and (2.4) gives the rate of forwardreaction in terms of the absolute reaction rate theory.
dn kT K*~= ciT = ( h) r, «(jT) (1- 0) {aLaM} (2.5)
The thermodynamics of the chemisorbed layer at the interface, i.e.values of r0' K* and rp", are not known, therefore the isothermal rateequation is given in a simplified general form thus
(2.6)
where CPj is the isothermal rate constant of the forward reaction.As the reaction progresses, concentrations of the reactants Land M
decrease while the concentration of the product Q increases. Because ofthese composition changes and the influence of the reverse reaction Q ~ L+ M, the rate decreases with an increasing reaction time. The rate of thereverse reaction is represented by
(2.7)
where <Pr is the rate constant of the reverse reaction. Therefore, the netoverall rate of reaction is
(2.8)
When the rates of forward and reverse reactions are the same, i.e. dnl dt= 0, the reaction is said to be at an equilibrium state. It follows that the ratioof the rate constants <Pfl <I> r is the equilibrium constant of the reaction.
K - ~ - ( ~ ) (2.9)- CPr - aLaM eq
In terms of a single rate constant, the net reaction rate is formulated as
(2.10)
where (aLaM)eq is the equilibrium value for the activity aQ in stage II at anygiven reaction time.
For a given surface coverage 8, the temperature dependence of the rateconstant is' represented by

Rate Phenomena 37
10)c·00caQ)~o.5
'EcaencooQ)ro~
+ lncreasinq-r-r--
Fig. 2.2 Effect of temperature on rate constant for reaction involving an activatedcomplex.
(2.11)
where <1>0 is a pre-exponential constant and AH* is the heat of activation forthe reaction at a given site fillage 8.
Since the activation energy ~G* is always positive, the enthalpy of ac-tivation for the reaction is also positive. As shown in Fig. 2.2, in the plot In<Pvs 1/ T the slope of the line gives AH*. It should be noted that since thethermodynamic quantities for the activated complex (K* / cp*) in the chem-isorbed layer are not known, the AH* derived from the rate measurementsover a sufficiently large temperature range, is the apparent heat ofactivation.
Another aspect of the kinetics of interfacial reactions is the rate of chem-isorption or desorption at the reaction surface as given by the followingtheoretical equation for an uncontaminated surface.f
<l>f= (21tMiRT)-1/2 exp (-~H* / RT) (2.12)
where Mi is the molecular mass of the adsorbed species. This equation istransformed to the following form for the maximum rate of vaporisation,i.e. free vaporisation, from an uncontaminated surface at low pressures
Ra Pitemax = -----=~-- (2.13)
where Pi is the vapour pressure in atm. for which the equation is reducedto the following form.
(2.14)

38 Fundamentals of Steelmaking
2.1.1 EXAMPLES OF EXPERIMENTS ON RATES OF INTERFACIAL REACTIONS
2.-1.1a Nitrogen transfer across iron surfaceThe rate of reaction of gaseous nitrogen with liquid and solid iron, in thepresence or absence of surface active alloying elements, has been studiedby many investigators since the late 1950s. It was in the late 1960s that therate controlling reaction mechanism was resolved,5-7 which was furtherconfirmed in the subsequent experimental work done by Fruehan andMartonikf and by Byrne and Belton."
When the rate of reaction is not hindered by slow nitrogen transport toand from the gas-m~tal interface, the rate of nitrogenation
N2(g) = N*2 ~ 2[N] (2.15)
is controlled either by the rate of chemisorption or dissociation of N2molecules on the metal surface. The rate of reverse reaction, i.e. de-nitrogenation, is of course a second order type with respect to nitrogendissolved in the metal. The equation below represents the rate of nitrogentransfer from gas to liquid iron
(2.16)
where p is the density of liquid iron, A the surface area of the melt onwhich the nitrogen stream is impinging and V the volume of the melt. Therate constant <PI' in units of g N cm-2min-1atm-1N2I is for the forwardreaction (2.15). The equilibrium partial pressure (PN2)eq corresponding tothe nitrogen content of the melt at the reaction time t, is that given by theequilibrium constant K for nitrogen solubility.
(PN2)eq = [%N]2/K
With this substitution the isothermal rate equation is
(2.17)
d [%N] = 100A <I>(1- 8) { - [o/£N]2/K}dt pV f PN2 0
For constant N2 pressure and temperature, the integration of equation(2.18)gives for %N = 0 at t = 0,
In KpN2 + [%N] = 2 100A <I> (1 - 8)t (2.19)KpN2 - [%N] PN2 pV f
(2.18)
Byrne and Belton? made an accurate determination of the rate constant<pjforreaction of N2 with high purity iron and Fe-C alloys at 1550-1700°C,by measuring the rate of 15N ~ 14N isotope exchange that occurs on theiron surface, as represented by

Rate Phenomena 39
log <Pf= - 6340 ~ (710) + 1.85 (± 0.38) (2.20)
where the rate constant <l>fis in units of g N cm-2min-1atm-1. The apparentheat of activation A.H* = 121.4 k] mol-1 is much lower than the valueexpected for the rate of dissociation of N2• As pointed out by Byrne andBelton, the rate of chemisorption of N2 is presumably controlling thereaction mechanism.
The surface active elements dissolved in iron, e.g. 0, S, Se, Te, areknown to lower the rate of nitrogen transfer across the iron surface. On thebasis of the experimental rate data with liquid iron containing 0 and 5, asgiven in various publications (Refs. 6-10) and the surface tension data, theeffects of ° and S on the fraction of vacant sites, 1-8, in the chemisorbedlayer may be represented by
11 - 8 = 1 + 260 (%0 + %5/2) (2.21)
which is a slightly simplified form of the equation that was derived byByrne and Belton.
For the chemical reaction-controlled nitrogen removal from liquid iron(or steel) in reduced pressures or in an inert gas stream with very low Nzpressure
(2.22)
the integrated form of the rate equation is
100A <Pr (1- 8)tpv- (2.23)
where %No is the initial nitrogen content and <Pr the rate constant = <l>f/ K.The solubility of Nz in liquid iron or low alloy steel is given by
376log K (= [%N]z/PN2 (atm) = - T ~2.48 (2.24)
Combining this with equation (2.20) gives for the rate constant <I>r in gNcm-2min-1%N-l
5964log <I>= - -- + 4.33r T (2.25)
2.1.1b Rate of decarburisation of liquid Fe-C alloys by CO2
Sain and Beltoril! determined the rate of decarburisation of high purityFe-C alloys by CO2 at temperatures between 1160 and 1600°C, underconditions where mass transport of reactants was not rate determining.For the reaction

40 Fundamentals of Steelmaking
CO2(g) + [C] -+ 2CO(g) (2.26)
the rate of decarburisation was found to be controlled by the rate ofchemisorption of CO2 on the melt surface. That is,
d[%C]dt = - <Pf (1 - 8)PC02 (2.27)
for which the following rate constant <PI' g C cm-2min-1atm-1, was ob-tained as a function of temperature.
5080log CPf = - -r + 2.65 (2.28)
The temperature coefficient corresponds to an apparent heat of activationMI* = 97.3 k] mol-I which, as argued by Sain and Belton, is indicative ofthe rate of chemisorption being the controlling reaction mechanism. If therate were controlled by the dissociation of CO2 in the adsorbed layer, theapparent heat of activation would have been much higher, e.g. 375 to 425k] mol-I.
The sulphur in iron retards the rate of decarburisation, i.e. rate of CO2chemisorption, in much the same way as it affects the rate of N2 chem-isorption. This is demonstrated by the experimental results of Sain and
6
o 0 0.002 0.004 0.006 0.008 0.010Sulphur (mass %)
Fig. 2.3 Effect of sulphur on the rate constant for decarburisation of graphite-saturated liquid iron. From Ref. 11.

Rate Phenomena 41
Belton reproduced in Fig. 2.3. The curves were calculated for the values of(1-8), derived from the surface tension data on the Fe-C-S melts. A similarresult is obtained by using equation (2.21) with due correction for theeffect of carbon on the activity coefficient of sulphur f'§, thus for the Fe-C-Smelts
1(1 - 8) = 1 + 130f~ [%S]
where logf~ = O.11[%C].
(2.29)
2.2 FICK'S DIFFUSION LAWS
2.2.1 FIRST LAW-STEADY STATE DIFFUSION
The quantity of diffusing substance which passes per unit time throughunit area of a plane perpendicular to the direction of diffusion, known asthe flux I, is proportional to the concentration gradient of the diffusingsubstance
J=-D ~ (2.30)
The coefficient D is the diffusivity of the substance in the medium; C is theconcentration of the substance per unit volume and x the distance in thedirection of diffusion.
The steady state diffusion is illustrated graphically in Fig. 2.4 for gasdiffusing through a permeable diaphram of thickness Sx.
2.2.2 SECOND LAW-NONSTEADY STATE DIFFUSION
The rate of accumulation of diffusing substance in a given volume elementis the difference between the inward and outward -flux. In other words,what goes in and does not come out, stays there.
The rate of concentration change - del dt resulting from flux over adistance dx is
dCJ = - dt dx
Hence, the change in flux with distance is
d] dedx = - dt
Invoking the first law and re-arranging gives the second law.

42 Fundamentals of Steelmaking
Impermeable wallsof the vessel
~--~X---..
Distance X
Fig. 2.4 Illustration of steady state diffusion.
(2.31)
The solution of this equation depends on the geometry and on theboundary conditions of the medium in which the dissolved substance isdiffusing.
For the boundary conditions,Co = initial uniform concentrationC, = constant surface concentrationD = constant diffusivity
the solution of Fick's second law gives the relation in terms of dimension-less variables shown in Fig. 2.5 for the sphere and infinite cylinder ofradius L, and slab of thickness 2L. The fractional saturation, or desatura-tion is defined by
i= Cm-CoCs-Co
where Cm is the mean concentration of the diffusate.

Rate Phenomena 43
1.0~--------------~~--~~--------~~~0.9
0.8
0.7
.°1°0
.
6
IE 1(1)0.5o 0
0.4
0.3
0.2
0.1OL-----------~------------~----------~a 0.5 1.0 1.5
1Dt-L-
Slab, sheet(infinite width and length,
thickness 2L)
Fig.2.5 Mean concentration or fractional saturation of slab, cylinder, or sphere ofuniform initial concentration Co and constant surface concentration CS1 Cm is themean concentration at time t.
2.2.3 INTERDIFFUSION IN BINARY METALLIC SOLUTIONS
In a study of diffusion in alpha brass, Smigelskas and Kirkendall= foundthat zinc moves much faster than copper as evidenced by the relativemotion of inert molybdenum wire placed on the sample as markers. Thisobservation of the difference in the drift velocities of components of a solidsolution, known as the 'Kirkendall effect,' led to numerous definitions ofthe coefficient of diffusion in binary metallic solutions, e.g. chemical dif-fusivity, intrinsic diffusivity or volume diffusivity. Subsequently, Starkl 'showed that the interdiffusivity D is an invariant of binary diffusion mo-tion as formulated below
D-- C2V2fl _ C1V1J2- act/ ax ac2/ axwhere Vs are the partial molar volumes. For dilute solutions, i.e. C2 --+ 0and C1VI --+ 1, the above equation reduces to the form of Fick's first law
(2.32)
12 = -D dC2dx
.~Darkent+ and Hartley and Cranktf independently derived the
phenomenological equation for diffusion in a binary system 1-2, showingthe thermodynamic effect on the interdiffusivity

44 Fundamentals of Steelmaking
- - d In a2D = (C1VID~ + C2V2DD d In C2
where D*1 and D*2 are the self-diffusivities of components I and 2. Fordilute solutions, C2 ~ 0, D = D*2.
(2.33)
2.2.4 DIFFUSION IN IONIC MEDIA (SLAGS)
Polymeric melts, i.e. molten slags and glasses, are ionic in nature consist-ing of positively charged ions, known as cations, and negatively chargedcomplex silicate, aluminate and phosphate ions, known as anions. Cationsare the primary mobile species in polymeric melts. For the limiting case ofD*a (anion) « D", (cation), the chemical diffusivity of the cation is aboutthe same as the self-diffusivity, Dc - D*c.
2.3 MASS AND HEAT TRANSFER THROUGH REACTION PRODUCT LAYER
2.3.1 PARABOLIC RATE OF OXIDATION OF IRON
The scale forming in the oxidation of iron, or low alloy steels, consists ofthree layers of oxides: wustite on the iron surface followed by magnetitethen haematite on the outer surface of the scale. From several experimen-tal studies it was found that the average wustite/magnetite/haematitethickness ratios were about 95:4:1.In iron oxides, the diffusivity of iron isgreater than the oxygen diffusivity. The rate of oxidation is controlledprimarily by diffusion of iron through the wustite layer from the iron-wustite interface to the wustite-gas or wustite-magnetite interface, thenthrough the thin layers of magnetite and haematite.
The flux of iron through the wustite layer is by Fick's first law
where D is the iron diffusivity, C the concentration of Fe in wustite and Xthe thickness of the wustite layer. Upon integration
]Fj( = D(C' - C") (2.34)
where C' and C" are the iron concentrations in the oxide at the iron-wustite and wustite-gas (or magnetite) interfaces respectively. The rate ofincrease in scale thickness with the flux of iron is
- dX]Fe = C dt (2.35)

Rate Phenomena 45
where C is the average iron content of wustite. From equations (2.34) and(2.35)
c x: = D (C' - e")
which upon integration gives the parabolic rate equation,
){2 = 2D (C' - C")tC (2.36)
or (2.37)
where Ais the parabolic rate constant, em- (scale) S-l
If the measurement of the rate of oxidation is made by the thermo-gravimetric method, then the parabolic rate constant ~ would be in unitsof (gO)2cm-4s-1. From the compositions and densities of the oxides, withthe relative thickness ratios of wustite:magnetite:haematite = 95:4:1, thevalues of kp and Aare related as follows.
kp, (gO)2cm-4s-1 = 1.877/"', em- (scale) S-l (2.38)
Many experimental studies have been made of the rate of oxidation ofiron in air and oxygen at temperatures 600 to 1300°C. The temperaturedependence of the parabolic rate constant is shown in Fig. 2.6; the refer-ences to previous studies denoted by different symbols are given in apaper by Sheasby et al.16
From theoretical considerations, Wagner"? derived the following equa-tion for the parabolic rate constant in terms of the activity of oxygen andself-diffusivities of the mobile species in the scale. For the case of wustitewith D*Pe» D*o, Wagner equation is simplified to
(2.39)
where a'° and a"° are oxygen activities at the iron-wustite and wustite-magnetite interfaces, respectively.
The values of kp = 1.877"- calculated from the measured tracer diffusivityof iron18,19using Wagner's equation, are consistent with the average ex-perimental values in Fig. 2.6, which is represented by the followingequation. /
8868log kp = - -----r- + 0.9777 (2.40)

46 Fundamentals of Steelmaking
TEMPERATURE,oC
1300 1200 1100 1000 900 800 700 600
10-5
4
10-6
4
Itt 10-7~E~
N ··_·40~ a..::t.
10-8
4
10-9
4
C10-10
6 8 10 12
104 K-1T '
Fig. 2.6 Temperature dependence of the parabolic rate constant for oxidation of ironin air or oxygen with or without H20. From Ref. 16.
2.3.2 HEAT-TRANSFER CONTROLLED CALCINATION OF LIMESTONE
In the rate measurements made by Turkdogan et al.20 on the calcination ofrelatively large spheroidal particles of limestone (3 to 14 cm dia), thecentre and surface temperatures of the samples were measured with thePt/Pt-Rh thermocouples during calcination. As noted from an example ofthe experimental data in Fig. 2.7, after about 50 percent calcination, withthe formation of an outer casing of CaO, the centre temperature 'of theCaC03 core remained constant at 897°C until all the carbonate haddecomposed.
The dissociation pressures of reagent gradient CaC03 measured byBakers! and Hills22 are represented by the following equation.
8427log Peo2 = - ----y- + 7.169 (2.41)

Rate Phenomena 47
1400
Surface
Furnace
-uL
Center
50%400~ ~f~ ~ ~~ IO_O~
o 40 80 120 160Time (min)
Fig.2.7 Variation of surface and centre temperatures during calcination of 8.3 emdiameter limestone sphere in argon at 1 atm. From Ref. 20.
In the calcination experiments in argon at 1 atm pressure, the CO2 press-ure will be about 1 atm at the calcination front within the particles, forwhich the calculated centre temperature would be 902°C. This dissociationtemperature is very close to the measured centre temperature 897°C, in thecalcination of a high grade natural limestone, containing 2 mol% MgC030
On the basis of these experimental findings, the rate controlling stepwas considered to be heat transfer through the porous CaO outer casingaround the limestone core of the spheroidal sample for which the follow-ing rate equation would apply.
[3 - 2F - 3 (1 - F)2/3] = 6K (Ts - Ti) t + Ce p~Hr~
where F is the fraction of CO2 removed in calcination time t, Ke the effec-tive thermal conductivity of burnt lime, T, the outer surface temperature,Ti that at the centre, p the bulk density of the limestone in units of molcm-3, ~H the enthalpy of calcination, r0 the initial radius of the spheroidallimestone particle and C is a constant (a negative number) that takes
(2.42)

48 Fundamentals of Steelmaking
account of all early time departures from the assumed boundary condi-tions for which equation (2.42) applies.,.to -For the period of calcination when the temperature difference AT= T, -T, remains essentially unchanged, the effective thermal conductivity ofburnt lime can be determined from the weight loss data .using equation(2.42). Thus, with the notation [3-2F-3(1-F)2/3] = Y,
_ dY (PLlli,;,)Ke - dt 66.T (2.43)
An example of the calcination rate data is given in Fig. 2.8 for a spheroi-dal14 em diameter (3.58 kg) limestone. Beyond 50 percent calcination, themeasurements are in-accord with the rate equation (2.42). The linear varia-tion of (dY/ dt)r20 with the temperature difference AT across the limelayer, shown in Fig. 2.9, is in accord with the equation (2.43). The slope ofthe line with the appropriate values of Llli and p*, gives for the effectivethermal conductivity Ke = 0.0053 J cm-1s-1K-l for burnt lime with a poros-ity of about 50%.
2.4 REACTION OF GASES WITH POROUS MATERIALS
The rate of a heterogeneous reaction between a fluid and a porous me-dium is much affected by the counter-diffusive flow of fluid reactants andproducts through pores of the medium. Complexities of the rates of reac-tion of gases with porous materials are highlighted in this section withexamples on the oxidation of carbon and the reduction of iron oxide whichare relevant to some of the pyrometallurgical processes related to iron andsteelmaking.
2.4.1 MATHEMATICAL ANALYSIS OF THIELE (1939)
The first mathematical analysis of a dual reaction rate-diffusion controlledprocess on the pore surface is attributed to the work of Thiele.P In order toobtain an analytical expression in a closed form for the rate of reaction onthe pore surface, Thiele considered an ideal simple pore structure with thefollowing assumptions.
1. The reactant molecules of the fluid are transported into and-withinthe porous structure of a granule by a diffusive flux through a con-centration gradient.
2. There is no volume change in the fluid medium resulting from thereaction on the pore surface, i.e. no pressure buildup in pores.
"For the limestone containing 2 mol % MgC03,AH is about 159.7 k] mol-1 and the carbonate density p= 0.0248 mol cm-3•

Rate Phenomena 45
1.0
0.8
0.6
Y
0.4
0.2
00 5
100
99
95 "0Q)
>o90 ~
Nou?J.
75
50
10 15 20 25 30Calcination time x 10-3 (sec)
Fig. 2.8 Calcination rate of 14 em diameter (3.58 kg) limestone spheroid in air at1135°C, plotted in accord with equation 2.42. From Ref. 20.
roQ)~
N
Eo-~Q)(
No~....-...>-I+- 6"0 'a'-""
Fig. 2.9 Variation of the rate of calcination, (dY/ dt)r~, with the temperature dif-ference across the calcinated layer. From Ref. 20.

50 Fundamentals of Steelmaking
3. The surface diffusion in the adsorbed layer on the pore wall isnegligible .
. r - 4. The pores are interconnected, uniform in cross sections and the poresurface area remains unchanged.
5. The reverse reaction at the pore wall is negligible and the steady stateconditions prevail.
6. The temperature across the particle remains uniform.In a detailed study of the reaction rates on catalyst pores, Wheeler= and
Weisz and Prater= made an extensive use of Thiele's analysis in derivingrate equations for reactions on pore surfaces. For example, for a first ordertype reaction involving a gaseous species i, the rate of reaction per spheri-cal porous pellet of radius r is given by the following expression.
Rate per pellet (mol S-l) =
4Jtr2Ci (cppSDe)1/2 { tanh\3'l/J) - 3~ } (2.44)
where C, = molar concentration per em> of reactant in the gas stream out-side the pellet,
<I> = specific rate constant of chemical reaction per unit area of thepore wall,
p = molar bulk density of the porous medium,5 = internal pore surface area per unit mass, cm2mol-1,
De = effective gas diffusivity, characteristic of the porous medium,cm2s-1,
tp = Thiele's dimensionless parameter defined by
tV = ! (cllPS) 1/23 De
Three rate limiting cases are given below.(a) When 'ljJ is small, e.g. tV<0.2, with (i) decreasing particle size, (ii) de-creasing temperature, i.e. decreasing cI> / De' and (iii) decreasing pressure,i.e. increasing De' the dimensionless parameters in parenthesis in equation(2.44) approach the value of 'ljJ in equation (2.45) and equation (2.44) issimplified to
(2.45)
4Rate per pellet (mol S-1) = 3" nr3cppSCi (2.46)
This is the limiting case for almost complete pore diffusion, hence internalburning.(b) When tp is large, e.g. tp>2, with (i) increasing particle size, (ii) increasingtemperature, i.e. increasing ell/ De and (iii) increasing pressure, i.e. decreas-ing De' tanh (1p) ~ 1 and equation (2.44) is simplified to
Rate per pellet (mol S-1) = 43tr2(<I>pSDe)1/2Ci (2.47)

Rate Phenomena 51
The diffusion-controlled reaction at this limiting case is confiried to poremouths at the outer surface of the pellet, and hence the rate per pellet isproportional to the external geometrical surface area of the pellet. Further-more, since De does not vary much with temperature, the apparent heat ofactivation for the reaction at this limiting case is about one-half of that forthe case (a) of almost complete pore diffusion.(c) With large particles, high temperatures and low velocity gas flows, therate is ultimately controlled by mass transfer in the gas-film boundarylayer, for which the rate per pellet would be proportional to the particlediameter.
2.4.2 OXIDATION OF CARBON IN CO2-CO MIXTURES
Most forms of carbon are porous, therefore the rate of oxidation, i.e. gas-ification of carbon, is decisively affected by the pore structure, internalpore surface area, effective gas diffusivity in the pores and particle size asoutlined in the previous section.
In a critical review of the oxidation of carbon, Walker et al.26 gave adetailed and a comprehensive account of (up to 1959) experimental andtheoretical studies on this subject. In the late 1960s, Turkdogan and co-workers27-29 pursued further experimental work on the oxidation of sev-eral types of carbon in CO2-CO mixtures at temperatures up to 1300°Cand at pressures of 0.01 to 10 atm. A few salient features of their findingsare briefly given here.
The effect of particle size on the rate of oxidation of high purity graphitespheres in CO2 at atmospheric pressure and temperatures 900, 1000 and1100°C is shown in Fig. 2.10. In accord with Thiele analysis, for smallerparticles the rate per pellet is proportional to the cube of particle. diameter,indicating chemical reaction control in essentially uniform internal burn-ing. With larger particle size, the rate of oxidation is controlled by limitedgas diffusion into pores, hence the rate is proportional to the square ofparticle diameter in accord with equation (2.47). Then, there is the mixedcontrol for intermediate particle sizes.
In rate measurements with many small granules, the rate is given interms of the fraction F of mass oxidised, for which the integrated forms ofthe rate equations (2.46) and (2.47) are as follows.
a. For 'ljJ<0.2complete internal burning:
In(l - F) = - <PSCi (2.48)
b. For '1'>2external burning:
(2.49)

52 Fundamentals of Steelmaking
THEORETICAL SLOPE 2: IFOR PORE DIFFUSIONCONTROL
I
THEORETICAL SLOPE 3:1FOR CHEMICAL REACTIONCONTROL
'O-07.~0-1--~--~--~--~----~~I-O--~--~--~0.1 . 10.0DIAMETER t em
Fig. 2.10 . Rate of oxidation of electrode graphite as a function of particle diameterfor 0.96 atm CO2• From Ref. 27.

Rate Phenomena 53
_6~----------------------------~('I')
o,..-X
Ie:§,§ 4.ceno'0en(J)asE:e2:::sQ;CoQ)
~a:
00
Atm. CO2
1 2Particle diameter (mm)
3
Fig. 2.11 Effect of particle size on the rate of oxidation of electrode graphite in purecarbon dioxide at lOOO°C. From Ref. 28.
In the integration of equation (2.47) to give the above equation, due ac-count is taken of the shrinking size of the spherical particle of initial radiusr0 during gasification.
As is seen from the rate data in Fig. 2.11, an increase in CO2 pressureincreases the particle size effect in lowering the extent of internal oxida-tion. In the oxidation of various types of carbon in pure CO2 at pressuresof 0.01 to 10 atm, the rate was found to be proportional to the square rootof the CO2 pressure. In the present re-assessment of these rate data, theauthor is now of the opinion that this apparent square root relationship ispurely empirical and not to be attributed to some hypothetical reactionmechanism.
On the assumption that both CO and CO2 are chemisorbed on the porewalls of the carbon and the rate of oxidation is due to the rate of dissocia-tion of chemisorbed CO2, for the limiting case of complete internal burn-ing the rate equation will be in the following form .
Rate = <P'PC02 t1+ k1pco + k2Pc02
where cP' is the rate constant (min-1atm-1C02) for a given temperatureand a particular. type of carbon; the constants kl and k2 are associated withthe chemisorption of CO and CO2, It should be noted that in compliancewith the notation in equation (1.69) for the ideal monolayer, the constantskl and kz are reciprocals of the respective activity coefficients of the ad-sorbed species, i.e. kl = 1/ 'Pco and k2 = 1/ CPeo2;the fraction of vacant sitesbeing (1 - S) = (1 -Seo - Seo2).
(2.50)
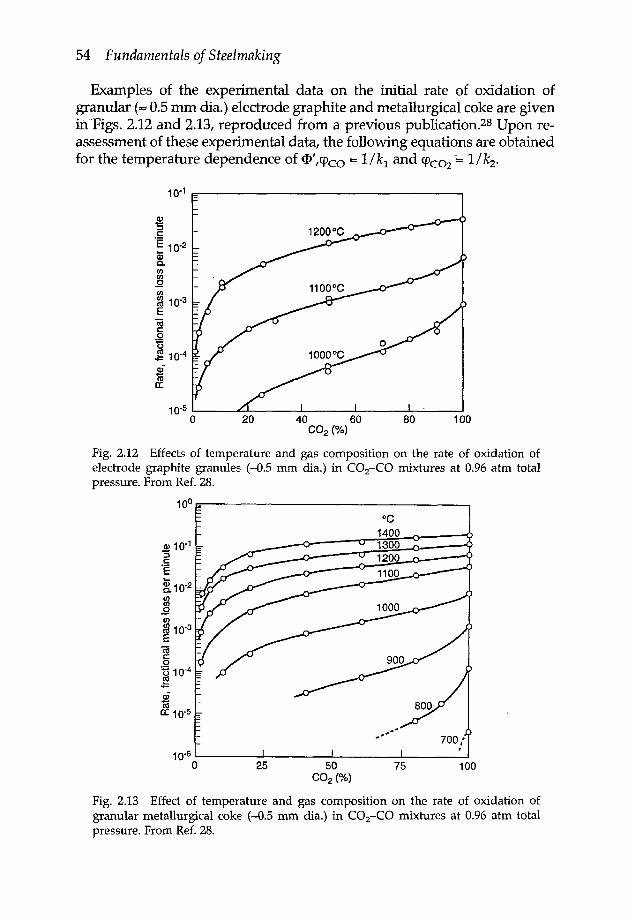
54 Fundamentals of Steelmaking
Examples of the experimental data on the initial rate of oxidation ofgranular (~0.5 mm dia.) electrode graphite and metallurgical coke are giveninFigs. 2.12 and 2.13, reproduced from a previous publication.28 Upon re-assessment of these experimental data, the following equations are obtainedfor the temperature dependence of <1>' ,CPco = 1/ kl and CPC02 ~ 1/ k2-
Q)
'St:·e 10-2CDCoenen.Qen~ 10-3E«it:oUjg 10-4
~a:
20 80 10040 60CO2 (0/0)
Fig. 2.12 Effects of temperature and gas composition on the rate of oxidation ofelectrode graphite granules (-0.5 mm dia.) in CO2-CO mixtures at 0.96 atm totalpressure. From Ref. 28.
Q) 10-1"5t:·E~ 10-2enen..Q(/)
~ 10-3Ecoc:o] 10-4
~a: 10-5
25 75 10050CO2 (0/0)
Fig. 2.13 Effect of temperature and gas composition on the rate of oxidation ofgranular metallurgical coke (-0.5 mm dia.) in CO2-CO mixtures at 0.96 atm totalpressure. From Ref. 28.

Rate Phenomena 55For electrode graphite:
log <1>' (min-Iatm-IC02) = - 16,540+ 10.75 (2.51)T
log 'Pco (atm) = - 8719 + 4.84 (2.52a)-T-
log <PC02 (atm) = -590 - 0.072 (2.52b)-T-
For metallurgical coke:
log <P' (min-1atm-1C02) = - 16,540+ 11.37 (2.53)T
log <Peo (atm) = -2117 + 0.27 (2.54a)-T-
log CPC02 (atm) = 3840-3.45 (2.54b)-T-
It should be noted that these equations fit the measured initial rates ofoxidation within a factor of about 1.5 for temperatures 800 to 1200°C andfor CO2 pressures 0.03 to 3 atm. For easy comparison of the reactivities ofelectrode graphite and metallurgical coke, the numerical values are givenbelow from the above equations for 900 and 1200°C.
Temperature °CElectrode graphite
<P' <Pea <PeozMetallurgical coke
<P' <Pea CPea2
9001200
4.5 X 10-43.3 X 10-1
0.00250.083
0.27 1.9 x 10-30.34 1.4 x 10°
0.0290.068
0.670.14
After about 3 to 5 percent of initial oxidation, the pore surface area of thecoke samples were found to be four to five times greater than the graphitesamples; this is consistent with the <p' values for coke being greater thanfor graphite by a similar factor. The extent of CO adsorption on the porewalls of electrode graphite or coke is greater than the CO2 adsorption.
There are variations in the reported values of the apparent heat ofactivation for oxidation of the electrode (or reactor grade) graphite in CO2,For example, Gulbransen et a1.30 obtained AH* = 368 k] mol-1 while accord-ing to Blackwood's work"! AH* = 260 k] mol=: in the present case AH* =
317 k] mol-I. Reference should be made also to the papers of Ergun,32Hedden and L6we,33 and by Crabke= for various other interpretations ofthe kinetics of oxidation of carbons.
Aderibigbe and Szekely= also investigated the oxidation of metallurgi-.cal coke in CO2-CO mixtures at 850 to lOOO°C. Their rate constants K1(E<P')are similar to those given by equation (2.53); their estimate of the apparentheat of activation being AH* = 249±47 kJ mol=".

56 Fundamentals of Steelmaking
10-5 ~ --'- .....i..- ---'900 1000 1100
Temperature (OC)1200
Fig.2.14 Effect of temperature on rate of oxidation of coke and graphite (1.9 and 2.2em dia. spheres, respectively) in 50:50 CO2-CO at 1 atm. From Ref. 36.
A mathematical analysis was made by Tien and Turkdogan= to formu-late the pore diffusion effect on partial internal burning of relatively largecarbon particles. The experimentally determined initial rates of oxidationof coke and graphite spheres (~ 2 cm dia.) in 1:1 CO2-CO mixture at 1 atmare compared in Fig. 2.14 with the values calculated from the mathemati-cal analysis. The results of such calculations are summarised in Fig. 2.15,showing critical particle size and temperature for the limiting rate con-trolling processes at 1 atm for 100% CO2 and 1:1 CO2-CO mixture. In eachdiagram, the lower curve is for 80 percent internal burning; therefore, inthe region below this curve there is almost complete pore diffusion. Theupper curve is for 20 percent internal burning; therefore, in the regionabove this curve, the pore diffusion control predominates.
2.4.2a ELECTRODE CONSUMPTION IN EAF STEELMAKING
The foregoing experimental data on the rate of oxidation of graphite willgive only a partial estimate of the rate of electrode consumption in theelectric arc furnace (EAF).
The net consumption is the result of various modes of wear that theelectrodes. are subjected to in the electric furnace environment. It can besubdivided into longitudinal consumption, consisting of such variables as

1400
1200
1000
~CD.a 800~ 1400Q.
E~
1200
1000
80010-2 10-1
III
IIIPore
diffusioncontrol
Rate Phenomena 57
101 10-2
Radius (em)
Fig.2.15 Critical radius and temperature for the limiting rate controlling processesat 1 atm pressure. (a) Coke, 100 per cent COZ; (b) Coke, 1:1 CO:C02; (c) Graphite, 100per cent COZ; (d) Graphite, 1:1 CO:C02, From Ref. 36.
arc vaporisation, butt losses, mechanical erosion due to interaction withthe steel bath etc., and transverse consumption due to oxidation of thetapered sidewall of the electrode. It is generally believed that a taperwhich results in a tip diameter of about 70percent of the original electrodediameter will produce low consumption rates. The net consumption isabout 70 to 90 percent of the total consumption, the remaining 10 to 30percent consumption being due to breakage.
Reference may be made to a paper by Jung et a1.36a for a detailed dis-course on electrode wear in the EAF steelmaking. .
2.4.3 REDUCTION OF IRON OXIDES
In view of its practical importance to the understanding and control ofironmaking processes, a great deal of research has been done on the gas-eous reduction of iron oxides and iron ores. Because of the porous natureof iron oxides and the reduction products, the interpretation of the reduc-tion rate data is inherently complex.
The formation of product layers during the gaseous reduction of densesintered haematite and magnetite pellets or natural dense iron ore parti-cles is a well-known phenomenon, as shown in Fig. 2.16. In several studies

58 Fundamentals of Steelmaking
Iron
Wustite
Magnetite
Haematite
Fig.2.16 Formation of reaction product layers in the gaseous reduction ofhaematitepellets.
made in the early 1960s37-39 it was found that the, thickness of the reducediron layer, encasing the iron oxide core of the pellet, increased linearlywith the reduction time. The measured rates were interpreted in terms ofthe rate-conrolling chemical reaction at the iron wustite interface; the di-ffusive fluxes of gases through the porous layers were assumed to berelatively fast. On the other hand, Warnerw and Spitzer et al.41 have ex-pressed the view that the rate of gaseous reduction is much affected by thegaseous diffusional processes, e.g. the gas-film resistance at the pelletsurface and particularly the resistance to diffusion in the porous productlayers. The rate measurements made by Turkdogan and Vinters=- on the'

Rate Phenomena 59
reduction of haematite pellets in H2-H20 and CO-C02 mixtures haveclearly demonstrated that the rate-controlling effects of gas diffusion intothe pores of the oxide granules or pellets and through the porous ironlayer dominate the reaction kinetics.
The sketch in Fig. 2.17 demonstrates three limiting rate controlling pro-cesses as outlined below.(a) With fine granules there is internal reduction producing rosettes or plate-lets of metallic iron within the oxide particle; the rate in terms of mass fractionreduced, F, is independent of particle size.(b)With large and dense oxide particles and at high temperatures, the gas dif-fusion is slow and the reaction is confined essentially to pore mouths on theouter surface of the particle, bringing about the development of a porous ironlayer around the pellet. Because of the layer formation, this mode of reduc-tion is often called 'topochemical reduction.' In the early stages of reduction,the porous iron layer is sufficiently thin for rapid gas diffusion, therefore theinitial rate of reduction is controlled jointly by (i) gas diffusion into the poremouths of the oxide and (ii) reaction on the pore walls of the wustite. That is,with Thiele parameter tp>2, the initial rate of reduction is represented by thefollowing proportionality for a given temperature and gas composition
elf ViPSDe- exdt r (2.55)
(c) When the porous iron layer becomes sufficiently thick, the rate ofreduction will be controlled essentially by the counter current gas diffu-
(c)
Fig. 2.17 Schematic representation of (a) uniform internal reduction of wustite toiron, and (b), (c) topochemical reduction; (b) limiting mixed control (partial internalreduction) and (c) diffusion in porous iron as the rate-controlling step.

60 Fundamentals of Steelmaking
sion (H2-H20 or CO-C02) for which the limiting rate equation, for a giventemperature is as follows.
[3 - 2F - 3 (1 - F)2/3] = Y = ~~ ( Pi -R~i)eq ) _ t + C (2.56)
where Pi is the H2 or CO partial pressure in the gas stream and (Pi)eq thatfor the iron-wustite equilibrium and C a constant (a negative number) thattakes account of all early time departures from the assumed boundaryconditions for this limiting case.(d) At high reduction temperatures, with large oxide pellets and low ve-locity gas flows, the rate of reduction is controlled primarily by masstransfer in the gas-film layer at the pellet surface. In this limiting case therate is inversely proportional to the square of the particle diameter.
The experimental data are given in Fig. 2.18 showing the particle sizeeffect on the initial rate of reduction of haematite granules or pellets in
LLJJ-;::)z:Ea:UJa...eneno....JZLLJ(!)>-Xo....J<ZS2t-(,.)
<.e: 0.1 I------------t---~----'~-"'Id
LIMITINGSLOPE - I
0.01 0.1RADIUS t em
Fig. 2.18 . Initial rate in hydrogen at 0.96 atm. as a function of particle radius atindicated temperatures. From Ref. 42.

Rate Phenomena 61
atmospheric pressure of hydrogen. It is seen that for pellets of radius morethan 1 mm, the reduction is confined to the outer surface in accord withthe equation (2.55).
For uniform internal reduction, the particle diameter should be less than0.1 mm. The effect of particle size on the rate of reduction of haematitegranules, d In (1- F)/dt, is shown in Fig. 2.19. Small extrapolation to thehypothetical zero particle size gives the rate for uniform internal reduction
(2.57)
Ie·e~.•.•.•.•-u,..!...- 10°.:"0
Ol-e;0::
101
------0---100
Average granule size (mm)
Fig.2.19 Effect of granule size on the rate of internal reduction of haematite ore inH2 and 90% CO + 10% CO2 mixture. From Ref. 42.

62 Fundamentals of Steelmaking
As discussed in section 2.4.4, the pore surface areas of reduced ironoxides have been measured. These S values in conjunction with the ap-parent rate constants <I>S give the specific rate constants for gaseousreduction of wustite. The temperature dependence of the specific rateconstants cp(H2) and cI>(CO), derived from the reduction-data, are givenbelow.
6516log cI>(H2) = - --r - 1.31
7634log <P(CO) = - --r - 1.80
(2.58)
(2.59)
The ratio of the rate constants <I>(H2) / cIl(CO) is about 20 at 1200°C andincreases to 50 at 700°C.
When the thickness of the reduced porous iron layer exceeds 1 mm,the subsequent rate of reduction is controlled primarily by gas diffu-sion through the porous iron layer. The reduction data plotted in accordwith equation (2.56) usually give elongated S-shaped curves as in Fig.2.20 for 15 mm diameter spheroidal haematite ore reduced in H2 at 1atm. From about 50% to 95% or 99% reduction, data are well repres-ented by straight lines. The effective H2-H20 diffusivities in the poresof the iron layer are derived from the slopes of the lines; details aregiven in the next section.
0.2
100
98
IJ...!.-roIIJ..
C\JI
ro
95 c:.~'0
90 -6~
~o
3010 20Time (min)
Fig. 2.20 .Diffusion plot of reduction data for 15 mm diameter spheroidal haematiteore. From Ref. 42.

Rate Phenomena 63
2.4.4 EFFECT OF REACTION TEMPERATURE ON PORE STRUCTURE OF·REACTEDMATERIAL
(a) Reduced iron oxide:The reaction temperature has a pronounced effect on the pore structure ofthe reaction product as in calcination and reduction. This is well demon-strated by the SEMmicrographs in Fig. 2.21.
The top left micrograph shows the fracture surface of dense haernatiteare which consists of agglomerates of spheroidal ore grains 2 - 5 urndiameter. The other micrographs show the fracture surfaces of the re-duced porous iron. The higher the reduction temperature, the coarser thepore structure.
The effect of reaction temperature on the pore surface area of iron andwustite formed by the reduction of haematite is shown in Fig. 2.22. Thehigher the reduction temperature, the smaller the internal pore surfacearea, i.e. the coarser the pore structure. The iron oxides reduced at tem-peratures below 800°C are known to be pyrophoric, which is a conse-quence of a fine pore structure with a large pore surface area as notedfrom the data in Fig. 2.22.
The pore surface area of the iron formed by gaseous reduction dependson the initial pore surface area of the iron oxide. This is demonstrated inFig. 2.23; for a given type of iron oxide, the pore surface area of ironformed upon reduction increases with increasing initial pore surface areaof the oxide. However, there is a considerable overlap. For example, asintered oxide pellet with 5 = 0.1 m2g-1 and a haematite ore with S = 10m2g-1,when reduced, both give porous iron with S ~ 1m2g-1.That is thepore surface area of the reduction or calcination product can be larger orsmaller than the pore surface area of the unreacted material. It is for thesereasons that care should be taken in comparing the rates of gaseous reduc-tion of different types of metal oxides.
It is seen from the data in Fig. 2.24 that the effective diffusivities for H2-H20 measured directly or calculated from the pore structure consider-ations.P agree well with those derived from the rate"measurements withinthe regime of pore-diffusion control, i.e. from the slopes of the lines in Fig.2.20. The temperature has a small effect on gas diffusivities. A markedeffect of temperature on the effective diffusivity seen in Fig. 2.24 is duemainly to the coarseness of the pore structure of iron when the oxide isreduced at higher temperatures.
(b) Calcined liinestone:The effects of time and temperature on the pore surface area of burnt limeare shown in Fig. 2.25; the initial pore surface area of the limestone used Inthe calcination experiments was 0.07 m2g-1. The soft burnt lime, i.e. lowcalcination temperature, being more reactive than the hard burnt lime, i.e.
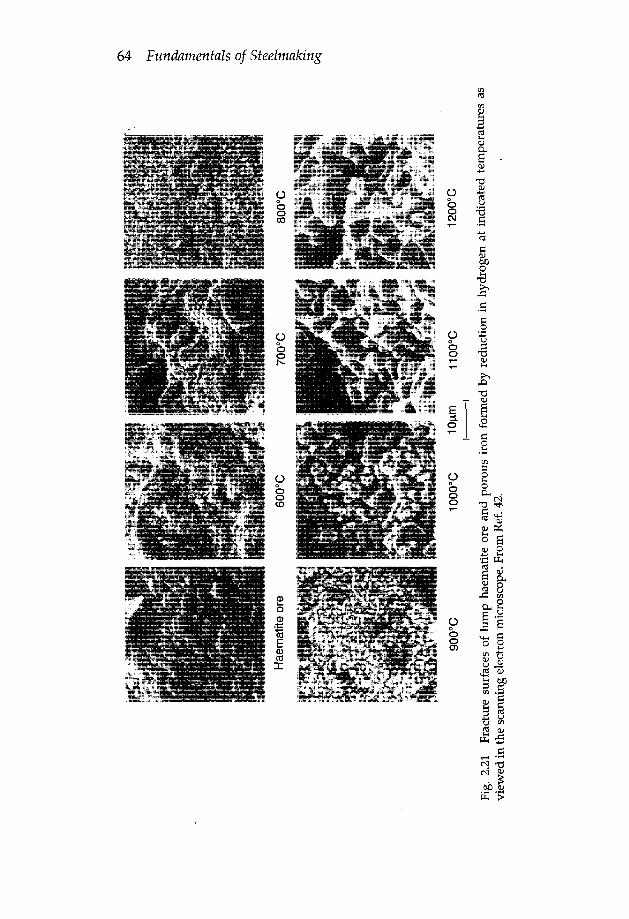
64 Fundamentals of Steelmaking

Rate Phenomena 65
100
.~•..(/)~~•..0c:: 1.00•..
••enN
E
en
0.1
Reduction temperature (OC)
Fig. 2.22 Connected internal pore surface area of iron and wustite formed by reduc-tion of haematite ores A and B; (a) ore A reduced to iron in H2 (0); (b) ore B reducedto iron in H2 ('\7) and reduced to wustite in an H2-H20 mixture (~); (c) ore Breducedto iron in a CO-C02 mixture (0) and reduced to wustite in another CO-C02 mixture(0). From Ref. 42.
10
Specularhaematiteore
SinteredV haematite
pellets
\Poroushaematiteores ~
0.01 0.1S (m2g-1 haematite)
Fig. 2.23 Relations between the internal pore surface area of H2 - reduced iron atBOOoe and the pore surface area of the corresponding haematite ores or sinteredpellets. From Ref. 42.

66 Fundamentals of Steelmaking
4-----------------------------------A Direct measurements
o Calculated from pore structure
o Derived from reduction data
Reduction temperature (OC)
o~------~--------~------~------~400 600 800 1000 1200
Fig. 2.24 H2-H20 effective diffusivity derived from data for rate of reduction ofhaematite to iron is compared with that obtained by direct measurements and calcu-lated from pore structure. From Ref. 43.
8
oQ)t-
o
~ 4c'to-
'-:::JenQ)t-oCo
en
500hr 60QoC0----
80 120
Time (hr)
o~~~----~~------~--------~--------~--------~------~o \60 200 240
Fig. 2.25 Effect of heat-treatment time and temperature on the pore surface area ofburnt lime. ·From Ref. 20.

Rate Phenomena 67
Table 2.1 Measured CO-C02 effective diffusivities for electrode graphite ..
Temperature -c % oxidised De (CO-C02) cm2s-1
500 0 0.006500 3.8 0.016500 7.8 0.020500 14.6 0.045700 0 0.009700 3.8 0.023700 7.8 0.029700 14.6 0.067800 0 0.012900 0 0.014
high calcination temperature, is self-evident from the time and tempera-ture effect on the pore surface area.(c) Partially gasified carbon:In the case of oxidation of carbons, the pore surface area increases during theearly stages of gasification then remains essentially unchanged. For example,the pore surface area of electrode graphite with initial S = 1m2g-1 increases toabout 2.5 rn2g-1 after 10% gasification with only a small increase duringfurther gasification. For the metallurgical coke with initialS = 4 m2g-1, thearea increases to about 20 m2g-1 after 10% gasification then remains essen-tially unchanged during the subsequent stages of gasification.s?
In the case of internal burning of carbon, the pore structure becomescoarser as the gasification progresses, resulting in an increase in the effec-tive gas diffusivity. A few examples of the measured CO-C02 effectivediffusivities for electrode graphite are given in Table 2.1, reproduced fromRef. 29.
2.5 VAPORISATION IN REACTIVE GASES
There are two types of mechanisms of enhanced vaporisation in reactivegases: (i) a chemical process involving the formation of volatile species,e.g. oxides, sulphides, halides, carbonyls and hydroxides, and (ii) a trans-port process in which the vapour reacts with the gas diffusing toward thevaporising surface.
The concept of diffusion-limited enhanced vaporisation, introduced byTurkdogan et al.44 is illustrated schematically in Fig. 2.26, using as anexample the vaporisation of liquid iron in a stream of an oxygen-inert gasmixture ..In this counter-current transport process, at some short distancefrom the surface of the metal, the gaseous oxygen and metal vapour reactto form a metal oxide mist.
2M(g) + 02(g) --+ 2MO(s,l) (2.60)

68 Fundamentals of SteelmakingFe t O2
h':'
~~~~FeO'.::::: fog
~~%~
..,.,"~I-~---~ Max rate
in vacuot
Vaporisationcut-off
Noo"0
Cct1{Eo
o 0 , I:lDistance x ~
t(J)U.
J
o o~ 0 P02~Fig. 2.26 Schematic representation of vaporisation of metals (iron as an example) inoxygen-bearing gas mixture flowing over the surface. From Ref. 44.
The formation of an oxide in the gas phase provides a sink for the metalvapour and oxygen resulting in a counterflux of these two gaseous spe-cies. Increasing the oxygen partial pressure in the gas mixture decreasesthe distance 6 through which the metal vapour is diffusing, hence the rateof vaporisation increases. On further increasing the oxygen partial press-ure, the flux of oxygen towards the surface of the metal eventually be-comes greater than the equivalent counter-flux of the metal vapour. Thisresults in the oxidation of the metal surface and cessation of vaporisationbecause the vapour pressure of the metal oxide is much lower than thevapour pressure of the metal. Just before this cutoff, the rate of vaporisa-tion will be close to the maximum rate for free vaporisation in vacuo. Thismechanism of enhanced vaporisation in an oxidising gas is the primarycause of the formation of metal oxide fumes in all pyrometallurgical pro-cesses. With the elimination of oxygen in air by burning natural gas andinjecting steam in the vicinity of an exposed liquid steel (or hot metal)stream, the fume emission is drastically curtailed. In fact, it was. on thebasis of these findings that the fume suppression techniques have beenimplemented for many years in the U.S. Steel plants.
As is seen from some examples of the laboratory experimental results(Fig. 2.27) the rates of vaporisation of iron and copper increase with in-creasing partial pressure of oxygen until a maximum rate is obtained,beyond which vaporisation ceases. The results with various metalssummarised in Fig. 2.28 show that the measured maximum rates of

Rate Phenomena 69
.c~ 1.5o
~~ 1.0en·co0.ctS> 0.5cg
40 60 80 100P02 (mm Hg)
-.c~ 0.12EoS"0
.~ 0.08o0.«J>Q;§: 0.04oo
Fig. 2.27 Rates of vaporisation of copper at 1200°C and iron at 1600°C in argon-oxygen mixtures at 1atm pressure as affected by gas velocity parallel to surface andpartial pressure of oxygen. Gas velocity: (0) 40, (8) 60, and (A) 80 cm sec-I. FromRef. 44.
vaporisation agree well with those calculated for free vaporisation usingequation (2.14). A quantitative analysis of these observations in terms ofmass transfer is given in the paper cited.44 .
White fumes emitted from the blast furnace runner exposed to air, isanother example of vaporisation-induced occurrence. The X-ray scanspectra of fume samples have revealed that the potassium and sulphurwere the most dominant elements in the white fume samples. This findingcan be accounted for by the following reaction mechanism.
The blast furnace slag contains 1.5 to 2.0% S and about 0.5%K20. Uponexposure to air, the potassium and sulphur will be evolved from the slagsurface as potassium sulphate by the reaction
(2.61)
In addition, there is 502 evolution from the uncovered slag runner

70 Fundamentals of Steelmaking
1 0-3 E----L- •••••••••••••••'-I....L...L.LL..I._-'--"---L.~L..J..J.I-_.I...._I__'_.L...J.._L..L.l.J10-3 10-2 10-1
_P_ (g atom cm-2 h-1)...j 21tRTM
Fig. 2.28 Experimentally observed maximum rate of vaporisation of metals inargon-oxygen mixtures compared with rate of free vaporisation in' vacuo. From Ref.44.
(2.62)
In the oxidising atmosphere over the slag, exposed to air, the 502 is partlyoxidised to 503' In the cooler ambient atmosphere away from the slagsurface, 503 and K2S04 will react with moisture in the air to form acomplex sulphate K2504.H2S04 which appears as a white fume. The X-rayscan spectra indicated an atom concentration ratio K/S of about one, inaccord with the described reaction mechanism.
2.6 KINETICS OF GAS BUBBLES IN OXYGEN STEELMAKING
2.6.1 BUBBLE NUCLEATION AND GROWTH
The theory of homogeneous nucleation predicts a supersaturation ofabout 104 atm for nucleation of gas bubbles in liquid metals with.surfacetension in the range 1-1.6 Nm-1. On the other hand, the bubble nucleationat gas-filled crevices on the container wall, or at the surface of solid inclu-sions in the liquid metal, occur with very small supersaturation.
As an example, let us consider the growth of CO bubbles in liquid steelfor which the criterion is 20
Pea> Po + r (2.63)

Rate Phenomena 71
where Pco is the pressure of CO in equilibrium with the concentrations ofC and 0 in steel, Po the static pressure over the bubble and r is the bubbleradius. For the bubble to grow at the mouth of a cylindrical crevice, theradius of the crevice must be greater than the critical minimum rmin
20(2.64)r.;;» p p
CO- 0
There is a maximum crevice radius above which the crevice cannot sustainthe residual gas pocket, which is needed for bubble growth,
20rmax < - p cos e
o(2.65)
where e is the contact angle between the melt and the refractory surface;usually e > 90°.
2.6.2 GAS HOLDUP IN STEEL BATH
In most practical applications of gas injection into liquids, we are con-cerned mainly with rates of reactions in the swarm of bubbles. Mass-transfer phenomena in the swarm of bubbles have been studied exten-sively with aqueous solutions; accumulated knowledge is well docu-mented in a review paper by Calderbank.s" Also, several studies havebeen made of the bubble size and velocity of rise of single bubbles inliquid metals. Szekely presented a comprehensive review of these studiesin his book on Fluid Flow Phenomena in Metals Proceseing.v:
An attempt is made here to estimate the size range of dispersed gasbubbles in liquid steel for the conditions prevailing in BOF and Q-BOPsteelmaking. The bubbles are assumed to be generated from a multitude ofpoints across the bottom of the vessel, as though the entire vessel bottomwere in fact one big porous plug.
The volume fraction of gas holdup (e) is given by the following ratio:
E = Vb = 1 _ Vs . (2.66)Vb + Vs HA
where Vb = transitory bubble volume in the bath at any time,Vs = steel volume in the vessel,H = average bath depth,A = average bath cross sectional area.
The velocity of bubble rise, Ubf in a swarm of bubbles is given by the ratio11
= EA (2.§7)
where Us = superficial gas velocity,11 = gas flow rate.

72 Fundamentals of Steelmaking
Yoshida and Akita+?have measured the volume fraction of gas holdupin non-foaming aqueous solutions with Us in the range 0.03 to 0.6 m S-1. Inthese experiments, the gas was injected through a single nozzle on thebottom of the liquid column contained in a cylindrical vessel. From theirexperimental results for the air-water system, the following equation isobtained.
log (1 - E) = - O.14610g(1 + Us) + 0.06 (2.68)
In the studies of Calderbank and co-workers= with the air-water sys-tem, the gas was injected into the column of water through a sieve plate onthe bottom of the column. The fractional holdup of gas was reported asshown in Fig. 2.29. The units in F factor are:
Us, m S-1 and Pg (the gas density), kg m-3.
TIle experimental results of Crozierv', not shown in Fig. 2.29, for F>O.3arein good agreement with those reported by Calderbank. The dotted curveis calculated from equation (2.68),and plotted in Fig. 2.29in terms of the Ffactor with Pg (air at 25°C and 1 atm) = 1.185 kg m-3. In the presentassessment of gas holdup in the steel bath, the preference is given to thedata reported by Calderbank. The dot-dash curve is taken to represent theaverage values. It appears that at F ~ 1, the gas holdup reaches an essen-tially constant value of E = 0.6.
In the estimation of.fractional gas holdup in the steel bath, during decar-burisation or argon stirring, the gas flow rates taken are for the melt
1.0 ...-----------------------,
0.80.::l
"'C
(5..c:en~ 0.6c:o
~-; 0.4E::J~W
0.2
---- CaJderbank45--_.- Average------------- Yoshida and Akita47
--_.-_._ •.........•. _--_ __ .......• -
/' .
.',.# ,I,,"~
,~"o~--~--~--~-~-~---~--~---~---~~o 0.1 0.2 0.3 0.4 0.5 0.6 0.7 0.8 0.9 1.0F = Us ~ (m S·1) (kg m-3)1/2
Fig. 2.29 Experimental data of Calderbank= on gas holdup in sieve plate columnsfor the air-water system are compared with those of Yoshida and Akita-".
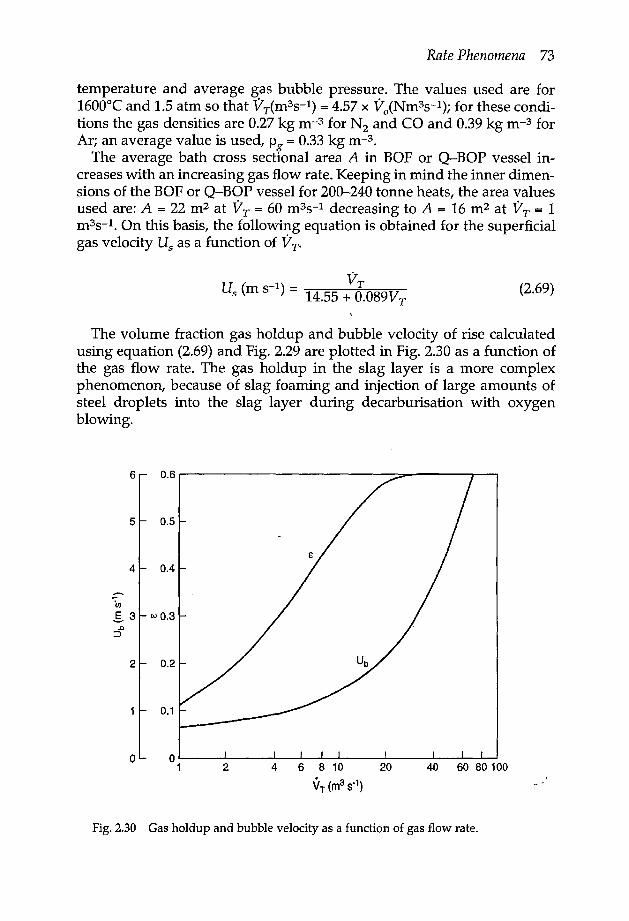
Rate Phenomena 73
temperature and average gas bubble pressure. The values used are for1600°C and 1.5 atm so that VT(m3s-1) = 4.57 x Vo(Nm3s-1); for these condi-tions the gas densities are 0.27 kg m-3 for N2 and CO and 0.39 kg m-3 forAr; an average value is used, Pg = 0.33 kg m-3.
The average bath cross sectional area A in BOF or Q-BOP vessel in-creases with an increasing gas flow rate. Keeping in mind the inner dimen-sions of the BOF or Q-BOP vessel for 200-240 tonne heats, the area valuesused are: A = 22 m2 at 11T = 60 m3s-1 decreasing to A = 16 m2 at 11T = 1m3s-1. On this basis, the following equation is obtained for the superficialgas velocity Us as a function of VT.
U ( -1) - 1fTs m s - 14.55 + 0.089V T
(2.69)
The volume fraction gas holdup and bubble velocity of rise calculatedusing equation (2.69) and Fig. 2.29 are plotted in Fig. 2.30 as a function ofthe gas flow rate. The gas holdup in the slag layer is a more complexphenomenon, because of slag foaming and injection of large amounts ofsteel droplets into the slag layer during decarburisation with oxygenblowing.
6 0.6
5 0.5
4 0.4
'u>§,3 wO.3.c
:::>
2 0.2
0.1
0 01 2 4 6 8 10 20 40 60 80 100
VT (m3 s') J
Fig. 2.30 Gas holdup and bubble velocity as a function of gas flow rate.

74 Fundamentals of Steelmaking
2.6.3 ESTIMATION OF BUBBLE SIZE FOR UNIFORMLY DISPERSED BUBBLES IN THESTEEL BATH
Many estimates were made in the past of gas bubble diameters in steel-making processes; the estimates varying over a wide range from 1 to 8 cmormore.*
Calderbank and co-workers= and Leibson et a1.49 have found that inaqueous solutions the bubble size becomes smaller with an increasing gasflow rate, ultimately reaching a minimum size of about 0.45 cm diameter atlarge gas flow rates. Relatively large gas bubbles in motion are subject todeformation and ultimately to fragmentation into smaller bubbles. The dragforce exerted by the liquid on a moving bubble induces rotational andprobably a turbulent motion of the gas within the bubble. This motioncreates a dynamic pressure on the bubble surface; when this force exceedsthe surface tension, bubble breakup occurs. Because of the large differencebetween the densities of the gas and liquid, the energy associated with thedrag force is much greater than the kinetic energy of the gas bubble. There-fore, the gas velocity in the bubble will be similar to the bubble velocity. Onthe basis of this theoretical reasoning, Levich''? derived the following equa-tion for the critical bubble size as a function of bubble velocity.
3 1/3 20d =(C 2) 1T1.
C d Pg PI Ub(2.70)
where 0 is the surface tension and Cd the drag coefficient, which is close tounity. As the bubble size decreases with increasing bubble velocity, the gascirculation within the bubble diminishes, thus becoming less effective in bub-ble fragmentation. Another view to be considered is that, as the gas holdupincreases with increasing gas flow rate, the liquid layer separating the bub-bles becomes thinner. Consequently, the dynamic gas pressure exerted on thebubble surface becomes nullified by similar forces exerted in the neighbour-ing bubbles, hence the cessation of bubble fragmentation at high values of E.
The bubble fragmentation with increasing e, hence increasing Ub, iscalculated for bubbles in water with a = 0.072 Nm-1 and in liquid steelwith (a) a = 1.7 Nm-1 in the presence of 0 < 4 ppm and 40 ppm 5, and (b) a= 1.3 Nm-1 in the presence of 600 ppm 0 and 120 ppm S. The results areshown in Fig. 2.31. As noted earlier, the limiting bubble size in air-watersystem is d = 0.45 em which intersects the fragmentation curve at E = 0.41,depicting the cessation of bubble fragmentation.
In an attempt to estimate the minimum bubble size in the swarm ofbubbles in liquid steel, the author proposes the following hypothesis: 'the
"The bubbles with diameters > 1 em acquire spherical cap shape as they rise in liquids. Theapparent bubble. diameter is that of a sphere which has a volume equivalent to that of the spherical capshape bubble.

Rate Phenomena 75
---- Equation (2.70)
••.. - •• _._ ••• Uniform limitingbubble diameter
Water
o~----------~------------~----------~o 0.2 0.4 0.6
Fig. 2.31 Calculated bubble diameter for bubble fragmentation mechanism equa-tion (2.70), compared with uniform limiting diameter at high E values for water andliquid steel: (a) for 0 < 4 ppm and 40 ppm S (b) for 600 ppm 0 and 120 ppm S.
surface energy of bubbles per unit mass of liquid which the bubbles dis-place, are equal for all liquids.'* This conjectured statement leads to thefollowing similarity relation for non-foaming inviscid liquids.
(2.71)
With 01 = 0.072 Jm-2 and d1 = 0.45 cm for gas-water system and 02 = 1.3Jm-2 and P2 = 6940 kg m-3, we obtain d2 = 1.16 cm for the limiting bubblediameter in liquid steel containing = 600 ppm 0 and = 120 ppm S. For themelt containing 0 < 4 ppm and 40 ppm S, d2 = 1.52 ern. These limitingvalues intersect the fragmentation curves for liquid steel at about E = 0.40,similar to that for water.
A uniform constant bubble size and essentially constant e = 0.6 at highgas flow-rates, means a constant number of bubbles per unit volume of theemulsion. Noting that for the close-packed (fcc) arrangement of bubbles,the packing fraction (gas holdup) is e = 0.74, the thickness ~ of the liquidfilm at the nearest approach of the bubbles is derived from the followingequality of the bubble number.
0.6 0.74= (d + '6/2)3 (2.72)
Noting that for water the experimental data give d = 0.45 cm and thatestimated for liquid steel d = 1.16 cm, equation (2.72)gives ~ = 0.65 mm for
"Surface energy Eb of dispersed bubbles of uniform size per unit mass of liquid which they displacedis given by
J kg-I liquid

76 Fundamentals of Steelmaking
bubbles in aqueous solutions and 6 == 1.68 mm for bubbles in liquid steel atthe limiting value of E = 0.6 for non-foaming inviscid liquids.
2.6.4 RATE EQUATION FOR TRANSPORT CONTROLLED GAS BUBBLE REACTIONSIN LIQUID STEEL
For mass-transfer controlled reactions of gas bubbles in liquid steel, therate equation has the following form.
In :;-~~ =-50kmto 0 - 0 e
(2.73)
where Xo and Xe are the initial and gas-metal equilibrium concentrationsof the diffusing reactant in the melt, km the mass-transfer coefficient and Sothe bubble surface area which is in terms of E, *
So = 6; r m2/m3 gas-melt emulsion (2.74)
From many studies of gas bubble reactions in nonfoaming aqueoussolutions, the following formulation has been derived for the liquid-phasemass-transfer coefficient for the regime of surface-renewal at the gas-liquid interface.s=
DU 1/2i.; = 1.28 (--T) (2.75)
where D is the diffusivity of the reactant in the liquid-film boundary layer.In the presence of surface active solutes such as oxygen and sulphur in
liquid steel, the bubble surface will be less mobile hence the rate constantkm will be somewhat less than that given by equation (2.75) for the mobilesurface, which is a necessary condition for surface-renewal. On the otherhand, the surface active solutes decrease the bubble diameter, hence in-crease the bubble surface area for a given gas holdup. It appears that theproduct Sokm may not be too sensitive to the presence of surface activesolutes in the liquid.
The rate constant Sokm for the transport controlled reaction is obtainedfrom the combination of equations (2.67), (2.74) and (2.75), as givenbelowfor an average solute diffusivity D = 5 x 10⁻⁹ m2s-1•
(2.76)
"Bubble surface area with respect to unit mass of liquid is
s; = l~ E (-k) I m2/kg liquid

Rate Phenomena 77
The rate constant thus calculated is plotted in Fig. 2.32 against the gas flowrate 11T at 1600°C and for an average gas pressure of 1.5 atm in the steelbath for 220 ± 20 tonne heats.
2.6.5 AN EXAMPLE OF CALCULATED RATE OF NITROGEN REMOVAL
In Q-BOP steelmaking, the melt sometimes is purged (before tapping)with argon or an argon + oxygen mixture for 1 to 2 minutes at the rate of 2Nm3min-1t-1, usually for some hydrogen removal. In this example, weshall consider nitrogen removal controlled by two different mechanisms:(i) mass-transfer controlled and (ii) chemical reaction controlled.
Converting the gas flow rate to that in the melt at 1600°C and 1.5 atmpressure, for a 220 t heat, 11T = 34 m3s-1 for which the rate constant Sokm =0.48 s -1 from Fig. 2.32. If the steel initially contains 30 ppm No and the gas-metal equilibrium value N, is negligibly small, in 10 seconds of purging,the residual content will be 0.25 ppm N. It is all too clear from this examplethat, according to the present assessment of the rate phenomena, the trans-port of reactants to and from the gas bubbles in liquid steel are very fast atrelatively high gas flow rates. It appears that the reaction rates would becontrolled primarily either by an interfacial chemical reaction or by satura-tion of the gas bubbles with the reactant, or depletion thereof.
0.1
~E~°en
0.01
0.0011 4 10 40 100Vr m3 5-1 at 1600°C and 1.Satm. - -!,:
Fig.2.32 Calculated rate constant for mass-transfer controlled reaction of gas bub-bles in 220 ± 20 tonne steel bath in the BOF or Q-BOP vessel.
78 Fundamentals of Steelmaking
Now let us consider the chemical-reaction controlled rate of denitrogena-tion. From equation (2.25) in section 2.1.1a, the rate for 1600°C <Pr = 0.233 gN cm-2s-1%N-I. For liquid steel containing 600 ppm 0 and 120 ppm 5, (I-S) = 0.055 from equation (2.21). For the gas flow rate VT = 34 m3s-1, E = 0.6and the bubble surface area is Sm = 1.11 cm2g-I liquid steel. Inserting thesenumbers in equation (2.22) for the limiting case of %Ne ~ 0, gives
1 1%N - %No = 100 x 1.11 x 0.233 x 0.055t = 1.42t
In 60 seconds time of purging, 0.0030% No will be reduced only to 0.0024%N. In actual fact, the argon bubbles traversing the melt will contain someN:z; for example, if the nitrogen partial pressure in gas bubbles were 0.001atm N2, the equilibrium content in the melt would be 0.0015% N;There-fore, with %Ne > 0, the nitrogen removal will be much less than thatcalculated above for the chemical-reaction controlled rate for the hypo-the tical limiting case of %Ne = O.
The foregoing prediction from the rate equation is in complete accordwith the practical experience that even at high rates of argon purging ofthe melt, as in Q-BOP, there is no perceptible nitrogen removal because ofthe presence of surface active solutes, oxygen and sulphur, in the steelbath.
2.7 MAXIMUM RATE OF DEGASSING OF LIQUID STEEL WITH ARGON
PURGING
If the rates of diffusional processes and chemical reactions are sufficientlyfast, the argon bubbles traversing the melt will be saturated with N2 or H2to the corresponding equilibrium values for the concentrations present inthe melt. It is for this limiting case that the following rate equation isapplicable.
Denoting Nand H by X, and using molar contents in the gas bubbles,
ilx = d P~;nx 1~6 X 10⁶ gmol X2/min tonne
ilAr = 22.41:x 10-3 gmol Ar/min tonne
where M is the molecular mass of X2 and V the argon blowing rate in Nm3
min-lt-I. In the X2-saturated argon bubbles for izAr » 1iX2
izX2 P _ d ppmX 22.414 x 10⁻³ pizAr - dt MV
where P is the average bubble pressure in the melt.

Rate Phenomena 79
Since the gas bubbles are in equilibrium with the melt
P_ [ppmX]2_
X2 - K2 -dpprnX
dt22.414 X 10-3 P
MV (2.77)
where K is the equilibrium constant. The integration of the above rateequation gives with Xo being the initial concentration,
1 1 MV= _ t22.414 X 10-3K2P
(2.78)pprnX
For the average liquid steel temperature of 1650°C at turn down, thevalues of the equilibrium constants are as given below.
For N2: K = 459} · h ·For H2: K = 27.2 WIt PX2 In atm
For an average gas bubble pressure of P = 1.5 atm in the melt, thefollowing rate equations are obtained.
1 _ 1 N = 0.00395 VtppmN ppm 0
11·H - H = 0.0804 Vtppm ppm 0
(2.79)
(2.80)
As shown in the previous section, the nitrogen removal by argon purg-ing even at high rates is not possible because of the low rate of chemicalreaction at the melt-bubble surface in steels containing relatively largeconcentrations of oxygen and sulphur at tap. If the reaction kinetics arefavourable, some hydrogen removal may be achieved at very high argonflow rates as in Q-BOP. For example, purging with argon at the rate of 2Nm3 min-1 t-1 steel for 2 minutes, at the maximum rate of degassing, theinitial 7 ppm H would be reduced to 2 ppm.
From the observations made at the Gary Q-BOP Shop of U.S. Steel, itwas noted that there was very little hydrogen removal with argon purgingas given in the above example. However, with an argon + oxygen mixture,there was about 3 to 4 ppm H removal in 2 minutes purging at the rate of 2Nm3min-1t-1, which is about 75% of the maximum possible rate. Theseobservations indicate that with Ar + O2 purging, the rate of the reaction
12[H] + 2: 02(g) --+ H20(g)
is considerablyfaster than the rates of either of the following reactionswith argon alone.
2[H] ~ H2(g)
2[H] + [0] ---:.H20(g)

80 Fundamentals of Steelmaking
2.8 COMPUTER-BASED PACKAGES
There are numerous computer software packages, as for examplePHOENICS, FLUENT, CFDS-FLOWS3D, GENMIX, TEACH(2D, 3D), 2E/FIX, SOLA/VOF, METADEX(R) and FID, which are used in the steelindustry in the process and design engineering of plant facilities and in thecontrol of steelmaking processes. References may also be made to thepublications by Szekely et al.Sl-53 on the mathematical and physical mod-elling of metallurgical processes involving fluid flow, heat transfer, masstransfer and gas-slag-metal reactions.
There are of course many other publications on this subject which can-not all be cited here as the subject matter is well outside the scope of thisbook.
REFERENCES
1. J. SZEKELY and N.J. THEMELIS,Rate phenomena in process metallurgy, Wiley,New York, 1971.
2. G.H. GEIGER and D.R. POIRIER, Transport phenomena in meiallurgv, Addison-Wesley, Reading, Massachusetts, 1973.
3. S. GLASSTONE, K.J. LAIDLER and H. EYRING, The theory of rate processes,McGraw-Hill, New York, 1941.
4. C.N. HINSHELWOOD,Kinetics of chemical change, Oxford University Press, Lon-don, 1942.
5. T. Fuwx, S. BAN-YAand T. SHINOHARA,Tetsu-to-Hagane, 1967, 53, 5328.6. M. INOUYEand T. CHOH, Trans. Iron Steel Inst. Japan, 1968, 8, 134.7. K. MORI and K. SUZUKI,Trans. Iron Steel Inst. Japan. 1970, 10, 232.8. R.J. FRUEHANand L.]. MARTONIK,Metall. Trans. B, 1980, 11B, 615.9. M. BYRNEand G.R. BELTON,Metall. Trans. B, 1983, 14B, 441.
10. S. BAN-YA,T. 5HINOHARA,H. TOZAKIand T. FUWA, Tetus-to-Hagane, 1974, 60,1443.
11. D.R. SAIN and G.R. BELTON,Metall. Trans. B, 1976, 7B, 235; 1978, 9B, 403.12. A.C. 5MIGELSKASand E.O. KIRKENDALL,Trans. AIME, 1947, 171, 130.13. J.P. STARK,Acta Metall., 1966, 14, 228.14. L.S. DARKEN, Trans. AIME, 1948, 174, 184.15. G.S. HARTLEYand J. CRANK, Trans. Faraday Soc. 1949, 76, 1169.16. J.S. SHEASBY,W.E. Boggs and E.T. TURKDOGAN,Metal Science, 1984, 18, 127.17. C. WAGNER, Z. Phys. chern., Abt B, 1933, 21, 25; in Atom mooements, p. 153.
ASM, 1950.18. L. HIMMEL, R.F. MEHL and C.E. BIRCHENALL,Trans. AIME, 1953, 197, 827.19. P. HEMBREEand J.B. WAGNER, Trans. AIME, 1969, 245, 1547.20. E.T. TURKDOGAN,R.G. OLSSON, H.A. WRIEDT and L.S. DARKEN, SME Trans.,
1973, 254, 10.21. E.H. BAKER,J. Chern. Soc., 1962, 464.22. A.W.D. HILLS, Inst. Min. Me tall. Trans., 1967, 76, 241.

Rate Phenomena 81
23. E.W. THIELE, Ind. Eng. Chem., 1939, 31, 916.24. A. WHEELER, Catalysis, 1955, 2, 105.25. P.B. WEISZ and C.D. PRATER,Advan Catalysis, 1954, 6, 143.26. P.L. WALKER, F. RUSINKOand L.G. AUSTIN, Advan. Catalysis, 1959, 21, 33.27. E.T. TURKDOGAN,V. KoUMP, J.V. VINTERSand T.F. PERZAK, CARBON, 1968, 6,
467.28. E.T. J'URKDOGAN and J.V. VINTERS,Carbon, 1969, 7, 101; 1970, 8, 39.29. E.T. TURKDOGAN, R.G. OLSSON and J.V. VINTERS, Carbon, 1970, 8, 545.30. E.A. GULBRANSEN,K.F. ANDREW and F.A. BRASSORT,Carbon, 1965, 2, 421.31. J.D. BLACKWOOD,AUST. J. AppL. SCI., 1962, 13, 199.32. S. ERGUN, J. Phys. Chern., 1956, 60, 480.33. K. HEDDEN and A. LOWE, Carbon, 1967, 5, 339.34. H.-J. GRABKE,Ber. Bunsenges. physik Chem., 1966, 70, 664.35. D.A. ADERIBIGBEand J. SZEKELY,Ironrnaking & Steelmaking, 1981, 8, 11.36. R.H. TIEN and E.T. TURKDOGAN,Carbon, 1970, 8, 607.36a.H. JUNG, R.S. ARMSTEAD, N. AL. IBRAHIM and B. BOWMAN, Ironmaking &
Steelmaking, 1990, 17, 118.37. W.M. McKEWAN, Trans. TMS-AIME, 1960,218,2.38. J.M. QUETS, M.E. WADSWORTH and J.R. LEWIS, Trans. TMS-AIME, 1960, 218,
545: 1961,221, 1186.39. N.J. THEMELISand W.H. GAUVIN, A.I.Ch.E.]., 1962, 8, 437; Trans. TMS-AIME,
1963, 227, 290.40. N.A.WARNER, Trans. TMS-AIME, 1964, 230, 163.41. R.H. SPITZER, F.S. MANNING and W.O. PHILBROOK, Trans. TMS-AIME, 1966,
236, 726.42. E.T. TURKDOGANand J.V. VINTERS,Metall. Trans., 1971, 2, 3175; 1972, 3, 1561.43. E.T. TURKDOGAN,R.G. OLSSON and J.V. VINTERS,Metall. Trans., 1971, 2, 3189.44. E.T. TURKDOGAN, P. GRIEVESON and L.S. DARKEN, ]. Phys. Chern., 1963, 67,
1647; J. Metals, 1962, 14, 521.45. P.H. CALDERBANK,Chern. Eng. (London), 1967, 212, CE 209.46. J. SZEKELY,Fluid flow phenomena in metals processing, Academic Press, New
York, 1979.47. F. YOSHIDAand K. AKITA, A.l.Ch.E.J., 1965, 11, 9.48. R.D. CROZIER, Ph.D. Thesis, University of Michigan, Ann Arbor, 1956.49. I. LEIBSON,E.G~HOLCOMB, A.G. CACUSO and J.J. JACMIC, A.I.Ch.E./., 1956, 2,
296.50. V.G. LEVICH, Physicochemical hydrodynamics, Prentice-Hall, Englewood, Cliff.,
New Jersey, 1962.51. J. SZEKELY,J.W. EVANS and J.K. BRIMACOMBE.The mathematical and physical
modelling of primary metals processing operations. Wiley, New York, 1988.52. J. SZEKELY,G. CARLSSON and L. HELLE, Ladle metallurgy. Springer, Berlin,
1989.53. J. SZEKELYand O.J. ILEGBUSI,The physical and mathematical modelling of
tundish operations. Springer, Berlin, 1989.

CHAPTER 3
Thermochemical and TransportProperties of Gases
Gases playa key role in all phases of pyrometallurgical processes. In assessingthe technical aspects of irorunaking and steelmaking and the new develop-ments on these processes, some information is always needed on the physicaland chemical properties of gases at elevated temperatures. Therefore, it wouldbe appropriate to give in this chapter a selected set of data and other relevantinformation on the thermochemical and transport properties of gases.
3.1 THERMOCHEMICAL PROPERTIES
3.1.1 MOLAR HEAT CAPACITY
The molar heat capacities of a few simple gases are plotted in Fig. 3.1. Withthe exception of 502 and C021 for other gases Cp increases almost linearlywith an increasing temperature. For monatomic gases Cp is essentiallyindependent of temperature.
-~~ 40:::2.
Q.o
50
Monatomic gases20C=====~======~======~====~300 700 1100 1500Temperature (K)
1900
Fig. 3.1 Molar heat capacities of simple gases.
82

Thermochemical and Transport Properties of Gases 83
There is an interesting correlation for the heat capacity per atom, i.e. Cp= molar Cp/number of atoms per mol, as shown below.
number of atoms per mol c,J g-atom-1K-1at 298K
12
3-6
20.8 ± 0.0514.6 ± 0.212.2 ± 1.0
The average of these values Cp = 16 ± 4 is approximately similar to that forcomplex crystalline minerals and alumino silicate glasses discussed in sec-tion 1.6 of Chapter 1.
3.1.2 HEAT CONTENT
The molar heat contents of simple gases are plotted in Fig. 3.2 over therange 300-1900K.
3.1.3 EQUILIBRIUM STATES IN GAS MIXTURES
When assessing the state of reactions involving gas mixtures, the partialpressures of the gaseous species should be evaluated from the reactionequilibrium data for all the pertinent gas reactions. The method of calcula-tion is demonstrated below by two examples.
60-(5E
20
700 1100Temperature (K)
1500 1900
Fig.3.2 Heat contents of simple gases.

84 Fundamentals of Steelmaking
A. Gas mixture CO-C02-S02 :
At elevated temperatures the following are the predominant gaseousspecies in the equilibrated gas mixture: C021 CO, COS, 52 and S02: otherspecies such as 021 5, SO, 5031 CS and CS2 are small enough to be neg-lected in the calculations. With this simplification, the material balance forcarbon (}2C),sulphur (L5) and oxygen (LO) are represented by the follow-ing ratios for the ingoing gas mixture at (PCO)i + (PC02)i + (PS02)i = 1atmosphere and ambient temperature.
LC = 1 - (PS02)i = (Peo? + Peo + Peos ) (3.1)k5 (PS02)i 2ps2 + Pso2 + Peas e
LC = 1- (PS02)i = ( PC02 + Pea + Peas ) (3.2)LO 2 - (Peo)i 2PS02 + Peos + 2PC02 + Pco e
where e indicates partial pressures in the equilibrated gas mixture.
For the reaction 2CO + 502 = 1!zS2 + 2C02,l (3.3)
Ks= (Pe02)2 (PS2)1/2Pea Pso2
(3.3a)
For the reaction 3CO + 502 = COS + 2C021
K - (PC02)2 Peose - (Peo)3 Pso2
For the sum of all the predominant species,
(Peo2 + Peo + Peas + PS2+ PS02)e = 1
(3.4)
(3.4a)
(3.5)
By simultaneous solution of these five equations, for known values of theequilibrium constants Ks and Kc and known ingoing gas composition, theequilibrium partial pressures of the gaseous species are calculated througha computer programme. Examples of the calculated data are given in Fig.3.3 showing the equilibrium ratio Peo2/Peo at the indicated temperaturesas a function of percent (S02)i in the ingoing gas.
B. Gas mixture CO-C02-H20-CH4:
This example is in relation to reheating a reformed gas in the direct ironore reduction processes. If there is complete gas equilibrium at the. reheat-ing temperature and pressure, the activity of carbon in the equilibratedgas mixture must satisfy the following three basic reaction equilibria:
2eD = C + CO2
Kl = aePeo2/P~O
H2 + CO = C + H20K2 = aePH20/PHiPco
(3.6)(3.6a)
(3.7)(3.7a)
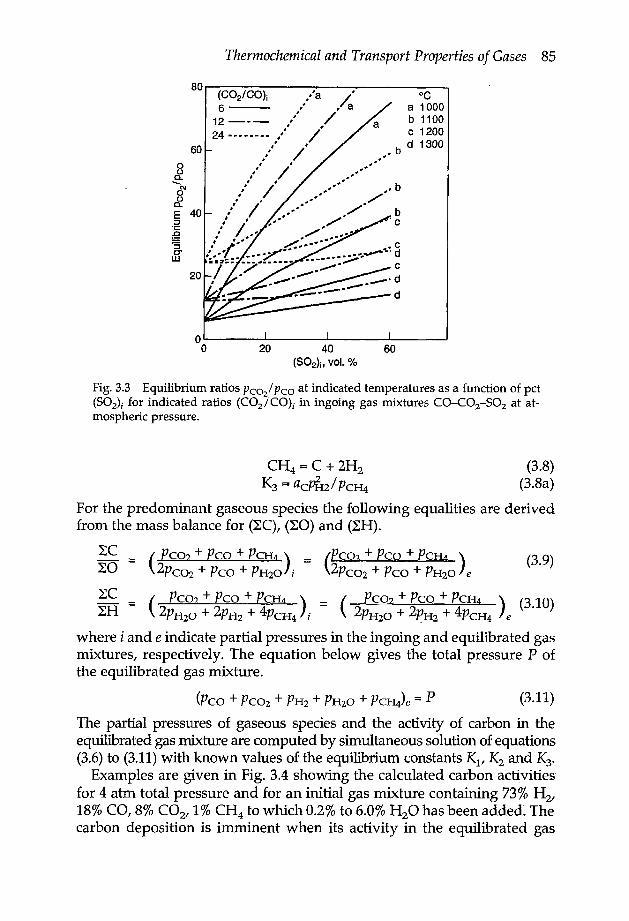
Thermochemical and Transport Properties of Gases 85
20
80~--------------------------~(C02/CO)j6---
12---24 --- -----
°Ca 1000b 1100c 1200
, b d 1300",
",""", ,. b
/'bc
oU
Q..••....8'oQ.
E 40::::;,g·s0-W
o~----~------~------~----~o 20 40(S02)j, vol, 0/0
60
Fig. 3.3 Equilibrium ratios Peoz/ Peo at indicated temperatures as a function of pet(S02)i for indicated ratios (C02!CO)i in ingoing gas mixtures CO-C02-S02 at at-mospheric pressure.
CH4=C+2H2
K3 = acPfu/PCH4(3.8)
(3.8a)
For the predominant gaseous species the following equalities are derivedfrom the mass balance for (~C), (~O) and (~H).
~C ( PC02 + Pco + PCH4) _ (PC02 + Pco + PCH4 ) (3.9)~O = 2PC02 + Pco + PH20 i - 2PC02 + Pea + PH20 e
~C = ( PC02 + Pco + PCH4 ) _ ( PC02 + Pco + PCH4 ) (3.10)~H 2PH20 + 2PH2 + 4PCH4 i - 2PH20 + 2~H2 + 4PCH4 e
where i and e indicate partial pressures in the ingoing and equilibrated gasmixtures, respectively. The equation below gives the total pressure P ofthe equilibrated gas mixture.
(pco + PC02 + PH2 + PH20 + PCH4)e = P (3.11)
The partial pressures of gaseous species and the activity of carbon in theequilibrated gas mixture are computed by simultaneous solution of equations(3.6) to (3.11) with known values of the equilibrium constants KI, K2 and K3.
Examples are given in Fig. 3.4 showing the calculated carbon activitiesfor 4 atm total pressure and for an initial gas mixture containing 73% Hz,18% CO, 8% CO2, 1% CH4 to which 0.2% to 6.0% H20 has been added. Thecarbon deposition is imminent when its activity in the equilibrated gas

600Temperature (OC)
Fig. 3.4 Calculated activity of carbon for complete gas equilibrium at 4 atm andindicated temperatures for reformed natural gas containing 73% H2I 18% CO, 8%CO2 and 1% CH4 to which an indicated amount of H20 is added.
86 Fundamentals of Steelmaking
1.2...----------------------,
1.1
c:o€coo15 1.0.Z'.::;~o«
0.9
0.8 M::....- ~ __L.. _""'____lI._.Io....I._.a....-....I
400 500 700 800
exceeds unity, with respect to graphite. With the addition of 0.2% H20 tothis gas mixture, there should be no carbon deposition in the equilibratedgas mixture at temperatures below 512°C and above 720°C. In an earlierstudy of the reduction of iron oxides in a similar gas mixture, carbondeposition was observed at all temperatures below 1000°C (see Ref. I),indicating lack of complete gas equilibrium even at lOOO°C.
3.2 TRANSPORT PROPERTIES
The molecular transfer of mass, momentum and energy are interrelatedtransport processes of diffusion under a concentration gradient, viscousflow in a velocity gradient and heat conduction in a thermal gradient. Theearlier derivation of equations for the transport properties, as given below,were based on an oversimplified kinetic theory of gases.
D = V3vl (diffusivity)'tl = V3nmvl (viscosity)K = V3ncvvl (thermal conductivity)
where m = molecular massn = number of molecules per em>V = mean thermal molecular velocity1 .= mean free pathc., = specific heat capacity per g at constant volume.
. (3.12)(3.13)(3.14)

Thermochemical and Transport Properties of Gases 87
The derivation of the transport properties from the rigorous kinetictheory of gases, described in depth by Chapman and Cowling- andHirschfelder et al.3 is based on the evaluation of the intermolecular energyof attraction, the collision diameter and the collision integral involving thedynamics of a molecular encounter, hence the intermolecular force law.
For a brief description of the theoretical equations for the calculation ofthe transport properties of gases, reference may be made to the author'sprevious publication.s For the present purpose, it is sufficient to giveselected numerical data on the transport properties of a few gases, relev-ant to ironmaking and steelmaking processes.
Table 3.1 Diffusivity D at 1 atm pressure: cm2s-1 == 10-4m2s-1
Temperature, K
Gas 300 1000 1500 2000
H2 1.46 10.82 21.07 33.90Ar 0.18 1.46 2.88 4.56N2 0.20 1.59 3.05 4.98O2 0.22 1.67 3.27 5.30CO 0.20 1.63 3.20 5.19CO2 0.11 0.93 1.87 3.00H2O 0.28 2.83 5.79 9.57
Table 3.2 Viscosity ll:(poise) == g cm-1s-1 == O.lN s m-2 == O.lJ m-3s
Temperature, K
Gas 300 1000 1500 2000
H2ArN2O2COCO2H20
0.892.501.772.071.791.491.57
1.955.344.074.824.153.854.77
2.536.985.116.205.345.016.44
3.068.276.307.646.536.057.84
Table 3.3 Thermal conductivity K x 104, J cm-1s-1k-1 == x 102, kg m s-3K-l == x 102,
Wm-1K-l
Temperature, K
Gas 300 1000 1500 2000
H2 17.45 39.96 53.87 67.64Ar 1.97 4.18 5.44 6.44N2 2.50 6.18 8.15 10.53
°2 2.57 6.68 9.02 11.62CO 2.53 6.35 8.57 10.96CO2 1.62 5.49 7.71 9.95H2O 3.84 13.55 20.20 26.93

88 Fundamentals of Steelmaking
3.2.1 INTERRELATIONS BETWEEN TRANSPORT PROPERTIES
B:2.1a Viscosity/thermal conductivityFor monatomic gases,
K= 15R4M11 (3.15)
where R = 8.314 J mol-1K-l (molar gas constant)M = molecular mass, kg mol-111 = viscosity, N s m-2 == J m-3s
For polyatomic gases,
K = lSR 11 { ~ Cv + ~ }4M 15 R 5 (3.16)
where Cv is the molar heat capacity at constant volume and
{ is 1+ ~ } is the 'Eucken" correction factor' for thermal conduc-
tivity of polyatomic gases. For monatomic gases Cv = 3R/2; with thissubstitution, equation (3.16) is reduced to equation (3.15). In terms of themolar heat capacity at constant pressure, Cv = Cp - R, equation (3.16) istransformed to the following form.
5R 11K = ( Cp + -4-) M (3.17)
3.2.1b Thermal diffusivity/thermal conductivityThe thermal diffusivity, DT, is analogous to mass diffusivity and is givenby the ratio
K
pCp
where p is the molar density of the gas.
(3.18)
3.2.1c Temperature and pressure effectsThe diffusivity, viscosity and thermal conductivity increase with an in-creasing temperature, thus
D ex 13/2
11 ex Tl/2
K C( TJ/2
(3.19)
(3.20)
(3.21)
The viscosity and thermal conductivity are independent of pressure;however, the diffusivity is inversely proportional to pressure.

Thermochemical and Transport Properties of Gases 89
3.2.1d Molecular mass effectD oc M-l/2
'Y) cc Ml/2
K ~M-l
(3.22)
(3.23)
(3.24)
3.3 PORE DIFFUSION
When the pores are small enough such that the mean free path I of themolecules is comparable to the dimensions of the pore, diffusion occursvia the collision of molecules with the pore walls. Knudsen" showed thatthe flux involving collision of molecules with reflection from the surface ofthe capillary wall is represented by the equation
] = _ ~ vr de3 dx (3.25)
where fj is the mean thermal molecular velocity = (8kTjn:m)1/2, r theradius of capillary tube and del dx the concentration gradient along thecapillary. For r in cm and the Knudsen diffusivity DK in cm2s-1
(3.26)
The Knudsen diffusivity being independent of pressure but moleculardiffusivity inversely proportional to pressure, it follows that in any porousmedium, the Knudsen diffusion predominates at low pressures where themean free path is larger than the dimensions of the pore.
For the mixed region of molecular and Knudsen diffusion in capillaries,Bosanquet? derived the following expression based on a random walkmodel in which the successive movements of molecules are terminated bycollision with the capillary wall or with other molecules:
1D
1 1= DK" - ~
1 II
(3.27)
where Dii is the molecular self-diffusivity. For a porous medium of uni-form pore structure with pores of equal size, the Bosanquet interpretationformula gives for the effective diffusivity of component i
(3.28).'-
where E is the volume fraction of connected pores, 't the tortuosity factor,D12 the molecular diffusivity for a binary mixture 1-2 and DKi theKnudsen diffusivity of component i for a given uniform pore radius r.

90 Fundamentals of Steelmaking
1.0 ,..----------- .--- Experimental
- - - - - Calculated.-- ....• -- ..•.. Limiting slope-1
en...•...N
5 0.1CDo
0.0 1 '-----'---'-__'__~ ............•_ __'__--'--.....&.....I.-'--'-.L.L..I0.1 . 1.0 100.1
Pressure (atm.)
Fig. 3.5 Pressure dependence of effective diffusivity He-C02 at 20°C in iron re-duced from haematite ore in hydrogen at indicated temperature.
1.0 10
The experimental data are shown in Fig. 3.5 for effective diffusivity He-CO2 at 20°C in porous iron reduced from haematite are in hydrogen at 800and 1000°C.8 As discussed in section 2.4.4, the pore structure of ironbecomes finer at a lower reduction temperature. It is for this reason thatthe Knudsen diffusion effect at lower pressures become more pronouncedfor porous iron reduced at 800°C as compared to that reduced at lOOO°C.More detailed information is given in the author's previous publicationson the subject of gas diffusion in porous media.s-"
REFERENCES
1. B.T. TURKDOGANand J.V. VINTERS,Metall. Trans., 1974, 5, 11.2. S. CHAPMAN and T.G. COWLING, The mathematical theory of non-uniform gases,
Cambridge Univ. Press, London, (3rd edn. 1970).3. J.O. HIRSCHFELDER,C.F. CURTISS and R.B. BIRD, Molecular theory of gases and
liquids, Wiley, New York, 1954.4. E.T. TURKDOGAN, Physical chemistry of high temperature technology, Academic
Press, New York, 1980.5. A. EUCKEN, Physik.Z., 1913, 14, 324.6. M. KNUDSEN, Ann. Phys. (Leipzig), 1909, 28, 75.7. C.H. BOSANQUET,Br. TA Rep. BR-507, September 1944.8. E.T. TURKDOGAN,R.G. OLSSON and J.V. VINTERS,Metall. Trans., 1971, 2, 3189.

CHAPTER 4
Physicochemical Properties ofSteel
4.1 SELECTED THERMODYNAMIC ACTIVITIES
4.1.1ACTIVITY COEFFICIENTS IN FE-X BINARY MELTS
In binary metallic solutions with complete liquid miscibility, there arepositive or negative departures from Raoult's law and Henry's law asshown schematically in Fig. 4.1.
For low solute contents, as in low-alloy steels, the activity is definedwith respect to Henry's law and mass percent of the solute
a, = fiX[%i] (4.1)
such that fi ~ 1.0 as [%i] -;. o.Up to several percent of the solute content, log fi increases or decreases
linearly with an increasing solute concentration.
logfi = ei[%i]
The proportionality factor e, is known as the interaction coefficient.
(4.2)
1.0
Henry's law ('f)
.. 1.o~~·~--·-----·--·-·-------------------~
6 Atom fraction 1.0
Fig. 4.1 Shematic representation of nonideal behaviour in binary metallic solutions.
91

92 Fundamentals of Steelmaking
Table 4.1 Values of ef for dilute solutions in liquid iron at 1600°C
Element i e! Element i e~I t
Al 0.045 0 - 0.10C 0.18 P 0!062Cu 0.023 S - 0.028Cr 0.0 Si 0.11Mn 0.0 Ti 0.013Ni 0.0 V 0.015
For dilute solutions in liquid iron, the binary interaction coefficients e~ arelisted in Table 4.1, taken from the data compiled by Sigworth and Elliott.!
Using the experimental data of Smith.!= the carbon activity is plotted inFig. 4.2 with respect to two different standard states. When the standardstate is chosen so that in infinitely dilute solutions the activity coefficient fcapproaches unity, the temperature effect on the activity vs compositionrelation becomes almost negligible, at least within the range 800o-1200°C.
The activity of carbon in liquid iron was measured in many independentstudies. The data compiled and re-assessed by Elliott et al.2 are given in Figs.4.3 and 4.4 as activity coefficients 'tc and fc for two different standard states.
c 0.8o.0~ 0.6'0~=s; 0.4
~ 0.2
3.0The standard stateis so chosen thatfe +1.0 when °/oe +0
co.0~ 2.0'0~.s;~« 1.0
0.8 1.2Carbon (wt. %)
Fig. 4.2 Activity of carbon in austenite for two different standard states. From Ref.la.
0.4 1.6
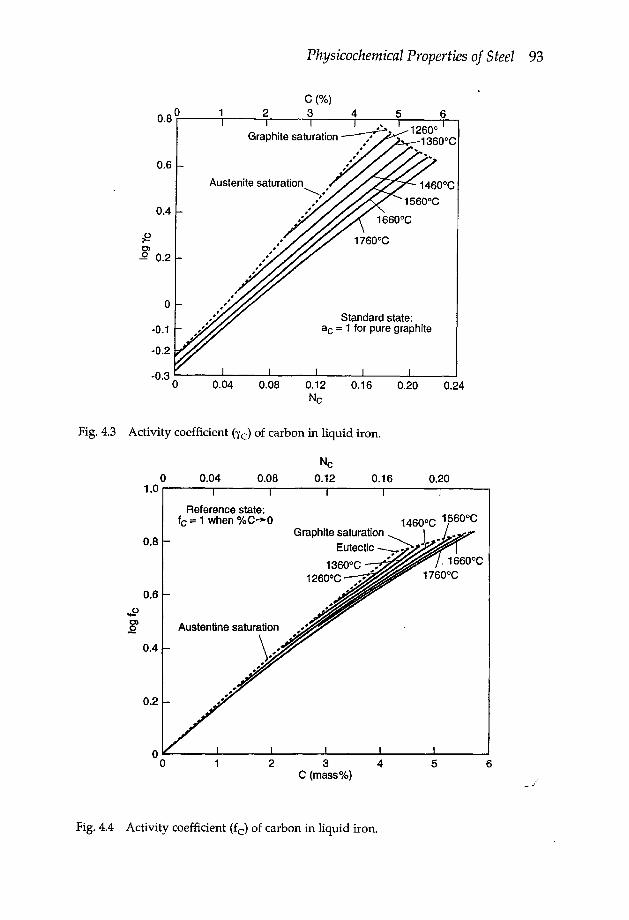
Physicochemical Properties of Steel 93
C (%)
0.80r--__ ~-_2r---___,3r--~4--~5--_T____,
Austenite saturation
..';/0.6
oStandard state:
ae = 1 for pure graphite
0.4
~C>.Q 0.2
-0.1
-0.2
-0.3 "'--__ ...L- .....&....__ --'- __ ---'- I....-__ ----'o 0.04 0.08 0.12 0.16 0.20 0.24
Nc
Fig. 4.3 Activity coefficient (yc) of carbon in liquid iron.
o1.0~----~-----~------T------r---_,--__,0.04 0.08Ne
0.12 0.16 0.20
Reference state:tc = 1 when %C~O
0.6
Austentine saturation
)...
0.8
0.4
0.2
o~---~------~----~----~---------------o 2 345 6C (masses)
Fig.4.4 Activity coefficient (fc) of carbon in liquid iron.

94 Fundamentals of Steelmaking
4.1.2 ACTIVITY COEFFICIENTS IN MULTICOMPONENT MELTS
In rnulticornponent melts, as in alloy steels, the activity coefficient of solutei is affected by the alloying elements for which the formulation is
logfi = e~ [%i] + ~e{ x [%j] (4.3)
where e{ is the interaction coefficient of i as affected by the alloying el-ementj.
. d log (e1 - J ii - d[%j] (4.4)
Selected interaction coefficients in dilute solutions of ternary iron basealloys for C, H, N, 0 and S at 1600°C are given in Table 4.2.
Table 4.2 Selected interaction coefficients in dilute solutions of ternary iron base alloys forC, H, N, 0 and S at 1600°C, from Ref. 1
Elementj e~ ek e~ eb e~
Al 0.043 0.013 -0.028 -3.9 0.035C 0.14 0.06 0.13 -0.13 0.11Cr -0.024 -0.002 -0.047 -0.04 -0.011Mn -0.012 -0.001 -0.02 -0.021 -0.026N 0.13 0 0 0.057 0.0070 -0.34 -0.19 0.05 -0.20 -0.27P 0.051 0.011 0.045 0.07 0.29S 0.046 0.008 0.007 -0.133 -0.028Si 0.08 0.027 0.047 -0.131 0.063
For the mass concentrations of carbon and silicon above 1%, as in theblast furnace and foundry irons, the following values of f~ should be used.
Mass % C or Si : 2.0 2.5 3.0 3.5 4.0 4.5 5.0.fs : 1.79 2.14 2.53 3.05 3.74 4.56 5.75fsi :1.37 1.50 1.64 1.78 1.95 2.10 2.32
4.1.3 FREE ENERGIES OF SOLUTION IN LIQUID IRON
For the solution of element Xi in liquid iron at 1 mass % XiI
Xi(pure) = [Xi] (1 mass %)
the free energy of solution is
AG RT 1 0.5585 0Ll S = n M. "Ii
1
where Mi is the atomic mass (g-atom) and "Ii the activity coefficient (withrespect to pure element) at infinite dilution (%Xi == 0).

Physicochemical Properties of Steel 95
For L\Gs in J mol-1 and substituting log for In,
AGs = 19.146 T log O.~~5 t;1
(4.5)
The free energies of solution of various elements in liquid iron are listedin Table 4.3.
Table 4.3 Free energies of solution in liquid iron for 1 mass %: (g) gas, (I) liquid, (s) solid,from Ref. 1
Element i
Al(l)C (gr)Co (1)Cr(s)Cu(l)IhH2(g)Mg(g)Mn (I)IhN2(g)Ni(l)lh02(g)lhP2(g)IhS2(g)Si(l)Ti(s)V(s)W(s)Zr(s)
0.0290.571.071.148.60
1.30
-63,178 - 27.91T22,594 - 42.26T1,004 - 38.74T
19,246 - 46.86T33,472 - 39.37T36,377 + 30.19T
-78,690 + 70.80T4,084 - 38.16T3,599 + 23.74T
-20,920 - 31.05T-115,750 - 4.63T-122,173 -19.25T-135,060 + 23.43T-131,500 - 17.24T-31,129 - 44.9BT-20,710 - 45.61T31,380 - 63.60T
-34,727 - 50.00T
0.66
0.00130.0380.101.200.043
4.2 GAS SOLUBILITIES IN SOLID AND LIQUID IRON
4.2.1 SIEVERT'S LAW
Diatomic gases such as °21 52' N2 and H2 dissolve in liquid and solidmetals in the atomic form
(4.6)
for which the isothermal equilibrium constant is
K = ([%~2PX2
For ideal solutions, the concentration of X is directly proportional to thesquare root of the equilibrium gas partial pressure; this is known as theSievert's law.
(4.7)

96 Fundamentals of Steelmaking
4.2.2 SOLUBILITY OF HYDROGEN
(4.8)
(4.9)
The temperature dependence of K (with PH2 in atm) is as follows for a,6(bcc) iron, y(fcc) iron and liquid iron (1);see Fig. 4.5.
Temperature (OC)
Fig. 4.5 Solubility of hydrogen in pure iron (or low-alloy steels) at 1 atm pressure ofH2•
1418log Ka,o = - -T- + 1.628 (4.9a)
log K.. = - 1~2 + 1.628
log s, = - l~O + 2.423
(4.9b)
(4.9c)
where the temperature T is in degrees Kelvin.During rapid cooling of a heavy-section steel casting, e.g. thick slab or
bloom, there will be little diffusion of H out of the casting. Because thehydrogen solubility decreases with a decreasing temperature, there will bea build up of Hz pressure in the steel matrix during rapid cooling. For thelimiting case of no hydrogen diffusion, the H2 pressures will be as shownbelow in the steel containing 2, 4 and 8 ppm H.

Physicochemical Properties oj Steel 97
Temperature °C
14001100900
900700500
2ppmH
0.0580.120.23
0.581.83
10.4
Hz pressure, atm4ppmH
0.230.480.92
2.337.3
41.6
BppmH
0.91.93.7
9.329.2
166.5
Because of this pressure buildup, internal cracking and flaking couldoccur in heavy sections of crack sensitive steels, if the hydrogen content istoo high. If degassing facilities are not available, heavy-section castings forcritical applications are cooled slowly to allow the diffusion of hydrogenout of the steel casting, e.g. slab, bloom or ingot. Most steel works nowa-days do have degassers. The HSLA grade steels for critical applications,e.g. armour plates, pressure vessels, rail steels etc., are degassed to removehydrogen to 2 ppm or less before casting.
4.2.3 SOLUBILITY OF NITROGEN
The nitrogen solubility data are summarised by the following equationsand are shown graphically in Fig. 4.6.
600400 Liquid
200 '1ZE 100~ 80en 60enctS 40~
20
10600 800 1000 1200 1400 1600 1800
Temperature (OC)
Fig. 4.6 Solubility of nitrogen in pure iron (or low-alloy steels) at 1 atm pressure of Nz-
lhN2 = [N]
K = [ppm N](PN2) 1 12
(4!.10)
(4.11)

98 Fundamentals of Steelmaking
1570logK s:. =- -- + 2.98o,o T
450log K; = -T- + 2.05
log K/ = - 1~8 + 2.76
(4.11a)
(4.11b)
(4.11c)
4.2.4 SOLUBILITY OF CARBON MONOXIDE
Carbon monoxide dissolves in liquid iron (steel) by dissociating intoatomic carbon and oxygen
CO(g) = [C] + [0] (4.12)
for which the equilibrium constant (which is not too sensitive to tempera-ture) is given by the following equation for low alloy steels containing lessthan 1% C.
K = [%C][ppm 0] = 20Pea (atm) (4.13)
At higher carbon contents, a correction should be made to K with theactivity coefficients jCo (logjCo = -0.13[%C]) and fc (logfc = 0.18[%C]).
For the reaction
CO2 (g) = CO (g) + [0] (4.14)
K = Pea [ppm 0] = 1.1 X 10⁴ at 1600°C (4.15)Peo2
For 800 ppm 0 in low carbon steel at tap, the equilibrium ratio PCO/PC02 is13.75. For this state of equilibrium, the gas mixture contains 6.8%C02 and93.2% CO.
4.2.5 SOLUBILITY OF WATER VAPOUR
From the free energy of formation of water vapour and the solubilities ofhydrogen and oxygen in liquid iron, the following equilibrium constant isobtained for the reaction of water vapour with liquid iron for 1600°C.
H20(g) = 2[H] + [0]
[ppm H]2[ppm 0] = 1.77 X 10⁶ at 16000CPH20(atm)
(4.16)
(4.17)K=
The hydrogen and oxygen contents of low alloy liquid steel in equilibriumwith H2-H20 mixtures at 1 atm pressure and 1600°C are shown in Fig. 4.7.

Physicochemical Properties of Steel 99
100~----------------------------~80604020
4
EQ.
Sc: 10~ 8o~ 6:c
2
0.004 0.01Oxygen (wt. %)
Fig. 4.7 Concentrations of hydrogen and oxygen in liquid iron at 1600°C inequilibrium with indicated compositions of H2-H20 mixtures.
1~--~~~~~----~~~~~--~0.001 0.04 0.1 0.2
4.2.6 SOLUBILITY OF SULPHUR DIOXIDE
From the free energy of formation of S02 and the solubilities of gaseoussulphur and oxygen in liquid iron, the following equilibrium constant isobtained for the reaction of S02 with liquid iron at 1600°C.
S02(g) = [5] + 2[0]
[%5][%0]2 = 1558 at 1600°Cpso2(atm)
(4.18)
(4.19)K=
For the concentrations of sulphur and oxygen present in liquid steel, it isseen that the corresponding equilibrium pressure of 502 is infinitesimallysmall. It is for this reason that no sulphur can be oxidised to S02 duringsteelmaking with oxygen blowing.
4.2.7 SOLUBILITY OF HYDROGEN SULPHIDE
(4.20)
K = .Es»: [ppm S] = 4.3 X 10⁶ at 1600°CPH2S
.•.•. ./'
(4.21)
For the steel containing 100 ppm 5, the equilibrium gas pressure ratio is

100 Fundamentals of Steelmaking
PH2S/PH2 = 2.4 X 10⁻⁵• This example illustrates that liquid steel cannot bedesulphurised by purging with hydrogen, and that sulphur bearing gasesin-the reheating furnace atmosphere will result in sulphur pickup by thesteel.
4.3 SELECTED IRON-BASE PHASE DIAGRAMS
4.3.1 CRYSTALLOGRAPHIC FORMS OF IRON
Iron occurs in two crystalline modifications as shown in Fig. 4.8: body-centred cubic (b.c.c). denoted by a and 0 and face-centred cubic (f.c.c)denoted by y. The phase transformations for pure iron occur at the follow-ing temperatures.
a-Fe 91!C y-Fe 13~oC a-Fe 15~oC liquid Fe
Face-centredcube
'Y-Fe
BOdy-centredcube
a-Fe, a-Fe
4.0
'Y-Fe -,..---
r-
a-Fe o-Fe--- ..--.-.--~I I J
<c:~ 3.6C.eenc:8B 3.2
~
2.8 o 400 800 1200Temperature (OC)
1600
Fig. 4.8 Variation of lattice constant of pure iron with temperature.
In the b.c.c structure, the comer atoms of the cube become centre atomsin the body of the neighbouring cubic lattice, with every atom havingeight nearest neighbours, i.e. coordination number eight. In the f.c.c struc-ture, the corner atoms of the cube become centre atoms on the faces of theneighbouring cubic lattice, with coordination number twelve.

Physicochemical Properties of Steel 101
The interatomic distance, i.e. diameter d of hypothetical tangent atomspheres, is related to the lattice parameter a (length of the unit cube edge)as derived from the geometry of atom arrangement.
for b.c.c. d=aV3 (4.22a)z-
for f.c.c. d= a (4.22b)-v2The interatomic distances calculated from the lattice parameters at thephase transformation temperature 910°C (Fig. 4.8), are
Phaseay
a, A2.8983.639
d, A*2.5102.573
In the non-close-packed structures, the atoms behave as though they wereslightly smaller than those in the close-packed structures.
In metallurgical language, a-Fe is called the ferrite phase and y-Fe, theaustenite phase. The ferrite phase goes through a magnetic transformationat 769°C, above which iron is not magnetic, however, this is not a truepolymorphic transformation. Since the lattice constant of austenite islarger than that of ferrite, the elements forming interstitial solid solutionsin iron, i.e. within the iron space lattice, have larger solubilities in theaustenite phase, e.g. H, B, C, Nand O. In the substitutional solid solutions,solute atoms replace the solvent atoms in the space lattice of the latter.Depending on the nature of the alloying elements in iron, the transforma-tion temperatures vary over a wide range. The elements with f.c.c struc-ture dissolved in iron favour the f.c.c. structure and therefore they extendthe temperature stability range of the austenite phase, e.g. Ni, Co.Similarly a solute element with b.c.c structure extends the stability rangeof the ferrite phase, e.g. Si, Cr, V. The existence of these two crystallineforms of iron is largely responsible for the versatility of iron alloys inpractical applications. The iron can be rendered malleable, ductile, toughor hard, by alloying with suitable elements and applying appropriate heatand mechanical treatments.
4.3.2 IRON-CARBON SYSTEM
Since carbon is one of the most important ingredients of steel, the study ofthe iron-carbon phase equilibrium diagram has received much attention"during the past several decades. The phase diagram is given in Fig. 4.9.
"In Sl units 10 A:= nm (nanometre) = 10-9m.

102 Fundamentals of Steelmaking
There are three invariants in this system; peritectic at 1499°Cf eutectic at1152°C and eutectoid at 738°C. The phase boundaries shown by brokenlines are for the metastable equilibrium of cementite, Fe3C, with austenite.It was shown by Wells" that if sufficient time is allowed, iron-carbon alloyscontaining austenite and cementite decompose to austenite and graphite.The solubilities of graphite and of cementite in a-iron below the eutectoidtemperature are given by the following equations using the data ofSwartz+
I 01 C ( h·) 5250 + 3.53og /0 grap lte = - ---r-3200log %C (cementite) = - ---r- + 1.50
(4.23)
(4.24)
1600~------------------------------------~1537°C 0 + liquid
~~~Cl>0..
E~ 1000
'Y+ graphite (stable phase)'1+ cementite (metastable phase)
8000.020% 738°C
727°C a + graphite0.021% (a + cementite)
600 0 1· 2 3 4Carbon (wt. %)
5
Fig. 4.9 Iron-carbon phase equilibrium diagram. Dashed lines represent phaseboundary for metastable equilibrium with cementite. .
The solubility of graphite in liquid iron is well established and theexperimental data, reviewed by Neumann and Schenck>,are summarisedby the equation
[%C] = 1.30 + 2.57 x 10⁻³ T (OC) (4.25)
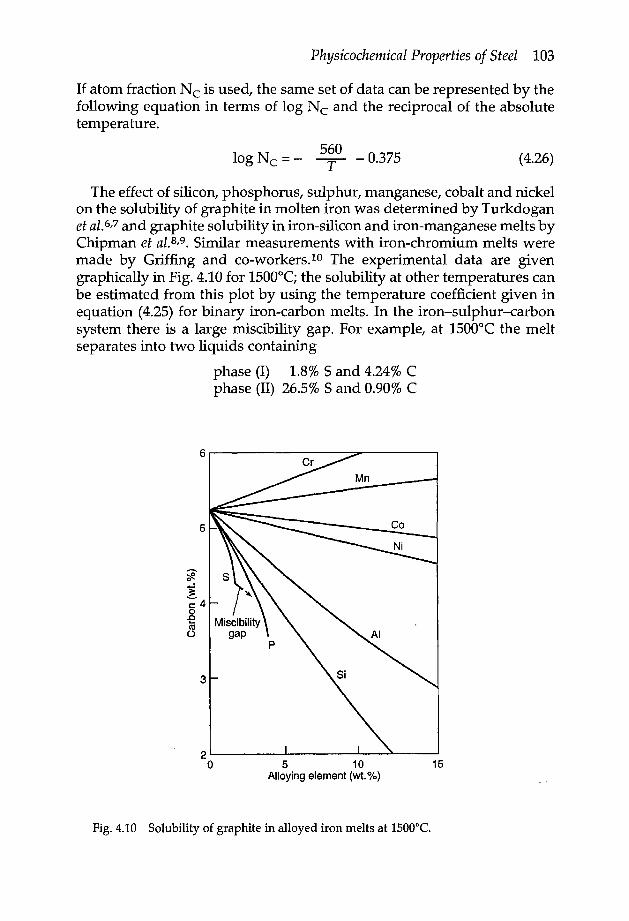
Physicochemical Properties of Steel 103
If atom fraction Nc is used, the same set of data can be represented by thefollowing equation in terms of log Nc and the reciprocal of the absolutetemperature.
560log Nc = - --y - 0.375 (4.26)
The effect of silicon, phosphorus, sulphur, manganese, cobalt and nickelon the solubility of graphite in molten iron was determined by Turkdoganet al.6,7 and graphite solubility in iron-silicon and iron-manganese melts byChipman et a1.8,9. Similar measurements with iron-chromium melts weremade by Griffing and co-workers.t? The experimental data are givengraphically in Fig. 4.10 for 1500°C; the solubility at other temperatures canbe estimated from this plot by using the temperature coefficient given inequation (4.25) for binary iron-carbon melts. In the iron-sulphur-carbonsystem there is a large miscibility gap. For example, at 1500°C the meltseparates into two liquids containing
phase (I) 1.8% Sand 4.24% Cphase (II) 26.5% Sand 0.90% C
5
3
5 10 15Alloying element (wt.%)
Fig.4.10 Solubility of graphite in alloyed iron melts at 1500°C.

104 Fundamentals of Steelmaking
4.3.2a Peritectic reactionThe peritectic reaction occurring in the early stages of solidification of low-carbon steels is of particular importance in the continuous casting of steel.The peritectic region of the Fe-C system is shown on a larger scale in Fig.4.11.As the temperature decreases within the two-phase region, C + liquid,the carbon contents of c-iron and residual liquid iron increase. At theperitectic temperature 1499°C,o-iron containing 0.10%C reacts with liquidiron containing 0.52%C to form y-iron with 0.16%C.
1550~----------------------------~
0-~Q)
~15 15000>a.E~
Liquid
1+ liquid
1450~--------~--------~~------~o 0.2 0.4 0.6
Fig. 4.11 Peritectic region of binary iron-carbon system.
The X-ray diffraction data give for the densities of iron-carbon alloys:7.89 g cm=' for o-Fe with 0.10%C and 8.26 g cm-3 for y-Fe with 0.16% C.Hence, the C to y phase transformation is accompanied by 4.7% volumeshrinkage. Because of this shrinkage, the thin solidified shell in the mouldof the caster will contract, producing a gap between the shell surface andmould wall. This situation leads to an uneven surface which is in partialcontact with the mould wall, hence resulting in reduced heat flux at con-tracted areas. A reduced solidification growth rate and a nonuniform shellwith thin spots, lowers the resistance of the steel to cracking which maycause a breakout in the mould. This phenomenon was well demonstratedexperimentally by Singh and Blazekt! using a bench scale caster; thissubject is discussed further in a paper by Wolf and Kurz.P
In low alloy steels containing 0.10 to 0.16% C, the solid/liquid ratio atthe peritectic invariant is higher than for steels containing more than0.16%C. Therefore, due to the peritectic reaction, low alloy steels with 0.10

Physicochemical Properties of Steel 105
to 0.16% C are more susceptible to the development of surface cracks incontinuous casting than steels with higher carbon contents.
4.3.2b Effect of alloying elements on peritectic invariantAs shown schematically in Fig. 4.12 for the ternary Fe-C-X, or multicom-ponent alloy steels, the peritectic reaction occurs over a temperature andcomposition range. From the experimental data on the liquidus and sol-idus temperatures of alloy steels, the carbon and temperature equivalentsof alloying elements have been evaluated in three independentinvestigations. 13-15
Fig. 4.12 Schematic representation of phase boundaries in low alloy steels aspseudo binary Fe-C system.
The carbon equivalents of the alloying elements for the peritecticreaction
C(6-Fe) + C(l-Fe) = C(y-Fe)
are usually formulated as follows
Liquid phase: 8.%C = 0.52 + ~~C~l . [%X]
-Delta phase: A%C = 0.10 + LAC~[)· [%X]
The changes in peritectic temperatures are formulated as
Liquid phase: AT = 1499°C + }:AT~l · [%X]
Delta phase: ~T = 1499°C + ~~T~[) • [%X]
(4.27)
(4.28)
(4.29)
(4.30)
(4.31)

106 Fundamentals of Steelmaking
The coefficients L\C1> and L\T~ can be positive or negative, depending onthe alloying element x.. If the reported values of these peritectic parameters are reliable numer-
ically and by the + or - sign, they should correlate to one another in aconsistent manner either empirically or theoretically. It is on the basis ofsuch a criterion that a reassessment is now made of the values reported byYamada et al.14
The slopes of the liquidus and solidus lines at low solute contents in theFe-X binary systems are plotted in Fig. 4.13 against the peritectic tempera-ture coefficients tlTpI and ~Tpo (OC/%X) in the Pe-C-X alloys. Of theelements considered here, Mn and Ni are the only two austenite stabilisersinvolving peritectic reactions, hence the peritectic temperature coefficientsare positive.
-1i-20
~ -200o.•...•o~~ -400
-600
-800-60 -50 -40 -30 -20 -10 0 10
aTPS (OC/%X)
0
~ -20.•..•0L
~ -40
-60-30 -20 -10 0 10
aTpl (OC/%X)
Fig. 4.13 Linear decrease in solidus, IlT & and liquidus, I1T1, temperatures at lowsolute contents in binary systems Fe-X, related to changes in peritectic temperatureswith respect to the binary Fe-C system.
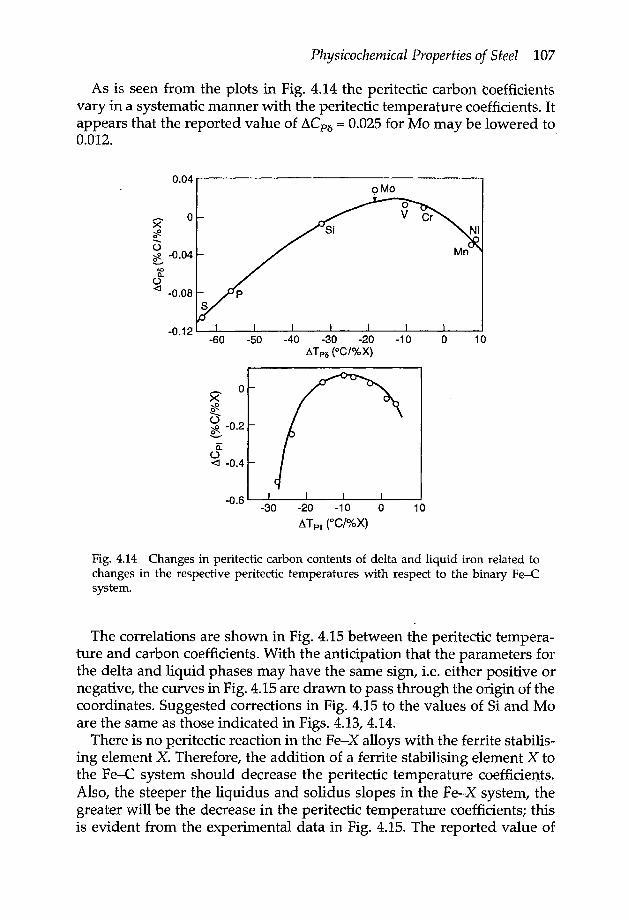
Physicochemical Properties of Steel 107
As is seen from the plots in Fig. 4.14 the peritectic carbon coefficientsvary in a systematic manner with the peritectic temperature coefficients. Itappears that the reported value of IlCPf) = 0.025 for Mo may be lowered to0.012.
0.04 ...--------------------,oMo
oXeft(3~ -0.04
r.oa,o<J -0.08
-0.12-20 -10 0 10-60 -50 -40 -30
ATPo (OC/%X)
x- 0(fi--ot:, -0.2
0::o<l -0.4
-0.6-30 -20 -10 0 10
ATPI (OC/%X)
Fig. 4.14 Changes in peritectic carbon contents of delta and liquid iron related tochanges in the respective peritectic temperatures with respect to the binary Fe-Csystem.
The correlations are shown in Fig. 4.15 between the peritectic tempera-ture and carbon coefficients. With the anticipation that the parameters forthe delta and liquid phases may have the same sign, i.e. either positive ornegative, the curves in Fig. 4.15 are drawn to pass through the origin of thecoordinates. Suggested corrections in Fig. 4.15 to the values of Si and Moare the same as those indicated in Figs. 4.13, 4.14.
There is no peritectic reaction in the Fe-X alloys with the ferrite stabilis-ing element X. Therefore, the addition of a ferrite stabilising element X tothe Fe-C system should decrease the peritectic temperature coefficients.Also, the steeper the liquidus and solidus slopes in the Fe-X system, thegreater will be the decrease in the peritectic temperature coefficients; thisis evident from the experimental data in Fig. 4.15. The reported value of
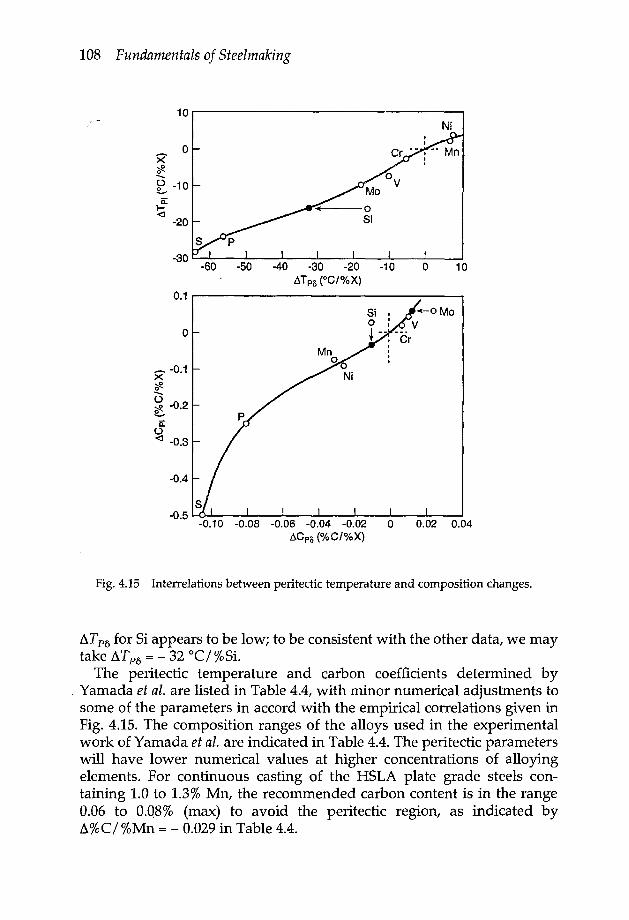
108 Fundamentals of Steelmaking
10~------------------------------~Ni
ox'#E -10
a::~
-30-60 -50 -40 -30 -20 -10 0 10
~T Po (OC/%X)0.1
Si I ~oMo0 I
VI
0 t -- __A
: Cr
_ -0.1X?fl..•.••...0~ -0.2~
a::0<l -0.3
-0.4
-0.10 -0.08 -0.06 -0.04 -0.02 0 0.02 0.04~Cpo (%C/%X)
Fig. 4.15 Interrelations between peritectic temperature and composition changes.
b.T Pb for Si appears to be low; to be consistent with the other data, we maytake l1Tpb = - 32 °C/%Si.
The peritectic temperature and carbon coefficients determined by. Yamada et al. are listed in Table 4.4, with minor numerical adjustments tosome of the parameters in accord with the empirical correlations given inFig. 4.15. The composition ranges of the alloys used in the experimentalwork of Yamada et al. are indicated in Table 4.4. The peritectic parameterswill have lower numerical values at higher concentrations of alloyingelements. For continuous casting of the HSLA plate grade steels con-taining 1.0 to 1.3%Mn, the recommended carbon content is in the range0.06 to 0.08% (max) to avoid the peritectic region, as indicated byb.%C/%Mn = - 0.029in Table 4.4.

Physicochemical Properties of Steel 109
Table 4.4 Peritectic temperature and composition parameters in accord with the curves inFig. 4.15
t1°C/%X t1%C/%X
Alloying Composition f1Tpl sr., t1Cp1 ACPbElement range, wt.%
Cr <1.5 -3 -5 +0.022 +0.006Mn <1.5 +3 +7 -0.085 -0.029Mo <1.5 -10 -18 +0.055 +0.012Ni <3.5 +4 +9 -0.082 -0.027P <0.05 -24 -56 -0.250 -0.080S <0.03 -28 -64 -0.500 -0.105Si <0.6 -16 -32 -0.035 -0.010V <1.0 -6 -11 +0.045 +0.010
The phase boundaries in the peritectic region of the Fe-C-X alloys,projected on the Fe-C-X composition diagram, are shown schematically inFig. 4.16 for alloys where X is: (a) ferrite stabiliser and (b) austenite sta-biliser. In the Fe-C-Mn (or Ni) system, the peritectic reaction occurs at allcompositions between the peritectic regions of the binaries Fe-C and Fe-Mn (Ni) systems. In the Fe-C alloys with ferrite stabilisers, the peritecticreaction will not occur beyond a certain concentration of the alloyingelement X as shown in FIg. 4.16a. This limiting case applies only to highalloy steels.
4.3.2c Liquidus temperatures of low alloy steelsThe liquidus temperatures of low alloy steels are derived from the binaryFe-X systems on the assumption that the coefficients a = 11 T / %X areadditive in their effects on the melting point of iron.
Below 0.5% C, where the solidification begins with the formation ofdelta (0) iron, the following equation would apply
Liquidus T(OC) = 1537 - 73.1[%C]+ ~a[%X] (4.32)
For the carbon contents within the range 0.5 to 1.0% C, where thesolidification begins with the formation of gamma (y) iron, the followingequation is recommended.
Liquidus T(OC) = 1531 - 61.5[%C]+ :l:a[%X] (4.33)
The same coefficients a. are used in both equations.
Alloying element X Coefficient u, °C/ %X
Al -2.5.-Cr -1.5Mn -4.0Mo -5.0

110 Fundamentals of Steelmaking
(a) x: Ferrite stablllser
1xeft.
o(b) X: Austenite stabiliser
1xeft.
o %C~
Fig.4.16 Phase boundaries in the peritectic region of the Fe-C-X alloys projected onthe composition diagram.
Alloying element X
NiPSiSV
Coefficient U, °C/ %X
-3.5-30.0-14.0-45.0-4.0
4.3.3 IRON-OXYGEN SYSTEM
The thermodynamics of the iron-oxygen system was studied in detail byDarken and Gurry.16 Fig. 4.17 gives the temperature-composition phasediagram for a total pressure of one atmosphere. There are two characteris-tic features of this system. Oxygen is soluble in iron to a limited extent

Physicochemical Properties of Steel 111
only; at the eutectic temperature 1527°C,the maximum solubility is 0.16%0, above which a liquid oxide phase containing 22.6% 0 is formed. Thesecond characteristic feature is the formation of wustite which has a vari-able composition and is not stable below 560°C. The stoichiometric ferrousoxide does not exist and wustite in equilibrium with iron has the composi-tion corresponding to about Fea.9sO within the temperature range 800-1371°C(melting temperature). That is, wustite is deficient in iron cationsand electroneutrality is maintained by the presence of some trivalent ironcations together with the divalent iron cations in wustite. Within thewustite phase, the ratio Fe3+ /Fe2+ increases with an increasing partialpressure of oxygen. Although magnetite in equilibrium with wustite hasthe stoichiometric composition Fe304, in the presence of haematite themagnetite becomes deficient in iron with an increasing temperature.
Jiq.-Ffl
\ "f'· 'd\ Iq.OXI a
1·5'·0
uo
1-013
•..~ 1200:lto-4:0:::l.IJQ.. 1000l:IJJto-
wustlte niagnatitcz
haczmatitczmagncztltcz
a-Fa • magncztitcz
20 40wt_%
Fig. 4.17 Iron-oxygen phase equilibrium diagram between FeO and Fe203 com-positions, based mainly on the data of Darken and Curry=: broken lines in singlephase regions are oxygen isobars in bar.

112 Fundamentals of Steelmaking
The solubility of oxygen in high-purity zone-refined iron was deter-mined by Turkdogan et al.17.18; this was later confirmed by the work ofKusano et al.)". Iron side of the Fe-O phase diagram is shown in Fig. 4.18.At about 900°C, iron (a or y) in equilibrium with wustite contains about 2ppm O. At the peritectic invariant (1390°C) y-iron containing 28 ppm 0 isin equilibrium with D-iron and liquid iron oxide. In ()-iron equilibratedwith liquid iron oxide, the oxygen content increases from 54 ppm at1390°C to 82 ppm at the eutectic temperature 1527°C.
1600~--------------------------------Liquid
6L~~ 1200Q;0-E~
'Y+ liquid oxide
'Y+ wustite
1000
a + wustite
800~----~----~------~----~----~o 20 40 60Oxygen (ppm)
80 100
Fig. 4.18 Iron side of the iron-oxygen phase diagram. From Refs. 17,18.
Subsequent to earlier studies by various investigators, Taylor and Chip-man-? made the most reliable measurement of the oxygen solubility inliquid iron in equilibrium with essentially pure liquid iron oxide at tem-peratures of 1530-1700°C. In a later study, Distin et al.21 extended thesolubility measurements up to 1960°C. These two sets of experimentaldata plotted in Fig. 4.19 are represented by the equation
I [010] 63T80 + 2.765og 10 sat. = - . (4.34)
Numerous other solubility measurements made are in general accord withthe data in Fig. 4.19. The oxygen content of liquid iron oxide inequilibrium with liquid iron decreases with an increasing temperature asgiven below and reaches the stoichiometric composition (22.27%) at about2000°C.

Physicochemical Properties of Steel 113
Temperature °C1527 (eutectic)178518801960
%0 in iron0.160.460.630.81
%° in liquid iron oxide22.6022.4022.3722.32
Temperature (OC)2000 1800 1600
0.8,..------r------...----
0.6
o(fl.'; 0.4o..
0.2
o~---~---~----~4.4 4.8 5.2
104fT (K-1)5.6
Fig. 4.19 Solubility of oxygen in liquid iron: (e) Taylor and Chipman, (0) Distin et al.
In a recent critical assessment of all the experimental thermochemicaldata on the iron-oxygen system, the author derived the following freeenergy equations.P
lh02(g) = [0]
K = [%Olfo(P02)1/2
at 1 mass % 0, aGo = - 115,750 - 4.63T J (1800-2200K)
where the activity coefficient logJo = - 0.10[%0]
Fe(l) + [0] = FeO(I)
AGo = - 109,710 + 45.89T J (1800-2500K)
Fe(l) + lh02(g) = FeO(l)
AGo = - 225,460 + 41.26T J (1800-2200K)
(4.35)
(4.35a)
(4.35b)
(4.35c)
(4.36)
(4.36~)
(4.37)
(4.37a)

114 Fundamentals of Steelmaking
4.3.4 IRON-SULPHUR SYSTEM
The iron-sulphur phase equilibrium diagram is given in Fig. 4.20. Thesolubility of sulphur in solid iron was determined by Rosenqvist andDunicz23 and Turkdogan et aZ.24; the iron side of the iron-sulphur systemthus evaluated is shown in Fig. 4.21. There is a peritectic invariant at1365°C where the equilibrium phases are: y-iron with 0.050 percent 5,c-iron with 0.18 percent 5 and liquid containing 12 percent S. At theeutectic invariant 988°C,y-iron in equilibrium with the liquid phase con-tains 0.012percent S.
1600
1500
1400
1300
o 1200•LtJa:::. 1'00J0-ela:hJQ..
~ 1000wt-
900
800
700
SULPHU R, wt. '-5 10 15 20 25 30 35 40 45 50I I I I I I I I I
1537-\
~,1365- <,
~~(/) N~ en"- ~II
\ • •1190·
\ ~,
/I \ ,
\ ' \~ \
V \\,\
988- ,I I
44(311 I
91:3- II.
(FeS) ,,I II• II
769- I II--- ---- 10--- -- ---- IIIMAGN. TRANSF. ,, II
I 697- IIr---.~, 'ATM. II
I 11uII600 a 10 20 30 40 50 60 70
SULPHUR, IN ATOM ~
Fig.4.20 Iron-sulphur phase equilibrium diagram.

Physicochemical Properties of Steel 115
4.3.5 IRON OXYSULPHIDE
Hot-shortness of steel is an old metallurgical problem that has been asubject of research for several decades. It has long been recognised that thepresence of oxygen and/ or sulphur in steel is the primary cause of hot-shortness, which usually occurs within the temperature range 900 to1100°C. The hot-short range of course varies with the type of steel, par-ticularly with the %Mn/ %Sratio in the steel. From the phase diagram (Fig.4.21) it is predicted that pure iron-sulphur alloys containing less than 100ppm S should not be subject to hot-shortness during the entire hot-working operation because no liquid sulphide can form. On the otherhand, an iron containing 200 ppm S will produce a small quantity of aliquid phase as its temperature falls below 1100°C. In the presence ofoxygen, a liquid oxysulphide will form in y-iron at lower sulphur contentsand temperatures. As shown in Fig. 4.22, the sulphur content of iron inequilibrium with wustite and liquid oxysulphide reaches a maximum of143 ppm at 1200°C; this is about one half of that in purified iron. At theternary eutectic invariant (913°C) the sulphur in solution in equilibriumwith wustite and liquid oxysulphide is 70 ppm.
1600
1000
ucum~ J------- I
I-Fe ~~LIOUID
-----= z--; 1365-
/ 0.050\ 5I
0.18' S
r-Fe / y - Fe + LIQUID
/I 98S--
I y-Fe+ FeS913·J
1500
f' 1400~~ 1300~a::~ 1200lE
""••• 1100
900o 0.05 0.10
SULPHUR, wt. ex.0.15 0.20
Fig. 4.21 Iron side of the Fe-S phase diagram. From Refs. 23,24.
There is an extensive liquid miscibility gap in the system Fe-S-O, asshown in Fig. 4.23 based on the work of Hilty and Crafts= and of Bog andRosenqvist.V The isothermal sections in Fig. 4.24 show the phaseequilibria at 1100 and 1400°C.
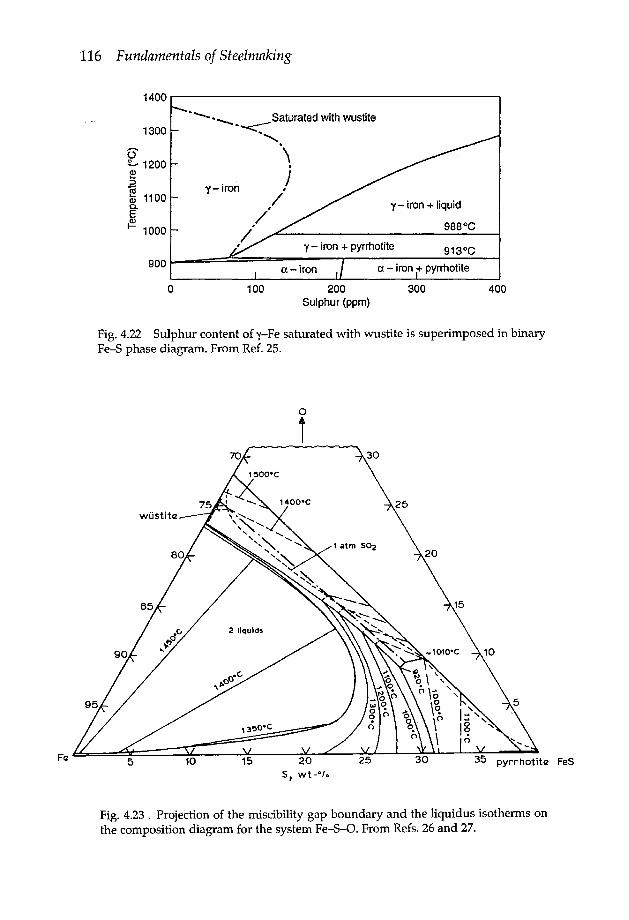
116 Fundamentals of Steelmaking
1400r-----------------------------------------~- ---.................. Saturated with wustite..~ -,
'\.J
/'/'
/.
,,(-iron
y - iron + liquid
988°C
13006~ 1200~.a~ 11000-E~ 1000
913°C900~~==========-------,------------~~--~a - iron a - iron + pyrrhotite
"(- iron + pyrrhotite
o 100 200Sulphur (ppm)
300 400
Fig. 4.22 Sulphur content of y-Fe saturated with wustite is superimposed in binaryFe-S phase diagram. From Ref. 25.
Fa FeS
Fig. 4.23 . Projection of the miscibility gap boundary and the liquidus isotherms onthe composition diagram for the system Fe-S-O. From Refs. 26 and 27.

Physicochemical Properties of Steel 117
tron
Pyrrhotite
(0) IIOQoe
Sulphurwt. 0/0
Oxygenwt. %
Magnetite
Iron
Sulphurwt. %
Pyrrhotite
Fig.4.24 1100° and 1400°C isotherms for Fe-S-O system; y, gamma iron; W, wustite;P, pyrrhotite; 11' liquid oxysulphide; 12/ liquid metal.
4.3.6 IRON-MANGANESE OXYSULPHIDE
The addition of manganese to steel is a well-known remedy to hot-:.,shortness by virtue of forming solid oxides and sulphides. The solubilityof MnS in y-iron determined by Turkdogan et al.24 is represented by
MnS(s) = [Mn] + [5]

118 Fundamentals of Steelmaking
log [%Mn][%S] = - 9°iO + 2.93 (4.38)
./ the univariant equilibria in the Fe-Mn-S-O system in the presence ofy-iron and Mn(Fe)O phases, derived by Turkdogan and Kor25 are shownin Fig. 4.25. For manganese contents in the region above the univariant j,no liquid phase is present; below this curve, liquid oxysulphide forms.That is, as long as the steel contains Mn(Fe)O and Mn(Fe)S in equilibriumwith iron, a liquid oxysulphide may form somewhere between 900° and1225°C, depending on the concentration of manganese in solution in steel(in the absence of other alloying elements), e.g. for 10 ppm Mn 900°C andfor - 10 percent Mn, - 1220°C. In the absence of oxygen however, a verysmall amount of manganese (e.g. 20 ppm Mn at 1000°Cand 400 ppm at-1300°C)is sufficient to suppress the formation of liquid sulphide.
16Mn - S - 0
100
810
0--ro Q)
0 0 2:~ ~
0c ~:2 'Y+ Oxi. + 11
.e~ ~0 0.1
0
.5 -8 ~.-.a: cFe - Mn - 0 0.01 ~
-16 0.001
-20 '--_----'- __ ----'-__ ---" __ ----1800 1000 1200 1400 1600
Temperature (OC)
Fig. 4.25 Univariant equilibria in Fe-Mn-S-O system in the presence of y-Fe andMn(Fe)O phases. From Ref. 25.
j) ,,(-Fe,Oxi., 'MnS', 11m) y-Fe, Oxi., 'MnS', 'PeS'n) y-Pe, Oxi., 'FeS', 11p) y-Fe, Oxi., 'MnS', 12q) ,,(-Fe,Oxi., II' 12

Physicochemical Properties of Steel 119
4.3.7 ELEMENTS OF LOW SOLUBILITY IN LIQUID IRON
A few elements of low solubility in liquid iron play some role in thesteelmaking technology; a brief comment on the chemistry of such el-ements in liquid iron is considered desirable.
(a) Lead:The break out of the furnace lining is often blamed on the presence of
lead in the melt. Small amounts of metal trapped in the crevices of thelining are likely to get oxidised subsequent to tapping. The lead oxidetogether with iron oxide will readily flux the furnace lining, hence widen-ing the cracks which ultimately leads to failure of the lining. The solubilityof lead in liquid iron is sufficiently high that in normal steelmaking prac-tice there should be no accumulation of lead at the bottom of the melt,except perhaps in the early stages of the melting of lead-containing scrap.
At steelmaking temperatures the vapour pressure of lead is about 0.5atm and the solubility-" in liquid iron is about 0.24 percent Pb at 1500°Cincreasing to about 0.4 percent Pb at 1700°C.The free-machining leadedsteels contain 0.15 to 0.35percent Pb. Evidently lead added to such steels isin solution in the metal prior to casting and precipitates as small leadspheroids during the early stages of freezing.
(b) Calcium:The boiling point of calcium is 1500°Cand its solubility in liquid iron is
very low. Sponseller and Flinn-? measured the solubility of calcium in ironat 1607°Cfor which the calcium vapour pressure is 1.69atm. Under theseconditions at 1607°C,0.032percent Ca is in solution. That is, the solubilityat 1 atm pressure is 189ppm Ca. They also investigated the effect of somealloying elements on the solubility; as seen from the data in Fig. 4.26,C, Si,Ni and Al increase markedly the calcium solubility in liquid iron. In meltssaturated with CaC2 the solubility of calcium of course decreases with anincreasing carbon content.
(c)Magnesium:The solubility of magnesium in iron-carbon alloys determined by Trojan
and Flinnw, is shown in Fig. 4.27 as functions of temperature and carboncontent. Subsequently, Guichelaar et al.3I, made similar measurementswith liquid Fe-Si-Mg alloys. Their data have been used in numerousstudies to derive the equilibrium relations for the solubility of magnesiumin liquid iron. However, there are some variations in the interpretation ofthe above mentioned experimental data. A reassessment of these experi-mental data is considered desirable.
The equilibrium relation for the solubility of Mg (in units of mass %atrrr ") is represented by
Mg(g) = [Mg]

120 Fundamentals of Steelmaking
0.3.-----------------.
' •.~ CaC2 - satu.O~--' ------.~•.---~---~---~o 2.5 5.0 7.5
Alloying elements (wt. %)
Fig. 4.26 Effect of alloying elements on the solubility of liquid calcium in liquid ironat 1607°C, corresponding to 1.69 atm pressure of calcium vapour. From Ref. 29.
0.2';€~cao
0.1
10.0
8.7· 5.5 3.2 atm. Mg vapour
3 4Carbon (wt.%)
5
Fig. 4.27 Solubility of magnesium in liquid iron-carbon alloys at indicated tempera-tures and pressures of magnesium vapour. From Ref. 30.
K - [%MglfMgM - Pg Mg
where fMg is the activity coefficient affected by the alloying elements. Inthe experiments with the Fe-C-Mg melts coexistent with liquid Mg, thelatter contained less than 2 percent Fe, therefore, the Mg vapour pressureprevailing in the reactor would be essentially the same as that for pure Mgfor which the following is obtained from the data of Guichelaar, et ale
(4.39)

Physicochemical Properties of Steel 121
o 6730log P Mg(atm) = - --y + 4.94 (4.40)
In the experiments with the Fe-Si-Mg alloys, the Mg-rich phase con-tained relatively large concentrations of Fe and Si. In addition todetermining the miscibility gap in this system, Guichelaar et al., also mea-sured the equilibrium vapour pressure of Mg in the system by the 'boilingmethod.'
These experimental data are presented in Fig. 4.28 as a plot of log([%Mg] / PMg) versus the concentration of C or Si in the iron-rich phase. Forthe Fe-C-Mg system, there is a linear relation; for the Fe-Si-Mg system, alinear relation holds up to about 18 percent Si. From the slopes of the lines,the following interaction coefficients are obtained:
e~g = - 0.15 and e ~g = - 0.046
0.4 r----------------.;..._~
o
..0.8
.b
Q GraphiteYo saturatedlibPo"'d' ~
I 10 Fe .. C - Mg'61oc"9 1260rra:
, 1:;:(13431/ Y ~/r 1427
'C) I 0) -04:E ~ .~c.0>.Q
-1.2
o 10 20C Oi Si (mass%)
30
Fig. 4.28 Solubility of Mg in liquid Fe-C and Fe-Si alloys, derived from data in Refs.30 and 31.
The intercepts of the lines with the ordinate axis at %C and %Si ~ 0 givethe equilibrium constant KMg for pure liquid iron (undercooled). The tem-perature dependence of KMg shown in Fig. 4.29 is represented by

122 Fundamentals of Steelmaking
log KMg = 41iO - 3.698 (4.41)
which gives the following free energy equation for the solution of Mgvapour in liquid iron:
Mg(g) = [Mg] (1%)AGs = -78,690 + 70.80 T J mol-1
(4.42)
(4.42a)
1450Temperature (OC)
1400 1350 1300
01~~ -1.2.Q
-1.4 '-5-.8----6--.0----6"--.2----6.1.-4-----'
104rr (K-1)
Fig. 4.29 Temperature dependence of the quilibrium constant for the solubility ofMg in liquid iron (undercooled), %Mg atm+.
For the quaternary melts Fe-C-Si-Mg, the activity coefficient of Mg maybe approximated by the product
f - fe x fSiMg- Mg Mg
The solubility of Mg in liquid Fe-C-Si-Mg alloys calculated from theabove equations agrees well with the measured values reported by Trojanand Flinn.
In the experiments by Engh et al.32 the Mg solubility in graphite-saturated liquid iron at 1260°Cwas measured by equilibrating the liquidFe-C-Mg alloys with liquid Pb-Mg alloys. The vapour pressure of Mg inthe two-liquid system was derived from equation (4.40) and the knownactivity coefficient of Mg in the Pb-Mg phase. The ratio %Mg/PMg(atm) =
0.553 they obtained for graphite-saturated iron compares well with 0.525determined by Trojan and Flinn. Noticeably higher values were reportedby other investigators: 0.80 by Speer and Parlee= and 0.70 by Irons andGuthrie.34

Physicochemical Properties of Steel 123
4.4 SOLUBILITIES OF CAD, CAS, MGD AND MGS IN LIQUID IRON
There are large variations in the experimental data for the solubilities ofoxides and sulphides of calcium and magnesium in liquid iron as evidentfrom the data listed in Table 4.5 for 1600°C.For low concentrations of Ca,Mg, 0 and S in liquid iron, their activity coefficients fi will be essentiallyunity, therefore the solubility products for unit activities of oxides andsulphides are given in terms of mass percentages of the solutes.
Table 4.5 Experimentally determined solubility products of CaO, MgO, CaS and MgS arecompared with those calculated from the thermochemical data for 1600°C.
KMgS = [%Mg][%S]
Experimental Ref.
9.0 x 10⁻⁷ 371.0 x 10⁻¹⁰ 382.5 x 10⁻⁹ 394.5 x 10⁻⁸ 405.5 x 10⁻⁹ 412.0 x 10⁻⁶ 377.5 x 10⁻⁶ 421.7 x 10⁻⁵ 377.9 x 10⁻⁸ 393.2 x 10⁻⁷ 405.9 X 10⁻² 37
CalculatedSolubility product
Kcao = [%Ca][%O] 6.0 X 10⁻¹⁰
KMgO = [%Mg][%O] 2.4 X 10⁻⁹
KCas = [%Ca][%S] 2.0 X 10⁻⁹
1.2 X 10⁻⁴
The solubility products measured by Nadif and Gatellier=? are muchhigher than those of other investigators and several orders of magnitudegreater than those calculated from the free energy data and solubilities ofCa(g) and Mg(g) in liquid iron already discussed.
It should be noted that the free energy data used for CaO and MgO arethose determined recently by Gourishankar .ei al.35. using the Knudseneffusion technique. They found that for the reactions
Ca(g) + ~02(g) = CaO(s)
Mg(g) + Ih02(g) = MgO(s)
(4.44)
(4.45)
the standard free energy data given in JANAF Tables.w are in error andshould be corrected as follows:
AGT = ACT (tabulated) + 33 k] mol-1 CaO
8Gr = ~GT (tabulated) - 34 k] mol? MgO
(4.44a)
(4.45ay-
The experimental data of Gourishankar et al. for reactions (4.44)and (4.45)may be represented by the following free energy equations.

124 Fundamentals of Steelmaking
For CaO: i1Gy = -753,880 + 192.5T J (1900-2100 K) (4.46)
For MgO: ACT = -759,380 + 202.6T J (1800-2100 K) (4.47)r
These equations are used in the free energy data given in Table 1.1 ofChapter 1.
For the reaction equilibrium
Mg5(s) = [Mg] + [5]
K = [%Mg][%S] f~g f~
I K - 17,026 5 161og -- -T- + .
(4.48)
(4.48a)
(4.48b)
where the activity c~efficients f'ivrg and f~ ~ 1 for low concentrations ofMg, Sand C dissolved in iron. For graphite-saturated liquid iron at 1260°Cwith 4.4% C, for which f'ivrg = 0.22 and f~ = 4.4, the calculated solubilityproduct is [%Mg][%S]= 1.2 x 10⁻⁶; this agrees well with the experimentaldata of Engh et al.32 plotted in Fig. 4.30. Some of the data points lyingabove the calculated line are indicative of the presence of a small quantityof dispersed particles of MgS in the melt; the same point of view wasexpressed by Engh et al. in their paper.
10-2
8
6
4
2
~~10-3ft:II
:?!vi 8
6
4
2
10-4
10-4 2 4 6 8 10-3 2 4 6 8 10-2
Mg, Mass %
Fig. 4.30 Sulphur and magnesium contents of carbon-saturated liquid iron at1260°C. From Ref. 32. The line is calculated for MgS saturation, i.e. [%Mg)[%S] = 1.2 xlQ-6.

Physicochemical Properties of Steel 125
4.5 SOLUBILITIES OF NITRIDES AND CARBIDES IN SOLID AND LIQUID IRON
For steel compositions of practical interest, the nitrides and carbides donot form in liquid steel. These compounds precipitate during cooling ofthe solidified steel along the austenite grain boundaries. These precipitatesmarkedly influence the mechanical properties of steel both at room tem-perature and hot working temperatures.
Representing the nitride and carbide by XY nr the reaction to be con-sidered is
[X] + n[Y] = XYn (4.49)
where Y is nitrogen or carbon, and X the alloying element in steel. Theisothermal state of equilibrium is represented by the solubility product
K = [%x][% Y]n (4.50)
where the temperature dependence of the equilibrium constant K is of theform
AlogK=- T + B (4.51)
For the elements dissolved in steel, when the product [%X] [% Y]n ex-ceeds the equilibrium solubility product K, the nitride or carbide willprecipitate, if the reaction kinetics are favourable.
Example:Calculate the temperature at which AIN and Nb(C,N) begins to precipitateunder equilibrium conditions in steel containing in solution 0.02% AI,0.04% Nb, 0.08% C and 0.006% N.For AIN:
6770log [0.02 x 0.006] = - ----y- + 1.03 = - 3.921
:. T = !.~~ = 1367°K == 1094°C
9450 .log [0.04X 0.080.7 x 0.0060.2] = - ----y- + 4.12 = - 2.61
:. T = ~~i~= 1404°K == 1131°C
If there is equilibrium precipitation of AlN and Nb(C,N) in homoge-.nised austenite, the concentrations of AI, Nb and N in solution willdecrease with a decreasing temperature as shown in Fig. 4.31a. On theother hand, if Al and Nb are concentrated at the austenite grain

126 Fundamentals of Steelmaking
boundaries as a consequence of solute microsegregation during solidifica-tion, the nitride and carbonitride precipitation under equilibrium condi-tions will begin at higher temperatures, as shown in Fig. 4.31b. Thissubject will be discussed in more detail in Chapter 10.
1.2?fi.enen<!
0.05 :E 1.0en(a) w
c:Nb
«0.04 0 0.8~ z
:::>en 0en<{ aJ
~ Z'Z.. 0.03 ;{ 0.60 0:i= (!]
<{ t-o: «r- 0.02 z 0.4z 0w ~oz «0 a:(.) f-
0.01 Z 0.2woZ0o
0.00 0.0900 1000 1100 1200 1200 1300 1400 1500
TEMPERATURE,oC TEMPERATURE,oC
Fig. 4.31 Equilibrium precipitation of A1N and Nb (C,N) in austenite during cool-ing: (a) for homogenous solute distribution in steel, (b) for solutes segregated toaustenite grain boundaries.
The reassessed values of the solubility products of carbides and nitridesin ferrite, austenite and liquid iron are given in Table 4.6, reproduced fromthe author's previous publication+" The temperature dependence of thesolubility product K; in austenite is shown in Fig. 4.32.
4.6 SURFACE TENSION OF LIQUID IRON ALLOYS
The experimental data for the surface tension of liquid iron and its binaryalloys have been compiled recently by Keene.e+ For purified liquid iron,the average value of the surface tension at temperature T(OC) is repres-ented by
aPe = (2367± 500) - O.34T(OC), mNm-1

Physicochemical Properties of Steel 127
10-1
5
2
10-2
5
2
10-3
5
c"> 2~X 10-4
~II 5
C"-~2
10-5
5
2
10-6
5
2
10-7900 1000 1100 1200 1300 1400
TEMPERATURE,OC
Fig. 4.32 Equlibrium solubility products of carbides and nitrides in austenite.
Keene derived the following. weighted average limiting values of o(mNm-l) for dilute solutions of X in Fe-X binary alloys.
Fe-C: Virtually no effect of C on O'F~
Fe-Ce: o = O'Fe - 700[%Ce]Fe-Mn: a = aFe - 51[%Mn]; aa/ aT = -0.22Fe-N: a = aFe - 5585[%N]Fe-P: a::; aFe - 25[%P]Fe-S: (Discussed later)Fe-Si: 0 = aPe - 30[%Si]; aol aT = - 0.25Gibbs' exact treatment of surface thermodynamics gives, for fixed unit
surface area and constant temperature and pressure,

128 Fundamentals of Steelmaking
Table 4.6 Reassessed values of the solubility products of carbides and nitrides in iron
Solubility product log K; logKa logKl
[%AI][%N] 6,770+ 1.03
8,790+ 2.05 12'i50 + 5.58- -T- - -T-
[%BJ[%N]13,970 + 5.24
14,250 + 4.6110,030 + 4.64- -T- - -y- - -r-
[%Nb][%N]10,150 + 3.79 12'i70 + 4.91- -r-
[%Nb ][%C]O.877,020 + 2.81
9,830+ 4.33- -T- - -T-
[%Nb ][%C]07[%N]o.29,450 + 4.12
12,120 + 5.57- -T- - -T-
[%Ti][%N]15,790
+ 5.4018,420 + 6.40
17,040+ 6.40- -T- - -T- - -T-
[%Ti][%C]7,000
+ 2.7510,230 + 4.45
6,160 + 3.25- -T- - -T- - -T-
7,700+ 2.86
9,720+ 3.90[%V][%N] - -T- - -y-
6,560+ 4.45
7,050+ 4.24[%V][%C]O.75 - -T- - -r-
kdo = - RT ~ I', d(ln ai)
i(4.52)
where ri is the surface excess concentration of the ith component and a, itsactivity. For a ternary system, equation (4.52) is reduced to
do = - RT ( r2d (In a2) + r3d (In a3)) (4.53)
Since carbon dissolved in iron has virtually no effect on the surface tensionof liquid iron, for the ternary system Fe-C-S, equation (4.53) is simplifiedto
do = - RT Tsd(ln as) (4.54)
As shown, for example by Kozakevitch.s" the addition of carbon to iron-sulphur alloys lowers the surface tension (Fig. 4.33). In the lower diagram,the plot of surface tension against the activity of sulphur illustrates thatthe apparent effect of carbon on the surface tension results from the effectof carbon on the activity coefficient of sulphur dissolved in iron.
As is seen from the compiled data in Fig. 4.34,* the surface tension dataof various investigators for the Fe-S melts are in close agreement. Thepoints read off from the curves in Figs. 4.33 and 4.34 are plotted in Fig. 4.35as 0 versus log as. It is seen that for as > 0.01, 0 is a linear function of log as,
*References to data in Fig. 4.34 are given in a previous publication by the author.w

Physicochemical Properties of Steel 129
S%Isosurface tension curves, mNm-1
1300
c.~ 900c~Q)octl'§ 700en
Sulphur activity
Fig. 4.33 Surface tension of liquid Fe-C-S alloys at 14S0°C. From Ref. 45.
a limiting case for almost complete surface coverage with chemisorbed S.The shaded area represents the data of Selcuk and Kirkwood+? for 1200°C.
4.7 DENSITY OF LIQUID STEEL
The temperature dependence of the densities of liquid iron, nickel, cobalt,copper, chromium, manganese, vanadium and titanium are given by thefollowing equations as a linear function of temperature in °C in gcm=:
Iron: 8.30 - 8.36 x 10⁻⁴TNickel: 9.60 - 12.00 x 10⁻⁴TCobalt: 9.57 - 10.17x 10⁻⁴TCopper: 9.11 - 9.44 x 10⁻⁴TChromium: 7.83 - 7.23 x 10⁻⁴TManganese: 7.17 - 9.30 x lO-4TVanadium: 6.06 - 3.20 x 10⁻⁴TTitanium: 4.58 - 2.26 x 10⁻⁴T

130 Fundamentals of Steelmaking
2000~--------------------------~
1800
_1600"Ezg 1400co·enc; 1200o
~::J(J) 1000
800
Fig. 4.34 Surface tension of Fe-S alloys at 1550-1600°C.
•
The specific volume and density of liquid iron-carbon alloys are given inFig. 4.36 for various temperatures. It should be noted that the density ofthe liquid in equilibrium with austenite does not change much over theentire liquidus range.
4.8 VISCOSITY
The viscosity is a measure of resistance of the fluid to flow when subjectedto an external force. As conceived by Newton, the shear stress e, i.e. forceper unit area, causing a relative motion of two adjacent layers in a fluid isproportional to the velocity gradient du / dz, normal to the direction of theapplied force
duc=l1dz
where the proportionality factor Y) is viscosity of the fluid (liquid or gas).Viscosity unit: poise (g em-Is-I) == O.lN s m-2•
From theoretical considerations and experimental data, Andrade-? de-rived the following relation for viscosities of liquid metals at their meltingtemperatures.

Physicochemical Properties of Steel 131
2000
1800
1600
-IE2: 1400Ec...gl!~G) 1200u~~en
1000
800
600-3
(Fe-C·S)14500C
-2 -1 oLog as
Fig.4.35 Surface tension of Fe-S, Fe-C-S and Fe-C-Si-S alloys related to sulphuractivity; as ~ %5 when %C and %S ~ o.
0.155,...-------------------,6.5
6.6
6.7~o
6.8 :96.9~
c7.0 ~
7.1
7.2
Oi10.150..8-Q)
E:lg 0.145oot::·0Q)a..
en 0.140
o 2 3 4 5wt. (0/0)
" I I I I Io 2 4 6 8 10 12 14 16 18 20
Carbon concentrationsl atom %
Fig. 4.36 Density of iron-carbon alloys. From Ref. 48.

132 Fundamentals of Steelmaking
II = 5.4 x lO-4(MT m)1/2 V-2/3 (4.55)
where M is the atomic mass in g and V = M/ P the molar volume.,. The coefficients of viscosity of iron, cobalt, nickel and copper measuredby Cavaliers? are given in Fig. 4.37. In these experiments Cavalier was ableto supercool metals 140°-170°C below their melting points and as seenfrom the data, there are no discontinuities in the viscosity coefficient vstemperature lines extending below the melting temperatures of the metals.The viscosities of Fe-C alloys determined by Barfield and Kitchener= aregiven in Fig. 4.38. In the iron-carbon melts the coefficient of viscosity isessentially independent of composition within the range 0.8 to 2.5 percentC; above 2.5 percent. C, the viscosity decreases continuously with an in-creasing carbon content.
C\lE -t25t----T-~-I·'#---+-----t------fU)Z..-S~~ -1.50t----~+-----4-----,.tIC---t------4
Cu1.75 ""-- ..1....- .....0...- --'
4 5 6 7 81Q4/T K-1
Fig. 4.37 Temperature dependence of viscosity coefficient of liquid iron, cobalt,nickel and copper. From Ref. 50.
4.9 MASS DIFFUSIVITIES IN SOLID AND LIQUID IRON
The diffusivity is an exponential function of temperature,
D = Do exp(-E/R7) (4.56)
where Do is a constant for a given solute and E the activation energy(enthalpyjfor the diffusion process.

Carbon wt %
Physicochemical Properties of Steel 133
(\j'
EIIIZ
ci-; -1.2 \-----T#-t--::-r--T.-:-:=--t------i-i
OJ.Q
-1.4 '-----"-------'------:-"'::"""5.0 5.5 6.0 6.5
1rr x 104 K-1
Fig. 4.38 Composition and temperature dependence of the viscosity coefficient ofiron-carbon melts. From Ref. 51.
The general trend in the temperature dependence of solute di£fusivity insolid iron is shown in Fig. 4.39. The interstitial elements, e.g. 0, N, C, B,Hhave diffusivities much greater than the substitutional elements. Becauseof larger interatomic spacing, the diffusivities of interstitials in bee-iron aregreater and the heats of activations (-8SkJ) are smaller than those in thefcc-iron with E - 170kJ. With the substitutional elements, the heat of ac-tivation is within 210 to 250 k] for bee-iron and within 250 to 290 k] for fcc-iron.
In liquid iron alloys, diffusivities of elements are within 10-5 to 10-4
cm2s-1 with E within 15 to 50 k].Some solute diffusivity data for liquid iron and iron-carbon alloys are
given in Table 4.7.
4.10 ELECTRICAL" CONDUCTIVITY
The electrical conductivity A.in the units of Q-1cm-1 is the reciprocal of the!electrical resistivity. The electrical conductivity of liquid low alloy steel isabout A= 7140 Q-1cm-1 at steelmaking temperatures.

134 Fundamentals of Steelmaking
10-6
cJQ)
~(\J
E0
>=' 10-7I-sCi5:::>u..u..is
10-10
10-11
6 7 8104{f, K-1
9 10 II
Fig. 4.39 Range of diffusivities of interstitial and substitutional elements in bee andfcc iron.
4.11 THERMAL CONDUCTIVITY
From Fick's law, the thermal conductivity is defined by
K- Q- - aT/ ax (4.57)
where Q is heat flux, energy per unit area per unit time, aT/ax the tem-perature gradient normal to the direction of heat flow and K the thermalconductivity.

Physicochemical Properties of Steel 135Table 4.7 Selected solute diffusivities in liquid Fe-C alloys .
Diffusing Concen- Medium Temp. D Do Eelement tration range cm-sec-! cm2sec-1 kJ
mass % DC
C 0.03 Fe 1550 7.9x1Q-sC 2.1 Fe 1550 7.8x1Q-sC 3.5 Fe 1550 6.7x1Q-sCo Dilute sol. Fe 1568 4.7xlD-sCo Dilute sol. Fe 1638 5.3x1Q-sFe Fe-4.6%C 1240-1360 4.3x1Q-3 51Fe Fe-2.5%C 1340-1400 1.0x10⁻² 66H Dilute sol. Fe 1565-1679 3.2x1Q-3 14Mn 2.5 gr.satu.Fe 1300-1600 1.93xlO-4 24N Dilute sol. Fe 1600 1.1xl0-4N Dilute sol. Fe-0.15%C 1600 5.6x1Q-S0 Dilute sol. Fe 1600 5.0x1Q-sP Dilute sol. Fe 1550 4.7x1Q-sS <0.64 gr.satu.Fe 1390-1560 2.8x1Q-4 315 -1 Fe 1560-1670 4.9xlO-4 36Si <2.5 Fe 1480 2.4x1D-sSi <1.3 Fe 1540 3.8x1Q-sSi 1.5 gr.satu.Fe 1400-1600 2.4x 10⁻⁴ 34
Units of K: J cm-1s-1K-l == 10-2kg m s-3K-l == 10-2Wm-1K-l
The effect of temperature on the thermal conductivities of iron, carbonsteels and high alloy steels are shown in Fig. 4.40.
80
..-~..-E 64S~.....,.s;
+=0 48:::J-0C00«SE 32~Q).cI-
·16 0 200 400 600 800 1000Temperature °C
Fig. 4.40 Temperature dependence of thermal conductivity of purified iron and ironalloys.

136 Fundamentals of Steelmaking
4.12 THERMAL DIFFUSIVITY
Analogous to mass diffusivity, the thermal diffusivity u is defined as
u= (4.59)
where p is density and C; molar heat capacity. In metals, the electronsmigrate at much faster rates than the atoms; therefore the thermal dif-fusivity is much greater than the mass diffusivity.For low-alloy steels at 1000oe:a ~0.04 cm2s-1D ~ 3 X 10-12 cm2s-1 (substitutional)D ~ 3 X 10⁻⁷ cm2s-1 (interstitial)
REFERENCES
1. G.K. SIGWORTH and J.F. ELLIOTT,Met. Sci., 1974, 8, 298.1a.R.P. SMITH,J. Am. Chem. Soc., 1946, 68, 1163.2. J.F. ELLIOTT,M. GLEISERand V. RAMAKRISHNA,Thermochemisiru for steelmak-
ing, vol. II, Addison-Wesley Publishing Co., Reading, Massachusetts, 1963.3. C. WELLS, Trans. ASM, 1938,26,289.4. J.C. SWARTZ,Trans. AIME, 1969, 245, 1083.5. F. VON NEUMANN and H. SCHENCK,Arch. Eisenhiiiiemo, 1959, 30, 477.6. E.T. TURKDOGANand L.E. LEAKE,]. Iron and Steel Inst., 1955, 179, 39.7. E.T. TURKDOGANand R.A. HANCOCK, ibid, 1955, 179, 155; 1956, 183, 69.8. J. CHIPMAN, R.M. ALFRED,L.W. GOTT, R.B. SMALL,D.M. WILSON, C.N. THOM-
SON, D.L. GUERSNEYand J.C. FULTON, Trans. ASM, 1952, 44, 1215.9. J. CHIPMAN and T.P. FLORIDIS,Acta Met, 1955, 3, 456.
10. N.R. GRIFFING,W.O. FORGENGand G.W. HEALY, Trans. AI ME, 1962, 224, 148.11. S.N. SINGH and K.E. BLAZEK,]. Metals (AIME), 1974, 26(10), 17.12. M.M. WOLF and W. KuRZ, Metall. Transaction B, 1981, 12B, 85.13. A.A. HOWE, Applied Scientific Research, 1987, 44, 51.14. H. YAMADA, T. SAKURAIand T. TAKENOUCHI, Tetsu-to-Hagane, 1990, 76,438.15. M.M. WOLF, in 1st European Conference on Continuous Casting, p. 2.489. Flo-
rence, Italy, Sept. 23-25, 1991.16. L.S. DARKEN and R.W. GURRY,]. Am. Chern. Soc., 1945, 67, 1398; 1946, 68, 798.17. M.T. HEPWORTH, R.P. SMITH and E.T. TURKDOGAN, Trans. Met. Soc. AIME,
1966, 236, 1278.18. J.H. SWISHER and E.T. TURKDOGAN,Trans. Met. Soc. AIME, 1967, 239, 426.19. A. KU5ANO, K. ITO and K. SAND, Trans Iron and Steel Inst. Japan, 1970, 10, 78.20. C.R. TAYLORand J. CHIPMAN, Trans. AIME, 1943, 154,228.21. P.A. DIS1'IN, S.G. WHITEWAYand C.R. MASSON, Can. Metall.Q., 1971, 10, 13.22. E.T. TURKDOGAN,Ironmaking and Steelmaking, 1993, 20, 469.

Physicochemical Properties oj Steel 137
23. T. ROSENQVISTand B.L. DUNICZ, Trans. AIME, 1952, 194, 604;]. Iron and SteelInst., 1954, 176, 37.
24. E.T. TURKDOGAN, S. IGNATOWICZ and J. PEARSON, J. Iron and Steel Inst., 1955,180, 349.
25. E.T. TURKDOGAN and G.J.W. KOR, Metall. Transaction, 1971,2, 1561.26. D.C. HILTY and W. CRAFTS, Trans. AIME, 1952, 194, 1307.27. S. BOG and T. ROSENQVIST,Proc. Natl. Phys. Lab. Symp., 1958, No.9, p. 6B.28. A.E:LoRD and N.A. PARLEE, Trans. Met. Soc. AIME, 1960,218,644.29. D.L. SPONSELLERand R.A. FLINN, Trans. Met. Soc. AIME, 1964, 230, 876.30. P.K. TROJAN and R.A. FLINN, Trans. ASM, 1961, 54, 549.31. P.J. GUICHELAAR, P.K. TROJAN, T. CLUHAN and R.A. FLINN, Metall. Trans.,
1971, 2, 3305.32. T.A. ENGH, H. MIDTGAARD, J.C. BERKE and T. ROSENQVIST,Scand. J. Metall.,
1979, 8, 195.33. M. SPEERand N. PARLEE,AFS Cast Metals Res. J., 1972, 8, 122.34. G.A. IRONS and R.LL. GUTHRIE, Can. Metall. Quart., 1976, 15, 325.35. K.V. GOURISHANKAR, M.K. RANJBAR and G.R. ST.PIERRE, J. Phase Equilibria,
1993, 14, 601.36. JAN AF THERMOCHEMICALTABLES- 1985 SUPPLEMENT,J. Phys. Chern. Reference
Data, 1985, 14.37. M. NADIF and C. GATELLIER,Rev. Metall. CIT, 1986, 83, p. 377.38. S. KOBAYASHI,Y. OMORI and K. SANBONGI, Tetsu-io-Hagane, 1970, 56, 998.39. K. SUZUKI, A. EJIMA and K. SANBONGI, Teisu-to-Hagane, 1977, 63, 585.40. S. GUSTAFFSSON, P.O. MELLBERG and G. RUIsT, Thermodynamic behaviour of
calcium in liquid iron, Final Report ECSC, November 1982.41. Q. HAN, X. ZHANG, D. CHEN and P. WANG, Metall. Trans. B., 1988, 19B, 617.42. E.B. TEPLITSKIIand L.P. VLADIMIROV, Russian Journal Phys. Chern., 1977, 51,
490.43. E.T. TURKDOGAN, Iron & Steelmaker, 1989, 16(5), 61.44. B.J. KEENE, A survey of extant data for the surface tension of iron and its binary
alloys, NPL Rep. DMA(A) 67, June 1983.45. P. KOZAKEVITCH, in Surface phenomena of metals, p. 223. Chern. Ind., London,
1968.46. E.T. TURKDOGANin Foundry Processes - their chemistry and physics, p. 53, Ed. S.
Katz and C.F. Landefeld, Plenum Press, New York, 1988.47. E. SELCUKand D.H. KIRKWOOD,]. Iron and Steel Inst., 1973, 211, 134.48. L.D. LUCAS, Compt. Rend., 1959, 248, 2336.49. E.N. DA C. ANDRADE, Philo. Mag., 1934, 17, 497, 698.50. G. CAVALIER,Proc. Nat. Phys. Lab. No.9, 1958, vol. 2, 4D.51. R.N. BARFIELDand J.A. KITCHENER, J. Iron and Steel Inst., 1955, 180, 324.

CHAPTERS
Physicochemical Properties ofMolten Slags
5.1 STRUCTURAL ASPECTS
Molten slags are ionic in nature consisting of positively charged ionsknown as cations, and negatively charged complex silicate, aluminate andphosphate ions known as anions.
The fundamental building unit in solid silica and molten silicates is thesilicate tetrahedron Si04-4. Each silicon atom is tetrahedrally surroundedby four oxygen atoms and each oxygen atom is bonded to two siliconatoms. The valency of silicon is +4 and that of oxygen is -2, therefore thesilicate tetrahedron has 4 negative charges.
The three dimensional silicate structure repeats regularly in crystallinesilica. In molten silica the Si02 tetrahedra are irregularly grouped, asillustrated in Fig. 5.1.
Si - 0 tetrahedra
Crystalline silica Molten silica
Fig. 5.1 Schematic representation of the tetrahedral arrangement of silica networkin crystalline and molten silica.
138
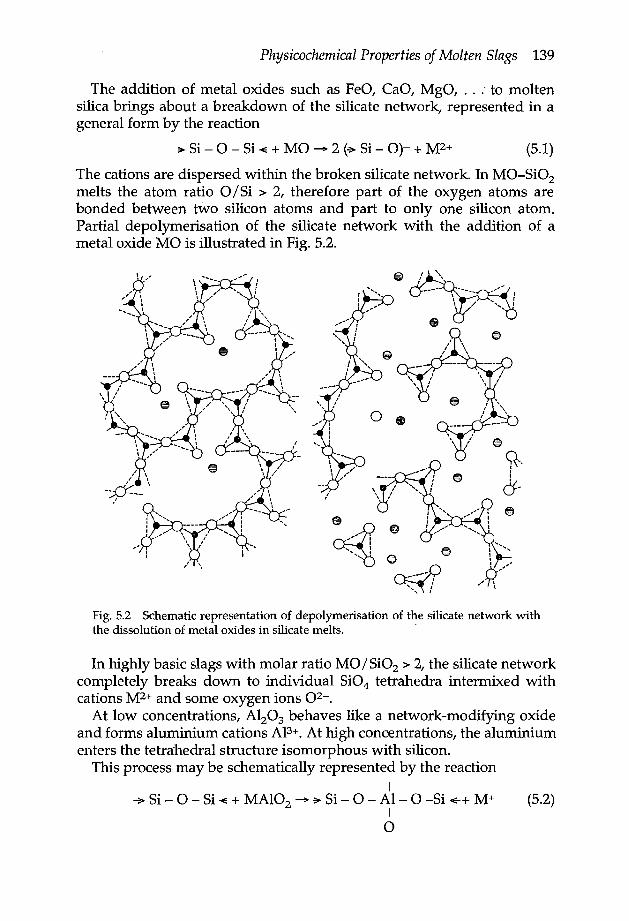
Physicochemical Properties of Molten Slags 139
The addition of metal oxides such as FeO, CaO, MgO, .. : to moltensilica brings about a breakdown of the silicate network, represented in ageneral form by the reaction
~ Si - 0 - Si ~ + MO ~ 2 (~Si - 0)- + M2+ (5.1)
The cations are dispersed within the broken silicate network. In MO-Si02melts the atom ratio O/Si > 2, therefore part of the oxygen atoms arebonded between two silicon atoms and part to only one silicon atom.Partial depolymerisation of the silicate network with the addition of ametal oxide MO is illustrated in Fig. 5.2.
Fig. 5.2 Schematic representation of depolymerisation of the silicate network withthe dissolution of metal oxides in silicate melts. .
In highly basic slags with molar ratio MO/ Si02 > 2, the silicate networkcompletely breaks down to individual Si04 tetrahedra intermixed withcations M2+and some oxygen ions 02-.
At low concentrations, Al203 behaves like a network-modifying oxideand forms aluminium cations AI3+.At high concentrations, the aluminiumenters the tetrahedral structure isomorphous with silicon.
This process may be schematically represented by the reaction1
-> Si - 0 - Si ~ + MAI02 ~ ~ Si - 0 - AI- 0 -Si -E-+ M+ (5.2)Io

140 Fundamentals of Steelmaking
The cation M+ is located in the vicinity of AI-O bonding to preserve thelocal charge balance. At low concentrations of phosphorus in steelmakingslags, the phosphate ions P043- are incorporated in the silicate network. Insteelmaking slags, the sulphur exists as a sulphide ion 52-. The sulphateions 5°42- exist in slags only under highly oxidising conditions and in theabsence of iron or any other oxidisable metal.
Although molten slags are ionised, the slag composition can be repres-ented in terms of the constituent oxides, e.g. CaO, FeO, SiOz, P20S ... Thethermodynamic activity of an ion in the slag cannot be determined.However, the activity of an oxide dissolved in molten slag, forming M2+and 02- ions, can be determined experimentally and the followingequality can be written
MO~M2++02- (5.3)
aMO (aM2+ x aoz-)- (5.4)(aMO) ° - (aM2+ x a02-)O
where the superscript 0 refers to the standard state which is usually puresolid or liquid oxide.
5.2 SLAG BASICITY
For steelmaking slags of low phosphorus content, the slag basicity hastraditionally been represented by the mass concentration ratio
v= %CaO%Si02
For slags containing high concentrations of MgO and P20S' as in somelaboratory experiments, the basicity may be defined by the following massconcentration ratio, with the assumption that on a molar basis the con-centrations of CaO and MgO are equivalent. Similarly, on a molar basis lizP20S is equivalent to Si02•
(5.5)
B = %CaO + 1.4 %MgO%Si02 + 0.84% P20S
For slags containing MgO < 8% and P20S < 5%, the basicity B isessen-tially directly proportional to V.
(5.6)
B = 1.17V (5.7)
Another measure of slag basicity is the difference between the sum ofthe concentrations of basic oxides and acidic oxides.
(%CaO + %MgO + %MnO) - (%Si02 + %P20S + %Ti02) (5.8)

Physicochemical Properties of Molten Slags 141
This formulation of slag basicity is not used very often.For the calcium aluminate type of slags used in steel refining in the ladle
furnace, the slag basicity used in some German and Japanese publications,is defined by the ratio
%CaO (5.9)
However, such a ratio becomes meaningless at low concentrations ofeitherSifr, or A1203• For the ladle furnace slag the basicity may be definedby the following mass concentration ratio
BLF = %CaO + 1.4 x %MgO%Si02 + 0.6 X %A1203
(5.10)
The slag basicities as defined above are for the compositions of moltenslags. In practice, the steelmaking slags often contain undissolved CaOand MgO. The chemical analyses of such slag samples without correctionfor undissolved CaO and MgO, will give unrealistic basicities which aremuch higher than those in the molten part of the slag.
There has been a trend in recent years to relate some physicochemicalproperties of slags, such as sulphide capacity, phosphate capacity, carbidecapacity etc., to the so-called optical slag basicity. Such attempts to gener-alise the physicochemical properties of silcates, phosphates, aluminatesetc., into a single rationale invariably lowers the accuracy of representingthe composition dependence of the equilibrium constants of gas-slag-metal reactions. As is seen from the plot in Fig. 5.3, there is no meaningful
12 I I
•8 - ••• -
0
8 •:!c~
••0 0 ~A.4 I--0 -
X°0 0 xx:1 Ac9 o 0 0 x A
0 o~~ x~
0 [ I0.5 0.6 0.7 0.8
A
Fig. 5.3 Compositions of simple and complex slags do not give a meaningful cor-relation between optical basicity A and concentration-based slag basicity B.

142 Fundamentals of Steelmaking
correlation between the so-called optical basicity A and the concentration-based slag basicity B for simple and complex slags, to which referenceswill be given later in this chapter.
5.3 SELECTED PHASE DIAGRAMS OF BINARY AND TERNARY OXIDE SYSTEMS
Pertinent to the steelmaking type of slags, a few phase diagrams of binaryand ternary oxide systems are given here from the data compiled by Levinet al.)
Iron oxide dissolves in slags in two valency states: divalent iron cationsFe2+ and trivalent iron cations Fe3+. The ratio Fe3+ /Fe2+ depends on tem-perature, oxygen potential and slag composition; this is discussed later inthis chapter. In the formulation of the equilibrium constants of slag-metalreactions and the thermodynamic activities of oxides in slags, the total irondissolved in the slag as oxides is usually converted to the stoichiometricformula FeO and denoted by Fe.O, thus
%FetO = %FeO (analysed) + 0.9 x %Fe203 (analysed)
or %FetO = 1.286 x %Fe (total as oxides)
(5.11a)
(S.11b)
For the sake of simplicity in printing, the subscript t will be omitted in allthe subsequent equations and diagrams.
5.3.1 BINARY OXIDE SYSTEMS
The simplest oxide system is that of FeO-MnO where there is a completeseries of liquid and solid solutions (Fig. 5.4).
1900~------------------~
<D:;~Q)o,E~ 1500
Liquid
01700a,
Solid solution
'-1371°C
1300~--~----~--~----~FeO 25 50 75 MnO
MnO{wt.%}
Fig. 5.4 Phase diagram for FeO-MnO system.

Physicochemical Properties of Molten Slags 143
In the CaO-MgO system (Fig. 5.5) there is a small solid solubility at theterminal regions at the eutectic temperatures -- 2300°C. Dolomite,MgCa(C03)v is an important raw material for use in steelmaking furnacesas a basic refractory material. The dolomite is calcined at temperatures inthe order of 1700°C to yield a material less subject to deterioration bymoisture during storage.
LIME + PERICLASE
Fig. 5.S Phase diagram for CaO-MgO system.
In considering the silicate binary systems, mention should be made ofthe polymorphic forms of silica. The following are the major phase trans-formations of silica: melting temperature 1723°C;cristobalite ~ tridymitetransformation 1470°C; tridymite ~ quartz transformation 867°C.However, tridymite is not a true polymorphic form of pure silica. It hasbeen demonstrated+s that tridymite is formed within the temperaturerange 867-1470°C only when some metal ions dissolve in silica. It is forthis reason that in all the metal oxide-silica systems tridymite appears as astable phase over the indicated temperature range. In most of the silicatesystems, except those with alkali oxides and alumina, there is a liquidmiscibility gap ..as seen from the phase diagrams in Figs. 5.6, 5.7 and 5.8.Another characteristic feature is that there is a negligible amount of solid-solution formation in most of the silicate systems. ._.
In the CaO-Si02 system (Fig. 5.6) there are two phases with congruentmelting points: a-2CaO·Si02 and CaO·Si02i two with incongruent melt-ing points: 3CaO·2Si02 and 3CaO·Si02, the latter being stable only

144 Fundamentals of Steelmaking
20700
LlOUID, 2 lI0UIDS
I
CoO + L.
CoO+ 3CoO·SiOz~
(3CoO· Si02W 1500a:: +::3
p-2CaO'SiOz)t-<a: 12500c.LJQ.
~c.LJ
Qo~1000 en --
CoO +.B -2CaO • SiOz• en
NONO' 0 0uo c.:;; enNO ~+66750 • uc:::Q.rt') o 00 u
CaD + r-2CaO'Si02 u eta.rot')
500CoO 20 40
SiOZ(CRISTOBALITEl + L .1470°1436°
a-CaO·Si02 +Si02 (TRIOYMITE)11250
P - CoO, Si02 + Si02 (TRIDYMITE)8670
P-CaO-Si02 +Si02 (QUARTZ)
60
8102' wt.%Fig. 5.6 Phase diagram for CaO-Si02 system.
80 Si02
1800
1200
II \
2 LIQUIDS \I \I I
/ N1700'I
I Si 02 (CRISTOBALITE) + L.
LIQUID
:/ 1470·
~0'Si02 + L Si02 (TRIDYMITE) + L.
\ 1208~i\. _~V' ---."
1175° 1180'
FeO' + 2FeO' Si02 2 FeO 'Si02 (FAYALITE) + ITRIDYMITEI I I
1600
1000FeO' 20 eo
Fig. 5.7 Phase diagram for FeO-Si02 system.
within the temperature range 1250-2070°C. One characteristic feature ofthe di-calcium silicate is that on conversion from ~ to y crystalline modi-fication at 675°C,there is about a 12percent volume expansion causing thesolid mass to become powdery. In electric furnace practice, the reducingslag used has a composition similar to that of di-calcium silicate, andbecause of the transformation from ~ to y form, on cooling the slag be-comes powdery; in industry this type of slag is often referred to as the'white falling slag'. The formation of y-2CaO·SiOzin blast furnace slags ishighly undesirable if the slag is to be used as an aggregate for con-structional purposes.

Physicochemical Properties of Molten Slags 145
1900
1800
MgO + L. \ y~o.I
1850·
LIQUID
MoO + 2MgO· 5102 ~\ \I \, 2 LIQUIDS
,, ,,~695·--V
f\ ( ISi02 + L
I,J ,L.1551·2MgO'Si02l
M90~Si021 MgO'SiO~+ Si02
~lJ.i0:::~~ 11000:::\.&JQ.
::E\.&Jt-
1600
1500MgO 20 80
Fig. 5.B Phase diagram for MgO-Si02 system.
The phase diagram for the FeO-Si02 system in Fig. 5.7 is that inequilibrium with solid or liquid iron; this is not a true binary system. Theamount of ferric oxide in the melt along the liquidus curve, in equilibriumwith iron, decreases from about 12 percent at the FeO comer to about 1percent at silica saturation.
The phase diagram for the MgO-Si02 system is given in Fig. 5.8. Below40% Si02 the eutectic melting occurs at 1850°C indicating that magnesia,even in the presence of appreciable amounts of silica, is a good refractorymaterial. The refractory oxides and some silicates are often called by theirmineralogical names: MgO (magnesia)-periclase; 2 MgO·Si02 - forsterite;MgO·Si02 - protoenstatite.
The phase diagram for the CaO-A1203 system is given in Fig. 5.9. Theprefused or sintered calcium aluminates made for flux additions to thesteel ladle usually contain 42 to 48% Al2031 which is within the region oflow liquidus temperatures.
5.3.2 TERNARY AND QUATERNARY OXIDE SYSTEMS
Most steelmaking slags consist primarily of CaO, MgO, Si02 and FeO. Inlow-phosphorus steelmaking practices, the total concentration of theseoxides in liquid. slags is in the range 88 to 92%. Therefore, the simplest typeof steelmaking slag to be considered is the quaternary system CaO-MgO-Si02-FeO. ,
First, let us consider the ternary system CaO-Si02-FeO; the liquidusisotherms of this system is shown in Fig. 5.10. The isothermal section ofthe composition diagram in Fig. 5.11 shows the phase equilibria at 1600°C.

146 Fundamentals of Steelmaking
-, -, -,2300 ~
\2200 \2100 \
\u 2000 \~w 1900 \0:::::> LIME -lI0UID \~0:: IBOO \wa... \~ 1700w \.-
16001535
1500
1400LIME • SA
1300
CoO :30
3CoOoAIz03 CoOoAtp3
12CoO·7A~03WEIGHT %
Fig. 5.9 Phase diagram for CaO-A1203 system.
There are four two-phase regions where, as depicted by dotted lines, themelt is saturated with Si021 2CaO·Si021 3CaO·Si02 or CaO; two three-phase regions (2CaO·Si02 + 3 CaO·Si02 + liquid) and (3CaO·Si02 + CaO+ liquid); and one liquid phase region.
Magnesia is another important ingredient of steelmaking slags, whichare invariably saturated with MgO to minimise slag attack on the magne-sia refractory lining of the furnace.
The effect of MgO on the solubility of calcium silicates and calciumoxide is shown in Fig. 5.12 for the system (CaO + MgO)-Si02-FeO, inequilibrium with liquid iron at 1600°C.The broken-line curve delineatesthe region of saturation of molten slag with solid calcium (magnesium)silicates and solid magnesio-wustite (MgO-FeO solid solution). Effects ofthe concentrations of MgO and FeO on the solubility of CaO in2CaO·Si02-saturated slags are shown in Fig. 5.13.
Tromel et al.s have made a detailed study of the solubility of MgO iniron-calcium silicate melts. The solubility data are given in Fig. 5.14as iso-MgO concentrations for CaO-MgO-Si02-FeO slags saturated with olivine(Mg, Fe)zSi04, and magnesio-wustite in equilibrium with liquid iron at1600°C.Point A is for the ternary system Mg-Fe-O and B for Mg-Ca-O.Along the composition path AB, molten slag is saturated with both olivine

Physicochemical Properties of Molten Slags 147
WEIGHT %
Fig. 5.10 Liquidus isotherms of CaO-Si02-FeO system.
and Mg(Fe)O. Along the composition path CD, the slag is saturated withboth pyroxene (Ca,Mg) silicates and magnesio-wustite.
Below the dotted curve BACD in Fig. 5.15 for double saturations, thecurves for 10 to 60% FeO are the MgO solubilities in the slag as magnesio-wustite. The solubility data obtained in other experimental work6--8are ingeneral accord with the data of Tromel et ale in Fig. 5.15. In the work ofLeonard and Herron," it was also found that the addition of CaF2 up toabout 10% had no perceptible effect on the solubility of MgO in steelmak-ing type slags. .
The shift in the solubility isotherms at 1600°C with the addition of 9 and15% MnO to the system CaO-Si02-FeO, co-existing with liquid iron, ..i5shown in Fig. 5.16 as determined by Gorl et al.9
Pertinent to the compositions of neutral ladle slags, the phase equilibriain part of the system CaO-AI203-Si02 at 1600°C is shown in Fig. 5.17.

148 Fundamentals of Steelmaking
CaO 20 40 60 80 'F~O'
Fig.5.11 Phase equilibria in the system CaO-Si02-FeO in equilibrium with liquidiron at 1600°C.
(C:O~------~-------4~O~------60~-------8~O------~FQOMgO) F~07 wt-Of.
Fig. 5.12 . Effect of MgO (wt.%) on the solubility isotherms at 1600°C in the system(CaO + MgO)-Si02-FeO in equilibrium with liquid iron.

Physicochemical Properties of Molten Slags 149
Fig. 5.13 Solubility of CaO in (CaO-MgO-Si02-FeO) slags saturated with2CaO'Si02 at 1600°C.
(CaO+
MgO) 40 60 80 F<zO'
Fig.5.14 Iso-MgO concentrations (wt.%) for CaO-MgO-Si02-FeO slags saturatedwith olivine and magnesio-wustite in equilibrium with liquid iron at 1600°C.

150 Fundamentals oj Steelmaking
32
8
~ Mg(Fe)O + 2Ca(Mg)O.Si02
/
o 2 3 4 5
Fig. 5.15 Solubility of MgO, as magnesio-wustite, in the system CaO-MgO-Si02-FeO at 1600°C as a function of slag basicity and FeD concentration, derived from thedata in Fig. 5.14.
5.4 THERMODYNAMIC ACTIVITIES OF OXIDES IN SIMPLE AND COMPLEX
SLAGS
Thermodynamic activities of oxides dissolved in molten slags are relativeto.pure liquid or solid oxides as the standard state; that is, for pure oxidethe activityaMo = 1.
Reference may be made to a previous publication by the author."? forcompiled experimental data on the thermodynamic activities in binaryand ternary oxide systems. In this chapter the activity data are given for afew ternary and multicomponent systems which are closely related tosteelmaking slags.
5.4.1 ACTIVITIES IN CaO-FeO-Si02 SYSTEM
The oxide activities in the CaO-FeO-Si02 melts in equilibrium with liquidiron at about 1550°C are given in Fig. 5.18. The iso-activity curves in thetop diagram represent the experimentally determined activities of ironoxide with respect to liquid FeO.11,12 The activities of CaO and Si02 with

Physicochemical Properties of Molten Slags 151
20 40 60 80 Fa 0·'wt -°/0
Fig.5.16 Shift in the solubility isotherms at 1600°C with the addition of 9 and 15%MnO to the system CaO-Si02-FeO; the total CaO, Si02 and FeO contents are relatedto 100%.
2CaQ.Si02 Si02
70~~~~----~+------------~3CaD-Si02
80
Mass (%)
Fig. 5.17 Phase equilibria in the system CaO-AI203-Si02 at 1600°C.
respect to solid oxides were calculated from the FeO activities by Gibbs-Duhem integration.P

152 Fundamentals of Steelmaking
o.r~
CaO 0'6 o·s FaO
--aSi02 (5)
-·-ac•o (s)
0'6
Fig.S.18 Activities of FeO(l) (experimental), CaO(s) and Si02(s) (by Gibbs-Duhemintegration) in CaO-FeO-Si02 melts in equilibrium with liquid iron at 1550°C. FromRefs. II, 12.
5.4.2 ACTIVITIES IN CaO-A1203-Si02 SYSTEM
Rein and Chipman-> measured the activity of silica in the CaO-AI203-
Si02 system; from these experimental data they calculated the activities ofCaO and A1203 by Gibbs-Duhem integration. The salient features of theseoxide activities at 1600°C, with respect to solid oxides, are shown in Fig.5.19 for the mass ratios of CaO/ Al203 = 2/3 and 3/2; the compositions ofladle slags are well within the range given in Fig. 5.19.

Physicochemical Properties of Molten Slags 153
10-1
10-4 L---&_......011....-""'-- __ ......1....-__ --'o 10 20
Mass % Si02
30
0.4
f 0.313«j
<5;f 0.2
0.1
10 20Mass % Si02
30
Fig. 5.19 Silica and alumina activities, with respect to solid oxides, in CaO-A1203-
Si02 melts at 1600°C, derived from experimental data of Rein and Chipman.P
The ratio of the activities (aA1203)V3/ (acao), within the entire liquid com-position range up to 30% Si02, is shown in Fig. 5.20.
5.4.3ACTIVITIES IN MnO-AI203-Si02 SYSTEM
In the deoxidation of steel with the ladle addition of silicomanganese andaluminium together, the deoxidation product is molten manganese al-uminosilicate with the mass ratio MnO/Si02 at about 1:1 and containing10 to 45% A1203. The activities of oxides in the MnO-AI203-Si02 melts at1550° and 1650°C were computed by Fujisawa and Sakao-+ from the avail-able thermochemical data on the system. They also determined experi-mentally the activities of MnO and Si02 by selected slag-metal equilibriummeasurements and found a close agreement with the.computed data.
The activities of A1203and Si02, with respect to solid oxides, are plottedin Fig. 5.21 for melts with mass ratio of MnO/Si02 = 1. For melts contain-ing up to 30% Al203 the activity of MnO remains essentially unchanged atabout 0.1 then decreases to about 0.05 at 40% A1203•
5.4.4 ACTIVITY COEFFICIENT OF FeO IN SLAGS
With hypothetical pure liquid FeG as the standard state, the activity ofiron oxide is derived from the concentration of dissolved oxygen in liquidiron that is in equilibrium with the slag. For the reaction equilibrium
FeO(I) = Fe + [0] (5.12)

154 Fundamentals of Steelmaking
0.1 ~ ~ ~ ~ ~~ ~ ~
o 5 10 15 20 25 30
Silica, mass %
Fig. 5.20 Effect of slag composition on the activity ratio (aAlzo3)1/3 / aCaO for the
system CaO-A1203-Si02 at 1600°C.
UJ 0.8Q)
+=#.:;~ctS 0.6No
(jj"'C
~ 0.4('t)
oN« 0.2
1.0~---,,-,----------------------------------~--~
'41" 15500C......1650°C ''''--...
...... '..........•.• ... ...••.... ... ....... ..<,; .
........•.....•...............- .... -..•...•..•..••.••..•..•.
.•.•.•....•.•.•.•
O~~-L----~--~----~--~----~--~----~--~o 5 10 15 20 25 30 35 40 45Mass % AI203
Fig. 5.21 . A1203 and Si02 activities in MnO-A1203-Si02 system for mass ratio ofMnO/Si02 = I, derived from data compiled by Fujisawa & Sakao.t+

Physicochemical Properties of Molten Slags 155
Ko = [aol (5.12a)aFeO
where ao = [%Olfo, using log fa = -O.lx[%O]. The temperature depend-ence of the equilibrium constant Ko given below is that derived from thefree energy equation (4.36a).
5730log Ko = - --y + 2.397 (5.12b)
In the past, we have generated a wide variety of formulations to repres-ent the composition dependence of the iron oxide activity or activitycoefficient in complex slags. In the present reassessment of this property ofthe slag the author came to the conclusion that, within the limits of uncer-tainty of the experimental data on slag-metal reaction equilibrium, there isa decisive correlation between the activity coefficient of FeO and the slagbasicity B as shown in Fig. 5.22; the experimental data used are fromnumerous independent studies.t1,15-20 It is evident that YFeO reaches apeak at a basicity of about B = 1.8. It should be pointed out once again thatthe concentration of iron oxide is for total iron as oxides in the slag repres-ented by the stoichiometric formula FeO as in equation (5.11b).
3
••"0+o
oIf 2?-
o~------~----~~----~o 2 8 4 6
Fig. 5.22 Effect of slag basicity on the activity coefficient of iron oxide in simple andcomplex slags at 1600°C.
..The experimental data cited in Fig. 5.22 are for simple and complex
slags which differ considerably in their compositions. Some data are forsilicate melts with no P205 and basicities of B = 0 to 3. On the other

156 Fundamentals of Steelmaking
extreme the equilibrium data used are for slags saturated with CaO andcontain P20S in the range 1 to 20%. It should be noted that the correlationirr Fig. 5.22 is for slags containing CaD, Si02t FeO<40%, MnO<15%,MgO<20% and P20s<20%.
There are several other experimental data for temperatures of 1530° to1750°C which give YFeO values that are in general accord with the relation-ship shown in Fig. 5.22 for 1600°C.
5.4.5 ACTIVITY COEFFICIENT OF MNO IN SLAGS
The slag/metal mang~ese distribution ratio is governed by two interrelatedreaction equilibria. One reaction is oxidation of Mn with FeO in the slag.
(FeO) + [Mn] = (MnO) + Fe (5.13)
aMnO (5.13a)
where the oxide activities are with respect to pure liquid oxides,The second reaction to be considered is
[Mn] + [0] = (MnO) (5.14)
[%Mn][aol (5.14a)
From a critical reassessment of the experimental data of numerous stud-ies, the author-! derived the following equations for the temperaturedependence of the equilibrium constants KFeMn and KMn•
7452log KFeMn = --y - 3.478
1 K 13'T182 - 5.875og Mn =
(5.13b)
(5.14b)
The ratio of the activity coefficients YFeO/YMnO in slags is derived fromthe equilibrium data cited in Fig. 5.22 for simple and complex slags andthe equilibrium constant KFeMn thus
YFeO _ 1 { NMnO} (5.15)YMnO - KFeMn NFeO [%Mn]
where Ns are mol fractions of the oxides. The results are given in Fig. 5.23.There is a sharp decrease in the ratio of the activity coefficients as thebasicity B increases from 1.5 to 2.0. At basicities above 2.5, the ratioYFeO/YMnO is essentially constant at about 0.63.
The actiyity coefficient of MnO, with respect to pure liquid MnO as thestandard state, is derived from the data cited above using the relation

Physicochemical Properties of Molten Slags 157
o
~o
~
o~------~--------~------~o 2 4
cD
6B
Fig. 5.23 Variation of activity coefficient ratio with slag basicity at 1600°C.
xc
o
~
B
Fig. 5.24 Effect of slag basicity on the activity coefficient of manganese oxide insimple and complex slags at 1600°C.

158 Fundamentals of Steelmaking
- K {[%Mn][aa]}YMnO - Mn N
MnO(5.16)
The variation of YMnO with slag basicity shown in Fig. 5.24 is similar to thatof YFeO. It should be noted that to maintain consistency in the interpreta-tion of the data, the curve drawn in Fig. 5.24 is that derived from thecombination of curves in Figs. 5.22 and 5.23.
5.5 OXYGEN POTENTIAL DIAGRAM
The reducibility of a metal oxide relative to other oxides, or the ox-idisability of a metal relative to other metals, can readily be assessed fromthe free energy data.
For the oxidation reaction involving pure metals and metal oxides intheir standard states, i.e. aM = I, aMo = 1
2M+02=2MO
the isothermal equilibrium constant is
K= ~Pa2
(5.17)
(5.18)
where P02 is the equilibrium oxygen partial pressure for which the stand-ard state is 1 atm at the temperature under consideration. The standardfree energy change is
AGO = - RTln K = RTln P02 (5.19)
which is also called the oxygen potential.In an earlier study, Richardson and Jeffes22 compiled the free energy
data on metal oxides which were then available, and presented the data asan oxygen potential diagram (Fig. 5.25) that is reproduced from theirpaper.
The oxides for which the oxygen potential lines are above that of CO canbe reduced by carbon. As the affinity of the metals for oxygen increases,i.e. ~GO decreases, the temperature of reduction of the oxides by carbonincreases.
For easy conversion of oxygen potentials to the corresponding values ofP02 or to the equilibrium ratios of H2/H20 and CO/C021 appropriatescales are included in the enclosed oxygen potential diagram for variousoxides of metallurgical interest.
Scale for Po2:
Lines drawn from the point 0 on the ordinate for the absolute zerotemperature through the points marked on the right hand side of thediagram give the isobars. For example, for the Fe-FeO equilibrium the

Physicochemical Properties of Molten Slags 159
o
c
Absolule zero
Fig. 5.25 Oxygen potential diagram, reproduced from the paper by Richardson andJeffes.22
oxygen potential is -82 kcal (-343 kj) at 1200°C.By drawing a line passingthrough this point and the point 0, the oxygen partial pressure of about 7x 10-13 atm is read off the P02 scale.
Scale for CO / CO2:
Draw the line from point C to a point on the oxygen potential; theextension of this line gives the corresponding equilibrium CO / CO2 ratio.
Scale for H2/H20:Same as above by using point H.

160 Fundamentals of Steelmaking
5.6 GAS SOLUBILITIES IN SLAGS
In acidic melts, H20 vapour reacts with double bonded oxygen and de-polymerises the melt, thus
(~ Si - 0 - Si «) + H20 = 2 (~ Si - OH)
Inbasic melts, H20 reacts with free oxygen ions
(02-) + H20 = 2(OH)- (5.21)
Both for acidic and basic melts the overall reaction is represented by
(0*) + H20 = 2(OH*) (5.22)
where 0* represents double or single bonded oxygen, or 02-, and OH* issingle bonded to silicon or as a free ion. The equilibrium constant for agiven melt composition is
(5.23)
where PH20 is the vapour partial pressure.The solubilities of H20 (in units of mass ppm H20) at 1atm pressure of
H20 vapour in CaO-FeO-Si02 and CaO-Al203-Si02 at 1550°C,measuredby Iguchi et al.23 are given in Fig. 5.26.
5.6.2 SOLUBILITY OF N2
Nitrogen dissolves in molten slags as a nitride ion N3- only under reduc-ing conditions
lhN2(g) + %(02-) = (N3-) + %02(g) (5.24)
for which the equilibrium constant (known as nitride capacity) is
P 3/4eN = (%N) 02
1/2 (5.25)PN2
Many studies have been made of the solubility of nitrogen in CaO-Al203 and CaO-AI203-Si02 melts in the 1970s. These were reviewed bythe author in a previous publication.!? Reference should be made also to asubsequent work done by Ito and Fruehan-? on the nitrogen solubility inthe CaO-AI203-Si02 melts. They showed that the nitride capacity of thealumino silicate melts increases with a decreasing activity of CaO as shownin Fig. 5.27.:

Physicochemical Properties of Molten Slags 161
Fig. 5.26 Hydroxyl capacity, COH ppm H20 atm-1/2 of CaO-FeO-Si02 and CaO-AI203-Si02 melts at 1550°C. From Ref. 23.
5.6.2a Slagfmetal distribution ratio (N)/[N]For Al-killed steels the corresponding equilibrium partial pressure of oxy-genis
1.22 X 10⁻¹⁶Poz (atm) = [%Al]4/3 at 1600°C

162 Fundamentals of Steelmaking
zU0\ -13o 0 CaO- Si02 -A1203
• CaO- Si02
() CaO-AI20J
-12
-14------------~----------~--------~-3 -2 -1 o
Fig. 5.27 The relation between the nitride capacity and the activity of lime for CaO-Si02-A1203 slag at 1550°C. From Ref. 24.
log 0Coo
From the solubility data for nitrogen we have
PN Ih(atm1/2) = 21.9[%N] at 1600°C2
Substituting these in the equation for eN gives
(%N) x 5.3 X 10⁻¹⁴[%N][%AI]
In lime-rich aluminate ladle slags of low Si02 content, the lime activity isaCao = 0.5 for which eN = 10-13.These give the following equilibriumrelation
(%N)[%N] = 1.9 x [%Al]
Dissolved [%AI] (%N)/[%N]0.005 0.00950.02 0.0380.06 0.1140.10 0.190
The equilibrium nitrogen distribution ratio between slag and steel is verylow even at high aluminium contents, well above the practical range. Theslag/steel mass ratio in the ladle is also low, about 1/100. For these rea-sons, liquid steel in the ladle cannot be de-nitrogenised by the slag that isusable in industry in steel refining.

Physicochemical Properties of Molten Slags 163
5.6.3 SOLUBILITY OF S2
Sulphur-bearing gases dissolve in molten slags as sulphide ions (52-) un-der reducing conditions, and as sulphate ions (50,i-) under highly oxidis-ing conditions. In steelmaking the oxygen potential is not high enough forthe solution of sulphur as sulphate ions, therefore we need to consideronly the sulphide reaction.
Whether the sulphur-bearing species is primarily H2S or S021 there is acorresponding equilibrium value of PS
2depending on the temperature and
gas composition. It is convenient to consider the reaction in a general formas
(5.26)
For a given slag composition the equilibrium relation is represented by
Cs :: (%5) ( P02 ) 1/2PS2
(5.27)
where ps are equilibrium gas partial pressures. The equilibrium constantCs is known as the sulphide capacity of the slag. The value of Cs dependson slag composition and temperature.
Experimentally determined sulphide capacities of binary oxide meltsare shown in Fig. 5.28. References to experimental data are given in Ref.10.
For the slag-metal system, the sulphur reaction is formulated in termsof the activities (s concentrations) of sulphur and oxygen dissolved in thesteel.
[5] + (02-) = (52-) + [0] (5.28)
For low-alloy steels
(%5)ks = [%S] [%0] (5.28a)
where the equilibrium constant ks depends on slag composition andtemperature.
Conversion of Po Ips to [%0]1 [%5]:2 2
The free energies of solution of O2 and 52 in liquid low alloy steel are givenbelow; see Table 4.3 in Chapter 4.
lh52 = [5]lh02 = [0]
For the reaction equilibrium
lh52 + [0] = lh02 + [5]
aGs = -135,060 + 23.43T JaGo = -115,750 - 4.63T J

164 Fundamentals of Steelmaking
10-5~_-",- __ --,-_~..L-_-I. _o 20 40 ·60 80 100
BASIC OXIDE, mol.-O/o
Fig.5.28 Sulphide capacities of binary oxide melts. From Ref. 10.
the standard free energy change is
~Go = ~Gs - AGo = -19,310 + 28.06T J
(P02 ) 1/2 [%5] _ 1009
K = PS2
[%0] - --y - 1.466
(5.29)
(S.29a)
For steelmaking temperatures an average value of K is 0.133; with thisconversion factor the following is obtained.
( P02) 1/2 = 0.133 [%0]PS2 [%5]
With this substitution the values of Cs are converted to ks.
(%5)7.5 x Cs = ks = [%5] [%0] (5.30)
A slag of high ks value and steel deoxidation to low levels of [0] are

Physicochemical Properties of Molten Slags 165
necessary conditions for steel desulphurisation. This subject is' discussedin more detail later.
5.6.4 SOLUBILITY OF O2
Oxygen dissolves in molten slags by oxidising the divalent iron ions to thetrivalent state.Gas-slag reaction:
lh02(g) + 2(Fe2+) = 2(Fe3+) + (02-) (5.31)
Slag-metal reaction:Fe" + 4(Fe3+) + (02-) = 5(Fe2+) + [0] (5.32)
These reactions provide the mechanism for oxygen transfer from gas tometal through the overlaying slag layer. Partly for this reason, the steelreoxidation will be minimised by maintaining a low concentration of ironoxide in the ladle slag, tundish and mould fluxes.
MOLAR RATIO (CaO+MgO)/Si02
0·3
60 40FaD, mol.-o/o
20
• 0·2N
~+-C")
~0·1
o 10 20MxDy 1 rnol.-"
Fig. 5.29 Effect of slag composition on the ratio Fe3+ IFe2+ in melts saturated with-metallic iron at 1600°C: (a) CaO-MgO-Si02-FeO melts at indicated molar concentra-tions of total iron oxide FeO; (b) MgO-Si02-FeO melts; (c) pseudobinary FeO-MxOymelts. From Ref. 25.
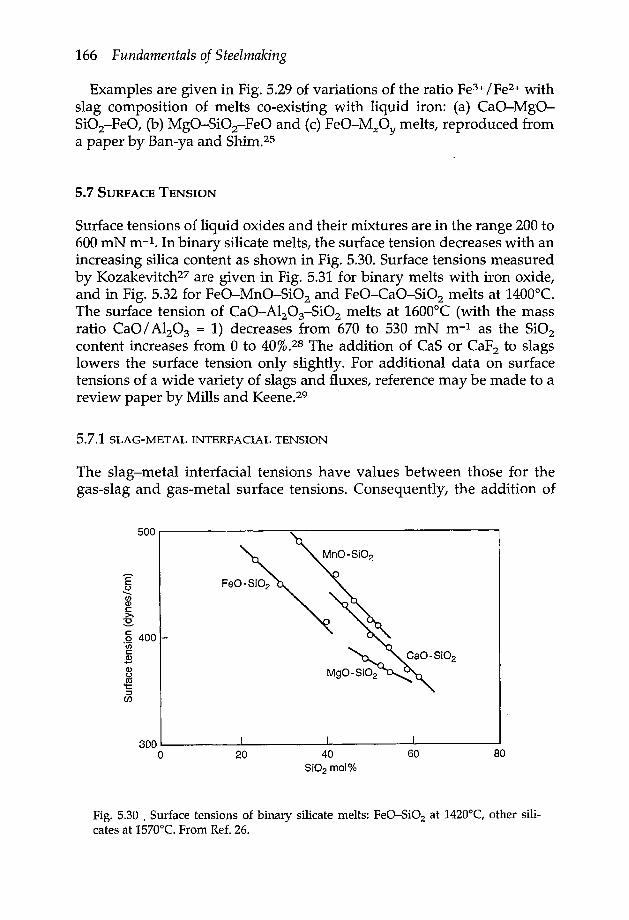
166 Fundamentals of Steelmaking
Examples are given in Fig. 5.29 of variations of the ratio Fe3+ /Fe2+ withslag composition of melts co-existing with liquid iron: (a) CaO-MgO-Si02-FeO, (b) MgO-Si02-FeO and (c) FeO-MxOy melts, reproduced froma paper by Ban-ya and Shim.2S
5.7 SURFACE TENSION
Surface tensions of liquid oxides and their mixtures are in the range 200 to600 mN rn-I. In binary silicate melts, the surface tension decreases with anincreasing silica content as shown in Fig. 5.30. Surface tensions measuredby Kozakevitch-? are given in Fig. 5.31 for binary melts with iron oxide,and in Fig. 5.32 for FeO-MnO-Si02 and FeO-CaO-Si02 melts at 1400°C.The surface tension of CaO-AI203-Si02 melts at 1600°C (with the massratio CaO / Al203 = 1) decreases from 670 to 530 mN m-I as the Si02content increases from 0 to 40%.28 The addition of CaS or CaF2 to slagslowers the surface tension only slightly. For additional data on surfacetensions of a wide variety of slags and fluxes, reference may be made to areview paper by Mills and Keene.s? .
5.7.1 SLAG-METAL INTERFACIAL TENSION
The slag-metal interfacial tensions have values between those for thegas-slag and gas-metal surface tensions. Consequently, the addition of
Eo-..CJ)Q)c~~§ 400
'00c~Q)o
~:len
300~------~-----------~~--------~------~o 20 60 80
Fig. 5.30 . Surface tensions of binary silicate melts: FeO-Si02 at 1420°C, other sili-cates at 1570°C. From Ref. 26.
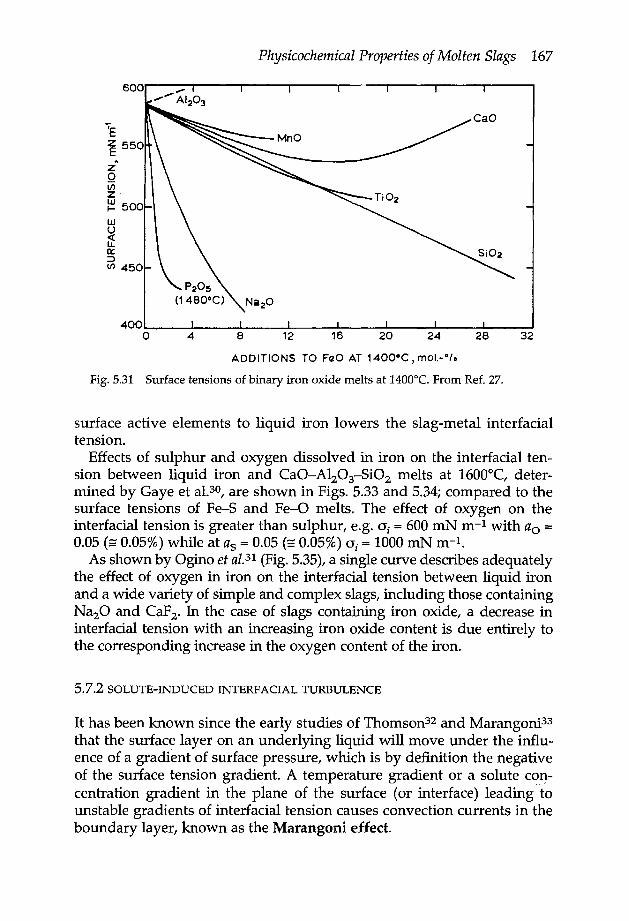
Physicochemical Properties of Molten Slags 167
600
zov;z·~ 500wU~a::=.lV) 450
4 8 12 16 20 24 28 32ADDITIONS TO FczOAT 1400°C, mol.-O/o
Fig. 5.31 Surface tensions of binary iron oxide melts at 1400°C. From Ref. 27.
surface active elements to liquid iron lowers the slag-metal interfacialtension.
Effects of sulphur and oxygen dissolved in iron on the interfacial ten-sion between liquid iron and CaO-AI203-Si02 melts at 1600°C, deter-mined by Gaye et a1.30, are shown in Figs. 5.33 and 5.34; compared to thesurface tensions of Fe-S and Fe-O melts. The effect of oxygen on theinterfacial tension is greater than sulphur, e.g. o, = 600 mN m-l with ao =0.05 (= 0.05%) while at as = 0.05 (= 0.05%) o, = 1000 mN m-l.
As shown by Ogino et a1.31 (Fig.5.35), a single curve describes adequatelythe effect of oxygen in iron on the interfacial tension between liquid ironand a wide variety of simple and complex slags, including those containingNa20 and CaF20 In the case of slags containing iron oxide, a decrease ininterfacial tension with an increasing iron oxide content is due entirely tothe corresponding increase in the oxygen content of the iron.
5.7.2 SOLUTE-INDUCED INTERFACIAL TURBULENCE
It has been known since the early studies of Thomson= and Marangoni=that the surface layer on an underlying liquid will move under the influ-ence of a gradient of surface pressure, which is by definition the negativeof the surface tension gradient. A temperature gradient or a solute con-centration gradient in the plane of the surface (or interface) leading "tounstable gradients of interfacial tension causes convection currents in theboundary layer, known as the Marangoni effect.

168 Fundamentals of Steelmaking
(a)
-I-~.o~
CaO
Fig. 5.32 Isosurface tension curves in FeO-MnO-Si02 and FeO-CaO-Si02 meltssaturated with iron at 1400°C.
The phenomenon of interfacial turbulence accompanying mass transferhas been demonstrated in many investigations using either aqueous-organic solutions or gas-slag-metal systems. For a brief review .of thissubject, reference may be made to a previous publication.l? However, aparticular reference will be made here to the work of Riboud and Lucas=who measured changes in interfacial tension accompanying the transfer ofalloying elements from liquid iron drops to alumino silicate melts contain-ing iron oxide. The interfacial tension was measured using the X-ray fluo-roscopy technique. As is seen from an example of their experimentalresults in Fig. 5.36, the oxidation of aluminium in a liquid iron drop by the

Physicochemical Properties of Molten Slags 169
1200
800
~1100'EzS,§ 1000CJ> .c2(ij'0{g 900Q)
E
0.1 0.3 0.5 0.7Sulphur activity in iron
Fig. 5.33 Effect of sulphur in iron on the interfacial tension between liquid iron andCaO-AI203-Si02 melts, determined by Gaye et al.3D is compared to the surface ten-sion of Fe-S melts at 1600°C.
1300
700
~1100z~co'u;~ 900as'0.{gCD
:E
Oxygen activity in iron
Fig, 5.34 Effect of oxygen in iron on the interfacial tension between liquid iron andCaO-A1203-Si02 melts, determined by Gaye et aI.3D is compared to the surface ten-sion of Fe-O melt at 1600°C.

170 Fundamentals of Steelmaking
Mass % oxygen in iron
0.00101800r-----~~----~------~------~----~0.0032 0.0100 0.0316 0.1000 0.2512
.•... ...1400 ... .•.
I.••.••0 ...~ ••• CiiIE
CiiIIZ Q
CiiII
E Q. ac0tilC 1000OJ
"0u0-'-(1J
C
600
200~----~------~------~------~----~-3.0 -2.5 -2.0 -1.5
Log [0/0 OJ
-1.0 -0.6
Fig. 5.35 General relation between the oxygen content of iron and the interfacialtension between the metal and various slag systems at 1580°C. From Ref. 31.
slag is accompanied by an appreciable decrease in the interfacial tensionwhich reaches values close to zero. As the rate of transfer of aluminiumfrom metal to slag decreases with the progress of the reaction, there is arestoring effect, i.e. the interfacial tension increases, ultimately reachingthe equilibrium value of about 1200 mN m-1 as -d% All dt approacheszero.
5.8 DENSITY
Many repetitive measurements of slag densities have been made. Onlyselected references are given on the density data cited here for steelmak-ing type of slags. Since the density of silica (2.15g cm-3 at 1700°C)is much

Physicochemical Properties of Molten Slags 171
20TIME, min
Fig.5.36 Changes in metal-slag interfacial tension which occur during the transferof aluminium from a liquid Fe-AI alloy drop to molten calcium silicate in an inertatmosphere. From Ref. 34.
60
lower than the densities of other metal oxide components of slags, densi-ties of slags will decrease with an increasing silica content.
The density data for binary silicates are given in Fig. 5.37. The data inFig. 5.38 are for CaO-MgO-AI203-Si02 melts, relevant to neutral slags for
5
~i0214750C' (37,38)
MgO-Si02
cao-s~' (39)1700°C, (39)
2~------~--------~------~--------o 60 8040
Mass% Si02
Fig. 5.37 Densities of binary silicate melt. From Refs. 35-39.
20
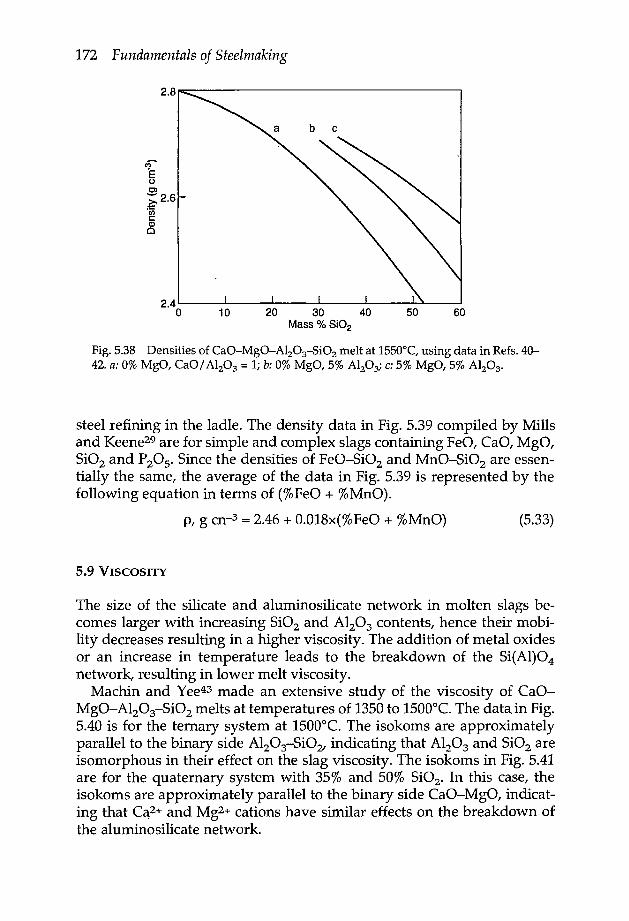
172 Fundamentals of Steelmaking
-C")
·EoC)
~2.6'Ci)c:C1>o
10 20 30 40Mass % Si02
50 60
Fig. 5.38 Densities of CaO-MgO-A1203-Si02 melt at 1550°C, using data in Refs. 40-42. a: 0% MgO, CaO/ A1203 = 1; b: 0% MgO, 5% A1203; c: 5% MgO, 5% A1203"
steel refining in the ladle. The density data in Fig. 5.39 compiled by Millsand Keene-? are for simple and complex slags containing FeO, CaO, MgO,Si02 and P205. Since the densities of FeO-Si02 and MnO-Si02 are essen-tially the same, the average of the data in Fig. 5.39 is represented by thefollowing equation in terms of (%FeO + %MnO).
p, g cn-3 = 2.46 + 0.018x(%FeO + %MnO) (5.33)
5.9 VISCOSITY
The size of the silicate and alumino silicate network in molten slags be-comes larger with increasing Si02 and Al203 contents, hence their mobi-lity decreases resulting in a higher viscosity. The addition of metal oxidesor an increase in temperature leads to the breakdown of the Si(AI)04network, resulting in lower melt viscosity.
Machin and Yee43made an extensive study of the viscosity of CaO-MgO-AI203-Si02 melts at temperatures of 1350to 1500°C.The data in Fig.5.40 is for the ternary system at 1500°C. The isokoms are approximatelyparallel to the binary side AI203-Si021 indicating that Al203 and Si02 areisomorphous in their effect on the slag viscosity. The isokoms in Fig. 5.41are for the quaternary system with 35% and 50% Si02. In this case, theisokoms are approximately parallel to the binary side CaO-MgO, indicat-ing that Cq2+and Mg2+cations have similar effects on the breakdown ofthe alumino silicate network.

Physicochemical Properties of Molten Slags 173
45
CJ••• •8l
.t4.. 1 -~
+ 5"10 16l13*J3.9 ·/~l/ flJ- /-50/03.8 . / /
3.7
/ 1IIIf. /
C? / ~ ~ /E / tOIC,,)
C) 3.6 • ~~ / 0/~ - ~CJen 3.5 ~/ ~ CJ /c •Q)
/ ~_®/03.4
~ / ~ ~ ~3.3
- ~ ,6 /~
3.2
3 1
3.0.
I29r
2.S127'-
I2 6~
2.50 10 20 30 i.0 50 60 70 80 90 100
Total mass % iron oxides
Fig. 5.39 Densities of simple and complex slags containing iron oxide at about1400°C. From Ref. 29.
In an earlier study, Turkdogan and Bills+s showed that for a giv~!ltemperature the viscosity of CaO-MgO-A1203-Si02 melts is a single func-tion of the mol fractions of Si02 and silica equivalence of A1203 as (NSiO +Na). In slags containing less than 20% A12031 N; SId NAl 0 . As is seen frdm
2 3

174 Fundamentals of Steelmaking
Fig. 5.40 Isokoms (O.lN s m-2) for CaO-A1203-Si02 system at 1500°C. From Ref. 43.
the plot in Fig. 5.42, a single curve represents the viscosities of CaO-Si0245, CaO-AI203-Si0243,46 and CaO-MgO-Alz03-SiOz43 melts. In asubsequent experimental work, Bills+? found that this correlation alsoholds good for CaO-BaO-FeO-Si02 and CaO-MgO-FeO-AI203-Si02melts.
For the temperature range 1400 to 1800°C, the temperature dependenceof viscosity may be represented as follows for (NSiO + Na) = 0.45 and 0.65
2
7477(NSi02 + Na) = 0.45: log 11 (O.IN s m-2) = ----r- - 3.727 (5.34a)
(Nsio2 + Na) = 0.65: log '11 (O.IN 5 m-2) = 10,::-5 - 4.390 (5.34b)
As one would expect, the heat of activation for viscous flow increases withincreasing contents of silica and alumina in the slag.
Viscosities of steelmaking slags are well represented by the experimen-tal data of Kozakevitch-? given in Fig. 5.43.
In the study of viscosities of mould fluxes for continuous casting, theexperimental results have been represented as a function of temperatureusing the relation
11 = AT exp (BII) (5.35)
where A and B are functions of slag composition. For the compositionrange (wt %) 33-56% Si021 12-45% CaO, 0-11% A1203, 0-20% Na20 and

Physicochemical Properties of Molten Slags 175
15
4S2~0----~----~3~0~--~~~~4~0--~-------5~O----~----~600
mass %CaO
500/08i02
10~--~~--~----~~~~~~~~~~~~--~o
30 40 50mass%CaO
20
Fig. 5.41 Isokoms (O.1N s m-2) for CaO-MgO-A1203-Si02 system at 1500°C formelts containing 35% and 50% Si02. From Ref. 43.
-20% CaFz1 an interpolation formula has been derived for the parametersA and B as a function of the mole fractions of the constituents as givenbelow.s''
In A = - 17.51 - 35.76x(AI203) + 1.73x(CaO)+ 5.82x(CaF2) + 7.02x(Na20)
B = 31140 + 68833x(AI203) - 23896x(CaO)- 46351x(CaFz) - 39519x(NazO)
(5.36)
(5.37)

176 Fundamentals of Steelmaking
Fig. 5.42 Viscosities of CaO-MgO-A1203-Si02 melts at 150QOC as a function of Si02
and A1203 contents. Points 0 • II from Ref. 43; Points /).from Ref. 45; points 0 fromRefs. 43 and 46.
where A is in units of 0.1 N s m-2K-l (=poise/ deg.) and B is in degreesKelvin.
5.10 MASS DIFFUSIVITY
Because of the ionic nature of molten slags, the diffusive mass transfer isby ions. The ionic diffusivities are measured using the radioactive tracerelements dissolved in an oxidised form in the melt. Typical examples ofionic diffusivities in slags at 1600°C are given below.
Ion Dt cm2/s
Si4+, 02-Al3+Ca2+, Mg2+, Fe2+5-2
4 X 10⁻⁷ - 1 x 1Q-6~ 1 x 10⁻⁷
6 X 10⁻⁶ - 1 X 10⁻⁵
~ 4 X 10⁻⁶
Since the electro neutrality has to be maintained, diffusion of a cation is

Physicochemical Properties of Molten Slags 177
CaO 90 80 70 60 50 40 30 20 10 FeOCaO(mass-es)
Fig. 5.43 Viscosity (N s m-2) of CaO-FeO-Si02 melts at 1400°C. From Ref. 27.
accompanied by diffusion of the oxygen ion. The diffusion that occurs inthe dissolution of a solid oxide in the slag is controlled by the mobility ofthe 02- ion which is smaller than the divalent cations.
5.11 ELECTRICAL CONDUCTIVITY
The electrical current in molten slags is carried by the cations. However, inslags containing high concentrations of FeO or MnO (>70%) the electronicconduction becomes the dominant mechanism. .
The ionic conductivity Ai is theoretically related to the self diffusivity ofthe ionic species i by the Nernst-Einstein equation
RT A.F2Z~C. l
l t
(5.38)
where F = Faraday constant, 96,500 C mol-1Z, = valency of ion iC, = concentration of ion i, mol cm='Ai = specific conductivity, Q-1cm-1
For steelmaking slags: A= 0.5 - 1.5 Q-lcm-l
For ladle slags: A= 0.4 - 0.7 Q-1cm-1

178 Fundamentals of Steelmaking
The electrical conductivity increases with an increasing slag basicity andincreasing temperature.
5.12 THERMAL CONDUCTIVITY
Because of the presence of iron oxide, the metallurgical slags are opaque toinfrared radiation, therefore the heat conduction is primarily thermal.
Thermal conductivity of slags and mould fluxes are in the range 0.5 to1.2 Wm-1K-l. From experimental data the following approximate empiri-cal relation has been found
K(Wm-1K-l) = 1.8 x 10⁻⁵V-l
where V is the molar volume = M, m3mol-1.p
(5.39)
REFERENCES
1. E.M. LEVIN, C.R. ROBBINS and H.F. McMuRDIE, Phase diagrams for ceramists,1974 3rd edn. Am. Ceram. Soc.
2. M.L. KEITH and D.F. TUTTLE,Am. J. Sci, 1952, 'Bowen Volume', Part I, 203.3. D.W. FLORKE,Naturwissen, 1956, 43, 419.4. S.B. HOLMQUIST,J. Am. Ceram. Soc., 1961, 44, 82.5. G. TROMEL,K. KOCH, W. FIX and N. GROBKURTH,Arch. Eisenhutienuies., 1969,
40, 969.6. K.L. FETIERS and J. CHIPMAN, Trans. AIME, 1941, 145, 95.7. R.J. LEONARDand R.H. HERRON, NOH-BOS Conference Proc., 1977, 60, 127.8. R. SELIN, Scan J. Metallurgy, 1991, 20, 279.9. E. GORL, R. KLAGES,R. SCHEELand G. TROMEL,Arch Eisenhiiiierunes., 1969,40,
959.10. E.T. TURKDOGAN, Physicochemical properties of molten slags and glasses, The
Metals Society (now The Institute of Materials), London, 1983.11. C.R. TAYLORand J. CHIPMAN, Trans. AIME, 1943, 159, 228.12. M. TIMUCIN and A.E. MORRIs, Metall. Trans, 1970, 1, 3193.13. R.H. REIN and J. CHIPMAN, Trans. Met. Soc. AIME, 1965, 233, 415.14. T. FUJISAWAand H. SAKAO, Tetsu-to-Hagane, 1977, 63, 1494, 1504.15. T.B. WINKLER and J. CHIPMAN, Trans. AIME, 1946, 167, 111.16. H. KNUPPEL and F. DETERS,Stahl u. Eisen, 1961, 81, 1437.17. G. TROMELand W. FIX, Arch. Eisenhidienuies, 1962, 33, 745.18. H.B. BELL,J. Iron and Steel Inst., 1963, 201, 116.19. H. Surro and R. INOUE, Trans. Iron and Steel Inst. Japan, 1984, 24, 257.20. T. USUI, K. YAMADA,Y. KAWAI, S. INOUE, H. ISHIKAWAand Y. NIMURA, Tetsu-
io-Hagane, 1991, 77, 1641.21. E.T. TURJ(DOGAN,Ironmaking and Steelmaking, 1993, 20, 469.22. F.D. RICHARDSONand J.H.E. JEFFES,]. Iron and Steel Inst., 1948, 160, 261.

Physicochemical Properties of Molten Slags 179
23. Y. IGUCHI,S. BAN-YAand T. FUWA, Trans. Iron and Steel Inst, Japan, 1969, 9, 189.24. K. ITO and R.J. FRUEHAN,Metall. Trans. B, 1988, , 19B, 419.25. S. BAN-YAand J.-D. SHIM, Can. Metall. Q., 1982, 21, 319.26. T .B. KING,]. Soc. Glass Technol., 1951, 35, 241.27. P. KOZAKEVITCH,Rev. Metall., 1949, 46, 505, 572.28. A.S. KIM, A.A. AKBERDINand I.5. KULIKOV,VINITI (USSR) Rept. No. 5508-81,
1981~29. K.C. MILLS and B.}. KEENE, Inter. Met. Rev., 1981, 26, 21.30. H. GAYE, L.D. LUCAS,M. OLETTEand P.V. RIBOUD, Can. Metall. Q., 1984, 23,
179.31. K. OGINO, S. HARA, T. MIWA and S. KIMOTO, Trans. Iron and Steel Inst. lapan.,
1984, 24, 522.32. J.J. THOMSON,Philos. Mag., 1855, 10(5), 330.33. C. MARANGONI,Ann. Phys. Chem., 1871, 143, 337.34. P.V. RrnOUD and L.D. LUCAS, Can. Metall. Q., 1981, 20, 199.35. D.R. GASKELL,A. McLEAN and R.G. WARD, Trans. Farady Soc., 1969, 65, 1498.36. Y. SKIRAISHI,K. IKEDA,A. TAMURAand T. SAITO, Trans. Japan Inst. Met., 1978,
19,264.37. Yu M. GOGIBERIDZE,M.A. KEKELIDZEand SHe M. MIKIASHVILI,Soob A Gruz.
SSR, 1963, 32(1), 117.38. L. SEGERS,A. FONTANAand R. WINAND, Electrochem. Acta., 1978, 23, 1275.39. J.W. TOMLINSON,M.S.R. HEYNESand J.O'M. BOCKRIs,Trans. Faraday Soc., 1958,
54, 1822.40. L.R. BARRETTand A.G. THOMAS,f. Glas Techno!., 1959, 43, 179s.41. H. WINTERHAGER,L. GREINERand R. KAMMEL,Forschungsberichte des Landes,
Nordrhein-Westfalen, Nr. 1630. Westdeutscher Verlag, 1966.42. E.V. KruNOCHKIN, K.T. KUROCHIN and P.V. UMRIKH1N,Fiz. Khim. Poverkh.
Yavlenii Rasp., 1971, pp. 179-83. Naukova Dumka, Kiev.43. J.S. MACHIN and T.B. YEE, J. Am. Cerm. Soc., 1948, 31, 200; 1954, 37, 177.44. E.T. TURKDOGANand P.M. BILLS,Am. Ceram. Soc., 1960, 39, 682.45. J. O'M. BOKRISand D.C. LOWE, Proc. R. Soc., 1954, 226A, 423.46. P. KOZAKEVITCH,Rev. Metall., 1960, 57, 149.47. P..M. BILLS,]. Iron and Steel Inst., 1963, 201, 133.48. P.V. RIBOUD, M. OLETTE, J. LECRECand W. POLLOK, NOH-BaS Conf Proc.,
1978, 61, 411. .

CHAPTER 6
Equilibrium Data on LiquidSteel-Slag Reactions
From the physicochemical properties of liquid iron alloys and slags docu-mented in Chapters 4 and 5 and the available experimental data on slag-metal reactions, an assessment will be made of the equilibrium states ofslag-metal reactions. and deoxidation reactions pertinent to steelmakingand steel refining in the ladle.
Understanding the physics and chemistry of ironmaking and steelmak-ing reactions has been the subject of many repetitive studies since the early1930s, both in academia and in government and industry sponsored re-search laboratories. The manner of applying the principles of thermo-dynamics and physical chemistry has gone through many different phasesof development, searching for a better understanding of the operation andcontrol of the pyrometallurgical processes. Reflecting upon the manyfacets of these previous endeavours, the author has now reached the con-clusion that the equilibrium states of slag-metal reactions, pertinent to thesteelmaking conditions, can be quantified in simpler forms. It is the au-thor's considered opinion that the equilibrium constants of slag-metalreactions vary with the slag composition in different ways, depending onthe type of reaction. For some reactions the slag basicity is the key param-eter to be considered; for another reaction the key parameter could be themass concentration of either the acidic or basic components of the slag.The equilibrium relations given are for low alloy steels in which the ac-tivities of dissolved elements are essentially equivalent to their massconcentrations.
6.1 OXIDATION OF IRON
In steelmaking slags, the total number of g-mols of oxides per 100 g of slagis within the range 1.65 ± 0.05. Therefore, the analysis of the slag-metalequilibrium data, in terms of the activity and mol fraction of iron oxidegiven in section 5.4.4, can be transposed to a simple relation between themass ratio [ppm 0] / (%FeO) and the sum of the acidic oxides %Si02 + 0.84x %P205 as depicted in Fig. 6.1a for slag basicities of B>2. The experimen-tal data used in the diagram are those cited in Fig. 5.22. There is of course acorollary relation between the ratio [ppm 0]/ (%FeO) and the slag basicityas shown in Fig. 6.1h.
180

Equilibrium Data on Liquid Steel-Slag Reactions 181
801600°C
6'CD
LL.
'#;;:400ECo.9:
00 10 20 30(a) % 8;02 + 0.84 x % P20S
80
6'1700°CCD
LLcfl.::::::'405'ECoB
02.2 2.6 3.0 3.4 3.8
(b) B
Fig. 6.1 Equilibrium ratio [ppm 0] I (%FeO) related to Si02 and P205 contents andslag basicity; experimental data are those cited in Fig. 5.22.
6.2 OXIDATION OF MANGANESE
For the FeO and MnO exchange reaction involving the oxidation of man-ganese in steel formulated below
(FeO) + [Mn] = (MnO) + [Fe] (6.1)
the equilibrium relation may be described in terms of the mass concentra-tions of oxides
K'FeMn·::::(%MnO) (6.2)(%FeO) [%Mn]
where the equilibrium relation K' FeMn depends on temperature and slagcomposition. The values of K' FeMn' derived from the equilibrium constantKpeMn in equation (S.13b) and the activity coefficient ratios YPeO/YMnO inFig. 5.23, are plotted in Fig. 6.2 against the slag basicity. In BOF, Q-BOPand EAF steelmaking, the slag basicities are in the range 2.5 to 4.0 and themelt temperature in the vessel at the time of furnace tapping in mostpractices is between 1600-1650°C, for which the equilibrium K'PeMn isabout 1.8 ± 0.2.

182 Fundamentals of Steelmaking
6
c:E,.f 4~ .
1.600°C2
1,650°C
'.70QoC
01.5 2.5 3.5 4.5
8
Fig.6.2 Equilibrium relation K'FeMn in equation (6.2)related to slag basicity.
6.3 OXIDATION OF CARBON
As noted in section 4.2.4, for the reaction
CO(g) = [C] + [0] (6.3)
the equilibrium constant for low alloy steels containing less than 1% C forsteelmaking temperatures, is
K= [%C][ppm 0] = 20Pco (atm)
(6.4)
With respect to the slag-metal reaction, the equilibrium relation forcarbon oxidation would be .
(FeO) + [C] = co + [Fe]
K - Pco (atm)FC - [%C]aFeO
log Kpc = - 5~0 + 5.096
(6.5)
(6.5a)
(6.Sb)

Equilibrium Data on Liquid Steel-Slag Reactions 183
For 1600°C, YFeO = 1.3 at slag basicity of B = 3.2 and Peo == 1.5 atm(average CO pressure in the vessel), we obtain the following equilibriumrelation between the carbon content of steel and the iron oxide content ofslag.
KFC = 108.8
apeO = 1.3NpeO "" 72 ~·~.65 (%FeO) = 0.11 x (%FeO)
(%FeO) [%C] = 1.25 (6.6)
For the reaction
(MnO) + [C] = CO + [Mn]
the following equilibrium relations apply
KMC
= Pco (atm) [%Mn][%C]aMnO
log KMC = - 13'i82 + 8.574
(6.7)
(6.7a)
(6.7b)
KMC = 34.4 at 1600°C, YMnO= 2.05 at B = 3.2 and aMno = 71 2;0{65 (%MnO)
= 0.017 (%MnO). For these values and 1.5 atm CO we obtain the followingequilibrium relation.
[%Mn](%MnO) = 0.4 [%C] (6.8)
6.4 OXIDATION OF SILICON
For low silicon contents we may use mass concentrations of Si and 0 in theequilibrium constant for the reaction
[Si] + 2[0] = (Si02) (6.9)
[%Si][%0]2(6.9a)
where the silica activity is with respect to solid Si02 as the standard state.The temperature dependence of KSi is given by
I K 30,410 - 11.59og Si = T (6.9b)
For the BOF tap temperatures K == 3 x 10⁴ and for lime-saturated slags aSi;z< 0.01; therefore for 800 ppm 0 in steel at turndown the equilibrium con-tent of silicon in the steel would be less than 1 ppm Si. In practice the steel

184 Fundamentals of Steelmaking
contains 0.003 to 0.005% Si at turndown. Evidently, at these low concentra-tions of silicon the reaction kinetics are no longer favourable to reach slag-metal equilibrium with respect to silicon oxidation.
6.5 OXIDATION OF CHROMIUM
There are two valencies of chromium (Cr2+and Cr3+)dissolved in the slag.The ratio Cr2+/ Cr3+ increases with an increasing temperature, decreasingoxygen potential and decreasing slag basicity. Under steelmaking condi-tions, i.e. in the basic slags and at high oxygen potentials, the trivalentchromium predominates in the slag. The equilibrium distribution of chro-mium between slag and metal for basic steelmaking slags, determined byvarious investigators.t-" is shown in Fig. 6.3; slope of the line represents anaverage of these data.
Il ~~~II
0
•2
0 4 8 12 16 20 24 28.Faa 1 wt->
Fig. 6.3 Variation of chromium distribution ratio with the iron oxide content of slag,in the (~) open hearth! and (0) electric arc furnaces at tap is compared with theresults of laboratory experiments- (e).
(%Cr)[%Cr]
In the AOD stainless steelmaking with bottom blowing argon-oxygenmixtures, the chromium and carbon are oxidised independently of eachother. As the chromic oxide particles float out of the melt together with gasbubbles they react with carbon, resulting in some chromium recoveryback into the steel. The temperature and gas composition have a signifi-cant effect on the direction of the reaction.
= (0.3 ± 0.1) x (%FeO) . (6.10)
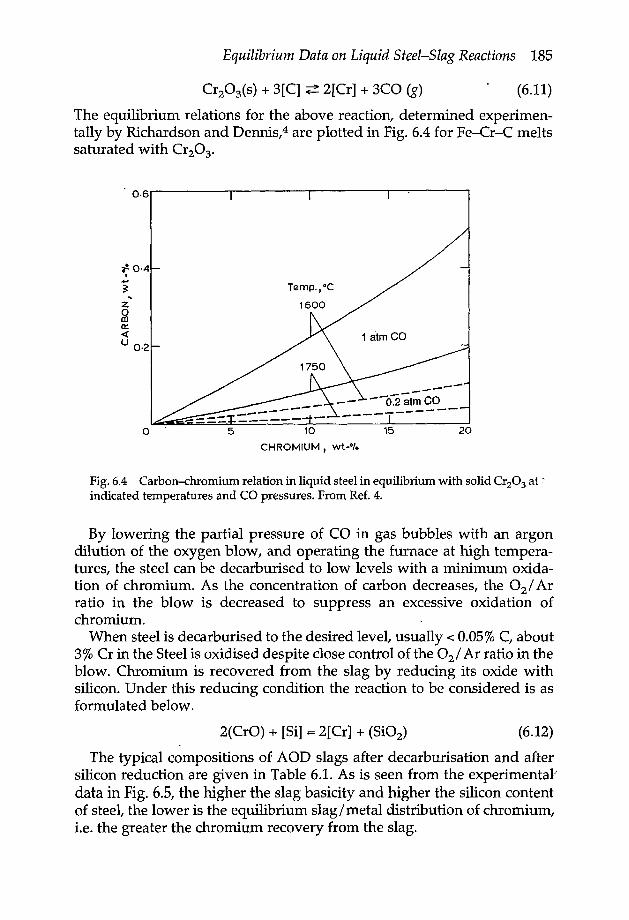
Equilibrium Data on Liquid Steel-Slag Reactions 185
(6.11)
The equilibrium relations for the above reaction, determined experimen-tally by Richardson and Dennis,« are plotted in Fig. 6.4 for Fe-Cr-C meltssaturated with Cr203'
0·6
;! 0·4I
~ZoCDa::4:U 0.2
Temp.,oC
o . 5 10
CHROMIUM t wt->15 20
Fig. 6.4 Carbon-chromium relation in liquid steel in equilibrium with solid Cr203 at .~indicated temperatures and CO pressures. From Ref. 4.
By lowering the partial pressure of CO in gas bubbles with an argondilution of the oxygen blow, and operating the furnace at high tempera-tures, the steel can be decarburised to low levels with a minimum oxida-tion of chromium. As the concentration of carbon decreases, the O2/ Arratio in the blow is decreased to suppress an excessive oxidation ofchromium.
When steel is decarburised to the desired level, usually < 0.05% C, about3% Cr in the Steel is oxidised despite close control of the O2/ Ar ratio in theblow. Chromium is recovered from the slag by reducing its oxide withsilicon. Under this reducing condition the reaction to be considered is asformulated below.
2(CrO) + [Si]= 2[Cr] + (Si02) (6.12)
The typical compositions of AOD slags after decarburisation and aftersilicon reduction are given in Table 6.1. As is seen from the experimental'data in Fig. 6.5, the higher the slag basicity and higher the silicon contentof steel, the lower is the equilibrium slag/metal distribution of chromium,i.e. the greater the chromium recovery from the slag.

186 Fundamentals of Steelmaking
Table 6.1 Ranges of ADD slag composition after decarburisationand after silicon reduction
Composition, wt. %
after decarburisation after silicon reduction
FeDMnOSiD2A1203CaOMgOCr304*
4-64-812-1818-228-157-15
20-30
1-21-330-403-8
33--4310-201-3
* Incorrect formulation often reported in plant data.
-I~b u~ "I-_ L..J
eno
-2----------~--------~~------~--------~-3 -2 -1 olog [o/oSi]
Fig.6.5 Equilibrium slag/metal chromium distribution varying with the concentra-tion of silicon in iron coexisting with chromium oxide containing CaO-A1203-Si02
slags at temperatures of 16000 to 1690°C. See Ref. 5 for references to experimental data.
6.6 OXIDATION OF PHOSPHORUS
The state of equilibrium of the phosphorus reaction between slag and lowalloy steel has been described and formulated in a variety of ways duringthe past six decades. The incorrect earlier formulations are shown below.
3(CaO) + 5(FeO) + 2[P] = (Ca3P208)
2[P] + 5[0] = (P205)
(6.13)
(6.14)

Equilibrium Data on Liquid Steel-Slag Reactions 187
It was in the late 19608 that the correct formulation of the phosphorusreaction was at last realised, thus
(6.15)
At low concentrations of [P] and [0], as in most of the experimentalmelts, their activity coefficients are close to unity, therefore mass con-centrations can be used in formulating the equilibrium relation kpo for theabove reaction.
k = (%P) [0'- 0]-2.SPO [%P] /0
(6.16)
The equilibrium relation kpo, known as the phosphate capacity of the slag,depends on temperature and slag composition. The values of kpo arederived from the experimental data of several independent studies,6-10asdiscussed below.
In the experiments of Nagabayashi et al.B the MgO-saturated FeO-MgO-P20S slags were equilibrated with liquid iron containing 1.5 to 3.0%p and 0.1 to 0.2% O. For these high solute concentrations, the phosphorusand oxygen interaction coefficients have to be incorporated in the calcula-tion of kpo using the equations below.
logfp = 0.062[%P]
logfo = 0.07[%P] - 0.1[%0]
(6.17a)
(6.17b)
As is seen from the experimental data plotted in Fig. 6.6, the slagbasicity B is not a suitable parameter to describe the composition
106 i:cl ••~o •••0
.e105 + +0: ••+ 0
, • lc c •t D CC 0
104 ~~ CJQJ C
c-+--0 JQ.~
103 + Cn 1,600°C DlD
102 [JC C
C~
1010 4 8 12
B
Fig. 6.6 Phosphate capacities of slags do not relate to basicity.

188 Fundamentals of Steelmaking
dependence of the phosophate capacity of slags. Of the basic oxides pres-ent in the steelmaking type of slags, it is primarily %CaO (+ CaF2) andsecondarily %MgO in the slag which strongly influence the phosphatecapacity of the slag.
By comparing the kpo values for the system FeO-MgO-P 205 with thosefor the lime containing slags, %CaO equivalence of MgO is estimated to be0.3 x %MgO. The %CaF2 is taken to be equivalent to %CaO. On thispremise, the sum of these basic oxides as
BO = %CaO + %CaF2 + 0.3 x %MgO (6.18)
is considered to be the key parameter in describing the composition de-pendence of the phosphate capacity of the slag. The kpo values of widelydifferent slag compositions are plotted in Fig. 6.7.
107
1600°C Ref. 107Ref.
6 !}1550°C7 -With CaF28 1\9 g } 1700°C10 x With CaF2 I.
105 * Fig. 6.8 ~ 105 + 10• Fig. 6.8
0~104 104
103 103
102 102
o101 101 '--- __ ---..I.. __!._ __ --'"'"
o 20 40 60 0 20 40 60B 0 = % CaO + 010 CaF2 + 0.3 x 010 MgO B 0 = % CaO + 010 CaF2 + 0.3 x % MgO
Fig. 6.7 Equilibrium data showing the decisive effects of CaO, CaF2 and MgO onphosphate capacities of simple and complex slags.
The observed scatter in the kpo values is random and not related in anysystematic manner to variations in the concentrations of other oxide com-ponents of the slag. The average kpo values are represented by the parallellines drawn to intersect the ordinate at points * for pure iron phosphatemelts.
Several studies were made in the 1930S11-14 and subsequently byTromel and Schwerdtfeger= of the phosphorus reaction between ironphosphate slags and liquid iron containing up to about 10% P. About tenyears ago, Ban-ya et al.16 measured the activity of iron oxide in iron phosp-hate melts at temperatures of 1200to 1450°C.In deriving the values of kpofrom these experimental data, due account was taken of the effect of
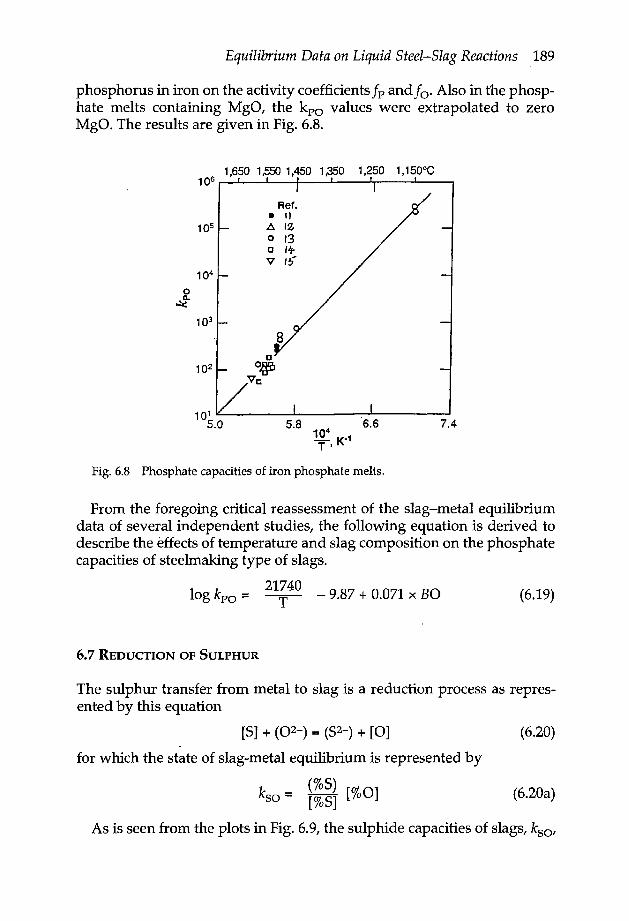
Equilibrium Data on Liquid Steel-Slag Reactions 189
phosphorus in iron on the activity coefficients fp andfo. Also in the phosp-hate melts containing MgO, the kpo values were extrapolated to zeroMgO. The results are given in Fig. 6.8.
1,650 1,550 1,450 1,350 1,250 1,150°C106 __ ~~--~--~--~~--~--~
Ref.• Its: 12o 13o 1+V I~
105
104
0D.
~103
102
1015.0 5.8 4 -6.6 7.4
~ K-1T'Fig. 6.8 Phosphate capacities of iron phosphate melts.
From the foregoing critical reassessment of the slag-metal equilibriumdata of several independent studies, the following equation is derived todescribe the effects of temperature and slag composition on the phosphatecapacities of steelmaking type of slags.
21740log kpo = -T- - 9.87 + 0.071 x BO (6.19)
6.7 REDUCTION OF SULPHUR
The sulphur transfer from metal to slag is a reduction process as repres-ented by this equation
[5] + (02-) = (52-) + [0]
for which the state of slag-metal equilibrium is represented by
(6.20)
(%5)kso = [%S] [%0] (6.20a)
As is seen from the plots in Fig. 6.9, the sulphide capacities of slags, kso,

190 Fundamentals of Steelmaking
measured in three independent studies are in general accord. The effect oftemperature on kso is masked by the scatter in the data. The concentrationof acidic oxides, e.g. %Si02 + 0.84 x%P2051 rather than the slag basicityseems to be a better representation of the dependence of kso on the slagcomposition. -
• Ref •b. 1,EOO 8o 1,6CX) } 10• 1,625-1,715X 1,600 6
1.0
0.85' 0
~~I~ 0.6~LIIo
~
o~--~--~----~~~o 10 20 30 40 1
Fig. 6.9 Sulphide capacities of slags.
x
• • 0 AX
o· A
2 3
84 5
In view of the relationship between the ratio [ppm 0] / (%FeO) and thesum of the acidic oxides in Fig. 6.1, the sulphide capacity of the slag maybe represented also by the following expression.
ks = (%5)[%5] (%PeO] (6.21)
As the concentrations of 5i02 and P205 increase, the value of ks decreases,as shown in Fig. 6.10 which is reproduced from a previous publication."
For steel desulphurisation in the ladle with the calcium aluminate-basedslag and aluminium addition to steel, the slag-metal equilibrium data arefor the reaction given below
(6.22)2f3[AI] + [5] + (02-) = (52-) + Ih(A1203)
for which the equilibrium relation is
_ (%5)KSA - [%5] [%AI]-2I3 (6.22a)

Equilibrium Data on Liquid Steel-Slag Reactions 191
40
o 10 20 30%Si02+0·84 (o/OP205)
40
Fig.6.10 Variation of the equlibrium constants Ks with Si02 and P20S contents ofsimple and complex slags at temperatures of 1535° to 1700°C. From Ref. 5.
Numerous experimental studies have been made of the sulphide capa-cities of simple and complex slags by many investigators. The availablegas-slag-metal equilibrium data, compiled by the author-" in a criticalreview of the subject, are used to derive the equilibrium relations pertinentto steel desulphurisation in the ladle. .
The effects of temperature and composition of calcium aluminate melts onthe equilibrium constant KSA are shown in Fig. 6.11. As is seen from the reas-sessed equilibrium data in Fig. 6.12 for 1600°C,KSA decreases with an increas-ing Si02 content but increases with an increasing MgO content of the slag.
The solubilities of CaS in CaO-A1203 melts have been measured (Fig.6.13). At 1600°C and lime saturation the solubility is 4.77% CaS == 2.12% S.If the sulphur "content of the steel is high and the slag volume is low, theladle slag will become saturated with CaS during desulphurisation. As thedesulphurisation continues the excess CaS formed becomes dispersed inthe slag, resulting in a decrease in the dissolved CaO content of the slag,hence decreasing the value of KSA'

192 Fundamentals of Steelmaking
4.4
~en~ 4.0.Q
3.6
3.2 &"'-~--L.I---.....c;...._..J- __ ...J-__ -'0.8 1.0 1.2 1.4
% CaO/%AI203
Fig. 6.11 Effects of temperature andcomposition of calcium aluminate melts
th ilib . t t K (%5)on e qu 1 num cons an SA = [01 S1[%AI]-2/3. 10
1.6
4.0
3.6
3.2
1.2 1.3 1.4% CaO/Olo AI203
1.5
Fig. 6.12 Effects of Si02 and MgO onthe equilibrium constant KSA at 1600°C.
4.8r---------__...----.,
4.0
~ 3.2en~5en(3 2.4
1.6 '~,Aluminatesatur. ~
oe Ozturk & Turkdogan 18
!;). Sharma & Richardson 19
A Kor & Richardson200.8 L..-__ -1- __ ----JI...- __ --'-- __ ----J
0.4 0.8 1.2 1.6 2.0Mass ratio % CaO/% AI203
Fig. 6.13 Solubility of CaS in calcium aluminate melts at indicated temperatures as afunction of mass ratio %CaOI%A1203•
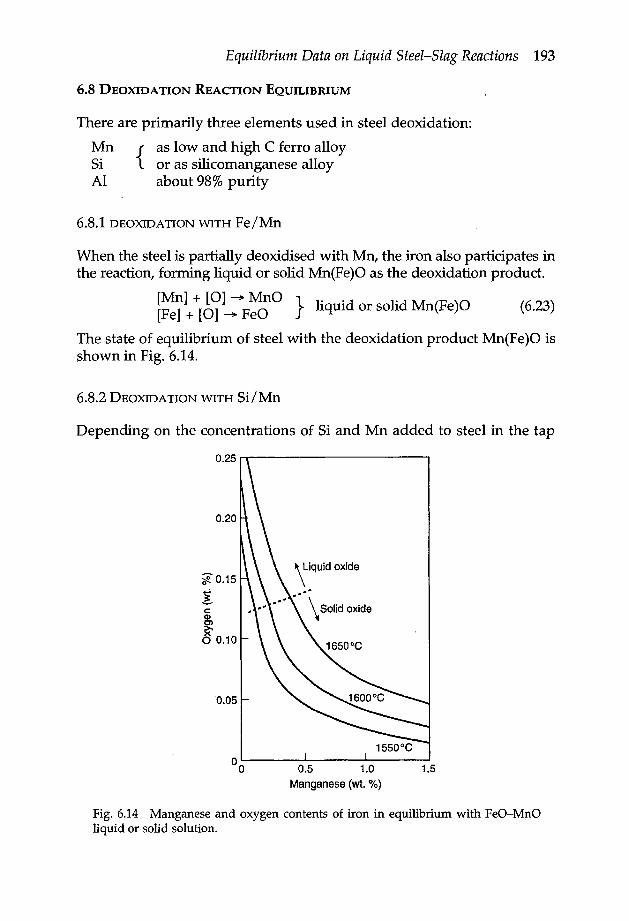
Equilibrium Data on Liquid Steel-Slag Reactions 193
6.8 DEOXIDATION REACTION EQUILIBRIUM
There are primarily three elements used in steel deoxidation:
Mn {as low and high C ferro alloySi or as silicomanganese alloyAl about 98% purity
6.8.1 DEOXIDATION WITH Fe/Mn
When the steel is partially deoxidised with Mn, the iron also participates inthe reaction, forming liquid or solid Mn(Fe)O as the deoxidation product.
[Mn] + [0] ~ MnO } Iiouid lid M (F )0 (6.23)[Fe] + [0] -+ FeO qUI or so n e
The state of equilibrium of steel with the deoxidation product Mn(Fe)O isshown in Fig. 6.14.
6.8.2DEOXIDATION WITH Si/Mn
Depending on the concentrations of Si and Mn added to steel in the tap
0.25 ,....------------,
0.20
\LiqUid oxide
....• ' \ Solid oxide
~0.15
ic:<l>
~o 0.10
·0.05
0.5 1.0 1.5Manganese (wt. 0,,(,)
Fig. 6.14 Manganese and oxygen contents of iron in equilibrium with FeO-MnOliquid or solid solution.

194 Fundamentals of Steelmaking
ladle, the deoxidation product will be either molten manganese silicate orsolid silica.
[Si] + 2[0] ~ sio, } molten xMnO·SiOz[Mn] + [0] ~ MnO or solid Si02
(6.24)
One of the early pioneering studies of slag-metal reaction equilibria isthat attributed to Korber and Oelsen-! for their measurement of theequilibrium distribution of manganese and silicon between liquid iron andMnO-FeO-SiOz slags saturated with silica. The results of their experimentsat 1600 ± 10°C are shown in Fig. 6.15 by way of example; these equilibriumdata have been substantiated in numerous subsequent studies.
Value of the equilibrium constant for Si deoxidation is already given inequation (6.9). The following equilibrium relation is obtained for the Si/Mn deoxidation reaction
[Si] + 2(MnO) = 2[Mn] + (Si02) (6.25)
50 o~o 1-0
o0-~ ~o : ..c 02: ~20" 30
o0--
10 -40
1-2 1-60-4 0-8Mn,%
Fig. 6.15 Concentrations of Mn, Si and 0 in liquid iron equilibrated with Si02-
saturated iron-manganese silicate melts at 1600° ± IOcC.From Ref. 21.

Equilibrium Data on Liquid Steel-Slag Reactions 195
K "= {[%Mn]}2 asio2 (6.25a)MnSl aMnO [%Si]
1510log K = --r + 1.27 (6.25b)
where the oxide activities are relative to pure solid oxides. For high con-centrations of silicon (>0.4%)the activity coefficient lSi should be used inthe above equation, thus logfsi = 0.11 x [%Si].
The activities of MnO in manganese silicate melts have been measured
Si02 saturated
-c-' 1500___ 1600
1: 1.6CD,'u:=CD
8~";'£~ 0.8
o ~ ~ ~0.8 1.6 2.4 3.2
Molar ratio MnOSi02
1.0
0.8
0.60c:~
<:!
0.4
0.2
Fig. 6.16 Activities in MnO-Si02 melts with respect to solid oxides, derived fromthe experimental data in Refs. 22 and 23.

196 Fundamentals of Steelmaking
0.02
SATURATED WITH SOLID Si02
I0.01
MOLTEN SILICATE
o~----~~~------~--------~--------~o 0.1 0.2SILICON, wt %
0.3 0.4
0.10~s DEOXIDATIONZ- PRODUCT:0 SOLID SILICAo~ ~en DEOXIDATION
0.05 PRODUCT:MOLTEN
MANGANESESILICATE~
00 0.25 0.50 0.75 1.0
MANGANESE, wt %
Fig.6.17 Equilibrium relations for deoxidation of steel with silicon and manganeseat 1600°C.
by Rao and Gaskell.s- Their results are in substantial agreement with theresults of the earlier work by Abraham et al.23 The activity coefficients ofthe oxides (relative to solid oxides) are plotted in Fig. 6.16. For liquid steelcontaining Mn>O.4% the deoxidation product is a MnO-rich silicate withFeO<8%; therefore the activity data in Fig. 6.16 can be used together withequations (6.9) and (6.25) in computing the equilibrium state of the Si/Mndeoxidation as given in Fig. 6.17a. The deoxidation product being eithersolid silica or molten manganese silicate depends on temperature, Si andMn contents, as shown in Fig. 6.17b.

Equilibrium Data on Liquid Steel-Slag Reactions 197
6.8.3 DEOXIDATION WITH Si/Mn/ Al
Semi-killed steels with residual dissolved oxygen in the range 40 to 25ppm are made by deoxidising steel in the tap ladle with the addition of asmall amount of aluminium together with silicomanganese, or a combina-tion of ferro silicon and ferromanganese. In this case, the deoxidation prod-uct is molten manganese alumino silicate having a composition similar to3MnO·AI203·3Si02• With a small addition of aluminium, e.g. about 35 kgfor a 220 to 240 t heat together with Si/Mn, almost all the aluminium isconsumed in this combined deoxidation with Si and Mn. The residualdissolved aluminium in the steel will be less than 10 ppm. As is seen fromFig. 5.21, for the deoxidation product MnO-AI203-Si02 saturated withA1203, the silica activities are 0.27 at 1650°C, 0.17 at 1550°C and decreasingprobably to about 0.12 at 1500°C. Using these activity data and equation(6.9) the deoxidation equilibria are calculated for AI/Si/Mn; these arecompared in Fig. 6.18 with the residual ppm 0 for the Si/Mn deoxidationat the same concentrations of Mn and Si.
160~----------------------~~
40
0/0 Mn % Si0.4 0.05
.------- 0.4120
E.9; 80
o
o~----~----~------~----~1500 1525 1550 1575 "1600
Temperature (OC)
Fig. 6.18 Deoxidation equilibria with Si/Mn compared with All Si/Mn for the de-oxidation product saturated with A1203.
6.8.4 DEOXIDATION WITH Al
Numerous laboratory experiments have been made on the aluminiumdeoxidation of liquid steel using the EMF technique for measuring the.oxygen activity in the melt. The equilibrium constants obtained from inde-pendent experimental studies agree within about a factor of two. An aver-age value for the quilibrium constant is given below.
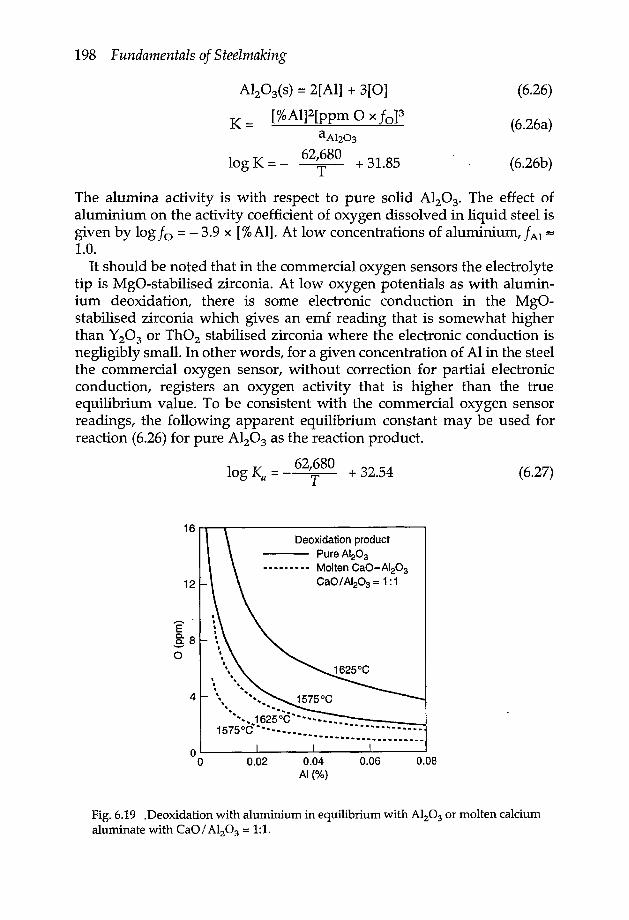
198 Fundamentals of Steelmaking
K=[%AI]2[ppm 0 x fO]3
(6.26)
(6.26a)aAl203
log K = - 62~80 + 31.85 (6.26b)
The alumina activity is with respect to pure solid A1203• The effect ofaluminium on the activity coefficient of oxygen dissolved in liquid steel isgiven by log 10 = - 3.9 x [%AI]. At low concentrations of aluminium, fAI ~1.0.
It should be noted that in the commercial oxygen sensors the electrolytetip is MgO-stabilised zirconia. At low oxygen potentials as with alumin-ium deoxidation, there is some electronic conduction in the MgO-stabilised zirconia which gives an emf reading that is somewhat higherthan y203 or Th02 stabilised zirconia where the electronic conduction isnegligibly small. In other words, for a given concentration of Al in the steelthe commercial oxygen sensor, without correction for partial electronicconduction, registers an oxygen activity that is higher than the trueequilibrium value. To be consistent with the commercial oxygen sensorreadings, the following apparent equilibrium constant may be used forreaction (6.26)for pure Al203 as the reaction product.
log s; = 62/~80 + 32.54 (6.27)
12
Deoxidation product--- Pure AI203- _. _. -. - - Molten CaO-AI20a
CaO/AI203 = 1:1
4
o~----~----~------~----~o 0.02 0.04 0.06 0.08AI (%)
Fig.6.19 .Deoxidation with aluminium in equilibrium with A1203 or molten calciumaluminate with CaOI Al203 = 1:1.

Equilibrium Data on Liquid Steel-Slag Reactions 199
When the Al-killed steel is treated with Ca-Si the alumina inclusions areconverted to molten calcium aluminate. For the ratio %CaO/ A1203 = 1:1,the activity of Al203 is 0.064with respect to pure Al203 at temperatures inthe range lS00-1700°C. The apparent equilibrium relations, consistentwith the readings of commercial oxygen sensors, are shown in Fig. 6.19 forthe deoxidation products: pure Al203 and molten calcium aluminate with%CaOf%AI203 = 1:1.
REFERENCES
1. P. BREMER, Stahl u. Eisen, 1951, 71, 575.2. R.V. PATHY and R.G. WARD, J. Iron and Steel Inst., 1964, 202, 995.3. E. AUKRUST, P.J. KOROS and H.W. MEYER, J. Met., 1966, 18, 433.4. F.D. RICHARDSON and W.E. DENNIS, ]. Iron and Steellnst., 1953, 175, 257, 264.5. E.T. TURKDOGAN, Physicochemical properties of molten slags and glasses, The
Metals Society (now The Institute of Materials), London, 1983.6. H. KNuPPEL and F. OETERS, Stahl u. Eisen, 1961, 81, 1437.7. H. SUITO, R. INOUE and M. TAKADA, Trans. Iron and Steel Inst, Japan, 1981, 21,
250; 1982, 22, 869.8. R. NAGABAYASHI, M. HINO and S. BAN-YA, Teisu-to-Hagane, 1988, 74, 1577.9. J.C. WRAMPELMEYER, S. DIMITROV and D. JANKE, Steel Research, 1989, 60, 539.
10. T.B. WINKLER and J. CHIPMAN, Trans. AIME, 1946, 167, 111.11. C.H. HERTY, Trans. AI ME, 1926, 73, 1107.12. H.O. VON SAMSON-HIMMELSTJERNA, Arch Eisenhiutenues, 1932, 6, 471.13. W. BISCHOF and E. MAURER, Arch. Eisenshuttenioes, 1932, 6, 415.14. E. MAURER and W. BISCHOF,]. Iron and Steel Inst., 1935, 132, 13.15. G. TROMEL and K. SCHWERDTFEGER, Arch. Eisenhidienuies, 1963, 34, 101.16. S. BAN-YA, T. WATANABE and R. NAGABAYASGI, in Advances in the science of
iron and steelmaking, p. 79. Japan/USA Seminar, Kyoto, May 16-28, 1983.17. E.T. TURKDOGAN, Ironmaking and Steelmaking., 1988, 15, 311.18. B. OZTURK and E.T. TURKDOGAN, Metal Science, 1984, 18, 299.19. R.A. SHARMA and F.D. RICHARDSON,]. Iron and Steel Inst., 1961, 198, 386.20. G.J.W. KOR and F.D. RICHARDSON, J. Iron and Steel Inst., 1968, 206, 700.21. F. KORBER and W. OELSEN, Mitt. Kaiser-Wilhelm Inst. Eisenforsch, 1935, 17, 231;
1933, IS, 271.22. B.K.D.P. RAO and D.R. GASKELL, Metall. Trans. B., 1981, 12B, 311.23. K.P. ABRAHAM, M.W. DAVIES and F.D. RICHARDSON, J. Iron and Steel Inst.,
1960, 196, 82.

CHAPTER 7
Pretreatment of Blast FurnaceIron
The impetus to hot metal refining developed by the Japanese steel indus-try was, in part, to accomplish the objective of improving cost effective-ness in steelmaking by reducing the volume of waste product slag to bedisposed of.
The hot metal refining, developed primarily by the steel industry in Japan,involves two or three processing steps. The first step is desiliconisation toresidual Si < 0.15 percent. After deslagging, the hot metal is desulphurisedand dephosphorised by injecting with nitrogen plus oxygen a mixture ofsinter fines, burnt lime, calcium fluoride and some calcium chloride. In somepractices, sodium carbonate alone is injected. There are many variations inthe method of hot metal refining practices in the Japanese steel industry. Asexamples, the flow diagrams of three different refining processes are shownin Figs. 7.1, 7.2, 7.3.For a comprehensive review of these developments in thelate 1970s, reference may be made to the papers by Fuwa! and Ishihara.s
Desiliconisation by additionof Mn ore or Fe ore onto
runnerSoda ash
recovery plant
Fig. 7.1 Hot metal refining with Na2C03 in torpedo car - Kashima Works ofSumitomo Metal Industries.
7.1 DESILICONISATION
To improve steelmaking in open hearth furnaces, attempts were made inthe 1940s in the European and North American steel plants to lower thesilicon content of hot metal from more than 1% Si to 0.4-0.6% Si. This wasdone simply by adding dried mill scale either onto the blast furnace run-ner or into the hot metal transfer ladle.

Pretreatment of Blast Furnace Iron 201
The desiliconised slag and ~DePhOSPhoriSing.the dephosphorised slag reagent
are combined
~ l~:~g(J- ~ ~1 ~ L------ISlag granulation 'tjJ
Desiliconisingreagent
The dephosphorisedslag held in wait
Fig.7.2 Hot metal refining with lime-seale-salt in torpedo car - Kimitsu Works ofNippon Steel Corporation.
B.F.
{
Scale {SCaleScale CaO CaDfl9 CaF2 CaF2
.. :dEo2
:rc>~: Qfi +. +Deslagging Deslagging
Ar, N2BOF
Fig. 7.3 Hot metal refining with lime-seale-salt in transfer ladle - Keihin Works ofNKK Corporation.
Table 7.1 Desilieonisation Processes
Efficiency %Process Reagent usage for ASi = 0.4%
80-90Mill scale and lime added to BF 15-25 kg t-1 mill scalerunner 8-10 kg t-1 lime
Mill scale added to transfer ladle 32 kg t-1
Mill scale injection into torpedo 15-25 kg t-1 for 0.25% ASicarOxygen blowing into torpedocar
0.13 Nm3 min-1t-1
Deep oxygen injection intotransfer ladle
0.3 Nm3 min-1t-1 45-55
60-8040-60
35-40
In more sophisticated present practices, the hot metal is desiliconisedfrom 0.4-0.6% to less than 0.15%, to facilitate the subsequent stage-ofrefining for phosphorus and sulphur removaL Various methods of de-siliconisation are listed in Table 7.1.

202 Fundamentals of Steelmaking
Depending on the operating conditions, there is a temperature gain or lossof about ± 20°C when mill scale or ore sinter fines are used for desiliconisa-tiona Although the oxidation of silicon with iron oxide is an exothermicreaction, a temperature loss in hot metal may occur because of slag removal,using moist reagents, extra fluxes or carrier gases. At low levels of initialsilicon content some decarburisation does occur during desiliconisationwhich also contributes to a drop in melt temperature. With oxygen lancingthe hot metal temperature will increase by between 120°C and 150°C.
The slags produced during desiliconisation contain primarily Si021 FeO,MnO and CaO. Since the phosphorus and sulphur contents of these slagsare low they can be recycled to the sinter plants.
7.2 DEPHOSPHORISATION & DESULPHURISATION
After desiliconisation and slag removal, the hot metal is dephosphorisedand desulphurised with the injection of an oxidising basic flux mixtureusing nitrogen or air as a carrier gas and accompanied with top or bottomblowing of oxygen in some processes. Examples of processes and fluxesused are summarised in Table 7.2.
Table 7.2 Dephosphorisation & Desulphurisation Processes
%P %5
Process Vessel Flux mixture, % kgr-l Before After Before After
Injection with N2 Torpedo 35 CaO, 55 mill scale 52 0.10 0.015 0.025 0.005car 5 CaF2I 5 CaCI2
Injection with N2 Torpedo Na2C03 15 0.09 0.011 0.040 <0.01O2 top blowing car 20 0.11 0.020 0.060 <0.01
Na2C03 top addition Ladle Na2C03 20 0.10 <0.010 0.030 <0.005O2 top blowingN2 bubbling
Injection with N2 Ladle 30 CaD, 62 sinter fines 45 0.12 0.010 0.025 <0.014 CaF24 CaC12
Injection with N2 Ladle 38 CaD, 42 sinter fines 40 0.10 0.010 0.040 0.02O2 top blowing 20 CaF2O2 bottom blowing Q-BOP 39 CaO, 55 sinter fines 51 0.14 0.010 0.020 0.01
6 CaFz
As is seen from the experimental and plant data in Fig. 7.4 reported byMarukawa-', high phosphorus distribution ratios between slag and metalare obtained at a lower temperature treatment of hot metal with soda ash.A major drawback to using sodium carbonate-based fluxes is in the evolu-tion of alkali fumes from the reduction of carbonate by carbon in iron
Na2C03 (1)+ 2[C] ~ 2 Na(g) + 3 CO (g) (7.1)
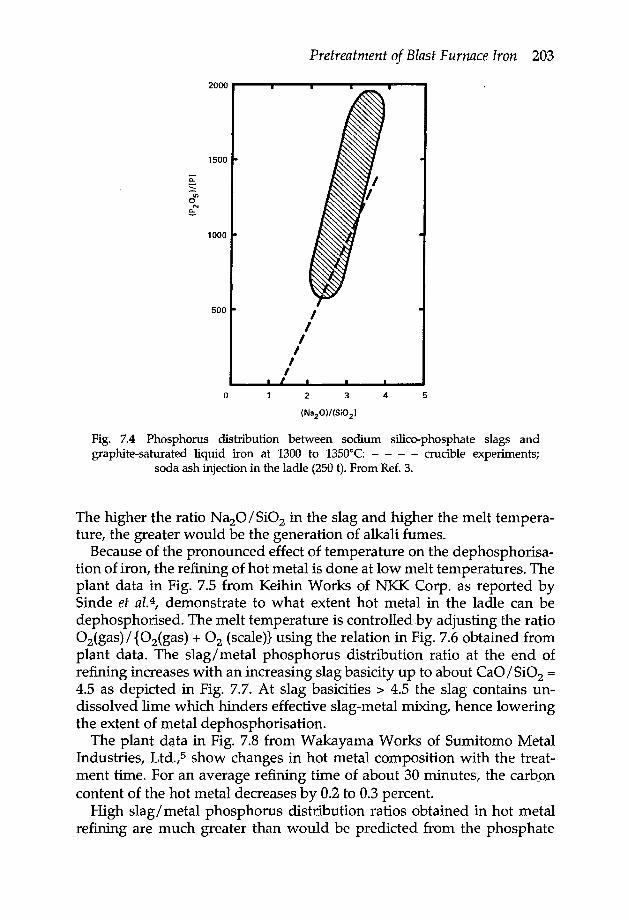
Pretreatment of Blast Furnace Iron 203
IIIIII
o 2 3 4 5
Fig. 7.4 Phosphorus distribution between sodium silico-phosphate slags andgraphite-saturated liquid iron at 1300 to 1350°C: - - - - crucible experiments;
soda ash injection in the ladle (250t). From Ref. 3.
The higher the ratio Na20/Si02 in the slag and higher the melt tempera-ture, the greater would be the generation of alkali fumes.
Because of the pronounced effect of temperature on the dephosphorisa-tion of iron, the refining of hot metal is done at low melt temperatures. Theplant data in Fig. 7.5 from Keihin Works of NKK Corp. as reported bySinde et al», demonstrate to what extent hot metal in the ladle can bedephosphorised. The melt temperature is controlled.by adjusting the ratio02(gas)/ {02(gas) + O2 (scale)}using the relation in Fig. 7.6 obtained fromplant data. The slag/metal phosphorus distribution ratio at the end ofrefining increases with an increasing slag basicity up to about CaO/ Si02 =4.5 as depicted in Fig. 7.7. At slag basicities> 4.5 the slag contains un-dissolved lime which hinders effective slag-metal mixing, hence loweringthe extent of metal dephosphorisation.
The plant data in Fig. 7.8 from Wakayama Works of Sumitomo MetalIndustries, Ltd.,? show changes in hot metal composition with the treat-ment time. For an average refining time of about 30 minutes, the carboncontent of the hot metal decreases by 0.2 to 0.3 percent.
High slag/ metal phosphorus distribution ratios obtained in hot metalrefining are much greater than would be predicted from the phosphate

204 Fundamentals of Steelmaking30-----F-IU-X--------------·------~
o 12kg/t• 10kg/tA 8kg/t
~Sc:o~ 20en.§.c0.enos:0.
~ 10CD
~0:-~
Fig. 7.S Influence of temperature and flux consumption on [%P] afterdephosphorisation.
c~ 50«Sf/).g.c0-f/)o-a aQ)"CC>.5:;"C -50~
o~~--------~------~----~1300 13501250
Temperatureafterdephosphorisation(OC)
o 60 80 100
Fig. 7.6 Relation between the gaseous oxygen ratio and AT duringdephosphorisation.
3.0.---------------------,
~•...•..~2.5C>.Q
20 40
2.0'----I....-.,--~--I....-.,-~-----'2
(0, gas) x 100{c/o}(0, gas) + (0, scale)
Temperature1300-1320°C
4 5CaO/Si02
Fig.7.7 Relation between CaO/Si02 and phosphorus partition ratio.
3 6 7

Pretreatment of Blast Furnace Iron 205
000 o 20 40 60TREATMENT TIME,min
Fig. 7.8 Changes in hot metal composition during dephosphorisation treatmentfrom data reported by Nashiwa et al.s
capacities of the slags, on the assumption of carbon-oxygen equilibrium inthe melt. An extensive degree of dephosphorisation achieved in hot metalrefining, is brought about by the non equilibrium state of high oxygenactivity in the melt during the flux injection with nitrogen plus oxygen.Takeuchi et al» made oxygen sensor measurements at different positionsin the melt during the flux injection with a 75% O2 + 25% N2 mixture. Theyfound that the measured oxygen activity in the melt was about 1000 timesgreater near the lance tip and about 100 times greater near the slag layer incomparison to the C-O equilibrium.
7.3 DESULPHURISATION
In most steel plants outside Japan, hot metal refining is confined to de-sulphurisation in the transfer ladle with various injected materials such aslime plus spar, lime plus magnesium, calcium carbide plus magnesium orcalcium carbide plus limestone. .
Plant data from various steel works are plotted in Fig. 7.9 for three typesof reagents injected at the rates of 30 to 40 kg min-l. As shown in Fig. 7.10the quantity of Mg to be injected together with CaO or CaC2 is adjusted inaccord with the initial sulphur content of the hot metal. Desulphurisationoccurs primarily by the following reactions
Mg(g) + [5] ~CaC2 ~
Ca(g) + [5] ~
Mg5(s)Ca(g) + 2[C]Ca5(s)
Most of the desulphurisation is done by magnesium. For the removal ~f0.04% 5 in the desulphurisation of hot metal, with about 70% efficiency ofmagnesium usage, the amount of the reagent to be injected would be 1.45

206 Fundamentals of Steelmaking
-1
0encfl.•...••.
-2en~0.s
30 CaC03 + CaC2
-3 20 Mg + 80 CaO
25 Mg + 75 CaC2
4 8kg reagentlt HM
12
Fig. 7.9 Hot metal desulphurisation with lance injection in transfer ladle.
1.5
0.5
0.04 0.08Initial % S in hot metal (HM)
0.12
Fig. 7.10 Plant data within shaded area showing magnesium usage in hot metaldesulphurisation with Mg+CaO and Mg+CaC2 injection in the transfer ladle at therate of 30 to 40 kg min-I.

Pretreatment of Blast Furnace Iron 207
kg t-1 HM for the 30 Mg + 70 CaO mixture. For this quantity of solidinjection with N2 flowing at the rate of 35 N1 per kg solids, the heatabsorbed from the melt would be about 4310 k] t-1 HM. On the otherhand, the heat generated by the reaction Mg(g) + [S] ~ MgS would beabout 5060 k] t-I HM for 0.04% AS which compensates for the thermalenergy absorbed in heating the injected material to the bath temperature.
The solubility of MgS in hot metal decreases with a decreasing bathtemperature thus
17,026log [%Mg][%S] = - -T- + 5.15
A lower residual dissolved sulphur will be achieved at a lower refiningtemperature. Depending on the operating conditions the residual dis-solved sulphur in the treated hot metal is in the range 0.002 to 0.005% S.The sulphur-rich slag in the transfer ladle is skimmed off as much asoperating conditions will permit, prior to charging the hot metal to theBOFvessel.
s_~~0.4(500:r: 0.2 L.-...I-_ .........•...•.........~ ...•..........~"""""""""
1979 19801-6 10 12 2 4 6 8
Transition of LD refining (300 t LO)
E • Conventional LDe1a oSMP •• ~gl! 0.4 - • .W!."~~ ..::J- f"'IA..g ~ 0.2 - 0 0%>•.••.5!lt) o~oeo •"0 as Q 0<90'::: O~C)~~ I I I I-0.2 '----~------'---'----'"2 4 6 8 10
Slag volume (ton/heat)
Relationship between slag volume andMgO dissolution from refractory
1fi40 f- •
0> 120 ton LD ~~ (low carbon .;. •••~30- ,.~ ••- .--..•..o •••••••g20-#,!"~ I I I10'------~----~----~--~
0.10 0.20 0.30Initial (0/0 Si)
Relation between CaO consumption andinitial (0/0 Si) in LD refining
0.40
c:o~.~*900_-a.QCJ)-,g e 80C-O>C 70~--"'--~--~--'"
0.1 0.2 0.3 0.4Initial (% Si)
Relationship betweendephosphorisation ratio and initial
(0/0 Si) in LD refining
Fig.7.11 Selected diagrams from a paper by Itoh et al.8 on the development of slagminimum refining process (SMP) by Nippon Steel Corporation.

208 Fundamentals oj Steelmaking
During desulphurisation the nitrogen content of hot metal is reducedfrom 60-70 ppm to 30-35 ppm which reflects on lower levels of nitrogen in'BOF heats at tap. For example, for 30 to 35 ppm N in desulphurised hotmetal the BOF steel at tap would contain < 20 ppm N, as observed at thesteel works of Thyssen Stahl AG, Duisburg.?
7.4 BENEFITS OF HOT METAL REFINING
It is seen from the plant data of Muroran Works of Nippon Steel Corpora-tion in Fig. 7.11 reported by Itoh et al.B, that by reducing the silicon contentof hot metal to <0.2%, a substantial saving was realised in lime consump-tion and the extent of dephosphorisation became more stable. As wouldbe expected, a decrease in slag volume also lowers the extent of refractorywear and increases the steel yield. The minimum slag practice decreasesscrap melting in BOF which proves to be an advantage for easier control ofthe steelmaking operation.
The overall economics of the minimum slag practice in BOF steelmakingdepends a great deal on the availability and the relative cost of raw mater-ials, steel scrap and hot metal. At present the minimum slag practice, with95 percent or more refined hot metal in the BOF charge, is neither practicalnor cost effective in most steel industries outside Japan.
REFERENCES
1. T. FUWA, Iron and Steelmaker, 1981, 8(6), 18-25; 8(7), 25.2. 5. ISHIHARA, Trans. Iron Steel Insf. Japan, 1985, 25, 537.3. K. MARUKAWA, Development of the Preliminary Treatment Process of Molten Pig
Iron with Sodium Carbonate Flux, Report, 1982, Kashima Works of 5umitomoMetal Industries, Ltd.
4. T. 5INDE ei al., Teisu-to-Hagane, 1987, 73(12), 5862.5. H. NASHIWA, T. ADACHI, T. OKAZAKI and K. IEDA, Ironmaking & Steelmaking,
1981, 8(1), 29.6. S. TAKEUCHI, M. OZAWA, T. NOZAKI, T. EMI and M. OHTANI, in 'Development
of Hot Metal Preparation for Oxygen Steelmaking', 13-1; McMaster University,Hamilton, Ontario, 1983.
7. R.W. SIMON, W. FLORIN, R. HAMMER and E. HOFFKEN, Steelmaking ConferenceProceedings, 1989, 72, 313.
8. Y. ITOH, S. SATOH and Y. KAWAucHI, Trans. Iron Steel Inst. Japan, 1983, 23, 256.

CHAPTER 8
Oxygen Steelmaking
8.1 INTRODUCTION
The first commercial operation of steelmaking with oxygen top blowing inthe converter was in the early 19508 at Linz and Donawitz (Austria). Thismanner of steelmaking became known as Linz-Donawitz or LD process.For many years now, most of the steel has been made by top oxygenblowing for which different names are given. For example, in Europeansteel plants the process is still called LD; in the UK, BOS (basic oxygensteelmaking); in the Far East and America, BOF (basic oxygen furnace), withthe exception of U.S. Steel where it is called BOP (basic oxygen process).
In the early 1970s, a bottom-blown oxygen steelmaking process wasdeveloped in Canada and Germany. This process, known as OBM in Eu-rope and Q-BOP elsewhere, was in full size commercial operation by themid 19708 in U.S. Steel plants followed by several plants in Europe andJapan. The tuyeres, mounted in a removable bottom, consist of a centralpipe for blowing oxygen together with burnt lime, and an annular gaparound the central pipe for the passage of gaseous hydrocarbon, e.g. pro-pane or natural gas (CH4). Upon contact with liquid steel the hydrocarbondissociates to C and H2 with the absorption of heat. This endothermicreaction suppresses overheating of the tuyere tip by the exothermic reac-tion of oxygen with liquid steel.
Further developments in oxygen steelmaking led to the present prac-tices of various types of top and bottom blowing known as combinedblowing, as illustrated schematically in Fig. 8.1 for BOF and Q-BOP pro-cesses. There is also post combustion of CO in the upper part of the vesselto generate additional heat for steelmaking.
The presentation in this chapter is on the fundamentals of steelmakingreactions and assessment of the state of slag-metal reactions at the end ofoxygen blowing, i.e. at first turndown of the vessel for sample taking. Fora description of steelmaking facilities and plant layout, reference may bemade to the U.S. Steel publication The Making, Shaping and Treating of Steel,1985 edition.
8.2 FURNACE CHARGE
Depending on the local operating conditions, availability of scrap, blastfurnace iron (hot metal) and the extent of hot metal pretreatment, 75 to 95
209
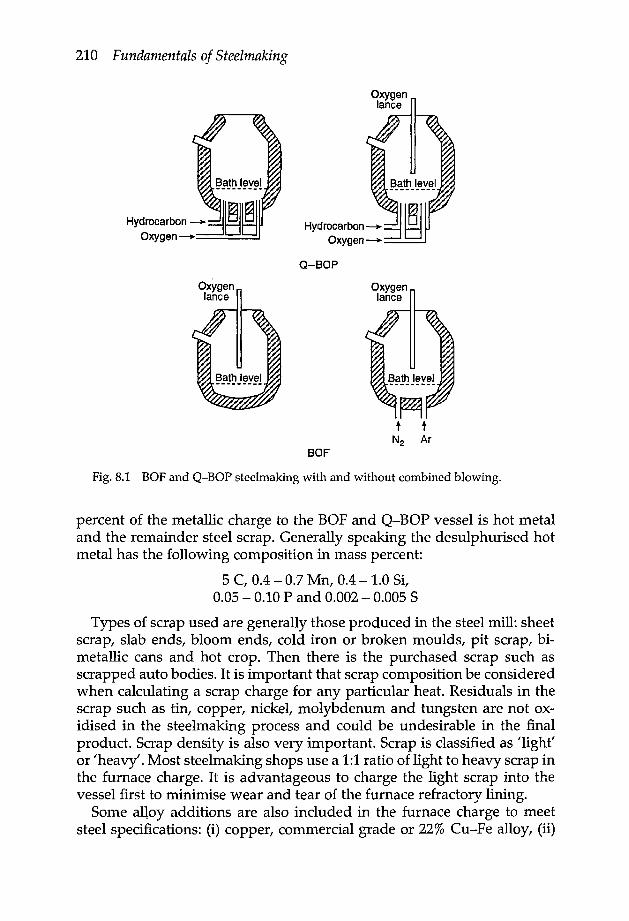
210 Fundamentals oj Steelmaking
Oxygenlance
Oxygenlance
a-BOPOxygen
lance
Fig. 8.1 BOF and Q-BOP steelmaking with and without combined blowing.
BOF
percent of the metallic charge to the BOF and Q-BOP vessel is hot metaland the remainder steel scrap. Generally speaking the desulphurised hotmetal has the following composition in mass percent:
5 C, 0.4 - 0.7 Mn, 0.4 - 1.0 Si,0.05 - 0.10 P and 0.002 - 0.005 S
Types of scrap used are generally those produced in the steel mill: sheetscrap, slab ends, bloom ends, cold iron or broken moulds, pit scrap, bi-metallic cans and hot crop. Then there is the purchased scrap such asscrapped auto bodies. It is important that scrap composition be consideredwhen calculating a scrap charge for any particular heat. Residuals in thescrap such as tin, copper, nickel, molybdenum and tungsten are not ox-idised in the steelmaking process and could be undesirable in the finalproduct. Scrap density is also very important. Scrap is classified as 'light'or "heavy'. Most steelmaking shops use a 1:1 ratio of light to heavy scrap inthe furnace charge. It is advantageous to charge the light scrap into thevessel first to minimise wear and tear of the furnace refractory lining.
Some alloy additions are also included in the furnace charge to meetsteel specifications: (i) copper, commercial grade or 22% Cu-Fe alloy, (ii)

Oxygen Steelmaking 211
nickel as nickel oxide or 48% Ni-Fe alloy, (iii) molybdenum as moly oxideand (iv) chromium as an iron alloy. When the silicon content of hot metalis low, some silicon carbide and/ or ferrosilicon are included in the furnacecharge as additional fuel for steelmaking.
Soon after starting oxygen blowing, burnt lime and burnt dolomite arecharged into the vessel as fluxes. In some shops a small addition of fluor-spar (CaF2) is made when the aimed carbon content of the steel at turndownis more than 0.10 percent. In some practices, limestone, dolomite and/ oriron are are used as a coolant when needed. In the Q-BOP steelmaking allthe lime needed for the process is bottom blown together with oxygen.
8.2.1 STATIC CHARGE CONTROL
Computer-aided charge-control calculations are made for every heat.About 80 percent of the charge-control model is based on the heat andmaterial balance, the remainder being based on empirical relations whichvary from one melt shop to another. Since every steelmaking shop has itsown formulation of the charge-control model, only general aspects of thissubject will be discussed here in a simplified form.
B.2.1a Material balanceSteelmaking is an oxidation process to remove the oxidisable elementsfrom hot metal and scrap to the furnace slag as the steel is decarburisedwith oxygen blowing.
[C] + lh02 ~ CO (gas)
[Si] + O2 ~ Si02 Fluxed with[P] + 0/402 ~ lhP20S lime (CaO) forming
[Mn] + 11202 ~ MnO molten slag
Fe + 1h02 ~ FeO
At the end of oxygen blowing the slag basicity (as V = %CaO / %Si02) isin the range 2.5 to 4.0, with iron oxide contents of 10 to 35% FeO depend-ing on the aimed carbon, sulphur and phosphorus contents of the steel attap. From trial and error calculations the following formulation has emer-ged for the quantities of burnt lime and burnt dolomite to be charged,depending on the total silicon content of the furnace charge.
kg burnt lime/t metallic charge =
19 x V x %Si (in furnace charge) (B.lf
kg burnt lime= (2 + 0.3 x V) (8.2)kg burnt dolomite

212 Fundamentals of Steelmaking
Calcined (burnt) dolomite, known as Idoloma' or Idolo', is always in-cluded in the furnace charge to minimise slag attack on the MgO-C bricklining of the vessel. Burnt dolomite contains about 56% CaO and 41%MgO the remainder being impurities. Burnt lime contains about 96% CaO,1% MgO, 1% Si02 and other minor impurities with a 1.5%-10ssof ignition.
In making an approximate calculation of the material balance given hereas an example, certain average values are used with 'regard to the com-position of slags at tap as given below.
v = %CaO/%Si02
2.5 13.03.5 J4.0
%FeO(total) %MgO6.75.44.74.3
(16.6 x V - 30)
In steelmaking slags the sum of the four primary oxides CaO + MgO + FeO+ Si02 is in the range 88 to 92%. In calculating the MgO solubilities for theindicated V ratios, using the data in Fig. 5.12 for the quaternary system,the values are adjusted to an average value of 90% for the sum of thesefour oxides.
The slag mass per tonne of steel is estimated from the quantities CaO,MgO, Si (as Si02) in the furnace charge and X% FeO in the tap slag for theaimed slag basicity V as given below.
I CaO + MgO + Si02Slag mass, kg t- steel = 90 _ (16.6 x V _ 30) (8.3)
Two examples of calculations of the furnace charge are given using theforegoing formulations.
Example A for 0.4% Si in the furnace charge with an aimed slag basicity V= 2.5:
Burnt lime:DolomaCaOMgOSi02
Slag mass
19 x 2.5 x 0.419/2.7519 x 0.96 + 6.91 x 0.576.91 x 0.4 + 0.194 x 60/28 + 0.192218 + 295 + 876
90 - 11.5
= 19 kg t-I= 6.91 kg t-I
= 22.18 kg t-I= 2.95 kg t-I= 8.76 kg t-I
= 43.17 kg t-I
Estimated slag composition at tap:51.38% CaO, 6.83% MgO, 11.5% FeO and 20.29% SiOZ;V = 2.53.
Example ~ for 1% Si in the furnace charge with the aimed slag basicity V =
4.0:

Oxygen Steelmaking 213
Burnt lime:DalarnaCaOMgOSi02
Slag mass
19 x 4.0 x 176/3.276 x 0.96 + 23.75 x 0.5723.75 x 0.4 + 0.7610 x 60/28 + 0.768650 + 1026 + 2219
90 - 36.4
== 76.0 kg t-I= 23.75 kg t-I= 86.50 kg t-I= 10.26 kg t-I== 22.19 kg t-1
= 221.92 kg t-1
Estimated slag composition at tap:38.98% CaO, 4.62% MgO, 36.4% FeO and 10% Si02; V = 3.90
In the detailed formulation of material balance for the furnace charge,several additional terms are incorporated in the charge control system, asfor example: aimed turndown temperature, carbon, sulphur andphosphorus contents in the steel, also the slag volume required to achievethe aimed steel composition at tap. These additional terms for the chargecontrol model are formulated using reliable equilibrium data on slag-metal reactions, with plant analytical data logs on slag and metal samplestaken from the vessel at tap.
B.2.1b Heat balance
For a 220 tonne metallic furnace charge containing 4% C,O.6% Si, 0.5% Mnand 0.06% P to produce steel containing at tap 0.03% C, <0.005% Si,O.2%Mn and 0.01% P, the thermal energy generated by oxidation will be asfollows.
[C] + lh02 ~ CO - 83.4 X 10⁶ k][Si] + O2 ~ Si02 - 35.4 x 10⁶k][P] + %02 ~ IhP20S - 2.2 x 10⁶ kJ
[Mn] + 11202 ~ MnO - 4.0 x 10⁶ kJFe + lh02
---;10 FeO - 17.1 x 10⁶ kJTotal heat generated = -142.1 x 10⁶ kJ
The heat generation due to the oxidation of iron is for a 22 t furnace slagcontaining 20% FeO (total) which corresponds to the oxidation of 3421 kgof iron.
The approximate quantities of heat requirement to raise the bath tem-perature to 1650°C are given below.
Amount and Temperature..of Charge Material Heat Required
38.21 x 10⁶ kJ60.77 x 106 kJ
175 t HM,1340°C45 t steel scrap, 25°C
7.3 t lime } 250C3.0 t dalarna 14.31 X 10⁶ kJ
Total = 113.29 X 10⁶ kJ

214 Fundamentals of Steelmaking
The difference of about 29 x 106 k] between the quantities of heat gener-ated and heat absorbed is a measure of the heat losses, primarily by thefurnace off gases (CO) and in part by heat conduction through the vessellining and outer shell into the melt shop environment.
Examples of heat balances are given below for reactions of variousfurnace charges in the vessel with respect to the furnace charges being atroom temperature and the steel bath at 1600°C.
Reaction 8H, kJ kg-I furnace chargeFe203 + 3[C] ~ 2[Fe] + 3CO 4607
NiO + [C] ~ [Ni] + CO 3362Mo02 + 2[C] ~ [Mo] + 2CO 4527CaC03 + [C] ~ CaO + 2CO 5614
Cu ~ [Cu] 924Fe-75% Si + O2 ~ [Fe] + Si02 -20,844
SiC + 3h02 ~ Si02 + CO -19,420
To generate additional heat in the vessel for minimising skull buildup atthe converter mouth, some of the carbon monoxide generated in the steeldecarburisation is combusted with oxygen in the upper part of the vessel.For O2 at 25°C, and CO and CO2 at 1600°C, the heat generated would be
CO + lh02 ~ C021 AH = -22,420 kJ Nm-3 O2
In the 220 tonne heats, about 160 Nm302 is used for post combustionduring the oxygen blowing time of about 22 minutes in BOF and 16 to 18minutes in Q-BOP steelmaking.
B.2.Ie Reliability of static charge-control systemThe time sequence of charge-control calculations and materials handling isshown in Fig. 8.2 in a simplified form. The preliminary calculation for heatB starts at the time of charging the vessel for heat A. How good of anestimate can be made of the temperature and composition of the steel atthe end of oxygen blowing (on the basis of the static charge control pro-gramme) depends on (i) accuracy of the charge control model, (ii) ac-curacy of inputs to the computer system, (iii) consistency of steelmakingpractices and quality of materials used, (iv) reliability of the computersystem and its use, and (v) reliability of measuring and interfacingdevices.
8.3 DYNAMIC CONTROL OF OXYGEN BLOWING
It was in the 1970s that the sublance technology was developed in theJapanese steel industry for dynamic control of oxygen steelmaking. The

Preliminarycalculationfor heat B
Order hot metaland scrap for
heat B
Oxygen Steelmaking 215
Oxygen blow Tap
Actual weights of hotmetal and scrap and
hot metal temperaturefor heat B picked up
by computer
Composition of hotmetal for heat Breceived from
chern labTrim calculation
for heat Bperformed by
computer
Preliminarycalculationfor heat C
Oxygen trimfor heat B
performed bythe computer
Add fluxes andtrim materials
to heat B
a 10 6030 40Time (minutes)
Fig. 8.2 Time sequence of charge-control calculations and materials handling.
20 50
dynamic control system involves the use of a sublance for sampling andanalysing waste gas for CO and CO2 together with the computer model forcharge control. A water-cooled sublance is lowered into the steel bath tomeasure the bath temperature, the carbon content of steel and to take a metalsample for chemical analysis. This sampling is done usually 2 or 3 minutesbefore the scheduled end of the blow. With the data collected, including thewaste-gas analysis, calculations are made by the process-control computer todetermine the corrections to the blow that are necessary to achieve the de-sired end point temperature and carbon content of the steel. Use of thesublance with a good static charge control model and dynamic process con-trol system will ascertain first turndown hit rates of over 90 percent.
8.3.1 AUTOMATED CONTROL OF OXYGEN BLOWING
Use of the sublance in controlling oxygen blowing varies from one steelmill to another. A brief description is given here of a fully automaticoxygen blowing practice that was developed at Kawasaki Steel Corpora-tion, reported in a paper by Iida et al.)
As shown in Fig. 8.3, the automatic control system for blowing consistsof four subsystems.
A: Subsystem for static controlThe raw material blending and the amounts of oxygen, coolant and fluxesnecessary for blowing, are calculated using static control models based onthe material balance and heat balance.

216 Fundamentals of Steelmaking
1---------1 Subsystem of static control~~~--~------~
Subsystem of program control
Adjusting of LH and F02
©Subsystem of slagformation control Subsystem of dynamic
'--- -...It----+--t control with sublance
LH lance height
F02 oxygen flow rate
Fig. 8.3 Schematic representation of the system and function of fully automatic BOFsteelmaking. From Ref. 1.
B: Subsystem for programme controlThe lance height and oxygen blowing rate are automatically controlledand the fluxes automatically charged according to the computer pro-gramme selected before starting the blow. This subsystem also controlsthe operation of the waste gas treatment system, the gas recovery oper-ation and start of the sublance operation.
C: Subsystem for slag formationThis subsystem continuously monitors slag formation based on the mea-sured values of acceleration of lance vibration, which controls the lanceheight and oxygen flow rate, so that the slag foam height is maintained atthe desired level.
D: Subsystem for dynamic control by sublanceThe steel temperature and carbon content are measured by the sublanceduring blowing and the required amounts of oxygen and coolant arecalculated using the dynamic control model, whereby charging of thecoolant and terminating oxygen blowing are automatically carried out.
It should be noted that a highly automated oxygen steelmaking is prac-tical and cost effective, only when more than 90%of the furnace charge is

Oxygen Steelmaking 217
pre-treated hot metal with Si<0.2%, P<O.Ol% and 5<0.01%, as accom-plished in many of the Japanese steel works.
8.4 STEELMAKING SLAGS
8.4.1 SLAG FORMATION IN BOF STEELMAKING
In BOF steelmaking the metal and slag compositions change during oxygenblowing as shown in Fig. 8.4. These data, reported by van Hoom et al.2,
were obtained from a series of trial heats made in a 300 t capacity BOF atHoogovens IJmuiden BV. In the early stages of the blow most of the siliconis oxidised forming a slag of low basicity. Humps on the manganese andphosphorus curves are characteristic of all pneumatic steelmaking pro-cesses caused by changes in the melt temperature and slag composition.
5
S.• --... - ----- ...
--~-~---- •......•..•.•
..• t::'1n - .. -----~,,~.•. ----- --- ~ --- ..•Si
o 4 8 12OXYGEN BLOWING, x10-3 nm3
16
Fig.8.4 Changes in metal and slag compositions during steelmaking in the BOF forabout a 300 t melt, using data of van Hoorn et al.2•
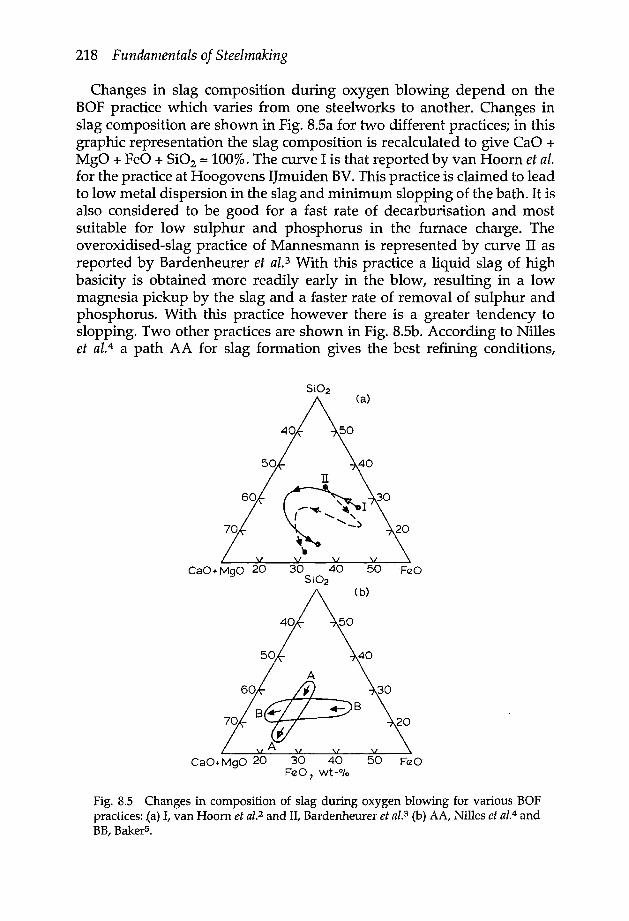
218 Fundamentals of Steelmaking
Changes in slag composition during oxygen blowing depend on theBOF practice which varies from one steelworks to another. Changes inslag composition are shown in Fig. 8.5a for two different practices; in thisgraphic representation the slag composition is recalculated to give CaO +MgO + FeO + Si02 = 100%. The curve I is that reported by VanHoorn et alefor the practice at Hoogovens Ijmuiden BV. This practice is claimed to leadto low metal dispersion in the slag and minimum slopping of the bath. It isalso considered to be good for a fast rate of decarburisation and mostsuitable for low sulphur and phosphorus in the furnace charge. Theoveroxidised-slag practice of Mannesmann is represented by curve II asreported by Bardenheurer et al.3 With this practice a liquid slag of highbasicity is obtained ·more readily early in the blow, resulting in a lowmagnesia pickup by the slag and a faster rate of removal of sulphur andphosphorus. With this practice however there is a greater tendency toslopping. Two other practices are shown in Fig. 8.Sb. According to Nilleset al:" a path AA for slag formation gives the best refining conditions,
CaO+MgO 20 50 FeO
(b)
CaO+MgO 20 30 40 50 FeO'FeO, wt->
Fig. 8.5 Changes in composition of slag during oxygen blowing for various BOFpractices: .(a) I, van Hoom et aZ.2 and II, Bardenheurer et aI.3 (b) AA, Nilles et aZ.4 andBB, BakerS.

Oxygen Steelmaking 219
particularly for decarburisation. The path BBwas considered by Bakers tobe better for phosphorus and sulphur removal.
In the early stages of the blow the slag basicity is low; therefore thesolubility of MgO is high. As the basicity increases with the progress ofoxygen blowing, the solubility decreases resulting in rejection of MgOfrom the molten slag. However, an increase in slag basicity during theblow is accompanied by an increase in slag mass which counteracts MgOrejection; in fact the total amount of MgO taken up by the slag increasesduring the later stages of the blow.
8.4.2 SLAG FORMATION IN Q-BOP STEELMAKING
In Q-BOP steelmaking the oxygen and lime powder are blown through aseries of tuyeres located on the bottom of the converter. The mode of slagformation during the blow in Q-BOP will be somewhat different from theBOF practices. As would be expected from the differences in the directionof the oxygen blow in these top and bottom-blowing processes, concentra-tions of iron and manganese oxides in BOF slags will be higher than thosein Q-BOP slags. For the same reason the slag temperature in BOF is higherthan the metal temperature, the reverse being the case for Q-BOP.
8.4.3 SLAG COMPOSITION AT TURNDOWN
Composition of slags in low alloy steelmaking by the BOF and Q-BOPprocesses varies within the following range, depending on the carboncontent of steel at tap: 40 to 60%CaO,4 to 8%MgO, 3 to 8% MnO, 5 to 35%FeO (total), 10 to 28% Si02, 1 to 3% P20S' 1 to 2% Al203, 0 to 2% CaF2, 0.1to 0.2% 5 and minor amounts of other oxides. As pointed out earlier, thesum of the oxides CaO + MgO + FeO + Si02 is in the range 88 to 92percent.
As noted from the plant data in Fig. 8.6, for the turndown temperaturesof 1625 ± 25°C, the total iron oxide content of the finishing slag at tapdecreases with increasing concentrations of Si02 and CaO. The dottedlines are for the quaternary system CaO-MgO-FeO-Si02 saturated withdicalcium (magnesium) silicate at 1600°C (Fig. 5.12). The readings fromFig. 5.12 for the silicate saturated melts are readjusted to CaO + MgO +FeO + Si02 = 90%; these are depicted by the dotted lines in Fig. 8.6. Thereis a pronounced shift in the position of the univariant equilibrium in thecomposition diagram for the saturated-steelmaking slags, to higher con-centrations of CaO and to the corresponding lower concentrations of Si02,as compared to the quaternary system CaO-MgO-FeO-Si02 in-equilibrium with liquid iron. This change in composition of the saturatedslags to higher concentrations of CaO is due, in part, to slag temperaturesbeing somewhat higher than 1600°C, also to the presence of P20S' MnO,

220 Fundamentals of Steelmaking
30~r--r--r----r---'
25
15 20 25 30 40 45 50 55 60 65
20~ 15u,'eft
%CaO
Fig. 8.6 The total iron oxide (as FeO) content of steelmaking slags is related to theSi02 and CaD contents. The dotted line is for Ca0-6%MgO-FeO-Si02 system satu-rated with dicalcium (magnesium) silicate.
Fe203 and other minor oxides which increase the lime solubility in theslag.
TIle iron oxide content and slag basicity are related as shown in Fig. 8.7.The lower part of the hatched area is usually for BOF slags and the upperpart for Q-BOP slags.
2~----~------~------~o 10 20 30%FeO
Fig.8.7 Variation of slag basicity with total iron oxide content of steelmaking slagscontaining PzOs < 3%.
8.5 DECARBURISATION
In most oxygen steelmaking processes the rate of oxygen blowing is usu-ally within the range 2.2 to 3.0 Nm3 min-1 t-1, depending on the composi-tion of the furnace charge. During the first three to four minutes of oxygenblowing most of the silicon is oxidised, during which time about 0.4 orO.S%C of the carbon is oxidised with an increasing rate of decarburisationas shown .schematically in Fig. 8.8 for BOF heats. For Q-BOP heats thedecarburisation rate curve has a similar shape, the only difference being in

Oxygen Steelmaking 221
the duration of oxygen blowing which is about 16 to 18 minutes. Depen-ding on the rate of oxygen blowing the plateau of the maximum rate ofdecarburisation is in the range 0.20 to 0.28%C per minute, which corres-ponds to the consumption of about 90 percent or more of the oxygenblown per minute.
5 10 15 20 25Oxygen blowing time (min)
Fig. 8.8 Schematic representation of change in the decarburisation rate during oxy-gen blowing in BOF steelmaking ..
Below about O.4%C, the rate of decarburisation decreases with a de-creasing carbon content because of an increase in the consumption ofoxygen by the oxidation of phosphorus, manganese, iron and an increas-ing amount of oxygen dissolution in the steel bath. As an example let usassume that, starting at 17 minutes of the blowing time with the steelcontaining O.4%C, the rate of decarburisation will decrease linearly with adecreasing carbon content of the steel bath during the last five minutes ofthe blow, for which the rate equation will be .
d%C 01 01--ar- = - (IOC - IOCeq) (t -17) (8.4)
where %Ceq is the aimed equilibrium carbon content according to thecharge-control modeL Upon integration
In %C - %Ceq = (t - 17) (8.5)%Co- %Ceq
Inserting %Co = 0.4 at t = 17 min and %Ceq = 0.04
In %C - 0.04 = (t - 17) (8.5a)0.036

222 Fundamentals of Steelmaking
For the case considered as an exmaple, the decrease in the carbon contentand increase in the oxygen content of the bath would be as given below.
t, min %C ppm 0*17 0.40 7518 0.172 17419 0.089 33720 0.058 51721 0.047 63822 0.042 714
8.6 COMBINED-BLOWING IN BOF STEELMAKING
There are various types of combined-blowing practices in BOF steelmak-ing; the major ones are listed in Table 8.1.
Table 8.1 Major combined-blowing practices
Bottom Flow rate Bottom wear rateProcess Developed by Gases Nm3 min-I mm per heat
injected t-1
LBE ARBED-IRSID6 N2/ Ar 0.01-0.10 0.3-0.6LD-CB Nippon Steel CO2, N2/ Ar 0.02-0.06 0.3-0.8
Corp. 7
LD-KGC Kawasaki Steel CO, N2J Ar 0.01-0.20 0.2-0.3COrp.8
LD-OTB Kobe Steel Corp. CO, N2/ Ar 0.01-0.10 0.2-0.3Ref.9,lO
NK-CB Nippon Kokan e021 N2J Ar 0.02-0.10 0.7-0.9K.K.l1
A brief description is given here only of the LBE system: incidentally,LBE is an acronym for 'Lance Bubbling Equilibrium'. In this system thereare 10 to 16 gas injection elements arranged in one or two concentriccircles on the converter bottom as shown in Fig. 8.9a. Nitrogen or argon isfed to the valve stand at a pressure of 10 atm and injected through thebottom of the vessel at gas flow rates of up to 0.1 Nm3min-1t-1. Theinjection elements used may be of type I or II shown in Fig. 8.9b. In type I,the gas is blown through copper channels that are inserted in the groovedrefractory plate encased in a stainless steel shell; in type II, 2 mm inside-diameter stainless steel tubes are embedded in a one-piece MgO-C refrac-tory block.
*For the product [%C][ppm 0] = 3D,average in 200-240 t BOF heats.
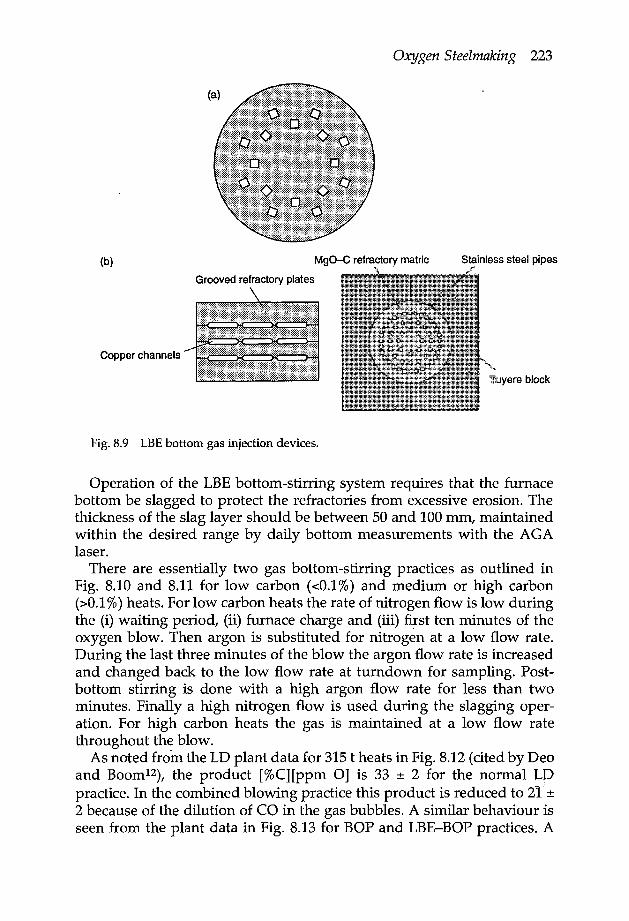
Oxygen Steelmaking 223
(b)
Grooved refractory plates
Copper channels
Fig. 8.9 LBE bottom gas injection devices.
MgO-C refractory matric Stainless steel pipes
Tuyere block
Operation of the LBEbottom-stirring system requires that the furnacebottom be slagged to protect the refractories from excessive erosion. Thethickness of the slag layer should be between 50 and 100mm, maintainedwithin the desired range by daily bottom measurements with the AGAlaser.
There are essentially two gas bottom-stirring practices as outlined inFig. 8.10 and 8.11 for low carbon «0.1%) and medium or high carbon(>0.1%) heats. For low carbon heats the rate of nitrogen flow is low duringthe (i) waiting period, (ii) furnace charge and (iii) first ten minutes of theoxygen blow. Then argon is substituted for nitrogen at a low flow rate.During the last three minutes of the blow the argon flow rate is increasedand changed back to the low flow rate at turndown for sampling. Post-bottom stirring is done with a high argon flow rate for less than twominutes. Finally a high nitrogen flow is used during the slagging oper-ation. For high carbon heats the gas is maintained at a low flow ratethroughout the blow.
As noted from the LD plant data for 315t heats in Fig. 8.12 (cited by Deoand Boom--), the product [%C][ppm 0] is 33 ± 2 for the normal LDpractice. In the combined blowing practice this product is reduced to 21' ±2 because of the dilution of CO in the gas bubbles. A similar behaviour isseen from the plant data in Fig. 8.13 for BOP and LBE-BOP practices. A

224 Fundamentals of Steelmaking
"'CcO)'- ctl.~
0>0.. a '-.~~.5 E 3:;; en
'C..<l> aU) c'0. 0)0E; :c~ 0>0)c, .!2cu CDCOe: <Do ~ 32(J'.)(tjO::o. U)en
<D High~ flow3:8rJ)caC)
Es0m
Lowflow
c=J Argon
k~~;~i~~~1~i~iI~~~iiiNitrogen
o 5 10 15 (minutes)
Fig.8.10 Bottom-stirring practice for low-carbon heats « O.10%C).
-0cO>cae:Ole.
g>~.5 E 3: Ol0..2 c: ._ 00 "5. 0>0
E-o zs 0- 0>0) CD«Sc: CD ~.!Qca
32cncu a: (/)Ci)
cCD0>;:~o0:0
.m High~ flow3:00;::::(I)ctS0>
Eg0m
Lowflow
c=J Argon
li~~~~~~~1!j~1~1~1j1~1i;!~1N itrog en
o 5 10 15 (minutes)
Fig.8.11 Bottom-stirring practice for medium- and high-carbon heats (> O.10%C).
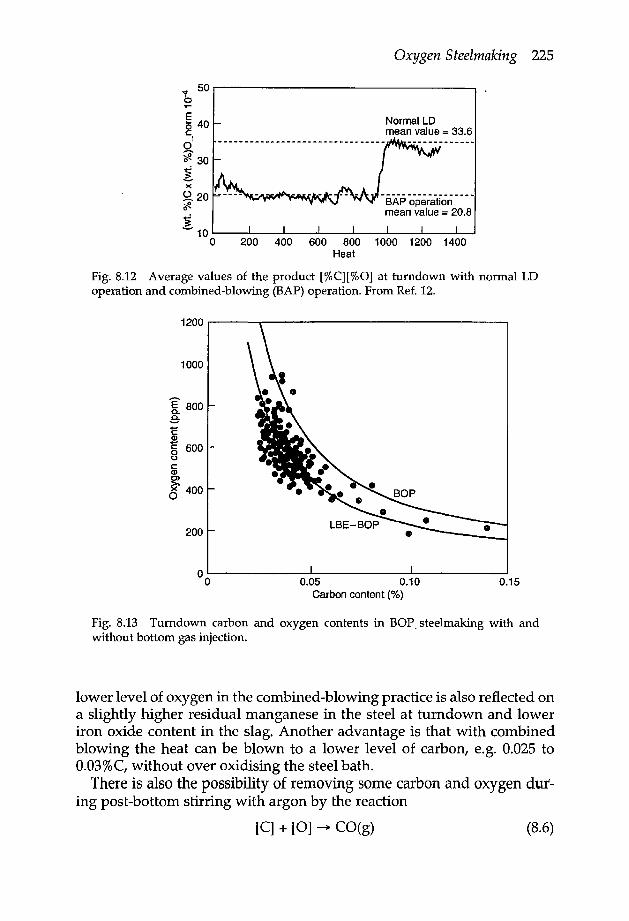
Oxygen Steelmaking 225
~ 50~----------------------------~b~Eo 40c0
1
~ 30
!x
S:2. 20rJ!. -SAP operation - - --
mean value= 20.8j-10~--~--~--~--~--~-----~-----~~
o 200 400 600 800 1000 1200 1400Heat
Fig. 8.12 Average values of the product [%C][%O] at turndown with normal LDoperation and combined-blowing (BAP) operation. From Ref. 12.
1200~----------~----------------------------------------------------------------------~
1000
E 800a..s"E~§ 600(JcQ)0)
~ 400o
200
0.05 0.10 0.15Carbon content (%)
Fig. 8.13 Turndown carbon and oxygen contents in BOP. steelmaking with andwithout bottom gas injection.
lower level of oxygen in the combined-blowing practice is also reflected ona slightly higher residual manganese in the steel at turndown and loweriron oxide content in the slag. Another advantage is that with combinedblowing the heat can be blown to a lower level of carbon, e.g. 0.025 to0.03%C,without over oxidising the steel bath.
There is also the possibility of removing some carbon and oxygen dur-ing post-bottom stirring with argon by the reaction
[C] + [0] ~ CO(g) (8.6)

226 Fundamentals of Steelmaking
If the kinetics of the chemical reaction at the melt-bubble surface is favour-able and the rate is controlled by the mass transfer of C and 0 to thebubble surface, the rate equation would be as given in section 2.6.4
1n :~ - ~'2q = - So km t (8.7)o 0 - 0 eq
where t is the duration in seconds of post-bottom argon injection, %Co =
0.04 at turndown (t = 0) and % Ceq is for the C-O equilibrium for an averageCO partial pressure in the gas bubbles. For the argon injection rate of 0.1Nm3min-1t-1, the volume flow rate of gas bubbles in the melt (for 160QoCand 1.5 atm average pressure) would be 1fT = 0.457 m3min-1t-1. For 220 theat, VT = 1.68 m3s-1,.for which the previously derived rate constant fromFig. 2.32 is Sokm = 0.015 S-l. Inserting these values in equation (8.7)gives
1n %C - ~~eq = - 0.015 t (8.8)0.04 - 0 eq
With the equilibrium constant [%C][ppm 0] = 20 x Peo (atm), the valuesof %Ceq are derived for every incremental time of argon injection from Cand 0 contents in the melt. Results of the calculations are given below.
t, seconds %C % Ceq ppm 0 Pco atm*o 0.0400 800
0.026 0.95730 0.0353 737
0.025 0.87060 0.0316 688
0.024 0.76590 0.0288 651
0.023 0.724120 0.0263 618
These calculated rates of decarburisation are about twice those observedin trial heats at Gary BOP Shop of u.S. Steel, reported by Wardrop.13Evidently the rate of reaction in equation (8.6) is not controlled solely bymass transfer. Because of the retarding effects of oxygen and sulphur onthe kinetics of the C-O reaction, the rate of decarburisation during thepost-bottom argon injection will be controlled jointly by the interfacialchemical reaction and the mass transfer of C and 0 to the bubble surface.
8.7 METAL EMULSION IN FOAMING SLAGS
A foam is a heterogeneous medium consisting of gas bubbles dispersed ina liquid. Similarly, an emulsion is a dispersion of finely sub-divided
"For an incremental time At with nAr mol Ar injection, nco mol CO generation and for an averagebubble pressure of 1.5 atm, Pco = {nco/(nco + nAr)} 1.5 atm.

Oxygen Steelmaking 227
particles of a liquid in an immiscible liquid. The formation of foams andemulsions and their relative stabilities are strongly influenced by surfacetension and viscosity. The energy required to create foam or emulsionincreases with an increasing surface tension of the liquid. The foam sta-bility is determined by the rate of drainage of the liquid film between thebubbles; the lower the viscosity the faster the rate of drainage. Conse-quently, liquids of high surface tension and low viscosity, such as metalsand mattes, cannot foam. Because molten slags have low surface tensionsand high viscosities, they are susceptible to foaming in processes involv-ing extensive rapid gas evolution as in oxygen steelmaking.
The foam is unstable; when the gas supply is terminated the foam col-lapses under the influence of interfacial tension (the Marangoni effect) andgravity force. The lower the surface tension and higher the viscosity, theslower would be the rate of collapse of the foam. Cooper and Kitchener-+have studied the foaming characteristics of metallurgical slags. They foundthat the relative foam stability increases with a decreasing temperature andincreasing Si02 and P205 contents of the slag. Swisher and McCabe15 ob-served similar effects of the additions of B203 and Cr203 to silicate melts.When the surface tension/viscosity ratio (0'/,,) is lowered by changingtemperature and/ or slag composition, the relative foam stability increases.
A large volume of CO evolved at a high rate from the steel bath duringdecarburisation* causes ejection of steel droplets into the slag layer. Theextent of metal emulsion in slag in pneumatic steelmaking processes wasfirst brought to light by Kozakevitch and co-workers.16--18 From 200 t BOFtrial heats, Meyer et al.19 and Trentini-? found that about 30 percent of themetallic charge is dispersed in the slag during the period of a high rate ofdecarburisation. The metal droplets are in the range 0.1 to 5 mm diameter,and the slag-metal interfacial area has been estimated to be 100 to 200 m2
per tonne of steel in the slag layer. According to the studies of Meyer et al.,the average residence time of metal droplets in the slag is about 1 to 2minutes, the rate of decarburisation in the metal emulsion is 0.3 to 0.6%Cper minute and in the entire system about 0.25% C per minute. Near theend of decarburisation, the slag foam subsides and most of the metaldroplets return to the steel bath.
8.8 CONTROL OF SLAG FOAMING
Excessive slag foaming during high rate of decarburisation causes bathslopping resulting in an overflow of slag from the vessel mouth. Several
"At the high rate of decarburisation 0.25% C mirr-l, the volume of CO generated at 1600°C and 1.5atm average bubble pressure would be 4699 m3 min-1 in a 220 tonne heat; the superficial gas velocitybeing about 3.6 m S-1.

228 Fundamentals of Steelmaking
devices are being used to check the slag height in the vessel and to makenecessary changes in the blowing practice to curtail bath slopping. A sounddetecting system has been used as an indicator of the onset of slopping. Themain part of this system is a condenser microphone which is contained in awater cooled probe and placed in a dust free location in the-hood.
The control system described by Iida et aI.l consists of (i) a device tomeasure lance vibration and (ii) a probe attached to the sublance to mea-sure slag height. These measurements together with lance height andoxygen flow rate are put into the computer control system using thefollowing empirical relation.
G-bSH= -V +LH+BHa 0
where G acceleration of lance vibration, em S-2
VO = oxygen flow rate, Nm-mirr-'SH = foaming slag height, mLH = lance height, mBM = furnace - bottom height correction, ma, b = constants.
The principle of this slag formation control system is shown in Fig. 8.14.When the judgment result is 'good', the blowing pattern continues aspreviously programmed. When the result is 'not good' the blowing pro-gramme is adjusted for soft or hard blow by changing the oxygen blowrate and/ or lance height. After the judgment result shows 'good' theinitial programme is then followed. An example of the automatic blowingpractice to curtail slopping is shown in Fig. 8.15.
(8.9)
Lance height
r M C~lculation o~Signal by computer :- - - - foaming sl.ag height
t :. by equation (8.9)-- --,,,,,,---------------,
IJUdg~menll
! (Signal)Mouth of vessel .
I Slopping I ~ ITake down lance and decrease oxygen flow rate II Excessive I ~ ITake down lance II Good I ~ IMaintain LH and F02 as program IIInsufficient I ~ ITake up lance I
Fig.8.14 Principle of automatic control of slag formation. From Ref. 1.

Oxygen Steelmaking 229
Lance height
9xygen flow rate
Wave form of theacceleration ofthe lancemovement
t-- ----r---+ __ ---r- -------II--SloppingExcessivet------~~--~~--~~---------II--
Calculatedslag height
Blowing time (min)
Fig. 8.15 Example of automatic blowing control. From Ref. 1.
Variation of the lance height pattern during the blow depends on thedesign of the oxygen-lance nozzle. The design features of de Laval nozzlesused at some plants are summarised in Table 8.2, reproduced from thebook by Deo and Boom.P Depending on the nozzle design and oxygenblowing rate, the blowing patterns are as shown schematically in Fig. 8.16as given in Ref. 12.
4.0
._--- Plant 1-31•- •• -. - •• - Plant 1-37•...........•.....•Plant 1-02- - - - - Plant 2---Plant3.----. Plant4• - - - PlantS• •••• _. Plant 6
_3.5g~3.0.a;s:Q)~ 2.5as...J
2.0
1.5
1.00 10 20 30 40 50 60 70 80 90 100Process time (% of total blow)
Fig. 8.16 Blowing regime of various plants; for details of plant names see footnote toTable 8.2. From Ref. 12.

230 Fundamentals of Steelmaking
Reference may be made also to a review paper by Koria-! on the funda-mentals of nozzle design for top-blown oxygen steelmaking and empiricalcorrelations for blowing regimes in relation to the converter capacity.
Table 8.2 Lance head design data of some steel plants. From Ref. 12
Plant 1 Plant 1 Plant 1 Plant 2 Plant 3 Plant 4 Plant 5 Plant 6#31 #37 #02
F02
(m3min-1) 915 915 660 650 750 900 900 330
Po (Pa) 10.2 10.8 6.6 11.1 13.3 11.6 11.0 7.9d, (mm) 46.6 45.2 55.0 37.6 36.9 48.44 40.6 41.0de (mm) 58.0 61.3 65.75 55.35 51.95 63.0 57.75 50.581 (deg) 14 14 10 14 16 12 14 10n 5 5 4 5 5 4 6 3Wbath (tons) 315 315 315 245 230 330 300 100Bottom- BAP BAP BAP tuyeres LBE BAP BAPstirring cp 5.5system mm
Sihot metal (%) 0.400 0.400 0.400 0.330 0.400 0.750 0.600 0.400
Notes: Plant information:Plant 1: Hoogovens Ijmuiden, BOS No.2,
#31: lance head design 31, converter 23;#37: lance head design 37, converter 23;#02: lance head design 02, converter 21 and 22.
Plant 2: BS Lackenby.Plant 3: Sollac Dunkerque.Plant 4: BS Port Talbot.Plant 5: BS Scunthorpe.Plant 6: Hoogovens Ijmuiden, BOS No.1.
8.9 STATES OF STEELMAKING REACTIONS AT THE END OF OXYGENBLOWING*
Over the years various studies have been made of the plant analytical dataon slag and metal samples taken from the vessel at turndown in an at-tempt to assess the states of slag-metal reactions at the end of oxygenblowing. Invariably there were variations in the results of these indepen-dent studies and the conclusions drawn from them with regard to the stateof steelmaking reactions.
The direction of oxygen blowing, either by top lancing as in BqP (LD,BOP etc.) or bottom injection together with powdered lime through thebath as in Q-BOP, has a pronounced effect on the states of steelmakingreactions at the end of the blow. The analysis of both the BOF and Q-BOPplant data should give a better insight to the understanding of the state ofgas-slag-metal reactions in oxygen steelmaking processes. The analytical
*This subject was discussed by the author in a recent publication.s-

Oxygen Steelmaking 231
plant data used in this study were on samples taken from the vessel at firstturndown from the BOP and Q-BOP shops of U.S. Steel. These plant datawere acquired through the kind collaboration of the USS research person-nel at the Technical Center.
8.9.1 OXYGEN-CARBON RELATION
Noting from the plot in Fig. 8.17, there is an interesting correlation be-tween the product [ppm 0] [%C] and the carbon content of the steel. Thesquare root correlation holds up to about O.05%C in BOP and up to 0.08%C in Q-BOP steelmaking. At low carbon contents, the oxygen content ofsteel in the BOP practice is higher than that in Q-BOP steelmaking. Forcarbon contents above 0.15% the product [ppm 0] [%C] is essentially
O/oC0.02 0.05 0.1 0.2
32
24
0'fft.....o 16Ec.S:
8
• BOP )1 610 200Co Q·BOP , ±
..°O~-------O~.-2--------0-.4--------0~.6
0.3
o
Fig. 8.17 Variation of product [ppm O][%C] with carbon content of steel at firstturndown.

232 Fundamentals of Steelmaking
constant at about 30 ± 2, which is the equilibrium value for an average gas(CO) bubble pressure of about 1.5 atmosphere in the steel bath./ At low carbon levels in the melt near the end of the blow, much of the
oxygen is consumed by the oxidation of iron, manganese and phosphorus,resulting in a lower volume of CO generation. With the bottom injection ofargon in the BOP combined-blowing practice, and the presence of hydro-gen in the gas bubbles in Q-BOP, the partial pressure of CO in the gasbubbles will be lowered in both processes when the rate of CO generationdecreases. A decrease in the CO partial pressure at low carbon contentswill be greater in Q-BOP than in BOP practices, because the hydrogencontent of gas bubbles in Q-BOP is greater than the argon content of gasbubbles in BOP. It is· presumably for this reason that the concentrationproduct [O][C] in Q-BOP steelmaking is lower than in the BOP combined-blowing practice, particularly at low carbon levels.
The non-equilibrium states of the carbon-oxygen reaction at low carboncontents in BOP and Q-BOP are represented by the following empiricalrelations.
BOP with C < 0.05%:[ppm 0] -{%C = 135 ± 5 (8.10)
Q-BOP withC < 0.08%:[ppm 0]"; %C = 80 ± 5 (8.11)
8.9.2 IRON OXIDE-CARBON RELATION
There is a striking difference in the iron oxide-carbon relation betweenBOP and Q-BOP steelmaking. At all levels of turndown carbon, the ironoxide content of the BOP slag is about twice that of the Q-BOP slag (Fig.8.18). The dotted line depicts the slag-metal equilibrium value of (%PeO)[%C] ~ 1.25 given in equation (6.6).
As depicted in Fig. 8.19, the square root correlation also applies to theproduct (%FeO)[%C] for low carbon contents, with marked departurefrom this empirical correlation at higher carbon contents. The slopes of thelines for low carbon contents are given below. .
BOP with C < 0.10%:(%FeO) " %C = 4.2 ± 0.3 (8.12)
Q-BOP with C < 0.10%:(%FeO)" %C = 2.6 ± 0.3 (8.13)

Oxygen Steelmaking 233
10
• BOP } 1610±200Co Q-BOP
------- Equilibrium
20
oQ)u..
o~--------~----------~----------~o 0.2 0.4 0.6C (%)
Fig. 8.18 Iron oxide-carbon relations in BOP and Q-BOP are compared with theaverage equilibrium relation (- - - -).
O/oC0.02 0.05 0.1 0.2 0.3 0.4 0.5 0.6
3
2
0.2 0.4
V%C
0.6 0.8
Fig. 8.19 Variation of product (FeO)[%C] with carbon content of steel at firstturndown.

234 Fundamentals of Steelmaking
8.9.3 MANGANESE OXIDE-CARBON RELATION
At-low carbon contents the ratio [%Mn] / (%MnO) may also be consideredto be essentially proportional to v%C as shown in Fig. 8.20. The followingare the slopes of the lines for the empirical non-equilibrium relations.
BOP with C < 0.10%:[%Mn] _1_ = 0.1 ± 0.02 (8.14)(%MnO) v%C
Q-BOP with C < 0.10%:[.%Mn] _1_ = 0.2 ± 0.02(%MnO) v%C
(8.15)
%C0.02 0.05 0.1 0.2 0.3 0.4 0.5 0.6
6c 0.08~~~
0.2 0.4VOloC
0.6 0.8
c~ 0.04~
Fig. 8.20 Metal/ slag manganese distribution ratios in BOP and Q-BOP are relatedto carbon content of steel at first turndown.
8.9.4 FEO-MNO-MN-O RELATIONS
From the foregoing empirical correlations for the non-equilibrium states ofreactions involving the carbon content of steel, the relations obtained forthe reaction of oxygen with iron and manganese are compared in the tablebelow with. the equilibrium values for temperatures of 1610 ± 20°C andslag basicities of B = 3.2 ± 0.6.

Oxygen Steelmaking 235
Values forBOP Q-BOP slag-metal
C < 0.05% C < 0.08% eguilibrium[ppm 0] 32 ± 4 32 ± 5 26 ± 9(%FeO)
[%Mn][ppm 0] 13.6 ± 3.2 16.1 ± 2.6 18 ± 6(%MnO)
(MnO) 2.6 ± 1.0 2.1 ± 0.6 2.2 ± 0.4(%FeO)[%Mn]
It is seen that the concentration ratios of the reactants in low carbon steeldescribing the states of oxidation of iron and manganese, are scatteredabout the values for the slag-metal equilibrium. However, as indicated bythe plant data in Fig. 8.21, the oxidation of iron and manganese are in thenon-equilibrium states for high carbon contents in the steel at turndown.Although the concentration product [O][C] is close to the equilibriumvalue for an average CO pressure of about 1.5 atm in the steel bath, theconcentrations of iron oxide and manganese oxide in the slag are abovethe equilibrium values for high carbon contents in the melt.
60--------~------------------------~..- 4000eaf8: ~ 20- '-"
• BOP )1,610 ± 20°Co Q-BOP 0.1 - 0.3 %C
IZ:7:2JSlag - metal equilibrium
o00
0 8 • ~O--------~--------~------~------~30--------~--------~--------------~
•o o 0 • 0
o~------~--------~------~--------2.4 2.8 3.2 3.6 4.0
8
Fig. 8.21 Non-equilibrium states of oxidation or iron and manganese at high carboncontents in steel.
It is concluded from these observations that(i) at low carbon contents the equilibrium state of iron and manganese
oxidation controls the concentration of dissolved oxygen

236 Fundamentals of Steelmaking
(ii) at high carbon contents it is the CO-C-O equilibrium which controlsthe oxygen content of the steel.
8.9.5 STATE OF PHOSPHORUS REACTION
The slag/metal phosphorus distribution ratios at first turndown in BOPand Q-BOP steelmaking are plotted in Fig. 8.22 against the carbon contentof the steel. The plant data are for the turndown temperatures of 1610 ±20°C and slags containing 50 ± 2% CaO and 6 ± 2% MgO. The shaded areais for the slag-metal equilibrium for the above stated conditions in Q-BOP,based on the empirical [O][C] relations, i.e. for C < 0.08%, [ppm 0] v%C =80 and for C > 0.15%, [ppm O][%C] = 30.
160
• BOP ]1 610 + 20°CCO-BOP , -
120 IZ:I2J E~Uilibrium for[0 contents in Q-BOP
0e
ii:'1K'~ ~80~e....
0°
o 0, e 040 0 0
• 0
01 0•0 0
00 0.1 0.2 0.3
%C
Fig. 8.22 Slag/ metal phosphorus distribution ratios at first turndown in BOP andQ-BOP practices; slag-metal equilibrium values are within the hatched area for Q-BOP.
Noting that the oxygen contents of the steel at low carbon levels aregreater in BOP steelmaking, the equilibrium phosphorus distributionratios will likewise be greater in BOP than in Q-BOP steelmaking. Forexample, at 0.05% C and about 600 ppm 0 in BOP at turndown the aver-age equilibrium value of (%P)/ [%P] is about 200 at 1610°C, as compared tothe average value of 60 in Q-BOP at 0.05% C with about 360 ppm O.

Oxygen Steelmaking 237
Below 0.04% C the phosphorus distribution ratios in Q-B·OP are ingeneral accord with the values for slag-metal equilibrium. However, athigher carbon contents the ratios (%P)/[%P] are well above theequilibrium values. In the case of BOP steelmaking below 0.1% C at turn-down, the ratios (%P)/[%P] are much lower than the equilibrium values.On the other hand, at higher carbon contents the phosphorus distributionratios are higher than the equilibrium values as in the case of Q-BOP.
The effect of temperature on the phosphorus distribution ratio in Q-BOPis shown in Fig. 8.23for melts containing 0.014%to 0.022%C with BO = 52± 2% in the slag.
120
80
40~------~------~~------~1,600 1,640 1,680 1,720
Temperature, -c
Fig. 8.23 Effect of turndown temperature on the slag/metal phosphorus distribu-tion ratios in Q-BOP for turndown carbon contents of 0.014 to 0.022% C; curves arefor slag-metal equilibrium.
8.9.6 STATE OF SULPHUR REACTION
A highly reducing condition that is required for extensive desulphurisa-tion of steel is opposite to the oxidising condition necessary for steelmaking. However, some desulphurisation is achieved during oxyge9blowing for decarburisation and dephosphorisation. As seen from typicalexamples of the BOP and Q-BOP plant data in Fig. 8.24, the state of steeldesulphurisation at turndown, described by the expression [%0](%5)1
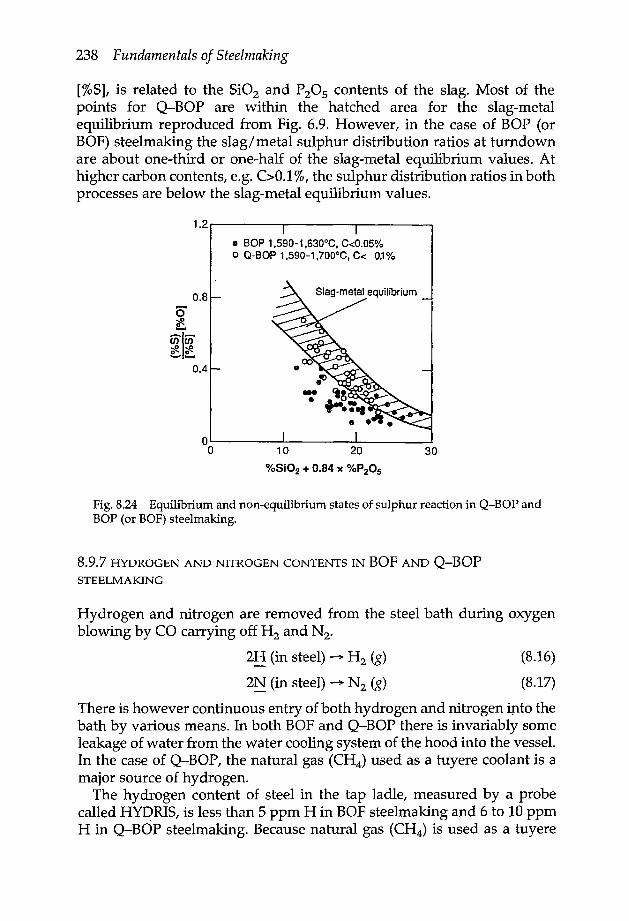
238 Fundamentals of Steelmaking
[%5], is related to the Si02 and P20S contents of the slag. Most of thepoints for Q-BOP are within the hatched area for the slag-metalequilibrium reproduced from Fig. 6.9. However, in the case of BOP (orBOF) steelmaking the slag/metal sulphur distribution ratios at turndownare about one-third or one-half of the slag-metal equilibrium values. Athigher carbon contents, e.g. C>O.l%, the sulphur distribution ratios in bothprocesses are below the slag-metal equilibrium values.
• BOP 1,590-1 ,630cC, C<O.05%,o Q-BOP 1,590-1 ,700°C, C< O~10/0
Fig. 8.24 Equilibrium and non-equilibrium states of sulphur reaction in Q-BOP andBOP (or BOF) steelmaking.
8.9.7 HYDROGEN AND NITROGEN CONTENTS IN BOF AND Q-BOPSTEELMAKING
Hydrogen and nitrogen are removed from the steel bath during oxygenblowing by CO carrying off H2 and N2•
2H (in steel) ~ H2 (g) (8.16)
2N (in steel) ~ N2 (g) (8.17)
There is however continuous entry of both hydrogen and nitrogen into thebath by various means. In both BOF and Q-BOP there is invariably someleakage of water from the water cooling system of the hood into the vessel.In the case of Q-BOP, the natural gas (CH4) used as a tuyere coolant is amajor source of hydrogen.
The hydrogen content of steel in the tap ladle, measured by a probecalled HYDRIS, is less than 5 ppm H in BOF steelmaking and 6 to 10 ppmH in Q-BOP steelmaking. Because natural gas (CH4) is used as a tuyere
Oxygen Steelmaking 239
coolant in the Q-BOP the hydrogen content of steel made in this vessel isalways higher than that in the BOF vessel. In both practices the re-blowwill always increase the hydrogen content of the steel. A relatively smallvolume of CO evolved during the re-blow cannot overcome the hydrogenpickup from various sources.
In the BOF practice the steel in the vessel contains 12 to 18 ppm N at firstturndown. In the Q-BOP practice the nitrogen content of the steel in thevessel is in the range 15 to 25 ppm at first turndown. When there is a re-blow the nitrogen contents of the steel in both processes will be higherthan those at the first turndown.
The primary source of nitrogen in Q-BOP steelmaking is the natural gaswhich contains about 1% N2. It has long been known that in BOF steel-making the quantity of oxygen consumed in all the reactions during theblow is always a little higher than the quantity that is lanced into the melt.This difference is a positive indication of air entrainment into the oxygenjet stream in toplancing, hence some nitrogen pickup by the steel.
8.9.8 GENERAL COMMENTS
Since the plant data cited were acquired from the BOP shops of U.S. Steel,discussion on the oxygen top blowing process has been abbreviated as BOPsteelmaking. Observations made on the states of reactions at turndownfrom the BOP plant data apply equally well to all other types of top blowingpractices, known under different names, e.g. LD, BOS, BOF ... etc.
The analyses of plant data on slag and metal samples taken at firstturndown have revealed that there are indeed equilibrium and non-equilibrium states of reactions in BOF and Q-BOP steelmaking. In all thereactions considered, the carbon content of steel is found to have a deci-sive effect on the state of slag-metal reactions.
Considering the highly dynamic nature of steelmaking with oxygenblowing and the completion of the process in less than 25 minutes in BOFand less than 18 minutes in Q-BOP steelmaking, it is not surprising thatthe slag-metal reactions are in the non-equilibrium states in heats withhigh carbon contents at turndown. With regard to low carbon heats all theslag-metal reactions are close to the equilibrium states in Q-BOP. In thecase of BOF steelmaking however, the states of steel dephosphorisationand desulphurisation are below the expected levels for slag-metalequilibrium. As..we all recognise it is of course the bottom injection of lime,together with oxygen, that brings about a closer approach to the slag-metal equilibrium in Q-BOP as compared to the BOF practice, particularlyin low carbon heats.
In the computer-based packages related to steelmaking processes, someof which were cited in sections 1.13 and 2.8 of Chapters 1 and 2 respec-

240 Fundamentals of Steelmaking
tively, the formulations are invariably based on the assumption that thegas-slag-metal equilibrium prevails during oxygen blowing. It is all tooclear from the assessment of the plant data presented here that due consid-eration must be given to the non-equilibrium states of steelmaking reac-tions, particularly in the BOF practice, in the formulation of the computersoftware on steelmaking processes.
8.10 STATES OF SLAG-METAL REACTIONS IN EAF STEELMAKING
Practical aspects of steelmaking and the plant equipment used in the electricarc furnace (EAF) have been adequately described and documented in detailin a series of papers compiled in a reference book entitled Electric furnacesteelmaking, edited by Taylors". Therefore this subject will not be discussedfurther. However, the subject barely touched upon in any EAF related papersis on the assessment of the states of slag-metal reactions at the time of furnacetapping. This lack of technical information on EAF steelmaking reactions isdue mainly to a traditional reluctance of the EAF steelmaking plants torelease from their heat logs the analytical data on slag and steel compositionswhich are encountered in the production of a wide variety of steel grades. Itis hard to comprehend this attitude of the EAF steehnakers; it appears asthough they have highly secretive recipes. After all, in the present practice ofEAF steelmaking supplemented with oxygen lancing throughout the scrapmelting and steel refining operations, the states of slag-metal reactions willhardly differ from what occurs in BOF or Q-BOP steelmaking, for whichthere are many publications based on plant data.
An estimate made in this section of Chapter 8 on the states of slag-metalreactions at tap is based on the analytical data of about fifty heats, whichwere given to the author from one of the EAF steelmaking plants for anassessment of the states of steelmaking reactions. The data consideredhere are for the grades of steel containing 0.05 to 0.20% C, 0.1 to 0.3% Mn,0.1 to 0.3% Cr and small contents of Cu, Ni and Mo; the tap temperaturesbeing in the range 1610 to 1640°C.
8.10.1 SLAG COMPOSITION
The iron oxide, silica and calcium oxide contents of slags are within thehatched areas shown in Fig. 8.25. The silica contents are slightly higher thanthose in the BOF or Q-BOP slags. On the other hand the CaO contents ofEAF slags are about 10% lower than those in the BOF slags. This differenceis due to the higher concentrations of A1203! Cr203 and Ti02 in the EAFslags; 4 to ~2% Al203, 1 to 4% Cr203 and 0.2 to 1.0%Ti02. In these slags thebasicity ratio B is about 2.5 at 10% FeO, increasing to about 4 at 40% FeO.

40
-cf!.030Q)
LL
20
Oxygen Steelmaking 241
30 20 30 40CaO (0/0)
50
Fig. 8.25 FeO, Si02 and CaO contents of EAF slags at tap, are compared with theBOF slags.
30
l0Q)
LL ,,,20
,,,
0.0510~------~~----~------~----~~o 0.200.10
C (%)0.15
Fig.8.26 Relation between %FeO in slag and %C in steel at tap in EAF steelmakingis compared with the relations in BOF and Q-BOP steelmaking.
8.10.2 IRON OXIDE-CARBON RELATION
As is seen from the plant data within the hatched area in Fig. 8.26, the ironoxide contents of EAF slags are much higher than those of the BOF slagsfor the same carbon content at tap. However, the product [%C][ppm 0] attap is about 26 ± 2 which is slightly lower than that for BOF or Q-BOPsteelmaking.

242 Fundamentals of Steelmaking
8.10.3FEO-MNO-MN RELATION
For the slag-metal reaction involving [Mn], (FeO) and (MnO), theequilibrium relation K'FeMn = (%MnO)/ (FeO)[%Mn] is 1.8. ± 0.2 at 1625 ±~5°C and the basicity B > 2.5, as shown in Fig. 6.2. The EAF data arescattered about K'FeMn = 1.8 ± 0.4, which is near enough to the slag-metalequilibrium similar to those in BOF and Q-BOP steelmaking. The sameconclusion was drawn from the results of trial heats in another EAF steel-making plant, as shown later in Fig. 9.17.
8.10.4 STATE OF CHROMIUM OXIDATION
As shown earlier in Fig. 6.3, the slag/ metal distribution ratio of chromiumin both the electric arc furnace and open hearth furnace steelmaking, thelatter now being obsolete, are in general accord with the slag-metalequilibrium values. That is, at tap the ratio (%Cr)/[%Cr] is proportional tothe iron oxide content of the slag, with a proportionality factor of 0.3 ± 0.1.
8.10.5 STATE OF PHOSPHORUS REACTION
For steels containing 0.07 to 0.09% C in the furnace at tap, the estimateddissolved oxygen contents will be about 370 to 290 ppm O. For slagscontaining (40± 2) %CaO and (6 ± 1) %MgO, the equilibrium constant kpofor the phosphorus reaction, given in equations (6.16) and (6.19), is in therange 2.57 x 10⁴ to 4.94 X 10⁴ at 1625°C.For the tap carbon contents andslag composition given above, the equilibrium slag/ metal phosphorusdistribution ratios will be in the range 4 to 13. The EAF plant data showratios (%P)/[%P] from 15 to 30. Similar to the behaviour in BOF steelmak-ing, the state of phosphorus oxidation to the slag in EAF steelmaking isgreater than would be anticipated from the equilibrium considerations forcarbon, hence oxygen contents of the steel at tap.
8.10.6STATE OF SULPHUR REACTION
The state of steel desulphurisation, represented by the product {(%S)/[%S]}(%FeO), decreases with increasing contents of Si02 and P20S in theslag, as shown in Fig. 8.27.The EAFplant data within the hatched area arebelow the values for the slag-metal equilibrium. This non-equilibriumstate of the.sulphur reaction in EAF steelmaking is similar to that observedin BOF steelmaking.

Oxygen Steelmaking 243
2000Q)u...
~Ciilw*'*'_ •.......•
100
o~--------~----------~----------~o 10 20 30
Fig.8.27 Slag/metal sulphur distribution ratios at tap in EAF steelmaking is com-pared with the slag-metal equilibrium values.
8.10.7 SUMMARY
General indications are that the states of slag-metal reactions at tap in EAFsteelmaking are similar to those noted in BOF and Q-BOP steelmaking atcarbon contents above 0.05% C. That is, the slag/ metal distribution ratio ofmanganese and chromium are scattered about the equilibrium values; thephosphorus and sulphur reactions being in non-equilibrium states. Also,the iron oxide content of the slag is well above the slag-metal equilibriumvalues for carbon contents of steel at tap. On the other hand, the product[%C][ppm 0] = 26 ± 2 approximately corresponds to the C-O equilibriumvalue for gas bubble pressures of 1.3 ± 0.2 atm in the EAF steel bath.
REFERENCES
1. Y. lID A, K. EMOTO, M. OGAWA, Y. MASUDA, M. ONISHI and H. YAMADA,
Kawasaki Steel Giho, 1983, 15, 126 (in Japanese); Trans. Iron and Steel Inst. Japan,1984, 24, 540.
2. A.I. VAN HOORN, J.T. VAN KONYNENBURG and P.J. I<REYGER, in Role of slag inbasic oxygen steelmaking, ed. W.-K. Lu, p. 2-1, 1976, Hamilton, Ontario.McMaster University Press.
244 Fundamentals of Steelmaking
3. F. BARDENHEURER,H. YOM ENDE and K.G. SPEITH,Arch. Eisenhiiienuies, 1968,39,571.
/4. P. NILLES, E. DENIS, F. MERKEN and P. DAUBY, CRM Metall, Rep., 1971, 27, 3.S. R. BAKER,British Steel Corporation Report, code CAPL/SM/ A/31/74.6. F. SCHLEIMER,R. HENRION, F. GOEDERT,G. DENIER and J.C. GROSJEAN,Iron and
Steel Engineer, 1981, 58(12), 34.7. H. Iso, Y. JYONO, K. ARIMA, M. KANEMOTO, M. OKAJIMA and H. NARITA,
Trans. Iron and Steel Inst. Japan, 1988, 28, 49.B. K. EMOTO, T. IMAI, F. SUDO, H. TAKE and T. ISODA, Steelmaking Conf Proc.,
1987, 70, 347.9. S. ITO, M. KITAMURA, S. KOYAMA, H. MATSUI and H. FUJIMOTO, Steelmaking
Conf. Proc, 1982, 65, 123.10. H. YAMANA, T. SOEJIMA, J. KOBAYASHI, H. MATSUI, H. FUJIMOTO and N.
GENMA, Steelmaking Conf Proc., 1987, 70, 339.11. Y. MrYAWAKI,Y. NIMURA, T. USUI, K. YAMADAand T. HIROSE, Proc. 4th Process
Technology Conf., 1984, 163.12. B. DEO and R. BOOM, Fundamentals of steelmaking metallurgy, Prentice Hall
International, London, 1993.13. R.M. WARDROP, Steelmaking Conf Proc., 1984, 67, 107.14. C.F. COOPER and J.A. KrrCHENER,]. Iron and Steel Inst., 1959, 193, 48.15. J.H. SWISHERand C.L. MCCABE, Trans. Met. Soc. AIME, 1964, 230, 1669.16. P. KOZAKEVITCHand P. LEROY,Rev. u«, 1954, 51, 203.17. P. KOZAKEVITCH, G. URBAIN, B. DENIZOT and H. MARGOT-MARETTE, Congr.
international sur les aciers a l'oxugene, 1963, p. 248. Le Touget Inst. Res.Siderurgie.
18. P. KOZAKEVITCH,J. Metals, 1969, 21, 64.19. H.W. MEYER,W.F. PORTER,G.C. SMITH and J. SZEKELY,]. Metal, 1968, 20, 35.20. B. TRENTINI, Trans. Met. Soc. ArME, 1968, 242, 2377.21. S.C. KORIA, Steel Res., 1988, 59, 257.22. Ethem T. Turkdogan Symposium, pp. 253-269, The Iron and Steel Society of
AIME, May 15-17, 1994.23. Electric furnace steelmaking, ed. C.R. TAYLOR.The Iron and Steel Society, Inc.,
1985.

CHAPTER 9
Steel Refining in the Ladle
The treatment of steel in the ladle has gone through many facets of develop-ment during the past four decades. The first new major developments in the1950s were ladle-to-ladle and ladle-to-mould vacuum degassing processesfor hydrogen removal to prevent flake cracking in forgings and heavy-guage plate steels. In the 1960s more efficient vacuum degassing processeswere developed: Dortmund-Hoerder (DH) and Ruhrstahl-Heraeus (RH),later modified to RH-OB by Nippon Steel Corporation. The advent of gran-ulated flux injection into liquid steel and argon stirring for desulphurisationstarted in the 1970s, followed by the development of cored-wire feeding ofelements for micro alloying steel and inclusion morphology control. Theseinnovations widened the scope of steel refining in the ladle to meet strin-gent requirements for high performance in continuous casting. The subjectsto be discussed in this chapter constitute the major technical aspects of ladlerefining processes which involve thermochemistry, gas-slag-steel reactionequilibria, reaction kinetics and fluid dynamics.
9.1 TAP LADLE
9.1.1 LADLE REFRACTORY LINING
In most steelmaking shops the ladle lining is made of high alumina bricks(70 to 80% AI203), with magnesia bricks for the slag line. The choice ofmagnesia bricks depends on the steel treatment in the ladle furnace (LF)and composition of the ladle slag. Magnesia bricks contain about 10% Cand some metallic additives such as Mg, Al or Si to minimise the oxidationof carbon. References may be made to a paper by Schrader and Rankovic!for tests made of the slag attack on various commercial MgO-C bricks.With calcium aluminate slag containing 10% FeO and 3% Si02, the extentof erosion increases with relative brick flux content as shown in Fig. 9.1.
For a given ladle refining practice, the lining erosion, hence the ladlelife, depends on the frequency of the ladle recycle and contact time. Withinfrequent ladle recycle, the thermal stresses on the lining increase causinga higher erosion rate. The erosion rate increases also with an increasingtime of slag contact. The following are average numbers for ladle life,depending on the frequency of the recycle.
Recycle, heats/ladle/ day1 to 24to 6
Life, heats/ladle25 to 3050 to 55
245

246 Fundamentals of Steelmaking
25~------------------------------~
5
• A - Pitch periclaseo B - Pitch periclase (Mg).• C - Pitch periclase (Mg, AI)o 0 - Resin (Mg, AI) 10% CA E - Resin 18% C6. F - Resin (AI, Si) 18% C
°0 2 3 4 5 6 7 8 9 10
20
~15co·00e 10w
Relative brick flux content
Fig. 9.1 Erosion by a 3-percent-Si02 slag vs. relative flux content. From Ref. 1.
In many electric furnace shops, the resin-bonded (calcined) dolomitebrick lining is used for the ladles. Because the calcined dolomite refracto-ries are sensitive to thermal cycling, cooling of the ladles is undesirable.Provided the ladle lining is not allowed to cool, the life of dolomite linedladles is about twice that of the alumina brick lined ladles. Once thedolomite lined ladle is in service on a back-to-back cycle, preheating foronly one hour is sufficient.
Stabilisation of calcined dolomite:Upon calcination, the mineral dolomite, CaC03·MgC03, becomes a
physical mixture of CaO and MgO.
CaC03·MgC03 ~ CaO + MgO + 2COz (9.1)
Because of the hydration of lime in air, the calcined dolomite is unstable,known as 'dusting' or 'perishing' in storage; the lower the calcinationtemperature, the greater the instability.
In order to stabilise the calcined dolomite, the lime must be converted totri-calcium silicate during calcination. This is achieved by calcining a mix-ture of dolomite and the mineral serpentine so that the following reactionwill occur during calcination.
dolomite serpentine6(CaC03'MgC03) + 3MgO'2SiOz'2H20 ~
2(3CaO·Si02) + 9MgO + 12C02 + 2H20 (9.2)
Typical composition of stabilised dolomite brick:40.0% CaO, 40.3% MgO, 14.4% Si021 3.5% Fe203 and 1.5% Alz03.
9.1.2LADLE PREHEATING
The basic .refractory and high alumina bricks have high thermal conduc-tivities (Fig. 9.2), therefore ladles must be preheated to avoid excessive
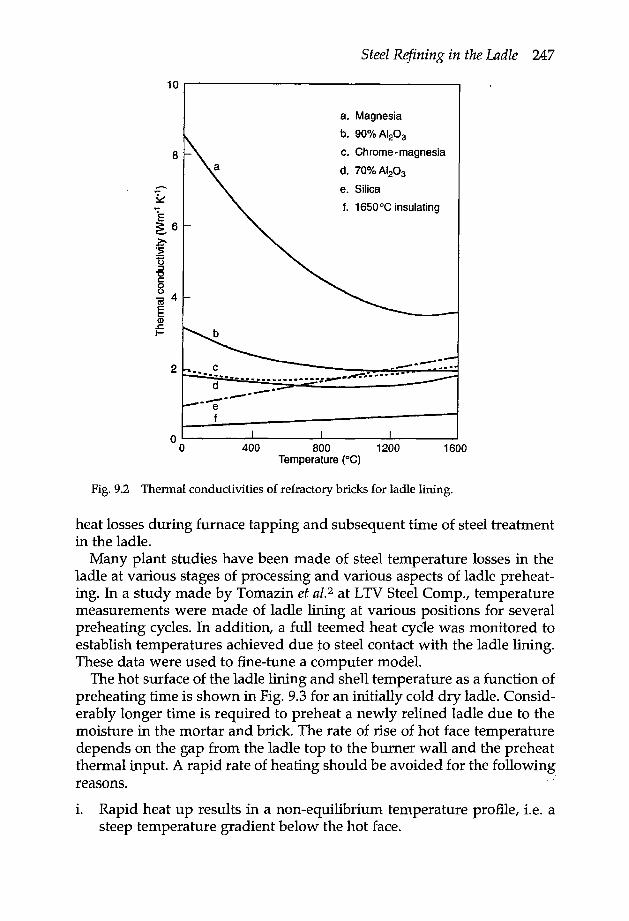
Steel Refining in the Ladle 247
10r-------------------------------~a. Magnesia
b. 90% AI203
c. Chrome - magnesia
d. 70% AI203
e. Silica
f. 1650°C insulating
8
2
o~------~------~------~------~o 400 BOO 1200Temperature (Oe)
1600
Fig.9.2 Thermal conductivities of refractory bricks for ladle lining.
heat losses during furnace tapping and subsequent time of steel treatmentin the ladle.
Many plant studies have been made of steel temperature losses in theladle at various stages of processing and various aspects of ladle preheat-ing. In a study made by Tomazin et a1.2 at LTV Steel Comp., temperaturemeasurements were made of ladle lining at various positions for severalpreheating cycles. In addition, a full teemed heat cycle was monitored toestablish temperatures achieved due to steel contact with the ladle lining.These data were used to fine-tune a computer model.
The hot surface of the ladle lining and shell temperature as a function ofpreheating time is shown in Fig. 9.3 for an initially cold dry ladle. Consid-erably longer time is required to preheat a newly relined ladle due to themoisture in the mortar and brick. The rate of rise of hot face temperaturedepends on the ·gap from the ladle top to the burner wall and the preheatthermal input. A rapid rate of heating should be avoided for the following.reasons.
i. Rapid heat up results in a non-equilibrium temperature profile, i.e. asteep temperature gradient below the hot face.

248 Fundamentals of Steelmaking
f 800
~::lca 600Ci50-E~ 400
200
1000
2 4 6 8 10 12Time on preheater (h)
Fig.9.3 Lining temperatures during preheating a cold dry ladle. From Ref. 2.
ii. Rapid heat up generates extreme shell stresses.iii. Thermal shock resistance of the brick may not be high enough to
withstand a fast rate of heat up.
The change in temperature profile of a steel ladle lining is shown in Fig.9.4 for the duration of preheating, transferring to the melt shop for tap andsteel treatment. The hot face temperature decreases during transfer of theladle from preheater to the melt shop. As shown in Fig. 9.5 computed by
;>W 1000a::::lt-.qa:w~ 800wt-
1400 2600
1200 2200
SURFACE TEMPERATURES
~1800 W
a::;:,l-eta:w0-
1400 ~\aJl-
". ~ ~ .
-- HOT FACE REFRACTORY
600 - - - SAFETY LINING
•••••••• INSULATING LINING 1000
_.- STEEL SHELL400
600
200 ._._._._._._._._._._._._._._._._._._._._._._._.-
o~ __ ~ ~ ~ ~ __ ~ ~ ~ __ ~ ~ ~200
50050 100 150 200 250liME, min.
300 350 400 450
Fig. 9.4 Temperature profile of a steel ladle as a function of time. From Ref. 3.

Steel Refining in the Ladle 249
20~-------------------------------1080°C
10 20 30 40 50Time from end of preheat to start of tap (min)
Fig. 9.5 The effect of cooling time for two different preheat temperatures for anuncovered ladle between end of preheat and tap, on the tap temperature adjustment.From Ref. 2.
Tomazin et al., the tap temperature of the steel should be adjusted inaccordance with the preheat hot face temperature and the time intervalfrom end of preheat to start of tap.
Decrease in liquid steel temperature with time in the ladle is shown inFig. 9.6 for ladle with or without a cover and with a slag layer. At the endof steel treatment, granular burnt rice hull is thrown onto the slag surfacefor additional thermal insulation to minimise heat losses from the steelduring casting.
9.1.3 POROUS PLUG ON THE LADLE BOTTOM
The top lancing method is used for steel refining in the ladle with powderinjection and stirring the melt with high argon flow rates. For gas bubblingat moderate rates, e.g. <0.6 Nm3min-1, a porous refractory plug is used.This is fitted usually on the bottom of the ladle as illustrated schematicallyin Fig. 9.7.
There are various designs of porous plugs; those in Fig. 9.8 are typicalexamples.4 Reference may be made to a review paper by Anagbo andBrimacombe> on porous plugs in liquid metal refining in the ladle.
9.2 STEEL HOMOGENISATION WITH GAS STIRRING
The mixing of liquid steel with gas injection to achieve homogenisation ofmelt temperature and composition is due primarily to the dissipation of
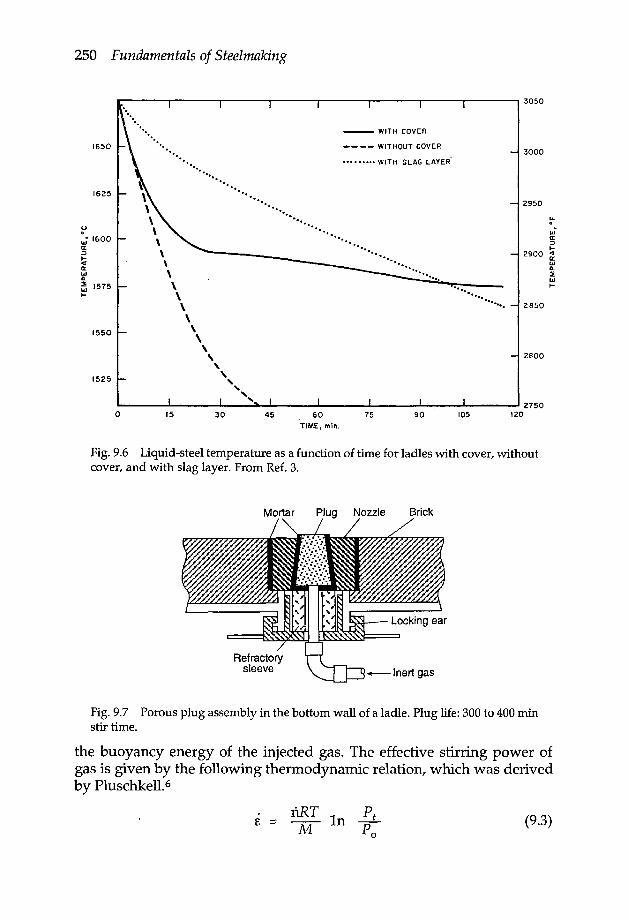
250 Fundamentals oj Steelmaking
1625
-- WITH COVER
-- -- WITHOUT COVER
••• • •••••••• WITH SLAG LAYER'·.... ..... ....................
...........................
30001650
2950
u
:; 1600a::>l-e:[a:wc,~ 1575I-
UJa::>I-
2900 ~UJn,~UJI-
2850
1550
2800
1525
o~----~------~--~~.-...----~----~------~----~----~2750
'2015 30 45 60TIME, min.
75 90 105
Fig. 9.6 Liquid-steel temperature as a function of time for ladles with cover, withoutcover, and with slag layer. From Ref. 3.
Fig. 9.7 Porous plug assembly in the bottom wall of a ladle. Plug life: 300 to 400 minstir time.
the buoyancy energy of the injected gas. The effective stirring power ofgas is given by the following thermodynamic relation, which was derivedby Pluschkell. 6
(9.3)

Steel Refining in the Ladle 251
Hot face
Increasing strength:. Decreasing porosity
Sliced plug Concentric plug
Capillary porous plugs
Fig. 9.8 Typical examples of porous plugs. From Ref. 4.
e = stirring power, W t-1n = molar gas flow rateR = gas constant, 8.314 J mol-lK-lT = temperature, KM = mass of steel, t (tonne)p 0 = gas pressure at the melt surface, atmP, = total pressure at injection depth H (m)
= Po + pgHP = steel density, 6940 kg m-3 at - 1600°Cg = 9.81 m S-2
With these values the following equation is obtained.
i (Wt-l) = 14.23 VTM' log (1 + ~)1.48Po
(9.4)
where v = ga~ flow rate, Nm3 min-l.
9.2.1 MIXING TIME
The gas stirring time to achieve 95% homogenisation is called the mixingtime 'to Several experimental and theoretical studies have been made to

252 Fundamentals of Steelmaking
formulate the mixing time in terms of the gas stirring power, ladle diame-ter and depth of gas injection in the melt. Tile following relation is fromHie work of Mazumdar and Guthrie."
'"t(s) = 116(£ )-1/3(D5/3H-l)
where D = average ladle diameterH = depth of gas injection
Calculated mixing times are given in Fig. 9.9 for the simplified case of D ~H. In a 200 t heat, the melt homogenisation will be achieved with argonbubbling for 2.0 to 2.5 minutes at the rate of 0.2 Nm3 min-I.
(9.5)
170Heat size t D=Hm
100 2.6
145 200 3.3300 3.8
120~Q)
E~ 95C)c·x
~70
45
20----------~----~--~o 0.5 1.0 1.5 2.0Gas injection rate (Nm3/min)
Fig.9.9 Calculated mixing times for 100,200 and 300 tonne heat sizes.
9.2.2 RATE OF SLAG-METAL REACTION IN GAS STIRRED MELTS
The rates of most slag-metal reactions are controlled primarily by masstransfer of the reactants and products across the slag-metal interface. Insteel desulphurisation in the ladle, the slag-metal mixing is achieved withargon stirring, and the mass transfer controlled rate of desulphurisation isformulated as
(9.6)

Steel Refining in the Ladle 253
where So = initial content in steel,Seq = content in equilibrium with the ladle slag,S = content at the end of argon stirring time,k = the rate constant, mirr-!
From the pilot plant tests'' with 2.5 t heats on steel desulphurisation, it wasfound that at moderate gas bubbling rates, corresponding to the power ofstirring i < 60 W t-l, there was little or no slag-metal mixing, hence the rateof desulphurisation was slow. The slag-metal mixing was achieved at highgas flow rates corresponding to E > 80 W t-1 for which the rate constant is
k(min-l) == 8 x 10⁻⁶(i )2.1 (9.7)
Details on the rate of steel desulphurisation in the ladle will be givenlater when discussing steel refining in the ladle.
9.3 LADLE SLAGS
The ladle slag used in the treatment of the aluminium-killed steel is usu-ally the lime (magnesia)-saturated alumino silicate, preferably low in ironoxide and manganese oxide contents. Prior to the advent of the ladlefurnace, the ladle slag was formed by adding to the tap stream lime-basedfluxes, as for example (i) 80 percent lime plus 20 percent spar, (ii) prefusedcalcium aluminate, or (iii) 50 percent lime plus 50 percent prefused cal-cium aluminate. The amount of flux added is in the range 5 to 10 kg pertonne of steel, depending on the steel-refining practice.
It should be emphasised here that these solid fluxes should not beadded into an empty ladle prior to furnace tapping. The reason being thatsome of the flux remains on the bottom of the ladle and does not mix withthe liquid steel stream. Any material stuck on the ladle bottom may ul-timately become unstuck and shoot to the surface of the melt duringsubsequent steel processing, either at the ladle furnace or at the caster,causing melt eruption resulting in molten steel and slag splashing whichcan be hazardous to the ladle operators.
It should be noted that the practice of steel desulphurisation developedby the steel industry in the 1970s was based primarily on the concept ofpouring liquid steel onto a mixture of granular desulphurising fluxeswhich were dumped into a preheated ladle shortly before furnace tapping,as described for..example in the papers by Hutnik et aI.8a, Hawkins= andMikulecky=, However, in this desulphurising practice, attention was paidto the steel temperature and to the preheated ladle temperature to ensure.they were sufficiently high to avoid any skull formation on the bottom orside walls of the ladle, hence to prevent the occurrence of a subsequentmelt eruption in the ladle. With this point in view, the tap temperature of

254 Fundamentals of Steelmaking
steel in the furnace was raised to about 1700 to 1750°C, depending on thepractice and steel grade, and the hot face temperature of the ladle liningraised to a high enough temperature at the preheater so that it would beabout 1125 to 1175°C at the time of furnace tapping.
In most practices using the ladle furnace, the steel is often tapped with littleor no aluminium addition to the ladle. After skimming off the furnace slagfrom the ladle, the melt is deoxidised with bar aluminium followed by the ad-dition of lime-rich fluxes which form the ladle slag during arc reheating. Theso called 'slag conditioner' containing about 68% CaC:z,11% Si021 9% A1203,
3% CaO and 4% C021 is often added at the rate of about 1 kg per tonne ofsteel to maintain a reducing condition in the slag and also to generate a foamyslag for submerged arc heating in the ladle furnace. The average slag com-position after arc reheating is in mass percent: 50-56 CaO, 7-9 MgO, 6-12 Si02120-25 Al203 1-2 (FeO + MnO), 0.3-0.5 Ti02 and small amounts of S and P.
In the silicomanganese-killed coarse-grain steel of high drawability, asfor instance the tyre-cord-grade high-carbon steel, there is a narrow crit-ical range for the total aluminium content. It should be within 15 to 25ppm to ensure that the deoxidation product is molten alumino silicate ofabout spessartite composition (3MnO·AI203·3Si02), which has a highductility required in the cold drawing of steel to a thin wire of about 0.2mm diameter. For this grade of steel, the ladle slag to be used is calciumsilicate of wollastonite composition (CaO·Si02).
9.4 CHILL FACTORS FOR LADLE ADDITIONS
The ladle additions of ferro alloys and fluxes will lower the steel tempera-ture in the tap ladle. For the quantity of heat extracted from the steel bath,~H kJt-1 steel, the decrease in the bath temperature will be
-/)"T(°C) = :
where 790 kJt-1°C-l is the heat capacity of the liquid steel.The following are the chill factors for 1 kg alloying element addition per
tonne of steel at 1630°C.
Element:AT,oC
C-5.85
Cr-1.33
Fe-1.79
Mn-1.90
Si Al+1.78 . +0.14
For Al-killed steels, the heat of reaction in deoxidation of the steel mustbe included in calculating the effect of Al addition to the tap ladle on thesteel temperature.
2Al(R1) + 3[O](1630°C) ~ A1203(1630°C)
In the deoxidation of steel containing 600 ppm 0, the heat generated is
Steel Refining in the Ladle 255
-14,830 kJt-1 which gives a temperature benefit of flT = 19°C. That is, withAl deoxidation of the steel in the tap ladle, the decrease in the steel tem-perature during furnace tapping will be less by 19°C.
The chill factors for a few ferro alloys are given below,
Added material for1% alloying elementat 100% recovery
CokeHC - Fe/50% CrI.C - Fe/70% CrHC-Fe/MnFe/50% Si
Decrease in steeltemperature in the tapladle, -/1°C
65412430o
For 1 kg flux addition per tonne of steel at 1630°C, the chill factors are
FluxSi02CaF2CaOCaC03
CaO-AI203
-AT,OC2.593.372.163.472.39
Apart from the chill effects of the ladle additions, there are heat losses tothe ladle refractory lining and heat losses by radiation 'during furnacetapping. For the case of aluminium killed steel with the ladle addition of10 kg (lime + pre-fused calcium aluminate) per tonne of steel, the decreasein steel temperature during furnace tapping to a pre-heated ladle is in therange 55 to 75°C. The heat loss due to the flux addition is nearly balancedby the heat generated in aluminium deoxidation of the steel. Therefore, inthe particular tapping practice considered, the heat losses are almost en-tirely by radiation and conduction into the ladle lining.
9.5 REACTIONS OCCURRING DURING FURNACE TAPPING
9.5.1 NITROGEN PICKUP
During furnace tapping, there is a momentary entrainment of air bubblesat the place of entry of the tap stream to the steel bath in the ladle. This isdemonstrated by the photographs in Fig. 9.10, showing increase in airbubble entrainment with increasing free fall height of a water stream. ..'
From a theoretical analysis? for the simplified limiting case of an un-broken steel stream from the furnace to the ladle, the following estimate is

256 Fundamentals of Steelmaking
made of the volume of transitory air entrainment durin.g furnace tappingat the rate of 30 tonne per minute
V (Nm3) = 5.3t - O.34t2 (9.8)where t is the duration of furnace tapping in minutes. For a 220 t heat, thetransitory air entrainment during furnace tapping is estimated to be about20 Nm3• With respect to the mass of steel (220 t), this volume of transitoryentrainment of air bubbles corresponds to 92 ppm Nand 25 ppm O.
Almost all the oxygen in the entrained air bubbles will be picked up bythe de oxidants added to the ladle. On the other hand, the extent of nitro-gen pickup by the steel from the momentarily entrained air bubbles willbe controlled by the rate of the chemical reaction
(9.9)As discussed in section 2.1.1, oxygen and sulphur in steel retard the kine-tics of nitrogen reaction with steel. The higher the concentration of oxygenand/ or sulphur, the smaller the amount of nitrogen pickup. The plantanalytical data within the hatched area in Fig. 9.11 show nitrogen pickupduring tapping of 220 t heats, as affected by the extent of steel deoxidationin the tap ladle; in these heats the steel contained about 0.01% s. There isalso the possibility of nitrogen pickup from the ladle additions of ferroalloys which contain some nitrogen.
. ;) .• ":=;}.
,fi~·" ..• ...t'I. + ~.•. y.... .,..~.... ,'..' ..•...
. , ..•~,- .•. ,. ..' .
Fig. 9.10 Photographs showing increase in air bubble entrainment with increasingfree fall height of a water stream.

Steel Refining in the Ladle 257
Ea.. B20z<l
10
30
200 300 400Dissolved oxygen (ppm)
Fig.9.11 Nitrogen pickup during tapping of 220 t heats as affected by the extent ofdeoxidation in the tap ladle.
100 500 600
9.5.2 HYDROGEN PICKUP
The moisture contained in the ladle additions, e.g. burnt lime, coke andferro alloys, will react with liquid steel resulting in hydrogen pickup bythe steel during furnace tapping.
H20 ~ 2[H] + [0] (9.10)
Noting that the solubility of hydrogen in liquid steel increases with de-creasing oxygen content, the hydrogen pickup in the aluminium-killedsteel is expected to be somewhat higher.
Of the ferro alloys added, the ferromanganese is probably the majorcontributor to the hydrogen pickup. Plant studies made on changes inhydrogen levels at various stages of steelmaking processes indicate that anaverage hydrogen pickup due to ferromanganese addition is AH = 2 ppmH/%Mn.
9.5.3 FURNACE SLAG CARRY OVER
The percentages of utilisation of the ladle additions for low carbon heatsare 85-95% for Mn, 60-70% for Si, and 35-65% for AI. The copious blackfumes emitted" at the time of the addition of ferromanganese to the tapstream, indicate that the vaporisation of manganese is the primary causeof some loss of manganese during the ladle addition. Losses in the ladleadditions of aluminium and silicon are due to reactions with the furnaceslag that is carried into the tap ladle. There is also the iron oxide rich skull

258 Fundamentals of Steelmaking
accumulating at the converter mouth, some of which falls into the ladleduring furnace tapping and reacts with aluminium and silicon.
Mass of slag carryover and fallen converter skull:The reaction of aluminium and silicon with the furnace slag and fallenconverter skull is represented in a general form by the following equation
Fe(Mn)Ox + AI(Si) ~ Fe(Mn) + Al(Si)Ox (9.11)
Using the average molecular masses and assuming 80% Fe304 for theconverter skull, the following approximate relation is derived for the lossof aluminium and silicon to the ladle slag for 220 t steel in the tap ladle.
[%Al + %Si]; = A(%FeO + %MnO)Wfs x 10-6 + Wsk x 10-4 (9.12)
where
Wfs = mass of furnace slag carryover, kgWsk = mass of fallen converter skull, kgA(%FeOt + %MnO) = decrease in oxide contents of furnace slag duringtapping.
For low carbon Q-BOP heats, 8. (%FeOt + %MnO) is about 20% for whiCW-the above equation becomes
[%AI + %Si]s = (0.2Wfs + WsJ x 10-4 (9.13)
Phosphorus reversion:Another consequence of slag carryover is phosphorus reversion to the AI-killed steel in the tap ladle. For a 220 t heat, the phosphorus reversionA[ppm P] is represented by
A[ppm P] = 0.045A(%P)Wfs (9.14)
where A(%P) is the decrease in the phosphorus content of the furnace slagcarried into the tap ladle. For low carbon Q-BOP heats, A(%P) is about0.3% for which the above equation becomes
A[ppm P] ~ 0.014Wjs (9.15)
Results of the analysis of Q-BOP heat logs, as described above, areplotted in Fig. 9.12 (the data points are scattered within the hatched area)which show the expected increase in the extent of phosphorus reversionwith an increase in [%AI + %Si]s reacting with the ladle slag. For highphosphorus reversion of 45 ± 10 ppm, the mass of slag carryover is esti-mated to be Wfs = 3214 ± 714 kg, corresponding to a slag thickness (in a 220t ladle) of about 125 ± 28 mm. In most cases of furnace tapping, thephosophorus reversion is about 20 ± 10 ppm for which the estimated slagcarryover is about 1430 ± 714 kg. This estimated average slag carryoverduring furnace tapping corresponds to a slag thickness (in a 220 t ladle) of

Steel Refining in the Ladle 259
E 800..0..
///// AI or AIiSi killed Q)
z c0 60 ~ 0.3-0.6°/oMn 4 g.•...en cia: 3 ww 40 >> 0wa: 2 >-en 0:::> 20 0:II 1 «0 0I (!Ja, 0 «C/) ..J
0 enI ..20a.
o 0.02 0.04 0.06 0.08 0.10 0.12 0.14 0.16
(%AI + %Si), REACTING WITH LADLE SLAG
Fig. 9.12 Phosphorus reversion during tapping of 220 t Q-BOP heats is related to%Al + % Si reacting with carry-over furnace slag and fallen converter skull.
about 55 ± 28 mm, which is in general accord with the plant observationsin the so-called minimum slag carryover practice.
When the heat is tapped open, with only the addition of fer-romanganese and a small amount of aluminium, the steel is not reducedenough to cause phosphorus reversion. In fact, in some cases of open heattapping with about 0.3-0.6% Mn addition, the phosphorus content of thesteel decreases by about 10 ppm, due to the mixing of the carried overfurnace slag with the steel during tapping.
For the average value of Wfs = 1430 ± 714 kg, for which A[ppm P] = 20 ±10, Wsk is estimated to be 470 ± 35 kg.
9.6 LADLE FURNACE
The ever increasing users demand for higher quality steel, particularly forcritical applications, and the advent of sequential continuous casting,made it necessary for steel plants to install ladle furnaces for steel reheat-ing that is needed for (i) the extended time of steel refining and (ii) theadjustment of steel temperature for the caster on a correct timely basis.
There are several types of ladle furnaces for arc reheating of steel, de-signed by different manufacturers, e.g. Finkl-Mohr, Lectromelt, ASEA-SKF, MAN-GHH, Daido-NKK etc. The basic features of the Daido-NKKladle furnace are shown in Fig. 9.13.
9.6.1 ARC REHEATING IN THE LADLE FURNACE (LF)
The following statements summarise the basic requirements for efficientarc reheating in the ladle furnace.
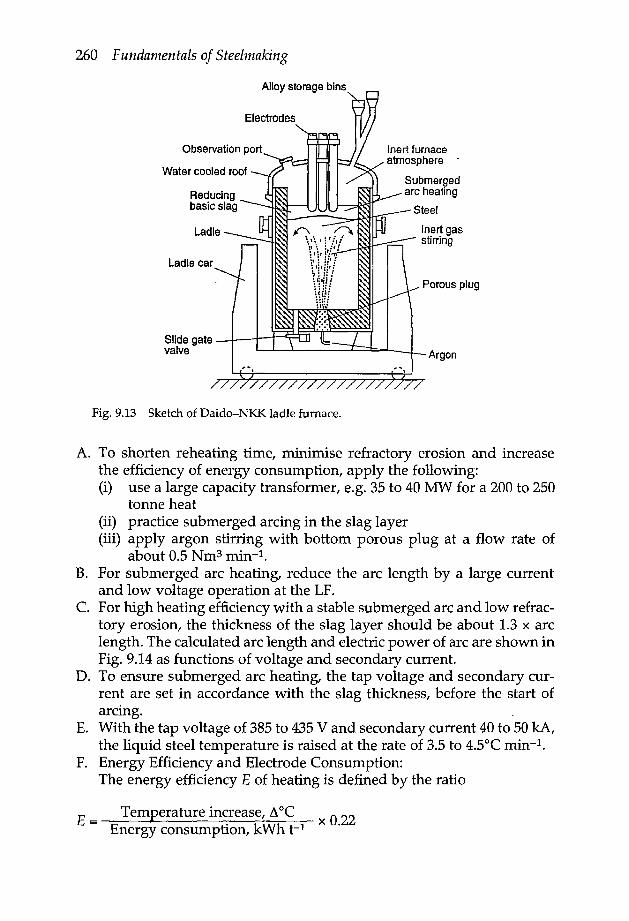
260 Fundamentals of Steelmaking
Ladle car
Alloy storage bins
Water cooled roof
Inert furnaceatmosphere -
Submergedarc heating
Steel
Slide gatevalve Argon
Fig. 9.13 Sketch of Daido-NKK ladle furnace.
A. To shorten reheating time, minimise refractory erosion and increasethe efficiency of energy consumption, apply the following:(i) use a large capacity transformer, e.g. 35 to 40 MW for a 200 to 250
tonne heat(ii) practice submerged arcing in the slag layer(iii) apply argon stirring with bottom porous plug at a flow rate of
about 0.5 Nm> min-I.B. For submerged arc heating, reduce the arc length by a large current
and low voltage operation at the LF.C. For high heating efficiency with a stable submerged arc and low refrac-
tory erosion, the thickness of the slag layer should be about 1.3 x arclength. The calculated arc length and electric power of arc are shown inFig. 9.14 as functions of voltage and secondary current.
D. To ensure submerged arc heating, the tap voltage and secondary cur-rent are set in accordance with the slag thickness, before the start ofarcing.
E. With the tap voltage of 385 to 435 V and secondary current 40 to 50 kA,the liquid steel temperature is raised at the rate of 3.5 to 4.SoC min-I.
F. Energy Efficiency and Electrode Consumption:The energy efficiency E of heating is defined by the ratio
E = Temperature increase, 11°C 0 22Energy consumption, kWh t-I x ·

Steel Refining in the Ladle 261
0_ 25~(')0 20,...~~cu 15(5~Q) 385V~0 100.
360V
335V
o·c~ 5m
o~~--~--~--~--~--~~30 35 40 45 50 55Value of secondary current (kA)
Fig. 9.14 Calculated arc lengths and electric power of arc.
where 0.22 kWh t-I °C-I is the theoretical amount for 100 percent effici-ency of energy consumption.
The energy efficiency of heating increases with an increasing heat size.
Heat size, t
50100250
E0.40 to 0.500.45 to 0.550.55 to 0.65
G.The electrode consumption increases with an increasing(i) cross sectional current density, i.e. with a decreasing electrode
diameter;(ii) heating time.
Electrode consumptionkgt-I
Current densityAcm-2
Heating timemin
0.1 to 0.30.4 to 0.8
1040
1580
H.The arcing periods are usually limited to less than 15 minutes at onetime of arcing.

262 Fundamentals of Steelmaking
9.6.2 REHEATING WITH OXYGEN INJECTION
Liquid steel can be reheated by oxidising Al and Si with a lance injection ofoxygen deep into the melt. For the reactions
2AI(R.T.) + 3h02(RT) ~ AI203(1630°C)
Si(R.T.) + 02(RT) ~ Si02(1630°C)
(9.16)
(9.17)
heats generated are
27,000 kJIkg Al28,500 kJ /kg Si in Fe-75% Si alloy
To raise the melt temperature by 35°C with 70% thermal efficiency ofthe process, the amounts of reactants used are
1.46 kg Alit steel and 1 Nm302/t steel1.85 kg Fe-75% Silt steel and 1.2 Nm302/t steel
Reheating with Al oxidation in the melt is being used in RH-OB de-gassers and in various types of ladle furnaces, including the Bethlehemplants-- in Steelton, Sparrows Point and Burns Harbor. With this practice,the steel temperature can be raised at the rate of 6°C min-I. To ensurehomogenisation of the melt temperature and flotation of oxidation prod-ucts out of the melt, the oxygen injection must be followed by argonstirring and rinsing.
During oxygen injection to oxidise AI, there is also some oxidation of Si,Mn and C as shown below:
i. In all grades of steel, 0.6 g Si and Mn/Nl O2ii. In C ranges < 0.4%, a little or no C oxidationiii. In rail grades (~0.8% C), the loss is about 0.01% C per heat.
9.7 STEEL DEOXIDATION
For liquid steel to be castable, hot workable and the product to have thedesired metallurgical and mechanical properties, the liquid steel must bedeoxidised in the tap ladle for which the deoxidants used are: fer-romanganese, ferrosilicon, silicomanganese and aluminium.
There are three categories of steel deoxidation:
(i) Resulphurised steel deoxidised with ferromanganese to 100-200 ppmo.
(iia) Semi-killed steel deoxidised with Si/Mn to residual SO to 70 ppm o.b) Semi-killed steel deoxidised with Si/Mn/ Al to residual 40 to 25 ppm
O..

Steel Refining in the Ladle 263
c) Semi-killed steel deoxidised with Si/Mn/Ca to residual 20 to 15 ppmo.
(iii) Killed steel deoxidised with Al to residual 4 to 2 ppm o.The reaction equilibrium data for steel deoxidation were presented in
section 6.8. In this section the practical aspects of deoxidation are pre-sented _with reference to the test results obtained at the U.S. Steel plants.
9.7.1 OPEN HEAT TAPPING
Now that the ladle furnace is available for the final refining of steel, thesteel can be partially deoxidised in the tap ladle with Fe/Mn and Fe/Si,followed by a final deoxidation with aluminium at the ladle furnace sta-tion. There are several advantages to this practice, as for example
i. to minimise nitrogen pickup during tappingii, to minimise phosphorus reversion from carried over furnace slagiii. to eliminate aluminium losses in the tap ladle.
9.7.2 SLAG AIDED DEOXIDATION
The dissolution of the deoxidation products Mn(Fe)O or manganese sili-cates in a neutral ladle slag, such as calcium aluminate, will lower thethermodynamic activities of the deoxidation products, hence increase theextent of deoxidation. The concept of slag aided deoxidation is by nomeans new. In the Perrin process developed in the early 1930s, the deox-idation of the open hearth or Bessemer steel with ferromanganese andferrosilicon was enhanced by tapping the steel into a molten calcium(magnesium) aluminosilicate slag placed on the bottom of the tap ladle.
9.7.2a Partial deoxidation with Fe/MnThe plot in Fig. 9.15 depicts the progress of partial deoxidation of steel duringtapping of a 200 t heat with the addition of 1800 kg lime-saturated calciumaluminate and ferromanganese to the ladle in the early stage of tapping, e.g.at 1/8 ladle fillage. At the time of ladle additions, the small quantity of steel inthe ladle is almost completely deoxidised with the residual manganese in thesteel being at a concentration of about 1.6% Mn. As the ladle is filled, thedissolved manganese is consumed in the deoxidation reaction and diluted toabout 0.32% Mn when the ladle is full and the residual dissolved oxygen isreduced to about 300 from 650 ppm in the furnace.
The results obtained using this practice in the EAF and Q-BOP shops ofU.S. Steel are plotted in Fig. 9.16 for steels containing in the tap ladle about0.003% Si and Al each. If no calcium aluminate slag addition were made tothe tap ladle, the deoxidation by Mn and Fe alone with pure Mn(Fe)O as

264 Fundamentals of Steelmaking
1.6
1.2.c~::::ce0
O.B
0.4
0a
800
600 oEQ..
400 Q..
200
LADLE FILLAGE
Fig.9.15 Changes in dissolved contents of Mn and 0 in steel during furnace tap-ping with calcium aluminate and ferromanganese added to the tap ladle at 1/8 ladlefillage. From Ref. 10.
the deoxidation product would have resulted in much higher levels of theresidual dissolved oxygen in the steel, as depicted by the dotted curve.
A more detailed analysis of the EAF heats is given in Fig. 9.17. Theslopes of the lines K' FeMn are in close agreement with the slag-metalequilibrium relation given in Fig. 6.2. Similarly, the relation between%MnO in the ladle slag and the product [%Mn][ppm 0] in Fig. 9.18 is inclose accord with the equilibrium value.
In these EAF trial heats, there was no argon stirring in the ladle duringfurnace tapping. Yet, the slag aided partial deoxidation achieved duringfurnace tapping was close to the levels governed by the slag-metalequilibrium. Evidently there is sufficient mixing of slag and metal for thedeoxidation reaction to progress at a relatively fast rate. Because of the off-centre entry of the steel stream into the ladle, there is always a slowrotation of the slag layer in the ladle. Thus, most of the slag layer passesthrough the area of stream entry where there is localised mixing of slagand metal, hence a faster reaction rate.
In this practice, the final aluminium deoxidation was done with a wirefeeder, based on the level of the residual dissolved oxygen in the tap ladle.The efficiency of aluminium recovery was about 85 to 90 percent. Al-though the ladle slag contained 4 to 7%MnO and 7 to 12%FeO, there waslittle reduction of these oxides during the injection of aluminium wire,accompanied by argon stirring at a moderate rate of about 200 NI rnirr-l.

Steel Refining in the Ladle 265
W-J.0::sa..~~,
oEa.a.ClW
:=ioenen£S
Mn/Fe )'" - - - ,deoxidation withoutladle slag
0.2 0.8
o~-- ~ ~ ~ ~ ~o 1.0
0.6,
1630t10°CTap ladlesample
• Q-BOP
6 EAF
%Mn IN TAP LADLE
Fig. 9.16 Partial deoxidation of steel with ferromanganese and calcium aluminateladle slag during furnace tapping for steel in ladle containing Si and Al each <
0.003%.From Ref. 10.
0.4 0.6
0.6
Fig. 9.17 Manganese content of steel in EAF at tap and in tap ladle is related to%MnO/%FeO ratio in furnace and ladle slags. From Ref. 10.
1700t10°Ctap EAF sample
0.2
o~ ~ ~ __ ~~ ~ ~ __ ~o 0.1 0.2 0.3 0.50.4
O/oMn

266 Fundamentals of Steelmaking
8 Estimated 0equilibrium o 0,,
,
relation ,
0 6c ,
~ ,(fi
4
2
o~ __ ~ ~ ~ ~ __ ~ ~·0 20 40 60 80
[%Mn][ppm 0]100 120
Fig. 9.18 Manganese deoxidation product is related to MnD content of ladle slagafter EAF tapping. From Ref. 10.
In the EAF steelmaking, the nitrogen content of steel in the furnace is 35to 45 ppm at tap. With partial deoxidation from about 650 to 300 ppm inthe tap ladle, the nitrogen pickup will be less than 10 ppm.
9.7.2b Deoxidation with Si/MnIn semi-killed steels deoxidised with silicomanganese and a small amountof aluminium, the deoxidation product is molten manganese aluminosili-cate and the residual dissolved oxygen is about 50 ppm for steel contain-ing about 0.8% Mn and 0.2% Si. With the addition of 1000 kg of prefusedcalcium aluminate to the ladle for a 200 t heat, the residual dissolvedoxygen in the steel can be lowered to about 20 ppm with the Si/Mndeoxidation; this is because of the dissolution of the deoxidation productsin the calcium aluminate slag.
It should be noted that with ladle slag containing a high percentage ofalumina and a low concentration of silica, some alumina will be reduced bysilicon. As noted from the equilibrium data in Fig. 9.19, steel containing, forexample, 0.2% Si may pick up an appreciable amount of aluminium by thereduction of alumina from the slag. The final stage of deoxidation of the steelbath in the ladle is controlled by the aluminium recovered from the slag.
9.7.2c Deoxidation with AlThe oxygen, sensor readings and analysis of steel samples from the tapladle have indicated that the addition of lime-spar or prefused calcium

Steel Refining in the Ladle 267
0.2
~U5
0.1
Fig. 9.19 Si and Al contents of steel in equilibrium with molten calcium aluminateslags containing ~ 5% Si02 at 1600°C.
8~------~--------------------~Plant data ( 0 ) for total AI
and 1600 ± 10°C
o\ 00
\, 0 08-, 000 0
'...... 0 CO 000 0••.•.•.. 0
00000
Equilibrium with .•.•.•........-....... 0 050:50 CaO/AI
20
3•••••••• __ ••.•••••
0.02 0.04 0.06AI (%)
Fig. 9.20 Plant data for deoxidation with Al and calcium aluminate ladle slag dur-ing furnace tapping compared with equilibrium values for Al203 and molten calciumaluminate (50:50 CaO/ A1203) inclusions.
aluminate to the ladle extends the deoxidation of steel with aluminium dur-ing furnace tapping. This is demonstrated by the plant data plotted in Fig.9.20.The oxygen sensor readings give results which are between those for thedeoxidation product Al203 and molten calcium aluminate, indicating that thealumina inclusions in the melt are in fact fluxed by the ladle slag.
In the plant trials with 30 t AOD heats, reported by Riley and Nusselt'",the oxygen sensor reaclings were taken after vigorous mixing of steel with the

268 Fundamentals of Steelmaking
18~----~-------------------- _o • Measured
o '\ - -- Equilibrium for AI203 .
00 ~ 0
\,650±100C1600±10°C 0 ~ 0
\ 0 0 ~~'", 0 "'" ~cfJ '<,..
• ~~ ..• co CD 0 ~ •• •. _
~ ..• o 0 ..• "'-.. 0
• -. -<;••--..•• , .- fP. .. ---- .•--2~--------~------~·~·--·~·~~·~·o 0.02 0.04 0.06
% Ar (dissolved)
oE 140.0.III
~~ 10ctSr::CDC)
~ 6o
Fig. 9.21 Oxygen sensor measurements after Al deoxidation and hard argon stirringin 30 t AOD, reported by Riley and Nusselt.P
lime-rich aluminate slag and hard argon blowing. As can be seen from their plantdata in Fig. 9.21, the residual dissolved oxygen contents for 1650 and 160QoC arebelow the equilibrium curves for pure alumina, because of the fluxing of aluminainclusions with the calcium aluminate furnace slag and argon stirring. In fact, theoxide inclusions separated from the steel samples were found to have composi-tions similar to those of the calcium aluminate AOD slag.
9.7.3 DEOXIDATION WITH CA-SI
Steel semi-killed with Si/Mn can be deoxidised further by the cored-wire in-jection of Cal-Silo In the 60-tonne trial heats made at the Anzin Works inFrance, reported by Thomas et al.12 the semi-killed steel (0.1% C, 0.2% Si, 0.5%Mn) was deoxidised from 75 to about 15ppm 0 by the cored-wire injection ofCal-Sil (30% Ca). Their reported plant data are plotted in Fig. 9.22 showingthe fractions of oxygen and calcium reacting as a function of the addition of Ca.
If the content of dissolved oxygen in the ladle is lowered to 20 or 30 ppmby slag-aided Si/Mn deoxidation during furnace tapping, a subsequentdeoxidation by Cal-Sil injection may lower the residual dissolved oxygento about 10 ppm or less.
9.7.4 ARGON RINSING FOR INCLUSION FLOATATION
After arc reheating and trim additions for composition adjustment, the rateof argon bubbling should be reduced to a low level of 75 to 150- Nl min-I,i.e. argon rinsing, to float out the residual deoxidation products, known asinclusions. With argon rinsing for 5 to 8 min, the total oxygen content of thesteel as simple or complex oxide inclusions is less than 15 ppm.

Steel Refining in the Ladle 269
1.0 ,..---------------,(a)
g> 0.8
Meo 0.6eo~tt 0.4
0.2'----"""'--------'-------....I.--..J0.5 r----------------,
C)cne 0.4asoc~ 0.3~u,
0.2 '- """'-- ---'-- --....1.--10.24 0.32 0.40
Addition kg Ca/tonne0.48
Fig. 9.22 Fractions of oxygen and calcium reacting in deoxidation of semi-killedsteel (- 75 ppm 0) with Cal-Sil (30% Ca) cored-wire injection are related to theamount of Ca added, derived from plant data reported by Thomas et aZ.12
At argon flow rates above 200 Nl min-I, the gas bubbles open up anIeye' of 30 to 60 em in the slag layer, thus exposing the steel surface to air.This situation leads to the re-oxidation of the bath, hence generates moreoxide inclusions and lowers the efficiency of inclusion removal.
The total aluminium content of the metal sample taken from the tun dishor the mould is about 0.007% lower than the content in the last sampletaken from the ladle. This fade in aluminium is due primarily to thereoxidation of steel during casting and to the flotation of alumina out ofthe melt in the tundish.
9.8 DESULPHURISATION
In certain grades of clean steel, e.g. armour plates, plates for off-shore oilinstallations and line pipes, the sulphur content should be less than 20ppm. This low level of sulphur in the steel can be achieved only by de-sulphurisation ·ofthe fully killed steel in the ladle. The ladle slag to be usedis the lime-saturated calcium aluminate containing less than 10% Si02 andless than 0.5% of both FeO and MnO. .
The overall desulphurisation reaction is represented by
(9.18)

270 Fundamentals of Steelmaking
For this reaction to proceed rapidly, good slag-metal mixing is necessary;this is achieved by top lance injection of argon at the rate of 1.0-1.8 Nm3
min-I. It should be noted that with the porous plug on the ladle bottom,the maximum argon flow attainable is about 0.6 Nm3 min-t, In some steelworks, three porous plugs are installed on the bottom of the ladle for hardargon stirring. However, in most plants hard argon stirring for de-sulphurisation is done by top lancing deep into the melt in the ladle.
To prevent re-oxidation of the steel bath and nitrogen pick-up, the ladlemust be covered with a lid; the free board under the lid being flushed withargon at the rate of about 0.6 NI min-1. Furthermore, there should be atleast 75 cm deep free board from the ladle top to the slag surface toprevent splashing of-slag and metal on to the ladle lid. Many ladle fur-naces do not have high enough free board for extensive steel de-sulphurisation with heavy argon stirring.
9.8.1 DESULPHURISATION METHODS
1. TN (Thyssen-Niederrheim) process:The ladle slag is made up by adding to the tap ladle, per tonne of steel,about 8 kg of the mixture 80% CaO + 20% CaFz. The alumina generated inthe deoxidation of the steel during furnace tapping reacts with the lime andspar added to the ladle which forms a lime-rich molten aluminate. Thealuminium content of the steel is adjusted to 0.07-0.10% and the steel isdesulphurised by top lance injection of either Cal-Sil (30% Ca) or a powdermixture of CaO and CaF2I with argon flowing at the rate of about 1Nm3
mirr+, For grades of steel low in silicon content, the desulphurisation isdone by a lime + spar injection. Depending on the amount injected, 50 to 80percent desulphurisation is achieved in 12 to 15 minutes time of treatment.
Amount injectedkgt-1
123
Percent desulphurisationCal-Sil CaO-CaF2
55 4570 6080 70
With this method, the steel can be desulphurised to a level of 20 or 40 ppmS, provided the initial sulphur content is less than 110 ppm So.
In a modified version of the TN process, the steel is desulphurised witha co-injection of Cal-Sil (30% Ca) and a powder mixture of 7% AI-+ 15%CaF2 + 78% CaO deep into the melt. The following quantities are used pertonne of steel:
(i) 10 to 15 kg calcium aluminate-based ladle slag with CaO / Alz03 =1.5 to 1.8;
(ii) 0.8 to 1.3 kg Cal-Sil injected at the rate of 35 kg mirr+;(iii) 1 to 2 kg (AI-CaF2-CaO) injected at the rate of 60 kg min-l.

Steel Refining in the Ladle 271
Using this method, the steel initially containing 0.014 ± 0.002% So is de-sulphurised to 25 to 45 ppm S in 6 or 7 minutes time of co-injection.
2. Calcium aluminate slag and argon stirring:If there is sufficient free board over the slag layer in the ladle, ~ 1 m,extensive desulphurisation can be achieved with a lime-saturated alumi-nate slag and hard argon stirring at the rate of 1.5 to 1.8 Nm3 min-I. Thispractice is best suited for operating in the tank degasser, where there is avery good slag-metal mixing at reduced tank pressures. Furthermore,there is hydrogen and some nitrogen removal during desulphurisation.
The slag/metal sulphur distribution ratios at the end of desulphurisa-tion are plotted in Fig. 9.23. The plant data from U.S. Steel Works arewithin the hatched area for desulphurisation of various grades of steel by(i)TN process, (ii) with lime-rich aluminate slag and hard argon stirring ina covered ladle and (iii) in the tank degasser. The sulphur distributionratios after desulphurisation are in close agreement with the slag-metalequilibrium values for 0.006 ± 0.002 and 0.03 ± 0.01 % Al at temperatures of1600 ± 15°C.The lower the silica content of the aluminate slag the greaterthe extent of desulphurisation.
As reported by Bannenberg et al.13 of Dillinger Hiittenwerke, high sul-phur steels can be desulphurised to low residual levels by hard argonstirring in the tank degasser, using the lime-rich aluminate slag containingless than 1% Si02• In this practice with 180 tonne heats, burnt lime and baraluminium are added to the tap ladle and the furnace slag carry over is
40
..- - - - - - - - - Slag metal equilibrium
7///Z/ U.S. Steel plant data
AI (%)
1000 ••..0.030..~en~ 400UiC
100
10----~--~--~----~--~--~o 5 10 15 20
Si02 (mass %)25 30
Fig. 9.23 Slag/ metal sulphur distribution ratios after desulphurisation with lime-saturated CaO-MgO-AI203-Si02 slags at 1600 ± 15°C with steels containing residual0.006 ± 0.002% Al or 0.03 ± 0.01% Al are compared with the equilibrium values.

272 Fundamentals of Steelmaking
kept to about 400 kg. The initial and final sulphur contents and quantitiesof slag in the ladle are as shown below.
Ladle slagkg t-12216141210
Sulphur, ppmInitial Final
700 60500 40300 20200 15100 10
If the silica content of the slag is high and the silicon content of steel islow, there will be a reduction of silica from the slag by aluminium in thesteel during hard argon stirring.
SiOz + %[AI]~ [Si]+ 2h(AI203) (9.19)
It is seen from the plot in Fig. 9.24 that the tank degasser data13 areconsistent with the experimental equilibrium data 14 for lime-saturatedcalcium aluminate melts containing less than 5% Si020
3. EXOSLAG practice:The AI-killed steel can be desulphurised, at least partially, during furnacetapping by pouring steel onto a molten lime-saturated calcium aluminate,formed prior to tapping by the exothermic alumino-thermic reaction.
Fe203 + 2AI ~ Al203 + 2Fe (9.20a)
xCaO + A1203~ xCaO·AI203 (9.20b)
An exothermic slag mixture, EXOSLAG,was formulated and tested atthe Research Laboratory of USSin 1984.15The following preferred mixtureincludes the additional lime needed to flux the alumina generated in thedeoxidation reaction to give a lime-saturated aluminate slag with the nom-inal ratio of %CaO/%AI203 = 60/40.
Mixturemust be
1 58%burnt lime~ 30% haematite are fines (low
Si02)
J 12% aluminium powderkept dry
The ignition temperature of the exothermic reaction in equation 9.20afor this mixture was determined in laboratory tests to be in the range 870to 890°C which is 130 to 110°C lower than the hot-face temperature of thelining in the preheated ladle.
In a preheated ladle, with the hot-face temperature of about 1000°C,sufficient self ignition of the EXOSLAG occurs in about 5 minutes topermit tapping of the steel onto the desired molten calcium aluminateslag. The self ignited material is only partly molten because of the pres-ence of excess lime, which is fluxed subsequently with the alumina gener-ated in the deoxidation of steel with AI.
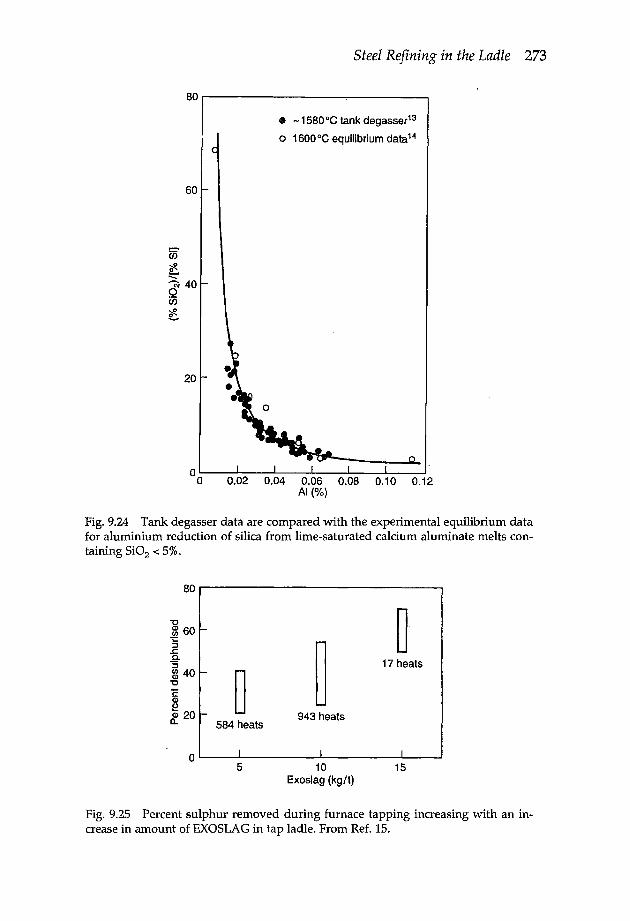
Steel Refining in the Ladle 273
80.-------------------~--------~
• -1580°C tank degasser13
o 1600°Cequilibrium data14
60
20
0.02 0.04 0.06 0.08 0.10 0.12AI (%)
Fig.9.24 Tank degasser data are compared with the experimental equilibrium datafor aluminium reduction of silica from lime-saturated calcium aluminate melts con-taining Si02 < 5%.
80
"m 60 f-
"§
~
.c0.."S~ 40 f-
~"EQ)
~~ 20 to-584 heats
943 heats
0) I
5 10Exoslag (kg/t)
~.
17 heats
I
15
Fig.9.25 Percent sulphur removed during furnace tapping increasing with an in-crease in amount of EXOSLAGin tap ladle. From Ref. 15.

274 Fundamentals of Steelmaking
The extent of desulphurisation achieved with the EXOSLAGpractice for200-tonne EAF, BOF and Q-BOP heats in USS are shown in Fig. 9.25 fortap steel compositions in the range 0.04 to 0.4% C and 0.006 to 0.045% 5,with the amount of furnace slag carry over < 1500 kg.
There is also the temperature benefit realised in the EXOSLAGpractice.As indicated by the plant data in Fig. 9.26 the tap temperature can belowered by about 24°C with the EXOSLAGpractice. In this practice thereis 20 to 30 ppm N pickup by the steel.
1700 ...-----------------.• Exoslag
o Lime + aluminate
6'~ 1660e
:::::1
~Q)0-E~~ 1620«S..J
1580 '--~---L-L..------J_----I1620 1660 1700
Tap temperature (OC)1740
Fig.9.26 Decrease in steel temperature from furnace to ladle. From Ref. 15.
It should be emphasized that the EXOSLAGmixture put on the bot-tom of the preheated ladle must be dry to prevent violent eruptionwhen the liquid steel is poured upon it. Also, as soon as the exothermicreaction has completed forming molten calcium aluminate, with excesslime floating on top, the steel must be tapped right away. Molten slagformed on the bottom of the ladle should not be allowed to solidifybefore the start of furnace tapping. Pouring liquid steel onto a mass ofsolid slag at the bottom of the ladle can have hazardous consequences,caused by subsequent floatation of the mass of slag to the melt surfacein the ladle.
9.8.2 RATE OF DESULPHURISATION
The relation between the argon flow rate and the density of power ofstirring by injection about three metres below the melt surface is shown inFig. 9.27, calculated using equation (9.4). As pointed out earlier, the slag-metal mixing is achieved at high gas flow rates corresponding to E > 80
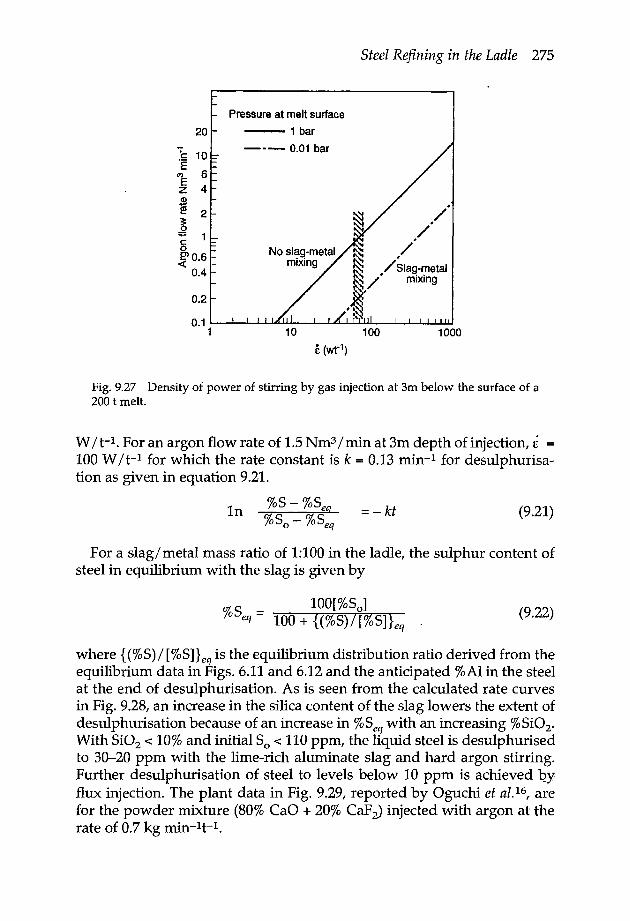
Steel Refining in the Ladle 275
Pressure at melt surface
20 -1bar
C: 10 --- 0.01 bar°e
C') 6E 4z<De 2
~c:0~0.6
0.4
0.2
0.11 10 100 1000
£ (wr1)
Fig. 9.27 Density of power of stirring by gas injection at 3m below the surface of a200 t melt.
W/t-I. For an argon flow rate of 1.5 Nmv/rnin at 3m depth of injection, E100 W/t-I for which the rate constant is k = 0.13 mirr+ for desulphurisa-tion as given in equation 9.21.
In %5- %5eq%50 - %5eq
= -kt (9.21)
For a slag/metal mass ratio of 1:100 in the ladle, the sulphur content ofsteel in equilibrium with the slag is given by
_ 100[%50]
%Seq - 100 + {(%S)/[%S]}eq (9.22)
where {(% 5) / [%51}eq is the equilibrium distribution ratio derived from theequilibrium data in Figs. 6.11 and 6.12 and the anticipated %AI in the steelat the end of desulphurisation. As is seen from the calculated rate curvesin Fig. 9.28, an increase in the silica content of the slag lowers the extent ofdesulphurisation because of an increase in %Seq with an increasing %SiOz.With Si02 < 10% and initial So < 110 ppm, the liquid steel is desulphurisedto 30-20 ppm with the lime-rich aluminate slag and hard argon stirring.Further desulphurisation of steel to levels below 10 ppm is achieved byflux injection. The plant data in Fig. 9.29, reported by Oguchi et al.16, arefor the powder mixture (80% CaO + 20% CaF2) injected with argon at therate of 0.7 kg min-It-I.

276 Fundamentals of Steelmaking
100r----------------------------------
E~ 0a o~------~------~--------~------~'-:Ja100~---------------------------------'sC/)
80
60
40
20
80
60
40
20
15
105
Si02 (%)
20
15
"10
5
o
o ~------~------~--------~------~o 164 8 12Argon injection time (min)
Fig. 9.28 Calculated rate curves for desulphurisation at 1600°C of a 200 t steelcontaining 0.03% Al with 2 t ladle slag and argon stirring at 1.5 Nm-mirr-t (= ~ 100Wt-l).
e With Ar-bubblingo Without Ar-bubbling
Ar gas + fluxt
5
o 2 468Time (min)
10 12
"Fig. 9.29 . Desulphurisation of liquid steel to very low levels with injection of (80%CaO + 20% CaFz). From Ref. 16.

9.9 VACUUM DEGASSING
Steel Refining in the Ladle 277
Since the 1950s many advances have been made in plant equipment forvacuum degassing of steel and in the technology of steel refining in vac-uum degassing facilities. Only brief comments are made here on differenttypes of degassers.
9.9.1VACUUM DEGASSER WITH ARC REHEATING
There are various types of ladle furnaces attached to a vacuum system;only two are briefly mentioned here. In the Finkl-Mohr system, the elec-trodes for arc reheating are inserted through the top of the vacuum tankcover and the melt is stirred with gas bubbling through a porous plug. TheASEA-SKF system consists of a ladle furnace, a mobile induction coilstand (for induction stirring of the melt), a vacuum cover with an exhaustduct and a cover fitted with three carbon electrodes.
9.9.2VACUUM LADLE DEGASSING
Steel is treated in a tank degasser without arc reheating as shown sche-matically in Fig. 9.30 for two different melt stirring systems. In one case,the liquid steel is inductively stirred during degassing and alloying addi-tions. In the other case, the melt is stirred with argon bubbling through aporous plug on the ladle bottom. As discussed earlier, extensive steeldesulphurisation can be achieved in the tank degasser in addition to hy-drogen and some nitrogen removal.
Alloy additions
Vacuumjets
Vacuumchamber
Stainless steelladle
(nonmagnetic)
Alloyadditionhopper
Ladle
+-Argoninlet
Slide gatevalve
Porous plug
Fig.9.30 Two types of tank degasser: (a) induction coil stirring, (b) porous plug forargon bubbling.

278 Fundamentals of Steelmaking
9.9.3 RECIRCULATION DEGASSING
In recirculation degassing, the liquid steel in a ladle is forced by at-mospheric pressure into an evacuated chamber where it is exposed to lowpressure and returned back into the ladle. The steel is recirc-ulated throughthe low pressure chamber 40 to 50 times to achieve the desired level ofdegassing. There are three types of degassers.
(a) DH (Dortmand-Hoerder) degasser with one snorkel and ladle mov-ing up and down to force the liquid metal in and out of the vacuumchamber.
(b) RH (Ruhrstahl-Heraeus) degasser with two snorkels and stationaryladle (Fig. 9.31a). Argon is injected into one snorkel to force liquid steelinto the vacuum chamber; steel flows back into the ladle through the othersnorkel.
(a)
Ladle
Alloy(b)
additionhoppers
Upper barreland domesection
Lower barrelsection
'Pants'section
SlagLadle
Alloyadditionhoppers
Upper barreland domesection
Lower barrelsection
'Pants'section
Slag
Fig.9.31 General outline of (a) RH and (b) RH-OB vacuum degassers.
(c) In the RH-OB degasser, developed by Nippon Steel Corp., there isoxygen injection into the pool of liquid steel in the vacuum chamber (Fig.9.31b). With this degasser it is possible to (i) reheat the steel by oxidisingaluminium added to the melt and (ii) enhance steel decarburisation.
In the RH and RH-OB, the rate of steel circulation between the ladle andvacuum chamber is determined by the snorkel diameter and rate of argoninjection into the snorkel as shown in Fig. 9.32a.The extent of temperatureloss during vacuum degassing becomes greater with a decreasing steelcapacity of the unit (Fig. 9.32b).Similar heat losses from the melt will occurin the tank degasser. In the use of these processes, heats to be degassed aretapped at a higher temperature depending on the heat size.

SteelRefining in the Ladle 279
160
'2'eQ) 120cc:g
~c: 80o~'3~'0 40(j)Q)
U5
o------~----~----~----~o 1 234Rate of argon injection (Nm3 min-1)
U)
~ 30e.a~ 20Q.
E~ 10
10 20 30Treatment time (min)
Fig. 9.32 RH and RH-OB plant data for (a) steel circulation rate, (b) temperatureloss during treatment time.
9.9.4 CARBON DEOXIDATION
One of the applications of RH or RH-OB treatment of steel is to lower thelevel of oxygen content of steel by carbon deoxidation before addingaluminium for complete deoxidation. For the light vacuum treatment,BOF steel is tapped at about 0.08 to 0.10% C when the oxygen content is400 to 300ppm. During degassing, the steel is decarburised down to 0.04%C and deoxidised to about 200 ppm 0 which is four times less than theoxygen content of BOF steel with 0.04% C at turndown for tap. With thiscarbon-deoxidation practice there is a considerable cost saving in alumin-ium usage for deoxidation.
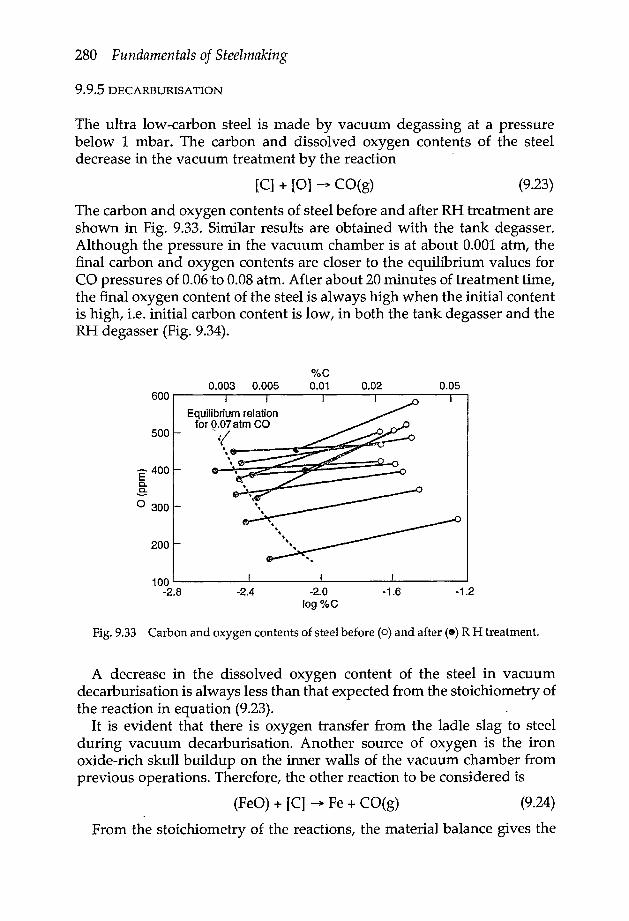
280 Fundamentals of Steelmaking
9.9.5DECARBURISATION
The ultra low-carbon steel is made by vacuum degassing at a pressurebelow 1 mbar. The carbon and dissolved oxygen contents of the steeldecrease in the vacuum treatment by the reaction -
[C] + [0] ~ CO(g) (9.23)
The carbon and oxygen contents of steel before and after RH treatment areshown in Fig. 9.33. Similar results are obtained with the tank degasser.Although the pressure in the vacuum chamber is at about 0.001 atm, thefinal carbon and oxygen contents are closer to the equilibrium values forCO pressures of 0.06to 0.08 atm. After about 20minutes of treatment time,the final oxygen content of the steel is always high when the initial contentis high, i.e. initial carbon content is low, in both the tank degasser and theRH degasser (Fig. 9.34).
%C0.003 0.005 0.01 0.02 0.05
600
500
E400o,
~o 300
200
100-2.8 -2.4 -2.0 -1.6 -1.2
log %C
Fig. 9.33 Carbon and oxygen contents of steel before (0) and after (0) R H treatment.
A decrease in the dissolved oxygen content of the steel in vacuumdecarburisation is always less than that expected from the stoichiometry ofthe reaction in equation (9.23).
It is evident that there is oxygen transfer from the ladle slag to steelduring vacuum decarburisation. Another source of oxygen is the ironoxide-rich skull buildup on the inner walls of the vacuum chamber fromprevious operations. Therefore, the other reaction to be considered is
(FeO) + [C] ~ Fe + CO(g) (9.24)
From the stoichiometry of the reactions, the material balance gives the

Steel Refining in the Ladle 281
600~--------------------------~• Tank degasser 180t~ Tank degasser 180to RH degasser 250t 00
A 0
500 '-
15' 400 - 0(1)' 1l..>(5 1l..°
Af/)f/)
~ 300 -- A6 A A 0A-E 1l..0 A8: 200 - &
A-
Ae0 •100 - .,
•• • •0 I I I I I
200 300 400 500 600 700 800ppm OJ(dissolved)
Fig.9.34 Oxygen contents of steel before and after vacuum decarburisation. Points• /). o, Ref. 13 17 18.
following relation for the amount of oxygen transferred to the steel fromthe ladle slag and oxidised skull in the vacuum chamber,
~O (slag) = 16A2[AC] - [AO] (9.25)
where [~C] = [%C]i - [%C]![~O] = [ppm O], - [ppm O]!
The values of ~O (slag) derived from the plant data using the aboverelation for vacuum decarburisation are shown in Fig. 9.35.The higher theinitial carbon content, the greater the amount of oxygen transfer from slagto metal for decarburisation. When the initial carbon content is below 200ppm, there is no more oxygen pickup from the slag; the oxygen andcarbon contents decrease during degassing in accord with the stoichiome-try of the reaction [C]+[O] --+ CO.
9.9.6 RATE OF DECARBURISATION
The rate of decarburisation is formulated as
%Cf - -- k t%Ci - CIn (9.26}
where the rate constant kc for RH degassing is given by the followingrelation.l?

282 Fundamentals oj Steelmaking
o<] 200ECoCo
100
400
~300:§.
o
200 300 400pprn O,
500
Fig. 9.35 Oxygen pickup from ladle slag during decarburisation in (1\) tank de-gasser and (0) R H degasser.
kc= (~)( Q~q) (9.27)
where Q = circulation volume rate of molten steel, m3 min-IV = volume of the steel in the ladleq = volumetric mass-transfer coefficient of decarburisation m-'
min-I.
For the 600 mm snorkel inside diameter and the argon injection rate of 2Nm-mirr-' the rate constant kc = 0.12 min-I. Kouroki et a1.20 and manyother investigators have reported that the rate constant for RH decar-burisation is not affected by the initial dissolved oxygen content of thesteel. However, in most of the publications, no reference is made to theiron oxide content of the ladle slag. The rate constant kc appearing to beindependent of the oxygen content of the steel may well be due to the useof a ladle slag that is high in iron oxide content. In fact, Ohma et al.2I havefound from the RH trial heats that the rate of decarburisation increaseswith an increasing iron oxide activity in the ladle slag. For example, kc is0.1 min-I at aPeD = 0.1 and increases to 0.2 min-I at aFeD = 0.4. Thesefindings support the view that with slag particles carried into the vacuumchamber, reaction (9.24) does participate in the vacuum decarburisationprocess.
The rate constant for decarburisation in the tank degasserl7,22 is about0.07 min-I at the argon flow rate of 0.4 Nm3min-1 and increases to about0.09mirr ! at 1.8Nm3min-1 for 180 to 200 t heats.
For the average rate constants kc = 0.12min-1 for RH degasser and 0.08min-I for tank degasser, the extent of decarburisation in 20 minutes timeof degassing would be as shown below.

Steel Refining in the Ladle 283
Initial %C0.080.060.040.02
RH degasser0.00720.00540.00360.0018
Final %CTank degasser
0.0160.0120.0080.004
9.9.7 DEHYDROGENATION
To prevent the formation of hydrogen-induced hairline cracks or flaking inthe bloom casting and thick slabs, the liquid steel is vacuum treated to lowerthe hydrogen content to 2 ppm or less. For the initial (Hi) and final (HI)hydrogen contents, the rate equation for vacuum degassing is of the form
In (9.28)
The rate of dehydrogenation of 220 t ,heats at USS Gary-RH was evalu-ated by measuring the hydrogen content of the steel with the HYDRISsystem during degassing.P The results obtained from the three heats (me-dium carbon, Al-killed steels) are shown in Fig. 9.36 for the 600 mmdiameter snorkel and the steel circulation rate of about 140 t/min-1 at USSGary-RH; the rate constant k = 0.13 min-1 obtained from these tests is inclose agreement with the values given in publications on RH degassing
J:EC-o.of:
2
o~~--~~--~~--~~o 2 4 6 8 10 12 14RH degassing time (min)
Fig. 9.36 Rate of dehydrogenation in RH degassing as measured by the HYDRISsystem at U.S. Steel Gary Works. From Ref. 23.

284 Fundamentals of Steelmaking
from various steel plants. To achieve 2 ppm H in the steel, the RH degass-ing time is 7 min for Hi = 5 ppm and 12.4 min for Hi = 10 ppm.,/-Bannenberg et al.13 derived a rate equation for dehydrogenation of 180 tsteel in the tank degasser, as a function of tank gas pressure (1 to 100mbar) and argon bubbling rate. The rate equation is for th-emass transferof hydrogen to rising argon bubbles in the melt as represented by equation(9.28). A close agreement was observed between the calculated and mea-sured hydrogen contents after degassing times of 5 to 25 min; the HYDRISsystem being used for the measurements. At 1 mbar tank pressure, kH =0.09 min-I for the argon bubbling rate of 0.9 Nmtmirr+, increasing to 0.16min-1 at the flow rate of 1.8 Nm-mirr-': the latter is similar to kH in RHdegassing with 1.5 to·2.0 Nm3min-1 argon injection into the 600 mm diam-eter snorkel.
9.9.8 DENITROGENATION
Some nitrogen removal from liquid steel during vacuum degassing ispossible, only if the steel is fully deoxidised and contains low concentra-tions of sulphur.
The rate equation derived by Bannenberg et al.13 for denitrogenation ofsteel in the tank degasser is based on a mixed-control model; (i) liquid-phase mass transfer to argon bubbles and (ii) gas-metal interfacial reac-tion. The calculated data given in Fig. 9.37 for Al-killed steels, showing theeffect of sulphur over the range 10 to 200 ppm 5, were substantiated by themeasured nitrogen contents.t=
80~------------------------------------------------~70
Stirring rate 1.8 (Nm3/min)Pressure 1 (mbar)o content 2 (ppm)
E~40z
30
60
20
-----:::.....~200~---..--~ 100
40----10
10
o~----~----~------~----~------~----~o 5 10 15 20 25Treatment time in tank degasser (min)
30
Fig. 9.37 .Calculated sulphur effect on denitrogenation in tank degasser with argonstirring rate of 1.8 Nm3min-1. From Ref. 13.

Steel Refining in the Ladle 285
The rate of denitrogenation represented by equation (2.23) is-re-writtenhere in a simplified form
1 1ppm No = kN (1 - 8) tppmN
where kN is the limiting apparent rate constant for 0 and S contents ~zero. The calculated rate equation of Bannenberg et al. giving the results inFig. 9.37 together with equation (2.21)for (1 - 8) give for the apparent rateconstant kN = 0.0013 (ppm N min):'! for 180 t heats at 1 mbar tank pressureand argon bubbling at the rate of 1.8 Nm3min-l. For much lower argonbubbling rates of 0.3 to 0.4 Nm=mirr-t, the value of kN will be much lower,e.g. probably in the range (4 to 5) x 104 (ppm N min)-I.
9.10 CALCIUM TREATMENT
Most grades of steel are treated with calcium using either a Ca-Si alloy ora Ca-Fe(Ni) mixture, depending on the silicon specification. This treat-ment is made after trim additions and argon rinsing. In most melt shops,the cored-wire injection system is used in the calcium treatment of steel.
The melting and boiling points of calcium are 839°C and 1500°C respec-tively. The cored-wire containing Ca-Si or Ca-Fe(Ni) is injected into themelt at a certain rate such that the steel casing and contents of the cored-wire melt deep in the steel bath, e.g. 1.5 to 2.0 m below the melt surfacewithout hitting the bottom of the ladle or resurfacing without being com-pletely melted. In 200 to 240 tonne heats the cored-wire of 16 x 7 mm crosssection or 13 mm diameter is injected at the rate of about 180 m min-I.
During calcium treatment, the alumina and silica inclusions are con-verted to molten calcium aluminate and silicate which are globular inshape because of the surface tension effect. This change in inclusion com-position and shape is known as the inclusion morphology control. This isdemonstrated schematically in Fig. 9.38.
The calcium aluminate inclusions retained in liquid steel suppress theformation of MnS stringers during solidification of steel. This change inthe composition and mode of the precipitation of sulphide inclusion dur-ing solidification of steel is known as sulphide morphology or sulphideshape control.
9.10.1 OBJECTIVE'S OF INCLUSION MORPHOLOGY CONTOL
Several metallurgical advantages are brought about with the modificationof composition and morphology of oxide and sulphide inclusions by cal-cium treatment of steel, as for instance

286 Fundamentals of Steelmaking
As cast
MnS segregated atgrain boundaries
Rolled
MnS stringer in therolling direction
~~
~
Ca wire treated
CaS ..MnS ring formedaround C12A7
Numerous brokenangular crystals inthe rolling direction
DOFig. 9.38 Schematic illustration of modification of inclusion morphology with cal-cium treatment of steel.
(i) to improve steel castability in continuous casting, i.e. minimisenozzle blockage,
(ii) to minimise inclusion related surface defects in billet, bloom andslab castings,
(iii) to improve steel machinability at high cutting speeds and prolongthe carbide tool life,
(iv) to minimise the susceptibility of steel to re-heat cracking, as in theheat-affected zones (HAZ) of welds,
(v) to prevent lamellar tearing in large restrained welded structures,(vi) to minimise the susceptibility of high-strength low-alloy (HSLA)
linepipe steels to hydrogen - induced cracking (HIe) in sour gas orsour oil environments.
(vii) to increase both axisymmetric tensile ductility and impact energyin the transverse and through-thickness directions in steels withtensile strengths below 1400MPa.
9.10.2REACTION OF CALCIUM IN LIQUID STEEL
When calcium is injected deep into the melt as an alloy of Ca-Si, Ca-Al or aspure Ca admixed with nickel or iron powder, the subsequent reactions inliquid steel will be the same. The following series of reactions are expectedto occur to 'varying extents in Al-killed steels containing alumina inclusions.

Steel Refining in the Ladle 287
Ca (1) ~ Ca(g)Ca(g) ~ [Cal
[Cal + [0] ~ CaO[Cal + [5] ~ CaS
[Cal + (x+lh)AI203 ~ CaO·xAlz03 + 2/3[AI] (9.29)
Depending on the steel composition, the manner of calcium injection andother process variables, there will be variations in the conversion of aluminainclusions to aluminate inclusions; the smaller inclusions will be convertedto molten calcium aluminate more readily than the larger inclusions.
As is seen from the plant data in Fig. 9.39, the deoxidation of steel with alu-minium is shifted to lower levels of residual dissolved oxygen upon subse-quent calcium treatment because of the lower alumina activity in themodified inclusions. It is a generally accepted view that the calcium retainedin liquid steel is primarily in the form of calcium aluminate inclusions, and toa lesser extent as calcium sulphide inclusions dispersed in the melt, or as dis-solved Ca in the steel. The analytical data from various ladle refining shopsare summarised in Fig. 9.40 for Al-killed steels containing 5 < 50 ppm and S >100 ppm. In all cases, the calcium treatment was made by the cored-wireinjection of Cal-Sil at the rates of 0.16 to 0.36 kg Ca/tonne steel, with the 16 x7 mm cross section cored-wire being injected at the rate of about 180 m/ min.
16oEa.0.
IJI>- 12rsi=o«zw<D>-x'0
Equilibrium for dissolvedAI and AI203 activity
a: 1.0 b: 0.064
-o~ ~ ~ ~ ~ ~ ~'0 0.01 0.02 0.03
G/oAI
0.04 0.05 0.06
Fig. 9.39 Oxygen sensor readings before and after Cal-Sil injection into Al-killedsteel at 1600 ± 15°C. From Ref. 24.

288 Fundamentals of Steelmaking80
_<0.005%S/I
@> 0.01 %S /60 /
/I
E /0-0- J
~ 40 I:::> I(3..JI«o /
20 //
///
00 20 40
--------- CA'2
60TOTAL OXYGEN ppm AS AI203
Fig. 9.40 Relation between calcium and total oxygen contents of Al-killed steelsafter Cal-Sil treatment. From Ref. 24.
80 100
The dotted lines for the indicated compositions of calcium aluminates(CAx) are calculated from the stoichiometry of the reaction (9.29)and thephase equilibrium diagram for the system CaO-AI203; the region for mol-ten calcium aluminate is for 1600°C. The shaded areas marked L are forthe steel samples taken a few minutes after Cal-Sil injection, those markedT are for the tundish samples. Because of the floatation of inclusions out ofthe melt, the total calcium and oxygen contents of the steel in the tundishsamples are always lower than those in the ladle soon after the end of Cal-Sil injection. For a given total oxygen content of the steel, initially asalumina inclusions, a greater amount of calcium is retained in the low-Ssteels. In liquid steels containing S < 50 ppm, there is almost completeconversion of alumina inclusions to molten calcium aluminate inclusions.In high-sulphur steels the conversion is partial, resulting in solid alumi-nate, presumably coated with a thin layer of molten aluminate, or solidaluminate with unreacted alumina core. Some calcium sulphide is alsoassociated with these aluminate inclusions.
9.10.3 EFFICIENCY OF CALCIUM USAGE AND RETENTION IN STEEL
The material balance for calcium consumption is given by the followingsummation:

Steel Refining in the Ladle 289
amount injected W = Wso1 + Was + W'as + Ws1 + Wv
where Wso1 = amount dissolved in liquid steelWas = amount retained as aluminate and sulphide inclusionsW'as = amount. reacted with sulphur and alumina and floated
outWs1 = amount reacted with the ladle slagWv = amount burnt at the surface of the melt
The study of plant data on calcium treated steels and the author's the-oretical considerations indicate that
Wso1« Was
With this simplification, the efficiency of calcium usage is approximatedby
E ==uWas + W'as
W (9.30)
The efficiency factor for calcium retention in liquid steel would be
E =r (9.31)
Experience has shown that the efficiency factor for calcium retentiondecreases with an increasing amount of calcium injection beyond a certainamount, depending on the total oxygen content of the steel as oxide inclu-sions. Because of inclusion floatation out of the melt during the timeinterval prior to casting, (Er)T in the tun dish will be lower than (Er)L in theladle soon after calcium treatment. As a rule of thumb, we may take (Er)T:=::Ih(Er)L'
From many trial heats the following values of calcium retention areobtained for Al-killed steels initially containing 50 to 80 ppm 0) as al-umina inclusions.
kg Ca/tonneinjected
0.160.36
(Er)L0.24 to 0.300.12 to 0.18
(Er)T0.12 to 0.150.06 to 0.09
If the steel is to be degassed for hydrogen removal, the calcium treat-ment should be made after vacuum degassing.
9.10.4 SULPHIDE MORPHOLOGY (SHAPE) CONTROL
In steels not treated with calcium, the sulphur precipitates as minute parti-cles of MnS in the last interdendritic liquid to freeze, which delineate the

290 Fundamentals of Steelmaking
prior austenite grain boundaries in the as cast structure. During hot roll-ing, the MnS particles are deformed forming stringers in the rolled prod-uct. The MnS and A1203 stringers make steel susceptible to, for example (i)re-heat cracking in the heat-affected zones of welds, (ii) lamellar tearing inlarge restrained welded structures and (iii) hydrogen-induced cracking insour gas or oil environments.
In the calcium treated low-sulphur steels, the grain boundary precipita-tion of MnS is suppressed by the precipitation of sulphur as a Ca(Mn)Scomplex on the calcium aluminate inclusions during solidification of steel,by the following reaction.
(CaO) + 2[5]+ [Mn] + 2f3[AI]~ (CaS·MnS) + lh(A1203) (9.32)
The extent of sulphide-shape control that can be achieved during solid-ification of the calcium treated steel is governed by the total oxygen,sulphur and calcium contents of the steel. From the theoretical consider-ation of reactions occurring in the impurity enriched interdendritic liquidduring solidification, the following criteria are derived for the tundishcompositions of the Al-killed steels, to achieve an acceptable degree ofsulphide-shape control during solidification.
As aluminateinclusions
ppm 0 ppmCa25 20-3025 20-3012 15-2012 15-20
%Mn0.4-0.61.3-1.50.4-0.61.3-1.5
ppmS<20< 30< 10< 15
If an acceptable level of sulphide shape control is not achieved, theHSLA steels for linepipes and off shore installations will be susceptible tohydrogen-induced cracking (HIe) in sour gas (containing H2S) and souroil environments. The general concensus that emerged from many experi-mental studies is that a high resistance to HIe in HSLA steels can beassured, by lowering the sulphur and oxygen (Al203 inclusions) contentsof the steel and by treating steel with calcium to prevent the formation ofMnS during solidification.
9.11 INCLUSION CONTROL IN BEARING STEELS
The deleterious effects of oxide inclusions on the fatigue resistance ofbearing steels are now well understood through many years of experimen-tal and theoretical studies. This subject was well documented in a series ofpapers by Brooksbank and Andrews.s" The fatigue failure is a conse-quence. of the structural tessellated stresses in and around the inclusions.

Steel Refining in the Ladle 291
As originally conceived by Laszlo.w the tessellated stresses -are of thegeneral form
(9.33)
where cI> is a variable function depending on (i) the elastic moduli of theinclusions and the steel matrix, (ii) the inclusion size, shape, and distribu-tion, and (iii) the position and direction of the individual stress con-sidered. The sign depends on the type of stress, e.g., positive forcircumferential and negative for radial. Laszlo termed (am - ai)8.T theIstrain potential of structural tessellation,' where am is the mean linearcoefficient of thermal expansion of the matrix, ui is the mean linear coeffi-cient of the inclusion, and 8.T is the temperature change in the system.
Upon cooling, if the contraction of inclusion is less than that of the steelmatrix, i.e., ai < am' stresses will develop in and around the inclusionsleading to crack initiation, hence the deterioration of the fatigue life. Inclu-sions having a, > am are not detrimental to fatigue properties becauseadverse stresses will not develop. Brooksbank and Andrews have shownthat the variations in fatigue life with the type of inclusion in the steel are ingeneral accord with those predicted from the term (urn - ai)!lT, as shown inFig. 9.41 for oil-quenched 1 percent C-Cr steels. The most detrimental inclu-sions to fatigue life are: calcium aluminates, alumina, spinels, silicates andnitrides in this descending order. In the case of sulphide inclusions, thecoefficient of contraction «, is greater than that of the steel, consequentlythey are non-detrimental to fatigue life; MnS inclusions are the most in-nocuous to fatigue life. It is also known that encapsulating alumina inclu-sions with a layer of MnS, occurring during solidification of the steel,reduces the detrimental effect of alumina. According to the theoretical anal-ysis of Brooksbank and Andrews, the mass ratio °/S in the steel should notexceed 0.4 to eliminate stresses around Al203 by the encapsulating MnS.This theoretical prediction has been substantiated by many fatigue tests onbearing steels, as cited in references (27) and (28). To attain adequate encap-sulation of alumina inclusions by MnS, the sulphur content of many bearingsteels is maintained on the high side, e.g. 0.015 to 0.025 percent s.
Although the encapsulation of calcium aluminate particles by Ca(Mn)Swill soften their detrimental effect on fatigue life, it is not as effective asencapsulation of A1203 particles by MnS. Therefore, care is taken in theladle refining of bearing steels to prevent the entrainment of calcium-bearing ladle slag in the steel.
In the past, the vacuum-carbon deoxidation (VCD) was mandatory forthe ladle refining of bearing steels. However, with the much improvedladle refining facilities we have today and with careful implementation ofthe Iclean-steel practice' in aluminium deoxidation of steel (without th~initial VCD), it now is possible to lower the concentration of Al203inclusions in the steel below 15 ppm. At this low level of Al203 content,

292 Fundamentals of Steelmaking
COEFFICIENT OF THERMAL EXPANSION.&<-1o 5
calcUTl auninattls -C::C2DA=Al203
~- ----- - - - - _. ~...-- __ a....-..__ ~ __ ~~~----- afumina --
:;:;- - - _ ns't-
nitrid(zs .9- -- - - - - - - - - - - (ij
silicatCls Ca) ic-cso .~A: AL2D3 ~M.MnO -s51:5i02
~~~~~~"""'l"""r'~~"""l""""~~~~~~-~--~~~ ~~-~~- iIFflO and MnO :5 ~~~~~-+~~~~~~~~~~--~ ~~
I.D
~:P4 ~.~~------------~~~--~~~~--~----~---~------&~~IIMCaS - -\.OIt"~~¥MnS
POTENTIAl.(matrix)t \()DF~MINGT POTENTIAL
I _ STRESS-RAISING
Fig. 9.41 Stress-raising and void forming properties of inclusions in 1% C-Cr bear-ing steels. From Ref. 25.
coupled with encapsulation by MnS, the bearing steel will have the de-sired resistance to fatigue failure.
9.12 OTHER REFERENCES ON INCLUSIONS IN STEEL
It is outside the scope of this book to make a comprehensive presentationon the subject of inclusions in steel. For indepth background information

Steel Refining in the Ladle 293
on all metallurgical aspects of inclusions in steel, reference ·should bemade to a series of books authored by Kiessling under the heading Non-metallic inclusions in steel Parts I-IV over a period 1964-1976, which weresubsequently compiled as a single book-? by The Metals Society; Part V ofthis series by Kiessling was published in 1989. References may also bemade to a series of papers published in various conference proceedings onthe subject of inclusions in stee13O--32•
The physicochemical aspects of inclusions in steel have been studied indetail experimentally and theoretically by the research personnel in IRSIDsince the early 1980s. Their assessment of morphology modification ofinclusions by the calcium treatment of steel is based on their experimen-tally determined solubility products of CaO and CaS in liquid stee1.33 Asdiscussed in section 4.4 of Chapter 4, these measured solubility productsare several orders of magnitude greater than those derived from the ther-mochemical data. However, not being deterred by this dilemma, due ac-knowledged consideration is given here to the consensus of Gaye et al.34
on the state of CaS-calcium aluminate equilibrium in liquid steel as rep-resented by the equilibrium diagram for 1600°C in Fig. 9.42. For dilutesolution in liquid steel, the activities of dissolved Ca, S and Al areequivalent to their mass concentrations in percent as given in thisdiagram.
KCaS 1.7 x 10⁻⁵Caliq
10-4
CaliqKCaO 9 x 10⁻⁷
10-5 L....-..__ -'-- L--- ---I10-1 10-2 10-3 10-3
Mass % [8]10-2 10-1Mass % [ AI]
Fig. 9.42 Computed equilibrium diagram for Fe-AI-Ca-O-S system at 1600°C;(- - -) curves for aluminate inclusions containing 5% Si02• From Ref. 34.

294 Fundamentals of Steelmaking
On the basis of these equilibrium data, Gaye et al.34 developed a com-puter programme to evaluate, from a global analysis of a steel sample, thecomposition and amounts of inclusions which are formed in liquid steel atthe treatment temperature and during the subsequent cooling until theonset of solidification. The computed data in Fig. 9.43 show the precipita-tion path of inclusions formed during the calcium treatment and subse-quent cooling of the liquid steel containing 0.02% S.The left hand diagramin Fig 9.43 represents the distribution among liquid steel, oxide and sul-phide inclusions of the remaining total calcium analysed in the cast prod-uct. In the case considered with the steel containing 0.02% 5, the CaSprecipitates only during cooling. The right hand diagram depicts the CaOand Alz03 contents of the inclusions formed during calcium treatment andcooling of the steel (solid-line curves) as well as the average contents in theinclusion population (dotted curves). The computed average compositionof these oxide inclusions is 51.6% CaO, 38.8%Al2031 9.5% Si02 and 0.1 %MnO. Additional computed and analytical data are presented in anotherpaper by Gaye et al.35 on the control of inclusion composition by slagtreatment of steel and inclusion transformations during cooling of thesolidified steel.
1600 1560 1520Temperature (OC)
52
~ 50o·00:::J~ 48.s046<f Ca-treatment~~ 44cco
~ 42oeft.~ 40co~
38
1600 1560 1520Temperature (OC)
Fig. 9.43 Computed precipitation path of inclusions in Ca-treated medium carbonsteel: 0.38% C, 0.75% Mn, 0.25% Si, 0.015% AI, 35 ppm Ca and 30 ppm O. From Ref.34.

Steel Refining in the Ladle 295
REFERENCES
1. D.M. SCHRADERand L.L. RANKOVIC, Iron and Steelmaker, 1988, 15(6), 23.2. C.E. TOMAZIN, E.A. UPTON and R.A. WALLIS, Steelmaking Conf Proc., 1986, 69,
223.3. The Making, Shaping and Treating of Steel, U.S. Steel, Published by Association
of Iron and Steel Engineers 1985.4. B. GRABNERand H. HOEFFGEN, Radex Rundschau, 1985, 3, 581.5. P.E. ANAGBO and J.K. BRIMACOMBE,Iron & Sieelmaker, 1988, 15(10), 38; 15(11),
41.6. W. PLUSCHKELL,Stahl und Eisen, 1981, 101,97.7.. D. MAZUMDAR and R.I.L. GUTHRIE,Metall. Transaction B, 1986, 17B, 725.8. J. ISHIDA, K. YAMAGUCHI, S. SUGIURA, K. YAMANO, S. HAYAKAWA and N.
DEMUKAI, Denki-Seiko, 1981, 52, 2.8a. A.W. HUTNIK and J.B. HEMPHILL, National Open Hearth & Basic Oxygen Conf
Proc. 1974, 57, 358.8b. R.J. HAWKINS, ibid, 1976, 59, 479.8c. J.H. MIKULECKY,ibid, 1977, 60, 338.9. T. CHOH, K. IWATA and M. INOUYE, Trans. Iron and Steel Inst. Japan, 1983, 23,
598.10. E.T. TURKDOGAN, Ironmaking and Steelmaking, 1988, 15, 311.11. M.R. RILEYand L.G. NUSSELT,Proc. 5th Inter. Iron and Steel Cong., 1986, 6, 177.12. A. THOMAS, F. VILLETTEand J. PITON, Iron and Steel Engineer, 1986, Feb., 45.13. N. BANNENBERG,B. BERGMANNand H. GAYE, Steel Research, 1992, 63(10), 431.13a. N. BANNENBERGand B. BERGMANN, Stahl u. Eisen, 1992, 112(2), 57.14. B. OZTURK and E.T. TURKDOGAN,Metal Science, 1984, 18, 306.15. S. GILBERT,G.G. MONOS and E.T. TURKDOGAN, Steelmaking Conference Pro-
ceedings, 1988, 71, 291.16. Y. oGUCHI, T. FUJII, H. KAMAMURA, F. SUDO, A. NANBA and M. ONISHI,
Tetsu-to-Hagane, 1983, 69, A.37.17. D. NOLLE, U. EULENBURG, A. JAHNS and H. MISKA, Inter. Conf. Secondary
Metallurgy, ICS, 1987, p. 269.18. U.S. Steel Technical Center, private communication.19. N. SUMITAet al., Kawasaki Steel Gihou, 1983, 15, 15~.20. S. KOUROKI, T. OBANA, Y. SHIROTA and M. TANAKA, Scaninject V, 1989, p.
642.21. H. OHMA, H. NAKATA, K. Mom and T. YAJIMA, Steelmaking Con!. Proc., 1986,
69, 327.22. N. BANNENBERG,PH. CHAPELLIERand M. NADIF, Stahl u. Eisen, 1993, 113(9),
75.23. R.P. STONE,J. PLESSERSand E.T. TURKDOGAN,Stahl u. Eisen, 1990, 110(11), 65:
Electric Furnace Con!. Proc., 1990, 48, 83.24. E.T. TURKDOGAN1 in Calcium Treatment Symposium, p. 3. The Institute of
Metals (now The Institute of Materials), London, 1988.25. D. Brooksbank and K.W. ANDREWS,]. Iron Steel Inst., 1969, 207,474; 19701208,
582; 1972, 210, 246 and 765.26. F. LASZLO,J. Iron Steel Inst., 1943, 147, 173; 1945, 152, 207.

296 Fundamentals of Steelmaking
27. R. TRICOT, in Production and Application of Clean Steels, Pub. No. 134, The Ironand Steel Institute, London, 1972, 199.E. EMEKES, in Production and Application of Clean Steels, Pub. No. 134, The Ironand Steel Institute, London, 1972, 215.
29. R. KIESSLING, Non-metallic inclusions in steel, Parts I-IV, The Metals Society,London, 1978; Part V, The Institute of Metals (now The Institute of Mater-ials), London, 1989.
30. Inclusions, F.B. Pickering, ed., Institution of Metallurgists, London (now TheInstitute of Materials), Monograph no. 3, 1979.
31. Swedish symposium on non-metallic inclusions in steel, H. Nordberg and R.Sandstrom, eds., Swedish Institute of Metal Research, Stockholm, 1981.
32. Clean Steel 4 Proc., The Institute of Materials, London, 1994.33. M. NADIF and C. GATELLIER, Rev. Metall. CIT, 1986, 83, 377.34. H. GAYE, C. GATELLIER, M. NADIF, P.V. RrnOUD, J. SALEIL and M. FARAL, in
Clean Steel 3, p.137, The Institute of Metals (now The Institute of Materials),London, 1986.
35. H. GAYE, C. GATELLIER and P.V. RrnOUD, in Proc. The Ethem T. TurkdoganSymposium, p.113. The Iron and Steel Society, Inc., Warrendale, PA, USA,1994.
28.-...
CHAPTER 10
Reactions during SteelSolidification
Problems sometimes encountered in the steel castability, hot workability,machinability and shortcomings of the mechanical properties of the pro-duct, are caused by common inpurity elements in the steel such as oxygen,sulphur, nitrogen and hydrogen. These impurities manifest their effects ina variety of ways during solidification of the steel, hot working and ma-chining of the product and in service performance of the product. Theeffects of these impurities on various properties of the steel are accentu-ated by the solidification process involving interdendritic microsegrega-tion. Some special cases discussed in this chapter are typical examples ofthe consequences of microsegregation occurring during solidification ofthe steel; namely (i) the formation of subsurface blowholes, (ii) the modeof formation of oxysulphide inclusions in free-machining steels, (iii) thecritical ratio (Mu/S), to suppress hot shortness of steel, (iv) the sulphideshape modification and (v) the control of nitride precipitation in contin-uous casting.
10.1 SOLUTE ENRICHMENT IN INTERDENDRITIC LIQUID STEEL
For background information on the technical aspects of the morphology ofdendritic solidification of metal alloys, reference may be made to the workof Chalmers.I< Flemings+" and their co-workers. The dendrites and sub-dendritic branches have a platelike morphology; as they grow in the dir-ection of heat flow, subdendritic branches are formed such that liquidbecomes trapped between the interdendritic branches of the solidifyingmetal.
10.1.1 SCHElL EQUATION
Microsegregation resulting from solute rejection during dendritic freezingin binary alloys was formulated by Scheil= for two limiting cases sum-marised below.
A. Complete solute diffusion in the solid (dendrite arms) and inter-dendritic liquid, appropriate for the interstitial solutes C, 0, Nand H.
C CoI = k + (1- k)g (10.1)
297

298 Fundamentals of Steelmaking
where g = volume fraction remaining liquid, in any given volume el-ement of the solidifying mass
Co = initial solute concentration at g = 1C, = solute concentration in the enriched liquidk = solid/liquid equilibrium solute distribution ratio.
B. Negligible diffusion in the solid and complete diffusion in the inter-dendritic liquid, appropriate for substitutional elements, Mn, Si, Nb, P ...
C, = C~k-l (10.2)
The solute distribution ratios in dilute solutions of X in selected systemsFe-X are listed below.
Solute XAlCHMnNNboPSiSTi
k = [%X]&/[%Xh0.600.200.270.740.270.27-00.080.600.040.60
An example is shown in Fig. 10.1of solute enrichment in the interdendriticliquid for steel containing Mn, Si, C and O. It should be remembered thatthe term 'percent local solidification' refers to the progress of solidificationin any given volume element of the solidifying casting.
10.1.2 REACTIONS IN THE INTERDENDRITIC LIQUID
When solute concentrations in the interdendritic liquid steel become suffi-ciently high, reactions may occur between the solutes resulting in theformation of oxide, silicate, oxysulphide inclusions, and in some cases, gasbubbles. When interdendritic reactions occur, the solute enrichment iscomputed by incorporating the Schell equation with equations for reactionequilibria, on the assumption that no supersaturation is needed for theformation of the reaction products. Methods of computations are given inthe author's previous publications. 6-8
An example of the calculations is given in Fig. 10.2 showing the con-centration of dissolved oxygen in the interdendritic liquid steel controlledby the local deoxidation reaction for steel containing 0.50%Mn, 0.004%0and zero to' 0.030% Si. If there were no deoxidation reaction occurring at

2.4
2.0
o1.6 (fl. 0.06
c CiS:2 (fl.
'* 61.2 '* 0.04
0.8
0.4
Reactions during Steel Solidification 299
Local solidification percent
Fig.10.1 Interdendritic solute enrichment, if no reaction occurs between them dur-ing solidification of the steel.
90% local solidification, the concentration of dissolved oxygen would havebeen enriched to 0.04% O. In steel containing as little as 0.01% Si, the Si/Mn deoxidation in the inter dendritic liquid suppresses oxygen enrich-ment. The equilibrium oxygen contents of the interdendritic liquid steelare shown in Fig. 10.3 for the C-O reaction at 1 atm CO at various stages ofsolidification for several initial carbon concentrations. From the com-parison of the oxygen concentration curves in Figs ..10.2 and 10.3, we seethat for steel containing 0.5% Mn, 0.03% Si and 0.004% 0 (dissolved), theC-O reaction generating CO bubbles will not occur at any stage of thesolidification in steels containing less than 0.08% C and no H or N.
Another important reaction in the impurity enriched interdendritic liq-uid is the precipitation of MnS inclusions. At the liquidus temperatures of1525 to 1500°C, the solid MnS solubility product [%Mn][%S] is 1.07 to 0.92respectively. 11) steel with 1.0% Mn, the product [%Mn][%S] in the inter-dendritic liquid increases during solidification as shown in Fig. 10.4 forsteels containing 0.01 and 0.03% S. For an average liquidus temperature of1510°C and under equilibrium conditions, the MnS precipitation beginswhen the concentration product [%Mn][%S] reaches the equilibrium sol-ubility product of about 1.0.

300 Fundamentals of Steelmaking
~ 0.02
~c:CD
~o 0.01
o~----~----~------~----~----~50 60 70 80
Solidification (%)90 100
Fig. 10.2 Oxygen content of enriched liquid controlled by Si-Mn deoxidation dur-ing solidification. From Ref. 6.
'0' 0.02~ic:CD
~Xo 0.01
(% C)o0.0200.0220.0240.0260.0280.0300.0350.0400.0508:8980.0800.100
o~----~------~----~--------~----~50 60 70 80
Solidification (0/0)90 100
Fig.10.3 Equilibrium oxygen content of steel, for carbon-oxygen reaction at 1 atm. COat various stages of solidification for several initial carbon concentrations. From Ref. 6.
The interdendritic precipitation of MnS in the later stages of local solid-ification is in evidence, as shown in Fig. 10.5, from the photomicrogaph ofthe etched section of an Al-killed steel casting containing 1.5% Mn, 0.25% Cand 0.05% S. In this as-cast structure, the circular or oblong shaped whiteregions are the cross sections of the dendrite arms; the darker regionscorrespond to the higher manganese contents, hence the pearlitic structureupon the austenite to ferrite phase transformation on cooling. The MnSinclusions are lined up along the middle of the interdendritic region.

Reactions during Steel Solidification 301
1.2 ...---------------------."'C
'5so~ 1.0
"'C
Cco"'C
Cii~ 0.8.S:'0:J-g 0.6C.Ci5'~:=: 0.4c:E
Onset of MnS precipitation
___ /.~:510:~~ _
0.2 --~----'--------'--------I84 88 92
Local solidification (%)96
Fig. 10.4 Estimation of the onset of MnS precipitation in the impurity enrichedinterdendritic liquid steel initially containing 1.0% Mn and 0.01 or 0.03% S.
X 500
Fig. 10.5 Manganese sulphide inclusions in the interdentritic regions in the as-castconditions (0.25% C, 1.5% Mn and 0.05% S). From Ref. 7.

302 Fundamentals of Steelmaking
10.1.3LIQUIDUS TEMPERATURE AND SOLUTE ACTIVITY COEFFICIENTS IN THEINTERDENDRITIC LIQUID
As the interdendritic liquid steel becomes enriched with alloying el-ements, the liquidus temperature decreases with the progress of localsolidification. Because the equilibrium constants of reactions are tempera-ture dependent, in calculating the state of reactions in the enriched inter-dendritic liquid, due account should be taken of the liquidus temperatureof the steel using the formulation given in section 4.3.2b. Also due accountshould be taken of the activity coefficients of solutes in the alloy enrichedinterdendritic liquid using the interaction coefficients given in Table 4.2.
As an example, let us consider a steel containing 1.0%Mn, 0.2%Si. 0.5%C, 0.02%Sand 0.01%P. At 90%local solidification, i.e. g = 0.1, the enrichedliquid will contain: 1.82%Mn, 0.63% Si, 1.78% C, 0.182% Sand 0.083%P.For the initial steel composition, the liquidus temperature is about 1492°C;in the enriched liquid at g = 0.1, the liquidus temperature is 1404°C.Changes in the solute activity coefficients from the initial (g = 1) to g = 0.1are as follows.
Solidificationstage, g
1.00.1
0.920.74
Ie1.191.94
is1.111.58
iN1.151.69
iH1.071.34
1.292.56
10.2 SUBSURFACE BLOWHOLE FORMATION
In continuous casting the subsurface blowholes may form if the concentra-tions of C, 0, Nand H are high. The photograph of a bloom section in Fig.10.6 shows a severe case of subsurface blowholes that occurred in contin-uous casting. During reheating to the hot-rolling temperatures, the oxidis-ing furnace gases penetrate below the surface through the blowholes. Thesubsurface scale thus formed cannot be removed by the scale breaker;consequently during hot rolling, defects are developed on the surface ofthe slab. In the case of rephosphorised and resulphurised steel, the forma-tion of subsurface scale is accelerated by the oxidation of phosphorus inthe steel to iron phosphate, or by the formation of liquid iron-manganeseoxysulphide inclusions, thus increasing the extent of surface defects on thehot-rolled product.
In the early 1960s, the author developed a simple theoretical model toestimate steel compositions that will insure a non-porous surface in thecontinuous casting of billets, blooms or slabs».The practical validity of thissimple theoretical model was subsequently substantiated experimentallyfor wide ranges of steel compositions.Y'<".
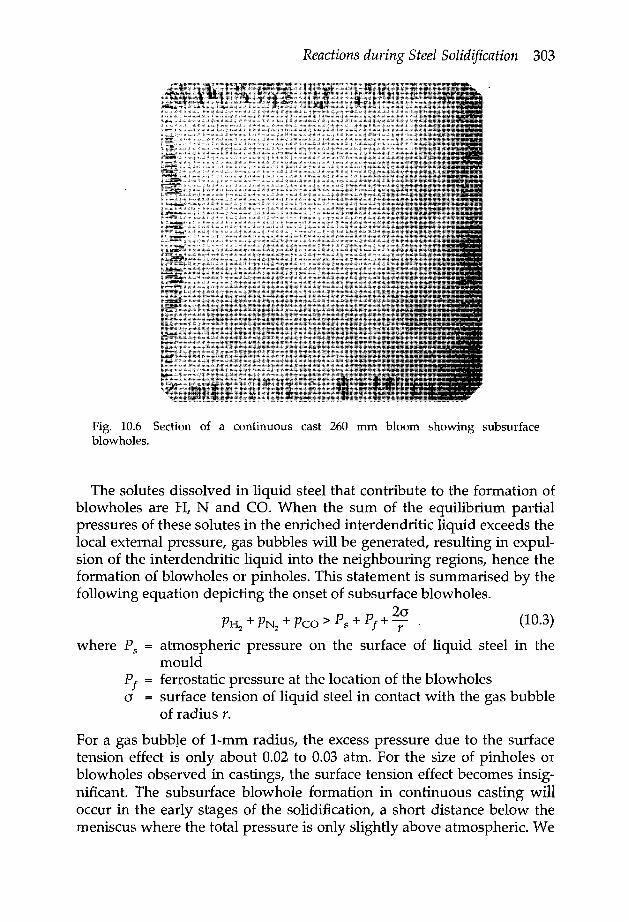
Reactions during Steel Solidification 303
Fig. 10.6 Section of a continuous cast 260 mm bloom showing subsurfaceblowholes.
The solutes dissolved in liquid steel that contribute to the formation ofblowholes are H, N and CO. When the sum of the equilibrium partialpressures of these solutes in the enriched interdendritic liquid exceeds thelocal external pressure, gas bubbles will be generated, resulting in expul-sion of the interdendritic liquid into the neighbouring regions, hence theformation of blowholes or pinholes. This statement is summarised by thefollowing equation depicting the onset of subsurface blowholes.
20PH + PN + Pco > P, + Pf+ - (10.3)2 2 rwhere P; = atmospheric pressure on the surface of liquid steel in the
mouldPf = ferrostatic pressure at the location of the blowholeso = surface tension of liquid steel in contact with the gas bubble
of radius r.
For a gas bubble of 1-mm radius, the excess pressure due to the surfacetension effect is only about 0.02 to 0.03 atm. For the size of pinholes orblowholes observed in castings, the surface tension effect becomes insig-nificant. The subsurface blowhole formation in continuous casting willoccur in the early stages of the solidification, a short distance below themeniscus where the total pressure is only slightly above atmospheric. We

304 Fundamentals of Steelmaking
may take an average of 1.05 atm as the critical total gas pressure for theonset of the subsurface blowhole formation in continuous casting. The gaspartial pressures are calculated for the solute enriched concentrationsusing the solubility data given in Chapter 4. The total gas pressure buildupat 90 percent local solidification is used in estimating steel compositionswhich are susceptible to the formation of blowholes.
Two examples are given in Fig. 10.7 showing the effective gas partialpressure buildup in the interdendritic liquid at about 90% of solidification.Fig. 10.7a is for AI-killed steels containing C < 0.1% and 0, 50 and 100 ppmN. Hydrogen in the steel is a major contributor to the formation of subsur-face blowholes. With the Al-killed steel containing 50 ppm N, the criticalhydrogen content is 8 ppm for the onset of blowholes. In fact, if the steel inthe tun dish contains about 9 ppm H, which sometimes can be the case inQ-BOP steelmaking, a breakout in the caster becomes imminent. Gas bub-bles forming in the early stages of solidification enter the mould gap andbecome intermixed with mould flux, thus lowering the thermal conduc-tivity at the gap; this situation can be the cause of a break-out in the
2.0
1.6
-.C\IJ:+ 1.2C\I
6
0.8E~Q):s 0.4enen 2.0CD0..(ij
i§1.6-C\I
J:+Nz 1.2+0Q,
0.8
2 4 6 8 10Hydrogen (mass ppm)
Fig. 10.7 Total gas pressure at 90% local solidification. (a) Al-killed steel containing< 0.1% C (b) Semi-skilled steel containing: (i) 1.5% Mn, 0.2% Si, 0.08% C, 10 ppm 0 (ii)0.5% Mn, 0.03% Si, 0.02% C, 40 ppm O.
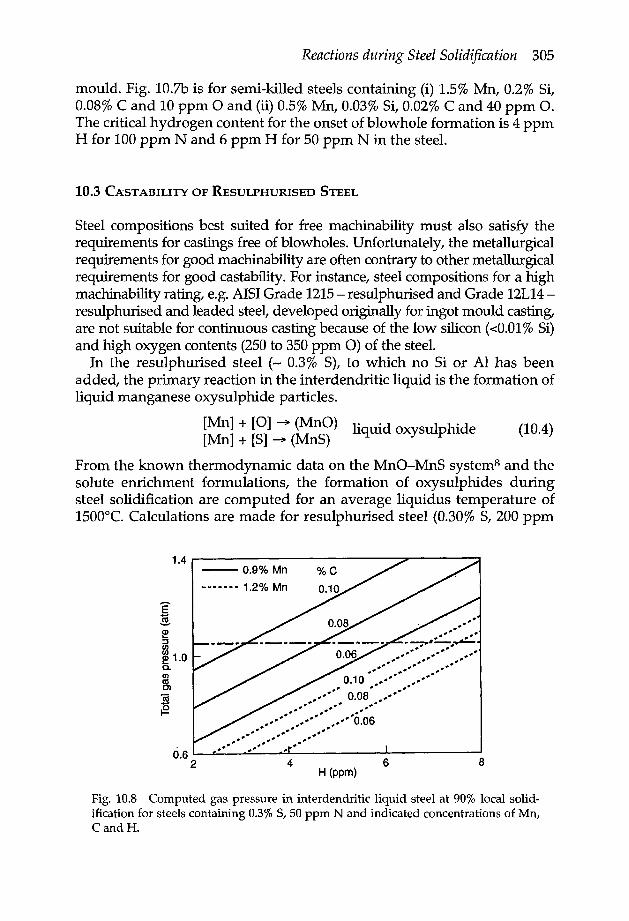
Reactions during Steel Solidification 305
mould. Fig. 10.7b is for semi-killed steels containing (i) 1.5% Mn, 0.2% Si,0.08% C and 10 ppm 0 and (ii) 0.5% Mn, 0.03% Si, 0.02% C and 40 ppm O.The critical hydrogen content for the onset of blowhole formation is 4 ppmH for 100 ppm Nand 6 ppm H for 50 ppm N in the steel.
10.3 C.A:STABILITYOF RESULPHURISED STEEL
Steel compositions best suited for free machinability must also satisfy therequirements for castings free of blowholes. Unfortunately, the metallurgicalrequirements for good machinability are often contrary to other metallurgicalrequirements for good castability. For instance, steel compositions for a highmachinability rating, e.g. AISI Grade 1215- resulphurised and Grade 12L14-resulphurised and leaded steel, developed originally for ingot mould casting,are not suitable for continuous casting because of the low silicon «0.01 % Si)and high oxygen contents (250 to 350 ppm 0) of the steel.
In the resulphurised steel (- 0.3% S), to which no Si or Al has beenadded, the primary reaction in the interdendritic liquid is the formation ofliquid manganese oxysulphide particles.
[Mn] + [0] ~ (MnO) liquid oxysulphide[Mn] + [5] ~ (MnS)
From the known thermodynamic data on the MnO-MnS system" and thesolute enrichment formulations, the formation of oxysulphides duringsteel solidification are computed for an average liquidus temperature of1500°C. Calculations are made for resulphurised steel (0.30% 5, 200 ppm
(10.4)
1.4--0.9%Mn % C------- 1.2%Mn
ES~:JUl
~ 1.00-U)asC>
S~
0.62 4 6 8
H (ppm)
Fig. 10.8 Computed gas pressure in interdendritic liquid steel at 90% local solid-ification for steels containing 0.3%5, 50 ppm N and indicated concentrations of Mn,CandH.

306 Fundamentals of Steelmaking
0.09
~Cf)s 0.08go
0.07
0.9 1.0Mn (mass 0/0)
0.06 L..- ~ ..1..- ..L_ _____I0.8 1.21.1
Fig.10.9 Estimated C and Mn contents of free-machining steels (containing 0.3%S,200 ppm 0, 50 ppm Nand 4 or 6 ppm H) for continuous casting, free of subsurfaceblowholes.
0) containing 0.9 to 1.2% Mn, 0.06 to 0.10% C, 50 ppm Nand 3 to 8 ppm H.The computed total gas pressure in the interdendritic liquid at 90% localsolidification is shown in Fig. 10.8. Taking 1.05 atm as the critical pressurefor the onset of blowhole formation, the critical carbon and manganesecontents are estimated as given in Fig. 10.9. With carbon contents abovethe line, the subsurface blowholes are expected to form in continuouscasting.
It should be noted that the fast rate of cooling inherent to continuouscasting, results in the formation of oxysulphide particles that are smaller insize and have Mn/Fe ratios lower than those formed in the ingot mouldcasting. Consequently, for the same steel composition the machinabilityrating of continuously cast steel will be lower than that which is cast in alarge ingot mould. This is demonstrated by the machinability ratingsgiven below.
Cross sectionof casting, mm152x152 billet254x254 bloom380xS08 bloom810x810 ingot
Average size of MnSinclusions, !lm2
396280
150
Screw testMachinability,parts per hour*
90145170300
"Tests were made at the U.S. Steel Technical Center

Reactions during Steel Solidification 307
10.4 CRITICAL RATIO (MN/S)c TO SUPPRESS HOT SHORTNESS OF STEEL
The hot shortness of steel at hot working temperatures and crack suscep-tibility of steel in continuous casting, have long been known to be due, inpart, to the presence of liquid oxysulphide and iron sulphide at the grainboundaries. The unanimous consensus of many plant investigations andlaboratory studies, is that the hot ductility decreases with a decreasingratio of Mn/S below some critical ratio. There are wide variations in thetechnical literature on the value of the critical ratio (Mn/S), for the sup-pression of hot shortness of steel. These reported variations are due to themethod of testing and to the criterion chosen for the definition of theductile /brittle transition.
The results of three separate studies81I21I3are given in Fig. 10.10 for AI-killed steels, showing the relationship between the critical ratio (Mrr/S),and sulphur content of the steel. For compositions above the line only MnSforms; below the line some liquid FeS forms with the FeS/MnS ratioincreasing with a decrease in the Mn/S ratio below the critical value. Thepoints in Fig. 10.10 are based on the experimental work of Schmidtmannand Rakoskit+ as interpreted ty Toledo et aI.13 The formulation derived bythe author" for the estimation of (Mn/S), becomes less accurate at lowsulphur contents. In the author's formulation, (Mn/S), = 2.7 is for the free-machining steel with 0.3% Sand 200 ppm 0; this compares well with theratio 3.5 estimated from practical observations of the ductile/brittle transi-tion in the hot rolling of free-machining steels.P An average value of (Mn/S), = 3.0 is used in marking the region of hot shortness in Fig. 10.9.
It should be emphasised that the foregoing evaluation of (Mrr/S), is forsteel (i) in the as-cast condition and (ii) in which the precipitation of MnSoccurs under the conditions of local equilibrium in the solidifying inter-dendritic liquid. In the case of rapid rates of solidification, as in continuouscasting, the local reaction equilibrium may not prevail and some liquid'FeS' may precipitate in the last liquid to freeze, resulting in low hotductility even though the ratio Mn/S in the steel >. (Mn/Sj; However,upon annealing at a high enough temperature, the nonequilibrium 'FeS'will be converted to MnS, resulting in the recovery of hot ductility, asdemonstrated by several examples in the work reported by Lankford.w
10.5 CAS FORMATION DURING SOLIDIFICATION
The sulphide shape control by the calcium treatment of steel discussed insection 9.10.4 is another consequence of microsegregation and reactionsoccurring in the interdendritic liquid.
During the calcium treatment of AI-killed low-sulphur steels, the prim-ary reaction is the conversion of alumina inclusions to molten calcium

308 Fundamentals of Steelmaking
100
0w~0.....•..c~
~ 10
o o (Mn/S) > (Mn/S)c
<> (Mn/S) < (Mn/S)c
1~~~~~~~~~~--~~~~0.001 0.01 0.1
Fig. 10.10 The critical ratio (%Mn/ %S)c as a function of sulphur content of steel.Calculated lines: a Ref. 8, b Ref. 12, c Ref. 13i Experimental points: 0, 0 Ref. 14.
S (mass %)
aluminates containing a small amount of sulphur. As is seen from thereaction equilibrium data in Fig. 6.11,the equilibrium sulphur distributionratio (5)/ [5] for the reaction with calcium aluminate, increases with adecreasing temperature. As the steel temperature is decreasing from theend of calcium treatment to the start of casting, the aluminate inclusions inthe melt will pick up sulphur as demonstrated in Fig. 10.11 for steelscontaining 0.01and 0.06%AI, 10and 40pm 5, 20 and 40ppm 0 (total). Thereaction with the aluminate inclusions shown below
(CaO) + 2[5] + [Mn] + %[AI] ~ (CaS-MnS) + V3(AI203)
will continue in the interdendritic liquid during the progress of solidifica-tion, as depicted in Fig. 10.11.The lower the sulphur content and higherthe aluminium, oxygen (as A1203) and calcium contents (as aluminateinclusions), the more extensive will be the sulphide shape modification,i.e. suppression of MnS precipitation. As shown in Fig. 10.12,the sulphidemorphology modification is enhanced by manganese in the steel, par-ticularly at lower levels of Ca and higher levels of 5.
Steel in the tun dish usually contains less than 25 ppm of Ca and 0 ascalcium aluminate inclusions. Therefore, to achieve an acceptable level ofsulphide shape modification, i.e. little or no MnS precipitation, the sulphur

Reactions during Steel Solidification 309
100--------------------------------
(fJ8 80.9:ss:0-Sen-g 60>"0enfn=0'0c.Q 40~CD>c8ECD
~ 20n,
%AI--0.05---0.05- - - - 0.01.------- 0.01
(ppm) 0 (= Cal20402040
0~------_4----L---~--~----~--~1600 1500 20 40 60 80 100Percent solidified
Fig. 10.11 Calculated conversion of dissolved sulphur to CaS on dispersed particlesof calcium aluminate during cooling and solidification of steel.
(J)ce-mo.9~s:c.::;(/)
"0
Q)
>"5(f)(/):c'0co.~
~ooCQ)eQ)0..
ppm Ca
Manganese, mass %
Fig.10.12 Calculated conversion of sulphur in steel to Ca (Mn)S during solidifica-tion of the steel containing indicated amount of Ca, Sand Mn.

310 Fundamentals of Steelmaking
content of the steel should be less than 30 ppm with Ca/S ratio of at least1:1, or preferably somewhat higher.
10.6 CAUSES AND EFFECTS OF NITRIDE PRECIPITATION IN CONTINUOUSCASTING
The microalloyed HSLA steels are susceptible to the formation of trans-verse cracks on the surfaces of continuously cast slabs. This serious prob-lem in the manufacture of HSLA plate steels (for line pipes, pressurevessels, and offshore oil constructions) has been investigated extensivelysince the late 1970s.For background information, reference may be madeto a series of papers published in conference proceedings, HSLA SteelsTechnology and Applicationst? and Vanadiu1n in High-Strength Sfeel18.
In continuous slab casting of crack-sensitive steels, the transverse cracksare seen mostly on the loose surface (top surface) of the slab because thetop surface of the slab is under tension during unbending at the straight-ener. The transverse cracks initiate at the valleys of deep oscillation marksand propagate below the surface along the austenite grain boundaries. Aswould be expected, the surface cracks are always filled with scale andshow internal oxidation. The subsurface intergranular cracks, caused bythe sulphide, nitride, and carbonitride precipitates at the prior austenitegrain boundaries, are neither oxidised nor related to oscillation marks.
10.6.1HOT DUCTILITY
The initiation of transverse cracks at oscillation marks and their propaga-tion below the surface of the slab is a manifestation of low-hot ductility ofthe steel at a temperature when the slab is being straightened. For a betterunderstanding of the mechanism of formation of surface cracks in thecontinuous casting of slabs, numerous studies have been made of theeffects of temperature and steel composition on the hot ductility of HSLAsteels using the Gleeble hot-tensile test machine. In most tests, the steelsample is given a homogenising treatment at a temperature of 1300 to1350°C, cooled to the test temperature in the range 600 to 1200°C andsubjected to tensile test at the strain rate of about 3 x 10⁻³S-1,whichapproximates that experienced by the slab during bending and straighten-ing in the strand.
As typical examples, some of the test results ofMintz and Arrowsmith"?are shown in Fig. 10.13; similar results were obtained by many otherinvestigators. The low ductility trough associated with the austenite --;.ferrite transformation at temperatures of 850 to 700°C, as noted in plainiron-carbon alloys.s? extends to higher temperatures with the addition of

Reactions during Steel Solidification 311
Al and/ or Nb, even though the microstructure is fully austenitic. Thiseffect of Al and Nb is, of course, due to the precipitation of AlN andNb(C,N) at the austenite grain boundaries, as substantiated by numerousstudies using electron microscopy and electron diffraction techniques. Thepapers cited in References 19 through 26 are typical examples of suchstudies. Even in a much earlier study by Lorig and Elsea.F in themid-1940s, it was noted that the precipitation of AIN at the primary aus-tenite grain boundaries was one of the principal causes of intergranularfracture in carbon and low-alloy steel castings.
90
80
~ 70~~ 60co.~ 50c:.Qg 40"0Q)
0: 302010
700 750 800 850 900 950Test temperature (OC)
700 750 800 850 900 9501000Test temperature (OC)
Fig. 10.13 Effects of Nb and Al on hot ductility of HSLA steels after solution treat ..ment for 5 min. at 1330°C. From Ref. 19.
Both precipitates of AlN and Nb(C,N) at the austenite grain boundarieshave similar deleterious effects on hot ductility. In fact, any fine precipitateat the austenite grain boundaries will lower the hot ductility of the steel. Arationale for the effect of precipitates on hot ductility may well be at-tributed to Hasebe.P' who concluded from his earlier studies that the hotductility derived from hot tensile tests is dependent on the effectivenessby which precipitates reduce the mobility of austenite grain boundaries.
It is now a well established fact that the low hot ductility trough in theC-Mn-Si steels; low in Al content, is associated with the austenite ~ferrite transformation. The low hot ductility, resulting in intergranularfracture, is caused by strain concentration at the austenite grain bound-aries accompanying the precipitation of the thin films of the softer ferritephase at the grain boundaries.

312 Fundamentals of Steelmaking
In the case of the HSLA steels, the low hot ductility associated withintergranular fracture is caused by the grain-boundary precipitation ofnitrides and carbonitrides which reduces grain-boundary mobility, lead-ing to growth of voids around the precipitates, thus facilitating inter-granular crack propagation, even when the microstructure is fullyaustenitic. As the concentrations of AI, Nb, C and N increase, the pre-cipitation of nitrides and carbonitrides begin at higher temperatures,resulting in low hot ductility at temperatures well above the A3 transfor-mation temperature, hence widening the temperature range of low hotductility.
There is always an impurity enrichment at the valleys of oscillationmarks where the nitrides and carbonitrides will precipitate, causing locallow hot ductility. When the oscillation marks are deep, the local rate ofheat transfer will be reduced, resulting in blown grains below the depres-sion, thus causing further local weakening of the surface layer. Noting thata deep oscillation mark increases the stress concentration due to the notcheffect of the depression during straightening of the slab, the surface cracksinitiate at the valleys of deep oscillation marks. Nevertheless, the primarycause of crack initiation and propagation is the precipitation of nitridesand carbonitrides concentrated at surface depressions and along the aus-tenite grain boundaries. Without precipitation of nitrides and car-bonitrides, surface ripples alone cannot cause transverse cracks.
The process variables, such as rate of cooling and/ or rate of straining,affect the particle size and rate of precipitation of nitrides and car-bonitrides which, in turn, govern the temperature range of the low hotductility trough. For example, Mintz and Arrowsmith found that coolingthe steel at a faster rate to the Gleeble test temperature, gave significantlyless precipitation of Nb(C,N) in the matrix and a much finer precipitationof Nb(C,N) at the austenite grain boundaries, resulting in a lower hotductility. They also showed that in the Gleeble tension tests, a slowerstrain rate widened the temperature range of low hot ductility.
In their study of the influence of prior precipitation on hot ductility,Wilcox and Honeycombe-? found that the temperature range of low hotductility in the HSLA steels increased when the steel sample was givenan intermediate heat treatment of 15 minutes at 850°C, near the A3 tem-perature; their experimental results are reproduced in Fig. 10.14. Thiseffect of intermediate heat treatment at a lower temperature is due to anincrease in the volume fraction of the precipitates of AIN and Nb(C,N)on reheating, resulting in the extension of the low hot ductility trough tohigher temperatures. It follows from these observations that a tempera-ture cycle near the slab surface in the secondary cooling zone below themould will enhance the precipitation of nitrides and carbonitrides, con-sequently .increasing the chances of formation of surface cracks at theslab straightener.

Reactions during Steel Solidification 313
80
70
60
c;e 50Z0~ 40-c(!)Z0..I 30w
20
10
160
140
120tGa..
100 :E:r."l-t!)
80 zwa:In
60 I-0:t:
40
20
~----~------~------~----~------~----~ 01300800 900 1000 1100 1200
TEMPERATURE,OC
• V SPECIMENS DIRECTLY COOLED TO TEST TEMPERATURE[] V SPECIMENS GIVEN INTERMEDIATE HEAT TREATMENT OF
1/4 H AT 850°C (DASHED LINE SHOWS EFFECT OF THISUPON HOT DUCTILITY)
Fig. 10.14 Hot ductility (-, D) and hot strength (1", v) of HSLA steel after solutiontreatment for 30 min. at 1300°C, the steel composition: 0.24 C, 1.20 Mn, 0.07 Nb, 0.06AI, 0.01 N. From Ref. 24.
It should be noted that the intergranular precipitates are not readilyseen under electron microscopy on replicas taken from transverse sec-tions across the intergranular cracks because of the two-dimensionalnature of the intergranular precipitate. With the technique developed byWilcox and Honeycombe, direct carbon extraction replicas taken fromthe intergranular fractures were used to study grain-boundaryprecipitation.
In accord with the temperature range of low hot ductility caused byprecipitation and y ~ a transformation, the depth of transverse cracks willdepend on the temperature gradient below the surface of the slab. That is,the cracks will propagate to a certain depth where the temperature is highenough for the steel to be in the ductile range and/ or where the tensilestress field becomes too low. It should also be noted that the transversecracks may propagate deeper below the surface during cold scarfing toremove surface ripples because of the steep temperature gradient generatedduring scarfing, resulting in thermal stresses below the slab surface.
Tramp elements, such as Cu, Sn, Sb and iron-rich Fe(Mn)S accumulatingat the austenite grain boundaries because of microsegregation during so-lidification, are also responsible for low hot ductility of austenite, par-ticularly in the as-cast condition.

314 Fundamentals of Steelmaking
Then there is the effect of grain size on the hot ductility of austenite. Asdemonstrated by Ohmori and Kunitake-", for a given mode of matrixstrengthening mechanism, the elongation in tensile testing is determinedby the prior austenite grain size and is linearly proportional to the inverseof the prior austenite grain size. In a recent study, Maehara et aI.30 foundthat the austenite grain size in the as-cast structure depends largely on thecarbon content of the steel, the maximum grain size being in the 0.10 to0.15% C region where the hot ductility is low. This effect of carbon on thehot ductility of austenite in the as-cast condition is in addition to the well-known carbon dependency of surface-cracking susceptibility in continu-ously cast slabs,31-33which is due to the o-ferrite _~ austenite phase trans-formation in low-alloy steels containing 0.09 to 0.16%C.
Mintz and Arrowsmith-? noted that slabs from casts (low Al content)which gave no plate rejections had a course distribution of Nb(C,N) at theaustenite grain boundaries (Fig. 10.15a); interparticle spacing and meanparticle size of -140 and 40 nm, respectively. Slabs from casts (high Alcontent) which had high plate rejections were found to have a fine denseboundary precipitation of Nb(C,N) (Fig. IO.ISb); interparticle spacing andmean particle size of -60 and 14 nm, respectively. Similar observationswere made by Funnell-> with the precipitation of AlN in low-alloy steels;smaller AlN particles at the austenite grain boundaries, causing poorer hotductility than coarser particles. The observed particle-size effect on hotductility is in general accord with the expected particle-size effect on thegrain-boundary mobility: the coarser the particle size and greater the in-terparticle spacing the lesser is the reduction in the grain-boundary mobi-lity, i.e., the higher the hot ductility.
The practical significance of these findings is that the HSLA steels maybe rendered less susceptible to cracking during hot deformation by con-trolling the precipitation of nitrides and carbonitrides so that coarse pre-cipitates are formed at the austenite grain boundaries.
Fig. 10.15 Precipitation of Nb(C, N) at the austenite grain boundaries in HSLAsteels: (a) coarse precipitate in the cast (0.021% AI) having no plate rejections; (b) fineprecipitate in the cast (0.036% AI) with high rejection level. From Ref. 19.

Reactions during Steel Solidification 315
10.6.2 MODES OF NITRIDE AND CARBONITRIDE PRECIPITATION
The precipitation of nitrides and carbonitrides plays a key role in the grainrefinement of HSLA steels through controlled hot-rolling and ther-momechanical treatment. As part of the development work on HSLA steels,numerous studies have been made of the solubilities of nitrides and carbidesin low-alloy steels. A detailed information is given in a previous publicationby the authore+ on the reassessed values of the equilibrium solubility prod-ucts of nitrides and carbides; these are summarised in Table 4.6.
In section 4.5, two examples were given of the equilibrium precipitationof AIN and Nb(C,N) in Fig. 4.31: (a) precipitation in homogeneous aus-tenite and (b) precipitation in the solute enriched regions which would bethe case for the as-cast structure. However, the nitrides and carbonitridesdo not precipitate readily during cooling of the steel casting or duringcooling of the steel after the solution treatment. Gladman and Pickering=for example, have shown that the steel containing 0.08%Al and 0.012%N,after the solution treatment at 1350°C, had to be cooled at a rate of 1 to 2"Cmirr " before any appreciable precipitation of AIN occurred below9000e at which the supersaturation ratio, as defined below, is about 53.
S .. [%X] [%Y]upersaturahon ratio = {[%X] [%Y]} e
where the subscript e indicates the equilibrium solubility product at agiven temperature.
In hot ductility tests, steel samples are cooled to the test temperature atrelatively high rates, e.g., >50°C/min, yet there is a grain-boundary pre-cipitation of nitrides and carbonitrides which results in low hot ductility. Ithas long been concluded from these observations that precipitation fromthe supersaturated solution is strain induced and occurs during the me-chanical test to measure ductility at a particular temperature.
The strain-induced precipitation from the supersaturated solution isshown schematically in Fig. 10.16 with respect to the equilibrium pre-cipitation. The equilibrium precipitation occurs only in the isothermaltreatment of steel for which the treatment time is longer at lower tempera-tures, e.g. about 30 minutes at 1100°C and 72 hours at 850°C. As men-tioned earlier, Mintz and Arrowsmith found that a strain-inducedprecipitation occurs at higher temperatures, i.e. lower supersaturationratios as the strain rate decreases. In continuous casting, the strain exertedon the slab surface during bending in the strand would be adequate forthe onset of a precipitation of nitrides and carbonitrides, leading to crackformation at the straightener. The temperature cycle at and near the slab-surface caused by nonuniform water-spray cooling in the strand, will alsoincrease the extent of strain-induced precipitation, enhancing the cracksusceptibility of the steel.
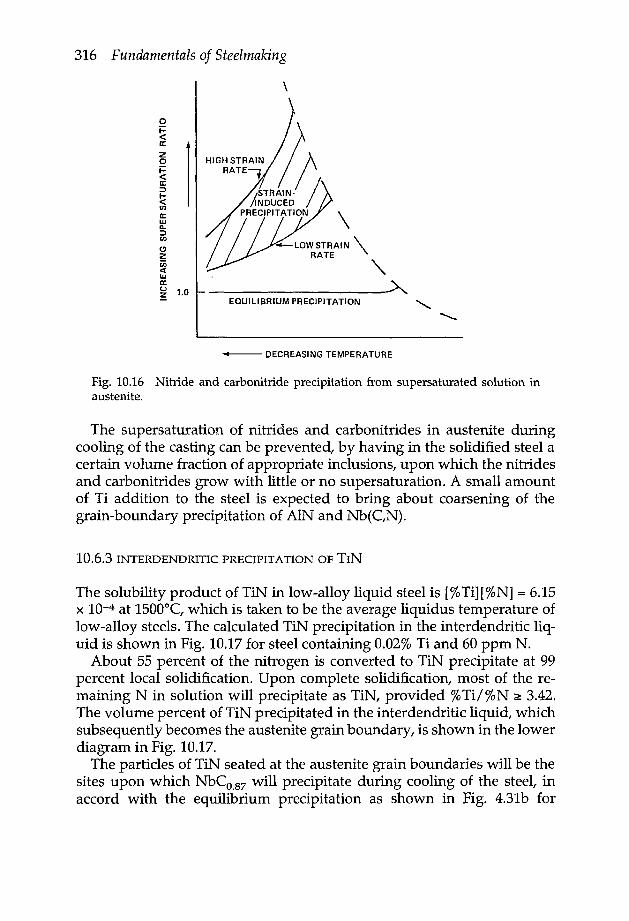
316 Fundamentals of Steelmaking
oi=<ta::2oi=<t0:::>...<t(I)
a:wQ.
::>enC!'2en<twa:~ 1.0
\
\<4-LOWSTRAIN \
RATE -,------~
EQUILIBRIUM PRECIPITATION "
~ DECREASING TEMPERATURE
Fig. 10.16 Nitride and carbonitride precipitation from supersaturated solution inaustenite.
The supersaturation of nitrides and carbonitrides in austenite duringcooling of the casting can be prevented, by having in the solidified steel acertain volume fraction of appropriate inclusions, upon which the nitridesand carbonitrides grow with little or no supersaturation. A small amountof Ti addition to the steel is expected to bring about coarsening of thegrain-boundary precipitation of AlN and Nb(C,N).
10.6.3 INTERDENDRITIC PRECIPITATION OF TIN
The solubility product of TiN in low-alloy liquid steel is [%Ti][%N] = 6.15x 10⁻⁴ at 1500°C, which is taken to be the average liquidus temperature oflow-alloy steels. The calculated TiN precipitation in the interdendritic liq-uid is shown in Fig. 10.17for steel containing 0.02%Ti and 60 ppm N.
About 55 percent of the nitrogen is converted to TiN precipitate at 99percent local solidification. Upon complete solidification, most of the re-maining N in solution will precipitate as TiN, provided %Til %N ;::3.42.The volume percent of TiN precipitated in the interdendritic liquid, whichsubsequently becomes the austenite grain boundary, is shown in the lowerdiagram in Fig. 10.17.
The particles of TiN seated at the austenite grain boundaries will be thesites upon which NbCO.87 will precipitate during cooling of the steel, inaccord with the equilibrium precipitation as shown in Fig. 4.31b for

Reactions during Steel Solidification 317
zi=~cw~<t-o:(jwa:A.
Zt-Zwua:wA.
zi=u.ot- 0.02zwua::wA.
:1 0.01::>..Jo>
0.001....--------------......a...-------'85 90 95 100
PERCENT LOCAL SOLIDIFICATION
Fig.10.17 Calculated TiN precipitation in the interdendritic liquid during solidifica-tion of steel containing 0.02% Ti and 60 ppm N.
Nb(C,N). Although NbCO.87 is soluble in TiN, because of the low inter-diffusivities in the carbonitrides and relatively fast rate of cooling of thesteel, the NbCO.87 will precipitate epitaxially on the TiN particles. By thismeans of enforcing the equilibrium precipitation of NbCO.87 at highertemperatures, resulting in coarser precipitates at the austenite grainboundaries, the low hot ductility trough will be shifted to the lower tem-perature range where y ~ a transformation occurs, i.e. about 850 to 700°C.Now if the surface temperature of the slab at the straightener is main-tained at a temperature of either above 900°C or below 700°C, the trans-verse surface or subsurface cracks should not develop duringstraightening of the slab.
Similar to TiN, the solubility for ZrN in liquid steel is low: [%Zr][%N] =
1.9 x 10⁻³ at 1500°C. Therefore, the precipitation coarsening can beachieved also with the addition of Z!. However, the required minimummass ratio %Zr/ %N = 6.52 is about twice that with Ti. Furthermore, thenozzle blockage becomes a serious problem in continuous casting of steel

318 Fundamentals of Steelmaking
containing Zr. For these reasons Ti would be the preferred addition toachieve precipitate coarsening./ ·'1£the Al and N contents of steel are sufficiently high, there will be AlNprecipitation in the interdendritic liquid, providing sites for the growth ofother nitrides and carbonitrides during cooling of the steel, as noted inprevious studies.19,36 Because of other adverse effects however, high lev-els of Al and N in the steel cannot be tolerated.
With the titanium fixation of nitrogen as TiN, most of the aluminiumwill remain in solution in the steel, and the grain refinement during con-trolled rolling will be primarily via the solution and reprecipitation ofniobium-vanadium carbides containing some TiN. The primary role of Alin such steels is in the deoxidation of liquid steel, for which 0.02 to 0.03%Al (dissolved) would be adequate.
10.6.4 CRITICAL MICRO ALLOYING ELEMENTS IN HSLA STEEL
There are many publications on the recent developments of HSLA platesteels for continuous casting, reporting similar results and recommenda-tions for improved practices. In addition to the papers cited so far, refer-ence may be made also to the papers by McPherson et al.37,38 and byColeman and WilCOX.39
Concensus is that the slab-rejection rate due to transverse cracks isreduced by decreasing the contents of AI, Nb and N in steel containing<0.09% C. The addition of Ti up to about 0.02% has been noted to reducethe crack sensitivity of steel. Microalloying of HSLA steels are usually inthe ranges shown below.
0.06 to 0.08% C0.02 to 0.03% Al0.015 to 0.025% Nb (if the steel is normalised)0.008 to 0.015% Nb (if the steel is quenched and tempered)0.06 to 0.08% V0.01 to 0.02% Ti
<SOppmN< 5 ppm B
As for the casting practice, there should be uniform cooling of the slabsurface in the spray zone, also the slab surface temperature at the strandstraightener should be either above 900°C or below 700oe, to ensure thatno surface and subsurface transverse cracks are formed in the continuouscasting of high-strength, low-alloy steels.

Reactions during Steel Solidification 319
REFERENCES
1. B. CHALMERS,Principles of Solidification, John Wiley & Sons, Inc. New York,1964.
2. W.A. TILLER,K.A. JACKSON,J.W. RUTTERand B. CHALMERS,Acta Metallurgica,1953, I, 428.
3. W.C. WINEGARDand B. CHALMERS,ASM, 1954, 46, 1214.4. M.e. FLEMINGS,Solidification Processing, McGraw-Hill, New York, 1974.5. H.D. BRODYand M.e. FLEMINGS,Trans. Met. Soc. AIME, 1966, 236, 615.6. E.T. TURKDOGAN,Trans. Met. Soc. AI ME, 1965, 233, 2100.7. E.T. TURKDOGANand R.A. GRANGE,J. Iron and Steel Inst., 1970, 208, 482.8. E.T. TURKDOGAN,Fifth Inter. Iron and Steel Congr., (Process Tech. Proc.) 1986, 6,
767.9. E.T. TURKDOGAN,]. Metals, 1967, 19(1), 38.
10. B. HARKNESS,A. NICHOLSONand J.D. MURRAY,]. Iron and Steel Inst., 1971, 209,692.
11. D. BURNSand J. BEECH, Ironmaking and Steelmaking, 1974, 1,239.12. H. NAKATA and H. YASUMAKA,Trans. Iron and Steel Inst. Japan, 1986,26, B-98;
Tetsu to Hagane, 1990, 76, 376.13. G.A. DETOLEDO,O. CAMPO and E. LAINEZ, Steel Research, 1993, 6,292.14. E. SCHMIDTMANNand F. RAKOSKI,Arc. Eisenhidteruoes, 1983, 54, 357.15. S.Y. OGAWA, T.B. KING and N.J. GRANT, Trans. AIME, 1962, 224, 12.16. W.T. LANKFORD,Metall. Trans., 1972, 3, 1331.17. HSLA Steels Technology and Applications, (M. Korchynsky, ed.), ASM, Metals
Park, Ohio, 1983.18. Vanadium in High Strength Steel, VANITEC, London, 1979.19. B.MINTZ andJ.M. ARROWSMITH,Met. Tech., 1979, 6,24.20. T. NOZAKI, J. MATSUNO,K. MURATA,H. 001 and M. KODAMA, Trans. Iron Steel
Inst. Japan, 1978, 18, 330.21. M. HATER, R. KLAGES, B. REDENZ and K. TAFFNER, Steelmaking Conference,
1973, 56, 202.22. K. KONOSHITA,G. KASAl and T. EMI, in Solidification and Casting of Metals, 268-
274, 1979, London, The Metals Society.23. G.D. FUNNELL, in Hot Working and Forming Processes, 104-107, 1979, London,
The Metals Society. .24. J.R. WILCOXand R.W.K. HONEYCOMBE,in Hot Working and Forming, 108-112,
1979, London, The Metals Society.25. G.D. FUNNELLand R.J. DAVIES,Met. Tech., 1978, 5, 150.26. L. ERICSON,Scand. J. Metall., 1977, 6, 116.27. C.H. LORIGand A.R. ELSEA,Trans. AFS, 1947, 55, 160.28. S. HASEBE,Tetsu-to-Hagane, 1962, 48, 1575.29. Y. OHMORI and T. KUNITAKE,Metal. Sci., 1983, 17, 325.30. Y. MAEHARA, K. YASUMOTO,Y. SUGITANIand K. GUNJI, Trans. Iron Steel Inst.
Japan, 1985, 25, 1045.31. S.N. SINGH and K.E. BLAZEK,J. Metals, 1974, 26, (10), 17.32. A. GRILLand J.K. BRIMACOMBE,Ironmaking Steelmaking, 1976, 3, 76.33. T. SAEKI, S. OOGUCHI, S. MIZOGUCHI, T. YAMAMOTO, H. MISUMI and A.
TSUNEOKA,Tetsu-to Hagane, 1982, 68, 1773.

320 Fundamentals of Steelmaking
34. E.T. TURKDOGAN, Iron and Steelmaker, 1986, 16(5), 61.35. T. GLADMAN and B.F. PICKERING, J. Iron Steel Insf., 1967, 205, 653.36~ B.C. WOODFINE and A.G. QUARRELL, ]. Iron Steel lnsi., 1960, 195, 409.37. N.A. MCPHERSON and R.E. MERCER, Ironmaking and Steelmaking, 1980, 7, 167.38. N.A. MCPHERSON, A.W. HARDIE and G. PATRICK, Inter. Iron Steel Trans., 1983,
3,21.39. T.H. COLEMAN and J.R. WILCOX, Mater. Sci. Tech., 1985, 1, 80.

Aactivated complex 35activation energy (enthalpy) 37, 132activity
alumina 198, 287and basicity 155, 157binary melts 91-93calcium oxide (lime) 162carbon 92, 93definition 13-14iron oxide 153-156, 180manganese oxide 156-158, 195metal ions in slag 140multicomponent melts 94oxides 150, 196oxygen 189phosphorus 189temperature effect 14
activity coefficients 16-17adiabatic reactions 6adsorption 27, 28, 37air bubble entrainment 255-256A1203 see aluminaalloy steels 94alloying elements 109, 110, 119, 127
chromium 211copper 210effect on peritectic invariant 105effect on transition temperature
101molybdenum 211nickel 211
alpha brass 43alumina
activity 198, 287inclusions 286-287, 291, 307-308ladle lining 245reduction by silicon 266
aluminiumand calcium solubility 119deoxidation with 153, 197-199, 262-263,
266-267,287,318recovery 264and reheating 262in steel 109, 267, 270
Index
aluminium killed steel 161, 199, 254-255,258,272,283,284,286,304,307
aluminium nitride 125, 126,311, 318aluminosilicate network see silicate
network structureAnzin Works 268AOD
slag composition 186, 268stainless steelmaking 184, 267
ARBED-IRSID 222arc reheating 260-261
and vacuuum degassing 277argon
blowing 268bottom blowing 184flow rate 274injection 222, 232, 278, 282purging 78-79rinsing 262, 268-269, 285stirring 225, 245, 262, 270, 271-272top lancing 270
armour plate grade steel 269ASEA-SKF system 277austenite
grain boundaries 125-126hot ductility 313-314phase transformation 101, 300, 310, 311stabilisers 106
Avogadro's law 2
Bbasic oxygen steelmaking (BOS)
automated 216combined blowing 222-226decarburisation 226desulphurisation 207, 208development 209equilibrium and non-equilibrium
reactions 239gas bubbles 71hydrogen content 238-239iron oxide-carbon relation 232-233iron oxide-manganese oxide-carbon
relations 234-236melt temperature 181
. ~?1

322 Fundamentals of Steelmaking
basic oxygen steelmaking (BOS) (cont.)nitrogen content 238-239<?xygen blowing rate 220-221oxygen content of steel 279oxygen-carbon relation 231-232phosphorus reaction 236-237slags 181, 217-219sulphur reaction 237-238tap temperatures 183terminology 210top lancing 230turndown conditions 225
basicity of slags 140-142, 180, 181, 212, 219,220and activity ISS, 157and phosphate capacity 187
bearing steels, inclusion control 290-292Bessemer steel 263Bethlehem Steel 262binary silicates, density 171binary systems 21-23
activity coefficients 91-93interdiffusion 43-44phase diagrams 142-145
blast furnace iron, pretreatment 200-208blast furnace slag 69, 144blast furnace white fumes 69, 70blowholes, subsurface 297, 302-305, 306body centred cubic iron 100, 133, 134BOF process see basic oxygen steelmaking
(BOS)Boltzmann constant 26BOP process see basic oxygen steelmaking
(BaS)boron, diffusivity 133Boyle's law 1breakouts 104, 119, 304British Steel 230bubble surface 226burnt rice hull 249
Ccalcination of limestone 46-49calcined (burnt) dolomite (dolorna, dolo)
143,212,246calcined limestone, pore structure 63, 66calcium
reactions 286-288solubility in liquid iron 119, 120treatment 285-290,293
calcium aluminatein deoxidation 267
flux 145inclusions 291lime-saturated 272melts 191nitrogen solubility 160phase diagram 145, 146~288slags 141, 190,. 263, 267-268, 271-272
calcium aluminate-silicahydroxyl capacity 161interfacial tension 167nitrogen solubility 160oxide activities 152-153phase diagram 147, 151surface tension 166viscosity 174
calcium carbide, desulphurisation 205calcium fluoride 147, 166, 167calcium oxide
activity 162bottom injection 239in desulphurisation 205flux 211in hot metal refining 200, 201in slag 141, 149, 183, 271solubility 123-124, 149
calcium oxide saturated calcium aluminate272
calcium oxide-barium oxide-iron oxide-silica, viscosity 174
calcium oxide-iron oxide-silicahydroxyl capacity 161oxide activities 150-151viscosity 177
calcium oxide-magnesia, phase diagram143
calcium oxide-magnesia-alumina-silica171-176,254
calcium oxide-magnesia-iron oxide-alumina-silica, viscosity 174
calcium oxide-magnesia-silica-iron oxidemagnesia in 149, 150phase diagram 148, 149in slag 145
calcium oxide-silicaphase diagram 143, 144viscosity 174
calcium oxide-silica-iron oxidemanganese oxide addition 151phase diagrams 145, 147, 148
calcium sulphide 123-124effect on surface tension 166formation during solidification 307-310

solubility 191, 192calcium-iron(nickel) 285calcium-silicon 268, 285CaO-A1203 see calcium aluminatecarbide capacity 141carbides, solubility 125-128carbon
activity 92, 93addition to iron-sulphur alloys 128and calcium solubility 119and chromium 185deoxidation 279di£fusivity 133, 135oxidation 51-57, 67, 182-183, 262steels 108, 211
carbon monoxidefrom decarburisation 227postcombustion 209solubility 98
carbon monoxide-carbon dioxide-sulphurdioxide 84
carbon monoxide-carbon dioxide-water-methane 84-85
carbonitride precipitation 315-316castability 297, 305, 305-306cementite 102CFDS-FLOWS3D 80charge control see furnace charge controlCharles's law 1chemical potential see Gibbs free energychemisorption see adsorptionChemSage 31-32chill factors for ladle additions 254-255chromium 109
as alloying metal 211and carbon 185density 129oxidation 184-186, 242recovery 184-186
clean steel 269, 291close-packing of gas bubbles 75cobalt
density 129di£fusivity 135viscosity 132
coke, reactivity 55combined blowing, basic oxygen
steelmaking (BaS) steelmaking 222-226computer-based packages 31-32,80,
239-240contact angle 29-30continuous casting
Index 323
and blowhole formation 302; 303crack susceptibility 105, 307, 310HSLA steels 108, 318and ladle furnace 259machinability requirements 306mould fluxes 174nitride precipitation 310-318nozzle blockage 317-318and peritectic reaction 104
converter skull 257, 280-281copper
as alloying metal 210density 129vaporisation rate 68, 69viscosity 132
cored-wire injection 245, 268, 269, 285, 287cost effectiveness 200, 216-217, 279crack susceptibility 97, 105, 307, 315cracking
hydrogen-induced (HIe) 286, 290transverse 310, 312, 313, 317, 318
cristobalite 143
DDaido-NKK 259Dalton's law 2de Laval nozzles 229decarburisa tion
carbon monoxide production 227and desulphurisation 237effect of sulphur 40-41rate 39-41, 218-219,220-222,226,
281-283vacuum degassing 280-281
degassing 78-79,97,245,277-285see also RH degassing; RH-OB degassing;
vacuum degassingdehydrogenation .283-284denitrogenation 77-78, 162, 284-285density, temperature dependence 129-130deoxidation
aluminium 197-199,262-263,266-268,287
calcium-silicon 268ferromanganese 193in the ladle 262-268products 264reaction equilibrium 193-199silicomanganese 193, 196,266silicomanganese / aluminium 197slag aided 263-268
dephosphorisation 200, 202-205, 236-7

324 Fundamentals of Steelmaking
desiliconisation 200,200-202desulphurisation
f argon stirring 245, 270-271..basic oxygen steehnaking (BOS) 207, 208,
239electrode arc furnace 242in hot metal refining 200Japanese methods 200, 202-205in the ladle 190, 191,205-208, 269-276rate 252, 274-276reducing conditions 100, 237and sulphur pickup 100Thyssen-Niederrheim (TN) 270
DB degassing 245, 278diffusion 41-44, 89-90
Schell equation 297-298diffusion-limited enhanced vaporisation
67-70diffusivity
data 86-87, 135definition 43-44electrode graphite 67pressure effect 90temperature effect 132-133
Dillinger Huttenwerke 271ductility 286Dulong and Petit's law 9
E2E/FIX 80electric arc furnace steelmaking
chromium oxidation 184, 242desulphurisation 242electrode consumption 56-57equilibrium and non-equilibrium states
242,243iron oxide-carbon relation 241iron oxide-manganese oxide-manganese
relation 242melt temperature 181nitrogen content 264phosphorus reaction 242slag composition 144, 181,240-241slag-metal reactions 240-243, 264sulphur reaction 242
electrical conductivityof slags 177-178of steel 133
electrode, see also carbonelectrode consumption 56-57electrode graphite, diffusivity 67emulsion 226-227
energydefinition 3of reaction 35
enthalpy (heat content) 3-4, 6of activation 37at melting point 11-13 -of gases 83of mixing (solution) 15, 16of reaction 5, 6
entropy 7of mixing (solution) 15of reaction 8-9
equilibrium constant 19temperature dependence 19-20, 122
equilibrium and non-equilibrium reactionsin EAF steelmaking 242, 243in oxygen steelmaking 239
equilibrium states of gas mixtures 83-86Eucken correction factor 88eutectic systems 22, 23, 102EXOSLAG practice 272-274
FF*A*C*T 31face centred cubic iron 100, 133, 134fatigue resistance 290-292Fe/Mn see ferromanganeseferric/ferrous iron ratio 165-166ferrite phase 101ferrite stabilisers 107ferromanganese 193, 197,257, 259, 262ferrosilicon 197, 262, 263Fick's diffusion laws 41-44, 134FID 80Finkl-Mohr system 277first law of thermodynamics 3-6flaking 283FLUENT 80fluorspar (calcium fluoride) 211fluxes 174, 178,202, 211, 245, 253, 254foaming of slags 226-230, 254forsterite 145fractional saturation 42-43free energy
change 18-19of formation 9, 10Gibbs 8metal oxides 158-159of mixing (solution) 15, 94-95
fume suppression techniques 68furnace bottom, slagging 223furnace charge 209-214

control 211-214, 215furnace lining 212
breakout 119furnace tapping 255-256
Ggas bubbles
close-packing arrangement 75kinetics 70-73, 76-77nucleation and growth 70-71in oxygen steelmaking 70-73size 74-76
gas constant 2gas holdup 71-73gas laws 1-3gas mixtures, equilibrium states 83-86gas stirring 223, 224, 249-253gases
heat content 83kinetic theory 86-87molar heat capacity 82-83reaction with porous materials 48reactive 67-70solubility 95, 160-166thermochemical properties 81-85transport properties 86-89
Gay-Lussac's law 1GENMIX80Gibbs adsorption equation 26Gibbs free energy see free energyGibbs-Duhem integration 151, 152Gleeble test 310, 312grain boundary precipitation 307, 310-317graphite
diffusivity 67solubility 102, 103
Hhaematite 44, 45, 57-67, 90, 111hairline cracks 283heat
of adsorption 28balance 213-214capacity 4, 9-11content see enthalpyof melting 13of reaction 6transfer 44--48
heat-affected zones of welds 286, 290Henry's law 17, 18, 19, 91Hess's law 6HIe see cracking
Index 325
high carbon steel, tyre cord grade 254high strength low alloy (HSLA) steel
continuous casting 318cracking 286, 290, 314degassing 97grain refinement 315hot ductility 310, 312microalloyed 245, 310, 318plate grade 108
high sulphur steel 271high temperature processes 34Hoogovens Ijmuiden BV 217, 218, 230hot ductility 307, 310-314hot metal refining, Japanese steel industry
200hot rolling 307, 315hot shortness 115, 117-118
and oxysulphide 115, 117-118suppression 117-118, 297, 307
hot workability 297HYDRIS 238, 284hydrocarbon gas 209,238-239hydrogen
diffusivity 133, 135dissolved 302-303, 304in oxygen steelmaking 238-239pickup 257solubility 96-97
hydrogen sulphide, solubility 99-100hydroxyl capacity, calcium oxide-iron
oxide-silica 161
Iideal gas 1ideal solutions 16impact energy 286inclusions
detrimental 291; 292flotation 268-269morphology control 245, 285-286,
289-292,297physicochemical aspects 293, 294
interaction coefficients 17-18, 91-92, 94interdendritic liquid steel 297-302interdiffusion, binary systems 43-44interfacial reactions, kinetics 34-41interfacial tension see surface tensioninterfacial turbulence (Marangoni effect)
167-170iron
crystallographic forms 100-101density 129

326 Fundamentals of Steelmaking
iron (cant.)diffusivity 135manganese content 193, 194oxidation 44--45,180oxygen content 193, 194phase transitions 100silicon content 194vaporisation rate 68, 69viscosity 132
iron alloys, surface tension 126-129,131
iron ores, reduction rate 57-62iron oxide
activity 153-156, 180pore structure 63reduction 57-62, 90
iron oxide-calcium oxide-silica, surfacetension 166, 168
iron oxide-carbon relationin EAF steelmaking 241in oxygen steelmaking 232-233
iron oxide-manganese oxide, phasediagram 142
iron oxide-manganese oxide-manganeserelations 242
iron oxide-manganese oxide-manganese-oxygen relations 234-236
iron oxide-manganese oxide-silica, surfacetension 166, 168
iron oxide-silicaphase diagram 143, 144, 145surface tension 166
iron oxysulphide 115-117, 297, 306, 307see also iron-sulphur-oxygen
iron-carbondecarburisation 39-41density 130, 131phase equilibrium 101-110viscosity 132
iron-carbon-magnesium 120-122iron-carbon-silicon-magnesium 122iron-manganese oxysulphide 117-118iron-manganese silicate melts 194iron-oxygen, thermodynamics 110-113iron-silicon-magnesium 119-122iron-sulphur 114
carbon addition 128iron-sulphur-carbon 103iron-sulphur--oxygen lIS, 116, 117
JJapanese steel industry 200, 208, 214-217
KKawasaki Steel Corporation 215,222killed steel 263, 269
see also aluminium killed steelkinetic theory, gases 86-87Kirkendall effect 43 -Knudsen diffusivity 89, 123Kobe Steel Corporation 222Kopp's rule 9, 11
LLackenby 230ladle furnace steel refining 141, 245-296
addition chill factors 254-255conditions 193-194degassing 277dephosphorisation 203desulphurisation 206ladle lining 245preheating 246-249slags 152, 162,253-254
lance bubbling equilibrium (LBE) 222, 223lance injection 229-230, 262Langmuir adsorption isotherm 27-29lattice constant, temperature effects 100LD process see basic oxygen steelmaking
(BOS)lead, solubility in liquid iron 119lead-magnesium alloys 122lime see calcium oxidelimestone
calcination 46-49see also calcined limestone
Linz-Donawitz (LD) process 209liquidus temperatures, low alloy steels
109-110low alloy steel
carbon oxidation 182electrical conductivity 133, 133-134liquidus temperatures 109-110oxidation rate 44-45peritectic reaction 104-105phase boundaries 105phosphorus reaction 186slag composition 15, 219sulphur reaction 163thermal diffusivity 136thermodynamic activities 91
low carbon steel 104, 280
Mmachinability 286,297, 305, 306, 307

magnesialadle lining 245refractory properties 145, 146in slag 140, 141, 149solubility 123-124, 146, 147, 150,219
magnesia-carbon, refractory properties212,222
magnesia-silica, phase diagram 145magnesio-wustite 146, 147, 149magnesium
desulphurisation 205solubility in iron-carbon alloys 119-122
magnesium sulphide, solubility in liquidiron 123-124
magnetite 44, 45, 57manganese
austenite stabiliser 106density 129in deoxidation 193, 194, 196di£fusivity 135in EAF steelmaking 265and hot shortness lIS, 117oxidation 181, 235, 262and peritectic temperature 109vaporisation 257
manganese alumino silicate 153manganese oxide
activity 156-158, 195addition to calcium oxide-silica-iron
oxide 151manganese oxide-alumina-silica, oxide
activities 153, 154manganese oxide-carbon relation, in
oxygen steelmaking 234manganese oxide-manganese sulphide,
thermodynamics 305manganese sulphide 289-290, 299, 300-301manganese/sulphur ratio 115, 307~arangonieffectI67-170,227mass diffusivity, slags 176-177mass transfer 44-48material balance 211, 288-289mathematical modelling 48-51, 56, 80, 302melt temperature 181melting paints of polymeric substances 13~ETADEX80metallurgical requirements 305MgO see magnesiamicroalloyed HSLA steel 245, 310, 318micro segregation 297, 307mill scale in hot metal refining 200,201minimum slag process 208, 259
Index 327
miscibility gap 23, 103, 115, 116, 143mixing time 251-252molar heat capacity of gases 82-83molar quantities of solutions 15molecular mass effect in transport
phenomena 89molecular self-diffusivity 89molybdenum 109, 211MTDATA31multicomponent systems 94
NNemst-Einstein equation 177network see silcate network structurenickel 106, 109, 110, 119, 129, 132,211niobium 125, 126niobium carbide 316-317niobium-vanadium carbides 318Nippon Kokan 222Nippon Steel Corporation 201, 207, 208,
222,245,278nitride capacity 160, 162nitride inclusions, detrimental 291nitrides
precipitation 297, 310-318solubility 125-126, 127, 128
nitrogendiffusivity 133, 135dissolved 302-303in EAF steelmaking 266injection 222in oxygen steelmaking 238-239pickup 256, 263, 266, 270, 274removal see denitrogenationsolubility 97-98, 160, 162titanium fixation 318
nitrogenation 38-39NKK Corporation 201non-ideality 3, 16, 19, 91non-steady state diffusion 41-42
oOBM process see Q-BOP processoffshore installations 269, 290, 310oil-quenched steel 291olivine 146, 149open hearth process 184, 190, 200open heat tapping 262-263optical slag basicity 141-142oxidation
carbon 51-57, 182-183chromium 184-186
328 Fundamentals of Steelmaking
oxidation (cont.)iron 44-45, 180
"manganese 181,.phosphorus 186-189silicon 183-184
oxidation rate, low alloy steels 44-45oxide content, slags 145,212, 218, 219, 240oxide inclusions, morphology control
285-286oxides
activities 150, 150-158, 196free energy 158-159and silicate network 139solubility 123-124surface tension 166-170
oxygenacitivity coefficients 189blowing rate 220-221diffusivity 133, 135effect on surface tension 27, 28, 167, 169,
170injection, in reheating 261-262in iron 193, 194and nitrogen 256potential diagram 158-159and silicon-manganese deoxidation 300solubility 110-113, 165,221-222,235in steel 279, 288
oxygen steelmakingblowing processes 209-244blowing rate 229dynamic blowing control 214-217dynamic nature 239gas bubble kinetics 70-73gas evolution 227see also basic oxygen steelmaking: Q-BOP
steelmakingoxygen-carbon relation, in oxygen
steelmaking 231-232oxysulphides 297, 306, 307
pparabolic rate equation 44-45partial pressures 2passivation 6periclase 145
see also magnesiaperitectic systems 22, 102, 104, 110peritectic temperatures 104, 106, 107, 109Perrin process 190phase bounda.ries IDS, 110phase diagrams 20, 21-23, 25, 26
binary systems 142-145calcium aluminate 288iron-base 100-124
phase rule 20phase transformations 11:-12, 100, 101, 104,
143PHOENICS80phosphate capacity
and basicity 187of slag 141, 187-189
phosphorus 109, 110activity coefficients 189diffusivity 135low 218oxidation 186-189reactionsEAF steelmaking 242oxygen steelmaking 236-237removal 219reversion 258, 263in slags 140in steel 211, 218
pipeline steels 286, 290, 310polymeric materials 10-11, 44, 83pore diffusion 89-90pore structure 63-67porous materials, reaction with gases 48porous plugs 249, 250, 251, 270potassium 69potential diagram, oxygen 158-159pressure effects, transport phenomena 88,
90pretreatment of blast furnace iron 200-208protoenstatite 145pyrometallurgy 34,68,82pyroxene 147pyrrhotite 117
QQ-BOP steelmaking
degassing 79denitrogenation 77-78gas bubbles 71hydrogen content 238-239, 304iron oxide-carbon relation 232-233iron Oxide-manganese oxide-
manganese-oxygen relations 234-236manganese oxide--carbon relation 234melt temperature 181nitrogen content 238-239oxygen blowing 220-221, 230oxygen-carbon relation 231-232

phosphorus reaction 236-237process 209, 210slag basicity 181slag carryover 258slag steelmaking 219sulphur reaction 237-238
quartz 143quaternary systems 122, 145-150
Rradioactive tracers 176Raoult's law 16, 17, 91rate constant, temperature dependence
36-37rate controlling reactions see reaction ratesrate equations, gas bubble reactions 76-77rate phenomena 34-81reaction rates 58recirculation degassing 278reducing slag, electric furnace 144reduction
of iron oxides 57-62of sulphur 189-192
reduction products, pore structure 63-67refractories 145, 146
dolomite 143magnesia-carbon 212, 222thermal conductivity 246-247thermal cycling 245-246
reheat cracking 286,290reoxidation of steel 165resulphurised steel, castability 305-306RH degassing 245, 278, 279, 281-283RH-OB degassing 245, 262, 278, 279
SSchell equation 297-298scrap, composition 119, 209-210second law of thermodynamics 7semi-killed steel 197, 262, 268, 269, 305Sievert's law 95silica, phase transformations 143silicate inclusions, detrimental 291silicate network structure 11, 12, 138, 139,
172silicomanganese, in deoxidation 153, 193,
197,262,264-266,300silicon
addition 211and calcium solubility 119in deoxidation 196di£fusivity 135
Index 329
in iron 109, lID, 194oxidation 183-184, 262in steel 267
similarity relation 75slag
basicity 140-142, 180, 181,212, 219, 220calcium aluminate 190carryover 257-259, 263chromium recovery 184-186compositionand activities 153, 154AOD 186basic oxygen steelmaking 217-219blast furnace 69electrode arc furnace 240-241estimation 212-213ladle slag 253-254low alloy steelmaking 15oxide content 212-213and steel reoxidation 165turndown 219-220conditioner 253density 170-172desiliconisation 202electrical conductivity 177-178foaming 73, 226-230, 254ionic nature 44, 138, 140, 176-178ladle 253-254lime-saturated 183mass diffusivity 176-177molten, physicochemical properties
138-179oxide activities 150-158oxide content 140, 145, 212, 218, 219, 240phosphate capacity 187-189recycling 202solubility of gases 160-166sulphide capacity 141, 189-192, 191thermal conductivity 178thickness 258-269use for constructional purposes 144viscosity 172-176waste product disposal 200
slag minimum refining process, NipponSteel Corporation 207
slag steelmaking, Q-BOP 219slag-metal distribution 161-162slag-metal interfacial tension 166-167 .'slag-metal reactions 240-243, 252-253, 263slag-steel reactions 180-199sodium carbonate flux 202sodium oxide 167

330 Fundamentals of Steelmaking
SOLA/VOF 80SOLGASMIX 31Sollae Dunkerque 230solute enrichment 297-302, 299solution 15, 43sour gas. and oil 286, 290spessartite 254spinel inclusions, detrimental 291spreading coefficient 31stainless steelmaking, AOD 184standard state 5steady state diffusion 41steel
aluminium content 267aluminium-killed 199aluminium content 270carbon content 108, 211, 280castability 286degassing 78-79deoxidation 153, 196, 262-269desulphurisation in the ladle 190, 191high sulphur 271homogenisation by gas stirring 249-253impurities 297liquid, gas holdup 71-73liquiddensity 129-130reactions with slag 180-199mechanical properties 297oxgyen content 288phosphorus content 211physicochemical properties 91-137quality 259reheating 259,260-261oxygen injection 261-262reoxidation 165,270silicon content 267solidification reactions 297-314sulphur content 211, 269thermodynamic properties 91-95
steel castings, cooling 96-97steel refining, in the ladle 172, 180, 245-296steelmaking
heterogeneous reactions 34open hearth process 200oxygen blowing process 99, 209-244see also basic oxygen steelmaking (BOS);
electric furnace steelmakingstrain potential of structural tessellation
291sublance technology 214-217subsurface blowholes 297, 302-305, 306
sulphate ions, in slag 140sulphide
capacity 141, 163, 164, 189-192inclusions, morphology control 285, 287,
289-290,297,308solubility in liquid iron 123-124
sulphur .in blast furnace slag 69and decarburisation 40-41diffusivity 135effect on denitrogenation 284-285effect on interfacial tension 167, 169low 218and nitrogen 256pickup, and desulphurisation 100reactionsin EAF steelmaking 242in oxygen steelmaking 237-238reduction 189-192removal 219solubility 114, 163in ste~1110, 211, 218, 269
sulphur dioxide, solubility 99Sumitomo Metal Industries 200,203supercooling 132supersaturation 315, 316surface active substances 39, 76, 78surface curvature, and surface tension 29surface defects 286, 302surface energy see surface tensionsurface tension 25-26
effect of surface curvature 29and foam formation 227liquid iron 27, 28liquid iron alloys 126-129, 131liquid oxides 166-170practical importance 29
Ttank degassing 277tap ladle 197, 245-249tap temperatures, basic oxygen
steelmaking (BOS) 183TEACH(2D, 3D) 80tearing, lamellar 286, 290temperature effect
activity coefficients 302carbon oxidation 56density 129-130dephosphorisation 203,204diffusivity 132-133equilibrium constant 19-20, 122

lattice constant 100pore structure 63-67rate constant 36-37thermal conductivity 135thermodynamic activity 1~transport phenomema 88viscosity 133
ternary systems 23-25, 145-150thermal conductivity 86-87, 134-35
refractories 246-247slag 178temperature dependence 135and thermal diffusivity 88and viscosity 88
thermal cycling 245-246, 315thermal diffusivity 88, 136thermochemical properties, gases 81-90thermodynamic activity see activitythermodynamics 1-32, 110-113thermomechanical treatment 315Thiele, mathematical analysis 48-51third law of thermodynamics 7Thyssen Stahl AG 208Thyssen-Niederrheim (TN),
desulphurisation 270titanium 129, 318titanium nitride, interdendritic
precipitation 316-318top lancing 230,249topochemical reduction 59tramp elements 313transfer ladle 200transport phenomena 34,81-90,86-89tridymite 143triple point of water 20
Index 331
turndown 182-183, 219-220, 225, 226, 230,237
tyre cord grade, high carbon steel 254
uU.S: Steel 68, 79, 209, 226, 231, 239, 263, 271,
272,283, 306
Vvacuum degassing 245, 277-285
decarburisation 280-281vacuum-carbon deoxidation 291vanadium 109, lID, 129vaporisation of metals 67-70vaporisation rate 37, 70viscosity 86-87, 130-132, 172-176
temperature dependence 133and thermal conductivity 88
WWagner's equation 45water, solubility 98-99, 160white falling slag 144white fumes (blast furnace) 69, 70wollastonite 254work of adhesion and cohesion 30wustite 44, 45, 58, 59, 111, 115, 116
XX-ray fluoroscopy 168
Zzirconia, stabilised 198zirconium 318zone-refined iron 112