Embed Size (px)
Citation preview

page 1 of 43
Funding Issues in U.S. Community Colleges: Findings from a 2008 Survey of the National Council of
State Directors of Community Colleges
Stephen G. Katsinas and Terrence A. Tollefson
A report of the
Education Policy Center
at
The University of Alabama
for the National Council of State Directors of Community Colleges
Tuscaloosa, Alabama
April 2009

page 2 of 43
© 2008 by the University of Alabama This report may be reproduced in whole or in part, without permission. The recommended citation for citing or exerting portions of this report is as follows: Katsinas, S. G., and Tollefson, T. A. (2008). Funding issues in U.S. community colleges: Findings from a 2008 survey of the National Council of State Directors of Community Colleges [Report]. Tuscaloosa, Alabama: Education Policy Center, The University of Alabama. Available from the EPC Web site: [URL to be inserted] Acknowledgments The authors wish to thank the members of National Council of State Directors of Community Colleges (NCSDCC) for their participation and encouragement, and to express our appreciation for the support of the Education Policy Center, College of Education, The University of Alabama; and for the support of the Department of Educational Leadership and Policy Analysis, Clemmer College of Education at East Tennessee State University. The authors also wish to thank James C. Palmer for his assistance with developing the original survey and for his assistance with previous administrations of the survey. Currently, Palmer is a professor of higher education at Illinois State University, editor of the annual Grapevine survey of state appropriations to higher education (since 1999), and editor of Community College Review. Formerly, Palmer was vice president for communications at AACC, assistant director of the ERIC Clearinghouse for Community Colleges at UCLA, and a past president of the Council for the Study of Community Colleges. He is co-editor of the monograph, Sustaining Financial Support for Community Colleges (2005). Finally, the authors wish to thank Catherine Sale, Graduate Assistant in the Department of Educational Leadership, Policy, and Technology Studies at the University of Alabama, for her assistance in various aspects of compiling this study. About the Authors Stephen G. Katsinas is director of the Education Policy Center at The University of Alabama. He has also held positions at Miami-Dade College, Oklahoma State University, the University of Toledo, and the Bill J. Priest Center for Community College Education at the University of North Texas as an endowed professor; he is a past president of AACC’s Council for the Study of Community Colleges. He has served on advisory committees for the Ford and W.K. Kellogg Foundations, has worked with the Rural Policy Research Institute, and authored more than 60 publications. Over the past twenty years, he has visited more than 350 community colleges in 36 states. His interests are state and federal policy and history, governance, finance, and access. Terrence A. Tollefson is a professor emeritus in the Department of Educational Leadership and Policy Analysis at East Tennessee State University, where he specializes in community college and higher education administration. At ETSU, he has served as the president of the faculty senate and acting chair of his department. His former positions also have included service as

page 3 of 43
faculty senate president and director of curriculum at Oakland Community College (MI); associate vice president for policy and planning at the North Carolina Department of Community Colleges; director of the Junior and Community College Division, National Laboratory for Higher Education; past president of the Council for the Study of Community Colleges; and state director of community colleges in New Jersey and Colorado. He has taught community college leadership at North Carolina State University, is a past editor of Community College Review, and is a former member of the board of the National Council of State Directors of Community Colleges. He has many publications to his credit, including serving as the lead author and editor of Fifty State Systems of Community Colleges: Mission, Governance, Funding and Accountability (1999), for which he is currently coordinating the revision for its fourth edition. Author Contact Information Stephen G. Katsinas Director and Professor, Education Policy Center The University of Alabama PO Box 870231 Tuscaloosa, AL 35487-0231 Tel: 205/348-2470 E-mail: [email protected]
Terrence A. Tollefson Professor Emeritus, Department of Educational Leadership and Policy Analysis East Tennessee State University PO Box 70550 Johnson City, TN 37614-0554 Tel: 423/439-7617 E-mail: [email protected]
10-28-08 draft, page 2 of 43
Foreword The National Council of State Directors of Community Colleges (NCSDCC) is pleased to support the publication of Funding Issues in U.S. Community Colleges: Findings From a 2008 Survey of the National State Directors of Community Colleges.
The structures of state-level coordination and governance are highly varied across the 50 states. Some have only separate statewide boards for community colleges, some have a single statewide board coordinating both two-year and four-year institutions, and, in some states, the same statewide board that coordinates elementary and secondary education also coordinates community colleges. In several states, a statewide board both coordinates and serves as the sole governing board for all its community colleges. Despite these differences in structure and governance, members of NCSDCC are well positioned to comment on issues of access and funding in their own sectors, other sectors of education, and in the state government. In approximately half of the states, some or all community colleges receive funding from local government sources. It is well known that no sector of American higher education serves more first-time, low income students than do the nation’s community colleges. At the state level, community college funding issues are never considered in a vacuum. Alone among education sectors, community college funding flows from both state appropriations and federally funded workforce training programs that are often matched by states and administered through non-education–related state cabinet agencies.
Readers should also be aware of a key difference that exists across the states: In 25 states, local appropriations (usually from ad valorem taxes) exceed 10%, and in 25 states they are lower than 10% and sometimes approach zero (see Appendix A). This report also provides insights as to how large states are delivering on the promise of access at a time when many states are seeing substantial growth in their high school graduation class sizes. The issues are important and many.
This year’s survey also includes two new sections: one on facilities and another on hot topics. By comparing similarities and differences across our diverse states, insights can be gleaned, and issues and concerns can be highlighted and analyzed. We are also making available a summary and powerpoint presentation of the 2008 results at the Education Policy Center Website [insert URL here].
I wish to thank the authors of this report, Stephen G. Katsinas and Terrence A. Tollefson, for their commitment to this important project. I would also like to thank members of the staff of the American Association of Community Colleges for their assistance: President and CEO George R. Boggs, Vice President for Government Relations David Baime, Senior Legislative Associate James Hermes, and Legislative Associate Laurie Quarles. Finally, I wish to thank the members of NCSDCC for their participation and interest in this project.
James O. Rose
Chair, NCSDCC, and Executive Director Wyoming Community College Commission

10-28-08 draft, page 3 of 43
Survey Background The past twelve months have seen great tumult in the financial world, beginning with mortgage foreclosures, and continuing with a severe credit crunch and dramatic worldwide reductions in the value of stocks. One result is a dramatically changed state revenue picture, prompting heightened concern about the immediate short- and long-term future and stability of state investments in higher education. Just what is going on out in the field in terms of access, funding, and overall support for community colleges? These are the questions that originally spurred the need for a formal survey of funding and access issues in U.S. community colleges. The survey was originally developed in 2003 by Stephen G. Katsinas, with the assistance of James C. Palmer and Terrence A. Tollefson, and was approved by the Institutional Review Board of the University of North Texas. Its first administration was conducted as a class project in 2003 and not formally published, the second in 2004. Prior to both initial administrations, the instrument was reviewed by an expert panel of representatives of the National Council of State Directors of Community Colleges (NCSDCC). The 2004 survey results are available from (http://education.ua.edu/edpolicycenter/documents/StateDirectorsSurvey2004.pdf), and the 2007 survey results are available from http://www2.aacc.nche.edu/pdfs/FundingIssues.pdf This report summarizes the perceptions gleaned from community college state directors (or their designees) during the fourth full administration of this survey. It is offered as a barometer of the current situation and future prospects for community college funding and access. Given the fact that community colleges serve larger numbers of low income, first-generation college students than any other sector of American higher education today, assessing perceptions related to finance and access of the individuals charged with coordination and oversight at the state level is important, particularly if the nation is to effectively deliver on the promise of postsecondary educational opportunities. Participants and Methodology
The 2008 survey was sent to 51 members of NCSDCC; see www.statedirectors.org/directors/ncsdcc.htm for an official list of members). As with previous administrations, state directors were surveyed because of their knowledge, experience, and perspectives regarding issues not only including the funding and access of community colleges, but also in the larger context of state policy in a dynamic, rapidly changing policy environment. In light of the 2.3 million new students at U.S. community colleges from 2000–2001 to 2005–2006 brought on by Tidal Wave II, the 2007 survey included a special section on facilities. (Beginning in 1994, experts including the late Clark Kerr predicted an inevitable enrollment surge in higher education, as the grandchildren of World War II veterans began to graduate from high school in increasing numbers (Hardy, Katsinas & Bush, 2007.) For 2008, with the national economy clearly weakening, a special section on tuition and student aid was included, because our FY2003 survey found all 49 states reporting higher tuition while more than half flat-funded or cut their state student aid programs. Would states fund student aid to help academically talented, low income students attend America’s community colleges during a recession? Data were collected from August to October of 2008. Responses were received from 49

10-28-08 draft, page 4 of 43
NCSDCC members (or their designees), representing all states except Alaska and New Hampshire. Puerto Rico, also an NCSDCC member, was not surveyed. Responses from Arizona, Nebraska, New Jersey, and New Mexico came from their state community college associations. Responses from Georgia came from the University System of Georgia (UGA), which coordinates community colleges, and the Technical College System of Georgia (TCS), which coordinates technical colleges. The tables in this report denote UGA as GA/UGA and TCS as GA/TGS.
State directors or their designees from all nine “megastates“ (i.e., California, Florida, Georgia, Illinois, New York, North Carolina, Ohio, Pennsylvania, and Texas) responded. We note that Michigan, which for decades ranked as a megastate, two years ago fell behind Georgia in state tax appropriations for higher education last year, and is no longer considered to be a megastate). In FY 2008, the nine megastates accounted for $39.7 billion of the total $77.5 billion, or 51.2% of state tax appropriations for higher education nationwide, enrolling about 52% of US community college students (Palmer, 2008a, see also http://www.grapevine.ilstu.edu/tables/pdf/Table6_08.pdf). New this year are three documents: First, a summary of the 2008 survey results; second, a Chronicle of Higher Education feature by Editor Jeffery Selingo on the 2008 survey summary; and third, a PowerPoint presentation visually documenting 2008 survey results. Caveats to Interpreting Survey Results Survey responses should be interpreted in light of the following: A majority of states (27) responded to the survey before the collapse of capital markets and
Wall Street investment houses precipitated the national economic crisis that occurred in October of 2008. It is likely, therefore, that the results presented here understate the fiscal challenges faced in those states, and therefore the nation as a whole. This is particularly true as the report relates to key drivers of the state budget process, and mid-year budget cuts next year.
State directors or their designees could choose whether or not to respond to individual survey
questions; thus, the number of responses received for different survey items varies, as the totals on the data tables show.
Most of the results presented are the respondents’ perceptions, not actual measures. Although it can be assumed that state directors of community colleges are most knowledgeable about issues related to their own education sector, their responses to most questions can be interpreted only as estimates.
Summary of Findings Section One: Community College Funding in the Year Just Concluded (FY2007-2008) 1. State funding for community colleges has weakened from the prior year.

10-28-08 draft, page 5 of 43
In FY 2006–2007, only 2 states reported mid-year budget cuts in their community college operating budgets, while 47 states did not. For the year just concluded (FY2007-2008), however, 9 states reported mid-year budget cuts for community colleges, including two of the largest, California and Florida. (Table 1). 2. State funding for all sectors of public education has weakened from last year. In FY2006-2007, no state made mid-year funding cuts for K-12 education, only two states cut community colleges, just one state cut a Historically Black College or University (HBCU), only three states cut their regional universities and only three states cut their flagship universities’ budgets. In the year just concluded, FY2007-2008, however, five states made mid-year cuts for K-12 education, nine states cut community colleges, three cut HBCUs, eight cut regional universities, and ten cut flagship universities. In terms of mid-year budget cuts occurring last year, little difference was observed when comparing megastates with smaller states, and when comparing community colleges with and without local support. It would appear that, in terms of being asked to return previously appropriated money back to the states to cover budget shortfalls, community colleges were treated about the same as their flagship and regional university counterparts, while fewer states reported mid-year cuts in elementary and secondary education. From this it can be inferred that if cuts are to occur next year, community colleges will likely have no favored position in comparison with other sectors of public higher education (Table 1). 3. Strong competition for scarce state tax dollars continues, and with significantly heightened concerns over recession, higher education’s position has slipped. In nearly every state, higher education is the largest discretionary item in the state budget. Competition is fierce for scarce state tax dollars, and higher education is often the last major expenditure item decided in the state budgeting process, with available state spending depending upon “what’s left” after other major items are considered (see Table 11, Items 1 and 2). Like last year, a substantial majority of respondents this year agreed or strongly agreed that increases in support for K–12 education (45 of 47) and Medicaid (43 of 47) were key drivers of budgetary decisions in their states. Ranked in a tie for third by state directors as a budget driver in their state budgeting process in FY2006-2007, Higher Education slipped to a tie for fifth in FY2007-2008. Recession, producing a decline in state revenue, jumped from the seventh ranked item last year (21 of 49) to third in FY2007-2008 (36 of 46), a clear indication of weakening economic conditions (see also Table 2). 4. The impact of increasing state investments in Medicaid and K-12 education, and the decline in state revenue with recession, has heightened concerns for the near future. Twenty-nine states (or 60%), including most large states, reported a structural deficit in their state’s budget process, compared to thirteen states (or 27%) indicating “no,” and six states (13%) indicating “not sure.” Many states with fast-growing Tidal Wave II community college enrollment increases (U.S. community college enrollments spiked by 30% nationwide in just five years between 2000-2001 and 2005-2006) reported both structural deficits in their respective state budgeting processes (see Table 9), as well as “recession, producing a decline in revenue.”(See Table 2). Seven megastates strongly agreed that recession, producing a decline in state revenue, was a key driver of budgetary decisions, while one megastate disagreed. Four megastates strongly agreed, and three agreed, that Medicaid was a key budget driver. (See Table

10-28-08 draft, page 6 of 43
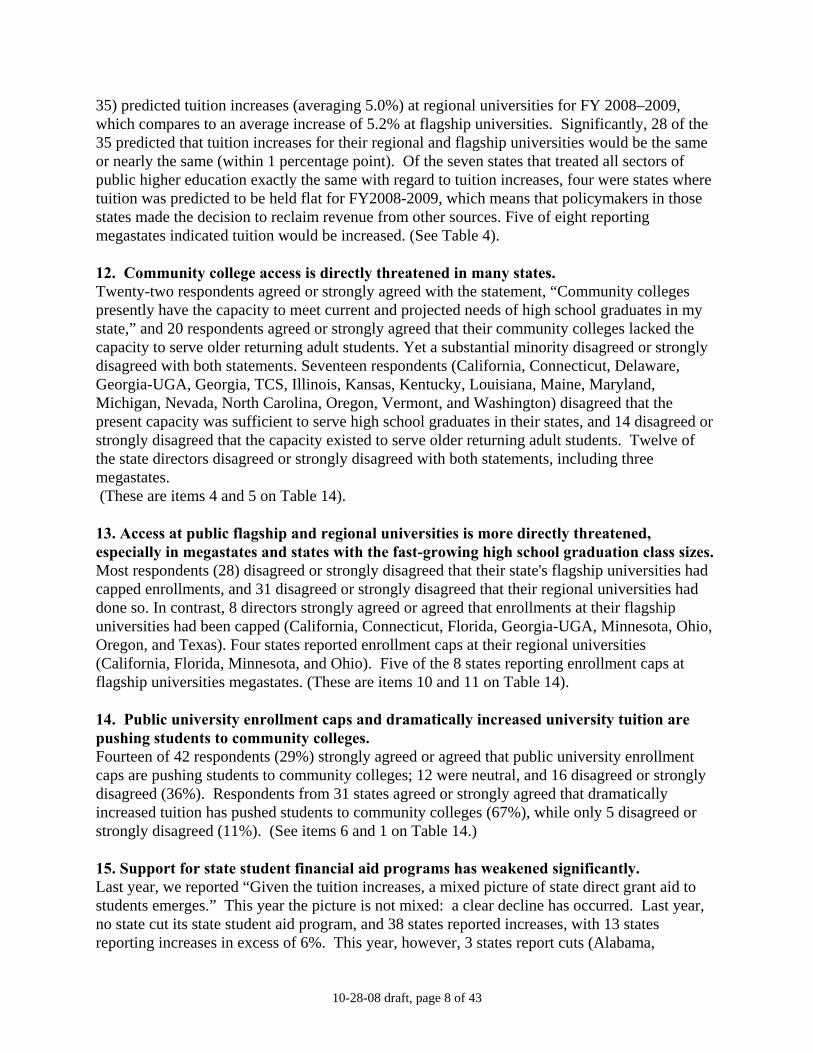
2). As noted above, the survey was administered before intervention by the federal government in the financial markets in September 2008. 5. The majority of states that have community college funding formulas did not receive full funding for FY 2007–2008; fewer were fully funded than in the year before. Respondents from 21 reporting states indicated that they did not have funding formulas. Of the 28 reporting states with funding formulas, just 10 (or 36%) indicated their formulas were fully funded, while a clear majority, 18 (or 64%), indicated that their formulas were not fully funded. This compared to FY 2006-2007, when 14 reporting states (or 41%) indicated their formulas were fully funded, and 20 (or 59%) indicated they were not fully funded. Among the seven reporting megastates, three reported the funding formulas for their community colleges were fully funded, while four did not (Georgia’s responses were split) (See Table 3). Section Two: Future Funding Prospects 6. Total state operating budget support for postsecondary education initially increased from FY 2007-2008 to FY 2008–2009, but that increase was well below the inflation rate. Since the collapse of the U.S. financial markets, however, many states have recalled substantial sums from community colleges and other postsecondary institutions. Last year (FY 2006-2007 to 2007-2008), while all 45 respondents predicted increases in state operating budget support for community colleges from FY2006-2007 to FY 2007–2008, with an average predicted increase of 8.3%, 18 states predicted increases equal to or less than the 3.4% Higher Education Price Index (HEPI) inflation measure for FY2007. This year, when predicting increases in state operating budget support from the current year to next (FY 2007-2008 to FY 2008-2009), 45 respondents indicated an average increase of 3.1%. A majority of states, 23, predicted increases below the forecast HEPI of 3.6% for FY2008. Three states predicted flat operating budget support (Massachusetts, West Virginia, and Wisconsin), and eight states predict cuts (Florida, Illinois, Kentucky, Minnesota, New Jersey, Rhode Island, South Carolina, and Virginia). Combined with the large growth in high school graduates, the reported failure of 18 of 28 states to fully fund their community college funding formulas, and the perception that rural, suburban, and urban community colleges in many states face fiscal strain, it is very clear that the funding picture has weakened. (See Table 5; see also Tables 3 and 8.) 7. Community college operating support lags behind other education sectors. Last year (FY 2006-2007 to FY 2007-2008), the median of 6.7% in predicted state operating increases for community colleges compared with the rates of 8.2% for K-12 education; 7.5% for HBCUs; 5.5% for regional universities, and 4.0% for flagship universities. Thus, community colleges fared better than regional universities and less well than K-12 education and HBCUs. When asked to predict state operating budget support by sector for next year (FY2007-2008 to FY2008-2009), however, the median predicted increase in state operating support for community colleges was 4.5% (with 45 states reporting). This compared to 4.9% for K-12 education (with 23 states reporting), 4.0% for regional universities (33 states reporting) and flagship universities (31 states reporting), and HBCUs at 2.9% (12 states reporting). The 23 states with local funding of community colleges predict an average increase of 3.6% in their state operating budget support, exactly matching the predicted HEPI inflation measure for FY 2008, while the average

10-28-08 draft, page 7 of 43
predicted increase for the 23 states without locally funded community colleges was 3.1%, well below the HEPI inflation measure. When asked to respond to the item “Community college student services will likely be cut in FY2008-2009,” a significant minority of 13 strongly agreed or agreed (28%), while 10 were neutral, and 19 disagreed or strongly disagreed (See Table 5 and also item 8 on Table 14.) 8. Very real concerns about mid-year reductions in operating budget support exist. When asked to predict the likelihood that mid-year budget cuts might occur in the 2008-2009 fiscal year in their states, 22 predicted the likelihood as “Very high” or “High”, while 10 were neutral, and 21 responded “Low” or “Very Low.” Four megastates reported “Very High,” and 1 “High”, while 1 indicated “Neutral,” and 1 indicated “Low.” States that produce and export energy and/or natural resources states tended to report “Low” or “Very Low.” (See Table 8). Over half of the respondents who indicated “Very High” or “High” likelihood of mid-year budget cuts next year responded after US Treasury Secretary Henry Paulson indicated that the federal government of the United States would intervene in the financial markets to bring stability. Of the 22 responses that indicated the likelihood of mid-year budget cuts in FY2008-2009 was “Very High” or “High,” 19 indicated on Table 2 (above) that Medicaid was a key budget driver in their state’s budgeting process (10 “Strongly Agreed” and 9 “Agreed”). 9. Tuition increases remain a predominant method by which states deal with scarce resources for community colleges specifically and public higher education generally. Respondents predicted tuition increases from FY 2007–2008 to FY 2008–2009 in each postsecondary sector--community colleges, HBCUs, regional universities, and flagship universities (with median increases of 5.0%, 6.6%, 6.6%, and 6.0%, respectively). Interestingly, within the several sectors of public education, only community colleges saw larger predicted tuition increases for next year than last year; perhaps it is possible that an election year may serve to moderate such increases. (See Table 4). It is important to note that the 5.0% rate of predicted tuition increase for community colleges is still over a full percentage point above the Higher Education Price Index inflation measurement. 10. States with community colleges that do not receive substantial local financial support will see higher rates of tuition increases. This year, for the first time, tuition increases were calculated for states with and without local financial support for their community colleges. Of the 20 states responding that provide local support for their community colleges exceeding 10% of total revenues, the average predicted tuition increase was 3.7%. This compares to a much higher rate of 6.3% for the 22 states where local support for community colleges does not exceed 10% of total revenue. Interestingly, during the FY2003 recession, state operating budget support was cut at greater rates for those states with local support, while tuition rose at higher rates for those states that did not have local funding. It is possible that this pattern could repeat itself should the nation fall deeper into recession. 11. Many states are increasing tuition at the same or similar rates across all postsecondary sectors (community colleges, HBCUs, regional universities, and flagship universities). Of particular interest to policymakers concerned with increasing baccalaureate degree success by fostering community college transfer is tuition at regional universities. Most respondents (31 of
10-28-08 draft, page 8 of 43
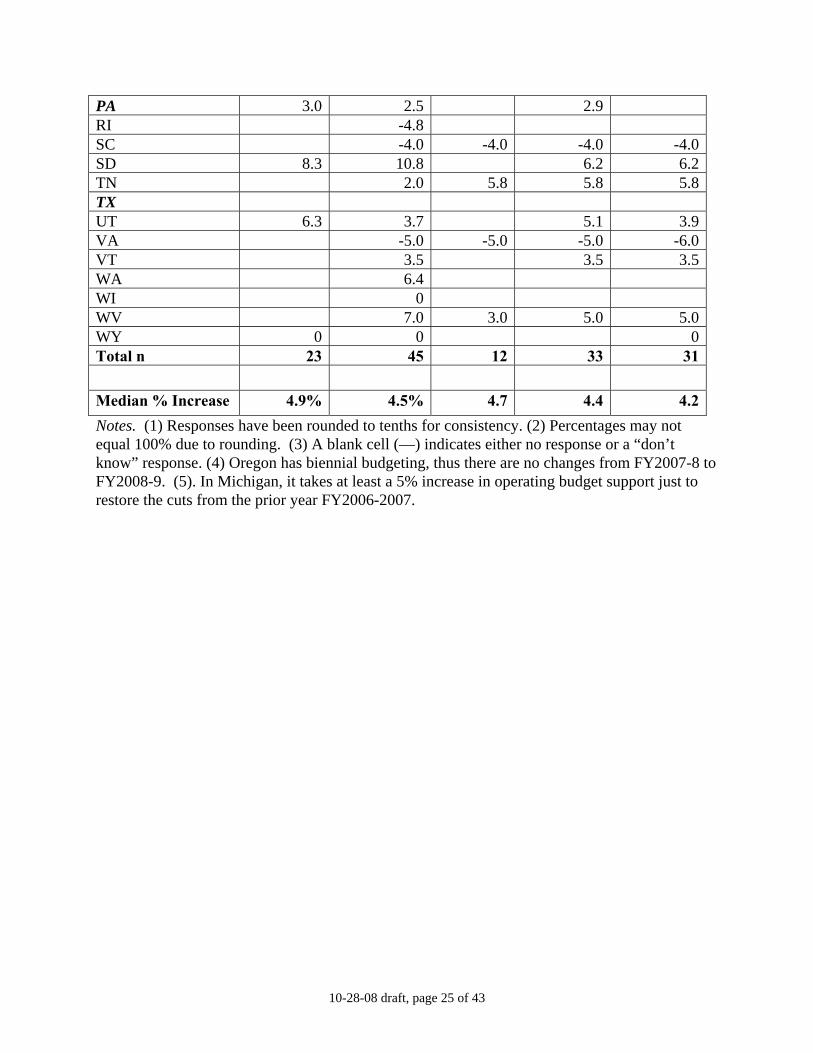
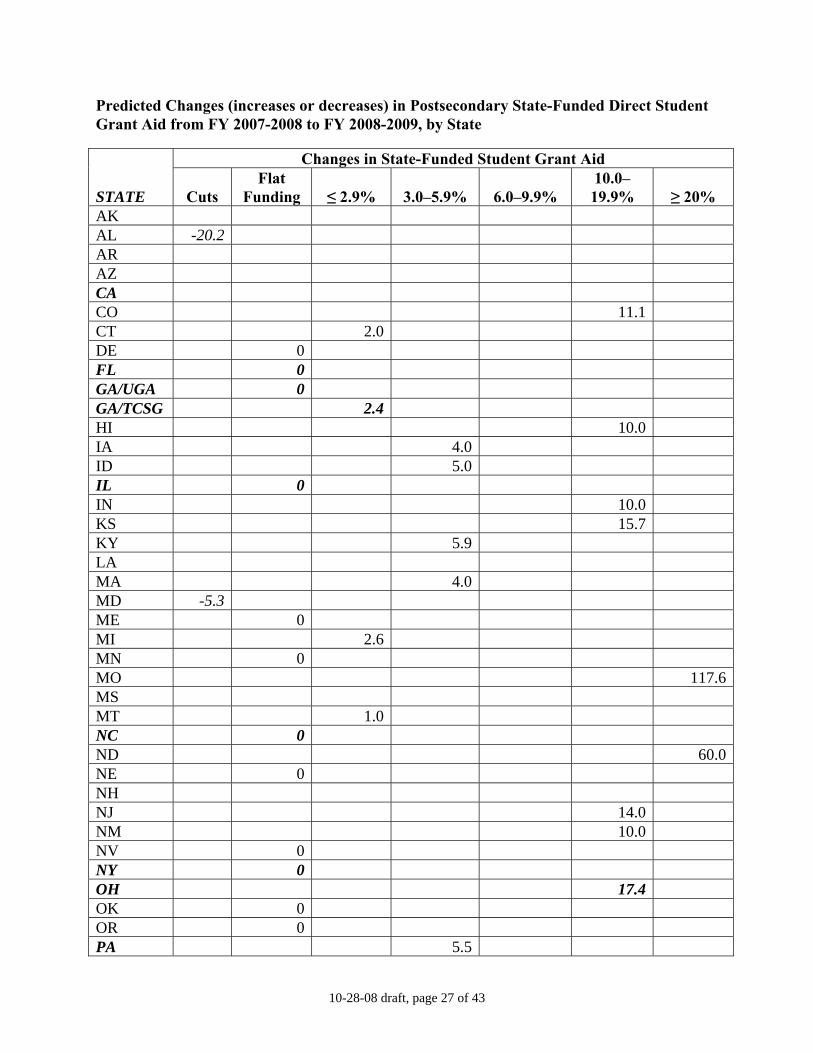
35) predicted tuition increases (averaging 5.0%) at regional universities for FY 2008–2009, which compares to an average increase of 5.2% at flagship universities. Significantly, 28 of the 35 predicted that tuition increases for their regional and flagship universities would be the same or nearly the same (within 1 percentage point). Of the seven states that treated all sectors of public higher education exactly the same with regard to tuition increases, four were states where tuition was predicted to be held flat for FY2008-2009, which means that policymakers in those states made the decision to reclaim revenue from other sources. Five of eight reporting megastates indicated tuition would be increased. (See Table 4). 12. Community college access is directly threatened in many states. Twenty-two respondents agreed or strongly agreed with the statement, “Community colleges presently have the capacity to meet current and projected needs of high school graduates in my state,” and 20 respondents agreed or strongly agreed that their community colleges lacked the capacity to serve older returning adult students. Yet a substantial minority disagreed or strongly disagreed with both statements. Seventeen respondents (California, Connecticut, Delaware, Georgia-UGA, Georgia, TCS, Illinois, Kansas, Kentucky, Louisiana, Maine, Maryland, Michigan, Nevada, North Carolina, Oregon, Vermont, and Washington) disagreed that the present capacity was sufficient to serve high school graduates in their states, and 14 disagreed or strongly disagreed that the capacity existed to serve older returning adult students. Twelve of the state directors disagreed or strongly disagreed with both statements, including three megastates. (These are items 4 and 5 on Table 14). 13. Access at public flagship and regional universities is more directly threatened, especially in megastates and states with the fast-growing high school graduation class sizes. Most respondents (28) disagreed or strongly disagreed that their state's flagship universities had capped enrollments, and 31 disagreed or strongly disagreed that their regional universities had done so. In contrast, 8 directors strongly agreed or agreed that enrollments at their flagship universities had been capped (California, Connecticut, Florida, Georgia-UGA, Minnesota, Ohio, Oregon, and Texas). Four states reported enrollment caps at their regional universities (California, Florida, Minnesota, and Ohio). Five of the 8 states reporting enrollment caps at flagship universities megastates. (These are items 10 and 11 on Table 14). 14. Public university enrollment caps and dramatically increased university tuition are pushing students to community colleges. Fourteen of 42 respondents (29%) strongly agreed or agreed that public university enrollment caps are pushing students to community colleges; 12 were neutral, and 16 disagreed or strongly disagreed (36%). Respondents from 31 states agreed or strongly agreed that dramatically increased tuition has pushed students to community colleges (67%), while only 5 disagreed or strongly disagreed (11%). (See items 6 and 1 on Table 14.) 15. Support for state student financial aid programs has weakened significantly. Last year, we reported “Given the tuition increases, a mixed picture of state direct grant aid to students emerges.” This year the picture is not mixed: a clear decline has occurred. Last year, no state cut its state student aid program, and 38 states reported increases, with 13 states reporting increases in excess of 6%. This year, however, 3 states report cuts (Alabama,

10-28-08 draft, page 9 of 43
Maryland, and South Carolina), 13 states reported flat-funding, and 7 states reported increases of less than 3%. Put differently, 10 states last year predicted increases of less than 3%, while this year, 23 do so (see Table 6). 16. The majority of states will raise their state student direct grant aid programs below the inflation rate (according to the Higher Education Price Index). While 27 of 41 states reported increases in direct grant student aid across all sectors of postsecondary education, with an average increase of 7.9%, there were significant outliers. Three states—Missouri, North Dakota, and Utah--saw increases of 117% , 60% , and 41%, respectively. The increase for the remaining 38 states was just 2.8%. (See Table 6). 17. All community colleges face great budgetary strains, with rural community colleges facing the greatest strain. Thirty-one respondents agreed or strongly agreed (69%) that rural community colleges would face the greatest financial strain, compared to 30 respondents a year ago. Significantly, 22 respondents or 54% agreed or strongly agreed that suburban community colleges would face the greatest fiscal strain, compared to just 14 a year ago, and 46% reported their urban community colleges would face the greatest strain. A number of respondents indicated that rural community colleges in the 25 states with local funding lacked access to a good stream of local support, a problem likely made worse in the 18 states that failed to fully fund their community college funding formulas. (See Tables 10 and 3.) 18. Most community college functions remain stable; however significant weakening from last year can be seen, particularly for vocational, technical, and occupational education. Respondents were asked whether each of six functions of community colleges would be strengthened, stay the same, or weakened next year. Last year, the picture that emerged was general stability with some positive change. This year, however, while the functions remain stable, significant weakening can be seen in vocational, occupational, and technical education, and more states indicate weakening of all functions. Large majorities predicted that four of the six functions would stay the same in FY 2008–2009: Noncredit courses and community services, noncredit federally supported workforce training, developmental education, and fine arts and cultural arts. A smaller majority (26 or 55%) predicted the general education and transfer function would remain stable compared to last year. A majority (24) predict vocational, occupational, technical education will remain stable, compared to 31 predicting strengthening last year. In each of the six key community college education functions, more states predict weakening than last year. Given the reality that many of the most expensive programs at community colleges are contained in the vocational/occupational/technical education function, if state operating budgets are cut as predicted, it may be difficult for community colleges to change their program mix to help the nation’s workforce retool as America from recession (See Table 7.) Section Three: Special Section on Budgeting, Student Aid, Tuition Policies and Hot Topics Some higher education leaders argue for close coordination of state policies for appropriations for public higher education operating budgets, tuition, and student financial aid. Some call this

10-28-08 draft, page 10 of 43
the “high tuition/high aid” model of state policy. Others disagree, arguing such policies promote state investments in merit-based student aid, as opposed to need-based student aid and low tuition. As per the suggestion of NCSDCC members, this year’s survey assesses what is happening across state lines as it relates to state budgeting, student aid and tuition policy, an issue made all the more timely in light of dramatically expanding community college enrollments (up by 2.2 million or 30% in five years from 2000-2001 to 2005-2006) and the rapidly weakening national economy. Community colleges stand at the crossroads of access; can their budgets withstand severe cuts as occurred in FY2003 and maintain the open door, and if so, what mix of state budgeting, student aid, and tuition policies in a time of fierce competition for scarce state tax dollars will help bring this about? Budgeting processes 19. Public higher education funding depends upon “what’s left” in the budget process. When asked “Does the amount of available state funding depend upon “what’s left” after other major items have been considered in your state’s budgeting process?”, 22 responded yes (47%), 20 no (43%), and 5 not sure (10%) not sure. When asked “Is the funding for public higher education operating budgets always/nearly always the last major item considered in your state’s budget process?’, 19 said yes (40%), 24 no (50%), and 5 not sure (10%). Nine 9 directors responded yes (20%) to the item, “In general, state legislatures ‘look the other way’ while colleges raise tuition, while 30 responded no (77%), and 1 indicated not sure (2%). (See Table 11, items 1, 2, and 11). 20. Funding public higher education operating budgets is a higher state priority than funding state student financial aid programs, including both need- and merit based. Respondents were asked if funding need-based and merit based student financial aid was a higher state policy priority than the community college operating budgets in their states. Regarding need-based student aid, 10 directors responded yes (22%), 27 no (60%), and 8 were not sure (18%); while regarding merit-based student aid, 9 directors responded yes (20%), 35 no (76%), and 2 responded “not sure” (4%). Respondents were also asked if funding merit-based student aid receives a higher priority than (See Table 11, items 4 and 5). 21. Most states allow the use of state appropriations for institutionally based student aid. When asked “Do state law and/or state regulations allow colleges and universities to use state appropriations for institutionally-based student aid?”, 28 responded yes (61%), 12 no (26%), and 6 were not sure (13%). (See Table 11, item 10.) Student financial aid 22. Investments in state need-based student aid to help low income students access community colleges are not keeping pace with tuition increases. When asked if tuition increases had far outstripped increases in state support for need-based student financial aid since 2000, 28 respondents (60%) said yes, 13 (28%) said no, and 5 indicated “not sure” (12%). Of the 46 responses to the statement “In the most recently approved budget, state investment in need-based student aid did not keep pace with tuition increases,” 11 or 24% said “yes,” while 33 (72%) said “no,” and 2 (4%) “not sure.” Additionally, when asked to respond if “Merit-based state student financial aid receives a higher policy priority than need-based student financial aid”, a majority of 27 responded no (64%), and 4 were not sure (10%),

10-28-08 draft, page 11 of 43
while a significant minority of 11 states responded yes (26%). (See Items 6, 9, and 15, Table 11). 23. Investments in state student aid (need- or merit-based) are not sufficient to allow low income community college students to work their way through college without debt. Excepting California, the nation has clearly moved away from the goal of low or no tuition as advocated by the 1970s era Carnegie Council on Policy Studies in Higher Education. When asked, “Has the percentage of students graduating from community colleges with significant loan debt increased in recent years?”, 21 (49%) responded yes and 5 (12%) no, with 17 responding not sure (40%). Only 13 of 44 responding states knew if increasingly larger percentages of students graduating with baccalaureate degrees in their states were leaving due to increased loan debt, while 31 (70%) were not sure; of those responding, 5 (11%) said yes and 8 (18%) said no. When asked “Is your state’s need-based student aid program funded well enough so that low income students can work their way through college without debt?”, 4 responded yes (9%) and a resounding 36 (77%) said no, with 6 not sure (17%). When asked “Is your state’s merit-based student aid program funded well enough so that low income students can work their way through college without debt?”, only 1 responded yes (2%), while 34 said no (76%), and 10 not sure (22%). (See items 25, 26, 7, and 8 in Table 11). 24. Conditions for successful “high tuition/high aid” policy do not exist in most states. Central to a successful high tuition/high aid policy is the close coordination of state policies regarding appropriations for operating budgets, tuition, and student financial aid. Yet when asked “Are appropriations (operating budgets), tuition, and state student financial aid (merit and/or need-based) closely aligned in your state?” by a margin of nearly four to one, with 9 responding yes (17%) and 35 no (73%), state directors answer no. Just two directors (4%) were not sure. 25. Tuition increases are not tied to increases in state student aid programs in most states When asked if tuition was increased with corresponding increases in need-based state-funded student financial aid programs, 8 responded yes (18%), 30 no (68%) and 6 not sure (14%). And when asked if tuition was increased with corresponding increases in merit-based state-funded student financial aid programs, 4 responded yes (9%), 34 no (79%) and 5 not sure (12%). (Items 3, 12, and 13 in Table 11.) 26. Most states believe they reach most financially needy students, but concerns remain. When asked “Does your state do a good job of reaching financially needy students with information about state and federal student financial aid programs?”, 25 states responded yes (57%), 12 no (27%), and 7 not sure (16%). When asked if their state office participates in College Goal Sunday, an important program that promotes high school seniors to fill out Federal Application for Student Financial Assistance (FASFA) forms to obtain need-based direct grant student aid, 18 directors responded yes (41%), 12 no (27%), and 14 not sure (32%). 27. Most high school seniors receive no state student aid for scoring well on exit exams. When asked “Do high school students in your state receive scholarship aid for scoring well on state-required high school proficiency or exit tests?”, only 5 responded yes (11%), while a clear majority of 37 responded no (82%), and only 3 not sure (7%). It is possible functional ties for

10-28-08 draft, page 12 of 43
students for a key outcome from high school, scoring well on exit examinations, may not exist. 28. State policymakers believe access is threatened by higher gas prices. A majority of state directors (23 or 54%) strongly agreed or agreed with the statement, “Higher gas prices will force restructuring of the ‘way we do business’ in higher education,” while 17 (37% were neutral, and only 4 (9%) disagreed. A majority (23 or 52%) strongly agrees or agrees that online learning can make up for an enrollment decline that may occur due to higher gas prices, while 7 disagree or strongly disagree (17%). Sixteen directors (37%) responded strongly agree or agree to the statement “I am concerned that part-time enrollments at community colleges in my state may fall due to higher gas prices,” while 16 (37%) were neutral, and 11 (26%) disagreed. (See Table 14, items 3 and 7). 29. Federal help is needed to help community college students address high gas prices. When asked “Given higher gas prices, should federal direct grant aid (Pell and SEOG) programs make daily commuting transportation an allowable expense?” 31 (72%) responded yes, 1 (2%) responded no, and 11 (26%) responded not sure. When asked “Given higher gas prices, do you believe federal laws governing direct grant aid (Pell and SEOG) should make the purchase of internet services for use at home to take classes an allowable expense?”, 26 (60%) responded yes, 6 (14%) responded no, and 11 (26%) responded not sure. When asked “Would an income tax deduction for travel to obtain postsecondary education help students in your state cope with higher gas prices?”, 21 (47%) responded yes, 11 (24%) no, and 13 (29%) not sure. Most states have not encouraged their institutions to study the impact of higher gas prices on access for commuting students (36 states or 80%), and 21 indicated they would participate in a study of the impact of higher gas prices if asked (47%). (See Table 14, item 2, and Table 11, items 20-24.) 30. Most community colleges participate in federal student loan programs, but most states are not encouraging their community colleges to sign up for federal direct student loans. When asked “Do all of the community colleges in your state participate in federal student loan programs?”, 33 (79%) responded yes, 10 (23%) no, and 1 (2%) not sure. When asked “Is your state encouraging community colleges to sign up for federal direct loans, as economic conditions prompt more private lenders to cut back their student-loan operations?”, 10 (22%) responded yes, 23 (51%) no, and 12 (27%) not sure (see Table 11, items 26 and 27). 31. Proprietary institutions are not encroaching on state student aid in most states. Nine respondents (23%) said yes, proprietary institutions encroaching on state student aid, while 24 said no (60%), and 7 were not sure (18%). (See item 16, Table 11.) 32. While there is high variance in the types of existing state student aid programs, need-based and merit-based direct grants to students are most common. Respondents were asked what types of student financial aid programs existed in their state (See Table 12). A total of 39 states responded that they had need-based state direct grants, 34 merit-based state grants, 18 need-based state direct supplemental grants, 15 states each had scholarships for two year nursing students, K-12 teacher preparation, and K-12 math and science teacher preparation, while 14 had state funded student loan programs, 9 had scholarships for two year allied health students, and 3 states had scholarships for community college teaching.

10-28-08 draft, page 13 of 43
33. The procedures by which tuition is increased is different across the states, but in most it is set through formal actions of either local governing or state governing boards. A high level of differentiation across the states in terms of how tuition policy is set. Within the community college sector, tuition is formally set by the legislature in 2 states, by local boards in 21 states, by state governing boards in 17 states, and has been deregulated in 2 additional states. In 6 states, the percentage increases for community college tuition are assumed by the state budget, but local boards enact the increases, while the legislature sets the maximum percentages by which institutions can raise tuition in 8 states. In 3 states, tuition increases enacted on an ad-hoc basis by legislatures create a de facto high tuition policy. (See Table 13.) 34. Major restructuring of community college governance and coordination is not likely to occur in most states, but the environment is fluid. Nine respondents agreed or strongly agreed that significant restructuring of the governance or coordination of community colleges and higher education may soon occur, while 22 disagreed or strongly disagreed. This suggests relative stability, although it is worth noting, however, that significant restructuring has already occurred in some states over the past decade. When asked if legislation allowing community colleges to deliver four year degrees may soon pass in their states, 3 (8%) responded strongly agree, 4 (8%) neutral, and 30 (83%) strongly disagreed or disagreed (See Table 14, items 9 and 12). Conclusions As the nation heads into deep recession, the financing of access by the states for community college students has significantly weakened. More states took budget cuts in the year just concluding than the year before, and most states predict mid-year budget cuts in the year ahead. Operating budget support has not kept pace with the surging enrollments that have increased by 2.2 million students in 5 years alone from 2000–2001 to 2005–2006. Tuition is rising at rates double the Higher Education Price Index inflation rate in many states, while increases in state funding for student aid remains well below the 3.6% Higher Education Price Index of inflation. Again, as last year, state directors predict that rural community colleges—the sector of the community college world that has experienced the largest increases in enrollment-over one million students from 2000-2001 to 2005-2006 (Hardy et al., 2007)--will see the greatest financial strain. The dramatic growth in the percentages of suburban community colleges facing fiscal strain may reflect the mortgage foreclosure crisis gripping many suburban communities across America. Thus, current signs of recession are troubling, especially in light of the severity of the FY 2003 recession when, in the first year of the administration of these state directors’ surveys, 34 states took mid-year budget cuts (http://education.ua.edu/edpolicycenter/documents/StateDirectorsSurvey2004.pdf). Since 1996, community colleges have been specifically mentioned by name in nearly every State of the Union presidential address, usually in friendly, if not glowing terms. As was noted in the conclusion of a 2005 review of the long-term funding of community colleges since the Vietnam War,
Sadly…attention does not translate into hard dollars to finance preservation—

10-28-08 draft, page 14 of 43
much less expansion—of the open door college. For those who see community colleges as critical portals to the baccalaureate, and who are concerned with access to an education that can prepare and retain workers for jobs in the knowledge economy, the current situation is troubling. Structural state budget deficits caused by skyrocketing increases in health care, corrections, and K–12 expenditures threaten community college operating budgets, as do the anti-tax and private benefits movements. (Katsinas, 2005, p. 29)
Now, as the nation lurches toward probable recession, a review of responses of state directors regarding the impact of the 2003 recession does not bode well for the immediate short term. That so many states use higher education tuition increases to ameliorate short-term state budget revenue shortfalls may mean that a round of dramatic tuition increases at rates three to five times above the inflation rate may soon occur. Sadly, our earlier surveys also revealed that during the FY2003 recession and immediately thereafter, states did not increase their investments in their state-funded direct grant aid programs to offset the previously enacted tuition increases. In Minnesota, for example, tuition averages over $4,500 at community colleges; in Texas tuition has more than doubled since 2000 to about $3,000 for a full-time student (Katsinas, 2007). It is very clear that the high tuition/high aid model of student financial aid does not work well, if at all, for low income students attending community colleges. State directors as a group are responsible as no others are in their states to coordinate the very institutions that provide postsecondary access to large numbers of first-time full-time students. That by a margin of nearly 4 to 1, they report that state policies for operating budget appropriations, tuition, and student aid (need- and merit-based) are not closely aligned in their states speaks to the failure of the high tuition/high aid model. Directors were nearly unanimous in reporting that students could not work their way through community colleges without incurring debt. It is likely that linkages between state appropriations, state tuition policy, and state student aid funding policy are being overwhelmed by the dire need for revenue to avoid state budget revenue shortfalls to address burgeoning K-12 enrollments and skyrocketing Medicaid cost increases (which have been growing due to the expensive Part D prescription drug program passed by Congress earlier this decade). The high tuition/high aid model is cracking at the precise time community college access for low income students is being threatened by higher gas prices. Federal assistance through changes in the regulations for Pell Grants and SEOG, to make commuting and the purchase of internet providers an allowable expense for need-based student aid would help. A change in the federal tax code to allow tax deductions for commuting expenses, an idea proposed by community college expert Robert Pedersen, would help even more. Finally, as the Congress considers legislation to provide economic stimulus, dramatically increasing the federal match for the state portion of the Medicaid to prevent a significant spending contraction at the state level would surely produce an immediate, positive impact on community college access and finance, in light of recent experience in the states, as public higher education typically receives “what’s left on the table” in terms of operating budget support, and the failure of state funded student aid to keep pace with fast-rising tuition increases.

10-28-08 draft, page 15 of 43
References Bureau of Labor Statistics. (2008, September). News. Retrieved from
www.bls.gov/news.release/pdf/cpi.pdf on October 23, 2008. Hardy, D. E., Katsinas, S. G., & Bush, V. B. (2007, Winter). Tidal Wave II, community colleges,
and student financial aid. Enrollment Management Journal, 1(1), 23–48. Katsinas, S. G. (2005, Winter). Increased competition for scarce state dollars. New Directions for
Community Colleges, Issue No. 32, pp. 19–32. Katsinas, S. G. (2007, October 27). Rural community colleges are the land grant institutions of
this century. Chronicle of Higher Education, pp. B26–B29. Katsinas, S.G.; Palmer, J.C.; and Tollefson, T.A. (2004). State funding for community colleges:
Perceptions from the field. A survey of the members of the National Council of State Directors of Community Colleges. Retrieved April 28, 2008, from http://education.ua.edu/edpolicycenter/documents/StateDirectorsSurvey2004.pdf
Palmer, J. C. (Editor). (2008a). Distribution of states, by size of state tax appropriation for higher education, FY08 (Table 6). Retrieved April 16, 2008, from www.grapevine.ilstu.edu/tables/pdf/Table6_08.pdf
Palmer, J. C. (Editor). (2008b). One-year and two-year percent changes in state tax appropriations for state-aided community colleges (Table 10). Retrieved April 16, 2008, from www.grapevine.ilstu.edu/tables/pdf/table10_07.pdf
Paulson, Henry. September 19, 2008. US Secretary of the Treasury Henry Paulson announced major federal intervention in the nation’s money markets (see http://www.ustreas.gov/press/releases/hp1148.htm, accessed October 13, 2008).

10-28-08 draft, page 16 of 43
Table 1 Mid-Year Budget Cuts, by Public Education Sector and State: FY 2007–2008
State
Public Education Sector
K-12 n=44
Community Colleges
n=48 HBCUs
n=18
Regional Universitie
s n=44
Flagship Universitie
s n=46
Cuts
No Cuts
Cuts
No Cuts
Cuts
No Cuts
Cuts
No Cuts
Cuts
No Cuts
AK AL X X X X X AR X X X X X AZ X X --- --- --- --- X CA X X --- --- X X CO X X --- --- X X CT X X --- --- X X DE X X X X X FL X X --- --- X X GA/UGA X X X X X GA/TCSG X X X X X HI X IA X X --- X X ID X X --- X X IL X X --- --- X X IN X X --- X X KS X X --- X X KY X X X X X LA X X X X X MA X X --- X X MD X X X X X ME X X --- X X MI X X --- --- X X MN X X --- --- X X MO X X X X X MS X X X X X MT X X --- X X NC X X X X X ND X X --- --- X X NE X X --- X X NH NJ X X --- --- X X NM X X --- X X NV X X --- --- X X NY X X --- X X

10-28-08 draft, page 17 of 43
OH --- --- X X X X OK X X X X X OR X X X X PA RI --- --- X --- --- --- --- X SC X X X X X SD X X --- X X TN X X X X X TX X X X X X UT X X --- --- X X VA --- --- X X X X VT X X --- --- X X WA X X --- --- X X WI X X --- --- X X WV X X X X X WY X X --- --- --- --- X Total n 5 39 9 39 3 15 8 36 10 36 Total % 11% 89% 19% 81% 17% 83% 18% 82% 22% 78% Notes: (1) percentages may not equal 100% due to rounding. (2) A blank cell (—) indicates either no response or a “don’t know” response. (3) the column “Responses received after September 18” is indicated, because on September 19, 2008, US Secretary of the Treasury Henry Paulson announced major federal intervention in the nation’s money markets (see http://www.ustreas.gov/press/releases/hp1148.htm, accessed October 13, 2008). Table 1a Mid-Year Budget Cuts, by Public Education Sector: Year Just Concluded (FY 2007–2008) and Prior Year (FY 2006-2007)
Public Education Sector
K-12 Community
Colleges HBCUs Regional
UniversitiesFlagship
Universities
Cuts No
Cuts
Cuts No
Cuts
CutsNo
Cuts
CutsNo
Cuts
Cuts No
Cuts FY 2006-7 0 45 2 47 1 18 3 44 3 44
% 0 100% 4% 96 5% 95% 7% 94% 7% 94% FY2007-8 5 39 9 39 3 15 8 36 10 36
% 11% 89% 19% 81% 17% 83% 18% 82% 22% 78%
CHANGE +5 -6 +7 -8 +2 -3 +5 -8 +7 -8

10-28-08 draft, page 18 of 43
Table 1b Mid-Year Budget Cuts in Megastates, by Public Education Sector: FY 2007–2008
MEGASTATES, Public Education Sector
K-12 Community
Colleges HBCUs Regional
Universities Flagship
Universities
Cuts No
Cuts
CutsNo
Cuts
Cuts No
Cuts
Cuts No
Cuts
Cuts No
CutsFY 2006-2007 0 45 2 47 1 18 3 44 3 44 FY2007-2008 5 39 9 39 3 15 8 36 10 36
CHANGE +5 -6 +7 -8 +2 -3 +5 -8 +7 -8 Table 1c Mid-Year Budget Cuts in States with and without Local Support for Community Colleges, by Public Education Sector and State: FY 2007–2008
LOCAL compared to NON LOCAL by Sector of Public Education
K-12 Community
Colleges HBCUs
Regional Universitie
s
Flagship Universitie
s
Cuts No
Cuts
CutsNo
Cuts
CutsNo
Cuts
Cuts No
Cuts
CutsNo
CutsLOCALLY funded n 3 19 3 21 1 15 3 19 4 20
% 7% 41% 7% 46% 2% 33% 7% 41% 9% 43%
NON-LOCALLY FUNDED n
2 19 6 18 2 11 5 17 6 17
% 4% 41% % % 4% 24% 11% 37% 13% 37%

10-28-08 draft, page 19 of 43
Table 2 Key Drivers of State Budget Decisions, Year Just Concluded (FY 2007-2008)
State
Key Drivers of State Budget Decisions, FY 2007-2008
Medicaid n=47
Corrections n=47
K-12 n=47
Higher Education
n=46
Recession, producing decline in revenue
n=46
Unemployment Insurance
n=47
Tax Reductions
n=47
Transportation n=47
AK AL D A SA A A D N D AR A D SA D N SD A D AZ SA SA SA SA SA A SA SA CA N A A SA SA N A A CO SA A SA D A D N A CT A SA A D SA N A N DE SA SA SA A SA A N A FL SA A SA A SA N SA A GA/UGA A N A A SA SD SA N GA/TCSG A N A N SA N SA N HI A A A A A A A A IA D D SA SA N N D A ID A A A A A D D A IL SA D A A SA D A D IN SA N SA A SA D SA N KS SA N SA SD A SD N N KY SA SA SA D SA D D D LA A A A A N D SA SA MA SA A A A A SA SA SA MD SA A A A A N D A ME SA N SA SD A SD A SD MI SA SA A N SA A A N MN A A SA N SA N SA A MO A A A N N N N N MS SA A A A SA D SD D MT A A A N D D D D NC SA A SA SA SA N A N ND SA A SA A D D A A NE SA SA SA D D D N N NH NJ A N SA N A A NM SA A A A SA D N A NV D D SD SD SA SD SD N NY SA SA SA D D D N N OH A N A A SA N SA A OK A SA N N D N SA A OR A A A A A D D A PA RI A A A A A A SD N SC SA A SA N A A SA A

10-28-08 draft, page 20 of 43
SD SA N A A A N N N TN A A A D SA N D D TX UT SA D SA N A N A SA VA A D SA N SA N N A VT A A A D A N A A WA A A SA A SA A A SA WI A N SA SA SA N A A WV A A SA A SA N A N WY A N A A SD D D A
SA/A n 43 31 45 26 36 8 26 25 SA/A % 91% 66% 96% 57% 78% 17% 55% 53%
Rank 2 4 1 5(tie) 3 8 5(tie) 7 SA=strongly agree; A=agree; N=neutral; D=disagree; SD=strongly disagree, blank cells = no response. Table 2a Key Drivers of State Budget Decisions, FY2006-2007, and FY2007-2008 (Respondents who indicated either “strongly agree” or “agree,” number and percentage)
Year Just Ended (FY 2007-8
Key Drivers of State Budget Decisions
Medicaid n=47
Corrections n=47
K-12 n=47
Higher Education
n=46
Recession, producing decline in revenue
n=46
Unemployment Insurance
n=47
Tax Cuts n=47
Transportation n=47
Strongly Agree/Agree n=47
43 31 45 26 36 8 26 25
% 91% 66% 96% 57% 78% 17% 55% 53%
RANK 2 4 1 6(tie) 3 8 5 6(tie)
Prior Year (FY2006-7) SA/A n=49
44 33 45 33 21 6 27 29
% 90% 67% 92% 67% 43% 12% 55% 59% RANK 2 3(tie) 1 3(tie) 7 8 6 5
MEGASTATES AND NON MEGASTATES
KEY DRIVERS OF STATE BUDGETS IN MEGASTATES, FY2007-2008 SA 4 1 3 2 7 4 A 3 3 5 4 3 3 N 1 3 1 5 1 4 D 1 1 1 2
SD 1 1 KEY DRIVERS OF STATE BUDGETS IN NON-MEGASTATES, FY2007-2008
SA 16 7 20 3 16 1 7 5 A 20 20 17 17 13 7 12 17 N 6 1 9 4 14 8 9 D 3 5 8 4 13 8 7
SD 1 3 1 4 3 1

10-28-08 draft, page 21 of 43
Table 3 Formula Funding Status of Community Colleges in Year Just Completed (FY 2007-2008), by State State
Formula Funding State
Formula Funding
Fully funded
Not fully
funded
No
formula
Fully
Funded
Not fully
funded
No
formula AK MT X AL X NC X AR X ND X AZ X NE X CA X NH CO X NJ X CT X NM X DE X NV X FL X NY X GA/UGA X OH X GA/TCSG X OK X HI X OR X IA X PA ID X RI X IL X SC X IN X SD X KS X TN X KY X TX X LA X UT X MA X VA X MD X VT X ME X WA X MI X X WI X MN X WV X MO X WY X MS X Total n/% 10 36% 18 64% 21 NA Table 3a Formula Funding Status of Community Colleges: Year Just Completed (FY 2007-2008) and Prior Year (FY 2006-2007) Fully
Funded Not Fully Funded No Formula
FY2006-2007 14 20 14 Total n/% 41% 59% NA FY2007-2008 10 18 21 Total n/% 36% 64% NA CHANGE FY2006-7 to FY2007-8
number -4 2 +7 percent -5% +5% NA

10-28-08 draft, page 22 of 43
Table 4 Changes in Tuition in Public Postsecondary Education, by Sector and State: FY 2007–2008 to FY 2008–2009 State
Public Education Sector and % Tuition Increase Community
Colleges HBCUs (if any)
Regional Universities
Flagship Universities
AK AL 0 10.1 11.0 10.6AR 8.2 3.9 6.2 6.0AZ 10.0 --- --- ---CA --- --- 10.0 10.0CO 5.0 --- 7.5 9.5CT 5.5 --- 6.6 5.5DE 7.7 --- --- ---FL 6.0 --- --- ---GA/UGA 5.0 6.0 8.0 8.0GA/TCS 14.0 --- --- ---HI 12.7 IA 4.0 --- --- ---ID 4.4 --- 5.5 5.0IL 3.0 --- 11.6 10.8IN 3.9 --- 5.0 5.0KS 0 10.0 6.0 6.0KY 5.2 7.0 7.4 9LA* MA 3.0 --- 3.0 3.0MD --- 0 0 0ME 8.0 --- 1.0 1.0MI --- --- --- ---MN 2.0 --- 3.0 7.3MO 4.7 3.7 6.1 4.0MS 2.0 2.0 2.0 2.0MT 12.0 --- 0 0NC 0 2.0 2.0 2.0ND 5.0 5.0 5.0 5.0NE 5.0 --- 5.0 6.0NH NJ 6.0 --- 7.0 8.5NM 2.0 --- 4.0 5.0NV 4.6 --- 9.0 10.0NY 5 --- 5 6OH 0 0 0 0OK 0 0 0 0OR 2.0 3.0 3.0

10-28-08 draft, page 23 of 43
PA RI 9.6 --- --- ---SC 3.0 8.0 6.0 8.0SD 5.4 7.9 7.9TN 6.0 6.0 6.0 6.0TX --- --- --- ---
UT 5.4 --- 6.2 6.0VA 5.0 5.0 5.0 5.0VT 6.0 --- 6.0 6.0WA WI 5.4 --- --- ---WV 4.0 7.0 6.0 7.0WY --- --- --- ---Total n 46 16 38 37 Median % Increase 5.0% 6.6% 6.6% 6.0%Notes: (1) Responses have been rounded to tenths for consistency. (2) A blank cell (—) indicates either no response or a “don’t know” response. (3) Each sector in Louisiana was allowed to raise tuition between 0% up to a maximum of 5%. For this reason, the midpoint of 2.5% was assigned to each sector. (4) The range for Kansas’ community college tuition increases was 0 to 10%. Table 4a Median Percentage Changes in Public Postsecondary Tuition Increases Comparing Year Just Ending (FY2007-2008) to Prior Year (2006-2007), by Education Sector Community
Colleges HBCUs(if any)
Regional Universities
Flagship Universities
Year Just Concluded, FY2007-2008 n 46 16 35 35 Median Percentage-Point Change 5.0% 5.0% 6.0% 6.0%
Prior Year, FY2006-2007 n 48 12 36 37 Median Percentage-Point Change 5.0% 6.6% 6.6% 6.0%
Percentage-Point CHANGE, FY2006-07 to FY2007-2008
-0.0% -1.6% -0.6% 0.0
Table 4b Median Predicted Percentage Changes in Public Postsecondary Education Tuition in States with/without locally funded Community Colleges, FY2007-2008 to FY2008-2009, by Sector
Community Colleges
HBCUs (if any)
Regional Universities
Flagship Universities
States with Locally Funded n Community Colleges
n=20 3.7
n=8 2.8
n=18 4.2
n=18 4.8
States without Non-Locally Funded n Community Colleges
n=22 6.3
n=8 6.3
n=17 6.2
n=17 6.4

10-28-08 draft, page 24 of 43
Table 5 Changes in State Operating Budget Support from FY 2007-2008 to FY 2008-2009, By Education Sector and State
State
Percentage Change in State Budget Support by Education Sector K-12
Education Community
Colleges HBCUs (if any)
Regional Universities
Flagship Universities
AK AL 2.7 4.6 6.7 11.0 12.5AR 1.6 0.8 1.3 0.8AZ 15.0 5.0CA 0.6 CO 7.6 9.2 10.5CT 4.5 2.4 1.2 1.9DE 0.3 FL -7.1 GA/UGA 6.5 6.5 6.5 6.5 6.5GA/TCS 0.5 HI 10.1 IA 4.0 4.0 ID 3.9 9.9 9.5 7.2IL 5.0 -1.0 2.8 3.0IN 6.0 4.0 4.5KS 5.5 3.4 3.4 3.4KY 1.6 -3.0 -3.0 -3.0 -3.0LA 5.6 MA 2.0 0 0 0MD 3.8 7.6 10.6 11.6 8.0ME 5.0 8.0 1.0 1.0MI* 3.5 6.0 8.5 5.7MN -1.0 -1.0 MO 4.4 4.4 4.4 4.4MS 6.0 1.0 1.0 1.0MT 5.0 5.0 5.0 5.0NC 1.2 3.7 1.0 ND 12.0 12.0 12.0 16.0NE 8.0 3.0 3.0 2.0NH NJ 5.0 -7.0 -4.0 -4.0NM 4.9 3.1 5.4 6.9NV NY 8.0 3.0 3.0 2.0OH 8.1 7.8 7.9 9.1OK OR
10-28-08 draft, page 25 of 43
PA 3.0 2.5 2.9 RI -4.8 SC -4.0 -4.0 -4.0 -4.0SD 8.3 10.8 6.2 6.2TN 2.0 5.8 5.8 5.8TX UT 6.3 3.7 5.1 3.9VA -5.0 -5.0 -5.0 -6.0VT 3.5 3.5 3.5WA 6.4 WI 0 WV 7.0 3.0 5.0 5.0WY 0 0 0Total n 23 45 12 33 31
Median % Increase 4.9% 4.5% 4.7 4.4 4.2
Notes. (1) Responses have been rounded to tenths for consistency. (2) Percentages may not equal 100% due to rounding. (3) A blank cell (—) indicates either no response or a “don’t know” response. (4) Oregon has biennial budgeting, thus there are no changes from FY2007-8 to FY2008-9. (5). In Michigan, it takes at least a 5% increase in operating budget support just to restore the cuts from the prior year FY2006-2007.

10-28-08 draft, page 26 of 43
Table 5a Median Predicted Percentage Changes in State Operating Budget Support Comparing Year Just Ending (FY2007-2008) to Prior Year (FY 2006-2007), by Sector K-12
Education Community
Colleges HBCUs (if any)
Regional Universities
Flagship Universities
Year Just Concluded, FY2007-2008 n
23 45 12 33 31
% +4.8% +3.1% +2.9% +4.0% +4.1% Median % Increase 4.9% 3.5% 3.7 3.5 4.2 Prior Year, FY2006-2007 n
22 48 12 36 35
% +8.6% +8.2% +7.9% +7.7% +5.8% CHANGE, FY2006-07 to FY2007-08
-3.83% -5.15% -5.02% -3.7% -1.76%
The national Higher Education Price Index (inflation measure) for FY 2008 is 3.6%. Table 5b Predicted Average Percentage Changes in State Operating Budget Support by Sector: Year Just Ending (FY2007-2008) to Next Year (FY 2008-2009)
States with….
K-12 Education
Community Colleges
HBCUs(if any)
Regional Universities
Flagship Universities
Locally Funded n community colleges (+or-)
n=15 +4.4%
n=23 +3.6%
n=5 +4.2%
n=18 +4.0%
n=18 +3.6%
Non-Locally Funded n community colleges (+or-)
n=9 +5.44%
n=23 +3.1%
n=7 +3.1%
n=16 +3.4%
n=15 +3.9%
Table 5c Summary of Predicted Changes in State Operating Budget Support by Sector in Comparison to the Higher Education Price Index (estimated at 3.6%): Year Just Ending (FY2007-2008) to Next Year (FY2008-2009)
Sector of Education
CUTS or INCREASES < OR = TO HEPI (3.6%)
INCREASES GREATER THAN HEPI (3.6%)
Local Non
Local Local Non
Local K-12 Education n=25 4 3 10 8 Community Colleges n=21 11 13 10 11 HBCUs n=4 1 3 3 3 Regional Universities n=18 10 8 8 9 Flagship Universities n=11 8 8 8 8 Table 6
10-28-08 draft, page 27 of 43
Predicted Changes (increases or decreases) in Postsecondary State-Funded Direct Student Grant Aid from FY 2007-2008 to FY 2008-2009, by State
STATE
Changes in State-Funded Student Grant Aid
Cuts Flat
Funding ≤ 2.9% 3.0–5.9% 6.0–9.9% 10.0–19.9% ≥ 20%
AK AL -20.2 AR AZ CA CO 11.1 CT 2.0 DE 0 FL 0 GA/UGA 0 GA/TCSG 2.4 HI 10.0 IA 4.0 ID 5.0 IL 0 IN 10.0 KS 15.7 KY 5.9 LA MA 4.0 MD -5.3 ME 0 MI 2.6 MN 0 MO 117.6MS MT 1.0 NC 0 ND 60.0NE 0 NH NJ 14.0 NM 10.0 NV 0 NY 0 OH 17.4 OK 0 OR 0 PA 5.5

10-28-08 draft, page 28 of 43
RI SC -4.0 SD TN 2.0 TX UT 41.0VA 2.0 VT 3.5 WA 7.9 WI 2.5* WV 6.0 WY 0 Total n 3 13 7 6 2 7 3A total of 41 states responded, and the average was a 7.9% increase. Without Missouri (117% increase), North Dakota (60% increase), and Utah (41% increase), the average among the other 38 states was an increase of 2.8%. Notes: (1) A blank cell (—) indicates either no response or a “don’t know” response. (2) A response in italics indicates a negative percent change. (3) Data for Wisconsin are for the Wisconsin Technical College System institutions only. Table 6a Average Percentage Predicted Changes (increases or decreases) in Postsecondary State-Funded Direct Student Grant Aid
Changes in State-Funded Student Grant Aid
Cuts Flat
Funded0.1 to ≤ 2.9%
3.0–5.9%
6.0–9.9%
10.0–19.9% ≥ 20%
Next Year (FY2007-2008 to FY2008-2009)
3 13 7 6 2 7 3
Last Year to This Year (FY2007-2008 to FY2008-2009)
3 7 8 2 7 4
CHANGE n +3 +10 0 -2 0 0 -1

10-28-08 draft, page 29 of 43
Table 7 Predicted Changes in Community College Functions: FY 2007–2008 to FY 2008-2009
State
Predicted Changes in Key Community College Functions General
Education /Transfer
Vocational/ Occupational/ Technical Ed
Noncredit courses/
community services
Noncredit federal training
Developmental Education
Fine Arts/ Cultural Arts
+ = - + = - + = - + = - + = - + = - AK AL X X X X X X AR X X X X X X AZ X X X X X X CA X X X X X X CO X X X X X X CT X X X X X X DE X X X X X X FL X X X X X X GA/UGA X X X X X X GA/TCS X X X X X X HI X X X X X X IA X X X X X X ID X X X X X X IL X X X X X X IN X X X X X X KS X X X X X X KY X X X X X X LA X X X X X X MA X X X X X X MD X X X X X X ME X X X X X X MI X X X X X X MN X X X X X X MO X X X X X X MS X -- --- --- --- --- --- --- --- --- --- --- --- --- --- --- MT X X X X X X NC X X X X X X ND X X X X X X NE X X X X X X NH NJ X X X --- --- --- X X NM X X X X X NV X X X X X X NY X X X X X X OH X X X X X X OK X X X X X X OR X X X X X PA X RI X X X X X X SC X X X X X X SD X X X X X X TN X X X X X X TX

10-28-08 draft, page 30 of 43
UT X X X X X X VA X X X X X X VT X X X X X X WA X X X X X X WI X X X X X X WV X X X X X X WY X X X X X X Total n 14 26 7 13 24 9 7 33 6 8 30 7 9 30 7 1 35 9
Total % 30% 55% 7% 28% 52% 20% 15% 72% 13% 18% 67% 16% 20% 65% 15% 2% 78% 20%
Notes: (1) +, =, and – denote that functions will strengthen, remain the same, or weaken, respectively.(2)Percentages may not equal 100% due to rounding. (3) A blank cell (—) indicates either no response or a “don’t know” response. Table 7a Summary of Predicted Changes in Community College Functions: Next Year (FY 2007–8 to FY 2008-9), compared to Last Year (2006-7 to 2007-8)
KEY COMMUNITY COLLEGE FUNCTION
PREDICTED CHANGES from….
CHANGE from prior year
FY 2006-2007 to FY 2007-2008
(August to December, 2007)
FY 2007-2008 to FY2008-2009
(August to October, 2008)
+ = - + = - + = -
General Education/ Transfer
24 52%
21 48%
1 2%
14 30%
26 55%
7 15%
-10 -22%
+5 -7%
+6 +13%
Vocational/Occupational/ Technical Education
31 63%
16 33%
1 2%
13 28%
24 52%
9 20%
-18 -35%
+8 +19%
+8 +17%
Non-Credit courses/ Community Services
10 21%
35 73%
3 6%
7 15%
33 72%
6 13%
-3 -6%
-2 -1%
+3 +7%
Non-Credit Federal Training
13 29%
27 60%
2 11%
8 18%
30 67%
7 16%
-5 -11%
+3 +7%
+5 +5%
Developmental Education
13 28%
31 67%
2 4%
9 20%
30 65%
7 15%
-4 -8%
-1 -2%
+4 +11%
Fine Arts/Cultural Arts 1 2%
41 93%
2 5%
1 2%
35 78%
9 20%
0 0%
-6 -15%
+6 +15%
Table 7b Summary of Predicted Changes in Community College Functions by States with and without Local Funding: FY 2007–2008 to FY 2008-2009
Predicted Changes in Community College Functions General
Education /Transfer
n=47
Vocational/ Occupational/ Technical Ed
n=46
Noncredit courses/ community services
n=46
Noncredit federal Training
n=45
Developmental Education
n=46
Fine Arts/ Cultural Arts
n=45
+ = - + = - + = - + = - + = - + = - Local 9 12 2 7 12 3 4 14 4 4 14 3 4 15 3 1 18 2 Non-Local
5 15 5 6 13 6 7 18 2 4 17 4 4 17 4 0 17 8
Total n 14 26 7 13 24 9 7 33 6 8 30 7 9 30 7 1 35 9

10-28-08 draft, page 31 of 43
Table 8 Likelihood that mid-year budget cuts might occur in 2008-2009 year, by state QUESTION: “In your opinion, what is the likelihood that mid-year budget cuts in state
operating funds for community colleges in your state might occur in the 2008-2009 academic year?”
STATE
Likelihood of mid-year budget cuts next year n=47
States that responded to this item…
Very High High Neutral Low Very Low
AFTER Sept. 18th
AND Very High/High
AK
AL X X X AR X AZ X X X CA X X CO X CT X X X DE X X FL X GA/UGA X X X GA/TCSG X X X HI X X X IA X ID X IL X X IN X KS X KY X X X LA X MA X MD X ME X X MI X X X MN X X X MO X X MS X MT X X NC X X X ND X X NE X NH NJ X X NM X X NV X NY X OH X X

10-28-08 draft, page 32 of 43
OK X X OR X X PA RI X SC X SD X X X TN X TX UT X VA X VT X WA X WI X WV X X WY X
Total n 11 11 10 5 10 22 13 % 23% 23% 21% 11% 21%
Very High and High, Low and
Very Low n 22 15
VH/H & L/VL % 46% 32% Note. A blank cell (—) indicates either no response or a “don’t know” response. Over half of the respondents who indicated “Very High” or “High” likelihood of mid-year budget cuts next year responded after September 18, 2008. On September 19, 2008, US Treasury Secretary Henry Paulson indicated that the federal government of the United States would intervene in the financial markets to bring stability. Of the 22 responses who indicated the likelihood of mid-year budget cuts in FY2008-2009 was “Very High” or “High,” 19 indicated on Table 2 (above) that Medicaid was a key budget driver in their state’s budgeting process (10 “Strongly Agreed” and 9 “Agreed”).

10-28-08 draft, page 33 of 43
Table 9 Existence of a structural deficit in state’s budget process that in the long-term will specifically hurt community colleges
STATE
Opinion Regarding Deficit n=48
Opinion Regarding Deficit
Yes No Not sure Yes No Not sure
AK MT X AL X NC X AR X ND X AZ X NE X CA X NH CO X NJ X CT X NM X DE X NV X FL X NY X GA/UGA X OH X GA/TCS X OK X HI X OR X IA X PA ID X RI X IL X SC X IN X SD X KS X TN X KY X TX X LA X UT X MA X VA X MD X VT X ME X WA X MI X WI X MN X WV X MO X WY X MS X Total n/% 29 60% 13 27% 6 13%
Note: Of the 29 responses who indicated “Yes,” that the existence of a structural deficit in their state’s budget process that in the long-term will specifically hurt community colleges, 25 indicated on Table 2 (above) that Medicaid was a key budget driver in their state’s budgeting process (13 “Strongly Agreed” and 12 “Agreed”, 1 was “Neutral,” 3 “Disagreed” and none “strongly disagreed”).

10-28-08 draft, page 34 of 43
Table 10 Types of community colleges (rural, suburban, urban) predicted to sustain the greatest fiscal strain in FY 2008-2009 State
Type of College by Service Area Rural n=45
Suburban n=42
Urban n=44
SA A N D SD SA A N D SD SA A N D SD AK AL X X X AR X X X AZ X --- --- --- --- --- X CA X X X CO X X X CT X X X DE X X X FL X X X GA/UGA X X X GA/TCSG X X X HI X X X IA X X X ID X X X IL X X X IN X X X KS X X X KY X X X LA X X X MA X X X MD X X X ME X X X MI X X X MN X X X MO X X X MS X X X MT X --- --- --- --- --- --- --- --- --- --- NC X X X ND X X X NE X X X NH NJ X X X NM X X X NV --- --- --- --- --- --- --- --- --- --- --- --- --- --- --- NY X X X OH X X X OK X X X OR X X X PA RI --- --- --- --- --- --- --- --- --- --- X SC X X X SD

10-28-08 draft, page 35 of 43
TN X X X TX X X X UT X X X VA X X X VT X --- --- --- --- --- --- --- --- --- --- WA X X X WI X X X WV X X X WY X X X Total n 13 18 13 1 0 5 17 16 3 1 10 10 21 1 2 Total % 29% 40% 29% 2% 0% 12% 40% 38% 7% 2% 23% 23% 48% 2% 5%
Responding SA/A &D/SD
31 1 22 4 10 3 69% 2% 52% 9% 46% 7%
Note. SA = strongly agree; A = agree; N = neutral; D = disagree; SD = strongly disagree. A blank cell (—) indicates either no response or a “don’t know” response. Percentages may not add to 100% due to rounding. Table 10a Type of Community Colleges Predicted to Experience the Greatest Fiscal Strain Next Year (FY 2008-2009) compared to Year Just Concluded (FY 2007-2008)
Prediction
Type of College by Service Area Rural Suburban Urban
Strongly Agree/ Agree Neutral
Disagree/ Strongly Disagree
Strongly Agree/ Agree Neutral
Disagree/ Strongly Disagree
Strongly Agree/ Agree Neutral
Disagree/ Strongly Disagree
Next Year (FY2008 to FY2009)
31 13 1 22 16 4 10 21 3 69% 29% 2% 52% 38% 9% 46% 48% 7%
This Year (FY2007 to FY2008)
30 13 5 14 20 8 12 20 9 66% 26% 11% 34% 48% 19% 30% 49% 22%
CHANGE n %
+1 0 -4 +8 -4 -4 -2 +1 -6 +3% -3% -9% +18% -10% -10% -16% -1% -15%

10-28-08 draft, page 36 of 43
Table 11 Items 1-27: The budgeting process, student aid/tuition issues in the states
ITEM
STATES RESPONDING…
Number Percent
Yes No Not Sure Yes No
Not Sure
1. Is the funding for public higher education operating budgets always/nearly always the last major item considered in your state’s budget process? (n=48)
19 24 5 40% 50% 10%
2. Does the amount of available state funding depend upon “what’s left” after other major items have been considered in your state budgeting process? (n=47)
22 20 5 47% 43% 10%
3. Are appropriations (operating budgets), tuition, and state student financial aid (merit and/or need-based) closely aligned? (n=48)
8 35 5 17% 73% 10%
4. Is funding merit-based student aid a higher state policy priority than the community college operating budget in your state? (n=46)
9 35 2 20% 76% 4%
5. Is funding need-based student financial aid a higher state policy priority than the community college operating budgets in your state? (n=45)
10 27 8 22% 60% 18%
6. Have tuition increases since 2000 outstripped increases in state need-based student financial aid? (n=46)
28 13 5 60% 28% 11%
7. Is your state’s need-based student aid program funded well enough so that low income students can work their way through college without debt? (n=46)
4 36 6 9% 77% 17%
8. Is your state’s merit-based student aid funded well enough so that low income students can work through college without debt? (n=45)
1 34 10 2% 76% 22%
9. In the most recently approved budget, did state investment in need-based student aid keep pace with tuition increases? (n=46)
11 33 2 24% 72% 4%
10. Do state law and/or state regulations allow colleges and universities to use state appropriations for institutionally-based student aid? (n=46)
28 12 6 61% 26% 13%
11. In general, state legislatures “look the other way” while colleges raise tuition. (n=44)
9 34 1 20% 77% 2%
12. In general, tuition is increased with corresponding increases in need-based state-funded student financial aid programs. (n=44) 8 30 6 18% 68% 14%
13. Tuition is increased with corresponding increases in merit-based state-funded student financial aid programs. (n=43)
4 34 5 9% 79% 12%
14. Merit-based state student financial aid receives a higher policy priority than need-based student financial aid. (n=42)
11 27 4 26%
64%
10%

10-28-08 draft, page 37 of 43
Table 11 (continued) Items 1-27: The budgeting process, student aid/tuition issues in the states
ITEM
STATES RESPONDING… Number Percent
Yes No Not Sure Yes No
Not Sure
15. In general, proprietary institutions encroach on state financial aid. (n=40)
9 24 7 23%
60% 18%
16. Does your state do a good job of reaching financially needy students with information about state and federal student financial aid programs? (n=44)
25 12 7 57%
27% 16%
17. Does your state office participate in College Goal Sunday? (n=44)
18 12 14 41%
27% 32%
18. Do high school students in your state receive scholarship aid for scoring well on state-required high school proficiency or exit tests? (n=45)
5 37 3 11%
82% 7%
19. Given higher gas prices, should federal direct grant aid (Pell and SEOG) programs make daily commuting transportation an allowable expense? (n=43)
31 1 11 72%
2% 26%
20. Given higher gas prices, do you believe federal laws governing direct grant aid (Pell and SEOG) should make the purchase of internet services for use at home to take classes an allowable expense? (n=43)
26 6 11 60%
14% 26%
21. Would an income tax deduction for travel to obtain postsecondary education help students in your state cope with higher gas prices? (n=45)
21 11 13 47%
24% 29%
22. Has your state encouraged its institutions to study the impact of higher gas prices on access for commuting students? (n=45)
5 36 4 11%
80% 9%
23. Would your agency participate in a study of the impact of higher gas prices? (n=45)
21 3 21 47%
7% 47%
24. Has the percentage of students graduating from community colleges with significant loan debt increased in recent years? (n=43)
21 5 17 49%
12% 40%
25. Do increasingly larger percentages of graduating students leave your state after achieving their baccalaureate degrees due to increased loan debt? (n=44)
5 8 31 11%
18% 70%
26. Do all of the community colleges in your state participate in federal student loan programs? (n=44)
33 10 1 79%
23% 2%
27. Is your state encouraging community colleges to sign up for federal direct loans, as economic conditions prompt more private lenders to cut back their student-loan operations? (n=45)
10 23 12 22%
51% 27%

10-28-08 draft, page 38 of 43

10-28-08 draft, page 39 of 43
Table 12 Type /of state student aid program (need-based, merit-based, loans, scholarships)
that exists in your state….
Type of State Student Financial Aid Program Need-based
state direct… Scholarships for…. Merit based state
grants
State funded student loans grants
supple-mental grants
2-year nursing
2year allied health
CC teach-
ing
K-12 teacher
Prep
K-12 math/
science Total n 39 18 15 9 3 15 15 34 14 Table 13 Procedure by which tuition is set for each sector of public higher education
Question: Which of the following statements best describes the procedure by which tuition is set for each type of public higher education institution in your state (please check all that apply for each college type):
* In Kentucky, for all public institutions, tuition is set by the state coordinating board.
Method(s) Flagship
Universities Regional
Universities HBCUs Community
Colleges Tuition is formally set by the state legislature 2
Tuition is formally set by local boards 11 10 6 21
Tuition is formally set by state governing boards 22 21 4 17
Tuition has been deregulated for each sector 3 3 2
Percentage increases assumed by state budget; but local boards enact the increases
6 6 1 6
Legislature sets the maximum percentages by which tuition can be raised
10 10 4 8
Tuition increases enacted on an ad-hoc basis by legislatures create a defacto policy
3 3 1 3
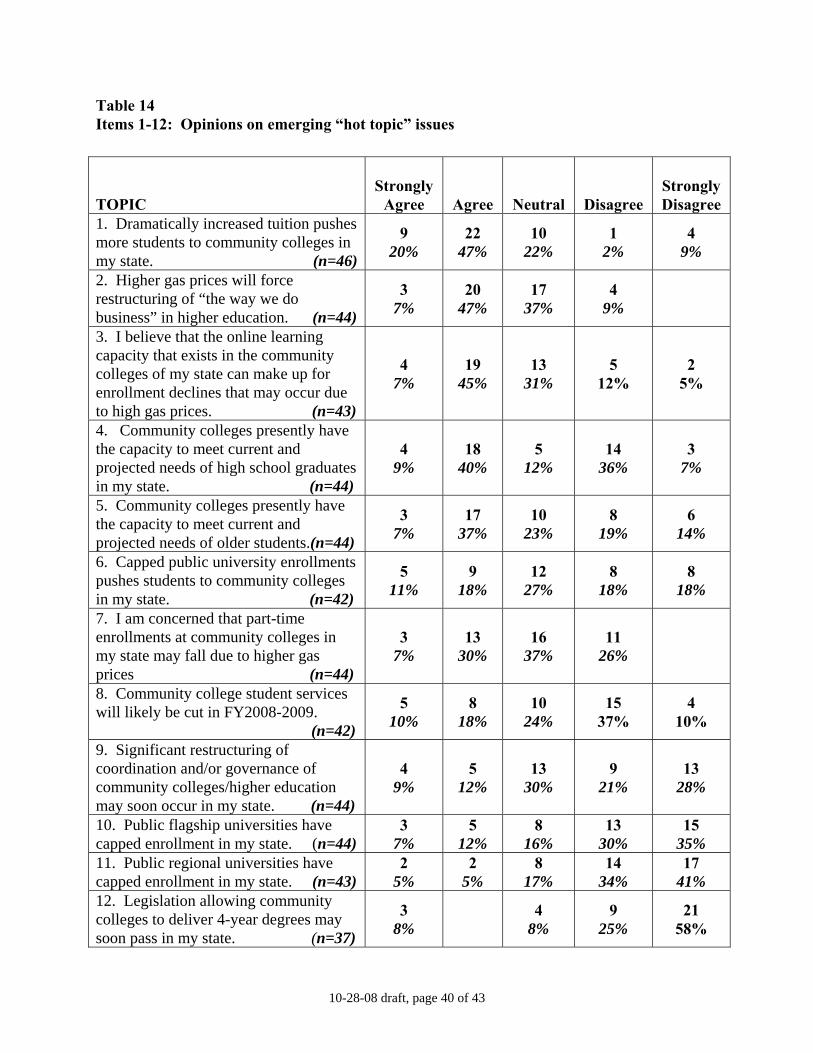
10-28-08 draft, page 40 of 43
Table 14 Items 1-12: Opinions on emerging “hot topic” issues
TOPIC Strongly
Agree Agree
Neutral
Disagree
Strongly Disagree
1. Dramatically increased tuition pushes more students to community colleges in my state. (n=46)
9 20%
22 47%
10 22%
1 2%
4 9%
2. Higher gas prices will force restructuring of “the way we do business” in higher education. (n=44)
3 7%
20 47%
17 37%
4 9%
3. I believe that the online learning capacity that exists in the community colleges of my state can make up for enrollment declines that may occur due to high gas prices. (n=43)
4 7%
19 45%
13 31%
5 12%
2 5%
4. Community colleges presently have the capacity to meet current and projected needs of high school graduates in my state. (n=44)
4 9%
18 40%
5 12%
14 36%
3 7%
5. Community colleges presently have the capacity to meet current and projected needs of older students.(n=44)
3 7%
17 37%
10 23%
8 19%
6 14%
6. Capped public university enrollments pushes students to community colleges in my state. (n=42)
5 11%
9 18%
12 27%
8 18%
8 18%
7. I am concerned that part-time enrollments at community colleges in my state may fall due to higher gas prices (n=44)
3 7%
13 30%
16 37%
11 26%
8. Community college student services will likely be cut in FY2008-2009. (n=42)
5 10%
8 18%
10 24%
15 37%
4 10%
9. Significant restructuring of coordination and/or governance of community colleges/higher education may soon occur in my state. (n=44)
4 9%
5 12%
13 30%
9 21%
13 28%
10. Public flagship universities have capped enrollment in my state. (n=44)
3 7%
5 12%
8 16%
13 30%
15 35%
11. Public regional universities have capped enrollment in my state. (n=43)
2 5%
2 5%
8 17%
14 34%
17 41%
12. Legislation allowing community colleges to deliver 4-year degrees may soon pass in my state. (n=37)
3 8%
4
8% 9
25% 21
58%

10-28-08 draft, page 41 of 43
Appendix A Local Tax Appropriation Funding Status of Community Colleges
State-Aided Community Colleges (receive at least 10% of government funding)
State Community Colleges (receive under 10% of government funding)
Arizona Alabama California Alaska Coloradoa Arkansas
Idaho Connecticut Illinois Delaware Iowa Florida
Kansas Georgia Marylanda Hawaii Michigan Indiana
Mississippi Kentucky Missouri Louisiana Montana Massachusetts Nebraska Maine
New Jersey Minnesota New Mexico Nevada
New York New Hampshire North Carolina North Dakota
Ohioa Rhode Island Oklahomaa South Dakota
Oregon Tennessee Pennsylvania Utah
South Carolina Vermont Texas Virginia
Wisconsin Washington Wyoming West Virginia
Note. Adapted from Palmer (2008b). a Some colleges receive no local tax support.