Embed Size (px)
Citation preview

Richard S. LukajSenior Managing Director
The Bank Street Group
Funding White Space Broadband Wireless Providers
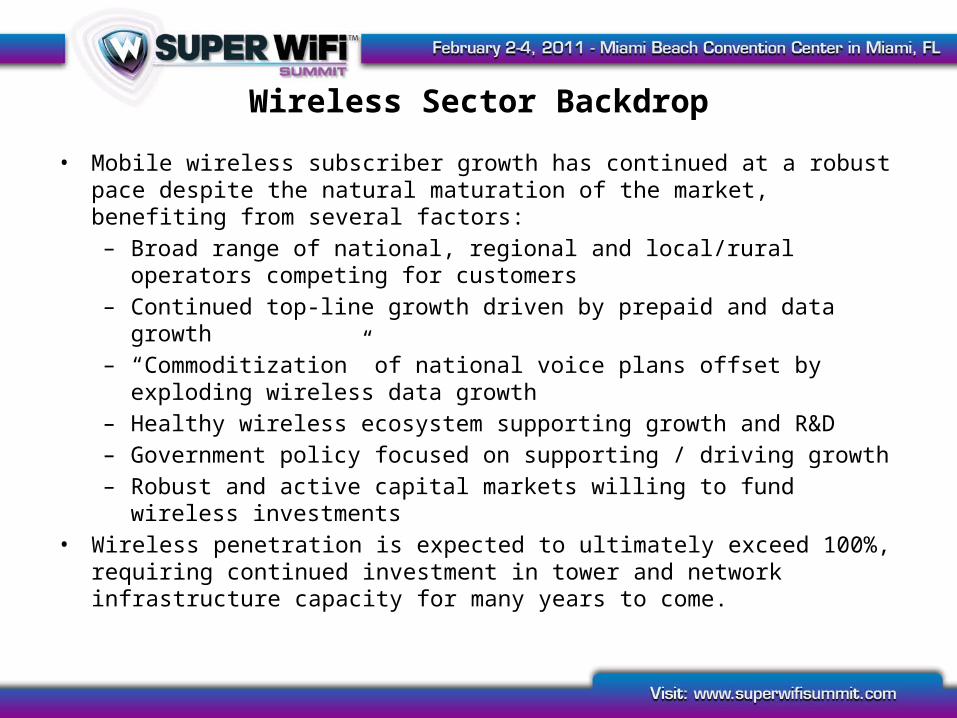
Wireless Sector Backdrop
• Mobile wireless subscriber growth has continued at a robust pace despite the natural maturation of the market, benefiting from several factors:– Broad range of national, regional and local/rural operators competing for
customers– Continued top-line growth driven by prepaid and data growth– “Commoditization” of national voice plans offset by exploding wireless data
growth– Healthy wireless ecosystem supporting growth and R&D– Government policy focused on supporting / driving growth– Robust and active capital markets willing to fund wireless investments
• Wireless penetration is expected to ultimately exceed 100%, requiring continued investment in tower and network infrastructure capacity for many years to come.
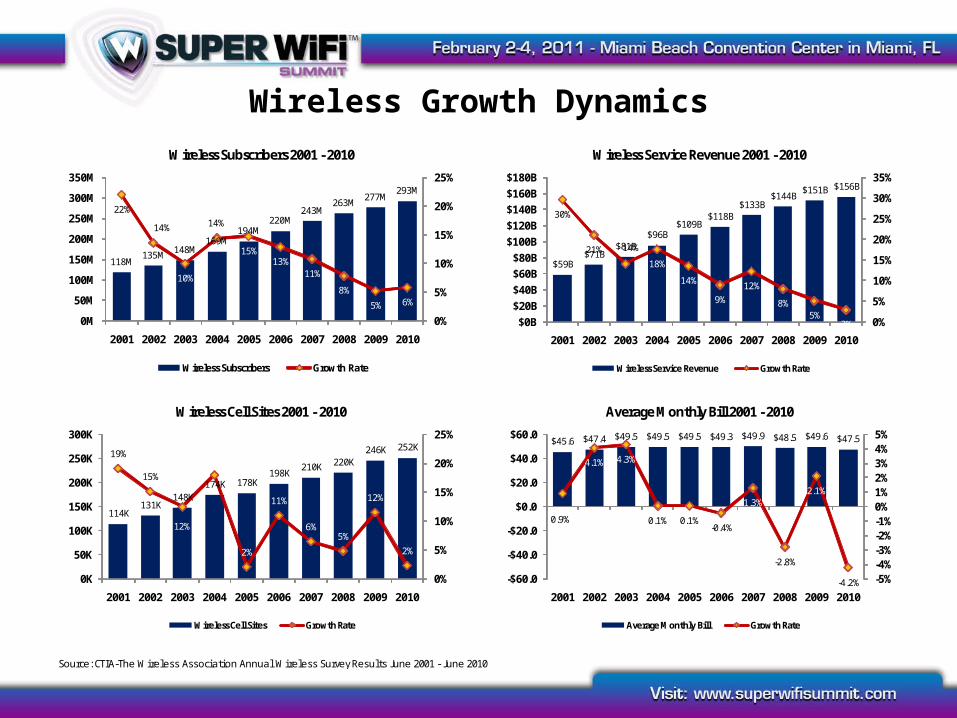
Wireless Growth Dynamics
Source: CTIA-The Wireless Association Annual Wireless Survey Resul ts June 2001 - June 2010
118M135M 148M
169M194M
220M243M
263M 277M293M
22%
14%
10%
14%
15%13%
11%
8%
5% 6%
0%
5%
10%
15%
20%
25%
0M
50M
100M
150M
200M
250M
300M
350M
2001 2002 2003 2004 2005 2006 2007 2008 2009 2010
Wireless Subscribers 2001 - 2010
Wireless Subscribers Growth Rate
$59B$71B
$81B$96B
$109B$118B
$133B$144B
$151B $156B
30%
21% 14%
18%
14%
9%12%
8%5%
3% 0%
5%
10%
15%
20%
25%
30%
35%
$0B$20B$40B$60B$80B
$100B$120B$140B$160B$180B
2001 2002 2003 2004 2005 2006 2007 2008 2009 2010
Wireless Service Revenue 2001 - 2010
Wireless Service Revenue Growth Rate
114K131K
148K174K 178K
198K210K 220K
246K 252K19%
15%
12%
18%
2%
11%
6%5%
12%
2%
0%
5%
10%
15%
20%
25%
0K
50K
100K
150K
200K
250K
300K
2001 2002 2003 2004 2005 2006 2007 2008 2009 2010
Wireless Cell Sites 2001 - 2010
Wireless Cell Sites Growth Rate
$45.6 $47.4 $49.5 $49.5 $49.5 $49.3 $49.9 $48.5 $49.6 $47.5
0.9%
4.1% 4.3%
0.1% 0.1%-0.4%
1.3%
-2.8%
2.1%
-4.2% -5%-4%-3%-2%-1%0%1%2%3%4%5%
-$60.0
-$40.0
-$20.0
$0.0
$20.0
$40.0
$60.0
2001 2002 2003 2004 2005 2006 2007 2008 2009 2010
Average Monthly Bill 2001 - 2010
Average Monthly Bill Growth Rate
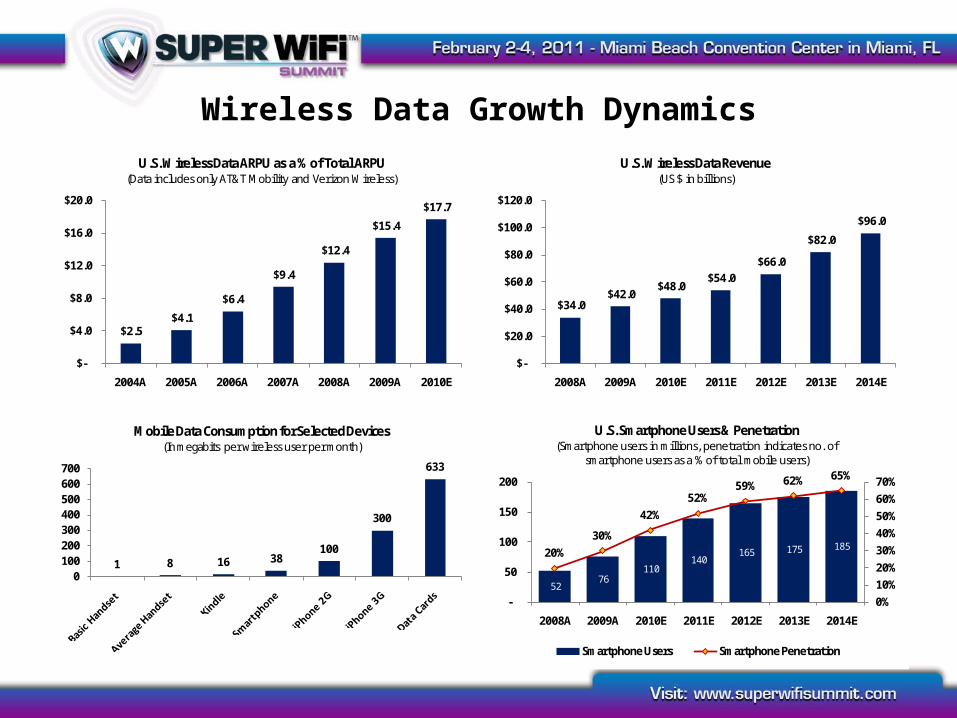
Wireless Data Growth Dynamics
$34.0 $42.0
$48.0 $54.0
$66.0
$82.0
$96.0
$-
$20.0
$40.0
$60.0
$80.0
$100.0
$120.0
2008A 2009A 2010E 2011E 2012E 2013E 2014E
U.S. Wireless Data Revenue(US $ in billions)
$2.5 $4.1
$6.4
$9.4
$12.4
$15.4
$17.7
$-
$4.0
$8.0
$12.0
$16.0
$20.0
2004A 2005A 2006A 2007A 2008A 2009A 2010E
U.S. Wireless Data ARPU as a % of Total ARPU(Data includes only AT&T Mobility and Verizon Wireless)
1 8 16 38100
300
633
0100200300400500600700
Mobile Data Consumption for Selected Devices(In megabits per wireless user per month)
52 76
110 140
165 175 185 20%30%
42%52%
59% 62% 65%
0%10%20%30%40%50%60%70%
-
50
100
150
200
2008A 2009A 2010E 2011E 2012E 2013E 2014E
U.S. Smartphone Users & Penetration(Smartphone users in millions, penetration indicates no. of
smartphone users as a % of total mobile users)
Smartphone Users Smartphone Penetration

Wireless Broadband Competition
• Wireless broadband is still at an early stage of development across all aspects of the sector, including the competitive landscape– Nationwide and large regional operators are focused on launching / expanding
their 4G deployments– Small operators are focused on deployments and also device availability and
roaming agreements to compete with national carriers– Small independent operators, especially those utilizing unlicensed spectrum,
remain starved for growth capital and additional scale– New entrants such as Lightsquared and Dish-ICO/Echostar-Terrestar face
substantial technology, buildout, business and funding challenges– Customer usage and network requirements continue to be redefined by the
introduction of new devices and platforms– Operators are still trying to develop the “right” data pricing plan, i.e. tiered
pricing versus flat-rate with throttles
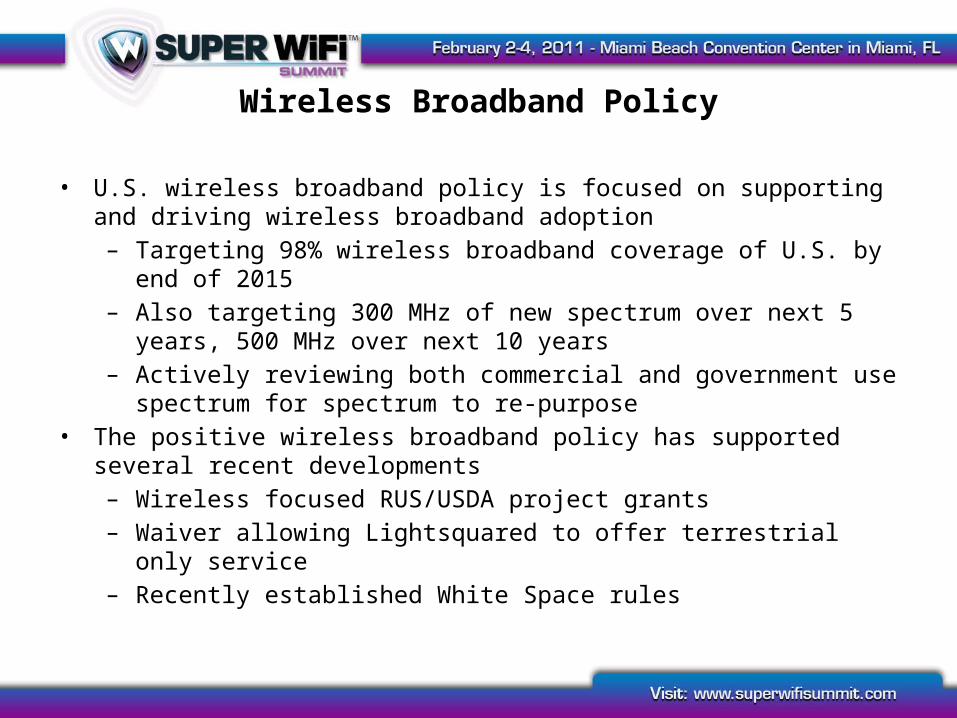
Wireless Broadband Policy
• U.S. wireless broadband policy is focused on supporting and driving wireless broadband adoption– Targeting 98% wireless broadband coverage of U.S. by end of 2015– Also targeting 300 MHz of new spectrum over next 5 years, 500 MHz over next
10 years– Actively reviewing both commercial and government use spectrum for
spectrum to re-purpose• The positive wireless broadband policy has supported several recent developments
– Wireless focused RUS/USDA project grants– Waiver allowing Lightsquared to offer terrestrial only service– Recently established White Space rules
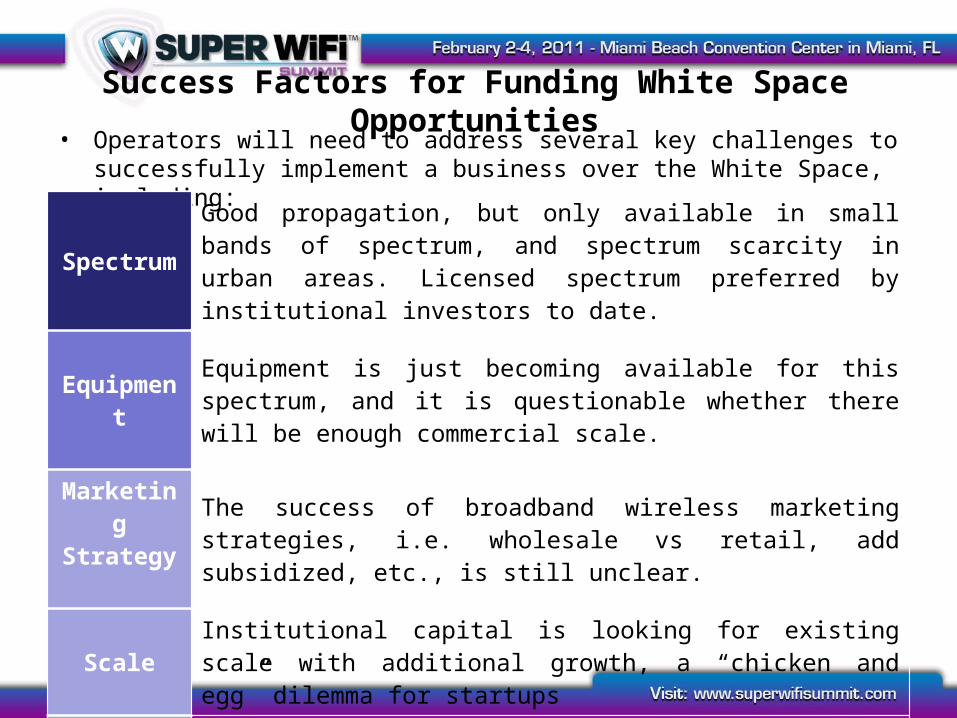
Success Factors for Funding White Space Opportunities• Operators will need to address several key challenges to successfully implement a
business over the White Space, including:
SpectrumGood propagation, but only available in small bands of spectrum, and spectrum scarcity in urban areas. Licensed spectrum preferred by institutional investors to date.
Equipment Equipment is just becoming available for this spectrum, and it is questionable whether there will be enough commercial scale.
Marketing Strategy The success of broadband wireless marketing strategies, i.e. wholesale
vs retail, add subsidized, etc., is still unclear.
Scale Institutional capital is looking for existing scale with additional growth, a “chicken and egg” dilemma for startups
Roaming For local or regional operators, roaming relationships will be a key factor to providing a competitive offering.

Debt Capital Markets Overview
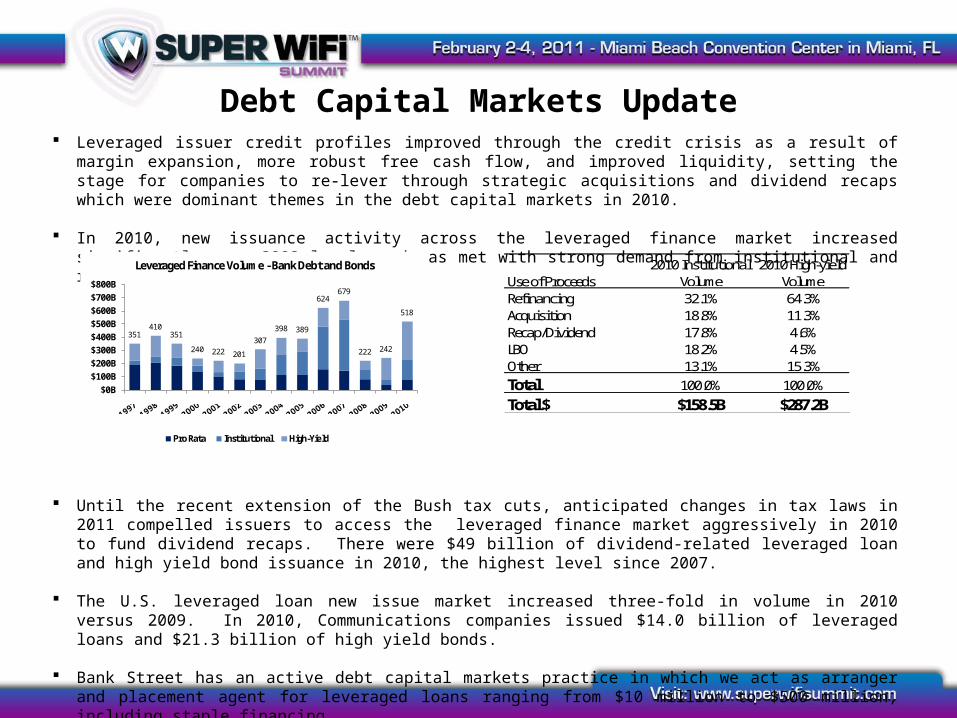
Debt Capital Markets Update Leveraged issuer credit profiles improved through the credit crisis as a result of margin expansion, more robust free cash flow,
and improved liquidity, setting the stage for companies to re-lever through strategic acquisitions and dividend recaps which were dominant themes in the debt capital markets in 2010.
In 2010, new issuance activity across the leveraged finance market increased significantly over 2009 levels and was met with strong demand from institutional and retail investors.
Until the recent extension of the Bush tax cuts, anticipated changes in tax laws in 2011 compelled issuers to access the leveraged finance market aggressively in 2010 to fund dividend recaps. There were $49 billion of dividend-related leveraged loan and high yield bond issuance in 2010, the highest level since 2007.
The U.S. leveraged loan new issue market increased three-fold in volume in 2010 versus 2009. In 2010, Communications companies issued $14.0 billion of leveraged loans and $21.3 billion of high yield bonds.
Bank Street has an active debt capital markets practice in which we act as arranger and placement agent for leveraged loans ranging from $10 million to $500 million, including staple financing.
351410
351
240 222 201
307398 389
624679
222 242
518
$0B$100B$200B$300B$400B$500B$600B$700B$800B
Leveraged Finance Volume - Bank Debt and Bonds
Pro Rata Institutional High-Yield
Use of ProceedsRefinancing 32.1% 64.3%Acquisition 18.8% 11.3%Recap/Dividend 17.8% 4.6%LBO 18.2% 4.5%Other 13.1% 15.3%Total 100.0% 100.0%Total $ $158.5B $287.2B
2010 High-yield Volume
2010 Institutional Volume
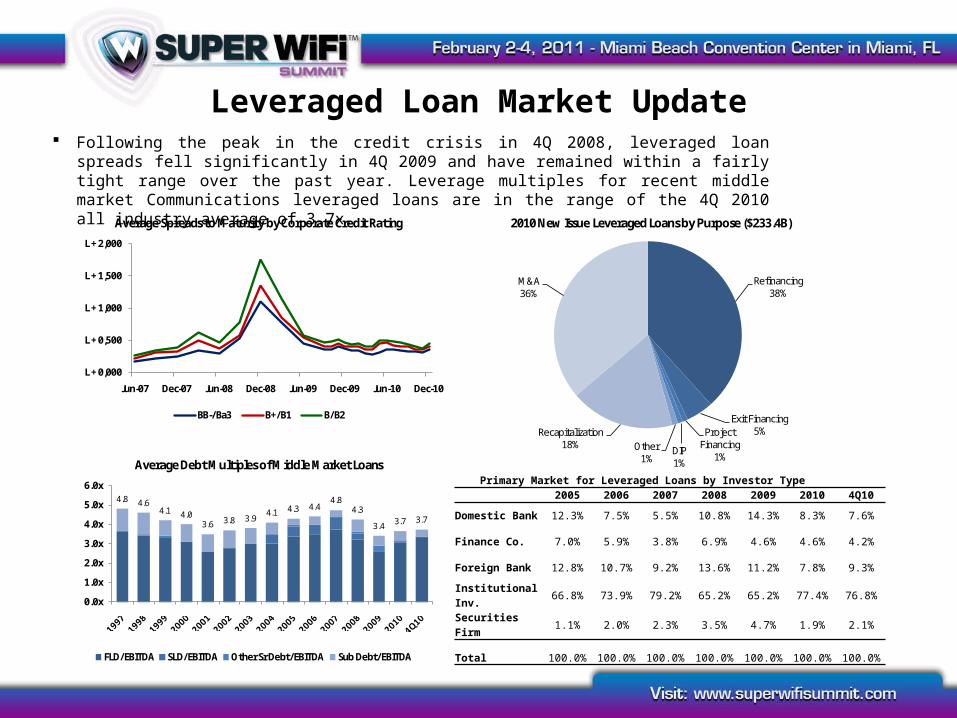
L + 0,000
L + 0,500
L + 1,000
L + 1,500
L + 2,000
Jun-07 Dec-07 Jun-08 Dec-08 Jun-09 Dec-09 Jun-10 Dec-10
Average Spreads to Maturity by Corporate Credit Rating
BB-/Ba3 B+/B1 B/B2
Refinancing38%
Exit Financing5%Project
Financing1%
DIP1%
Other1%
Recapitalization18%
M&A36%
2010 New Issue Leveraged Loans by Purpose ($233.4B)
4.8 4.64.1 4.0
3.6 3.8 3.94.1 4.3 4.4
4.84.3
3.4 3.7 3.7
0.0x
1.0x
2.0x
3.0x
4.0x
5.0x
6.0x
Average Debt Multiples of Middle Market Loans
FLD/EBITDA SLD/EBITDA Other Sr Debt/EBITDA Sub Debt/EBITDA
Leveraged Loan Market Update Following the peak in the credit crisis in 4Q 2008, leveraged loan spreads fell significantly in 4Q 2009 and
have remained within a fairly tight range over the past year. Leverage multiples for recent middle market Communications leveraged loans are in the range of the 4Q 2010 all industry average of 3.7x.
Primary Market for Leveraged Loans by Investor Type 2005 2006 2007 2008 2009 2010 4Q10
Domestic Bank 12.3% 7.5% 5.5% 10.8% 14.3% 8.3% 7.6%
Finance Co. 7.0% 5.9% 3.8% 6.9% 4.6% 4.6% 4.2%
Foreign Bank 12.8% 10.7% 9.2% 13.6% 11.2% 7.8% 9.3%
Institutional Inv. 66.8% 73.9% 79.2% 65.2% 65.2% 77.4% 76.8%
Securities Firm 1.1% 2.0% 2.3% 3.5% 4.7% 1.9% 2.1%
Total 100.0% 100.0% 100.0% 100.0% 100.0% 100.0% 100.0%
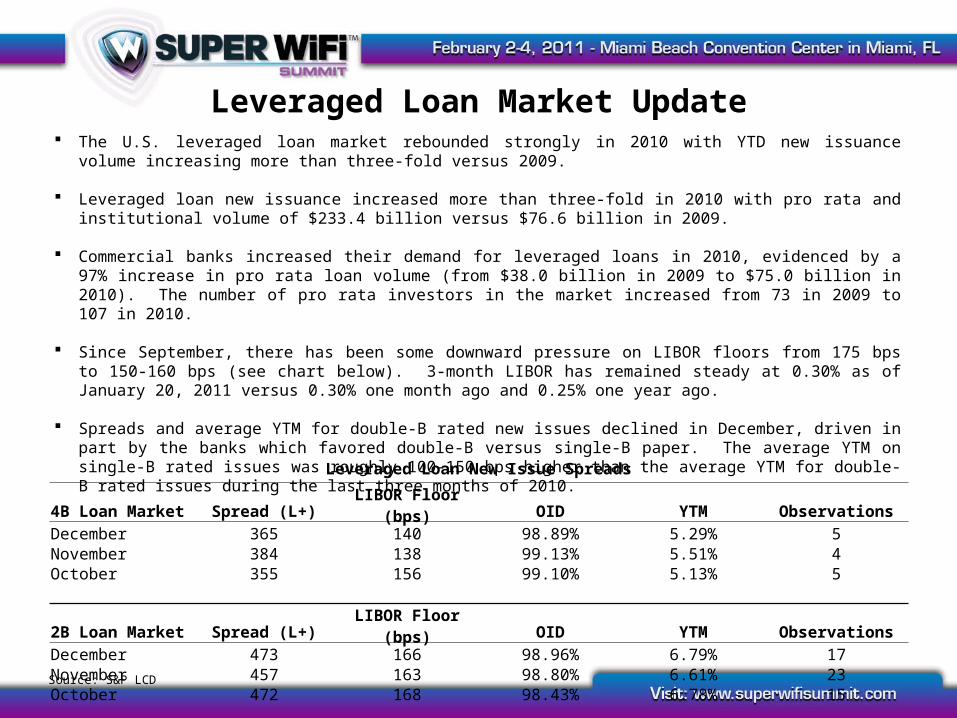
Leveraged Loan Market Update The U.S. leveraged loan market rebounded strongly in 2010 with YTD new issuance volume increasing more than three-fold
versus 2009.
Leveraged loan new issuance increased more than three-fold in 2010 with pro rata and institutional volume of $233.4 billion versus $76.6 billion in 2009.
Commercial banks increased their demand for leveraged loans in 2010, evidenced by a 97% increase in pro rata loan volume (from $38.0 billion in 2009 to $75.0 billion in 2010). The number of pro rata investors in the market increased from 73 in 2009 to 107 in 2010.
Since September, there has been some downward pressure on LIBOR floors from 175 bps to 150-160 bps (see chart below). 3-month LIBOR has remained steady at 0.30% as of January 20, 2011 versus 0.30% one month ago and 0.25% one year ago.
Spreads and average YTM for double-B rated new issues declined in December, driven in part by the banks which favored double-B versus single-B paper. The average YTM on single-B rated issues was roughly 100-150 bps higher than the average YTM for double-B rated issues during the last three months of 2010.
Source: S&P LCD
Leveraged Loan New Issue Spreads
4B Loan Market Spread (L+) LIBOR Floor (bps) OID YTM ObservationsDecember 365 140 98.89% 5.29% 5November 384 138 99.13% 5.51% 4October 355 156 99.10% 5.13% 5
2B Loan Market Spread (L+) LIBOR Floor (bps) OID YTM ObservationsDecember 473 166 98.96% 6.79% 17November 457 163 98.80% 6.61% 23October 472 168 98.43% 6.78% 15
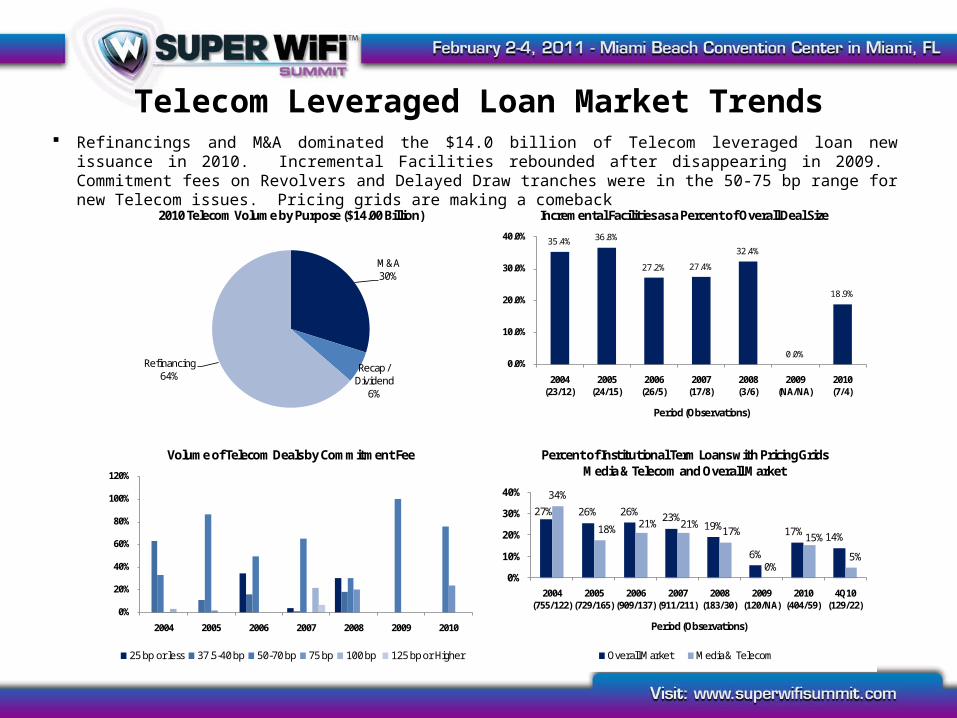
M&A30%
Recap / Dividend
6%
Refinancing64%
2010 Telecom Volume by Purpose ($14.00 Billion)
35.4% 36.8%
27.2% 27.4%
32.4%
0.0%
18.9%
0.0%
10.0%
20.0%
30.0%
40.0%
2004 (23/12)
2005 (24/15)
2006 (26/5)
2007 (17/8)
2008 (3/6)
2009 (NA/NA)
2010 (7/4)
Period (Observations)
Incremental Facilities as a Percent of Overall Deal Size
0%
20%
40%
60%
80%
100%
120%
2004 2005 2006 2007 2008 2009 2010
Volume of Telecom Deals by Commitment Fee
25 bp or less 37.5-40 bp 50-70 bp 75 bp 100 bp 125 bp or Higher
27% 26% 26% 23%19%
6%
17% 14%
34%
18% 21% 21%17%
0%
15%
5%
0%
10%
20%
30%
40%
2004 (755/122)
2005 (729/165)
2006 (909/137)
2007 (911/211)
2008 (183/30)
2009 (120/NA)
2010 (404/59)
4Q10 (129/22)
Period (Observations)
Percent of Institutional Term Loans with Pricing GridsMedia & Telecom and Overall Market
Overall Market Media & Telecom
Telecom Leveraged Loan Market Trends Refinancings and M&A dominated the $14.0 billion of Telecom leveraged loan new issuance in 2010. Incremental Facilities
rebounded after disappearing in 2009. Commitment fees on Revolvers and Delayed Draw tranches were in the 50-75 bp range for new Telecom issues. Pricing grids are making a comeback
Equity Capital Markets Overview
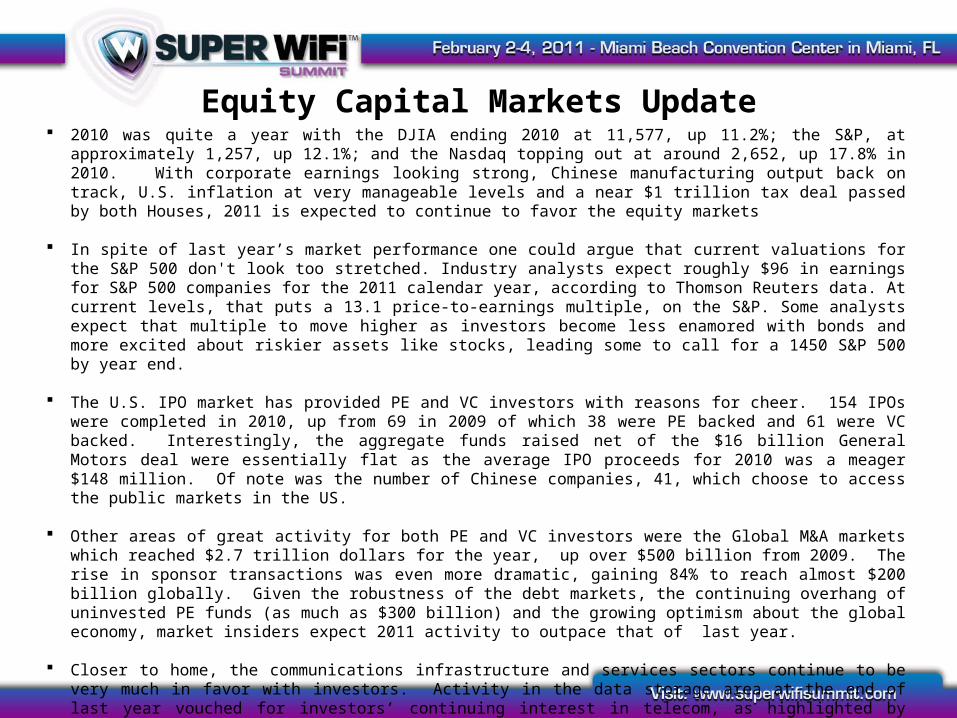
Equity Capital Markets Update 2010 was quite a year with the DJIA ending 2010 at 11,577, up 11.2%; the S&P, at approximately 1,257, up 12.1%; and the
Nasdaq topping out at around 2,652, up 17.8% in 2010. With corporate earnings looking strong, Chinese manufacturing output back on track, U.S. inflation at very manageable levels and a near $1 trillion tax deal passed by both Houses, 2011 is expected to continue to favor the equity markets
In spite of last year’s market performance one could argue that current valuations for the S&P 500 don't look too stretched. Industry analysts expect roughly $96 in earnings for S&P 500 companies for the 2011 calendar year, according to Thomson Reuters data. At current levels, that puts a 13.1 price-to-earnings multiple, on the S&P. Some analysts expect that multiple to move higher as investors become less enamored with bonds and more excited about riskier assets like stocks, leading some to call for a 1450 S&P 500 by year end.
The U.S. IPO market has provided PE and VC investors with reasons for cheer. 154 IPOs were completed in 2010, up from 69 in 2009 of which 38 were PE backed and 61 were VC backed. Interestingly, the aggregate funds raised net of the $16 billion General Motors deal were essentially flat as the average IPO proceeds for 2010 was a meager $148 million. Of note was the number of Chinese companies, 41, which choose to access the public markets in the US.
Other areas of great activity for both PE and VC investors were the Global M&A markets which reached $2.7 trillion dollars for the year, up over $500 billion from 2009. The rise in sponsor transactions was even more dramatic, gaining 84% to reach almost $200 billion globally. Given the robustness of the debt markets, the continuing overhang of uninvested PE funds (as much as $300 billion) and the growing optimism about the global economy, market insiders expect 2011 activity to outpace that of last year.
Closer to home, the communications infrastructure and services sectors continue to be very much in favor with investors. Activity in the data storage area at the end of last year vouched for investors’ continuing interest in telecom, as highlighted by Dell’s purchase of Compellent Technologies for $820 million. The deal was reportedly valued at 4x the company’s 2011 sales which looked relatively cheap compared to HP’s earlier acquisition of 3PAR for 10x forward sales and EMC’s purchase of Isilon Systems for 8-9x forward sales.
Public Equity Capital Markets
$9
-$25-$26
$12
$18
$12$9
$4
-$10-$7
-$3 -$4
$14
$0
$11$13
-$25
-$6-$10
-$17
-$11
-$5
-$19
-$5
-$30-$25-$20-$15-$10
-$5$0$5
$10$15$20$25
Jan-
09
Mar
-09
May
-09
Jul-0
9
Sep-
09
Nov
-09
Jan-
10
Mar
-10
May
-10
Jul-1
0
Sep-
10
Nov
-10
U.S. Equity Mutual Fund Flows ($ in billions)
$33 $38 $42$24 $16
$38
$84 $91$78
$142
$176
$125
$40
$69
$99
$64
$39
$12
$0$20$40$60$80
$100$120$140$160$180$200
2005 2006 2007 2008 2009 2010
Total Equity & Equity Linked Issuance ($ in billions)
IPOs Follow-ons Converts
12%11%
17%
-15%
-10%
-5%
0%
5%
10%
15%
20%
Jan-10 Apr-10 Jul-10 Oct-10 Dec-10
Major Equity Index Performance
S&P 500 ^DJI NASDAQ
$0.0
$5.0
$10.0
$15.0
$20.0
$25.0
$30.0
Jan Feb Mar Apr May Jun Jul Aug Sep Oct Nov Dec
2010 Total Equity & Equity Linked Issuances
IPOs Follow-ons Converts
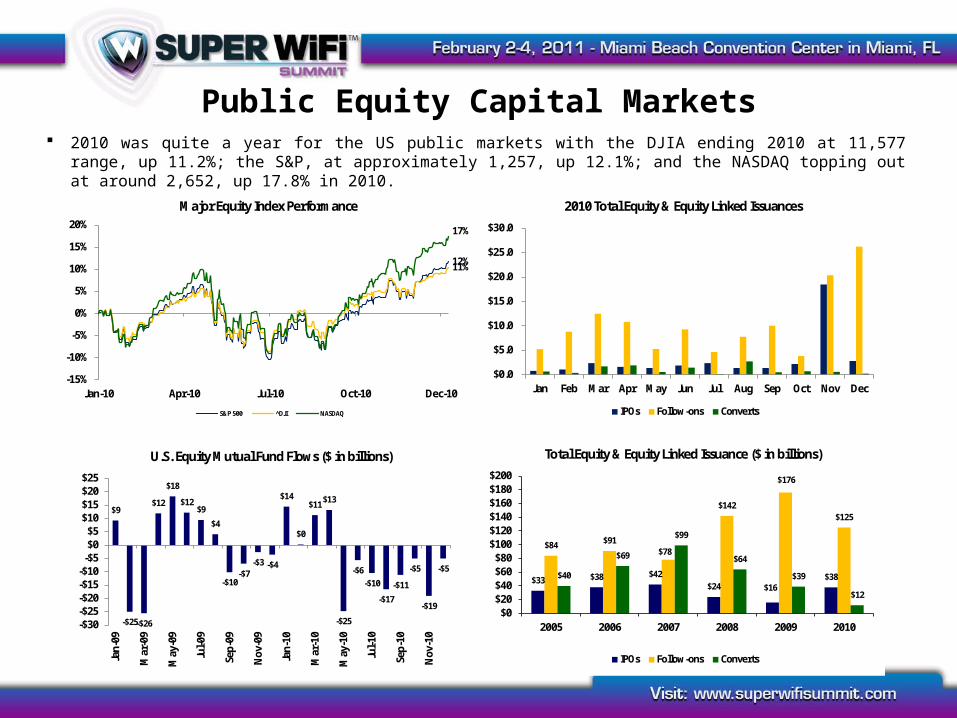
2010 was quite a year for the US public markets with the DJIA ending 2010 at 11,577 range, up 11.2%; the S&P, at approximately 1,257, up 12.1%; and the NASDAQ topping out at around 2,652, up 17.8% in 2010.
Public Equity Capital Markets
0
50
100
150
200
250
300
$-
$10.0 B
$20.0 B
$30.0 B
$40.0 B
$50.0 B
$60.0 B
$70.0 B
2003 2004 2005 2006 2007 2008 2009 2010
# of
Dea
ls
IPO Issuance
Energy9%
Materials3%
Industrials9%
Consumer Discretionary
8%
Consumer Staples
3%
Healthcare16%
Financials33%
Information Technology
18%
Utilities1%
IPO Proceeds 2010 by Sector
0
20
40
60
80
100
$0.0B
$10.0B
$20.0B
$30.0B
$40.0B
$50.0B
Jan-
09
Mar
-09
May
-09
Jul-0
9
Sep-
09
Nov
-09
Jan-
10
Mar
-10
May
-10
Jul-1
0
Sep-
10
Nov
-10
# of
Dea
lsMonthly Follow-On Issuance
Energy, 14%
Materials, 6%Industrials, 5%
Consumer Discretionary,
9%
Healthcare, 12%
Financials, 41% Information Technology,
12%
Utilities, 2%
Follow-On 2010 by Sector
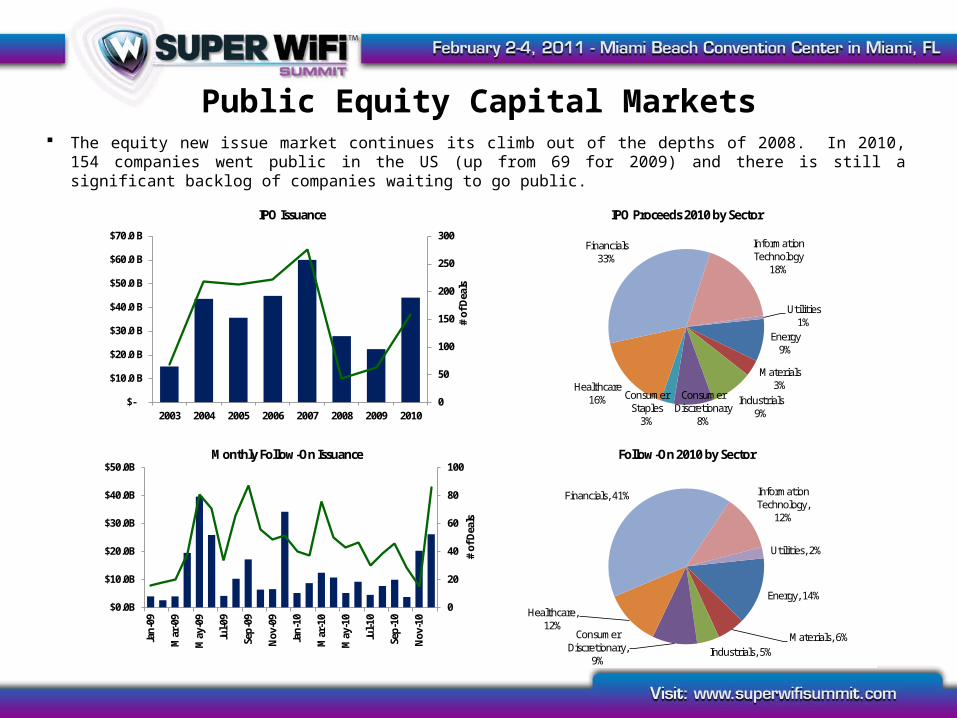
The equity new issue market continues its climb out of the depths of 2008. In 2010, 154 companies went public in the US (up from 69 for 2009) and there is still a significant backlog of companies waiting to go public.
Private Equity Capital Markets
$18.9$21.8 $22.6
$26.1
$30.0$28.1
$18.3
$4.9$6.9
$4.8
$0B
$5B
$10B
$15B
$20B
$25B
$30B
$35B
2003 2004 2005 2006 2007 2008 2009 Q1 2010
Q2 2010
Q3 2010
Total VC Investments in the U.S. Between 2003 - 3Q2010
2,991 3,146 3,194
3,7484,029 4,014
2,916
755962 780
0500
1,0001,5002,0002,5003,0003,5004,0004,500
2003 2004 2005 2006 2007 2008 2009 Q1 2010
Q2 2010
Q3 2010
Total VC Investment in the U.S. Between 2003 - 3Q 2010by Number of Deals
$7.2 $7.3$7.8 $7.7 $7.8
$7.3 $7.1
$5.9
$3.4$4.3
$5.2 $5.4$4.9
$6.9
$4.8
$0B
$3B
$6B
$9B
1Q07
2Q07
3Q07
4Q07
1Q08
2Q08
3Q08
4Q08
1Q09
2Q09
3Q09
4Q09
1Q10
2Q10
3Q10
Total VC Investment in the U.S. Between 1Q07-3Q10
872
1,0681,0161,0731,0241,065
1,004921
637707 716
856755
962
780
0
200
400
600
800
1,000
1,200
1Q07
2Q07
3Q07
4Q07
1Q08
2Q08
3Q08
4Q08
1Q09
2Q09
3Q09
4Q09
1Q10
2Q10
3Q10
Total VC Investment in the U.S. Between 1Q07-3Q10 by Number of Deals
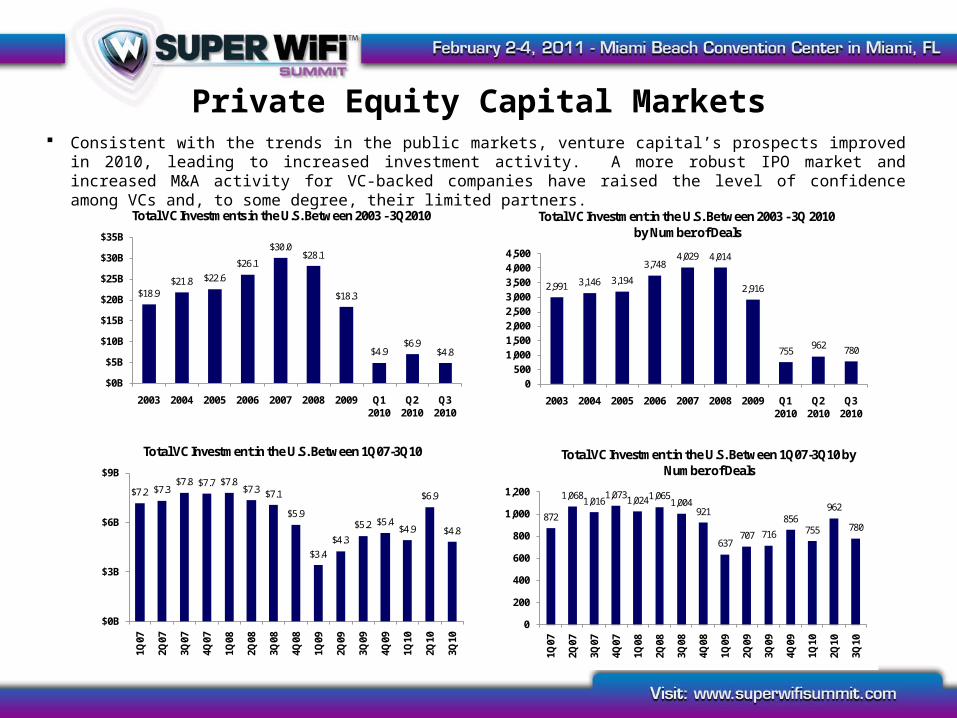
Consistent with the trends in the public markets, venture capital’s prospects improved in 2010, leading to increased investment activity. A more robust IPO market and increased M&A activity for VC-backed companies have raised the level of confidence among VCs and, to some degree, their limited partners.
Private Equity Capital Markets
$0B
$100B
$200B
$300B
$400B
$500B
$600B
$700B
2004 2005 2006 2007 2008 2009
Annual PE Investments (Capital Invested)
$0B
$40B
$80B
$120B
$160B
$200B
$240B
Q1
2005
Q2
2005
Q3
2005
Q4
2005
Q1
2006
Q2
2006
Q3
2006
Q4
2006
Q1
2007
Q2
2007
Q3
2007
Q4
2007
Q1
2008
Q2
2008
Q3
2008
Q4
2008
Q1
2009
Q2
2009
Q3
2009
Q4
2009
Q1
2010
Q2
2010
Q3
2010
PE Investments by Quarter (Capital Invested)
0
200
400
600
800
1,000
Q1
2005
Q2
2005
Q3
2005
Q4
2005
Q1
2006
Q2
2006
Q3
2006
Q4
2006
Q1
2007
Q2
2007
Q3
2007
Q4
2007
Q1
2008
Q2
2008
Q3
2008
Q4
2008
Q1
2009
Q2
2009
Q3
2009
Q4
2009
Q1
2010
Q2
2010
Q3
2010
PE Investments by Quarter (# of Deals)
0
500
1,000
1,500
2,000
2,500
3,000
3,500
2004 2005 2006 2007 2008 2009
Annual PE Investments (# of Deals)
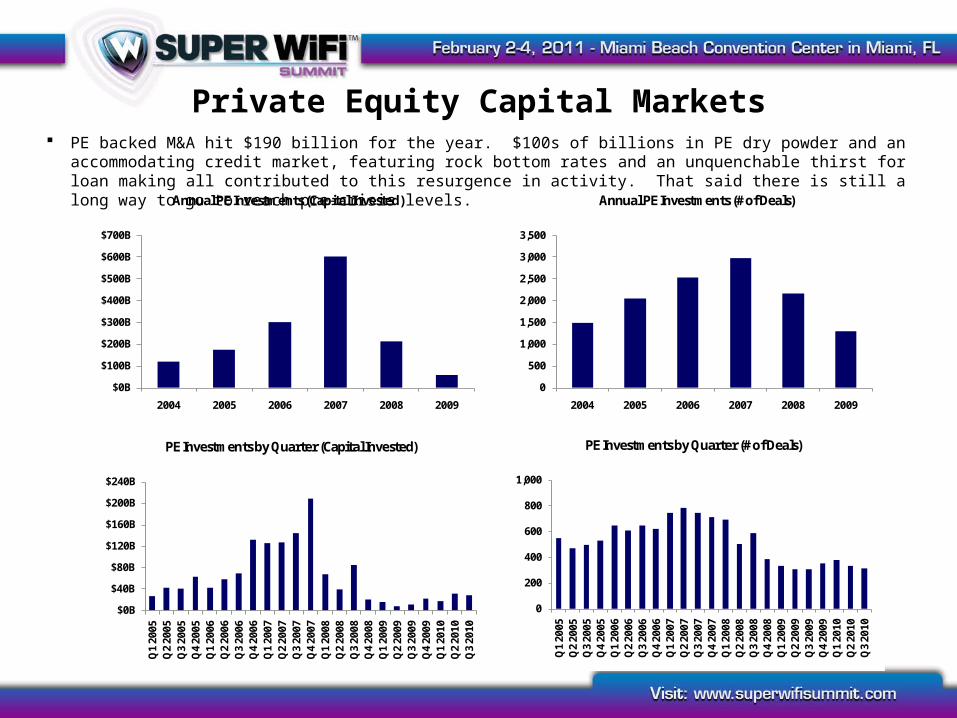
PE backed M&A hit $190 billion for the year. $100s of billions in PE dry powder and an accommodating credit market, featuring rock bottom rates and an unquenchable thirst for loan making all contributed to this resurgence in activity. That said there is still a long way to go to reach pre-crisis levels.
Introduction To Bank Street Group
Introduction to The Bank Street Group
Experience
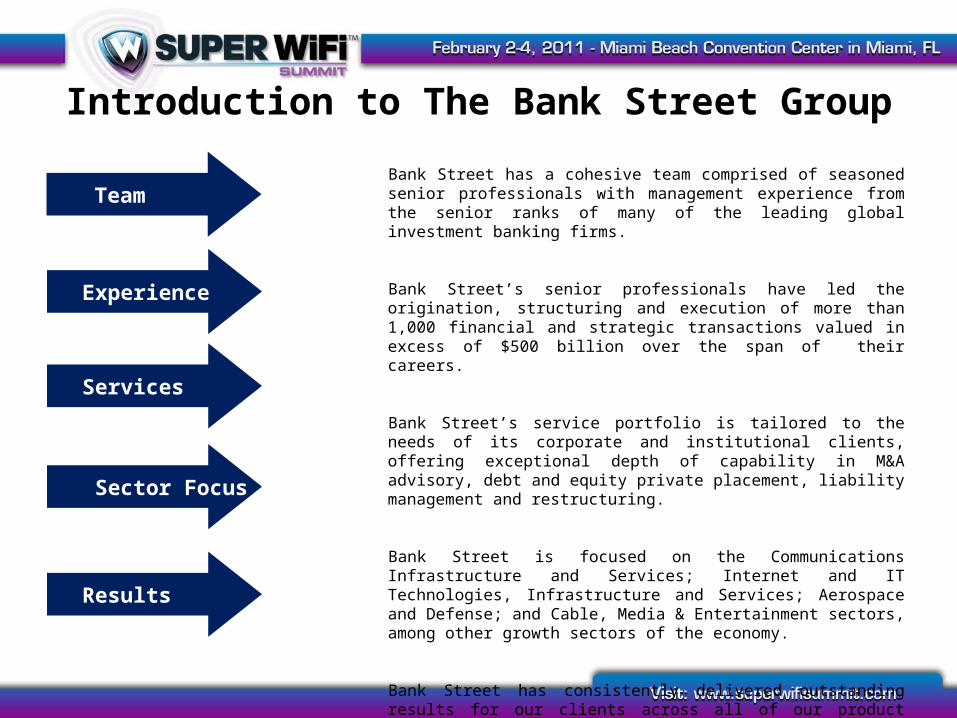
Bank Street has a cohesive team comprised of seasoned senior professionals with management experience from the senior ranks of many of the leading global investment banking firms.
Bank Street’s senior professionals have led the origination, structuring and execution of more than 1,000 financial and strategic transactions valued in excess of $500 billion over the span of their careers.
Bank Street’s service portfolio is tailored to the needs of its corporate and institutional clients, offering exceptional depth of capability in M&A advisory, debt and equity private placement, liability management and restructuring.
Bank Street is focused on the Communications Infrastructure and Services; Internet and IT Technologies, Infrastructure and Services; Aerospace and Defense; and Cable, Media & Entertainment sectors, among other growth sectors of the economy.
Bank Street has consistently delivered outstanding results for our clients across all of our product lines and industry groups, a fact well evidenced by record valuations and the number of firms for which we’ve executed multiple transactions.
Team
Services
Sector Focus
Results
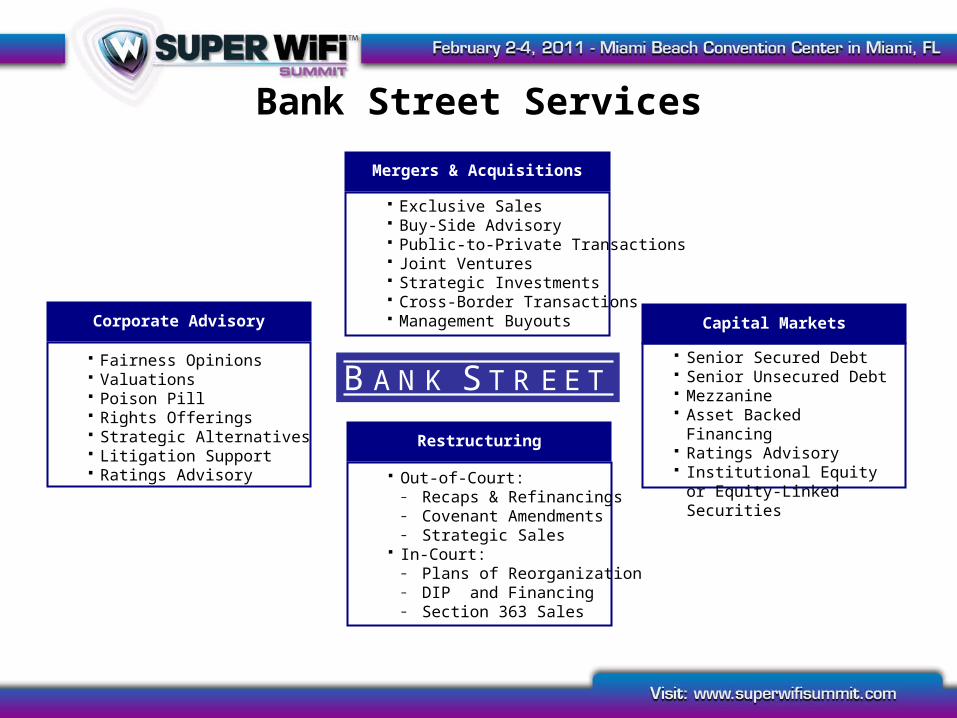
Bank Street Services
Mergers & Acquisitions
Exclusive Sales Buy-Side Advisory Public-to-Private Transactions Joint Ventures Strategic Investments Cross-Border Transactions Management Buyouts Capital Markets
Senior Secured Debt Senior Unsecured Debt Mezzanine Asset Backed Financing Ratings Advisory Institutional Equity or Equity-
Linked Securities
Corporate Advisory
Fairness Opinions Valuations Poison Pill Rights Offerings Strategic Alternatives Litigation Support Ratings Advisory
Restructuring
Out-of-Court:– Recaps & Refinancings– Covenant Amendments– Strategic Sales
In-Court:– Plans of Reorganization– DIP and Financing– Section 363 Sales
B A N K S T R E E T
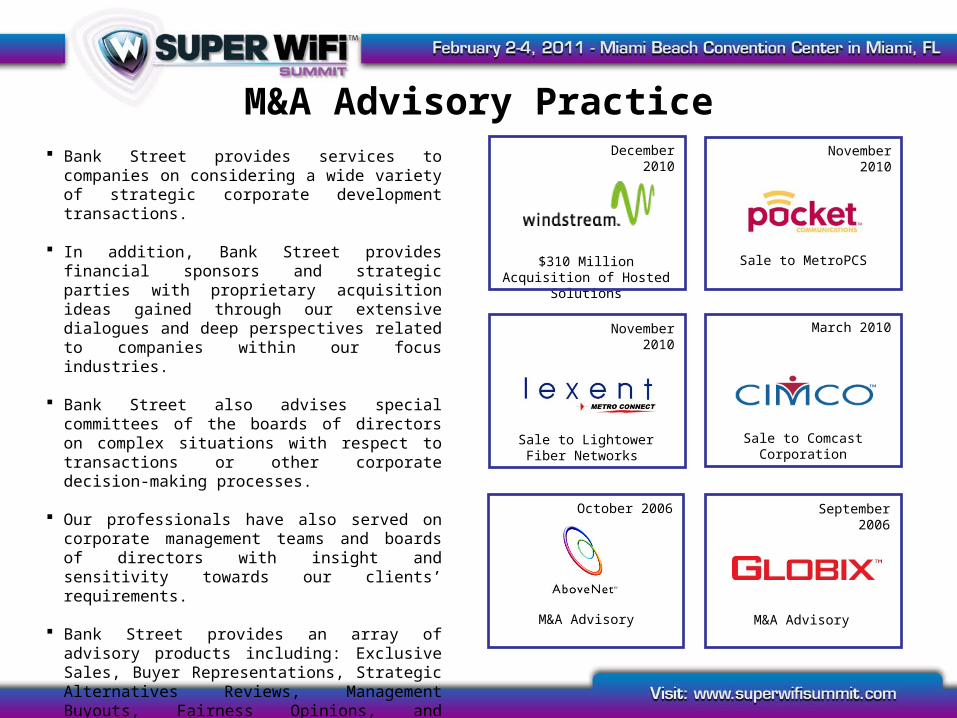
M&A Advisory Practice Bank Street provides services to companies on
considering a wide variety of strategic corporate development transactions.
In addition, Bank Street provides financial sponsors and strategic parties with proprietary acquisition ideas gained through our extensive dialogues and deep perspectives related to companies within our focus industries.
Bank Street also advises special committees of the boards of directors on complex situations with respect to transactions or other corporate decision-making processes.
Our professionals have also served on corporate management teams and boards of directors with insight and sensitivity towards our clients’ requirements.
Bank Street provides an array of advisory products including: Exclusive Sales, Buyer Representations, Strategic Alternatives Reviews, Management Buyouts, Fairness Opinions, and Exclusive Sales.
Sale to Lightower Fiber Networks
November 2010
$310 Million Acquisition of Hosted Solutions
December 2010 November 2010
Sale to MetroPCS
March 2010
Sale to Comcast Corporation
M&A Advisory
September 2006
M&A Advisory
October 2006
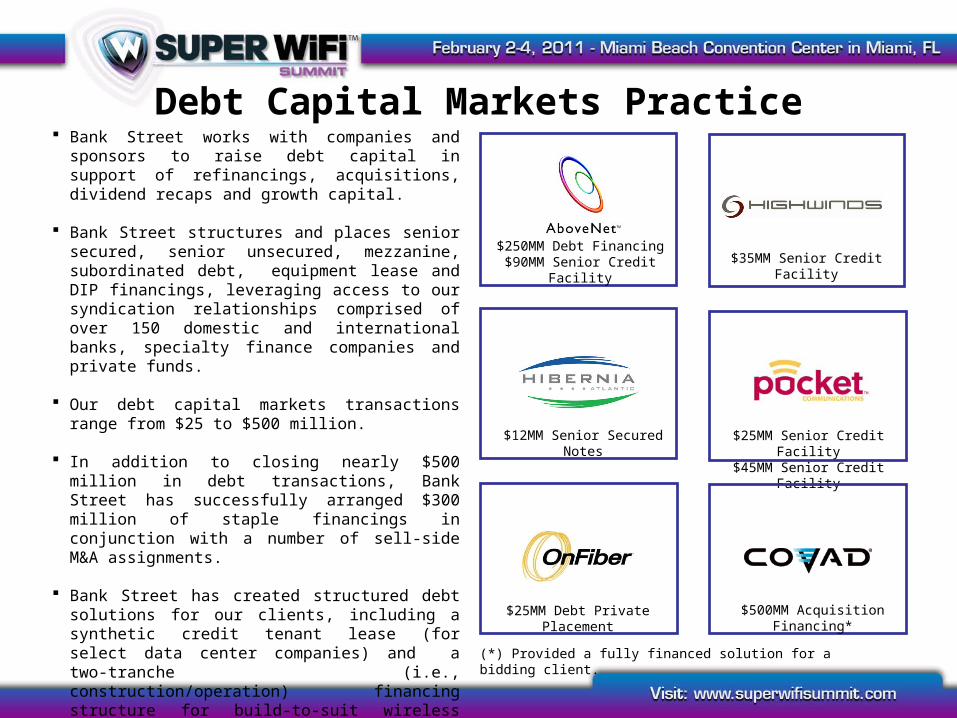
Debt Capital Markets Practice Bank Street works with companies and sponsors to raise
debt capital in support of refinancings, acquisitions, dividend recaps and growth capital.
Bank Street structures and places senior secured, senior unsecured, mezzanine, subordinated debt, equipment lease and DIP financings, leveraging access to our syndication relationships comprised of over 150 domestic and international banks, specialty finance companies and private funds.
Our debt capital markets transactions range from $25 to
$500 million.
In addition to closing nearly $500 million in debt transactions, Bank Street has successfully arranged $300 million of staple financings in conjunction with a number of sell-side M&A assignments.
Bank Street has created structured debt solutions for our clients, including a synthetic credit tenant lease (for select data center companies) and a two-tranche (i.e., construction/operation) financing structure for build-to-suit wireless tower companies.
As part of our M&A and strategic advisory assignments, our debt capital markets team advises clients on credit rating and cost-of-capital implications of strategic transactions.
$250MM Debt Financing$90MM Senior Credit Facility $35MM Senior Credit Facility
$12MM Senior Secured Notes $25MM Senior Credit Facility$45MM Senior Credit Facility
$500MM Acquisition Financing*$25MM Debt Private Placement
(*) Provided a fully financed solution for a bidding client.
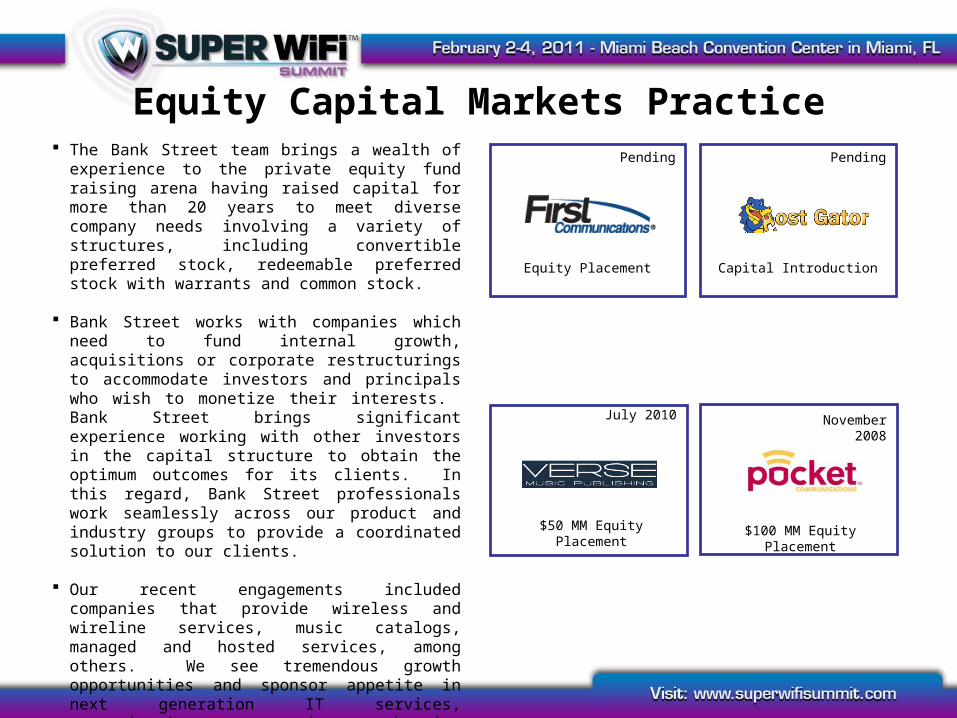
Equity Capital Markets Practice The Bank Street team brings a wealth of experience to the
private equity fund raising arena having raised capital for more than 20 years to meet diverse company needs involving a variety of structures, including convertible preferred stock, redeemable preferred stock with warrants and common stock.
Bank Street works with companies which need to fund internal growth, acquisitions or corporate restructurings to accommodate investors and principals who wish to monetize their interests. Bank Street brings significant experience working with other investors in the capital structure to obtain the optimum outcomes for its clients. In this regard, Bank Street professionals work seamlessly across our product and industry groups to provide a coordinated solution to our clients.
Our recent engagements included companies that provide
wireless and wireline services, music catalogs, managed and hosted services, among others. We see tremendous growth opportunities and sponsor appetite in next generation IT services, communications and hosting infrastructure, virtual/cloud technologies, tech-enabled media, among others.
BSG is interested in working with companies with equity capital needs of $25 million and above.
November 2008
$100 MM Equity Placement
Pending
Equity Placement
$50 MM Equity Placement
Pending
Capital Introduction
July 2010
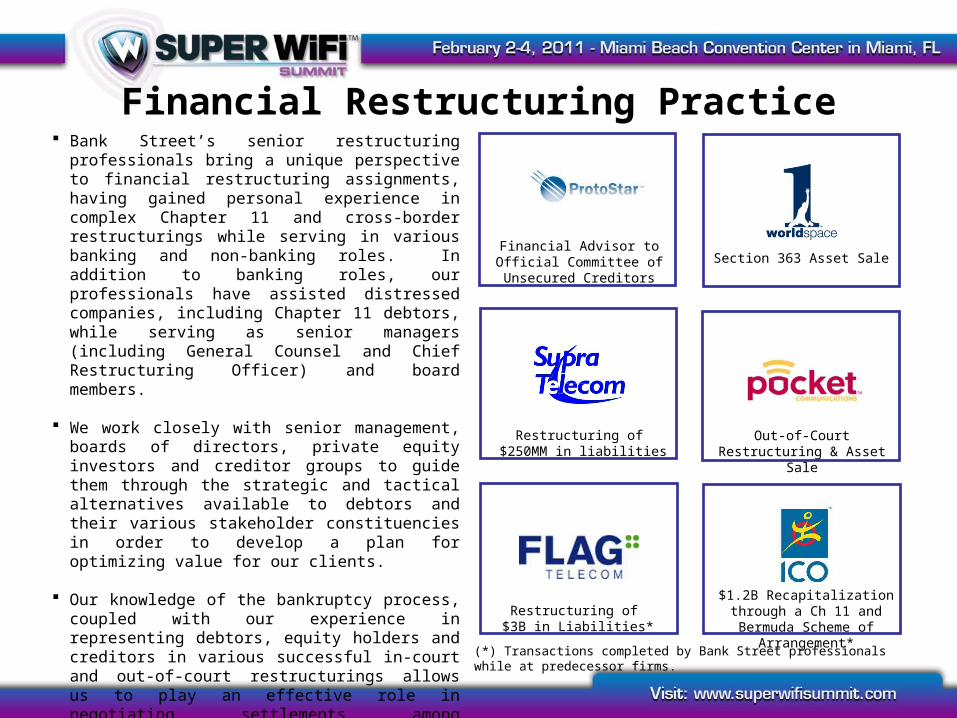
Financial Restructuring Practice Bank Street’s senior restructuring professionals bring a
unique perspective to financial restructuring assignments, having gained personal experience in complex Chapter 11 and cross-border restructurings while serving in various banking and non-banking roles. In addition to banking roles, our professionals have assisted distressed companies, including Chapter 11 debtors, while serving as senior managers (including General Counsel and Chief Restructuring Officer) and board members.
We work closely with senior management, boards of directors, private equity investors and creditor groups to guide them through the strategic and tactical alternatives available to debtors and their various stakeholder constituencies in order to develop a plan for optimizing value for our clients.
Our knowledge of the bankruptcy process, coupled with our experience in representing debtors, equity holders and creditors in various successful in-court and out-of-court restructurings allows us to play an effective role in negotiating settlements among stakeholder constituencies with conflicting objectives.
Our deep and up-to-date domain expertise in our industries of focus allows us to offer unique insight in support of developing and implementing innovative financial restructuring solutions.
Financial Advisor to Official Committee of Unsecured
CreditorsSection 363 Asset Sale
Restructuring of $250MM in liabilities
Out-of-Court Restructuring & Asset Sale
$1.2B Recapitalization through a Ch 11 and Bermuda Scheme of
Arrangement*Restructuring of $3B in Liabilities*
(*) Transactions completed by Bank Street professionals while at predecessor firms.
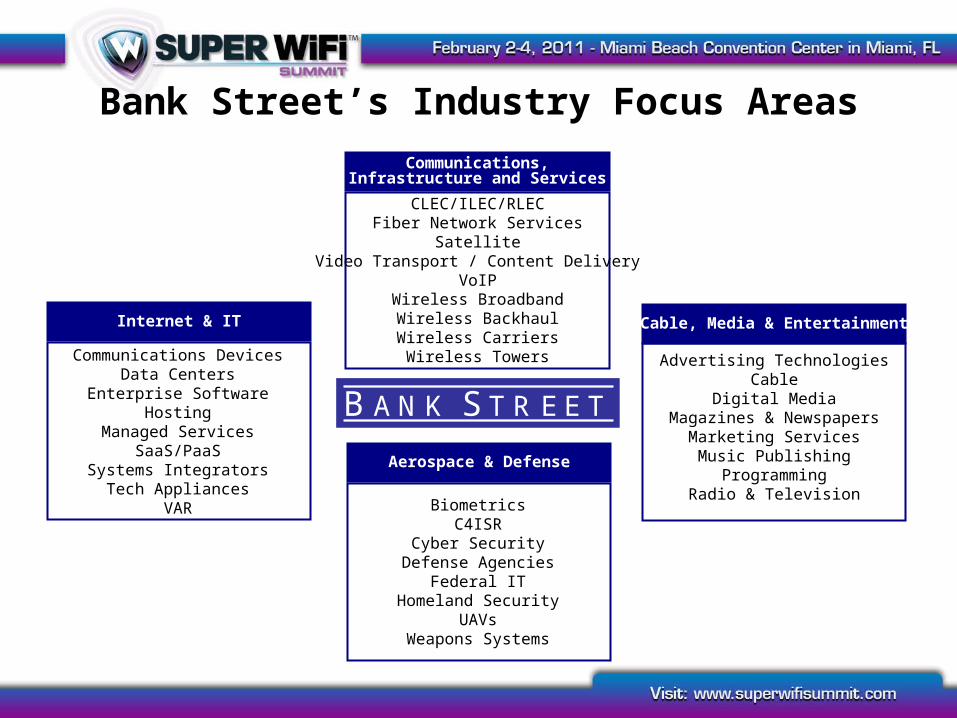
Bank Street’s Industry Focus AreasCommunications, Infrastructure and
Services
CLEC/ILEC/RLECFiber Network Services
SatelliteVideo Transport / Content Delivery
VoIPWireless BroadbandWireless BackhaulWireless CarriersWireless Towers Advertising Technologies
CableDigital Media
Magazines & NewspapersMarketing ServicesMusic Publishing
ProgrammingRadio & Television
Cable, Media & EntertainmentInternet & IT
Communications DevicesData Centers
Enterprise SoftwareHosting
Managed ServicesSaaS/PaaS
Systems IntegratorsTech Appliances
VAR
Aerospace & Defense
BiometricsC4ISR
Cyber SecurityDefense Agencies
Federal ITHomeland Security
UAVsWeapons Systems
B A N K S T R E E T
Richard S. LukajSenior Managing Director
The Bank Street Group