Embed Size (px)
Citation preview

Report Title: Analysis of Aquatic Habitat and Fish Population Data for Fundy Model Forest
Streams
Author: Watershed Technologies
Year of project: 2002
Principal contact information: Watershed Technologies
3 Elm St.
Doaktown, New Brunswick
E9C 1M9
File Name:
Soil_and_Water_2002_Watershed_Technologies_analysis_of_aquatic_habitat_and_fish_populat
ion_data_for_fundy_model_forest_streams
Fundy Model Forest
~Partners in Sustainability~

Fundy Model Forest
The Fundy Model Forest…
…Partners in Sustainability
Atlantic Society of Fish and Wildlife Biologists
Canadian Institute of Forestry
Canadian Forest Service
City of Moncton
Conservation Council of New Brunswick
Fisheries and Oceans Canada
Indian and Northern Affairs Canada
Eel Ground First Nation
Elgin Eco Association
Elmhurst Outdoors
Environment Canada
Fawcett Lumber Company
Fundy Environmental Action Group
Fundy National Park
Greater Fundy Ecosystem Research Group
INFOR, Inc.
J.D. Irving, Limited
KC Irving Chair for Sustainable Development
Maritime College of Forest Technology
NB Department of the Environment and Local Government
NB Department of Natural Resources
NB Federation of Naturalists
New Brunswick Federation of Woodlot Owners
NB Premier's Round Table on the Environment & Economy
New Brunswick School District 2
New Brunswick School District 6
Nova Forest Alliance
Petitcodiac Sportsman's Club
Red Bank First Nation
Remsoft Inc.
Southern New Brunswick Wood Cooperative Limited
Sussex and District Chamber of Commerce
Sussex Fish and Game Association
Town of Sussex
Université de Moncton
University of NB, Fredericton - Faculty of Forestry
University of NB - Saint John Campus
Village of Petitcodiac
Washademoak Environmentalists
“The Fundy Model Forest (FMF) is a partnership of 38 organizations that are promoting
sustainable forest management practices in the Acadian Forest region.”

Analysis of Aquatic Habitat and
Fish Population Data
for
Fundy Model Forest Streams
Prepared by
Watershed Technologies 3 Elm Street
Doaktown, NB E9C 1M9
March 2002

“Ecological restoration is a holistic approach not achieved through isolated manipulation of individual elements, but through approaches ensuring that natural ecological processes occur.”
National Research Council, 1992
“Clearly, the widespread practice of engineered structural modifications to stream with little or no scientific evidence biological benefits represents a management paradox of immense proportion.”
Kauffman, et al., 1997. Fisheries, Volume 22.

Analysis of Aquatic Habitat and Fish Population Data for FMF Streams i
TABLE OF CONTENTS
TABLE OF CONTENTS .............................................................................................................. i
EXECUTIVE SUMMARY ......................................................................................................... iii
INTRODUCTION..........................................................................................................................1
METHODS .....................................................................................................................................3
RESULTS and DISCUSSION ......................................................................................................4
Aquatic Habitat Information ............................................................................................4
A. Kennebecasis River Basin........................................................................................4
1. Main Stem Kennebecasis and Tributaries..........................................................4 2. Millstream and Tributaries.................................................................................4 3. Trout Creek and Tributaries...............................................................................5 4. Smiths Creek and Tributaries.............................................................................5 5. South Branch and Negro Brook.........................................................................5 6. Basin-wide Habitat Quality for Atlantic Salmon...............................................6
B. Hammond River Basin.............................................................................................6 1. Hammond Main Stem Headwaters ....................................................................6 2. North Branch......................................................................................................6
Water Quality.....................................................................................................................7
A. Oxygen and Temperature.........................................................................................7 B. Alkalinity .................................................................................................................7 C. Total Phosphate........................................................................................................8 D. Suspended Solids .....................................................................................................8
Ecoreach Identification .....................................................................................................8
A. Main Stem Kennebecasis.........................................................................................9 B. Millstream................................................................................................................9 C. Trout Creek ..............................................................................................................9 D. Smiths Creek..........................................................................................................11 E. South Branch..........................................................................................................11
Fish Population Information...........................................................................................11
A. Species Present.......................................................................................................11 B. Atlantic Salmon Redd Counts................................................................................12 C. Upstream Migrations at the McCully Station Counting Fence..............................13

Analysis of Aquatic Habitat and Fish Population Data for FMF Streams ii
Table of Contents – Cont’d
D. Stream Population Studies (Electrofishing)...........................................................13
1. Main Stem Kennebecasis.................................................................................14 2. Millstream........................................................................................................15 3. Trout Creek ......................................................................................................15 4. Smiths Creek....................................................................................................16 5. South Branch....................................................................................................17
Potential Salmonid Production.......................................................................................17
A. Kennebecasis River Basin......................................................................................17
1. Main Stem Kennebecasis.................................................................................17 2. Millstream........................................................................................................18 3. Trout Creek ......................................................................................................19 4. Smiths Creek....................................................................................................19 5. South Branch....................................................................................................19
B. Hammond River Basin...........................................................................................20 1. Hammond Main Stem Headwaters (above Hillsdale) ...............................20 2. North Branch Hammond River..................................................................20
Fish and abitat Monitoring Program.............................................................................20
A. Suggested Approach ..............................................................................................21
1. Performance Indicators ..............................................................................21 2. Program Review.........................................................................................22 3. Who Pays? .................................................................................................22
RECOMMENDATIONS.............................................................................................................42
ACKNOWLEDGEMENTS ........................................................................................................44
REFERENCES.............................................................................................................................45
APPENDICES
Appendix A – Habitat Assessment Reports for Hammond River Streams within the Fundy Model Forest....................................................................Binder 1
Appendix B – Habitat Assessment Reports for Hammond River Streams within the Fundy Model Forest....................................................................Binder 1
Appendix C - Atlantic Salmon Redd Counts for Stream Sections within the Kennebecasis River Basin ....................................................................47
Appendix D – Salmonid Production Potentials by Ecoreach for Kennebecasis Stream Sub-basins and Tributaries.......................................................................... Binder 2 Appendix E – Salmonid Production Potential for Hammond River Streams within the Fundy Model Forest ...................................................................Binder 2

Analysis of Aquatic Habitat and Fish Population Data for FMF Streams iii
EXECUTIVE SUMMARY Habitat and fish production data for Kennebecasis and Hammond streams within the Fundy Model Forest has been analyzed to (1) identify stream ecoreaches (habitat management units); (2) appreciate Atlantic salmon abundance; (3) estimate potential salmonid production from habitat variables; and (4) suggest a fish and habitat monitoring program. Watershed management suggestions are also offered. Habitat inventories identified “ecoreaches” with similar geomorphological and temperature conditions within primary stream sections. Potential salmonid production was estimated assuming habitat conditions control the stream density of salmonids.
Kennebecasis basin streams contain 2.8 million square meters (m2) of habitat, comprised of 10% riffles, 66% runs and 24% pools. The main stem Kennebecasis and its smaller tributaries contain 1.44 million m2 of aquatic habitat, but only five percent of this area is comprised of riffles, considered productive area for Atlantic salmon juveniles Brook trout habitat is also limited on the main stem Kennebecasis due to limited riparian cover, presence of fine substrates and cool
(∃21ºC), rather than cold, water temperatures. Most small tributary streams to the main Kennebecasis and headwaters of sub-basins (Millstream, Trout Creek, Smiths Creek, and South Branch) offer fair to good habitat conditions for trout. Water qualities are favourable to fish production with the unusual exception of low or non-existent flows in the main stem Kennebecasis and South Branch headwaters. Suspended solid concentrations indicate excessive riparian and/or up-slope erosion throughout much of the basin. Redd counts indicate self-sustaining Atlantic salmon populations in Millstream, Trout Creek, and Smiths Creek, but trend information for salmon or trout juvenile salmonid densities are not available. Juvenile density studies by Fisheries and Oceans Canada indicate a large decline of Atlantic salmon spawning escapement in the main stem Kennebecasis; brook trout density information is limited to UNB estimates in 1996, 1997 and 1998 that found fair to good populations on the upper main stem Kennebecasis and South Branch. Juvenile salmon densities in Smiths Creek appear to have declined substantially since 1997. Annual redd counts and salmonid density studies should be stratified for riffle and run habitat types within ecoreaches. The counting fence on mainstream Kennebecasis enumerated 127 (1996) and 119 (1997) adult salmon probably destined to spawn in the upper two ecoreaches. The potential egg deposition from these fish would be about 1 egg/m2, less than one-half the DFO conservation requirement of 2.4 eggs/m2. Kennebecasis streams have potential to produce 390 (worst case) to 3936 (best case) adult Atlantic salmon. Production from three large sub-basins (Millstream, Trout Creek and Smiths Creek,) is similar to mainstream production, although the sub-basins have 600,000 m2 less aquatic habitat. Potential brook trout production (density) is high for headwater Ecoreaches 4 and 5 for main stem Kennebecasis and the upper portions of Ecoreach 3 and associated Stone and McLeod brooks. Trout population potential is also high in Sharp Brook (Millstream tributary); Ecoreach 14 of Trout Brook; McGregor and Sally brooks (Smiths Creek tributaries); and the South Branch.

Analysis of Aquatic Habitat and Fish Population Data for FMF Streams iv
A monitoring program to assess present fish and habitat conditions, as well as to identify ecological stress, is suggested through assessment of marginal stream temperatures (18-21ºC summer afternoon temperature), fish assemblages, salmonid densities and sedimentation. Future restoration and conservation activities require a basin restoration “blueprint” or strategic plan accepted by stakeholders and basin resource users and managed by a permanent staff with supporting infrastructure.

Analysis of Aquatic Habitat and Fish Population Data for FMF Streams 1
INTRODUCTION
This study assesses past habitat and fish population work on streams in the Kennebecasis River
and Hammond River basins within the Fundy Model Forest Hammond River basin (Figure 1).
Previous aquatic studies by the University of Moncton researchers are not included.
The purpose of this study is to:
1. analyze available aquatic habitat and fish population data;
2. define stream management units (ecoreaches) important for sampling and monitoring
river health, as well as for stratifying management activities;
3. estimate potential salmonid populations based on habitat variables, highlighting those
streams or stream sections most productive to salmonids;
4. suggest a basin-wide stream monitoring program for conservation groups to measure the
cumulative watershed effects of land-use practices; and
5. suggest strategies and basin locations where watershed conservation groups could direct
management efforts.

Analysis of Aquatic Habitat and Fish Population Data for FMF Streams 2

Analysis of Aquatic Habitat and Fish Population Data for FMF Streams 3
METHODS
Habitat, fish population and Atlantic salmon redd count data were obtained from the
Kennebecasis Watershed Restoration Committee, the New Brunswick Department of Natural
Resources and Energy (DNRE), the Federal Department of Fisheries and Oceans (DFO),
University of New Brunswick (UNB), Hammond River Anglers Association and the New
Brunswick Aquatic Data Warehouse.
Habitat information was summarized utilizing DNRE’s Fishstream I computer program.
Potential salmonid production was generated from DNRE’s Fishstream II computer program
using the basic assumption that habitat conditions control the occurrence or absence of a
species at a stream site and can be indicative of fish density (e.g., Clarkson and Wilson,
1995). Since salmonid population estimates stratified by ecoreach or habitat type were
unavailable for the Kennebecasis basin streams, production parameters from similar
reference streams in northeast New Brunswick were used. Cool water production values
were utilized for streams with late afternoon summer temperatures > 21oC whereas coldwater
production values were utilized for streams with ≤ 21oC late afternoon summer temperatures.
Ecoreach identification was determined by reviewing field habitat data, digital terrain
models, and site visits.
Recommendations for basin-wide monitoring, as well as priority areas for future
management initiatives are based on the above information, interviews with watershed group
personnel, site visits, and literature reviews.

Analysis of Aquatic Habitat and Fish Population Data for FMF Streams 4
RESULTS and DISCUSSION
Aquatic Habitat Information
Riffles are the most important production areas for aquatic insects and juvenile salmonids,
especially Atlantic salmon. Brook trout require cold (≤18°C, p.m.) summer water temperatures,
moderate to abundant overhanging vegetation and substrate cover. A brief description of habitat
types and quantities is presented. Specific habitat conditions are detailed in Appendices A and B.
A. Kennebecasis River Basin
1. Main Stem Kennebecasis and Tributaries
This primary stream has 1.44 million m2 of aquatic habitat comprised of 79% runs
(flat, slow moving water), 16% pools and only 5% riffles (Table 1a; Appendix A).
Almshouse and Musquash tributaries have limited aquatic area (<35,000 m2).
Moosehorn Creek with 96,000 m2 (20%) of rifles, but very limited overhanging
cover. McLeod Brook has 30,000 m2 of coldwater habitat with moderate to dense
overhanging vegetation. Stone Brook has 23,000 m2 of coldwater habitat with about
one-half with 30% or more overhanging vegetation.
2. Millstream and Tributaries
Main stem Millstream has 303,966 m2 of aquatic habitat, of which only 13% is riffle
type habitat (Table 1a; Appendix A). Tributaries entering Millstream are small
(<35,000 m2) and have only 1% riffle habitat type excepting Mill Brook with 15%
riffle area. Overhanging vegetation is very limited in Mill Book, only moderate in
Sharp Brook (19,000 m2) and dense or ideal in McNair Book (16,000 m2)
(Appendix A).

Analysis of Aquatic Habitat and Fish Population Data for FMF Streams 5
3. Trout Creek and Tributaries
This sub-basin has 373,646 m2 of aquatic habitat area; riffle areas range from 11 to
32% (Table 1a; Appendix A). Trout Creek and its tributaries have more aquatic
habitat diversity than other Kennebecasis sub-basins, yet they have been subject to
more severe human abuses. Trout Creek has fluctuating summer water temperatures
and sparse overhanging cover, including headwater areas. Ward Creek (88,000 m2;
11% riffles), Parsons Creek (5,000 m2; 12% riffles), Mill Brook (12,000 m2; 3%
riffles), Parlee Brook (36,000 m2; 22 % riffles) and Cedar Camp Brook (53,000 m2;
12% riffles) have very limited overhanging vegetation (Appendix A).
4. Smiths Creek and Tributaries
Smiths Creek and its coldwater tributaries (McGregor Brook, Windgap Brook and
Sally Brook) provide 369,000 m2 of aquatic habitat (Table 1a; Appendix A). Smiths
Creek and Windgap Brook have limited overhanging vegetation, but McGregor Book
(10,000 m2; 19% riffles) and Sally Book (21,000 m2; 1% riffles) have abundant
overhanging vegetation.
McGregor and Sally brooks are important streams requiring additional habitat
inventories to assess habitat in headwater areas.
5. South Branch and Negro Brook
South Branch and Negro Brook have 81,000 m2 of aquatic habitat comprised of 15%
and 33% riffle areas, respectively (Table 1a; Appendix A). These coldwater streams
may have fair to good production potential for salmonids (pending stable water flows)
since overhanging vegetation is moderate to dense, respectively.

Analysis of Aquatic Habitat and Fish Population Data for FMF Streams 6
6. Basin-wide Habitat Quality for Atlantic Salmon
Main stem Kennebecasis and small tributaries have very limited habitat area for
juvenile Atlantic salmon production; only five percent or 97,000 m2 of habitat can be
considered as good production area (Table 1a; Appendix A). Fair to good production
areas for Atlantic salmon are also limited in Millstream (59,000 m2), Trout Creek
(82,000 m2), Smith Creek (30,000 m2) and South Branch (14,000 m2). Trout Creek’s
larger and diversified habitat indicate that, potentially, it is the most important sub-
basin for Atlantic salmon production
A site survey in September 2001 found main stem Kennebecasis headwaters without
surface flow with virtually no aquatic habitat from the confluence of the Big Spring at
Portagevale upstream to Goshen. Land-use practices, especially forest harvesting,
may be partially responsible for degrading this important salmonid production area.
B. Hammond River Basin
1. Hammond Mainstream Headwaters (above Hillsdale)
Aquatic habitat is limited to 72,000 m2 on the mainstream Hammond River above
Hillsdale. Riffle areas account for only 22% of the habitat (Table 1b; Appendix B).
About 12,000 m2 of the habitat are covered by 40% or more overhanging vegetation.
This may not be a coldwater stream.
2. North Branch Hammond River
North Branch waters contain 45,000 m2 of aquatic habitat, but riffle types comprise
32% of the habitat types. (Table 1b; Appendix B). About 11,000 m2 of the habitat
types present are covered with 40% or more overhanging vegetation suggesting a cool
water stream.

Analysis of Aquatic Habitat and Fish Population Data for FMF Streams 7
Water Quality
There have been several water sampling programs for Kennebcasis streams since 1994. The
following parameters are presented below to assess water quality conditions for aquatic life in
the absence of industrial pollution: oxygen, temperature, alkalinity, total phosphate and
suspended solids.
A. Oxygen and Temperature
Oxygen is usually considered the most important factor for supporting aquatic life.
Oxygen concentrations throughout basin streams represent saturated (ideal) conditions, the
result of atmospheric pressure on revolving surface waters, absence of industrial pollution
and photosynthesis by green plants.
Summer stream temperatures determine the presence of brook trout. Trout avoid areas with
temperatures above 21oC unless groundwater sources are present to provide areas of refuge.
Most summer temperatures in Kennebecasis basin streams are suitable for brook trout
excepting the main stem Kennebecasis below the South Branch confluence and the lower
reaches of Trout Creek, Smiths Creek and Millstream. Temperatures are suitable for
Atlantic salmon.
B. Alkalinity
Alkalinity of water is a measure of water’s capacity to neutralize acids, for example, to buffer
acid rain. Alkalinity is expressed as mg/l of calcium carbonate. Kennebecasis basin waters
have relatively high alkalinities (ranging from 50 to 150 mg/l) compared to most other New
Brunswick waters. Higher alkalinity enhances growth and development of aquatic life.
Analysis of Aquatic Habitat and Fish Population Data for FMF Streams 8
C. Total Phosphate
High phosphate levels (0.015 to 0.06 mg/l) of Kennebecasis streams (perhaps the highest
levels for streams in New Brunswick) are very beneficial to aquatic life. The phosphate
occurs from leaching or agricultural drainage. Phosphates, which are usually the single most
limiting nutrient in aquatic life, are utilized by aquatic plants, subsequently benefiting insect
and fish production. Higher alkalinities improve phosphate utilization by aquatic life, further
enhancing production.
D. Suspended Solids
Suspended solids are suspended and colloidal matter in water that diminishes the penetration
of light, often called turbidity. Clay, silt, erosion, sewage, industrial waste from mining,
logging, or shoreline development can influence suspended solids or turbidity. Suspended
solids are rarely directly lethal to aquatic life, but the duration and quantity of suspended
solids can have devastating effects on aquatic insects and fish (Newcombe and MacDonald,
1991).
Suspended solids are generally high (30 mg/l or more) for most Kennebecasis streams; the
location, extent and sources of suspended sediments should be a high priority for study. A
monitoring program is suggested in a subsequent section of this report.
Ecoreach Identification
“Ecoreaches” are streams or stream sections with similar geomorphological and temperature
conditions (Vanotte, 1980; (Frissell, et al., 1986; Whittier and Hughes, 1988). They represent
unique, individual management and sampling units as their uniform habitat controls the presence
and abundance of aquatic insects and fish (Clarkson and Wilson, 1995; Hooper, 1997).

Analysis of Aquatic Habitat and Fish Population Data for FMF Streams 9
A. Main Stem Kennebecasis River
Five ecoreaches or management units have been identified from the 1994 habitat surveys,
the digital terrain model and site visits (Figure 2 and Table 2). Each ecoreach provides
similar habitat features throughout that determine aquatic species presence, size and
abundance. For example, the lower three main stem ecoreaches below the South Branch
confluence provide fall, winter and spring habitat for salmonids, but poor summer habitat
due to warm temperatures, absence of cover and small substrate, excepting the upper
reaches of Ecoreach 3 that exhibits marginal temperatures. Main stem Ecoreaches 4 and 5
provide good summer habitat for salmonids due to cold temperatures, overhanging cover
and larger substrate. However, Ecoreach 5 is especially vulnerable to dewatering during
the late summer and winter months, a condition that could nullify any salmonid production.
B. Millstream
Millstream’s two ecoreaches are separated at the Beatty Brook confluence (Figure 2 and
Table 2). The lower ecoreach has warm summer temperatures, a slight gradient, sand and
gravel substrate, and is vulnerable to stream bank erosion. The upper ecoreach has a
moderate gradient, frequent riffle areas, larger substrate, good stream bank integrity, and
cold waters.
C. Trout Creek
This sub-basin’s varied geomorphological conditions provides three ecoreaches or
management / sampling units: below Parlee Brook confluence (Ecoreach 12), above Parlee
Brook confluence (and including Parlee Brook) to Trout Creek falls (Ecoreach 13) and
above Trout Creek falls including Cedar Camp Brook (Ecoreach 14).
Ecoreach 12 has unusual summer temperature fluctuations probably due to instream,
riparian and upslope activities. Ecoreach 13 has cool summer temperatures while Ecoreach
14 has cold temperatures, less gradient, small substrate, and narrow bank channel width.

Analysis of Aquatic Habitat and Fish Population Data for FMF Streams 10

Analysis of Aquatic Habitat and Fish Population Data for FMF Streams 11
D. Smiths Creek
Ecoreach 8 and 9 are separated by Windgap Brook. The lower ecoreach has a slight
gradient and is characterized by meandering stream channel, fine substrate, few riffles
areas and warm (>21oC) summer temperatures. The upper reach has cold summer
temperatures, more frequent riffles, and narrow stable stream banks.
E. South Branch
A ledge falls and steep valley slope separate Ecoreaches 10 and 11 on South Branch. The
lower ecoreach has a meandering channel through a floodplain, fine substrate, and
numerous pools and runs. The upper ecoreach has a higher gradient, larger substrate and
more riffles. Both ecoreaches have cold summer temperatures.
Fish Population Information
A. Species Present
1. Native Salmonids: Brook trout (Salvelinue fontinalis); Atlantic salmon (Salmo salar)
2. Non-native Salmonids: Rainbow trout (Oncorhynchas mykiss) (probably not self-sustaining) Brown trout (Salmo trutta)
3. “Potential” Game Fish: Chain pickerel (Esox niger) Burbot (Lota lota) Brown bullhead (Ictalurus nebulosis) American eel (Anguilla rostrata) American smelt(Osmerus mordax)
4. Sucker and Minnow Species: White sucker (Catostomus commersoni) Longnose sucker (Catostomus catostomus) Pearl dace (Phoxinus margarita) Finescale dace (Phoxinus neogaeus) Blacknose dace (Rhinichthys atratulus)
Analysis of Aquatic Habitat and Fish Population Data for FMF Streams 12
Common shiner (Notropis cornutus) Golden shiner (Notemigonus chrysoleucas)
5. Anadromous Species: Blueback herring (Alosa aestivalis) Gaspereau (Alosa pseudoharengus) Lamprey eel (Petromyzon marinus) Shortnose sturgeon (Acipenser brevirostrum)
6. Other Species: Slimy sculpin (Cottus cognatus)
B. Atlantic Salmon Redd Counts
Female Atlantic salmon excavate one or more nests or “redds” in gravel and rubble
substrate to deposit their eggs. The freshly excavated redds can be identified by their
rounded or elliptical shape, light substrate color, and elevated appearance. Redd counts
provide an index of female spawning escapement.
Redd counts occurred in 1997, 1999 and 2000 on various sections of Trout Creek, Smiths
Creek and Millstream (Appendix C). Most “index” section counts are not directly
comparable, but the counts do provide information that adult Atlantic salmon returns to
Trout Creek in 1997, 1999 and 2000 were substantial, as were returns to Millstream in
2000 and Smiths Creek in 1997 and 2000.
Redd index counts should be continued annually on specific Kennebecasis basin stream
sections with good spawning habitat to monitor spawning escapement and redd count
trends. These parameters can often be correlated with the following year fingerling
densities.
Redd counts are not required, in future, for Wards Creek or Parlee Brook. Smiths Creek
counts are required only for SFGA sections 14 and 15. Trout Creek redd counts are
required from SFGA sections 1 and 2 (Ecoreach 13), and 4 and 5 (Ecoreach 12). A redd
count index section is required in main stem Kennebecasis Ecoreach 4, perhaps from the
Trans-Canada Highway bridge downstream to the South Branch confluence.

Analysis of Aquatic Habitat and Fish Population Data for FMF Streams 13
C. Upstream Salmonid Migrations at the McCully Station Counting Fence
The University of New Brunswick operated the McCully Station counting fence on main
stem Kennebecasis from May through November, 1996 to 1998. Adult Atlantic salmon
and brook trout migrating upstream were counted and sampled for age and growth. Some
brook trout were radio-tagged to trace their migration within the Kennebecasis basin
(Sparkes, 2000).
Fence counts for Atlantic salmon in 1996 and 1997 were similar with 82 and 71 grilse and
45 and 48 large salmon (Table 3). The 1998 fence count for salmon was minimal in
October when partial upstream fish movements were assessed due to high flows. The
estimated habitat area that could be seeded by female salmon counted in 1996 and 1997 is
about 150,000 to 200,000 m2. Assuming most of the salmon could have spawned above
the South Branch in Ecoreach 4, there could have been an egg deposition of only 1 per
100 m2, less than one-half the DFO conservation requirement of 2.4 eggs per m2.
Brook trout migrants ranged between 1,620 and 2,016 fish during the 1996 to 1998
trapping periods (Table 3). High flows in June and July of 1996 and 1997 may account for
lower counts of trout than in 1998. Most brook trout were two or three years old and
exhibited a mean length of approximately 20 cm (Curry, 2000).
D. Stream Population Studies (Electrofishing)
There are 21 electrofishing sites in the Kennebecasis River basin, but only four DFO sites
(Smiths Creek, South Branch and main stem Kennebecasis) have been sampled annually.
Ideally, electrofishing sites should sample single habitat types in each stream ecoreach.
Salmonid populations estimated in one ecoreach usually cannot be compared with
populations in other ecoreaches because of different habitat characteristics.
A brief summary of DFO, UNB and Sussex Fish and Game Association (SFGA) stations
follows; unfortunately, multiple habitat types have been sampled within individual DFO
and SGFA sites. Past and new electrofishing stations should be GPS identified.

Analysis of Aquatic Habitat and Fish Population Data for FMF Streams 14
1. Main Stem Kennebecasis
Ecoreaches 1 and 2 below the Smiths Creek confluence near Norton were fished only
in 1994 (Table 4). One riffle and one run electrofishing station is required for each
ecoreach to determine juvenile salmon abundance as well as the abundance of
competitive and predator fish species.
Ecoreach 3 has two electrofishing stations (SFGA-19 and UNB-31) located on
McLeod and Stone brooks. Trout densities for McLeod Brook were very high (69 0+
age and 28 yearling and older trout per 100 m2) in 1996, but lower trout densities
were sampled in 1997 and 1998 (Table 4). The Stone Brook site (UNB-31) exhibited
faie to good densities of fingerling (10-32/100m2) and yearlings and older (10 to 26
fish/100m2) (Table 4). McLeod and Stone brooks are small coldwater streams that
provide important summer rearing habitat for resident or transient trout in Ecoreaches
3 and 4.
Ecoreach 4, between the confluence of the South Branch and Calimingo Brook, has
one DFO electrofishing site (DFO-15; 1981 to 2001) and one UNB sites (UNB-30;
1996 to 1998). The DFO site combines habitat types (riffles, runs, pools), but may
offer trend information for juvenile salmon densities. Fingerling (0+ age) salmon
densities were good (> 40 per 100 m2) from 1990 until 1998, but disappointing
thereafter. Larger parr (1+ and 2+ age) densities have declined below 10 fish per 100
m2 since 1995. Larger parr densities are not a good juvenile density indicator for
Kennebecaisi streams because of their mobility and preference for gravel/rock-rubble
riffles that are not abundant in Kenebecasis habitats. The UNB “electrofishing
station” (UNB-30) in Ecoreach 4 did sample individual pools, runs and riffles;
Atlantic salmon density data is only available from UNB (Dr. Allen Curry). Trout
density (Curry, 2000) was fair (fingerlings, 10 to 37 fish /100m2; yearlings and older,
20 to 24 fish/100m2).
Ecoreach 5 (Calimingo Brook confluence to headwaters) contains one SFGA
electrofishing station (SFGA-8) sampled in 1994 and one DFO station (DFO-14)

Analysis of Aquatic Habitat and Fish Population Data for FMF Streams 15
sampled annually since 1981 (Table 4). Fingerling salmon populations have
remained very low since 1981 indicating little adult salmon spawning in Ecoreach 5.
Larger parr densities have been variable, the lowest densities reflecting low water or
no water conditions. Brook trout and other species information may be present in the
DFO data; this information should be provided or if it is already available, added as
no catch in appropriate databases.
2. Millstream
Ecoreach 6 (below Beatty Brook confluence) was electrofished only in 1994 and at
two different locations (SFGA 1 and 2); juvenile salmon populations were fair to
good at about 16 fingerlings and 16 parr per 100 m2 at SFGA station (SFGA-2)
(Table 5).
Ecoreach 7 has two electrofishing sites, but only DFO site-13 has multi-year data
(1996 – 1998) (Table 5). This station and SFGA-2 station in Ecoreach 6 should be
relocated to include sampling of independent riffle and run habitat types.
3. Trout Creek
There are three ecoreaches for Trout Creek; the first ecoreach (below Parlee Brook)
has three electrofishing station sites since 1994 (SFGA-6, -7 and -21) (Table 6). The
Wards Creek stations (SFGA-7 and -21) should be discontinued, but SFGA-6 should
be continued if new trend information is comparable with previous years. This
station was last sampled in 1998 when juvenile Atlantic salmon densities were
6.5 fingerlings and 15.8 larger parr per 100 m2 (Table 6). Two additional stations
should be established, i.e. one each to sample run and riffle salmonid densities near
the SFGA-6 site.
Ecoreach 13 has had three electrofishing stations (SFGA-5, -18 and -20), but only the
SFGA-5 station (Parlee Brook) was fished consistently from 1994 to 1998; yearling
brook trout abundance was fair to good (3.1 to 12.9 fish per 100 m2). The SFGA-5

Analysis of Aquatic Habitat and Fish Population Data for FMF Streams 16
site should be maintained, but the SFGA stations 18 and 20 sites should be
discontinued and replaced with one station to sample riffle habitat type and one
station to sample run habitat type near the SFGA-5 site. Ecoreach 13 stations are
especially important to estimate Atlantic juvenile populations on the Kennebecasis
basins most productive tributary.
Ecoreach 14 has one SFGA station (SFGA- 4) fished from 1994 to 1997; fingerlings
and yearling and older trout populations were good ranging from 9.0 to 25.1
(fingerlings) and 4.3 to 26.2 (yearlings) fish per 100 m2, respectively (Table 6).
It appears that few Atlantic salmon adults or juveniles enter Cedar Camp Brook and
that Trout Creek falls prevents upstream salmon migration. The SFGA station 4
should be continued to provide brook trout trend information.
4. Smiths Creek
Windgap Brook separates Ecoreaches 8 and 9 on Smiths Creek. Only one
electrofishing site (DFO-17) on Ecoreach 9 provides trend information for salmonid
densities (Table 7). Juvenile salmon densities have been low (0.3 - 8.3 fingerlings per
100 m2 and 0.3 - 8.3 larger parr per 100 m2). Station DFO-17 combines pool, run and
riffle habitat types and may not accurately reflect juvenile salmon densities. Redd
counts undertaken in 1998, 1999 and 2000 on Ecoreach 9 suggest spawning
escapement maybe sufficient to provide higher densities of juvenile salmon.
Two electrofishing stations should be established on each of Smith Creek’s
ecoreaches to sample salmonid densities in riffle and run habitat types. The existing
DFO-17 site should also be fished annually until it can be determined whether trend
information is being provided.

Analysis of Aquatic Habitat and Fish Population Data for FMF Streams 17
5. South Branch
The South Branch falls separate Ecoreaches 10 (lower) and 11 (upper). The lower
ecoreach was electrofished at one site (SFGA-9) in 1994 only (Table 8). The upper
ecoreach (11) has two electrofishing sites (DFO-16 and UNB-31). The UNB site
represents a composite of 4 pools, 3 runs and 3 riffle replicates, combined to provide
salmonid densities (Table 8). The DFO-16 site contains riffle, run and pool habitat
types.
Brook trout densities at the SFGA-9 site in 1994 were fair to good (7.2 fingerlings
and 22.6 yearlings per 100 m2), as were yearling salmon densities (6.8 fish per
100 m2) (Table 8). Ecoreach 10 appears to be an important salmonid production area
for the South Branch and main stem Kennebecasis.
Ecoreach 11, above South Branch falls, has density information since 1981 for
juvenile salmon, and perhaps trout, from DFO-16 site. Juvenile salmon populations
have remained low at DFO-16 site indicating the South Branch receives little adult
salmon spawning. Moreover, unusual low flows do not favor production; perhaps,
low summer water flows may reduce or eliminate habitat availability. The combined
UNB electrofishing stations (UNB-31) suggest fair to good densities of fingerling
brook trout (10 - 12 per 100 m2) and older trout (10 - 28 fish per 100 m2) (Table 8).
The UNB station(s) contained large salmon parr, but no fingerling parr.
Potential Salmonid Production
A. Kennebecasis River Basin
1. Main Stem Kennebecasis
The main Kennebecasis River and smaller tributaries (Moosehorn Creek, Almshouse
Brook, Musquash Brook, McLeod Brook and Stone Brook) have habitat potential to

Analysis of Aquatic Habitat and Fish Population Data for FMF Streams 18
produce 174 to 2,073 adult Atlantic salmon depending on freshwater smolt
production and pos- smolt survival at sea (Tables 9 and 10; Appendix D). Ecoreach 1
(Millstream downstream to head of tide) may offer important juvenile salmon rearing
area depending on the abundance of competitive or predator species such as chain
pickerel. Atlantic salmon juvenile production is substantial if adults or juveniles can
access the habitat available in Moosehorn Creek. Upper portions of Ecoreach 3
(below South Branch confluence) and all portions of Ecoreach 4 (below Calamingo
Brook confluence) offer best production potential for adult salmon considering the
quantity and quality of habitat available. Although Ecoreach 5 (headwaters) has
potential to produce up to 200 adult salmon, its variable surface flows in September
and, perhaps winter months, seriously impact salmonid production.
Main stem Kennebecasis Ecoreaches 1, 2, and 3 represent poor summer habitat for
brook trout with predicted densities of 1.3 - 2.6 fingerlings/100 m2 and 0.28-1.45
yearlings and older trout per 100 m2. The McLeod Brook tributary (Ecoreach 3)
offers excellent habitat for fingerling trout (36.1 fish/100 m2) as does Stone Brook in
Ecoreach 4 at 27 fingerlings / m2 (Table 9). Ecoreaches 3 and 4, including Stone and
McLeod brooks, support over 50% of the main stem Kennebecasis’ salmonid
production, but contain only 22% of the habitat (Table 9; Appendix D). The UNB
1996-1998 electrofishing sites produced similar fingerling densities in 1997 as those
predicted above, but 1996 and 1998 fingerling and yearling densities were higher
(Table 4).
2. Millstream
Atlantic salmon production potential is similar in Ecoreaches 6 and 7 or about 30 to
250 adults per ecoreach (Table 9; Appendix D). Brook trout production in Ecoreach 6
is very low (0.5 fingerlings and 0.8 yearlings and older/100 m2), but fair above the
Beatty Brook confluence (Ecoreach 7) at 4.3 fingerlings and 6.5 yearlings and older
per100 m2 (Table 9). Sharp and McNair brooks offer good habitat for fingerling trout
whereas Mill Brook has poor habitat conditions for fingerling and older trout.

Analysis of Aquatic Habitat and Fish Population Data for FMF Streams 19
3. Trout Creek
The Trout Creek sub-basin has potential to produce 73 to 538 adult salmon from its
374,000 m2 of habitat area (Tables 9; Appendix D). The lower ecoreach, below the
Parlee Brook confluence, offers the largest quantity of habitat, but habitat quality is
poor compared with habitat quality in upstream Ecoreaches 13 and 14.
Brook trout potential production is highest in headwaters Ecoreach 14, above Trout
Creek falls where yearling production is predicted at 10 yearlings /100 m2 (Table 9).
Cedar Camp Brook, also in Ecoreach 14, offers fair habitat for trout production.
4. Smiths Creek
Smiths Creek Ecoreaches 8 and 9 have sufficient habitat to produce 60-579 adult
salmon (Table 9 and 10; Appendix D). Ecoreach 8, below Windgap Brook, has poor
habitat for brook trout excepting McGregor Brook that has good to excellent
production potential at 10.6 fingerlings and 21.2 yearlings and older trout per 100 m2.
Sally Brook’s habitat, within upstream Ecoreach 9, has outstanding brook trout
production: 30 fingerlings and 22 yearlings and older/100 m2 (Table 9; Appendix D).
Sally Brook may be the Kennebcasis basin’s most productive stream considering the
habitat area available.
5. South Branch
The South Branch may not be able to support a self sustaining Atlantic salmon
population without juvenile recruitment from main stem Kennebecasis; adult salmon
production potential is only 16-141 fish (Table 9; Appendix D).
Potential production of brook trout is high for both South Branch ecoreaches and
especially high for Negro Brook: 41 fingerlings and 22 yearlings or older per 100 m2
(Table 9; Appendix D). Ecoreach 10, below South Branch Falls, has extensive

Analysis of Aquatic Habitat and Fish Population Data for FMF Streams 20
habitat that offers good yearling and older potential production: 12.7 fish per 100 m2.
This should be an excellent angling stream.
UNB electrofishing studies during 1996-1998 estimate 10 to 30 fingerlings and 10 to
28 yearlings per 100 m2 within Ecoreach 11 waters; overall predicted fingerling
densities were similar, but predicted yearling densities were lower (Table 8 and 9).
B. Hammond River Basin
1. Main Stem Hammond River (above Hillsdale)
Habitat areas for this headwater area of the Hammond River basin are limited; adult
salmon production is estimated to range between 12-117 fish per year whereas
brook trout production may be low at 6 fingerlings and 2.6 yearlings and older fish
per 100 m2, assuming this area has cool water temperatures. (Table 10;
Appendix E).
2. North Branch Hammond River
Atlantic salmon production potential (12-109) is limited as are brook trout yearlings
and older production at 1300 fish or 2.9 trout per 100 m2. Fingerling brook trout
potential production is fair to good at 9 fish per 100 m2 (Table 10; Appendix E).
Fowler Brook’s extensive ledge substrate offers very poor trout and salmon habitat.
The North Branch is assumed to have cool summer water temperatures.
Fish and Habitat Monitoring Program
A fish and habitat monitoring program should be implemented in the Kennebecasis River basin,
especially for streams sensitive to change by land use practises. The program, managed by a
watershed coalition group, would monitor ecological stress by measuring including temperature
change, fish density, fish assemblages and siltation. These activities should be undertaken in

Analysis of Aquatic Habitat and Fish Population Data for FMF Streams 21
addition to previously discussed fish population monitoring activities (electrofishing and redd
surveys). Coalition group involvement with stakeholders and government agencies ensures
economical operations and a teamwork approach to understanding environmental conditions in
the basin.
Habitat or aquatic life degradations may be occurring or increasing, but there is no monitoring
program. Moreover, current and past protection or restoration measures (e.g. “no kill zone” and
riparian plantings) are not being measured for success or failure. DFO’s annual electrofishing
program is not stratified to account for various habitat types. DNRE’s redd counts are not annual
and may not be not undertaken on similar stream sections each year. DOE’s water classification
program samples too infrequently those key parameters to detect habitat change.
Simple, measurable performances indicators, such as temperature, fish assemblages and fish
densities, and sediments, can be utilized to monitor adverse land-use practices and restoration
programs. For any monitoring program, objectives and parameters should be subject to
modification, i.e. adaptive management.
A. Suggested Approach
The most sensitive, as well as the most productive streams, within the Kennebecasis
basin ecoreaches should be priority for monitoring considering soils, riparian buffers,
marginal temperatures (18º-21ºC, late afternoon), planned land use activities and
past/present in-stream, riparian and upslope restoration projects.
1. Performance Indicators
Temperature monitor placement is required to assess maximum and mean daily
temperatures for marginal coldwater (18º-21ºC, late afternoon) streams. Brook
trout are especially vulnerable in marginal streams.
Fish assemblages and relative production should be assessed by electrofishing,
utilizing one of several indicator species: the % abundance of wild salmonids (or

Analysis of Aquatic Habitat and Fish Population Data for FMF Streams 22
slimy sculpins or blacknose dace) and the abundance of non-salmonids measured
in riffles and runs. Salmonid abundance (or sculpin or blacknose dace) should be
60% of the standing crop (ideal) and non-salmonids should be less than 10% of
the standing crop. Indicator species densities could be good (∃20 fish/100 m2),
fair (10-20 fish/100 m2) or poor (� 10 fish/100 m2), for example.
Siltation should be measured using three indicators:
a) suspended solids (associated with turbidity meter readings initially)
b) substrate embeddedness (vibert boxes)
c) aerial flights over basin streams within 12 hours after a substantial rainfall to
pinpoint” erosional sources; sources could then be addressed directly with best
management practices.
Suspended solids, measured at least weekly during spring through fall, would
establish background and natural levels; the duration and quantity of suspended
solids should be evaluated employing the Newcombe-MacDonald method.
Substrate embeddedness, measured from replicate riffle samples throughout the
basin would establish background levels to compare future values particularly
where planned land-use practices or restoration efforts are anticipated or
undertaken.
2. Program Review
Watershed conservation groups have qualified personnel for data collection and
analysis. Overtime, the monitoring goals, objectives and/or performance
indicators should be modified as necessary based on new information.
3. Who pays?
The major users and beneficiaries of Kennebecasis River basin resources (e.g.
timber, agricultural) should be primary contributors to the monitoring program.
The program outlined above may cost between $20,000 and $30,000 per year

Analysis of Aquatic Habitat and Fish Population Data for FMF Streams 23
depending on personnel and equipment available from the lead watershed group
and government/private stakeholders.

Analysis of Aquatic Habitat and Fish Population Data for FMF Streams 24
Table 1a. Types and quantity of aquatic habitat for the Kennebecasis River streams within the Fundy Model Forest.
STREAM HABITAT TYPES
MAIN STREAM TRIBUTARY Portion Total Aquatic
Length Surveyed Habitat Riffles Runs Pool (km) (km) (m2) (%) (%) (%)
1. Kennebecasis 73.6 51.2 1,436,513 5 79 16 Almshouse Brook 5.3 2.1 15,562 1 54 45 Moosehorn Creek 15.4 8.0 95,789 20 67 13 Musquash Brook 8.2 3.2 11,976 10 43 47 Stone Brook 8.3 2.8 23,691 1 84 15 McLeod Brook 7.3 5.4 30,399 6 80 14 Moosehorn Creek 4.9 0.1 864 0 0 100 SUBTOTAL 123.0 72.8 1,614,794 6 78 16 2. Millstream 25.5 20.3 303,966 13 44 43 Mill Brook 8.4 2.8 26,946 15 43 42 Sharp Brook 7.4 2.7 18,944 1 81 18 McNair Brook 5.9 2.3 16,239 1 25 74 SUBTOTAL 47.2 28.1 36,095 16 51 33 3. Trout Creek 18.5 13.9 179,991 32 45 23 Ward Creek 11.6 8.3 87,707 11 71 18 Parsons Brook 5.0 3.1 5,125 12 71 17 Mill Brook 4.1 2.2 12,147 3 85 12 Parlee Brook 8.9 3.5 36,071 22 57 21 Cedar Camp Brook 11.0 5.5 52,605 12 57 31
SUBTOTAL 59.1 36.5 373,646 22 56 22 4. Smith Creek 21.7 20.7 311,744 8 50 42 McGregor Brook 6.2 1.9 10,275 19 43 38 Windgap Brook 7.2 3.4 25,815 16 76 8 Sally Brook 6.7 2.3 20,919 1 59 40

Analysis of Aquatic Habitat and Fish Population Data for FMF Streams 25
Table 1a. Types and quantity of aquatic habitat for the Kennebecasis River streams within the Fundy Model Forest.
STREAM HABITAT TYPES
MAIN STREAM TRIBUTARY Portion Total Aquatic
Length Surveyed Habitat Riffles Runs Pool (km) (km) (m2) (%) (%) (%)
SUBTOTAL 41.8 28.3 368,755 8 59 33
5. South Branch 12.1 7.3 73,444 15 42 43 Negro Brook 3.3 1.2 7,284 33 66 1 SUBTOTAL 15.4 8.5 80,728 17 44 39
BASIN TOTAL 286.5 174.2 2,804,018 10 66 24
Table 1b. Types and quantities of aquatic habitat for Hammond Rivers stream within the Fundy Model Forest.
STREAM HABITAT TYPES
MAIN STREAM TRIBUTARY Portion Total Aquatic Length Surveyed Habitat Riffles Runs Pool Sheet (km) (km) (m2) (%) (%) (%) (%)
Hammond River Headwaters above Hillsdale 22.0 13.1 71,925 22 70 8 - Fowler Brook 5.2 1.2 3,256 6 16 3 78 SUBTOTAL 27.2 14.3 75,161
North Branch 13.1 8.2 44,999 32 60 8 0 BASIN TOTAL 40.3 22.5 119,160
Analysis of Aquatic Habitat and Fish Population Data for FMF Streams 26
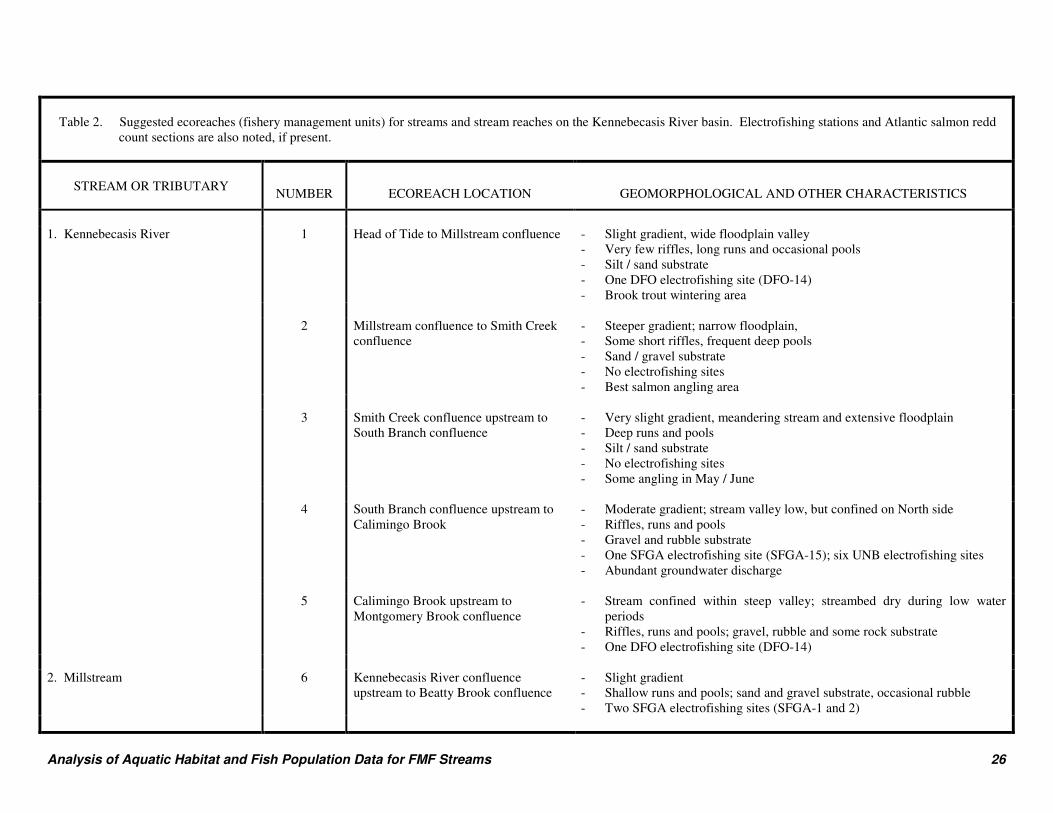
Table 2. Suggested ecoreaches (fishery management units) for streams and stream reaches on the Kennebecasis River basin. Electrofishing stations and Atlantic salmon redd
count sections are also noted, if present.
STREAM OR TRIBUTARY
NUMBER
ECOREACH LOCATION
GEOMORPHOLOGICAL AND OTHER CHARACTERISTICS
1. Kennebecasis River 1 Head of Tide to Millstream confluence - Slight gradient, wide floodplain valley
- Very few riffles, long runs and occasional pools - Silt / sand substrate - One DFO electrofishing site (DFO-14) - Brook trout wintering area
2 Millstream confluence to Smith Creek
confluence - Steeper gradient; narrow floodplain, - Some short riffles, frequent deep pools - Sand / gravel substrate - No electrofishing sites - Best salmon angling area
3 Smith Creek confluence upstream to
South Branch confluence - Very slight gradient, meandering stream and extensive floodplain - Deep runs and pools - Silt / sand substrate - No electrofishing sites - Some angling in May / June
4 South Branch confluence upstream to
Calimingo Brook - Moderate gradient; stream valley low, but confined on North side - Riffles, runs and pools - Gravel and rubble substrate - One SFGA electrofishing site (SFGA-15); six UNB electrofishing sites - Abundant groundwater discharge
5 Calimingo Brook upstream to
Montgomery Brook confluence
- Stream confined within steep valley; streambed dry during low water periods
- Riffles, runs and pools; gravel, rubble and some rock substrate - One DFO electrofishing site (DFO-14)
2. Millstream 6 Kennebecasis River confluence
upstream to Beatty Brook confluence - Slight gradient - Shallow runs and pools; sand and gravel substrate, occasional rubble - Two SFGA electrofishing sites (SFGA-1 and 2)

Analysis of Aquatic Habitat and Fish Population Data for FMF Streams 27
Table 2. Suggested ecoreaches (fishery management units) for streams and stream reaches on the Kennebecasis River basin. Electrofishing stations and Atlantic salmon redd
count sections are also noted, if present.
STREAM OR TRIBUTARY
NUMBER
ECOREACH LOCATION
GEOMORPHOLOGICAL AND OTHER CHARACTERISTICS
7
Beatty Brook confluence upstream to Wright Brook confluence
- Moderate gradient - Riffles, long runs and pools; gravel and rubble substrate - One DFO electrofishing site (DFO-13), one SFGA electrofishing site
(SFGA-3) - Redd count reach
3. Smith Creek 8 Kennebecasis confluence upstream to
Windgap Brook - Slight gradient; meandering stream - Runs and pools; sand / gravel and some rubble substrate; - One DFO electrofishing site (DFO-17) and one SFGA eletrofishing site
(SFGA-11) - Redd count reach.
9 Windgap Brook confluence to
headwaters - Long runs, pools, occasional riffles; gravel substrate with sand - One SFGA electrofishing site (SFGA-10); redd count reach
4. South Branch 10 Kennebecasis confluence upstream to
falls and hatchery discharge - Valley floodplain - Some meandering, long runs, pools; sand and some gravel substrate, some
silt; - One SFGA electrofishing site (SFGA-9)
11 Falls upstream to Headwaters - Moderate gradient; narrowed stream
- Riffles, pools and runs; gravel, some rubble substrate; - One DFO eletrofishing site (DFO-16); six UNB electrofishing sites
-

Analysis of Aquatic Habitat and Fish Population Data for FMF Streams 28
Table 2. Suggested ecoreaches (fishery management units) for streams and stream reaches on the Kennebecasis River basin. Electrofishing stations and Atlantic salmon redd
count sections are also noted, if present.
STREAM OR TRIBUTARY
NUMBER
ECOREACH LOCATION
GEOMORPHOLOGICAL AND OTHER CHARACTERISTICS
- 5. Trout Creek 12 Kennebecasis River confluence
upstream to Parlee Brook confluence - Slight gradient, valley lowland - Long runs and pools, short riffle; more riffles near Mill Brook; sand /
gravel substrate - One SFGA electrofishing site (SFGA-6) - Redd count reach
13 Parlee Brook confluence to Cedar
Camp Brook confluence and falls - Steeper gradient; steep valley; stream narrows - Riffles, runs, pools, occasional rapids; gravel / rubble/ rock substrate,
occasional ledge - One SFGA electrofishing site (SFGA-8) - Redd count reach.
14 Cedar Camp Brook confluence to
headwaters including Cedar Camp Brook
- Riffles, runs, pools; gravel / rubble substrate, some ledge - No electrofishing sites.

Analysis of Aquatic Habitat and Fish Population Data for FMF Streams 29
Table 3. Upstream migrations of Atlantic salmon and brook trout through the McCully Station counting fence, Kennebecasis River, 1996 – 1998.
SPECIES
DATE DATE FENCE 1SW MSW BROOK REMOVED OR SALMON LARGE SALMON TROUT INSTALLED (grilse) (large salmon)
1996 - May Not operated -- -- -- - June Installed June 3 0 0 691 - July 10* 3* 893 - August 6 3 116 - September 26 6 42 - October Removed Oct. 28 40 33 50 - November Not operated -- -- -- TOTAL 82 45 1,793
* Fence did not operate from July 2-7 inclusive, 1996 due to high water 1997 - May Installed May 29 0 0 2 - June 1* 1* 819 - July 15* 1* 698 - August 5 1 19 - September 8 3 37 - October 30 11 24 - November Removed Nov. 18 12 31 23 TOTAL 71 48 1,620
* Fence did not operate June 26, 27 or July 4-7 inclusive due to high water 1998 - May Installed May 7 0 0 455 - June 0 0 1,026 - July 3 1 371 - August 0 0 31 - September 17 9 72 - October Removed Oct. 29 16* 6* 61 - November -- -- -- TOTAL 36 16 2,016
* Fence did not operate from Oct. 30 – Nov. 8 inclusive due to high water. Fence could not be bypassed by fish on Oct. 2,3,11,12 and 16-19 inclusive due to high water conditions.

Analysis of Aquatic Habitat and Fish Population Data for FMF Streams 30
Table 4. Salmonid population estimates for Kennebecasis River, 1981 – 2001.
BROOK TROUT ATLANTIC SALMON
per per NO. REDDS STREAM LOCATION ECOREACH ELECTROFISHING YEAR 100 m2 100 m2 PREVIOUS
NO. STATION NO. AGE AGE YEAR
0+ 1+ 0+ 1+ (Y-1)
Kennebecasis Below Millstream 1 12 (SFGA) 1994 0.0 0.0 0.0 0.1 --
Above Millstream - 2 No Stations -- Below Smith Creek
Above Smith Creek - 3 No Stations -- Below South Branch
Above South Branch - 4 15 (DFO) 1981 20.0 6.5 -- Below Calimingo Brook 1982 36.4 7.1 -- 1983 10.0 1.8 -- 1984 17.7 1.8 -- 1985 45.0 9.4 -- 1986 27.4 5.3 -- 1987 23.3 5.1 -- 1988 31.2 8.0 -- 1989 15.9 8.9 -- 1990 54.6 7.8 -- 1991 87.5 13.1 -- 1992 89.7 15.9 -- 1993 143.8 22.4 -- 1994 72.2 13.1 -- 1995 73.8 7.3 -- 1996 71.0 5.9 -- 1997 79.6 2.8 -- 1998 42.5 4.4 -- 1999 28.4 2.6 -- 2000 26.5 0.7 -- 2001 9.5 2.9 --

Analysis of Aquatic Habitat and Fish Population Data for FMF Streams 31
Table 4. Salmonid population estimates for Kennebecasis River, 1981 – 2001.
BROOK TROUT ATLANTIC SALMON
per per NO. REDDS STREAM LOCATION ECOREACH ELECTROFISHING YEAR 100 m2 100 m2 PREVIOUS
NO. STATION NO. AGE AGE YEAR
0+ 1+ 0+ 1+ (Y-1)
Kennebecasis – Above South Branch - 4 30 (UNB) 1996 10 20 0.0 -- Cont’d Below Calimingo Brook 1997 37 5 0.0 -- 1998 10 20 0.0 --
Above Calimingo Brook 5 8 (SFGA) 1994 6.0 21.0 8.0 10.0 -- 14 (DFO) 1981 0.0 27.3 -- 1982 5.8 19.3 -- 1983 0.0 6.5 -- 1984 0.0 0.0 -- 1985 0.0 0.2 -- 1986 13.2 3.3 -- 1987 0.0 5.4 -- 1988 0.0 0.1 -- 1989 0.0 18.6 -- 1990 0.0 0.8 -- 1991 0.6 15.0 -- 1992 7.3 32.1 -- 1993 0.2 6.8 -- 1994 6.5 47.0 -- 1995 0.0 0.0 -- 1996 0.2 16.8 -- 1997 0.0 31.9 -- 1998 0.0 0.7 -- 1999 0.2 1.3 -- 2000 0.0 14.6 -- 2001 14.4 4.8 --

Analysis of Aquatic Habitat and Fish Population Data for FMF Streams 32
Table 4. Salmonid population estimates for Kennebecasis River, 1981 – 2001.
BROOK TROUT ATLANTIC SALMON
per per NO. REDDS STREAM LOCATION ECOREACH ELECTROFISHING YEAR 100 m2 100 m2 PREVIOUS
NO. STATION NO. AGE AGE YEAR
0+ 1+ 0+ 1+ (Y-1)
McLeod Brook 19 (SFGA) 1994 -- -- -- -- -- 1995 0.4 0.2 0.6 41.4 -- 1996 69.5 27.8 0.7 0.7 -- 1997* 1.74 1.4 7.1 8.4 -- 1998* 1.74 1.4 7.1 8.4 -- * Data should be rechecked to determine
whether 1998 data was collected.

Analysis of Aquatic Habitat and Fish Population Data for FMF Streams 33
Table 5. Juvenile salmonid population estimates for Millstream, 1994 – 2002.
BROOK TROUT ATLANTIC SALMON
per per NO. REDDS STREAM LOCATION ECOREACH ELECTROFISHING YEAR 100 m2 100 m2 PREVIOUS
NO. STATION NO. AGE AGE YEAR
0+ 1+ 0+ 1+ (Y-1)
Millstream Below Beatty Brook 6 1 (SFGA) 1994 0.1 0.3 0.3 0.5 --
2 (SFGA) 1994 0.0 0.3 16.2 16.4 --
Above Beatty Brook 7 3 (SFGA) 1994 9.2 7.2 20.7 16.7 -- 13 (DFO) 1996 0.0 0.0 10.5 2.5 -- 1997 0.0 0.0 50.2 3.8 -- 1998 0.0 0.0 1.4 41.2 3* 1999 - -- -- -- -- 2000 -- -- -- -- -- 2001 -- -- -- -- 34 -- * Section 14 only (SFGA)

Analysis of Aquatic Habitat and Fish Population Data for FMF Streams 34
Table 6. Salmonid population estimates for Trout Creek, 1994 – 2001.
BROOK TROUT ATLANTIC SALMON
per per NO. REDDS STREAM LOCATION ECOREACH ELECTROFISHING YEAR 100 m2 100 m2 PREVIOUS
NO. STATION NO. AGE AGE YEAR
0+ 1+ 0+ 1+ (Y-1)
Trout Creek Below Parlee Brook 12 7 (SFGA) 1994 0.2 0.3 0.0 9.2 --
(Wards Creek) (Wards Creek) 1995 0.0 0.0 1.0 7.0 -- 1996 0.0 0.3 0.0 0.4 -- 1997 0.2 0.2 0.5 0.7 -- 1998 0.0 0.0 0.0 0.5 -- 6 (SFGA) 1994 0.0 0.7 9.3 2.5 -- 1995 0.0 0.0 2.4 0.8 -- 1996 1.4 2.4 0.4 6.5 -- 1997 0.0 0.0 24.9 4.6 -- 1998 0.0 0.0 6.5 15.8 103 1999 -- -- -- -- -- 2000 -- -- -- -- 13 2001 -- -- -- -- 103 21 (SFGA) 1995 0.4 0.5 0.0 1.2 -- (Wards Creek) 1996 0.0 0.5 42.2 3.0 -- 1997 0.0 0.0 1.2 1.5 --
1998 0.0 0.0 0.0 5.0 --
Above Parlee Brook to 13 18 1995 0.5 0.2 0.2 15.3 -- Cedar Camp Brook and 1996 1.5 1.5 5.7 6.9 -- Trout Creek Falls 1997 -- -- -- -- -- 1998 -- -- -- -- -- 1999 -- -- -- -- -- 2000 -- -- -- -- 43 2001 -- -- -- -- 14

Analysis of Aquatic Habitat and Fish Population Data for FMF Streams 35
Table 6. Salmonid population estimates for Trout Creek, 1994 – 2001.
BROOK TROUT ATLANTIC SALMON
per per NO. REDDS STREAM LOCATION ECOREACH ELECTROFISHING YEAR 100 m2 100 m2 PREVIOUS
NO. STATION NO. AGE AGE YEAR
0+ 1+ 0+ 1+ (Y-1)
Parlee Brook 13 5 (SFGA) 1994 1.7 10.3 1.4 6.6 (Parlee Brook) 1995 3.2 6.3 1.6 5.2 1996 1.5 3.1 0.0 5.9 1997 2.8 7.4 0.0 0.9 1998 0.3 12.9 0.0 2.2 1999 -- -- -- -- 0 2000 -- -- -- -- 0 20 (SFGA) 1995 0.6 0.9 0.5 2.9 (Parlee Brook)
Trout Creek Falls to 14 4 (SFGA) 1994 15.4 26.2 0.0 0.4 Headwaters (Cedar Camp Brook) 1995 25.1 20.4 0.0 0.1 1996 9.0 11.1 0.0 0.0 1997 13.8 4.3 0.0 0.0

Analysis of Aquatic Habitat and Fish Population Data for FMF Streams 36
Table 7. Salmonid population estimates for Smith Creek, 1981 – 2001.
BROOK TROUT ATLANTIC SALMON
per per NO. REDDS STREAM LOCATION ECOREACH ELECTROFISHING YEAR 100 m2 100 m2 PREVIOUS
NO. STATION NO. AGE AGE YEAR
0+ 1+ 0+ 1+ (Y-1)
Smith Creek Below Windgap Brook 8 11 (SFGA) 1994 0.0 0.2 1.2 3.0 --
17 (DFO) 1981 4.7 6.0 -- 1982 3.3 6.1 -- 1983 0.8 0.6 -- 1984 5.3 3.0 -- 1985 7.6 3.5 -- 1986 6.1 6.5 -- 1987 6.7 7.8 -- 1988 3.1 8.3 -- 1989 1.4 5.2 -- 1990 1.6 5.8 -- 1991 0.7 3.8 -- 1992 14.5 32.1 -- 1993 2.2 7.3 -- 1994 7.7 6.4 -- 1995 2.6 6.1 -- 1996 6.5 3.2 --
1997 16.1 4.5 -- 1998 4.9 4.9 61 1999 0.1 0.3 -- 2000 0.4 0.4 7 2001 13.5 3.8 58
Above Windgap Brook 9 10 (SFGA) 1994 0.0 0.6 3.3 3.2

Analysis of Aquatic Habitat and Fish Population Data for FMF Streams 37
Table 8. Salmonid population estimates for South Branch, 1981 – 2001.
BROOK TROUT ATLANTIC SALMON
YEAR per per NO. REDDS STREAM LOCATION ECOREACH ELECTROFISHING 100 m2 100 m2 PREVIOUS
NO. STATION NO. AGE AGE YEAR
0+ 1+ 0+ 1+ (Y-1)
South Branch Below Falls 10 9 (SFGA) 1994 7.0 22.6 0.0 6.8 --
Above Falls 11 16 (DFO) 1981 0.0 0.0 0.0 5.3 -- 1982 5.8 2.5 -- 1983 0.0 10.5 -- 1984 0.0 1.4 -- 1985 0.0 21.6 -- 1986 13.2 2.3 -- 1987 0.0 4.0 -- 1988 0.0 1.4 -- 1989 0.0 4.5 -- 1990 0.0 2.6 -- 1991 0.6 0.2 -- 1992 7.3 2.8 -- 1993 0.0 1.0 -- 1994 6.5 9.4 -- 1995 0.0 14.1 -- 1996 0.2 5.5 --
1997 0.0 0.0 -- 1998 0.0 0.1 -- 1999 0.2 0.0 -- 2000 0.0 3.5 -- 2001 0.0 0.6 --
11 30 (UNB) 1996 12 28 0.0 < 5* -- 1997 32 10 0.0 < 5* -- 1998 10 22 0.0 < 5* --
* Data available from Alan Curry, UNB

Analysis of Aquatic Habitat and Fish Population Data for FMF Streams 38
Table 9. Potential production of salmonids in Kennebecasis River basin streams or stream sections (ecoreaches) estimated from habitat assessments (1994) and default production values from northeast New Brunswick streams with similar habitat features.
ATLANTIC SALMON BROOK TROUT
STREAM TRIBUTARY TOTAL COOL SMOLT ADULT 0+ AGE YEARLING AND ECOREACH HABITAT OR PRODUCTION RECRUITMENT FROM OLDER AGE AREA COLD RANGE SMOLT RANGE Per Total Per Total (m2) WATER (Poor to Good) (5 to 10%) 100 m2 (No.) 100 m2 (No.)
Main Stem Kennebecasis Ecoreach 1 574,858 Cool 800 – 6,310 40 – 631 1.3 7,707 0.28 1,632 Moosehorn Creek 95,788 Cold ? 320 – 1,472 15 – 147 3.5 3,375 4.9 1,374 Almshouse Brook 15,562 Cold 45 – 229 2 – 22 6.2 970 3.6 2,698 Ecoreach 2 226,132 Cool 492 – 2,906 24 - 290 1.7 3,928 1.27 1,429 Musquash Brook 11,976 Cold 45 – 201 2 – 20 3.1 378 5.0 1,347 Ecoreach 3 303,214 Cool/Cold 704 – 4,025 35 – 402 2.6 7,842 1.45 4,401 McLeod Brook 30,398 Cold 63 – 383 3 – 38 36.1 10,976 5.3 8,113 Stone Brook 23,691 Cold 39 – 276 2 – 27 27.0 6,405 4.7 4,795 Ecoreach 4 200,444 Cold 603 – 2,946 30 – 294 9.7 19,624 6.2 12,496 Ecoreach 5 131,862 Cold 7 – 2,005 20 – 200 10.2 13,493 5.8 7,664
SUBTOTAL 1,613,909 3,528 – 20,753 173 – 2,071 4.6 74,698 2.8 45,940 Millstream Ecoreach 6 169,064 Cool 70 – 706 31 - 282 0.53 901 0.77 1,294 Sharps Brook 18,943 Cold 34 – 227 2 -22 16.7 3,197 3.9 2,218 McNair Brook 16,238 Cold 65 – 285 3 -28 9.9 1,617 4.2 5,936 Mill Brook 26,946 Cool 108 – 436 5 – 46 2.9 794 1.2 1,063 Ecoreach 7 134,901 Cold 537 – 2,296 27 – 229 4.36 5,881 6.56 8,851
SUBTOTAL 366,092 814 – 3,950 68 - 607 3.3 12,370 5.2 19,272
Trout Creek Ecoreach 12 114,325 Cool 503 - 2,063 25 – 206 0.97 1,105 0.75 853 Ward Creek 87,707 Cold 234 – 1,221 11 – 22 5.3 4,652 3.4 2,976 Parsons Brook 5,125 Cold 14 – 72 1 – 7 4.0 207 2.0 100 Mill Brook 12,147 Cold 21 – 143 1 – 14 5.8 703 2.6 311

Analysis of Aquatic Habitat and Fish Population Data for FMF Streams 39
Table 9. Potential production of salmonids in Kennebecasis River basin streams or stream sections (ecoreaches) estimated from habitat assessments (1994) and default production values from northeast New Brunswick streams with similar habitat features.
ATLANTIC SALMON BROOK TROUT
STREAM TRIBUTARY TOTAL COOL SMOLT ADULT 0+ AGE YEARLING AND ECOREACH HABITAT OR PRODUCTION RECRUITMENT FROM OLDER AGE AREA COLD RANGE SMOLT RANGE Per Total Per Total (m2) WATER (Poor to Good) (5 to 10%) 100 m2 (No.) 100 m2 (No.)
Trout Creek Ecoreach 13 37,891 Cold 187 – 746 9 – 74 3.1 1,179 1.6 619 Parlee Brook 36,070 Cold 136 – 592 7 – 59 3.5 1,259 2.0 720 Ecoreach 14 27,775 Cold 205 – 752 10 – 75 4.7 1,315 10.0 779 Cedar Camp Brook 52,604 Cold 175 – 817 9 – 81 4.7 2,497 4.1 2,161
SUBTOTAL 373,643 1,475 – 6,406 75 - 538 3.4 12,917 2.2 8,519
Smiths Creek Ecoreach 8 173,667 Cool 71 – 715 31 – 284 0.91 1,583 1.66 2,888 McGregor Brook 10,275 Cold 43 – 181 2 – 18 10.6 1,092 21.2 2,178 Ecoreach 9 138,076 Cold 440 – 2,124 22 – 212 4.56 6,302 3.65 5,034 Windgap Brook 25,814 Cold 71 – 362 3 – 36 5.5 1,410 2.2 583 Sally Brook 20,919 Cold 56 – 279 2 – 29 30.0 6,293 22.2 5,276
SUBTOTAL 368,751 681 – 3,661 60 - 579 4.5 16,680 4.3 15,959
South Branch Ecoreach 10 43,877 Cold 163 – 737 8 - 73 5.3 2,334 12.7 5,788 Ecoreach 11 29,566 Cold 142 – 565 7 – 56 12.8 3,795 12.0 3,558 Negro Brook 7,284 Cold 29 – 126 1 – 12 41.4 3,019 22.4 1,809 SUBTOTAL 80,727 334 – 1 428 16 – 141 11.3 9,148 13.8 11,155 BASIN TOTAL 2,803,122 6,832 – 36,198 390 – 3,936 4.4 125,813 3.6 100,848

Analysis of Aquatic Habitat and Fish Population Data for FMF Streams 40
Table 10. Potential production (biomass) for salmonids in Kennebecasis River basin streams estimated from habitat assessment (1994) and default production values.
ATLANTIC SALMON PRODUCTION BROOK TROUT
STREAM SUB-BASIN TOTAL SMOLT ADULT 0+ AGE YEARLING AND HABITAT PRODUCTION RECRUITMENT FROM OLDER AGE
AREA RANGE SMOLT RANGE Total Total (m2) (Poor to Good) (5 to 10%) per 100 m2 (No.) per 100 m2 (No.)
1. Main Stem Kennebecasis and Tributaries 1,613,909 3,528 –20,753 173 – 2,071 4.6 74,698 2.8 45,940 2. Millstream and Tributaries 366,092 814 – 3,950 68 - 207 3.3 12,370 5.2 19,272 3. Trout Creek and Tributaries 373,643 1,475 – 6,406 73 – 538 3.4 12,917 2.2 8,519 4. Smiths Creek and Tributaries 368,751 681 – 3,661 60 – 579 4.5 16,680 4.3 15,959 5. South Branch and and Tributaries 80,727 334 – 1,428 16 – 141 11.3 9,148 13.8 11,155 BASIN TOTAL 2,803,122 6,832 – 36,198 390 – 3,936 4.4 125,813 3.6 100,845

Analysis of Aquatic Habitat and Fish Population Data for FMF Streams 41
Table 11. Potential production (biomass) for salmonids in two Hammond River River basin streams located within Fundy Model Forest.
ATLANTIC SALMON BROOK TROUT
STREAM SUB-BASIN TOTAL SMOLT ADULT 0+ AGE YEARLING AND HABITAT PRODUCTION RECRUITMENT FROM OLDER AGE
AREA RANGE SMOLT RANGE Total Total (m2) (Poor to Good) (5 to 10%) per 100 m2 (No.) per 100 m2 (No.)
1. Main Stem Hammnond River Above Hillsdale 71,295 250 – 1,178 12 – 117 6.14 4,417 2.66 1,915 2. North Branch Hammond River 44,999 242 – 1,094 12 – 109 9.11 4,097 2.93 1,318
- Fowler Brook 3,255 3 – 18 0 – 8 0.31 10 2.85 20 SUBTOTAL 48,254 245 – 1,112 12 – 117 8.51 4,107 2.77 1,338 BASIN TOTAL 120,179 495 – 2,290 24 - 234 8.3 8,524 2.7 3,253

Analysis of Aquatic Habitat and Fish Population Data for FMF Streams 42
RECOMMENDATIONS
The establishment of the Kennebecasis interdisciplinary working group (Kennebecasis
Watershed Restoration Committee or KWRC) represents a huge step forward in formalizing
basin-wide ecological objectives especially with respect to reestablishment of riparian
vegetation, the modification of land use practices, and monitoring background conditions and
results. Future restoration activities require a stakeholder “blueprint”, backed by specific
funding, to focus coordinated operational input from all stakeholders, particularly those forestry
and agricultural sectors who are the major users and beneficiaries of stream basin resources.
Many of the riparian and stream ecosystems in the Kennebecasis basin have been degraded by
“off channel” activities: grazing and croplands, usually in the lower to mid reaches of streams,
and logging in headwater areas.
The New Brunswick Department of the Environment and Local Government (DOE) does not
enforce its Clean Water Act requirement that riparian zones within 5 meters of a stream cannot
be impacted by agricultural practices. By default, watershed groups in the Kennebecasis and
Hammond stream basins have on a limited, piece-meal basis, initiated fencing projects to keep
cattle from grazing within the 5 meter riparian zone. There are minor initiatives that, along with
various in-stream channel projects, focus on symptoms, not causes of watershed degradation
within the Kennebecasis and Hammond basins. Watershed groups should formalize with their
stakeholders basin-wide ecological objectives and strategies with respect to “wholesale”
reestablishment of riparian vegetation and preservation of healthy resources within a two to five
year time frame. The DOE requirement should be strictly enforced, or challenged in court. The
New Brunswick Departments of Agriculture, Environment and Natural Resources should
allocate financial resources and regional staff to work directly with the watershed coalition group
to: (1) develop common goals (2) avoid special interest projects, isolated manipulations of
individual elements, and (3) ensure operations are dedicated to restoring natural ecological
processes in the basin.

Analysis of Aquatic Habitat and Fish Population Data for FMF Streams 43
Watershed managers, working directly with a formal, multi-government committee should
consider how current landscape conditions compare with historical conditions of the
Kennebecasis and Hammond basins before habitat degradation, then:
- identify/document processes leading to the decline (grazing, logging, rural development,
etc.)
- establish realistic goals, for example (1) the necessity to fence all riparian areas subject to
grazing or siltation; (2) plan to plant riparian species necessary throughout the basin;
(3) preserve habitat in key salmonid production streams: McLeod, Stone, Sharp, McNair,
McGregor and Sally; focus DOE and UNB to study causes for low water in South Branch
and Kennebecasis headwaters by examining peak flows, low flows, rapid fluctuations and
land use practices; and (4) protect the healthiest portions of the basin first, then
rehabilitate the rest.
- Develop/ apply methods and techniques to reverse/mitigate aquatic habitat decline
- develop simple, observable measures of success (monitoring program, adaptive
management)
- document and communicate restoration techniques to others.
The immediate challenge to Hammond and Kennebecasis watershed agencies and stakeholders
will be to focus and coordinate funding and regional manager priorities. A strategic watershed
plan, conceived and accepted by stakeholders, will ensure basin-wide operations that are co-
managed by permanent, professional staff with supporting infrastructure to achieve conservation
and restoration objectives, and actions everyone supports. Ecological restoration will come at a
high cost, but has to be regarded as an investment in the natural capital and environmental wealth
of the basins, New Brunswick and Canada. Eventually, basin stakeholders and future generations
will reap the self-maintaining benefits in perpetuity.

Analysis of Aquatic Habitat and Fish Population Data for FMF Streams 44
ACKNOWLEDGEMENTS Our thanks to the Kennebecasis Watershed Restoration Committee, Hammond River Angling
Association, New Brunswick Department of Natural Resources and Energy, Fisheries and
Oceans Canada, University of New Brunswick, New Brunswick Department of Environment and
Local Government and the New Brunswick Aquatic Data Warehouse for providing water, fish
and habitat data utilized in this report. Michelle Nordin was especially helpful in supplying
background data and assisting with site visits. Dean Toole and Gerry Munn kindly provided
background information relating to past management and restoration activities within the
Kennebcasis and Hammond basins, as well as ongoing issues and strategies.

Analysis of Aquatic Habitat and Fish Population Data for FMF Streams 45
REFERENCES
Barry, Erin. 2000. Nutrient Soils in the Kennebecasis watershed. Kennebecasis Watershed Restoration Committee, 140 Main Street, Suite 12, Sussex, N.B.
Byers, Todd. 1996. Kennebecasis River project, 1995: stream enhancement projects. Sussex
Fish and Game Association, 140 Main Street, Suite 12, Sussex, N.B. Byers, Todd. 1997. Trout Creek model watershed project: stream enhancement 1996. Sussex
Fish and Game Association, 140 Main Street, Suite 12, Sussex, N.B. Clarkson, R.W. and J.R. Wilson. 1995. Trout biomass and stream habitat relationships in the
White Mountains Area, East Central Arizona. Transactions of the American Fisheries Society 124: 599-612.
Connell, Chris. 1995. Habitat assessment report. Kennebecasis River Project. Sussex Fish and
Game Association, 140 Main Street, Suite 12, Sussex, N.B. Curry, R. Allen. 2000. The ecology of brook trout in the Kennebecasis River. A report prepared
for the Sussex Fish and Game Association and New Brunswick Department of Natural Resources and Energy. Report No. 00-01. Biology Department, University of New Brunswick, Fredericton, N.B.. 71 pp.
Frissel, C.W., W.J. Liss, C.E.Warren and M.D, Hurley. 1986. A hierarchical framework for
stream habitat classification: viewing streams in a watershed context. Environmental Management 10, No. 2: 199-214.
Hooper, W.C. 1997. Strategy to assess and monitor lake and stream ecosystem health in New
Brunswick. The 1997 Conference: Canadian Council on Ecological Areas “Protected Areas and the Bottom Line”. Fish and Wildlife Branch, New Brunswick Department of Natural Resources and Energy, Fredericton. 41p.
Kauffman, J.B, R.L. Beschta, Otting and Dana Lytjen. 1997. An ecological perspective of
riparian and stream restoration in the western United States. Fisheries, Volume 22, No. 5: 12-24.
Naiman, R.J., D.G. Lonzarich, T.J.Beechie, and S.C. Ralph. 1992. General principals of
classification and the assessment of conservation potential in rivers. In River Conservation and Management. Edited by P.J. Boon, P. Calow, and G.E. Pelts. John Wiley and Sons Ltd.
National Research Council (U.S.) Committee on restoration of aquatic ecosystems – science,
technology and public policy. 1992. Restoration of aquatic ecosystems. National Academy Press, Washington, D.C.

Analysis of Aquatic Habitat and Fish Population Data for FMF Streams 46
Newcombe, C.P. and D.D. MacDonald. 1991. Effects of suspended sediments on aquatic ecosystems. North American Journal of Fisheries Management 11: 72-82.
Sparks, David. 2000. Seasonal movements of brook charr (Salvelinus fontinalis) in the
Kennebecasis River, southern New Brunswick. MSc Thesis. University of New Brunswick, Fredericton, N.B.
Thebeau, Nadine. 1998. Trout Creek model watershed project: stream enhancement project,
1997. Sussex Fish and Game Association, 140 Main Street, Suite 12, Sussex, N.B. Thebeau, Nadine. 1999. Upper Kennebecasis River restoration project: 1998 final report.
Sussex Fish and Game Association, 140 Main Street, Suite 12, Sussex, N.B. Vannote, R.L., G.W. Minshall, K.W. Cummins, J.R. Sedell and C.F. Cushing. 1980. The river
continuum concept. Can. J. Fish. Aquat. Sci. 37: 817-822. Whittier, J.R. and R.M. Hughes. 1988. Correspondence between ecoregions and spatial patterns
in stream ecosystems in Oregon. Can. J. Fish. Aquat. Sci. 45: 1264-1278.

Analysis of Aquatic Habitat and Fish Population Data for FMF Streams Binder 1
APPENDIX A
Habitat Assessment Reports
for Kennebecasis Stream Sub-basins and Tributaries
Mainstream Kennebecasis
Almshouse Creek Moosehorn Creek Musquash Brook McLeod Brook
Stone Brook
Millstream
Sharp Brook McNair Brook
Mill Brook
Trout Creek
Wards Creek Parsons Creek
Mill Creek Parlee Brook
Cedar Camp Brook
Smith’s Creek
McGregor Brook Windgap Brook
Sally Brook
South Branch
Negro Brook

Analysis of Aquatic Habitat and Fish Population Data for FMF Streams Binder 1
APPENDIX B
Habitat Assessment Reports
for Hammond River Streams
within the Fundy Model Forest
Mainstream Hammond River (above Hillsdale)
North Branch Hammond River
Fowler Brook

Analysis of Aquatic Habitat and Fish Population Data for FMF Streams 47
APPENDIX C
Atlantic Salmon Redd Counts
For Stream Sections
Within the Kennebecasis River Basin

Analysis of Aquatic Habitat and Fish Population Data for FMF Streams Binder 2
APPENDIX D
Salmonid Production Potentials by Ecoreach
for Kennebecasis Stream Sub-basins and Tributaries
Mainstream Kennebecasis - Below Millstream Moosehorn Creek Almshouse Brook
Mainstream Kennebecasis - Millstream to Smith Creek Musquash Brook
Mainstream Kennebecasis - Smith Creek to South Branch McLeod Brook
Mainstream Kennebecasis - South Branch to Calimingo Brook Stone Brook
Mainstream Kennebecasis - Calimingo Brook to Headwaters
Millstream - Below Beatty Brook Sharp Brook
McNair Brook Mill Brook
Millstream - Above Beatty Brook
Trout Creek - Below Parlee Brook Wards Creek
Parsons Brook Mill Creek
Trout Creek – Parlee Brook to Trout Creek Falls Parlee Brook
Trout Creek – Trout Creek Falls to Headwaters Cedar Camp Brook
Smiths Creek - Below Windgap Brook
McGregor Brook Smiths Creek - Above Windgap Brook
Windgap Brook Sally Brook
South Branch - Below Falls South Branch -Above Falls
Negro Brook

Analysis of Aquatic Habitat and Fish Population Data for FMF Streams Binder 2
APPENDIX E
Salmonid Production Potential
for Hammond River Streams within the Fundy Model Forest
Mainstream Hammond River: above Hillsdale
North Branch Hammond River: Headwaters to Forks (above Hillsdale) Fowler Brook