Embed Size (px)
Citation preview

FURNACE CO EMISSIONS UNDER NORMAL AND COMPROMISED VENT CONDITIONS
FURNACE #1 – DRAFT HOOD EQUIPPED
August 2000
Prepared by Christopher J. Brown Ronald A. Jordan
David R. Tucholski Directorate for Laboratory Sciences
The United States Consumer Product Safety Commission
Washington, D.C. 20207

i
1. INTRODUCTION ................................................................................................................. 1
2. TEST EQUIPMENT AND SETUP ....................................................................................... 1
a. Furnace................................................................................................................................ 1
b. Test Chamber and Furnace Closet ...................................................................................... 2
c. Vent Blockage Device and Vent Disconnect...................................................................... 3
d. Measuring Equipment......................................................................................................... 4
i) Furnace Operating Parameters........................................................................................ 4
ii) Gas Sampling Systems.................................................................................................... 4
iii) Air Exchange Rate .......................................................................................................... 5
iv) Room Temperature, Pressure, and Relative Humidity ................................................... 5
v) Natural Gas ..................................................................................................................... 5
vi) Data Acquisition System ................................................................................................ 6
3. TEST METHODS AND PROCEDURES ............................................................................. 6
i) Furnace Installation......................................................................................................... 6
ii) Furnace Input Rate.......................................................................................................... 6
iii) Test Matrix...................................................................................................................... 7
iv) Test Procedures............................................................................................................... 7
4. DATA REDUCTION ............................................................................................................ 8
a. Equilibrium Determination ................................................................................................. 8
b. Air Exchange Rate .............................................................................................................. 8
c. Emission Rate ..................................................................................................................... 8
5. RESULTS AND DISCUSSION ............................................................................................ 9
a. Baseline Tests (Intact Vent)................................................................................................ 9
b. Blocked Vent Tests ............................................................................................................. 9
i) Degree of Blockage......................................................................................................... 9
ii) Input Rate...................................................................................................................... 10
iii) Cycling.......................................................................................................................... 11
ii
c. Disconnected Vent Tests .................................................................................................. 12
i) Location of Vent Disconnect ........................................................................................ 12
ii) Input Rate...................................................................................................................... 12
iii) Cycling.......................................................................................................................... 13
d. Observations ..................................................................................................................... 13
i) Flame Appearance ........................................................................................................ 14
ii) CO in Supply Air .......................................................................................................... 14
iii) Reduced Combustion Air.............................................................................................. 14
6. CONCLUSIONS.................................................................................................................. 14
ACKNOWLEDGMENTS ............................................................................................................ 15
REFERENCES ............................................................................................................................. 15
APPENDIX A: FURNACE SPECIFICATIONS AND SETUP................................................... 16
APPENDIX B: CHAMBER AND FURNACE CLOSET DESCRIPTION................................. 19
APPENDIX C: MEASUREMENT OF FURNACE OPERATING PARAMETERS.................. 21
APPENDIX D: GAS SAMPLING SYSTEM............................................................................... 23
APPENDIX E: FURNACE TEST MATRIX ............................................................................... 25
APPENDIX F: DERIVATION OF AIR EXCHANGE RATE AND EMISSION RATE............ 27
APPENDIX G. TEST DATA RESULTS..................................................................................... 31
EXECUTIVE SUMMARY
CPSC began a test program in 1999 to evaluate the carbon monoxide (CO) exposure hazard posed to consumers when a furnace vent pipe is blocked or disconnected. This report only describes the test results of a draft hood equipped furnace (Furnace #1) and does not address any associated health affects.
Tests were conducted in an environmentally controlled chamber with the furnace installed inside a closet located within the chamber. The chamber provided a well-mixed environment in which to measure the CO concentration and also allowed for the air exchange rate to be controlled. For each test, the CO concentration and air exchange rate in the chamber were measured. The CO emission rate from the furnace was then calculated using a simple mass balance model.
Three variables were investigated to determine how each affected the CO emissions from the furnace: the condition of the vent pipe, the energy input rate of the furnace, and the operating mode of the furnace. Tests were conducted with the vent pipe intact, partially or totally blocked, or totally disconnected. The input rate of the furnace was adjusted to its specified rate or to overfire conditions. The furnace was also operated continuously or cycled on and off.
The following is a summary of the test results:
• When the vent pipe was intact and not blocked, the concentration of CO in the chamber was negligible (< 3 ppm).
• During blocked vent tests, the CO concentration increased as the degree of vent blockage increased, as the input rate increased, and as the furnace “on” time increased. Depending on the test conditions, CO concentrations in the chamber ranged from 1 ppm to more than 1000 ppm.
• During disconnected vent tests, the CO concentration increased as the input rate and furnace “on” time increased. The CO concentration was generally higher when the vent was disconnected outside of the furnace closet as opposed to inside the closet. Depending on the test conditions, CO concentrations in the chamber ranged from 0 ppm to more than 1000 ppm.
• After initially working, the blocked vent shut off system failed to shut down the furnace when the vent pipe was totally blocked. This resulted in chamber CO concentrations ranging from 2 ppm to 331 ppm, depending on the test conditions.
• When the gas manifold pressure was adjusted to the manufacturer’s specifications, the furnace overfired by approximately 10 percent. Although the instructions also state to check the input rate by clocking the gas flow, there is no statement indicating whether the gas manifold pressure or clocking the gas flow takes precedent when setting up the furnace.
• No visible differences in the flame color, shape, or intensity were observed as the gas input rate varied from the manufacturer’s specified rate to an overfire rate of 23 percent. For all tests, the flame remained blue in color and did not impinge on the combustion chamber walls. This may be of concern since the installation instructions state that the “flame should be predominately blue in color” and “not impinge on the combustion chamber walls” for proper operation.
1
1. INTRODUCTION
CPSC began a test program in 1999 to evaluate the carbon monoxide (CO) exposure hazard posed to consumers when a furnace vent pipe is blocked or disconnected. This test program is part of CPSC’s effort to reduce deaths and injuries related to carbon monoxide poisoning. The test program consists of testing several different furnaces under controlled conditions and measuring the amount of CO that accumulates in a room when the vent pipe is partially blocked, totally blocked, or disconnected. The test results will be used to model indoor air concentrations and assess health effects. These modeling results will then be used to support current and potential recommendations to the ANSI/CGA Z21.47 Gas Fired Central Furnace subcommittee. For a draft hood equipped furnace, the current ANSI Z21.47 standard (1998) provides some degree of coverage for a totally blocked vent, but does not address the issues of a partially blocked vent or a disconnected vent.
This report describes the test results for a draft hood equipped furnace (Furnace #1). Tests were conducted in an environmentally controlled chamber with the furnace installed inside a closet located within the chamber. The chamber provided a well-mixed environment in which to measure the CO concentration and also allowed for the air exchange rate to be controlled. The furnace was operated at conditions specified by the ANSI Z21.47 standard (1998) and those that could occur in actual use. For all tests, the CO concentration in the chamber and closet were measured as well as the air exchange rate in the chamber. The CO emission rate from the furnace was then calculated using the equilibrium CO concentration, the air exchange rate, and a simple mass balance model.
2. TEST EQUIPMENT AND SETUP
a. Furnace
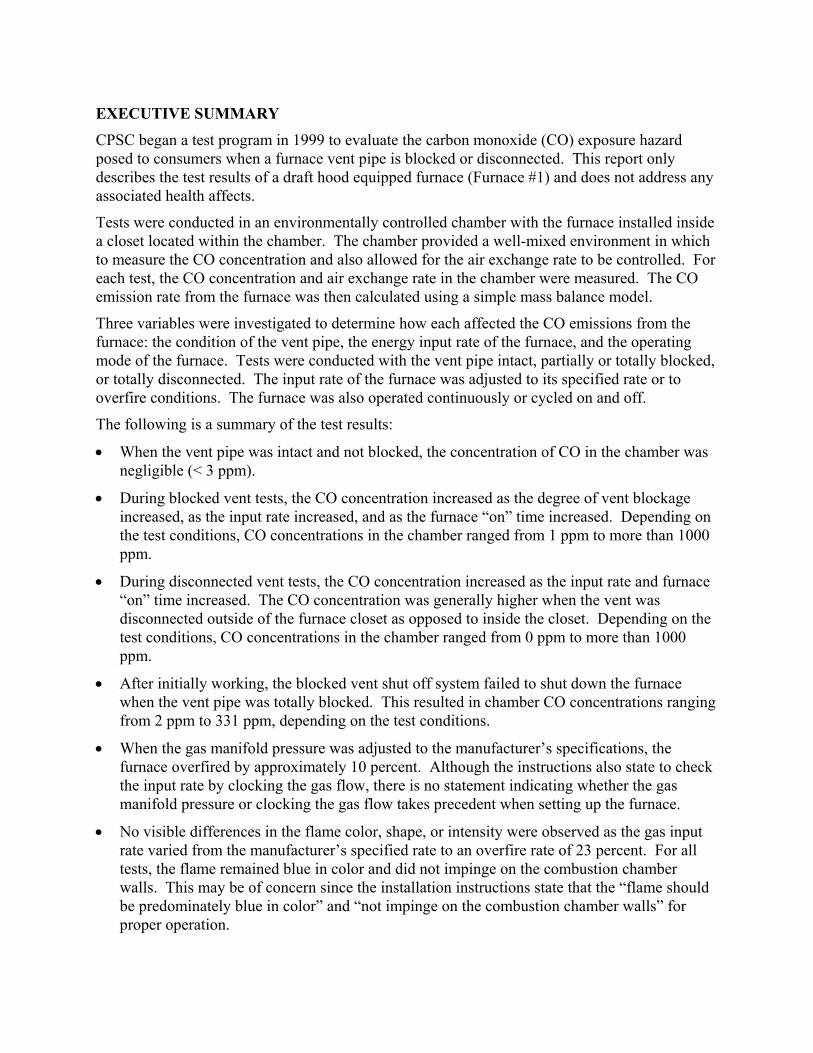
Tests were conducted using a draft hood-equipped furnace (Furnace #1). Furnace #1 is a non-condensing, mid-efficiency gas furnace with an Annualized Fuel Utilization Efficiency of 78 percent. This furnace was shipped from the manufacturer preset for use with natural gas and with an energy input rate of 100,000 Btu/hr. It is AGA certified (ANSI Z21.47a-CAN/CGA-2.3a 1995) as a Category I unit and for operation with a one-pipe vent (exhaust vent pipe) installation. The unit is configured for upflow operation (i.e., the circulation air blower is located at the bottom of the unit, blowing supply air upward, across the heat exchanger). Figure 2.1 shows the furnace as installed for testing. Appendix A provides additional details of the furnace setup and specifications.
The unit was purchased from a local heating, ventilation, and air conditioning (HVAC) dealer and installed by CPSC staff. On March 24, 1999, CPSC staff met with furnace manufacturing representatives (including a manufacturing representative for Furnace #1) and a representative from the Gas Appliance Manufacturers Association (GAMA) to obtain their input on the test protocol and setup. The manufacturing representative for Furnace #1 also met with CPSC staff on March 25, 1999, and verified that the furnace was installed and operating properly.
2
Figure 2.1. Draft Hood Equipped Test Furnace
Since the furnace is equipped with a draft hood, it must comply with the blocked vent shutoff system (BVSS) provisions (Section 2.19) of ANSI Z21.47. These provisions require a draft hood-equipped furnace to have a mechanism to shut off the furnace when the vent is totally blocked. This particular furnace is equipped with a bimetal disc thermostat located in the draft hood to comply with the BVSS provisions of the standard. The disc thermostat requires manual resetting each time the sensor is actuated.
b. Test Chamber and Furnace Closet
In order to accurately model room concentrations of CO, it was necessary to measure CO emissions from the furnace in a well-mixed room while controlling the number of air changes in that room. A modified environmental test chamber was therefore used for the tests. The internal volume of the chamber was 837 cubic feet (23.7 cubic meters). The chamber was designed to provide an environment in which the air was well mixed and the temperature, pressure, and air exchange rate could be controlled. In order to prevent back drafting, the differential pressure between the chamber and the laboratory was kept near zero using a pressure control system. Appendix B describes the chamber in greater detail.
A furnace closet was erected within the chamber. The internal volume of the closet was approximately 196 cubic feet (5.55 cubic meters). The closet complied with the National Fuel Gas Code (1996) and the manufacturer's requirements for a "Confined Space" furnace installation. A well-mixed environment within the closet could not be assumed since no fans were used to promote mixing. Fans were not used in the closet in order to prevent interference
3
with the operation of the furnace. The furnace was positioned inside the closet so that the manufacturer’s specification for minimum distances to combustible surfaces was met. Appendix B describes the furnace closet in further detail.
c. Vent Blockage Device and Vent Disconnect
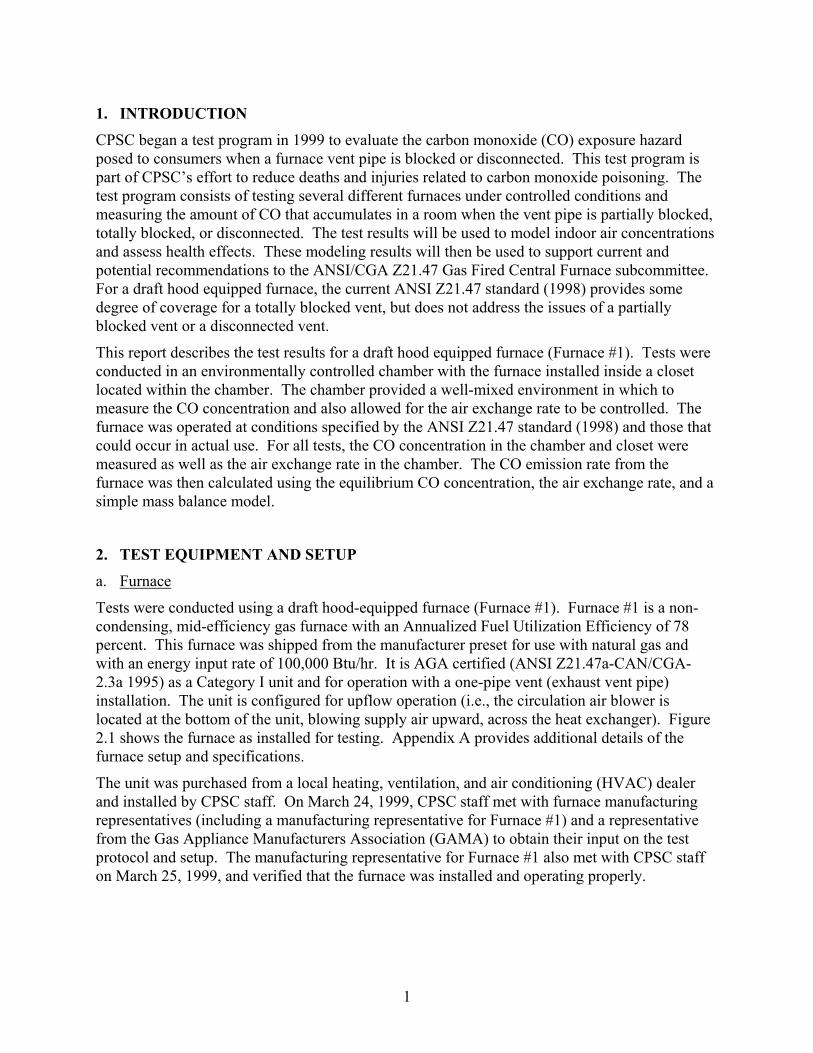
An optical iris was used to create various degrees of vent blockage. Figure 2.2 illustrates the iris (black in color) located in the vent system. Different blockages were obtained by adjusting the diameter of the iris. When the iris was totally closed, blockage was 99.6 percent since a small hole was still present. For testing purposes, it was assumed that a 99.6 percent blocked vent was equivalent to a totally blocked vent. The iris was located at a vertical height of 1.25 feet (0.38 meters) and a horizontal distance of 3.42 feet (1.04 meters) from the furnace (see Figure C.1 in Appendix C).
Iris
Figure 2.2. Iris Used to Create Vent Blockages
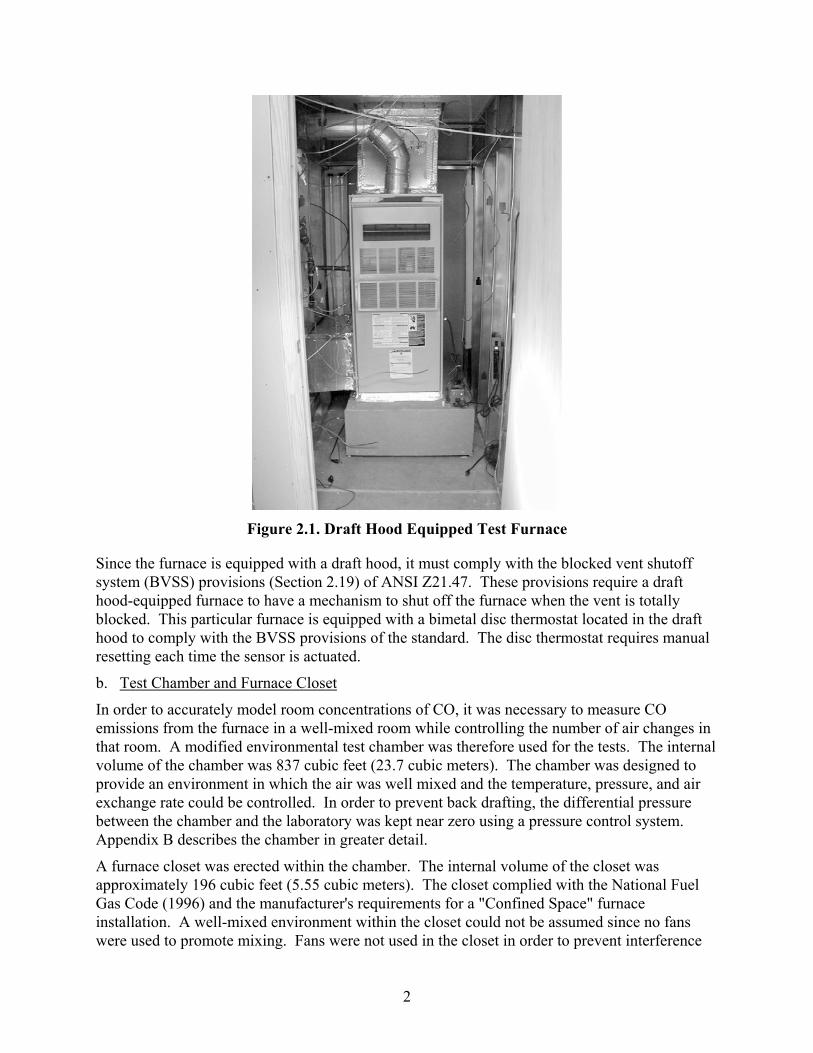
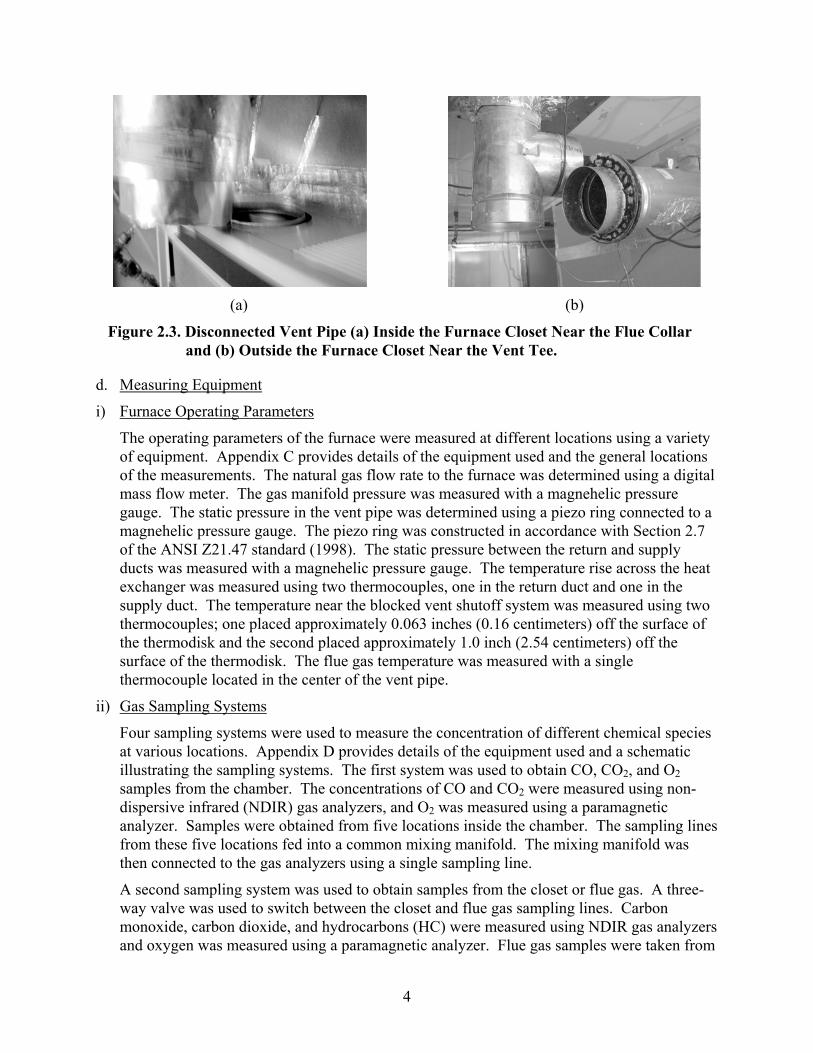
To simulate a disconnected vent pipe, the vent pipe was totally separated from a section of the vent system. The vent pipe was disconnected either inside or outside of the furnace closet. For disconnected vent tests where the vent disconnect was in the closet, the vent pipe was separated from the furnace at the flue collar (Figure 2.3 (a)). For disconnected vent tests where the vent was disconnected outside of the closet, that is, in the chamber, the vent pipe was separated at the vent tee (Figure 2.3 (b)). The vent tee was located at a vertical height of 1.24 feet (0.38 meters) and a horizontal distance of 4.0 feet (1.22 meters) from the furnace. Figure C.1 in Appendix C illustrates the location of the flue collar and the vent tee relative to the furnace.
4
(a) (b)
Figure 2.3. Disconnected Vent Pipe (a) Inside the Furnace Closet Near the Flue Collar and (b) Outside the Furnace Closet Near the Vent Tee.
d. Measuring Equipment
i) Furnace Operating Parameters
The operating parameters of the furnace were measured at different locations using a variety of equipment. Appendix C provides details of the equipment used and the general locations of the measurements. The natural gas flow rate to the furnace was determined using a digital mass flow meter. The gas manifold pressure was measured with a magnehelic pressure gauge. The static pressure in the vent pipe was determined using a piezo ring connected to a magnehelic pressure gauge. The piezo ring was constructed in accordance with Section 2.7 of the ANSI Z21.47 standard (1998). The static pressure between the return and supply ducts was measured with a magnehelic pressure gauge. The temperature rise across the heat exchanger was measured using two thermocouples, one in the return duct and one in the supply duct. The temperature near the blocked vent shutoff system was measured using two thermocouples; one placed approximately 0.063 inches (0.16 centimeters) off the surface of the thermodisk and the second placed approximately 1.0 inch (2.54 centimeters) off the surface of the thermodisk. The flue gas temperature was measured with a single thermocouple located in the center of the vent pipe.
ii) Gas Sampling Systems
Four sampling systems were used to measure the concentration of different chemical species at various locations. Appendix D provides details of the equipment used and a schematic illustrating the sampling systems. The first system was used to obtain CO, CO2, and O2 samples from the chamber. The concentrations of CO and CO2 were measured using non-dispersive infrared (NDIR) gas analyzers, and O2 was measured using a paramagnetic analyzer. Samples were obtained from five locations inside the chamber. The sampling lines from these five locations fed into a common mixing manifold. The mixing manifold was then connected to the gas analyzers using a single sampling line.
A second sampling system was used to obtain samples from the closet or flue gas. A three-way valve was used to switch between the closet and flue gas sampling lines. Carbon monoxide, carbon dioxide, and hydrocarbons (HC) were measured using NDIR gas analyzers and oxygen was measured using a paramagnetic analyzer. Flue gas samples were taken from

5
a single location downstream of the flue collar. Closet air samples were taken from five locations inside the closet. The sampling lines from these five locations fed into a common mixing manifold. The mixing manifold was then connected to the three-way valve using a single sampling line. To prevent water from condensing inside the gas analyzers during the sampling of the flue gas, the water was condensed out of the sample prior to entering the analyzers. A simple heat exchange system using recirculated chilled water was used to condense the water out of the gas sample.
A third sampling system was used to obtain the concentration of CO in the return and supply ducts. A three-way valve was used to switch between the return and supply duct sample lines. The concentration of CO was measured with a NDIR gas analyzer.
A fourth sampling system was used to obtain the background concentration of CO in the laboratory. A NDIR gas analyzer was used to measure the concentration of CO. The sampling line was positioned near the inlet pipe that brought fresh air into the chamber.
iii) Air Exchange Rate
To determine the air exchange rate in the chamber and closet, the tracer gas sulfur hexafluoride (SF6) was injected into the chamber. The flow rate of SF6 was measured using a rotameter and the concentrations of SF6 in the chamber and closet were measured with an electron capture gas chromatograph analyzer. To ensure that the tracer gas was evenly distributed, the gas was injected above each set of fans used with the four fin-and-tube heat exchangers. Samples were obtained using the existing sampling lines for the chamber and closet (Appendix D). To verify the number of air changes per hour (ACH) obtained with the SF6 tracer gas, CO was also injected into the chamber during several tests. A mass flow controller was used for the CO injection and the NDIR analyzers for the chamber and closet were used to measure the CO concentrations.
iv) Room Temperature, Pressure, and Relative Humidity
The temperature in the chamber was measured with four thermocouples. The thermocouples were located near each corner in the chamber. The temperature in the closet was measured with a single thermocouple located approximately midway between the floor and the ceiling. A thermocouple was also used to measure the ambient air temperature entering the chamber. The thermocouple was positioned near the inlet pipe for the fresh air supply to the chamber.
A photohelic pressure gauge was used to measure the differential pressure between the chamber and the laboratory. The pressure gauge was part of the pressure control system used to prevent the chamber from becoming over or under pressurized relative to the laboratory building in which the chamber was located.
The local pressure and temperature in the laboratory was obtained using a barometer with a built in thermometer. The relative humidity of the laboratory air was measured with a digital hygrometer.
v) Natural Gas
The furnace was fired with natural gas obtained from a city supply line. The daily average higher heating value of the natural gas was obtained from the local gas supplier (Washington Gas). In addition, the gas company supplied the daily average chemical composition of the natural gas.
6
vi) Data Acquisition System
A data acquisition system was used to record the majority of the data. The system consisted of a personal computer running LABTECH NOTEBOOK data acquisition software that recorded the data every 20 seconds. The data acquisition program recorded the raw voltage output from the various measuring devices (gas analyzers, thermocouples, pressure gauges, and flow meter) into a data file. The program converts these voltage readings directly into the appropriate units for concentration (percent or parts per million), temperature (degrees Fahrenheit), pressure (inches of water column), and flow rate (cubic feet per minute). These converted values were recorded in the data file. The only items not recorded electronically were the SF6 flow rate from the rotameter, the vent pressure, the differential pressure between the chamber and laboratory, and the barometric pressure, temperature and relative humidity of the laboratory. A second computer was used with the SF6 analyzer to record the concentrations.
3. TEST METHODS AND PROCEDURES
a. Furnace Installation
The furnace was installed according to the manufacturer’s installation instructions and the National Fuel Gas Code (1996). To confirm proper furnace operation, the temperature rise across the heat exchanger and the static pressure between the return and supply ducts were checked for compliance with the manufacturer’s specifications.
b. Furnace Input Rate
The furnace input rate was set by adjusting the gas manifold pressure. This was accomplished by turning the adjustment screw of the pressure regulator clockwise to increase the pressure or counter clockwise to decrease the pressure. All input rates reported in this report are within ± 3 percent of the stated values. The input rates were calculated using an average higher heating value of 1040 Btu per cubic feet.
A discrepancy existed in the manufacturer’s instructions on how to set the input rate to the furnace. The installer is instructed to first check the input rate by clocking the gas flow to the furnace using a gas meter. The installer is then instructed to check and adjust the gas manifold pressure to 3.5 inches of water column (w.c.). When the manifold pressure was set to 3.5 inches w.c., the furnace overfired by approximately 10 percent (110,000 Btu/hr). The instructions do not state whether manifold pressure or clocking the gas flow takes precedent. Since the installer may only set the manifold pressure and not clock the gas flow, a decision was made to test the furnace both at its specified rate (100,000 Btu/hr) and also at the rate obtained when the manifold pressure was set to 3.5 inches w.c. (110,000 Btu/hr).
The original test plan included testing the furnace in accordance with the overfire provisions of ANSI Z21.47 (1998). These provisions require that the furnace input rate be adjusted to 12 percent above the manufacturer’s specified rate. Since the firing rate obtained when installed according to the manufacturer’s directions was 10 percent above the manufacturer’s specified rate, and because staff felt it foreseeable that an installer might only adjust the manifold pressure, a decision was made to test the furnace at an input rate of 12 percent above this installed rate, as
7
well as 12 percent above the manufacturer’s specified rate. This resulted in firing rates of 123,000 Btu/hr and 112,000 Btu/hr, respectively. CPSC incident data demonstrates that some furnaces involved in CO exposure have, upon inspection, been found to be overfired.
c. Test Matrix
Table E.1 in Appendix E shows the Furnace Test Matrix. It should be noted that not all tests listed in Table E.1 were necessarily performed. The test plan design allowed for omission of some tests within the Baseline, Blocked Vent, and Disconnected Vent tests if certain criteria were satisfied. The criteria for omission were as follows: (1) if a shutoff device or other aspect of a furnace design caused it to shutdown during any of the incremental blockage or disconnected vent conditions; or (2) if the furnace continued to operate under partial blockage or disconnect conditions, but the resultant chamber CO concentrations were negligible; or (3) if the furnace input rate, as installed, was within ± 3 percent of the manufacturer’s specified input rate. If either of the first two criteria were satisfied, then tests involving lesser degrees of vent blockage or disconnect were omitted.
Each test had three main variables: the condition of the vent pipe, the input rate to the furnace, and the operating mode of the furnace. The vent pipe was intact (baseline condition), blocked, or disconnected. For blockage tests, the vent was blocked from 50 to 100 percent. Tests with the vent totally blocked were similar to the blocked vent shut off test required by ANSI Z21.47 standard (Section 2.19, 1993). For disconnected vent tests, the vent was totally separated from the vent system in the closet or in the chamber. The input rate to the furnace was 100,000 Btu/hr, 110,000 Btu/hr, 112,000 Btu/hr, or 123,000 Btu/hr. The furnace was operated either continuously or it was cycled on for 8 minutes and off for 2 minutes. The cycling rate was based on information obtained from the AGA booklet, “Fundamentals of Gas Appliances” (1988). The booklet states that, as a rule-of-thumb, the optimal cycling rate of a furnace burner is approximately six times per hour. The booklet also states that this optimal cycling rate will be maintained if the furnace is operating 20 to 80 percent of the time. Therefore, a cycle time of 8 minutes on and 2 minutes off was used.
d. Test Procedures
At the start of each day, the gas analyzers were calibrated according to the instructions specified by the manufacturer of the analyzer. In general, the meters were zeroed with nitrogen gas and spanned using a gas of known concentration (EPA protocol). The analyzers were also checked at mid- and low-range concentrations to verify the performance of the analyzers. To begin an actual test, the data acquisition program was started. The furnace was then started by setting the cycle timer to operate continuously or to cycle on and off. The cycle timer was used to simulate a call for heat by a thermostat. The furnace was allowed to warm up for 15 minutes in order to reach equilibrium. This 15-minute warm up is similar to many test protocols in the ANSI Z21.47 standard (1998). During this warm up period the manifold pressure was adjusted as required to attain the desired input rate. At approximately 15 minutes, the flue gas sample was obtained and the gas flow rate was recorded. If the vent was to be blocked or disconnected, staff entered the chamber and closet (if necessary) and made the appropriate changes to the vent pipe. The closet and chamber doors were closed and the SF6 tracer gas injection was started. The injection of the tracer gas continued until it had reached an equilibrium concentration in the chamber (approximately one hour). By this time, the concentrations of the other chemical
8
species (CO, O2, and CO2) had also reached equilibrium. After reaching equilibrium, the injection of the tracer gas was stopped, and the tracer gas decay was monitored. The test was complete once the concentration of the SF6 tracer gas was less than 10 percent of the SF6 analyzer’s full-scale value. The data acquisition program and cycle timer were then stopped, and the chamber and closet were allowed to air out before beginning the next test. As a back up to the electronic data, the concentration data were recorded manually at various times during the test. The times at which the three-way valves were switched to toggle between the return and supply duct samples and between the closet and flue samples were also recorded manually.
4. DATA REDUCTION
a. Equilibrium Determination
All data from the data acquisition program were imported into a Microsoft Excel spreadsheet. The SF6 concentration data were also imported into the same spreadsheet. The concentrations of CO and O2 in the chamber and closet were then plotted versus time in order to determine the equilibrium period. Once the equilibrium period was established, the average values for all data were calculated during this time interval. For cycling tests, the gas flow rate and the manifold pressure were averaged only during the “on” time of the cycle. Once the average values were obtained, the CO concentrations were corrected for any background CO present in the laboratory during the equilibrium period and also for any meter offset present at the start of the test.
b. Air Exchange Rate
The number of air changes per hour (ACH) for the chamber was estimated from the SF6 equilibrium concentration data in the chamber. The ACH was calculated based on the assumption that the chamber can be modeled as a one-zone system. In the one-zone model, the closet is treated as a non-participating volume. Thus, the actual chamber volume is the total internal volume of the chamber less the volume of the closet and any additional equipment (return duct, vent pipe, etc.) in the chamber. The net volume is 632 cubic feet (17.9 cubic meters). Appendix F provides a derivation of the following equation used to estimate the ACH in the chamber:
=
VCS
ACHeq
inj [4.1]
where, ACH = number of air changes per hour in the chamber, 1/hr Sinj = injection rate of SF6, cc/hr Ceq = equilibrium concentration of SF6 in chamber, 0.001 cc/m3 or ppb V = volume of chamber less volume of closet and any additional equipment, m3
c. Emission Rate
The CO emission rate from the furnace was estimated using the CO equilibrium concentration data in the chamber. The emission rate was calculated based on the assumption that the chamber can be modeled as a one-zone system and that the emission source is the combined closet and furnace. The derivation of the emission rate is similar to the derivation of the ACH described in Appendix F. The CO emission rate is then calculated using the following equation:
9
VACHCEeqCOCO = [4.2]
where, ECO = CO emission rate, cc/hr CCOeq = equilibrium concentration of CO in the chamber, cc/m3 or ppm ACH = air exchange rate in the chamber, air changes per hour V = volume of chamber less volume of closet and any additional equipment, m3
5. RESULTS AND DISCUSSION
a. Baseline Tests (Intact Vent)
Tests were conducted with the vent pipe intact to establish the baseline operating condition of the furnace at different input rates and with the furnace cycling or operating continuously. For all test conditions, the concentration of CO in the chamber was negligible (< 3 ppm) as illustrated in Table G.1 (Appendix G). The air exchange rate in the chamber varied from 10.4 to 11.3 air changes per hour.
b. Blocked Vent Tests
Tests were performed with the vent pipe partially and totally blocked. Three variables were looked at during these tests: the degree of vent blockage, the input rate of the furnace, and the operational mode of the furnace (continuous or cycling). For all tests, the air exchange rate varied from 9.9 to 12.3 air changes per hour. Table G.2 (Appendix G) provides a list of the data. The following is a summary of the trends observed for each test variable.
i) Degree of Blockage
Eight tests were conducted with the vent pipe totally blocked (Table 5.1). Of these eight tests, the furnace shut off twice within ten minutes after being totally blocked. Ten minutes corresponds to the current ANSI Z21.47 standard (1998), which requires draft hood equipped furnaces to shut off within ten minutes after the flue is totally blocked. For the tests in which the furnace did not shut off, the CO concentration in the chamber depended on the operational conditions of the furnace. At the manufacturer’s specified rate of 100,000 Btu/hr, the concentration of CO in the chamber reached a maximum of 6 ppm, which represents a CO emission rate of 1,046 cc/hr. At 110,000 Btu/hr (the rate obtained by installing the furnace per the manufacturer’s instructions), the concentration of CO in the chamber reached a maximum of 331 ppm. This represents a CO emission rate of 73,878 cc/hr. The air changes in the chamber ranged from 10.6 to 12.1 air changes per hour during the total blocked vent tests.
Table 5.1. Totally Blocked Vent Tests Results
Test Number
Input Rate (Btu/hr)
Mode of Operation
Did Furnace Shut Off
Shut off Time (minutes)
Chamber CO (ppm)
CO Emission Rate (cc/hr)
58 100,000 Continuous No N/A 6 1,046
10
69 100,000 Cycling No N/A 2 373
5 110,000 Continuous Yes 7.33 N/A N/A
4 110,000 Continuous Yes 9.00 N/A N/A
54 110,000 Continuous No N/A 331 73,878
56 110,000 Continuous No N/A 260 52,478
61 110,000 Cycling No N/A 38 7,957
57 110,000 Cycling No N/A 39 8,038
Tests were also performed with the vent pipe partially blocked from 50 to 95 percent. The vent was gradually blocked in order to determine the greatest amount of blockage possible where the furnace would continue to operate. However, as Table 5.1 illustrated, the furnace continued to operate with the vent totally blocked during several tests. Table 5.2 illustrates how increasing the degree of blockage affects the CO emissions from the furnace. The data listed in Table 5.2 is for this furnace operating continuously at an input rate of 110,000 Btu/hr. As expected, the concentration of CO in the chamber increased as the degree of vent blockage increased. This same trend was observed for different input rates and with the furnace cycling or operating continuously (Table G.2, Appendix G). The maximum concentration of CO obtained in the chamber was greater than 1000 ppm when the furnace was operated continuously at 123,000 Btu/hr and the vent pipe was blocked 90 percent. The exact CO concentration could not be measured since the actual concentration exceeded the upper limit of the CO analyzer (1000 ppm). The air changes in the chamber ranged from 9.9 to 12.3 air changes per hour during the partially blocked vent tests.
Table 5.2. Partially Blocked Vent Test Results for a Furnace Operating Continuously at 110,000 Btu/hr
Test Number Degree of Blockage (percent)
Input Rate (Btu/hr)
Chamber CO (ppm)
CO Emission Rate (cc/hr)
6 50 110,000 1 126
7 80 110,000 2 541
64 90 110,000 17 3,428
Although not required by ANSI Z21.47 (1998), the furnace shut off three times (Test 8, 16, and 39) during the partially blocked vent tests. When the furnace shut down, the blockages ranged from 80 to 95 percent and the time required for shut off ranged from 4 to 46 minutes. For the furnace operating continuously at an input rate of 123,000 Btu/hr and with the vent blocked 90 percent (Test 39), the furnace operated for a total of 43 minutes. During this time, the concentration of CO in the chamber reached an equilibrium value of 806 ppm before the furnace shut off.
ii) Input Rate
Tests were conducted at input rates of 100,000, 110,000, 112,000, and 123,000 Btu/hr as described in the “Test Methods and Procedures” section. Table 5.3 illustrates how increasing
11
the input rate affects the concentration of CO in the chamber. The data in Table 5.3 is for the furnace operating continuously with a constant vent blockage of 90 percent. Tests were performed at two additional input rates (113,000 and 116,000 Btu/hr) in order to supplement the data. As expected, the CO emission rate increased as the input rate increased. The concentration of CO in the chamber obtained at an input rate of 110,000 Btu/hr was slightly greater than the CO obtained at a rate of 112,000 Btu/hr. This may have occurred since the vent pipe for the test at 110,000 Btu/hr was blocked immediately without the normal 15 minutes warm-up period.
Table 5.3. Results of Increasing the Input Rate to a Furnace Operating Continuously with a Constant Vent Pipe Blockage of 90 Percent
Test Number Input Rate (Btu/hr)
Chamber CO (ppm)
CO Emission Rate (cc/hr)
64 110,000 17 3,428
47 112,000 11 1,964
67 113,000 163 34,624
66 116,000 308 65,752
52 123,000 > 1000 > 225,200
It was observed that as the input rate increased, the concentration of CO increased at different degrees of vent blockages and with the furnace cycling or operating continuously (Table G.2, Appendix G). At the manufacturer’s specified rate of 100,000 Btu/hr, the maximum concentration of CO measured in the chamber was 6 ppm. At 110,000 Btu/hr (the rate obtained by installing the furnace per the manufacturer’s instructions), the maximum concentration of CO measured in the chamber was 331 ppm.
iii) Cycling
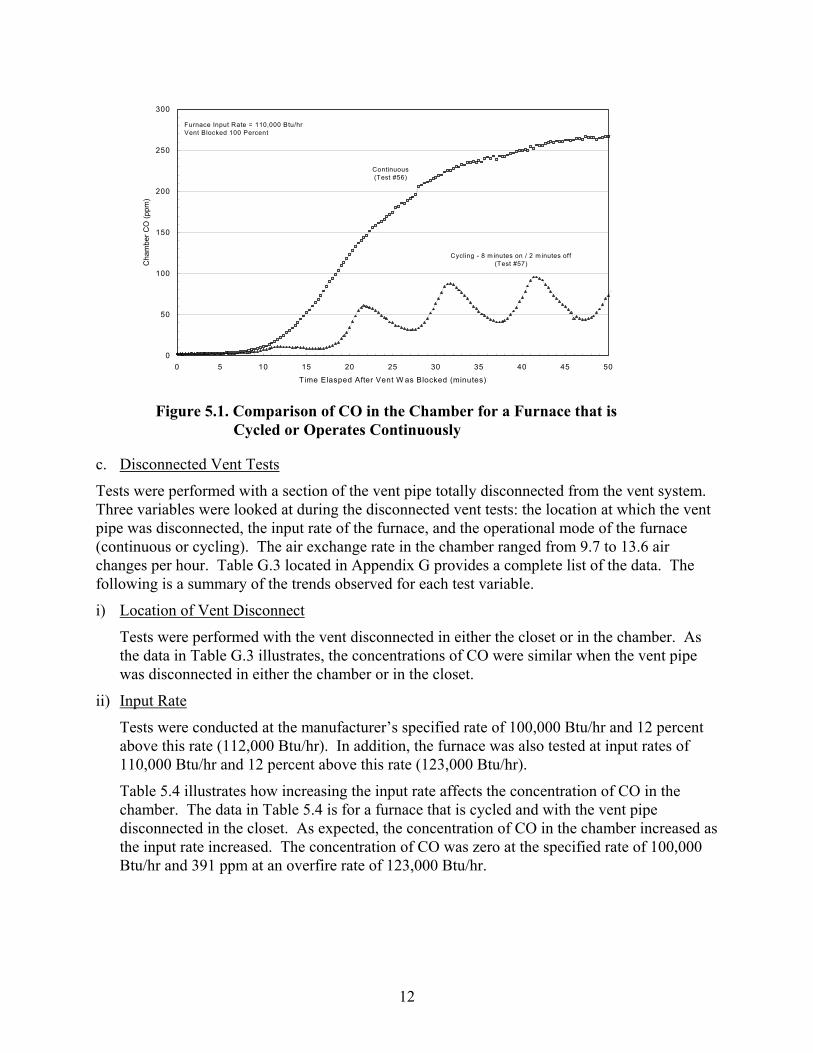
Tests were performed with the furnace operating continuously or cycling at a rate of 8 minutes on and 2 minutes off. As Figure 5.1 illustrates, a furnace with a blocked vent generated more CO when operating continuously than when cycling on and off. Figure 5.1 plots the data for a furnace operating at an input rate of 110,000 Btu/hr with the vent pipe totally blocked. For all input rates and vent blockages tested, when the furnace operated continuously, the equilibrium concentration of CO was approximately 2 to 3 times higher than when the furnace was cycled.
12
0
50
100
150
200
250
300
0 5 10 15 20 25 30 35 40 45 50
Time Elasped After Vent W as Blocked (minutes)
Cha
mbe
r CO
(ppm
)
Continuous(Test #56)
Cycling - 8 m inutes on / 2 m inutes off(Test #57)
Furnace Input Rate = 110,000 Btu/hrVent Blocked 100 Percent
Figure 5.1. Comparison of CO in the Chamber for a Furnace that is
Cycled or Operates Continuously
c. Disconnected Vent Tests
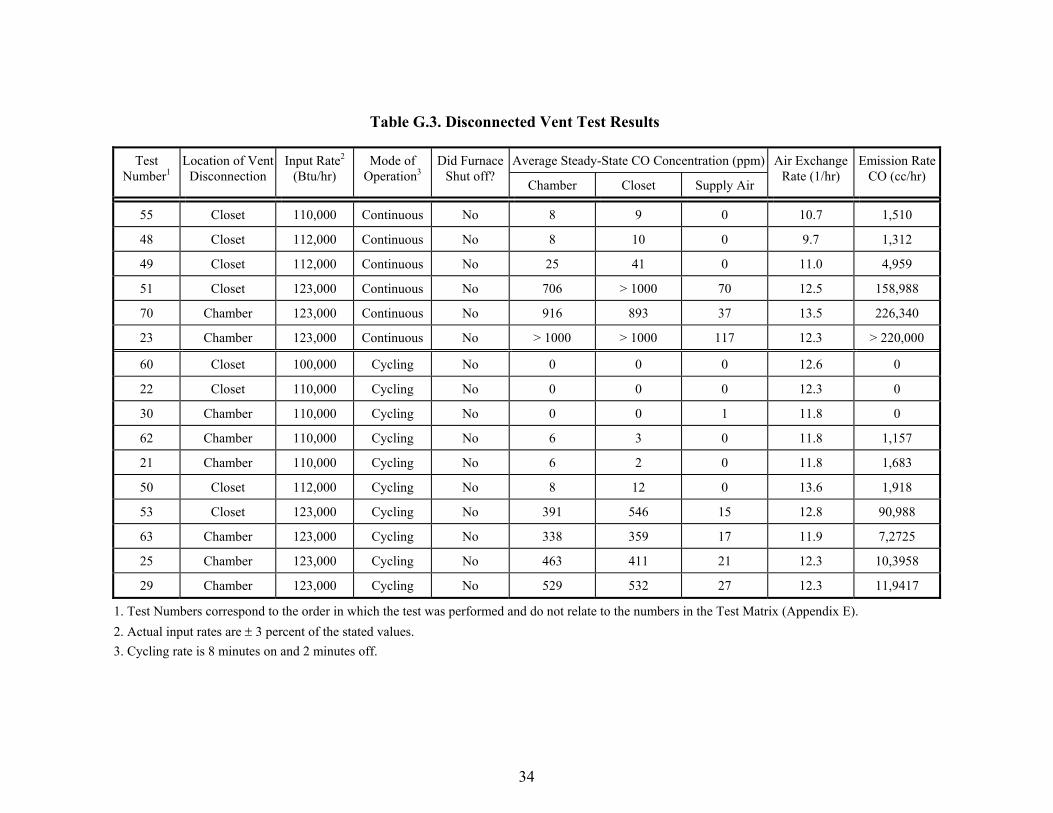
Tests were performed with a section of the vent pipe totally disconnected from the vent system. Three variables were looked at during the disconnected vent tests: the location at which the vent pipe was disconnected, the input rate of the furnace, and the operational mode of the furnace (continuous or cycling). The air exchange rate in the chamber ranged from 9.7 to 13.6 air changes per hour. Table G.3 located in Appendix G provides a complete list of the data. The following is a summary of the trends observed for each test variable.
i) Location of Vent Disconnect
Tests were performed with the vent disconnected in either the closet or in the chamber. As the data in Table G.3 illustrates, the concentrations of CO were similar when the vent pipe was disconnected in either the chamber or in the closet.
ii) Input Rate
Tests were conducted at the manufacturer’s specified rate of 100,000 Btu/hr and 12 percent above this rate (112,000 Btu/hr). In addition, the furnace was also tested at input rates of 110,000 Btu/hr and 12 percent above this rate (123,000 Btu/hr).
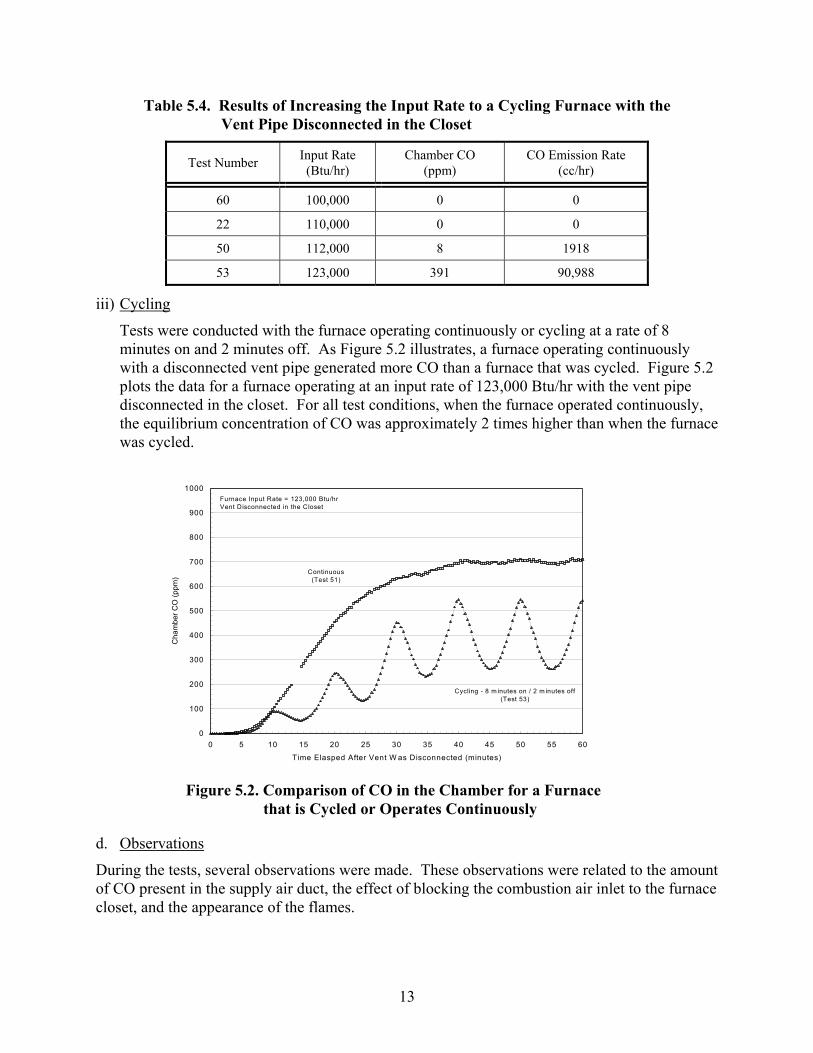
Table 5.4 illustrates how increasing the input rate affects the concentration of CO in the chamber. The data in Table 5.4 is for a furnace that is cycled and with the vent pipe disconnected in the closet. As expected, the concentration of CO in the chamber increased as the input rate increased. The concentration of CO was zero at the specified rate of 100,000 Btu/hr and 391 ppm at an overfire rate of 123,000 Btu/hr.
13
Table 5.4. Results of Increasing the Input Rate to a Cycling Furnace with the Vent Pipe Disconnected in the Closet
Test Number Input Rate (Btu/hr)
Chamber CO (ppm)
CO Emission Rate (cc/hr)
60 100,000 0 0
22 110,000 0 0
50 112,000 8 1918
53 123,000 391 90,988
iii) Cycling
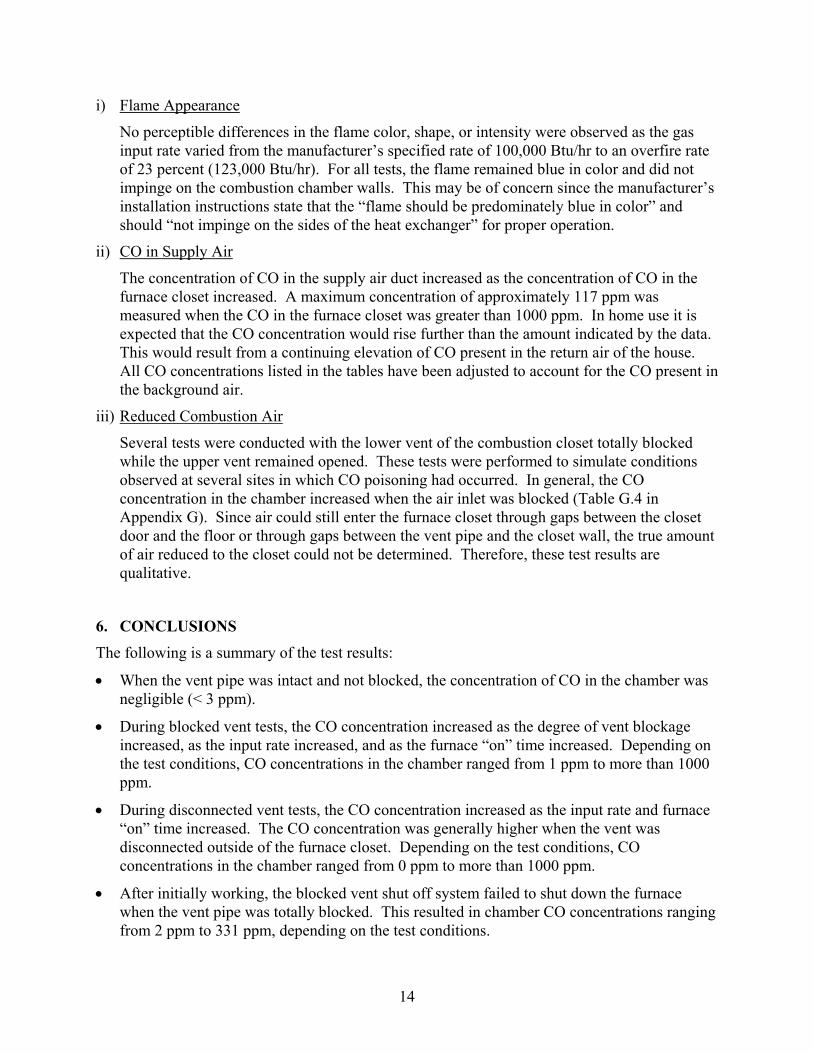
Tests were conducted with the furnace operating continuously or cycling at a rate of 8 minutes on and 2 minutes off. As Figure 5.2 illustrates, a furnace operating continuously with a disconnected vent pipe generated more CO than a furnace that was cycled. Figure 5.2 plots the data for a furnace operating at an input rate of 123,000 Btu/hr with the vent pipe disconnected in the closet. For all test conditions, when the furnace operated continuously, the equilibrium concentration of CO was approximately 2 times higher than when the furnace was cycled.
0
100
200
300
400
500
600
700
800
900
1000
0 5 10 15 20 25 30 35 40 45 50 55 60
Time Elasped After Vent W as Disconnected (minutes)
Cha
mbe
r CO
(ppm
)
Continuous (Test 51)
Cycling - 8 m inutes on / 2 m inutes off (Test 53)
Furnace Input Rate = 123,000 Btu/hrVent Disconnected in the Closet
Figure 5.2. Comparison of CO in the Chamber for a Furnace
that is Cycled or Operates Continuously
d. Observations
During the tests, several observations were made. These observations were related to the amount of CO present in the supply air duct, the effect of blocking the combustion air inlet to the furnace closet, and the appearance of the flames.
14
i) Flame Appearance
No perceptible differences in the flame color, shape, or intensity were observed as the gas input rate varied from the manufacturer’s specified rate of 100,000 Btu/hr to an overfire rate of 23 percent (123,000 Btu/hr). For all tests, the flame remained blue in color and did not impinge on the combustion chamber walls. This may be of concern since the manufacturer’s installation instructions state that the “flame should be predominately blue in color” and should “not impinge on the sides of the heat exchanger” for proper operation.
ii) CO in Supply Air
The concentration of CO in the supply air duct increased as the concentration of CO in the furnace closet increased. A maximum concentration of approximately 117 ppm was measured when the CO in the furnace closet was greater than 1000 ppm. In home use it is expected that the CO concentration would rise further than the amount indicated by the data. This would result from a continuing elevation of CO present in the return air of the house. All CO concentrations listed in the tables have been adjusted to account for the CO present in the background air.
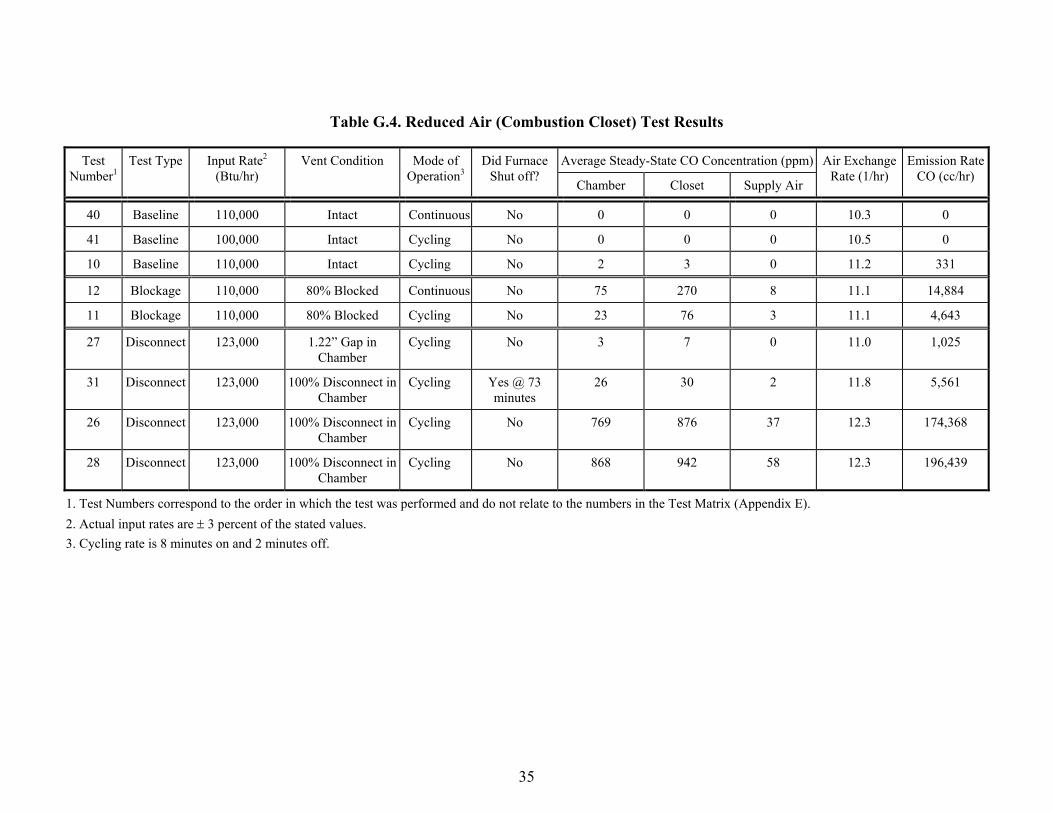
iii) Reduced Combustion Air
Several tests were conducted with the lower vent of the combustion closet totally blocked while the upper vent remained opened. These tests were performed to simulate conditions observed at several sites in which CO poisoning had occurred. In general, the CO concentration in the chamber increased when the air inlet was blocked (Table G.4 in Appendix G). Since air could still enter the furnace closet through gaps between the closet door and the floor or through gaps between the vent pipe and the closet wall, the true amount of air reduced to the closet could not be determined. Therefore, these test results are qualitative.
6. CONCLUSIONS
The following is a summary of the test results:
• When the vent pipe was intact and not blocked, the concentration of CO in the chamber was negligible (< 3 ppm).
• During blocked vent tests, the CO concentration increased as the degree of vent blockage increased, as the input rate increased, and as the furnace “on” time increased. Depending on the test conditions, CO concentrations in the chamber ranged from 1 ppm to more than 1000 ppm.
• During disconnected vent tests, the CO concentration increased as the input rate and furnace “on” time increased. The CO concentration was generally higher when the vent was disconnected outside of the furnace closet. Depending on the test conditions, CO concentrations in the chamber ranged from 0 ppm to more than 1000 ppm.
• After initially working, the blocked vent shut off system failed to shut down the furnace when the vent pipe was totally blocked. This resulted in chamber CO concentrations ranging from 2 ppm to 331 ppm, depending on the test conditions.
15
• When the gas manifold pressure was adjusted to the manufacturer’s specifications, the furnace overfired by approximately 10 percent. Although the instructions also state to check the input rate by clocking the gas flow, there is no statement indicating whether the gas manifold pressure or clocking the gas flow takes precedent when setting up the furnace.
• No visible differences in the flame color, shape, or intensity were observed as the gas input rate varied from the manufacturer’s specified rate to an overfire rate of 23 percent. For all tests, the flame remained blue in color and did not impinge on the combustion chamber walls. This may be of concern since the installation instructions state that the “flame should be predominately blue in color” and should “not impinge on the combustion chamber walls” for proper operation.
ACKNOWLEDGMENTS
Editors: Andrew Stadnik, Warren Porter, and James Hyatt
Design and Construction of Test Chamber: Mark Eilbert, Han Lim, and Perry Sharpless
General Support: Paula Simon, Dean LaRue, Dwayne Davis, Thomas Hardison, Shing-Bong Chen, and Janet Buyer
REFERENCES
American National Standard/National Standard of Canada for Gas-Fired Central Furnaces, ANSI Standard No. Z21.47-1998, American Gas Association, New York, NY (1998).
Application of Tracer Gas Analysis to Industrial Hygiene Investigations, Grot, R. and Lagus, P., Lagus Applied Technology, Inc. (1991).
Fundamentals of Gas Appliances, Revised, Catalog No. XH8808, American Gas Association, Arlington, VA (1996).
Guidelines for Modeling Indoor Air Quality, Nagada, N.L., Rector, H.E., and Koontz, M.D., New York, NY: Hemisphere Publishing Corporation (1987).
National Gas Fuel Code, NFPA Standard No. 54-1996, ANSI Standard No. Z223.1-1996, National Fire Protection Association, Quincy, MA (1996).

16
APPENDIX A: FURNACE SPECIFICATIONS AND SETUP
Table A1 lists some general information about the test furnace.
TABLE A.1. Specifications of the Test Furnace (Furnace #1)
Draft Type Natural; Draft Hood Equipped Input Rate Specified Rate Specified Manifold Pressure Orifice Size
100,000 Btu/hr 3.5 inches w. c. 0.093 inches (No. 42)
Burner Type Ribbon Combustion Chamber Closed Vent Type Type B Block Vent Shutoff System Bimetal disc thermostat located in
draft hood Annual Fuel Utilization Efficiency (AFUE) 78 % Return/Supply Air Temperature Rise Maximum Outlet Air Temperature Maximum Static Pressure
35 – 65 °F 180 °F 0.5 inches w.c.
Certifying Standard (on Name Plate) Z21.47a* CAN/CGA – 2.3a 1995
The furnace was installed according to the manufacturer’s installation instructions and the National Fuel Gas Code (1996). Three-quarter inch (1.91 centimeter) black galvanized pipe was used to connect the furnace to the main gas line. A pressure tap was added before the pressure regulator so that the supply pressure could be measured. The inlet pressure to the gas regulator ranged from 6.5 to 7.0 inches w.c. The furnace was placed on a 13 inch (33.0 centimeter) high platform so that the return duct would not contact the chilled water lines that ran along the floor of the chamber. The cracks between the furnace bottom and platform were sealed with aluminum tape, per the manufacturer’s instructions, to prevent a “possible negative pressure condition”.
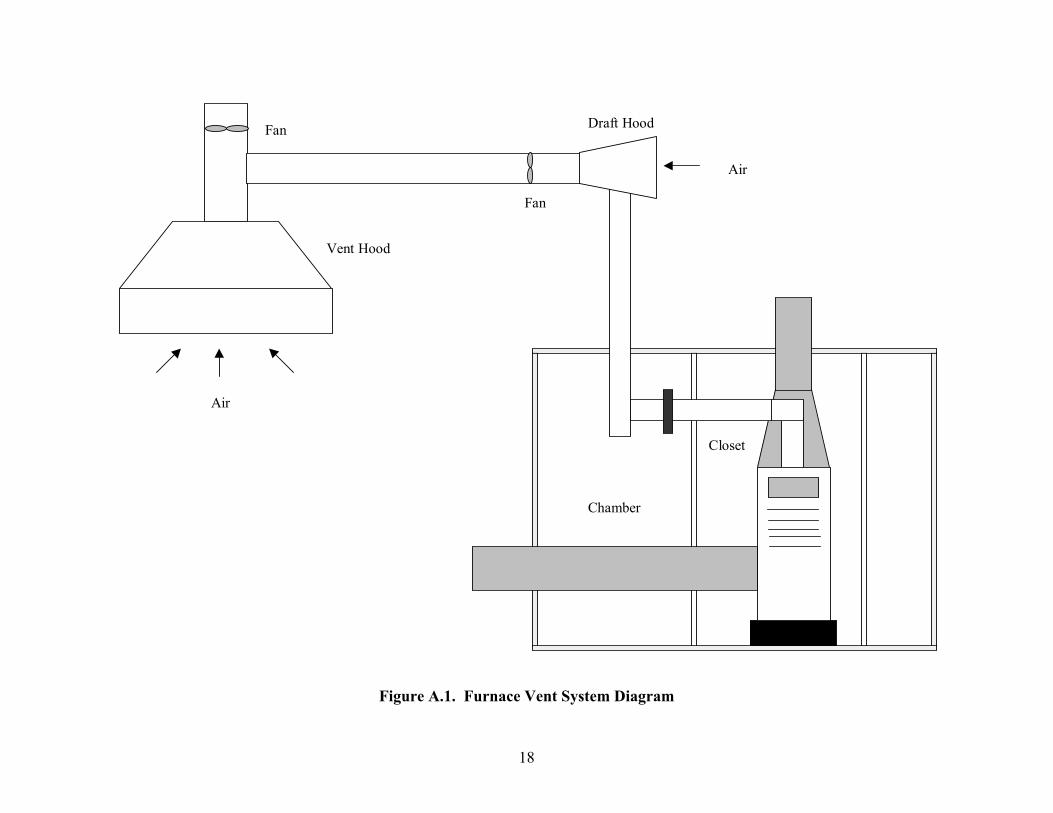
Flue gases from the furnace were vented using double-wall Type B vent material having an internal diameter of 5 inches (12.7 centimeters). The vent pipe had a total rise of 5.60 feet (1.70 meters) and a horizontal run of approximately 4.0 feet (1.21 meters). Figure A.1 illustrates the general vent system. Due to restrictions preventing modifications to the CPSC laboratory, the flue products had to be vented outdoors using an existing vent hood. The vent hood was located at a vertical distance of 5.0 feet (1.52 meters) from the furnace and a horizontal distance of 17.0 feet (5.18 meters). Due to the venting restrictions in the National Fuel Gas Code (1996) that states that the horizontal run of the vent pipe can not exceed 75 percent of the vertical height for draft hood equipped furnaces, the vent pipe could not be directly connected to the vent hood. Instead, the vent pipe terminated in a draft hood that was then connected to the vent hood (see

17
Figure A.1). The draft hood was open in the back allowing air to be drawn in with the flue products and a fan was used to transfer this mixture to the vent hood. When the fan for the draft hood was on and the furnace was off, the pressure in the vent pipe was 0.00 inches w.c. Therefore, the vent hood did not affect the operation of the furnace.
The return duct consisted of a duct that was 7.10 feet (2.16 meters) long, 16 inches (40.6 centimeters) high by 19 inches (48.3 centimeters) wide. The duct was attached to the furnace using flanges and screws. Aluminum tape was used to seal all seams along the duct and at the point of attachment between the duct and furnace. Air for the return duct was obtained from an adjoining room. A vent located at the end of the room prevented the pressure from going negative in this room when the furnace was operating. The supply duct consisted of several sections. The first section was a 16 inch (40.6 centimeters) long transition piece that reduced the 19 inch (48.3 centimeter) by 18 inch (45.7 centimeter) furnace opening to an 8 inch (20.3 centimeter) by 20 inch (50.8 centimeter) opening. The second section consisted of a rectangular duct that was 4.25 feet (1.30 meters) long, 8 inches (20.3 centimeter) high by 20 inches (50.8 centimeter) wide. This section was connected to a 90-degree duct. The final section was an 8 inch (20.3 centimeter) by 20 inch (50.8 centimeter) duct that was 10.6 feet (3.23 meters) long. Screws connected the various sections of the duct together and all duct seams within the closet were sealed with aluminum tape. The heated air from the supply duct was released in the main section of the laboratory. This section of the building contained a vent hood that exhausted to the outdoors and thus prevented a positive pressure from occurring in the room.
18
Vent Hood
Draft HoodFan
Fan
Air
Air
Chamber
Closet
Figure A.1. Furnace Vent System Diagram
19
APPENDIX B: CHAMBER AND FURNACE CLOSET DESCRIPTION
CHAMBER
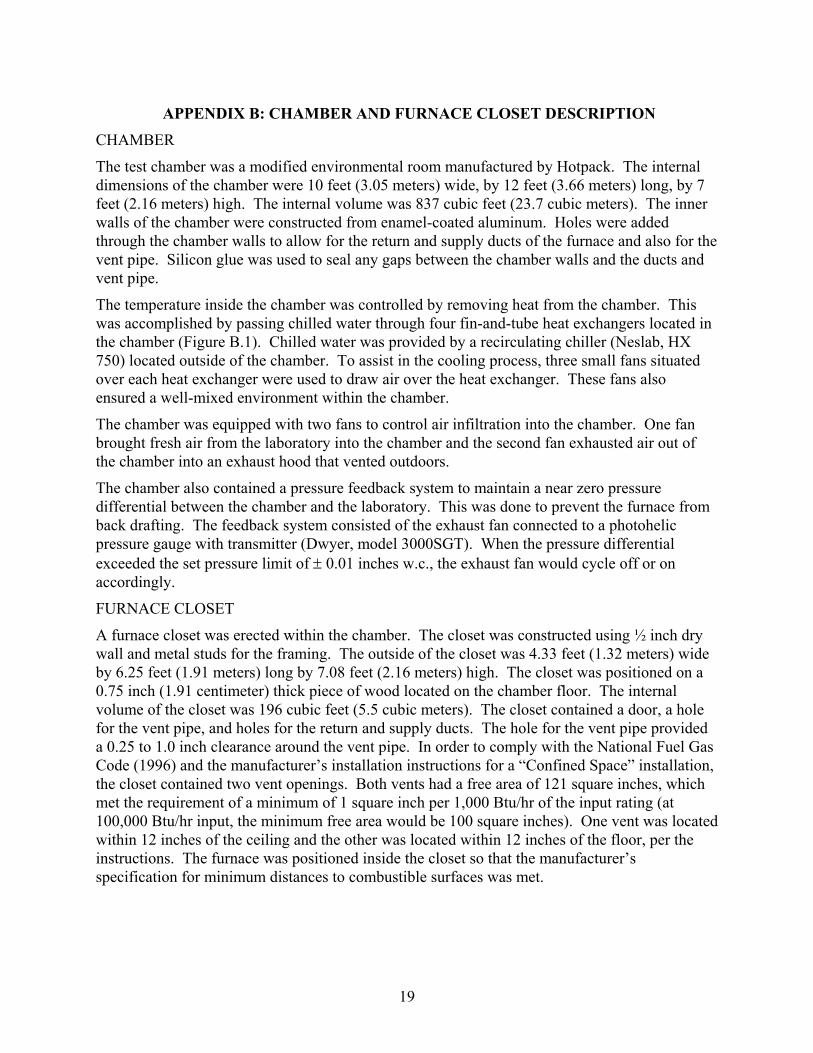
The test chamber was a modified environmental room manufactured by Hotpack. The internal dimensions of the chamber were 10 feet (3.05 meters) wide, by 12 feet (3.66 meters) long, by 7 feet (2.16 meters) high. The internal volume was 837 cubic feet (23.7 cubic meters). The inner walls of the chamber were constructed from enamel-coated aluminum. Holes were added through the chamber walls to allow for the return and supply ducts of the furnace and also for the vent pipe. Silicon glue was used to seal any gaps between the chamber walls and the ducts and vent pipe.
The temperature inside the chamber was controlled by removing heat from the chamber. This was accomplished by passing chilled water through four fin-and-tube heat exchangers located in the chamber (Figure B.1). Chilled water was provided by a recirculating chiller (Neslab, HX 750) located outside of the chamber. To assist in the cooling process, three small fans situated over each heat exchanger were used to draw air over the heat exchanger. These fans also ensured a well-mixed environment within the chamber.
The chamber was equipped with two fans to control air infiltration into the chamber. One fan brought fresh air from the laboratory into the chamber and the second fan exhausted air out of the chamber into an exhaust hood that vented outdoors.
The chamber also contained a pressure feedback system to maintain a near zero pressure differential between the chamber and the laboratory. This was done to prevent the furnace from back drafting. The feedback system consisted of the exhaust fan connected to a photohelic pressure gauge with transmitter (Dwyer, model 3000SGT). When the pressure differential exceeded the set pressure limit of ± 0.01 inches w.c., the exhaust fan would cycle off or on accordingly.
FURNACE CLOSET
A furnace closet was erected within the chamber. The closet was constructed using ½ inch dry wall and metal studs for the framing. The outside of the closet was 4.33 feet (1.32 meters) wide by 6.25 feet (1.91 meters) long by 7.08 feet (2.16 meters) high. The closet was positioned on a 0.75 inch (1.91 centimeter) thick piece of wood located on the chamber floor. The internal volume of the closet was 196 cubic feet (5.5 cubic meters). The closet contained a door, a hole for the vent pipe, and holes for the return and supply ducts. The hole for the vent pipe provided a 0.25 to 1.0 inch clearance around the vent pipe. In order to comply with the National Fuel Gas Code (1996) and the manufacturer’s installation instructions for a “Confined Space” installation, the closet contained two vent openings. Both vents had a free area of 121 square inches, which met the requirement of a minimum of 1 square inch per 1,000 Btu/hr of the input rating (at 100,000 Btu/hr input, the minimum free area would be 100 square inches). One vent was located within 12 inches of the ceiling and the other was located within 12 inches of the floor, per the instructions. The furnace was positioned inside the closet so that the manufacturer’s specification for minimum distances to combustible surfaces was met.
20
Chamber Doors
Exhaust Fan
Inlet Fan
Heat Exchanger
i h F
Furnace Closet
Return Duct
Supply Duct
Closet Door
Vent Pipe Furnace
Chamber
Figure B.1. Test Chamber Diagram (Top View)
21
APPENDIX C: MEASUREMENT OF FURNACE OPERATING PARAMETERS
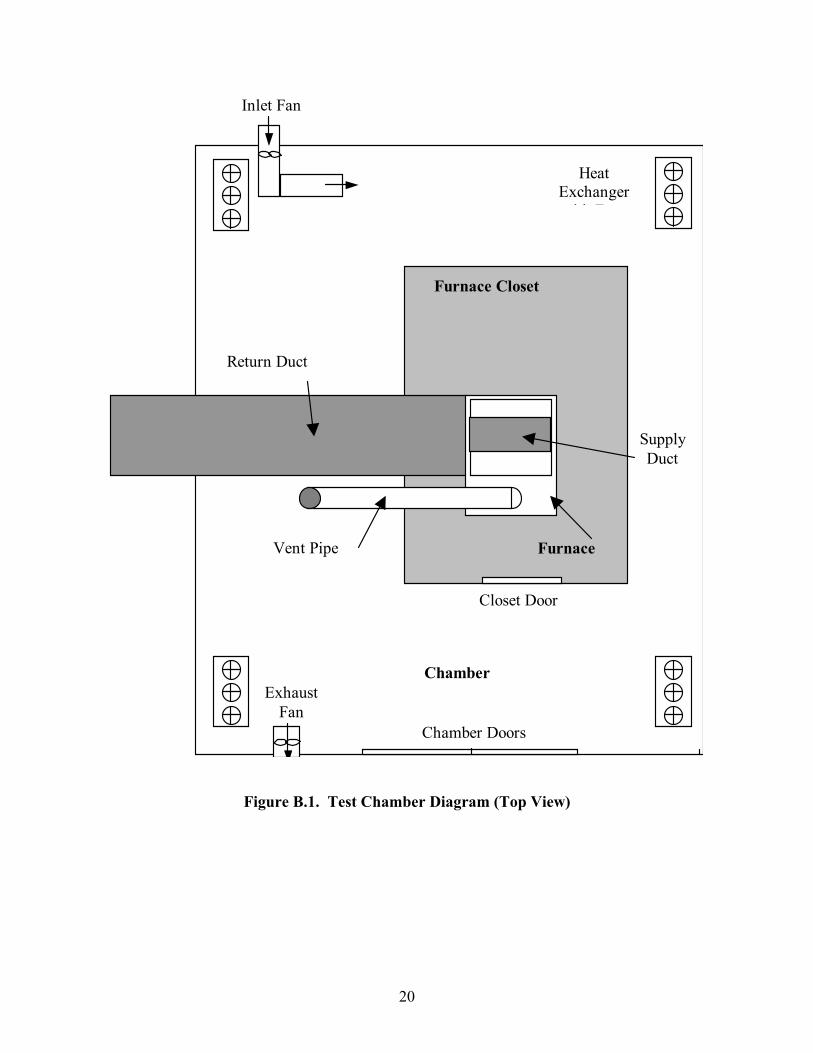
Figure C.1 illustrates the general locations where the different operating parameters of the furnace were measured.
T
P
P
T
T
T
TFlue GasSample
Return AirSample
Supply Air Sample
PiezoRing
Blocked VentShutoff System
P Gas Manifold Pressure
Mass Flow Meter
TTemperatureMeasurement
TemperatureMeasurement
P PressureMeasurement
Flue Collar
Iris
Vent Tee
Supply AirTemperature
FlueTemperature
VentPressure
Return AirTemperature
DifferentialPressure
Return Duct
Supply Duct
Figure C.1. Location of Measurements on Test Furnace

22
Table C.1. Equipment Used to Measure the Different Operating Parameters of the Furnace
Parameter Being Measured Equipment Type Manufacturer Model Range Accuracy
Gas Manifold Pressure Magnehelic Pressure Gage with Transmitter
Dwyer 605-10 0-10 inches w.c. ± 2% full scale
Differential Pressure Between the Return & Supply Air Ducts
Magnehelic Pressure Gage with Transmitter
Dwyer 605-1 0-1.0 inches w.c. ± 2% full scale
Vent Pressure Magnehelic Pressure Gage Dwyer 2301 0.5 – 0 – 0.5 inches w.c.
± 2% full scale
Gas Input Rate Mass Flow Meter (methane)
Sierra 826-NX-OV1-PV1-V1
0-2 scfm ± 1.5% full scale
Flue Temperature, Return and Supply Air Temperature, Air Temperature Near Blocked Vent Shutoff System
Thermocouple Omega Type K, 28 AWG -200 to 1250°C 2°C or 0.75% of Reading, which ever is greater

23
APPENDIX D: GAS SAMPLING SYSTEM
Rotameter Mass FlowMeter
NeedleValve
3-WayValve
Pump CoalescingFilter
Calibration GasSF6
BACKGROUNDSAMPLE
Recirculation
CalibrationGas
CO RETURN DUCTSAMPLE
Recirculation
SUPPLY DUCTSAMPLE
CalibrationGasCO
RecirculatingChiller
CalibrationGas
HCCO2COO2
FLUESAMPLE
CLOSETSAMPLE
RecirculationTo Exhaust Vent
O2 CO CO2Calibration
Gas CHAMBERSAMPLE
RecirculationTo Exhaust Vent
Figure D.1. Schematic of Gas Sampling Systems
24
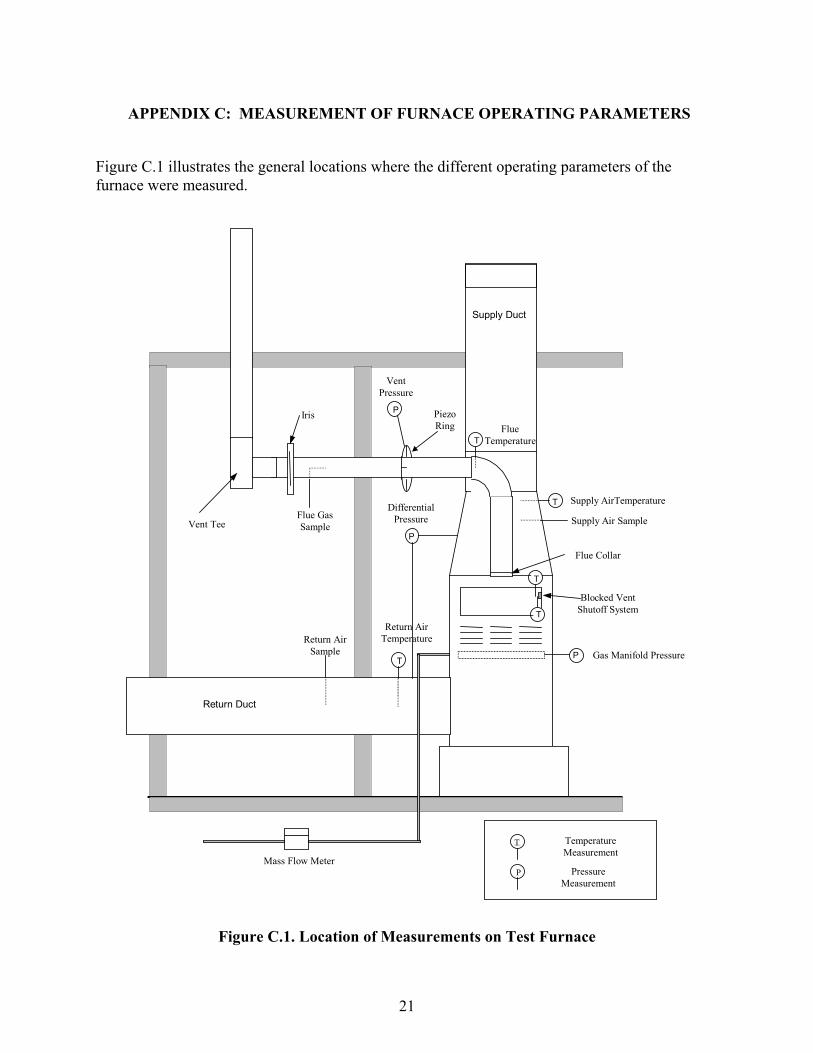
Table D.1. Equipment Used with the Gas Sampling Systems
Chemical Species Location Measuring Technique Manufacturer Model Range Accuracy
Carbon Monoxide (CO) Closet/Flue Non-Dispersive Infrared Rosemount 880A 0-200 ppm, 0-1000 ppm 1% Full Scale
Carbon Dioxide (CO2) Closet/Flue Non-Dispersive Infrared Rosemount 880A 0-10%, 0-20% 1% Full Scale
Oxygen (O2) Closet/Flue Paramagnetic Rosemount 755R 0-25% 1% Full Scale or 0.01% O2, which ever is greater
Hydrocarbon (HC) Closet/Flue Non-Dispersive Infrared Rosemount 880A 0-100% LEL1 1% Full Scale
Carbon Monoxide (CO) Return/Supply Air Non-Dispersive Infrared Rosemount 880A 0-100 ppm, 0-1000 ppm 1% Full Scale
Oxygen (O2) Chamber Paramagnetic Rosemount 755R 0-25% 1% Full Scale or 0.01% O2, which ever is greater
Carbon Monoxide (CO) Chamber Non-Dispersive Infrared Rosemount 880A 0-200 ppm, 0-1000 ppm 1% Full Scale
Carbon Dioxide (CO2) Chamber Non-Dispersive Infrared MSA Lira 3000 0-10% 1% Full Scale
Carbon Monoxide (CO) Return/Supply Air Non-Dispersive Infrared Beckman 866 0-100 ppm 1% Full Scale
Sulfur Hexafluoride (SF6) Chamber and Closet
Electron Capture Gas Chromatograph
Largus Applied Technology
101 0-5 ppb ±3% of reading
1. Lower Explosion Limit of Methane (5% by volume)
25
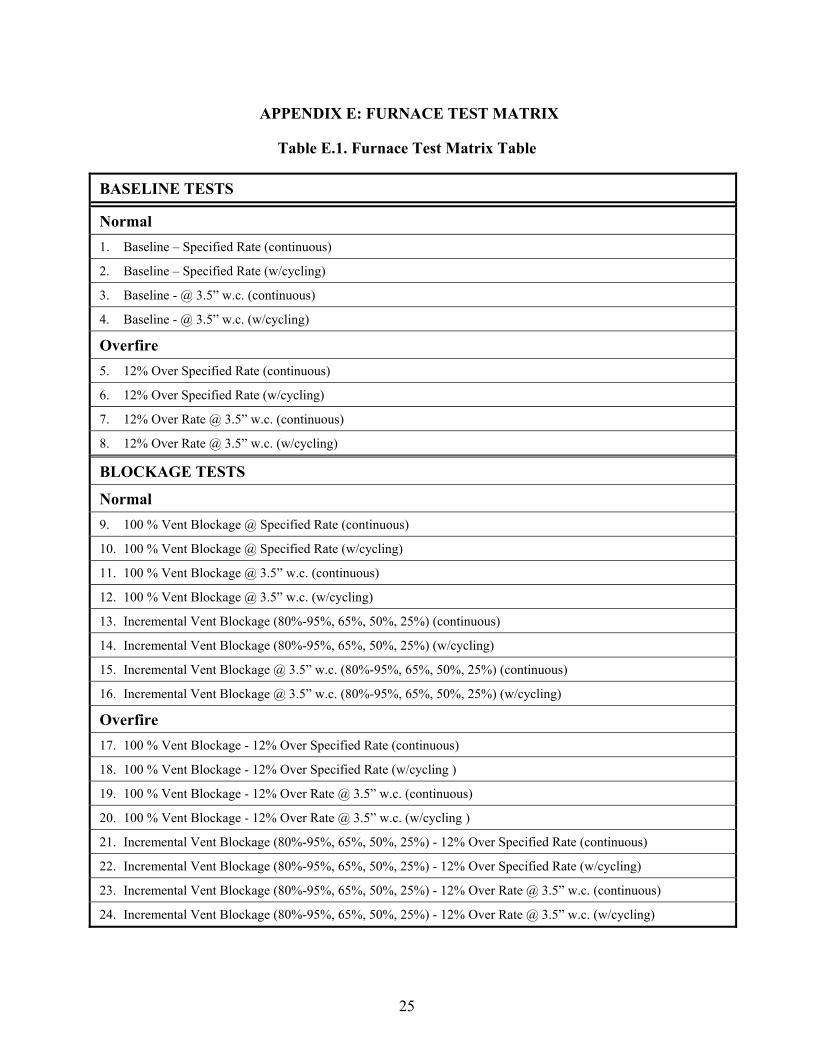
APPENDIX E: FURNACE TEST MATRIX
Table E.1. Furnace Test Matrix Table
BASELINE TESTS
Normal 1. Baseline – Specified Rate (continuous)
2. Baseline – Specified Rate (w/cycling)
3. Baseline - @ 3.5” w.c. (continuous)
4. Baseline - @ 3.5” w.c. (w/cycling)
Overfire 5. 12% Over Specified Rate (continuous)
6. 12% Over Specified Rate (w/cycling)
7. 12% Over Rate @ 3.5” w.c. (continuous)
8. 12% Over Rate @ 3.5” w.c. (w/cycling)
BLOCKAGE TESTS
Normal 9. 100 % Vent Blockage @ Specified Rate (continuous)
10. 100 % Vent Blockage @ Specified Rate (w/cycling)
11. 100 % Vent Blockage @ 3.5” w.c. (continuous)
12. 100 % Vent Blockage @ 3.5” w.c. (w/cycling)
13. Incremental Vent Blockage (80%-95%, 65%, 50%, 25%) (continuous)
14. Incremental Vent Blockage (80%-95%, 65%, 50%, 25%) (w/cycling)
15. Incremental Vent Blockage @ 3.5” w.c. (80%-95%, 65%, 50%, 25%) (continuous)
16. Incremental Vent Blockage @ 3.5” w.c. (80%-95%, 65%, 50%, 25%) (w/cycling)
Overfire
17. 100 % Vent Blockage - 12% Over Specified Rate (continuous)
18. 100 % Vent Blockage - 12% Over Specified Rate (w/cycling )
19. 100 % Vent Blockage - 12% Over Rate @ 3.5” w.c. (continuous)
20. 100 % Vent Blockage - 12% Over Rate @ 3.5” w.c. (w/cycling )
21. Incremental Vent Blockage (80%-95%, 65%, 50%, 25%) - 12% Over Specified Rate (continuous)
22. Incremental Vent Blockage (80%-95%, 65%, 50%, 25%) - 12% Over Specified Rate (w/cycling)
23. Incremental Vent Blockage (80%-95%, 65%, 50%, 25%) - 12% Over Rate @ 3.5” w.c. (continuous)
24. Incremental Vent Blockage (80%-95%, 65%, 50%, 25%) - 12% Over Rate @ 3.5” w.c. (w/cycling)
26
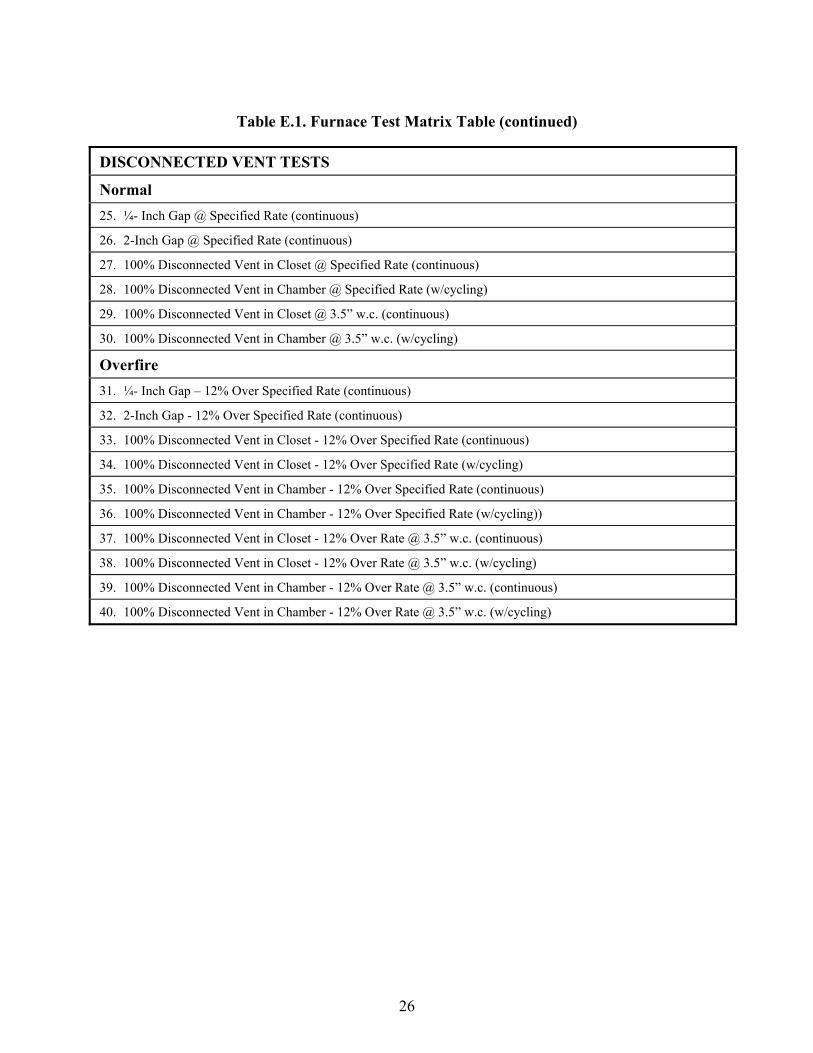
Table E.1. Furnace Test Matrix Table (continued)
DISCONNECTED VENT TESTS
Normal 25. ¼- Inch Gap @ Specified Rate (continuous)
26. 2-Inch Gap @ Specified Rate (continuous)
27. 100% Disconnected Vent in Closet @ Specified Rate (continuous)
28. 100% Disconnected Vent in Chamber @ Specified Rate (w/cycling)
29. 100% Disconnected Vent in Closet @ 3.5” w.c. (continuous)
30. 100% Disconnected Vent in Chamber @ 3.5” w.c. (w/cycling)
Overfire 31. ¼- Inch Gap – 12% Over Specified Rate (continuous)
32. 2-Inch Gap - 12% Over Specified Rate (continuous)
33. 100% Disconnected Vent in Closet - 12% Over Specified Rate (continuous)
34. 100% Disconnected Vent in Closet - 12% Over Specified Rate (w/cycling)
35. 100% Disconnected Vent in Chamber - 12% Over Specified Rate (continuous)
36. 100% Disconnected Vent in Chamber - 12% Over Specified Rate (w/cycling))
37. 100% Disconnected Vent in Closet - 12% Over Rate @ 3.5” w.c. (continuous)
38. 100% Disconnected Vent in Closet - 12% Over Rate @ 3.5” w.c. (w/cycling)
39. 100% Disconnected Vent in Chamber - 12% Over Rate @ 3.5” w.c. (continuous)
40. 100% Disconnected Vent in Chamber - 12% Over Rate @ 3.5” w.c. (w/cycling)
27
APPENDIX F: DERIVATION OF AIR EXCHANGE RATE AND EMISSION RATE
Air Exchange Rate
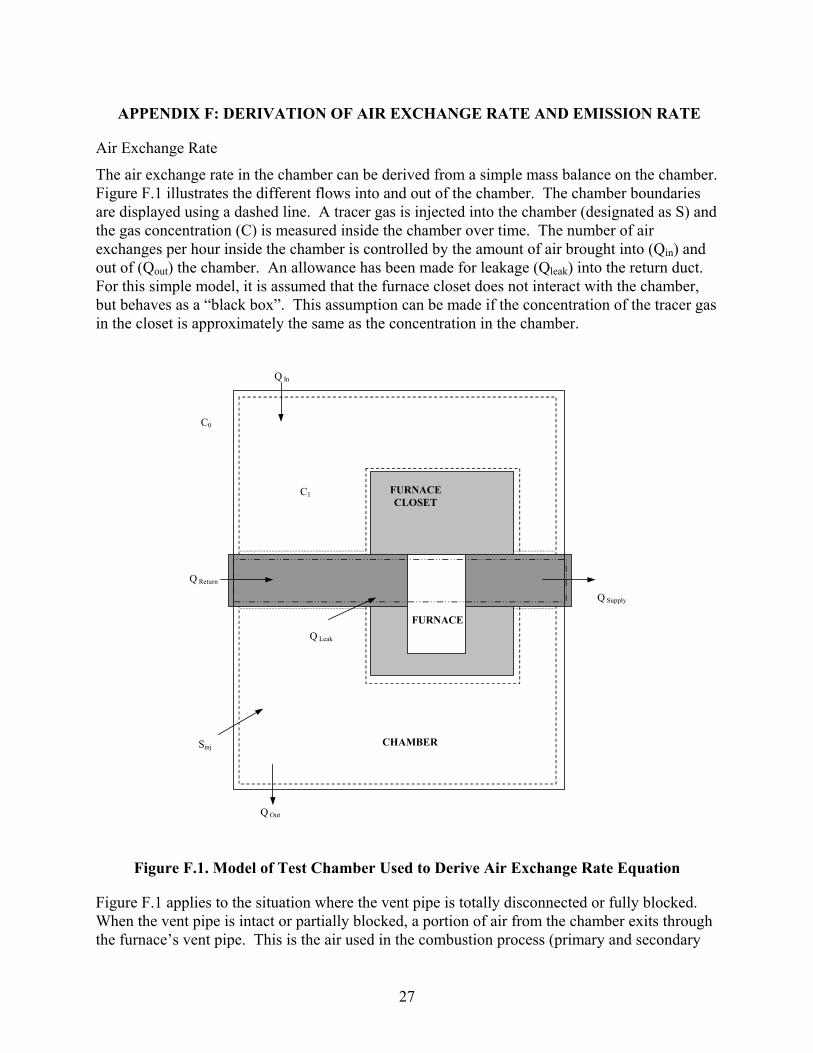
The air exchange rate in the chamber can be derived from a simple mass balance on the chamber. Figure F.1 illustrates the different flows into and out of the chamber. The chamber boundaries are displayed using a dashed line. A tracer gas is injected into the chamber (designated as S) and the gas concentration (C) is measured inside the chamber over time. The number of air exchanges per hour inside the chamber is controlled by the amount of air brought into (Qin) and out of (Qout) the chamber. An allowance has been made for leakage (Qleak) into the return duct. For this simple model, it is assumed that the furnace closet does not interact with the chamber, but behaves as a “black box”. This assumption can be made if the concentration of the tracer gas in the closet is approximately the same as the concentration in the chamber.
Q Supply
C0
Q Leak
Q Return
Q Out
Q In
FURNACECLOSET
FURNACE
CHAMBERSinj
C1
Figure F.1. Model of Test Chamber Used to Derive Air Exchange Rate Equation
Figure F.1 applies to the situation where the vent pipe is totally disconnected or fully blocked. When the vent pipe is intact or partially blocked, a portion of air from the chamber exits through the furnace’s vent pipe. This is the air used in the combustion process (primary and secondary
28
air) and by the draft hood. Since a pressure control system is used to maintain a zero pressure differential between the chamber and the surrounding laboratory, less air exits the chamber through the chamber's exhaust fan when the furnace is operating. To simplify the model, any air that would be exhausted through the vent pipe to the outdoors will be combined with the term for the flow out of the chamber (Qout).
Based on Figure F.1, a mass balance for chemical specie C inside the chamber yields the following equation:
injleakeoutin SQCQCQCdt
dCV +−= − 1101 [F.1]
where,
V = volume inside the chamber less the closet and the return duct, m3
C1 = concentration of the tracer gas in the chamber, 0.001 cc/m3 or ppb
C0 = concentration of the tracer gas present in the background, 0.001 cc/m3 or ppb
Qin = flow rate of air into the chamber, m3/hr
Qout = flow rate of air out of the chamber, m3/hr
Qleak = leak rate of air into the return/supply duct, m3/hr
Sinj = injection rate of tracer gas, cc/hr
In equation F.1, the following has been assumed: the air in the chamber is well mixed, the tracer gas does not get absorbed inside the chamber, any leakage from the supply duct to the chamber has been neglected, and the tracer gas does not get consumed in the burner flame.
Since a pressure control system is used to maintain a zero pressure differential between the chamber and the surrounding laboratory, the following equation can be written for the mass flow of air into and out of the chamber.
leakoutin QQQ += [F.2]
Equation F.1 can be rewritten using the relationship in Equation F.2 as follows:
injinin SQCQCdt
dCV +−= 10
1 [F.3]
or
VS
VQC
VQC
dtdC injinin +−= 101 [F.4]
At steady state, the rate of change of the chemical specie C inside the chamber is zero.
01 =dt
dC [F.5]
The number of air changes per hour (ACH) in the chamber can be defined by the following equation:
29
VQ
ACH in= [F.6]
Assuming that the background concentration of the tracer gas is zero, Equations F.5 and F.6 can be substituted into Equation F.4 to yield the following equation:
VS
ACHC inj+−= 100 [F.7]
Solving for ACH in Equation F.7 yields,
VCS
ACHeq
inj
1
= [F.8]
where C1 eq is the equilibrium concentration of the tracer gas.
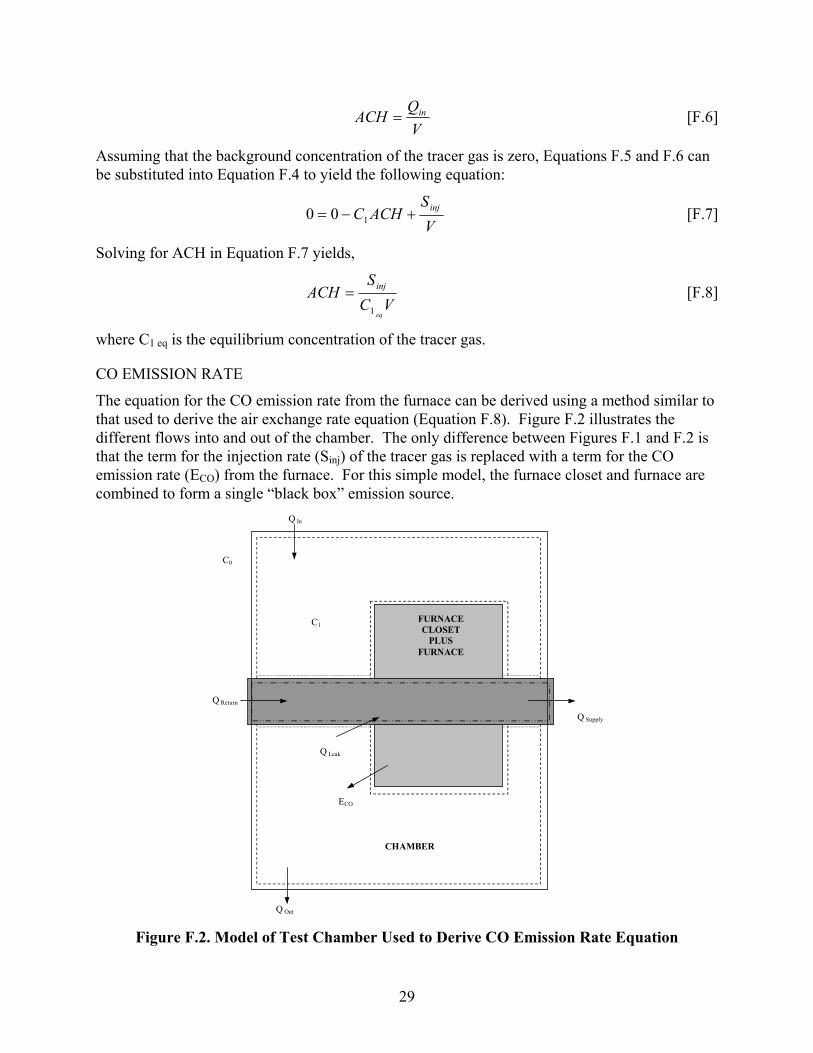
CO EMISSION RATE
The equation for the CO emission rate from the furnace can be derived using a method similar to that used to derive the air exchange rate equation (Equation F.8). Figure F.2 illustrates the different flows into and out of the chamber. The only difference between Figures F.1 and F.2 is that the term for the injection rate (Sinj) of the tracer gas is replaced with a term for the CO emission rate (ECO) from the furnace. For this simple model, the furnace closet and furnace are combined to form a single “black box” emission source.
Q Supply
C0
Q Leak
Q Return
Q Out
Q In
FURNACECLOSET
PLUSFURNACE
CHAMBER
ECO
C1
Figure F.2. Model of Test Chamber Used to Derive CO Emission Rate Equation
30
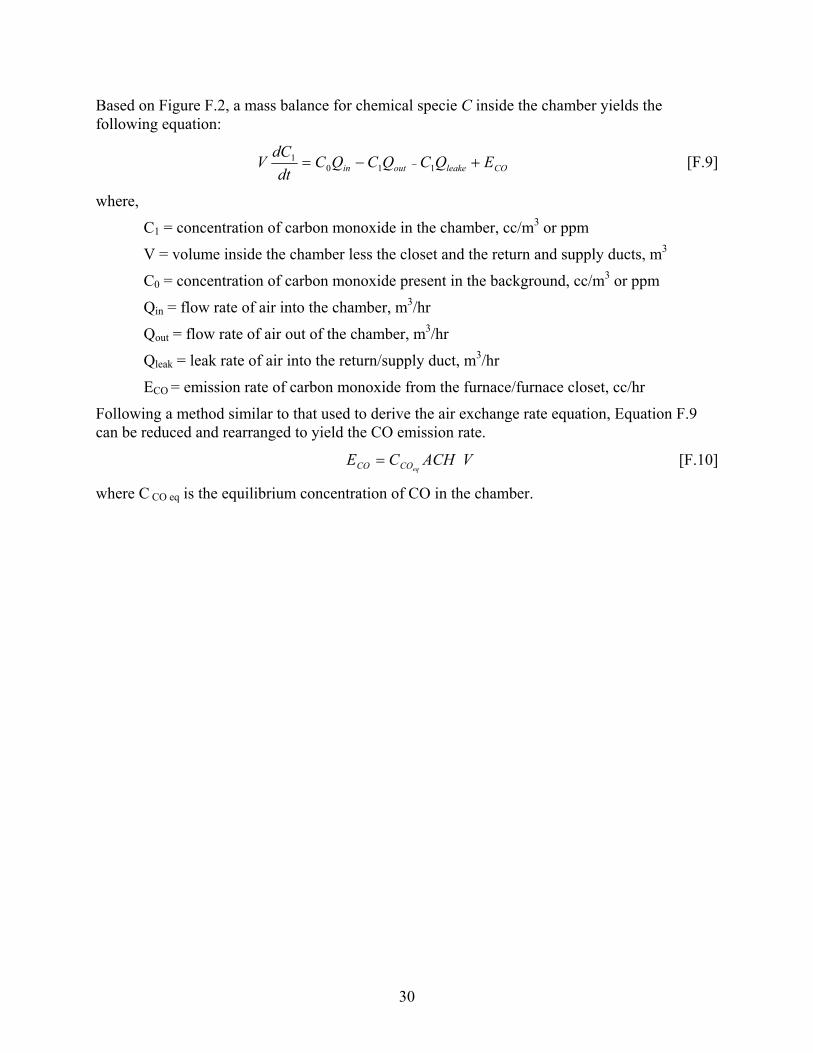
Based on Figure F.2, a mass balance for chemical specie C inside the chamber yields the following equation:
COleakeoutin EQCQCQCdt
dCV +−= − 110
1 [F.9]
where,
C1 = concentration of carbon monoxide in the chamber, cc/m3 or ppm
V = volume inside the chamber less the closet and the return and supply ducts, m3
C0 = concentration of carbon monoxide present in the background, cc/m3 or ppm
Qin = flow rate of air into the chamber, m3/hr
Qout = flow rate of air out of the chamber, m3/hr
Qleak = leak rate of air into the return/supply duct, m3/hr
ECO = emission rate of carbon monoxide from the furnace/furnace closet, cc/hr
Following a method similar to that used to derive the air exchange rate equation, Equation F.9 can be reduced and rearranged to yield the CO emission rate.
VACHCEeqCOCO = [F.10]
where C CO eq is the equilibrium concentration of CO in the chamber.

31
APPENDIX G. TEST DATA RESULTS
Table G.1. Baseline Test Results
Average Steady-State CO Concentrations (ppm) Test
Number1 Input Rate2
(Btu/hr) Mode of
Operation3 Chamber Closet Supply Air
Air Exchange Rate (1/hr)
CO Emissions Rate (cc/hr)
43 100,000 Continuous 1 1 1 10.4 186
59 110,000 Continuous 1 1 1 10.9 195
32 110,000 Continuous 1 0 0 10.8 193
19 123,000 Continuous 0 0 0 11.0 0
18 123,000 Continuous 0 0 0 11.0 0
35 123,000 Continuous 0 0 0 10.4 0
42 100,000 Cycling 1 0 0 10.6 190
3 110,000 Cycling 0 0 0 11.2 0
33 110,000 Cycling 0 0 0 11.3 0
44 112,000 Cycling 1 1 0 11.0 197
34 123,000 Cycling 2 2 0 10.9 390
17 123,000 Cycling 2 2 0 11.0 394
1. Test Numbers correspond to the order in which the test was performed and do not relate to the numbers in the Test Matrix (Appendix E). 2. Actual input rates are ± 3 percent of the stated values. 3. Cycling rate is 8 minutes on and 2 minutes off.
32
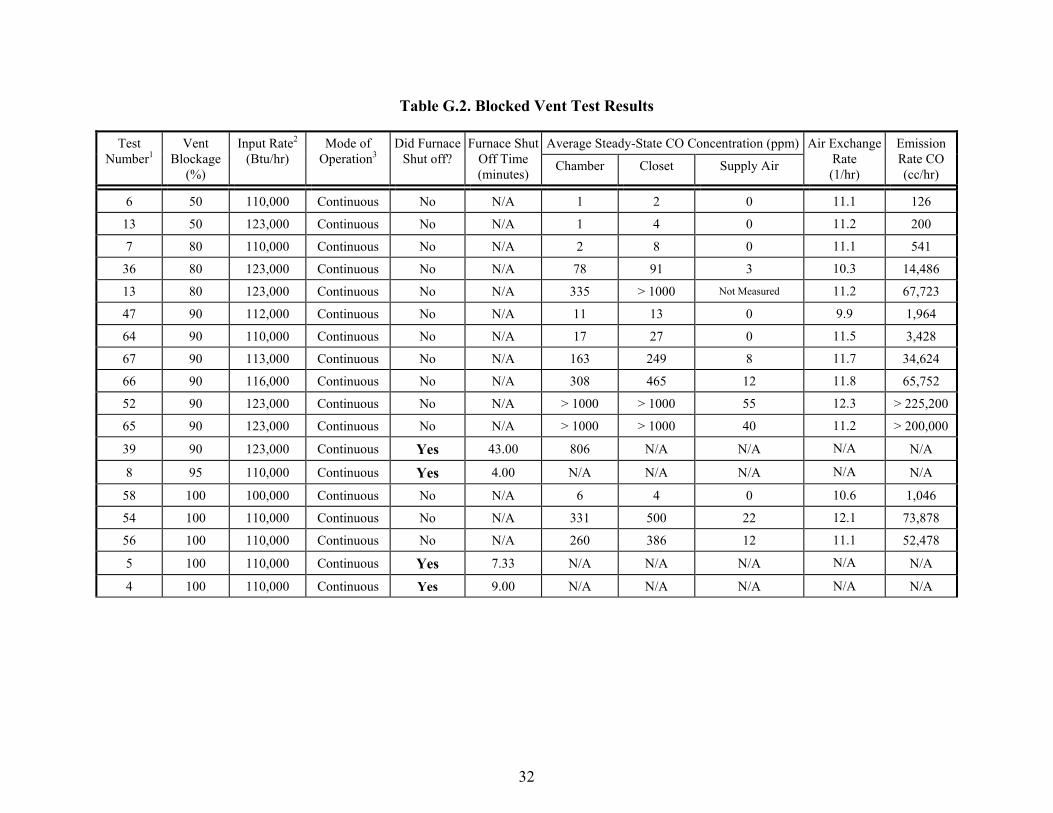
Table G.2. Blocked Vent Test Results
Average Steady-State CO Concentration (ppm)Test Number1
Vent Blockage
(%)
Input Rate2 (Btu/hr)
Mode of Operation3
Did Furnace Shut off?
Furnace Shut Off Time (minutes) Chamber Closet Supply Air
Air Exchange Rate (1/hr)
Emission Rate CO (cc/hr)
6 50 110,000 Continuous No N/A 1 2 0 11.1 126
13 50 123,000 Continuous No N/A 1 4 0 11.2 200
7 80 110,000 Continuous No N/A 2 8 0 11.1 541
36 80 123,000 Continuous No N/A 78 91 3 10.3 14,486
13 80 123,000 Continuous No N/A 335 > 1000 Not Measured 11.2 67,723
47 90 112,000 Continuous No N/A 11 13 0 9.9 1,964
64 90 110,000 Continuous No N/A 17 27 0 11.5 3,428
67 90 113,000 Continuous No N/A 163 249 8 11.7 34,624
66 90 116,000 Continuous No N/A 308 465 12 11.8 65,752
52 90 123,000 Continuous No N/A > 1000 > 1000 55 12.3 > 225,200
65 90 123,000 Continuous No N/A > 1000 > 1000 40 11.2 > 200,000
39 90 123,000 Continuous Yes 43.00 806 N/A N/A N/A N/A
8 95 110,000 Continuous Yes 4.00 N/A N/A N/A N/A N/A
58 100 100,000 Continuous No N/A 6 4 0 10.6 1,046
54 100 110,000 Continuous No N/A 331 500 22 12.1 73,878
56 100 110,000 Continuous No N/A 260 386 12 11.1 52,478
5 100 110,000 Continuous Yes 7.33 N/A N/A N/A N/A N/A
4 100 110,000 Continuous Yes 9.00 N/A N/A N/A N/A N/A
33
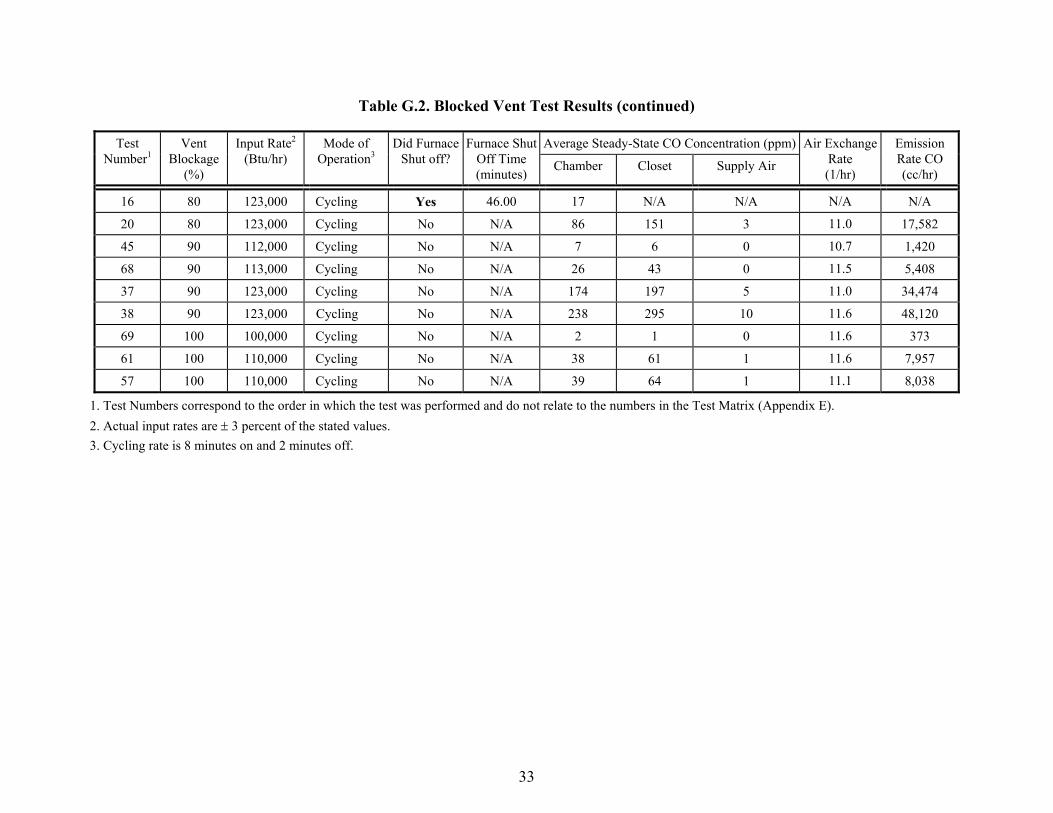
Table G.2. Blocked Vent Test Results (continued)
Average Steady-State CO Concentration (ppm)Test Number1
Vent Blockage
(%)
Input Rate2 (Btu/hr)
Mode of Operation3
Did Furnace Shut off?
Furnace Shut Off Time (minutes) Chamber Closet Supply Air
Air Exchange Rate (1/hr)
Emission Rate CO (cc/hr)
16 80 123,000 Cycling Yes 46.00 17 N/A N/A N/A N/A
20 80 123,000 Cycling No N/A 86 151 3 11.0 17,582
45 90 112,000 Cycling No N/A 7 6 0 10.7 1,420
68 90 113,000 Cycling No N/A 26 43 0 11.5 5,408
37 90 123,000 Cycling No N/A 174 197 5 11.0 34,474
38 90 123,000 Cycling No N/A 238 295 10 11.6 48,120
69 100 100,000 Cycling No N/A 2 1 0 11.6 373
61 100 110,000 Cycling No N/A 38 61 1 11.6 7,957
57 100 110,000 Cycling No N/A 39 64 1 11.1 8,038
1. Test Numbers correspond to the order in which the test was performed and do not relate to the numbers in the Test Matrix (Appendix E). 2. Actual input rates are ± 3 percent of the stated values. 3. Cycling rate is 8 minutes on and 2 minutes off.
34
Table G.3. Disconnected Vent Test Results
Average Steady-State CO Concentration (ppm)Test Number1
Location of Vent Disconnection
Input Rate2 (Btu/hr)
Mode of Operation3
Did Furnace Shut off?
Chamber Closet Supply Air
Air Exchange Rate (1/hr)
Emission Rate CO (cc/hr)
55 Closet 110,000 Continuous No 8 9 0 10.7 1,510
48 Closet 112,000 Continuous No 8 10 0 9.7 1,312
49 Closet 112,000 Continuous No 25 41 0 11.0 4,959
51 Closet 123,000 Continuous No 706 > 1000 70 12.5 158,988
70 Chamber 123,000 Continuous No 916 893 37 13.5 226,340
23 Chamber 123,000 Continuous No > 1000 > 1000 117 12.3 > 220,000
60 Closet 100,000 Cycling No 0 0 0 12.6 0
22 Closet 110,000 Cycling No 0 0 0 12.3 0
30 Chamber 110,000 Cycling No 0 0 1 11.8 0
62 Chamber 110,000 Cycling No 6 3 0 11.8 1,157
21 Chamber 110,000 Cycling No 6 2 0 11.8 1,683
50 Closet 112,000 Cycling No 8 12 0 13.6 1,918
53 Closet 123,000 Cycling No 391 546 15 12.8 90,988
63 Chamber 123,000 Cycling No 338 359 17 11.9 7,2725
25 Chamber 123,000 Cycling No 463 411 21 12.3 10,3958
29 Chamber 123,000 Cycling No 529 532 27 12.3 11,9417
1. Test Numbers correspond to the order in which the test was performed and do not relate to the numbers in the Test Matrix (Appendix E). 2. Actual input rates are ± 3 percent of the stated values. 3. Cycling rate is 8 minutes on and 2 minutes off.
35
Table G.4. Reduced Air (Combustion Closet) Test Results
Average Steady-State CO Concentration (ppm)Test Number1
Test Type Input Rate2 (Btu/hr)
Vent Condition Mode of Operation3
Did Furnace Shut off?
Chamber Closet Supply Air
Air Exchange Rate (1/hr)
Emission Rate CO (cc/hr)
40 Baseline 110,000 Intact Continuous No 0 0 0 10.3 0
41 Baseline 100,000 Intact Cycling No 0 0 0 10.5 0
10 Baseline 110,000 Intact Cycling No 2 3 0 11.2 331
12 Blockage 110,000 80% Blocked Continuous No 75 270 8 11.1 14,884
11 Blockage 110,000 80% Blocked Cycling No 23 76 3 11.1 4,643
27 Disconnect 123,000 1.22” Gap in Chamber
Cycling No 3 7 0 11.0 1,025
31 Disconnect 123,000 100% Disconnect in Chamber
Cycling Yes @ 73 minutes
26 30 2 11.8 5,561
26 Disconnect 123,000 100% Disconnect in Chamber
Cycling No 769 876 37 12.3 174,368
28 Disconnect 123,000 100% Disconnect in Chamber
Cycling No 868 942 58 12.3 196,439
1. Test Numbers correspond to the order in which the test was performed and do not relate to the numbers in the Test Matrix (Appendix E). 2. Actual input rates are ± 3 percent of the stated values. 3. Cycling rate is 8 minutes on and 2 minutes off.