Embed Size (px)
Citation preview
ANLFPP TM-257 ANLFPPTM-257
THE MEASUREMENT OF
GAMMA RAY INDUCED HEATING
IN A MIXED NEUTRON AND
GAMMA RAY ENVIRONMENT
by
Henry K. Chiu
FUSION POWER PROGRAM
Operated byArgonne National Laboratory The University of Cnicato97W Swrtli Cass Aveme for the U.S. Department of EnerfyAriomie. Illinois M439 M i e r Contract W-31-1t9-£»o-3a
Arjonne Natitnui Laboratory. **ith facilities in ihe >uies of Illinois and Idaho, isouned by the L nited States government. and operated N. The L ni\ ersir. of Chicagounder ihe provisions ot" u contract A nh ihe Departmeni of Enerr..
DISCLAIMER.This rcpor »as pr^parsni > jr. Jt^ Mint of »< -li. spcmvwajf b\ an os:enc> i:([he L'niteil Suie^ G»?v«nmep.i. \enhcr the Lmrcii Stales fknennneni n«?ran;, ageno. thereof. nwrjn> of:r>eirimplovee>.maln>jn% » m m j , « p i e < . (or impiicti. or xs->umev an> Eeuat liahilii} or rs>|}nnMniir. f<x the Jc^ank.^.compiewness. or a^fulne^t of jn\ :nt"<>rmaiM)o. jppanuii--. pn)*iuct. or pr.>-c^s discirscd. or represents that tt-, use would mx infringe pmateh imnetlr^hi-. Rj'wT."ncj hetuin r»> an; ^pecitii; commervul producr. proce*>. *Tsen ice P> trade name, trademark, manutjcturer. or i«hen*ise. due* mnnet^ssar:l> conssuutci or imptv it> endi>rsenKni. KCimimendarioo. t>rt>. oring f rhe L'nired Sfaies G«)» emmeraor an>; atieno rherwrf. The view sand opinions of authors cxprew-j herein ti» WH ne-;es>4ril> >uie «>r reflectihi>sc of the Lniteti Stales Government oran\ a!!enc^ thereof.
Reproduced from me best av ailaWe copy
Available to DOE and DOE cuniractors. from «heOtfice of Scientific and Technical Infonnafion
P.O. Box t>2OokRHtee.TN " S ? !
Pnce% av ail iWe lnr»?m »ft 15» 5"ft-*J«H.
AvaalaHe w the puMic frnm theSanonaJ Tethnica* [rtfomunon Service
I S. Depanment of Commen:e52^5 Plan Roval Ro«d
SprmgflieW. V \ Zllttl
i&ut'ior. Category:Magnetic Fcjsien EnergyCUC-423)
AHL/rPP/TM-257
ABL/PPP/TM—257
DE92 C4X457
NATIONAL LABORATQB'f9700 S. Caas Avenue
ftrgonr.e, I l l i n o i s 60439-480T
THE WASIBBar V GIMM U I nDnZD S f f l Bu * MIXED wEaemm ma amm u x own
Henry K. ChiuFusion Power Prograa
October I99T
Morlc supported byOffice of Fusion EnergyU.S. Department af Energy
under Contract tf-31-109-Eng-3£
UK
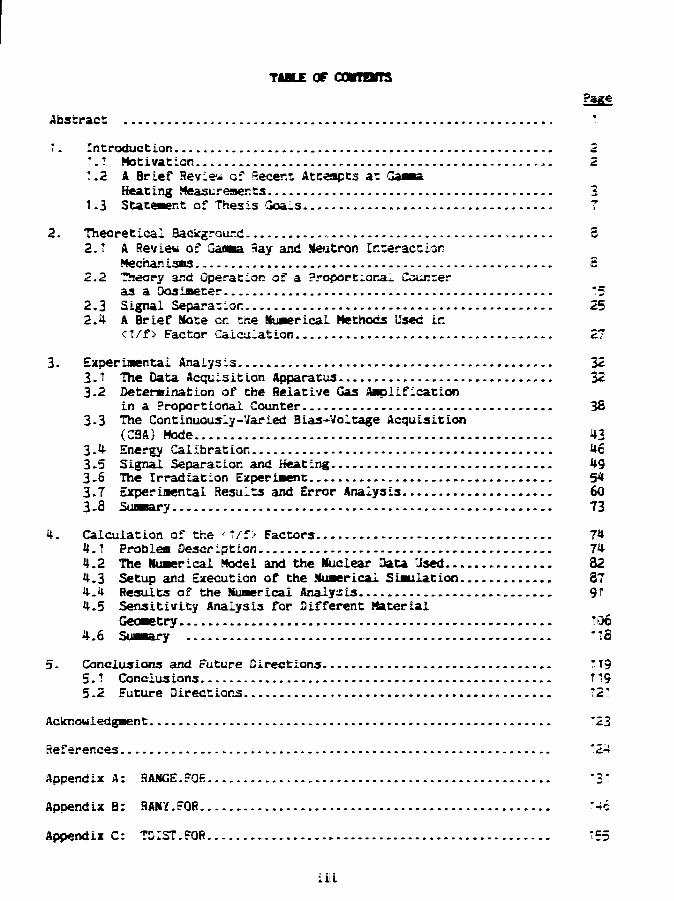
TABLE OF COVIUflS
Page
Abstract T
". Introduction 2I. T Motivation 21.2 A Brief Review of Recent Atcempts at Gamma
Heating Measurements 311.3 Statement of Thesis Goals 7
2. Theoretical Background S2.1 A Review of Gaoma 3ay and Meutron Interaction
Mechanisms 32.2 Theory and Operation of a Proportional Counter
as a Dosimeter — *52.3 Signal Separation 252.4 A Brief Note en cite Numerical Methods Used ir.
< 1/f > Factor Calculation 27
3. Experimental Analysis 323.1 The Data Acquisition Apparatus 323-2 Determination of the Relative Gas Amplification
in a Proportional Counter 3fi3-3 The Continuously-Varied Bias-Voltage Acquisition
(CBA) Mode 433-4 Energy Calibration 463-5 Signal Separation and Heating 493-6 The Irradiation Experiment 543.7 Experimental Results and Error Analysis 603.8 Summary ... 73
4. Calculation of the <"T/f> Factors 744.T Problem Description .. 744.2 The numerical Model and the iuclear Data Jsed 824.3 Setup and Execution of the numerical Simulation 374.4 Results of the Numerical Analysis 91!4.5 Sensitivity Analysis for Different Material
Geometry tO64.6 Summary ... ... .. TH8
5- Conclusions and Future Directions 11f95.! Conclus ions H 95.2 Future Directions. "2".
Acknowledgment , *23
References "2-i
Appendix A: HAMCE-rdfi *3"
Appendix B: HANY.FQR *46
Appendix C: TDIST.FOR 755
LliL
Appendix 0 : SPASM.FQR '59
Appendix E: KNISK.rOR f 62
IV
TW iar*u—*»•• or GOtM MAX IMOCB KfTIKiH * MIIED n m MD COMA UT eavn
Henry It. Chiu
The probiea of treasuring the gamma heating in a aixec Z~ neutron and
ray environment was explored. A new detector technique was developed to
•alee this aeasureaent. Gamma neattng aeasureaencs were aade ir. a lot.-"
assembly irradiated with T4-MeV neutrons and (n,n"; gammas produced by a Texas
Muclear Model 9400 neutron generator. Heating aeasureaents were made in the
•id-line of the lattice using a proportional counter operating in the
Continuously-varied Bias-voltage Acquisition (CBA) mode. The neutron-induced
signal was separated from the ga«Ba-induced signal by exploiting the signal
rise-tiae differences inherent to radiations of different linear energy
transfer coefficient (LET), which are observable in a proportional counter.
The operating limits of this Measurement technique were explored by varying
the counter position in the low-Z lattice, hence changing the irradiation
spectruB observed.
The experiment was Modelled numerically to help interpret the measures
results. The transport of neutrons and gaama rays in the assembly was
modelled using the one-dimensional radiation transport code AIIISftYPC. The
cross-section set used for these calculations was derived from the EMDF/B-V
library using the code MC2-2 for the case of DT neutrons slowing down in a
low-Z material. The calculated neutron and gamma spectra in the slab and the
relevant mass-stopping powers were used to construct weighting factors which
relate the energy deposition in the counter fill-gas to that in the counter
wall and in the surrounding material. The gaama energy deposition at various
positions in the lattice is estimated by applying these weighting factors to
the measured gamma energy deposition in the counter at those locations. The
overall utility of this aeasureaent technique for gamma heating in a low-Z
structure irradiated by a broad energy range, low fluence mixed radiation
field (characteristic of fusion blanket neutronicsi was discussed.
1. Introduction
The motivation, for measuring the ganaa heating in a low
fluence, broad energy, mixed gaona and neutron environment and the
proposed Methodology to conduct this measurement are presented.
1.1 Motivation
One criterion used in material selection for the next
generation of fusion test stand is the heating per material per
fusion event. Knowledge of the expected gamma heating will allow
design engineers to evaluate the heating that a given material will
experience in a fusion radiation environment. Satisfactory
(experimental error of less than 15%) measured gamma heating data
does not currently exist for materials exposed to the fusion
radiation sources in the current generation cf test stands. At best
the fusion-induced heating values for materials are calculated from,
neutronics transport simulations that model the cunent generation of
fusion, test stands. The main obstacle that bars the way for a
satisfactory heating measurement is the low radiation flux
characteristic of the existing test stands. At the present flax
output levels, direct measurement techniques such as calorimetry and
laser interferometry cannot distinguish the radiation-induced heating
from the heating induced by other factors in the test stand.
Dosinetry techniques such as therao-luminescent dosineters
(TLDs) and activation foils have been used to conduct heating
measurements in these test stands with limited success. The failure
of the ILDs lie in their inability to distinguish the energy weighted
iimportance of neutron induced effects from gaoma induced effects.
Neutron activation foils cover a limited energy range src. require
high fluences for good statistics. All dosimetry techniques suffer
from the inability to perform a true integrated energy measurement ir.
a mixed radiation field. However, by carefully designing a detector
one can create a device that will enable the experimenter to perfcrs
signal separation on its output. Having built such a detection
system, one oust choose to measure either the neutron component or
the gaaoa component of the fusion radiation field. As gatma. rays
numerically dominate the radiation spectrum, a measurement of the
gaona heating in the materials placed in an existing fusion radiation
spectnm was believed to be the simpler course. Once the ganma
heating for a material has been measured, the total heating for it
can be found by consulting design studies for the fraction of energy
of a fusion reaction partitioned to gamma rays through the inelastic
scattering of the fusion neutrons and then multiply the inverse of
this fraction by the measured gamut heating.
1.2 A Brief Review of Recent Attests at Gaaaa Heating
Previous atteapts to measure gamma heating in simulated fusion
blanket assemblies have met little success.1 In the low fiuence rate
regime the traditional macroscopic measurement methodologies ( e.g.
calorimetry, thermocouples, thermistors 1 are net applicable. The
well established microscopic methods {themc-liminescent dosiaeters
(TLDs), scintillation counters, and proportional counters) exhibit
characteristics that limit their use in this measurement:.
TLDs are thin film type dosiaeters formed from material that
fluoresces proportionally to the nams*^ incurred under irradiation,
when such materials are annealed after exposure. TL2s are integral
dosimeters, and they are excellent for quantifying the nunber of
particles interacting in the TID material. The advantages that TLBs
have over most other dosiaeters are that they are physically compact
and require no in-situ electronics. However, the TUJ material has
little capability to distinguish different species of radiation,
hence for radiations of different ionizing capacity TLDs do not
accurately report the energy deposition.
Scintillation counters can differentiate between different
radiations by pulse-shape discrimination of the output. The light
pulse output of the scintillator is a function of the exposure rate
and energy of the initiating radiation. Operation in a broad energy
mixed gamma and neutron field is difficult as there exist some
regions in energy (E < 1 MeV) where pulse-shape discrimination is not
possible.
Proportional counters are differential dosimeters. With a
proportional counter one is able to distinguish between different
neutral particles by the differences in the signal rise tine of the
secondary charged particles formed through radiation-arterial
interaction. Generally proportional counters are configured as gas-
filled cavities with, walls made of electrically conductive material
and filled with a molecular gas. Proportional counters are fragile,
physically restrictive and require in-situ electronic support. These
characteristics limit the placement of this type of detectors in a
complex experimental geometry.
The main difficulties of the heating measurements stem from the
broad energy range (0.0-14.8 MeV), the relatively low flux (10®
particles/cn^-sec), and the ambiguity of separating the neutron
effects from the gamma dose measurement. At present the dominant
technique for energy characterization is the wide dispersal of thin
film TLDs.2"6 HDs are very effective for providing energy
deposition data in pure gamma or pure neutron fAelds. They are
unfortunately limited to the measurement of integrated dose. In a
mixed neutron and gamma field, the effectiveness of TLDs is
questionable since the TLD response to neutrons is dependent upon the
spectrum. Presently the only method readily available for resolution
of radiation in a mixed field is the use of calibrated proportional
counters. Proportional counters can be effective at low levels of
gamma dose,7 and can readily observe the fast pulse-rise events which
are characteristic of the nuclear recoils produced by elastic neutron
scatter.7'8 By extending the observable energy range of the
proportional counter and providing a data acquisition routine that
ids events by energy and differential rise times, one can measure
the gamma heating in a low fluence rate, broad energy mixed radiation
field with high confidence.
"Die basis of the present work is a logical continuation and
extension of Yule's7 and Simons'9 efforts to measure gamma heating of
structural materials in fast reactor environments. Stainless-steel
walled counters were used for that series of experiments. The
efforts of Yule and Simons led to the following conclusions on ganaa
heating measurements. (Ij Ideally the walls of the proportional
counter should be made of the material of interest (i.e. aluminum
walls for measuring dose in an aluminum assembly). (2) The counting
method must be calibrated absolutely with respect to energy for the
results to be credible. (3) This method must show the ability to
separate the neutron induced signals fro& the ganma induced signals
for the results to be credible. (4} Sone idea of the electron
spectra in the measuring device mist be known (as we measure the
energy-loss of the gammas1 secondary electrons), before the results
can be properly interpreted.
A given detector's energy response is characteristic of the
from which it was fabricated. The gamma heating in
can be found if one makes detectors from each type of
material or if one can relate the measured heating in one material to
another by considering the underlying physics of the heating
processes. The investigation of the underlying physics will provide
a better understanding of the process and promises a general method
of solution for this problem.
1.3 Statement of Thesis Goals
The goals of this thesis are to: (1) develop a detector
technique that is sufficiently sensitive to register the differences
between neutron-induced and gamma-induced signals in a low fluence
environment, (2) make a measurement over the entire energy range of
the radiation environment, (3) develop a method to relate the
measured ganma heating in one material to another. It is hoped that
by measuring the ganma heating, one will be able to provide valuable
engineering criteria for proposed fusion blanket assemblies.
A coupled calculational and experimental program has been
designed to address these problems. Techniques to extend the energy
range of proportional counters and analysis software for fast neutron
signal rejection were developed. An experiment was designed to test
these developments in a simulated fusion radiation spectrum. A Texas
Nuclear 9400 deuterium-tritium fusion neutron generator was engaged
to simulate a fusion radiation environment. The transport and
interaction of gamma rays and neutrons in this experiment were
calculated with the radiation transport code ANISK/PC to provide a
basis for relating the Measured heating in the counter material to
the heating in the other materials irradiated by the neutron
generator. The results of the experiment and the calculations are
presented in the following chapters.
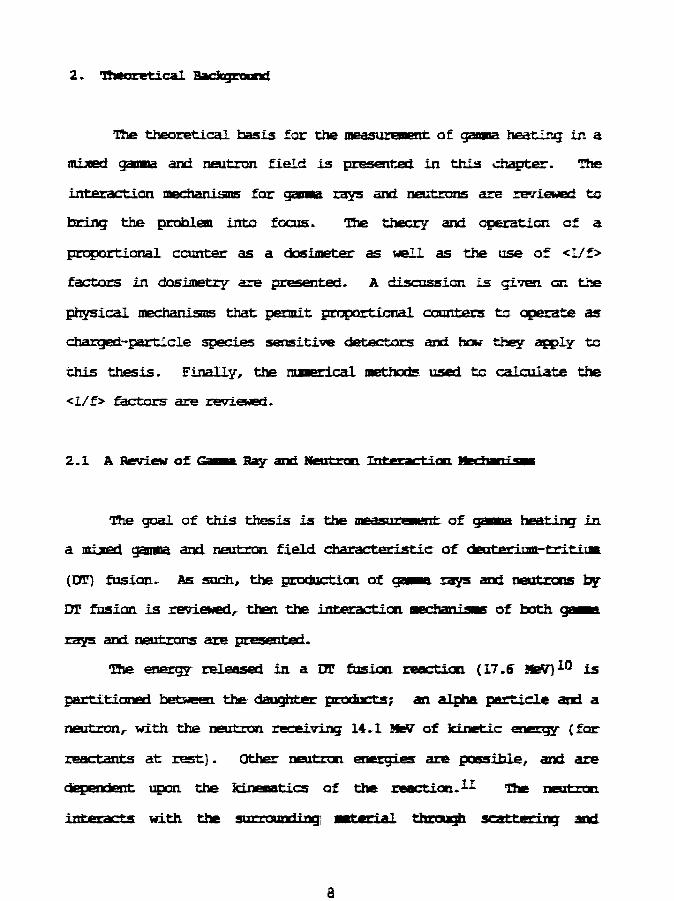
2, Theoretical Bacfegrauxi
The theoretical basis for the measurement of gamna heating lr. a
mixed ganna and neutron field is presented in this chapter. The
interaction mechanisms far ganma rajs and neutrons are reviewed to
bring the problem into focus. The theory and operation of a
proportional counter as a dosimeter as well as the use of <l/f>
factors in dosimetzy are presented. A discussion is given en the
physical mechanisms that permit proportional counters to operate as
charged-partlcle species sensitive detectors and how they apply to
this thesis. Finally, the numerical methods ns**1 to raimi^» the
<l/f> factors are reviewed.
2.1 A Review of Gamma. Hay and Neutron Int
The goal of this thesis is the measurement of ganna heating in
a mixed ganna and neutron field characteristic of deutpti urn-tritlui
(DT) fusion. As such, the production of gamma rays and neutrons by
OT fusion is reviewed, then the interaction Mechanisms of both gamma,
rays and neutrons are presented.
The energy released in a OT fusion, reaction (17.6 BieV)10 is
partitioned between the daughter products; an alpha particle and a
neutron, with the neutron receiving 14.1 9feV of kinetic energy (for
reactants at rest). Other neutron energies are possible, and are
dependent upon the kinematics of the reaction.^ The neutron
interacts with the surrounding! amterial through scattering and
absorption. The by-products of these neutrsn interactions are
charged particles (alphas, protons, and. recoil nuclei} and gamma
rays. The gamna spectrum, arises from inelastic scattering and
radiative capture of the fusion neutrons. The gamma population is
directly dependent on the neutron population. Gamma rays and
neutrons are electro-statical ly neutral and as such are undetectable
in their respective prijnary forms. However, both gamma rays and
neutrons produce charged particles as they interact with, matter.
These secondary charged particles can be detected through electrcnic
means. A DT neutron will produce many gamma, rays through inelastic
scattering off of the surrounding material ft before capture, and each
of these gswM* rays will npnrinry electrons through, scattering and/or
absorption. In fact the gamma induced electron spectrum will
numerically dominate the direct neutron generated charged particle
spectra.
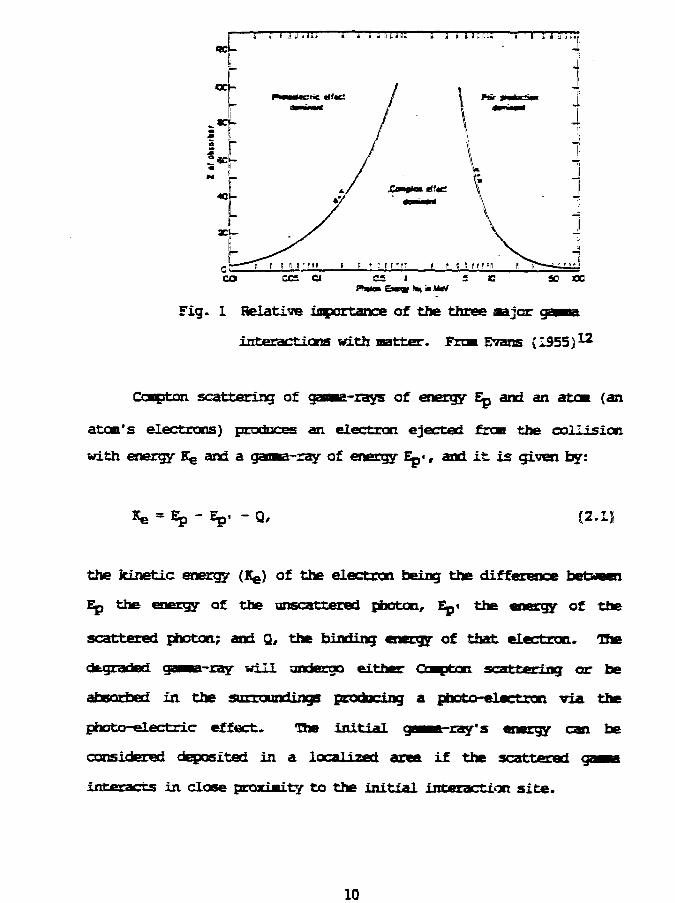
Gamma rays interact with matter through pair production ( he >8
MeV for Z < 20 ), Compton scatter and the photo-electric effect
(mainly below 60 keV); all of these reactions Lead to the production,
of energetic electrons. Figure 1 illustrates the regions in which
each type of interaction dnminntPB. The two curves in Figure 1 mark
the parameter space in which 2 types of gamma interaction have equal
anro From Fig. 1, the dominant, interaction for gamma—rays of
energy < 7 MeV with materials of Z < 30 is Cumpton scattering.
CO 30 DC
Fig. 1 Relative importance of the three najor
interactions with natter. From Evans (1955)^
Caapton scattering of gane-rays of energy Ep and an atom {an
atom's electrons) produces an electron ejected fron the collision
with energy Kg and a gaona-ray of energy Ep<, and it is given by:
-Q/ (2.1J
the kinetic energy (Kg) of the electron being the diffc
Ep the energy of the unscattered photon, Ep- the energy of the
scattered photon; and Q, the binding energy of that electron. The
degraded gaaaa-ray will undergo either Goapton scattering or be
absorbed in the surroundings producing a photo-electron via the
photo-electric effect. The initial IJI—I i IJ' energy can be
considered deposited in a localized area if the scattered
interacts in dose proximity to the initial interaction site.
10
' J ....ts
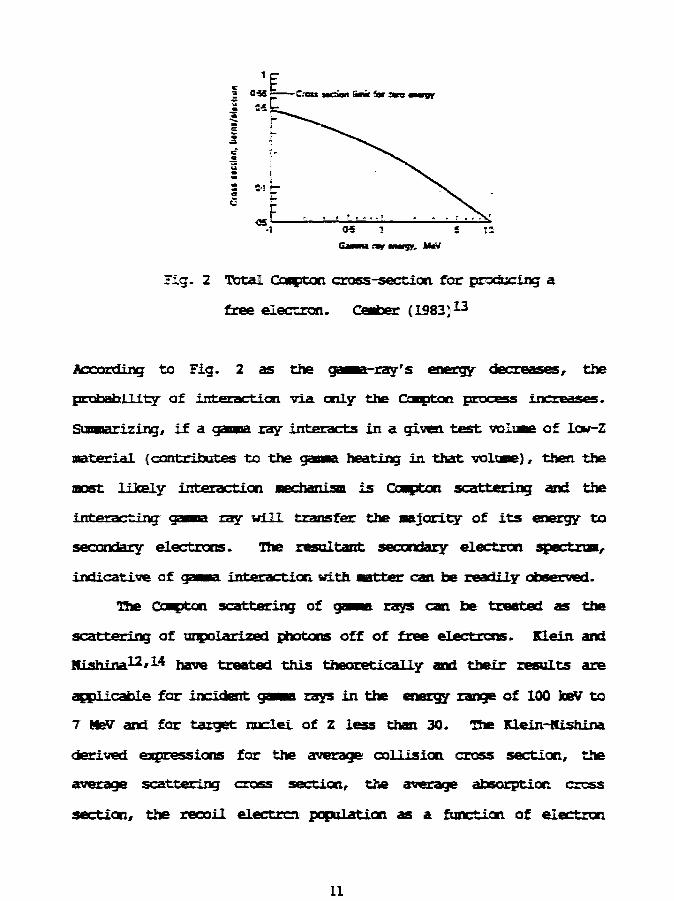
Fig. 2 Total Gampton cross-section far producing a
free electron. Canter {1983,13
According to Fig. 2 as the gamma-ray's energy decreases, the
probability of interaction via only the Compton process increases.
Summarizing, if a gamma ray interacts in a given test volume of low-Z
™»-t~«»WjaT (contributes to the gamma heating in that volume), then the
most likely interaction mechanism is Compton scattering and the
interacting gamma ray will transfer the majority of its energy to
secondary electrons. The resultant secondary electron spectrum,
indicative of gamma interaction with matter can be readily observed.
The Compton scattering of gamma rays can. be treated as the
scattering of unpolarized photons off of free electrons. Klein and
Hiahina12'1* have treated this theoretically and their results are
applicable for incident gamma rays in the energy range of 100 keV to
7 MeV and for target nuclei of Z less than 30. The Klein-Kishina
derived expressions for the average collision cross section, the
average scattering cross section, the average absorption cross
section, the recoil electron population as a function of electron
11
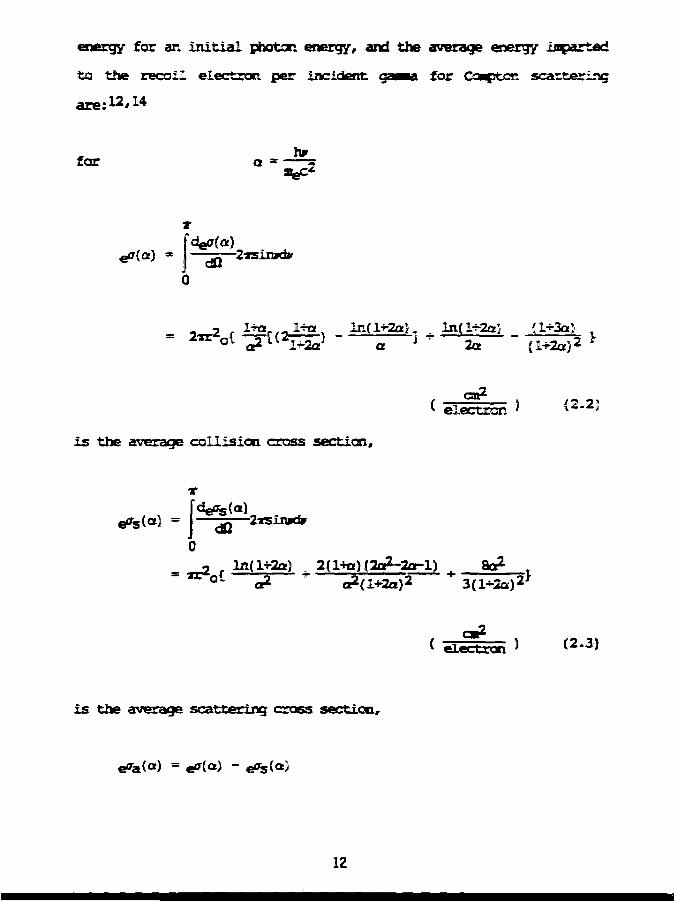
energy for an initial photon energy, and the average energy iaparted
to the recoil electron per incident gaana for CoaptOR scattering
are: 12/14
for
I
G
vv electron
is the average collision cross section.
So*
is the average scattering crt38>a section,
e°a(a)
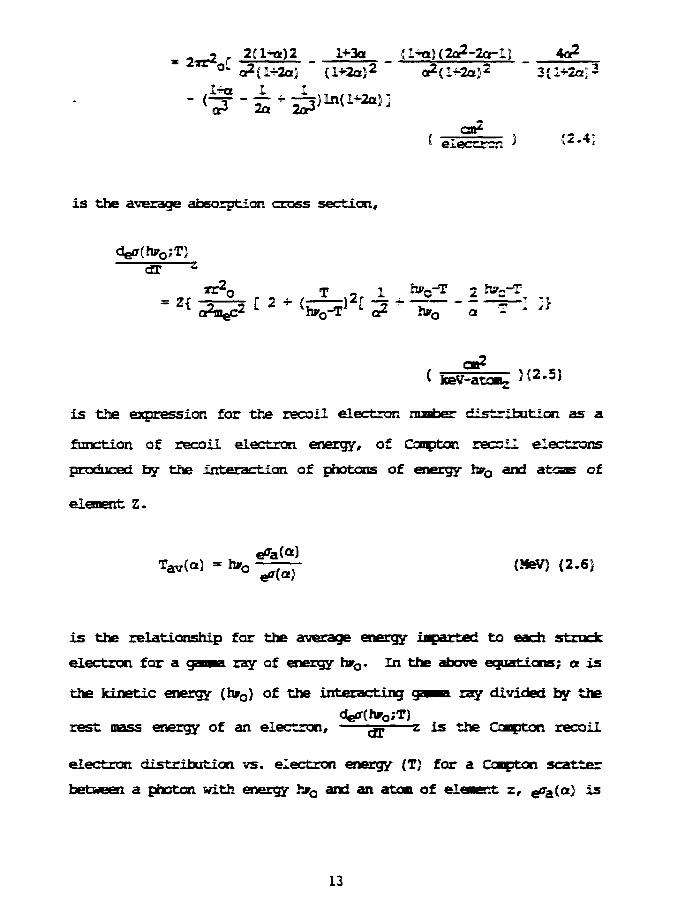
2(l+tt)2 l*3a g^a)(2a2-2a-ll 4a2
e l e l L n J «2-4*
is the average absorption cross section,
decr(hgo;T)dT
X2.S)
i s the expression for tiie recoil electron nunber distriisution as a
function of recoil electron energy, of Canpton recoil electrons
proriucerf by the interaction of photons of energy bro and atsas of
element Z.
(MeV) {2.6}
is the relationship for the average energy fBpnrtPri to each strode
electron for a gauoa ray of energy hro. In the above equations; a is
the kinetic energy (hra) of the interacting gamma, ray divided by thede<r(!wa;T}
rest mass energy of an electron, £gi z is the Goapton recoil
electron distribution vs. electron energy (TJ for a Oaapton scatter
between a photon with energy hvo and an aton of eleaent z, &ra{a) is
13
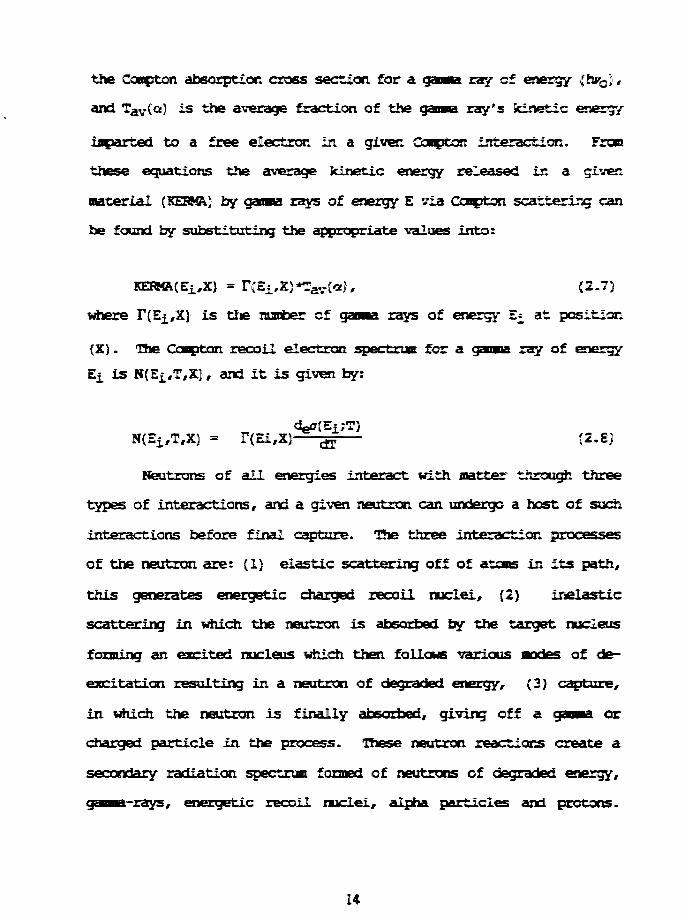
the Campton absorption cross section for a gamma ray of energy {ttyQ},
and Tav(o} is the average fraction of the gamma ray's kinetic energy
imparted to a free electron in a given Campton interaction. From
these equations the average kinetic energy released in a given
material, (KEHMA) by gamma rays of energy E via Compton scattering can
be found by substituting the appropriate values into:
rXJ = rCEi,X}*Tav{.a]l# (2.7)
where F(Ei,X) is the number cf gamma rays of energy E^ at position
(X). The Compton recoil electron spectrum for a gamma ray of energy
Ei is N(Ei,T,X), and it is given by:
(2.6)
Neutrons of ail energies interact with matter" through three
types of interactions, and a given neutron can undergo a host of such
interactions before final capture. The three interaction processes
of the neutron are: (1) elastic scattering off of atoms in its path,
this generates energetic charged recoil nuclei, (2) inelastic
scattering in which the neutron is absorbed by the target nucleus
farming an excited nucleus which then follows various modes of de-
excitation resulting in a neutron of degraded energy, {3} capture,
in which the neutron is finally absorbed, giving off a gamma or
charged particle in the process. These neutron reactions create a
secondary radiation spectrum formed of neutrons of degraded energy,
a-rays, energetic recoil nuclei, alpha particles and protons.
14
The charged particle species formed is dependent en the interaction
cross-section of the target nuclei.
2.2 theory and Operation of a Proportional Counter as a Dosiaeter
In theory, one can measure the total heating produced by the
products of the DT reaction if a counter with known sensitivity to
both the gamna induced electrons and the neutron incucec charged
particles is available. In practice, one can have a counter with a
known sensitivity to either the neutron coaponent cr the gaona
component, but not both. As there are nore <j>wiri induced electrons
than neutron induced charged particles, it was determined that a
measurement of the game, heating would provide the basis for
estimating the total heating.
The neutrons and rpim*<; produced by the OT reactions in a
fusion device will both interact with a detector placed in the
radiation field. For a ganma heating measurement to be successful
the detector tmn. either be totally insensitive to neutron induced
effects or be able to differentiate between the effects of both
neutrons and gannia rays. Clearly a totally neutron insensitive
detector is not possible, so a detector that can be made as neutron
insensitive as possible and have the capability to differentiate
between the ganma- and neutron-induced signals is sought. The need
for signal differentiation eliminates two classes of detectors (film
and TIDs) from consideration. The choice among the remaining four
types (ion chambers, activation foils, proportional counters, and
15
liquid scintillators} is determined by considering each detector's
neutron sensitivity and count rate efficiency.
A brief discussion of these detectors is in order. Liquid
scintillation counters are very efficient (up to 5C30 counts per
second) and can differentiate between neutrons and ganma rays.
However liquid scintillation counters7'15 operating in the energy
region 50 keV tc 1 MeV have difficulty resolving gacma induced
signals from neutron induced signals. Gamna rays in the energy range
from 0 to 1 MeV are the principal contributors to the gamut heating
measurements, so liquid scintillation counters are inappropriate
tools for measuring gaona heating. Activation foils are virtually
gaana ray insensitive, but are limited in energy response to the
gamna activation resonance energies of the foil material and require
either a large foil sample or long exposures for acceptable
statistics.15'16 It is conceivable that a judicious selection of
foil materials will enable the experimenter tc derive an estimate of
neutron induced heating at discrete energy values in the spectrum, of
interest. However, activation foils can provide only a measure of
the spectral shape and magnitude of the incident neutron field. It
remains for the user to interpret the absorbed dose to the foil
itself and then relate this dose to the dose experienced by the other
in the experiment. Both activation foil techniques and
liquid scintillation detectors are judged unsuitable for this
measurement.
Ion chambers and proportional counters arc very similar as both
can be filled with heavy gases to make then less neutron
16
sensitive.17*1*' The difference between the two detectors lie in how
their respective output signals are generated. The output signal for
an ion chamber is just the radiation induced electrical charge in the
fill gas collected on its electrodes. An ion chamber is a very
sensitive integrating dosimeter. As svrh it cannot distinguish
between events of different energy-loss per unit path length, art!
cannot separate the gamma component front the neutron component in a
mixpcl gamma and neutron field. Proportional counters are very
efficient for all energies (up to 500 keV, depending on the fill
gas), can differentiate signals, and their neutron sensitivity can be
altered by changing the filling gas. The counter chosen to measure
ganma heating in a mixed ganma and neutron field is the proportional
counter.
A charged particle interacting with the gas in a cylindrical
proportional counter will generate free electrons. These electrons
migrate to the wire anode along electric field lines induced, by the
voltage difference between the anode and the cathode shell. As these
free electrons approach to within an anode diameter of the anode, the
electric field induces an electron avalanche. The collapse of this
avalanche onto the wire anode changes the voltage on the anode, and
this voltage change is the counter output. The amplitude and
dispersion of the electron avalanche is dependent on the energy and
energy-loss per unit path length of the initiating charged particle.
The amplitude of the avalanche determines the nagnitude of the
voltage change on the anode, and the spatial dispersion of the
avalanche determines the rate of the signal rise.
17
Cavity ionization theory is the mathematical formalism
describing how radiation interacts with an idealized detector. The
theory can be broken up into two major approximations: (1) small
cavity theory, in which the detector is considered as a cavity in the
surrounding material so small that the presence of the cavity does
not perturb the charged particle spectrum in the surroundings, and
(2] large cavity theory, in which the cavity is so large that the
charged particle spectrum in the cavity is unique to the contents of
the cavity and is not influenced by its surround ings. The terms
large and small refer not to the physical size of the detector, but
rather to the size of the detector compared to the mean path length.
of the charged particle travelling in the detector material. Snail
cavity theory states that the charged-particle spectrum present in a
sufficiently small cavity is representative of its surrounding
materialsf14,19-20 where the phrase "sufficiently small cavity' is
used to indicate a condition such that the presence of a cavity in
the imtprial of interest and its contents do not cause the charged-
particle spectrum in the cavity to differ from that of the
surrounding mai-prf aT - When this unperturbing cavity is realized in a
physical detector, one has then achieved the famous Bcagg-Gcay
condition.
When using a gas filled proportional counter as a dosimeter,
its recorded output signal is just the energy loss spectrum of the
charged particles passing through the counter. The relationship for
the absorbed dose is:
18
D = 5 jE*R{E)dE, {2.9}
0
where:
D is the absorbed dose,
a. is the «y»y of the counter fill gas,
R(E) is the tabulated charged particle energy loss
distribution between energy E and E+dE.
Store practically, the expression for the absorbed dose is expressed
as the sum over the observed energy range of the product of discrete
values in the spectrum and the energy at those points:
l > P
£ is the approximate expression for the absorbed dose,
£(EjJ is the measured value of the charged-partlcle
energy-loss distribution at energy E^.
The measurement gives no direct indication of the absorbed dose in
the counter wall Material or the absorbed dose in the surrounding
•atprial. Making the assumption that small cavity theory applies,
the absorbed dose in the counter wall i«ai-oT-i*i as well as the
dOSe Of the eiHi&r natariaig f fViei^ft^eti by the neutral
radiation can be solved for, if the •echanisas for charged particle
production and an expression for the energy loss of these charged
particles in these materials are known.
Consider a region in space irradiated by a source of
electrostatically neutral particles. The charged particle
19
distribution in this region results from the interaction of the
neutral radiation spectrum with the material in the region. Picture
a small pocket in this region containing a material different from
that of the region having a density much less than that of the region
such that its presence does not perturb the ambient charged particle
distribution in the region. Small cavity theory states that: if the
energy deposited by the charged particle distribution in the small
pocket is measured, then the energy deposition in the surrounding
material can be found if the energy loss mechanisms for both the
pocket material and the surrounding material are known. Expanding on
this idealized case, consider the wall •»*-«»*-? *i of the proportional
counter as the material in the surrounding region and the counter
fill gas as the mai-gT-fai in the small pocket. Tine counter will
conform to the limitations of small cavity theory if the fill gas is
sufficiently dilute as to be transparent to the charged particles
generated in the counter wall material and if no {or almost no)
charged particles are fanned in the fill gas. The absorbed dose to
the counter wall material can be calculated if the absorbed dose in
the fill gas is measured and the energy loss mechanisms for these
charged particles in both the fill gas and the wall material are
known. This can be expressed mathematically as;
0 is the absorbed dose in the ,C wD is the measured absorbed dose in the fill gas.
20
<j> is the spectrum averaged mass stqpping power ratio fcr
the counter wall material and the counter fill gas.
This spectrum averaged 1/f factor <j> is derived from an examination
of how a cnarged-particle spectrum slowing down continuously in a
solid medium with a small gas filled cavity loses energy to the
medium and the gas.
Consider a solid medium with a small gas filled cavity,
uniformly irradiated by a photon flux. Assume that all the
electrons generated by photon interactions in this medium have an
initial energy of To, and that one electron is generated per unit
mass of the medium. Assume also that the presence of the cavity does
rot perturb the electron distribution. Under these circumstances,
electron equilibrium exist and the energy absorbed per unit mass in
the medium is To. The energy deposited per unit ness (dose) in the
fill gas as these electrons passes through the cavity is:
Dgas = flfeCVn^.^gasdr, (2.12)0
where,1 dT.tp'dx'gas is the mass stopping power of the gas,
Nz('Ly,T) is the number of electrons in the medium with
energies between T and T+dT.
In the continuous energy dissipation model, when electron equilibrium
exist, the expression N^fEyfT} is given by:7'^,14
21
) * 1& , (2.13}
substituting (2.13) into (2.12} gives
The energy lass per unit mass of gas divided by the energy less per
unit mass of solid is
f % dTQ (
0*dx
The quantity (1/f) is a canparision of the energy deposition, in the
cavity fill gas tc the energy deposition in the solid m°^vVj when
electron equilibrium exist for a source electron of energy T o. In
the general case, the electrons have TTIJI;T*| energies spread over a
spectrum rather than, having one unique initial energy- Foxr the
general case, the expression given in Equation 2.15 mist be averaged
over the spectrum of initial electron, energies.
Let ACEy,To} represent the photon inritmwi electron spectra*,
the spectrum averaged mass stopping power ratio <-«> is given by:
22
f TO*A(^TO)*[^J I dT2 0 0 (
p-dxJ
c_> = _
f To*A('Ey,To)dTo0
The above relations states that If cne can measure the absorbed dose
in one material, one can then estimate the abscroec dose in another
material in the wc radiation, field {assuming electront
if one can calculate the <j> factor for the two mafpriftls in the
given radiation field. It was further observed by Fane22 that if the
effective Z of the contents in the cavity and the Z of the cavity's
surroundings are equivalent, then the charged-particie spectrum and
the absorbed dose of both the surrounding material and the fill gas
are* equivalent. This relationship between effective Z and. the
absorbed dose is known as Fano's theorem. Sow If cne applies Fane's
theorem in the construction and operation of a proportional counter
the absorbed dose in the wall material will be nearly equivalent to1
the absorbed dose in the detector fill gas- A calculation, of the <T>
factor should yield a value of nearly 1.0, and Equation 2.11 and 2.16
can be used to estimate the absorhPri dose in the counter wall
material once the ahworfopd dose is Measured for the fill gas.
The proportional counter used in this experiment was
sufficiently snail; a 75C keV electron has a range in the fill gas
longer (~ 16 cm to 12.5 cm) than the long dimension of hte counter,
so that results of small cavity theory are applicable. That is, the
induced heating in materials exposed to a given radiation
23
T
spectrum can be calculated from the calculated <i> factor and the
measured heating in the counter. Furthermore, if the counter is made
to satisfy the physical conditions of Fane's theorem, then the
calculated <s> factor for the counter wall material and the fill gas
should be near unity if the calculation is correctly done. This
application of Fane's theorem will serve as a validity check fcr the
<s> factor calculation.
The counter used in the gamna heating measurements is presented
here as an example. The steel walled counter is filled with a gas
whose effective Z is m*i-f*wt as best as possible to that of the
counter wall material, to satisfy Fane's theorem. The fill gas
chosen was a mixture of 90% argon and 10% carbon dioxide. This
mixture of argon and carbon dioxide was one of three gas mixtures
considered. The others were a mixture of 90% argon and 10% methane,
and a mixture of 93% argon and 7% krypton. The argon and krypton
mixture was the best match for effective Z, but it tended to suffer
electronic breakdown when confronted with a rapid bias-voltage change
or sudden increase in fluence rates. The argon and methane filled
cuunLer had the best operational electronic characteristics, as it
did not break down in any of the evaluation tests, but it was not
chosen because the hydrogen atoms in methane yield a substantial
recoil proton signal when the counter was erpospri to a mixed gamma
and neutron field. The operational characteristics of the argon and
carbon dioxide filled counter lies in between those of the other two
counters. The argon and carbon dioxide filled counter was nearly
matched in effective Z to the counter's steel walls and while its
24
operational characteristics were not as stable as those of the argon
and methane filled counter, it was far acre stable than that of the
argon and krypton filled counter. The measured energy- deposition in
the chosen fill gas should then be nearly equivalent to the energy
deposition in the counter wall material.
The chosen fill gas is sufficiently heavy so that neutron
induced recoil nuclei are net a great concern.. Since true fill gas
has no appreciable cress section for neutrcn activation, the measured
energy-loss before signal separation is nearly all from gamna
interactions. After signal separation, the measured result is just
the gamma induced energy deposition in the counter fill gas. Now, if
the gamma induced charged-particle spectra are known for both the
counter fill gas and for the surrounding material exposed to the1
radiation field, the <j> factor for estimating the gamma induced
energy deposition in the surrounding material can be calculated from
Equation 2.16.
2.3 Signal Separation
As noted in the Section 2.2, the output signal of the
proportional counter is just the voltage change on the counter anode
as the electrons produced by charged particle interactions with the
fill gas Impact the anode. The rate of the signal rise and the
magnitude of this voltage change is <Jependeut on the kinetic energy
and the linear energy transfer (LET) coefficient of the initiating
particle. It is these differences in the observed rate of the signal
25
rises that permits signal separation between signals initiated by
electron and by other charged particles.
The process begins when a charged particle interacts ir. the
counter fill gas farming a raunfaer of free electrons along its
interaction track. The number of electrons formed per unit path
length ripppnds directly en the value of the LET. These electrons
migrate along the radial electric field lines to the anode. As they
travel closer to the anode, the field lines are geometrically
constricted leading ta high, electric field values and gas
multiplication: the energetic electrons strip more electrons from the
fill gas farming an electron avalanche. 19*23 i^e rate at which the
signal rises depends en the radial dispersion of the avalanche across
the field lines and is related to how many free electrons were
created in the initial part of the charged particle's interaction
track. That is, the rate of a signal's rise dqppnris directly on. the
energy-loss per unit path length (LET) of the initiating charged
particle. The greater the LET, the fastPr the rate of the signal
rise. 24
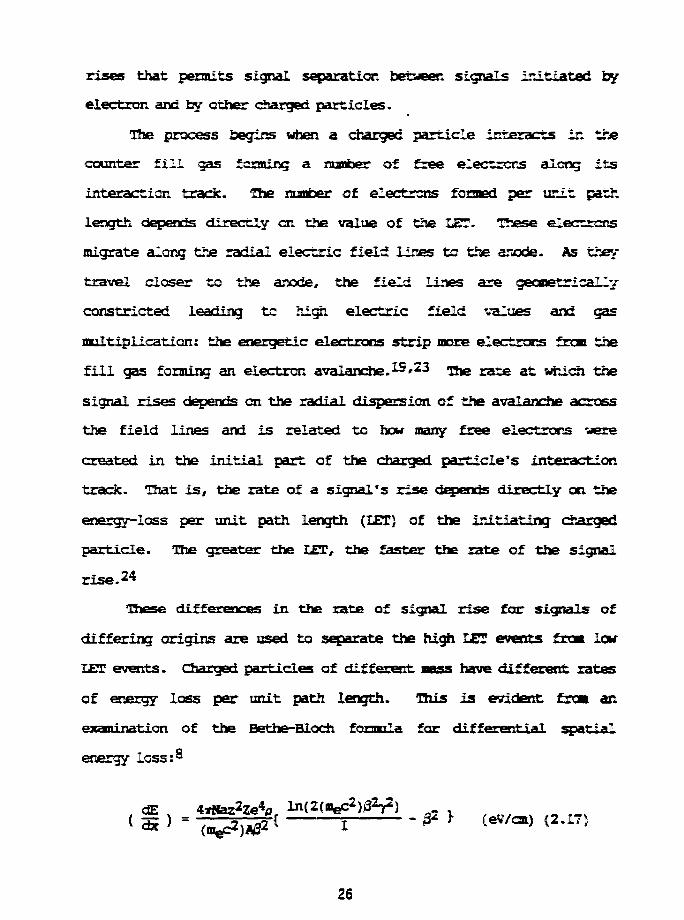
These differences in the rate of signal rise far signals of
differing origins are used to separate the high LET events fro* low
LET events. Charged particles of different mass have different rates
of energy loss per unit path length. This is evident from an
examination of the Bethe-Bloch formula far differential spatial
energy lcss:a
where:
z is the atomic nunfaer of the projectile,
Z is the atonic nunber of the target atom,
A is the atomic mass of the target,
p is tine atom density of the target,
I is the ionization potential of the target atom,
nieC2 is the electron rest energy-
One can, on the basis of signal pulse rise differences, partition, the
recorded signals into those arising from, electron initiated events
and those arising fron atonic recoil initiated events or other
charged particle initiated events. As gamma ray interactions produce
only electrons, the low LET (slow rise tine) events are associated
with ganma activity- - The high LET (fast rise time) signals that are
associated with neutron-induced events are recognizable in the
acquisition system's output and are removed frcrn further
consideration.
2.4 A Brief Note on the Numerical Methods Used in the <!/£> Factor
The <j> factor used to relate the measured energy deposition in
the counter fill gas to the surrounding material are derived from
calculations of the charged particle spectrum averaged mass stopping
powers for the fill gas and the counter wall material exposed to the
radiation field. The calculation of the charged particle
17
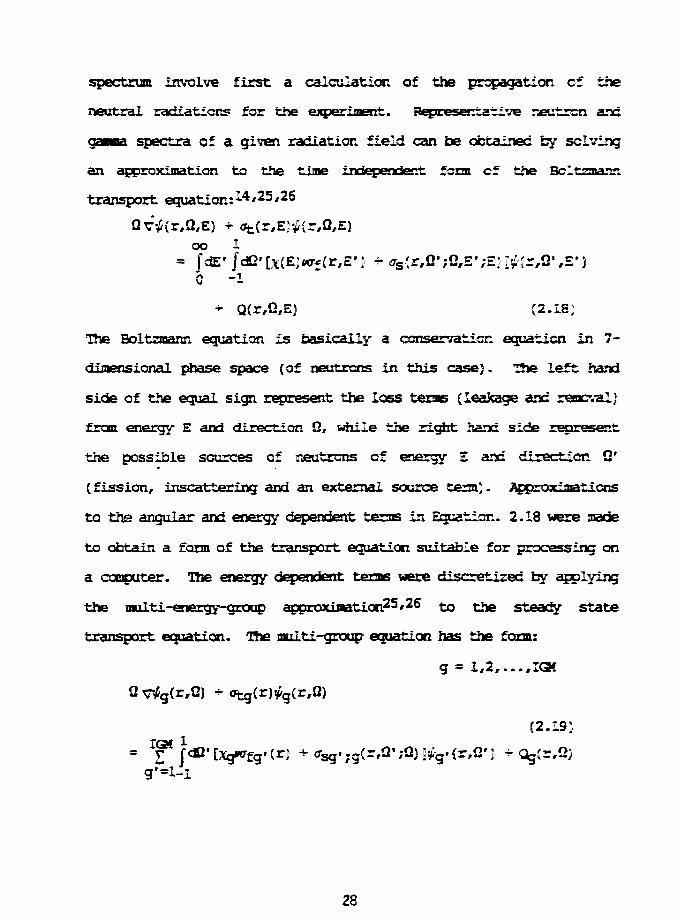
spectrum involve first a calculation of the propagation of the
neutral radiations for the experiment. Representative neutron and
gauna spectra of a given radiation field can be obtained fay solving
an approximation to the time independent fcrax of the Bcltzaam
transport equation: 1**25,26
op 1= JdE' Jd
0 -1
+ Q{r,G,E) {2.1flJ
The Boltzmann equation is basically a ccnservatiGn equation in 7-
dimensional phase space (of neutrons in this case;. The left hand
side of the equal sign represent the loss terms (leakage and removal}
from energy E and direction 0, while the right hand side represent
the passible sources of neutrons of energy E and direction Q'
(fission, inscattering and an external source term;. Approximations
to the angular and energy dependent terns in Equation. 2.18 "were made
to obtain a form of the transport equation suitable for processing on
a computer. The energy dependent terns were discretized by applying
the multi-energy-group approximation25'26 to the steady state
transport equation. The multi-group equation has the fora:
g = l,2,...,I3f
Q vtfg(r,Q) + ofcg(rtfg{r,0)
(2.19)
28
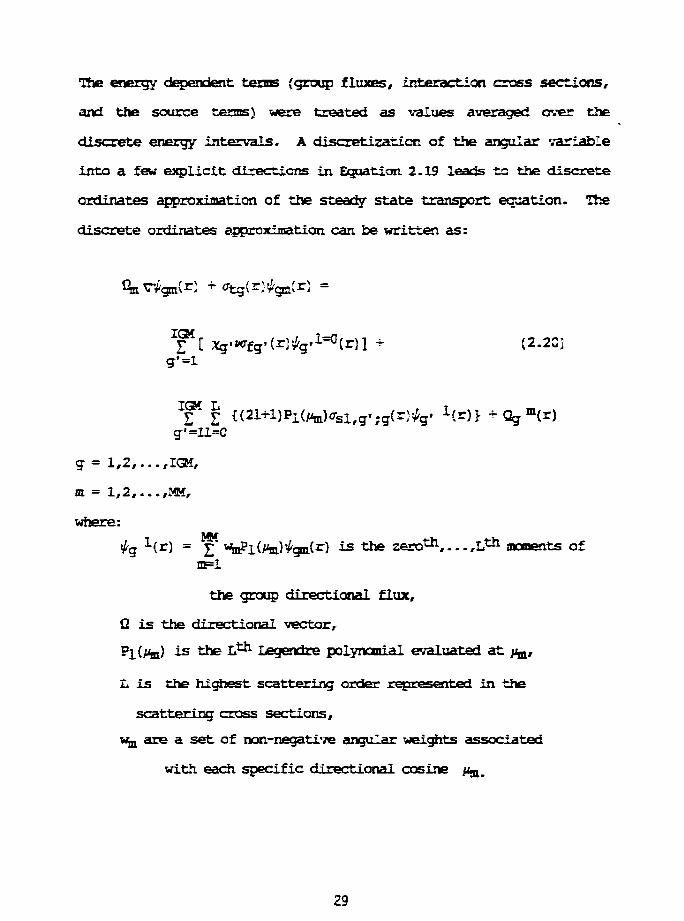
The energy dependent terms (group fluxes, interaction cross sections,
and the source terms) were treated as values averaged ever the
discrete energy intervals. A discretization of the angular variable
into a few explicit directions in Equation. 2.19 leads to the discrete
ordinates approximation of the steady state transport equation. The
discrete ordinates approximation can be written as:
g f g g ) l + J2.2CJg'=l
1 , g ; g g Hr)} + Qg m ( r )g'=ll=O
g = 1,2, . . . ,
at = 1 ,2 , . . . ,MM,
where:1(r) = j;* Wn i{rta) gm(r) is the zero^,... ,!&*• moments of
the group directional flux,
Q is the directional vector,
PlCujn) is the L ^ Legendre polynomial evaluated at fa,
L is the highest, scattering order represented in the
scattering cross sections,
wja are a set of non-negati-ze angular weights associated
with each specific directional cosine /%,
29
This set of coupled equations can be solved numerically, if a set of
interaction cross sections averaged over the energy groups of
interest is provided.
As noted in Section 2.1, the major component cf the ganma-
induced secondary electron distribution is produced by Oorapton
scattering. Making the assumption that the mechanism for all the
gamma interactions in this problem are Compton scatter, the <f>
factor calculation for the fill gas and for the counter wall material
in the irradiation field were derived from using the Klein-Nishina
model for Compton scatter and the calculated gaona spectrum.6'8'-2
As the evaluation of the Klein-Nishina model involves several
integrals, a brief review- of the method used is given. The numerical
integration scheme known as Simpson's rule was employed. Simpson's
rule takes three adjacent points of a data distribution and fits them
to a quadratic function, the area under the quadratic function is
found for eacit three point interval and the sum of these areas
divided by 3 are found for all data points considered. This sum. is
the numerical representation of the integral of the function defined
by the data distribution. A more detailed treatment and rigorous
derivation can be found in numerical methods text books.28'29
Once the <j> factor for the counter wall f»-f«*T-jai and the
counter fill gas is found, the gamma heating of the counter wall
material can be calculated from Equation 2.11. Calculation of the
mass weighted KEHMA distributions were made for Fe, Mg and C. The
ratios Mq KEEMA/Fe KERMA and. C KERMA/Fe KERMA were formed. These
KEHHR. ratios will provide an estimate of the gaona heating in the Mg
30
and C ccwgonents of the experiment once the garana heating in the
counter wall material (Fe) i s found.
31
3. Experiaental Analysis
The ideas for measuring ganma heating presented in Chapter 2
were developed into a method for measuring gamma heating in a mfx«*1
gauma and neutron field, and are presented in the early portions
(Sections 3.1 to 3.5) of this chapter. An experiment designed to
demonstrate the utility of this measurement method is described, the
results and error analysis of which are presented in the latter
portions (Sections 3.5 and 3.7} of this chapter.
3.1 The Data Acquisition Apparatus
The data acquisition y^^m consists of two main components: a
proportional counter and the electronic circuits that process the
counter output. The underlying physical principles of proportional
counter operation are presented first, followed by a component fay
component discussion of the collection electronics, presented in a
schematic fashion.
A circuit diagram representative of the cylindrical
proportional counter and its pre-aoplifier used in this experiment is
presented in Figure 3.1. The proportional counter is depicted in
cross section as a thin-walled cylindrical shell with a thin wire
running along its z-axis in Figure 3.2. The cylindrical shell is
sealed at the ends with insulating end plugs and is filled with a
mixture of 90% argon and 10% CO2 to a total pressure of 962 torr at a
temperature of 292 K. A set of field definition tubes encases the
32
1.5 mm thickstainless steal
wall
HV Supply Test Pulse
•N-Pre-amplfffer
ToFast and Slow
Amplifiers
Figure 3.1 A block diagram of t:ho countor-proampllfior nrrangomont.
3
CL
1 mil diameterstainless wire anode .- . ' • > • • \
\
pressure boundary
10 mil field tube
TZOS
6.35 crrr-12.7 cm-- 22.7 cm-
OD « 0 .750"ID « 0 . 6 9 1 "
F.lgui:o 3.2 An axial cross-aoctional view of tho proportional, counter,uaod In thia exporlmnnt;
ends of the anode wire and meets flush with the active volume of the
counter. The cylindrical shell of the counter is electrically
grounded to serve as the cathode. A positive DC high voltage,
isolated fay a large resistance, is applied to the thin central wire
making it the anode. The anode is coupled to the pre-ampiifier
through a blocking capacitor, with the counter and high voltage lead
on one side and the pre-amplifier on the other. The output of the
pre-amplifier is sent over coaxial cables to the signal processing
electronics.
As a charged particle interacts with the fill gas between the
electrodes it loses its energy by stripping electrons from the fill
gas. The stripped electrons migrate inward along field lines to the
anode. These electrons gain energy from the electric field as they
move closer to the anode, and they strip electrons from-more and more
gas atoms as they approach the anode. An electron avalanche ferns
within an anode diameter of the anode. The magnitude and duration of
this avalanche depends on the energy-loss per unit path length, of the
initiating charged particle, the density of the counter fill gas and
the electric field strength at the anode. A voltage change occurs on
the anode when the electron, avalanche inpacts on it. This voltage
change is the counter output for the initiating event.
In order to evaluate the voltage change that occurs at the
anode as a result of radiation interaction in the counter, the
signal must be processed and recorded. This is accomplished by
electronically amplifying these voltage changes at the anode to
useful levels <e. g. increase them to a level readable by a 0-10V
35
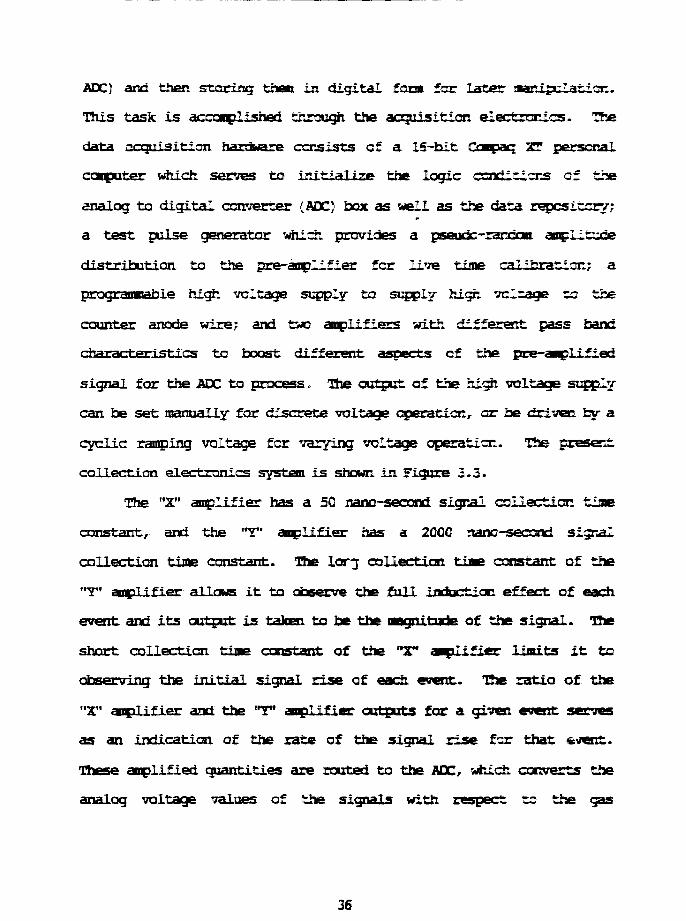
ADC) and then staring then in digital fora far T>*"«"* manipulation.
This task is accomplished through the acquisition, electronics. The
data acquisition hardware consists cf a 15-bit Compaq XT personal
computer which serves to initialize the logic conditions of the
analog to digital converter (ADC] box as well as the data repository;
a test pulse generator which, provides a pseutic-randcu amplitude
distribution to the pre-amplifier for live time calibration; a
programmable high, voltage supply to supply high, voltage to the
counter anode wire; and two amplifiers with different pass band
characteristics to boast different aspects of the pre-amplified
signal for the ADC to process. The output, of the high voltage supply
can be set manually for discrete voltage operation, or be driven by* a
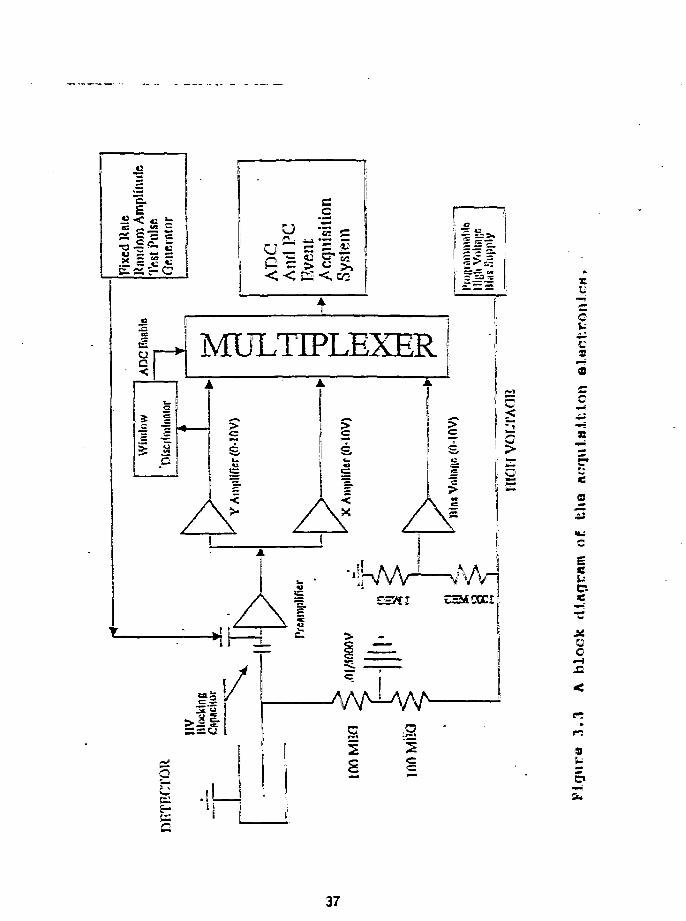
cyclic ramping voltage for varying voltage operaticn.. The present
collection electronics system is shewn in. Figure 2.3-
The "X" amplifier has a 50 nano-second signal collection, tiae
constant, and the "Y" amplifier has a 2000 nanc-second signal
collection, tiny constant. The larj collection tine constant of the
"Y" amplifier allows it to observe the full induction effect of each
event and its output is taken to be the nagni.Mrie of the signal. The
short collection tine constant of the "X" amplifier limits it to
observing the initial signal rise of each event. The ratio of the
"X" amplifier and the "T* amplifier outputs for a given event serves
as an indication of the rate of the signal rise fcr that event.
These amplified quantities are routed to the ADC, which, converts the
analog voltage values of the signals with respect to the gas
36
i OQ< < PI
inn
"«
u< ,
ee>k
V2 il H i
aa
c
—» n MUL11FLEXER>i
ilifie
rA
m
>s
t
1 ^
c
E2MC0CI
sisit
dQ
5
X
cu"oa>"3co
—4
oc
cc-
JDO
oa 1U
37
amplification at the recorded bias voltage into aigitai values arc
passes then cntc the XT for storage.
3.2 Determination of the Relative Gas Amplification in. a
Proportional Counter
The basic premise of proportional counter operation, is that the
energy-loss of a measured event E^ in. data channel i, is related to
the observed ionizaticn Z± caused by that evert in the counter
fay:14,27
Ii = A(V)*Et (3.1]
where A(V), known as the gas amplification is the proportional f. ty
constant for bias voltage (V) and it is a function of the counter
properties and the applied bias voltage (Vj. The relationship
between the bias voltage and the gas amplification is:
IiOg£A{V)I = C*V + k. {2.2}
This expression states that the logarithnic value of the gas
amplification is the sum of the voltage dependent properties C*V and
a constant (k) that defines the threshold value of log(A) for this
counter. The voltage dependent properties C*V are commonly referred
to collectively as the relative gas amplification, while the constant
k is known as the absolute calibration constant.
The relationship between the relative gas amplification and the
applied bias voltage can be determined by observing and recording the
change of the counter output signal as the bias voltage is changed.
For a given fill gas at a set pressure, a change in the counter bias
voltage leads to a change in the electric field. It is the electric
field in the counter that accelerates the secondary electrons which
strips neutral gas atoms of their electrons to form the electron
avalanche, hence the gas amplification of the initiating event. In
principle, this relationship between the bias voltage arc relative
gas amplification can be determined by exposing the counter to an
external mono-ionizing radiation source and observing the channel
into which the pulse height distribution's peak falls en successive
exposures with the counter at different voltages. Holding all ether
parameters constant, the shifting of the peak is directly related to
change in the bias voltage. An upward shift in the peak pulse height
channel indicates a larger value for the relative gas amplification.
In practice, the counting system's gain due to its
amplification electronics must first be determined. This is
accomplished jy introducing a test pulse signal into the system,
while no bias voltage is applied. This test pulse serves as a
relative reference gain setting for the system, once the system gain
is found, the relative gas amplification response of the counter can
be determined by making the following observations.
The formalism, for determining the response is given by a 5 step
process: (1} the bias voltage is first reduced to zero, (2) a test
pulse signal of known strength is fed into the system, (3} the
amplifier settings ajx adjusted until the peak of the puiser signal
falls into a channel defined as the reference pulse height channel,
(4) the counter is then exposed to the gamna source, and voltage is
applied to the anode until a well defined peak is observed, (5J the
39
channel in which this peak falls and the bias voltage that is applied
are recorded.
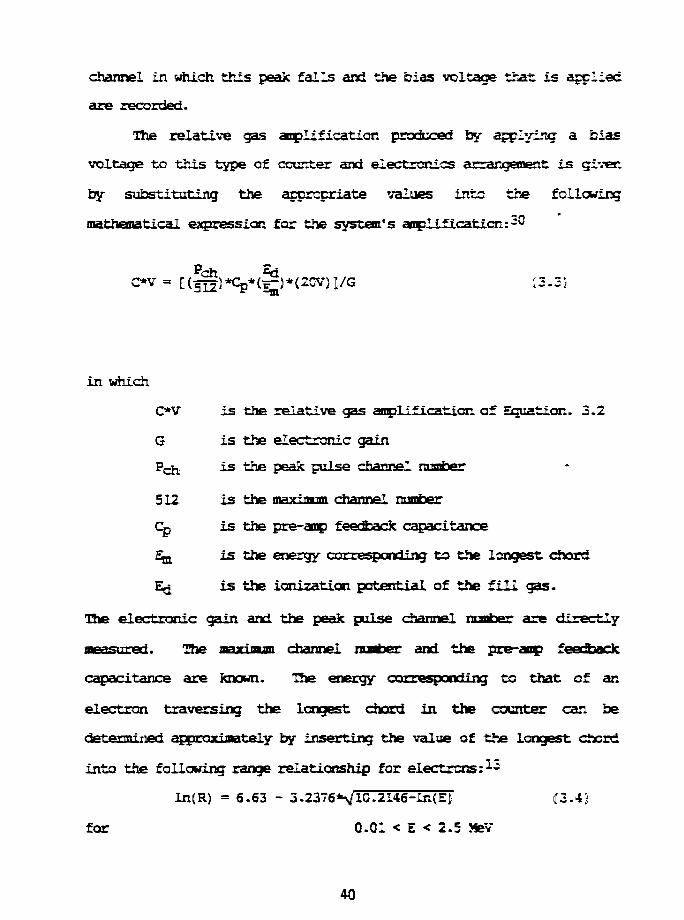
The relative gas amplification produced fay applying a .bias
voltage to this type of counter and electronics arrangement is given
by substituting the appropriate values into the following
mathematical expression for the system's amplification:20
Pen
in which
C*V is the relative gas amplification of Equation. 3.2
G is the electronic gain
Fc-h is the peak pulse channel natter
512 is the m»y?Mnn channel number
Cp is the pre-amp feedback capacitance
% is the energy corresponding to the longest chord
% is the ionization potential of the fill gas.
The electronic gain and the peak pulse channel number are directly
measured. The iwaxianm channel ntafcer and the pre-amp feedback
capacitance are known. The energy corresponding to that: of an
electron traversing the longest chord in the counter can be
determined apprmHiant«»T y by inserting the value of the longest chord
into the following range relationship for electrons:*-5
ln(R) = 6.63 - 3 -2376*V10.2L46-ln(E} (3.4J
for 0.01 < E < 2.5 SfeV
40
where
R = the range of the electron in units cf mg/ca?
= [ range (onj ] * [ mass density cf the gas ]
E = the kinetic energy of the electron
The ionization potentials for gases are found in published tables. 3*
The gas amplification is dependent upon the gas specie and fill-
pressure as these two parameters determine the ionizing potential and
the energy loss per unit path length of an electron in the counter-
The relationship between applied voltage and the relative gas
anplification can be found by observing the change in the peak pulse
height channel number with changing voltage.
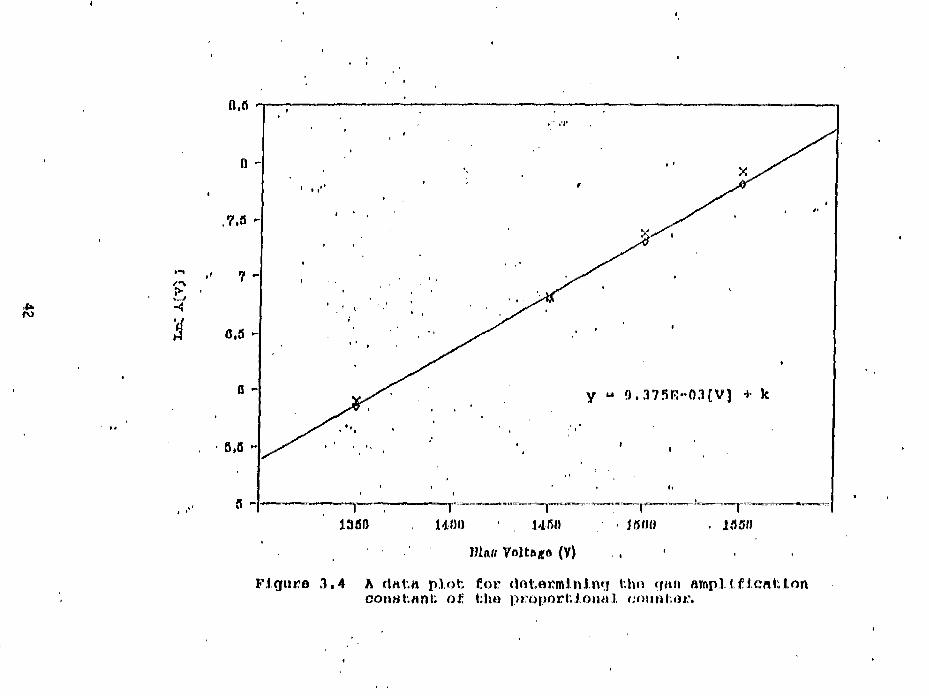
This was done by exposing the counter to a S Oo g*™u> source
and recording the spectrum peak channel as a function of the bias
voltage. The result of a series of observations is shown in Figure
3.4, as a plot of Log(A) values vs. the bias voltage (V). The
relative gas: amplification constant (C} of this counter is just the
slope of the fitted line shown in Figure 3.4, and the equation of
this line is
y = 9.375E-03 * V + k, (3.5)
so that C = 9.375E-Q3.
The experimental error for these observations is equal to the drift
of the bias voltage from the set value: for the high voltage supply
used in these measurements, the voltage deviation in all cases was
less than 15 volts resulting in error values of less than 1%. 15*e
relative gas amplification C*V for any voltage value within the
boundaries of the observation is taken fron this plot. TSe
y « 9.375E-03[V) I- k
13S0
IllftB V0ltl»«6 (V)
Figure 3,4 A clnV.a p lo t for dotarmlnlng \:\w q«n flmpllflcntionconuUnnb oft' Uho proporUional, fj
determination of the absolute energy calibration constant k (the true
y-axis intercept) for this counter will be presented, in Section 3.4.
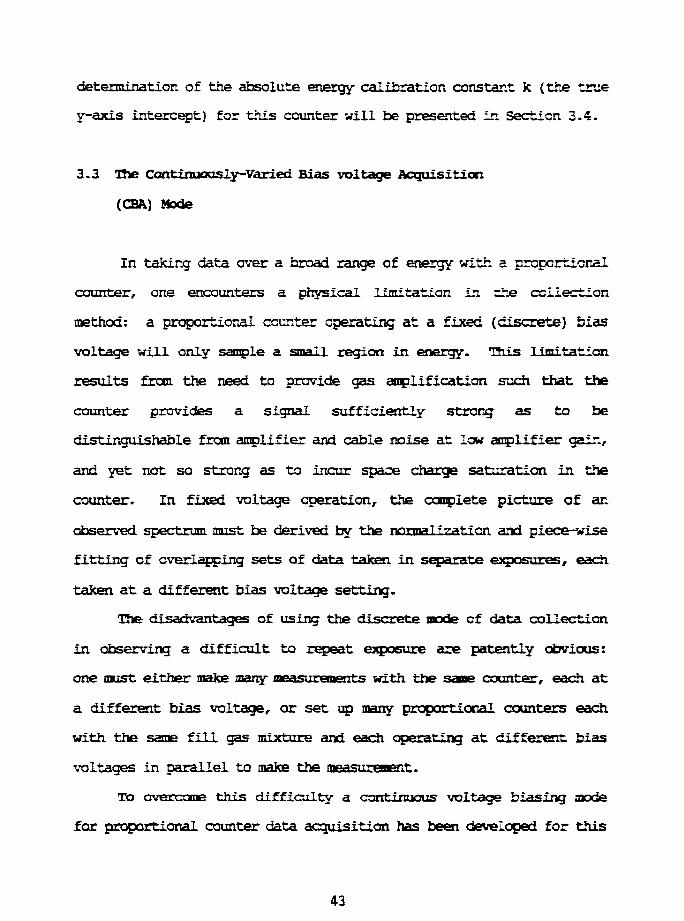
3.3 The Continuously-Varied Bias voltage Acquisition
(CBA) Mode
In taking data over a broad range of energy with a proportional
counter, one encounters a physical limitation In the collection
method: a proportional counter cperating at a fixed (discrete) bias
voltage will only sample a small region in energy. This limitation
results from the need to provide gas amplification such that the
counter provides a signal sufficiently strong as to be
distinguishable from amplifier and cable noise at low amplifier gain,
and yet not so strong as to incur space charge saturation, in the
counter. In fixed voltage operation, the complete picture of an
observed spectrum must be derived by the normalization and piece-vise
fitting of overlapping sets of data taken in separate exposures, each
taken at a different bias voltage setting.
The disadvantages of using the discrete node of data collection
in observing a difficult to repeat exposure are patently obvious:
one must either make many measurements with the sane counter, each at
a different bias voltage, or set up many proportional counters each
with the same fill gas mixture and each operating at different bias
voltages in parallel to make the measurement.
To overcame this difficulty a continuous voltage biasing mode
for proportional counter data acquisition has been developed for this
application: the Continuously-varied Bias-voltage Acquisition (C5A]
node. This mode of operation is intended to enable the experimenter
to measure the energy loss distribution over the entire energy rar.ge
of interest in a single exposure- This method offers a marked
improvement over the discrete voltage-biasing mode, such that an
energy loss spectrum, covering several orders of magnitude in energy
can now be observed with a single counter in a single exposure. This
is significant because with the counter operating in the CBA, the
energy loss distribution for a given radiation spectrum can be
obtained in one exposure instead of requiring multiple exposures with
the attendant fitting and normalizations. As a consequence,
equipment needs for data acquisition and the time spent in data
analysis have been reduced substantially.
The CB& mode consists of a cyclic linear-ramp high voltage
input to the counter and a table of calibration data to keep track of
the gas-amplification associated with each recorded signal. A
programmable high voltage supply driven by a cyclic linear-ramp
signal provides the cyclic high voltage input. The cyclic linear-
ramp signal is produced by a function, generator chip and the range
between endpoints can be manually adjusted by adjusting the input
voltage to the chip. The voltage range is determined by noting where
the region of interest lies in energy and then consulting the
correspondence table that associates the gas amplification to the
applied voltage. Care must be taken to select an upper voltage liaait
that is sufficiently high so that the weakest signals exceed the
amplifiers' lower acceptance gate yet keep the applied voltage
44
suf f Iciently low so that electronic breakdown does net occurs in. the
gas. The choice of a cyclic linear-ramp rather than a sinusoidal
input is predicated by the desire to increase acquisition tine in the
region between the voltage limits rather than around those limits.
Data collection begins by engaging the compiled FORTRAN
executable file at the computer and entering the constants ( C*V art!
k ) of Equation 3.5. The program then generates a log(gas-
amplification) vs.. voltage table for signal processing. The ADC is
controlled as a logical device by the program and it is instructed to
digitize the output of the "X" amplifier, the output of the "¥"
amplifier and the voltage output of the high voltage supply at the
moment of signal acceptance. These quantities are then passed on to
the computer. The value of the log(gas-amplification) at the sampled
voltage is subtracted from the logarithmic values of the encoded
amplifier output. A ratio is formed by dividing the "X" amplifier
output by the "Y" amplifier output for each, event. The resultant
data are placed into arrays indexed by the sampled voltage value in
the computer. The time (t), voltage (V), pulse height distribution
Y(t,V) and a distribution of the rate of the pulse rise times X(Y)
are saved for later processing. After the data are stored, the
computer sends an enable signal to the ADC, which passes a clear
input bit to the amplifiers and the next pulse is sampled.
The system live-time of each, exposure is determined by feeding
a pseudo white noise spectrum that runs from below the amplifier's
lower level threshold to above its upper acceptance gate into the
pre-amplifier. These 'white' signals fall into every active pulse-
45
height channel Y(t,V) and are recorded along with the real events.
The rate of the pulse rise-time for this pseudo random spectrum was
set by hardware manipulation to fall into the five highest observable
rise-time rate channels X(Y), to allow discrimination from real
signals. As the frequency and pulse width of these 'white' signals
are known, the live-time of the system in. a given energy region
(pulse-height channel) can be determined lay courttiiKj the number cf
•white' signals in the corresponding pulse-height array.
The advantages of the CBA mode over the discrete voltage mode
of counter operation are the reduction in analysis t-.^wt* and the
elimination of separate exposures that characterized discrete voltage
operation. In analyzing an exposure taken with the CBA mode,, one can
derive information over the entire span of interest without the need
for multiple normalizations and matchings. The uniformity of
equipment and environmental parameters during exposure is an added
bonus.
3.4 Energy Calibration
As stated in Section 3.2, the relationship between the energy-
loss of an observed event and its ionization in the counter is:
Ii = A(V}*E£,
and that
Log[A(V) ] = C*V + k
Having derived a value for the relative gas amplification constant C,
the absolute gas amplification A(V) can be solved for when the
46
absolute calibration, constant k is known. The ionization energy
observed by the counter of a charged particle interaction can be
deduced from the pulse height of its signal. The pulse height of an
event is dependent on the number of electrons produced by the energy-
loss of the charged particle in the counter. The relationship
between pulse height and ionization is given
P(V,t) =A(V)*[^J*£r C3-6}
where
P(V,t)= the observed pulse height,
A(V) = the gas amplification.
El = the ionization produced by a charged particle
in the proportional counter,
K = the threshold energy for ionization to take place,
I = the lonlzation potential of the gas,
Cl = 1.6Q2-1Q"13 coulonb/eV,
t = the collection time.
To derive the absolute calibration constant for a proportional
counter, one needs to expose it to a charged particle source of known
strength, and well-behaved energy distribution in the energy range of
the desired mwamampr^ -
Using the relationship between the range of an energetic
electron and Its kinetic energy given by Equation 3.4, and
substituting the calculated value of the maxiimm active path-length
of the counter for the range into this relationship, a value of 230.5
keV is found as the nwxfiram kinetic energy of an electron observable
47
by this particular counter- That is, if a reaction in the counter
produced an electron with a kinetic energy of 230.5 keV, it would be
reported in the last channel {channel 512) of the ADC's output.
However, observations made with this counter on a 6CCo gamna source
reported ionizations that peaked at channel 130 out of a possible
512. As these data channels are separated logarithmically in
ionization, it was concluded that these gamna signals were isi the 50
keV range. It was determined that a beta decay isotope with an
emission spectrum in this energy range would be best suited to
provide energy calibration for this counter. Tritium, a beta decay
isotope with a peak beta energy of 18.6 keV, was chosen to provide
data for the absolute energy calibration constant, and trace amounts
of it were injected into the counter fill gas.
The tritium doped counter was then placed into a shielded cell,
and the beta decay emission spectrum was recorded by the collection
electronics operating in the CBA node. The recorded data were then
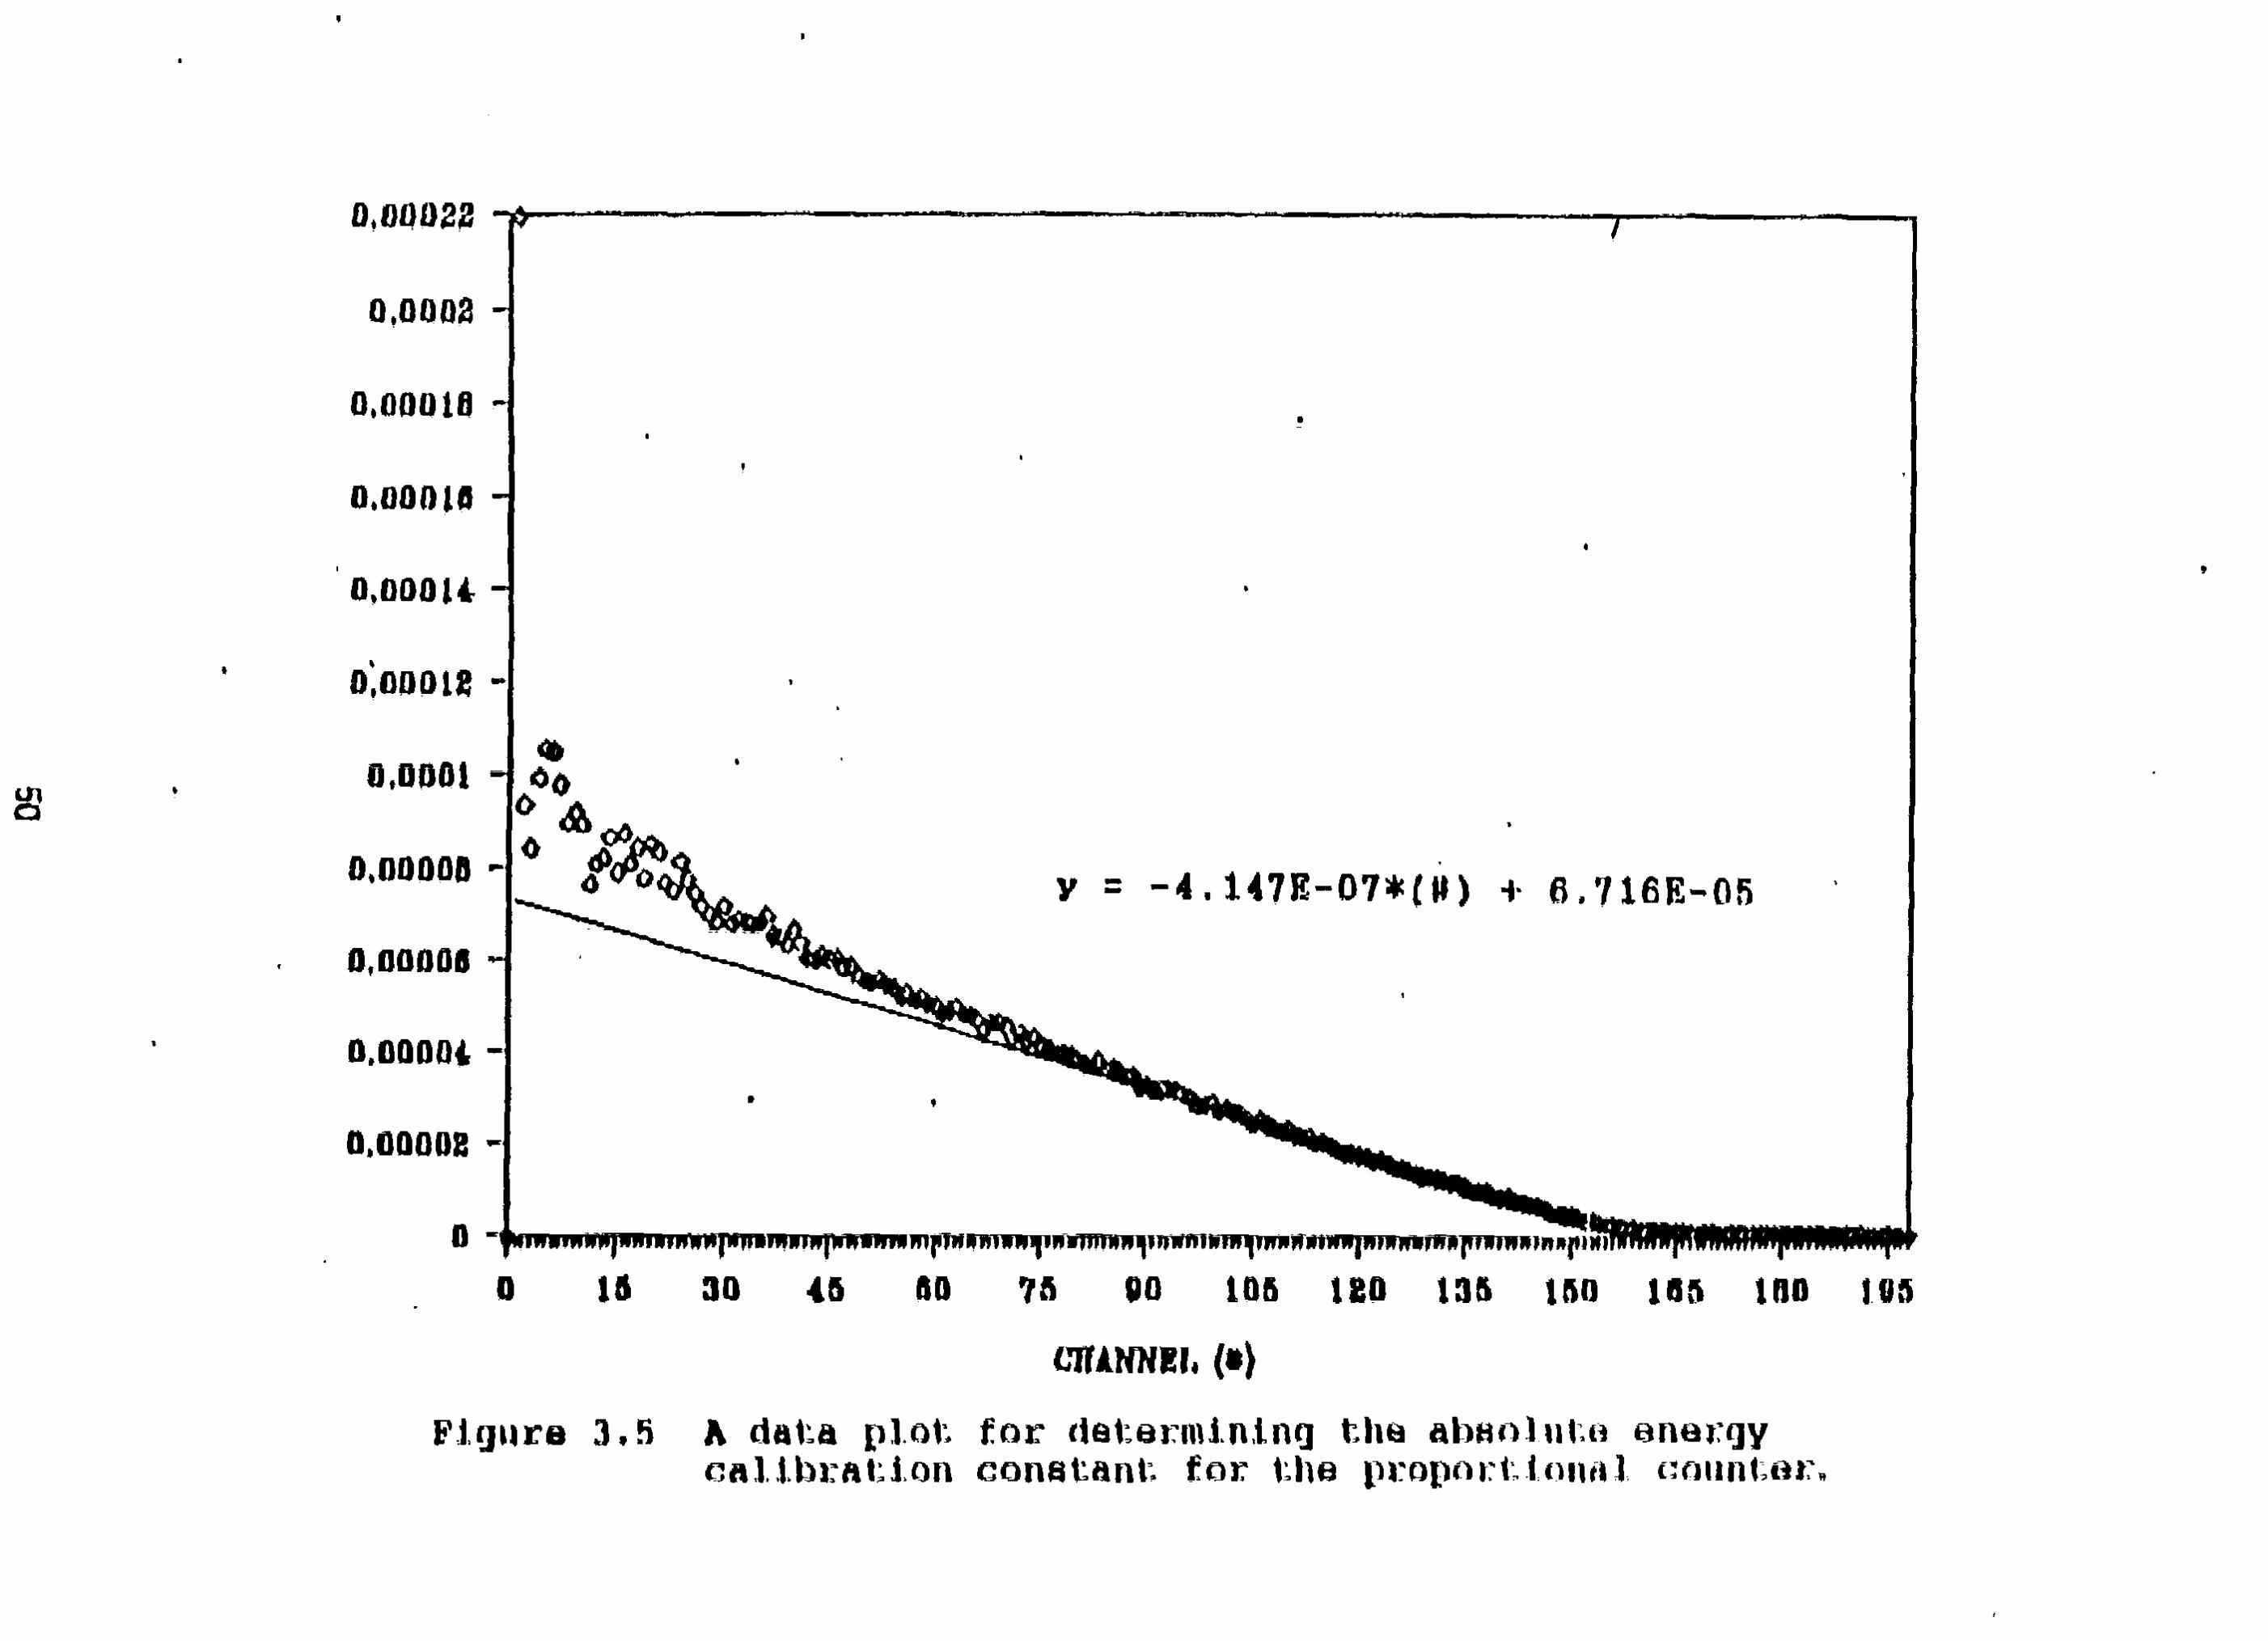
plotted in the spirit of a Kurie plot32"35 to determine the absolute
calibration constant k. To demonstrate this procedure, a short
discussion of Kurie plotting is presented.
The emission probability in momentum space of a beta decay is
given by3^
P{u)du = F(Z,E)*Const*(Eo-E)2*u2du. (3.7J
Noting that udu = mdE, a change in variables in Equation 3.7 results
in
P(E) = Const*F(Z,E)V2n£(Eo~E)2, (3.8)
the emission probability in energy for a given beta decay.
Rearranging terms to get an expression that is linear in energy on
the right hand side results in
= (E0-E). (3.9)Const*F(Z,
Kurie found that the energy endpoint of a given beta decay can be
found by plotting the left hand side of Equation 3.9, which consists
of known constants (c and m), a calculable result [F{Z,E), the
coulomb function of the daughter nucleus] and a measured quantity
[P(E)] and equating the x-intercept as the point where E = Eg. With
a slight modification to Equation 3.9, one can plot the probability
of emission vs. ionization channel. The channel in which the
endpoint falls then corresponds to an energy of 18.6 keV, and by
substituting valuas into Equation 3.1, the absolute calibration
constant for this particular counter is found to be k = -7.78275.
The Kurie plot of the tritium decay used in this calibration is
presented in Figure 3.5.
3.5 Signal Separation and Heating
As noted in the Section 2.3, the differential spatial energy
loss of a charged particle depends upon its mass and initial kinetic
energy. For two events that register the same pulse height (cause
the same ionization) in the counter, the rate of the pulse rise time
of the respective signals can be recorded. The rate of the rise time
of a signal is proportional to the density of secondary electrons
which impact the anode. A particle with a greater TM.near Energy
49
0,00022
0,0002
0,00016
0.00010
0,00014
0,00018
,0001
O.O000B -
0,00008
D.0Q0D4
0,00008
0
4.147E-O7*(W) + 8.716E-05
0
Figure 3.5 A data plot for determining tha abwohiUo energyeaUbrftUion constant, for the proportion*!!, counter
15 30 45 SO 75 90 105 U O 135 150 105 1H0 18!
Transfer coefficient (LET} would generate a mere spatially dense
secondary electron distribution and would register a larger rate cf
signal rise for its signal pulse. The rate of the signal rise is an
indication cf the ionization rate for the observed signal. In the
Q3A mode this quantity is recorded in. the X(Y) array. The pulses can.
be sorted, in LET in the Y(t,V) array by the contents of tee X(Y}
array.
A sorting subprogram linked to the main data analysis program
was written in FORERAN to perform the game ard neutron signal
separation. In this module, the signals arising from exposure cf the
counter in a mixed, ganna and neutron field Y^t//} are sorted fay the
associated %(Y) array. Those signals with X(Y) values greater than
a predetermined cutoff value were labelled neutron-induced events.,
This cutoff value was determined by observing the 2{YJ distribution
arising from a pure gamna ray exposure. The Y*m(t,*/J array is fanned
from the Ym(t,V) by subtracting out those events whose 2m(Y) value is
greater than the cutoff. The Y'm(t/V) array is then the energy-icss
spectrum of the gamna induced secondary charged particles in the
counter. This array is held for further processing to determine
gamma heating. The FORTRAN -yrmjr'flMfi used for data processing and
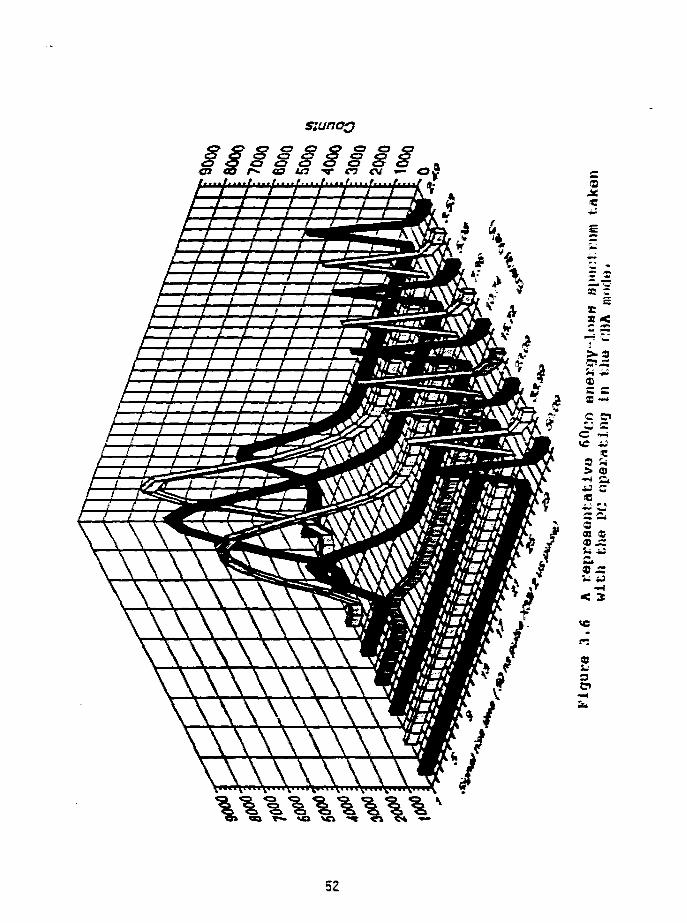
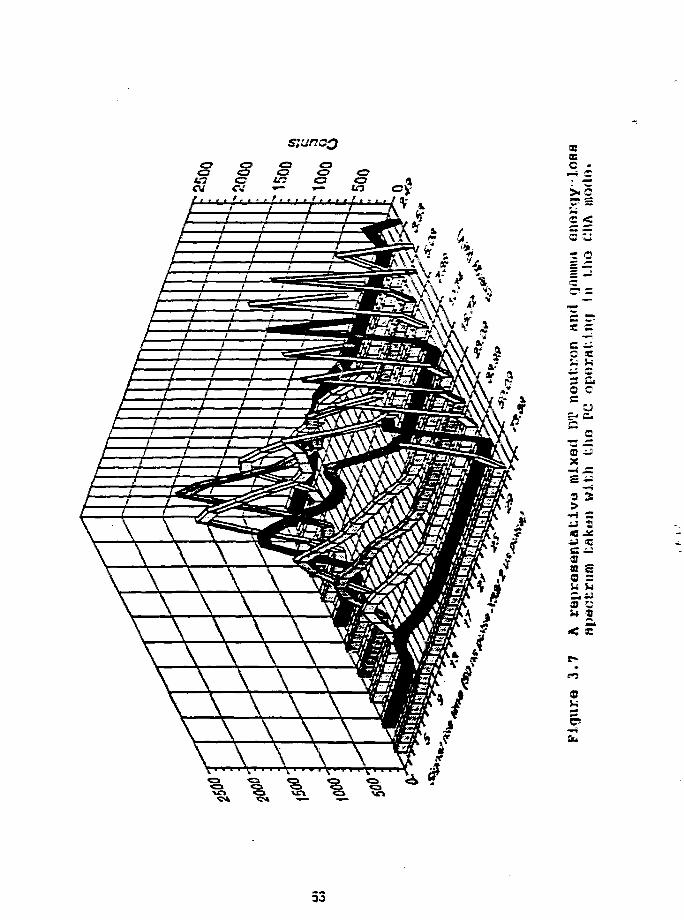
reduction are presented in appendices A and B. To illustrate the
separation process; the counter output from a 50Cc gamna source alone
is presented in Figure 3.6, and a representaticn of the counter
output from a typical mixed gamna and neutron exposure is presented
in Figure 3.7. The x-axis of this figure represents the signal rise
time. The y-axis represents selected energy groups. The z-axis
51
szunaQo o a es o o co <o o a o <p c
/rni/.m/irri/mf/rii./iiii/ini/'.Mi
/ / / / / / / / /
/ / / / Hm^-Fi ir i I t i t
If l i t ! jL-jj f " I I I f / f "^f/ I I t I / / // i i i i i 1i t i i t >
i / / / / f-iI f i i if I .if/ / / / / I I I iI f t f / i I i // I i I i f / // f t t I I I
I / I I I I iI i i t i t LZ
f/ / f i l l " }
vvwWAXVW
\Y\\\Y\\\\\'\\\\\w\\Vw\\YWwwVv
Z 3
X Qsr
R <C —
—* yi
03
«c —as
8 i*> a43 O
oas X
s
52
a o aa ai oV7 Ocu
O <U3 0
I ' " I ' / ' ' / ' * *"/ '' * r
/ / / I I 1
1i i
I t I II I f t
( f i t
\ \ \
\ \ \ \ x\ \ \ \ \\ \ \ \"V\ \ \ \ \\ \ \ yv\ \ \ \ \
^ ^ ^ , ^ ^ ^ '^ ^» ^L <=: «
#
00OS
c
NOPS
c Sx o5—,
C- —
o *a co o
!0 -i!
3 3
c —3a £a =
9 ~
<9
Cb
310
gives the integrated counts per channel of the measurement. Fran
Figure 3.6, are can conclude that ganna ray induced events have rise
times that fail in or below channel fifteen (15) on the x-axis. T£l*
observed cutoff serves as the limiting criterion far separating the
data shown in Figure 3.7. That is, for data collected in a mixed
gamma and neutron environment., those data registered in rise tine
channels greater than channel 15 were disregarded in the heating
calculation.,
Heating in the counter fill gas is equivalent to the energy
deposition in the counter divided by the mass of fill gas in the
counter. It can be found from:
Heating rate = Qfc* £ [(Nfc*k)I/(t*m) (3.101
where
Njc = number of counts at channel k,
k = the channel number,
Ok = the energy width of each channel,
t = the data collection time,
m = mass of the counter fill gas,
K = the total number of channels.
3.6 The Irritation Experiment
The main purpose of the experiment is tc demonstrate the
ability of the data acquisition system to provide ganma heating data
in a low-Z medium, irradiated by ITT fusion neutrons and gaona rays.
54
The experimental setup consists cf a iow-Z ojiic lattice
irradiated by a OT neutron generator with provisions ts take heating
data along the mid-line of the cubic lattice. The neitrcn 'generator
used was a Texas Sfcdear Made! 94CQ- The generator consists of an
accelerator flight tube connected to a deuterium ion source on one
end and a tritium impregnated target on the other. The ion source
consists of a plexi-giass tube fed by a deuteriur. gas line and
attached to a high-voltage biased extractor fissure. The deuteriaa
in the tube: is bathed in HF radiation to induce gas icnizati.cn. The
ionized deuterons are extracted from the tube through the fissure and
fed into the lead end of the flight tube. Two pairs of deflection
plates at the inlet of the flight tube provide focusing for the bears.
The deuterium ions then pass through a region containing ten
elements of 15 kff gradient each and are thus accelerated in the
flight tube to an energy of 150 KeV before they impact, onto the
target. The target consists of a stainless-steel cup which holds a
tritium impregnated titanium foil in. the cross-section of the flight
tube. These 150 keV deuterium {atonic and molecular) ions are
focused onto the tritium impregnated target fail with the result that
some of the deuterium and tritium fuse to form alpha particles and
14.8 MeV neutrons. Scattering reactions between these 14.8 MeV
neutrons with material in the target housing and the accelerator
walls produce copious amounts of gaona radiation. Figure 3.8
diagrams the workings of the model 9400.
The law-Z cubic lattice is formed of 144 rectangular (5 cs x 5
an x 61 cm x 0.2 cm) magnesium sleeves, fitted with (4.5 cm x 4.5 cat
55
0 1
deflection
platestarget cup
ion source•
—1
L. 1
field gradient
elomonts
D2note: drawing not to scalo
RF fiouroo
Figure 3.0 A block diagram of the Texas Nnoloar model 9400DT neutron gonaraUor,
Counter position! lire denoted by Pt,,,P6
Texns Nuclear 9400
• 50 cm
—
PI
—_
P2 —_
,—.
—
P3
— .
- • — -
1M
—-
—
P5
—
—
—
•
Pfi
H4 .*icm x 5cm x fiOn x• MR ulrcvr.s filled wlili rrciAiifjiilnr
l l i
Hole: ilmwlni nnt lo icnl*
Figure 3.9 A repronontativo diagrflm of fcho ox|.)ori,moni'.al aoUup.
x 61 an) rectangular graphite blocks stacked in a cubic array. A 40
cm long graphite block was especially machined with a channel 2.5 an
x 2.5 an in cross-section to hold the proportional counter and its
pre-amplifier. The cubic lattice is set on a reinforced, cart-
mounted platform, which can be raised or lowered horizontally by
means of a winch. This cubic lattice was placed 50cnr from the target
cup of the neutron generator, with the long dimension of the Mg
sleeves perpendicular to the beam. line. The experimental setup is
shown schematically in Figure 3.9.
The neutron generator and the graphite cubic lattice are
located in a large concrete vault in Building 315 at the Argonne
National Laboratory. The control station and power supply for both
the neutron generator and the proportional counter are situated
outside a concrete labyrinth as diagrammed in Figure 3.10. Control
logic and power are provided by cable connections between the control
area and the vault.
The goals of this experiment were to determine (1) the
applicability of the signal separation methodology and the CBA mode
of proportional counter operation for ganma heating measurements in a
mixed gamna and neutron field, and (2) the operating limits of this
method. The experiment consists of recording the energy-loss spectra
observed with the proportional counter in six positions along the
central-line of the cubic lattice spaced progressively further away
from the target. These six positions are shown in Figure 3.9. Great
care was taken to align the mid-line of the lattice and the active
volume of the counter with the beam line of the generator. The
58
O1
Shie
lded
Con
trol A
IM.
-
Concrete shielding
Experimental Vault
Figure 3.10 The relative placement of the experiment and the control aroa.
gamma-induced heating at each position was found from the procedure
detailed in the preceding section. The neutron output of each
exposure was monitored and recorded by a BF3 counter surrounded by a
cylinder of polyethylene 10 cm in radius situated in a corner of the
vault. The heating data from the six exposures were normalized by
the number of source neutrons for the given exposure. The result is
a radial gamma heating profile of the graphite cubic lattice.
3.7 Experimental Results and Error Analysis
Gamma heating measurements were made in the Icw-Z cubic lattice
at the six positions indicated in Figure 3.9. The measurement made
at position 4 was made in October of 1990, those measurements in
positions 1,3,5, and 6 were made in November of 1990 and the
measurement at position 2 was completed in January of 1991» This
erratic measurement schedule was influenced by both the duty factor
of the TN94GQ and its availability. The positioning of the cubic
lattice was slightly different (so that the exact midline of the
lattice may have been moved 1 cm. to either side of the beam line,
with no change in the radial direction) for each series, as it was
necessary to move the lattice away from, the TN9400 to accommodate
maintenance and other experiments. However as the sensitive volume
of the counter was re-aligned with the generator beam line for each
series of measurements, these interruptions should not adversely
affect the measurements.
60
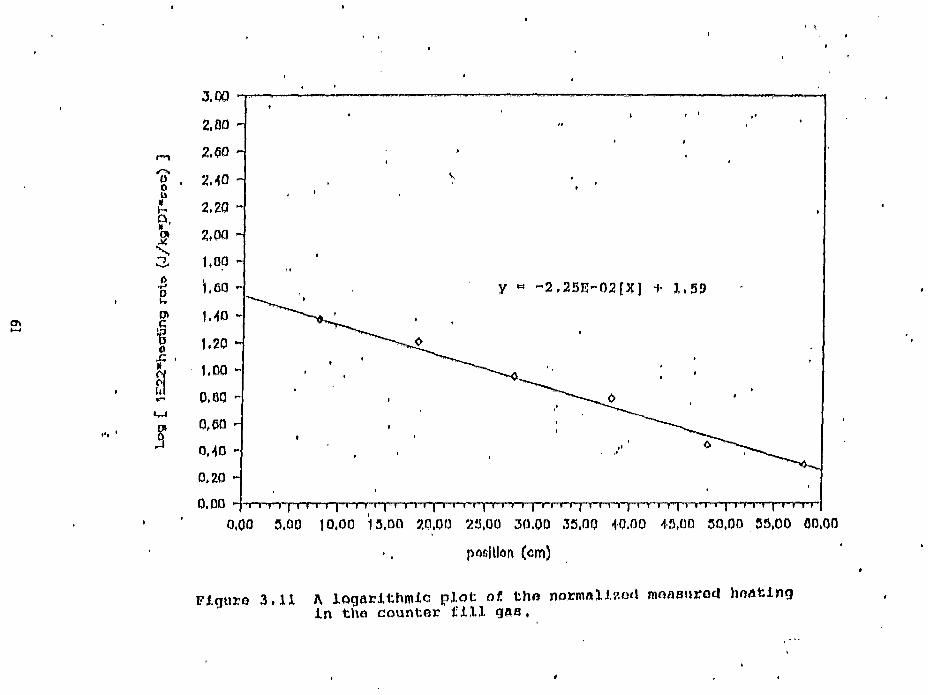
. '. •
bu
kkc
1a
3,00
2.00
2,(50
Z4O -
2.20 -
2,00 -
1,00 -
'1.6Q -
1.40
1,20 ~
1,00 -
o.no -0,60
OHO
0,20 -
y « -2.25R-02[K] + 1.59
O.DO " n r r | i r r i -|-i i t i1 1 rr i yi i r j i i i •!••(• i r n f i r i - r ; i-r-rr7-T~rT-r-f-i r
0,00 5,00 10,00 15.D0 20,00 23,00 30.00 33,00 -10,00 43,00 50.00 53,00 00,00
(cm)
Flguro 3.11 A logarithmic plot of tho normollzodl.n the countQj: fill qaa
hoating
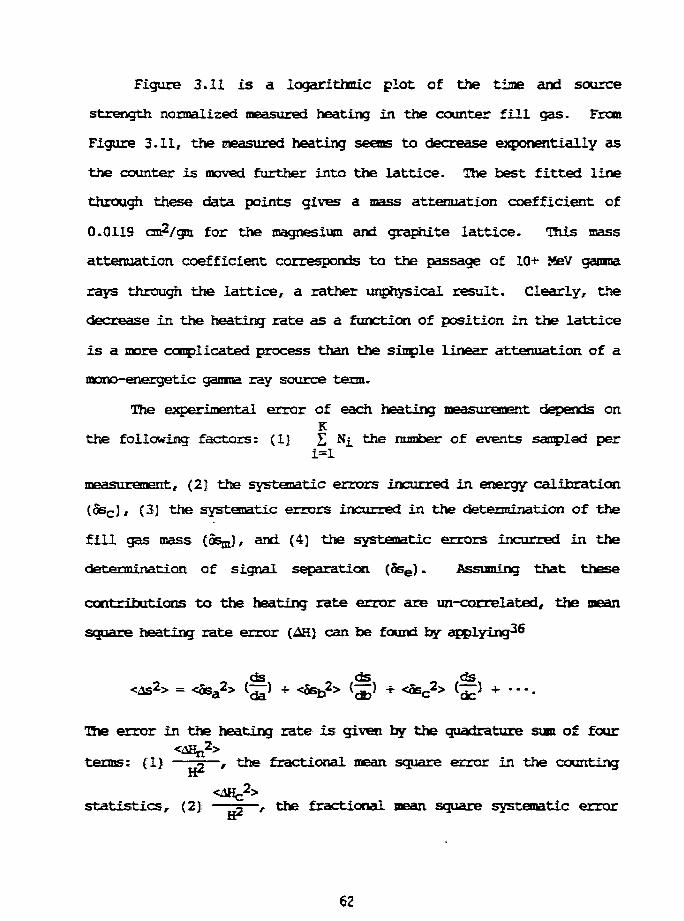
Figure 3.11 is a logarithmic plot of the time and source
strength normalized measured heating in the counter fill gas. From
Figure 3.11, the Pleasured heating seems to decrease exponentially as
the counter is moved further into the lattice. The best fitted line
through these data points gives a mass attenuation coefficient of
0.0119 cm?/gm for the magnesium and graphite lattice. This mass
attenuation coefficient corresponds to the passage of 10+ MeV gamma
rays through the lattice, a rather unphysical result. Clearly, the
decrease in the heating rate as a function of position in the lattice
is a more complicated process than the simple linear attenuation of a
mono-energetic gamma ray source term.
The experimental error of each heating measurement depends onK
the following factors: (1) £ Nj_ the number of events sampled per
measurement,. (2) the systematic errors incurred in energy calibration
(SscJ' (3) the systematic errors incurred in the determination of the
fill gas mass (5%), and (4) the systematic errors incurred in the
determination of signal separation (5se). Assuming that these
contributions to the heating rate error are un-correlated, the mean
square heating rate error (AH} can be found by applying^
ds ds ds™* ^*»a ffa ^ I O D db ^*~c rfr* •
The error in the heating rate is given by the quadrature sum of four
terms: (1) — ^ — , the fractional mean square error in the counting
2>
62
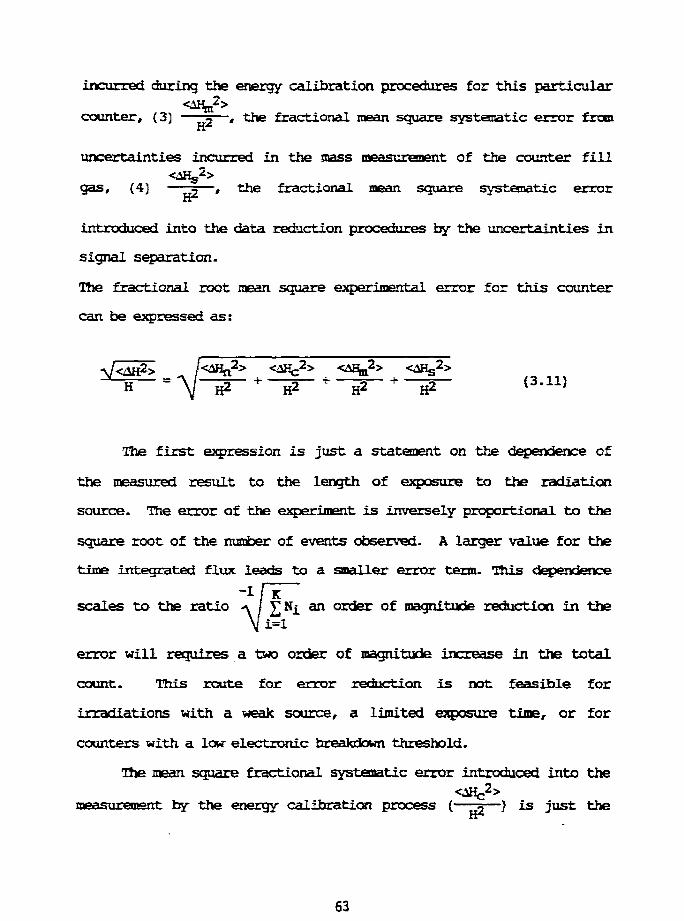
incurred during the energy calibration procedures for this particular
counter, (3J 2—* ^*e fractional mean square systematic error from
uncertainties incurred in the mass measurement of the counter fill<&ts2>
9as# W 2—' "t*ie fractional mean square systematic error
introduced into the data reduction procedures by the uncertainties in
signal separation.
The fractional root mean square experimental error for this counter
can be expressed as:
The first expression is just a statement on the dependence of
the measured result to the length of exposure to the radiation
source. The error of the experiment is inversely proportional to the
square root of the number of events observed. A larger value for the
time integrated flux leads to a smaller error term. This dependence
scales to the ratio «\ I £N^ an order of magnitude reduction in the
error will requires a two order of magnitude increase in the total
count. This route for error reduction is not feasible for
irradiations with a weak source, a limited exposure time, or for
counters with a low electronic breakdown threshold.
The mean square fractional systematic error introduced into the
<^HC2>
measurement by the energy calibration process (—-3—} is just the
63
square of the uncertainty (%) in determining the channel into which
the 18.S keV beta particle from tritium decay falls. The uncertainty
in determining the channel into which the 18.6 REV beta particle
falls by the using a Xorie type plot cf the energy-less spectrtsn is
nc more than one and one half percent*
The mass of the fill gas depends en four factors: (LJ the
atomic weight of the gas mixture, (,2J the active volume cf the
counter, (3!) the temperature at which the mixture is fed intc the
counter, and. (4) the pressure to which the counter is filled. The
active volume of a counter is known to within G.1% cf its true value,
as the counter is a precision machined product. The temperature at
the time of the filling was measured to within C.5 degree accuracy.
Likewise, the pressure cf the fill gas was measured to within 1 torr
{mg JJg) of its true value. The sum of these mean square fractional
errors amounted to less than (Q.4%)2. However, as the gas mixture was
rated at 1% errcr (i.e. SC% V - 1% Ar (mass 40J aixi 13% -/*• 1% CE2
(mass 44) ), a mean square fractional (—-s?—} of (l.C%)* was
assigned to the calculated mass of the fill gas.
The estimated mean square fractional error (—^—) incurred by
the signal separation process was determined by examining the portion
of the counter output that did not exhibit a clear separation between
the gamma and neutron induced signals. For the counter used in this
measurement the overlap of signals exist in the energy region 5 keV <
E < 33 keV (see Figure 3.7}, whereas the total energy range sampled
by the counter ranged from 1 keV to 113 keV. Fcr all other energies
there exist a clear separation of the gaona-inducec signals from the
neutron-induced signals, though for energies greater tsar. 33 ke7 the
neutron-irriuoad signals are miniscule when, canpared tc the ganra-
induced signals. The nancer of events falling into the energy fairs
corresponding to this overlap region account fcr 4C% cf the court
total. However, this overlap region, represents only 17% cf the tctai
energy deposition. Using the separation pcirt detesnined cy
observing the region where signal separation, is clearly defined (all
energies above 33 ke-V), the high signal rise rate events are
subtracted out cf the data array. This procedure subtracts cut
events that account for 5% of the total energy deposited. Being
conservative, an estimated mean square fractional errcre cf (5.0%):*"
was assigned to the separation technique used. The mean, square
fractional error incurred for the: signal separation, technique is
clearly the principle source of error in the measurement.
The experimental errors and the contributing components fcr
these measurements are presented in Table 3.1. Locking at column 3
of Table 3.1, one sees that the measurements with the greater
exposure exhibited the lower errors. The product cf the counts per
channel times the energy correspond ing to that channel are plotted
against energy for each of these measurements in Figures 3.12 through
3.17. The area under the curve in figures 3.12 through 3.17 is the
measured energy deposition in the counter for the six exposures.
These Figures indicate the region in energy that ccntributes most tc
the heating lies between 4 keV and 20 keV.
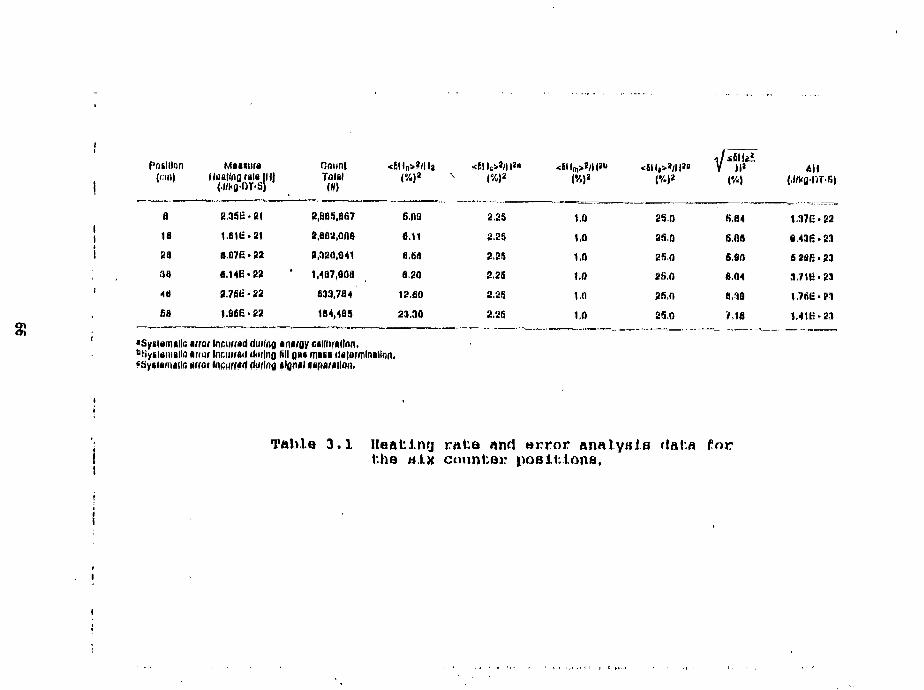
Cushion
aIB
28
38
48
£8
lBall|lQffll«(,1/fcgQT-S
2.35E-21
1.6IE-21
B.Q7E • 22
6.14B«22
2.761: - 22
1.66E>22
CountTotal
2,885,867
2,602,008
8,320,041
1,107,808
£33,704
184,495
n
600
6.11
8,6il
8,20
12.60
23.30
•Sysinm»llc arror Innunad riming antrgy cillhrtllon.b!iyiisinnllrt miiu Incurred dmlng till Q M mitt ililamilmllnn,'Sy*i«nuili; mar tacuitttt tuning ilgml ufWUion.
2.25
2,25
2,25
2.2S
2,25
2.25
1.0
1,0
1,0
1.0
1.0
1.0
25 0
2S.0
85.0
£5,0
250
25,0
s.nnS.fiO
8,30
7,18
M
1.37G.22
528R • 23
3,711:-23
Table 3,1 He ft t. ing rate «n«1 arror analyHis flaUa forthe atx counter positions,
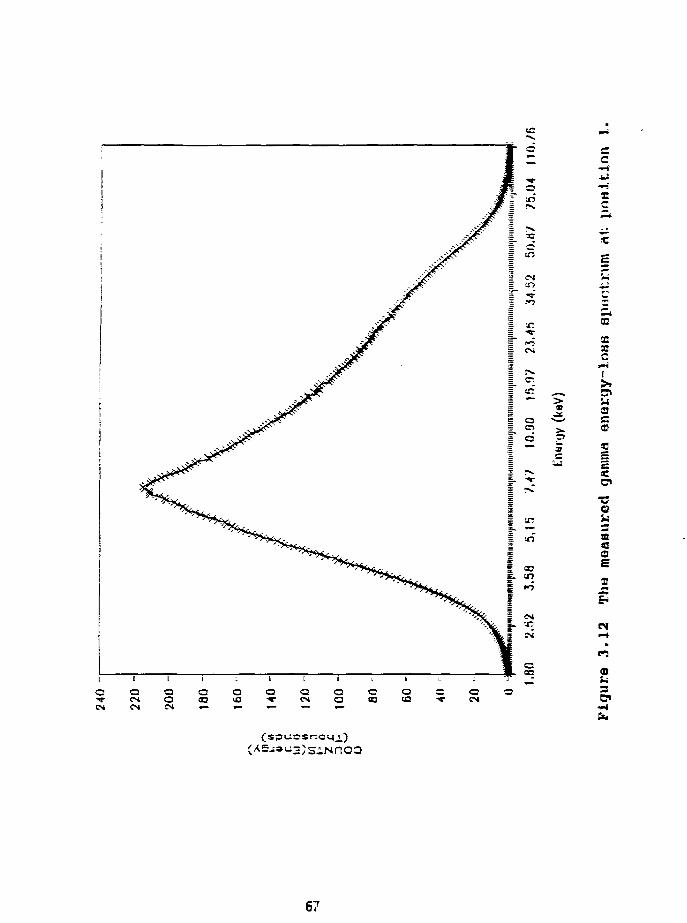
r o
a
IB
SB31O
QC
QUsat«!aE(S
&
a
&-Hi
67
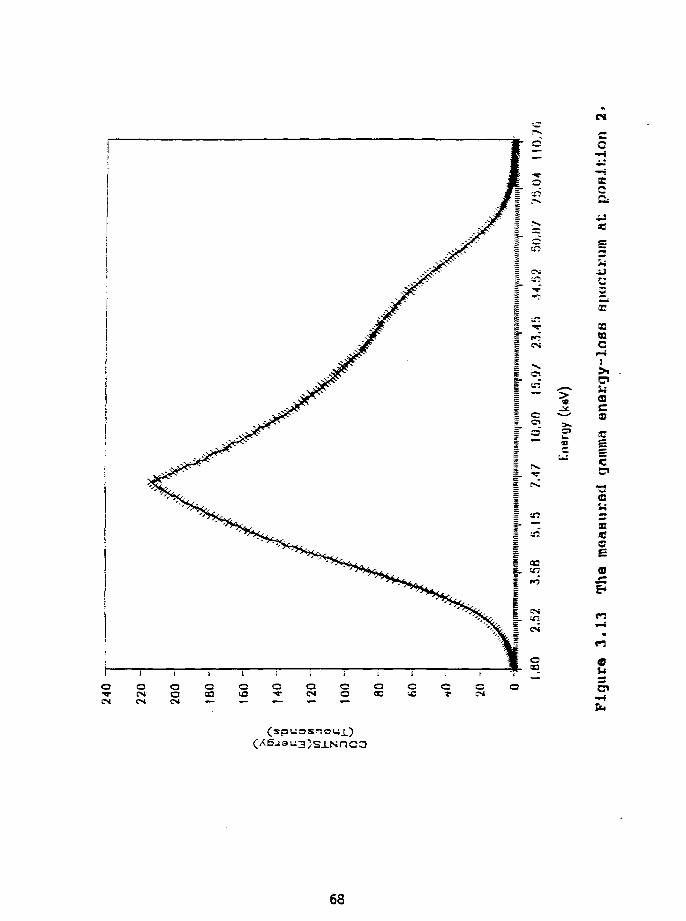
C
c
mcCi
03
cr-iI
i
szcc
m
or
68
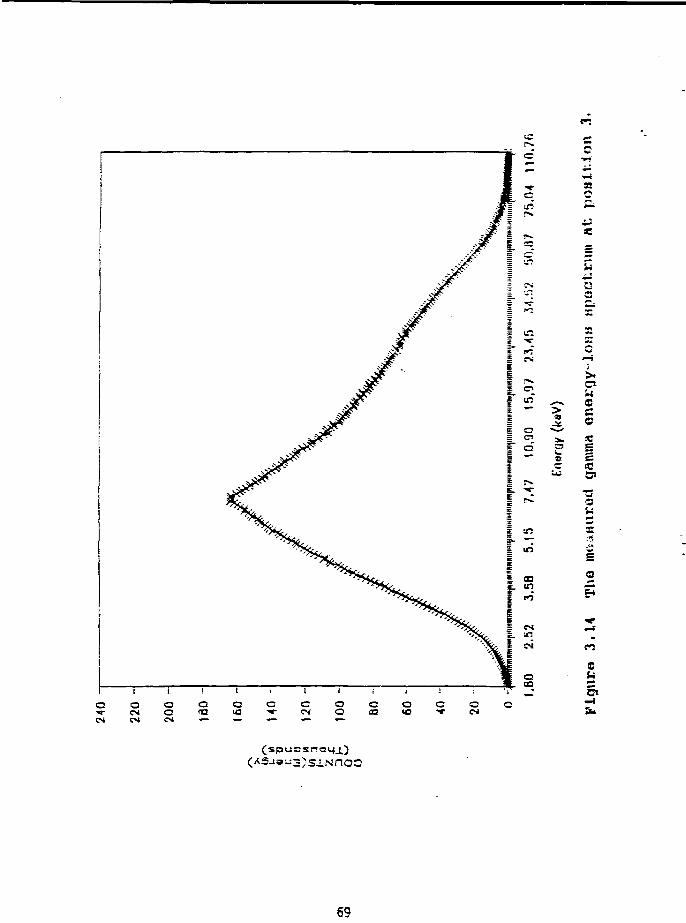
±3
11S<a
f s p u n s n c 14x3
69
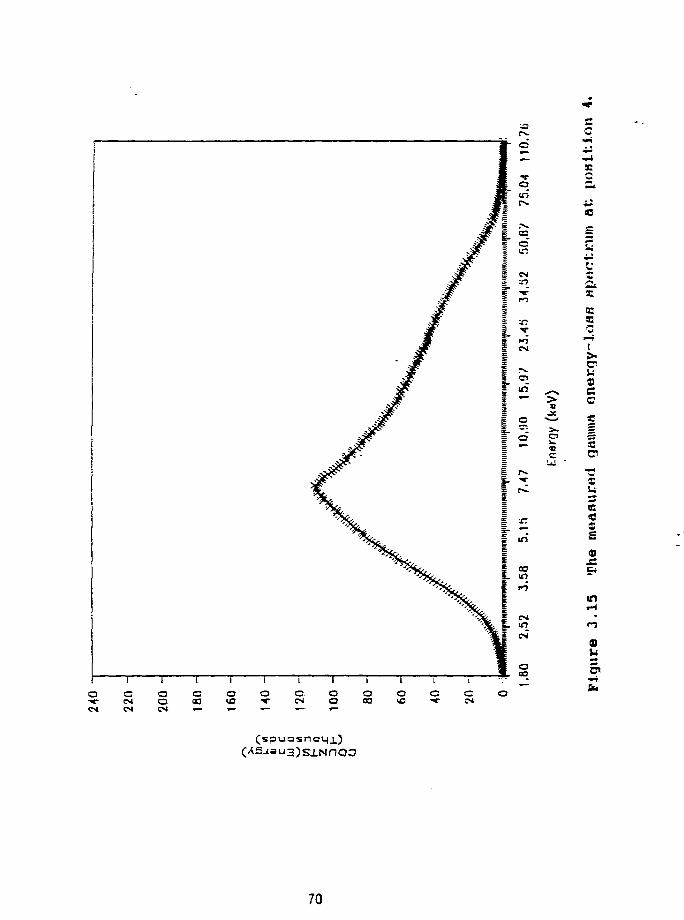
sc
OBC
<a
c
G
qt>-enacc
s
If)
9U
(spuosnoijx)
70
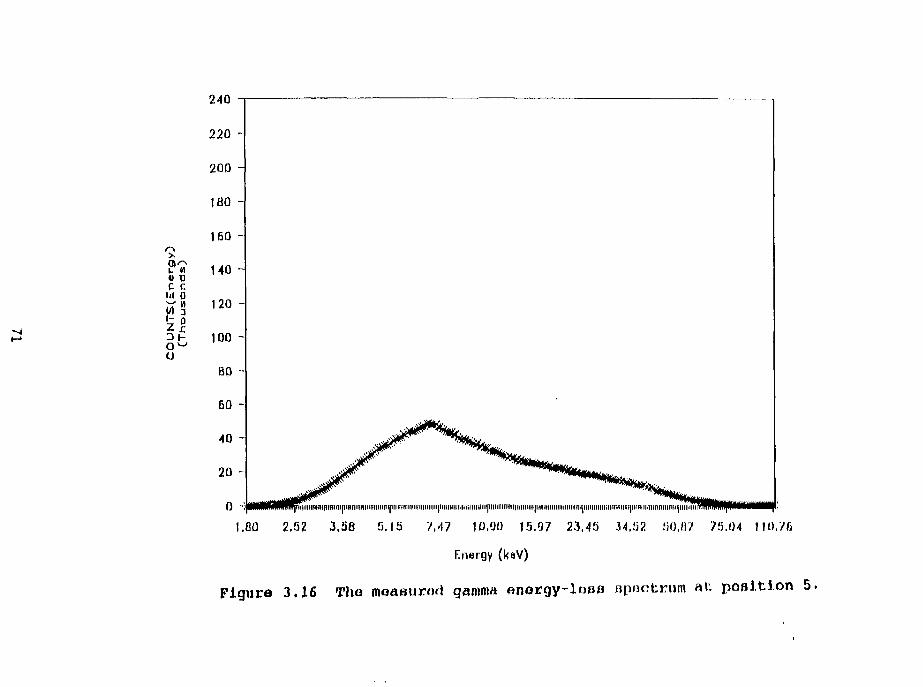
240 -
220 -
200 -
180
160
PS 140 HC CUl 0
Z.C
o
120 -
100 -
BO -
60 -
40 -
piniiiiiniiiiiiiiliili|ilin
1.80 2,52 3,58 5,15 7,47 10,90 15,97 23,45 34,S2 50.H7 75.04 110,76
Energy (keV)
Figure 3,16 Tho moasurod gamma onorgy-loao npockrum aU position 5.
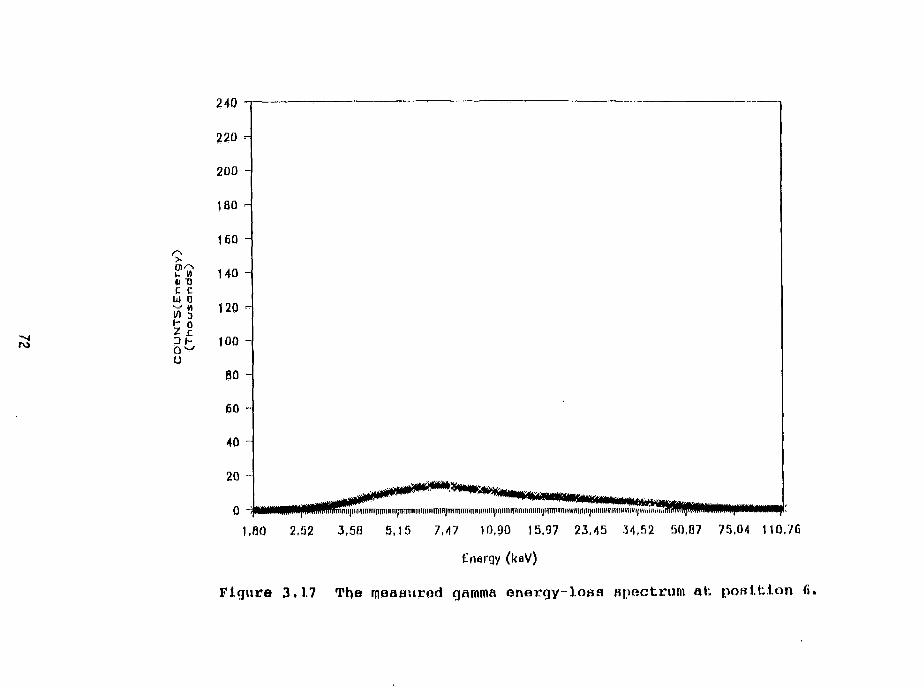
r\
?9c cWO
u
240
220
200 -
180 -
160 -
140 -
120 -
30
60 -
40 -
20 -
1,80 2,52 3,50 5,15 7,47 10,90 15,97 23,45 34,52 50,07 75.04 110.76
Energy (kaV)
Figure 3.17 The measured gamma energy-loss Bpectrum aU position fi.
3.8 Sunmaxy
Gamna heating was measured in the fill gas uf a proportional
counter which, was placed in a low-Z lattice and irradiated fay a mixed
gamma and fast neutron source. The methodology developed in Sections
3.4 and 3.5 enabled energy calibration of the detector and signal
separation of the counter output. The utility of the CBA mode of
proportional counter operation was demonstrated.
The gamma heating in the counter wall material and the
surrounding materials in the lattice can now be found if the
appropriate <l/f> factors are known. The <l/f> factor can be
calculated b^ applying the methodology for determining mass stopping
powers discussed in Chapter 2 to this experiment. These calculations
are presented in Chapter 4.
4. Calculation of the <l/f> Factors
The experiment was modelled numerically to derive the <l/f>
factor for the proportional counter used in the low-Z lattice. The
<l/f> factor, within the framework of cavity theory provide the means
to estimate the gamma heating for the counter wall material from the
measured heating in the counter fill gas. The results of these
calculations are presented, and the: limitations: of these calculation
are discussed.
4.1 Problem Description
The measured gamma heating values presented in Chapter 3 were
for heating in the counter fill gas. However, it is the ganca
heating in the surrounding wall material that is desired. For this
particular application where the wall of the proportional counter was
sufficiently thick to isolate the fill gas; from electrons: produced in
the MgC lattice, and where the fill gas density was kept sufficiently
low so that the majority of the electrons that lost energy to the
fill gas were produced fay gamma interactions in the wall of the
counter, under such circumstances small cavity theory applies. The
relationship between the measured heating in the fill gas and the
heating in the wall material can be found fro* a calculation of the
<l/f> factor for the fill gas and the wall material.
The direct and most physically correct method for calculating
the <l/f> factor requires the solution of a three-fold coupled
74
transport calculation: the propagation of neutrons through the bulk
material and the associated propagation of the charged particle
distribution generated fay these neutrons as they interact in the
counter wall material, the creation of garana rays: through, neutron
interactions and the propagation of these gamma rays in the bulk
material, and finally the propagation of the secondary electron
distribution generated in the counter wall material by the ganna
rays., The calculated charged particle distributions are then folded
in with, tabulated (or calculated); mass stopping power data for
materials of interest, referenced by charged particle energy to form.
the <l/f> factor for the counter wall material and the fill gas. The
<l/f> factor is found by taking the ratio of the mass stopping power
of Fe to the composite mass stopping power of the Ar and CQ2 mixture
and then averaging this recoil electron energy dependent term over
the source recoil electron spectrum. The requirements: for carrying
out the direct method of calculation for the <l/f> factor are:: (1) an
algorithm for solving the coupled neutron-gamma-secondary charged
particle transport problem, (2} tabulated mass stopping power data
for- the materials: of interest referenced by charged particle energy
or, (3) a computational model that calculates mass stopping powers
for any given material.,
The implementation of the direct method involves rather
sophisticated computational tools. However, with a few simplifying
assumptions, a calculation of the <l/f> factors was attempted.
The first simplifying assumption was: to ignore the neutron
induced charged particles:. In the actual experiment the neutron
75
induced signals (charged particle energy loss tracks} were removed as
It was the rjayrv* induced heating that was measured. This assumption
has the net effect of eliminating the calculation for charged
particle production due to direct neutron interactions and their
propagation {transport}. The calculation is then reduced to the
solution of the coupled gamma and electron transport problem in the
bulk and counter wall material.
The second assumption made was that the secondary electron
distribution observed by the fill gas is due only to ganma
interactions with the counter wall material. This implicitly assumes
that, the electrons generated outside the counter wall in the bulk
material do not penetrate the counter wall and that there are no
contributions to the electron distribution for ganma interactions
with the fill gas;. Basically, Bragg-Gray conditions for the counter
are assumed. This assumption effectively de-couples the electron
transport problem from the gamma transport problem. All that is
necessary to- calculate the electron distribution for the counter are
a value for the ganma flux at the counter position and an electron
emission model for gamma ray interaction in the counter wall
material.
At this point a second method of solution for finding the <l/f>
factor is possible. The spectrum-averaged mass stopping power as a
function of initial gamma ray energy have been tabulated for various
materials, most notably tissue and bone equivalent, materials. If
such data exist for iron, argon and carbon dioxide, the respective
spectrum-averaged mass stopping powers and the <l/f> factor can be
76
found by sunning the product of the gamma flux and the tabulated
data. The answer is only approximate, as all the mass stopping
powers should be averaged over the electron spectrum arising from
gamma interactions in the countar wall material (iron), whereas the
tabulated averaged mass stopping power data indexed by gamma energy
for each material are averaged over the electron spectrum arising
from gamma interactions with each raaterial.
A third method of solution is possible if one is willing to
make one more assumption about the interaction process. This third
assumption is that the electron distribution produced through gamma
interactions with the wall material are due to Compton scattering
only, ignoring the contributions from pair production and the photo
electric effect. This assumption can be justified as most of the
gamma rays in the experiment are of energy less than 2 MeV and the
wall nwfprfaT (iron) is of medium-Z. In this energy region for this
material the dominant gamma interaction mechanism is Compton
scattering. Having made this assumption, the distribution of
electrons with respect to electron energy T arising from Coopton
scatter with a gamma ray of energy h*- can be solved for by taking the
sum of the products of the Klein-Nishina expression for the recoil
electron distribution with respect to electron energy for an
initiating photon of energy hr, and the gamma flux at energy hv. The
recoil electron distribution for a gamma ray of energy hv interacting
with material Z in a Compton scatter as expressed in the Klein-
Nishina formulation was given in Equation 2.5:
77
dS
where:
511. C
r is the classical electron cr&it radius C2.S13xlC~~ cai},
Z is the atonic manber of the target atan,
T is the energy of the recoil electron.
Recall that Equation 2.3
NlEi,1",*} = r(Si,X) ^ ,
gives trie Oanptcrx recoil electron distriixrticjn at position. (X) f-r
ganoa rays of energy E _. Extending Equation 2.3 for the <y»n*»r*T case
of a gama spectrum, the resultant Canptcn source recoil electron
distritution at position (X) ( A(Sj_,T,X) } is the sum of the product
of the recoil electron distribution [ ^ z£ and the normalir.ed
ganna flux [r(EifX)I:
The PORnWH p£Oji.dBi TDIST.EOR was used ts calcalate A(E^,T,X1, and it
is presented in appendix C
Recall from the discussion in section 2.2 that the <l/f> factcr
is given ny Equation 2.IS:
.1 dT
c10
The <•£> factor for each counter position in the MgC lattice was
by substituting A(E£,T,X) for ACEj,,TcJ in Equation 2.IS. The
integrals in the above expression were found numerically using
Siapson's role- Simpson's rule is:
I s ( f ) [ F(Tfl)+F(T11)44F(TQd[i)+2F(T^reBJI. (4.2):
I is the approximate value of the integral,
AT is the width of the energy interval between points,
F(T) is the value of the integrand at point T.
The three functions F (TJ in the Siaopson's rule formulation for this
application are:
F2(T) = TQ*A(Ei,T,X) , (4.4J
F3(T) =
where
(4.6!
79
with TQ = Q, TQ, the upper iiaiit of the integral in Equation 2.16
replaced fay T n = E(,,^ ) - The FORTRAN program SPAS4.FCR msec for
these calculations is presented in Appendix D.
It is possible to infer the heating in. the surrounding bulk
material if the mass weighted KEHMA distributions are known for both
the counter wall and the surrounding bulk matPt fsIs in the same
irradiation spectrum. The ratios formed by the mass-weighted SZSSR
distributions of the surrounding bulk materials (Mg and CJ and the
mass-weighted XEHMA distribution for the counter wall material serve
as an indication of the dose to the bulk nCT*-«arrqT«g (assuming that the
energy-loss mechanisms do not significantly differ) relative to the
dose in the counter wall material.
To calculate the game-induced HEHMA. of a given material, one
must know the gamma spectrum to which it is exposed,, the charged,
particle production cross sections for that material, and the
associated charged particle energy distribution for each type of
interaction. The KERMA at any location in the radiation field is;
just the sum over all energies of the product of the energy averaged
gamna spectrum, the charged particle generation cross sections and
the sum over energy of the resultant charged particle energy
distribution.35,37,38 •stis is expressed mathe«aticaily as:
Etop5EBMA{X} = T r(E';E,X)*Tav.{cr) (4.7)
E=0
80
this is just a generalization of Equation 2.7, ir. which T{E,X] the
number of gamma ray cf energy E is replaced by the sun F(E' ;E,Xj and
summed over all gamma ray energies. The sum r(E';E,X) is given by:
pr<E';E,X) = I *(E±,X) flh^CEiJ PgCE^E^Ei, (4.8J
where Pg(Ei;E') is the gamna emission distribution for as. initial
neutron of kinetic energy ET_.
Recall from Chapter 2 that the dominant gpy* interaction
mechanism for material of Z less than 30 and gamma rays of energies
between 300 keV and 6 MeV is Compton scattering and that the Klein-
Nishina theory is sufficient for determining the Compton cross
sections.6 The average energy of the associated recoil electron
distribution can also be calculated on a per target electron basis
from the Klein-Nishina expressions for Compton scattering. A FCRSRAN
program KNISH was written to perform these calculations. A listing
of KNISH appears as Appendix E.
The gamma spectrum in the MgC lattice must be known for the
KEBMA distributions and the <l/f> factor to be calculated. A direct
measurement of the gamma spectrum in the MgC lattice was not
possible; the proportional counter was set up for energy-loss
measurements, and other detectors (Ge-Li and Nal)39 have high
sensitivity to the neutron component of the total spectrum. A
calculation of the gamma spectrum in the MgC lattice was then
necessary. As the sensitive volume of the counter was aligned with
the beam line of the neutron, generator, the problem can be viewed
roughly as a source propagation problem through a slab cf material in
one dimension. A discrete ordinates treatment of the transport
problem in one dimension was used to model the experiment.
The experiment was modelled in the following manner. (1) A 14
SfeV neutron propagation problem in a thin iron slab was implemented
to simulate the neutron attenuation and gawia production that occurs
in the stainless steel cup that holds the tritiated target fell in.
the deuterium beam line of the neutron generator. (2J The resulting
neutron and rpiniH spectra are then each multiplied the factor
(50* g 2 to account far the geometric dispersion between the target
and the front face of the lattice, and are then used as input source
terms for a neutron and gamma propagation problem through a 6C car
thick slab of magnesium and graphite in homogeneous mixture. The
attenuation in air was neglected. (3} Once the gamma spectrum in
the low-Z slab was calculated, the Compton recoil electron
distributions for iron and the fill gas, as well as the KEBMA
distributions for iron, magnesium, and graphite at the six counter
positions were solved for. Consequently the <l/f> factor and the
ratios of relative dose commitment were found for the materials in
the MgC lattice.
4.2 The Numerical Model and the Nuclear Data Used
The numerical modelling tool used for this project was
ASISN/PC.26 ANISN/PC solves a discretized approximation tc the
82
Boitzmann transport equation in one dimension. ANISN/PC car. solve
fluence rate propagation and eigenvalue search problems in one-
dimensional slab, cylindrical or spherical geometry. Specifically
ANISN/PC treats the energy dependent variables as grcup averaged
quantities and it accounts for the angular dependence by using a
finite set of angular quadratures. This code package is written in
FORTRAN and was adapted for a micro-computer from the code
The cross section set used in these calculations were formed by
weighting the cross section data extracted from, the ENDF/3-V nuclear
data library with a flux distribution formed by the propagation of 14
MeV neutrons through a slab of the nudides of interest. This was
done by using the neutron cross section data processing utility MC2-
2.42 SC2-2 is a FORTRAN program that permits the user to extract
material-indexed neutron interaction data from the ENDF/B-V data
library, weights the data with the fluence rate distribution of the
user's choice and writes the binned data to an output file in ISOTXS
format.2^'41 The process involves setting up a 14 MeV neutron source
propagation problem in MC2-2 and then instructing MC2-2 to use the
resulting fluence rate distribution to weight the neutron cross
section data for each isotope of interest. The energy group
structure of the output is defined by the user in the MC2-2 input
deck.
Using MC2-2, neutron interaction cross sections were generated
for iron (Fe) in a 5 mi thick Fe slab, and magnesium (Mg) and
graphite {12C) in a 60 cm thick C and S*j slab at the atomic densities
83
corresponding to that of the material in the target and lattice- The
energy group structure defined for these sets were 21 equal lethargy
groups each Q.5 lethargy units wide starting at the top energy of the
cross section library (available to MC2-2}, E = 14-IS MeV to a low
energy limit of Q.Q eV. Table 4.1 gives the correspondence between
the upper energy limit of each lethargy group and the group number.
The weighting spectrum calculated by MZ^-2 consisted of a sharp peak
in the top group, and near zero elsewhere. The weighting spectrum.
for Mg and C is given in Figure 4.1.
The drawback with MC^-Z is that it does not have the capability
to generate coupled neutron and gamma cross sections. The gamma
cross sections used in the heating calculations were taken from the
ELUNGP photon cross section library.26,43 The ganma production cross
sections were tabulated for each material at each energy group using
MC?-2. The gamma spectrum for each material was constructed by
taking the sum aver all neutron energies of the product of the
neutron fluence rate, the game production cross section and the
gamma emission distribution for each interaction. This expression
was given by Equation 4.8:
EtopT(E';E,X) = I *(EifX) <rn,g(Ei)
EQ *
where Pg(Ej:;Er) is the ganna emission distribution for an initial
neutron of kinetic energy Ej_. The qaama. emission distributions were
extracted from file 15 of the EH3F/B-V data library.43
84
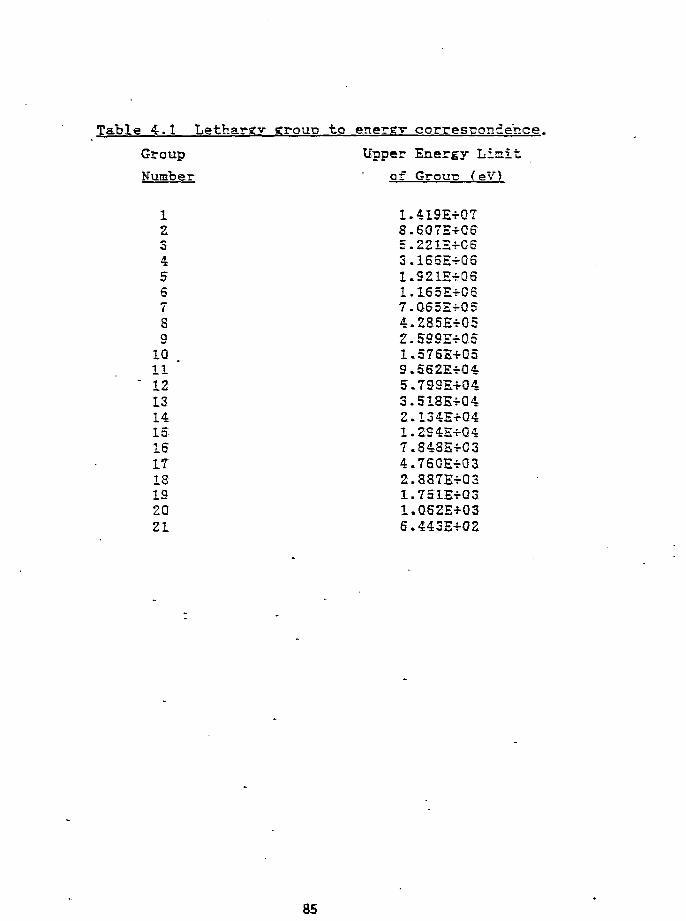
Table 4.1 Lethargy grout? to energy correspondence.
Group Upper Energy Limit
Number " of Group (eV)
1 1.419E+G72 8.6O7S-S-QS3 5.221E-=-C£4 3.1S6E+G65 1.921E+066 1.165E-rO67 7.Q65E-S-058 4.285E*Q59 2.59SE-fO51Q 1.57SE+Q511 * 9..562E+G4-
' 12 5.T99E+Q413 3.518E+Q414 2.134E*Q415 1.2S4ETQ4
16 7.848E+0317 4.760E+Q3IS 2.887E+Q319 1.751E*Q320 l.QS2ExO321 6.443E+02
85
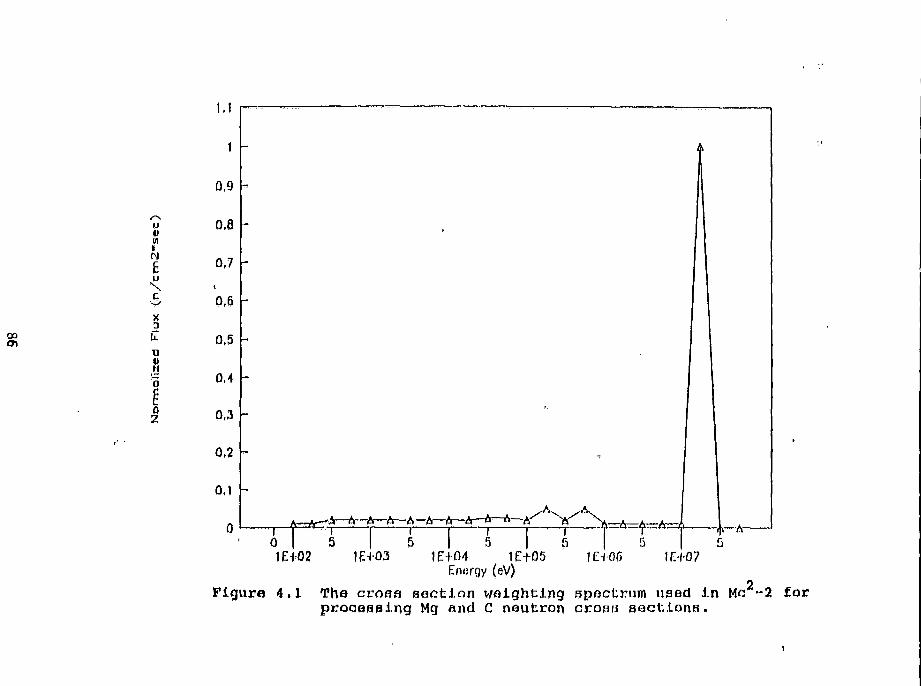
g•IVI
EuNxCu8o
§0
z
0 | 51EH02 1F.I03 1E+04 1E+05
Energy (eV)1EI06 1E+07
Figure 4.1 The cvoaa section weighting spectrum used in Me -2 forprocessing Mg and C neutron crosr* sections.
4.3 Setup and Execution of the Numerical Simulation
Having used MC2-2 to obtain neutron interaction cross sections
for iron, magnesium, and graphite (^C), ANISN/PC was used to
calculate the gamma spectrum, in the low-Z lattice. As outline in
Section 4.1, the problem is treated in four parts: a neutron
propagation problem through an iron slab whose solution is taken as
the source term for the second part, a ynr"* and neutron propagation
problem through a homogeneous magnesium and graphite mixture, which
in. turn is used in a <l/f> factor calculation for the fill gas and
wall material and a calculation of the average KEHMA for the
materials in the MgC lattice.
The propagation of 14 MeV neutrons through a 5 ram thick iron
siai) was calculated with ANISN/PC. The problem was structured as; the
propagation of 14 MeV neutrons front a mono-energetic neutron source
through a 5 mm thick slab of Fe. Iron cross; sections for a- P3
Legendre expansion treatment of the scattering was used. A £
quadrature set emphasizing forward scattering was used. The
production cross sections were treated as activity cross sections on
a group by group basis. The resulting ANISN/PC output provided the
reaction rates per energy group for gaana production in the iron slab
and the source neutron spectrum for the neutron propagation problem
in the magnesium and graphite lattice. The game emission spectrum
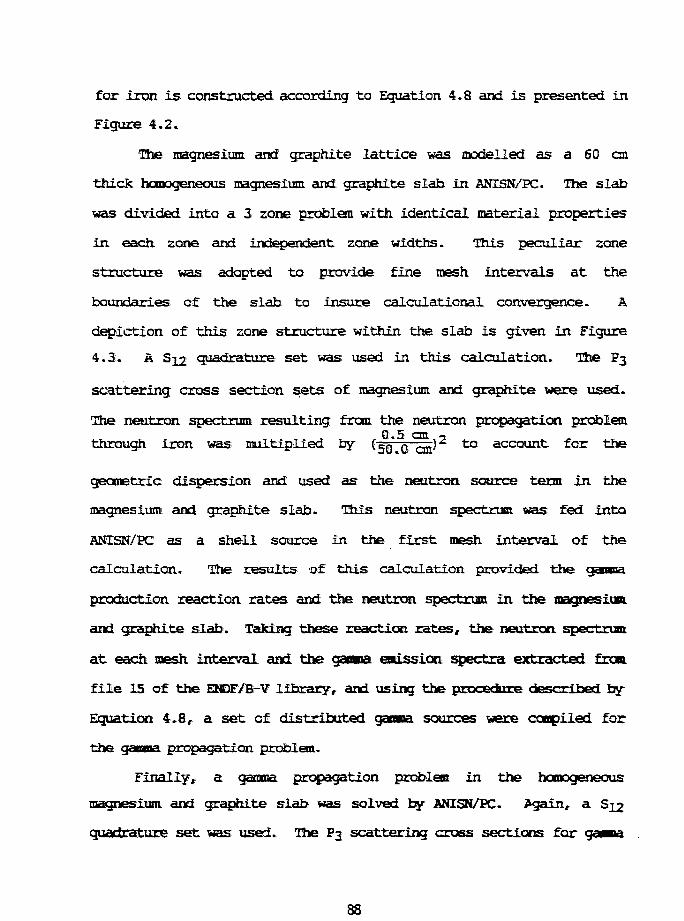
for iron is constructed according to Equation 4.8 and is presented in
Figure 4.2.
The magnesium and graphite lattice was modelled as a 60 cm
thick homogeneous magnesium, and graphite slab in ANISN/PC. The slab
was divided into a 3 zone probleni with identical material properties
in each zone and independent zone widths. This peculiar zone
structure was; adapted to provide fine mesh intervals at the
boundaries of the slab to insure calculational convergence. A
depiction of this zone structure within the slab is given in Figure
4.3. H S]_2 quadrature set was: used in this calculation. The P3
scattering cross section sets: of magnesium, and graphite were used.
The neutron spectrum resulting from, the neutron propagation probleniQ.,5 cm 1
through iron was; multiplied by (50 0 cm) t o a c C Q u n t f o r t*^
geometric dispersion and used as the neutron source tens in the
magnesium and graphite slab. This neutron spectrum was fed into
MISN/PC as a shell source in the first mesh interval of the
calculation. The results of this calculation provided the ganma
production reaction rates and the neutron spectrum, in the magnesium
and graphite slab. Taking; these reaction rates, the neutron spectrum
at each mesh interval and the gaona emission spectra extracted, frcn
file 15 of the ENDF/B-V library, and using the procedure described by
Equation 4.8, a set of distributed gamma sources were compiled for
the gamre propagation problem.
Finally, a gamma propagation problem in the homogeneous
magnesium and graphite slab was solved by ANISN/PC. Again, a
quadrature set was used. The P3 scattering cross sections for
88
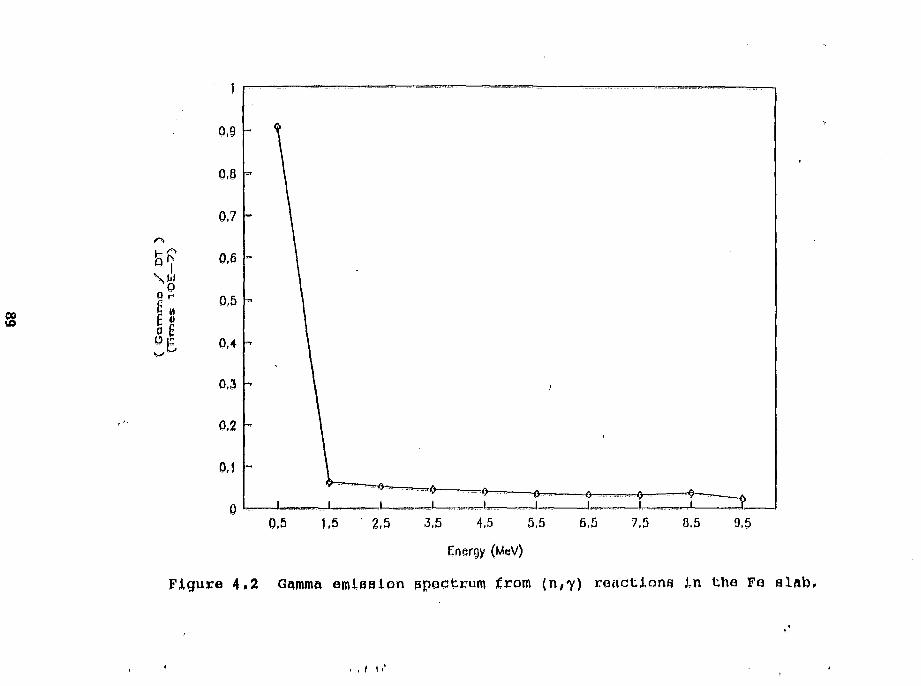
80 r
|
0,5 1,5 ' 2,5 3,5 4,5 5,5 6,5 7.5 0,5 9,5
Energy (MeV)
Figure 4,2 Gamma emission spectrum from (n,7) reactions In the Fe slab.
I , I 11'
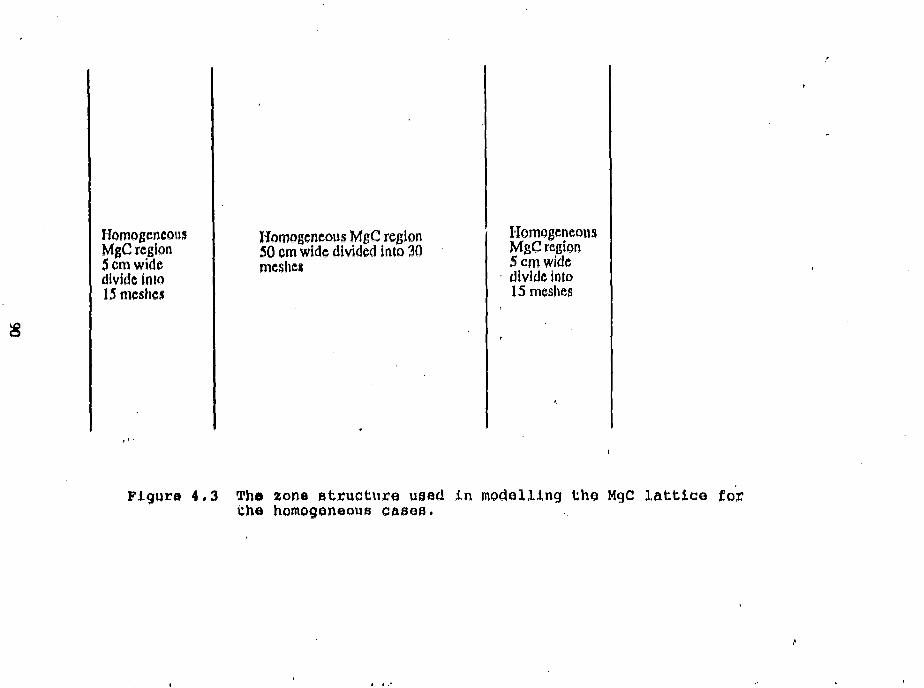
HomogeneousMgC region5 cm widedivide into15 meshes
Homogeneous MgC region50 cm wide divided into 30meshes
HomogeneousMgC region5 cm widedivide into15 meshes
4.3 Tha zone structure used in modelling the MgC lattice forthe homogeneous cases.
ray interaction in magnesium and graphite were extracted from the
FLUNGP photon cross section library. The zone and mesh structure
depicted in Figure 4.3 was used.
4.4 Results of the Numerical Analysis
The results of the calculations are presented as data plots in
this section. All data are normalized on a source UT reaction and
unit time basis except where noted.
The propagation and interaction of the OT source neutrons in
the SS304 cup that holds the tritiated target in place was modelled
by considering the propagation of UT neutrons through a 5 inn thick
iron slab. The neutron source was characterized as a mono-energetic
neutron source in the top energy interval of the cross-section
library. The calculated neutron spectrum in the fifth interval0.5 cm t
divided by the geometric dispersion factor (5Q Q on) is taken as the
input neutron source for subsequent neutron calculations in the
magnesium and graphite lattice. This modified neutron spectrum is
plotted in Figure 4.4. The yjuBki spectrum was constructed by
multiplying the neutron spectrum in the last mesh interval by the
gaona production cross-sections in each energy group and then sunming
the product of this and the ganma emission probabilities for each
group, this procedure was presented aathfatically in Equation 4.8.
This gaona spectrum, divided by the geometric dispersion factor0.5 cm ->
^50.0 en) w a s u s e d a s t h e <&aaBi source spectrum for the MgC lattice
analysis, and it is presented in Figure 4.5.
91
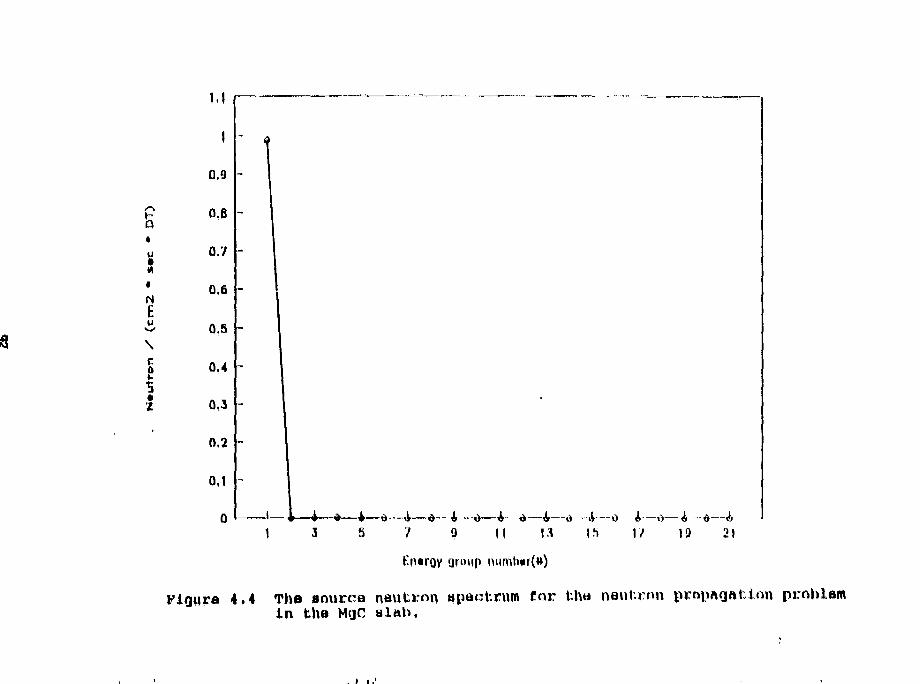
U
u
\
0
1
1.1
1
0,9
0.8
0.7
0,6
0.5
0.4
0,3
0.2
0.1
7 9 II 13
Kntrgy group numhir(«)
15 VI 19 21
Figure 4,4 The aourna neutron spectrum for the neutron propagation problemin the Mgc slab,
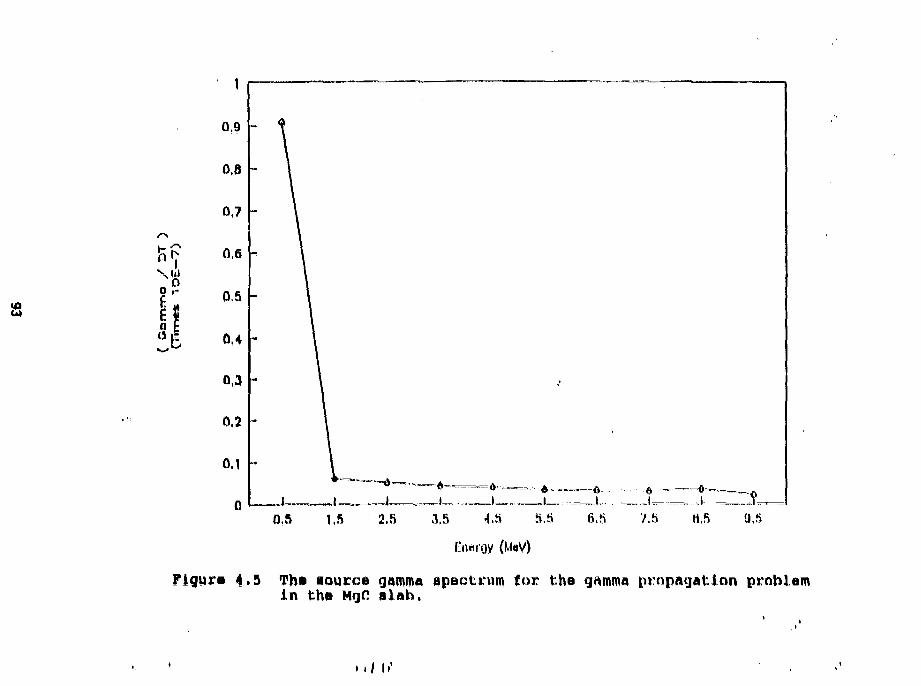
1
0.9
0.8
0,7
0.6
0.5
0.4
0.3
0,2
0.1
00.5 1,5 2.5 3,5 4.5 5.5 6.8 /.5 H,5 U.5
Energy (MeV)
Figure 4.5 The source gamma apectrum for the gamma propagation problemin the MgC slab.
Using the neutron spectrum derived in. the target, cup
calculations, the propagation of nestrons through the MgC lattice was
examined with JWISK/PC. The resulting neutron, distribution is
in Figure 4.6. Figures 4.7 and 4.8 represent the neutron
spectrum measured at the front (Fig. 4.7} and back (Fig. 4.8} of the
MgC lattice with a BC 5C1 counter. It is clearly seen from a
caparison of these three figures, that the calctzlated result, over-
estimates the neutron distribatian in. the lattice. The gamma
production in. the MgC lattice was derived by the same methodology
that was used to derive the gamma spectrum of the target cop. The
i-gfriT q-t-crf gamna producticn in. the MgC lattice was used as a
distributed source term for the gamma calculation. No plot cf the
tatnlatpti gamma production in the MgC lattice is attempted as it.
would be necessary to plot the gamma energy emission, spectra at each
position.
The gamma spectrum was binned into ten equal energy groups,
from 1 HeV to 1Q MeV. The gamma ^pr»-*"nm r**-*in*** in the target 0 9
calculation "tff nyn as an input shell *«»irn* to the ommmi
propagation problem. The gamma emission spectra obtained in the
neutron propagation problem Mere used as distributed sources in the
gaon propagation problem. The rnlcnTateri gmmmn spectra far the six
mesh positions < «<i r»— imriinrj to the six detector placement, positions
are presented in Figure 4.9. The outstanding features of these
spectra are the intensity of the IJ 1 1 1 IJJ 1 under 1 MeV { iron has a
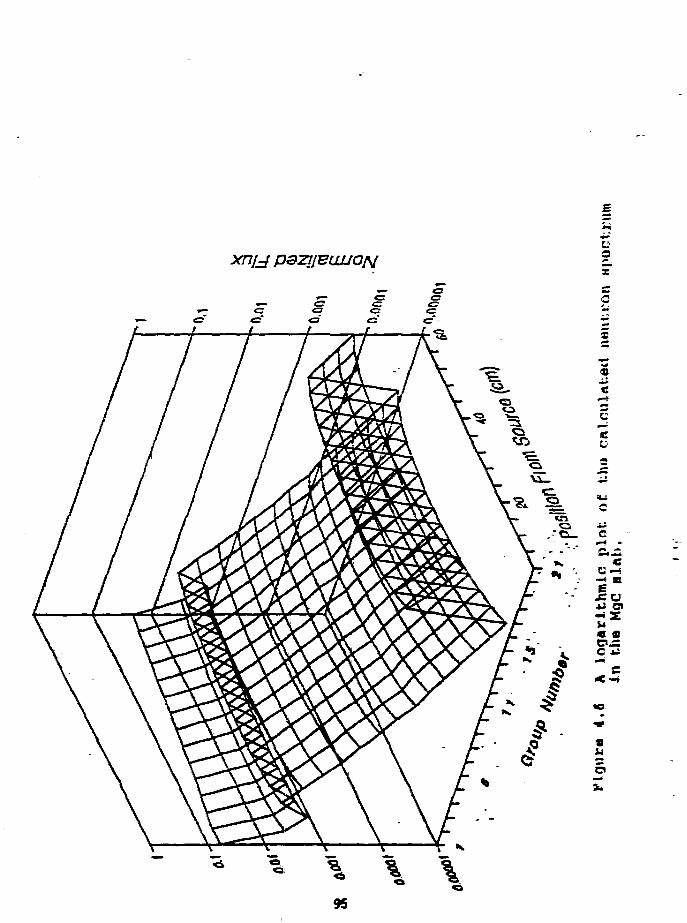
XHLJ P3Z7/BLUJaj\f a
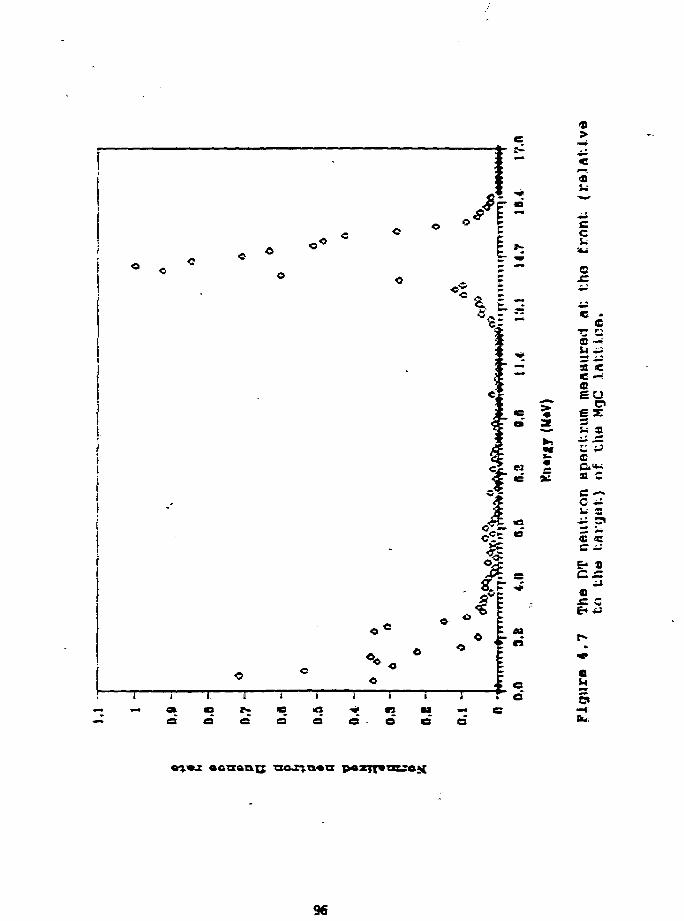
m>
"3
eu
e
ec
IB - ?
5 «c ~
— U IB
*C aa c
c —O iiU 8
c cc —E* *
ec z
e a5
96
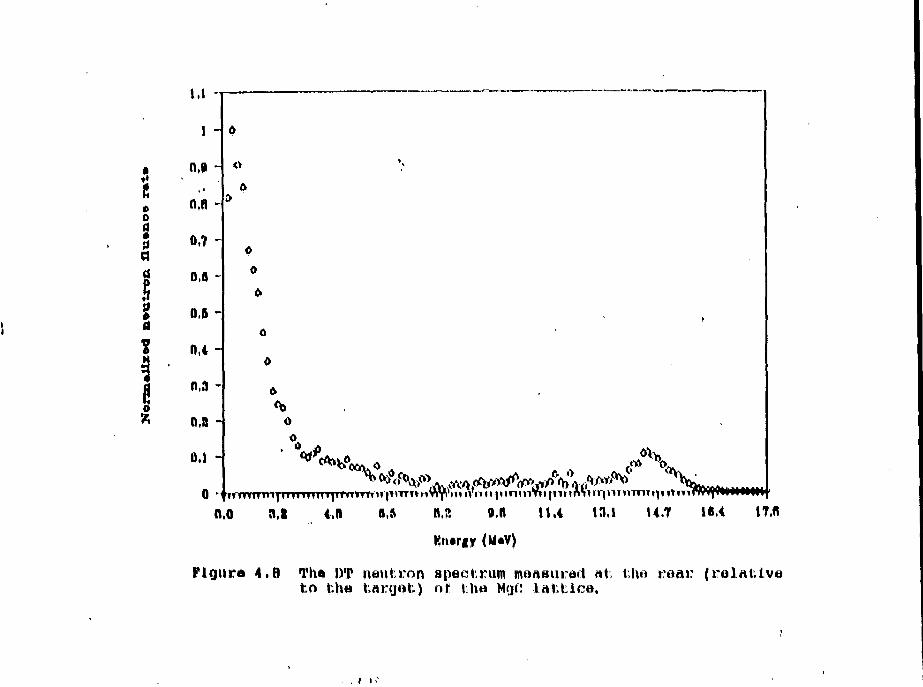
C0
8
s
1,1
1 -
O.fl -
0,7 -
O.fl -
0,5 -
0,4 -
0,9 "
Q.B
0,1
0
<>
6
0
6
0.
0,0 3,t
TTtirptTTf rn Wp'm ivn»rpinmTii p n i Ail nj t u inrmyi n n *
i.0
ITH|Mlinil
R,s o.n u.4
Kuargy (MtV)
14,7 lfl.4
Figure 4.8 The !)T neutron spectrum moasured n\ \)\a ram: (relativeto the targat) oj tha Mgfi latUlca,
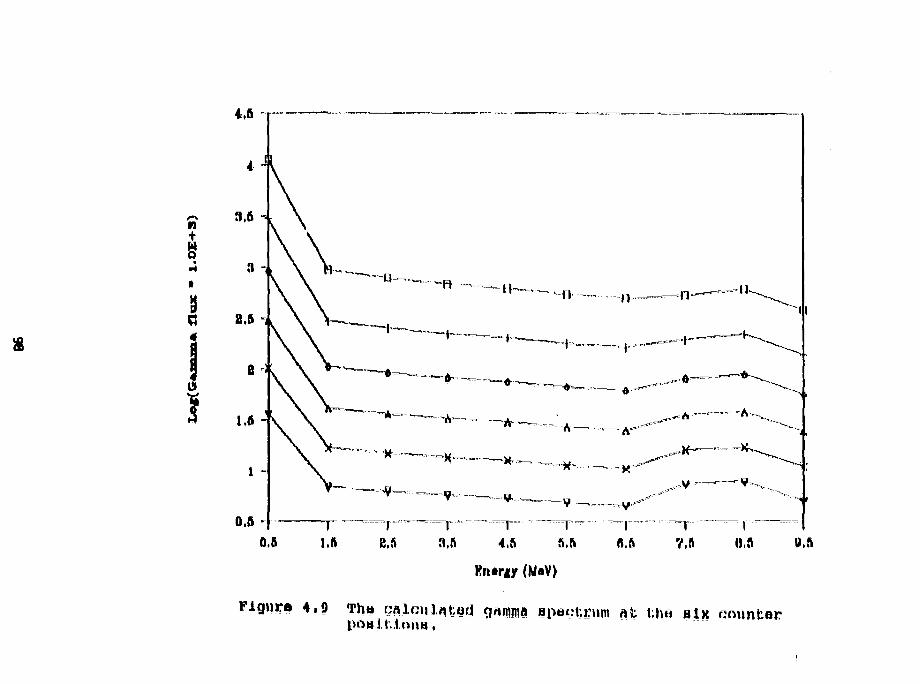
n
8
I
S,R ft.ft V.ft
4,9 Tha caiculgUad garoma spectrum f\t tposit.,! ona. six nountar
strong gaunt line at 850 iceV and annihilation radiation at 511 KeV}
and snail but significant contributions up to 9 MeV.
Having solved far the garaa propagation, in the slab, the
spectrun averaged mass stopping powers for the fill gas and the
counter wall material were salved for according tc the
outlined in Section 4.1. The mass stopping powers for electrons in
Fe and the fill gas were interpolated fron. table 12.4 cf the ICHJ
Report 37.^5 -^e calculated source Conpton reccil electron spectra
for the six counter positions are presented in Figures 4.10 through.
Figure 4.15. The discontinuities in these figures result from the
coarse energy group structure used in the ganaa calculations. A plot
of the value of ^ (Equation 2.15) as a function cf source electron
energy is given in Figure 4.16.
The mass-weighted KEBMA distributions for the counter wall
ma-h T-faT (Fe) and the surrounding mat trials {Mj and C) were found by
taking the sum over all energy groups of the product of the gaaaa
flux, the material mass density (kg/atom), the Goapton cross section
for that material and the recoil electrons' euexgy as outlined in
Equation 2.6 and Bauation 4.7. From these KEML distributions, the
relative dose i i — T > »• nr ratios of Hj to Fe and C to Fe were foraed
throughout the assembly for relating heating in the im>y,uy^vT M»TT to
that of the surrounding •«*•»)•** T«- These ratios were faraed by
dividing the Mg and C KFJ9A distributions by the Fe KFJMk
distribution at each •esh.
Recall froK Section 2.2, that a check of the <l/f> factor
calculations was proposed" by having the proportional counter
99
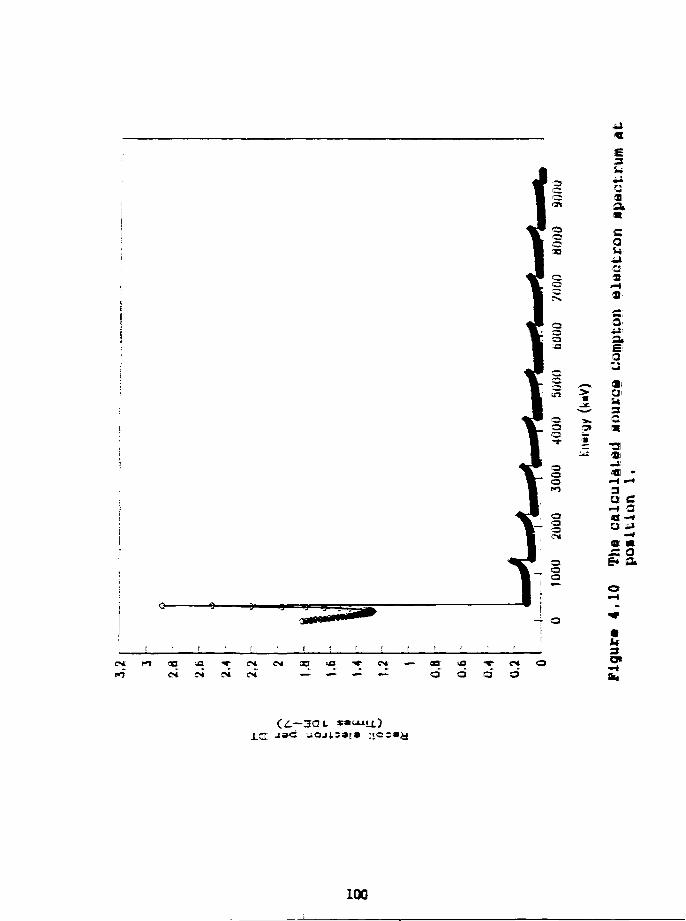
o
oQ30
C2
a
Qa
cX I
oaa• f
aa
aa
aa
—
7"2a>
caua
•HI.
5'- Ja.E;O'CJi
anU'i *31GOR
"319 '- J
*HI ^43!U: C^ * O
d **s. ae* ak
233a
100
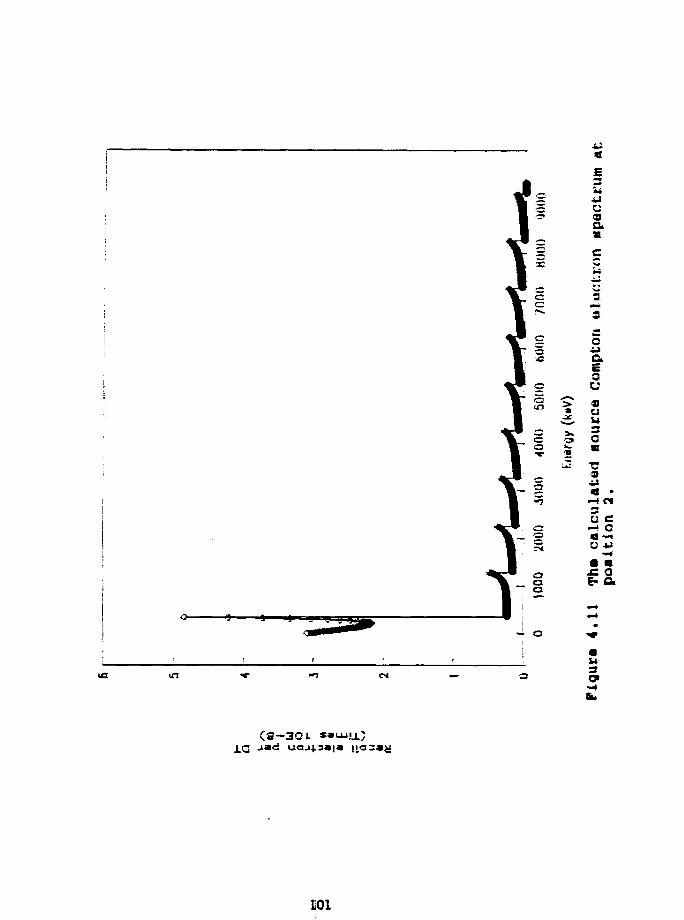
E3
aaec3
9
cao
>" a» a
3C
"«• 2
i n
u c~* o
—«• •£ a
143
CS-3OL
101
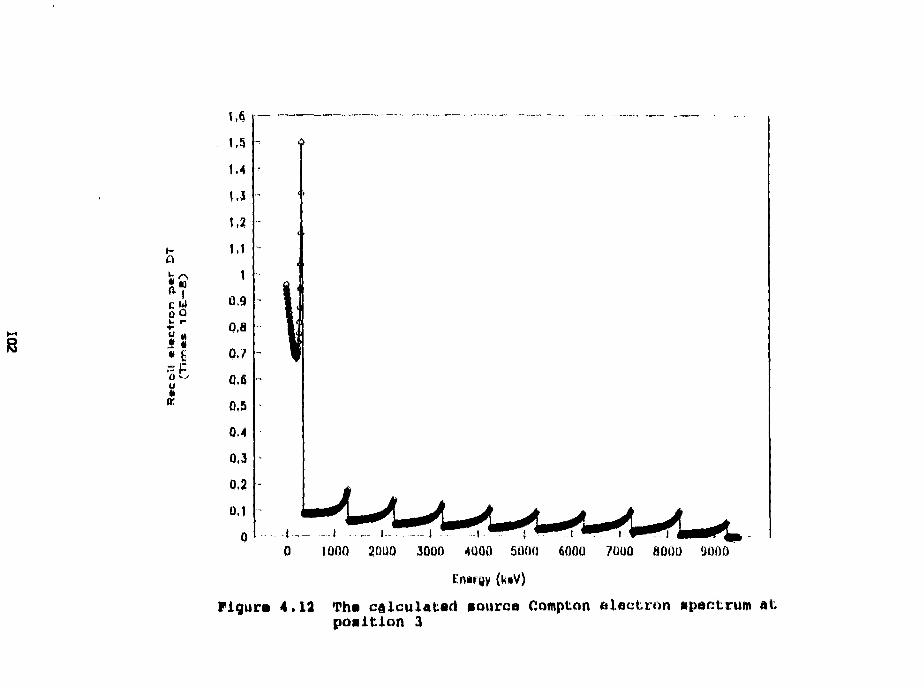
• «
"Iu*IK
1,6
1.5
1.4
1,3
1,2
1.1
1
0,9
0,7
0,6
0,5
0,4
0,3
0,2
0.1
0 1000 2000 3000 4000 5000 6000 7000 8000 0000
Enargy (ktV)
Figum 4.13 Th« calculated source Compton electron spectrum atposition 3
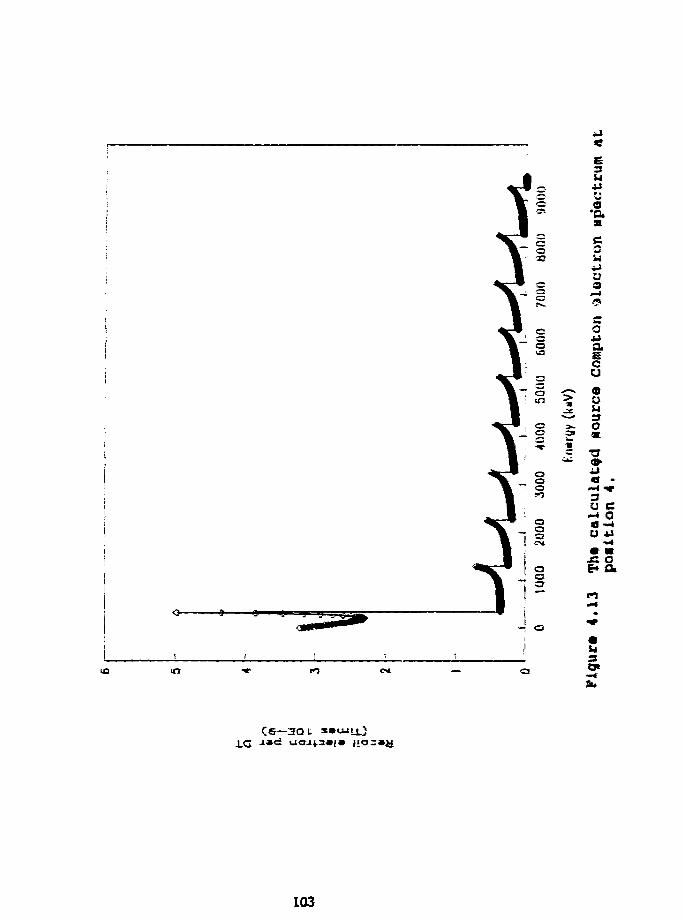
ac
e»
000
X)
oc
o8a
aa.at o
aoo
oo
2000
aaS3
*c
B3
*iUa"ft•co!4
ua<?
coi J
auao3O*
•a
« -3a c-i aa -i
-•4
• •J : O£* Q.
(43
C6—3Qt
103
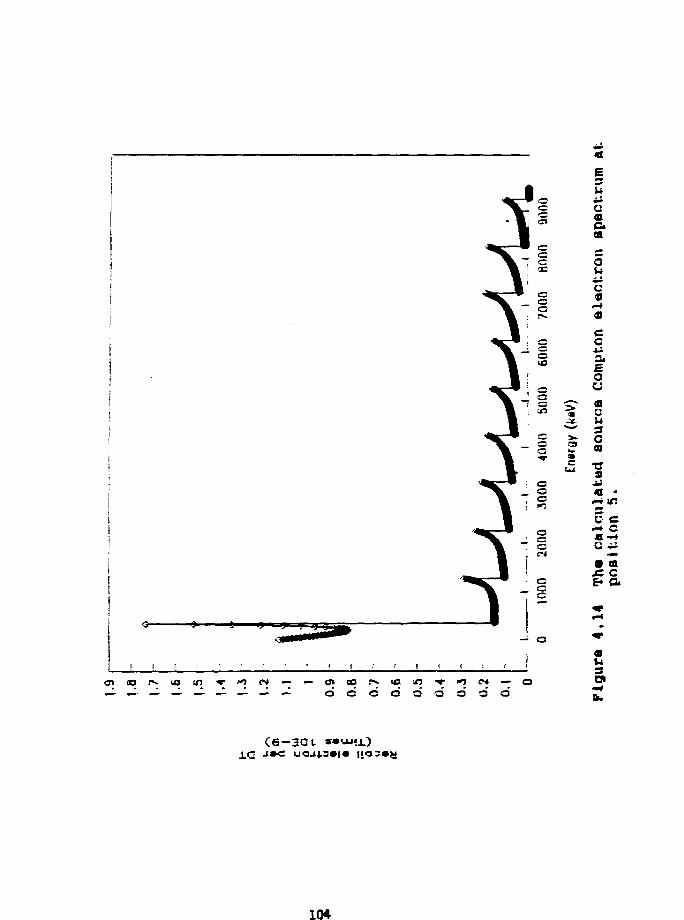
•u
m
e
a
a
ISm
eca.oc
- ^ 9m U
^ M
** O
5 -a
5 e-4 Ca-4
ac
— a
i i i t
03 !"-d o o a d a d a d
at
(6—3OL
104
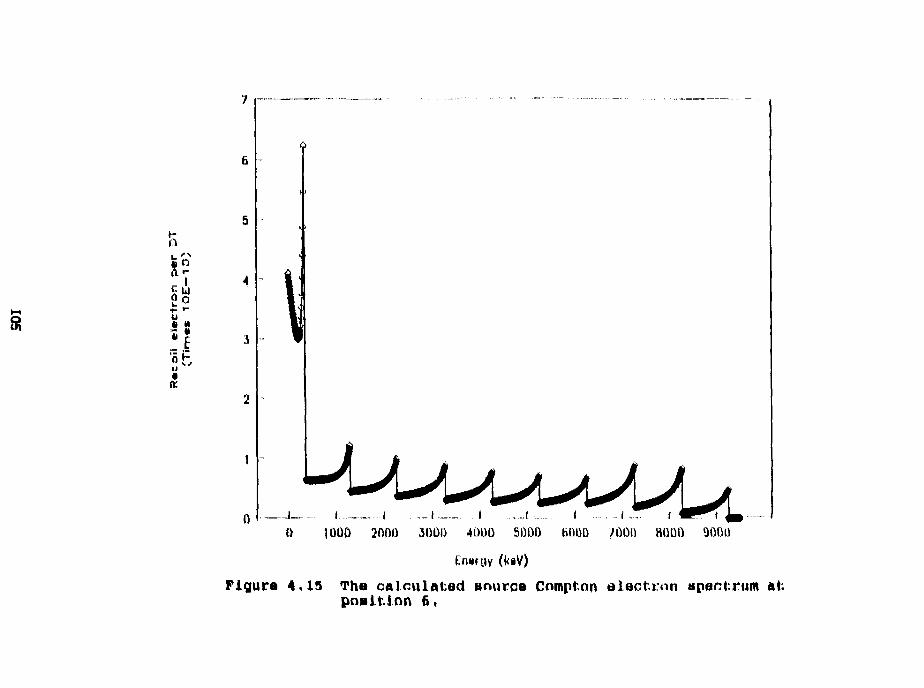
7
0 1000 2000 3000 4000 SOOO 6000 7000 HOOO 9000
Energy (kiV)
Flgura 4.15 The calculnted anurce Compton elentron apsctrum atposition 6,
physically satisfy the requirements of Fane's theorem (i.e. natch the
effective Z of the counter fill gas to the Z of the counter wall
material). The <l/f> factor for Materials satisfying Fane's theorem
is 1.0. Fran Figure 4.17, the <L/f> factor far Fe (the counter wall
material) and the fill gas is nearly l.Q everywhere ir. the lattice.
This indicates that the calculations were correct (or at least
consistent). The estimated gamma heating values for Fe, 5*j and C are
presented in Table 4.2.
4.5 Sensitivity Analysis far Different Material
In the calculation for the neutron propagation through the MgC
lattice, the ma-t-or-i*7 composition was asstwert hoaogeneous. This
assumption was made as the magnesium constituted ^ » " « ? f»f-<»T y 10% of
the mass of the lattice. This assumption may have significantly
influenced the neutron spectrum in the lattice, and hence changed the
strength of the distributed gamma sources used in the gamma
g.'t!.Ion.
was nade with AlHSf/PC, with the MgC lattice JLqjM»wH fri as a 25
zone hrtTTHij' m run slab. The iBBtenal composition and zone structure
of the heterogeneous slab are shown in Figure 4.IS. The results of
this calculation and the results ff"" the homogeneous calculation are
presented in figures 4.19 through 4.24.
The two features of these plots that stand out are: (1) they
all have the same general shape, and (2) the neutron flux for both
basically passed through the MgC slabs in these calculations.
106
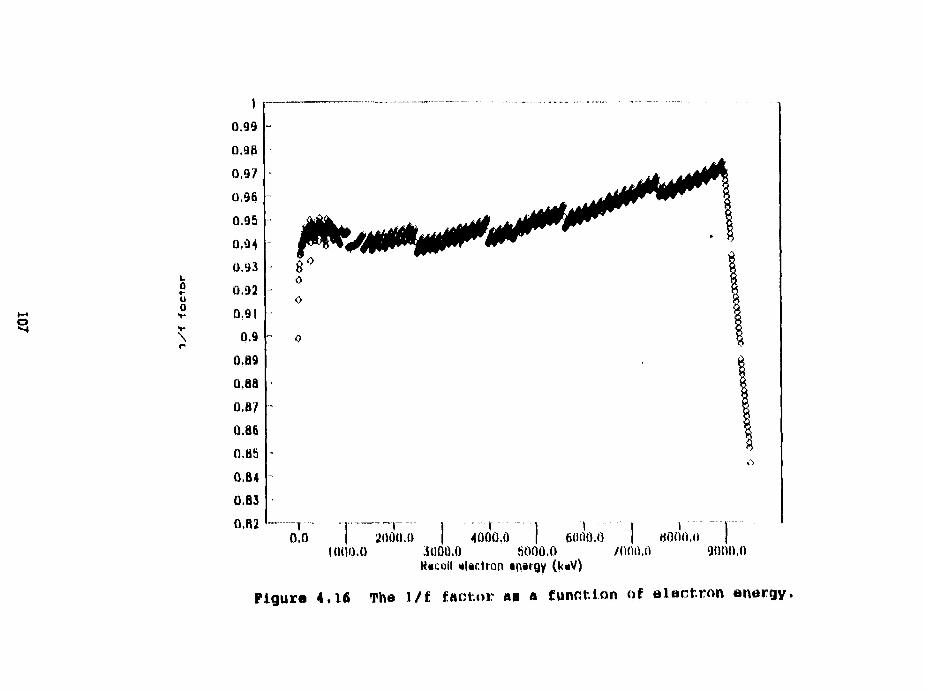
0u0
V
10.99
0,98
0.9?
0,96
0.95
0.94
0.93
0.92
0.91
0.9
0.89
0,88
0,8/
0.86
o.as0.64
0.83
0,32
0
0
0
T I0,0 20
000*
r ] I i i4000.0 | 6000.0 I 8(100.0
1000.0 3000.0 SOOO.O /flOO.O 9000,0R«coi! tlar.tron •naryy (k«V)
Figure 4,16 Tha l/i factor a* a tunfiUon Of elactron anargy.
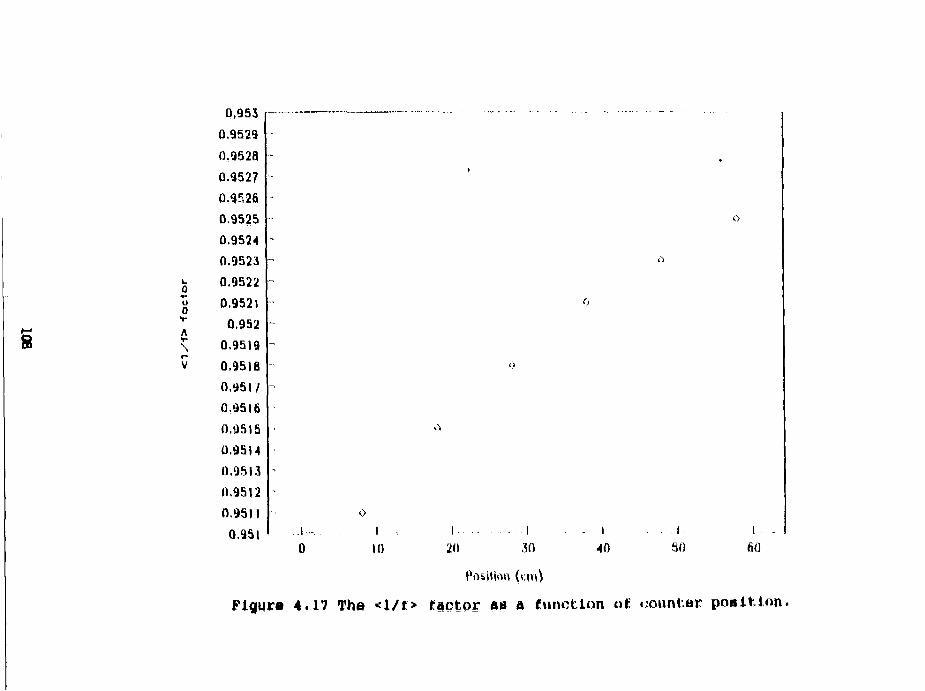
8 A\V
0,953
0.9529
0.9528
0.9527
0.9526
0.9525
0.9524
0.9523
0.9522
0.9521
0.952
0.9519
0.9518
0.9517
0.9516
0.9515
0.9514
0.9513
0.9512
0.9511
0.9SI I
10
I , i50
I -
600 10 20 30 40
Position (cm)
Figure 4,17 The <!/«> factor as a function at oountar pos i t ion .
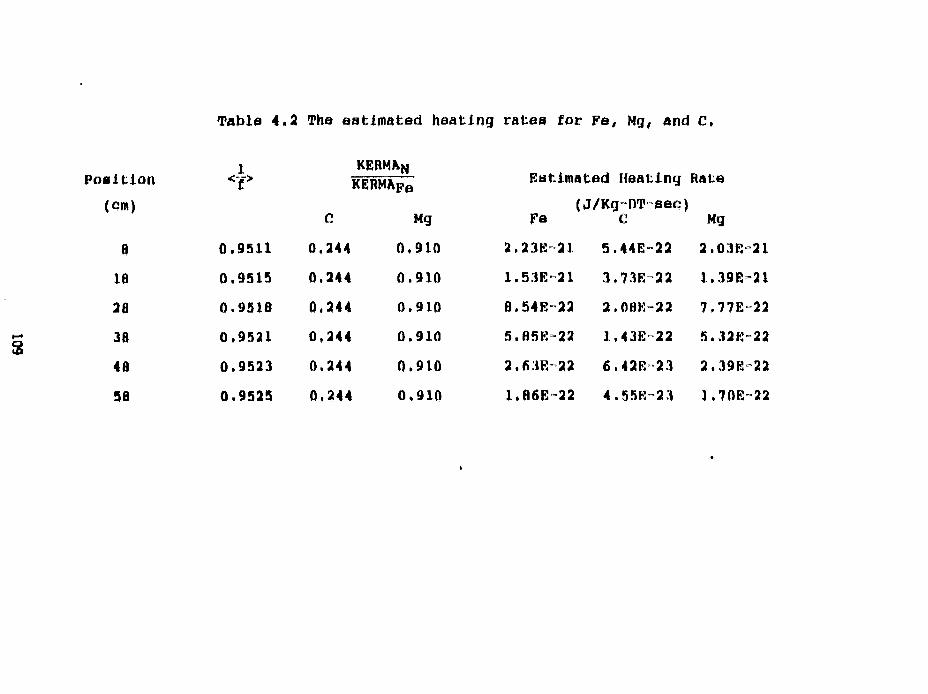
Table 4.2 The estimated heating rates for Fe, Mg, and c.
j KEBMANPosition <-(> KERMAp Estimated Heating Rate
(cm) (J/Kg-nT-see)
C Mg Pe c Mg
8 0 . 9 5 1 1 0 .244 0 . 9 1 0 2.23K 21 5 .44E-22 2.OIK 21
18 0 .9515 0 .244 0 . 9 1 0 1 .53E-21 3 . 7 3 E 2 2 1 . .19E 21
28 0 . 9 5 1 8 0 ,244 0 . 9 1 0 B.54E-22 2 .0BE-22 7 .77E-22
38 0 . 9 5 2 1 0 ,244 0 . 9 1 0 5.85K 22 1.43K 22 5 .32R-22
48 0 . 9 5 2 3 0 ,244 0 . 9 1 0 2 .63E-22 6.42E 23 2.39K 22
58 0 . 9 5 2 5 0 .244 0 . 9 1 0 1.R6K 22 4 . S 5 K 2 3 1.70K 22
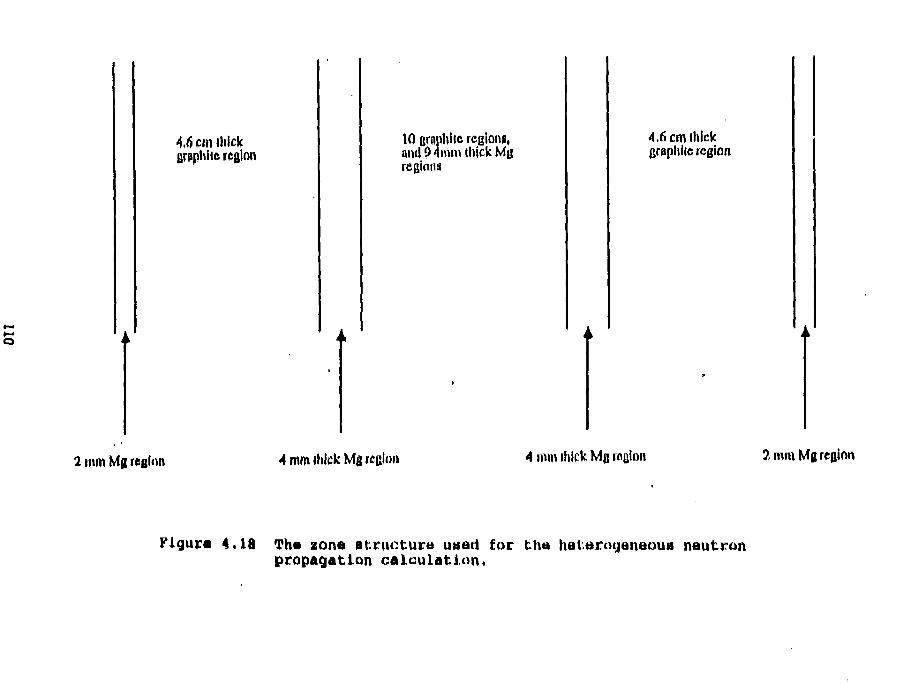
4,6 cm thickgraphite region
10 crnnliltc regions,and 04mm thick Mgregions
4.6 cm (hickgraphite region
2 mm M g region 4 mm ililek Mg rcgit 4 mm thick , mm Mg region
Flgura 4.18 Th« zone itructure used for the hatarogeneoua nautronpropagation calculation.
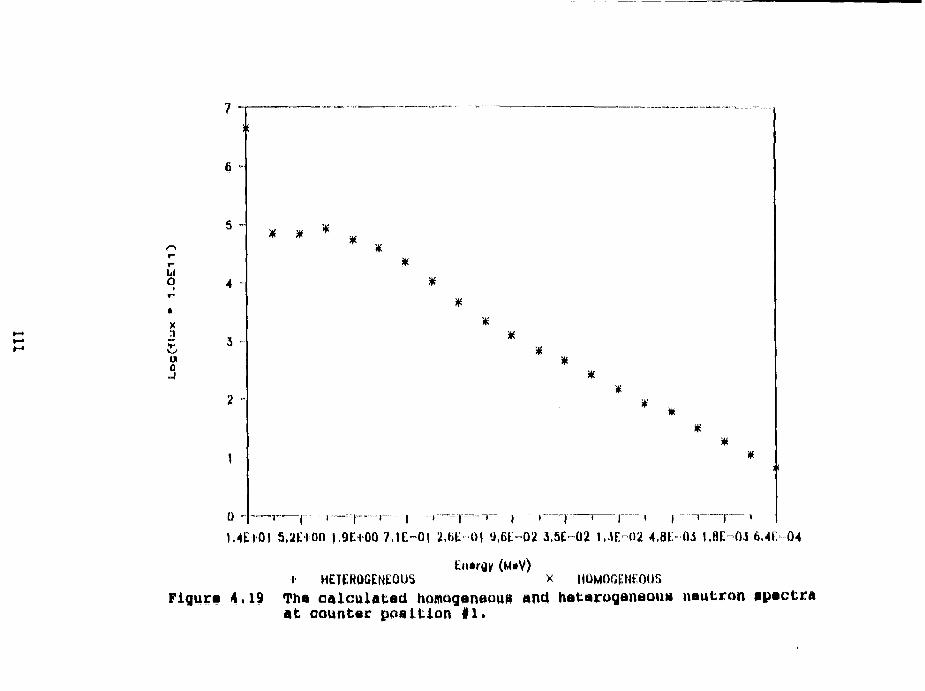
tX
U0
7 -
6 -
I i '),4EiO1 5,2E»00 l.OEiOO 7.1E™0| 2.6E 01 9.6E-D2 3.5E-02 I.3E-02 4.8E-03 1.8E-03 6.4F.-04
(MiV)»• HETEROGENEOUS x HOMOGENEOUS
Figurt 4.19 Tha calculated homoganeoua and hataroganaoua nautron ipactraAt counter position #1.
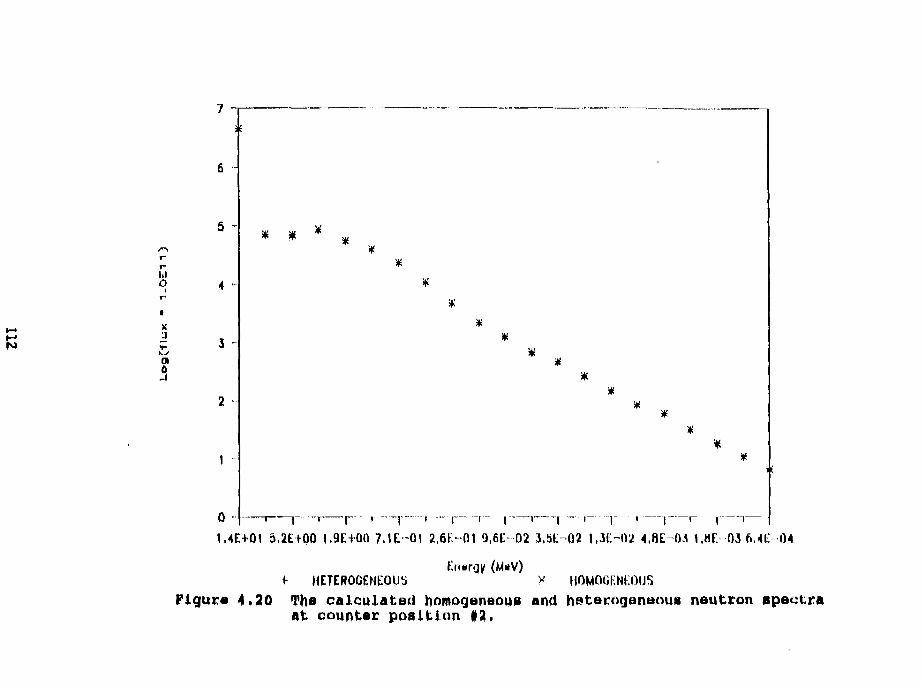
n
3
5 -
3 -
2 -
* *
1,4E+G1 5.2E+00 I.9EIQ0 7.1E-01 2,6
'4
-r- r —, - | ™-r
I Q,6E~02 3,5E-O2 I
r'l 4.8E-03 I.HE 03 6,4i: 04
» HETEROGENEOUS v HOMOGENEOUSFigura 4,20 The calculated homogeneous and hstarogenaoua nautron spectra
at counter position #2.
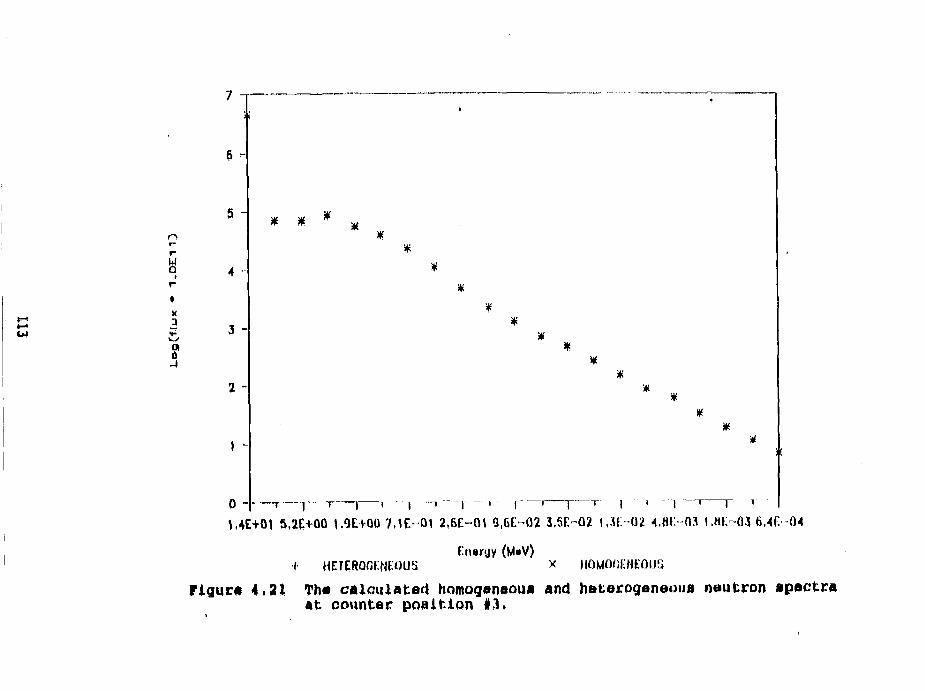
5 -* *
4 -
1.4E+01 5,2E+00 1.9E+Q0 7,1E-O1 2.6E-O1 a,6E~02 3.5E-G2 UK 02 4.8E-03 1.8E-03 6.4E 04
Entrgy (M»V)I HETEROGENEOUS X HOMOfiENEOIJS
rigur* 4,21 The calculated homogeneous and heterogeneous neutron spectraat counter position #3,
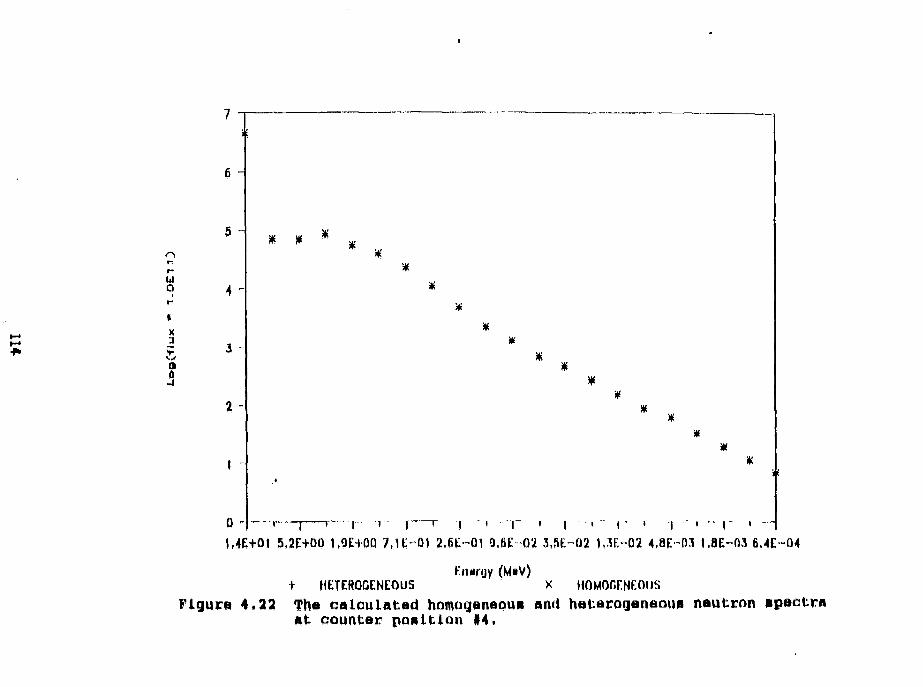
jf
f3
6 -
5 -
4 -
2 -
I -
0
* * *
t
T J t
*
¥¥
¥
[ i ) i | i | i | i
m
1,4E+01 5.2E+OO 1.9E+0Q 7,1E»O| 2.6E-01 9.6E-O2 3,ftt>02 1.3R-02 4,8E-03 1.8E-03
(M»V)+ HETEROGENEOUS X HOMOGENEOUS
Figure 4,22 The calculated homogeneous and heterogeneous neutronAt counter poHltlon #4.
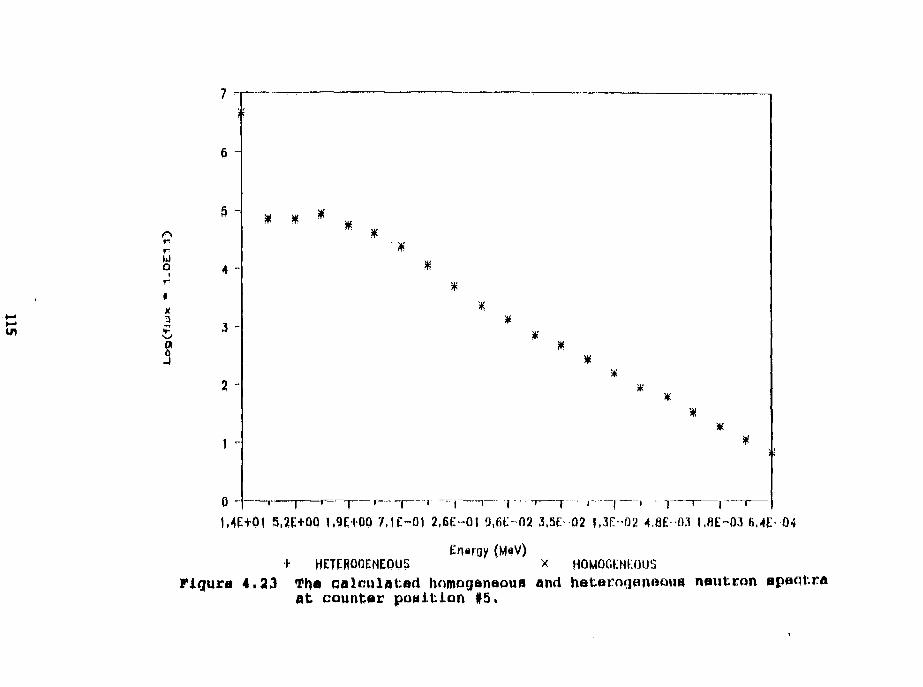
wo
1
f -f
5 -
4 "
3 -
2 -
o -
* * *
t 1 t | ! p- - (-. .... j -
*
5,2*:+QQ 1.9E400 7.1E-01 2.6E-O1 9,6E 02 3,5E-02 I.3E-O2 4.8E-03 l,HE~03 6.4E-O4
Eosroy (MaV)+ HETEROGENEOUS X HOMOGENEOUS
Figure 4.23 Th« calculated homogeneous and heterogeneous neutron spectraat counter position #5,
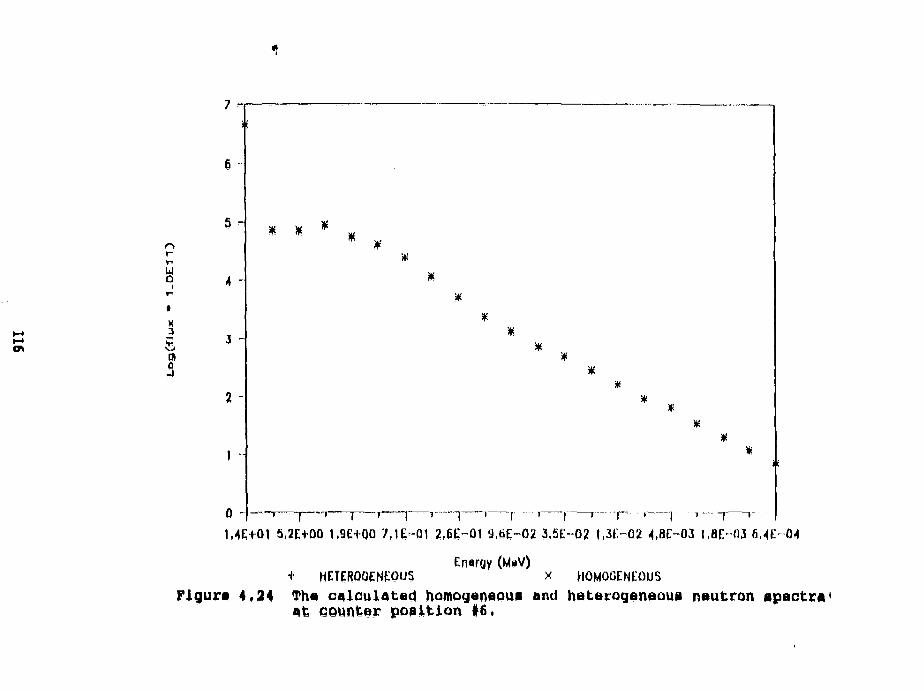
en
wo
x
£01
3
5 -=
3 -
2 -
* *
0 - —T
1.4E+01 5.2E+00 1.9E+0Q 7.1E-01 2,6e~O1 9.6E-O2 3.5E-O2 l,3t:-02 4.8E-03 |,8E-03 fi,-(E-04
y+ HETEROGENEOUS x HOMOCENEOUS
Flgura 4.24 Th« calculated homogenaoua and heterogeneous neutron spectra1
at counter poaition #6.
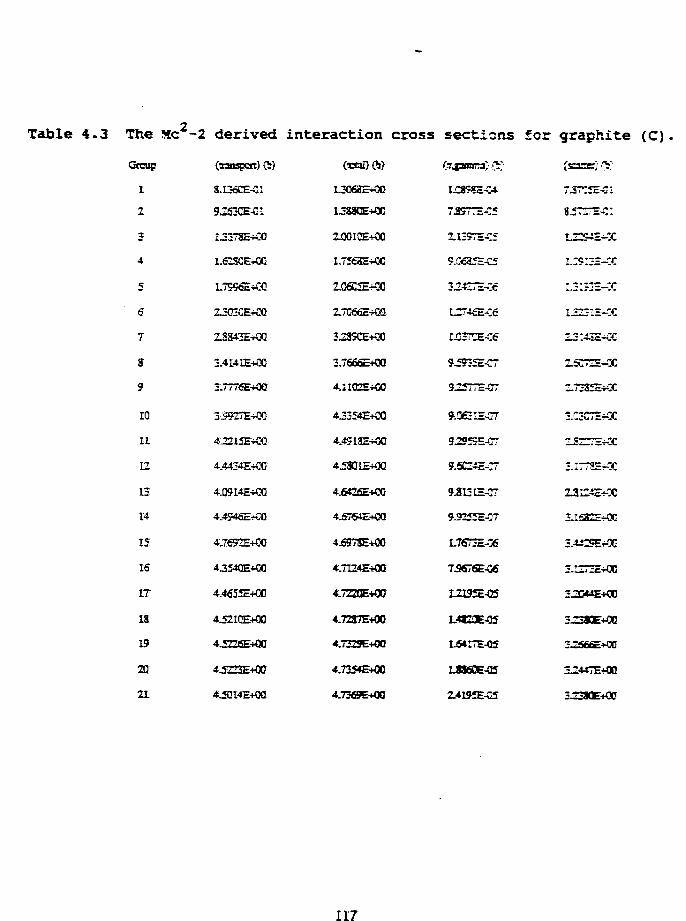
(transport) ft)
8.I36CE-C1
9.263CE-CI
L306aE+00
USSCE+QO
ZOOICE- 30
LCSSSE-W
7.SS77E-C5
L62KE-+CC
LCS7CE-C6
3--4I4IE+C0
35927E+00
3.7666E+CO
4.1IQ2E+GO
4J354E+CC 9.063^-07
4.4434E+CG
4.Q9I4E+CQ
4.4946E+C0
4.7692E+C0
4J540E+00
4.4655E+00
4J53QLE+OC
4.643SE-MX1
4.S764E+CG
4J223E+00
4.7U4E+O3
4.7Z33E+00
4.7287E+00
4.7323E+0O
4.73S«£-*O0
9J5G:4C--7-
9513IE-TT
9525^-C7
LTS73H-C6
7.S676&26
L2195E-0S
L4CJE-Q5
L6tt7E-Q5
U360E-Q5
2.K7SE+CC
2-73SS+CC
Table 4.3 The Me -2 derived interaction cross sections for graphite (CJ
Group
I
2
3
4
S
7
a9
10
It
12
13
14
15
IS
IT
ia
19
21
3.2S6SE+O0
12447E+00
117
A closer examination of these calculations, specifically the
interaction cross sections/ revealed why this happened. The
interaction cross sections for graphite (C) are presented in. Table
4.3. A quick comparison of the within-group scattering cross
sections (column 5} and the transport cross sections (calami 2,,
indicates that within-grcup scatter drwinates. The calculations are
A for the cross section set used.
4.6
A numerical analysis for the <L/f> factor and the SEHMA ratios
used ta <3jTt"?i"at;ff heating in. other mftt^Tiai^ fn*m gamm& heating values
measured in the counter were made with AMISW/PC and the Klein-Mishina
treatment of Gompton scattering. The <-ai<-nTjyt*ori <i/f> fa<~t-nr- for the
counter satisfied the check designed into the experiment to verify
the validity of the calculation methodology. The sensitivity
analysis done an the irw*'<ar"';!»i c Hipt'i* **;*t* ? r^> seems ta indicate no
qualitative difference an the choice of nwr*- »-j*T L*t *>ffPTT|*:T*:ion far
these cross section sets.
113
5. Conclusions and Future Directions
The body of ideas and work presented in Chapters one through
four are brought: into focus. Conclusions are made on the viability
of the techniques developed in this thesis for measuring gamma.
heating in low fluence, mised radiation environments. Suggestions
for further investigation into this and other related topics are
5.1 Conclusions
The goals of this thesis project were to: (1) create a
detector that is aisle to measure gamma heating in a low fluence,
mixed gamna and neutron field with good confidence, (2) be able to
perform this measurement over a broad energy range, and (3) develop a
method to relate the heating measured by the detector to the heating
experienced by other Materials in the same radiation environment.
The o y ' y i i * a T and <-aft-ni>*frffyu T methods are <*i'—'—I separately.
The results of the detector technology' development efforts
presented in Chapter 3 show that a proportional <Ta.uit.tft based
detection system can provide gamma heating measurements with good
confidence. The key attributes of this detection methodology are its
ability to perform signal separation and its ability tc take data
over a broad range of energy deposition. These attributes of this
detector and electronics aiiinip1 merit, allow the experimenter to
119
perform what were previously very difficult and arduous measurements
with relative ease.
A method to estimate the heating to other Materials in. a given
radiation field from the measured heating in the detector, based on a
calculation of the dose en—inwent. ratios for these Materials and the
detector wall wnt**n*i was shown. The results of the -small cavity
limit of cavity ioniration theory was used to relate the Measured
heating in the '-'jr>•<»!** fill <y* to the counter wall Material- "Che
method of relating measured heating in one Material to another lay the
use of <l/f> factors was demonstrated. The calculations indicate
that there exist a 5% difference between the absorbed dose in the
counter wall m»t:<»r-f»T and the ahwo chert dose in the counter fill gas.
As these calculations were made possible with the aid of many
simplfying assumptions; a more ckftailpti and complete series of
calculations will give better results. Use was made of Fane's
theorem to validate the <l/f> factor calculations and its positive
result indicate the numerical methods used in this thesis embodied
the correct physics.
However/ the results of the neutron propagation problems
presented in Chapter four indicate that AHISH/PC is only adequate far
a rough characterization of the radiation profile in a fast fluence
rate system. The significance of the large within-group scattering
cross section of graphite (Table 4.3), Jig and Fe is that 21 equal-
width lethargy groups do not characterize the interactions of DT
neutrons well. The implications for the <l/f> factor calculations
are: (1) the derived gamma emission spectrum may have been greater
120
than the true conditions, (2) the energy distribution, cf the
calculated gaona spectrum was not well characterized. The
applicability of AHISH/PC for future work in this field must, be re-
evaluated on the basis of whether or not a more detail energy group
structure (more groups at the upper energy limit.} is available. A
coupled neutron and garana cross section set would also be of great
benefit.
5.2 Future Directions
The signal separation technique could benefit fron using a
heavier fill gas in the counter, as a high-Z gas would have a mare
pronounced response difference for events of different LET. However
hlgher-Z gases would be increasingly sensitive to photoelectric
absorption. In soft gamma spectra, and this could complicate the
far the <L/f> fy^nr as one can not assise Gompton
scatter as the only gamma interaction in that instance. The merits
of using a heavier counter fill gas to aid in signal separation
should be investigated
The counter used in these measurements is limited by the
characteristics of the analog amplifiers and the processing speed
(4.77 MHz) of the data acquisition system to a •""—» observable
count rate of 2400 counts per second (cps). At higher count rates,
the counting system will experience signal pile-up. This limitation
can be removed if a faster 'data acquisition system is obtained. Of
121
course all the operating software oust also be changed tc interfa
with the faster processor.
The gamna heating measurement technique developed in this
thesis should prove valuable to the fusion materials researcher with.
an interest in measuring the deposition of the energy released by the
OT reaction in the candidate materials far next generation of fusion.
experiments. Gamna heating measurements can be made in the present
generation of fusion devices with the techniques developed in this
thesis, if provisions are made to transport and set up the
proportional, counter and the data acquisition system to such a site.
The data acquisition technique (the CBS.) can be adapted tc
other applications less esoteric, such as serving as the driving
electronics for a remotely operated radiation spectrometer capable of
disserving a broad energy range. Bemoteiy operated radiation
spectrometers have been deployed on space exploration probes, and
their use have been considered for an site, non-intrusive monitoring
of nuclear arms limitation treaty compliance. Previous remotely
operated spectrometers either ma»imi7»ar1 their energy range at the
expense of decreased energy resolution, or they npt-f fygart energy
resolution by decreasing the observable energy range. The GB& mode
of operation can drive a detector over a broad energy range while
maintaining good energy resolution, as the CBA. mode changes the
input bias-voltage to the detector to observe different portions of
the energy range, hence the possible count rate (resolution; for a
given channel can be maximized.
122
The caiculat Loral methods esec to model the experiaer:'; wculd benefit
greatly frc* the use a? a flee group coupled gamma arc reu~rcn cress section
set.. As ANISM/PC can only treat 21 energy groups and is ! laired zc are
spatial dimension, a mere sophisticated treatment of the transccrc e uatisr.
will produce more realistic results. A version of AMI5N that can treat acre
than 21 energy groups would be acceptable, tut a shree-cimensioral transfers
program such as MCN? would he best. Lastly a fine energy group structure
coupled gamma electron transport routine that will ailcw for the effects: af
pair production and photo-elecsric effect as well as Comptcr. scattering (e.g.
would he of Lmmense value far future; <T/f> factar calculations.
This document represents 3 J/2 years af work on my part; and it did ret;
come to fruition without assistance.. I would iiSce to taJce a anaent to than*
the principal pLayers for their time and effort. My waraest regards go tc;
Edgar Bennett far much useful technical guidance. Heartfelt thanks go tc 3rac
Mickiich for his good advice and rigorous proofreading. My gratitude goes to
Diclc McKnight far the generous dispensation af his expertise af MCz-2. Thanks
to Karl Barges for many interesting digressions. Thanks tc Art Cox and Con
Gregorash far experimental assistance. Uan regards zc Lee Ann Ciarlette and
Julie Stech of the Fusion Fawer Program at AML for their proapt secretarial
services. Finally, but r.ot least:: thanks: is tendered to the Fusion Power
Program and the Department of Educational Programs at AML fcr their financial
commitment and patience.
123
Refi
1. Yamaguchi, A., "Heating Measurements at ENS", DQE-JAERI
Workshop on Fusion Neutronics (1987).
2. Wang, T.K., F.M. Clikenan, K.Q. Ott, "Cn^ntational Study
of the Gama-Ray Energy Deposition Rate in the Purdue
Fast Breeder Blanket Assenbly", Ibclear Science and
Engineering 93 262-272 (1986).
3. Koch, K.R-, F-M. Clikeaan, R.H. Johnson, "GaiHa-Ray Energy
Deposition Measurenents in the Fast Efcrodcc Blanket
Facility", Nnclear Science and Engineering, 92, 596-605
(1986).
4. Simons, G.G., and A.P- Olson, "Analysis and
of Ganna-Ray Beating in the Demonstration BencfaBBrk
PlotonitiB—Fueled Critical ilsseably", Ifaclear Science and
Engineering, 53, 176-196 (1974).
5. Reddyr A.R., K. Ayyanyar and G-L- BCOM9BLL1,
'"nTerniDluBiinescence Hesponse of LiF to Reactor Neutrons'',
Radiation Hes., 4Q, 552-562 (1969).
124
6. Yang, Y., P.M. Deluca, Jr., D.W. Pearson, and F.H. Attix,
"GanBa-aay Yield of a 239Pu-Se Source", U5DCE Report Mb.
DOE/EV/01105-310 (1984).
7. Yule, T.J., "A Survey of Techniqaes, Including the Gas-
Filled Proportional Counter far Measuring Gamma-Ray
Heating in Low Power Fast Reactor Environments," AHL ZPR
-TK-140 (1973).
8. Bennett:, E.F., and T.J. Yule, 'Techniques and Analysis of
Fast-Heactor Neutron Spectroscopy with. Proton-Recoil
Proportional Counters," AHL-7763 (1971).
9. Simons, G.G., and T.J. Yule, "GaB«a-Hay Heating
Measurements in. Zero-Power Fast Reactors with Thermo-
luminescent Dosimeters," unclear Science and Engineering,
53, 162-175 (1974).
10. Stacey, W.M., Fusion, John Wiley and Sons, Hew York,
BY (1984).
11. Foderaro, A., ine FTtimnii <g of wpnt"non Int'oTsK*^''OR
MIT Press, Canbridge, MA (1971).
12. Evans, R. D., The Atoaic Nucleus, BfcGraw-Hiii, Mew
125
York, NY (1955).
13. Center/ H., Introduction to Health Physics, Pergamon
Press, New York, NY (1983).
14. Attix, F. H., Roesch, W. C. and E. Tbchilin, Rarifation
Dosimetry, Vol. I, academic Press, New York, NY (1968).
15. Cameron, J.R., P.R. Ifcran, F.H. Attix, "Hewiew of
Radiation Dosfmetry Research at the University of
Wisconsin During 19€ 1-1982", USDCE Heport No. DOE/EV/
01105-287 (1982).
16. Ikeda, Y.,et-at, "Determination of Neutron Spectrum in a
D-T Fusion Field £ Y Foil Activation Techniques", Presented
at the U5/JAERI Kbrksnop on Fusion Neutronics, Los Angeles,
CA {1988).
17. Attix, F.H., P.K. Deluca, D.W. Pearson, S.J. Qoetsch,
"MeasuraKxit of Neutron/GaHB Sensitivity Ratios far a
Of-Ccxmterr and for CO2~filled Graphite and Ar-filled
Magnesium Ion Chambers", USDCE: Report No. DOE/EV/01105
-264 (1979).
18. Deluca, P.M., P.D- Kiggins, P.¥. Pearson and F.H. Attix,
"Application of a Gcaphite-tfailed Proportional Counter for
126
Determining Photon and Neutron Dose Fractions in a 15 MeV
Neutron Beam", USDGE Report Mb. OOE/EV/01105-267 (198Q).
19. fencer, L. V. , and F. H. Attix, "A Theory of Cavity
Ionization/' Radiation Res., 3, 239 (1955).
20. Attix, F. H., L. DeLa Vergne and V. H. Ritz, "Cavity
lonization as a Function of Wall Material." J.
Research of the National Bureau of Standards, 60,
235-243 (1958).
21. Attix,. F.H., P.W. Pearson, P.M. Deluca, Jr., and S.J-
Goetsch., "Canparison of the Bragg-Gray Theory Corollaries
to Fast-Seutron Cavity Ionization Maasureaents at
14.3 M e r r Health Physics, 38 (1980).
22;. Fano,. U. r "Mote an the Bragg-Qeay Cavity Principle
for Measuring Energy Dissipation," Radiation Res., 1,
237? (1954).
23. Spencer, L.V., U- Fare, "Energy Spectrum Resulting fro«
Electron Slowing; Down", Physical Review, 93, 1172-1181
(1954);.
24. Loefa, Ii. H.
University of California Press, Berkeley, CA (1955).
127
25. Lewis, E. E. and W. F. Miller Jr., Gaaputational Methods
of Meutron Transport, John Wiley & Sons, Mew York, MY
(1984).
26. Parsons, D. K., "MUSK/PC Manual", EGG-2500, EGSG Idaho,
Inc., Idaho Falls, Idaho: (1987).
27. Wilkinson, D., H.,
Cambridge University Press, London, England (1950).
28. Davis, P. J . , and P. Rabinawitz, Methods of Ifcmerical
Integration^ Asademic Press, Hew Taric, JXI (1975)..
29. Churchhouse, R. F. , pm«»i-ical Methorfe, John Wiley and Son,
Hew York, NY (1981).
30. Dennett, E., F.,"A Continuous Hade Data Acquisition.
Technique fixe Proton Recoil Proportional Counter
Heutron SJiectrcMetry", NBJ-EFB/T3&-233 (1989).
31. RTP3^? Of Elaliological Health, TfarffQlnqfr T.
Handbookr U.S. Departaent of Healtn, Education and
Welfare, Hockville M3 (1970).
32. Blatt, jr. M. and V. F. Meissfcopf, TheareticgLL tfcclear
128
Physics, John Wiley & Sons, New York, NY (1952).
33. Segre, E», ed , ETqpcr-iinen ^T flfael<*=»T* Physics, Vol I I I ,
John Wiley & Sons, Bfewr York, NY (1959) .
34 . Kiirie, F. K. D», J . R. Richardson, and H. C. Paxton, Phys
Rev. 49, 368 (1936).
35. Fermi, E. , Nbclear Physics, University of Chicago Press,
Chicago, IL (1950).
P., R » , ]*)?yi*a g* u > ^ | '" t ion j*tirf irt p i ^ A r w T y s x s f o r
Physical Sciences , M33saw-Hiil, Msw York, BY (19€9).
37. Loevinger, R., "ft Fonnalism far Calculation of Absorbed
Dose to> a iy farffti|n: rrf»n photons and Electron. Beans", Med.
ci); (1S81).
38. Zer&yv C D . , F.H. Keller, "Electron Transport Theory/,
Calculations, and Experiments", Mtjrlear Science and
Eugf£neeringr 27, 190-213 (19€7).
39. Odeolad, E. , "Farther Approximate Studies an Beta
Absorption and Transmission"1, Acta Rariiologica, 46 (1957)
4Q:. Attix, F.H., e t -a l , "Fast Meatron Dosiaetry",
129
USDOE Jteport No. DOE/EV/O1105-307-314 (1985).
41. Duderstadt, J .J . , L.J. Hamilton, Nuclear Beactor Theory,
John Wiley and Sons, New York, NY 1.1376}.
42. Henrysan H , H., B.J. Tbppel, and C.G. Stenbergjr"3C2-2:
A Code to Calculate Fast Neutron Spectra and Milti-group
Cross sections", Argonne National LafaoratoiY report
ANL-8144 (1975).
43. Kinsesr, R. ed.,"ENDF-102: Data Foraiats and Procedures far
the Evaluated Huclear Data File EHDF/B-V," Brookhaven
National Trtinratory report BHL-HCS-5049€ (EHDF-1Q2) (197S)
44. Oak Ridge National Laboratory, "FIUH3: & 21 group Pfxrton
Cross Section Library Derived fraK E i a i T , DLC-86/EUMGP,
Radiation sftf Trffn<j mfornation Center, Oak: Ridge, TK
45. "Stopping Powers far Electrons and Positrons",
International Coonissioii on Radiation Holts and Measurements,
Bethesda, MD (1984).
130
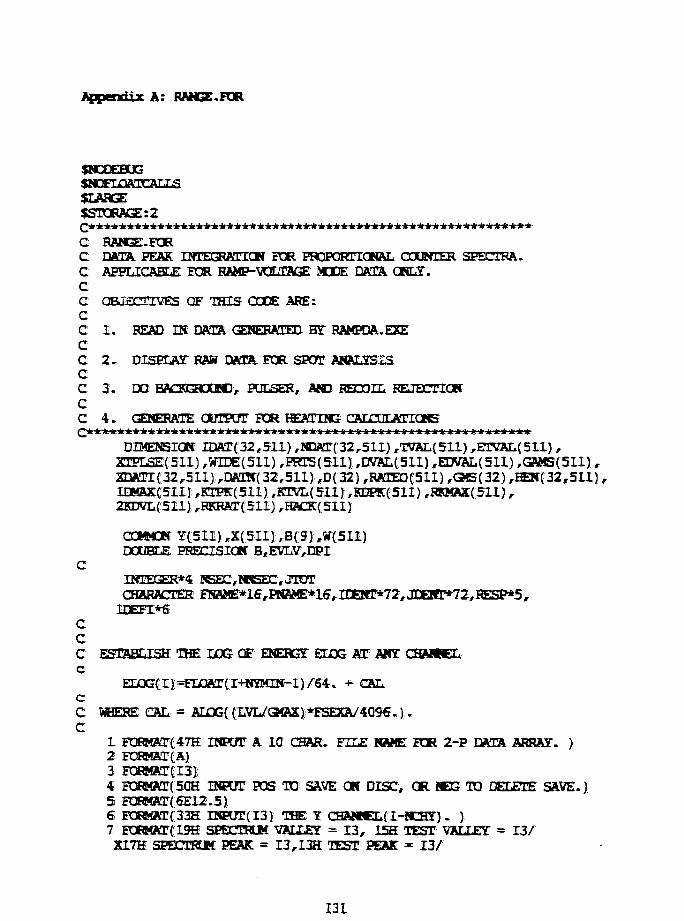
Appendix A: RANGE. FOR
$NCDEBUG$JCFLC«TCALLSSLAflGE$ST0RAGE:2
C RflNGE.FORC DATA BEftK IMEEGRKnaK FOR PROPORTIONAL COUNTER SPECTRA.C APPLICABLE FOR RAMP-TOLTKE MODE DATA ONLY.CC OBJECTIVES OF THIS CODE ARE:CC 1. READ IN DATA GENERATED BY RAMPDA.EXECC 2 . DISPLAY RAW DMA FOR SPOT ANALYSISCC 3 . DO BACKC3OJFC3, PULSER, AM} HrrrtTT. REJECTKJCCC 4 . GENERATE OUTPOT FOR ffiATENE CATXaLflTICKS
DIMENSION IDAT( 32 ,511) ,IEAT(:32,511) ,TVAL{511) ,ETVAL(511) ,XEPLSE(511) ,WIDE(511) ,PRTS(511) ,DVAL(511) ,EDVAL(5H) ,GAMS(511) ,XDATI(;32,511);,aATISr( 32,511) ,D(32) ,RATEO(511) ,GMS(32) ,ff iK(32,511)IDMAXC511); ,ETPK(5I1) ,RTVL(511) ,KDP!C(511) ,HRMAX(511) ,2EDVL(;511) ,RKRAT( 511) ,HftC3C( 511)
COMMQK TC5I1I,X(511) ,BC9J,W(511)DOUBLE PRECISICK B,EVLV,DPI
CINTEGER** MSEC,HBSEC, JTOTCHAMCrER FNAME*16rPSaME*16,IDEKr*72,JDERP*72,HESP*5,
1DEFI*6CCC ESTABLISH THE LOG OF ENERGY EUOG AT AHT CHAWELc
ELOG:{.r);=ELOATtI+«SKCN-l)/M. +- CSLcC WHERE CAL = ALOG( (LVL/O«X):*FSF^A/40S6.)-C
1 FOHMKTf 47H IHPOT A 10 CHAR. FILE MWE K E 2 -P DATA ARRAT. )2 FORMAT{ A)3 F0BMATCI3);4 EOfttOTtSOH INHJT POS TOi SAVE OK DISC, OR K G TO DELETE SAVE.)5 FOEWAT(6E12.5):6 P0BM»T(:33B[ ISPUT(T3) THE: Y CBAMCL( 1-JCHY). )7 FOBMATC19H SPECTHLK VALLEY = 1 3 , 15H TEST VALLEY = 1 3 /
X17H SPECIKK PEAK » I3,13H TEST1 PEAK = 1 3 /
131
X34H CHECK SFECI5UM: 3EFCRE PROCEEDING- J8 F0RMAT,{/45E MAIN MENU /X49H ALL OPTIONS REACHES BY INPUTTING (13) - TC 4}. /X49H I...PRINT HAW EATA HfcTWhLN AN? CHANNEL LIMITS. /X5QH 2...DISPLAY AMD PRINT 32-CEANNEL X/Y FOR ANY Y. /X44H 3...CARRY OUT RECOIL BACKGROUND ANALYSIS. /X49H 4...COMPLETE ANALYSIS AND OUTPUT FINAL RESULTS-/;:9 FORMAT(///iaX,27HLISTING OF ANALYSIS RESULTS ff\10 FQRMAT(I5,3Eia.8)11 FORMATf//4H J fI8E BCKGRD ,X18H FSTS .-13H TIME /)
12 FORMAT(49H CAN'T FIND CCWBISTENT SET OF DATA PEAKS/VALLEYS. I)13 FQRMAT(aFa.Q)14 FQBMAT(32H INITIAL «SG E1ATA LIME WHITE = F 7 . 2 /
X51H CHANNEL WHERE LUC BROADENS TC 1.5 TIMES INITIAL = 1 5 / )15 FORMATCISIS)IS FQRMA!T(43H INPUT A FILE NAME FOR THE DATA SPECTRUM- }17 FQRMAT(31H TOTAL PCIMTS AND START PCUfT = 215 ]18 FORMAT(10F8.Q)19 P0HMAT(52H INPUT A FILE NAME FOR THE GAMHA 5ACK3OJC SPECTRUK
)2a FORMATS218)21 FOHMAT(/41H TOTAL POINTS AND START PCINT = 215 /X32H RUN TIME IN SECONDS * IS /)
22 FORMAT(46H Y CHANNEL 3HERE BACKGSD RATIC * .9C OF MAX = 15}23 FORMAT(50H Y CHANNEL WHERE X/Y PROTdf CCT-QFF CHANNEL IS I = 15
)24 FORMAT(43H INPUT A -2AT FILE NAME FOR 32 X/Y SPECTRUM }26 FORMAT(35H THE ENERGY FOR THE X/Y SPECTRUM IS E12.5 }25 FQRMAT(53H INPUT(I3/I3) LOW AND ELQS. Y IZXZSS FOR DATA
LISTING./)27 FORMAT(53H INPUT NEGATIVE CHAN. NULL ABOVE AND SAVE FOR GRAPHER
)23 FORMAT(45E INPUT THE ENERGY SCALE FACTOR FSEXA (E12.5J. I29 FORMAT(36H THE Y (CR L06(E)) CHANNEL NUMBER IS 15 )30 FQRMAT(44H INPUT NEGATIVE TO f*!, * LOW X/Y CORRECTTCII }32 FQRMAT(/33H X/Y DISTRIBUTiai FOR Y CHANNEL » 13)
CCC NCHY, THE NUMBER OF Y (ENERGY) CHANNELS,. IS LESS THAN 512.C THIS RESTRICTS A FLOATING POINT ARRAY TO LESS THAN 1 PAGE.C THE NUMBER OF X/Y CHNNELS IS FIXED AT 32.
NCHY = 511NYMIN=1
C NABS AND NQRD ARE X AND Y POINT CCUHT FOR PLJTTIAU ROUTINES.C NABS=640C MORD=2aO
NABS=72Q
c3013 CONTINUE
C INPUT A 32XNCHY CHANNEL DATA ARRAY FROM CISC.
C CCHVERT TO FlOATUKr 9GHKT. THEN EMTEE MftJHC
203 DO 7519 J » l , K 3 rHRCK{J)=0.QDO 7513 1=1,32
HEC(I,J)=0.CDRHI{I,J)=Q.Q
7519 DKEX(I,J)*0.GC
WRITE(*,1)HE8D(*,2) FUME
REAO(IQ) HHMCWHITE(*,2) FHBMEREAD(IQ) IDEBTWRITE{*^2) IEESTHEAD(IO) H5EC
ccc miwJTPi. of s e c i n iREftD(lO) LVL
ccc lower lere l cut-off s e t 1896/4096READ(IQ) GMUC
ry^r; may d e f illBd ry*1K
REflD(io) n a xCDDSE(IQ)
DO208 I=lrHECK=O.GDO2081 J=l,32TSSn{J,l}^UXS{IDKS{Jtl)) Hr 32767.
2Q81
208c DiflansncsC WKETE(*,T755)C 7755 EQRMKT(' TSE DATA. OGLLAPSED CWER 32 CHRWELS",/}C DO 7733 J=l,HCffirC 7733 WRrTE(*,7744)J,BftC3C(J)C 7744 F0BMAT(5Z,I4,E12.6)
ccc the law energy cat -of fWRirE(*,28)HEAD(*,5) FSE3A
ccc Fuil Scale Energy X a^plif Icat ianC REKMBER 10 VOLTS = (EICHGT X AMFLIFICXriON) X CJRSTARTSC I . E. (EBEBGT X AMPLTETCATiar)C
CAL=ADDG{ (FD3AT(LVL) / Q 0 X )OC
DO61Q I=1,LTOT610 W(I)=€XP(ELOG(I))-+«C33aFF
CC MAIM BGftJ. OETIGHE gPTi-t 'W»l > HERE.
2oa
133
HEftD{*,3) 100IF{IQQ)2Q0,2GQ,20l
201 EF{100-4)202,202,200202 GO T0{204,205,206,199),
CGO TO 200
CC OMLY PRINT Tffi BAH DATA HbTWfchJT Y CHANNEL LIMITS AS INPUT.C
2Q4 CdlTINtJEOPEK^FILE^'CBA.PWr ,STRXl]S=f!IESr')WRITE(*,25)HEAD(*,3) ILOREAD{*,3) 3BIPAUSE 'PRUTEER CW/OFF'WRITE(*,2) EHWMEHKEEE(7,2} HOMEWRTTE(*,2) mOWOTITE(7,2) IEEHTDO152 J=IK},IHIWRETE(*,15) JWRTIE(7,15) JWlTE(T,ia) (ElflTKI,J),I«1,32)
152 WRITE(*,ia) {DKn{I ,J) ,I=l ,32}CL0SE(7)GO TO 200
C^•k-kk-k+k-k-kk-kkk-kkk-kk-li-)ik-itii-k-kk-k-it-it1t-kk-kkk-kkk-kkk-kk-k*-ll-kil-*-kkitkllkk*+k-*
c cnpy t h i s s e c t i o n f o r future re f erencec NABS AlO NQRD ARE X AH) Y POINT1 COJWT FOR PLOTTING SOUTINES.cC DISPLAY TIE 32 CHAWEL X/Y SPBCTBLK FOR AHY Y AMD ALSOC PRH*T THE 32 CHMtlLL X/Y SPECI5LM. iKZLL VALUE FOR Y TERMISA3ES.C
205 WRITE(*,6)HEAD(*,3) IYZ
IF( IY-LTOT) 117 ,117,20Q117 0^)200,200,116116 WKETE(*,32) H
WRITE{*,18) (DATI(I,IY},I=1,32)\XKL~lDO113 1=1,32IF{DATI{ I,IY)-{MAX) 113,113,114
114113
CALL PLTI51TCALL LIMAX(HABS,MDRD)DO115 1=1,32Et=IFIZ( (FLQAarCI)} *FLOAT(l«aS)/32. J-IJY=IFIX(.95*ELOAT(IK»D) *QKTI( I , IY) / t I K )
IF(JY)120,120,121
134
120 JY=0121 CALL SPLT(IXX,JT,-i,6}
LNGTH=2JYY=JT-1IF(JYY)112,112,115
112 J2Y=0
115 CALL SPLT(IX,JTZ",1,]LNGI!H)CALL PLTOUTWRITE(*,29) ITWRITE(*,26)WRITE(*,27)
5178 READ(*r15) IKDIF( 180)5178,602 ,205
602 DO603 1=1,32IF(r-IKQ) 601,600,600
601 D(I)=0.0GO TO 603
600 D(I)=DAII(I,IY)603 LLML'iEtJE
5EAD{*,2) FBBMEQPEN( 10 ,FILE=F!!IBHE, POF»=' POHMBITED ',STaTUS=' HOT'D0605 1=1,32XI=EL0Ar{I)
605 WRITE(10,5) XI ,D(I)CDOSEUO)GO TO 205
cC AHALY5E FDR DftTA AID LIVE TIME USUC BACKGRXIC SUBTMCTIClf.C COLLAPSE TO A SINGLE 32-CHMHEL SPECTRUM 0 ( 1 ) , LOCKEEC VALLET Cffiy«ELS BEFORE DATA PEAKS (H*VDAT) AHD BEFOREC LIVE TIME PEAK (K*VTEST).C
WE 0NL7 HAVE RECOILS AT HIGH ENEBG7 CHAflHELS.CCC
206 LXJRL'IAUE
DO 7Q00 J=l,HCHrDMAZ(J)=0.0RKHAT(J)=0.0
DO 7000 1=1,32
IF(MOD(J,100))7000,8717,70008717 WRITE(*,110)HEIf(I,J)7000 CONTINUE110 POFMAT(E12.6)
135
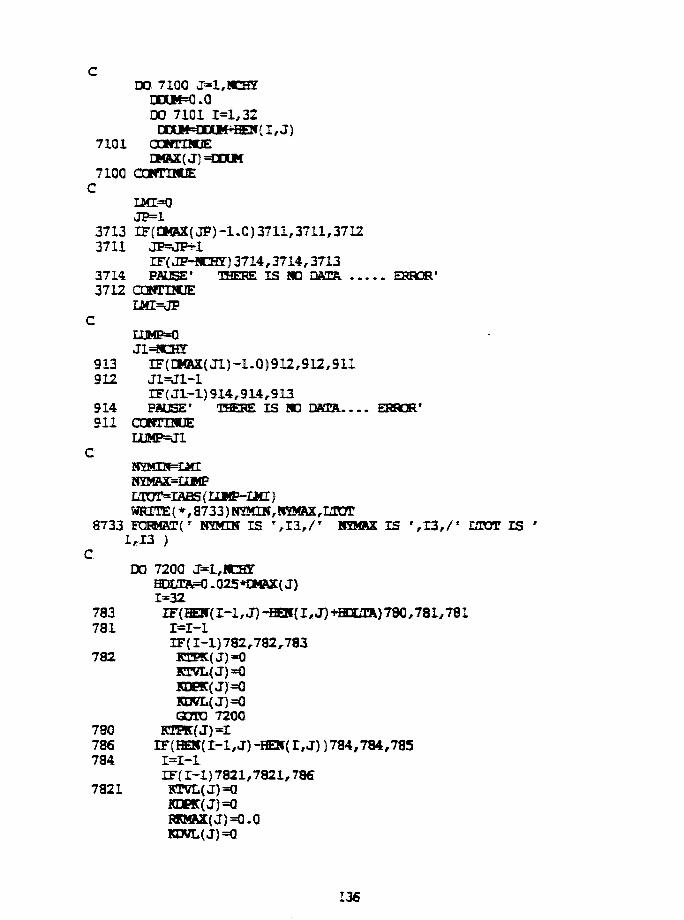
cDO 71QQ J=l,BCHy
DOUtO.QDO 7101 1=1,32
DDU*=DDtlf*«af 11, J)7101 CDNTIHUE
EMAX(J)=ECUM710Q OJfriNUE
CLMI=0JP=1
3713 IF(DMRX(JF)-1.C)3711,3711,37123711 JP=JP+1
IF( JF-HCHJT) 3714,3714,37133714 PAUSE' THERE IS 80 DAER ERROR'3712 COWTHWE
im=jpc
913 IF(l»ftX(Jl)-1.0)912,912,911912 J1=J1-1
IF( JL-1) 914,914,913914 PAUSE' THERE IS HO DATA ERROR'911 awnnuE
LUMP=J1c
WRITE (*, S733) NYMIN,8733 PORMftTC HSMIN IS ',13,/' HSMRX IS ',13,/* HEOT IS '
1*13 )C
DO 720Q J=l,HCHrFUCTAFO .025*DMRX( J)1=32
783 I F ( H I ( M , J ) -ffiJf{I,J)+HOaR) 780,781,781781 1=1-1
IF(1-1)782,782,783782 KTPK(J)=Q
KDVL(J)=QGOTO 7200
780 REPK(J)=I786 IF(HElf(I-l,J)^EK( I, J)) 784,784,785784 1=1-1
IF(1-1)7821,7821,78€7821 KTVL(J)=0
KDP!C(J)=0
KDWL(J)=Q
136
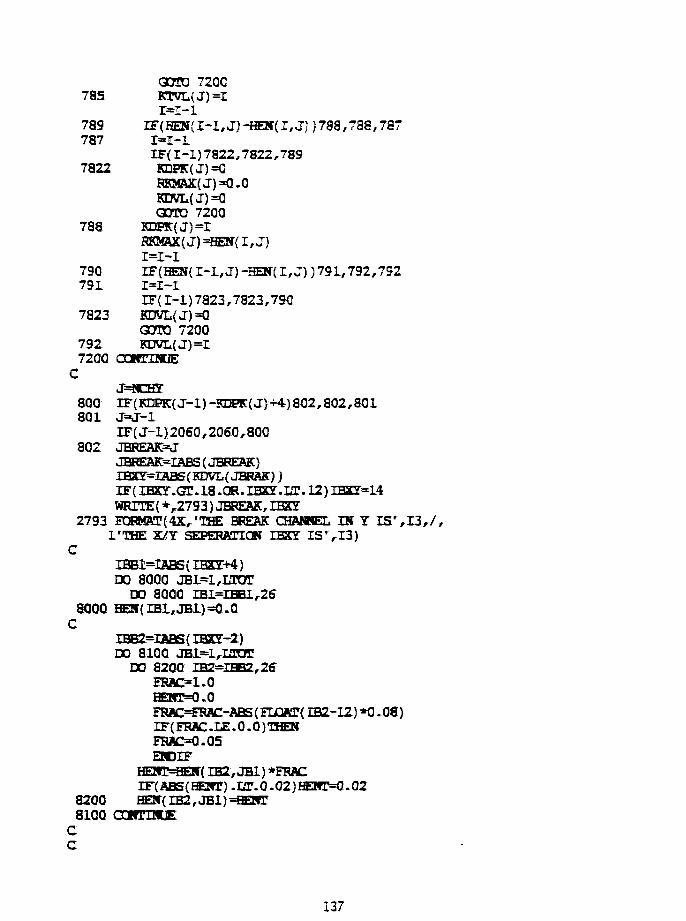
785
789787
7822
788
790791
7823
7927200C
800
GOTO 7200KTVL(J)=I1=1-1
IF(HEN{ 1-1, J) -HES(I, J}) 788,788,787r=i-iIF(1-1)7822,7822,789KDFK(J)=0KKMAX(J)=0.QKDVL{J)=QGOTO 7200
KDP!C(J)=rRKMAX(J)=HE»{I,J}1=1-1IF(HEN(I-1,J)-HEN(I,J}) 791,792,7921=1-1IF( 1-1)7823,7823,790KDVL(J)=QGOTO 7200KDVL(J)=I
GOKTHUE
j=«cffirIF( KDPK( J-l) -KDPK( JJ+4) 802, SQ2 , SO 1
801 J=J-1IF(J- l )2060,2060,800
802 JBREflK=JJBREAK=IABS (JBBEAK)TRX7=iaBS(KDVL(JBRflK))IF( IHXr.GT. 18 .OR. IBSI.HS. 12) IBXY=14WRITE( * r2793) JBBEftK, IBXy
2793 KJBBfflI(4X,rTffi BREM OfflMEL DT Y I S ' , I 3 r / ,1'THE X/T SEPERKTICW IBXT IS ' ,13 )
CIBBl=IftBS (IBET+4)DO 800Q JB1=1,KEOT
OQ aoao IBI=IBBI,268000 HEU(IB1,JB1)=O.Q
CIBB2=IABS(IBXY-2)DO 8100 JBl=lria?OT
DO 8200 IB2=IBB2,2fiEBUIC l.OHEKT=0.0FEac=FMC-ABS(Fixaa:{ IBZ-U.) *a .08)IF (FHftC .LE. 0 .0 ) THENFMC=0.05EHDIF
HEMP=HEir( IH2, JB1) *FMC
8200 HEH(IB2,JBl)=HEKr8100
cc
137
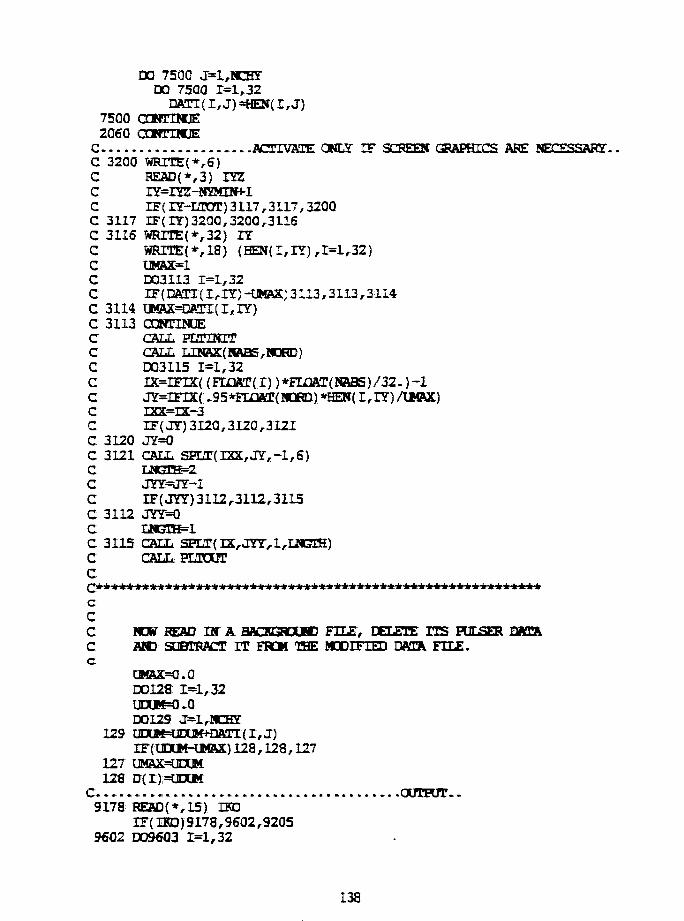
DO 750G J=1,NCHYDO 7500 1=1,32DATI(IrJ)=HE8<r(I,J)
7500 CONTINUE2060 CONTINUE
C ...ACTIVATE ONLY IF SCREEN GRAPHICS ARE NECESSARY.C 3200 WRITE(*> 6)C READ(*,3) IYZ
C IF(IY-LTOT)3117,3117,3200C 3117 IF(IY)3200,3200,3116C 3116 WRITE{*,32) IYC WRITE{*,18) (HEN(I,IY),I=1,32)
C DQ3I13 1=1,32C IF(DATI(I,IY)-UMAS)3113J,3113,3114C 3114 UMAX=DATI(I/IY)C 3113 CONTINUEC CALL EEZTUMITC CALL LINAX(NABS,NDBD}C D03115 1=1,32C IX=IFIX:((FLOAT(I))*ELOAr(NAaS)/32.)-lC JY=IiTX(.95*FIiDfla!(NORD)*HEI!f(I,IY)/UMAX)C I2CC=IX.-3C IF(JY) 3120,3120,3121C 3120 JY=0C 3121 CALL SPLT(32X,JY,-1,6)
C JYY=JY-1C IF(JZY) 3112,3112,3115C 3112 JYY=Q
C 3115 CALL SPLT(IX,JYY,1,LNG1H)C CALL PLTOUTCQ*+Jt *-Mkk-k*****itiririt*ir*-k-k*±**it*±it**-k1t±-k-k1tit*-kk-kk kk k kk-kkkkkkkk k
CCC VCKi READ IN A BAuKRXMD FILE, DELETE ITS PULSER D M AC AND SDHERACT IT FROM THE MODIFIED DATA. FILE.c
D012S 1=1,32UCUf=0.0D0129 J=1,NCHY
129 ( , )IF (tnXM-UMAX) 128,128,127
127 UMAX=CDIM128 D{r)=UDlM
C OOTTOT. -9178 READ(*,15) IKD
IF(IHD)9178,9602,92059602 DO9603 1=1,32
138
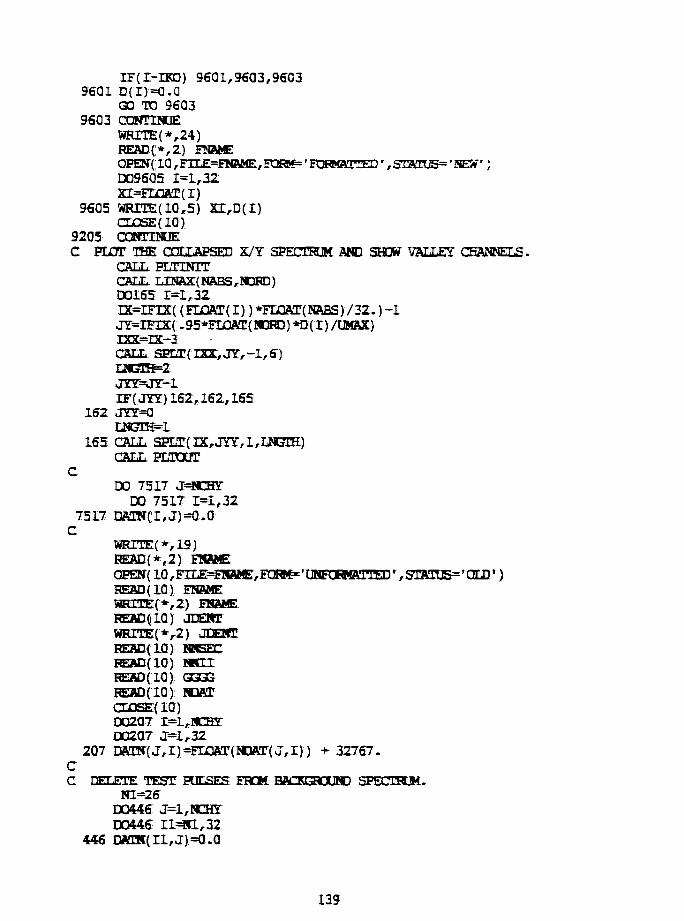
IF(I-IKD) 9601,9603,96039601 D(I)=0.0
00 TO 96039603 CONTINUE
WRrrE(*,24)READ(*,2) FNAMEOPEN"( 10 ,FILE=ENaME, P08K=' FORMATTED',STATU5='SEW' )DO9605 1=1,32XX=FLQAT(I)
9605 WRITE(lGr5) XE,D(I)CLOSE(IO)
9205 CONTINaEC PLOT THE COLLAPSED X/Y SPECTRUM AND SHOW VALLEY CHANNELS.
CALL FLT1NITCALL LINaX(NABS,NDFID)•0165 r=l,32LX=IEEX( (ELOAT(I)) *FLQAT(NABS)/32.)-1JY=IEIX( »95*FLOAT(NOro) *D( I) /UMAX)X3Q£—T*X~"* 3CALL SEET(I2X,JY,-l,ff)
JYY=JY-1IF(JYY)162,162,165
162 j r r=aLNGTS=1
165 CALL SPLT( IX,JYY, l f i a 5 E )CALL PETOUT
CDO 7517 J^XHT
DQ: 7517 1=1,327517 DATN"(;i,J)=O.Q
C«RITE(*,19)READ(*,2) FNAHE
HEAD(10) FNAMEWRITE(*>2) EHBttEREAD(10) JDEHTWRITE{*r2) JDESTBEAD(IQ) NNSECBEftD(lO) IHXXHEAD(Id) GGGGREAD(IO) NDATCLOSE(10)DO207 r=L,ICHrDO207 J=l,32
207 DATN(J,I)=FLQAT(NDAr(J,I)) + 32767.CC DELETE TEST POLSES FROM BAOOVXJND SPECTRUM-
Nl=26D0446 J=l,NCHyDO446 ri=«l,32
446! DATJt(IL,J)=0.0
139
cC NOW SUBTRACT THE BflCKOROUND FHGK THE LIVE DATAC
DO 7513 J=1,NCHYQMM=Q.QDO 7513 1=1,32
O3AM=DATI( I , J) -DATN( I , J )DATI(T,J)=Q3AKIF(DAII(I,J) .EE.Q.O)IWEI{I,J)=a.O
7513 CONTINUECC N2=IBXS>1C DO 7514 J=1,LIOTC PDHT=CLaC DO 7514 I3=«2;,N1CCC 7514 CONTINUE
GO TO 20QC
CC HJT THE; DflTA INTO AHSSYS GAMS 5 TPLSEC
199 CONTINUEC
DO 7523 J=l,NCHyGastS(J)=0.0PRTS'(J);=G-QTPLSE(J)=O.Q
7523 CONTINaEC
DO 752* JBI=LfETOT
DO 7525 12=1,267525 GMSfl=aEA+Dfl!TI(T2,JBl)
GftMS(JBI)=OSA7524 CONTINQECC
DO 7528 JBl=LfLTOTPSLETN1.QDO 7529 14=27,32
7529 PSLEr=PSLETH3ftTI(I4,JBl)TELSE(JB1);=PSLET
7525 OJBHINUEC
DO 6715 J=lrNCHTXFCGBMSf J),. .LE. Q:. .QJGBBB (J) =1- 0IF( TELSE( J) .LE. Q. 0) TPLSE (J) -1. Q
6715 CONTmjEC FINftL EDIT OF BESULTS-
PAOSE: "PRINTER ON/OFF FOR FIN»L EDIT'
140
WTEB(*r9)WEUTE(*r2) IDENTWRITE(*-,21)WRITE!*,. 11)
280 WRITE(*,ia) r,GRM5(r).ERT5(r)>TELSE(I),1=1+1IF (r-nUOT) 283 r 283 ,234
283: D3*TR=DCNTR+1IF(DCNI!Rr-58) 280 r
2 8 1 WRHE(*/.282)
282:GO TO 280
C OPTION TO SAVE Effl33L CM DISC.284 WRITE{*,4);
HERD(*>3); IGO)IF(: IGO.) 298 ,299 ,293
299 OJKL'INUE
WRITE!•'*/ •16);HEAD(*,2); PtBMEOPEW(:lQ,F^LE=PHftME/EOB fecEr!FM2a?TEe' rSTftTOS='SEWr
WRITE:(: 10,2): PNSMEWRITE('lQr2) IDEWT!
WRITE(10/,2Q:); HSBCWRITE( 10,15); ETOT
WRITER '*rifii5incor1615 roraffiT(5X," MPT I S : ' , ^ ) ;
wKETE(:iari5): mamWRITE(:'*„ 161S).NSHIBr
1616 roRHST!5X,r IBS: = ' r I5 )WRITE!10r20) EVL:
I6IT POEMKFCSX, I5EL IS;); GMSX
1618; POBMaT(Sffrr GMHC IS r ,E12.5);
WRITE!; 10^5); (PRTS(I) ^I^WRITE(:lOrlS): (TPLSEfI)vI=l,ITOT)
298 CD0SE('10)iWRITE(:;*rI622)
1622: KJRMffiT(' ENTER BEGIN TO (CONTINUE WITH NEW FILE1)REflD:(*,.1621)RESP
1621 EOHMATfAS);IF(5ESP.EQ;. "BEGIN' )THENGOTO 3013EBEIF•STOP
141
END
cC DERIVE: THE FULL -"-IH AT HALF MAXIMUM OF THE DATA PEAK OVERC THE: RANSL OF CAxA FROM ICH1 TO ICH2 FOR THE D(I) ARRAY.C
FUNCTION FWHK(TCH1,ICH2,D)DIMENSION; D{32)
CCMAXKLQ;DO1 K=ICHl.rICH2IF(:D (K) -CMAX.); 1 , 1 , 2
2 CMAX=D(K)
1 CONTIMUEHftLF=a.5*CMAX;
5 IF(DfK):-HALF) 3,3,44 K=K-L
8i VLO=ICH1GO TO 9
3
GO TO: 910: ym=FljQAT(K);-!-(HALF-D(K)) /IT3 DOS K=IMaXjrICH2
IF ( D ( K); -B&LE); 7 „ ff, £6 ccwrmjE
W(m 12 r 12,13:12 VHI TflAT(:K))->5
GO TO: 1A13 VHI=ETi3AT{K):-(HALF-D(K))/tI14 FWH»=VH
HETUBKEMD
CC FUNCTION: HHJ3 (IH^ILO^IHr^D); RETUBHB MAXDOC (LB=1) OR
C COUNT CHANNEL. NUMBER OF THE ARRAY D( I); IK THE INTERVAL H O TO IHX.C
FUNCTIQN: HUJQCIDIMENSIOR DC32):
C
1 U=L.<33> TO 3,
2 0=0.03 D04: I=ILO,IHI.
142
5 IF'(Dtr):-U)7,4,47
GQs TO 46 IF(D(r):-U);4,4,83 tf=D(I):
LOHI=I4
RETURNEND)
C SCBaCUTIME PLTINIT I w IT I ar.TTT-q PLOTTIHG HOOTISES.C
dUBWOUTINE1 EET1NITCC c a l l qcalar('L,3):
OMUL.KETURTTEHD1
c
Cc SORRODTIME: sEiarfix^rrriHvrjrLNGiH);: EEOTS: OK T ^ SKX&GE SCOPE AC VEREICSLflHST POSITIVE): LIME OR A. aQRIZOHE&LCIHff HRGATTVE); LIHEC OF EENGTK LH3TE STZiRTISE AT IX AHD I F .C
SDBBdJTINE f )
1 H£=IX+ENGEECflEL,
KfTUttMEND)
. - * . - * . - * - * * • * • * . * . * * * * * * . * * - * * * - * * . * _ *
CC SUBROUTINE LDJAX DEUUiS: LINEAR AXES, 3 2 UJAHEL TICS FOR ABSCISSA.C
CACL
IX=IFIX(:DEIL))
1 CALL SELT(IX,.a)rl,LHGrH):
2 BETQHSI
143
END:
cC SUBROUTINE: PUTOUT RETURNS' FHQK FDJITING HOUTINES.C
SUBROUTINE; EDTOUT'C
CHftEaCTER*! CHARC 1 fannat(:a);C read(*vl); char
CAUL QINEOTfCHaR^O)CALL QSM3DE(2)RETURNEND)
Cc * i»* * * * * * * * * * * * * * * * * * * * * * * * * * * * * * *
C LEAST' SQUftHES EOLXHC1CEAL: FIT1 . 8t(<=9); I S THE ORDER, N THE ARRATSIZE-
SUBEKXITIKE LSQPOL(M,N)C
CQWMDN r ( 5 I l } ,X( 5111EQEraaLEaSCECiWftX^TvSHftPI t CIHCH:, JK3H);, ( IOaHK, JO3LUM):DOOBLE: PHEdSIOHJ
cDO! 520 I=I,Hf
52Q) CfI*l):=L-O' QQ)DO53O J=2 j rHDQ: 530 1= 1,M
530; c(:r,j):;=c(:r,DO 5€0i I = I,M
= 0.0:55Gi J = 1,M
l = 0.QDO) 550; E = IrK;
550) &cri-r«i)) = A(;r rJDOJ 560 K = I r lf
560! B(Tli = B(;r)i *cC MITiaLIZa i lQK (MQEEBBTC
DO) 570 J = I ,K570; IPBCTr(Jl=Qi
CDO) 690 I=L,W
cC SEMKH FOR P1MH! ELEMEHT
D062® J=I,M:IF (fIEIVCrCfJl;-II:5aa,620),5aCli
580) DO 610 K*1,M
144
I F (IPIVOT(K)-l) 590 ,610 ,740590: IF(DABS(AMAX)-DABS(A( J , K ) ) ) 6 0 0 , 6 1 0 , 6 1 0600 IHOW=J
IOTJM=KAMAX=A(J,K)
610 CONTINUE620 CONTINUE
rervorr f IOXUM) -rpirorc ICQLUM) +1cC INTERCHaNQS HOWS: TO PUT PITOT ELEMENT OK DIAGONALC
I F (IBCW-ICOTIJM) 630 ,650 ,630630: DETEHM=-DETEBSC
DO: 640' L=1,MSWAP=A( IHCK,L)A( new r L) =A( Tc
640- A(:TcanjSHAB = B(IHOW):
B(ICGTJK) = SWAP650)
;=A(: ICOTI.1M, ICQIUM)
CC DIVIDE PIVOT BOW HT PIVCTE ELEMENT1
CAfTCOEDMy ICCMJM);=1.0DO:- 660; L==L,K
6S0: A(T<mrjiwfT.)=A (Trnriiw,.^) /PTOryrtTBflCOEOM]: = H(ICQLLM)/PIVOT(T);
Cc REDUCE: NDN-PITOT!1 HOWS:c
DO: 690 L1=1,M•nr(T.T-Trnrj»f] 670,690:^
670:
DO6BQ: A ( m , L)i=ft( LJULJi -A( ITfTfM,
B(IJL)i = BfLl); - B(TCOLUM)*r690 COREINUE74Q: BET0HK
CEND
145
Appendix B: HANY.POR(;**-***+•*********•»*+***•*+*•«•»*+
CC A COTE SEQ«ENT TO DECODE AND 5U3T THE OUTPUT GFC RANGE.FOR. ENERGY CALIBRATiaH IS PROVIDED BY THEC KURD! PLOT OF A TRITIUM SPECTRUM PROVIDED BY THE CSERC(;**•****+•*****************»***+*•********-********»*+**•»••*••*•»»»
$NQDEBUGSNOEIflATCALLSC RANY.FORC TO BE USED WITH AN IBM COMPATIBLE AM} RAMP 'TCKEHGE BIASING.C CONVERT C-P(e-) PULSE-HEIOE! SPECTRA TO ENERGY WEI3SEDC GAM4A SPECTRUM.C
DIMEKSICK FLZL(S11) ,EHEL(511) ,HES(51i) ,RAPS{511|,XEH»E(5il) ,PAPS(511) /EBBG?(5U} ,WHICW(SL1},"SWHaMP(5U) ,ETR(511) ,FHLV(511) / tagf i (5i l ) ,GBMS(.5IL5,Zoxje(511) ,TEPS(511) ,CHICIf(51iJ
Cr e a l * 8 BETA,DET,TMEF,ETl,CEMaX,cielt,ET2,HEXr
FNBME*15,FIIIB«IE*72,]mE»T*72,JDEirr*72/1PAMM*3, ACC*3 /DEFI*6,FEHaM*lS
CC THE LOG OF ENERG? AT SHY CHftHKEL I, EDOG(I), IS RELATEDC TO I, THE CHANNEL NUMBER, IBS/ THE CHANNEL "6b \ h"' rHCMC RANGE4A, AND THE CALIBRATICM E1CICR, CAL, BTC
ELOG(I) = (FLaAT(lHKEBS) -1-0 )/64. CALCC WHERE CAL = ALOG( (LVL/GMAX) *FSEZA/4Q96).C ELOG IS THE "IONIZATiaM" ENERG7, SOT THE "TRUE" ENEHG5T-CC WE WILL WHTH'TTJ: ELOG WITH TRUE EHEHGT BE PLUITUC A H2C DECAY SPECTHJM CK THE SAME SCALE AND HITERCOMFARI2IG THEC KHCWf ENERGY OF THE DECAY END-POUfT AND THE SCALEcC WKXA IS THE PRODUCT OF THE FULL-SCALE ENERGY" ANDC MfTT.TIPLICATiaW A. FSEXA IS FI2ED AND SUST BE IDENTICALC FOR ALL A VALUES. LVL IS THE ADC Y CHART BIAS AND MAXG ISC THE MAXIMUM GAS GAIN.CC FROM THE ENERGY E AND THE SLOPE TAKING FULL FRACTIONAL WH7TH £W ASC
ETfflM( E) =SQRT( F/?*F#H). 1 7 / E )C
1 FORMAT(37H INPUT FILE NAME FOR THE HEADER DATA. }2 FORMAT(6E12.5)3 FORMAT{8F8.0)4 FORMAT(10F8.1)5 FOHMAT(///16H HMPSNS QUTFUT. //)7 FORMAT(1QF8.2)
146
8 FORMAT(44H mrercxs) iao HEGRTIVE TC DELETE SISC SAVE.9 FORMAT(//9H ENERGT,1QH
1Q F0RMAT(I5)11 FOHMAT(//32E TOTAL POINTS AND STARTING POINT 218/X17H ADC Y-BIAS LEVEL 18 /X19H MAXDiM GAS GAIN = EI2.5/X2SH THE BUN TIME IN SECONDS = 18 /X34H THE CALIBRATION TIME IN SECOHDS = 18 / / )
12 FORMAT(40H INPUT A 1Q CHAR. HEADER DATA FILE NAME. J13 FORMAT(A)14 FQRMAT(7H MAX= E l l . 4 )15 PCHMBT(47H MPUT A 10 CHAR. aECCIL-PHOmH DATA FILE HRME. )16 FQHMAT{iaH FRST DEC = 1 SEV )17 FQFMAT(51H INPlir(E12.5) THE REFERENCE CALI3RATIQK EMEHG? ERF. /
X53H THEN INRJT{D15.a/) THE TOP 5 PQL"ZIO!IAL CCEFFICJEPTIS /XSOH IN AN M=€ LSQPOL FIT TO THE RATIO OF THE OBSERVED VSRlASiaW
/XS2H QF NEUTKH SPECTIOI (PER LETHARG5T) TO THE ERF VALOE /X36H AS A FUHCTIOH QF X=IiDG{ ENEHGT/ERF). /)
18 FQRMKT(2I8)19 FORMKT(Fia.3,E11.4,E10.3,F6.3)20 FQBMa!T(4aE INPUT A 10 CHARACTER FILE NAME FOR THE SAVED /
X24H FINAL HEUTKXT SPECTRUM. }2 1 FQRMAT( ' INPUT THE FILE NAME FOR THE CALIBRATiaff SPECTHM ' J22 FQRMAT(/51H LIST KWRHtrrKS AMD THEN LIST PHOTOW
SPECTRA(/LETHZ)//)23 FQRMAT(4D15.8)24 FOKMAT(10F8.3)25 FOBMAT(8E10.4)
950 FORMAT(37H MPUT(E12.5) THE ENEHG5T SCALE FSKXA.)951 FQRMAT(45H INPOT(E12>5) THE HSDHOGEN ATOM tlJfltNT HATM.}952 FQFMAT(35H THE LOGGED TEST PULSE COUTHS/SEC = E12.5 /
X28H INPUT(E12.5) OJWRELT VALUE. )953 FOHM»r(43H INPUT(E12.5) UPPER EHEBGT LIMIT IN OUTPOT. J
1QQ1 F0FMAT(15I5)9091 FCMQHiM)
C
NDRD=348C INPUT THE SPECTRUM OF C~P PF^TT-^ GBMS AND THE TESTC PULSER SPECTRUM TIME TOGETHER WITH OTHER DATA AS PRCDUCEDC BY THE ANALYSIS QF THE RAW DATA IN RANGE.FORC
DO 7311 J=i,511RAPS(J)=Q.QFLXL(J)=Q.QRES(J)=0.0ERFL(J)=0.0TIME(J)=0.0PAPS(J)=0.QENHGX"(J)=0.0WEIOK(J)=0.a
147
t J) =Q.QGAMS(J)=Q.QTAPS(J?=0.C
()CQDE(J)=0.QTEPS(J)=Q.a
7311 CXHttSVE165 WRITE(*,15)
READ(*,13) BHAHEOPE»(ia/FII£=FmiC/PQRM=IEQFMft!ITED',STATUS='OLE'READ(I0,13) EHAMEREAD(ia,13) IDEKT
IEE»rC NET MB IBS ARE TEE TOTRL POINTS AW3 THE STRHTIHG POIMT.
READ{10,18) MSECREAD(10,1001) MPTREAD(10,1001) IBSHEflD{10,18) LVLREflD(lQ,2) OJftXREflD(10,9091) DEFIREflD{lQy2) (GaMS{I),I=l,fHPT'JFEAD(10r2) (HAPS(I),I=I,»PT)REflD(lQ,7) (TIME(I),1=1,HPT]djOSE(lQ)
CC . . . . . . G E T RID OF THE NONSENSE NUMBERS...Cc DC 6715 I=1,HPTC IF(TIME{I).LE.0.0)TIME{I)=1.0c IF(GB»B(I) .LE.0.Q)GME(I)=O.QC6715 CCHTINUECc
1831 PDFMAT(6X,' O « X i s 1 , E 1 2 . 5 , ' i ± B i s 1 , 1 4 }C
C READ Tffi CALIBRAnCH SPECTRA. THESE DCI1JCE BOTH 'WHITEC ICHIZATICW WHICH, AMD 'WHITE AMPLITUDE' WHPMF ASC DERIVED FRCK TBE SPECIAL TEST PULSE CKJBRKTIClf BUfC OPTION Bf RAMPDA.C
WRITE(*,21)READ(*,13) FLHMCOFEW(i0,FILE=FL«AIC,FaH!f= ln»«rrED' ,STATU5=1OLDt)READ(10,13) FLUME:READ(10,13) JCEHTWRITE(*,13) EIJBIKWRITE{*,13) JDEMTREAD(10,18) KSEC
148
READ(1Q,2) CFSREAD<10,18} NNIIREAD(1Q,2) GGGGREAD(1Q,2) (HBX0V{I),1=1,511)READ(ia,3) (WfflMP(I), 1=1,511}CLOSE(IO)WRITE{*,11) NPT,IBS,LVL,C3fflX,NSEC,KSEC
CC RE-ENTER CPS. VRLUE FROM CALIBRATION MAY BE INCORRECT I F RAMFC RANGE LIMITS E^'ty'i» TABLE LIMITS.
WRCTE(*,952) CPSREAD(*,2) CPS
CC INPUT DATA WHICH INCLUDES THE POLDDIOG:C 1) A VSLDE FOR THE PRODUCT OF FULL-SCSLE ENEHG? ANDC GRS BOLHELICflUCir, FSEXa. F S E X A I S A (JJNSZBNZ R3R ALL A.C FRCK I T , THE QUANTITY CAL I S DERIVED TO ALLOW CCWVERSICNC OF THE LOG CHANNEL SCALE APPROPRIATE TO THE RAW DATA TOC LOG_EMEHGr. USING FSEXA, CAN FORM THE "ICHIZATiaN"C ENERGY MESH, ENRGY( I ) .C
WRITE{*,95G)READ{*,2) FSRXACAL = ALOG< (EL0AT(LVL)/O«AX)*FSEXA/4a9€.)
CC ASSUME A W CUTOFF, «CTOFF, OF -3 KEV FGR GAS.C
WCTOh't—.3D07Q5 1=1, NPT
705 ENRGY( I ) = ( e ^ > ( e l a g ( i ) - 1 . 0 0 1 5 3 4 } +SCTOFF}ETOP=ENRGY( NET)EBOT=ENRGT{1)
CWRITE(*,2831)EaOTWRITE(*,2a31)ETaP
2831 format(SX,'EBOT/ETOP I S I , E 1 2 . 5 )C****** p l o t s t h e raw d a t a generated fay RANGE ******C
PAUSE' PLOT GAMS'CALL PLARRAr{GJWS,NPT,EBOT,ETaP)
Cc****** plots the tine array generated fay rnprdna ****C
PAUSE ' PLOT TIME 'CALL PLARRArcnME,NPT,EBOT,ErOP)
CC SHUT THE CALIBRATION SPECTRUM TO CONFORM WITH IBS AS THEC INITIAL POINT AND NPT AS THE POINT COUNT; SMC AS FOR THEC DATA SPECTRUM. EDIT THE DATA USING PLOT ROUTINE.C
DO3QQQ 1=1,NPT
149
3Q0Q WHflMF{I)=WHftMF(ri]>PAUSE ' PLOT WHAMP 'CALL PLAHRAY(WHAMP,SPT,EBOT/ET0P)
CC WEIGHT WHJON USING AN ARBITRARY ENERGY-DEPENDENT TERM TGC REDUCE DEPENDENCE OPCK CHANNEL WMEER I. THEN PICT.C
DO2S88 1=1,NETII=I-KEBS-1AMUL=EXP(FLOAT{II)/S4.)
2888 WHICN(I)=WHION(I)/AMULPAUSE ' PLOT CHANNEL-WEIGHTED WKTON 'CALL PIARRAY(WHICK,NPT,EBOT,ETCP)
CC SMOOTH THE TIME SPECTRUM AMD PLOT-
CALL SMCCTH(TIME,NPT)PAUSE ' PLOT THE SMOOTHED TIME SPECTRUM 'CALL PIARRAY(TIME,NET,EBOT,ETOF5
CC NOR^!ALIZE THE DATA SPECTRUM TO SMOOTHED TIME SPECTRUM.C THEN PLOT THE TIME NORMALIZED DATA SPECTRUM.C
DO2806 I=1 ,NPT28Q6 PAPS(I}=GAMS(I)/TIME{I)
PAUSE ' PLOT THE TIME NORMALIZED SPECTRUM 'CALL PLARRAY(PAPS/NPT,EBOT/ETOP)
CC FORM THE CALIBRATiaN RATIO WHION/1SHAMP AND DEMOTE BYC FRLV. SMOOTH AND PLOT.C
DO1709 I=L,NPT1709 ERLV(r)^«HiaK(I)/WHAMP(I)
CALL SMOOTH( FRLV, NET)PAUSE ' PLOT SMOOTHED CALIBRATION RATIO 'CALL PLARRAY(FRLV,NFT,EBOT,ETOF)
CC FORM THE rar.~mRA^ i (ni-mRWkt 'I'KU ABSOLUTE DATA SPECTRUMC PER UNIT ENERGY. USE THE TEST PULSER COUWTS/SEC CPS TOC SCALE FLUX TO Aff ABSOLUTE VALUE. ALSO REQUIRE ENERGY,FSE,C CORRESPCBDING TO ACTIVE CUUHTUHi REGIOH, WHICH IS 4Q96-C LVL RATHER THAN FULL 4096.C
FSE=FSEXA*FL0AT(4a96-LVL) /4096.DO1890 1=1,NET
1890 GAW5(T)=CPS*GRffi(I)/(FSE*FRLV(I))PAUSE1 PLOT NORMALIZED {NOT TIME) GAMS SPECTRUM WITH
X CHANNEL WEIGHTING 'CALL FLARRAY(GAMS,NPT,EaOT,ETOP)
cDO1823 I=1,NPT
1823 PAPS(I)=CPS*PAPS(I)/(ESE*FRLV(I})PAUSE ' PLOT NORMALIZED SPECTRUM WITH CHANNEL WEIGHTINGCALL FLARRAY{PAPS,NPT,EaOT,ETOP}
150
CALL PLTOUTC
PAUSE f PRINTER IF WANT TO SAVE OUTPUT. 'WRTTE(*,5)WRHE(*,13) FNAMEWRITE(*,i3) IDESTWRTTE(*,9)DO723 I=1,NFT
723 WRITE(*,i9) ENRGY(I),GRMS(I),ERFL(I) ,RES(I)WRTTE(*,22)WRITE(*v25) (ETR(I),I=1,NPT)WRITE(*A25) (GAMS(I),I=1,NPT)
CC SAVE DAia ON DISC OR DELETE SAVE IF IGO NEG.
WRTTE(*,8)BE2yD(*,lQ) IQ3IF( IGO)165,718,718
718 WRITE!*,2Q)REftD{*,13) FNftMEOPEN( 10/FXLE=ETIftME,STATUS=fNEWt)WRITE(10,13) FNftMEWRITE(lQr13) IDEMTWRrTE(lQ,lQ) NETDO724 I=1,NPTWRITE( 1Q, 725) I,ENRG£( I) ,PAPS(I) ,GAMS( I)
7 2 4 COMTIMIIE725 FOHMar(4X, 13,2x,3 (E12.S,2x))
OJOSE(IQ)C
GO TO 165END
CC THE ROUTINE: SMXrrH(A3frH,NPT) PRODUCES THE SMOOTHED ARRAY ASMTHC FROM THE: INEUE ARRAY. ARRAY CONTAINS NPT POINTS.C
SUBROUTINE SMQOTH(ASHIH,NET)DIMENSION ASWH(511),RES(511)
CC SMOOTH THE ARRAY ASMTH TWICE OVER 5 ADJftCENT POINTS.
KKX=-2184 DO179 I=1,NPT179 RES(T)=ASMTH(I)
ASMTH(1)
ASMTH( NPT) =SES (NPT)ASMTH (NPT-1) =( RES (NPT)+RES (NPT-1)+RES (NPT-2)) / 3.1=3
173 IMIN=I-2
IF (IMAX-NPT)170,170,180170 DMM=0.0
DO172 J=IMIN,IMAX172 DMf=DMM+RES(J)
151
ASMTH(I)=EMl/5.1=1+1GO TO 173
180 KKK=KKK+1IF(KKK)184,183,I83
183 RETURNEND
CC SUBROUTINE FLARRAY SCALES AND PLOTS THE ARRAY TEMF.C
FUNCTION ELAHBAY{TEMP,NPT,EB0T,E3DP)C
DIMENSION TEMP (511)1 FORMAT(27H INPUT (F8.1) ENERGY MARKER )2 FORMAT(F8.1)3 FORMAT(16H ENERGY LIMITS = 2F8.1)4 F0RMAI(16H ENERGY MARKER = F8.1)
C NABS AND NORD ARE X AND Y POINTS AVAILABLE FOR PLOTTING.C NABS=640C NORD>=200C GET MAXIMUM VALUE OF SPECTRUM: FJCR PLOT NORMALIZATION.
PMAX=0.0DO30 I=1,NPTIT(TEMP( I) -PMAX) 30,30 ,31
31 PMAX=TEMP(I)30 CONTINUE
C INITIALIZE TO PLOT TEE CONTENTS OF Tffi TEMP ARRAY.33 WRITE(*,I).
READ(*,2) ENGYIF(ENGy)34r34,35
35 IF(ENGy-EBQT)33,36,3636 IFfENGT-ETOP)37,37,3337 CALX PLTUNIT
WRITE(*,3) EBOT,ETOFWRITE(*,4) ENG?NDEK=2CALL LINLOGAX(NABS,NC»D,NDEK)
C PLOT THI TIME NORMALIZED SPECTRA.DO32 I=1,NPELXY=IFIX( .95*TEMP( I) *ELQAT(NORD) /PMAX)LXX=IFIX(FLOAT( I) *FLQAT(NABS) /FLQAT(NPT))
32 CALL SFLrfLXa^OY,!,!)LXX=IFIX(FLaAT(NRBS) *ALOG(EHG3r/EBOT) /AL0G(ET0P/EBOT))CALL SPLT(LXX,G,1,NDRD)CALL PLTOUTGOTO 33
34 RETURNEND
CC ROUTINE UND0GAS:(NABS,N0RD) DRAWS A VERTICAL MARKER AND AC HORIZONTAL LOGARITHMIC MARKER OVER NDEK DECADES.C
FUNCTION LINLCGAX(NABS,NORD,NDEK)
152
cC FIRST DRAW VERTICAL TICKS.,
CALL SEET(Q,G,1,BDRD)IDEL=NDRD/1QLNGTH=NABS/4GD01 1=1,1QCALL: SELT( Q, I T , - 1 , LNGTH)
1 IY=IY+ir3ELC THEN DRAW HORIZONTAL LOGARITHMIC TICKS.
CALL, SELT( 0 , 0 , - 1 , N A B S )IDEL=NABS/NDEKSCL=FLQAT(TTTEL)LNGTH=»0RD/25
D02 I=1,NDEKCALL, SFLT(IX,a,l,LNGrH)
2 TK—IK+inELIX=IF2X(SCL*ALOG{2.)/ALOG< 1 0 . ) - 1 .
D03 r=l,NDEKCALL, SPLT( IX,. Q, 1,LSGTH)
3 IX=IX-<-IDEL:IX=IFIX(SCL*AL0G{4.) /AL0G( 10.) -1.)D04 I=lrNDEKCALL S5nr(JX,Q,l,LNGTH)
4 Ty=TX-j-mEr,IX=IFIX( SCL*AL0G( S.) /AL0G( 10 .) -1.)DOS r=l,NDEKCALL, SELT(IX,.Q,1,LNGTH)
5 TX^TX-HPra.HETOKNEND
Cc EtMcnas PLTINIT INITIALIZES: PLOTTIIG BOUTISES.c
FOSCTION
cCALL, 05MQCE( 6)RETURNEND
cC SUBRCtfTINE: SELT(IXrir,IHV,LNGIH) PILOTS CH Tffi SCREEIf AC VERTICAL^ IKT POSITIVE) LINE OR A ECHIZOHTAL( IHV NEGATIVE) LINEC OF LENGTH LNGTE STARTING AT IX AND 1 7 .C
FUNCTION SPLT(IXrIY,IHSr,LNGIH)C
IF(IHS-) l r 2,21 NX=IX+LNGTHCALL QLINECIX,!?,!!!,!?,!)RETURN
2 NT=IY+LNGTH
153
CALL QLINE(IX,IY,IX,NY,1)RETURNEND
CCc FUNCTION FI/TOUT RETURNS FRCM PLOTTING ROUTINES.c
FUNCnQN PLTQUT
cCHAHACTER CHAR
C 1 FOHMAT(A)C. HEAD(*fl) CHAR
CALL QinrarcraMi,o)CALL QSM3DE(2)RETURNEND
L54
Appendix C: TDIST.FQR
CcC:C TD1ST.FORCC A SHORT PROGRAM THAT CALCULATESC THE DISTRIBUTION QF COMPTON RECOIL. ELECTRONSC Itf ENERGY GIVES THE; INCIDENT GAMMA FLUX ANDC GAMMA ENERGY.C.. . . . . .C: IN. THE KLEINHSISHINA TREATMENT FOR THE SCATTERINGC: OF AW UKPOLARIZED: PHOTON OFF A FREE ELECTRON, THEC NUMBER VS. ENERGY DISTRIBUTION: OF A STRUCKC ELECTRON OF KINETIC ENERGY T FROM THE SCATTERINGC OF A PHOTON: OF ENERGY E AND A rFREE ELECTRON ATC REST1 IS GIVEN BY dPE(E;T),;:CC dPE(!E;:T); = dT*CONST*{2+(S12).*[( I/ALP2) +• (S2) -C 2/(ALPHA*SI)j>C:C ALPHA = ECIce\Fl/511.aC ALP2 = (ALPHA)**!C SI = [T/(E-T)IC SI2 = (SI)**2C S2 = (E-T)/EC CONST = 1.1416*(2.8LaE-13: cut) **2 / ALP2*51L (fceV)CC SO) dPE(E?T). HAS: UNITS OF cm2/keV-ELECTR0NCC THE ENERGT DISTRIBUTION: QF A RECOIL ELECTROJT OFC ENERGY TI ARISING: FROM THE COMFTOR SCATTER OF Ac PHOTON: OF ENERGY E, IS GIVFJT BY THE FOLLOWUKI:cC PE('E;T)j = Z*{ dPE(E;T) h*Ka FROM Q TO TICC A NUMERICAL SUMMIHG QF THE TERM dPE(E;TJ ISC PERFORMED; BY THIS PROGRAM.^^^i tt %J fti 4Bj kj tt> ttl) ftj tt. C't 4 j Ml tt. Ql' ft] ftj Si tt!i #$• A] ttj ftl ^' 9- ^ Vj ^ tt> A* 4|j ffi Kj A- AD ^ Aj ttJ ft Ar A1
ft] #1 ^1 V1 • : ftb Aj fli 01' 4IF Aj A #*> 4 i ^ 9- •!< ttl' ^
cC HAVING OBTAINED PE(:E;T); , THE: RECOIL ELECTROS:C DISTHIBUTIQIt ARISdG FHQM GAMMA RAYS OF ENERGYC Ep RED(T;E) IS GIVEW BY THE: PRODUCT:;CC REDCTT-E); = GAMMft.CE),*BE('EjsT)iCC AT THIS POINT THE GAMMA SPECTRUM IN BIN FORMC SHOULD BE INPUTED)CC FURTHERMORE, THE! TOTAL RECOIL ELECTRON
155
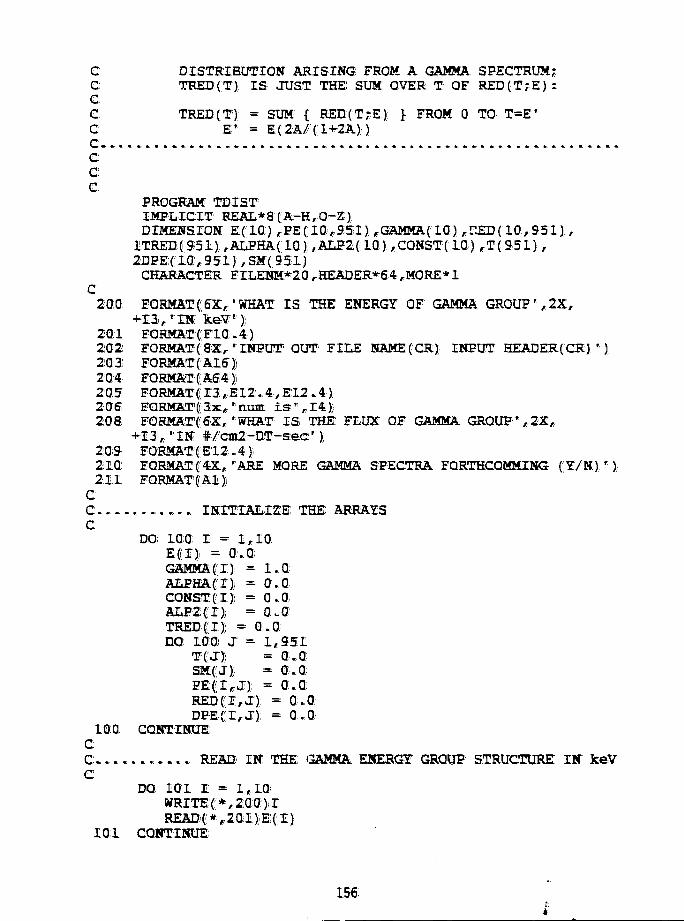
C DISTRIBUTION ARISING FROM A GAMMA SPECTRUM?C TRED(T) IS JUST THE: SUM OVER T OF RED(T?E):CC: TRED(T) = SUM { RED(T;E) } FROM 0 TO T=E'C Er = E(2A/(1+2A))
CCC
PROGRAM TDISTIMPLICIT REAL*8 (A.-H,0-2),DIMENSION E( 10) rPE( 10,951) ,GAMMAf 10) ,FJED( 10,951) ,1TRED(951) ,ALPHA(10) ,ALP2( 10);,CONST( 10) ,T(951) ,2DPE(mr95ll ,SM( 951)CHARACTER FILENM*20 rHEADER*64,MORE*1
C200: EQRMAT(;&Xr'WHAT IS THE ENERGY OF GAMMA GROUP',2X,
20)1 FORMAT (:F10. 4)202 FORMAT(:8:Xr
rINPUT: OUT FILE NAME(CR); INPUT HEADER(CR) ' )203 FORMATfAlS)]204 FORMATS A64)]205 F0RMAT :(T3ffE12.4rE12.4)206 EQRMAT(3xJ,'
!nuin: I s ' , . 14 ) ;208 FORMATfex,. "WHAT IS THE: FLUX QF GAMMA GROUPr,2X,
+13 , " IN #/cm2;-DT^s:ec");2QS FORMAT(E12.4);210: FORMAT1('4X:,'ARE MORE GAMMA SPECTRA FQRTHCOMMING (Y/N) ' )211 FORMAT('AI)i
CC............ INITIALIZE THE ARRAYS
DO 100; I = 1,10;Efl)) = 0.0;GftMMA('I); = 1.QALPHA('I)) = 0.0CONST (I)) = 0.0ALP2('I): = 0.0TRED('I)i = 0.0;DO; l.aa J = 1,951
TCJJ = O.aSM( J): = o.oPEfl^J); = 0.0BEDflrJJ = 0-0DPECI,J} = 0.0;
10 0J CONTINUEcC.. .. READ: IN THE GAMMA ENERGY GROUP STRUCTURE: IN keVC
DO: 101 I = I,,IQ;WRITEC*,2C0;);I
101 CONTINUE
L56
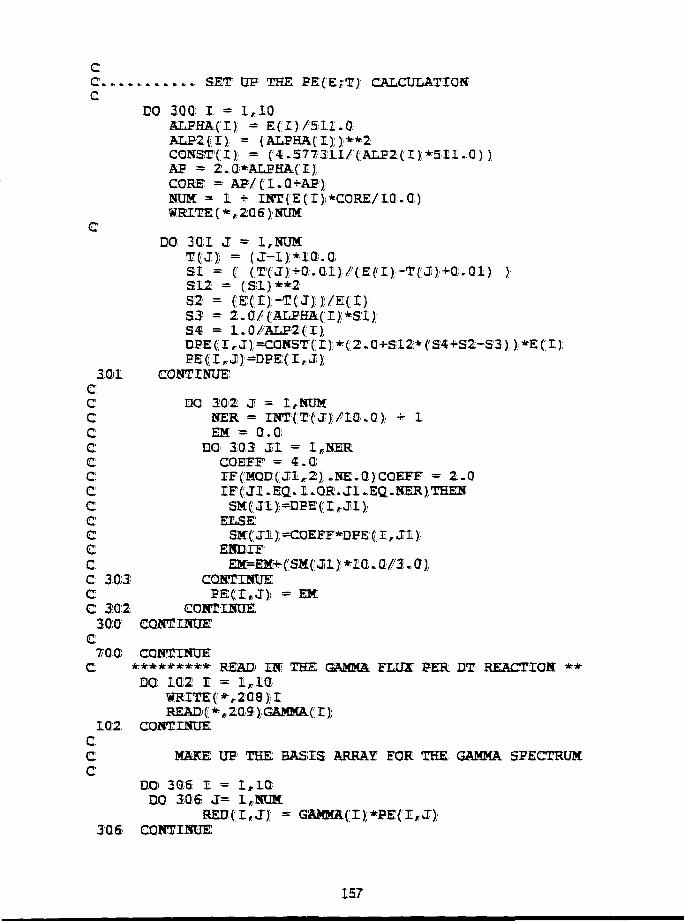
cC . . . . . SET OP THE PE(E;;T) CALCULATIONC
DO; 300 I = 1,10ALPHA (I); = ECr)/511.aALP2(I), = (ALPHA((I););**2CQNST'fr^ = (4.577311/CALP2(r);*511.a) )AP « 2.Q*ALPHA(r)CORE = AP/C'l-a+APJiHUM: = 1 - 1 - IKT(:E(r);,*CORE/10.0)>WRITE (* , 206 )NtIM
CDO; 301 J = 1,NUM:
51 = (' (;TICJJ:+0:.01);//fE(.T}/-TfJi)/1+Q:.Q.l). }s i 2 = (;si);**252 = ('Ecr)-T(JlJ:/E(r);53 = 2.0/(ALPHA('IJi*SllS€ = 1.0/ALP2CI);
3;QilcC QO 3Q2 JI = lrNUM:C HER = INT(T(;jJ;/lQ:.Q); +- 1c EM = a.aC DO 303 J l = l rHERC COEFF = 4 . aC IF(MQD(.Jl/,21i..NE.Q:),COEFF = 2.QC IF(fJI.EQ'.I.QK«JI.>EQ.HER),THEKCC ELSECC EHDIFCC; 303 COHTIKUEC PSCr.J l i = EMC 3:0:2 COMTINnE
300) CQMTIMIEC
7QQ) CONfCIMOEC *********** READ) US? THE GftMMS. FLUX PER DT REACTiaH: * *
DO: 102 I = I , iaWRITE c*, 208 );r
102 CQMEIKOECC MAKE UP THE: BASIS ARRAY FOR THE GAMMA SPECTRUMC
DO) 30S I = 1,10:DO 306 J= l^SUM
RED(r,j}; =306 CQMTIMIE
157
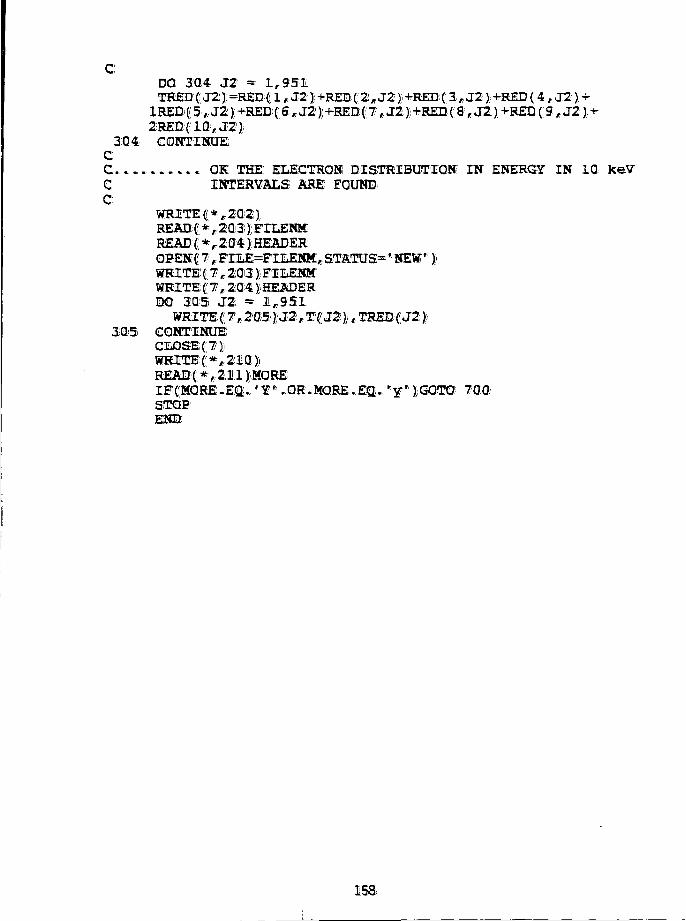
cDO 304 J2 = 1,951TREDC J2); =RED f I rJ2 J;+RED( 2, J2<);+RED( 2, J2);+RED( 4 , J2) +lREDf5>lJ2:);+RED:('6,J2);-^RED(:7,J2);+RED(8,J2)+RED(9,J21 +2REDC !QirJ2);
3:04 CONTINUECC.....-.«.« OK THE ELECTRON DISTRIBUTIOK IN ENERGY IN 10 keVC INTERVALS ARE: FOUND-C
WRITE ((* ,20)21READ (* , 203; J; FILENMREAD(*r204JHESDEROPENJf 7rFILE=FILEMK,STATUS=' NEW
f:)}WRITE C 7 , 203 )< FILENMWRITE; i 71/ 2041HESDER
305 CONTINUECLOSE; ('7))WRITE; (*
EQ;. ry r );GOTQ; 7QQSTOPEND
I53»
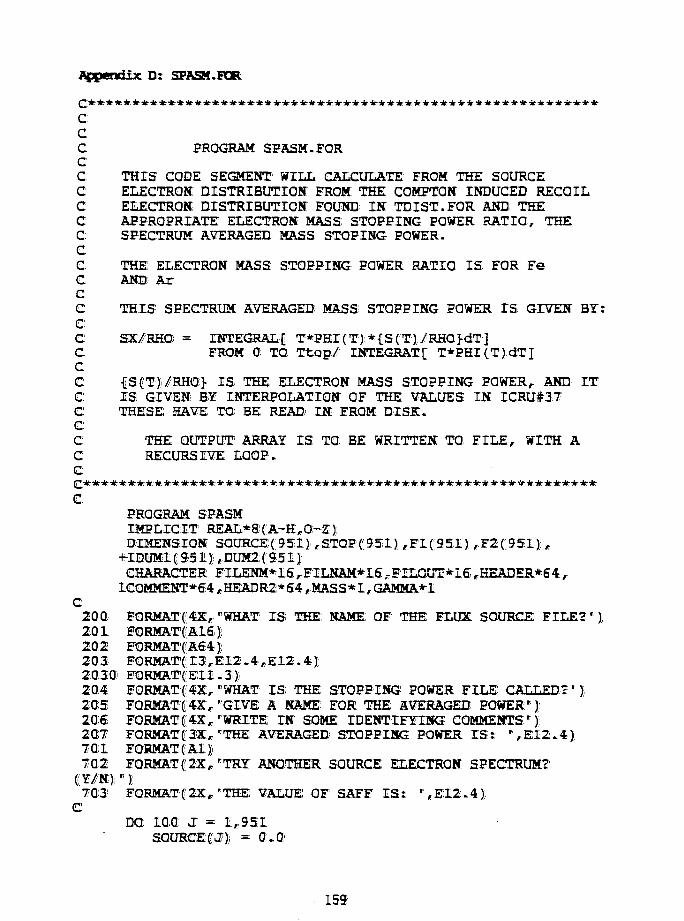
Appendix D: SPASM.FOR
CCC PROGRAM SFASM.FORCC THIS CODE SEGMENT WILL CALCULATE FROM THE SOURCEC ELECTRON DISTRIBUTION FROM THE COMPTON INDUCED RECOILC ELECTRON DISTRIBUTION FOUND IN TD 1ST.FOR AND. THEC APPROPRIATE ELECTRON MASS STOPPING POWER RATIO, THEC: SPECTRUM AVERAGED MASS STOP ING POWER.C:C THE ELECTRON MASS STOPPING POWER RATIO IS FOR FeC AND) ArCC THIS SPECTRUM AVERAGED; MASS STOPPING POWER IS GIVEN BY:CC SX/RHO = INTEGRAL^ T*PHI(T);*{S(T). /RHO]-dTjC FROM Q TO Tfcop/ INTEGRAT[ T*PHX(T).dTICC £S{'T))/RH©1 IS THE: ELECTRON MASS STOPPING POWER, AND ITC IS GIVEN? BY INTERPOLATION OF THE: VALUES IN ICRU#3:7C THESE SAVE! TO; BE READ- IN FROM DISK.CC THE OUTPUT1 ARRAY IS TO BE WRITTEN TO FILE, WITH: AC: RECURSIVE LOOP.C:
PROGRAM SPASMIMPLICIT REAL*8 (A-HrQ:~Z)j
SOURCE(S5I} rST0P('951) , F I ( 951); , F 2 ( 9 5 1 ) ; ,i ,,DUM2('951}
CHARACTER FILENM*16,FIIJSAM*L6,rFILOCrr*ISrKEADER*64:rICOMMENT* 64 HEADRii* 64 MASS* 1 , GAMMA* 1
C2Q;0; FQRMAT( 4X,, "WHAT I S THE; NAME OF THE FLUX SOURCE FILE?*)2QL FORMATCAL6):202 FORMAT'CAe*):203 FQRMAT(;i3(FE;12.4>E12.,4);2030) FORMAr(;EII.3;)(204: FQRMAT1(['4X:ff
t'WHAT IS THE STOPPING POWER FILE; CALLED?*)205 FQRMAT'C4Xr "GIVE A NAME; FOR THE! AVERAGED POWER*);206 F0RMAT((4X,,rWRITE; IN SOME! IDENTIFYING COMMENTS*)207 FQRMAT^X:,. rTHE AVERAGED STQPPISG POWER ISr ",E12.4)701 FORMATfAl)-702 F0RMAT(f2X:, rTRY ANOTHER SOURCE ELECTRON SPECTRUM?
703 FQRMATC2X;,.'THE VALUE OF SAFF I S t r ,E I2 . ,4 ) :C
DO 100 J = 1 ,551SOURCECJi} = a.O;
159
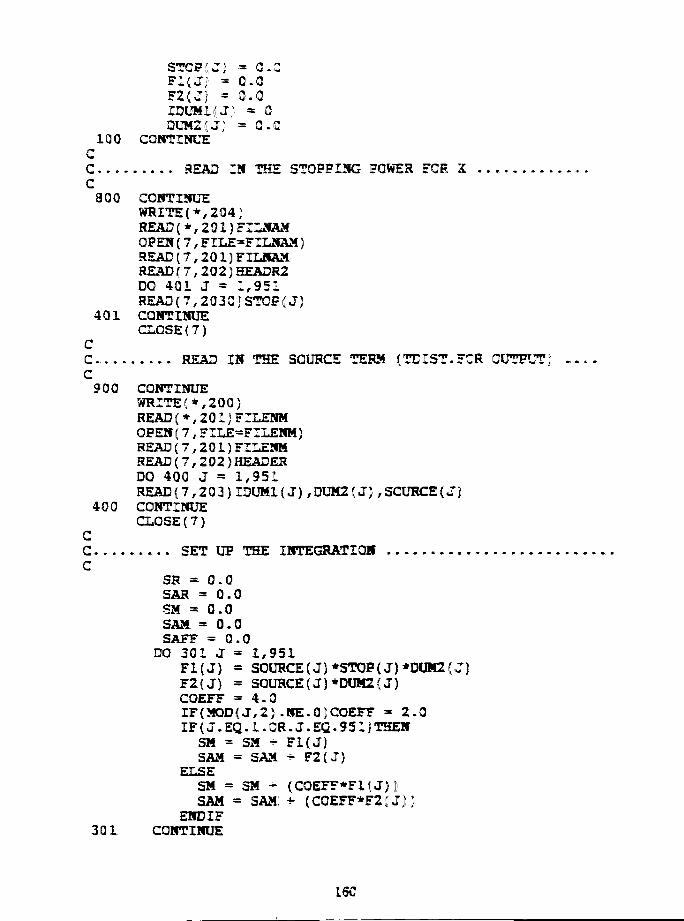
STCPJJJ = Q.SFL(JJ =0.0F2(Jj' = 0.0IDUM1(J; ~ GDUM2fJ} = Q.Q
IQQ CONTINUECC SEAD IN THE STOPPING FCWER FOE X ,C800 CONTINUE
WRITE(*,204)READ(*,201)FILNAMOPEN(7,FILE=FILNAM)READ(7,201)FILNAMREAD(7,202}HEADR2DO 401 J = 1,951HEAD{7,203C)STOP(J)
4Q1 CONTINUECLOSE{7)
CC. READ IN THE SOURCE TERM (TDIST.FCR OUTPUT'C900 CONTINUE
WRITE(*,200}READ(*,201)FILENMOP EN(7,FILE=FIL£NM)READ(7,201)FILENMREAD(7,202)HEADERDO 400 J » 1,951READ(7,203)IDUMl(J),DUM2(.I},SaURCE(J}
400 CONTINUECLOSE(7)
CC . SET UP THE INTEGRATIONC
SR = 0.0SAR = Q.OSM = Q.OSAM = 0-0SAFF = Q.QDO 301 J = 1,951
F1(J) = SOURCE(J)*STOF(J)*DIM2{JJF2(J) = SOURCE(J)*DUM2{J)COEFF =4.0IF(MOD(J,2).NE.Q)COEFF = 2.0IF(J.EQ.1.CR.J.EQ-951}THENSM = SM * F1(J)SAM = SAM: * F2(J)
ELSESM = SM > (COEFF*F1(J)JSAM = SAM! + (C0EFF*F2{JJJ
END IF301 CONTINUE
L60
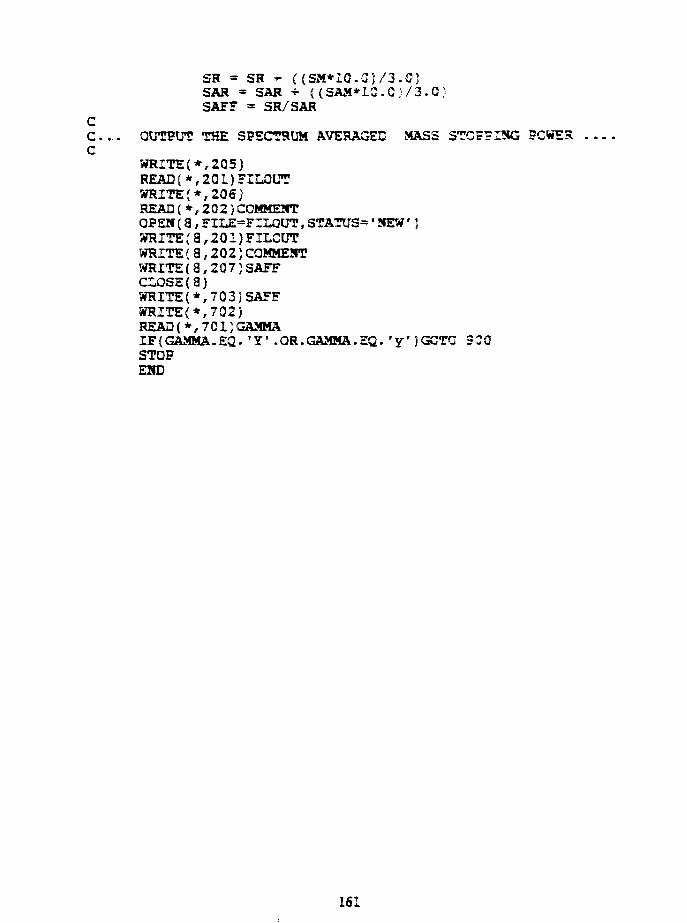
SR = SR * ((SM*10.QJ/3.0JSAR = SAR + ((SAM*lC.GJ/3.0j-SAFF = SR/SAR
CC... OUTPUT THE SPECTRUM AVERAGED MASS STOP?ING POWERC
WRITE(*,2G5)READ(*,2QL)FILOUTWRITE(*,2Q6)READ(*r202)COMMEHTOPEN(8,FILE=FILOUT,STATUS*'MEW'JWRITE(8,201)FILOCTWRITE(8,202)COMMENTWRITE(3,2Q7)SAFFCLOSE(3)WRITE(*,7Q3]SAFFWRITE(*r702)READ(*,701)GAMMAIF(GAMMA.EQ. ' Y ' .OR.GAMMA.EQ. ' y r JGCTC1 SCOSTOPEND
161
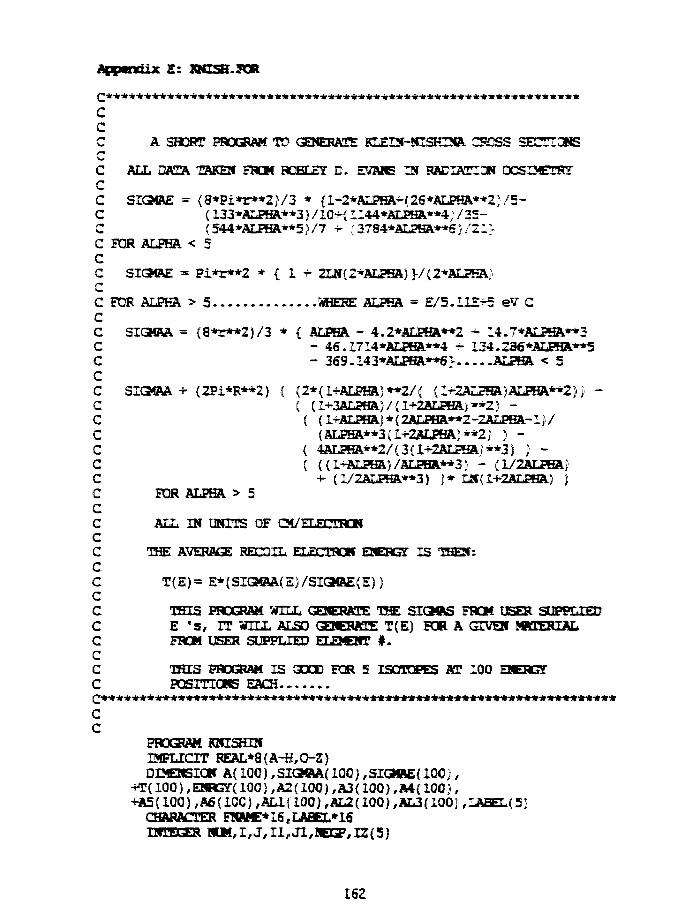
Appendix £ : JWI5H.3CR
C
cC A SHORT PROGRAM TO GENERATE KLEI3-MISHINA CSCSS SECmCMSCC ALL DATA TAKES FROM HOBLEY D1. EV2WE US RADIATION DCSIMETRYCC SIGMAE = (8*P i*r**2 ) /3 * {l-2*ALPHA^(26*ALPHA**2}/5-C (133*ALPHA**3)/10^(1144*ALPHA**4}/35-C (544*ALPHA**5)/7 +• (3784*ALPHA**€}/21~-C FOR ALPHA < 5CC SIGMAE = Pi*r**2 * { 1 +- 2LN{2*ALPHA}>/(2*ALPEA)CC FOR ALPHA > 5 WHERE ALPHA = E/5.I1E+5 eV CCC SIGMAA = {8*r**2} /3 * { ALPHA - 4.2*ALPHA**2 * 14.7*ALPHA**3C - 4e.l714*ALPHA**4 ^ 134.236*ALPHA**5C - 369.I43*ALPHA**6> ALPHA < 5CC SIC3IAA + (2Pi*R**2) { (2*(l-?-ALPHA)**2/( (i^2ALrHA)ALPHA**2)) -C ( (l+3ALFH&}/{l*2AL8HAj!**Z) ~C ( (i+ALPHA}*(2ALPHA**2-2ALPHA-l)/C (ALPHA**3(l-f-2ALPHAI**2) ) -C { 4ALPHA**2/(3(1*2ALPHA)**3} J -C ( {(l+KSHW/aLBB»**3) - (1/2ALPHA)C +• (1/2ALPHA**3) ) * L»(I+2ALPHA) JC FOR ALPHA > 5CC ALL IN UMTTS OF GM/TT.FTIHOWCC THE AVERAGE HBL^TL ELECTRON EJCHLK IS 1HES:CC T(E)= E*(SIGMAA(E)/SI(3ftE(E)}CC THIS PROGRAM WILL GENERATE T5E SIC3«S FROM U S R SUPPLIEDC E ' s , IT WILL ALSO GEHESATE T(E) FOR A GIVEIf MMERIALC FROM USER SUPPLIED ELES0TT # .CC THIS PROGRAM IS GOOD FOR 5 ISOTOPES AT 100 ENERGYC POSmOMS EACH
cc
PROGRAM KZflSHUrIMPLICIT REAL*8{A-H/O-Z}DIMENSION A(iaO),SI3QU(iaO},SIQIAE(iaO},
+T(100),ENRGY(100J,A2(100), A3{100) ,A4{100) ,+A5(1QQ),A6(10C),ALl{100),AL2(100) /AL3(100J,L
CHARflCTER FNAME+16, LAfiEL*16nUEOER BUM,I ,J , I l f J1,HBGP, 12(5}
162
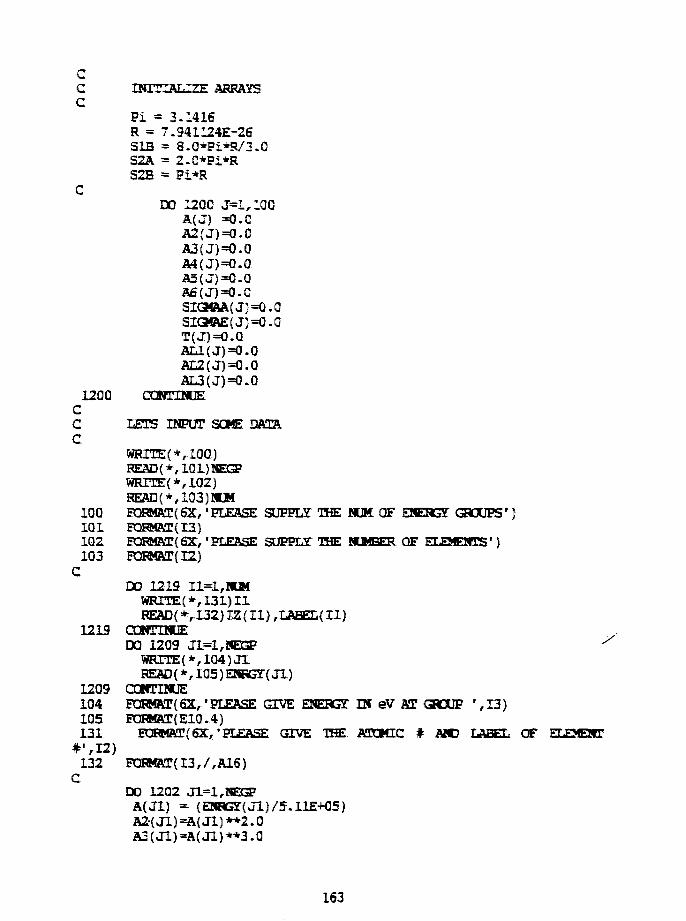
cC INITIALIZE ARRAYSC
Pi » 3-1416R = 7.941124E-26SIB = 8-Q*Pl*R/3.0S2A = 2.Q*P1*RS2B = Pi*R
CDO 1200 J=1,1QG
A(J) =0.0A2(J)=0.0A3(J)=0.QA4(J)=O.0A5(J)=0.0A6(J)=0.QSI(3CVA(J}=0.GSIOCVE(J)=0.0T(J)=0.QflLl(J)=O.QAL2(J)=0.QAL3(J)=0.Q
1200 CGMTUCECC LETS BSPOT SOMEC
WRTEE(*,10Q)
WRITE(*,1Q2)REftD(*,103)!KM
1QQ FQFMffir(6X, 'PLEftSE SUPPLY THE H H OF ESESGI GHUPS' J101 &W&T(I3)102. EQRMRr(6X, • PLEASE SUPPLT THE HUMBER OF ELEMENTS' }103 F0RMAT(I2)
CDO 1219 Il=l,lOfWRTTE(*,131)I1READ{ *,.I32) JZ (II) /IABEL{ II)
1219 CDHnMLEDO 1209 JI=1,HEGP 'WRETE(*,ia4)JlREAD(*,105)ESRGT(Jl)
1209 CQHTINUE104 F0HMaT(6X, 'PLEftSE GEVE ESEHGT HI eV AT OOUP ' ,13)105 POBMAT{E1Q.4)131 E0BMAX(6X,'PLEASE GIVE TfE ATOMIC # AMD LABEL OF ELEMENT#M2)132 POFMAT(I3,/,A16)
CDO 1202 Jl^l^HECFA(J1) = (ENBGJr(Jl)/5.11E+05)A2-(J1)=A(J1)**2.OA3(J1)=A(J1)**3.Q
163
A4(JL)=A{JL)**4.CA5(J1)=A{J1)**5.OA6(JI)=A(J1)**6-QAU(Jl)«(t.Q+A(Jl>JAL2{J1)»{1.Q+(2.Q*A(Jl)})AL3{J1)»(1.Q+(3.O*A(J1)))
1202 CQNTQCEC
DO 12Q3 J1=1,NEGFIF(A(J1) .LE.G.25)THEN
CTERM1={4.2O*A2(J1))TEBM2*(14.7*A3(J1))TEHM3=(46.1714*A4(Jl))TEHM4=(134.286*A5(J1J)TEBM5=(369.143*M( J1J)
TEEW6=(A( J l ) -SK3»A( J l ) =( S1B*TEHM6)
CSEPM1=(2.O*A(J1))SEFM2={5.2*A2(J1))SERM3=(13.3*A3{J1))SERM4=(32.6a57*A4(Jl))SEHM5={77.7143*A5(Jl))SERM6={ 18O..19*Afi( Jl))
SERM7=( SEFM2-SEFMl-SEra!3-^SEFW4-SERM5-*^EHM6-rl. 0)SIOffiE ( J l } =( S1B*SERM7)
CT(Jl)=(ENBGZ(Jl)*(SIO4AA(Jl)/Sia«ftE(Jlli))
Cc
ELSEIF(A(J1) .Grr.Q.25)THEMCCc
UEFM1=AL1(J1)**2UEHM2=AL2(J1)**2Ul=( (2.0*UE2Wl)/(A2(Jl)*AL2( J l ) ) )U2=(AL3(J1)/UEFM2)U3=(2.a*A2(Jl)-2.a*A(Jl)-1.0)U4=( (AL1( Jl.)*U3) /(A2( J l ) *UEHM2))U5=(4.0*A2( Jl))/{3.a*AL2( Jl)*UE3W2)
U7=( 1.0+A( J l ) )/A3( J l )O8=1.0/(2.0*A{J1J)U9=1.0/(2-0*A3(Jl))U10KJ9-U8+U7CH1=CJ1C*U6SIGKJ1-U2-U4-U5-U11SIQ«A( J l ) =S2A*SIG
S2=2.O*A(J1)B3=DL0G(B2)
164
SI<3©E{Ji;=(S2B*(l.G+2.C*E3//32)C
cENDIF
12Q3 cnsnmMcC POT OUTPUT INTO AN ASCII FILEC
WRITE(*,12Q)READ(*,12L)F«AMEOPEN(7,FIIZ=FNAME,STATU5=1NEW1)
WRITE(7,121}FNAMEDG 1300 I1=1,NUM
WRITE(7,122)IZ(I1),LABEL{I1)WRIT£(7,11Q)
Z=DELE(IZ(I1})DO 12Q4 J l^ l^
SGMaE=Z*SIQ«AE( J l )SGST=S3CUS*T(J1)
WRITE(7 r l l l) J1,ESRG5T( J l ) ,SOffiA,SSffiE/T( J l } ,1204 aaffDSUE130Q CONTINUE120 FQRMRT(6X, 'ELEASE GIVE A NAME FOR THE OUTPUT FILE'}121 FOHMAT(/,A16)122 FQHMAT( 6X, ' DATA FOR ELEMENT NUMBER:' , 13 , 2X,A1E}110 FQRMAT(1X,1G»DUE ENERGY eV SIOJAA SIO«AE
•*- T SG£T')111 F0FMAT(4XrI2,f 5( 1X,E10.4))
CD3SE(7)STOPEND
165
Internal
H. AttayaE. BennettM. BUlaneP. BlackburnJ. BreaksH. Chiu (3)0. ChopraH. ChungD. EhstD. EfctingerK. EvansP. FinnA. FischerY. Gohar
External
DISTRIBUTIQII LIST FOfi AML/FPP/TM-257
D. GruenA. HassaneinT. HuaA. HullC. JohnsonT. KassnerA. KraussB. taomisS. MajumciarH. MattasB,. MicklichR., McXnightB. PicolaglouiK. Forges
C. SeedD. SmithD.-K. SzeS.-W. TarnA. TaylorH. ThreshL. TurnerD.-Y. Wang
FFP Files (TO;ANL Contract FileTIS Files (3)ANL Fatent Dent..
DQE/QSTI for distribution per UC-420 (4Q)Manager, Chicago Operations Qffice-DOEANL-TIS LibrariesM'.A.. Abdau, University af California, Los: AngelesS. Berk,. Office of Fusion Energy/U.S. Department of EnergyH. Conn, University of California, Las AngelesY. Ikeda,, Japan. Atomic Energy Research. InstituteC. Kanna, Japan Atomic Energy Research InstituteA. Kumar, University of California, Los AngelesH. Maekawa, Japan Atomic; Energy Research InstituteGv Miley, University of Illinois, UrbanaP.. Palltzer, General Atomics:Y^ Watanabe, University af California, Las Angeles
166