Embed Size (px)
Citation preview
Future Entrepreneurs and Leaders Program
Consumer decision making and public policy nudges
David J. HardistyMay 10, 2014
Hello!
• About me • About you• Please ask questions and interrupt• Let’s take a break half way through

3
Organ Donation
Nudges
• Maintain freedom of choice, while “nudging” people in the right direction
• “Libertarian paternalism”• Decision architecture• Carefully chosen defaults are an example of a
nudge• Public policy tool (also useful in the private
sector)
5
Defaults
Why do they work? • Laziness• Implied endorsement• Status quo bias (loss aversion)
• What defaults do you think we should set, or change, in Canada?
• How about a default application to a local community college?
Johnson, E., & Goldstein, D. (2003). Do defaults save lives?. Science, 302, 1338-1339.
Outline
Nudging consumers towards:• Healthier eating• Public Health and Environmental Decision
Making• Decisions about the future (e.g., saving for
retirement)
Healthier eating
Mindless eating
• How many food related decisions do you make each day?
• Answer: on average, over 200 • Example: Which breakfast cereal
to have? How much to pour? Have another bowl? Add sugar? Skim milk or 2%? How much milk?
Wansink, Brian. Mindless eating: Why we eat more than we think. Random House Digital, Inc., 2007.
Portion size
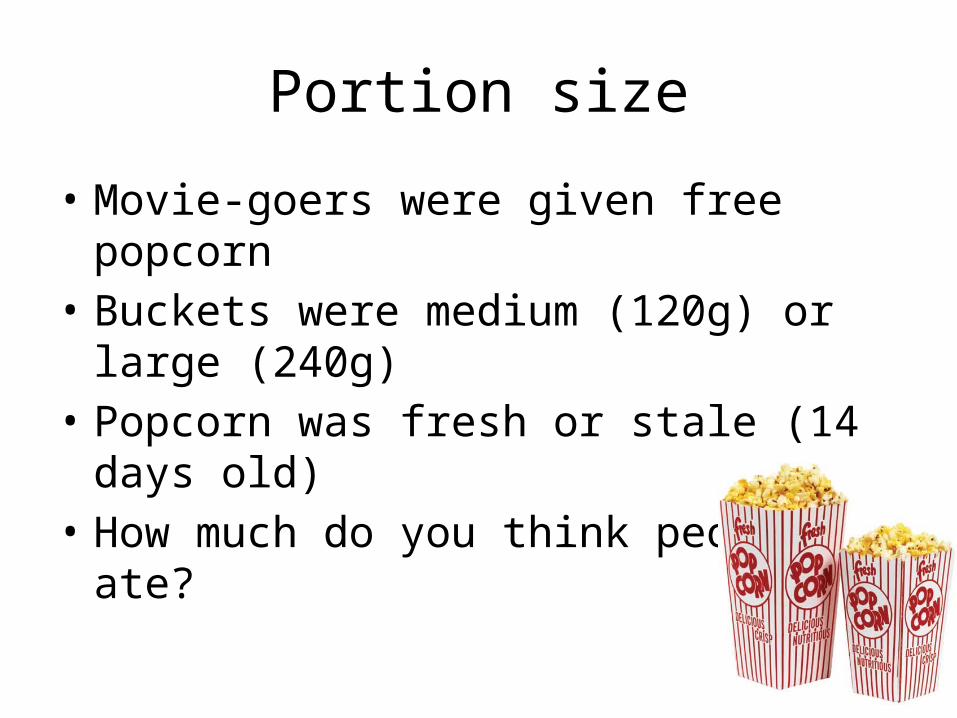
• Movie-goers were given free popcorn• Buckets were medium (120g) or large (240g)• Popcorn was fresh or stale (14 days old)• How much do you think people ate?
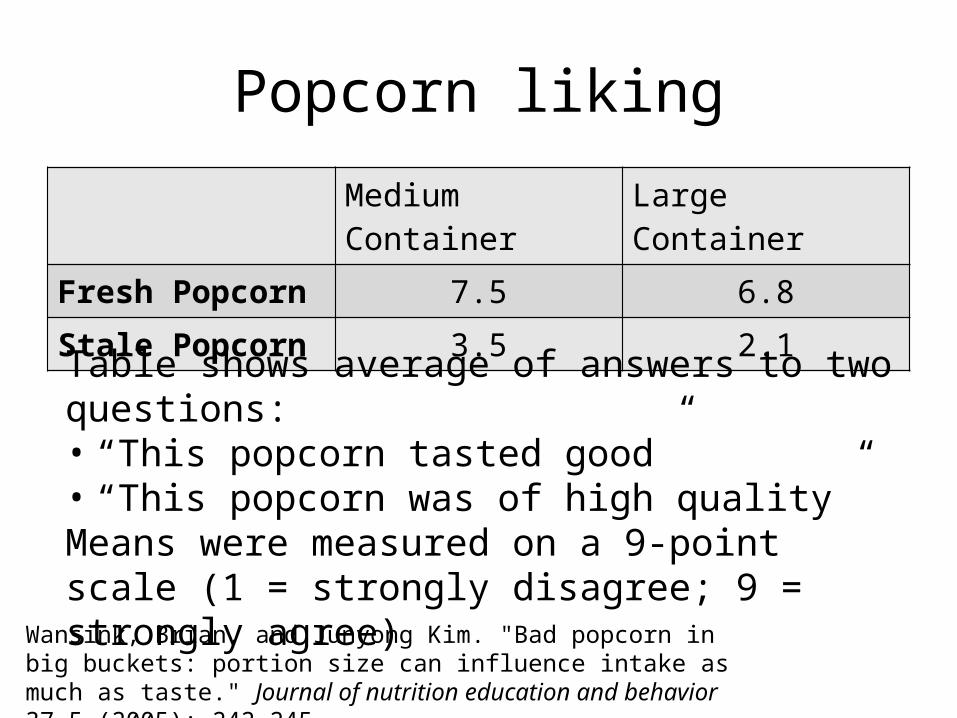
Popcorn likingMedium Container Large Container
Fresh Popcorn 7.5 6.8Stale Popcorn 3.5 2.1
Table shows average of answers to two questions:• “This popcorn tasted good”• “This popcorn was of high quality”Means were measured on a 9-point scale (1 = strongly disagree; 9 = strongly agree)
Wansink, Brian, and Junyong Kim. "Bad popcorn in big buckets: portion size can influence intake as much as taste." Journal of nutrition education and behavior 37.5 (2005): 242-245.
Popcorn consumption
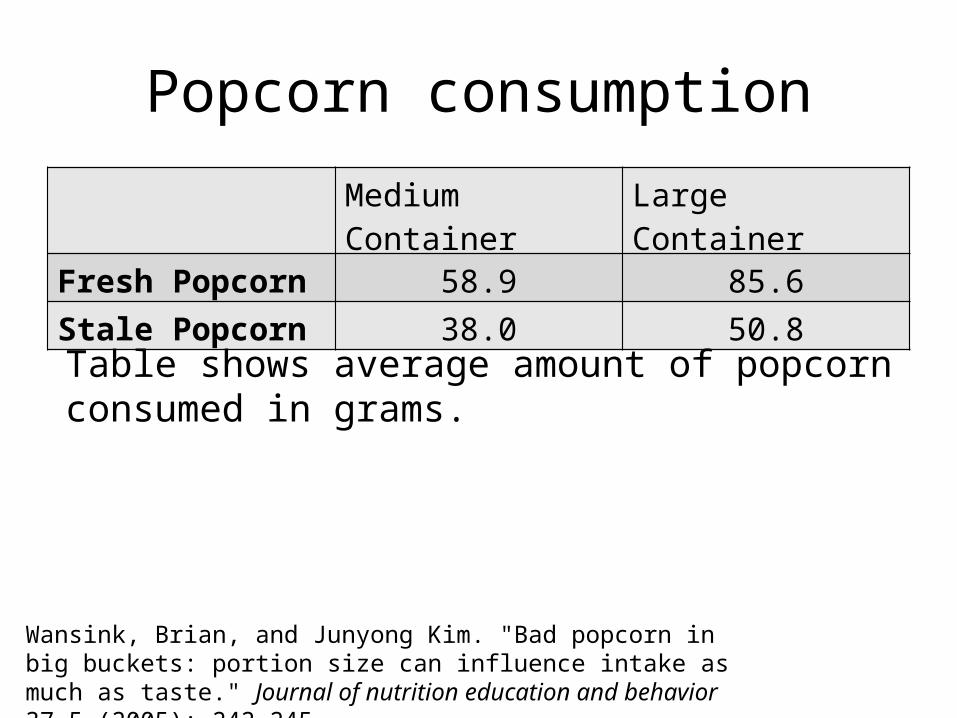
Wansink, Brian, and Junyong Kim. "Bad popcorn in big buckets: portion size can influence intake as much as taste." Journal of nutrition education and behavior 37.5 (2005): 242-245.
Medium Container Large ContainerFresh Popcorn 58.9 85.6Stale Popcorn 38.0 50.8
Table shows average amount of popcorn consumed in grams.
Food container size• Does the container size (as opposed to the portion
size) matter? In other words, does it matter how big the box is?
• Doubling the size of a container of meal-related food (such as a box of pasta) brings an 18% to 25% increase in consumption (Rolls, Engell, & Birch, 2000; Fisher, Rolls, and Birch 2001)
• For snack food, doubling the container increases consumption 30% to 45% (Wansink, 1996)
• Example: Adults at a Super Bowl party served themselves 53% more Chex-mix when presented with 4-liter serving bowls instead of 2-liter serving bowls (Wansink & Cheney, 2005)
• Why? The bigger containers subtly suggest it is “normal” to take more.
13
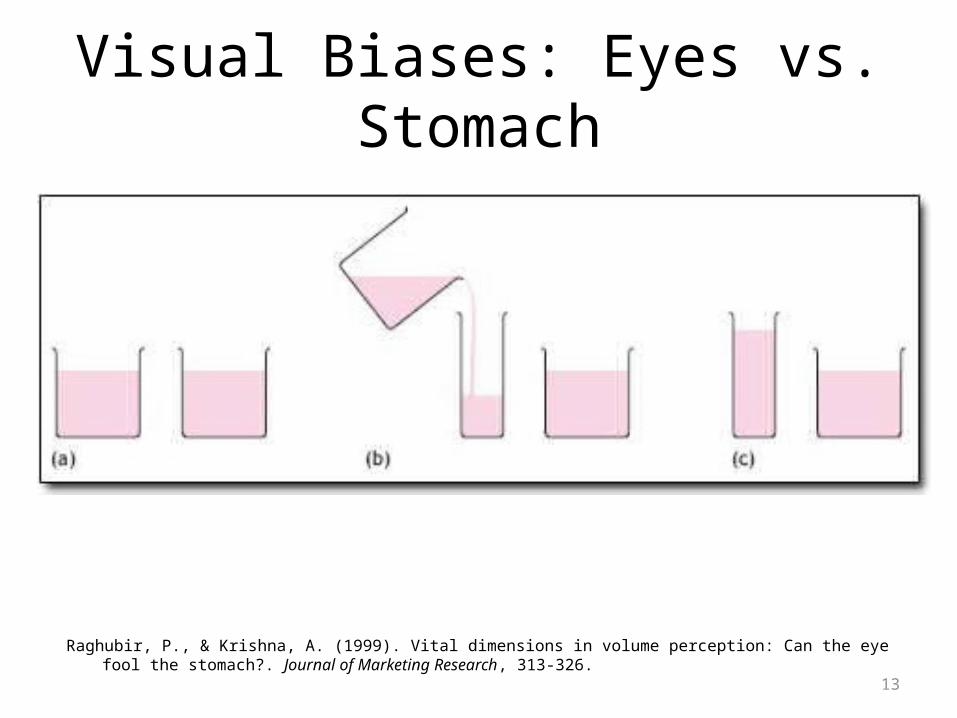
Visual Biases: Eyes vs. Stomach
Raghubir, P., & Krishna, A. (1999). Vital dimensions in volume perception: Can the eye fool the stomach?. Journal of Marketing Research, 313-326.
14
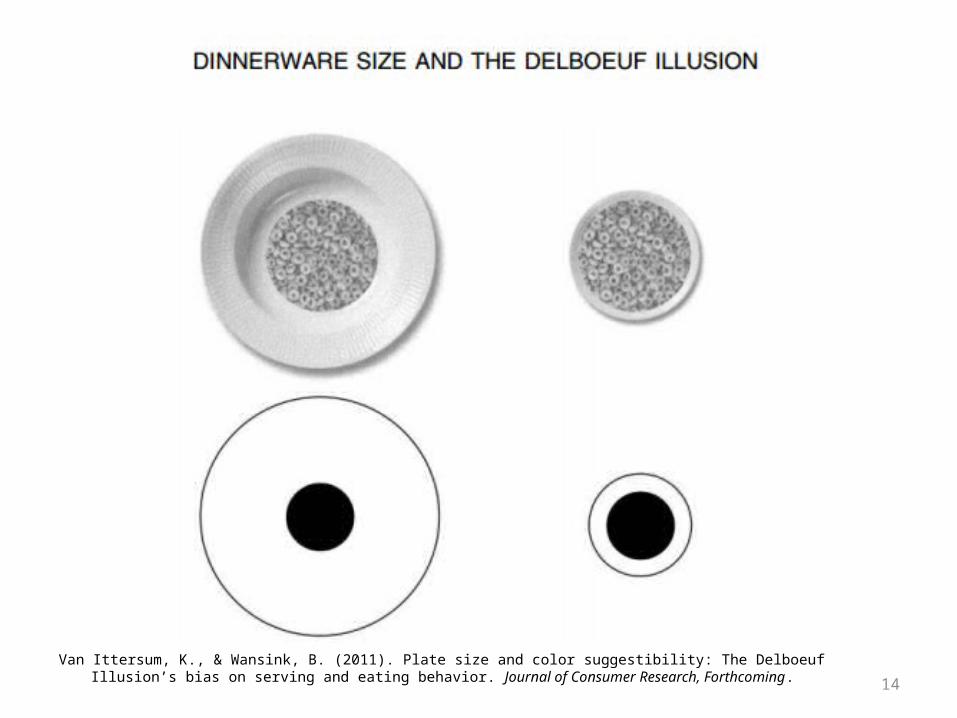
Van Ittersum, K., & Wansink, B. (2011). Plate size and color suggestibility: The Delboeuf Illusion’s bias on serving and eating behavior. Journal of Consumer Research, Forthcoming.
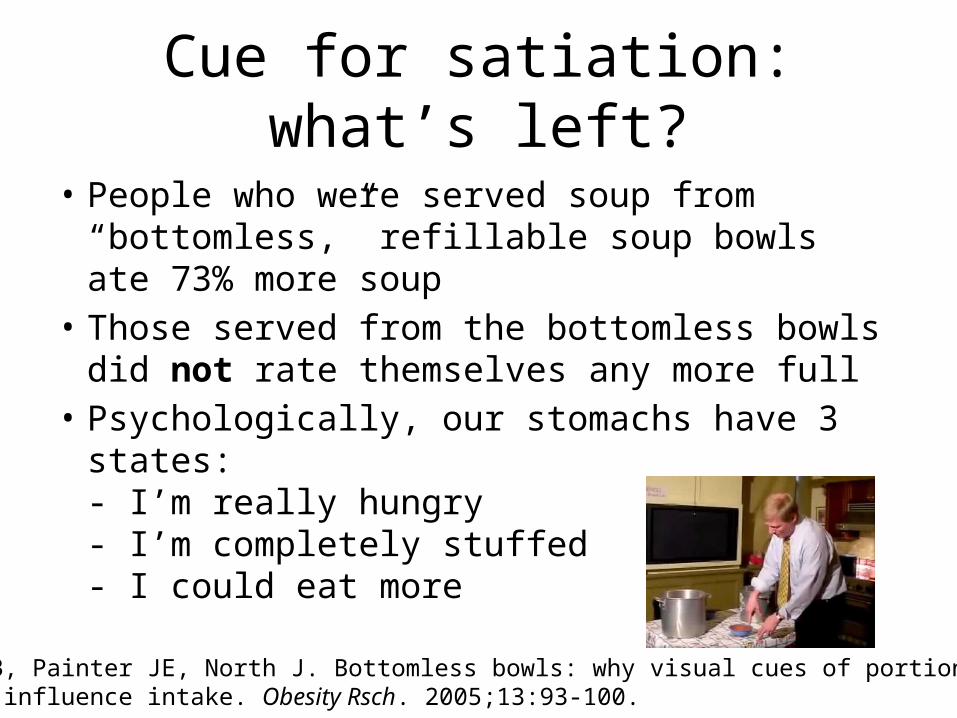
Cue for satiation: what’s left?
• People who were served soup from “bottomless,” refillable soup bowls ate 73% more soup
• Those served from the bottomless bowls did not rate themselves any more full
• Psychologically, our stomachs have 3 states: - I’m really hungry- I’m completely stuffed- I could eat more
Wansink B, Painter JE, North J. Bottomless bowls: why visual cues of portionsize may influence intake. Obesity Rsch. 2005;13:93-100.
Chicken Wings: Another satiation cue example
• People ate chicken wings, and tables were either bussed (cleaned) or not
• Those who ate at non-bussed tables ate about 4 wings, and remembered eating 4 wings
• Those who ate at bussed tables ate about 6 wings, but only remembered eating 4 wings
Group dynamics
• The larger the group you are in, the more you eat
• Eating with another person, you eat 35% more than eating alone
• Eat with 7 other people, you’ll eat 90% more• Normally we wait for the last person to finish,
and the longer you linger, the more you eat• Social modeling effect: you see others eating an
appetizer and you’ll eat it too
Convenience
• Free Hershey’s Kisses provided to secretaries every day for a month, in dishes either:- on secretary’s desk- 6 feet away from secretary’s desk
• On the desk: ate 9 per day• 6 feet away: ate 4 per day• Difference of 125 calories per day (translates into
weight gain of 5.7 kg, 12.5 lbs over the course of a year)
• The good news: it works with baby carrots, too
Other contextual food factors
• We eat more when there is more variety (e.g. more colors of M&Ms)
• We eat more in front of the TV
Food Nudges: Review and Application
• How could you reorganize a highschool cafeteria to nudge students towards healthier options?
• How could you reorganize your kitchen to nudge yourself?
• http://www.youtube.com/watch?v=hXxi-u0UvjE

Public Healthand
Environmental Decision Making
22
Questionnaire – Disease
• Tropical disease expected to kill 600 people in Vancouver. Two alternative programs have been proposed.
23
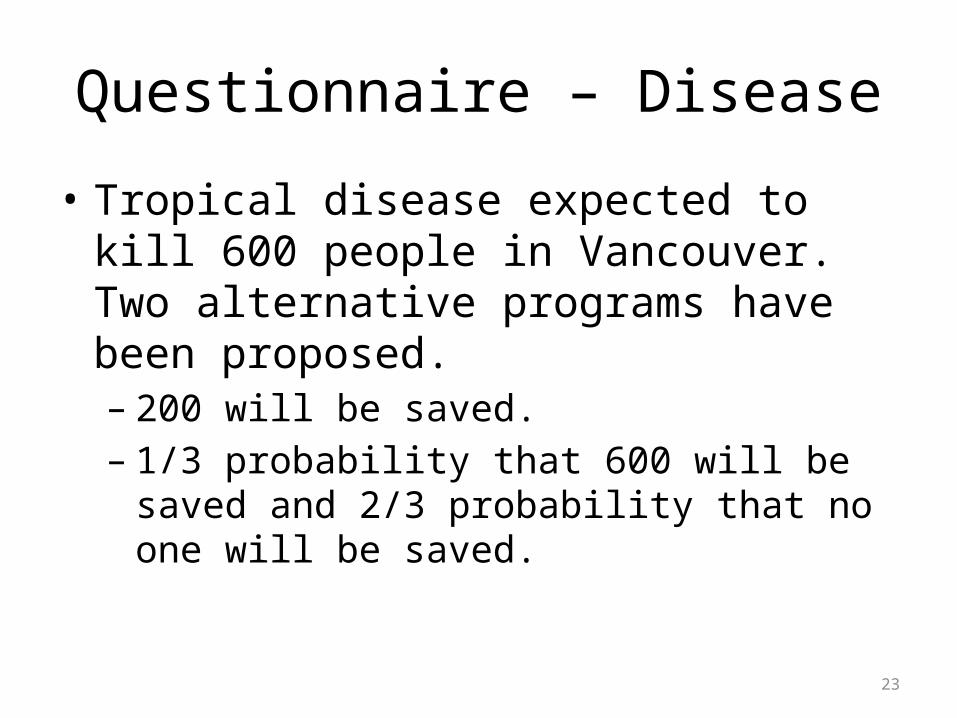
Questionnaire – Disease
• Tropical disease expected to kill 600 people in Vancouver. Two alternative programs have been proposed.– 200 will be saved.– 1/3 probability that 600 will be saved and 2/3
probability that no one will be saved.
24
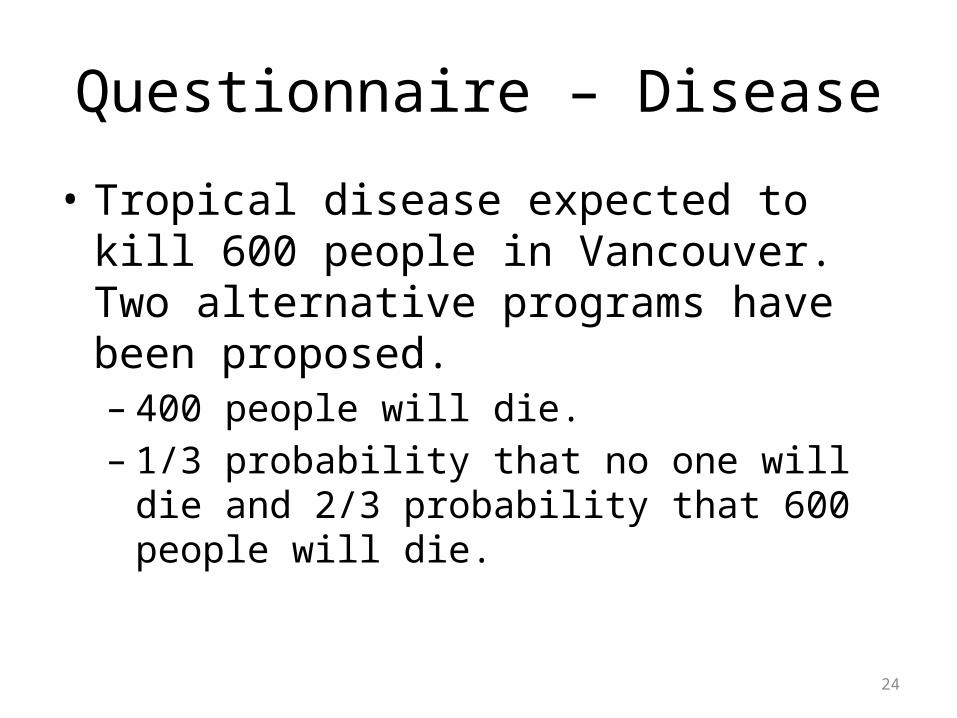
Questionnaire – Disease
• Tropical disease expected to kill 600 people in Vancouver. Two alternative programs have been proposed.– 400 people will die.– 1/3 probability that no one will die and 2/3
probability that 600 people will die.
25
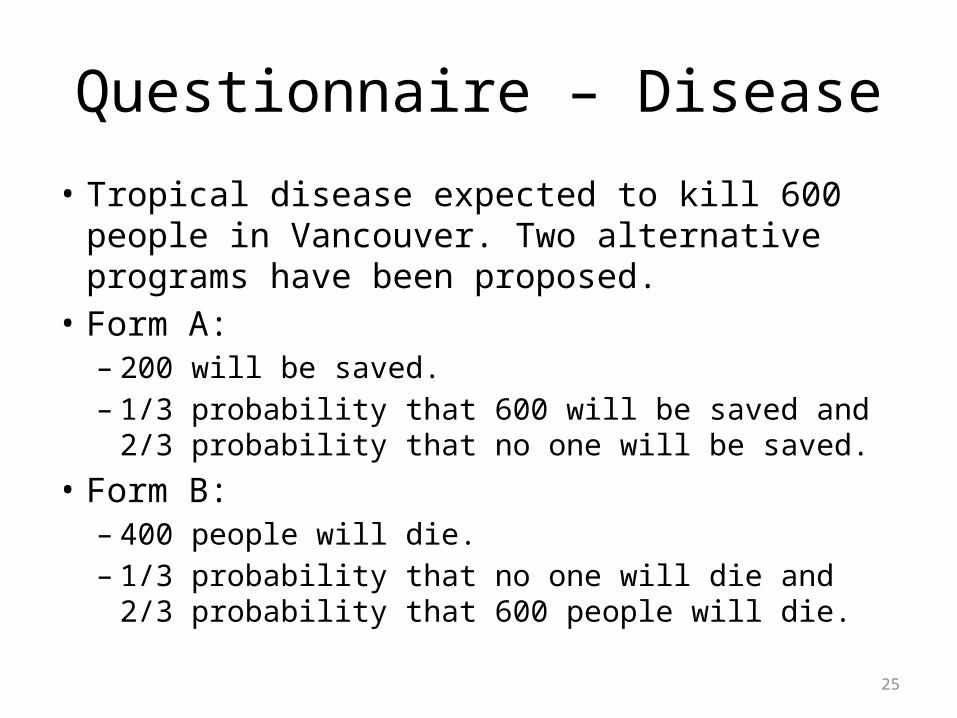
Questionnaire – Disease
• Tropical disease expected to kill 600 people in Vancouver. Two alternative programs have been proposed.
• Form A: – 200 will be saved.– 1/3 probability that 600 will be saved and 2/3 probability
that no one will be saved.• Form B:
– 400 people will die.– 1/3 probability that no one will die and 2/3 probability that
600 people will die.
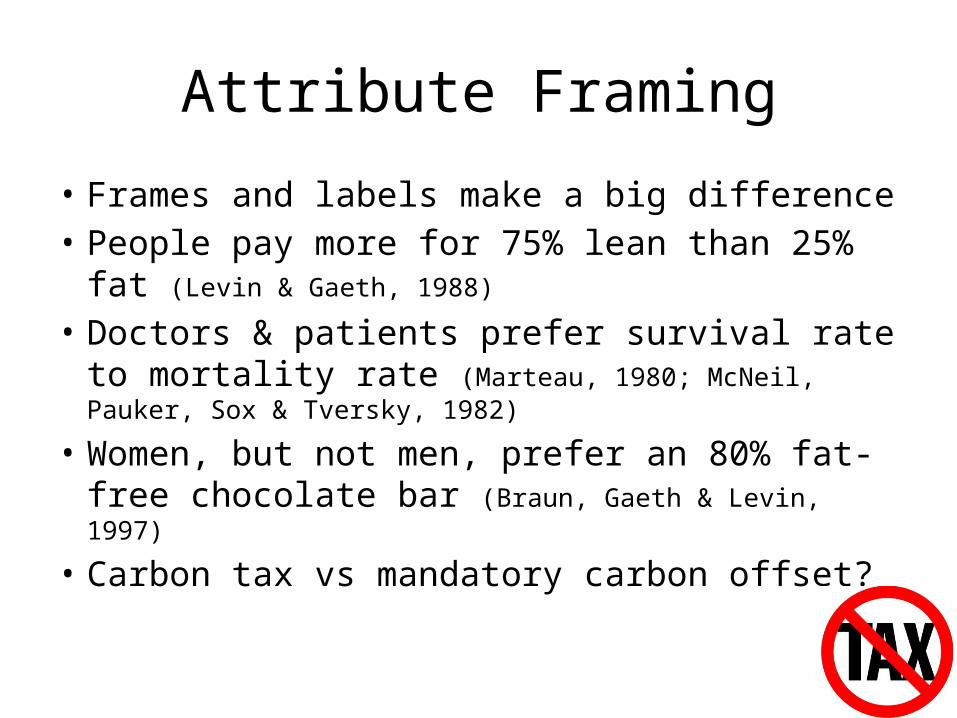
Attribute Framing
• Frames and labels make a big difference• People pay more for 75% lean than 25% fat
(Levin & Gaeth, 1988)
• Doctors & patients prefer survival rate to mortality rate (Marteau, 1980; McNeil, Pauker, Sox & Tversky, 1982)
• Women, but not men, prefer an 80% fat-free chocolate bar (Braun, Gaeth & Levin, 1997)
• Carbon tax vs mandatory carbon offset?
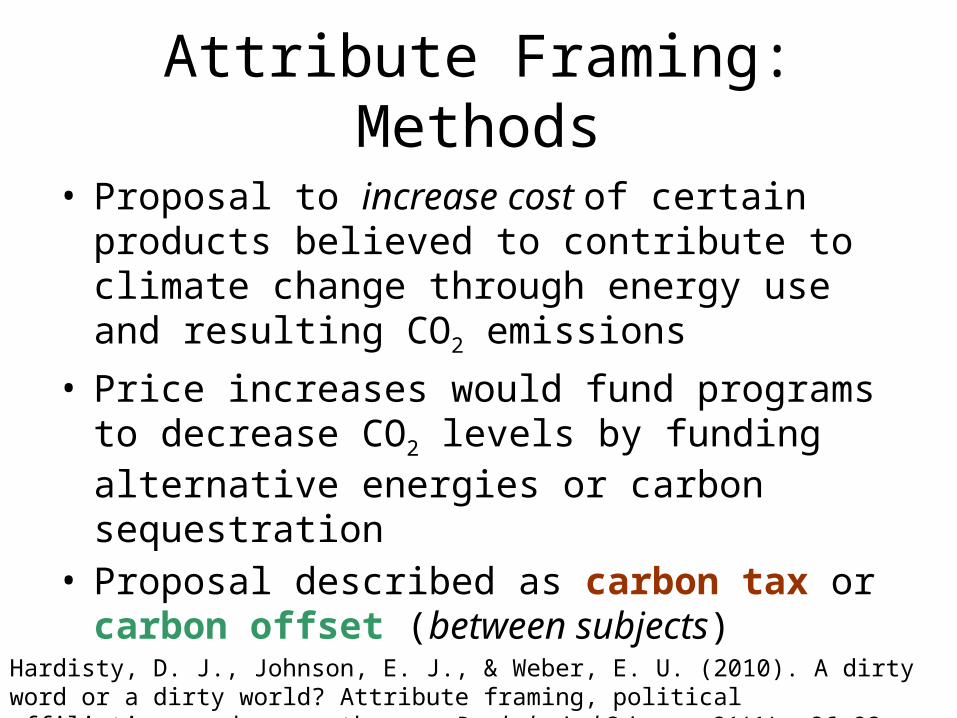
Attribute Framing: Methods
• Proposal to increase cost of certain products believed to contribute to climate change through energy use and resulting CO2 emissions
• Price increases would fund programs to decrease CO2 levels by funding alternative energies or carbon sequestration
• Proposal described as carbon tax or carbon offset (between subjects)
Hardisty, D. J., Johnson, E. J., & Weber, E. U. (2010). A dirty word or a dirty world? Attribute framing, political affiliation, and query theory. Psychological Science, 21(1), 86-92.
Attribute Framing: Methods
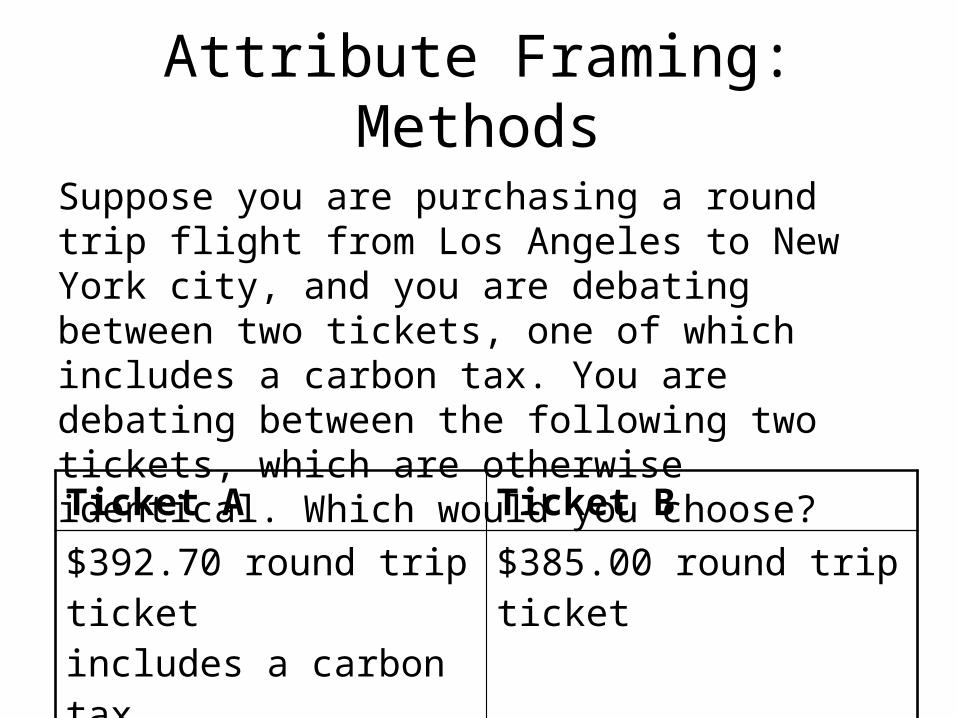
Suppose you are purchasing a round trip flight from Los Angeles to New York city, and you are debating between two tickets, one of which includes a carbon tax. You are debating between the following two tickets, which are otherwise identical. Which would you choose?
Ticket A Ticket B
$392.70 round trip ticketincludes a carbon tax
$385.00 round trip ticket
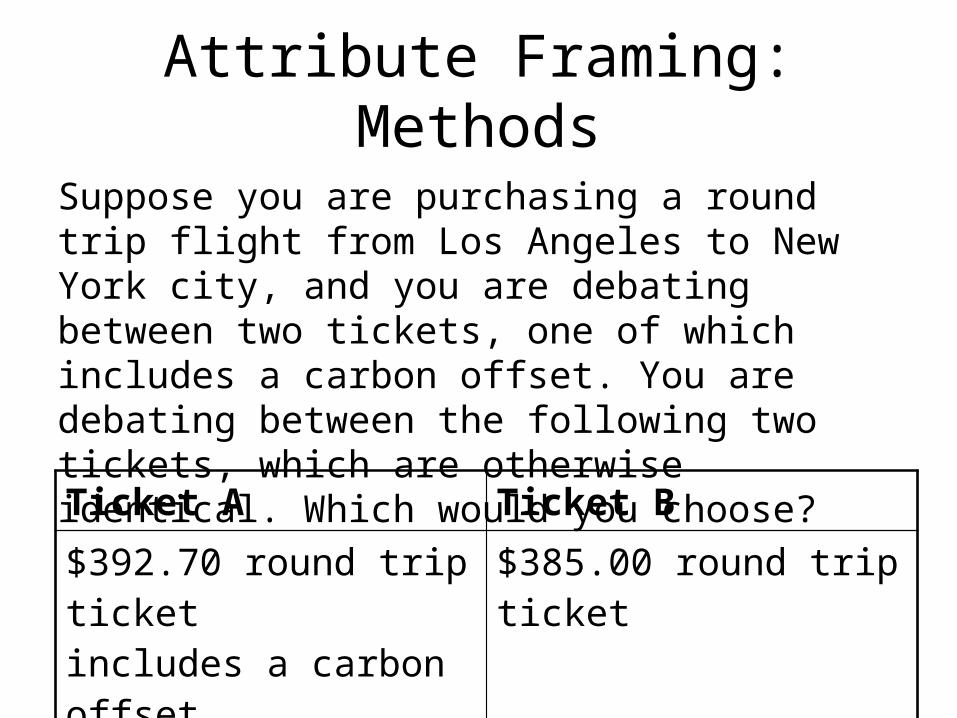
Attribute Framing: Methods
Suppose you are purchasing a round trip flight from Los Angeles to New York city, and you are debating between two tickets, one of which includes a carbon offset. You are debating between the following two tickets, which are otherwise identical. Which would you choose?
Ticket A Ticket B
$392.70 round trip ticketincludes a carbon offset
$385.00 round trip ticket
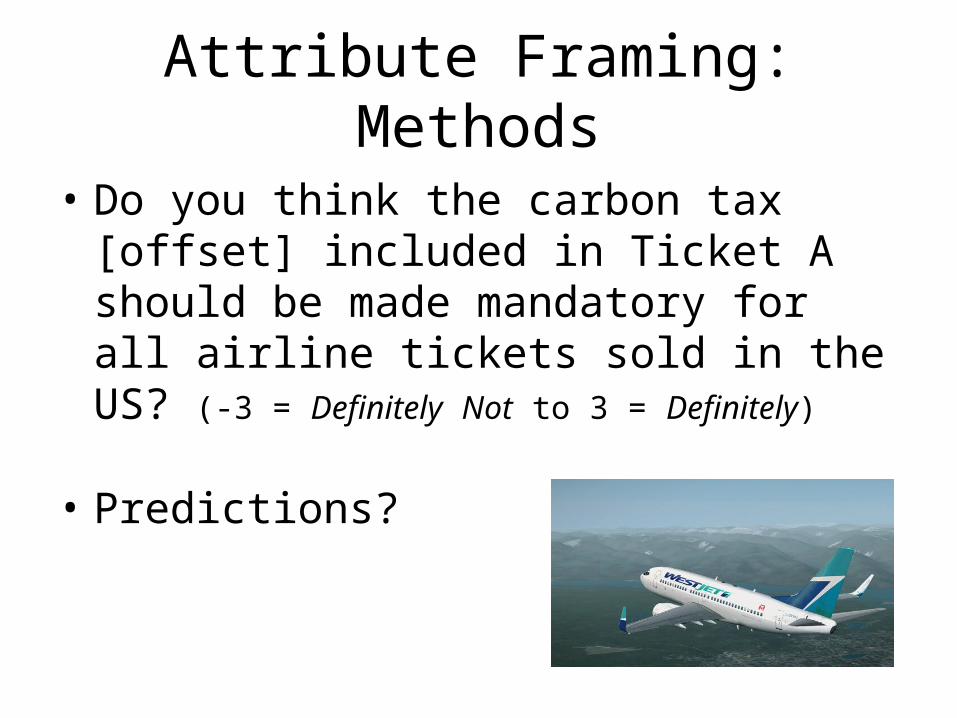
• Do you think the carbon tax [offset] included in Ticket A should be made mandatory for all airline tickets sold in the US? (-3 = Definitely Not to 3 = Definitely)
• Predictions?
Attribute Framing: Methods
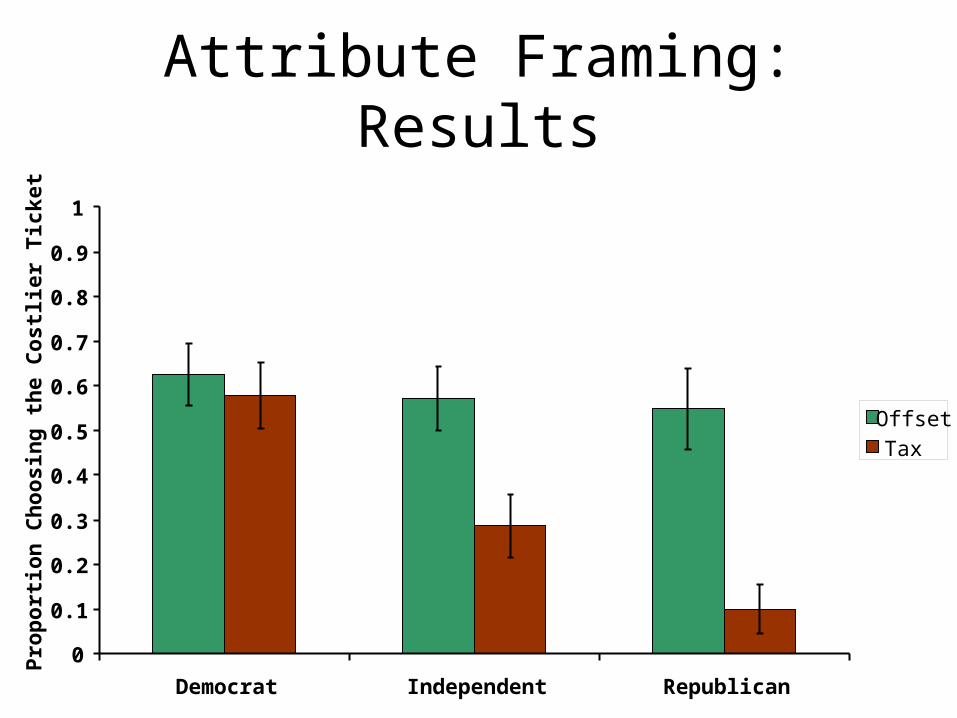
Attribute Framing: Results
0
0.1
0.2
0.3
0.4
0.5
0.6
0.7
0.8
0.9
1
Democrat Independent Republican
Prop
ortio
n Ch
oosi
ng th
e Co
stlie
r Tic
ket
OffsetTax
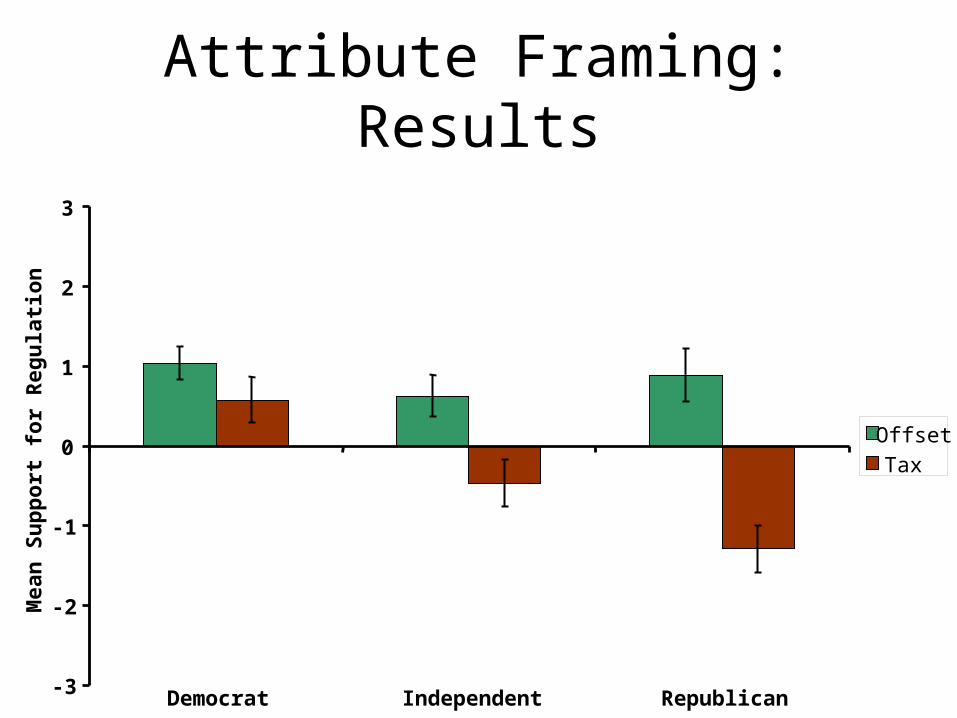
Attribute Framing: Results
-3
-2
-1
0
1
2
3
Democrat Independent Republican
Mea
n Su
ppor
t for
Reg
ulati
on
OffsetTax
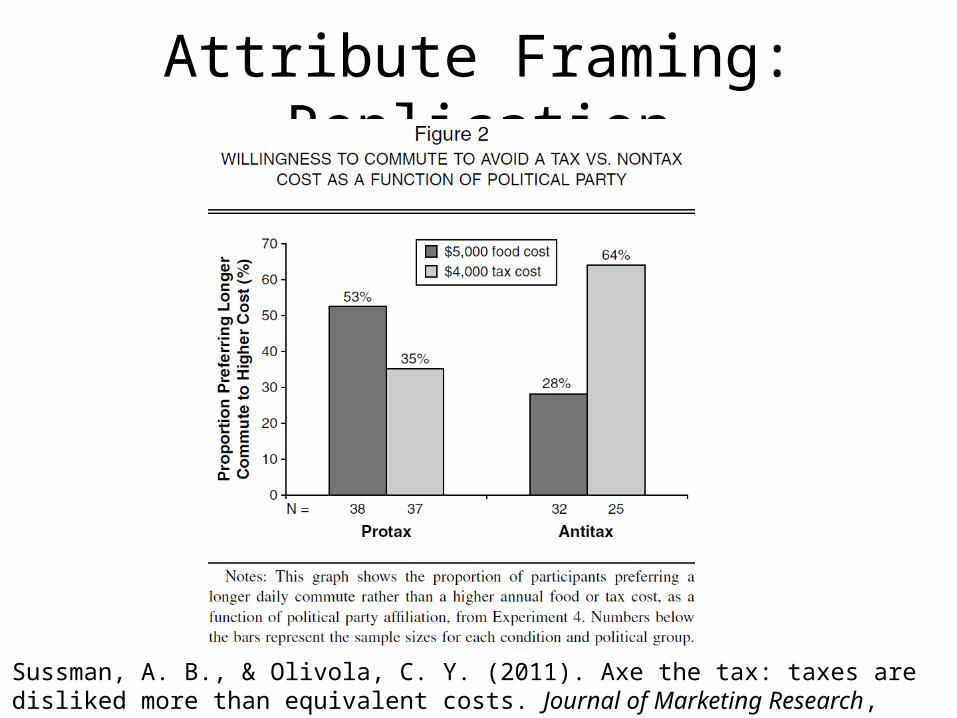
Attribute Framing: Replication
Sussman, A. B., & Olivola, C. Y. (2011). Axe the tax: taxes are disliked more than equivalent costs. Journal of Marketing Research, 48(SPL), S91-S101.
Attribute Framing: Summary
• Often the same attribute can be represented in two different ways
• Choose your frames wisely • Frames that don’t matter to you might still
matter to someone else
35
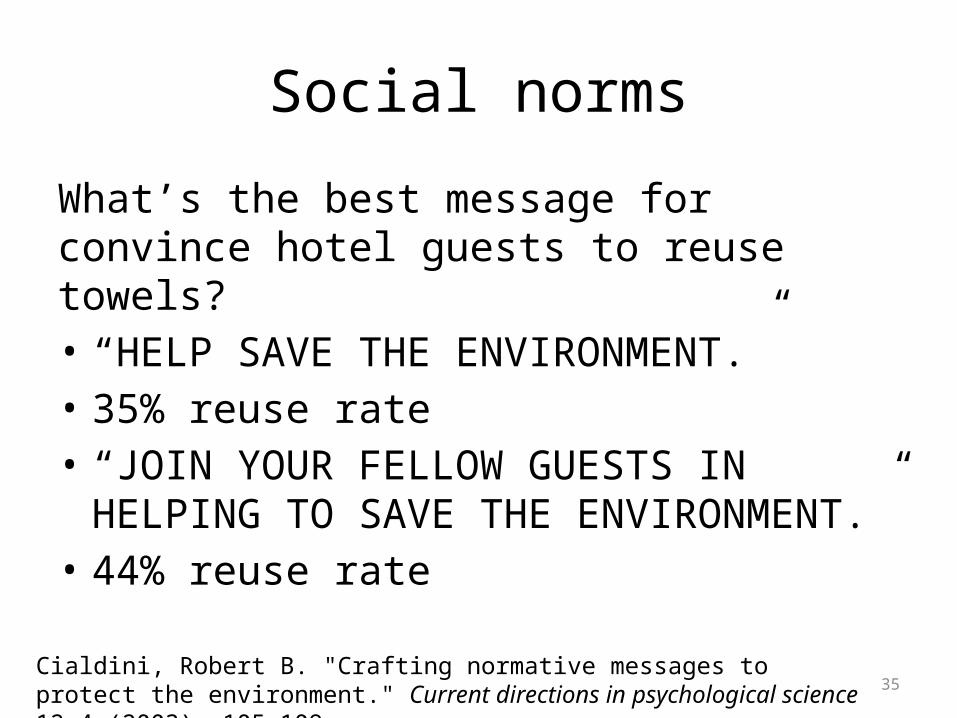
Social norms
What’s the best message for convince hotel guests to reuse towels? • “HELP SAVE THE ENVIRONMENT.” • 35% reuse rate• “JOIN YOUR FELLOW GUESTS IN HELPING TO
SAVE THE ENVIRONMENT.” • 44% reuse rate
Cialdini, Robert B. "Crafting normative messages to protect the environment." Current directions in psychological science 12.4 (2003): 105-109.
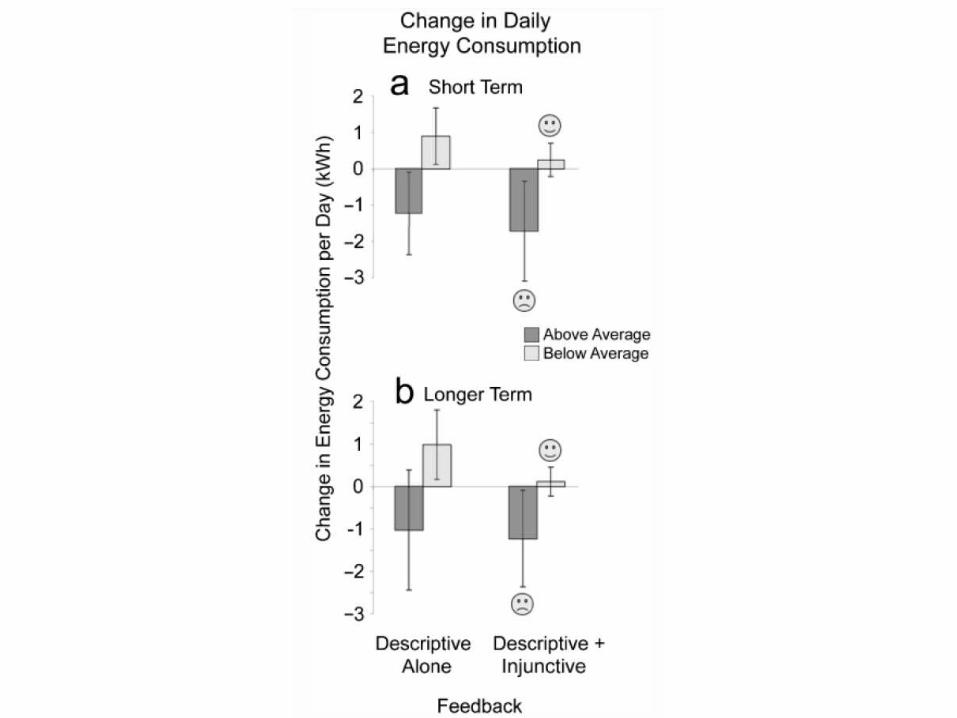
Descriptive vs Injunctive Social Norms
• Power company in California• Monthly energy bill shows how you compare
to your neighbors• Predictions?
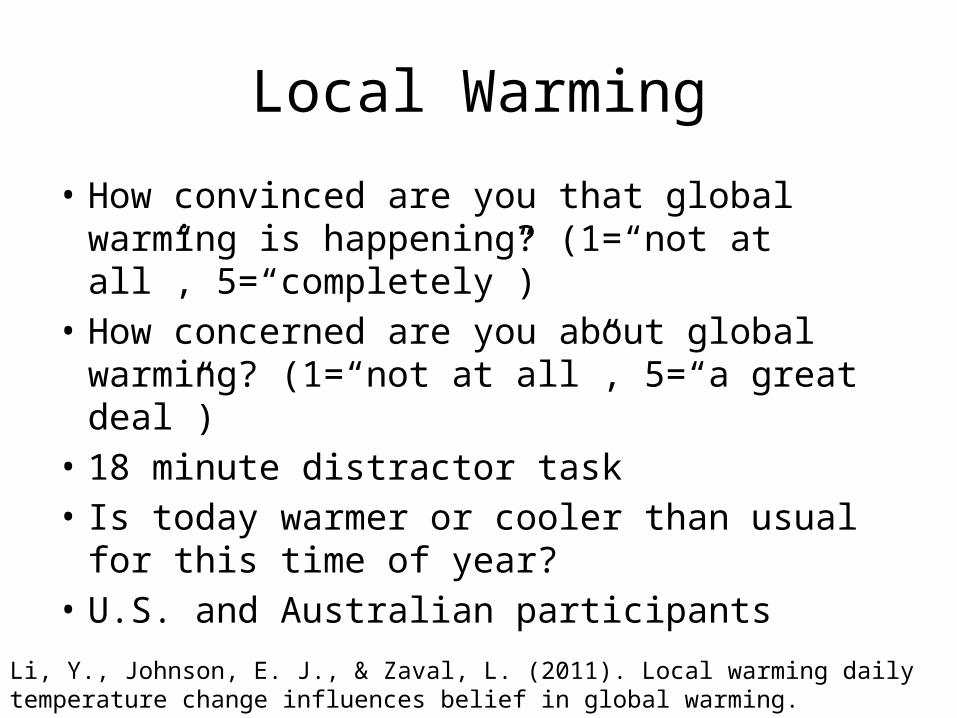
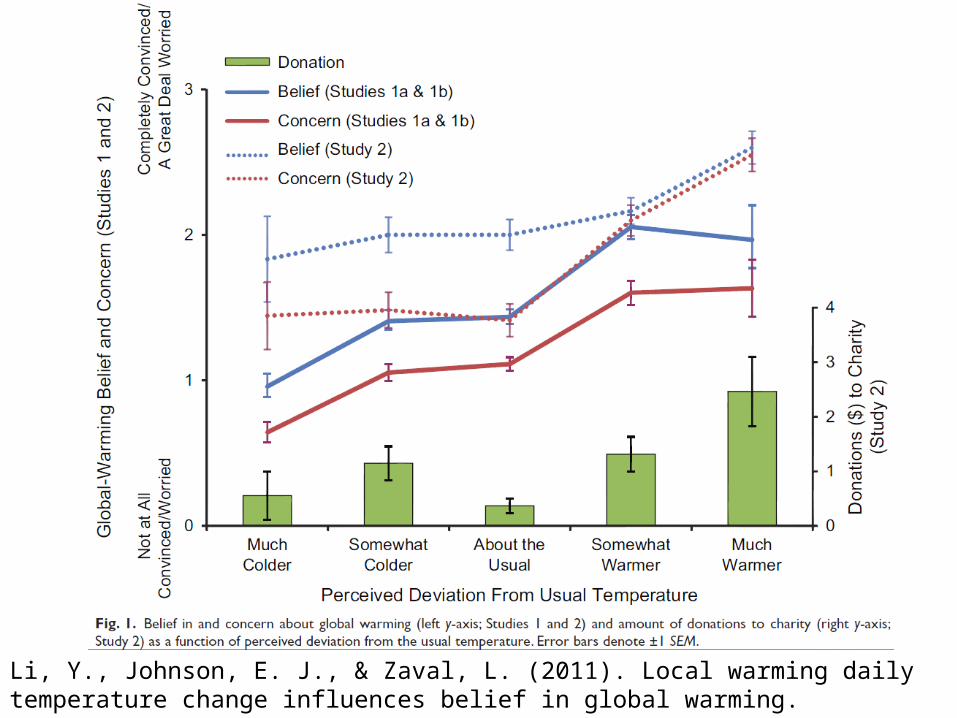
Local Warming
• How convinced are you that global warming is happening? (1=“not at all”, 5=“completely”)
• How concerned are you about global warming? (1=“not at all”, 5=“a great deal”)
• 18 minute distractor task• Is today warmer or cooler than usual for this
time of year? • U.S. and Australian participants
Li, Y., Johnson, E. J., & Zaval, L. (2011). Local warming daily temperature change influences belief in global warming. Psychological Science, 22(4), 454-459.
Li, Y., Johnson, E. J., & Zaval, L. (2011). Local warming daily temperature change influences belief in global warming. Psychological Science, 22(4), 454-459.
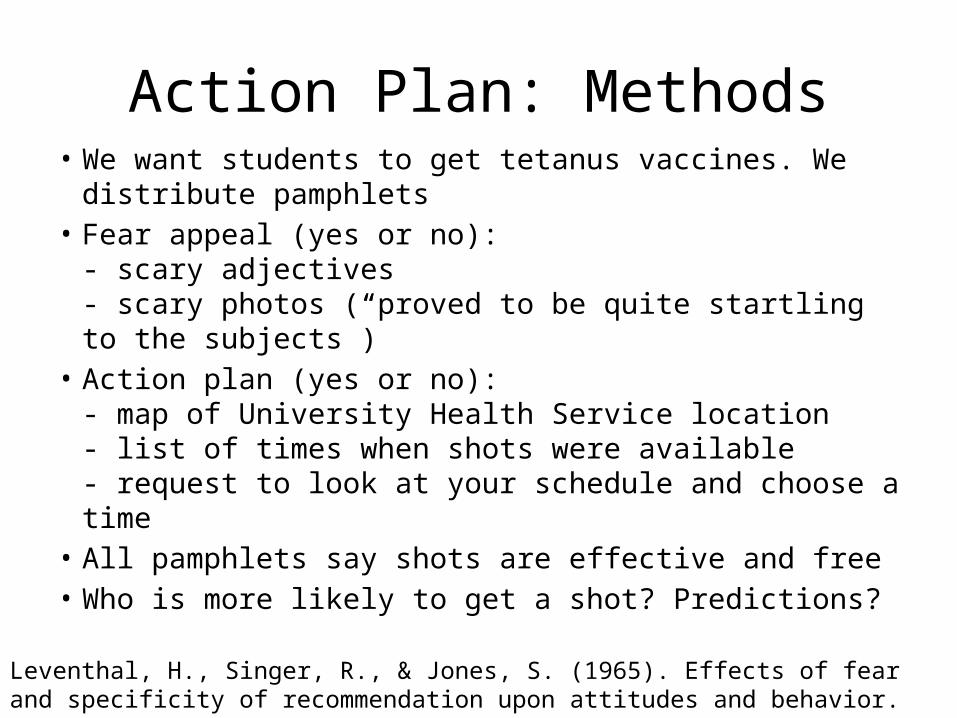
Action Plan: Methods• We want students to get tetanus vaccines. We
distribute pamphlets• Fear appeal (yes or no):
- scary adjectives- scary photos (“proved to be quite startling to the subjects”)
• Action plan (yes or no): - map of University Health Service location- list of times when shots were available- request to look at your schedule and choose a time
• All pamphlets say shots are effective and free• Who is more likely to get a shot? Predictions?Leventhal, H., Singer, R., & Jones, S. (1965). Effects of fear and specificity of recommendation
upon attitudes and behavior. Journal of Personality and Social Psychology, 2(1), 20.
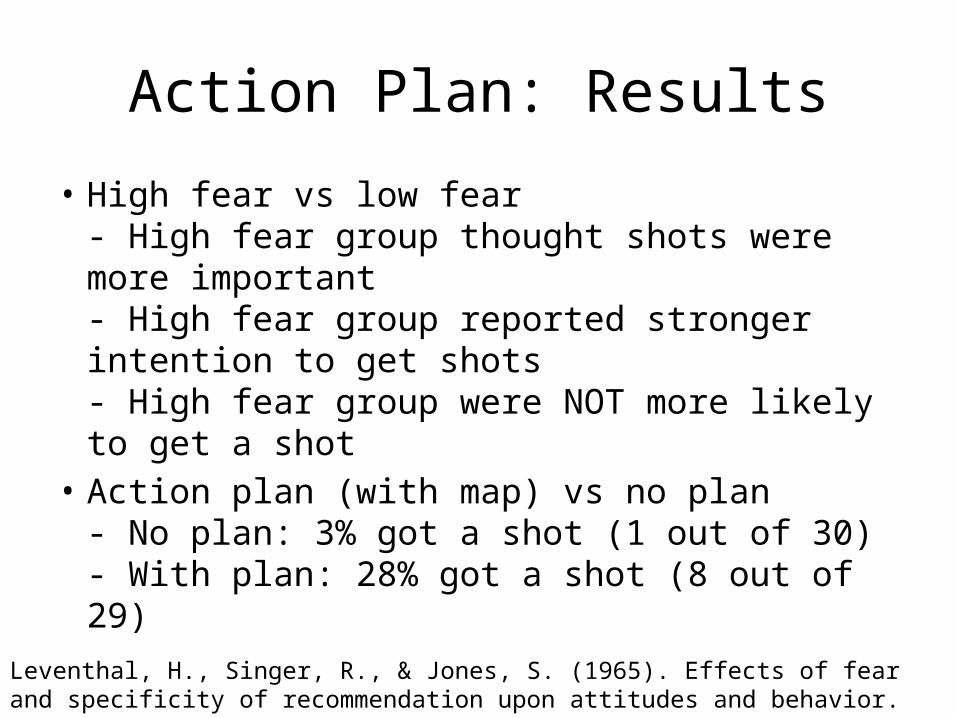
Action Plan: Results
• High fear vs low fear- High fear group thought shots were more important- High fear group reported stronger intention to get shots- High fear group were NOT more likely to get a shot
• Action plan (with map) vs no plan- No plan: 3% got a shot (1 out of 30)- With plan: 28% got a shot (8 out of 29)
Leventhal, H., Singer, R., & Jones, S. (1965). Effects of fear and specificity of recommendation upon attitudes and behavior. Journal of Personality and Social Psychology, 2(1), 20.
Decisions about the future
Temporal Discounting
• The farther something is in the future, the less we care about it
• Good things -> now• Bad things -> later• Would you rather receive $100 today, or $101
next year?• It is rational to discount future costs and
benefits by the market interest rate (~6%), following an exponential formula (V=Ae-kD)
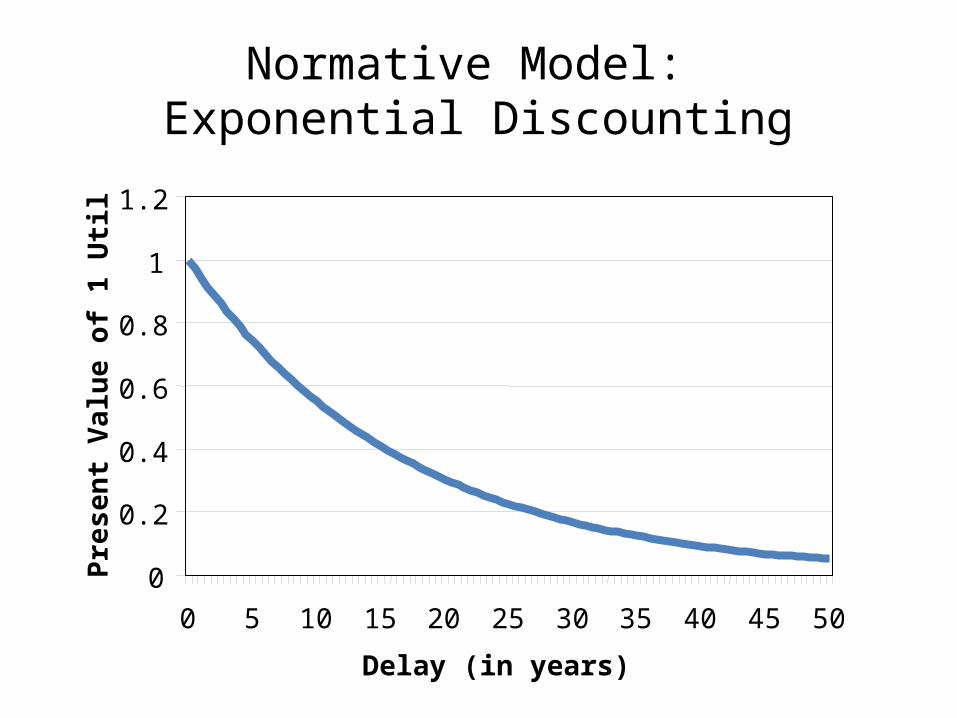
Normative Model: Exponential Discounting
0
0.2
0.4
0.6
0.8
1
1.2
0 5 10 15 20 25 30 35 40 45 50
Delay (in years)
Pres
ent V
alue
of 1
Util
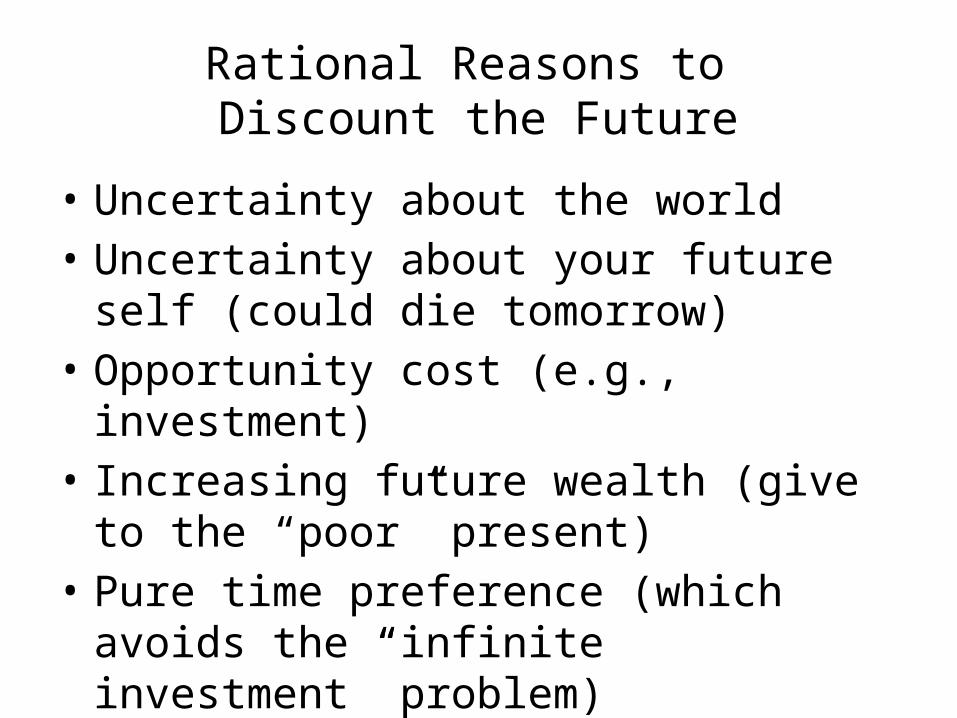
Rational Reasons to Discount the Future
• Uncertainty about the world• Uncertainty about your future self (could die
tomorrow)• Opportunity cost (e.g., investment)• Increasing future wealth (give to the “poor”
present)• Pure time preference (which avoids the
“infinite investment” problem)
Experiment
• Half the class, please close your eyes!
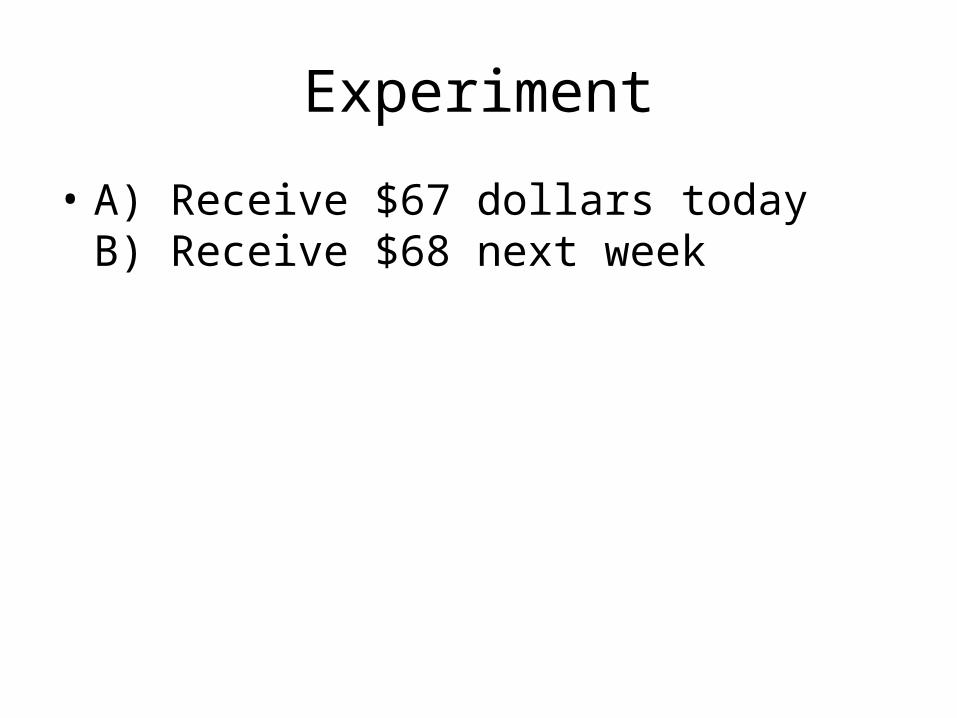
Experiment
• A) Receive $67 dollars todayB) Receive $68 next week
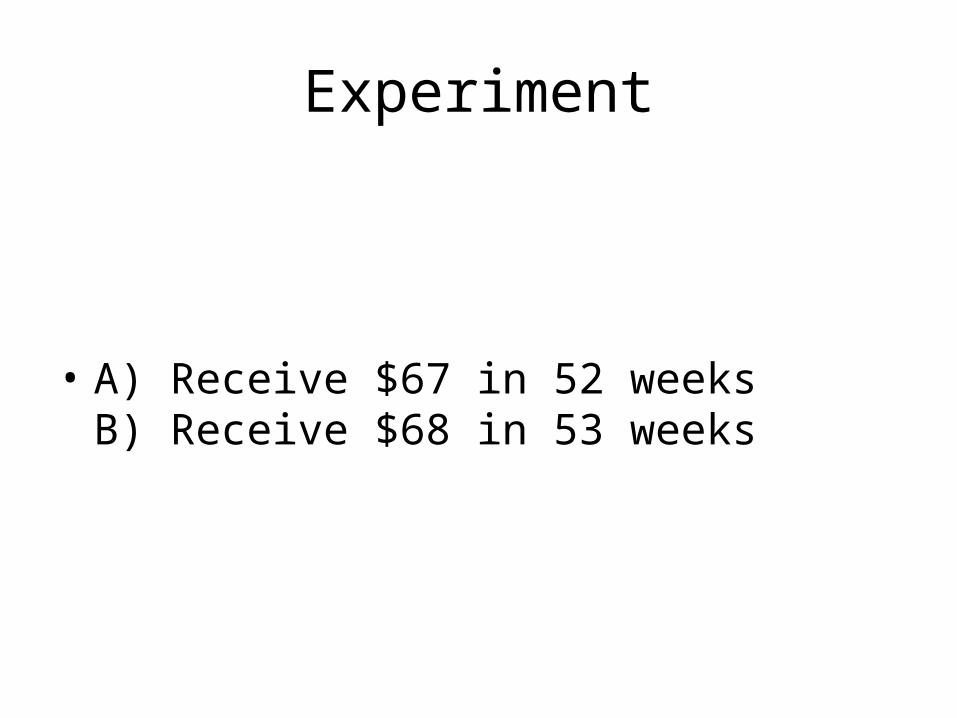
Experiment
• A) Receive $67 in 52 weeksB) Receive $68 in 53 weeks
Experiment
• A) Receive $67 dollars todayB) Receive $68 next week
• A) Receive $67 in 52 weeksB) Receive $68 in 53 weeks
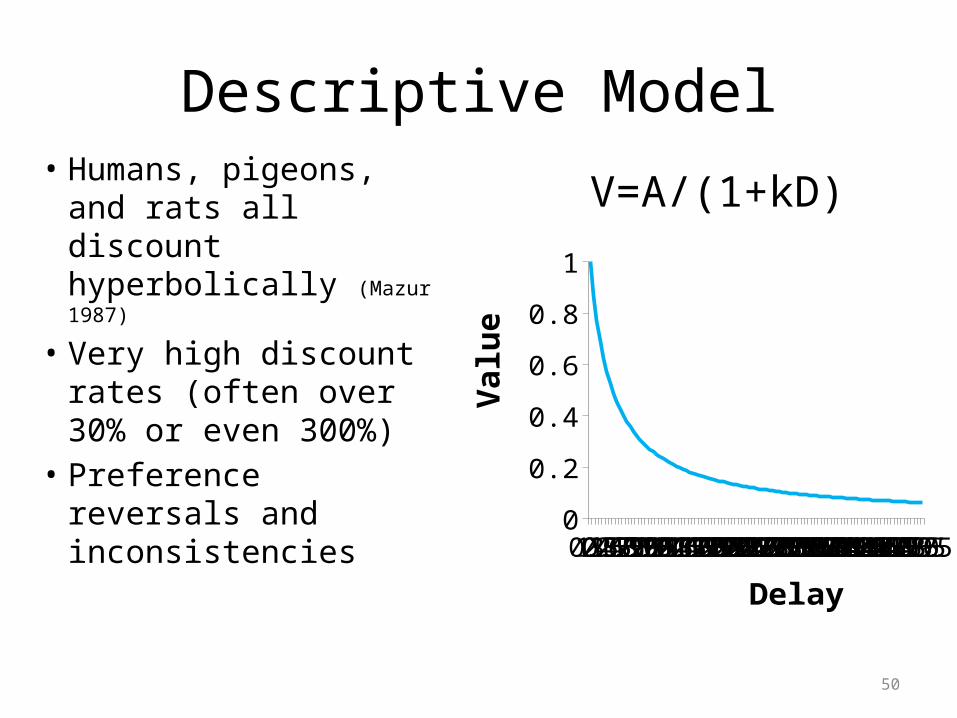
Descriptive Model• Humans, pigeons, and
rats all discount hyperbolically (Mazur 1987)
• Very high discount rates (often over 30% or even 300%)
• Preference reversals and inconsistencies
00.511.522.533.544.555.566.577.588.599.51010.51111.51212.51313.51414.51515.51616.51717.51818.51919.52020.52121.52222.52323.52424.52525.52626.52727.52828.52929.53030.53131.53232.53333.53434.53535.53636.53737.53838.53939.54040.54141.54242.54343.54444.54545.54646.54747.54848.54949.5500
0.2
0.4
0.6
0.8
1
Delay
V=A/(1+kD)
Valu
e
50
51
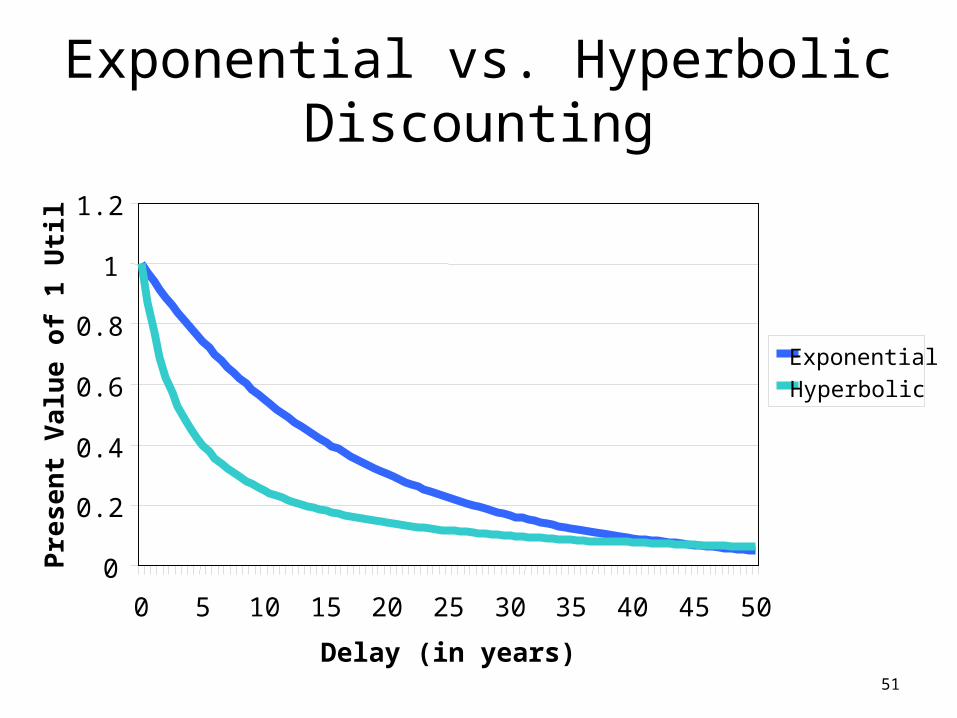
Exponential vs. Hyperbolic Discounting
0
0.2
0.4
0.6
0.8
1
1.2
0 5 10 15 20 25 30 35 40 45 50
Delay (in years)
Pre
sen
t V
alu
e o
f 1
Uti
l
Exponential
Hyperbolic
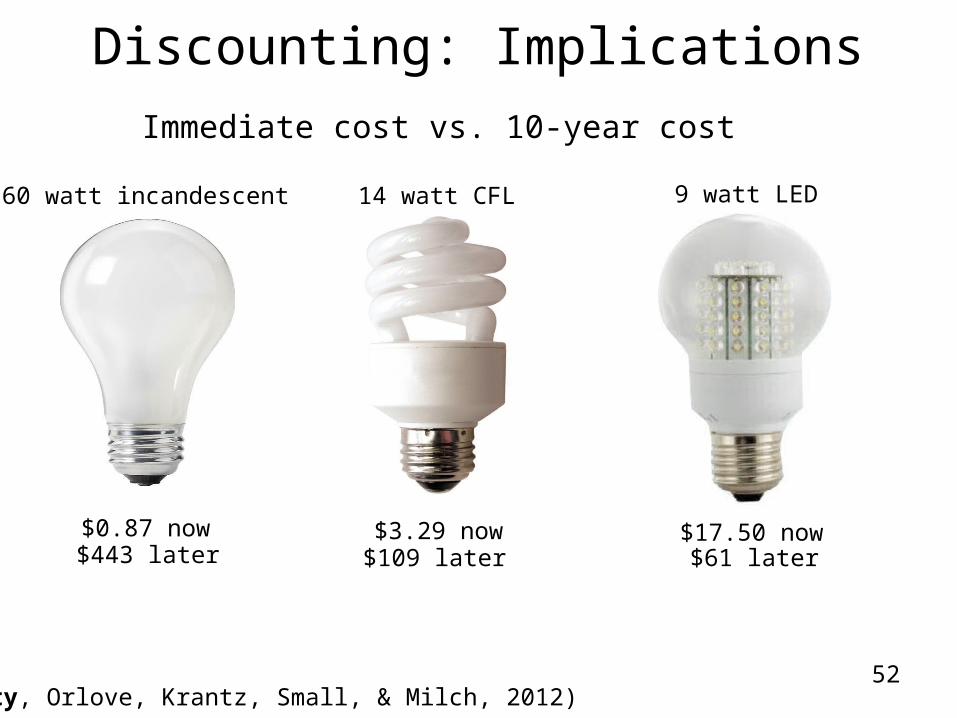
$0.87 now $3.29 now
(Hardisty, Orlove, Krantz, Small, & Milch, 2012)52
$17.50 now
9 watt LED14 watt CFL60 watt incandescent
$443 later $109 later $61 later
Discounting: ImplicationsImmediate cost vs. 10-year cost
Resource Slack (Zauberman 2005)
• “Think about your activities today and your available spare time. Now consider your likely activities and available spare time for the same day of the week a month from now. On which day do you expect to have more spare time?”
• “Think about your expenses today and your available spare money. Now consider your likely expenses and available spare money for the same day of the week a month from now. On which day do you expect to have more financial reserves?”
Zauberman, G., & Lynch Jr, J. G. (2005). Resource slack and propensity to discount delayed investments of time versus money. Journal of Experimental Psychology: General, 134(1), 23.
Resource Slack (Zauberman 2005)
• 1 = much more time [money] available today 10 = much more time [money] available next month
• For both time (M = 8.2, SD = 2.9) and money (M = 7.0, SD = 2.9), respondents believed that the resource would be more available in a month than today.
• “Yes... damn!” effect• Resource slack predicted discount rates, as well as
hyperbolic discounting
Zauberman, G., & Lynch Jr, J. G. (2005). Resource slack and propensity to discount delayed investments of time versus money. Journal of Experimental Psychology: General, 134(1), 23.
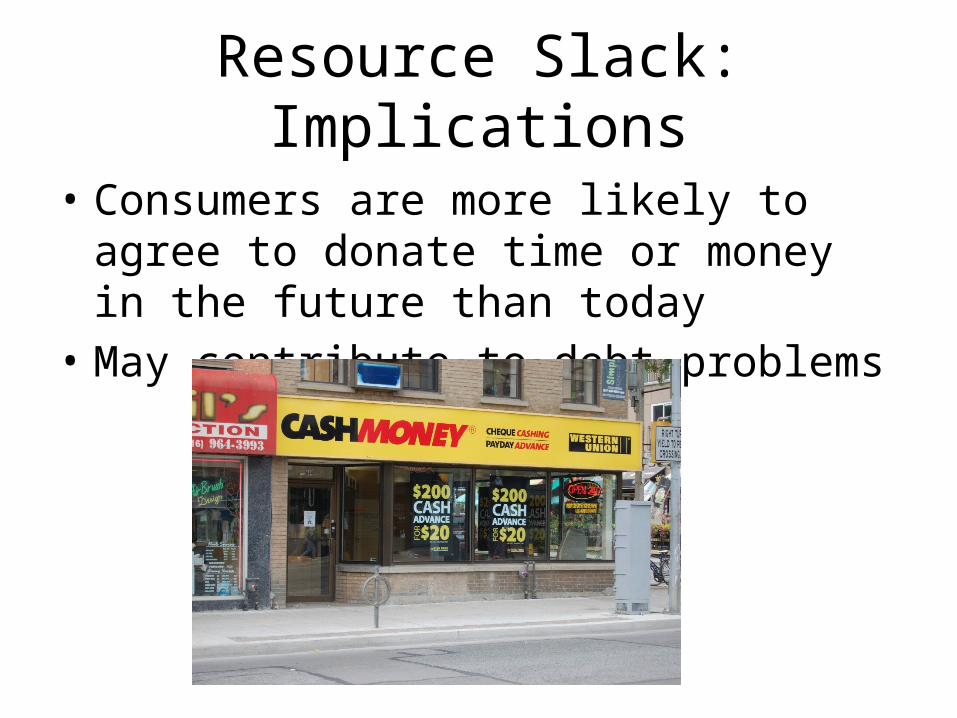
Resource Slack: Implications
• Consumers are more likely to agree to donate time or money in the future than today
• May contribute to debt problems
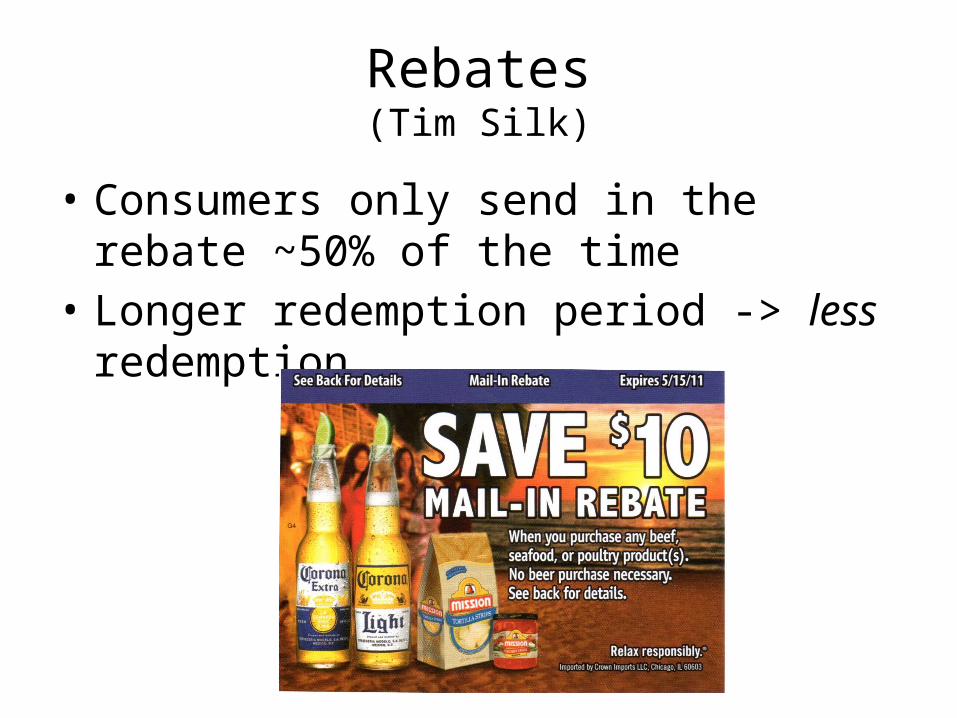
Rebates(Tim Silk)
• Consumers only send in the rebate ~50% of the time
• Longer redemption period -> less redemption
Public Policy Implications
• Do consumers need to be protected from themselves?
Regulations?
• Only immediate rebates• Advance ordering of school lunches• Cell-phone contracts
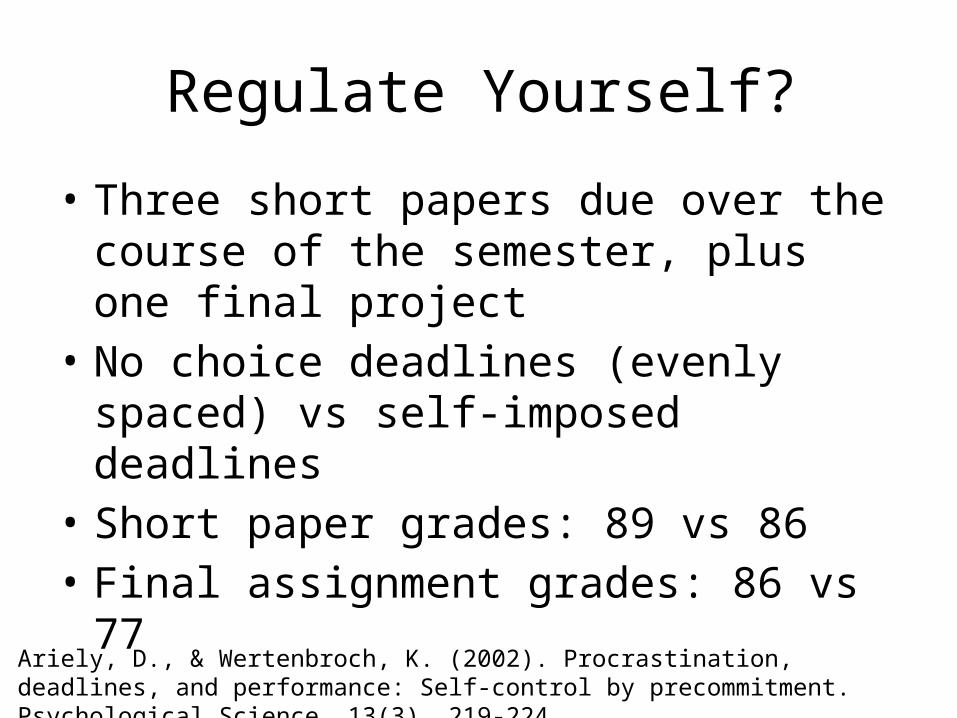
Regulate Yourself?
• Three short papers due over the course of the semester, plus one final project
• No choice deadlines (evenly spaced) vs self-imposed deadlines
• Short paper grades: 89 vs 86• Final assignment grades: 86 vs 77
Ariely, D., & Wertenbroch, K. (2002). Procrastination, deadlines, and performance: Self-control by precommitment. Psychological Science, 13(3), 219-224.
Commitment Devices
3 things required:1. Clearly defined goal2. Meaningful losses at stake3. A referee
• Have you used one?• See stickk.com
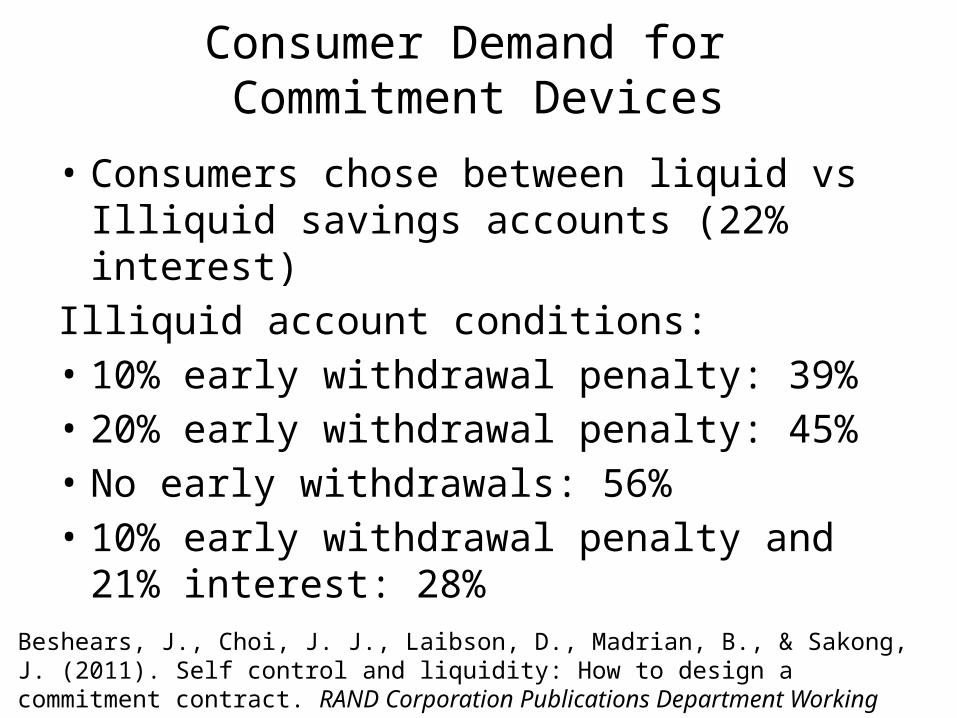
Consumer Demand for Commitment Devices
• Consumers chose between liquid vs Illiquid savings accounts (22% interest)
Illiquid account conditions: • 10% early withdrawal penalty: 39%• 20% early withdrawal penalty: 45%• No early withdrawals: 56%• 10% early withdrawal penalty and 21%
interest: 28%Beshears, J., Choi, J. J., Laibson, D., Madrian, B., & Sakong, J. (2011). Self control and liquidity: How to design a commitment contract. RAND Corporation Publications Department Working Papers.
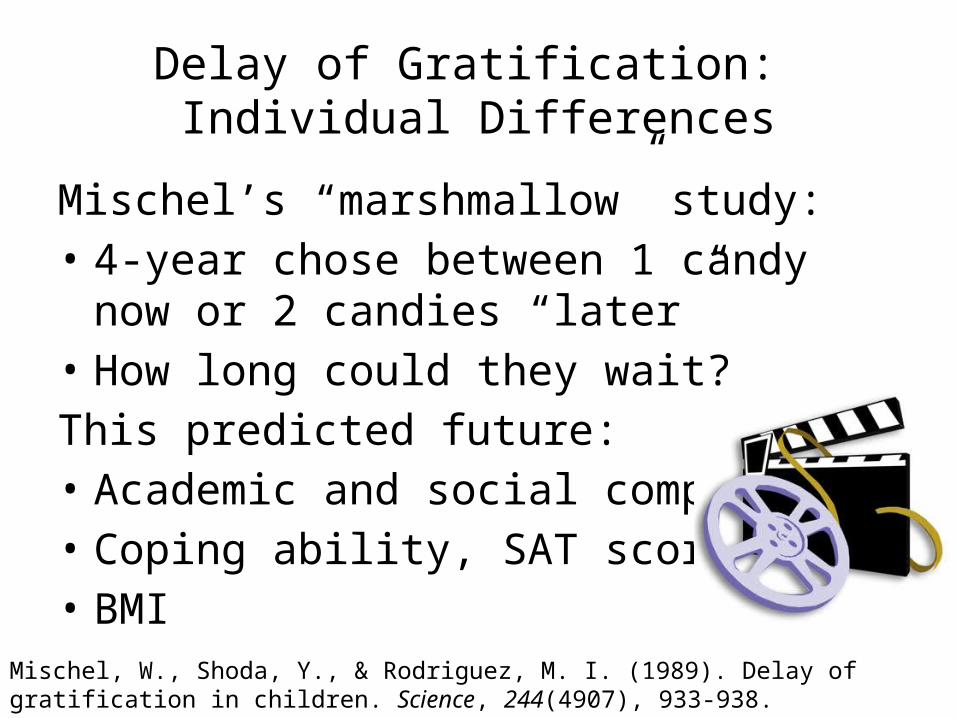
Delay of Gratification: Individual Differences
Mischel’s “marshmallow” study:• 4-year chose between 1 candy now or 2
candies “later” • How long could they wait? This predicted future:• Academic and social competence• Coping ability, SAT scores• BMI
Mischel, W., Shoda, Y., & Rodriguez, M. I. (1989). Delay of gratification in children. Science, 244(4907), 933-938.
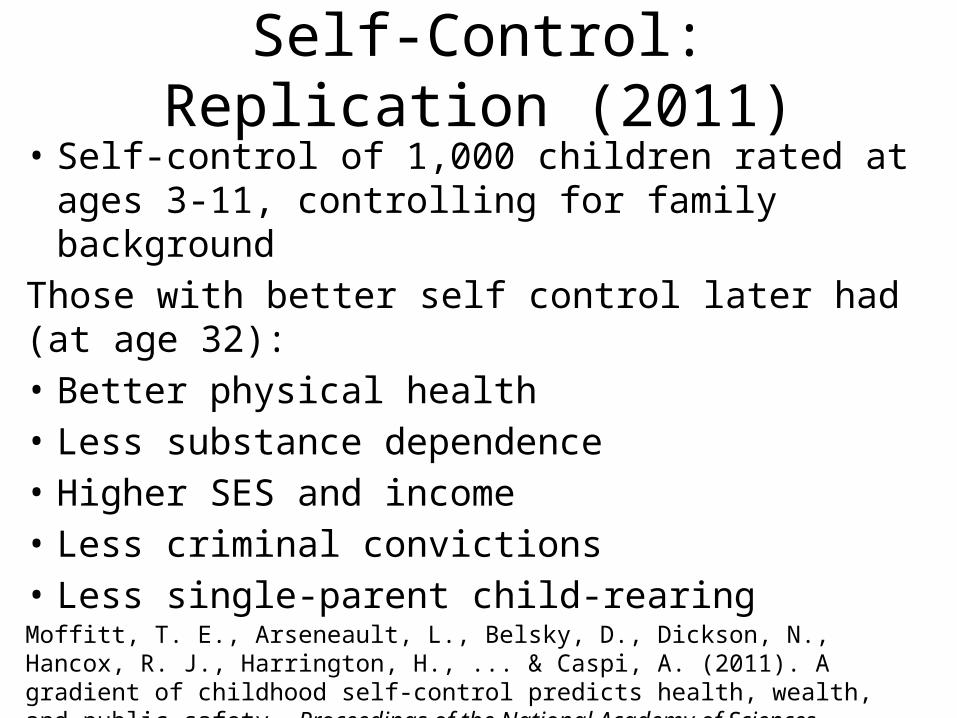
Self-Control: Replication (2011)• Self-control of 1,000 children rated at ages 3-11,
controlling for family backgroundThose with better self control later had (at age 32): • Better physical health• Less substance dependence• Higher SES and income• Less criminal convictions• Less single-parent child-rearingMoffitt, T. E., Arseneault, L., Belsky, D., Dickson, N., Hancox, R. J., Harrington, H., ... & Caspi, A. (2011). A gradient of childhood self-control predicts health, wealth, and public safety. Proceedings of the National Academy of Sciences, 108(7), 2693-2698.
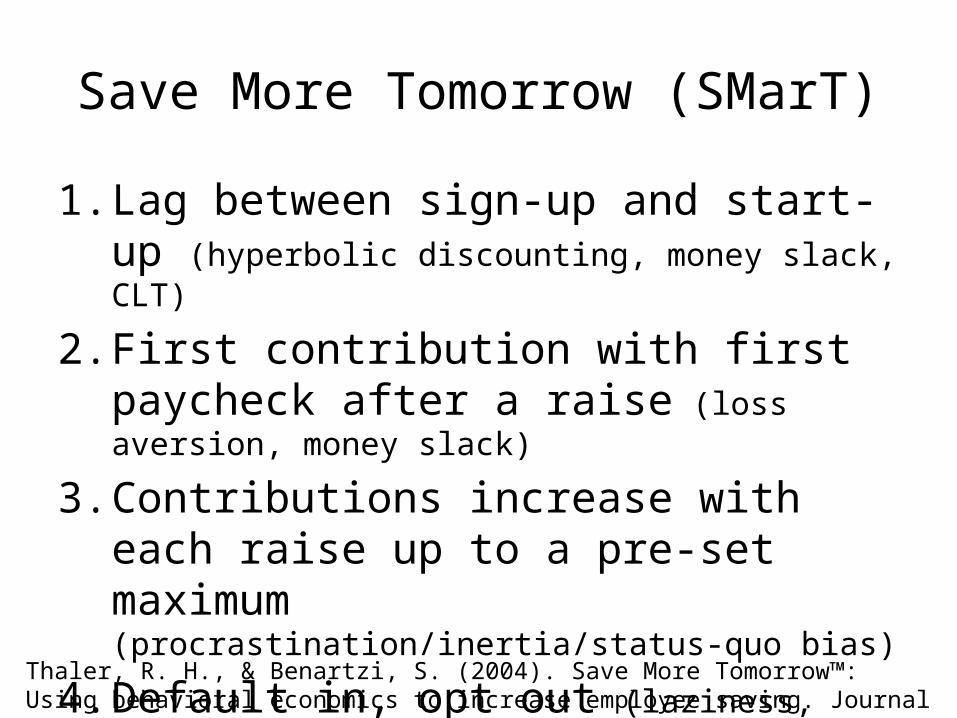
Save More Tomorrow (SMarT)
1. Lag between sign-up and start-up (hyperbolic discounting, money slack, CLT)
2. First contribution with first paycheck after a raise (loss aversion, money slack)
3. Contributions increase with each raise up to a pre-set maximum (procrastination/inertia/status-quo bias)
4. Default in, opt out (laziness, implicit endorsement, loss aversion, time slack)
Thaler, R. H., & Benartzi, S. (2004). Save More Tomorrow™: Using behavioral economics to increase employee saving. Journal of political Economy, 112(S1), S164-S187.
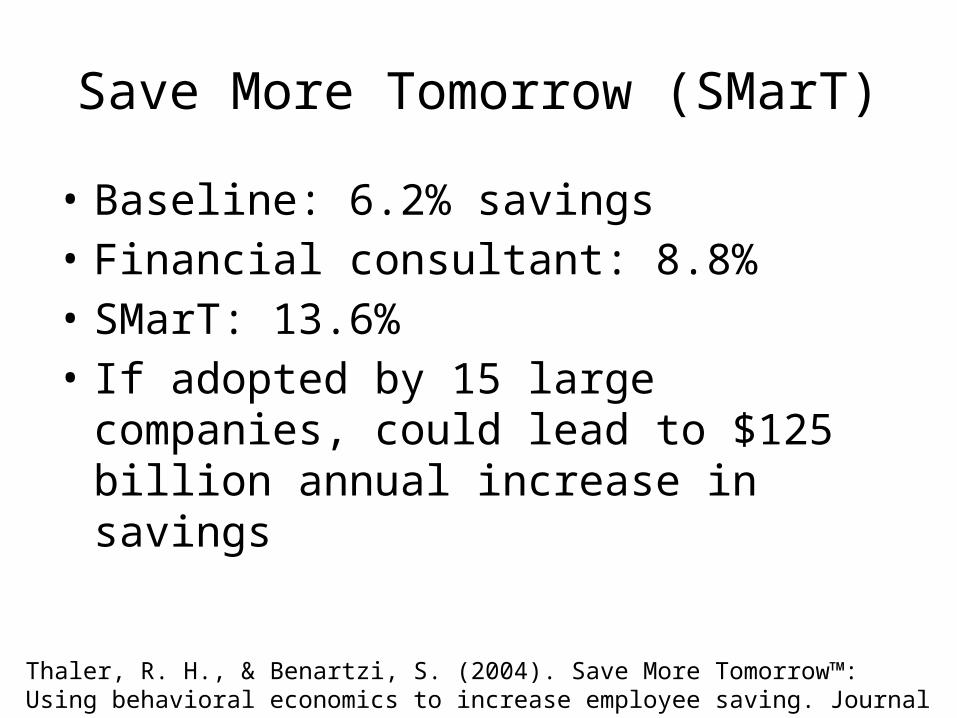
Save More Tomorrow (SMarT)
• Baseline: 6.2% savings• Financial consultant: 8.8%• SMarT: 13.6%• If adopted by 15 large companies, could lead
to $125 billion annual increase in savings
Thaler, R. H., & Benartzi, S. (2004). Save More Tomorrow™: Using behavioral economics to increase employee saving. Journal of political Economy, 112(S1), S164-S187.
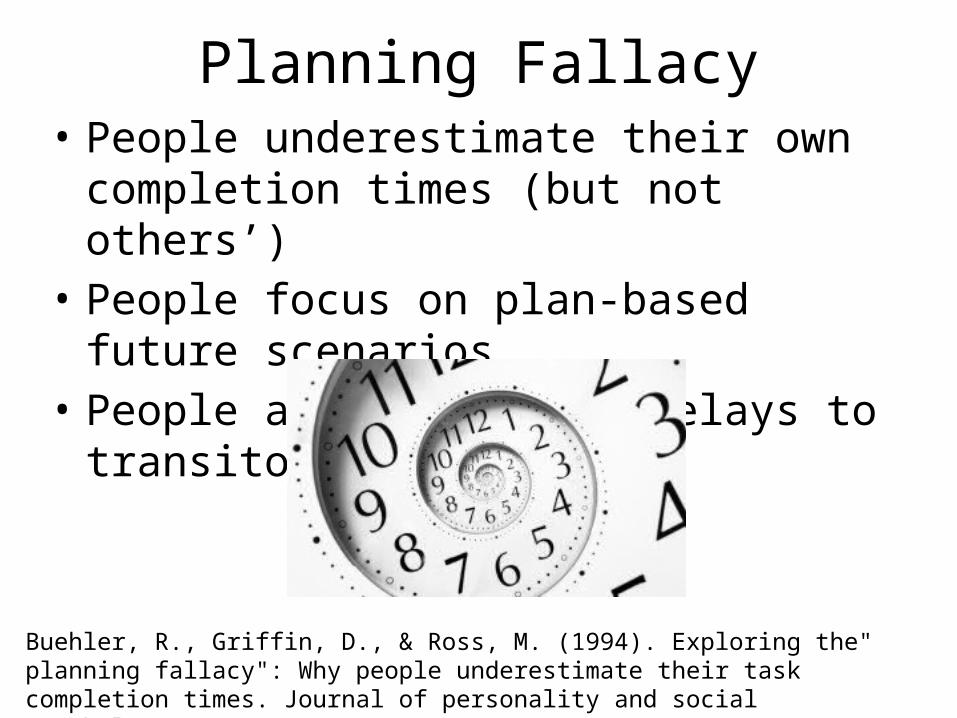
Planning Fallacy• People underestimate their own completion
times (but not others’)• People focus on plan-based future scenarios• People attribute past delays to transitory
factors
Buehler, R., Griffin, D., & Ross, M. (1994). Exploring the" planning fallacy": Why people underestimate their task completion times. Journal of personality and social psychology, 67(3), 366.
Planning FallacySolutions: • Compare to previous similar projects• Get others to estimate for you• Take a third person view when imagining
yourself doing the task• Commitment devices
Buehler, R., Griffin, D., & Ross, M. (1994). Exploring the" planning fallacy": Why people underestimate their task completion times. Journal of personality and social psychology, 67(3), 366.
Budgeting Fallacy
• People spend more than they predict they will• Savings goals influence predictions, but not
actual spending
Peetz, J., & Buehler, R. (2009). Is there a budget fallacy? The role of savings goals in the prediction of personal spending. Personality and Social Psychology Bulletin, 35(12), 1579-1591.

Sequences
• People prefer improving sequences (e.g., income, vacation package)
• This is opposite of what discounting models would predict
Loewenstein, G. F., & Prelec, D. (1993). Preferences for sequences of outcomes. Psychological review, 100(1), 91.
Choice BracketingWhen making multiple choices:• Broad bracketing means assessing the
consequences of all of them taken together• Narrow bracketing means making each choice
in isolation• Often people make more prudent choices when
using broad bracketing• Example: deciding whether to wear a seat-belt
“this one time” vs “every time”
Broad bracketing
• Low-income people buy more lottery tickets when buying one at a time than when deciding once how many to purchase (Haisley 2008)
• Broad bracketing can be helpful for impulse control (e.g., alcoholics anonymous) (Ainslie, 2005)

Broad bracketing creates sequences (Loewenstein & Prelec 1993)
• Narrow: Fine French meal in one month or two? Most prefer sooner.
• Broad: Eat French meal in one month and at home in two months, or eat at home in one month and French meal in two?
• Choice bracketing shifts discount rates from positive to negative
The “diversification bias”
• Choosing 3 snacks (1 per week) in advance, 64% chose a different snack for each week; choosing 1 snack each week, 9% chose a different snack each week (Simonson 1990)
• The more yogurt consumers buy at once, the more rare flavors they buy (Simonson & Winer 1992)
• Also shown with children and Halloween candy (Read & Loewenstein 1995) and audio tracks
Review
How can we nudge consumers to: • Eat healthier?• Be more sustainable?• Improve public health?• Save more for retirement?

Thank You!